
E X C E P T I O N A L S E R V I C E • S E N S I B L E A D V I C E ® A NASDAQ Traded Company - Symbol HBNC INVESTOR PRESENTATION | APRIL 27, 2022

E X C E P T I O N A L S E R V I C E • S E N S I B L E A D V I C E ® Forward-Looking Statements This presentation may contain forward-looking statements regarding the financial performance, business prospects, growth and operating strategies of Horizon Bancorp, Inc. and its affiliates (collectively, “Horizon”). For these statements, Horizon claims the protection of the safe harbor for forward-looking statements contained in the Private Securities Litigation Reform Act of 1995. Statements in the presentation materials should be considered in conjunction with the other information available about Horizon, including the information in the filings we make with the Securities and Exchange Commission. Forward-looking statements provide current expectations or forecasts of future events and are not guarantees of future performance. The forward-looking statements are based on management’s expectations and are subject to a number of risks and uncertainties. We have tried, wherever possible, to identify such statements by using words such as “anticipate,” “estimate,” “project,” “intend,” “plan,” “believe,” “will” and similar expressions in connection with any discussion of future operating or financial performance. Although management believes that the expectations reflected in such forward-looking statements are reasonable, actual results may differ materially from those expressed or implied in such statements. Risks and uncertainties that could cause actual results to differ materially include risk factors relating to the banking industry and the other factors detailed from time to time in Horizon’s reports filed with the Securities and Exchange Commission (the “SEC”), including those described in Horizon’s Annual Report on Form 10-K for the year ended December 31, 2021 and other subsequent filings with the SEC. Further, statements about the effects of the COVID-19 pandemic on our business, operations, financial performance, and prospects may constitute forward-looking statements and are subject to the risk that the actual impacts may differ, possibly materially, from what is reflected in those forward-looking statements due to factors and future developments that are uncertain, unpredictable, and in many cases beyond our control, including the scope and duration of the pandemic, actions taken by governmental authorities in response to the pandemic, and the direct and indirect impact of the pandemic on our customers, third parties, and us. Undue reliance should not be placed on the forward-looking statements, which speak only as of the date hereof. Horizon does not undertake, and specifically disclaims any obligation, to publicly release the result of any revisions that may be made to update any forward-looking statement to reflect the events or circumstances after the date on which the forward-looking statement is made, or reflect the occurrence of unanticipated events, except to the extent required by law. Non-GAAP Measures Certain non-GAAP financial measures are presented herein. Horizon believes they are useful to investors and provide a greater understanding of Horizon’s business without giving effect to non-recurring costs and non-core items. For each non-GAAP financial measure, we have presented comparable GAAP measures and reconciliations of the non-GAAP measures to those GAAP measures in the Appendix to this presentation. Please see slides 41-56. Important Information 2
E X C E P T I O N A L S E R V I C E • S E N S I B L E A D V I C E ® Corporate Overview 3

E X C E P T I O N A L S E R V I C E • S E N S I B L E A D V I C E ® 4 1Q22 Highlights Record Earnings • Record diluted EPS of $0.54, diluted • ROATE of 17.70%* and ROAA of 1.31% • Pre-tax, pre-provision net income* up 9.7% from the linked quarter and 6.1% from the prior year period Organic loan growth • Total loans up 2.3% or 9.5% annualized, ex. PPP and sold participation loans • Commercial loans up 2.9% or 12.0% annualized, ex PPP and sold participation loans • Consumer loans up 3.7% or 14.9% annualized • Residential mortgage down 0.2% or 0.7% annualized Disciplined expense management • Non-interest expense/average assets was 2.03% • Efficiency ratio 58.74% Sequential-quarter NIM expansion • 2.99% reported NIM up 2 bps from linked quarter • 2.93% adjusted NIM up 7 bps from linked quarter* * See Footnote Index and non-GAAP reconciliations in Appendix. ($000s except per share data) 1Q22 Change % vs. 4Q21 1Q21 Income Statement Net interest income $48,171 (3.6)% 13.2% Non-interest income $14,155 10.3% 2.0% Pre-tax, pre-provision net income* $25,716 9.7% 6.1% Reported net income $23,563 10.0% 15.4% Diluted EPS $0.54 10.2% 17.4% Efficiency ratio 58.74% (3.95)% 1.71% Return on Average Assets 1.31% 0.17% (0.09)% Return on Average Tangible Equity* 17.70% 1.96% 1.85% Balance Sheet Total loans (ex PPP & sold participations) $3,658,739 2.3% 7.0% Commercial loans (ex PPP & sold participations) $2,202,568 3.3% 14.4% Consumer loans $753,900 3.7% 18.1% Deposits $5,851,497 0.8% 23.9% Credit Quality Allowance for credit losses to total loans 1.41% (10) bps (15) Bps NPA ratio 0.54% 1 bps (14) Bps Net charge-offs to avg. loans for the period 0.00% (4) bps (1) bps

E X C E P T I O N A L S E R V I C E • S E N S I B L E A D V I C E ® 5 Disciplined operating culture Compelling value supported by commitment to dividend Well-established long-term growth goals Very attractive Midwest markets Deliberate mix of businesses delivers very strong operational performance Why Horizon? A High-Performing Operator in Growth Markets 1.31% ROAA, 17.70% ROATE & 2.03% operating expenses/avg. assets YTD Superior return metrics include GAAP ROAA, ROAE and operating expenses/avg. assets Closed 10 branch in 2021 and plan an additional 7 branch closures in 2022 Additional closings contributing to sustained tech/digital investments and consistently low expense/assets, efficiency and compensation/ FTE ratios 162% P/TBV and 9.2x P/E (TTM) with 3.2% dividend yield Recent HBNC share price presents compelling value, while unbroken 30-year record of quarterly cash dividends to shareholders continues in 2022 with an annual dividend amount of 60¢/share, representing a 27.8% payout ratio 17% average asset growth 2017-2021 In line with long-term goals of meaningfully outpacing GDP and industry, ~50/50 growth organic/acquired, and organic growth ≥3x GDP 30 minutes from downtown Chicago and Attractive Midwest Markets Illinois exodus, Indiana’s infrastructure and business-friendly climate, and Indiana and Michigan’s major global employers, entrepreneurs and research universities all contribute to favorable economic trends in Horizon markets >50% of total loans comprise commercial lending Commercial loan portfolio, excluding PPP loans, increased approximately $65 million, or 12% annualized, during Q1 2022 (1) Footnote Index included in Appendix (see slides 39-57 for non-GAAP reconciliation)

E X C E P T I O N A L S E R V I C E • S E N S I B L E A D V I C E ® 6 Craig M. Dwight Chairman & CEO • 43 Years of Banking Experience • 23 Years as President or CEO of Bank Mark E. Secor EVP & Chief Financial Officer • 33 Years of Banking and Public Accounting Experience • 13 Years with Horizon as CFO and EVP of Horizon Kathie A. DeRuiter EVP & Senior Operations Officer • 32 Years of Banking and Operational Experience • 21 Years as Senior Bank Operations Officer Todd A. Etzler EVP & Corporate Secretary & General Counsel • 30 Years of Corporate Legal Experience and 11 years of General Counsel Experience • 4 Years as SVP and General Counsel Seasoned Management Team Lynn M. Kerber EVP & Chief Commercial Banking Officer • 31 Years of Banking Experience • 4 Years with Horizon as Senior Commercial Credit Officer Noe S. Najera EVP, Senior Retail & Mortgage Lending Officer • 20 Years of Banking Experience • 6 Years with Horizon, 3 Years as SVP Retail Lending * As of April 1, 2022
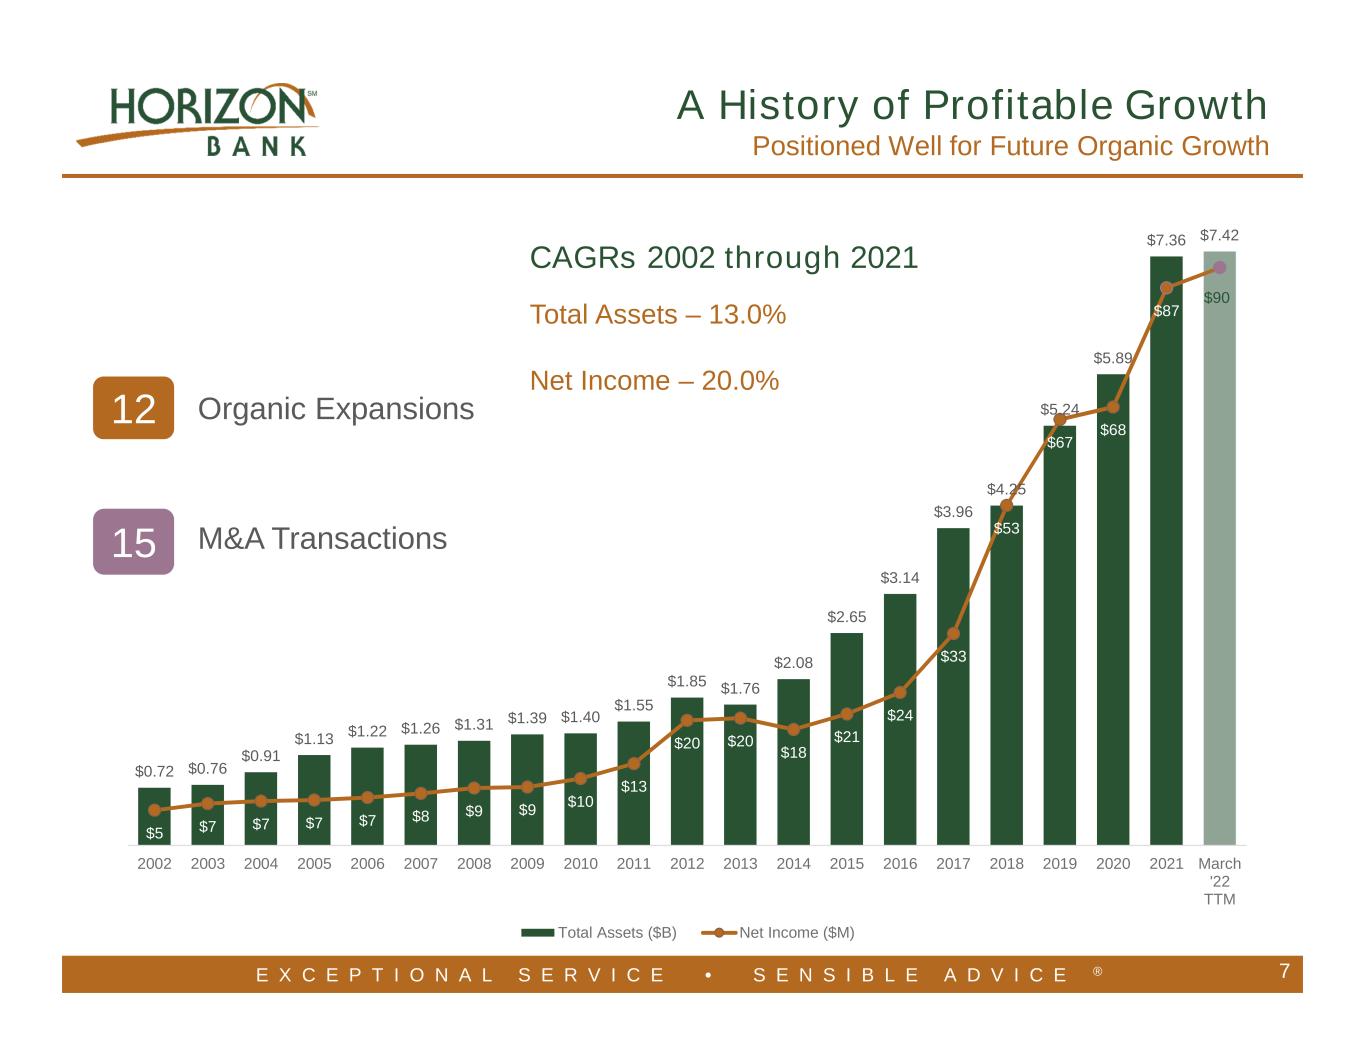
E X C E P T I O N A L S E R V I C E • S E N S I B L E A D V I C E ® A History of Profitable Growth Positioned Well for Future Organic Growth $0.72 $0.76 $0.91 $1.13 $1.22 $1.26 $1.31 $1.39 $1.40 $1.55 $1.85 $1.76 $2.08 $2.65 $3.14 $3.96 $4.25 $5.24 $5.89 $7.36 $7.42 $5 $7 $7 $7 $7 $8 $9 $9 $10 $13 $20 $20 $18 $21 $24 $33 $53 $67 $68 $87 $90 - 10 20 30 40 50 60 70 80 90 100 - 1.00 2.00 3.00 4.00 5.00 6.00 7.00 8.00 2002 2003 2004 2005 2006 2007 2008 2009 2010 2011 2012 2013 2014 2015 2016 2017 2018 2019 2020 2021 March '22 TTM Total Assets ($B) Net Income ($M) CAGRs 2002 through 2021 Total Assets – 13.0% Net Income – 20.0% 7 12 15 Organic Expansions M&A Transactions
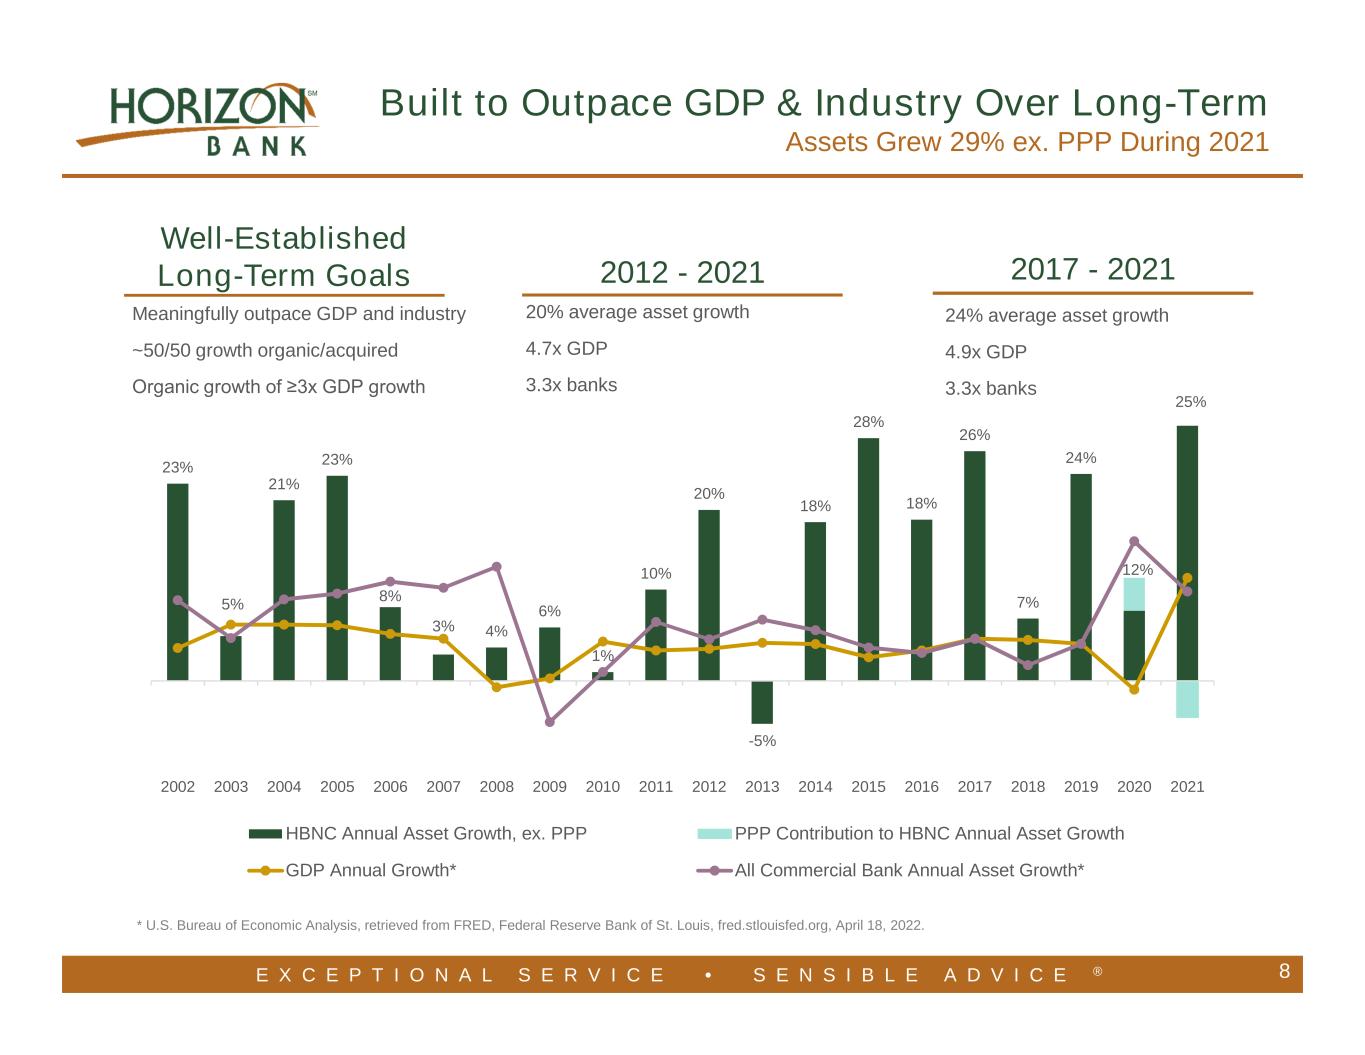
E X C E P T I O N A L S E R V I C E • S E N S I B L E A D V I C E ® 8 * U.S. Bureau of Economic Analysis, retrieved from FRED, Federal Reserve Bank of St. Louis, fred.stlouisfed.org, April 18, 2022. Built to Outpace GDP & Industry Over Long-Term Assets Grew 29% ex. PPP During 2021 23% 5% 21% 23% 8% 3% 4% 6% 1% 10% 20% -5% 18% 28% 18% 26% 7% 24% 12% 25% 2002 2003 2004 2005 2006 2007 2008 2009 2010 2011 2012 2013 2014 2015 2016 2017 2018 2019 2020 2021 HBNC Annual Asset Growth, ex. PPP PPP Contribution to HBNC Annual Asset Growth GDP Annual Growth* All Commercial Bank Annual Asset Growth* Well-Established Long-Term Goals Meaningfully outpace GDP and industry ~50/50 growth organic/acquired Organic growth of ≥3x GDP growth 2012 - 2021 2017 - 2021 20% average asset growth 4.7x GDP 3.3x banks 24% average asset growth 4.9x GDP 3.3x banks
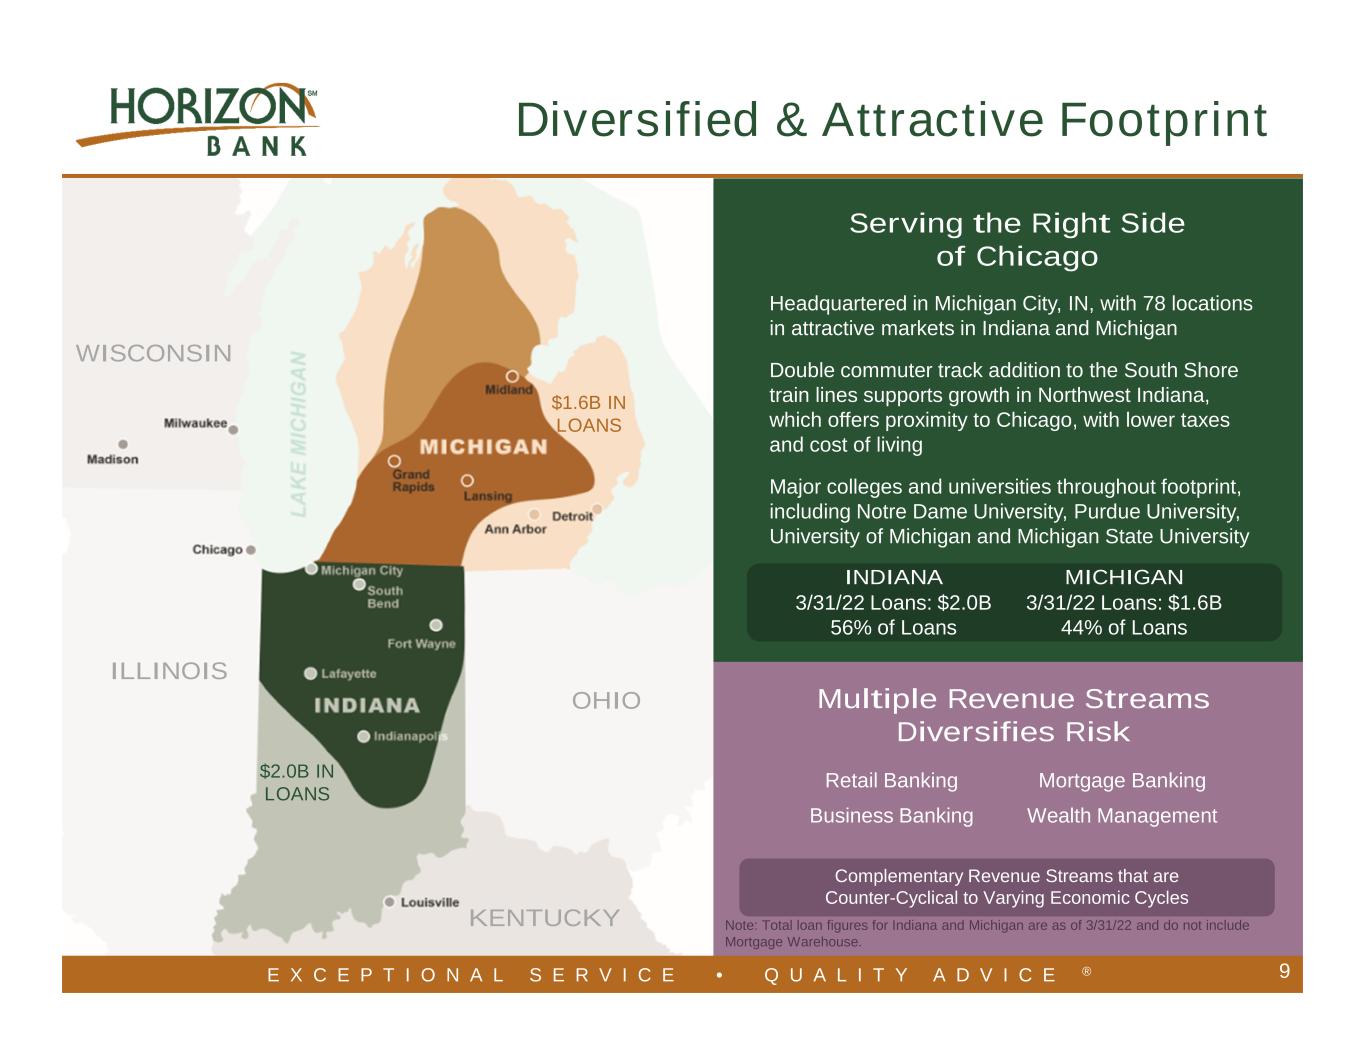
E X C E P T I O N A L S E R V I C E • S E N S I B L E A D V I C E ® 9 Multiple Revenue Streams Diversifies Risk Diversified & Attractive Footprint E X C E P T I O N A L S E R V I C E • Q U A L I T Y A D V I C E ® 9 Retail Banking Business Banking Mortgage Banking Wealth Management Complementary Revenue Streams that are Counter-Cyclical to Varying Economic Cycles Serving the Right Side of Chicago Headquartered in Michigan City, IN, with 78 locations in attractive markets in Indiana and Michigan Double commuter track addition to the South Shore train lines supports growth in Northwest Indiana, which offers proximity to Chicago, with lower taxes and cost of living Major colleges and universities throughout footprint, including Notre Dame University, Purdue University, University of Michigan and Michigan State University Note: Total loan figures for Indiana and Michigan are as of 3/31/22 and do not include Mortgage Warehouse. INDIANA 3/31/22 Loans: $2.0B 56% of Loans MICHIGAN 3/31/22 Loans: $1.6B 44% of Loans OHIO ILLINOIS WISCONSIN KENTUCKY $1.6B IN LOANS $2.0B IN LOANS
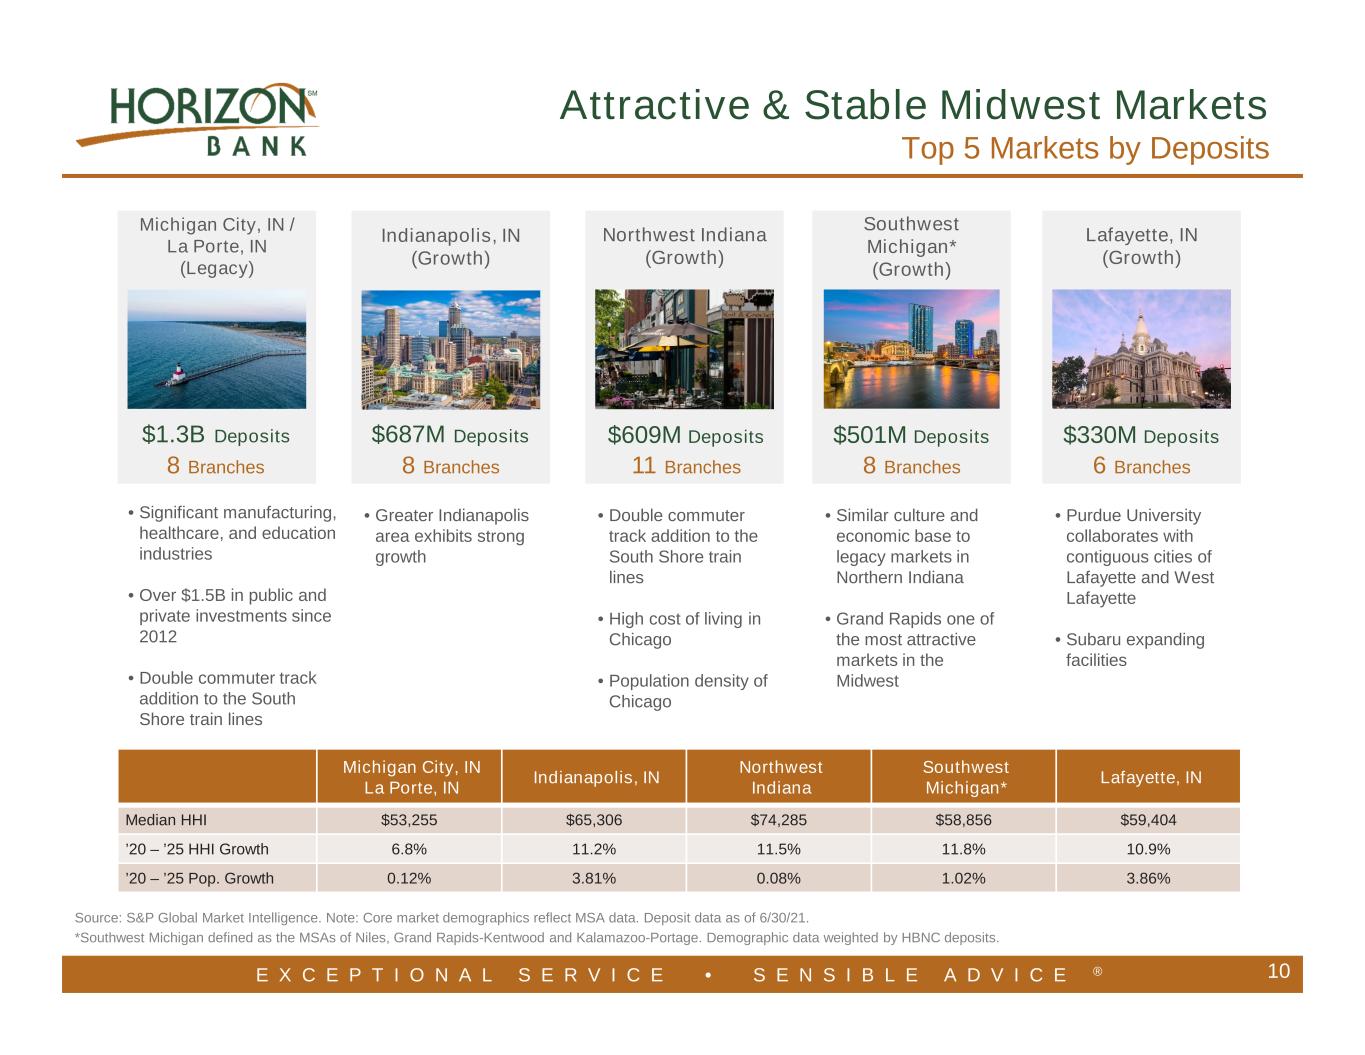
E X C E P T I O N A L S E R V I C E • S E N S I B L E A D V I C E ® 10 Michigan City, IN / La Porte, IN (Legacy) Indianapolis, IN (Growth) Northwest Indiana (Growth) Lafayette, IN (Growth) Southwest Michigan* (Growth) $1.3B Deposits $687M Deposits $609M Deposits $330M Deposits$501M Deposits 8 Branches 8 Branches 11 Branches 6 Branches8 Branches • Similar culture and economic base to legacy markets in Northern Indiana • Grand Rapids one of the most attractive markets in the Midwest • Purdue University collaborates with contiguous cities of Lafayette and West Lafayette • Subaru expanding facilities • Double commuter track addition to the South Shore train lines • High cost of living in Chicago • Population density of Chicago • Greater Indianapolis area exhibits strong growth • Significant manufacturing, healthcare, and education industries • Over $1.5B in public and private investments since 2012 • Double commuter track addition to the South Shore train lines Source: S&P Global Market Intelligence. Note: Core market demographics reflect MSA data. Deposit data as of 6/30/21. *Southwest Michigan defined as the MSAs of Niles, Grand Rapids-Kentwood and Kalamazoo-Portage. Demographic data weighted by HBNC deposits. Attractive & Stable Midwest Markets Top 5 Markets by Deposits Michigan City, IN La Porte, IN Indianapolis, IN Northwest Indiana Southwest Michigan* Lafayette, IN Median HHI $53,255 $65,306 $74,285 $58,856 $59,404 ’20 – ’25 HHI Growth 6.8% 11.2% 11.5% 11.8% 10.9% ’20 – ’25 Pop. Growth 0.12% 3.81% 0.08% 1.02% 3.86%
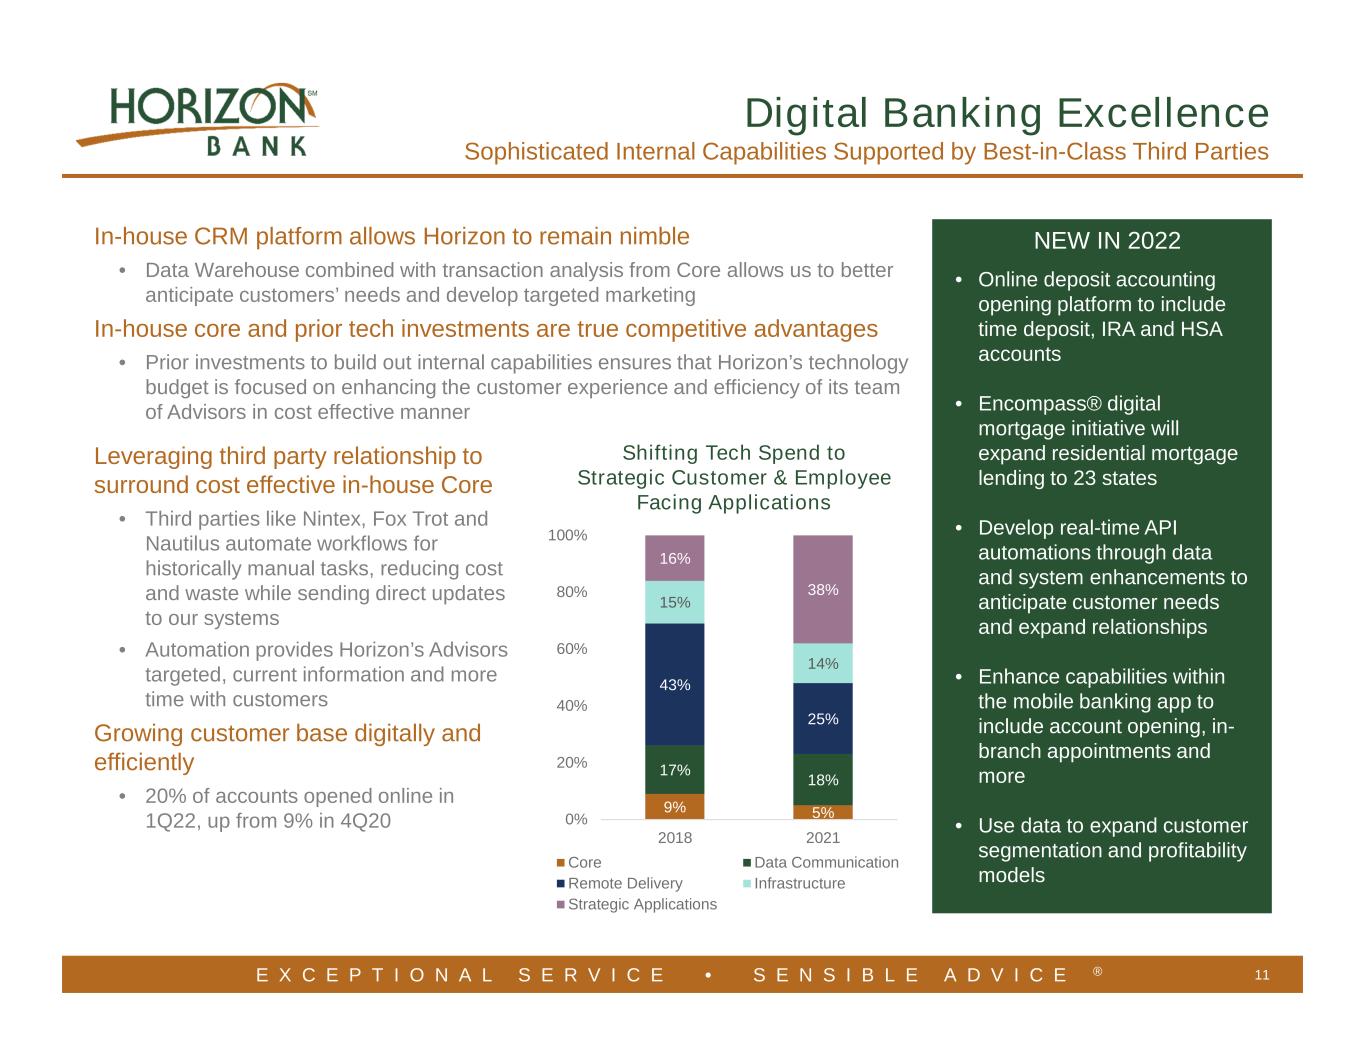
E X C E P T I O N A L S E R V I C E • S E N S I B L E A D V I C E ® Digital Banking Excellence Sophisticated Internal Capabilities Supported by Best-in-Class Third Parties 11 NEW IN 2022 • Online deposit accounting opening platform to include time deposit, IRA and HSA accounts • Encompass® digital mortgage initiative will expand residential mortgage lending to 23 states • Develop real-time API automations through data and system enhancements to anticipate customer needs and expand relationships • Enhance capabilities within the mobile banking app to include account opening, in- branch appointments and more • Use data to expand customer segmentation and profitability models In-house CRM platform allows Horizon to remain nimble • Data Warehouse combined with transaction analysis from Core allows us to better anticipate customers’ needs and develop targeted marketing In-house core and prior tech investments are true competitive advantages • Prior investments to build out internal capabilities ensures that Horizon’s technology budget is focused on enhancing the customer experience and efficiency of its team of Advisors in cost effective manner Shifting Tech Spend to Strategic Customer & Employee Facing Applications 9% 5% 17% 18% 43% 25% 15% 14% 16% 38% 0% 20% 40% 60% 80% 100% 2018 2021 Core Data Communication Remote Delivery Infrastructure Strategic Applications Leveraging third party relationship to surround cost effective in-house Core • Third parties like Nintex, Fox Trot and Nautilus automate workflows for historically manual tasks, reducing cost and waste while sending direct updates to our systems • Automation provides Horizon’s Advisors targeted, current information and more time with customers Growing customer base digitally and efficiently • 20% of accounts opened online in 1Q22, up from 9% in 4Q20
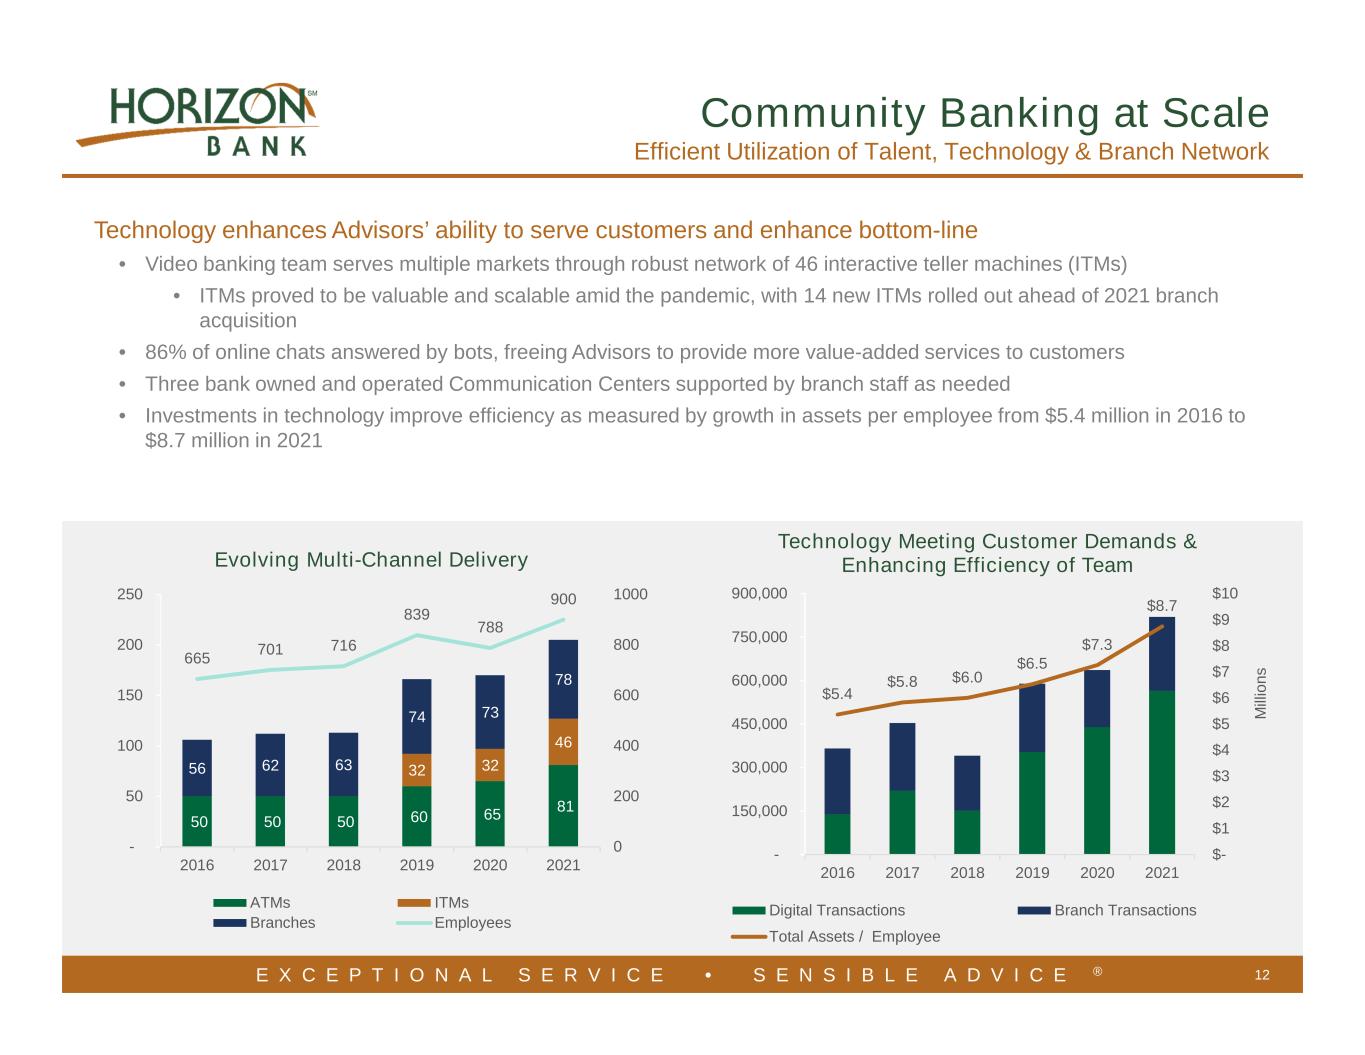
E X C E P T I O N A L S E R V I C E • S E N S I B L E A D V I C E ® Community Banking at Scale Efficient Utilization of Talent, Technology & Branch Network 12 50 50 50 60 65 81 32 32 46 56 62 63 74 73 78 665 701 716 839 788 900 0 200 400 600 800 1000 - 50 100 150 200 250 2016 2017 2018 2019 2020 2021 Evolving Multi-Channel Delivery ATMs ITMs Branches Employees $5.4 $5.8 $6.0 $6.5 $7.3 $8.7 $- $1 $2 $3 $4 $5 $6 $7 $8 $9 $10 - 150,000 300,000 450,000 600,000 750,000 900,000 2016 2017 2018 2019 2020 2021 M ill io n s Technology Meeting Customer Demands & Enhancing Efficiency of Team Digital Transactions Branch Transactions Total Assets / Employee Technology enhances Advisors’ ability to serve customers and enhance bottom-line • Video banking team serves multiple markets through robust network of 46 interactive teller machines (ITMs) • ITMs proved to be valuable and scalable amid the pandemic, with 14 new ITMs rolled out ahead of 2021 branch acquisition • 86% of online chats answered by bots, freeing Advisors to provide more value-added services to customers • Three bank owned and operated Communication Centers supported by branch staff as needed • Investments in technology improve efficiency as measured by growth in assets per employee from $5.4 million in 2016 to $8.7 million in 2021
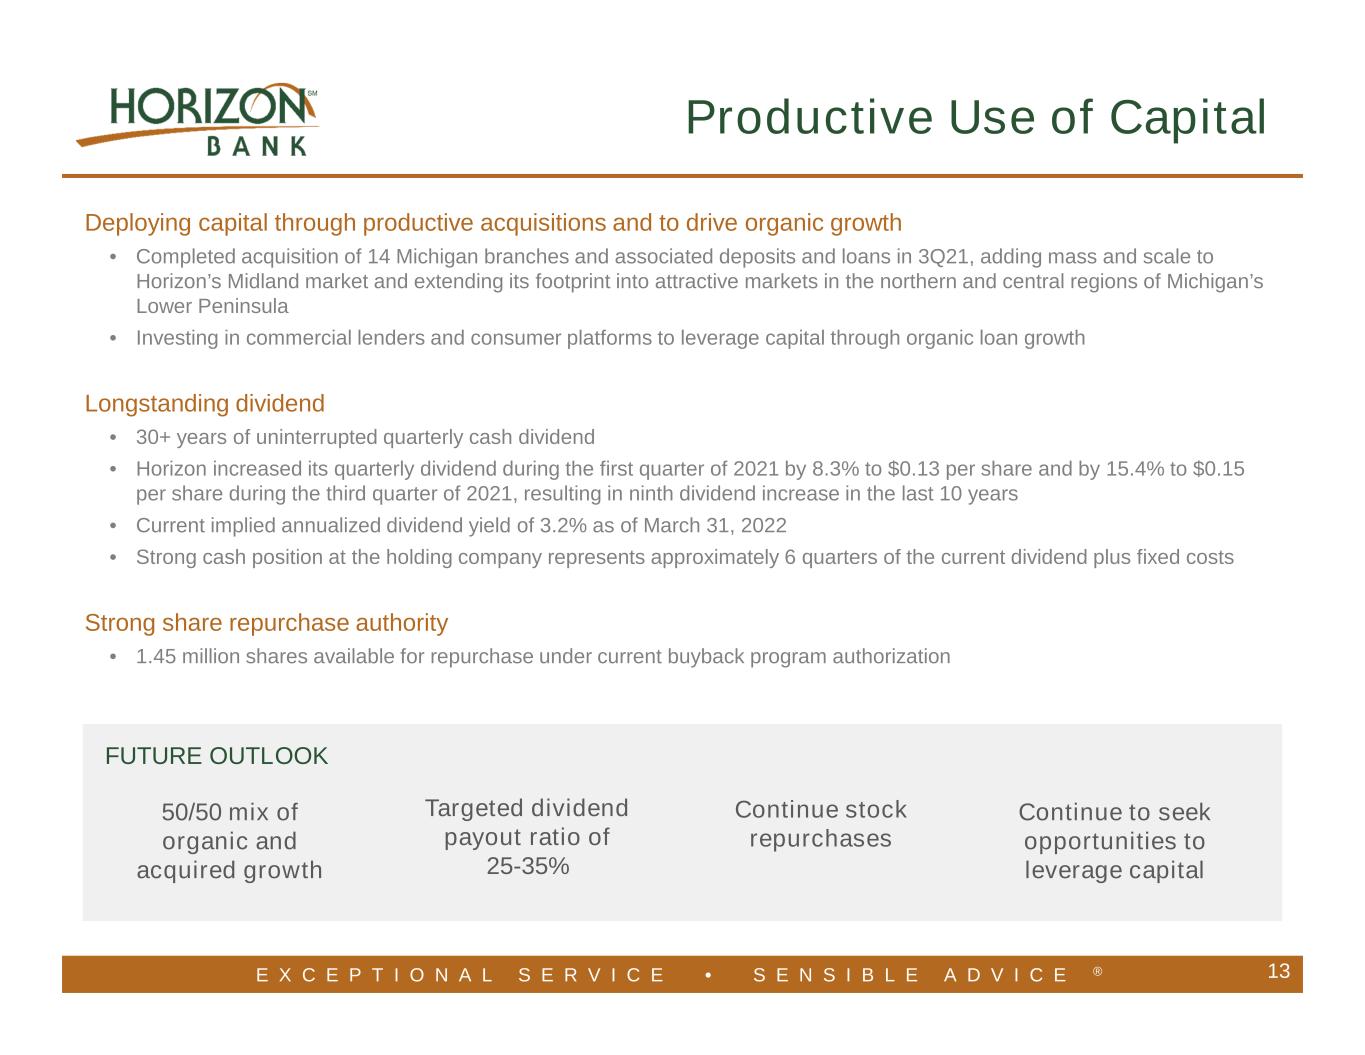
E X C E P T I O N A L S E R V I C E • S E N S I B L E A D V I C E ® 13 Productive Use of Capital Deploying capital through productive acquisitions and to drive organic growth • Completed acquisition of 14 Michigan branches and associated deposits and loans in 3Q21, adding mass and scale to Horizon’s Midland market and extending its footprint into attractive markets in the northern and central regions of Michigan’s Lower Peninsula • Investing in commercial lenders and consumer platforms to leverage capital through organic loan growth Longstanding dividend • 30+ years of uninterrupted quarterly cash dividend • Horizon increased its quarterly dividend during the first quarter of 2021 by 8.3% to $0.13 per share and by 15.4% to $0.15 per share during the third quarter of 2021, resulting in ninth dividend increase in the last 10 years • Current implied annualized dividend yield of 3.2% as of March 31, 2022 • Strong cash position at the holding company represents approximately 6 quarters of the current dividend plus fixed costs Strong share repurchase authority • 1.45 million shares available for repurchase under current buyback program authorization FUTURE OUTLOOK Targeted dividend payout ratio of 25-35% 50/50 mix of organic and acquired growth Continue to seek opportunities to leverage capital Continue stock repurchases
E X C E P T I O N A L S E R V I C E • S E N S I B L E A D V I C E ® 14 Financial Highlights
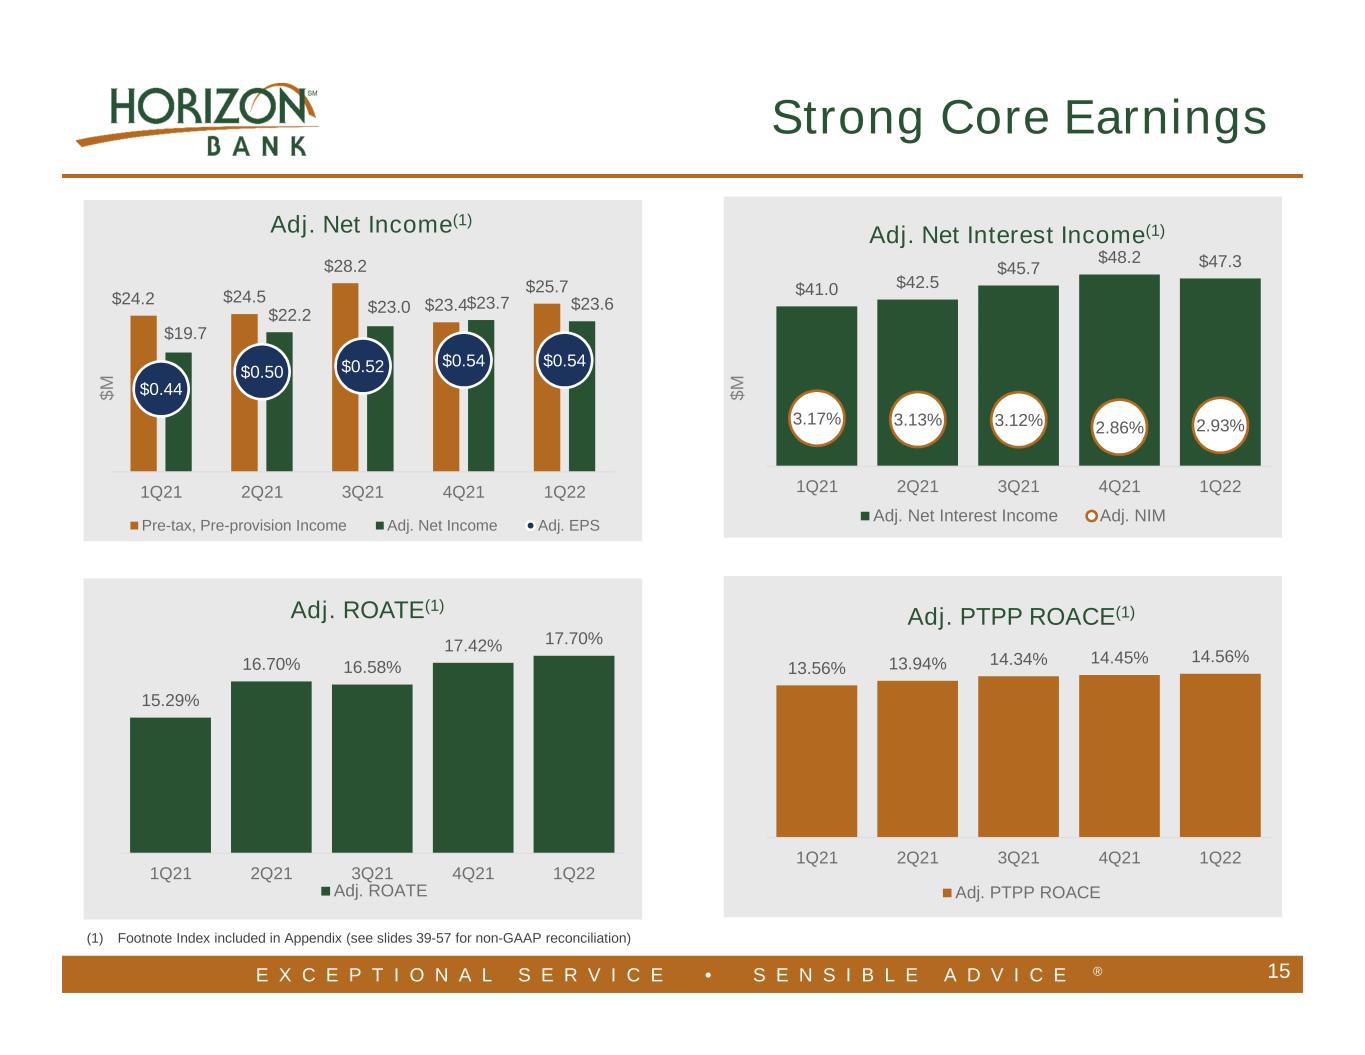
E X C E P T I O N A L S E R V I C E • S E N S I B L E A D V I C E ® 15 $ M $24.2 $24.5 $28.2 $23.4 $25.7 $19.7 $22.2 $23.0 $23.7 $23.6 $0.44 $0.50 $0.52 $0.54 $0.54 1Q21 2Q21 3Q21 4Q21 1Q22 Adj. Net Income(1) Pre-tax, Pre-provision Income Adj. Net Income Adj. EPS 13.56% 13.94% 14.34% 14.45% 14.56% 1Q21 2Q21 3Q21 4Q21 1Q22 Adj. PTPP ROACE(1) Adj. PTPP ROACE $41.0 $42.5 $45.7 $48.2 $47.3 3.17% 3.13% 3.12% 2.86% 2.93% 1Q21 2Q21 3Q21 4Q21 1Q22 Adj. Net Interest Income(1) Adj. Net Interest Income Adj. NIM $ M (1) Footnote Index included in Appendix (see slides 39-57 for non-GAAP reconciliation) 15.29% 16.70% 16.58% 17.42% 17.70% 1Q21 2Q21 3Q21 4Q21 1Q22 Adj. ROATE(1) Adj. ROATE Strong Core Earnings
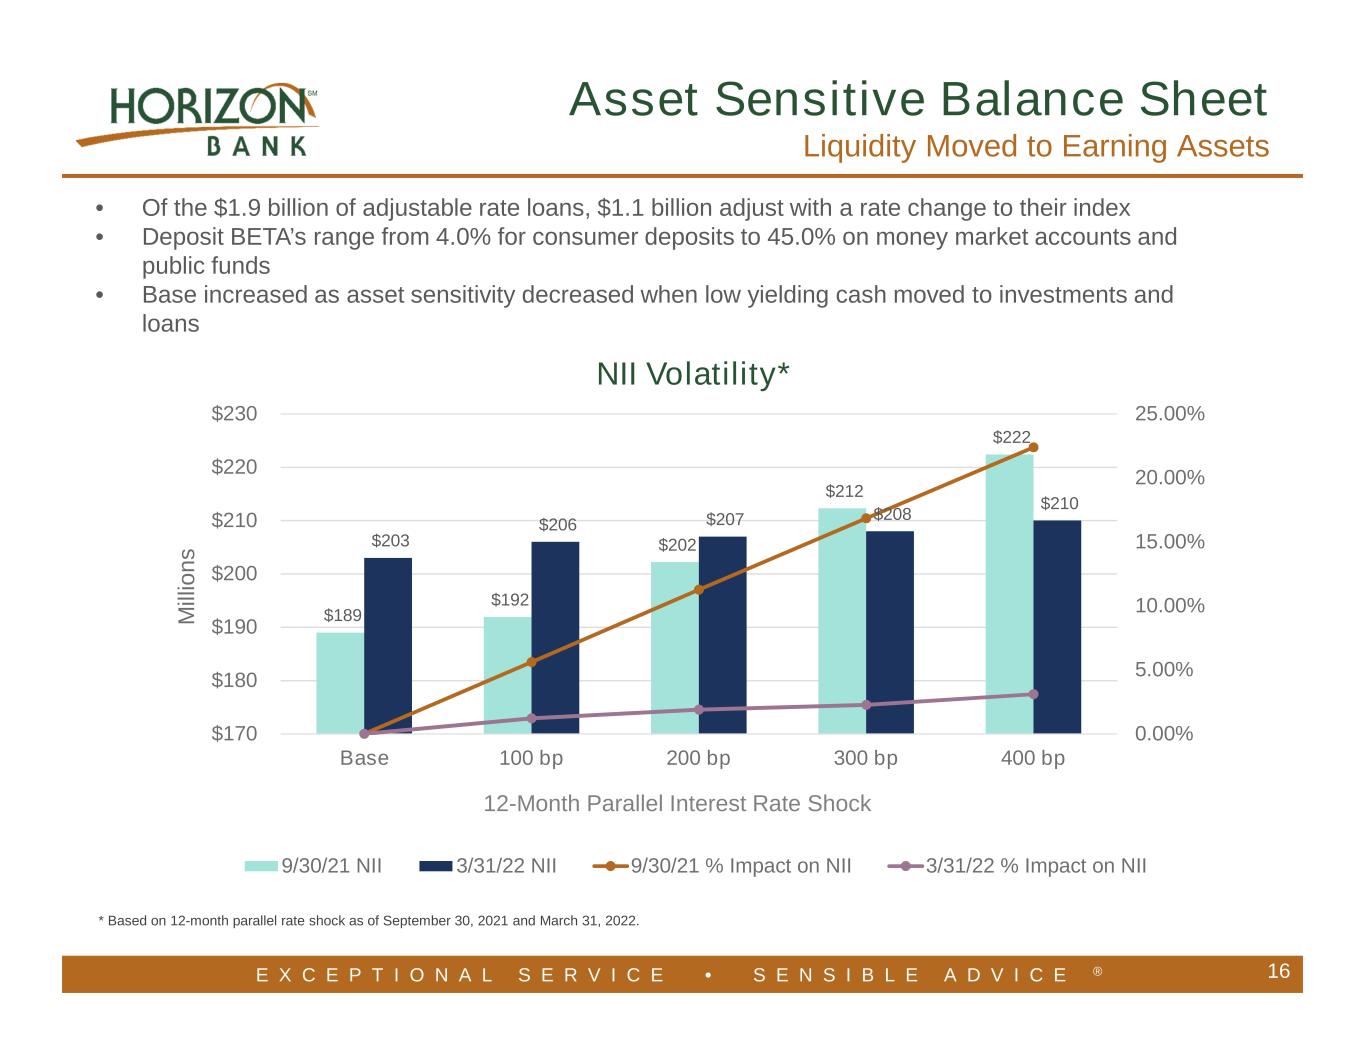
E X C E P T I O N A L S E R V I C E • S E N S I B L E A D V I C E ® 16 Asset Sensitive Balance Sheet Liquidity Moved to Earning Assets • Of the $1.9 billion of adjustable rate loans, $1.1 billion adjust with a rate change to their index • Deposit BETA’s range from 4.0% for consumer deposits to 45.0% on money market accounts and public funds • Base increased as asset sensitivity decreased when low yielding cash moved to investments and loans * Based on 12-month parallel rate shock as of September 30, 2021 and March 31, 2022. $189 $192 $202 $212 $222 $203 $206 $207 $208 $210 0.00% 5.00% 10.00% 15.00% 20.00% 25.00% $170 $180 $190 $200 $210 $220 $230 Base 100 bp 200 bp 300 bp 400 bp M ill io n s NII Volatility* 9/30/21 NII 3/31/22 NII 9/30/21 % Impact on NII 3/31/22 % Impact on NII 12-Month Parallel Interest Rate Shock
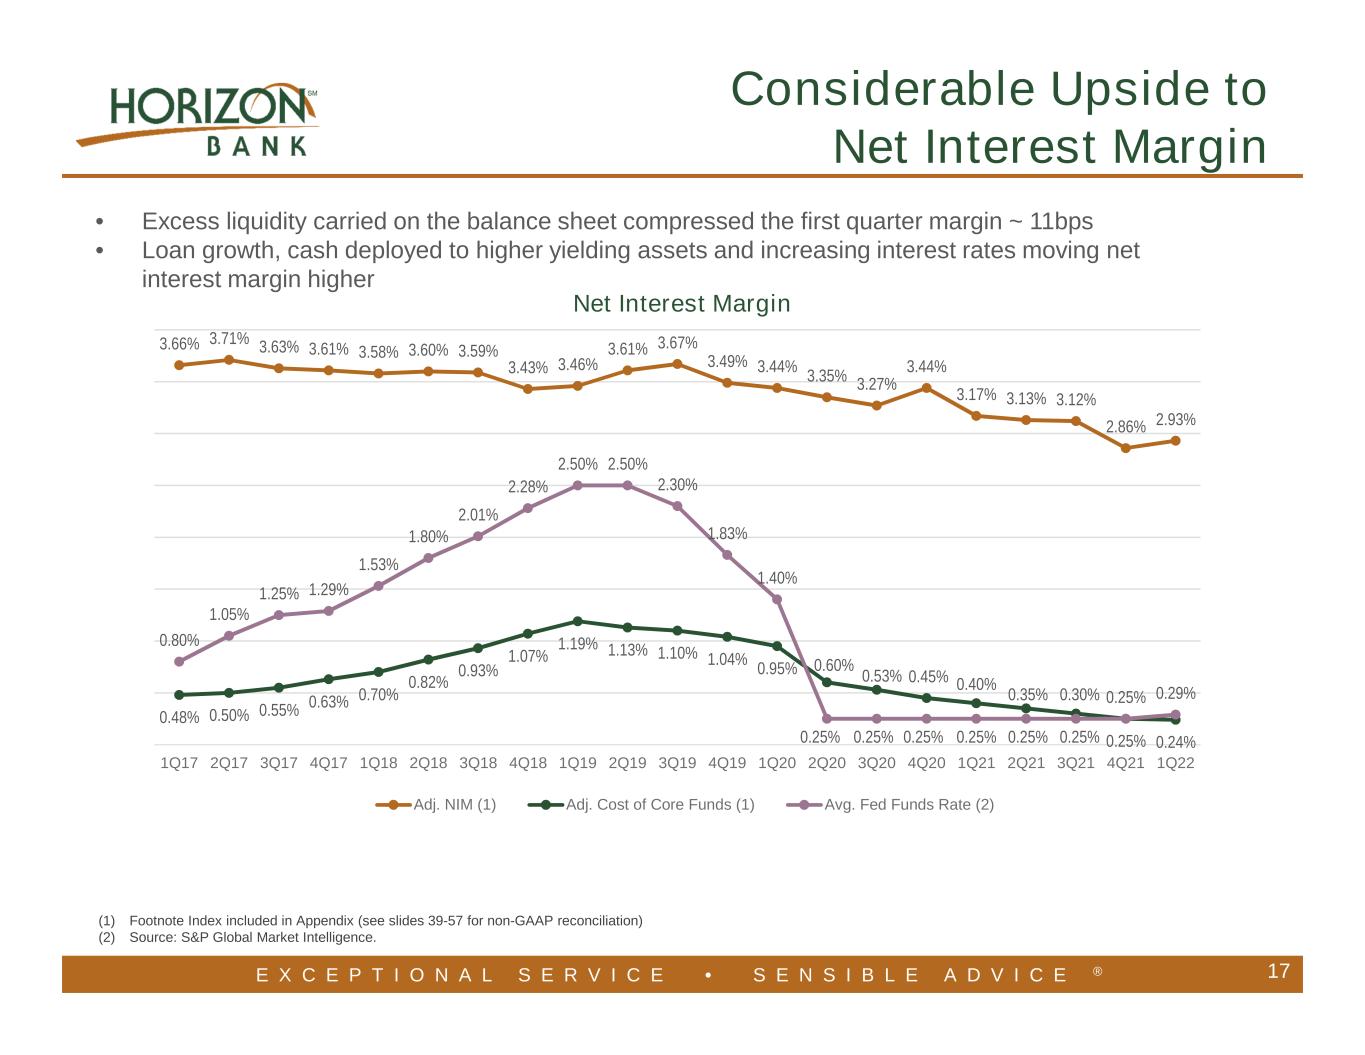
E X C E P T I O N A L S E R V I C E • S E N S I B L E A D V I C E ® 3.66% 3.71% 3.63% 3.61% 3.58% 3.60% 3.59% 3.43% 3.46% 3.61% 3.67% 3.49% 3.44% 3.35% 3.27% 3.44% 3.17% 3.13% 3.12% 2.86% 2.93% 0.48% 0.50% 0.55% 0.63% 0.70% 0.82% 0.93% 1.07% 1.19% 1.13% 1.10% 1.04% 0.95% 0.60% 0.53% 0.45% 0.40% 0.35% 0.30% 0.25% 0.24% 0.80% 1.05% 1.25% 1.29% 1.53% 1.80% 2.01% 2.28% 2.50% 2.50% 2.30% 1.83% 1.40% 0.25% 0.25% 0.25% 0.25% 0.25% 0.25% 0.25% 0.29% 1Q17 2Q17 3Q17 4Q17 1Q18 2Q18 3Q18 4Q18 1Q19 2Q19 3Q19 4Q19 1Q20 2Q20 3Q20 4Q20 1Q21 2Q21 3Q21 4Q21 1Q22 Net Interest Margin Adj. NIM (1) Adj. Cost of Core Funds (1) Avg. Fed Funds Rate (2) • Excess liquidity carried on the balance sheet compressed the first quarter margin ~ 11bps • Loan growth, cash deployed to higher yielding assets and increasing interest rates moving net interest margin higher 17 (1) Footnote Index included in Appendix (see slides 39-57 for non-GAAP reconciliation) (2) Source: S&P Global Market Intelligence. Considerable Upside to Net Interest Margin
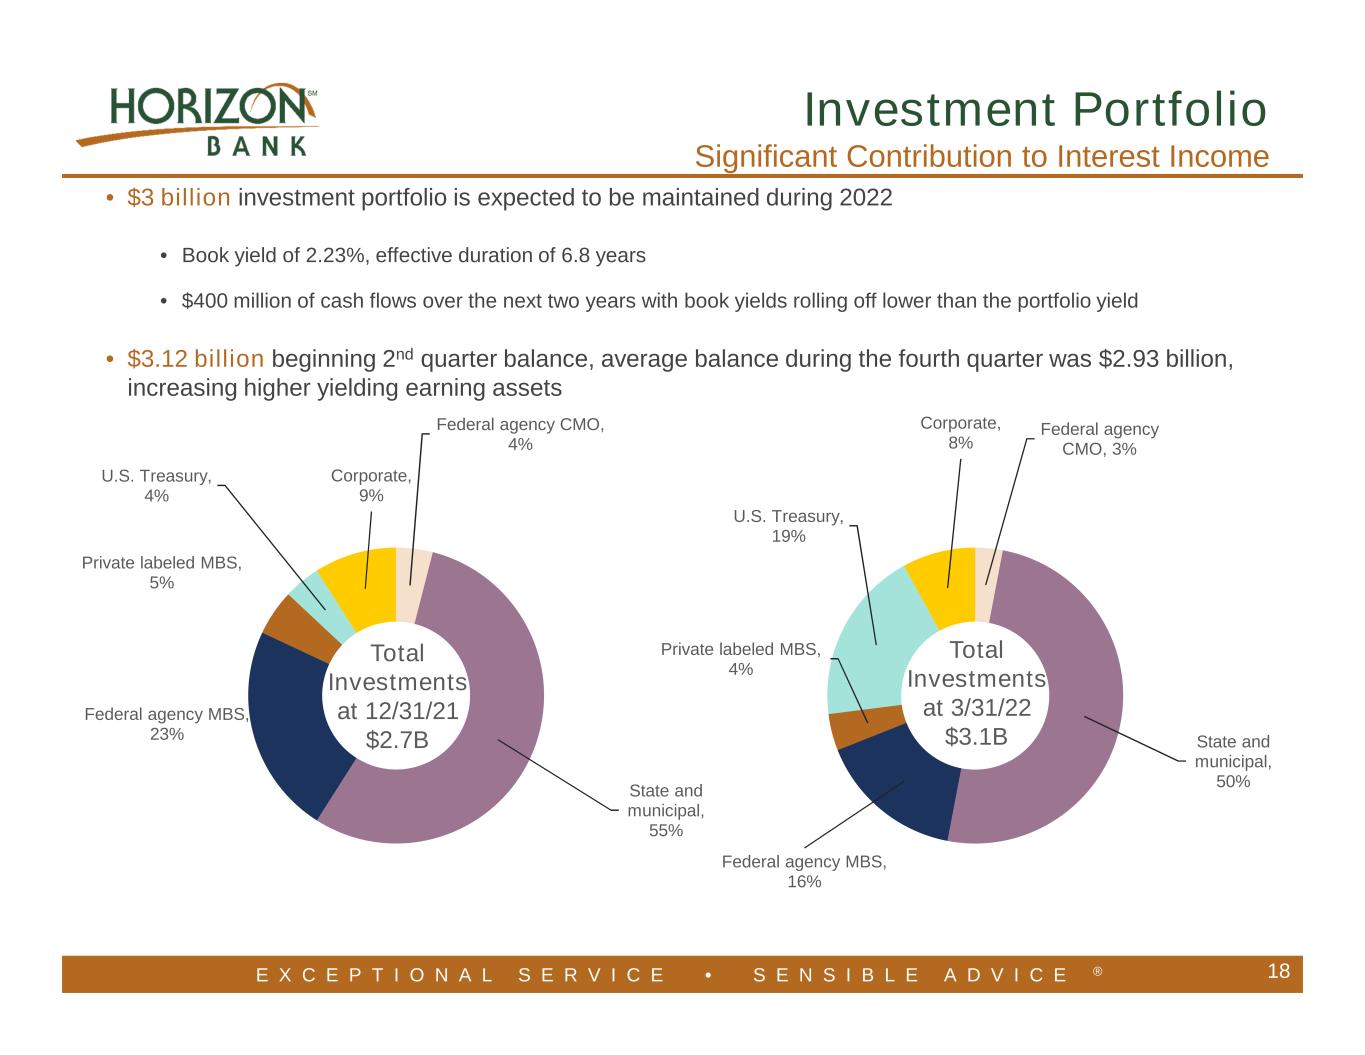
E X C E P T I O N A L S E R V I C E • S E N S I B L E A D V I C E ® Federal agency CMO, 3% State and municipal, 50% Federal agency MBS, 16% Private labeled MBS, 4% U.S. Treasury, 19% Corporate, 8% Total Investments at 3/31/22 $3.1B 18 • $3 billion investment portfolio is expected to be maintained during 2022 • Book yield of 2.23%, effective duration of 6.8 years • $400 million of cash flows over the next two years with book yields rolling off lower than the portfolio yield • $3.12 billion beginning 2nd quarter balance, average balance during the fourth quarter was $2.93 billion, increasing higher yielding earning assets Investment Portfolio Significant Contribution to Interest Income Federal agency CMO, 4% State and municipal, 55% Federal agency MBS, 23% Private labeled MBS, 5% U.S. Treasury, 4% Corporate, 9% Total Investments at 12/31/21 $2.7B
E X C E P T I O N A L S E R V I C E • S E N S I B L E A D V I C E ® 19 • Other Comprehensive Income (“OCI”) loss reduced Tangible Common Equity (“TCE”) by 67bps in the first quarter • We have the intent and ability to hold the investments to maturity and no plans to sell • Cashflows can be used to fund future loan growth as needed • Retained earnings and investments moving down the curve would earnback capital loss in approximately three quarters • No impact to regulatory capital ratios • The jump in longer term interest rates resulted in an unrealized loss on available for sale (“AFS”) investments that was in line with a rate move of over 100bps • With an additional 100bp shock to the AFS investments over the next quarter, TCE is estimated to be 6.54%, or another 40bp decline from the first quarter • In the fourth quarter, we moved selected AFS investments to held to maturity (“HTM”) investments, at March 31, 2022, 64% of investments were HTM • Bank capital is strong and sufficient to fund growth and will not restrict the ability for merger or share repurchase activities • OCI only considers AFS investments and derivatives, the economic value of equity (“EVE”) increased over the fourth quarter when deposits are included in the valuations Quick Earnback of Other Comprehensive Income

E X C E P T I O N A L S E R V I C E • S E N S I B L E A D V I C E ® Non-interest bearing 23% Interest bearing(1) 64% CDs 13% 20 • In-market relationships, strategic pricing and runoff of higher-priced time deposits, contributed to continued reduction in total deposit cost to 0.10% • Account and deposit retention data very strong to date Average Cost(1) Average Deposits ($000s) 1Q 2022 Average Balances 4Q 2021 Average Balances 1Q 2022 (QTD) 4Q 2021 (QTD) Non-interest bearing $1,322,781 $1,366,621 0.00% 0.00% Interest bearing (excluding CDs) $3,745,244 $3,793,949 0.07% 0.08% Time Deposits (CDs) $733,377 $750,040 0.47% 0.49% Total Deposits $5,801,402 $5,910,610 0.10% 0.11% (1) Footnote Index included in Appendix (see slides 39-57 for non-GAAP reconciliation) Strong Low Cost Core Deposits Total Deposits at 3/31/22 $5.9B
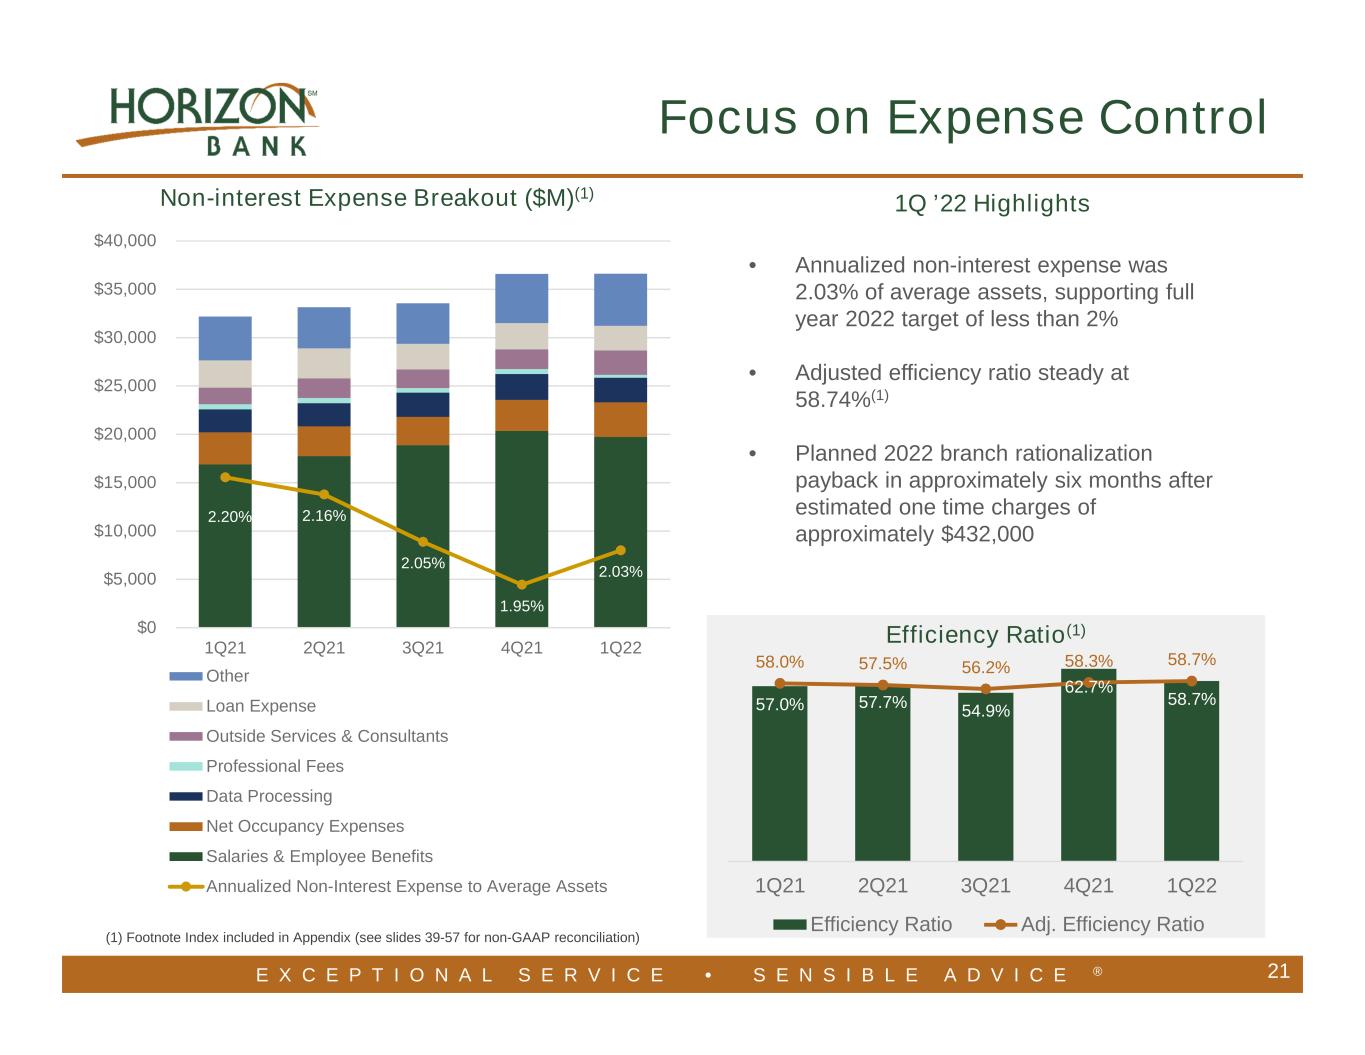
E X C E P T I O N A L S E R V I C E • S E N S I B L E A D V I C E ® 57.0% 57.7% 54.9% 62.7% 58.7% 58.0% 57.5% 56.2% 58.3% 58.7% 1Q21 2Q21 3Q21 4Q21 1Q22 Efficiency Ratio Adj. Efficiency Ratio • Annualized non-interest expense was 2.03% of average assets, supporting full year 2022 target of less than 2% • Adjusted efficiency ratio steady at 58.74%(1) • Planned 2022 branch rationalization payback in approximately six months after estimated one time charges of approximately $432,000 21 Efficiency Ratio(1) 1Q ’22 Highlights (1) Footnote Index included in Appendix (see slides 39-57 for non-GAAP reconciliation) Focus on Expense Control 2.20% 2.16% 2.05% 1.95% 2.03% $0 $5,000 $10,000 $15,000 $20,000 $25,000 $30,000 $35,000 $40,000 1Q21 2Q21 3Q21 4Q21 1Q22 Other Loan Expense Outside Services & Consultants Professional Fees Data Processing Net Occupancy Expenses Salaries & Employee Benefits Annualized Non-Interest Expense to Average Assets Non-interest Expense Breakout ($M)(1)
E X C E P T I O N A L S E R V I C E • S E N S I B L E A D V I C E ® Loan Portfolio Review 22
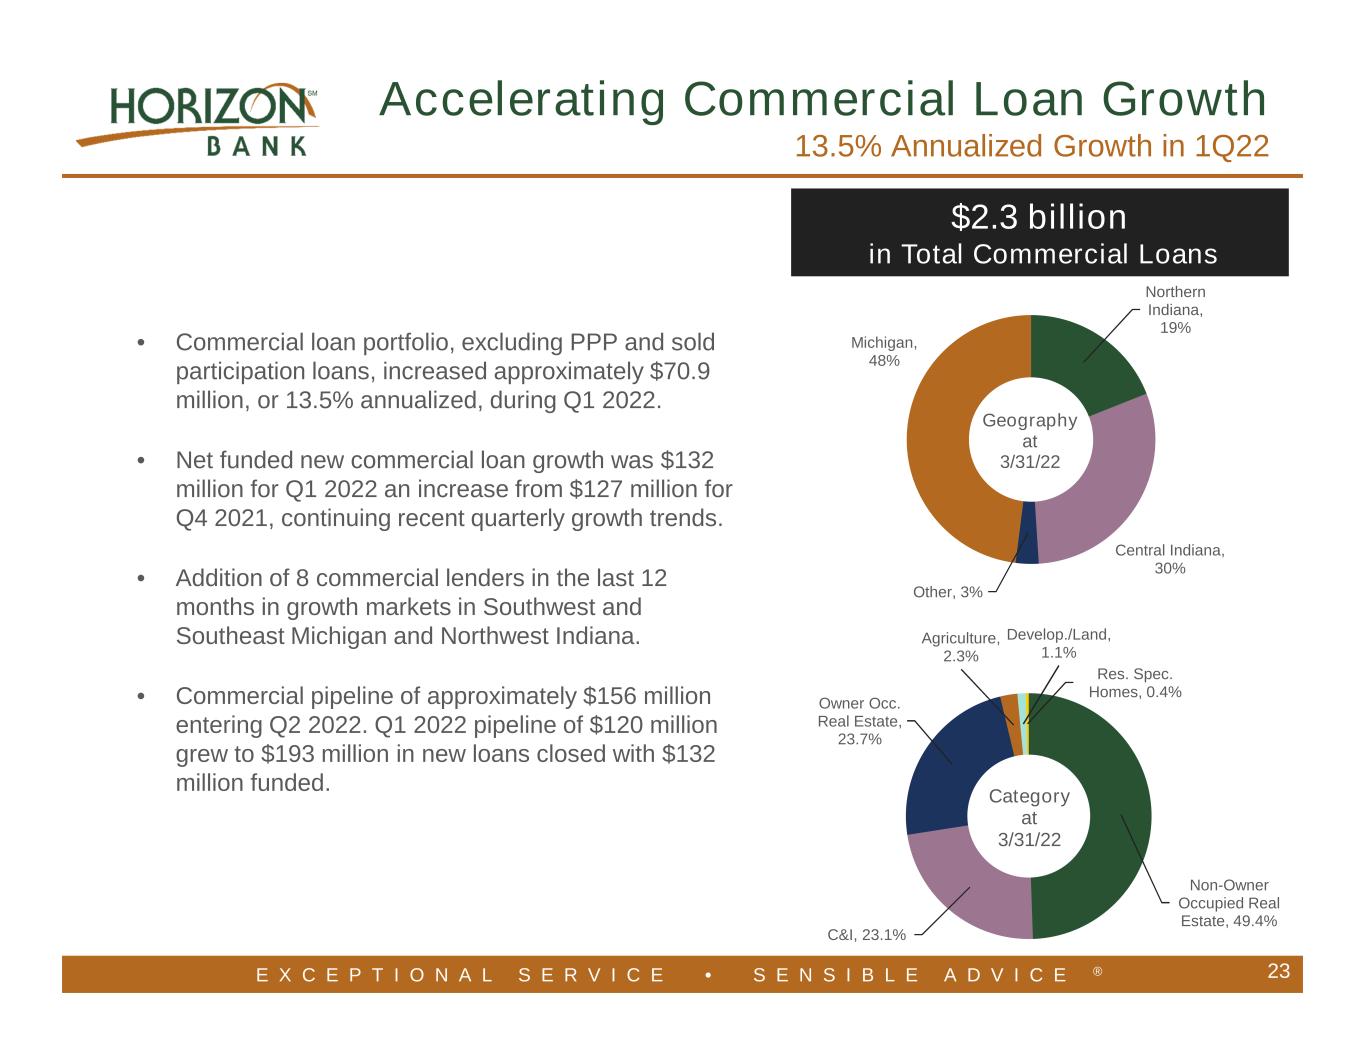
E X C E P T I O N A L S E R V I C E • S E N S I B L E A D V I C E ® Northern Indiana, 19% Central Indiana, 30% Other, 3% Michigan, 48% Geography at 3/31/22 Non-Owner Occupied Real Estate, 49.4% C&I, 23.1% Owner Occ. Real Estate, 23.7% Agriculture, 2.3% Develop./Land, 1.1% Res. Spec. Homes, 0.4% Category at 3/31/22 $2.3 billion in Total Commercial Loans Accelerating Commercial Loan Growth 13.5% Annualized Growth in 1Q22 23 • Commercial loan portfolio, excluding PPP and sold participation loans, increased approximately $70.9 million, or 13.5% annualized, during Q1 2022. • Net funded new commercial loan growth was $132 million for Q1 2022 an increase from $127 million for Q4 2021, continuing recent quarterly growth trends. • Addition of 8 commercial lenders in the last 12 months in growth markets in Southwest and Southeast Michigan and Northwest Indiana. • Commercial pipeline of approximately $156 million entering Q2 2022. Q1 2022 pipeline of $120 million grew to $193 million in new loans closed with $132 million funded.
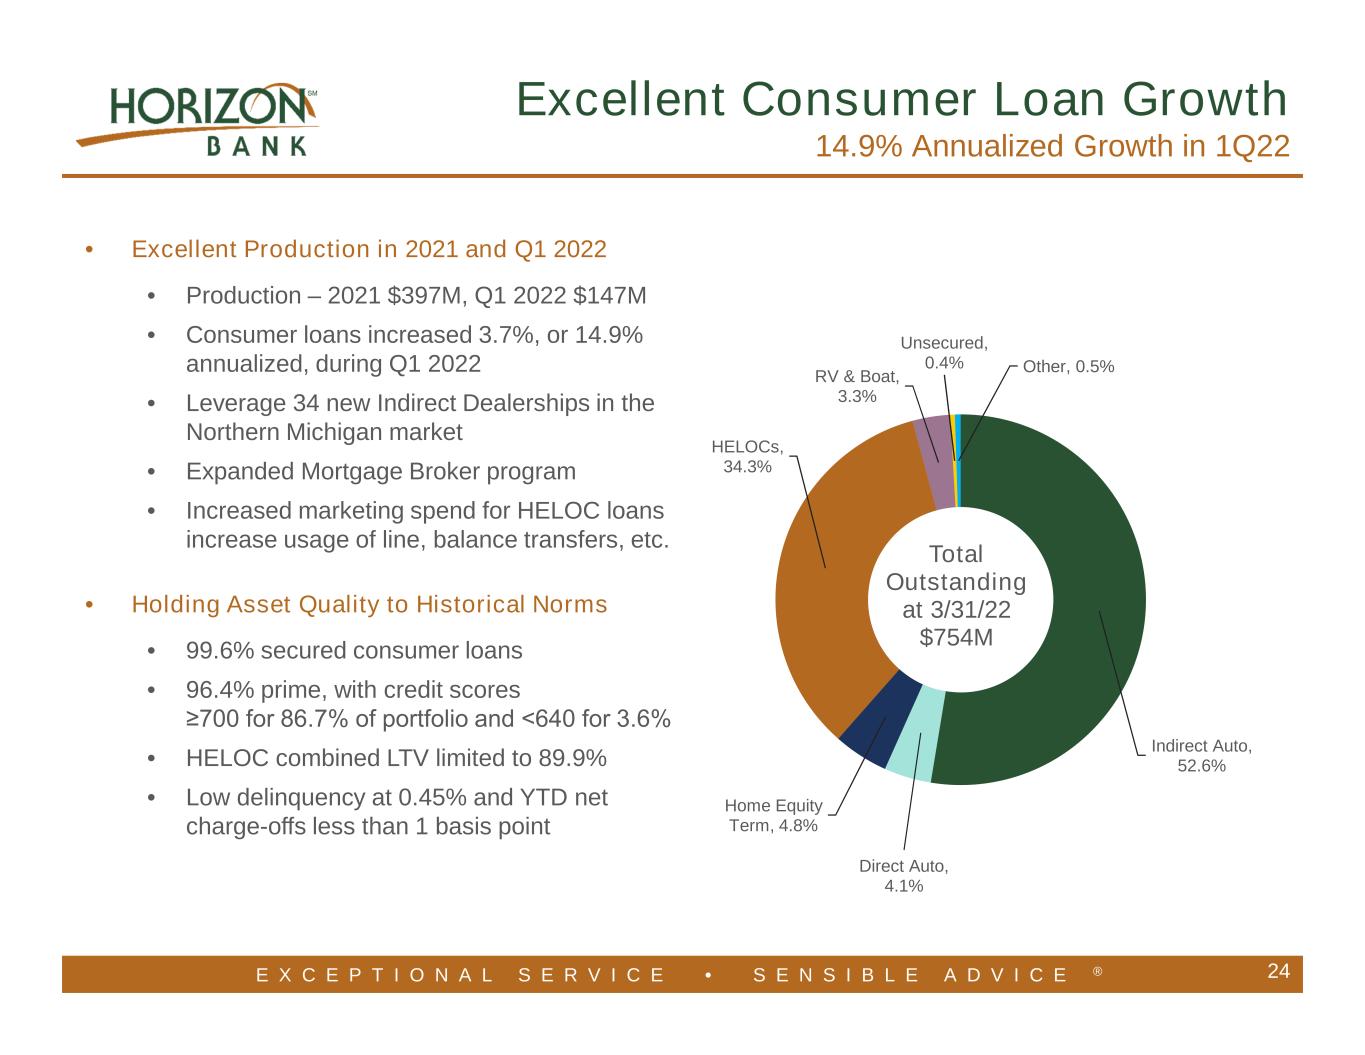
E X C E P T I O N A L S E R V I C E • S E N S I B L E A D V I C E ® 24 • Excellent Production in 2021 and Q1 2022 • Production – 2021 $397M, Q1 2022 $147M • Consumer loans increased 3.7%, or 14.9% annualized, during Q1 2022 • Leverage 34 new Indirect Dealerships in the Northern Michigan market • Expanded Mortgage Broker program • Increased marketing spend for HELOC loans increase usage of line, balance transfers, etc. • Holding Asset Quality to Historical Norms • 99.6% secured consumer loans • 96.4% prime, with credit scores ≥700 for 86.7% of portfolio and <640 for 3.6% • HELOC combined LTV limited to 89.9% • Low delinquency at 0.45% and YTD net charge-offs less than 1 basis point Indirect Auto, 52.6% Direct Auto, 4.1% Home Equity Term, 4.8% HELOCs, 34.3% RV & Boat, 3.3% Unsecured, 0.4% Other, 0.5% Total Outstanding at 3/31/22 $754M Excellent Consumer Loan Growth 14.9% Annualized Growth in 1Q22
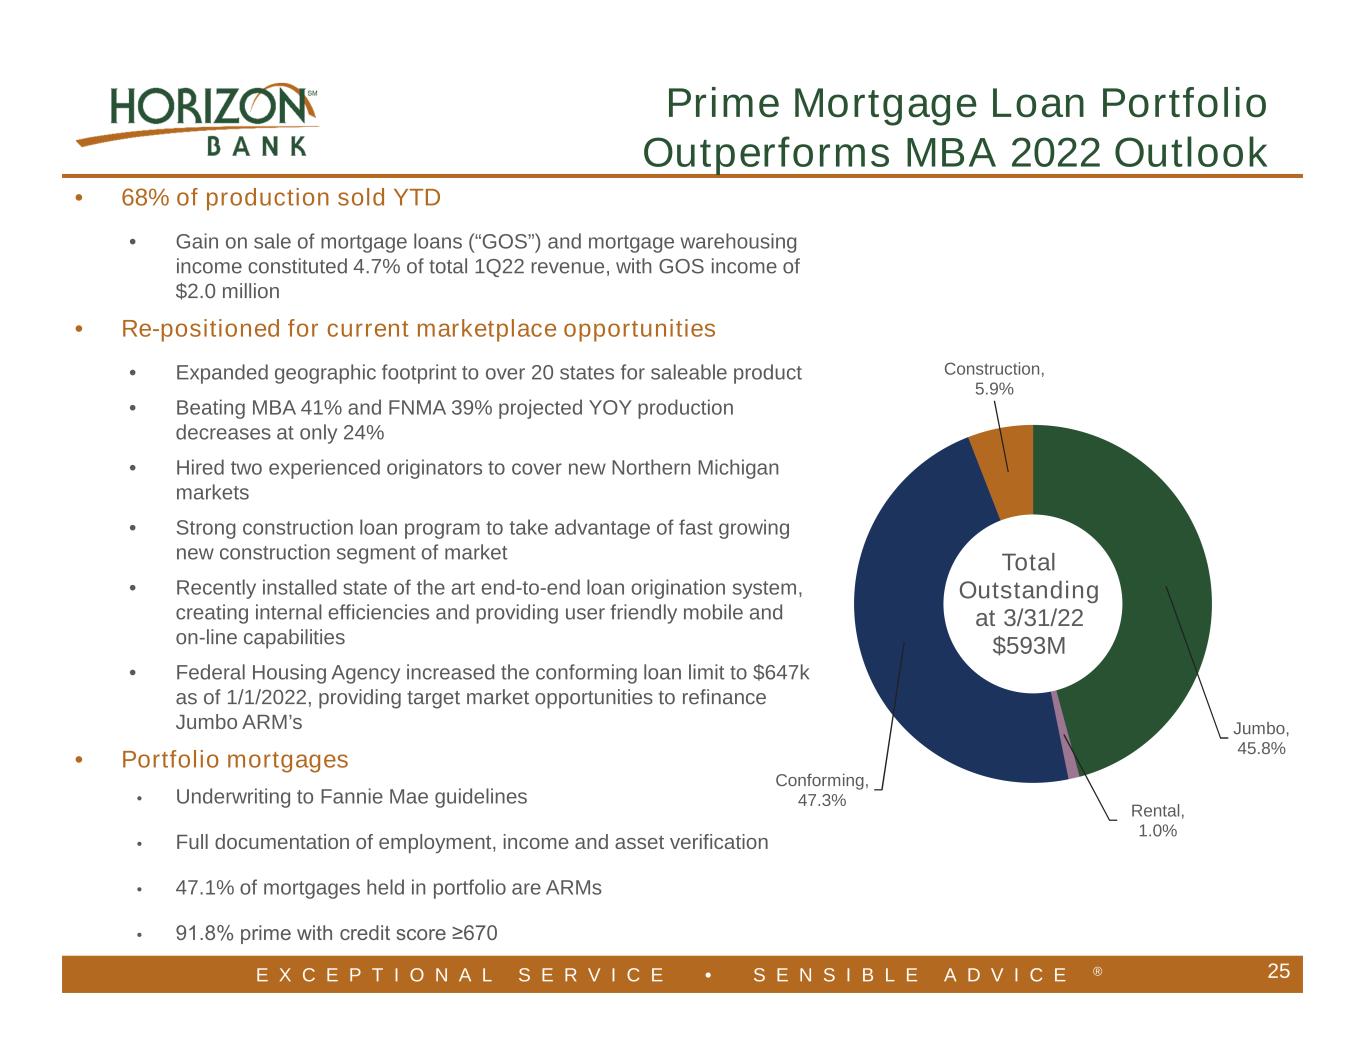
E X C E P T I O N A L S E R V I C E • S E N S I B L E A D V I C E ® 25 Jumbo, 45.8% Rental, 1.0% Conforming, 47.3% Construction, 5.9% Total Outstanding at 3/31/22 $593M • 68% of production sold YTD • Gain on sale of mortgage loans (“GOS”) and mortgage warehousing income constituted 4.7% of total 1Q22 revenue, with GOS income of $2.0 million • Re-positioned for current marketplace opportunities • Expanded geographic footprint to over 20 states for saleable product • Beating MBA 41% and FNMA 39% projected YOY production decreases at only 24% • Hired two experienced originators to cover new Northern Michigan markets • Strong construction loan program to take advantage of fast growing new construction segment of market • Recently installed state of the art end-to-end loan origination system, creating internal efficiencies and providing user friendly mobile and on-line capabilities • Federal Housing Agency increased the conforming loan limit to $647k as of 1/1/2022, providing target market opportunities to refinance Jumbo ARM’s • Portfolio mortgages • Underwriting to Fannie Mae guidelines • Full documentation of employment, income and asset verification • 47.1% of mortgages held in portfolio are ARMs • 91.8% prime with credit score ≥670 Prime Mortgage Loan Portfolio Outperforms MBA 2022 Outlook
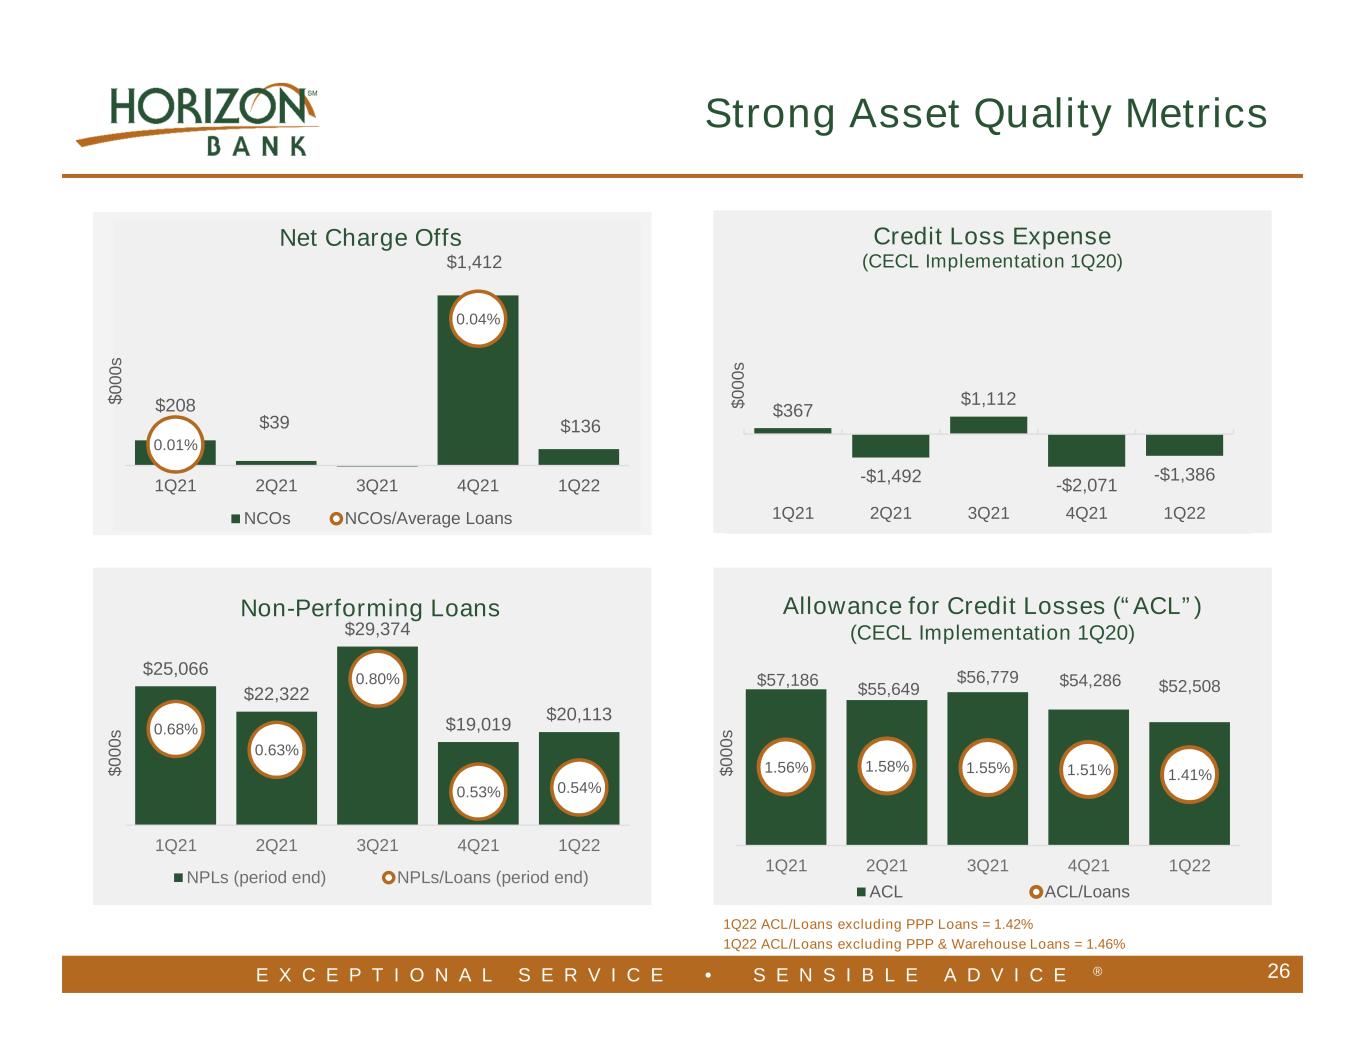
E X C E P T I O N A L S E R V I C E • S E N S I B L E A D V I C E ® $208 $39 $1,412 $136 0.01% 0.04% 1Q21 2Q21 3Q21 4Q21 1Q22 Net Charge Offs NCOs NCOs/Average Loans $ 0 0 0 s $25,066 $22,322 $29,374 $19,019 $20,113 0.68% 0.63% 0.80% 0.53% 0.54% 1Q21 2Q21 3Q21 4Q21 1Q22 Non-Performing Loans NPLs (period end) NPLs/Loans (period end) $ 0 0 0 s $367 -$1,492 $1,112 -$2,071 -$1,386 1Q21 2Q21 3Q21 4Q21 1Q22 $ 0 0 0 s 26 CECL $57,186 $55,649 $56,779 $54,286 $52,508 1.56% 1.58% 1.55% 1.51% 1.41% 1Q21 2Q21 3Q21 4Q21 1Q22 ACL ACL/Loans Strong Asset Quality Metrics Allowance for Credit Losses (“ACL”) (CECL Implementation 1Q20) $ 0 0 0 s Credit Loss Expense (CECL Implementation 1Q20) 1Q22 ACL/Loans excluding PPP Loans = 1.42% 1Q22 ACL/Loans excluding PPP & Warehouse Loans = 1.46%
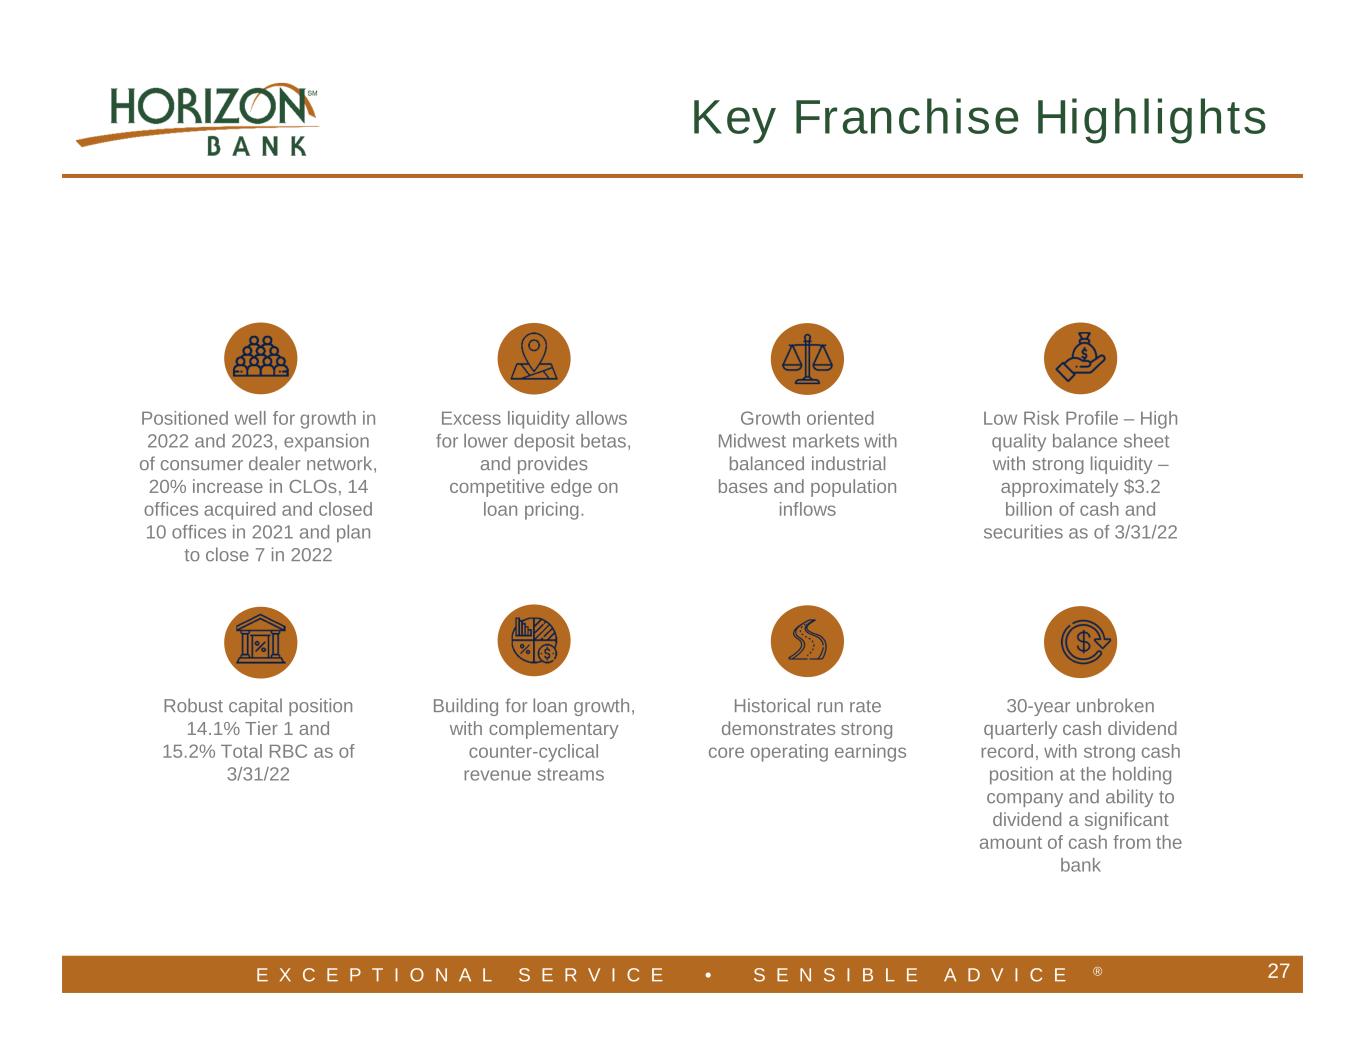
E X C E P T I O N A L S E R V I C E • S E N S I B L E A D V I C E ® 27 Key Franchise Highlights Positioned well for growth in 2022 and 2023, expansion of consumer dealer network, 20% increase in CLOs, 14 offices acquired and closed 10 offices in 2021 and plan to close 7 in 2022 Excess liquidity allows for lower deposit betas, and provides competitive edge on loan pricing. Growth oriented Midwest markets with balanced industrial bases and population inflows Low Risk Profile – High quality balance sheet with strong liquidity – approximately $3.2 billion of cash and securities as of 3/31/22 Robust capital position 14.1% Tier 1 and 15.2% Total RBC as of 3/31/22 Building for loan growth, with complementary counter-cyclical revenue streams Historical run rate demonstrates strong core operating earnings 30-year unbroken quarterly cash dividend record, with strong cash position at the holding company and ability to dividend a significant amount of cash from the bank
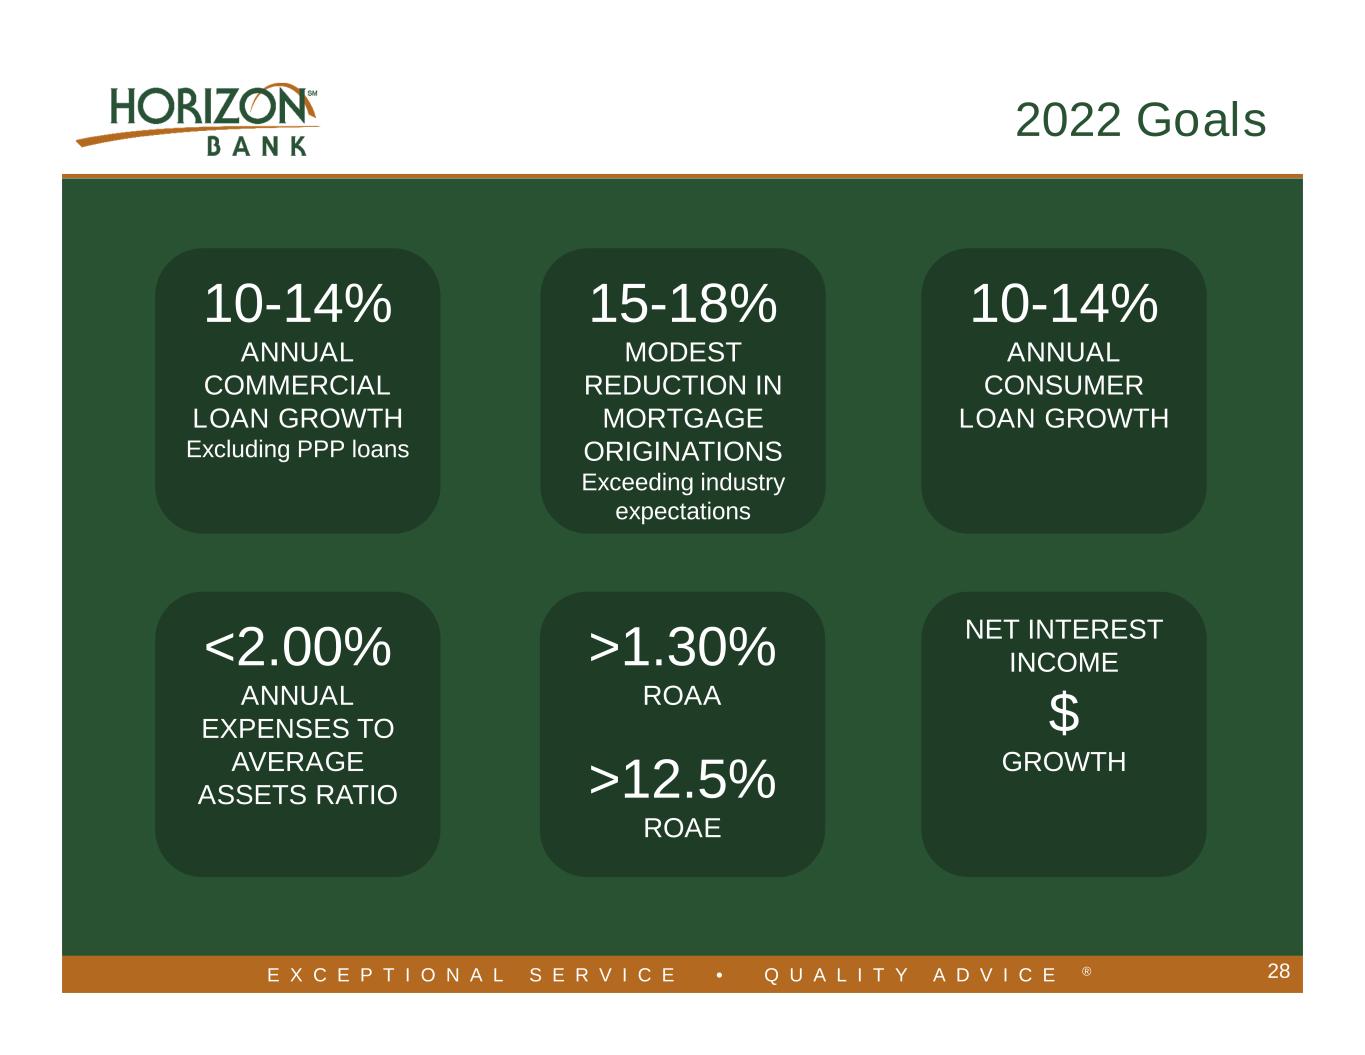
E X C E P T I O N A L S E R V I C E • S E N S I B L E A D V I C E ® 2022 Goals E X C E P T I O N A L S E R V I C E • Q U A L I T Y A D V I C E ® 28 10-14% ANNUAL COMMERCIAL LOAN GROWTH Excluding PPP loans <2.00% ANNUAL EXPENSES TO AVERAGE ASSETS RATIO >1.30% ROAA >12.5% ROAE NET INTEREST INCOME $ GROWTH 10-14% ANNUAL CONSUMER LOAN GROWTH 15-18% MODEST REDUCTION IN MORTGAGE ORIGINATIONS Exceeding industry expectations
E X C E P T I O N A L S E R V I C E • S E N S I B L E A D V I C E ® 29 Appendix
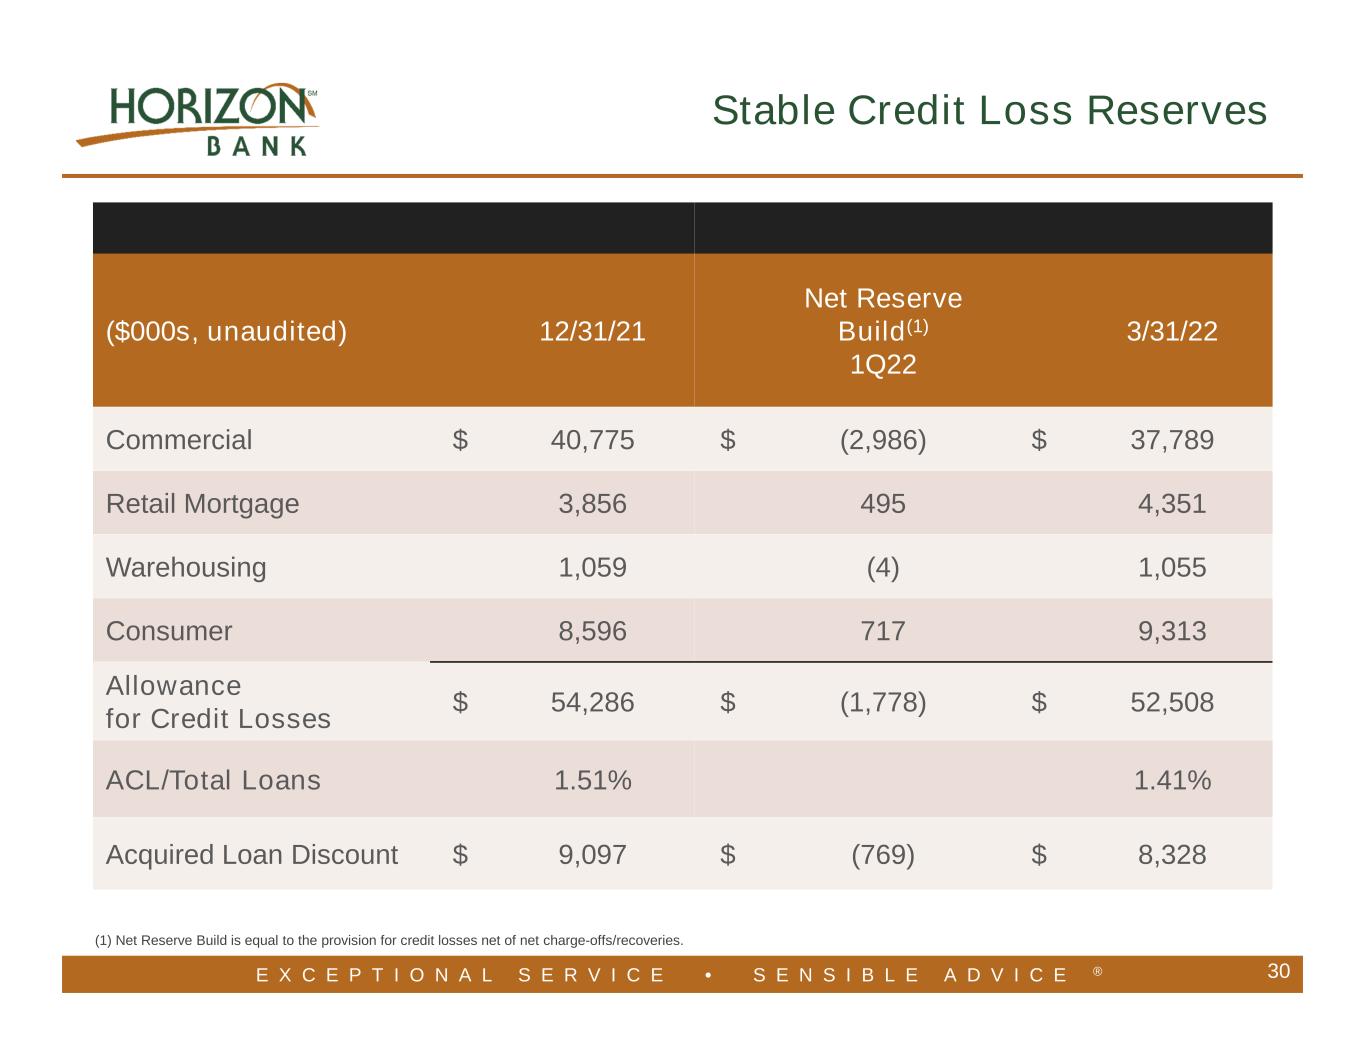
E X C E P T I O N A L S E R V I C E • S E N S I B L E A D V I C E ® 30 (1) Net Reserve Build is equal to the provision for credit losses net of net charge-offs/recoveries. Stable Credit Loss Reserves ($000s, unaudited) 12/31/21 Net Reserve Build(1) 1Q22 3/31/22 Commercial $ 40,775 $ (2,986) $ 37,789 Retail Mortgage 3,856 495 4,351 Warehousing 1,059 (4) 1,055 Consumer 8,596 717 9,313 Allowance for Credit Losses $ 54,286 $ (1,778) $ 52,508 ACL/Total Loans 1.51% 1.41% Acquired Loan Discount $ 9,097 $ (769) $ 8,328
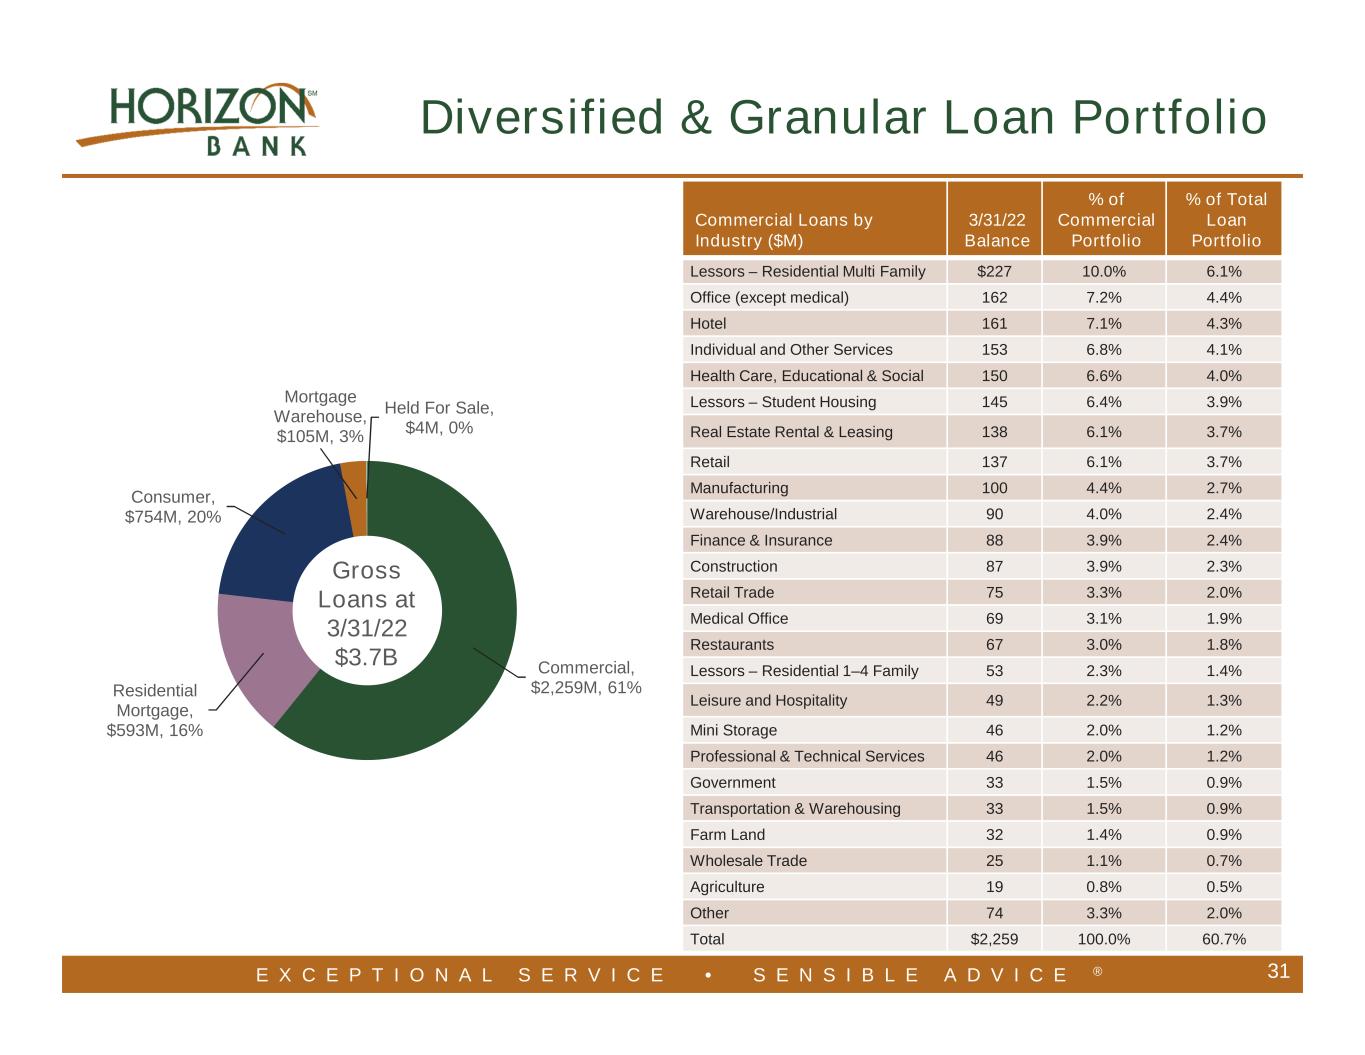
E X C E P T I O N A L S E R V I C E • S E N S I B L E A D V I C E ® Commercial, $2,259M, 61%Residential Mortgage, $593M, 16% Consumer, $754M, 20% Mortgage Warehouse, $105M, 3% Held For Sale, $4M, 0% 31 Gross Loans at 3/31/22 $3.7B Diversified & Granular Loan Portfolio Commercial Loans by Industry ($M) 3/31/22 Balance % of Commercial Portfolio % of Total Loan Portfolio Lessors – Residential Multi Family $227 10.0% 6.1% Office (except medical) 162 7.2% 4.4% Hotel 161 7.1% 4.3% Individual and Other Services 153 6.8% 4.1% Health Care, Educational & Social 150 6.6% 4.0% Lessors – Student Housing 145 6.4% 3.9% Real Estate Rental & Leasing 138 6.1% 3.7% Retail 137 6.1% 3.7% Manufacturing 100 4.4% 2.7% Warehouse/Industrial 90 4.0% 2.4% Finance & Insurance 88 3.9% 2.4% Construction 87 3.9% 2.3% Retail Trade 75 3.3% 2.0% Medical Office 69 3.1% 1.9% Restaurants 67 3.0% 1.8% Lessors – Residential 1–4 Family 53 2.3% 1.4% Leisure and Hospitality 49 2.2% 1.3% Mini Storage 46 2.0% 1.2% Professional & Technical Services 46 2.0% 1.2% Government 33 1.5% 0.9% Transportation & Warehousing 33 1.5% 0.9% Farm Land 32 1.4% 0.9% Wholesale Trade 25 1.1% 0.7% Agriculture 19 0.8% 0.5% Other 74 3.3% 2.0% Total $2,259 100.0% 60.7%
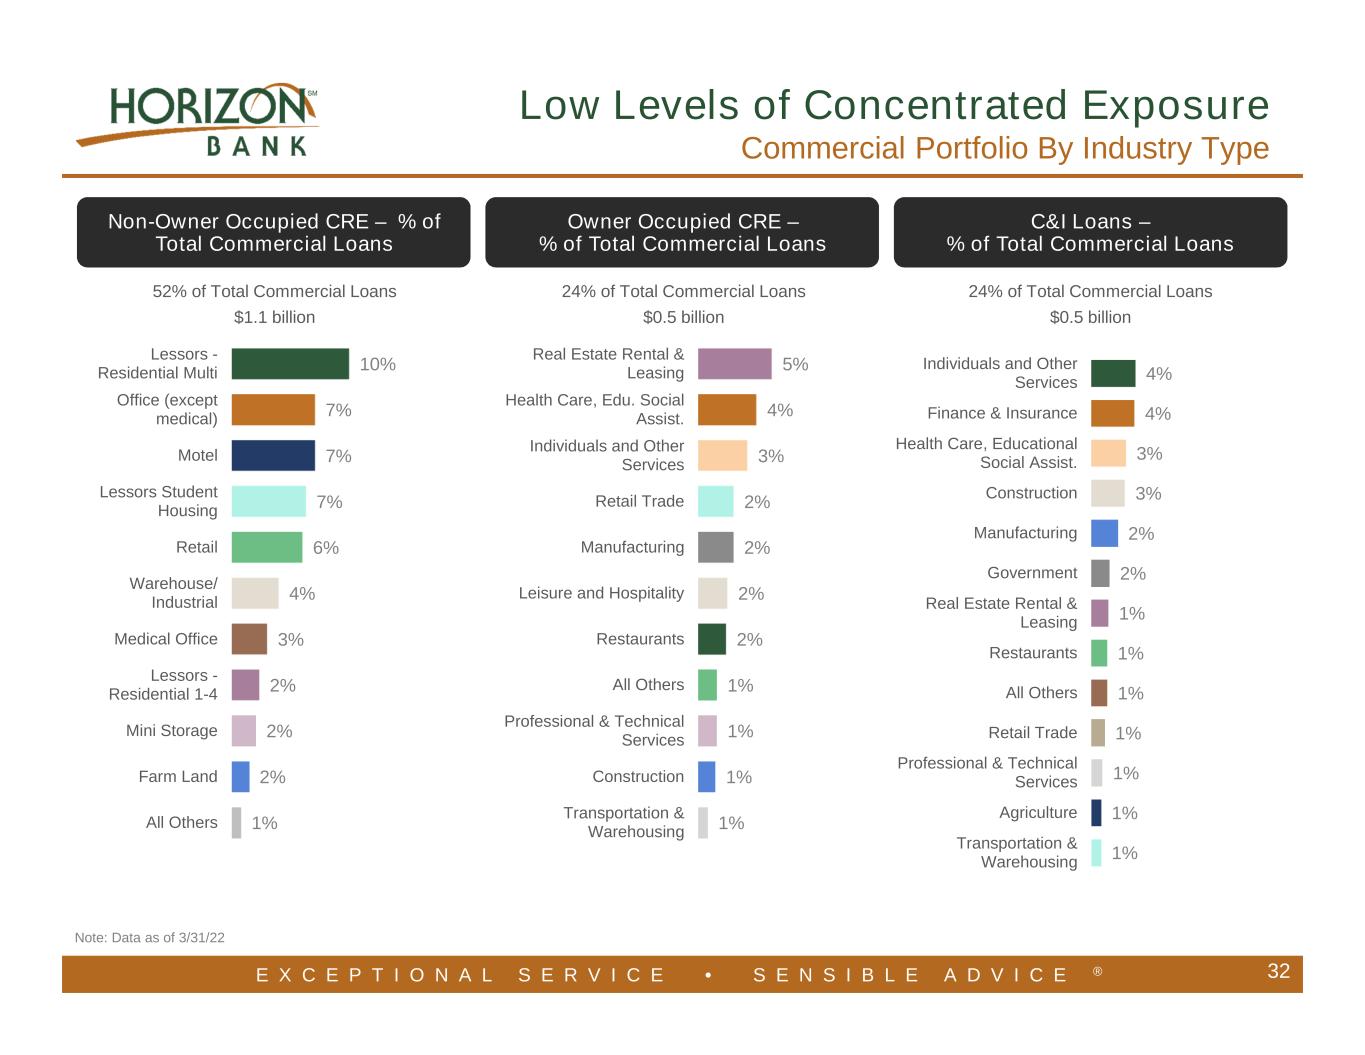
E X C E P T I O N A L S E R V I C E • S E N S I B L E A D V I C E ® 1% 2% 2% 2% 3% 4% 6% 7% 7% 7% 10% All Others Farm Land Mini Storage Lessors - Residential 1-4 Medical Office Warehouse/ Industrial Retail Lessors Student Housing Motel Office (except medical) Lessors - Residential Multi Note: Data as of 3/31/22 1% 1% 1% 1% 2% 2% 2% 2% 3% 4% 5% Transportation & Warehousing Construction Professional & Technical Services All Others Restaurants Leisure and Hospitality Manufacturing Retail Trade Individuals and Other Services Health Care, Edu. Social Assist. Real Estate Rental & Leasing 1% 1% 1% 1% 1% 1% 1% 2% 2% 3% 3% 4% 4% Transportation & Warehousing Agriculture Professional & Technical Services Retail Trade All Others Restaurants Real Estate Rental & Leasing Government Manufacturing Construction Health Care, Educational Social Assist. Finance & Insurance Individuals and Other Services 32 Non-Owner Occupied CRE – % of Total Commercial Loans Owner Occupied CRE – % of Total Commercial Loans 52% of Total Commercial Loans $1.1 billion 24% of Total Commercial Loans $0.5 billion C&I Loans – % of Total Commercial Loans 24% of Total Commercial Loans $0.5 billion Low Levels of Concentrated Exposure Commercial Portfolio By Industry Type
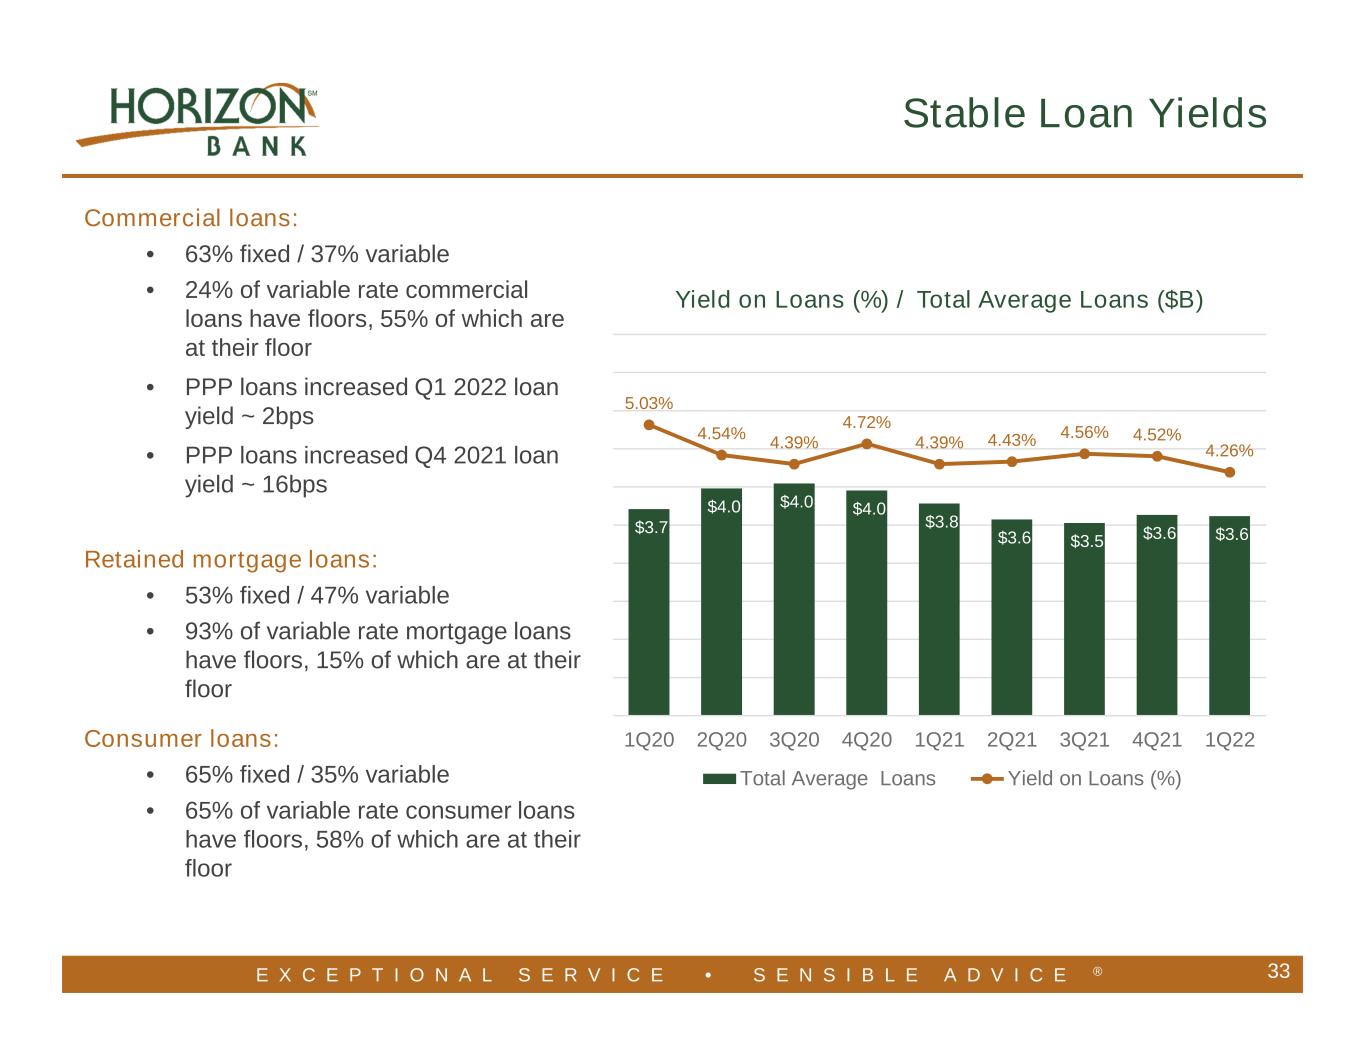
E X C E P T I O N A L S E R V I C E • S E N S I B L E A D V I C E ® Commercial loans: • 63% fixed / 37% variable • 24% of variable rate commercial loans have floors, 55% of which are at their floor • PPP loans increased Q1 2022 loan yield ~ 2bps • PPP loans increased Q4 2021 loan yield ~ 16bps Retained mortgage loans: • 53% fixed / 47% variable • 93% of variable rate mortgage loans have floors, 15% of which are at their floor Consumer loans: • 65% fixed / 35% variable • 65% of variable rate consumer loans have floors, 58% of which are at their floor 33 Stable Loan Yields $3.7 $4.0 $4.0 $4.0 $3.8 $3.6 $3.5 $3.6 $3.6 5.03% 4.54% 4.39% 4.72% 4.39% 4.43% 4.56% 4.52% 4.26% 1Q20 2Q20 3Q20 4Q20 1Q21 2Q21 3Q21 4Q21 1Q22 Yield on Loans (%) / Total Average Loans ($B) Total Average Loans Yield on Loans (%)
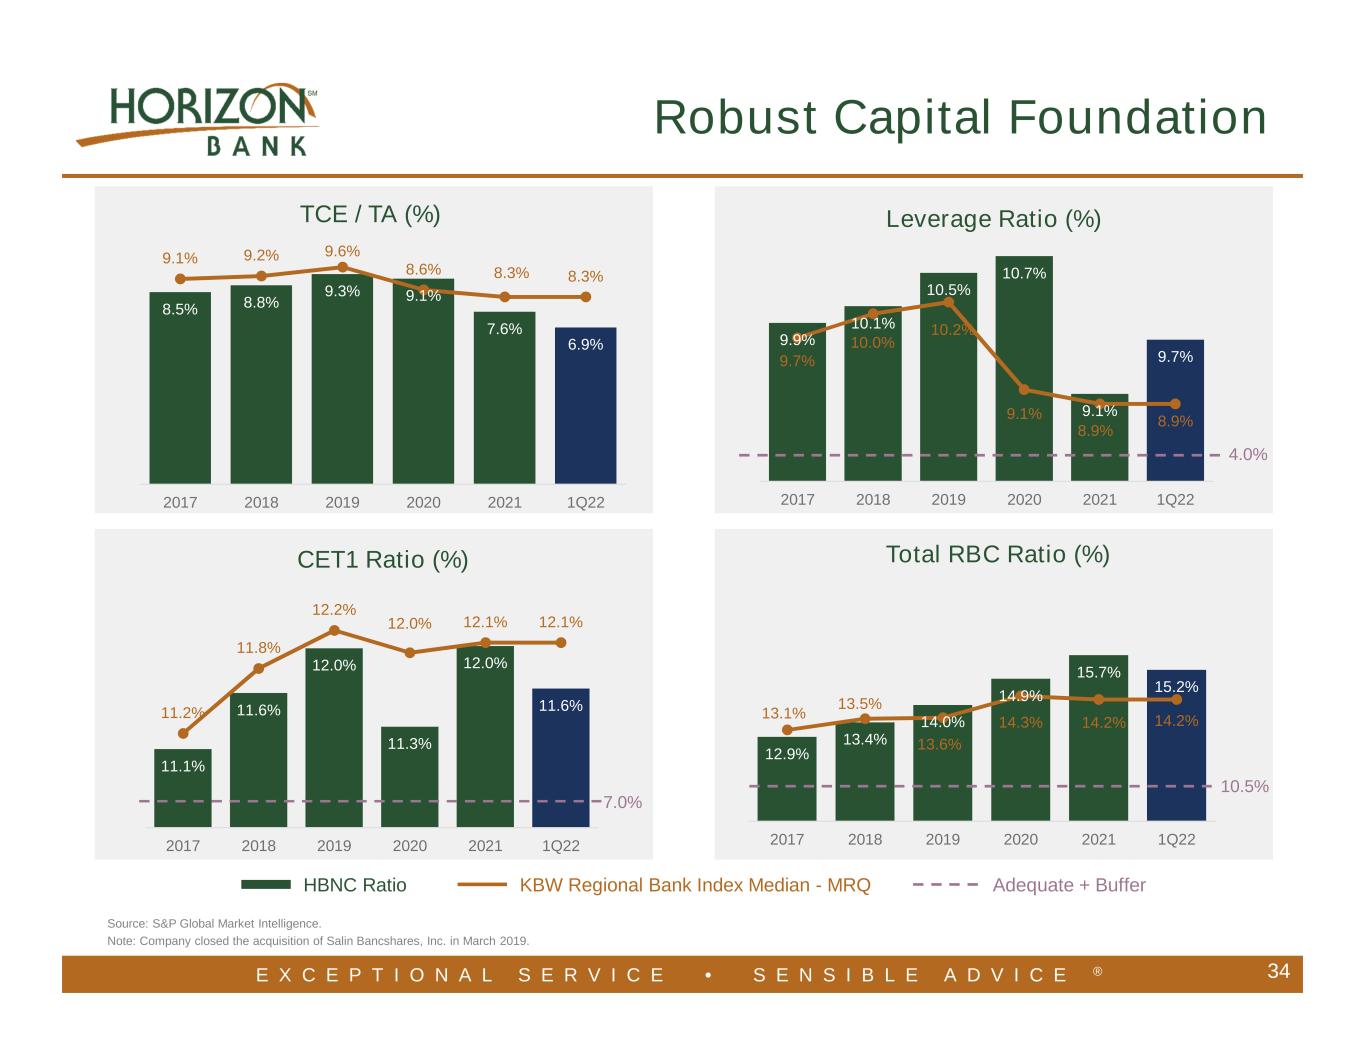
E X C E P T I O N A L S E R V I C E • S E N S I B L E A D V I C E ® 11.1% 11.6% 12.0% 11.3% 12.0% 11.6%11.2% 11.8% 12.2% 12.0% 12.1% 12.1% 2017 2018 2019 2020 2021 1Q22 9.9% 10.1% 10.5% 10.7% 9.1% 9.7%9.7% 10.0% 10.2% 9.1% 8.9% 8.9% 2017 2018 2019 2020 2021 1Q22 12.9% 13.4% 14.0% 14.9% 15.7% 15.2% 13.1% 13.5% 13.6% 14.3% 14.2% 14.2% 2017 2018 2019 2020 2021 1Q22 Source: S&P Global Market Intelligence. Note: Company closed the acquisition of Salin Bancshares, Inc. in March 2019. 34 TCE / TA (%) Leverage Ratio (%) Total RBC Ratio (%) 4.0% Adequate + Buffer 7.0% KBW Regional Bank Index Median - MRQ Robust Capital Foundation 10.5% HBNC Ratio 8.5% 8.8% 9.3% 9.1% 7.6% 6.9% 9.1% 9.2% 9.6% 8.6% 8.3% 8.3% 2017 2018 2019 2020 2021 1Q22 CET1 Ratio (%)
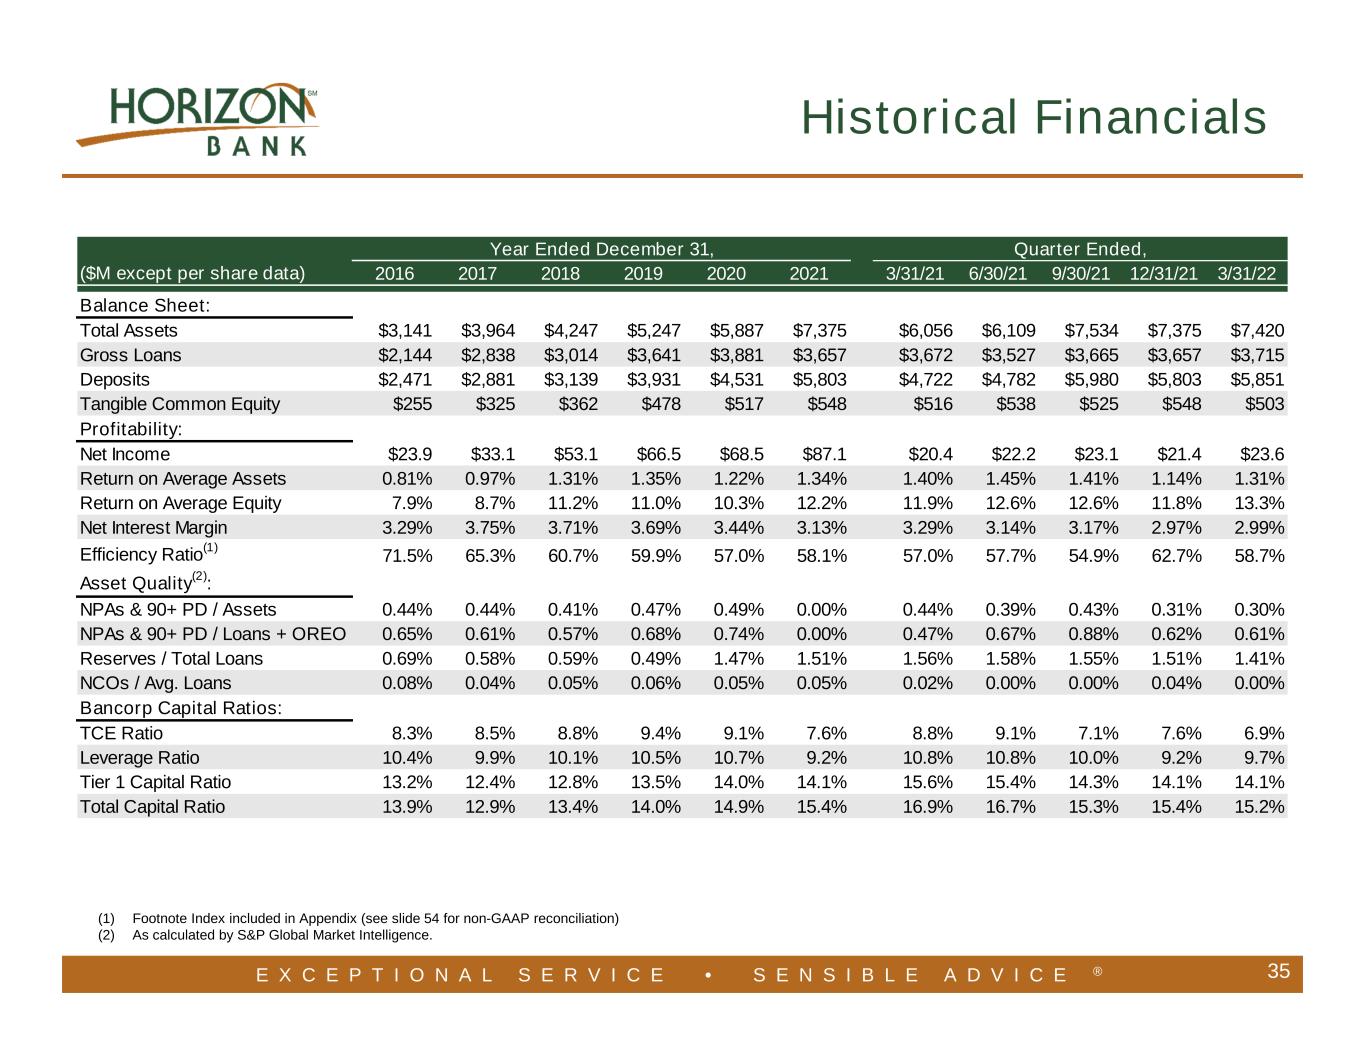
E X C E P T I O N A L S E R V I C E • S E N S I B L E A D V I C E ® 35 (1) Footnote Index included in Appendix (see slide 54 for non-GAAP reconciliation) (2) As calculated by S&P Global Market Intelligence. Historical Financials ($M except per share data) 2016 2017 2018 2019 2020 2021 3/31/21 6/30/21 9/30/21 12/31/21 3/31/22 Balance Sheet: Total Assets $3,141 $3,964 $4,247 $5,247 $5,887 $7,375 $6,056 $6,109 $7,534 $7,375 $7,420 Gross Loans $2,144 $2,838 $3,014 $3,641 $3,881 $3,657 $3,672 $3,527 $3,665 $3,657 $3,715 Deposits $2,471 $2,881 $3,139 $3,931 $4,531 $5,803 $4,722 $4,782 $5,980 $5,803 $5,851 Tangible Common Equity $255 $325 $362 $478 $517 $548 $516 $538 $525 $548 $503 Profitability: Net Income $23.9 $33.1 $53.1 $66.5 $68.5 $87.1 $20.4 $22.2 $23.1 $21.4 $23.6 Return on Average Assets 0.81% 0.97% 1.31% 1.35% 1.22% 1.34% 1.40% 1.45% 1.41% 1.14% 1.31% Return on Average Equity 7.9% 8.7% 11.2% 11.0% 10.3% 12.2% 11.9% 12.6% 12.6% 11.8% 13.3% Net Interest Margin 3.29% 3.75% 3.71% 3.69% 3.44% 3.13% 3.29% 3.14% 3.17% 2.97% 2.99% Efficiency Ratio (1) 71.5% 65.3% 60.7% 59.9% 57.0% 58.1% 57.0% 57.7% 54.9% 62.7% 58.7% Asset Quality (2) : NPAs & 90+ PD / Assets 0.44% 0.44% 0.41% 0.47% 0.49% 0.00% 0.44% 0.39% 0.43% 0.31% 0.30% NPAs & 90+ PD / Loans + OREO 0.65% 0.61% 0.57% 0.68% 0.74% 0.00% 0.47% 0.67% 0.88% 0.62% 0.61% Reserves / Total Loans 0.69% 0.58% 0.59% 0.49% 1.47% 1.51% 1.56% 1.58% 1.55% 1.51% 1.41% NCOs / Avg. Loans 0.08% 0.04% 0.05% 0.06% 0.05% 0.05% 0.02% 0.00% 0.00% 0.04% 0.00% Bancorp Capital Ratios: TCE Ratio 8.3% 8.5% 8.8% 9.4% 9.1% 7.6% 8.8% 9.1% 7.1% 7.6% 6.9% Leverage Ratio 10.4% 9.9% 10.1% 10.5% 10.7% 9.2% 10.8% 10.8% 10.0% 9.2% 9.7% Tier 1 Capital Ratio 13.2% 12.4% 12.8% 13.5% 14.0% 14.1% 15.6% 15.4% 14.3% 14.1% 14.1% Total Capital Ratio 13.9% 12.9% 13.4% 14.0% 14.9% 15.4% 16.9% 16.7% 15.3% 15.4% 15.2% Year Ended December 31, Quarter Ended,

E X C E P T I O N A L S E R V I C E • S E N S I B L E A D V I C E ® 36 Leader In Our Core Markets Source: S&P Global Market Intelligence. Deposit data as of 6/30/21, estimated pro forma for recent or pending transactions per S&P Global Market Intelligence MSA HBNC Rank HBNC Branches HBNC Market Share Deposits in Market ($M) Michigan City-La Porte, IN 1 9 60.0% $1,341 Indianapolis-Carmel-Anderson, IN 17 8 0.9% 687 Chicago-Naperville-Elgin, IL-IN-WI 52 10 0.1% 609 Lafayette-West Lafayette, IN 4 6 7.4% 330 Lansing-East Lansing, MI 12 4 2.9% 288 Niles, MI 4 5 13.1% 272 Midland, MI 2 2 19.1% 246 Cadillac, MI 2 3 31.3% 225 Detroit-Warren-Dearborn, MI 28 1 0.1% 177 Logansport, IN 3 1 18.2% 161 Grand Rapids-Kentwood, MI 20 2 0.5% 135 Auburn, IN 3 2 15.1% 129 Columbus, IN 5 2 6.1% 110 Warsaw, IN 5 3 5.3% 100 Big Rapids, MI 4 1 15.0% 96 Kalamazoo-Portage, MI 9 1 2.1% 93 Fort Wayne, IN 15 3 1.0% 91 Marion, IN 6 1 6.8% 64 Sturgis, MI 5 1 6.4% 63 Kokomo, IN 7 1 3.2% 50 Kendallville, IN 5 1 5.7% 44 South Bend-Mishawaka, IN-MI 13 1 0.7% 38 Saginaw, MI 12 1 0.8% 21 Elkhart-Goshen, IN 14 1 0.3% 15 Total Franchise 80 $5,838
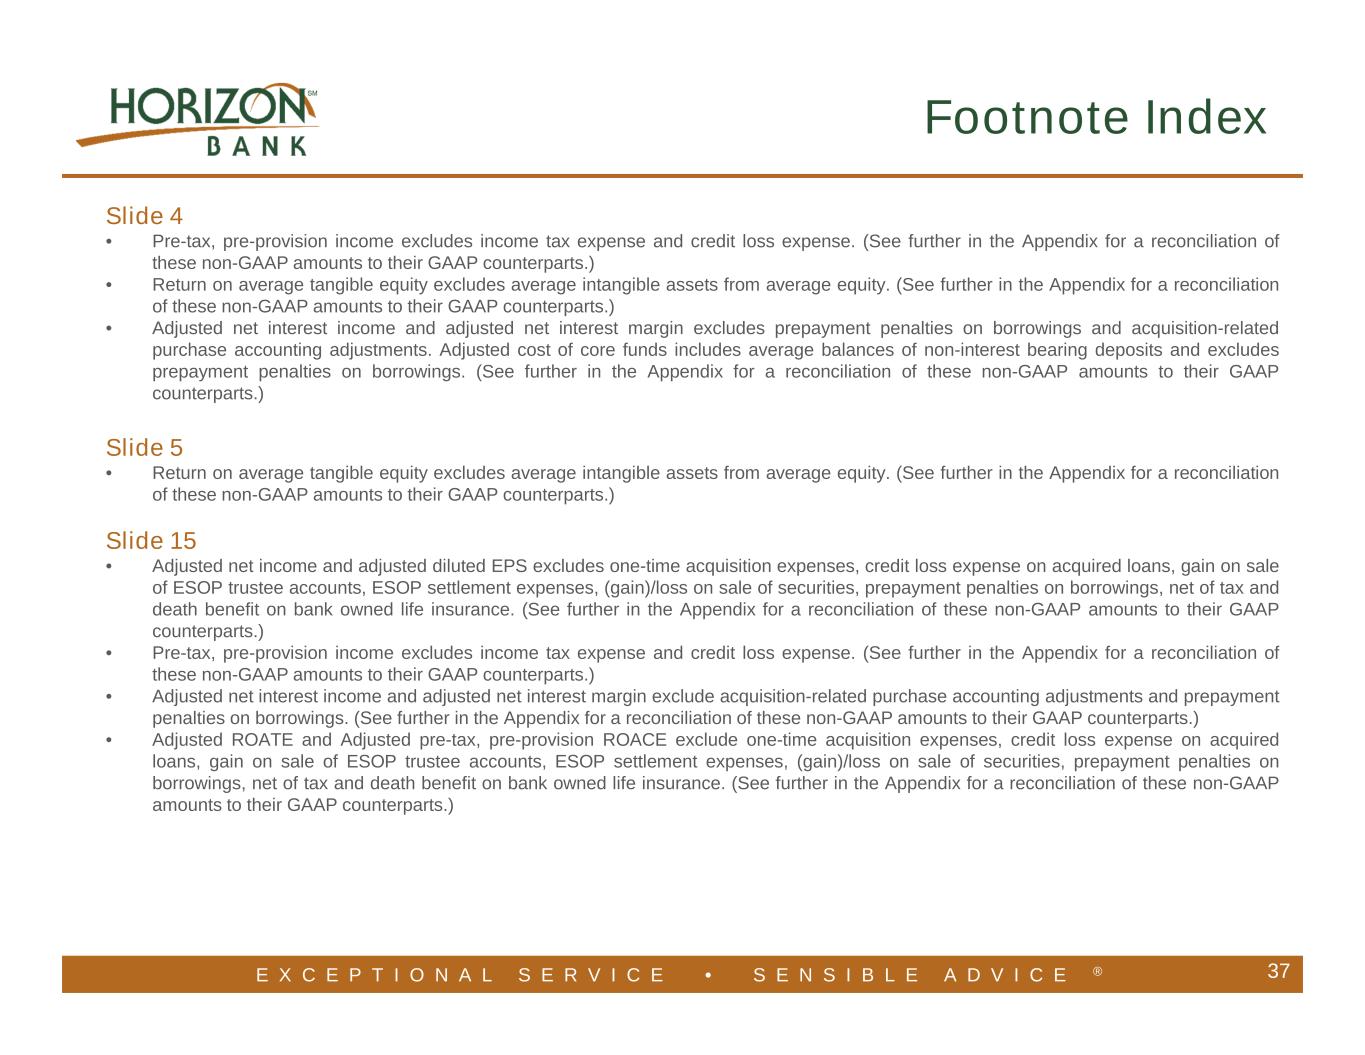
E X C E P T I O N A L S E R V I C E • S E N S I B L E A D V I C E ® 37 Slide 4 • Pre-tax, pre-provision income excludes income tax expense and credit loss expense. (See further in the Appendix for a reconciliation of these non-GAAP amounts to their GAAP counterparts.) • Return on average tangible equity excludes average intangible assets from average equity. (See further in the Appendix for a reconciliation of these non-GAAP amounts to their GAAP counterparts.) • Adjusted net interest income and adjusted net interest margin excludes prepayment penalties on borrowings and acquisition-related purchase accounting adjustments. Adjusted cost of core funds includes average balances of non-interest bearing deposits and excludes prepayment penalties on borrowings. (See further in the Appendix for a reconciliation of these non-GAAP amounts to their GAAP counterparts.) Slide 5 • Return on average tangible equity excludes average intangible assets from average equity. (See further in the Appendix for a reconciliation of these non-GAAP amounts to their GAAP counterparts.) Slide 15 • Adjusted net income and adjusted diluted EPS excludes one-time acquisition expenses, credit loss expense on acquired loans, gain on sale of ESOP trustee accounts, ESOP settlement expenses, (gain)/loss on sale of securities, prepayment penalties on borrowings, net of tax and death benefit on bank owned life insurance. (See further in the Appendix for a reconciliation of these non-GAAP amounts to their GAAP counterparts.) • Pre-tax, pre-provision income excludes income tax expense and credit loss expense. (See further in the Appendix for a reconciliation of these non-GAAP amounts to their GAAP counterparts.) • Adjusted net interest income and adjusted net interest margin exclude acquisition-related purchase accounting adjustments and prepayment penalties on borrowings. (See further in the Appendix for a reconciliation of these non-GAAP amounts to their GAAP counterparts.) • Adjusted ROATE and Adjusted pre-tax, pre-provision ROACE exclude one-time acquisition expenses, credit loss expense on acquired loans, gain on sale of ESOP trustee accounts, ESOP settlement expenses, (gain)/loss on sale of securities, prepayment penalties on borrowings, net of tax and death benefit on bank owned life insurance. (See further in the Appendix for a reconciliation of these non-GAAP amounts to their GAAP counterparts.) Footnote Index
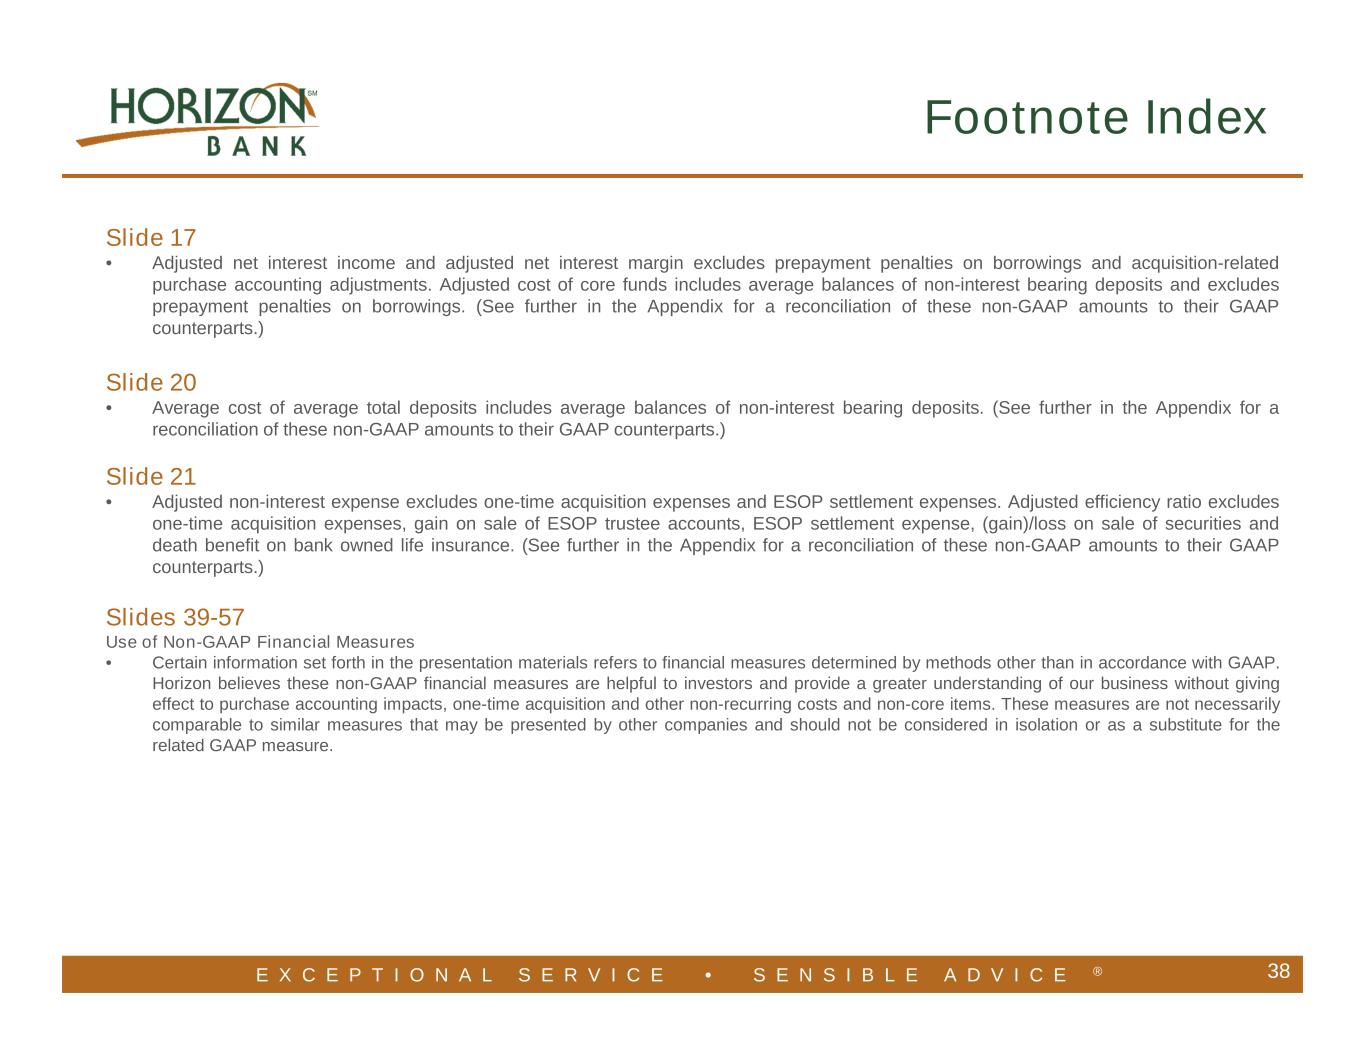
E X C E P T I O N A L S E R V I C E • S E N S I B L E A D V I C E ® 38 Slide 17 • Adjusted net interest income and adjusted net interest margin excludes prepayment penalties on borrowings and acquisition-related purchase accounting adjustments. Adjusted cost of core funds includes average balances of non-interest bearing deposits and excludes prepayment penalties on borrowings. (See further in the Appendix for a reconciliation of these non-GAAP amounts to their GAAP counterparts.) Slide 20 • Average cost of average total deposits includes average balances of non-interest bearing deposits. (See further in the Appendix for a reconciliation of these non-GAAP amounts to their GAAP counterparts.) Slide 21 • Adjusted non-interest expense excludes one-time acquisition expenses and ESOP settlement expenses. Adjusted efficiency ratio excludes one-time acquisition expenses, gain on sale of ESOP trustee accounts, ESOP settlement expense, (gain)/loss on sale of securities and death benefit on bank owned life insurance. (See further in the Appendix for a reconciliation of these non-GAAP amounts to their GAAP counterparts.) Slides 39-57 Use of Non-GAAP Financial Measures • Certain information set forth in the presentation materials refers to financial measures determined by methods other than in accordance with GAAP. Horizon believes these non-GAAP financial measures are helpful to investors and provide a greater understanding of our business without giving effect to purchase accounting impacts, one-time acquisition and other non-recurring costs and non-core items. These measures are not necessarily comparable to similar measures that may be presented by other companies and should not be considered in isolation or as a substitute for the related GAAP measure. Footnote Index
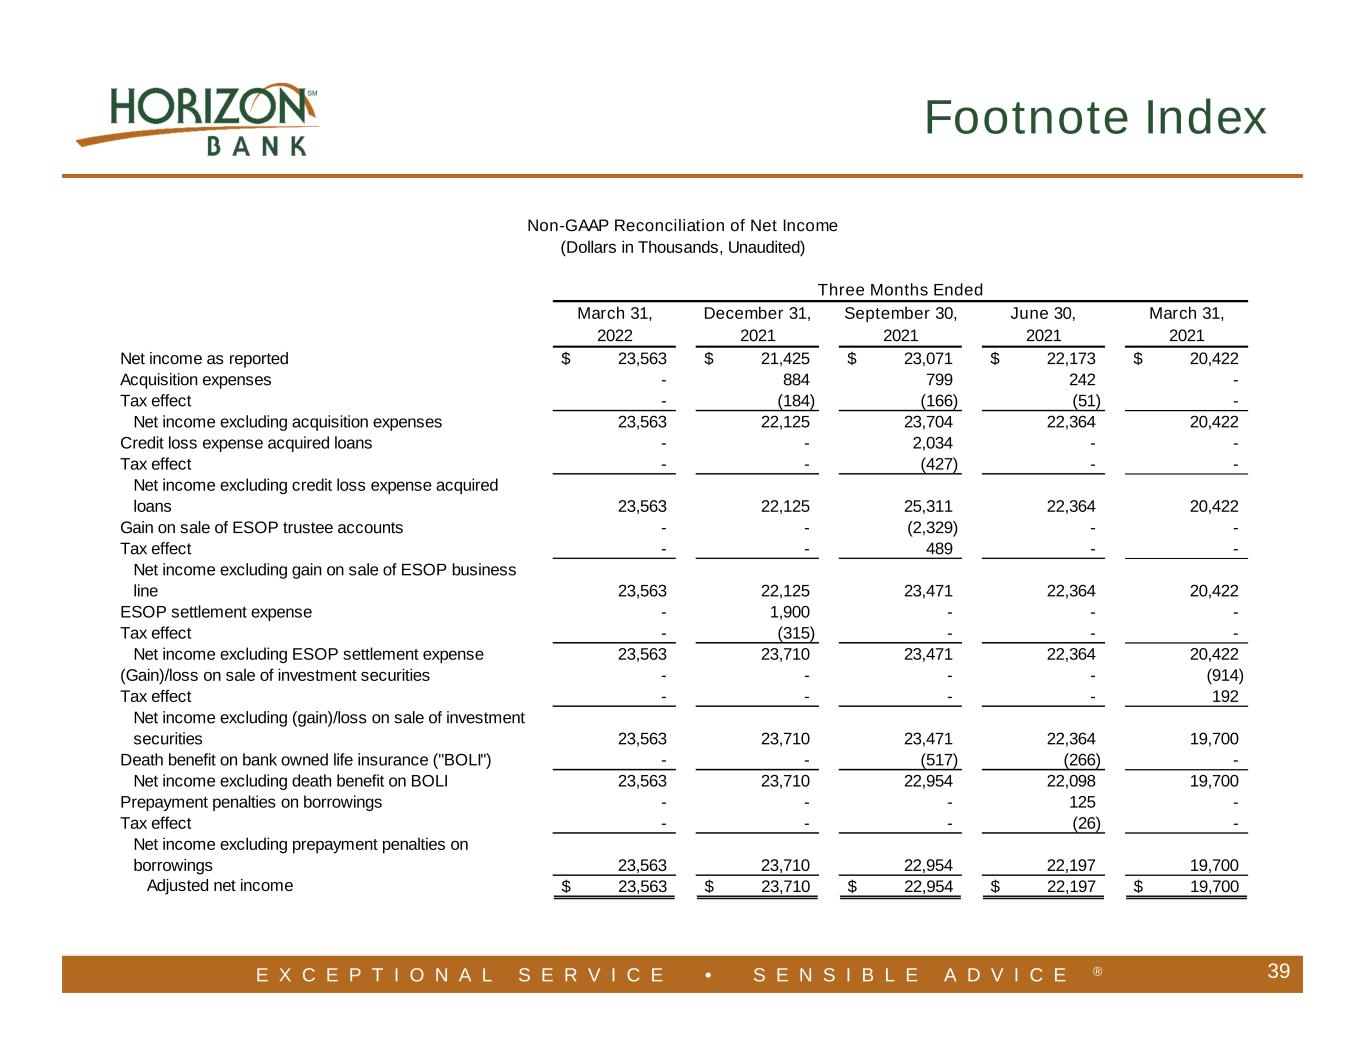
E X C E P T I O N A L S E R V I C E • S E N S I B L E A D V I C E ® 39 Footnote Index March 31, December 31, September 30, June 30, March 31, 2022 2021 2021 2021 2021 Net income as reported 23,563$ 21,425$ 23,071$ 22,173$ 20,422$ Acquisition expenses - 884 799 242 - Tax effect - (184) (166) (51) - Net income excluding acquisition expenses 23,563 22,125 23,704 22,364 20,422 Credit loss expense acquired loans - - 2,034 - - Tax effect - - (427) - - Net income excluding credit loss expense acquired loans 23,563 22,125 25,311 22,364 20,422 Gain on sale of ESOP trustee accounts - - (2,329) - - Tax effect - - 489 - - Net income excluding gain on sale of ESOP business line 23,563 22,125 23,471 22,364 20,422 ESOP settlement expense - 1,900 - - - Tax effect - (315) - - - Net income excluding ESOP settlement expense 23,563 23,710 23,471 22,364 20,422 (Gain)/loss on sale of investment securities - - - - (914) Tax effect - - - - 192 Net income excluding (gain)/loss on sale of investment securities 23,563 23,710 23,471 22,364 19,700 Death benefit on bank owned life insurance ("BOLI") - - (517) (266) - Net income excluding death benefit on BOLI 23,563 23,710 22,954 22,098 19,700 Prepayment penalties on borrowings - - - 125 - Tax effect - - - (26) - Net income excluding prepayment penalties on borrowings 23,563 23,710 22,954 22,197 19,700 Adjusted net income 23,563$ 23,710$ 22,954$ 22,197$ 19,700$ Three Months Ended Non-GAAP Reconciliation of Net Income (Dollars in Thousands, Unaudited)
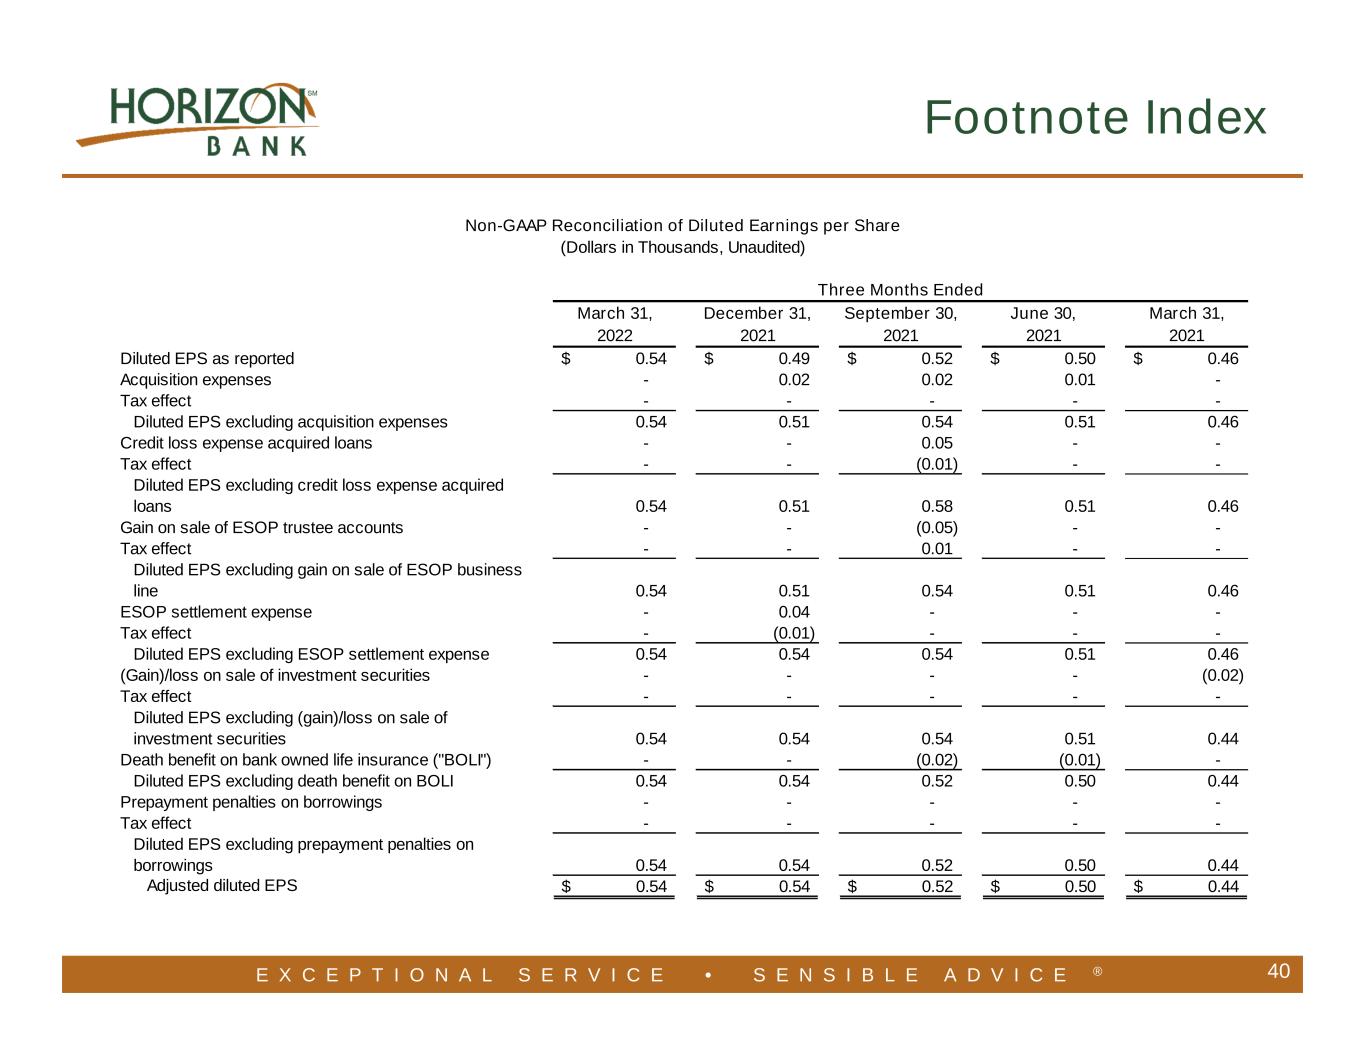
E X C E P T I O N A L S E R V I C E • S E N S I B L E A D V I C E ® 40 Footnote Index March 31, December 31, September 30, June 30, March 31, 2022 2021 2021 2021 2021 Diluted EPS as reported 0.54$ 0.49$ 0.52$ 0.50$ 0.46$ Acquisition expenses - 0.02 0.02 0.01 - Tax effect - - - - - Diluted EPS excluding acquisition expenses 0.54 0.51 0.54 0.51 0.46 Credit loss expense acquired loans - - 0.05 - - Tax effect - - (0.01) - - Diluted EPS excluding credit loss expense acquired loans 0.54 0.51 0.58 0.51 0.46 Gain on sale of ESOP trustee accounts - - (0.05) - - Tax effect - - 0.01 - - Diluted EPS excluding gain on sale of ESOP business line 0.54 0.51 0.54 0.51 0.46 ESOP settlement expense - 0.04 - - - Tax effect - (0.01) - - - Diluted EPS excluding ESOP settlement expense 0.54 0.54 0.54 0.51 0.46 (Gain)/loss on sale of investment securities - - - - (0.02) Tax effect - - - - - Diluted EPS excluding (gain)/loss on sale of investment securities 0.54 0.54 0.54 0.51 0.44 Death benefit on bank owned life insurance ("BOLI") - - (0.02) (0.01) - Diluted EPS excluding death benefit on BOLI 0.54 0.54 0.52 0.50 0.44 Prepayment penalties on borrowings - - - - - Tax effect - - - - - Diluted EPS excluding prepayment penalties on borrowings 0.54 0.54 0.52 0.50 0.44 Adjusted diluted EPS 0.54$ 0.54$ 0.52$ 0.50$ 0.44$ Three Months Ended Non-GAAP Reconciliation of Diluted Earnings per Share (Dollars in Thousands, Unaudited)
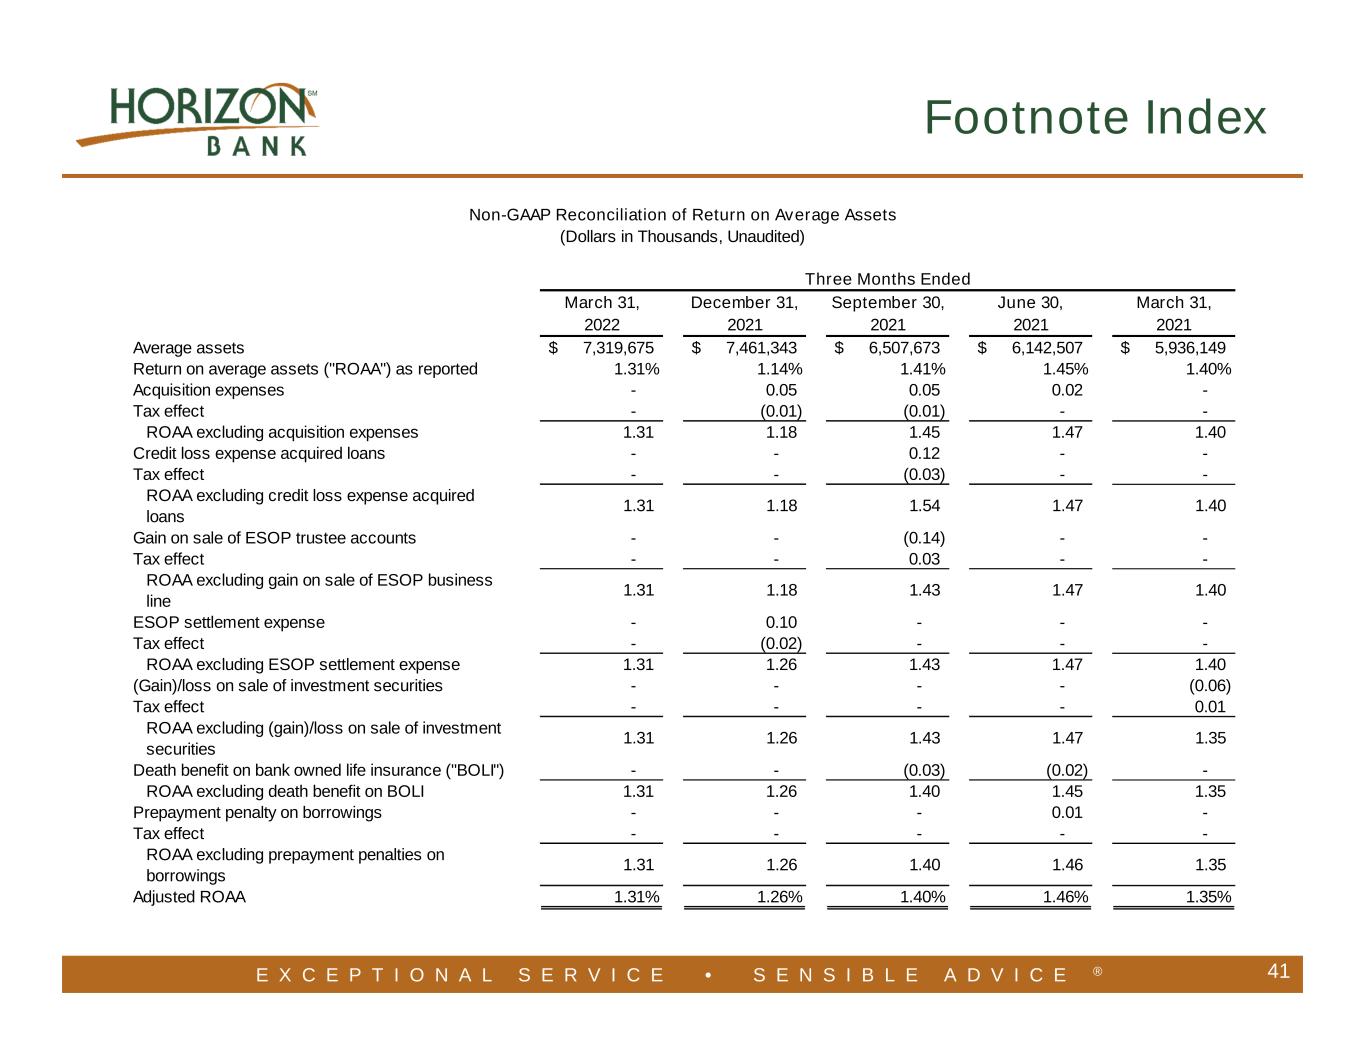
E X C E P T I O N A L S E R V I C E • S E N S I B L E A D V I C E ® 41 Footnote Index March 31, December 31, September 30, June 30, March 31, 2022 2021 2021 2021 2021 Average assets 7,319,675$ 7,461,343$ 6,507,673$ 6,142,507$ 5,936,149$ Return on average assets ("ROAA") as reported 1.31% 1.14% 1.41% 1.45% 1.40% Acquisition expenses - 0.05 0.05 0.02 - Tax effect - (0.01) (0.01) - - ROAA excluding acquisition expenses 1.31 1.18 1.45 1.47 1.40 Credit loss expense acquired loans - - 0.12 - - Tax effect - - (0.03) - - ROAA excluding credit loss expense acquired loans 1.31 1.18 1.54 1.47 1.40 Gain on sale of ESOP trustee accounts - - (0.14) - - Tax effect - - 0.03 - - ROAA excluding gain on sale of ESOP business line 1.31 1.18 1.43 1.47 1.40 ESOP settlement expense - 0.10 - - - Tax effect - (0.02) - - - ROAA excluding ESOP settlement expense 1.31 1.26 1.43 1.47 1.40 (Gain)/loss on sale of investment securities - - - - (0.06) Tax effect - - - - 0.01 ROAA excluding (gain)/loss on sale of investment securities 1.31 1.26 1.43 1.47 1.35 Death benefit on bank owned life insurance ("BOLI") - - (0.03) (0.02) - ROAA excluding death benefit on BOLI 1.31 1.26 1.40 1.45 1.35 Prepayment penalty on borrowings - - - 0.01 - Tax effect - - - - - ROAA excluding prepayment penalties on borrowings 1.31 1.26 1.40 1.46 1.35 Adjusted ROAA 1.31% 1.26% 1.40% 1.46% 1.35% Three Months Ended Non-GAAP Reconciliation of Return on Average Assets (Dollars in Thousands, Unaudited)
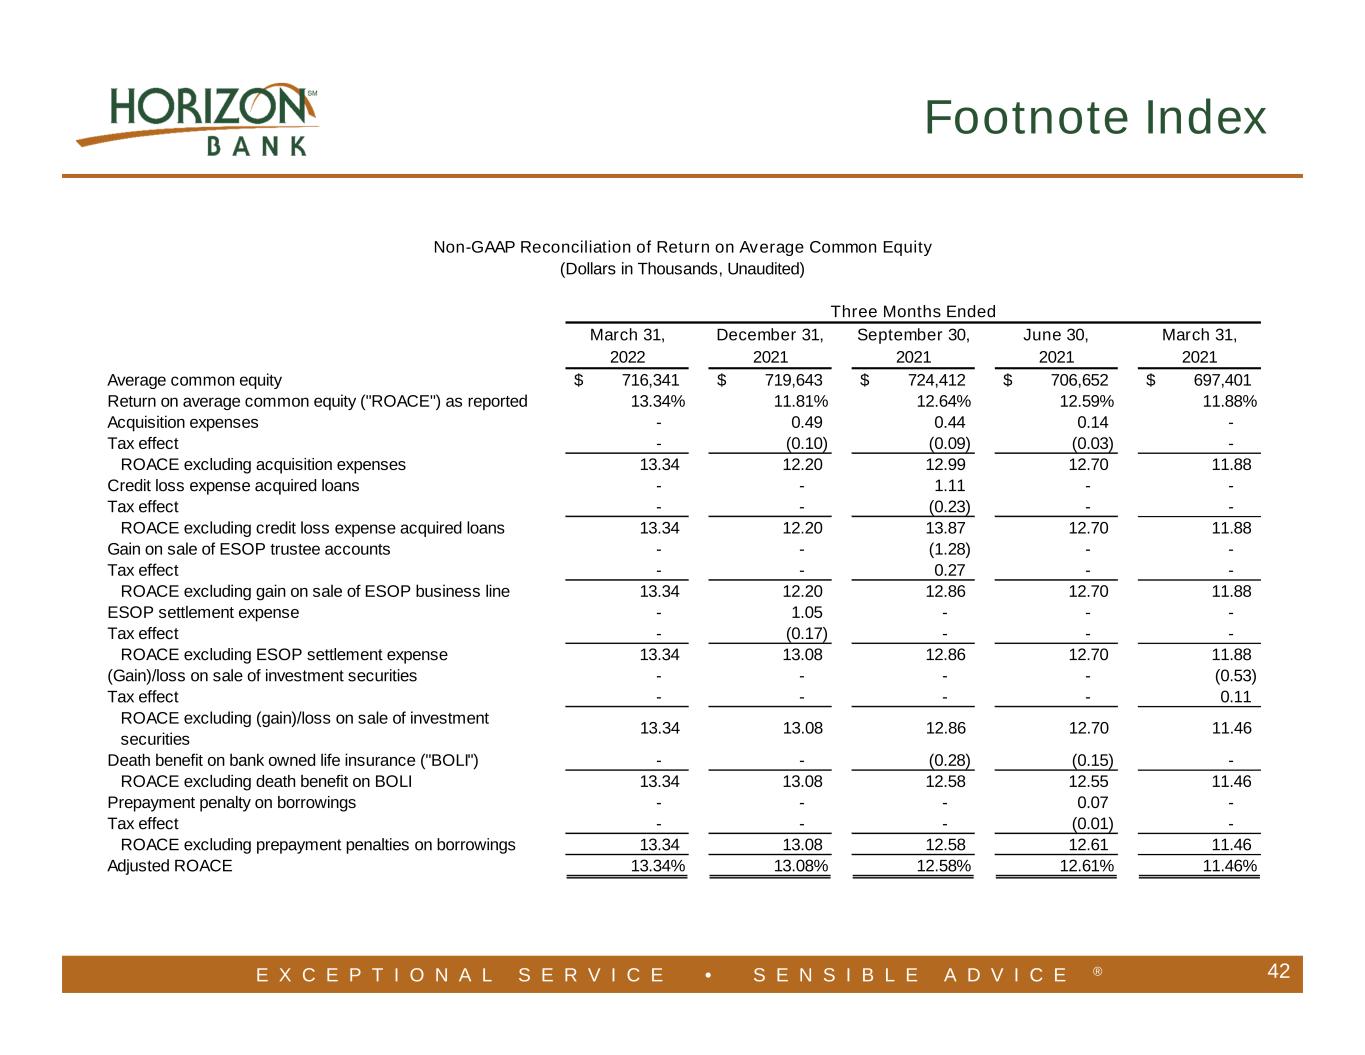
E X C E P T I O N A L S E R V I C E • S E N S I B L E A D V I C E ® 42 Footnote Index March 31, December 31, September 30, June 30, March 31, 2022 2021 2021 2021 2021 Average common equity 716,341$ 719,643$ 724,412$ 706,652$ 697,401$ Return on average common equity ("ROACE") as reported 13.34% 11.81% 12.64% 12.59% 11.88% Acquisition expenses - 0.49 0.44 0.14 - Tax effect - (0.10) (0.09) (0.03) - ROACE excluding acquisition expenses 13.34 12.20 12.99 12.70 11.88 Credit loss expense acquired loans - - 1.11 - - Tax effect - - (0.23) - - ROACE excluding credit loss expense acquired loans 13.34 12.20 13.87 12.70 11.88 Gain on sale of ESOP trustee accounts - - (1.28) - - Tax effect - - 0.27 - - ROACE excluding gain on sale of ESOP business line 13.34 12.20 12.86 12.70 11.88 ESOP settlement expense - 1.05 - - - Tax effect - (0.17) - - - ROACE excluding ESOP settlement expense 13.34 13.08 12.86 12.70 11.88 (Gain)/loss on sale of investment securities - - - - (0.53) Tax effect - - - - 0.11 ROACE excluding (gain)/loss on sale of investment securities 13.34 13.08 12.86 12.70 11.46 Death benefit on bank owned life insurance ("BOLI") - - (0.28) (0.15) - ROACE excluding death benefit on BOLI 13.34 13.08 12.58 12.55 11.46 Prepayment penalty on borrowings - - - 0.07 - Tax effect - - - (0.01) - ROACE excluding prepayment penalties on borrowings 13.34 13.08 12.58 12.61 11.46 Adjusted ROACE 13.34% 13.08% 12.58% 12.61% 11.46% Three Months Ended Non-GAAP Reconciliation of Return on Average Common Equity (Dollars in Thousands, Unaudited)
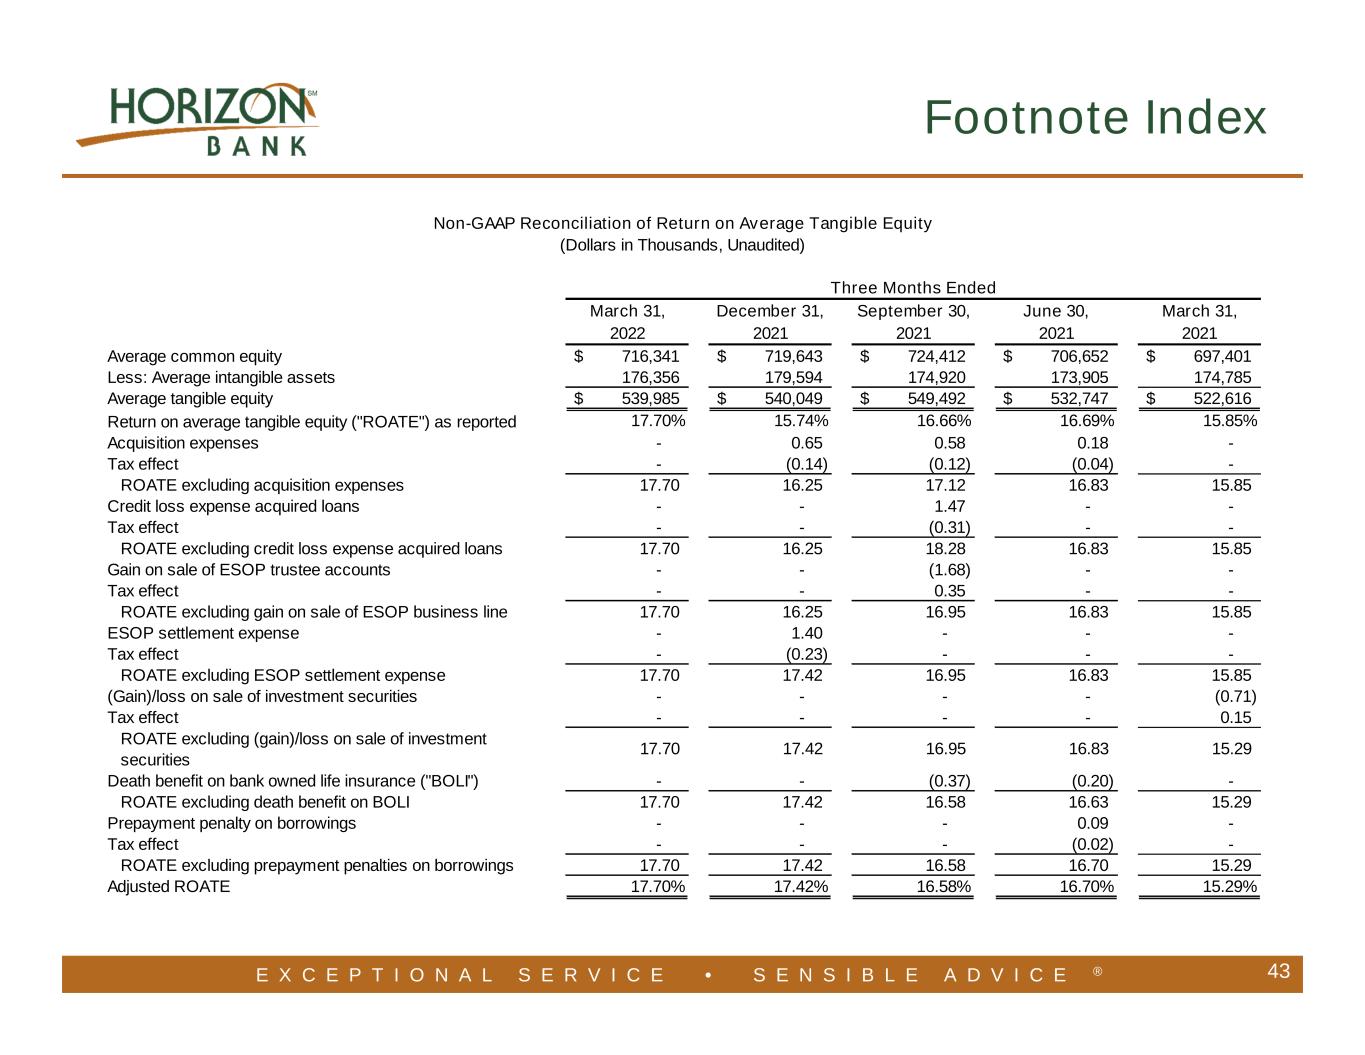
E X C E P T I O N A L S E R V I C E • S E N S I B L E A D V I C E ® 43 Footnote Index March 31, December 31, September 30, June 30, March 31, 2022 2021 2021 2021 2021 Average common equity 716,341$ 719,643$ 724,412$ 706,652$ 697,401$ Less: Average intangible assets 176,356 179,594 174,920 173,905 174,785 Average tangible equity 539,985$ 540,049$ 549,492$ 532,747$ 522,616$ Return on average tangible equity ("ROATE") as reported 17.70% 15.74% 16.66% 16.69% 15.85% Acquisition expenses - 0.65 0.58 0.18 - Tax effect - (0.14) (0.12) (0.04) - ROATE excluding acquisition expenses 17.70 16.25 17.12 16.83 15.85 Credit loss expense acquired loans - - 1.47 - - Tax effect - - (0.31) - - ROATE excluding credit loss expense acquired loans 17.70 16.25 18.28 16.83 15.85 Gain on sale of ESOP trustee accounts - - (1.68) - - Tax effect - - 0.35 - - ROATE excluding gain on sale of ESOP business line 17.70 16.25 16.95 16.83 15.85 ESOP settlement expense - 1.40 - - - Tax effect - (0.23) - - - ROATE excluding ESOP settlement expense 17.70 17.42 16.95 16.83 15.85 (Gain)/loss on sale of investment securities - - - - (0.71) Tax effect - - - - 0.15 ROATE excluding (gain)/loss on sale of investment securities 17.70 17.42 16.95 16.83 15.29 Death benefit on bank owned life insurance ("BOLI") - - (0.37) (0.20) - ROATE excluding death benefit on BOLI 17.70 17.42 16.58 16.63 15.29 Prepayment penalty on borrowings - - - 0.09 - Tax effect - - - (0.02) - ROATE excluding prepayment penalties on borrowings 17.70 17.42 16.58 16.70 15.29 Adjusted ROATE 17.70% 17.42% 16.58% 16.70% 15.29% Non-GAAP Reconciliation of Return on Average Tangible Equity (Dollars in Thousands, Unaudited) Three Months Ended
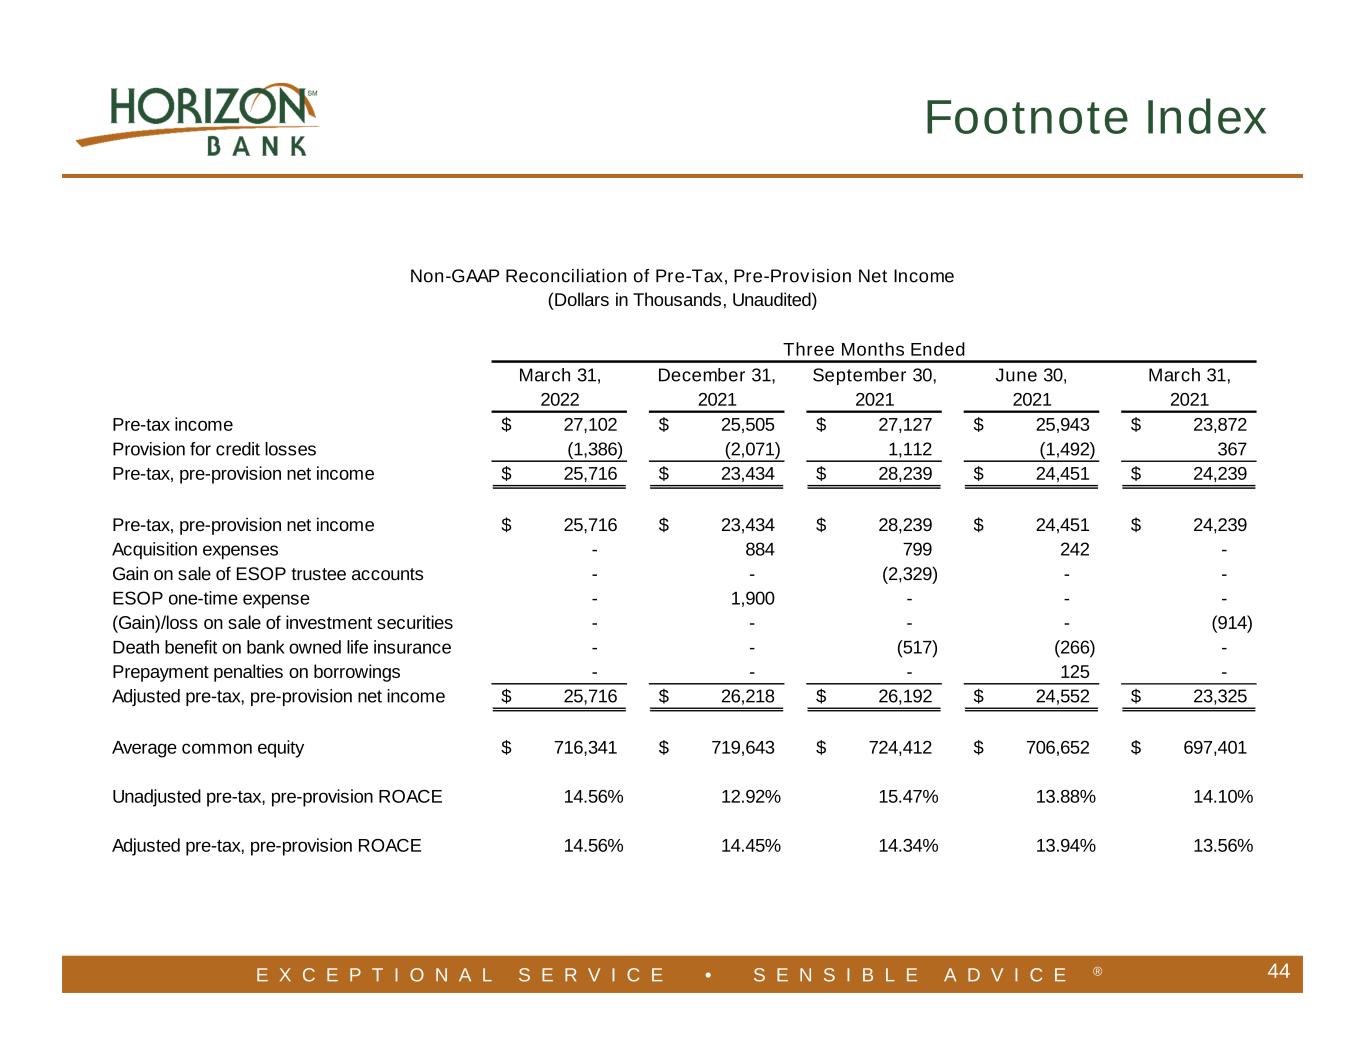
E X C E P T I O N A L S E R V I C E • S E N S I B L E A D V I C E ® 44 Footnote Index March 31, December 31, September 30, June 30, March 31, 2022 2021 2021 2021 2021 Pre-tax income 27,102$ 25,505$ 27,127$ 25,943$ 23,872$ Provision for credit losses (1,386) (2,071) 1,112 (1,492) 367 Pre-tax, pre-provision net income 25,716$ 23,434$ 28,239$ 24,451$ 24,239$ Pre-tax, pre-provision net income 25,716$ 23,434$ 28,239$ 24,451$ 24,239$ Acquisition expenses - 884 799 242 - Gain on sale of ESOP trustee accounts - - (2,329) - - ESOP one-time expense - 1,900 - - - (Gain)/loss on sale of investment securities - - - - (914) Death benefit on bank owned life insurance - - (517) (266) - Prepayment penalties on borrowings - - - 125 - Adjusted pre-tax, pre-provision net income 25,716$ 26,218$ 26,192$ 24,552$ 23,325$ Average common equity 716,341$ 719,643$ 724,412$ 706,652$ 697,401$ Unadjusted pre-tax, pre-provision ROACE 14.56% 12.92% 15.47% 13.88% 14.10% Adjusted pre-tax, pre-provision ROACE 14.56% 14.45% 14.34% 13.94% 13.56% Non-GAAP Reconciliation of Pre-Tax, Pre-Provision Net Income (Dollars in Thousands, Unaudited) Three Months Ended

E X C E P T I O N A L S E R V I C E • S E N S I B L E A D V I C E ® 45 Footnote Index March 31, December 31, September 30, June 30, March 31, 2022 2021 2021 2021 2021 Net interest income as reported 48,171$ 49,976$ 46,544$ 42,632$ 42,538$ Average interest earning assets 6,800,549 6,938,258 6,033,088 5,659,384 5,439,634 Net interest income as a percentage of average interest earning assets ("Net Interest Margin") 2.99% 2.97% 3.17% 3.14% 3.29% Net interest income as reported 48,171$ 49,976$ 46,544$ 42,632$ 42,538$ Prepayment penalties on borrowings - - - 125 - Acquisition-related purchase accounting adjustments ("PAU") (916) (1,819) (875) (230) (1,579) Adjusted net interest income 47,255$ 48,157$ 45,669$ 42,527$ 40,959$ Adjusted net interest margin 2.93% 2.86% 3.12% 3.13% 3.17% Non-GAAP Reconciliation of Net Interest Margin (Dollars in Thousands, Unaudited) Three Months Ended
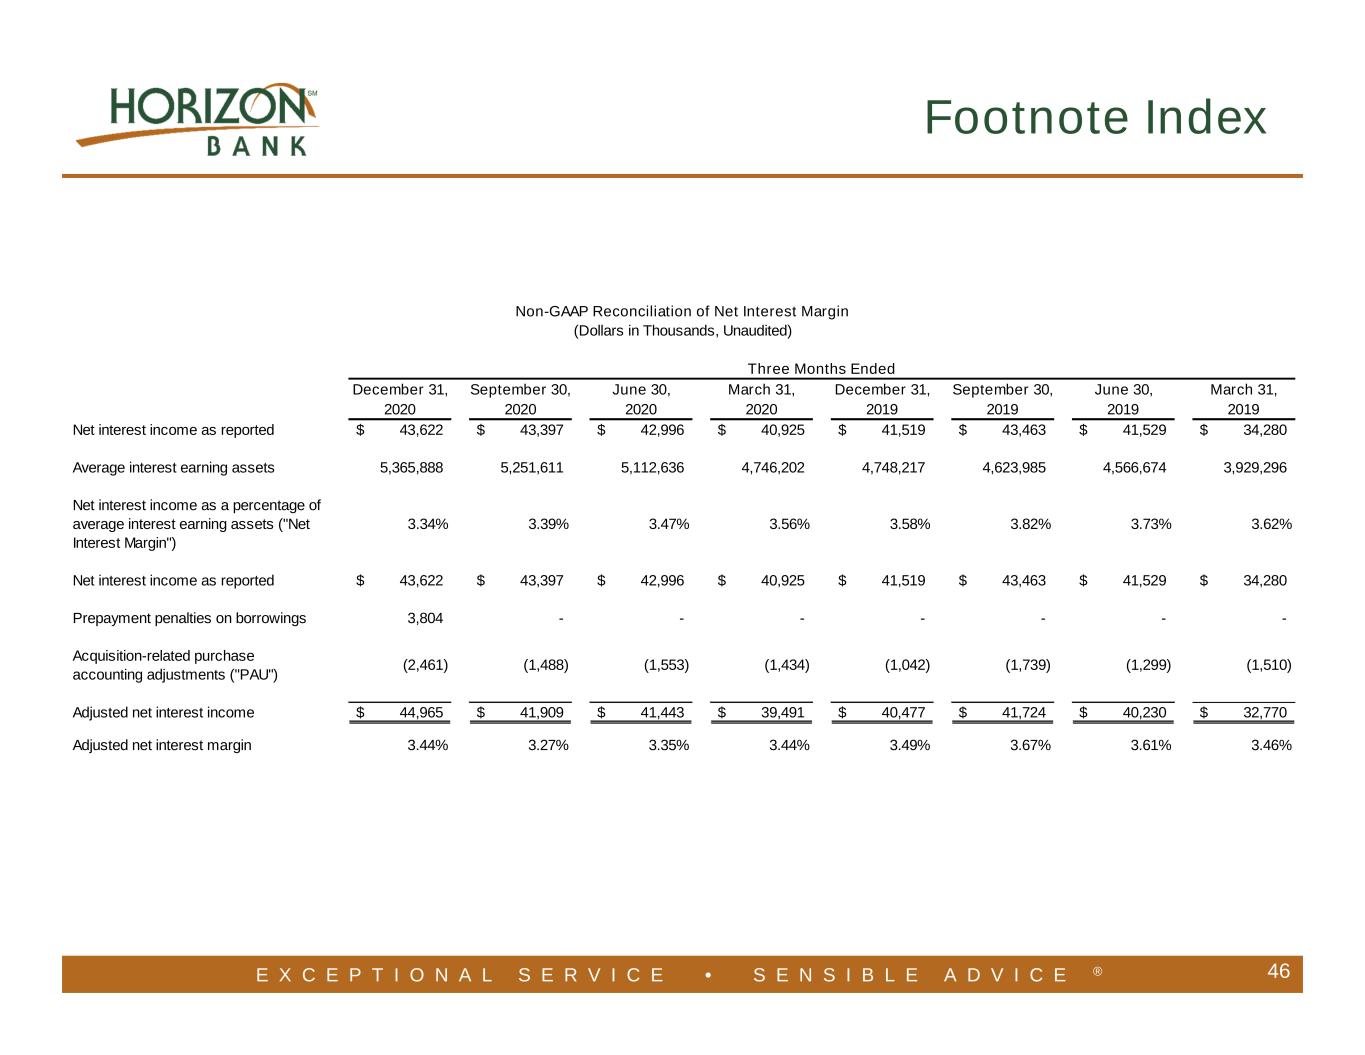
E X C E P T I O N A L S E R V I C E • S E N S I B L E A D V I C E ® 46 Footnote Index December 31, September 30, June 30, March 31, December 31, September 30, June 30, March 31, 2020 2020 2020 2020 2019 2019 2019 2019 Net interest income as reported 43,622$ 43,397$ 42,996$ 40,925$ 41,519$ 43,463$ 41,529$ 34,280$ Average interest earning assets 5,365,888 5,251,611 5,112,636 4,746,202 4,748,217 4,623,985 4,566,674 3,929,296 Net interest income as a percentage of average interest earning assets ("Net Interest Margin") 3.34% 3.39% 3.47% 3.56% 3.58% 3.82% 3.73% 3.62% Net interest income as reported 43,622$ 43,397$ 42,996$ 40,925$ 41,519$ 43,463$ 41,529$ 34,280$ Prepayment penalties on borrowings 3,804 - - - - - - - Acquisition-related purchase accounting adjustments ("PAU") (2,461) (1,488) (1,553) (1,434) (1,042) (1,739) (1,299) (1,510) Adjusted net interest income 44,965$ 41,909$ 41,443$ 39,491$ 40,477$ 41,724$ 40,230$ 32,770$ Adjusted net interest margin 3.44% 3.27% 3.35% 3.44% 3.49% 3.67% 3.61% 3.46% Non-GAAP Reconciliation of Net Interest Margin (Dollars in Thousands, Unaudited) Three Months Ended
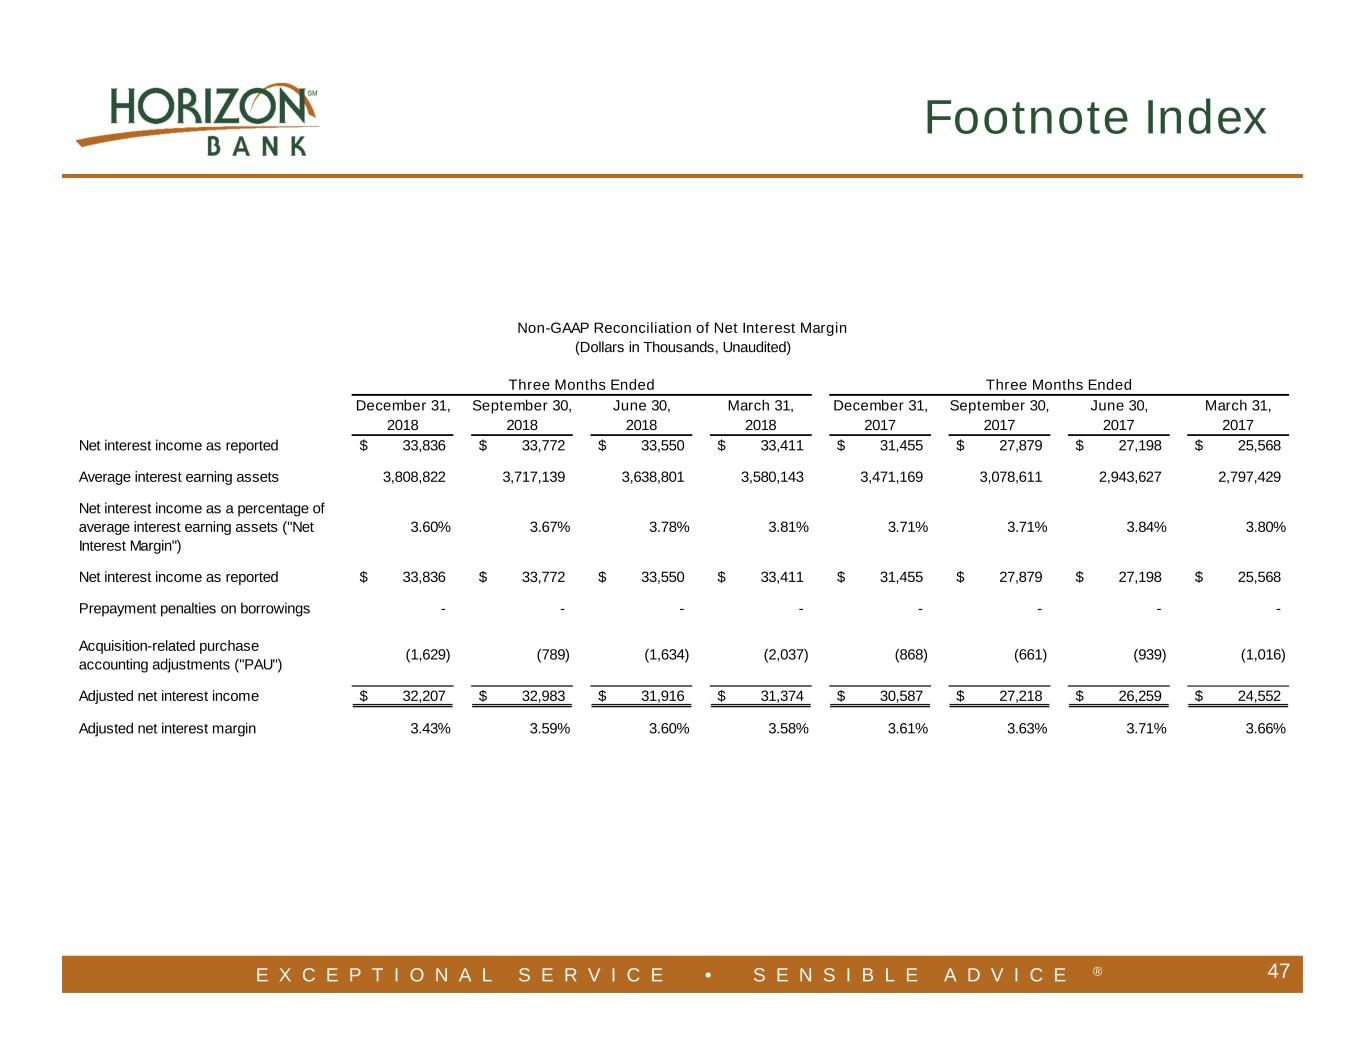
E X C E P T I O N A L S E R V I C E • S E N S I B L E A D V I C E ® 47 Footnote Index December 31, September 30, June 30, March 31, December 31, September 30, June 30, March 31, 2018 2018 2018 2018 2017 2017 2017 2017 Net interest income as reported 33,836$ 33,772$ 33,550$ 33,411$ 31,455$ 27,879$ 27,198$ 25,568$ Average interest earning assets 3,808,822 3,717,139 3,638,801 3,580,143 3,471,169 3,078,611 2,943,627 2,797,429 Net interest income as a percentage of average interest earning assets ("Net Interest Margin") 3.60% 3.67% 3.78% 3.81% 3.71% 3.71% 3.84% 3.80% Net interest income as reported 33,836$ 33,772$ 33,550$ 33,411$ 31,455$ 27,879$ 27,198$ 25,568$ Prepayment penalties on borrowings - - - - - - - - Acquisition-related purchase accounting adjustments ("PAU") (1,629) (789) (1,634) (2,037) (868) (661) (939) (1,016) Adjusted net interest income 32,207$ 32,983$ 31,916$ 31,374$ 30,587$ 27,218$ 26,259$ 24,552$ Adjusted net interest margin 3.43% 3.59% 3.60% 3.58% 3.61% 3.63% 3.71% 3.66% Three Months EndedThree Months Ended Non-GAAP Reconciliation of Net Interest Margin (Dollars in Thousands, Unaudited)
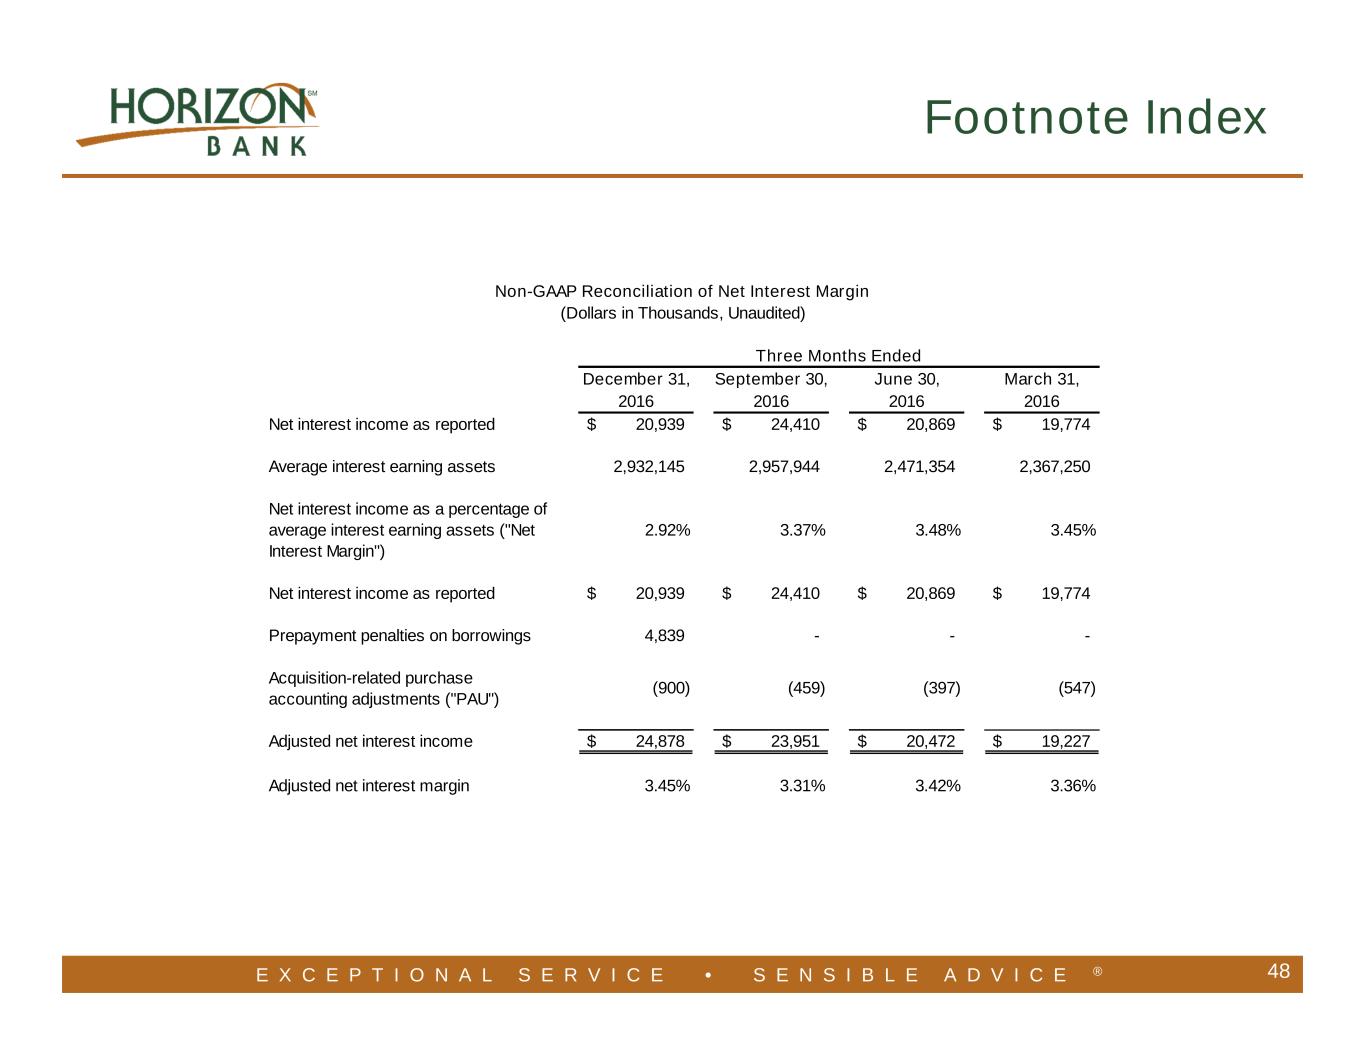
E X C E P T I O N A L S E R V I C E • S E N S I B L E A D V I C E ® 48 Footnote Index December 31, September 30, June 30, March 31, 2016 2016 2016 2016 Net interest income as reported 20,939$ 24,410$ 20,869$ 19,774$ Average interest earning assets 2,932,145 2,957,944 2,471,354 2,367,250 Net interest income as a percentage of average interest earning assets ("Net Interest Margin") 2.92% 3.37% 3.48% 3.45% Net interest income as reported 20,939$ 24,410$ 20,869$ 19,774$ Prepayment penalties on borrowings 4,839 - - - Acquisition-related purchase accounting adjustments ("PAU") (900) (459) (397) (547) Adjusted net interest income 24,878$ 23,951$ 20,472$ 19,227$ Adjusted net interest margin 3.45% 3.31% 3.42% 3.36% Three Months Ended Non-GAAP Reconciliation of Net Interest Margin (Dollars in Thousands, Unaudited)
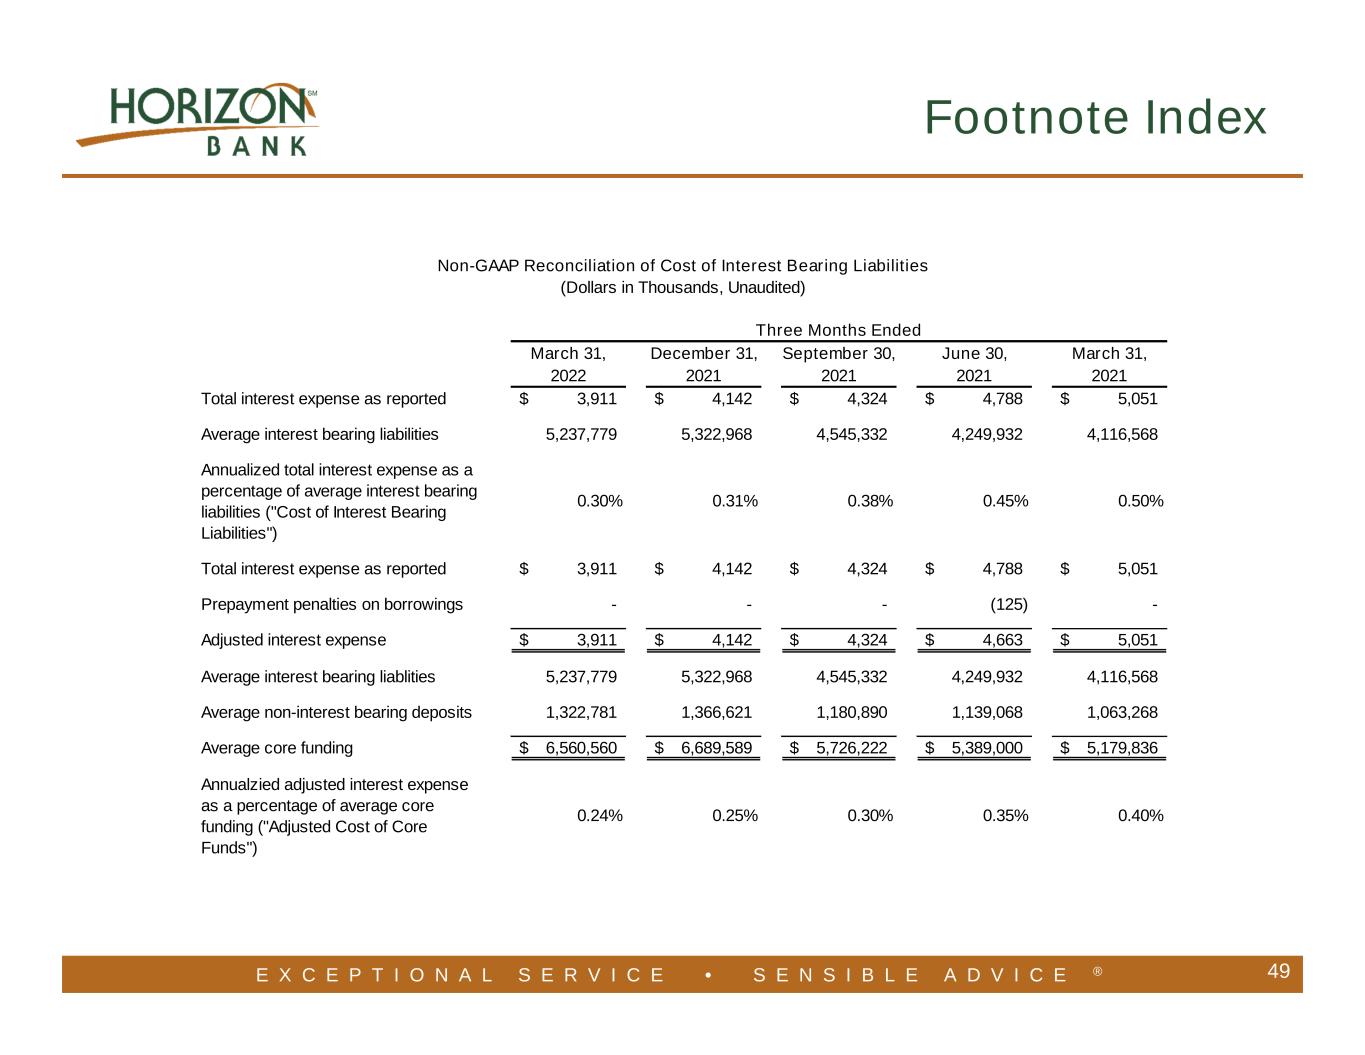
E X C E P T I O N A L S E R V I C E • S E N S I B L E A D V I C E ® 49 Footnote Index March 31, December 31, September 30, June 30, March 31, 2022 2021 2021 2021 2021 Total interest expense as reported 3,911$ 4,142$ 4,324$ 4,788$ 5,051$ Average interest bearing liabilities 5,237,779 5,322,968 4,545,332 4,249,932 4,116,568 Annualized total interest expense as a percentage of average interest bearing liabilities ("Cost of Interest Bearing Liabilities") 0.30% 0.31% 0.38% 0.45% 0.50% Total interest expense as reported 3,911$ 4,142$ 4,324$ 4,788$ 5,051$ Prepayment penalties on borrowings - - - (125) - Adjusted interest expense 3,911$ 4,142$ 4,324$ 4,663$ 5,051$ Average interest bearing liablities 5,237,779 5,322,968 4,545,332 4,249,932 4,116,568 Average non-interest bearing deposits 1,322,781 1,366,621 1,180,890 1,139,068 1,063,268 Average core funding 6,560,560$ 6,689,589$ 5,726,222$ 5,389,000$ 5,179,836$ Annualzied adjusted interest expense as a percentage of average core funding ("Adjusted Cost of Core Funds") 0.24% 0.25% 0.30% 0.35% 0.40% Non-GAAP Reconciliation of Cost of Interest Bearing Liabilities (Dollars in Thousands, Unaudited) Three Months Ended

E X C E P T I O N A L S E R V I C E • S E N S I B L E A D V I C E ® 50 Footnote Index December 31, September 30, June 30, March 31, December 31, September 30, June 30, March 31, 2020 2020 2020 2020 2019 2019 2019 2019 Total interest expense as reported 9,612$ 6,749$ 7,348$ 10,729$ 11,879$ 12,248$ 12,321$ 11,093$ Average interest bearing liabilities 4,077,223 4,027,057 3,975,297 3,814,785 3,794,943 3,601,144 3,570,713 3,131,276 Annualized total interest expense as a percentage of average interest bearing liabilities ("Cost of Interest Bearing Liabilities") 0.94% 0.67% 0.74% 1.13% 1.24% 1.35% 1.38% 1.44% Total interest expense as reported 9,612$ 6,749$ 7,348$ 10,729$ 11,879$ 12,248$ 12,321$ 11,093$ Prepayment penalties on borrowings (3,804) - - - - - - - Adjusted interest expense 5,808$ 6,749$ 7,348$ 10,729$ 11,879$ 12,248$ 12,321$ 11,093$ Average interest bearing liablities 4,077,223 4,027,057 3,975,297 3,814,785 3,794,943 3,601,144 3,570,713 3,131,276 Average non-interest bearing deposits 1,037,232 996,427 924,890 717,257 747,513 818,164 818,872 643,601 Average core funding 5,114,455$ 5,023,484$ 4,900,187$ 4,532,042$ 4,542,456$ 4,419,308$ 4,389,585$ 3,774,877$ Annualzied adjusted interest expense as a percentage of average core funding ("Adjusted Cost of Core Funds") 0.45% 0.53% 0.60% 0.95% 1.04% 1.10% 1.13% 1.19% Non-GAAP Reconciliation of Cost of Interest Bearing Liabilities (Dollars in Thousands, Unaudited) Three Months Ended

E X C E P T I O N A L S E R V I C E • S E N S I B L E A D V I C E ® 51 Footnote Index December 31, September 30, June 30, March 31, December 31, September 30, June 30, March 31, 2018 2018 2018 2018 2017 2017 2017 2017 Total interest expense as reported 9,894$ 8,499$ 7,191$ 6,015$ 5,319$ 4,191$ 3,607$ 3,266$ Average interest bearing liabilities 3,021,310 2,971,074 2,929,913 2,869,372 2,766,948 2,459,262 2,375,827 2,246,550 Annualized total interest expense as a percentage of average interest bearing liabilities ("Cost of Interest Bearing Liabilities") 1.30% 1.13% 0.98% 0.85% 0.76% 0.68% 0.61% 0.59% Total interest expense as reported 9,894$ 8,499$ 7,191$ 6,015$ 5,319$ 4,191$ 3,607$ 3,266$ Prepayment penalties on borrowings - - - - - - - - Adjusted interest expense 9,894$ 8,499$ 7,191$ 6,015$ 5,319$ 4,191$ 3,607$ 3,266$ Average interest bearing liablities 3,021,310 2,971,074 2,929,913 2,869,372 2,766,948 2,459,262 2,375,827 2,246,550 Average non-interest bearing deposits 656,114 640,983 605,188 595,644 603,733 540,109 499,446 491,154 Average core funding 3,677,424$ 3,612,057$ 3,535,101$ 3,465,016$ 3,370,681$ 2,999,371$ 2,875,273$ 2,737,704$ Annualzied adjusted interest expense as a percentage of average core funding ("Adjusted Cost of Core Funds") 1.07% 0.93% 0.82% 0.70% 0.63% 0.55% 0.50% 0.48% Three Months Ended Non-GAAP Reconciliation of Cost of Interest Bearing Liabilities (Dollars in Thousands, Unaudited) Three Months Ended
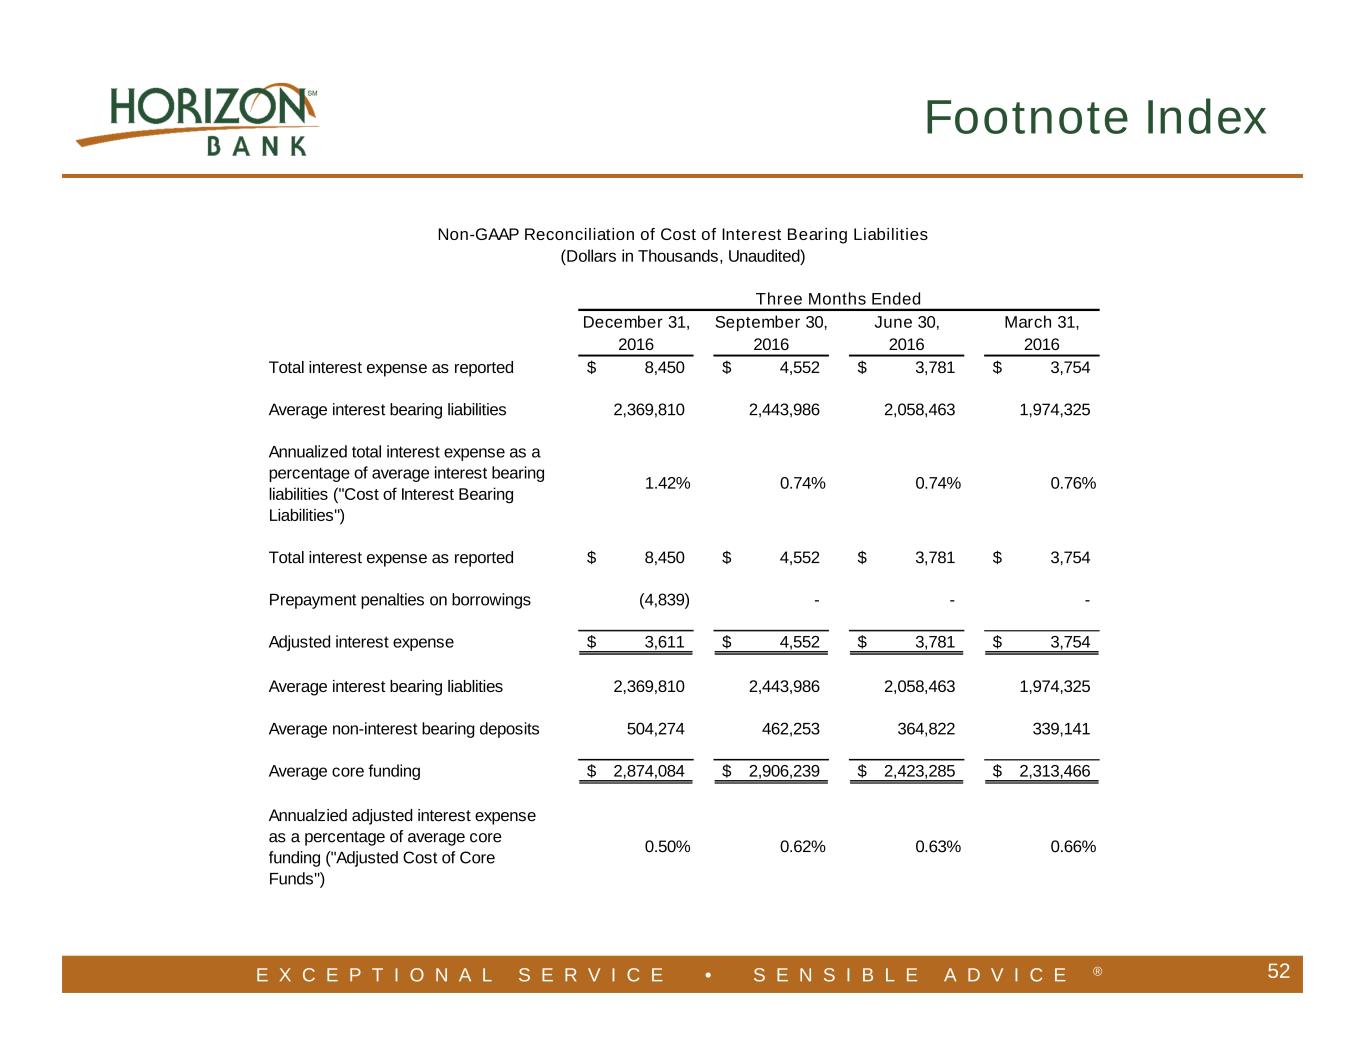
E X C E P T I O N A L S E R V I C E • S E N S I B L E A D V I C E ® 52 Footnote Index December 31, September 30, June 30, March 31, 2016 2016 2016 2016 Total interest expense as reported 8,450$ 4,552$ 3,781$ 3,754$ Average interest bearing liabilities 2,369,810 2,443,986 2,058,463 1,974,325 Annualized total interest expense as a percentage of average interest bearing liabilities ("Cost of Interest Bearing Liabilities") 1.42% 0.74% 0.74% 0.76% Total interest expense as reported 8,450$ 4,552$ 3,781$ 3,754$ Prepayment penalties on borrowings (4,839) - - - Adjusted interest expense 3,611$ 4,552$ 3,781$ 3,754$ Average interest bearing liablities 2,369,810 2,443,986 2,058,463 1,974,325 Average non-interest bearing deposits 504,274 462,253 364,822 339,141 Average core funding 2,874,084$ 2,906,239$ 2,423,285$ 2,313,466$ Annualzied adjusted interest expense as a percentage of average core funding ("Adjusted Cost of Core Funds") 0.50% 0.62% 0.63% 0.66% Three Months Ended Non-GAAP Reconciliation of Cost of Interest Bearing Liabilities (Dollars in Thousands, Unaudited)
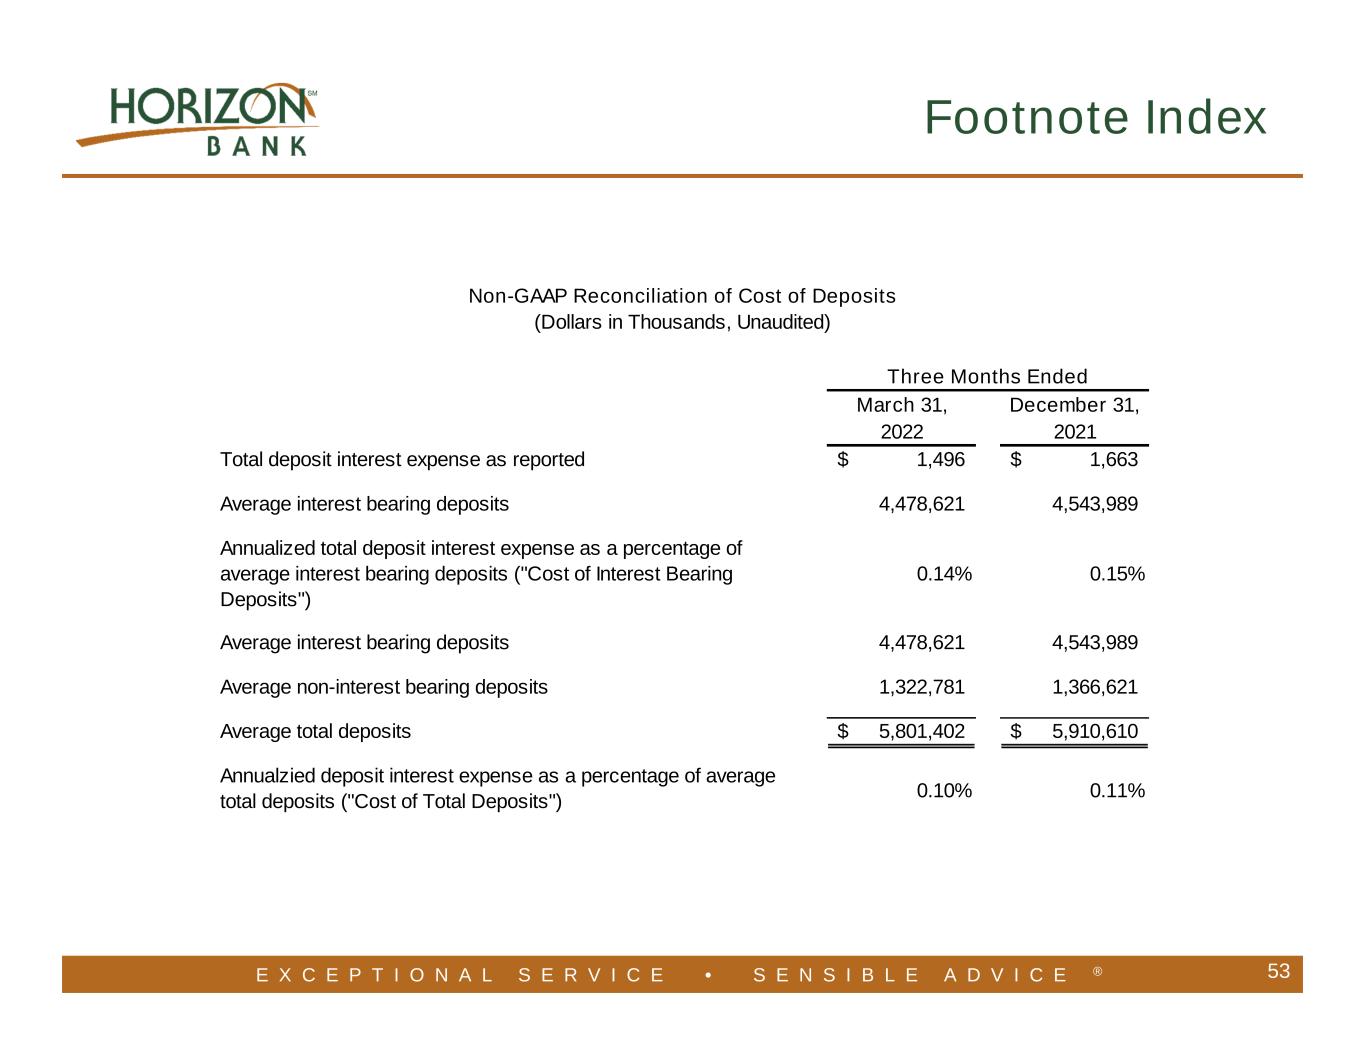
E X C E P T I O N A L S E R V I C E • S E N S I B L E A D V I C E ® 53 Footnote Index March 31, December 31, 2022 2021 Total deposit interest expense as reported 1,496$ 1,663$ Average interest bearing deposits 4,478,621 4,543,989 Annualized total deposit interest expense as a percentage of average interest bearing deposits ("Cost of Interest Bearing Deposits") 0.14% 0.15% Average interest bearing deposits 4,478,621 4,543,989 Average non-interest bearing deposits 1,322,781 1,366,621 Average total deposits 5,801,402$ 5,910,610$ Annualzied deposit interest expense as a percentage of average total deposits ("Cost of Total Deposits") 0.10% 0.11% Three Months Ended Non-GAAP Reconciliation of Cost of Deposits (Dollars in Thousands, Unaudited)
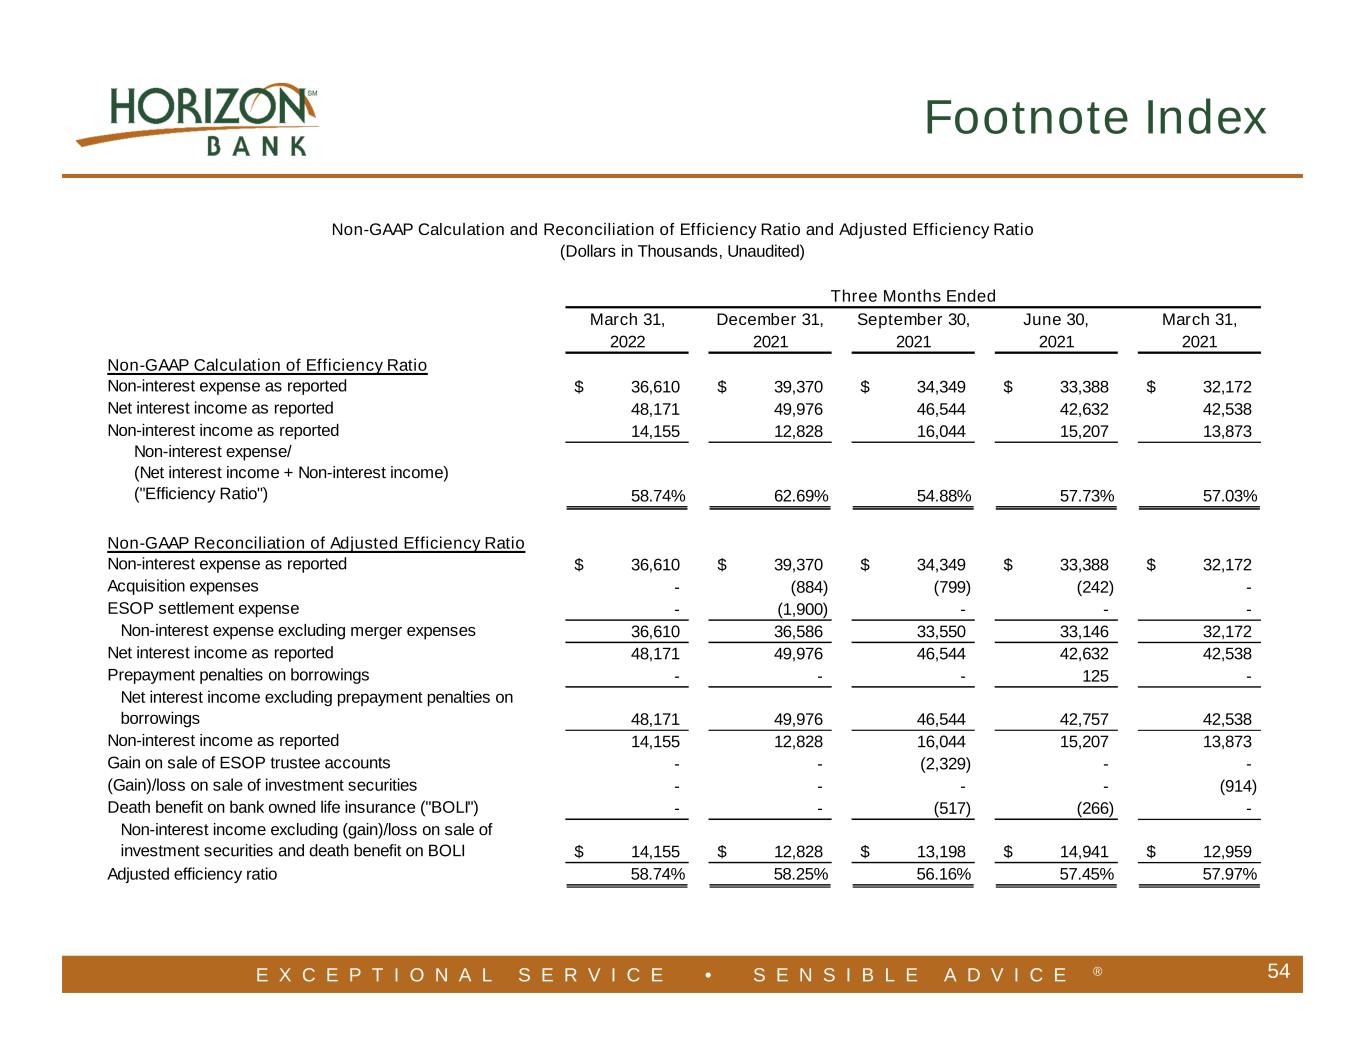
E X C E P T I O N A L S E R V I C E • S E N S I B L E A D V I C E ® 54 Footnote Index March 31, December 31, September 30, June 30, March 31, 2022 2021 2021 2021 2021 Non-GAAP Calculation of Efficiency Ratio Non-interest expense as reported 36,610$ 39,370$ 34,349$ 33,388$ 32,172$ Net interest income as reported 48,171 49,976 46,544 42,632 42,538 Non-interest income as reported 14,155 12,828 16,044 15,207 13,873 Non-interest expense/ (Net interest income + Non-interest income) ("Efficiency Ratio") 58.74% 62.69% 54.88% 57.73% 57.03% Non-GAAP Reconciliation of Adjusted Efficiency Ratio Non-interest expense as reported 36,610$ 39,370$ 34,349$ 33,388$ 32,172$ Acquisition expenses - (884) (799) (242) - ESOP settlement expense - (1,900) - - - Non-interest expense excluding merger expenses 36,610 36,586 33,550 33,146 32,172 Net interest income as reported 48,171 49,976 46,544 42,632 42,538 Prepayment penalties on borrowings - - - 125 - Net interest income excluding prepayment penalties on borrowings 48,171 49,976 46,544 42,757 42,538 Non-interest income as reported 14,155 12,828 16,044 15,207 13,873 Gain on sale of ESOP trustee accounts - - (2,329) - - (Gain)/loss on sale of investment securities - - - - (914) Death benefit on bank owned life insurance ("BOLI") - - (517) (266) - Non-interest income excluding (gain)/loss on sale of investment securities and death benefit on BOLI 14,155$ 12,828$ 13,198$ 14,941$ 12,959$ Adjusted efficiency ratio 58.74% 58.25% 56.16% 57.45% 57.97% Non-GAAP Calculation and Reconciliation of Efficiency Ratio and Adjusted Efficiency Ratio (Dollars in Thousands, Unaudited) Three Months Ended
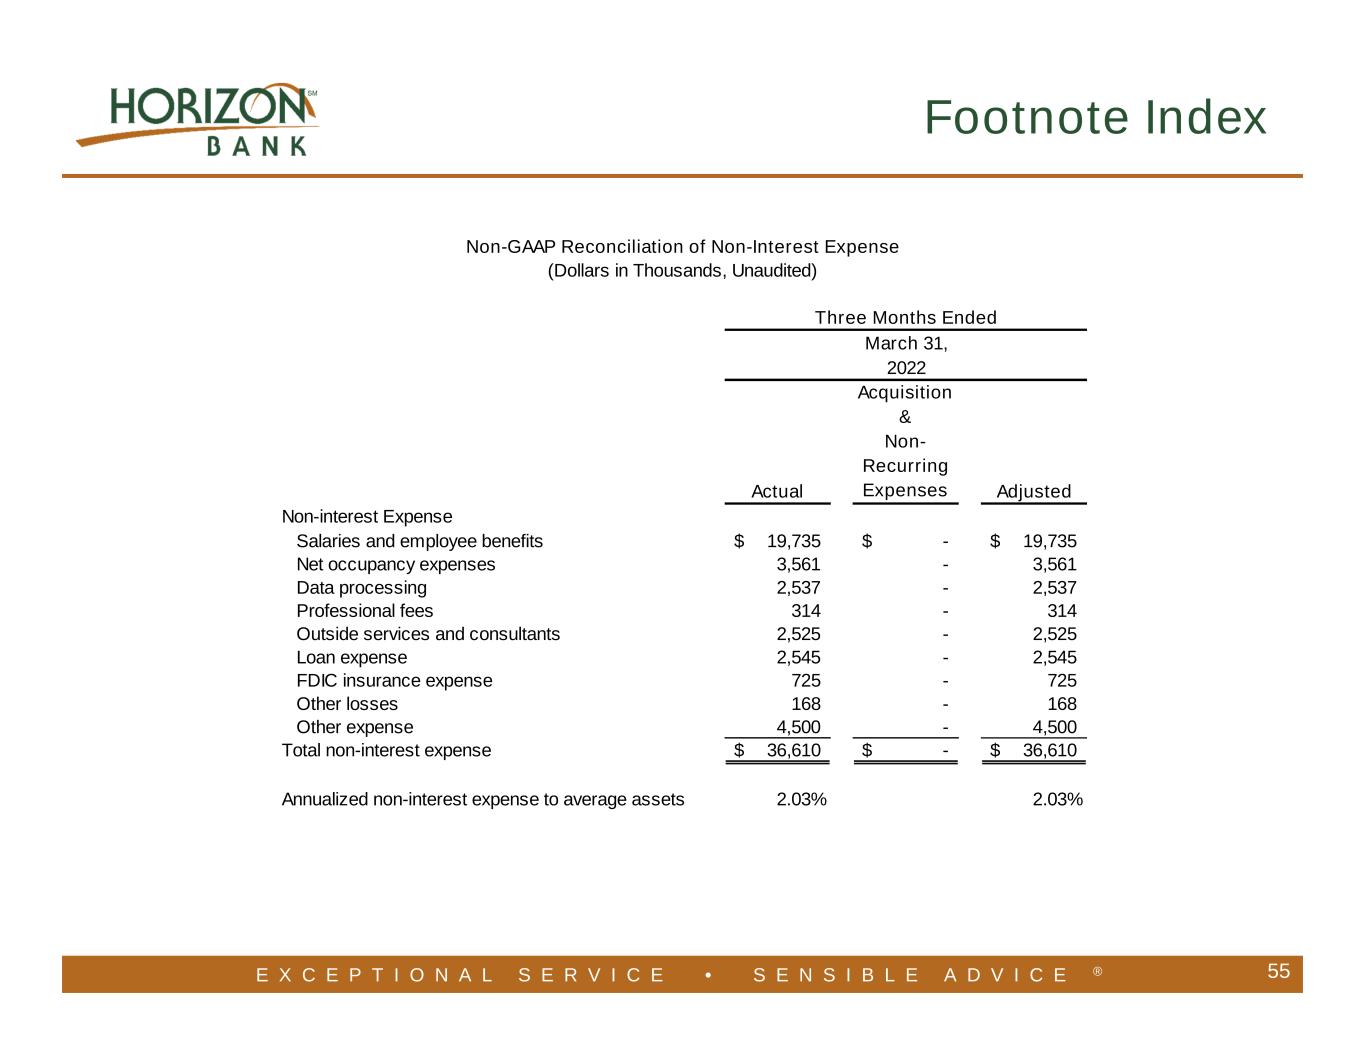
E X C E P T I O N A L S E R V I C E • S E N S I B L E A D V I C E ® 55 Footnote Index Actual Acquisition & Non- Recurring Expenses Adjusted Non-interest Expense Salaries and employee benefits 19,735$ -$ 19,735$ Net occupancy expenses 3,561 - 3,561 Data processing 2,537 - 2,537 Professional fees 314 - 314 Outside services and consultants 2,525 - 2,525 Loan expense 2,545 - 2,545 FDIC insurance expense 725 - 725 Other losses 168 - 168 Other expense 4,500 - 4,500 Total non-interest expense 36,610$ -$ 36,610$ Annualized non-interest expense to average assets 2.03% 2.03% 2022 Non-GAAP Reconciliation of Non-Interest Expense (Dollars in Thousands, Unaudited) Three Months Ended March 31,
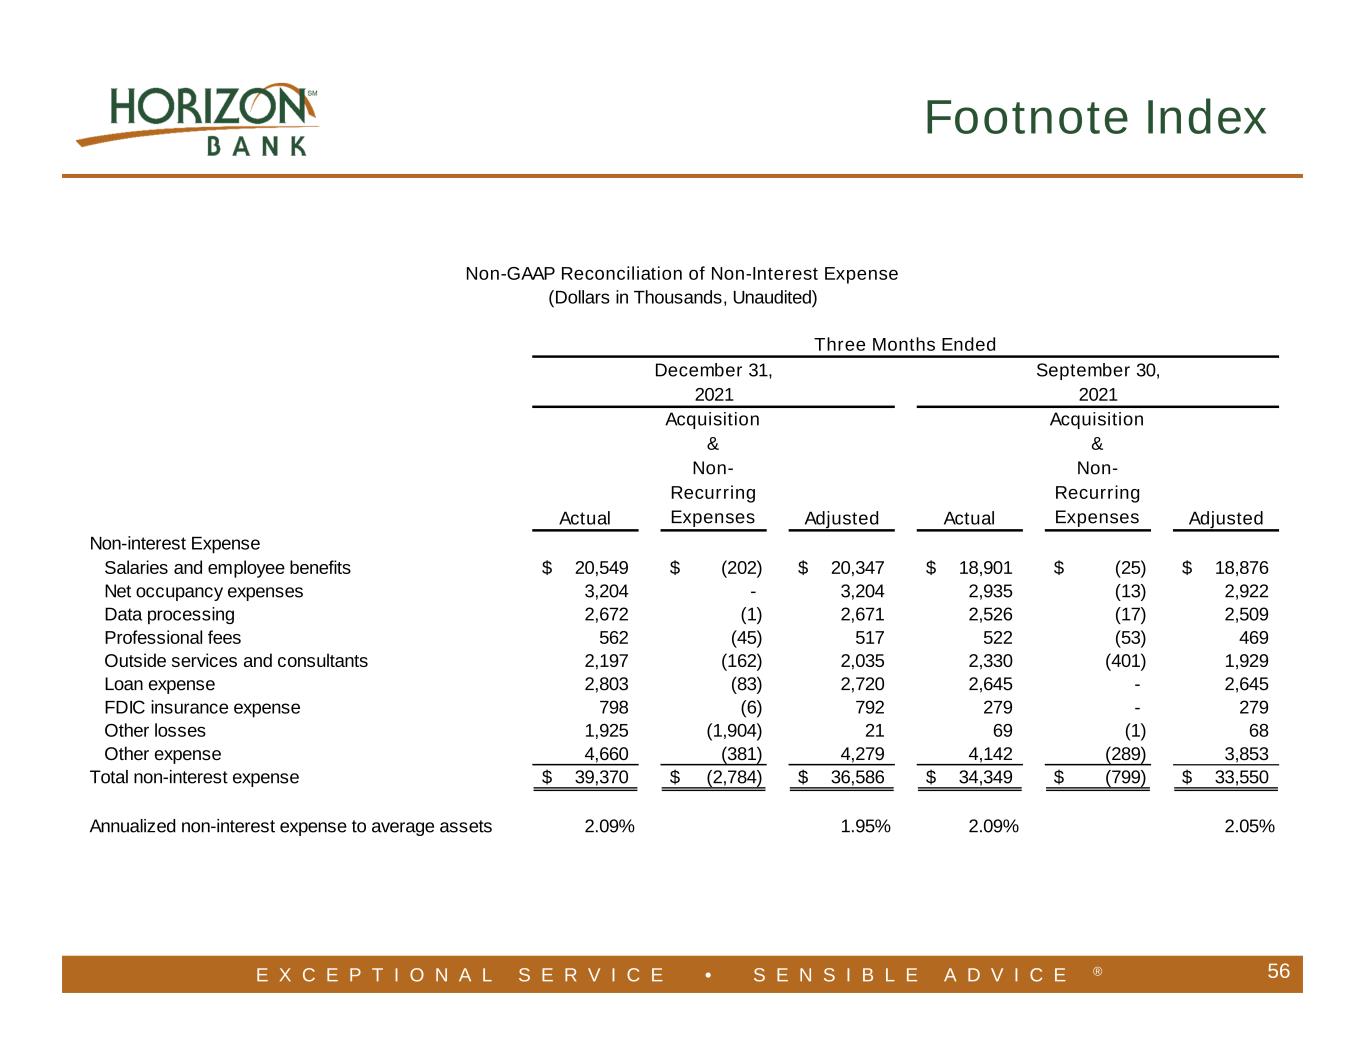
E X C E P T I O N A L S E R V I C E • S E N S I B L E A D V I C E ® 56 Footnote Index Actual Acquisition & Non- Recurring Expenses Adjusted Actual Acquisition & Non- Recurring Expenses Adjusted Non-interest Expense Salaries and employee benefits 20,549$ (202)$ 20,347$ 18,901$ (25)$ 18,876$ Net occupancy expenses 3,204 - 3,204 2,935 (13) 2,922 Data processing 2,672 (1) 2,671 2,526 (17) 2,509 Professional fees 562 (45) 517 522 (53) 469 Outside services and consultants 2,197 (162) 2,035 2,330 (401) 1,929 Loan expense 2,803 (83) 2,720 2,645 - 2,645 FDIC insurance expense 798 (6) 792 279 - 279 Other losses 1,925 (1,904) 21 69 (1) 68 Other expense 4,660 (381) 4,279 4,142 (289) 3,853 Total non-interest expense 39,370$ (2,784)$ 36,586$ 34,349$ (799)$ 33,550$ Annualized non-interest expense to average assets 2.09% 1.95% 2.09% 2.05% Three Months Ended Non-GAAP Reconciliation of Non-Interest Expense (Dollars in Thousands, Unaudited) December 31, September 30, 2021 2021
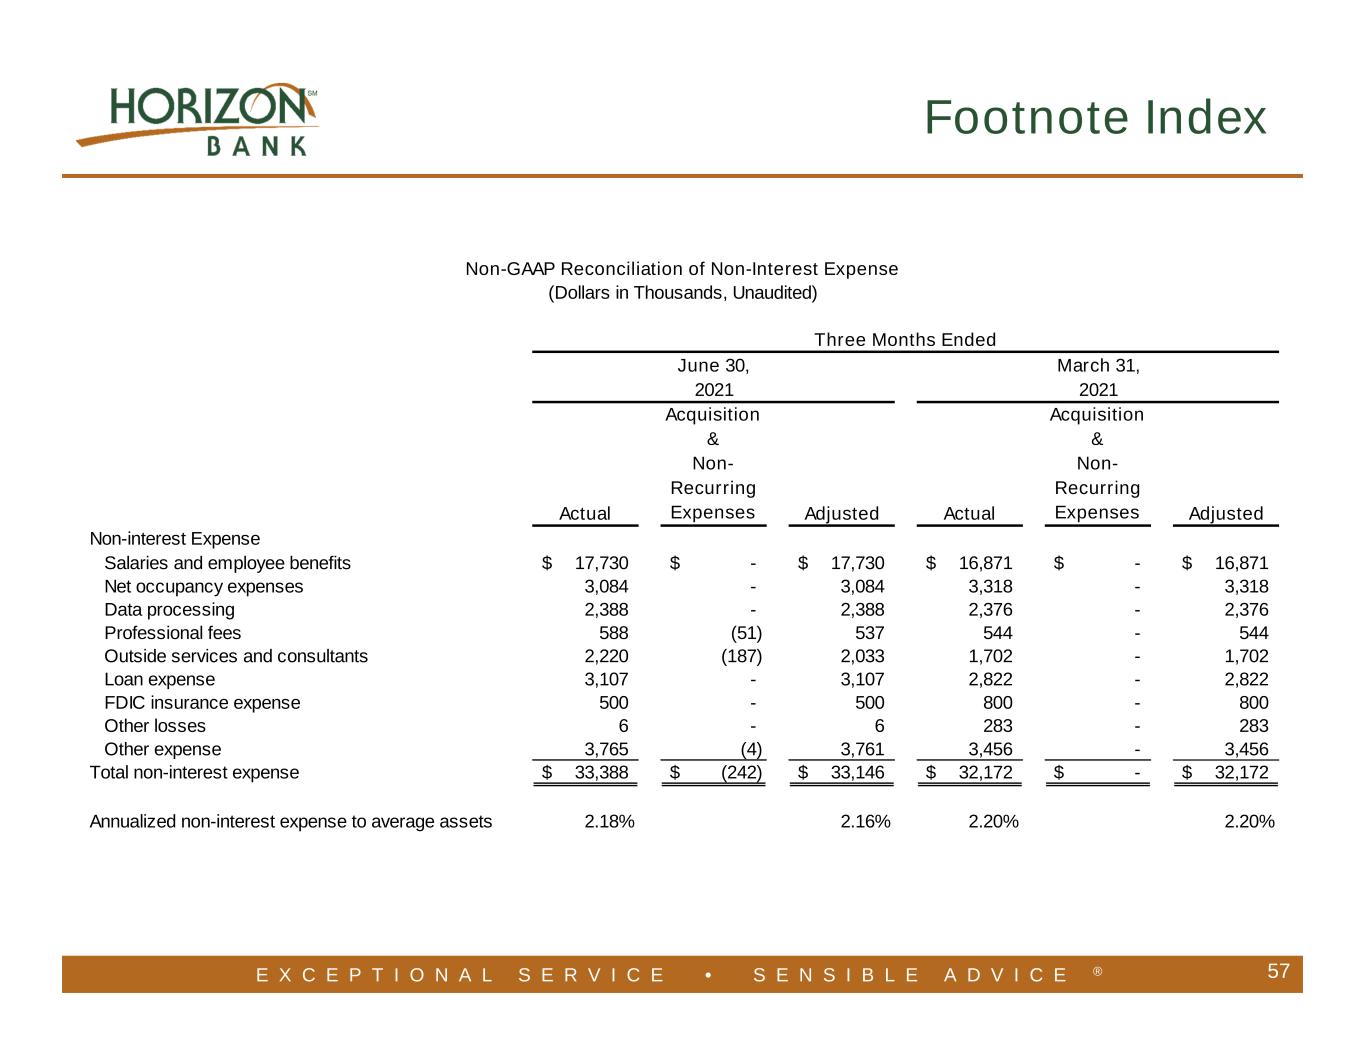
E X C E P T I O N A L S E R V I C E • S E N S I B L E A D V I C E ® 57 Footnote Index Actual Acquisition & Non- Recurring Expenses Adjusted Actual Acquisition & Non- Recurring Expenses Adjusted Non-interest Expense Salaries and employee benefits 17,730$ -$ 17,730$ 16,871$ -$ 16,871$ Net occupancy expenses 3,084 - 3,084 3,318 - 3,318 Data processing 2,388 - 2,388 2,376 - 2,376 Professional fees 588 (51) 537 544 - 544 Outside services and consultants 2,220 (187) 2,033 1,702 - 1,702 Loan expense 3,107 - 3,107 2,822 - 2,822 FDIC insurance expense 500 - 500 800 - 800 Other losses 6 - 6 283 - 283 Other expense 3,765 (4) 3,761 3,456 - 3,456 Total non-interest expense 33,388$ (242)$ 33,146$ 32,172$ -$ 32,172$ Annualized non-interest expense to average assets 2.18% 2.16% 2.20% 2.20% March 31, 2021 Three Months Ended Non-GAAP Reconciliation of Non-Interest Expense (Dollars in Thousands, Unaudited) June 30, 2021


