Exhibit 99.1
Filed by Horizon Bancorp
Pursuant to Rule 425 under the Securities Act of 1933
and deemed filed pursuant to Rule 14a-12
of the Securities Exchange Act of 1934
Subject Company: Wolverine Bancorp, Inc.
Commission File No. 001-35034

A NASDAQ Global Select Traded Company - Symbol HBNC
This presentation may contain forward-looking statements regarding the financial performance, business prospects, growth and operating strategies of Horizon Bancorp and its affiliates (collectively, “Horizon”). For these statements, Horizon claims the protection of the safe harbor for forward-looking statements contained in the Private Securities Litigation Reform Act of 1995. Statements in the presentation materials should be considered in conjunction with the other information available about Horizon, including the information in the filings we make with the Securities and Exchange Commission. Forward-looking statements provide current expectations or forecasts of future events and are not guarantees of future performance. The forward-looking statements are based on management’s expectations and are subject to a number of risks and uncertainties. We have tried, wherever possible, to identify such statements by using words such as “anticipate,” “estimate,” “project,” “intend,” “plan,” “believe,” “will” and similar expressions in connection with any discussion of future operating or financial performance.Although management believes that the expectations reflected in such forward-looking statements are reasonable, actual results may differ materially from those expressed or implied in such statements. Risks and uncertainties that could cause actual results to differ materially include risk factors relating to the banking industry and the other factors detailed from time to time in Horizon’s reports filed with the Securities and Exchange Commission, including those described in Horizon’s Annual Report on Form 10-K. Undue reliance should not be placed on the forward-looking statements, which speak only as of the date hereof. Horizon does not undertake, and specifically disclaims any obligation, to publicly release the result of any revisions that may be made to update any forward-looking statement to reflect the events or circumstances after the date on which the forward-looking statement is made, or reflect the occurrence of unanticipated events, except to the extent required by law. Forward-Looking Statements

Mark E. SecorEVP & Chief Financial OfficerJames D. NeffEVP – Consumer & Mortgage Banking
* Mark E. SecorEVP & Chief Financial Officer

Horizon is a Growth Story *

Indiana, Michigan and Ohio… The Right Side of Chicago Illinois and Chicago-High Taxes & Living Costs-Low Credit Rating-Unfriendly Business Environment

Branch Footprint December 2006 Locations – 15Counties – 6 Branches Michigan Illinois Indiana Ohio
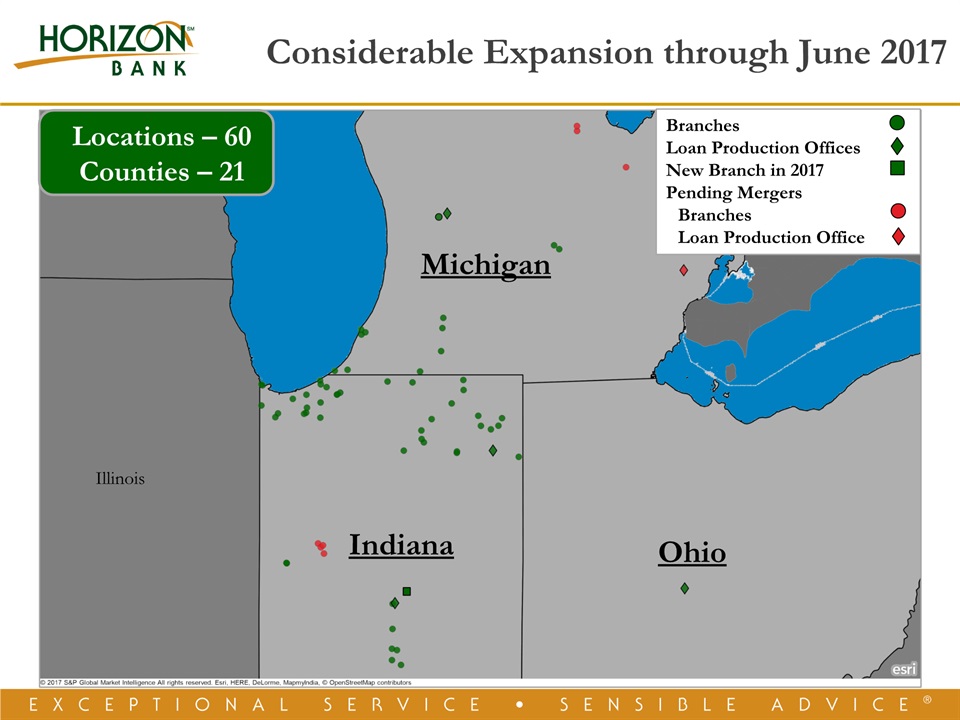
Considerable Expansion through June 2017 BranchesLoan Production Offices New Branch in 2017Pending MergersBranchesLoan Production Office Illinois Locations – 60Counties – 21 Michigan Indiana Ohio

($’s in millions, except per share data)Category 2006 2017 Assets $1,222 $3,321 Loans $848 $2,256 Deposits $914 $2,419 Trust Assets Under Management $391 $1,994 Market Capitalization $88 $585 Stock Price $8.13 $26.35 Average Daily Trading Volume (1) 5,811 59,211 * Growth Transformation Footnote Index included in Appendix

Balance Sheet Positioned Well for the Future * Asset SensitiveGrowth in Higher Yielding AssetsGood Core Deposits Growth
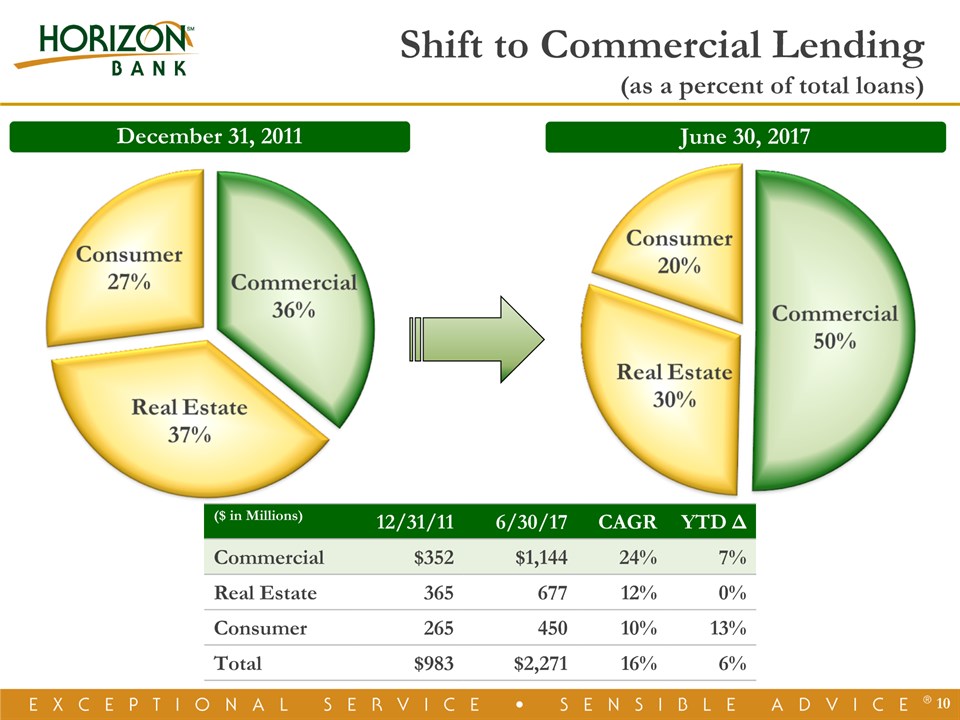
June 30, 2017 December 31, 2011 ($ in Millions) 12/31/11 6/30/17 CAGR YTD Δ Commercial $352 $1,144 24% 7% Real Estate 365 677 12% 0% Consumer 265 450 10% 13% Total $983 $2,271 16% 6% * Shift to Commercial Lending(as a percent of total loans)

June 30, 2017 * Well Diversified Loan Portfolio(Loans as a Percent of Total Loans)
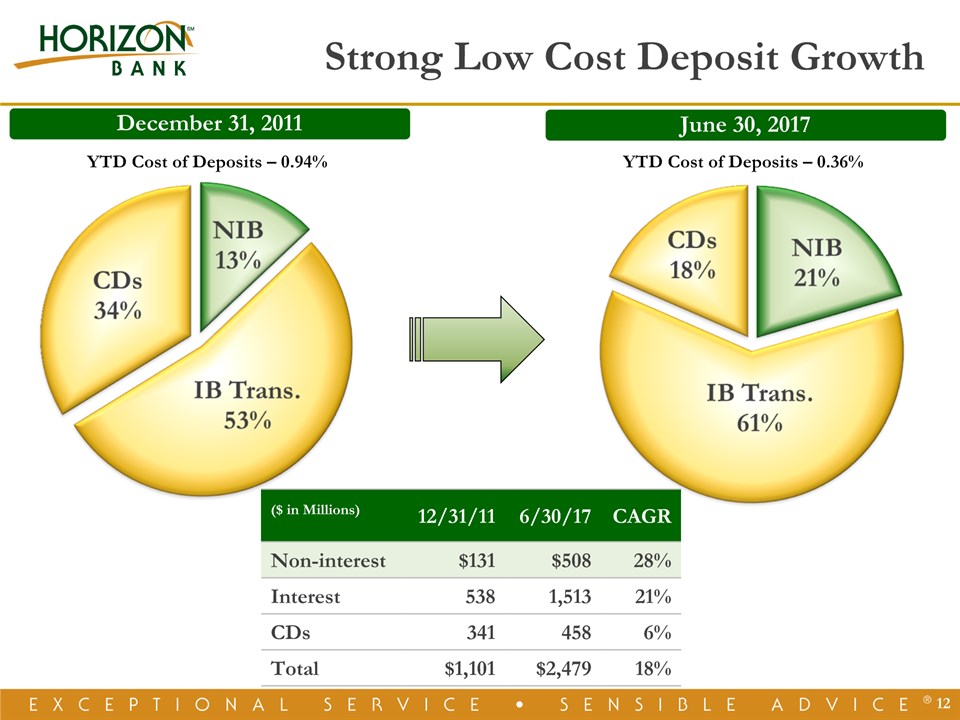
June 30, 2017 December 31, 2011 * Strong Low Cost Deposit Growth YTD Cost of Deposits – 0.94% YTD Cost of Deposits – 0.36% ($ in Millions) 12/31/11 6/30/17 CAGR Non-interest $131 $508 28% Interest 538 1,513 21% CDs 341 458 6% Total $1,101 $2,479 18%

Good Historical EarningsExhibits Ability to Execute *
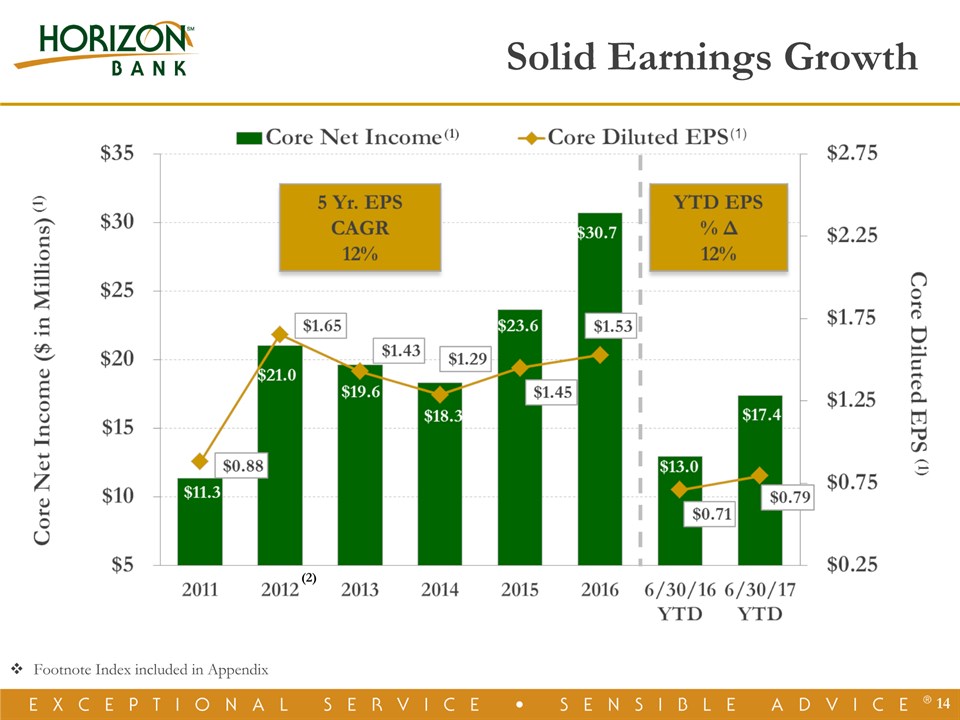
* Solid Earnings Growth (2) Footnote Index included in Appendix

* Less Dependence on Mortgage Revenue (1) Mortgage Revenue defined as interest and fee income from mortgage warehouse loans plus gain on sale of mortgage loans.
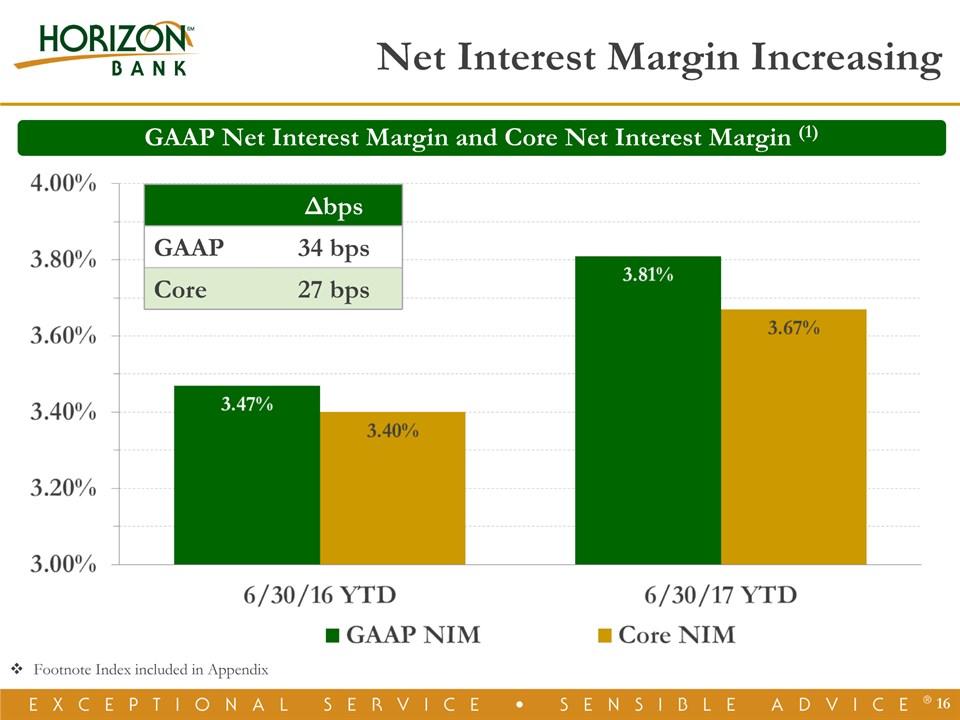
* GAAP Net Interest Margin and Core Net Interest Margin (1) Net Interest Margin Increasing Δbps GAAP 34 bps Core 27 bps Footnote Index included in Appendix
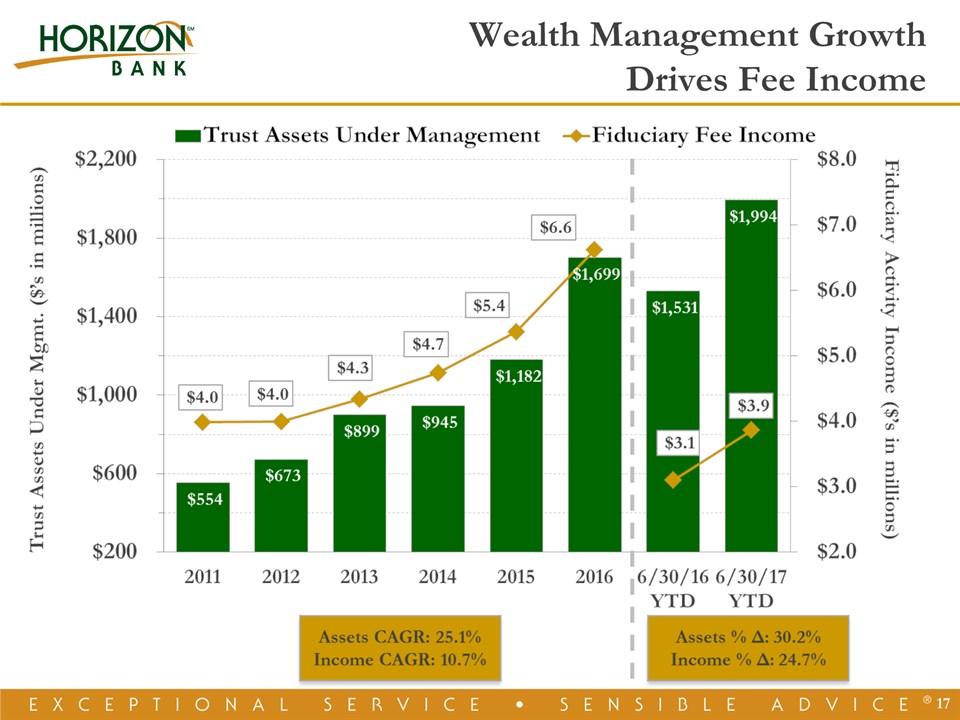
* Wealth Management Growth Drives Fee Income

A Company on the Move *
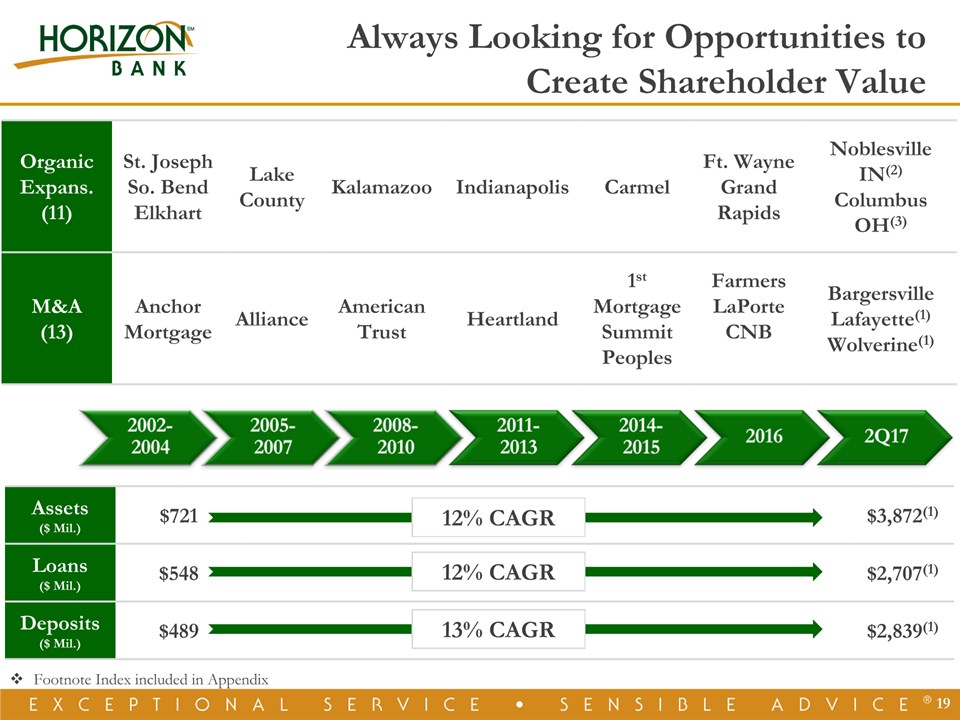
Always Looking for Opportunities to Create Shareholder Value * Assets ($ Mil.) $721 $3,872(1) Loans($ Mil.) $548 $2,707(1) Deposits($ Mil.) $489 $2,839(1) OrganicExpans.(11) St. JosephSo. BendElkhart Lake County Kalamazoo Indianapolis Carmel Ft. WayneGrand Rapids Noblesville IN(2)Columbus OH(3) M&A(13) Anchor Mortgage Alliance American Trust Heartland 1st MortgageSummitPeoples FarmersLaPorteCNB BargersvilleLafayette(1)Wolverine(1) 12% CAGR 12% CAGR 13% CAGR Footnote Index included in Appendix

Growth MarketsEmerging Markets GrandRapids AnnArbor Columbus NW Ohio FortWayne Lafayette Kalamazoo SouthBend Warsaw Indianapolis NWIndiana Growth Opportunities Abound Midland Troy Illinois Indiana Ohio Michigan
Growth MarketsEmerging Markets * GrandRapids AnnArbor Columbus NW Ohio FortWayne Lafayette Kalamazoo SouthBend Warsaw Indianapolis NWIndiana Growth Opportunities Abound Midland Troy Illinois Indiana Ohio Michigan
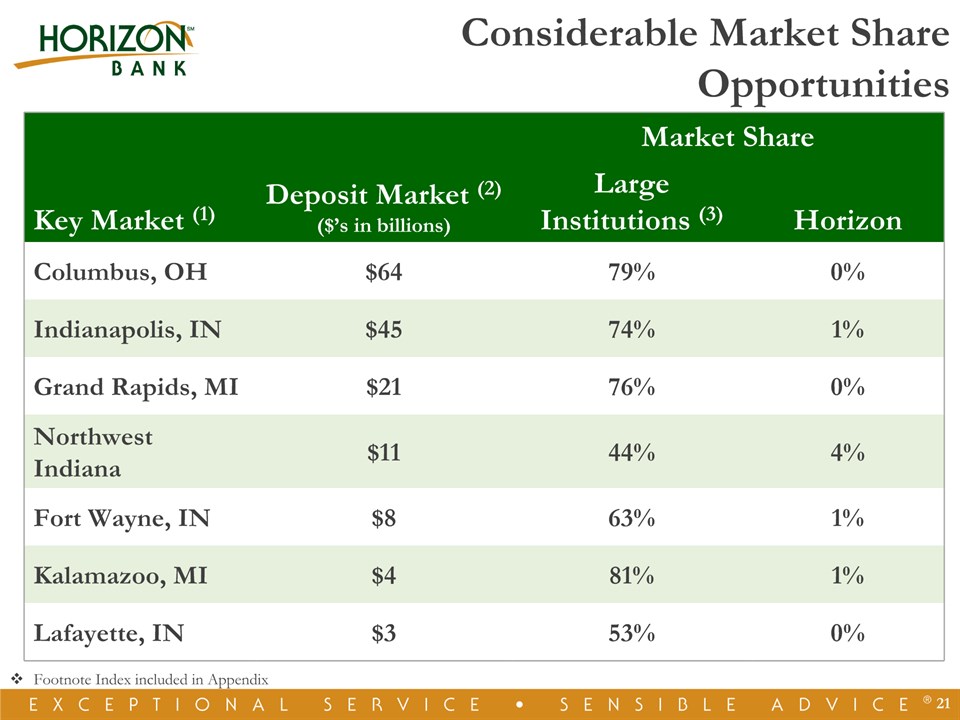
Considerable Market Share Opportunities * (1) (2) (3) Market Share Market Share Key Market (1) Deposit Market (2)($’s in billions) Large Institutions (3) Horizon Columbus, OH $64 79% 0% Indianapolis, IN $45 74% 1% Grand Rapids, MI $21 76% 0% Northwest Indiana $11 44% 4% Fort Wayne, IN $8 63% 1% Kalamazoo, MI $4 81% 1% Lafayette, IN $3 53% 0% Footnote Index included in Appendix

* Number of Banks Headquartered in Indiana and Michigan M&A Opportunities ContinueAs of December 31, 2016 139 Banks within Targeted Markets194 Banks Headquartered in Ohio213 Banks Headquartered in Indiana & Michigan
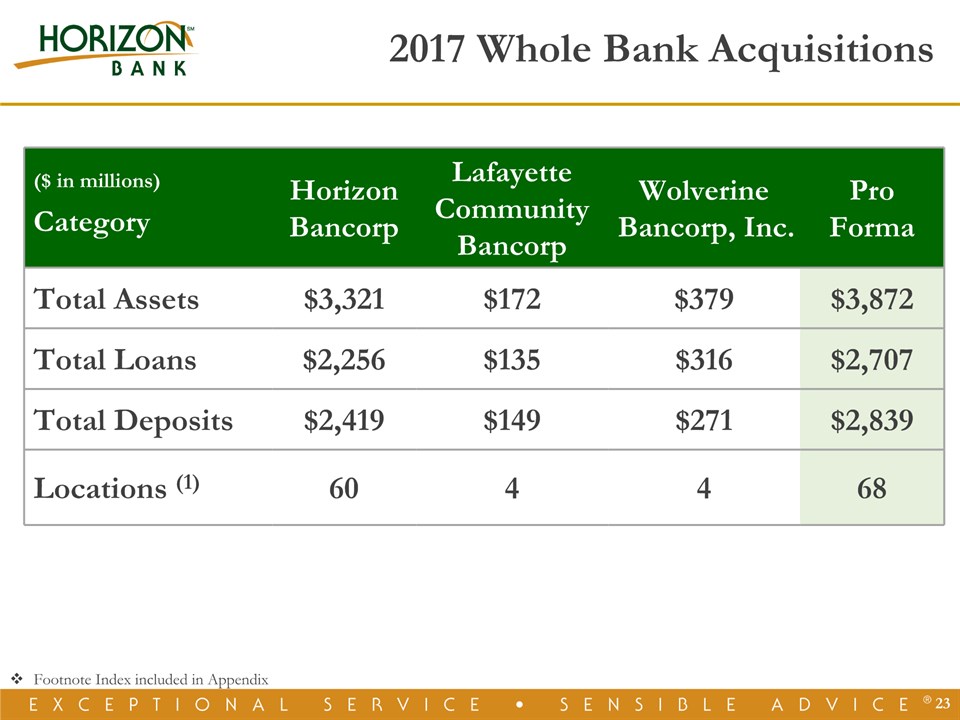
($ in millions)Category Horizon Bancorp Lafayette Community Bancorp Wolverine Bancorp, Inc. Pro Forma Total Assets $3,321 $172 $379 $3,872 Total Loans $2,256 $135 $316 $2,707 Total Deposits $2,419 $149 $271 $2,839 Locations (1) 60 4 4 68 * 2017 Whole Bank Acquisitions Footnote Index included in Appendix
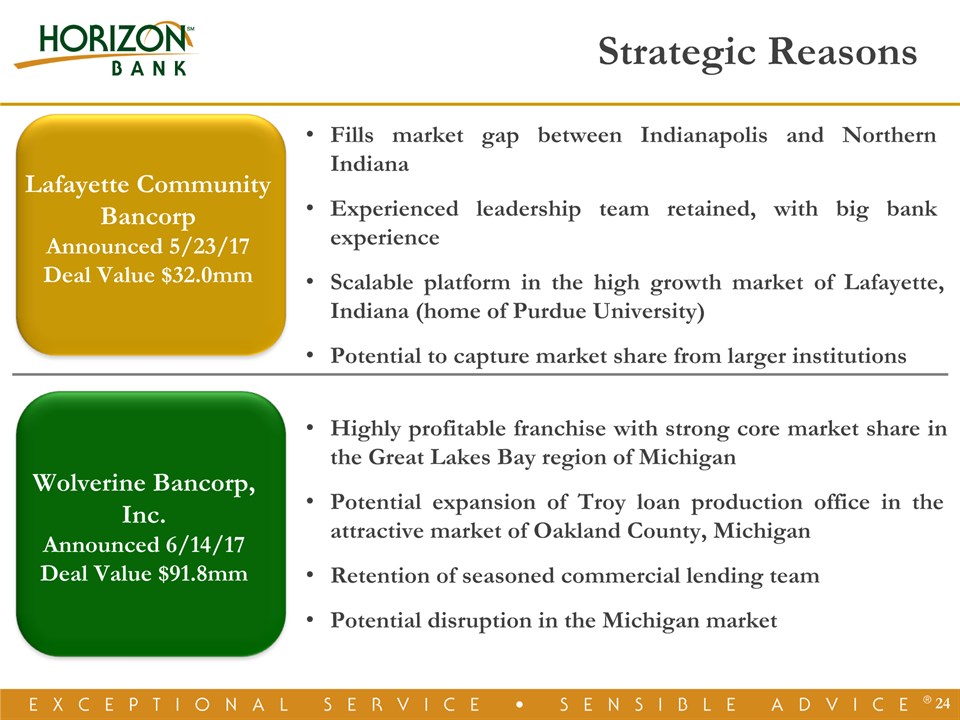
* Fills market gap between Indianapolis and Northern IndianaExperienced leadership team retained, with big bank experienceScalable platform in the high growth market of Lafayette, Indiana (home of Purdue University)Potential to capture market share from larger institutions Strategic Reasons Highly profitable franchise with strong core market share in the Great Lakes Bay region of MichiganPotential expansion of Troy loan production office in the attractive market of Oakland County, MichiganRetention of seasoned commercial lending teamPotential disruption in the Michigan market Wolverine Bancorp, Inc.Announced 6/14/17Deal Value $91.8mm Lafayette Community BancorpAnnounced 5/23/17Deal Value $32.0mm
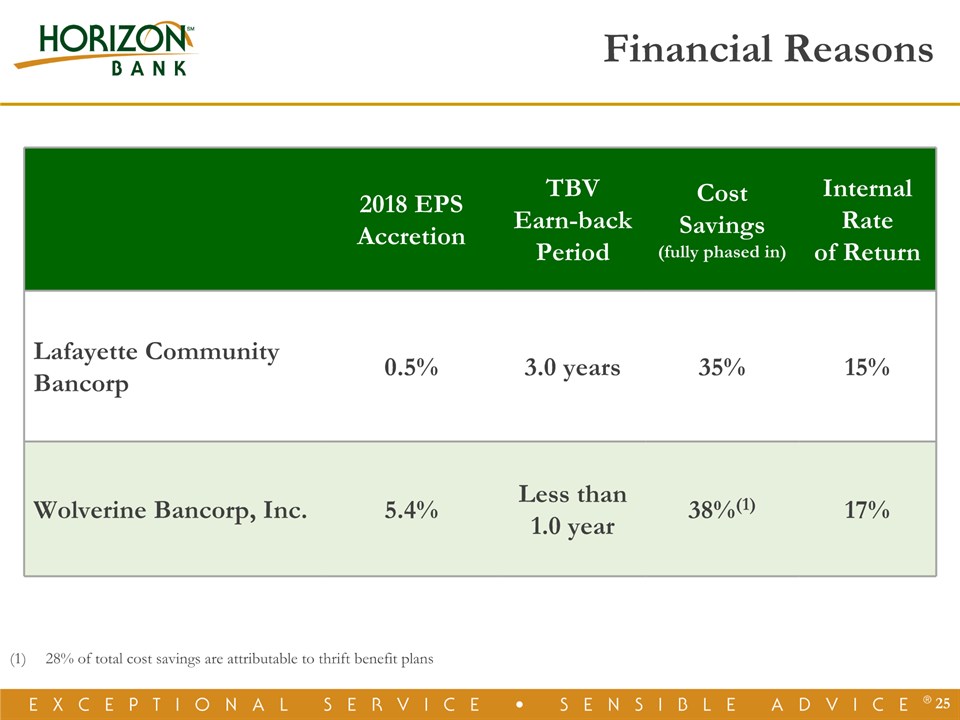
2018 EPSAccretion TBVEarn-backPeriod Cost Savings(fully phased in) Internal Rateof Return Lafayette Community Bancorp 0.5% 3.0 years 35% 15% Wolverine Bancorp, Inc. 5.4% Less than 1.0 year 38%(1) 17% * Financial Reasons 28% of total cost savings are attributable to thrift benefit plans

Historical Financial Performance Illustrates Ability to ExecuteConsistent, Well Executed and Disciplined Business StrategyA Growth Story10-year asset and net income CAGR of 10% and 12%, respectivelyThirteen acquisitions and eleven market expansions since 2002Capacity to take additional market shareEarnings improvement through mass and scaleEntering the “Sweet-Spot” for Market Performance and Trading MultiplesAptitude and Skill to Continue Mergers and Acquisitions * Investment Thesis
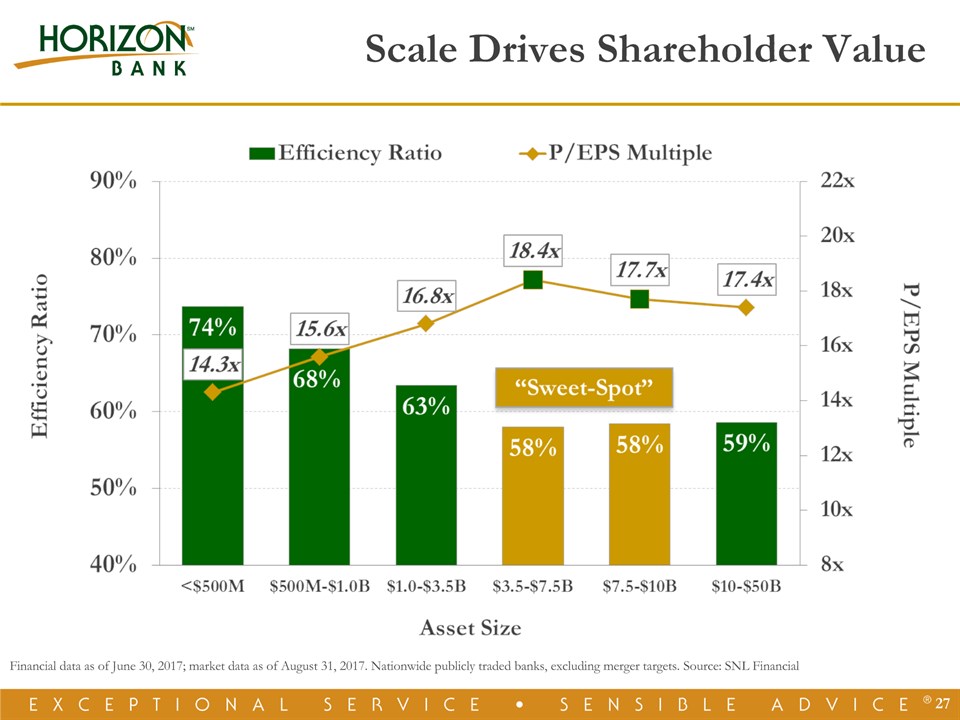
* Scale Drives Shareholder Value Financial data as of June 30, 2017; market data as of August 31, 2017. Nationwide publicly traded banks, excluding merger targets. Source: SNL Financial

Horizon Outperforms the MarketFor Total Shareholder Return As of June 30, 2017SNL U.S. Bank: Includes all Major Exchange Banks in SNL's coverage universe. * Horizon Bancorp: 5-Year Total Return Comparison

A NASDAQ Global Select Traded Company - Symbol HBNC

Appendix *

Slide 8(1) Based on the daily trading volume during the fourth quarter of 2006 and second quarter of 2017.Slide 14(1) Core net income and core diluted EPS excludes one-time merger expenses, gain on sale of securities and death benefit on bank owned life insurance. (See further in the Appendix for a reconciliation of these non-GAAP amounts to their GAAP counterparts.)(2) 2012 results benefited from a record level of mortgage loan production volume and mortgage warehouse loan balances.Slide 16(1) Core net interest margin excludes acquisition-related purchase accounting adjustments. (See further in the Appendix for a reconciliation of these non-GAAP amounts to their GAAP counterparts.)Slide 19(1) Financial information as of 6/30/2017 for Horizon Bancorp reflects the inclusion of 3/31/2017 financial information for the pending Lafayette Community Bancorp and Wolverine Bancorp, Inc. acquisitions, excluding merger adjustments.(2) Planned new branch for 2017 – Noblesville, IN.(3) Loan production office (“LPO”) located in Dublin, OH.Slide 21(1) All Key Markets are MSAs except for Northwest Indiana which includes Lake and Porter Counties.(2) Deposit Market Share as of 6/30/2016.(3) Large Institutions defined as total assets greater than or equal to $10.0 billion at 12/31/2016.Slide 23Horizon Bancorp financials as of 6/30/2017; Lafayette Community Bancorp and Wolverine Bancorp, Inc. financials as of 3/31/2017.(1) Locations include LPOs of Horizon Bancorp [4] and Wolverine Bancorp, Inc. [1]. Horizon’s LPOs are located in Fort Wayne, IN; Grand Rapids, MI; Dublin, OH; and Carmel, IN. Wolverine’s LPO is located in Troy, MI. * Footnote Index
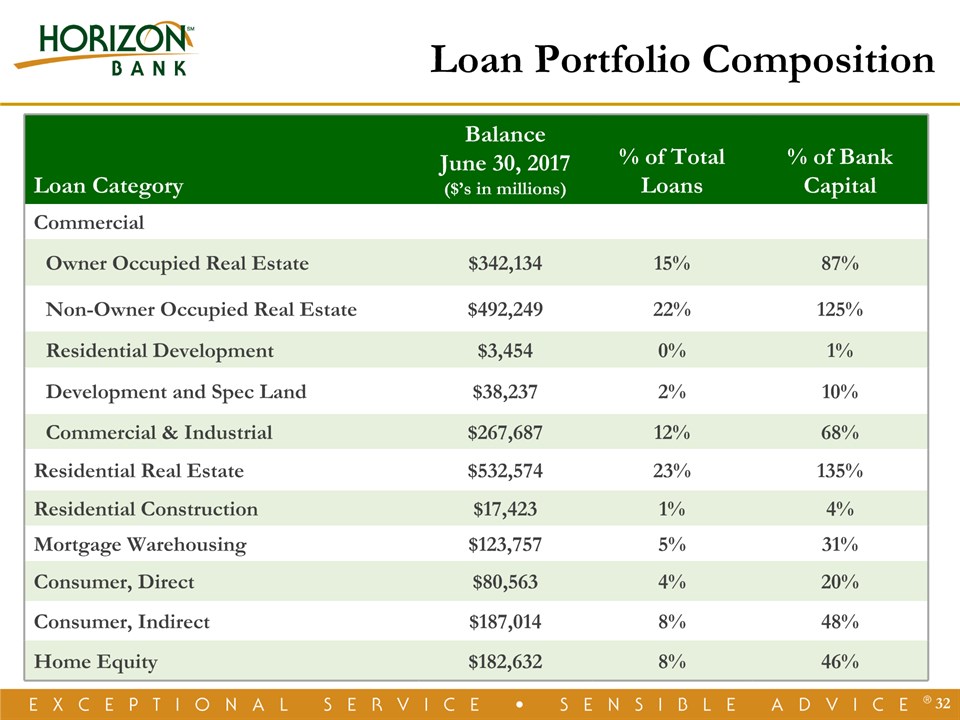
* Loan Portfolio Composition Loan Category BalanceJune 30, 2017($’s in millions) % of Total Loans % of Bank Capital Commercial Owner Occupied Real Estate $342,134 15% 87% Non-Owner Occupied Real Estate $492,249 22% 125% Residential Development $3,454 0% 1% Development and Spec Land $38,237 2% 10% Commercial & Industrial $267,687 12% 68% Residential Real Estate $532,574 23% 135% Residential Construction $17,423 1% 4% Mortgage Warehousing $123,757 5% 31% Consumer, Direct $80,563 4% 20% Consumer, Indirect $187,014 8% 48% Home Equity $182,632 8% 46%

* Non-GAAP Reconciliations

* Non-GAAP Reconciliations
COMMUNICATIONS IN THIS DOCUMENT DO NOT CONSTITUTE AN OFFER TO SELL OR THE SOLICITATION OF AN OFFER TO BUY ANY SECURITIES OR A SOLICITATION OF ANY VOTE OR APPROVAL.In connection with the proposed merger with Wolverine Bancorp, Inc. (“Wolverine Bancorp”), Horizon has filed with the SEC a Registration Statement on Form S-4 that includes a proxy statement of Wolverine Bancorp and a prospectus of Horizon, as well as other relevant documents concerning the proposed transaction. Shareholders and investors are urged to read the Registration Statement and the proxy statement/prospectus regarding the merger and any other relevant documents filed with the SEC, as well as any amendments or supplements to those documents, because they contain important information. A free copy of the proxy statement/prospectus, as well as other filings containing information about Horizon and Wolverine Bancorp, may be obtained free of charge at the SEC’s website at www.sec.gov. You may also obtain these documents, free of charge, from Horizon at www.horizonbank.com under the tab “About Us ― Investor Relations ― Documents ― SEC Filings,” or from Wolverine Bancorp at www.wolverinebank.com under the tab “Investor Information ― SEC Filings.” The information available through Horizon’s and Wolverine Bancorp’s websites is not and shall not be deemed part of this document or incorporated by reference into other filings Horizon or Wolverine Bancorp make with the SEC.Horizon and Wolverine Bancorp and certain of their directors and executive officers may be deemed to be participants in the solicitation of proxies from the shareholders of Wolverine Bancorp in connection with the proposed merger. Information about the directors and executive officers of Horizon is set forth in Horizon’s Annual Report on Form 10-K filed with the SEC on February 28, 2017, and in the proxy statement for Horizon’s 2017 annual meeting of shareholders, as filed with the SEC on March 17, 2017. Information about the directors and executive officers of Wolverine Bancorp is set forth in Wolverine Bancorp’s Annual Report on Form 10-K filed with the SEC on March 31, 2017, and in the proxy statement for Wolverine Bancorp’s 2017 annual meeting of shareholders, as filed with the SEC on April 17, 2017. Additional information regarding the interests of those participants and other persons who may be deemed participants in the transaction may be obtained by reading the proxy statement/prospectus regarding the Wolverine Bancorp merger. Free copies of these documents may be obtained as described in the preceding paragraph. * Additional Information for Shareholders