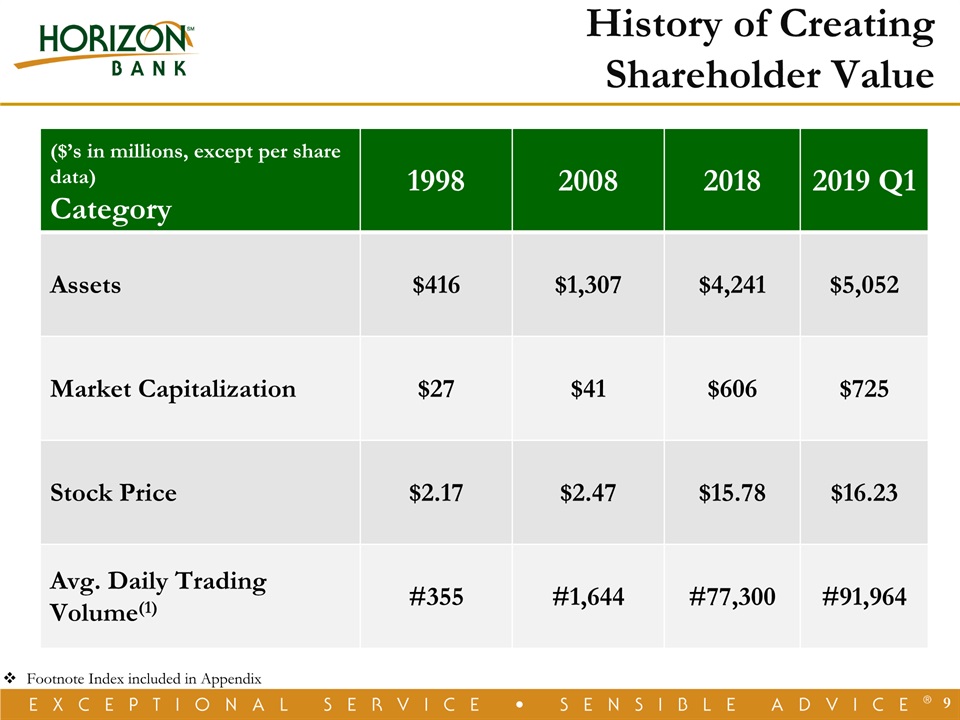
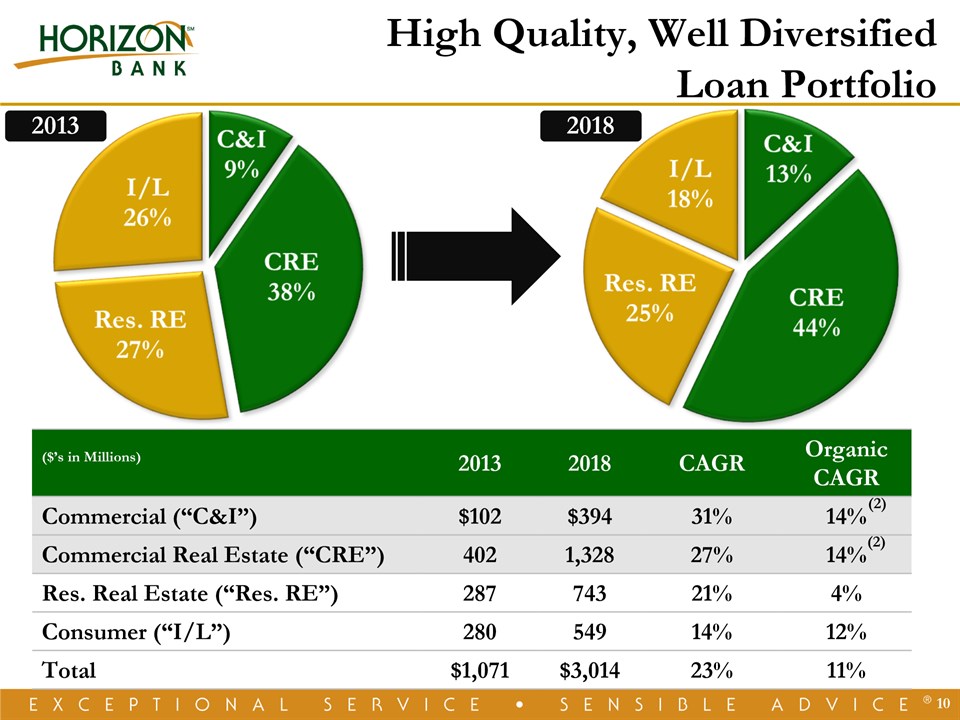
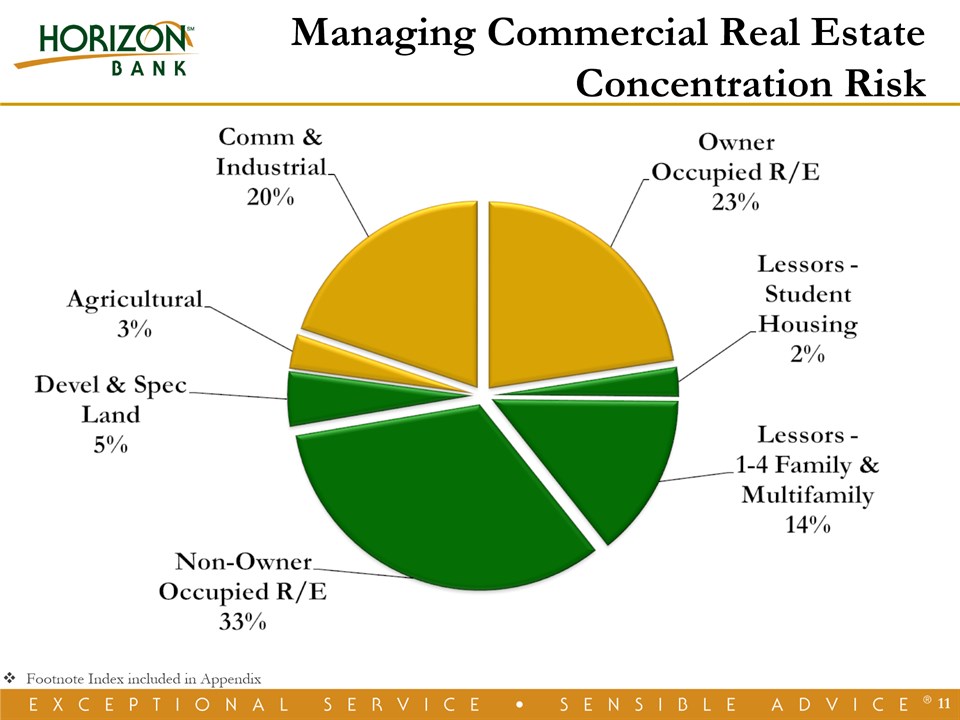
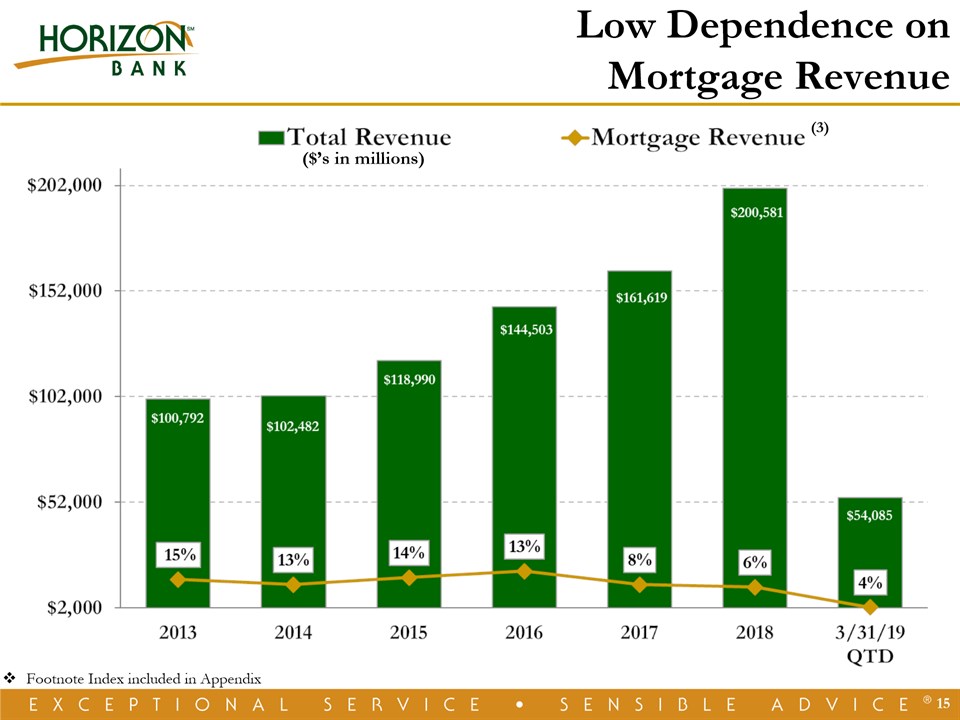
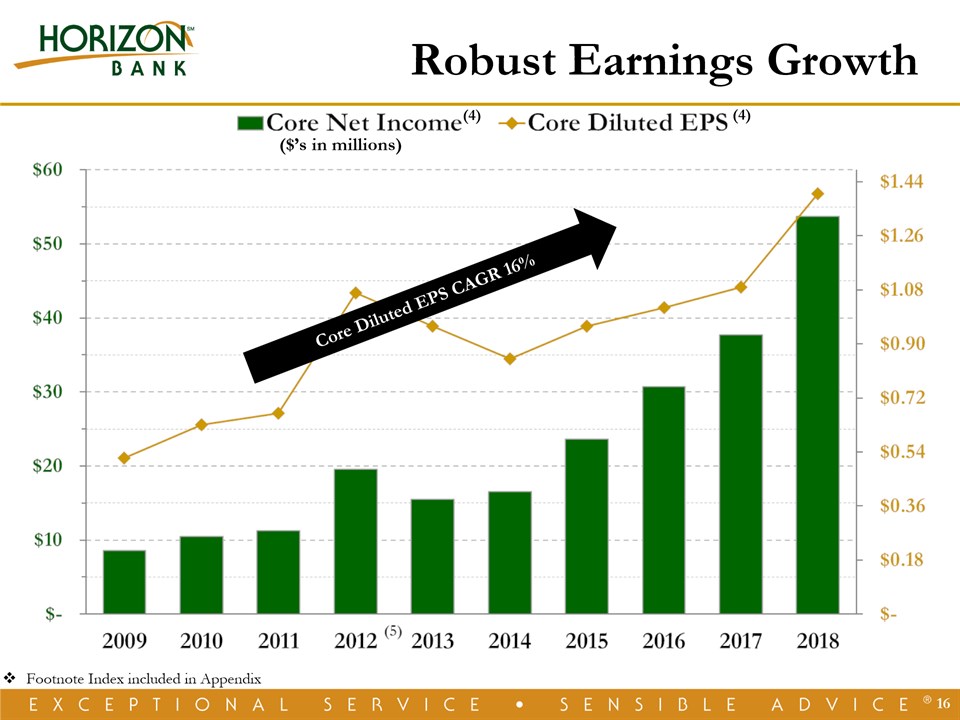
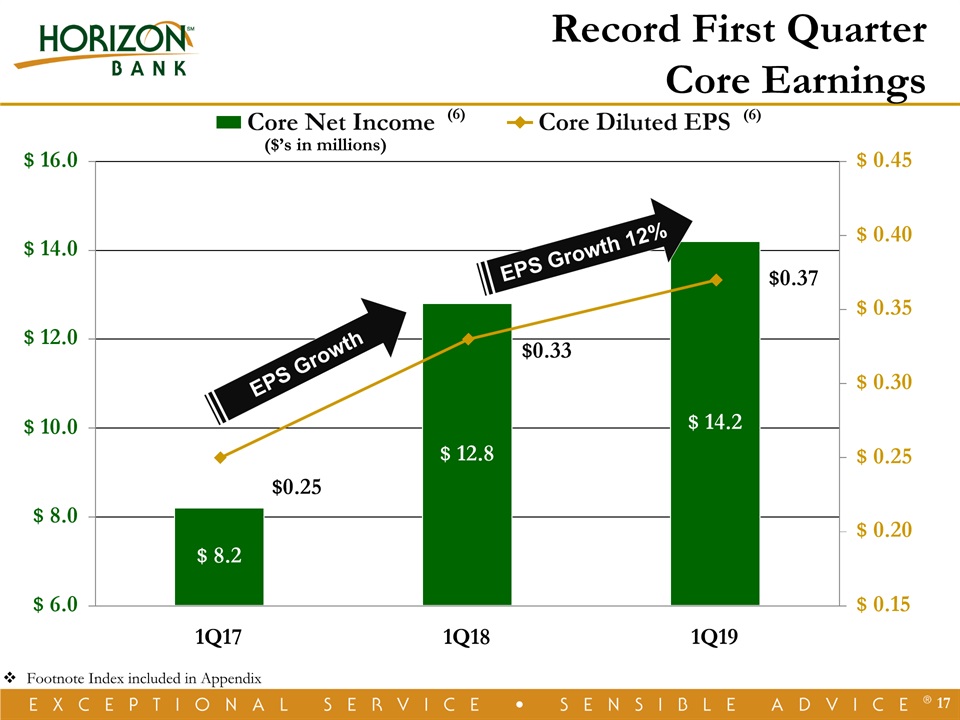
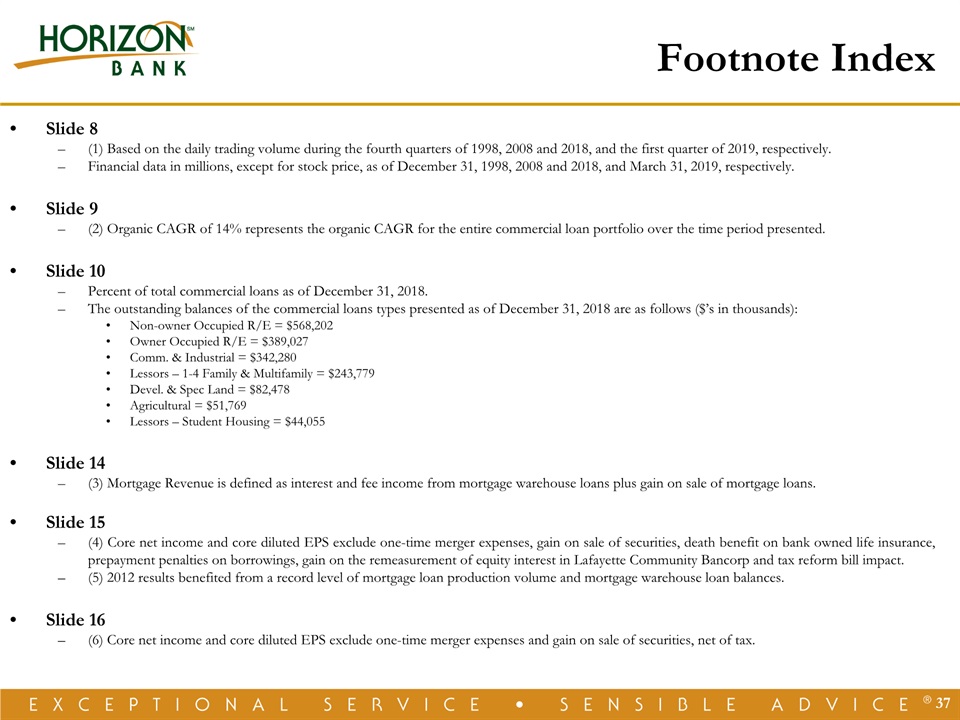
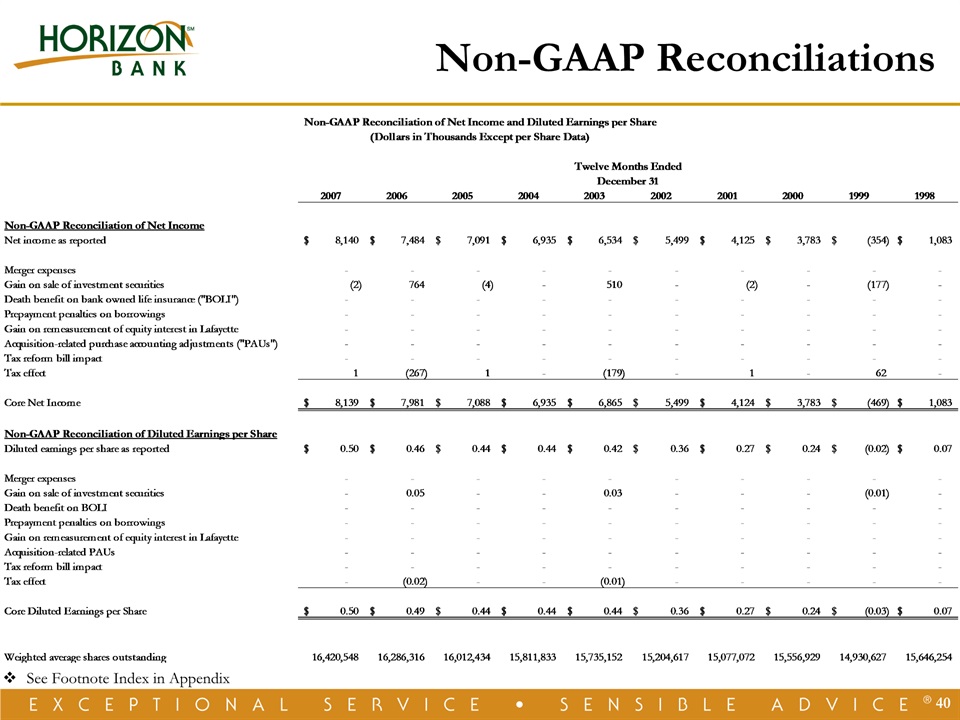
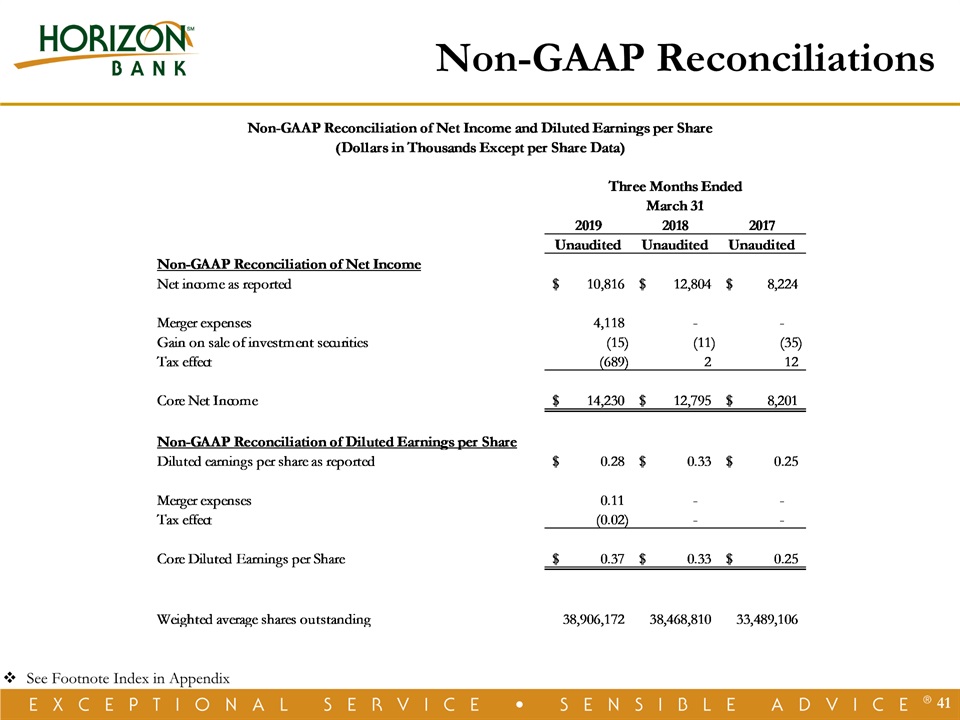
37 Footnote Index Slide 8(1) Based on the daily trading volume during the fourth quarters of 1998, 2008 and 2018, and the first quarter of 2019, respectively.Financial data in millions, except for stock price, as of December 31, 1998, 2008 and 2018, and March 31, 2019, respectively. Slide 9(2) Organic CAGR of 14% represents the organic CAGR for the entire commercial loan portfolio over the time period presented.Slide 10Percent of total commercial loans as of December 31, 2018.The outstanding balances of the commercial loans types presented as of December 31, 2018 are as follows ($’s in thousands):Non-owner Occupied R/E = $568,202Owner Occupied R/E = $389,027Comm. & Industrial = $342,280Lessors – 1-4 Family & Multifamily = $243,779Devel. & Spec Land = $82,478Agricultural = $51,769Lessors – Student Housing = $44,055Slide 14(3) Mortgage Revenue is defined as interest and fee income from mortgage warehouse loans plus gain on sale of mortgage loans.Slide 15(4) Core net income and core diluted EPS exclude one-time merger expenses, gain on sale of securities, death benefit on bank owned life insurance, prepayment penalties on borrowings, gain on the remeasurement of equity interest in Lafayette Community Bancorp and tax reform bill impact.(5) 2012 results benefited from a record level of mortgage loan production volume and mortgage warehouse loan balances.Slide 16(6) Core net income and core diluted EPS exclude one-time merger expenses and gain on sale of securities, net of tax.