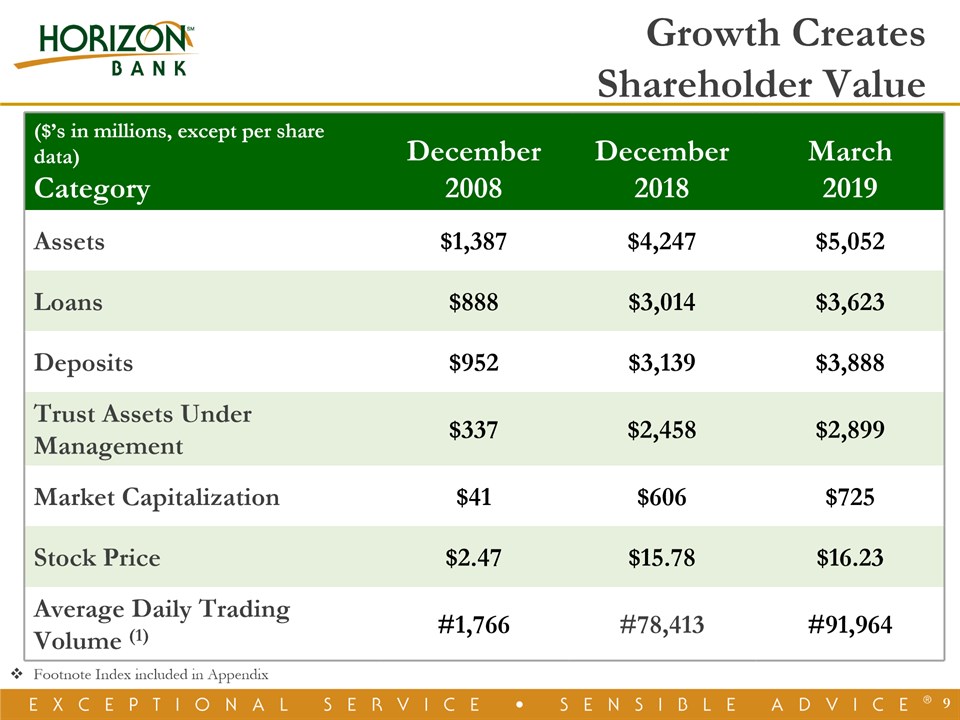
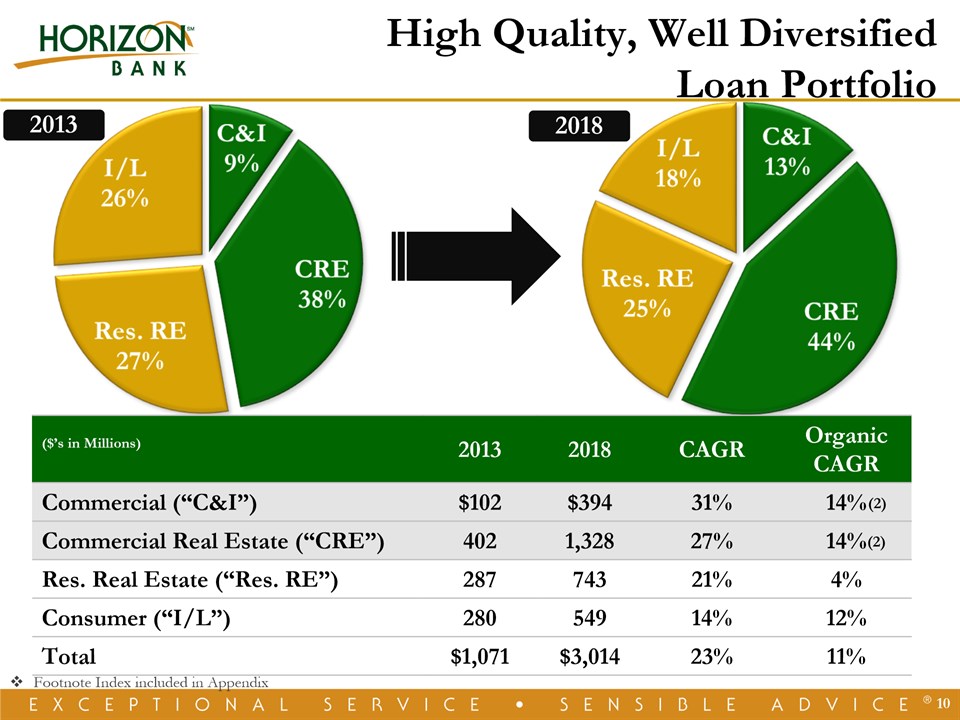
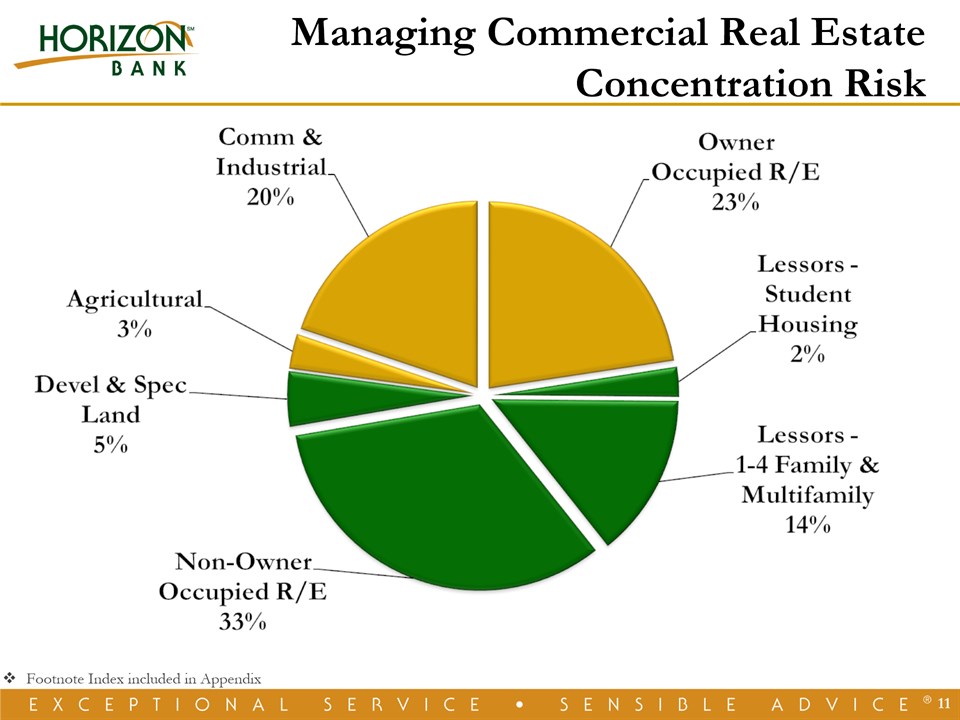
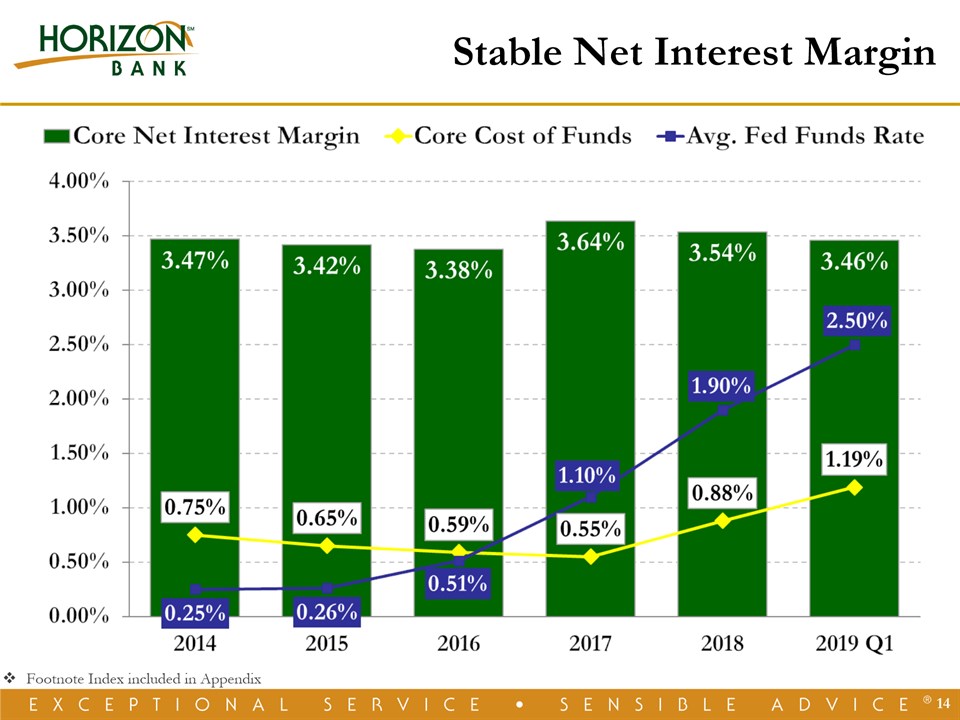
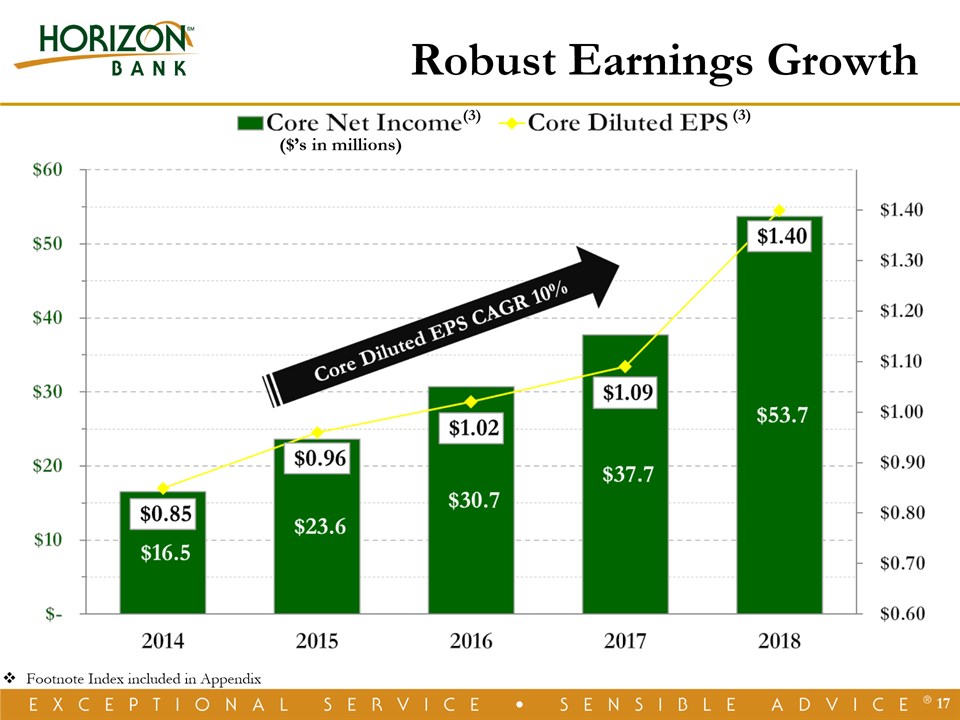
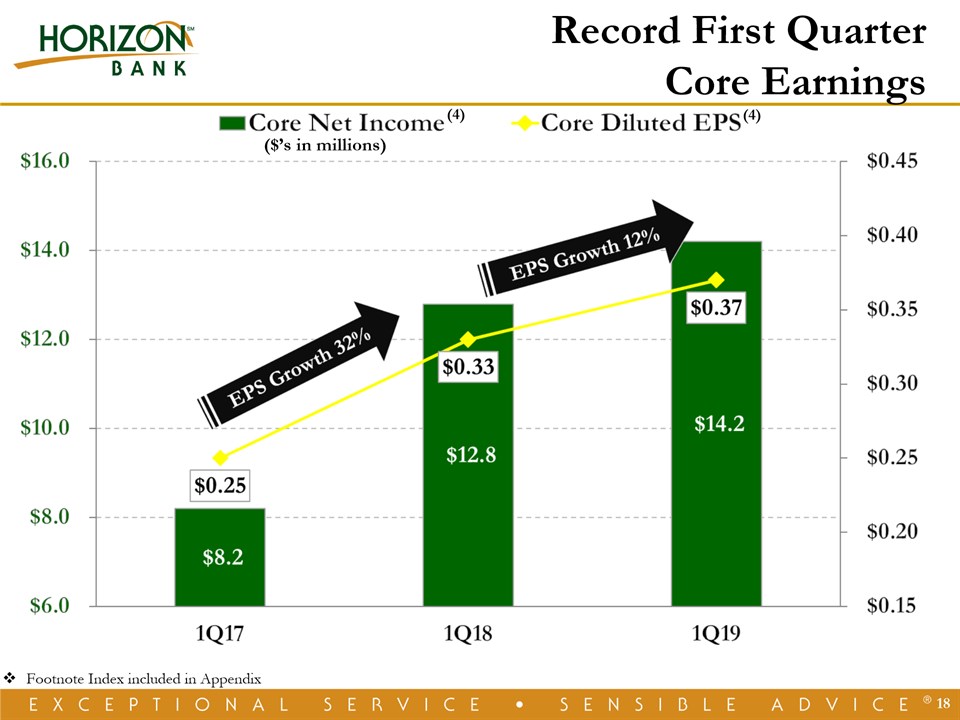
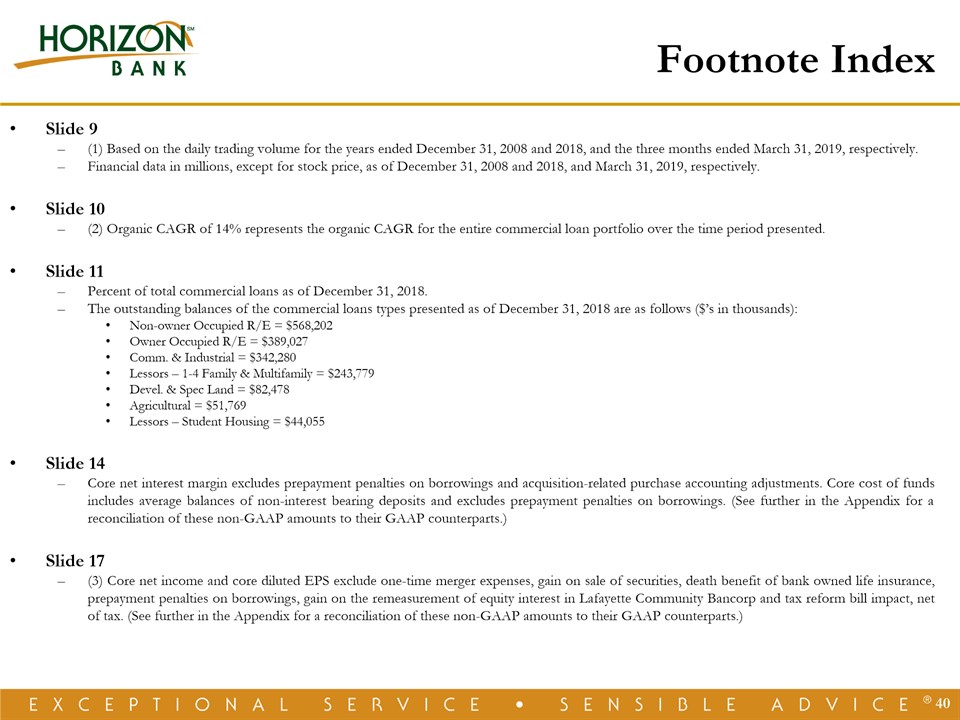
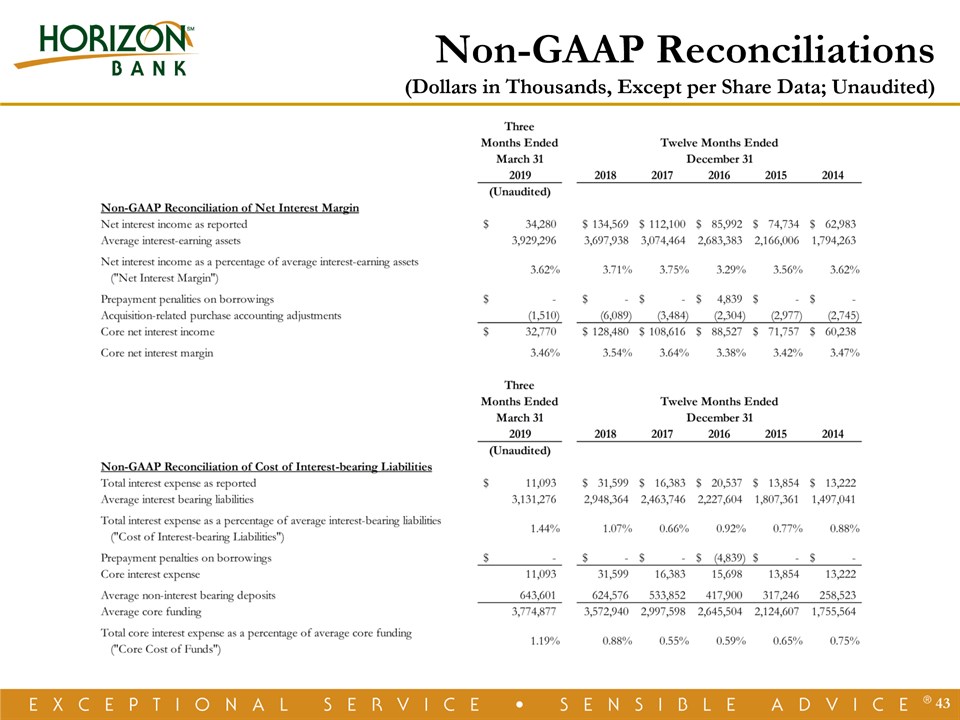
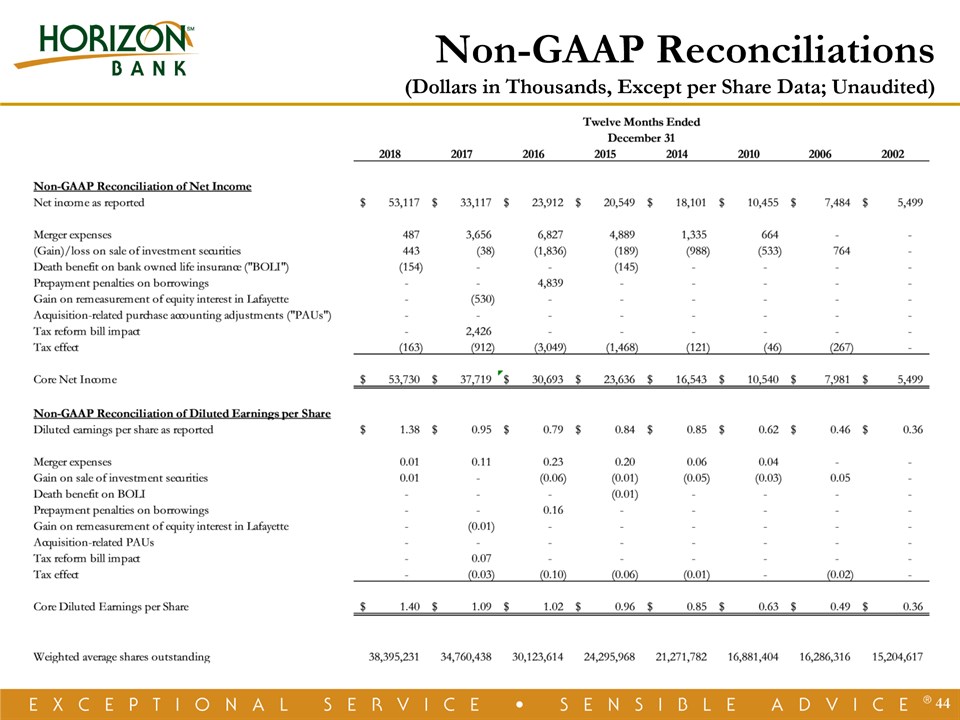
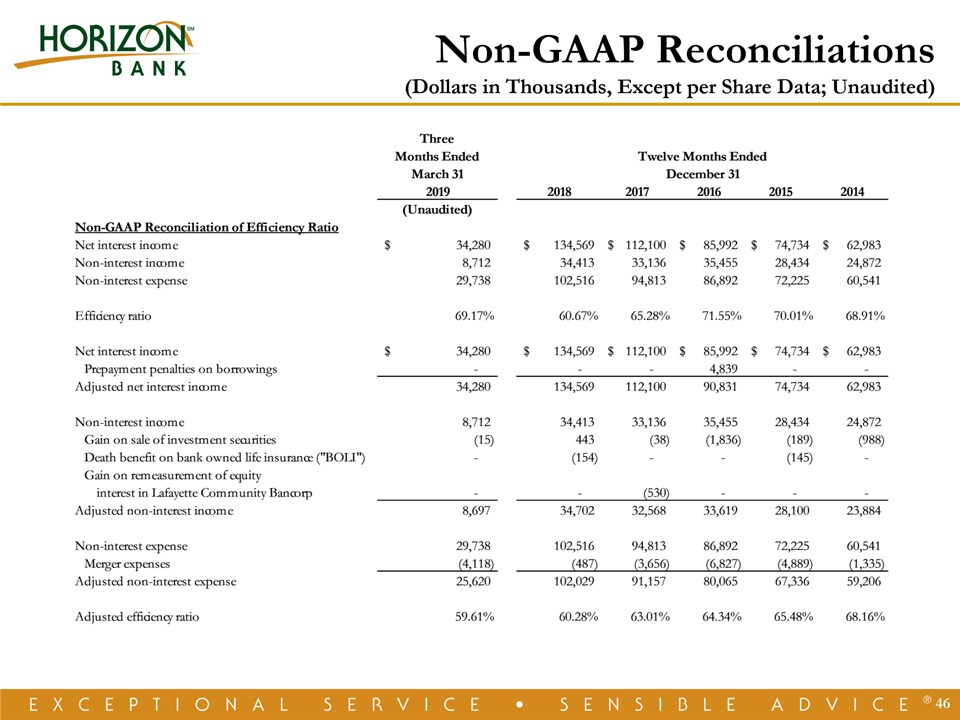
* Footnote Index Slide 9(1) Based on the daily trading volume for the years ended December 31, 2008 and 2018, and the three months ended March 31, 2019, respectively.Financial data in millions, except for stock price, as of December 31, 2008 and 2018, and March 31, 2019, respectively. Slide 10(2) Organic CAGR of 14% represents the organic CAGR for the entire commercial loan portfolio over the time period presented.Slide 11Percent of total commercial loans as of December 31, 2018.The outstanding balances of the commercial loans types presented as of December 31, 2018 are as follows ($’s in thousands):Non-owner Occupied R/E = $568,202Owner Occupied R/E = $389,027Comm. & Industrial = $342,280Lessors – 1-4 Family & Multifamily = $243,779Devel. & Spec Land = $82,478Agricultural = $51,769Lessors – Student Housing = $44,055Slide 14Core net interest margin excludes prepayment penalties on borrowings and acquisition-related purchase accounting adjustments. Core cost of funds includes average balances of non-interest bearing deposits and excludes prepayment penalties on borrowings. (See further in the Appendix for a reconciliation of these non-GAAP amounts to their GAAP counterparts.)Slide 17(3) Core net income and core diluted EPS exclude one-time merger expenses, gain on sale of securities, death benefit of bank owned life insurance, prepayment penalties on borrowings, gain on the remeasurement of equity interest in Lafayette Community Bancorp and tax reform bill impact, net of tax. (See further in the Appendix for a reconciliation of these non-GAAP amounts to their GAAP counterparts.)