Item 1: Report to Shareholders| Growth & Income Fund | December 31, 2005 |
The views and opinions in this report were current as of December 31, 2005. They are not guarantees of performance or investment results and should not be taken as investment advice. Investment decisions reflect a variety of factors, and the managers reserve the right to change their views about individual stocks, sectors, and the markets at any time. As a result, the views expressed should not be relied upon as a forecast of the fund’s future investment intent. The report is certified under the Sarbanes-Oxley Act of 2002, which requires mutual funds and other public companies to affirm that, to the best of their knowledge, the information in their financial reports is fairly and accurately stated in all material respects.
REPORTS ON THE WEB
Sign up for our E-mail Program, and you can begin to receive updated fund reports and prospectuses online rather than through the mail. Log in to your account at troweprice.com for more information.
Fellow Shareholders
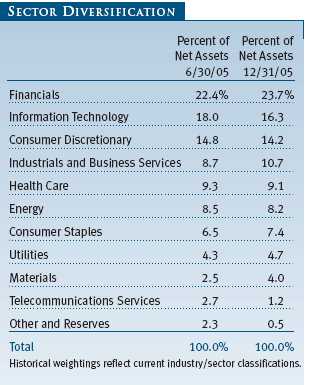
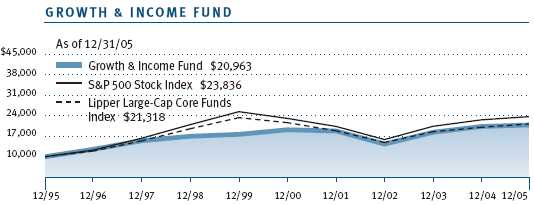
U.S. stocks, as measured by the S&P 500 Stock Index, recorded a lackluster year in 2005, never mustering a quarterly return of more than 4%. This was despite strong margins and profits for many companies and a market that looked and still looks reasonably priced at just 15.3 times 2006 earnings estimates. While large-cap stocks started to perform better in 2005, several mega-cap companies still lagged the overall market. The best-performing sectors in the second half of the year were materials and energy while telecommunications services and consumer discretionary (weighed down by the auto and media groups) fared worst. Financial stocks, the largest sector weighting in your fund, also had a strong second half. The S&P 500 financials rose 9% despite the Federal Reserve’s short-term interest rate increases. Investors appeared to anticipate that the end of the Fed’s hikes was in sight following 13 quarter-point increases over the last 18 months.
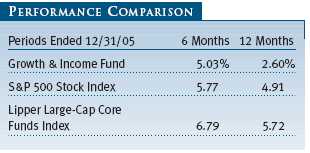
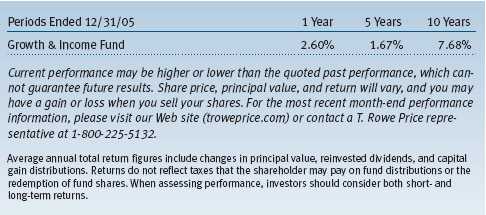
Your fund recorded returns of 5.03% and 2.60% for the 6- and 12-month periods, respectively, as shown in the table. These results lagged both the S&P 500 and the Lipper peer group for both periods and follow two strong years of good absolute and relative performance. Frankly, we were disappointed with 2005. We had a poor stock picking year, characterized by a few big duds and too few studs. Nevertheless, we think our investment process remains sound and that many of the stocks that were poor performers in 2005 can recover. We eliminated those we did not feel as strongly about. We’ll talk more about our holdings in our Portfolio Review section.
Although results for the year were disappointing, the fund’s performance relative to its competitors remains good over the longer term. Lipper ranked the fund in the top 13% of the Lipper large-cap core funds universe for the five-year period ended December 31, 2005. (Based on cumulative total return, Lipper ranked the Growth & Income Fund 687 out of 890, 272 out of 759, 78 out of 619, and 109 out of 229 funds for the 1-, 3-, 5-, and 10-year periods ended December 31, 2005, respectively. Past performance cannot guarantee future results.)
MARKET ENVIRONMENT
As noted earlier, domestic equity returns sputtered for most of the year despite rising earnings and revenue estimates. Gross domestic product grew at a healthy annual rate of 4.1% in the third quarter. Intermediate- and long-term yields remained low despite the Federal Reserve’s best efforts to raise rates through monetary policy. Low mortgage rates helped the housing market maintain its buoyancy against most predictions—including ours. It will be interesting to see the impact on housing prices and even interest rates as proposed tighter lending guidelines on mortgages start to be phased in this year.
The pace of mergers and acquisitions remained somewhat frenzied all year, as many public and private companies were anxious to deploy their excess cash, especially as agitated activist shareholders made their thoughts public through the various media. Complacent management teams with weak results have become vulnerable and are attempting to make shareholder-friendly moves. According to The New York Times, the dollar amount of share repurchases was up more than 60% year-over-year in 2005, and the number of dividend increases among S&P 500 companies was the most since 1998.
PORTFOLIO REVIEW
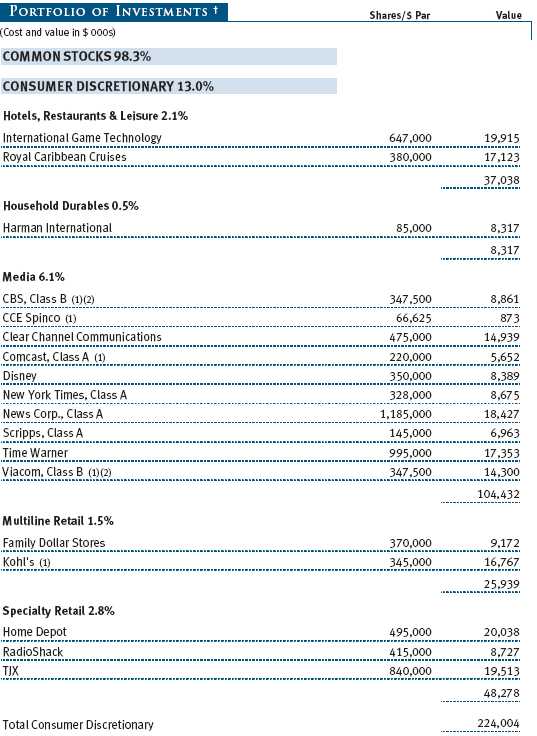
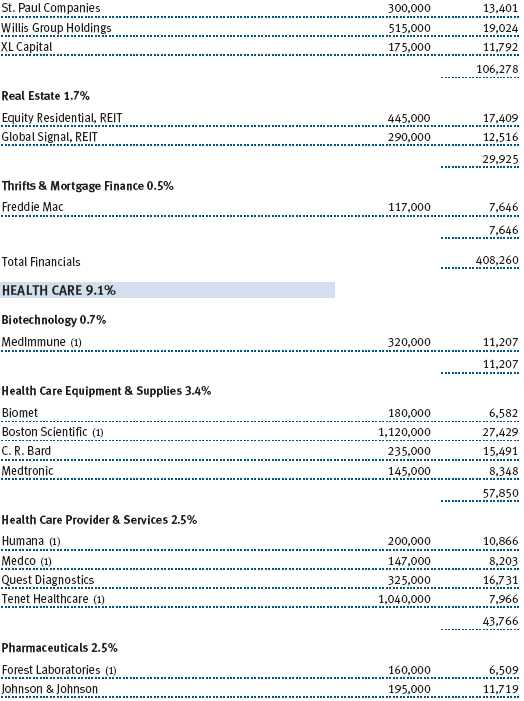
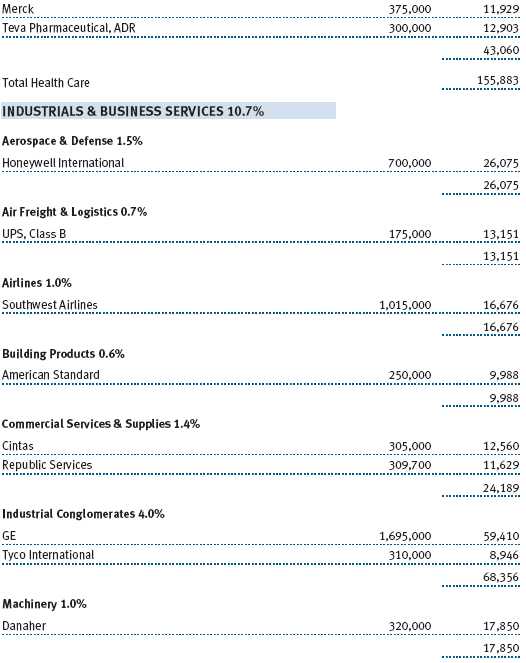
Our second-half winners came from a number of industry groups. Our best performer was technology/life sciences company Agilent Technologies, which we purchased in early June 2005 based on a thesis of margin improvement and a reprioritization of its assets. The thesis developed even faster than we hoped, and we exited our position at the end of the year when the stock reached a price above our comfort level. Three of our longtime energy holdings continued to fare exceptionally well as oil prices remained firm: oil-field services stocks Schlumberger and Baker Hughes and the deepwater driller Transocean. Two of our longtime health care holdings, generic manufacturer Teva Pharmaceutical and biotech MedImmune, also en joyed nice price appreciation. Teva had a number of legal victories, announced a merger that the market cheered, and saw steady growth in its multiple sclerosis drug Copaxone after Elan withdrew its promising new MS drug to investigate some negative side effects more thoroughly. MedImmune benefited from a favorable renegotiation with one of its partners, Abbott Laboratories, on a key drug as well as favorable developments with its FluMist franchise. (Please see our portfolio of investments for a complete listing of the fund’s holdings and the amount each represents in the portfolio.)
Our final strong industry group was financials, where we had three big winners: mega-financial Merrill Lynch, asset gatherer Charles Schwab, and financial conglomerate Marsh & McLennan. Merrill reported strong results that moved the company’s valuation closer to its peers. Schwab benefited from a change in leadership, a recovery in the stock market, and a number of shareholder-friendly moves that included selling a recently acquired, poor-performing asset, and buying back stock. Our final top 10 contributor was Newmont Mining, the world’s largest gold producer, whose stock benefited as the price of gold increased throughout the year.
As for the disappointments, four came from our technology holdings despite a valiant effort by tech stocks in general during the second half of 2005. Unfortunately, we did not own such big winners as Apple Computer and Google and instead suffered losses in more reasonably priced holdings like Dell and Cisco Systems. While neither company is an exceptionally large holding for us, both hampered our results. The market seemed disappointed with Dell’s decelerating revenue growth. As for Cisco, investors appeared to focus on the company’s top-line growth and questioned whether the company can maintain its high margins. Investors also seemed mixed on the company’s announcement that it intends to purchase Scientific-Atlanta. We will continue to monitor the company’s use of free cash flow in its pursuit of acquisitions. Cisco’s largest competitor, Junip er Networks, another fund holding, also saw its stock price languish late in the year with some of the same issues. Investors seemed concerned about the company’s returns from recent acquisitions, general industry competition, and the pace of enterprise spending, which drives Juniper’s growth. We still like Juniper because we think it is reasonably priced, especially relative to its cash-flow potential, and that the company produces best-in-class products. Another tech stock that hampered returns was Flextronics, a provider of advanced electronics services to many companies, including some of our other technology holdings. Several of Flextronic’s high-margin businesses disappointed at the end of the year, causing the company to lower its earnings guidance materially.
Our worst-performing stock was Tenet Healthcare. There were several negative developments, some of them company specific (such as the loss of its CFO and litigation developments), but the stock also suffered from weak industry fundamentals, especially with respect to bad debt expense and the pace of new patient admissions. Another weak performer was Boston Scientific, a medical device company whose key product, Taxus (a drug-coated stent used to keep arteries unclogged), continues to lose market share to competitor Johnson & Johnson’s Cypher. In addition, there were delays to several products in the company’s pipeline. Meanwhile, Sysco, one of the largest food distributors in North America, saw its stock price decline as sales fell a little short, c ausing the company’s earnings to miss consensus targets modestly. We still like Sysco and think that competitive dynamics within the industry are improving.
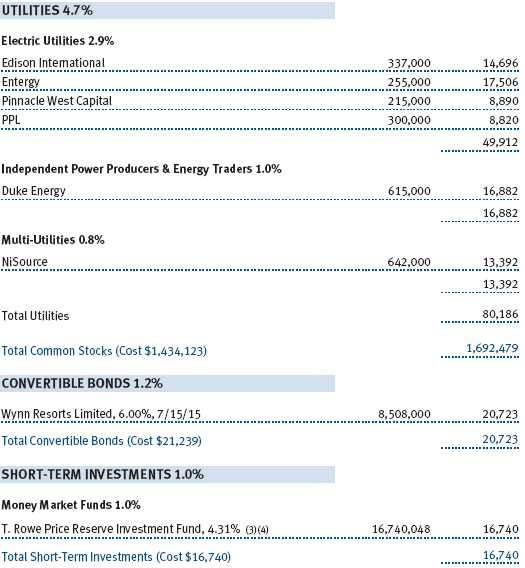
While most of our utility holdings performed well, NiSource was a key laggard after its earnings fell short of estimates. We are sticking with NiSource because the company pays a large dividend and we think earnings disappointments are behind us. Specialty department store chain Kohl’s also hampered results. We are inclined to hold our Kohl’s position because we think this one-time highflier still has good growth potential. Lastly, we trimmed detractor Comcast, the cable company. While the cash-flow picture is still good, it is not as strong as we had expected when we began to buy the stock, and competition to sell consumers the trifecta—video, voice, and data feeds by one provider—only seems to worsen.
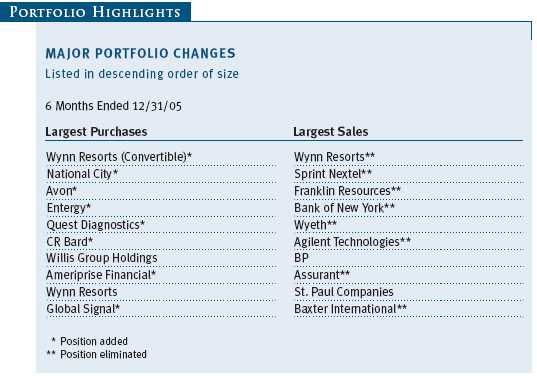
Because of our long-term strategy, the fund continues to have a stable turnover level of about 50%, making our average holding around two years. As usual given our wide investment charter, our list of new purchases was quite diverse. Our largest purchase in the second half was swapping our Wynn Resorts stock into a Wynn Resorts convertible bond. This is our only bond holding, but the switch to the bond was irresistible. A temporary short squeeze allowed us to convert to a bond position that has nearly the same upside potential and downside profile as the stock, yet gives us a coupon to clip while we wait for our investment thesis—tied to the build-out of two major investments, one in Las Vegas and another in Macau—to materialize.
Our second-largest purchase was National City, a regional bank that pays a large dividend but whose stock has underperformed its peer group on concerns about its mortgage business and credit quality concerns on other assets. We also purchased Avon Products, a stock we have had our eye on for some time. The company announced a series of setbacks and is now entering a restructuring phase following several years of good growth. The stock was significantly off its highs before we began our purchases. We bought Entergy, a New Orleans-based integrated utility company that owns and operates five regulated utilities, including Entergy New Orleans, which serves the devastated city of New Orleans. The stock sold off significantly following the hurricane damage, yet the effect of the impacted area on the company’s overall earnings appears not to be as grea t as the value lost in market capitalization during the sell-off. Since we think Entergy is one of the best-managed integrated utility companies in the country, we used this opportunity to establish a position.
We added two new names in health care: Quest Diagnostics, a large diagnostic testing provider, and CR Bard, which makes a diverse set of health care products sold mostly to hospitals. Both Quest and Bard offer reasonable growth at attractive valuations. Another new position was Ameriprise Financial, a spin-off from American Express that focuses on insurance and asset management. We also added Global Signal, a real estate investment trust that is one of the largest owners of wireless communications towers in this country. We think tower companies will continue to benefit from the migration of customers, voice usage, and data traffic from fixed-line to wireless networks. At our purchase price, the stock’s yield was also quite attractive.
We eliminated a few of our recent winners as our theses played out and the upside seemed limited: Sprint Nextel, money manager Franklin Resources, pharmaceutical maker Wyeth, insurance company Assurant, medical technology company Baxter International, and Agilent.
We also capitulated on a few stocks that we thought were dead money for now: drug maker Schering-Plough, technology holding Symantec, newspaper company Washington Post, and trust bank Bank of New York. While we believe these four names could still see upside from current levels, we think the potential is modest relative to new holdings where we have greater confidence.
SUMMARY AND OUTLOOK
The economic outlook remains bright, but we expect the pace of the country’s recovery to slow in 2006. We think earnings growth will be good but the market may need a little time to adjust to new rules on stock-option expensing, which must now be incorporated into companies’ earnings results. We also expect the Federal Reserve to stop raising short-term interest rates sometime in 2006, which may give a lift to financial holdings.

Your fund remains balanced between growth and value stocks and should be well positioned for most environments. Valuations for many large-cap, dividend-paying companies are still reasonable, especially when compared with small- and mid-cap companies. Yes, we know we have said this before, but it continues to be the case, especially among the largest of companies. Finally, many of the companies we own generate substantial free cash flow and are focused more than ever on using this cash to improve their balance sheets or return cash to shareholders, rather than funding speculative internal or external growth initiatives.
We appreciate your confidence in T. Rowe Price and your continued support.
Respectfully submitted,
| Anna M. Dopkin |
| Chairman of the fund’s Investment Advisory Committee |
| |
| January 18, 2006 |
| |
| The committee chairman has day-to-day responsibility for managing the |
| portfolio and works with committee members in developing and executing |
| the fund’s investment program. |
RISKS OF STOCK INVESTING
The fund’s share price can fall because of weakness in the stock markets, a particular industry, or specific holdings. Stock markets can decline for many reasons, including adverse political or economic developments, changes in investor psychology, or heavy institutional selling. The prospects for an industry or company may deteriorate because of a variety of factors, including disappointing earnings or changes in the competitive environment. In addition, the investment manager’s assessment of companies held in a fund may prove incorrect, resulting in losses or poor performance even in rising markets. While the fund will seek dividend-paying stocks, the overall income level is not expected to play a meaningful role in cushioning its share price against market declines.
GLOSSARY
Beta: A measure of the market risk of a portfolio showing how responsive the fund is to a given market index. By definition, the beta of the benchmark index is 1.00. Usually, higher betas represent riskier investments.
Dividend yield: The annual dividend of a stock divided by the stock’s price.
Lipper indexes: Fund benchmarks that consist of a small number of the largest mutual funds in a particular category as tracked by Lipper Inc.
Price/book ratio: A valuation measure that compares a stock’s market price to its book value, i.e., the company’s net worth divided by the number of outstanding shares.
Price/earnings ratio (P/E): A valuation measure calculated by dividing the price of a stock by its current or projected earnings per share. This ratio gives investors an idea of how much they are paying for current or future earnings power.
S&P 500 Stock Index: An unmanaged index that tracks the stocks of 500 primarily large-cap U.S. companies.

This chart shows the value of a hypothetical $10,000 investment in the fund over the past 10 fiscal year periods or since inception (for funds lacking 10-year records). The result is compared with benchmarks, which may include a broad-based market index and a peer group average or index. Market indexes do not include expenses, which are deducted from fund returns as well as mutual fund averages and indexes.
| AVERAGE ANNUAL COMPOUND TOTAL RETURN |
This table shows how the fund would have performed each year if its actual (or cumulative) returns had been earned at a constant rate.
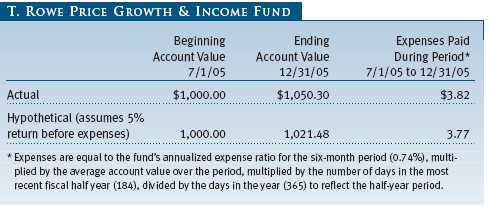
 As a mutual fund shareholder, you may incur two types of costs: (1) transaction costs, such as redemption fees or sales loads, and (2) ongoing costs, including management fees, distribution and service (12b-1) fees, and other fund expenses. The following example is intended to help you understand your ongoing costs (in dollars) of investing in the fund and to compare these costs with the ongoing costs of investing in other mutual funds. The example is based on an investment of $1,000 invested at the beginning of the most recent six-month period and held for the entire period.
Actual Expenses
The first line of the following table (“Actual”) provides information about actual account values and actual expenses. You may use the information in this line, together with your account balance, to estimate the expenses that you paid over the period. Simply divide your account value by $1,000 (for example, an $8,600 account value divided by $1,000 = 8.6), then multiply the result by the number in the first line under the heading “Expenses Paid During Period” to estimate the expenses you paid on your account during this period.
Hypothetical Example for Comparison Purposes
The information on the second line of the table (“Hypothetical”) is based on hypothetical account values and expenses derived from the fund’s actual expense ratio and an assumed 5% per year rate of return before expenses (not the fund’s actual return). You may compare the ongoing costs of investing in the fund with other funds by contrasting this 5% hypothetical example and the 5% hypothetical examples that appear in the shareholder reports of the other funds. The hypothetical account values and expenses may not be used to estimate the actual ending account balance or expenses you paid for the period.
Note: T. Rowe Price charges an annual small-account maintenance fee of $10, generally for accounts with less than $2,000 ($500 for UGMA/UTMA). The fee is waived for any investor whose T. Rowe Price mutual fund accounts total $25,000 or more, accounts employing automatic investing, and IRAs and other retirement plan accounts that utilize a prototype plan sponsored by T. Rowe Price (although a separate custodial or administrative fee may apply to such accounts). This fee is not included in the accompanying table. If you are subject to the fee, keep it in mind when you are estimating the ongoing expenses of investing in the fund and when comparing the expenses of this fund with other funds.
You should also be aware that the expenses shown in the table highlight only your ongoing costs and do not reflect any transaction costs, such as redemption fees or sales loads. Therefore, the second line of the table is useful in comparing ongoing costs only and will not help you determine the relative total costs of owning different funds. To the extent a fund charges transaction costs, however, the total cost of owning that fund is higher.

The accompanying notes are an integral part of these financial statements.


The accompanying notes are an integral part of these financial statements.
The accompanying notes are an integral part of these financial statements.

The accompanying notes are an integral part of these financial statements.

The accompanying notes are an integral part of these financial statements.
| NOTES TO FINANCIAL STATEMENTS |
NOTE 1 - SIGNIFICANT ACCOUNTING POLICIES
T. Rowe Price Growth & Income Fund, Inc. (the fund) is registered under the Investment Company Act of 1940 (the 1940 Act) as a diversified, open-end management investment company. The fund commenced operations on December 21, 1982. The fund seeks to provide long-term capital growth, a reasonable level of current income, and increasing future income through investments primarily in dividend-paying common stocks.
The accompanying financial statements were prepared in accordance with accounting principles generally accepted in the United States of America, which require the use of estimates made by fund management. Fund management believes that estimates and security valuations are appropriate; however actual results may differ from those estimates, and the security valuations reflected in the financial statements may differ from the value the fund ultimately realizes upon sale of the securities.
Valuation The fund values its investments and computes its net asset value per share at the close of the New York Stock Exchange (NYSE), normally 4 p.m. ET, each day that the NYSE is open for business. Equity securities listed or regularly traded on a securities exchange or in the over-the-counter market are valued at the last quoted sale price or, for certain markets, the official closing price at the time the valuations are made, except for OTC Bulletin Board securities, which are valued at the mean of the latest bid and asked prices. A security that is listed or traded on more than one exchange is valued at the quotation on the exchange determined to be the primary market for such security. Listed securities not traded on a particular day are valued at the mean of the latest bid and asked prices for domestic securities and the last quoted sale price for international securities.
Debt securities are generally traded in the over-the-counter market. Securities with original maturities of one year or more are valued at prices furnished by dealers who make markets in such securities or by an independent pricing service, which considers yield or price of bonds of comparable quality, coupon, maturity, and type, as well as prices quoted by dealers who make markets in such securities. Securities with original maturities of less than one year are valued at amortized cost in local currency, which approximates fair value when combined with accrued interest.
Investments in mutual funds are valued at the mutual fund’s closing net asset value per share on the day of valuation. Other investments, including restricted securities, and those for which the above valuation procedures are inappropriate or are deemed not to reflect fair value are stated at fair value as determined in good faith by the T. Rowe Price Valuation Committee, established by the fund’s Board of Directors.
Most foreign markets close before the close of trading on the NYSE. If the fund determines that developments between the close of a foreign market and the close of the NYSE will, in its judgment, materially affect the value of some or all of its portfolio securities, which in turn will affect the fund’s share price, the fund will adjust the previous closing prices to reflect the fair value of the securities as of the close of the NYSE, as determined in good faith by the T. Rowe Price Valuation Committee, established by the fund’s Board of Directors. A fund may also fair value securities in other situations, such as when a particular foreign market is closed but the fund is open. In deciding whether to make fair value adjustments, the fund reviews a variety of factors, including developments in foreign markets, the performance of U.S. securities markets, and the performance of instruments trading in U.S. markets that represent foreign securities and baskets of foreign securi ties. The fund uses outside pricing services to provide it with closing market prices and information used for adjusting those prices. The fund cannot predict when and how often it will use closing prices and when it will adjust those prices to reflect fair value. As a means of evaluating its fair value process, the fund routinely compares closing market prices, the next day’s opening prices in the same markets, and adjusted prices.
Currency Translation Assets, including investments, and liabilities denominated in foreign currencies are translated into U.S. dollar values each day at the prevailing exchange rate, using the mean of the bid and asked prices of such currencies against U.S. dollars as quoted by a major bank. Purchases and sales of securities, income, and expenses are translated into U.S. dollars at the prevailing exchange rate on the date of the transaction. The effect of changes in foreign currency exchange rates on realized and unrealized security gains and losses is reflected as a component of security gains and losses.
Rebates and Credits Subject to best execution, the fund may direct certain security trades to brokers who have agreed to rebate a portion of the related brokerage commission to the fund in cash. Commission rebates are reflected as realized gain on securities in the accompanying financial statements and totaled $157,000 for the year ended December 31, 2005. Additionally, the fund earns credits on temporarily uninvested cash balances at the custodian that reduce the fund’s custody charges. Custody expense in the accompanying financial statements is presented before reduction for credits, which are reflected as expenses paid indirectly.
Investment Transactions, Investment Income, and Distributions Income and expenses are recorded on the accrual basis. Dividends received from mutual fund investments are reflected as dividend income; capital gain distributions are reflected as realized gain/loss. Dividend income and capital gain distributions are recorded on the ex-dividend date. Investment transactions are accounted for on the trade date. Realized gains and losses are reported on the identified cost basis. Distributions to shareholders are recorded on the ex-dividend date. Income distributions are declared and paid on a quarterly basis. Capital gain distributions, if any, are declared and paid by the fund, typically on an annual basis.
NOTE 2 - INVESTMENT TRANSACTIONS
Consistent with its investment objective, the fund engages in the following practices to manage exposure to certain risks or enhance performance. The investment objective, policies, program, and risk factors of the fund are described more fully in the fund’s prospectus and Statement of Additional Information.
Securities Lending The fund lends its securities to approved brokers to earn additional income. It receives as collateral cash and U.S. government securities valued at 102% to 105% of the value of the securities on loan. Cash collateral is invested in a money market pooled trust managed by the fund’s lending agent in accordance with investment guidelines approved by fund management. Collateral is maintained over the life of the loan in an amount not less than the value of loaned securities, as determined at the close of fund business each day; any additional collateral required due to changes in security values is delivered to the fund the next business day. Although risk is mitigated by the collateral, the fund could experience a delay in recovering its securities and a possible loss of income or value if the borrower fails to return the securities. Securities lending revenue recognized by the fund consists of earnings on invested collateral and borrow ing fees, net of any rebates to the borrower and compensation to the lending agent. At December 31, 2005, there were no securities on loan.
Other Purchases and sales of portfolio securities, other than short-term securities, aggregated $909,065,000 and $1,091,946,000, respectively, for the year ended December 31, 2005.NOTE 3 - FEDERAL INCOME TAXES
No provision for federal income taxes is required since the fund intends to continue to qualify as a regulated investment company under Subchapter M of the Internal Revenue Code and distribute to shareholders all of its taxable income and gains. Federal income tax regulations differ from generally accepted accounting principles; therefore, distributions determined in accordance with tax regulations may differ significantly in amount or character from net investment income and realized gains for financial reporting purposes. Financial reporting records are adjusted for permanent book/tax differences to reflect tax character. Financial records are not adjusted for temporary differences.
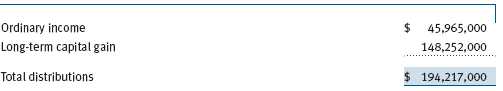
Distributions during the year ended December 31, 2005, were characterized as follows for tax purposes:
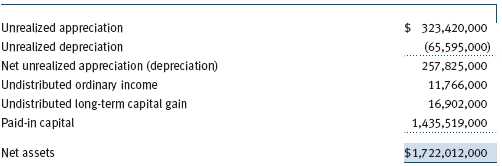
At December 31, 2005, the tax-basis components of net assets were as follows:
For the year ended December 31, 2005, the fund recorded the following permanent reclassifications to reflect tax character. Reclassifications to paid-in capital relate primarily to a tax practice that treats a portion of the proceeds from each redemption of capital shares as a distribution of taxable net investment income and/or realized capital gain. Results of operations and net assets were not affected by these reclassifications.

At December 31, 2005, the cost of investments for federal income tax purposes was $1,472,116,000.
NOTE 4 - RELATED PARTY TRANSACTIONS
The fund is managed by T. Rowe Price Associates, Inc. (the manager or Price Associates), a wholly owned subsidiary of T. Rowe Price Group, Inc. The investment management agreement between the fund and the manager provides for an annual investment management fee, which is computed daily and paid monthly. The fee consists of an individual fund fee, equal to 0.25% of the fund’s average daily net assets, and a group fee. The group fee rate is calculated based on the combined net assets of certain mutual funds sponsored by Price Associates (the group) applied to a graduated fee schedule, with rates ranging from 0.48% for the first $1 billion of assets to 0.29% for assets in excess of $160 billion. Prior to May 1, 2005, the maximum group fee rate in the graduated fee schedule had been 0.295% for assets in excess of $120 billion. The fund’s group fee is determined by applying the group fee rate to the fund’s average daily net assets. At December 31, 2005, the effective annual group fee rate was 0.31%.
In addition, the fund has entered into service agreements with Price Associates and two wholly owned subsidiaries of Price Associates (collectively, Price). Price Associates computes the daily share price and maintains the financial records of the fund. T. Rowe Price Services, Inc., provides shareholder and administrative services in its capacity as the fund’s transfer and dividend disbursing agent. T. Rowe Price Retirement Plan Services, Inc., provides subaccounting and recordkeeping services for certain retirement accounts invested in the fund. For the year ended December 31, 2005, expenses incurred pursuant to these service agreements were $64,000 for Price Associates, $1,141,000 for T. Rowe Price Services, Inc., and $1,436,000 for T. Rowe Price Retirement Plan Services, Inc. The total amount payable at period end pursuant to these service agreements is reflected as Due to Affiliates in the accompanying financial statements.
The fund is also one of several mutual funds sponsored by Price Associates (underlying Price funds) in which the T. Rowe Price Spectrum Funds (Spectrum Funds) may invest. The Spectrum Funds do not invest in the underlying Price funds for the purpose of exercising management or control. Pursuant to a special servicing agreement, expenses associated with the operation of the Spectrum Funds are borne by each underlying Price fund to the extent of estimated savings to it and in proportion to the average daily value of its shares owned by the Spectrum Funds. Expenses allocated under this agreement are reflected as shareholder servicing expense in the accompanying financial statements. For the year ended December 31, 2005, the fund was allocated $7,000 of Spectrum Funds’ expenses, of which $5,000 related to services provided by Price. The amount payable at period end pursuant to this agreement is reflected as Due to Affiliates in the accompanying financial statements. At December 31, 2005, no shares of the fund were held by the Spectrum Funds.
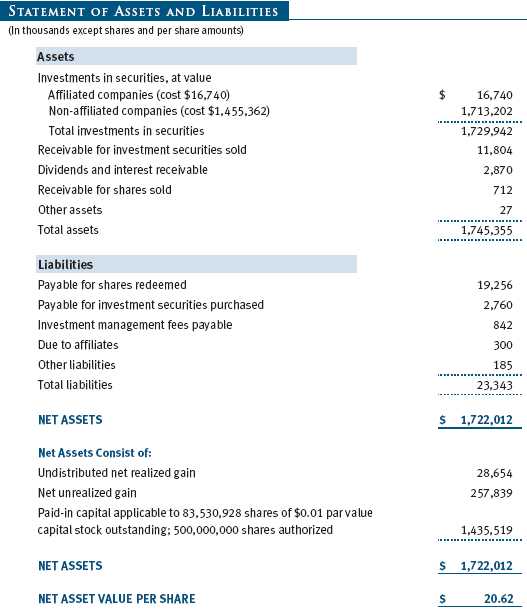
The fund may invest in the T. Rowe Price Reserve Investment Fund and the T. Rowe Price Government Reserve Investment Fund (collectively, the T. Rowe Price Reserve Funds), open-end management investment companies managed by Price Associates and affiliates of the fund. The T. Rowe Price Reserve Funds are offered as cash management options to mutual funds, trusts, and other accounts managed by Price Associates and/or its affiliates, and are not available for direct purchase by members of the public. The T. Rowe Price Reserve Funds pay no investment management fees. During the year ended December 31, 2005, dividend income from the T. Rowe Price Reserve Funds totaled $1,002,000, and the value of shares of the T. Rowe Price Reserve Funds held at December 31, 2005, and December 31, 2004, was $16,740,000 and $30,483,000, respectively.
As of December 31, 2005, T. Rowe Price Group, Inc. and/or its wholly owned subsidiaries owned 123,050 shares of the fund, representing less than 1% of the fund’s net assets.
| REPORT OF INDEPENDENT REGISTERED PUBLIC ACCOUNTING FIRM |
To the Board of Directors and Shareholders of T. Rowe Price Growth & Income Fund, Inc.
In our opinion, the accompanying statement of assets and liabilities, including the portfolio of investments, and the related statements of operations and of changes in net assets and the financial highlights present fairly, in all material respects, the financial position of T. Rowe Price Growth & Income Fund, Inc. (the “Fund”) at December 31, 2005, the results of its operations for the year then ended, the changes in its net assets for each of the two years in the period then ended, and the financial highlights for each of the five years in the period then ended, in conformity with accounting principles generally accepted in the United States of America. These financial statements and financial highlights (hereafter referred to as “financial statements”) are the responsibility of the Fund’s management; our responsibility is to express an opinion on these financial statements based on our audits. We conducted our audits of these financial statements in accordance with the standards of the Public Company Accounting Oversight Board (United States). Those standards require that we plan and perform the audit to obtain reasonable assurance about whether the financial statements are free of material misstatement. An audit includes examining, on a test basis, evidence supporting the amounts and disclosures in the financial statements, assessing the accounting principles used and significant estimates made by management, and evaluating the overall financial statement presentation. We believe that our audits, which included confirmation of securities at December 31, 2005, by correspondence with the custodian and by agreement to the underlying ownership records for T. Rowe Price Reserve Investment Fund, provide a reasonable basis for our opinion.
| PricewaterhouseCoopers LLP |
| Baltimore, Maryland |
| February 13, 2006 |
| TAX INFORMATION (UNAUDITED) FOR THE TAX YEAR ENDED 12/31/05 |
We are providing this information as required by the Internal Revenue Code. The amounts shown may differ from those elsewhere in this report because of differences between tax and financial reporting requirements.
The fund’s distributions to shareholders included:
- $33,231,000 from short-term capital gains,
- $164,055,000 from long-term capital gains, subject to the 15% rate gains category.
For taxable non-corporate shareholders, $29,458,000 of the fund’s income represents qualified dividend income subject to the 15% rate category.
For corporate shareholders, $25,448,000 of the fund’s income qualifies for the dividends-received deduction.
| INFORMATION ON PROXY VOTING POLICIES, PROCEDURES, AND RECORDS |
A description of the policies and procedures used by T. Rowe Price funds and portfolios to determine how to vote proxies relating to portfolio securities is available in each fund’s Statement of Additional Information, which you may request by calling 1-800-225-5132 or by accessing the SEC’s Web site, www.sec.gov. The description of our proxy voting policies and procedures is also available on our Web site, www.troweprice.com. To access it, click on the words “Company Info” at the top of our homepage for individual investors. Then, in the window that appears, click on the “Proxy Voting Policy” navigation button in the top left corner.
Each fund’s most recent annual proxy voting record is available on our Web site and through the SEC’s Web site. To access it through our Web site, follow the directions above, then click on the words “Proxy Voting Record” at the bottom of the Proxy Voting Policy page.
| HOW TO OBTAIN QUARTERLY PORTFOLIO HOLDINGS |
The fund files a complete schedule of portfolio holdings with the Securities and Exchange Commission for the first and third quarters of each fiscal year on Form N-Q. The fund’s Form N-Q is available electronically on the SEC’s Web site (www.sec.gov); hard copies may be reviewed and copied at the SEC’s Public Reference Room, 450 Fifth St. N.W., Washington, DC 20549. For more information on the Public Reference Room, call 1-800-SEC-0330.
| ABOUT THE FUND’S DIRECTORS AND OFFICERS |
Your fund is governed by a Board of Directors that meets regularly to review investments, performance, compliance matters, advisory fees, expenses, and other business affairs, and is responsible for protecting the interests of shareholders. The majority of the fund’s directors are independent of T. Rowe Price Associates, Inc. (T. Rowe Price); “inside” directors are officers of T. Rowe Price. The Board of Directors elects the fund’s officers, who are listed in the final table. The business address of each director and officer is 100 East Pratt Street, Baltimore, MD 21202. The Statement of Additional Information includes additional information about the fund directors and is available without charge by calling a T. Rowe Price representative at 1-800-225-5132.
| Independent Directors | |
| |
| Name | |
| (Year of Birth) | |
| Year Elected* | |
| [Number of T. Rowe Price | Principal Occupation(s) During Past 5 Years and Directorships of |
| Portfolios Overseen] | Other Public Companies |
| |
| Jeremiah E. Casey** | Director, National Life Insurance (2001 to 8/05); Director, The Rouse |
| (1940) | Company, real estate developers (1990 to 2004) |
| 2005 | |
| [59] | |
| |
| Anthony W. Deering | Chairman, Exeter Capital, LLC, a private investment firm (2004 to pres- |
| (1945) | ent); Director, Chairman of the Board, and Chief Executive Officer, The |
| 2001 | Rouse Company, real estate developers (1997 to 2004); Director, |
| [113] | Mercantile Bank (4/03 to present) |
| |
| Donald W. Dick, Jr. | Principal, EuroCapital Advisors, LLC, an acquisition and management |
| (1943) | advisory firm; Chairman, President, and Chief Executive Officer, The |
| 1982 | Haven Group, a custom manufacturer of modular homes (1/04 to |
| [113] | present) |
| |
| David K. Fagin | Chairman and President, Nye Corporation (6/88 to present); Director, |
| (1938) | Canyon Resources Corp. and Golden Star Resources Ltd. (5/00 to |
| 1994 | present) and Pacific Rim Mining Corp. (2/02 to present) |
| [113] | |
| |
| Karen N. Horn | Managing Director and President, Global Private Client Services, |
| (1943) | Marsh Inc. (1999 to 2003); Managing Director and Head of |
| 2003 | International Private Banking, Bankers Trust (1996 to 1999); Director, |
| [113] | Eli Lilly and Company and Georgia Pacific |
| F. Pierce Linaweaver | President, F. Pierce Linaweaver & Associates, Inc., consulting environ- |
| (1934) | mental and civil engineers |
| 2001 | |
| [113] | |
| |
| Theo C. Rodgers*** | President, A&R Development Corporation |
| (1941) | |
| 2005 | |
| [97] | |
| |
| John G. Schreiber | Owner/President, Centaur Capital Partners, Inc., a real estate invest- |
| (1946) | ment company; Partner, Blackstone Real Estate Advisors, L.P.; |
| 2001 | Director, AMLI Residential Properties Trust |
| [113] | |
| * | Each independent director serves until retirement, resignation, or election of a successor. |
| ** | Elected effective October 19, 2005. |
| *** | Elected effective April 1, 2005. |
| Inside Directors | |
| |
| Name | |
| (Year of Birth) | |
| Year Elected* | |
| [Number of T. Rowe Price | Principal Occupation(s) During Past 5 Years and Directorships of |
| Portfolios Overseen] | Other Public Companies |
| |
| James A.C. Kennedy, CFA | Director and Vice President, T. Rowe Price and T. Rowe Price Group, |
| (1953) | Inc.; Director, T. Rowe Price Global Asset Management Limited, |
| 1997 | T. Rowe Price Global Investment Services Limited, and T. Rowe Price |
| [45] | International, Inc. |
| |
| James S. Riepe | Director and Vice President, T. Rowe Price; Vice Chairman of the Board, |
| (1943) | Director, and Vice President, T. Rowe Price Group, Inc.; Chairman of the |
| 1982 | Board and Director, T. Rowe Price Global Asset Management Limited, |
| [113] | T. Rowe Price Global Investment Services Limited, T. Rowe Price |
| | Investment Services, Inc., T. Rowe Price Retirement Plan Services, |
| | Inc., and T. Rowe Price Services, Inc.; Chairman of the Board, Director, |
| | President, and Trust Officer, T. Rowe Price Trust Company; Director, |
| | T. Rowe Price International, Inc.; Chairman of the Board, all funds |
| *Each inside director serves until retirement, resignation, or election of a successor. |
| Officers | |
| |
| Name (Year of Birth) | |
| Title and Fund(s) Served | Principal Occupation(s) |
| |
| Francisco Alonso (1978) | Vice President, T. Rowe Price and T. Rowe Price |
| Vice President, Growth & Income Fund | Group, Inc. |
| |
| Jeffrey W. Arricale, CPA (1971) | Vice President, T. Rowe Price and T. Rowe Price |
| Vice President, Growth & Income Fund | Group, Inc.; formerly student, the Wharton |
| | School, University of Pennsylvania (to 2001) |
| |
| Timothy F. Bei (1973) | Vice President, T. Rowe Price; formerly student, |
| Vice President, Growth & Income Fund | University of Virginia (to 2003); Director of |
| | Business Development, Jupitermedia |
| | Corporation (to 2001) |
| |
| Laurie M. Bertner (1977) | Vice President, T. Rowe Price and T. Rowe Price |
| Vice President, Growth & Income Fund | Group, Inc. |
| |
| Joseph A. Carrier, CPA (1960) | Vice President, T. Rowe Price, T. Rowe Price |
| Treasurer, Growth & Income Fund | Group, Inc., T. Rowe Price Investment Services, |
| | Inc., and T. Rowe Price Trust Company |
| |
| Anna M. Dopkin, CFA (1967) | Vice President, T. Rowe Price and T. Rowe Price |
| President, Growth & Income Fund | Group, Inc. |
| |
| Roger L. Fiery III, CPA (1959) | Vice President, T. Rowe Price, T. Rowe Price |
| Vice President, Growth & Income Fund | Group, Inc., T. Rowe Price International, Inc., |
| | and T. Rowe Price Trust Company |
| |
| John R. Gilner (1961) | Chief Compliance Officer and Vice President, |
| Chief Compliance Officer, Growth & Income Fund | T. Rowe Price; Vice President, T. Rowe Price Group, |
| | Inc., and T. Rowe Price Investment Services, Inc. |
| |
| David R. Giroux, CFA (1975) | Vice President, T. Rowe Price and T. Rowe Price |
| Vice President, Growth & Income Fund | Group, Inc. |
| |
| Gregory S. Golczewski (1966) | Vice President, T. Rowe Price and T. Rowe Price |
| Vice President, Growth & Income Fund | Trust Company |
| |
| Michael W. Holton (1968) | Vice President, T. Rowe Price and T. Rowe Price |
| Vice President, Growth & Income Fund | Group, Inc. |
| Henry H. Hopkins (1942) | Director and Vice President, T. Rowe Price |
| Vice President, Growth & Income Fund | Investment Services, Inc., T. Rowe Price |
| | Services, Inc., and T. Rowe Price Trust Company; |
| | Vice President, T. Rowe Price, T. Rowe Price |
| | Group, Inc., T. Rowe Price International, Inc., and |
| | T. Rowe Price Retirement Plan Services, Inc. |
| |
| David M. Lee, CFA (1962) | Vice President, T. Rowe Price and T. Rowe Price |
| Vice President, Growth & Income Fund | Group, Inc. |
| |
| Patricia B. Lippert (1953) | Vice President, T. Rowe Price and T. Rowe Price |
| Secretary, Growth & Income Fund | Investment Services, Inc. |
| |
| Sudhir Nanda, Ph.D., CFA (1959) | Vice President, T. Rowe Price and T. Rowe Price |
| Vice President, Growth & Income Fund | Group, Inc. |
| |
| Karen M. Regan (1967) | Vice President, T. Rowe Price |
| Vice President, Growth & Income Fund | |
| |
| Robert W. Sharps, CFA, CPA (1971) | Vice President, T. Rowe Price and T. Rowe Price |
| Vice President, Growth & Income Fund | Group, Inc. |
| |
| Joshua K. Spencer, CFA (1973) | Vice President, T. Rowe Price and T. Rowe Price |
| Vice President, Growth & Income Fund | Group, Inc.; formerly Research Analyst and |
| | Sector Fund Portfolio Manager, Fidelity |
| | Investments (to 2004) |
| |
| Julie L. Waples (1970) | Vice President, T. Rowe Price |
| Vice President, Growth & Income Fund | |
| Unless otherwise noted, officers have been employees of T. Rowe Price or T. Rowe Price International for at least |
| five years. |
The registrant has adopted a code of ethics, as defined in Item 2 of Form N-CSR, applicable to its principal executive officer, principal financial officer, principal accounting officer or controller, or persons performing similar functions. A copy of this code of ethics is filed as an exhibit to this Form N-CSR. No substantive amendments were approved or waivers were granted to this code of ethics during the period covered by this report.
The registrant’s Board of Directors/Trustees has determined that Mr. Donald W. Dick Jr. qualifies as an audit committee financial expert, as defined in Item 3 of Form N-CSR. Mr. Dick is considered independent for purposes of Item 3 of Form N-CSR.
(a) – (d) Aggregate fees billed to the registrant for the last two fiscal years for professional services rendered by the registrant’s principal accountant were as follows:
Audit fees include amounts related to the audit of the registrant’s annual financial statements and services normally provided by the accountant in connection with statutory and regulatory filings. Audit-related fees include amounts reasonably related to the performance of the audit of the registrant’s financial statements and specifically include the issuance of a report on internal controls. Tax fees include amounts related to services for tax compliance, tax planning, and tax advice. The nature of these services specifically includes the review of distribution calculations and the preparation of Federal, state, and excise tax returns. All other fees include the registrant’s pro-rata share of amounts for agreed-upon procedures in conjunction with service contract approvals by the registrant’s Board of Directors/Trustees.
(e)(1) The registrant’s audit committee has adopted a policy whereby audit and non-audit services performed by the registrant’s principal accountant for the registrant, its investment adviser, and any entity controlling, controlled by, or under common control with the investment adviser that provides ongoing services to the registrant require pre-approval in advance at regularly scheduled audit committee meetings. If such a service is required between regularly scheduled audit committee meetings, pre-approval may be authorized by one audit committee member with ratification at the next scheduled audit committee meeting. Waiver of pre-approval for audit or non-audit services requiring fees of a de minimis amount is not permitted.
(2) No services included in (b) – (d) above were approved pursuant to paragraph (c)(7)(i)(C) of Rule 2-01 of Regulation S-X.
(f) Less than 50 percent of the hours expended on the principal accountant’s engagement to audit the registrant’s financial statements for the most recent fiscal year were attributed to work performed by persons other than the principal accountant’s full-time, permanent employees.
(g) The aggregate fees billed for the most recent fiscal year and the preceding fiscal year by the registrant’s principal accountant for non-audit services rendered to the registrant, its investment adviser, and any entity controlling, controlled by, or under common control with the investment adviser that provides ongoing services to the registrant were $1,008,000 and $903,000, respectively, and were less than the aggregate fees billed for those same periods by the registrant’s principal accountant for audit services rendered to the T. Rowe Price Funds.
Not applicable.
Not applicable. The complete schedule of investments is included in Item 1 of this Form N-CSR.
Not applicable.
Not applicable.
Not applicable.
Not applicable.
(a) The registrant’s principal executive officer and principal financial officer have evaluated the registrant’s disclosure controls and procedures within 90 days of this filing and have concluded that the registrant’s disclosure controls and procedures were effective, as of that date, in ensuring that information required to be disclosed by the registrant in this Form N-CSR was recorded, processed, summarized, and reported timely.
(b) The registrant’s principal executive officer and principal financial officer are aware of no change in the registrant’s internal control over financial reporting that occurred during the registrant’s second fiscal quarter covered by this report that has materially affected, or is reasonably likely to materially affect, the registrant’s internal control over financial reporting.
(a)(1) The registrant’s code of ethics pursuant to Item 2 of Form N-CSR is attached.
(2) Separate certifications by the registrant's principal executive officer and principal financial officer, pursuant to Section 302 of the Sarbanes-Oxley Act of 2002 and required by Rule 30a-2(a) under the Investment Company Act of 1940, are attached.
(3) Written solicitation to repurchase securities issued by closed-end companies: not applicable.
(b) A certification by the registrant's principal executive officer and principal financial officer, pursuant to Section 906 of the Sarbanes-Oxley Act of 2002 and required by Rule 30a-2(b) under the Investment Company Act of 1940, is attached.