UNITED STATES
SECURITIES AND EXCHANGE COMMISSION
Washington, D.C. 20549
SCHEDULE 14A
Proxy Statement Pursuant to Section 14(a)
of the Securities Exchange Act of 1934
(Amendment No. )
Filed by the Registrant x
Filed by a Party other than the Registrant ¨
Check the appropriate box:
¨ | Preliminary Proxy Statement | ¨ | Confidential, for Use of the Commission Only (as permitted by Rule 14a-6(e)(2)) | |||
x | Definitive Proxy Statement | |||||
¨ | Definitive Additional Materials | |||||
¨ | Soliciting Material Pursuant to §240.14a-12 |
HENRY COUNTY BANCSHARES, INC.
(Name of Registrant as Specified In Its Charter)
(Name of Person(s) Filing Proxy Statement, if other than the Registrant)
Payment of Filing Fee (Check the appropriate box):
| x | No fee required. |
| ¨ | Fee computed on table below per Exchange Act Rules 14a-6(i)(1) and 0-11. |
| (1) | Title of each class of securities to which transaction applies: |
| (2) | Aggregate number of securities to which transaction applies: |
| (3) | Per unit price or other underlying value of transaction computed pursuant to Exchange Act Rule 0-11 (set forth the amount on which the filing fee is calculated and state how it was determined): |
| (4) | Proposed maximum aggregate value of transaction: |
| (5) | Total fee paid: |
| ¨ | Fee paid previously with preliminary materials. |
| ¨ | Check box if any part of the fee is offset as provided by Exchange Act Rule 0-11(a)(2) and identify the filing for which the offsetting fee was paid previously. Identify the previous filing by registration statement number, or the Form or Schedule and the date of its filing. |
| (1) | Amount Previously Paid: |
| (2) | Form, Schedule or Registration Statement No.: |
| (3) | Filing Party: |
| (4) | Date Filed: |
HENRY COUNTY BANCSHARES, INC.
4806 N. HENRY BOULEVARD
STOCKBRIDGE, GEORGIA 30281
NOTICE OF ANNUAL MEETING OF SHAREHOLDERS
Dear Fellow Shareholder:
We cordially invite you to attend the 2009 Annual Meeting of Shareholders of Henry County Bancshares, Inc., the holding company for The First State Bank. At the meeting, we will report on our performance in 2008 and answer your questions. We look forward to discussing both our accomplishments and our plans with you. We hope that you can attend the meeting and we look forward to seeing you there.
This letter serves as your official notice that we will hold the meeting on April 21, 2009 at 6:30 p.m. at our office at 4806 N. Henry Boulevard, Stockbridge, Georgia 30281 for the following purposes:
| 1. | To elect the 2009 Board of Directors; and |
| 2. | To transact any other business that may properly come before the meeting or any adjournment of the meeting. |
Shareholders owning our common stock at the close of business on March 12, 2009 are entitled to attend and vote at the meeting.
Please use this opportunity to take part in the affairs of your Company by voting on the business to come before this meeting. Even if you plan to attend the meeting, we encourage you to complete and return the enclosed proxy to Anita Jarvis at the above listed address, as promptly as possible, in the envelope provided.
| By Order of the Board of Directors, |
|
| David H. Gill |
| President and Chief Executive Officer |
March 24, 2009
Stockbridge, Georgia
HENRY COUNTY BANCSHARES, INC.
4806 N. HENRY BOULEVARD
STOCKBRIDGE, GEORGIA 30281
PROXY STATEMENT FOR ANNUAL MEETING OF
SHAREHOLDERS TO BE HELD ON APRIL 21, 2009
Our Board of Directors is soliciting proxies for the 2009 Annual Meeting of Shareholders. This proxy statement contains important information for you to consider when deciding how to vote on the matters brought before the meeting. We encourage you to read it carefully.
VOTING INFORMATION
The Board set March 12, 2009 as the record date for the meeting. Shareholders owning our common stock at the close of business on that date are entitled to attend and vote at the meeting, with each share entitled to one vote. There were 14,245,690 shares of common stock outstanding as of March 12, 2009. A majority of the outstanding shares of common stock represented at the meeting will constitute a quorum.
When you sign the proxy card, you appoint David H. Gill or William C. Strom, Jr. as your representative at the meeting. Mr. Gill and Mr. Strom, or either of them, will vote your proxy as you have instructed them on the proxy card. If you submit a proxy but do not specify how you would like it to be voted, Mr. Gill or Mr. Strom will vote your proxy FOR the election to the Board of Directors of all nominees listed below under “Election Of Directors.” We are not aware of any other matters to be considered at the meeting. However, if any other matters come before the meeting, Mr. Gill or Mr. Strom will vote your proxy on such matters in accordance with their judgment.
You may revoke your proxy and change your vote at any time before the polls close at the meeting. You may do this by signing and delivering another proxy with a later date or by voting in person at the meeting.
We are paying for the costs of preparing and mailing the proxy materials and of reimbursing brokers and others for their expenses of forwarding copies of the proxy materials to our shareholders. Our officers and employees may assist in soliciting proxies but will not receive additional compensation for doing so. The Annual Report of the Company accompanies this proxy statement. We are distributing this proxy statement and the Annual Report on or about March 24, 2009.
NOTICE REGARDING THE INTERNET AVAILABILITY OF PROXY MATERIALS
We have posted materials related to the 2009 annual meeting on the Internet. The following materials are available on the Internet at www.firststateonline.com/home/about:
| • | This proxy statement for the 2009 annual meeting. |
| • | The Company’s annual report on Form 10-K filed with the Securities and Exchange Commission. |
1
PROPOSAL NO. 1: ELECTION OF DIRECTORS
Each member of the Board of Directors is elected each year so that the terms of the Board members expire at each annual meeting. The terms of the current directors will expire at the 2009 Annual Shareholders Meeting. Our directors are:
Paul J. Cates, Jr. | David H. Gill | William C. Strom, Jr. | ||
Phillip H. Cook | Edwin C. Kelley, Jr. | Ronald M. Turpin | ||
H.K. Elliott, Jr. | Mary Lynn E. Lambert | James C. Waggoner | ||
G.R. Foster III | Robert O. Linch |
Shareholders will elect the nominees as directors at the meeting to serve a one-year term, expiring at the 2010 Annual Meeting of Shareholders. The directors will be elected by a plurality of the votes cast at the meeting. This means that the 11 nominees receiving the highest number of votes will be elected. Abstentions and broker non-votes will not be considered to be either affirmative or negative votes.
The Board of Directors recommends that you elect each of the 11 nominees as directors.
If you submit a proxy but do not specify how you would like it to be voted, Mr. Gill or Mr. Strom will vote your proxy to elect each of the nominees. If any of these nominees is unable or fails to accept nomination or election (which we do not anticipate), Mr. Gill or Mr. Strom will vote instead for a replacement to be recommended by the Board of Directors, unless you specifically instruct otherwise in the proxy.
Set forth below is certain information about the nominees, each of whom has been a director of the Company and is also a director of The First State Bank.
Paul J. Cates, Jr. - President, Planters Warehouse and Lumber.
H. K. Elliott, Jr. - Owner, Elliott Construction Company.
G. R. Foster, III - Dentist.
David H. Gill - Mr. Gill has served as President of the Bank and of the Company since 2000. Prior to that time he served as Executive Vice President of the Bank and Vice President of the Company.
Edwin C. Kelley, Jr. - Owner, Buddy Kelley Properties.
Mary Lynn E. Lambert - Co-owner of a sand and gravel business.
Robert O. Linch - Private Investor.
William C. Strom, Jr. - Mr. Strom has served as Executive Vice President and Chief Credit Officer of the Bank since 2000 and Secretary of the Company since 1997. Mr. Strom served as Vice President of the Bank from 1995 to 2000.
Ronald M. Turpin - Retired builder.
James C. Waggoner - Owner, Stockbridge Veterinary Hospital.
Phillip H. Cook - Certified Public Accountant, Retired Partner KPMG LLP.
2
DESCRIPTION OF BUSINESS
General
Henry County Bancshares, Inc. (the “Company”), headquartered in Stockbridge, Georgia, is a Georgia business corporation which operates as a bank holding company. The Company was incorporated on June 22, 1982 for the purpose of reorganizing The First State Bank (the “Bank”) to operate within a holding company structure. The Bank is a wholly owned subsidiary of the Company.
The Company’s principal activities consist of owning and supervising the Bank, which engages in a full service commercial and consumer banking business, as well as a variety of deposit services provided to its customers. The Bank also conducts mortgage lending operations through its wholly owned subsidiary, First Metro Mortgage Co., which provides the Company’s customers with a wide range of mortgage banking services and products.
The Company, through the Bank, derives substantially all of its income from the furnishing of banking and banking related services.
The Company directs the policies and coordinates the financial resources of the Bank. The Company provides and performs various technical and advisory services for its subsidiaries, coordinates their general policies and activities, and participates in their major decisions.
The First State Bank, Stockbridge, Georgia
The Bank was chartered by the Georgia Department of Banking and Finance in 1964. The Bank operates through its main office at 4806 North Henry Boulevard, Stockbridge, Georgia, as well as six (6) full service branches located at 1810 Hudson Bridge Road in Stockbridge, 295 Fairview Road in Ellenwood, 114 John Frank Ward Boulevard in McDonough, 4979 Bill Gardner Parkway in Locust Grove, 2316 Highway 155 in McDonough and 1908 Highway 81 East in McDonough. The Bank owns two lots for the construction of future branches, one at the intersection of Chambers Road and Jonesboro Road in Henry County, as well as one in Butts County located at 620 W. Third Street in Jackson. The Bank owns an additional parcel of real estate adjacent to its main office location in Stockbridge, Georgia, upon which is situated a small house leased to an unaffiliated insurance company.
The Bank engages in a full service commercial and consumer banking business in its primary market area of Henry County and surrounding counties, as well as a variety of deposit services provided to its customers. The Bank offers on-line banking services to its customers. Checking, savings, money market accounts and other time deposits are the primary sources of the Bank’s funds for loans and investments. The Bank offers a full complement of lending activities, including commercial, consumer installment, real estate, home equity and second mortgage loans, with particular emphasis on short and medium term obligations. Commercial lending activities are directed principally to businesses whose demands for funds fall within the Bank’s lending limits. Consumer lending is oriented primarily to the needs of the Bank’s customers. Real estate loans include short term acquisition and construction loans. The Bank focuses primarily on residential and commercial construction loans, commercial loans secured by machinery and equipment with a developed resale market, working capital loans on a secured short term basis to established businesses in the primary service area, home equity loans of up to 80% of the current market value of the underlying real estate, residential real estate loans of up to 90% of value with adjustable rates or balloon payments due within five (5) years, and loans secured by savings accounts, other time accounts, cash value of life insurance, readily marketable stocks and bonds, or general use machinery and equipment for which a resale market has developed. The Bank makes both secured and unsecured loans to persons and
3
entities which meet criteria established by the Bank and the executive committee. Approximately 95% of the Bank’s loan portfolio is concentrated in loans secured by real estate, most of which is located in the Bank’s primary market area. The Bank, as a matter of state law and bank policy, does not extend credit to any single borrower or group of related borrowers in excess of 25% of statutory capital, or approximately $12,000,000. The lending policies and procedures of the Bank are periodically reviewed and modified by the Board of Directors of the Bank in order to ensure risks are acceptable and to protect the Bank’s financial position in the market. Among other services offered are drive-up windows, night deposits, safe deposits, traveler’s checks, credit cards, cashier’s checks, notary public and other customary bank services. The Bank does not offer trust services.
The Bank maintains correspondent relationships with Silverton Bank, SunTrust Bank, Federal Home Loan Bank, Compass Bank, and the Federal Reserve Bank of Atlanta. These banks provide certain services to the Bank such as investing excess funds, wire transfer of funds, safekeeping of investment securities, loan participation and investment advice.
The banking business in and around Henry County, Georgia is highly competitive which includes certain major banks which have acquired formerly locally owned institutions. These banks have considerably greater resources and lending limits than the Bank. In addition to commercial banks and savings banks, the Bank competes with other financial institutions, such as credit unions, agricultural credit associations, and investment firms which provide services similar to checking accounts and commercial lending. The Bank competes with numerous institutions within the primary service areas, including local branches of Bank of America, SunTrust Bank, Wachovia and BB&T. As of December 31, 2008 the Bank held approximately 26% of the deposit accounts in the Henry County area. Neither the Company nor the Bank generates a material amount of revenue from foreign countries, nor does either have material long-lived assets, customer relationships, mortgages or servicing rights, deferred policy acquisition costs, or deferred tax assets in foreign countries. Thus, the Company has no significant risks attributable to foreign operations.
The Bank relies substantially on personal conduct of its officers, directors and shareholders, as well as a broad product line, competitive services, and an aggressive local advertising campaign and promotional activities to attract business and to acquaint potential customers with the Bank’s personal services. The Bank’s marketing approach emphasizes the advantages of dealing with an independent, locally owned and headquartered commercial bank attuned to the particular needs of small to medium size businesses, professionals and individuals in the community.
A history of the Bank’s financial position for the fiscal years ended December 31, 2006, 2007 and 2008, is as follows:
| Years Ended | ||||||||||
| 2008 | 2007 | 2006 | ||||||||
Total Assets | $ | 656,245,974 | $ | 719,528,021 | $ | 695,051,272 | ||||
Total Deposits | $ | 591,106,388 | $ | 626,781,211 | $ | 596,673,741 | ||||
Net Income | $ | (14,165,268 | ) | $ | 8,858,040 | $ | 12,556,572 | |||
First Metro Mortgage Co.
First Metro Mortgage Co. was formed in 1985 to provide mortgage loan origination services in the same primary market area as the Bank. Its offices are located at the Bank’s branch facility on Hudson Bridge Road in Stockbridge, Georgia. First Metro Mortgage Co. initiates long term mortgage loans but immediately sells those loans in the secondary market to investors pursuant to agreements between the investors and the company prior to funding. All loans are sold without recourse, and the Bank does not retain servicing rights or obligations with respect to those loans. First Metro Mortgage Co. realized
4
net loss of $149,874 for 2008, compared to a net loss of $121,124 for 2007, and a net loss of $110,029 in 2006. First Metro Mortgage Co. was merged into and became a subsidiary of The First State Bank, effective July 1, 2003.
Employees
As of December 31, 2008, the Bank had 134 full-time employees and 20 part-time employees. None of the Bank’s employees are represented by a collective bargaining group. The Bank considers its relationships with its employees to be good.
MARKET FOR COMMON EQUITY AND RELATED STOCKHOLDER MATTERS
General
There is no established public trading market for the Company’s common stock. It is not traded on an exchange or in the over-the-counter market. There is no assurance that an active market will develop for the Company’s common stock in the future. Therefore, management of the Company is furnished with only limited information concerning trades of the Company’s common stock. The following table sets forth for each quarter during the most two recent fiscal years the number of shares traded and the high and low per share sales price to the extent known to management.
YEAR 2008 | NUMBER OF SHARES TRADED | HIGH SALES PRICE (Per Share) | LOW SALES PRICE (Per Share) | ||||||||
First Quarter | 102,091 | $ | 13.50 | $ | 11.00 | ||||||
Second Quarter | 52,570 | $ | 13.50 | $ | 11.00 | ||||||
Third Quarter | 13,121 | $ | 13.50 | $ | 12.00 | ||||||
Fourth Quarter | 6,330 | $ | 13.50 | $ | 10.50 | ||||||
YEAR 2007 | NUMBER OF SHARES TRADED | HIGH SALES PRICE (Per Share) | LOW SALES PRICE (Per Share) | ||||||||
First Quarter | 14,984 | $ | 13.50 | $ | 13.00 | ||||||
Second Quarter | 29,724 | $ | 14.00 | $ | 13.50 | ||||||
Third Quarter | 20,350 | $ | 14.50 | $ | 13.50 | ||||||
Fourth Quarter | 170,683 | $ | 13.50 | $ | 13.50 | ||||||
5
The Company has historically paid dividends on an annual basis. Any declaration and payment of dividends will be based on the Company’s earnings, economic conditions, and the evaluation by the Board of Directors of other relevant factors. The Company’s ability to pay dividends is dependent on cash dividends paid to it by the Bank. The ability of the Bank to pay dividends to the Company is restricted by applicable regulatory requirements. Currently, the Bank is prohibited from paying dividends to the Company without prior regulatory approval. The following table sets forth cash dividends which have been declared and paid by the Company since January 1, 2006.
| Cash Dividends Declared Per Share ($) | |||
Fiscal 2008 | |||
First Quarter | $ | .06 per share | |
Second Quarter | $ | .06 per share | |
Third Quarter | $ | .03 per share | |
Fourth Quarter | $ | .00 per share | |
Fiscal 2007 | |||
First Quarter | $ | .06 per share | |
Second Quarter | $ | .06 per share | |
Third Quarter | $ | .06 per share | |
Fourth Quarter | $ | .10 per share | |
Fiscal 2006 | |||
First Quarter | $ | .05 per share | |
Second Quarter | $ | .05 per share | |
Third Quarter | $ | .05 per share | |
Fourth Quarter | $ | .16 per share | |
| (1) | All dividends per share have been adjusted to reflect a two for one stock-split effective December 14, 2006. |
As of March 1, 2009, 14,245,690 shares of common stock were outstanding and held of record by approximately 604 persons (not including the number of persons or entities holding stock in nominee or street name through various brokerage houses).
The holders of the Company’s common stock are entitled to receive dividends when and if declared by the Board of Directors out of funds legally available. Funds for the payment of dividends of the Company are primarily obtained from dividends paid by the Bank.
There are no shares of the Company’s common stock that are subject to outstanding options or warrants to purchase, or that are convertible into, common equity of the Company.
EXECUTIVE COMPENSATION
Compensation Discussion and Analysis
The Company recognizes that an important reason for its success is its ability to attract and retain executive and senior management that can lead the daily operations of the Company in accordance with the policy guidelines of the Board. The management team of the Company must effectively carry out those programs that are required for the Company to meet its short term objectives, as well as reach its long term strategic goals. An effective and comprehensive compensation program is an important component of the overall strategy for management recruitment and retention. The compensation program should be fair, reasonable and competitive in the Company’s market environment.
6
The Company has established a Senior Management Compensation Committee (the “Committee”) which is charged with developing compensation strategies and making compensation policies for executive officers. The Committee makes compensation recommendations to the Board of Directors (the “Board”), which has adopted those recommendations without alteration. The Committee directs the executive compensation policy for the Company and its wholly owned subsidiary, The First State Bank. The Committee is composed solely of independent directors and has available to it such resources as it feels are necessary to ensure that the compensation levels are competitive in the market. The Committee may interview senior and executive management to determine those compensation issues that are most effective in meeting the Company’s objectives. The Committee consults with legal counsel as necessary and other such outside advisors as it deems proper to ensure availability of the appropriate information to assist in its deliberations. The Committee takes into consideration the experience level of the executives and their overall importance to the strategic initiatives the Company may undertake. The Committee typically makes two separate recommendations to the Board for executive compensation adjustments. The first recommendation, in the early part of the year, is to grant any adjustment in the base salary of the senior executives. The second major recommendation to the Board is a recommendation for annual bonus compensation based on performance for the year.
The elements of the compensation program are designed to attract and retain management best suited to the Company. The program is also crafted to provide a mechanism to align the interests of the management with those of the Company. A third goal of the compensation program is to reward executives for reaching or exceeding stated goals.
The Company includes a number of components in its compensation program. These components include cash, non-cash benefits, retirement programs, insurance protection and perquisites. Cash is used for base salary and for regular annual bonus purposes. Cash bonuses are typically paid based on the performance of the Company as a whole and the evaluated performance of each individual manager. Non-cash benefits include vacation, sick and personal day allowances. Retirement programs include profit sharing contributions, matching contributions to a 401(k) program and deferred compensation arrangements. Insurance protection includes health insurance for the executives (with the availability of dependent coverage at the executive’s expense), life insurance, both short and long term disability insurance and other health related group insurance coverage available at the executive’s expense. Perquisites include the use of a company vehicle for business and personal travel, routine expense reimbursements for business related activities, educational opportunities and social memberships.
The Committee meets as needed to review the Company’s objectives for the year and the performance of executive and senior management in meeting those objectives. The Committee also reviews industry comparisons of compensation. In 2008, the Committee used the resources of the Georgia Banker’s Association Annual Salary Survey, a compilation of responding Georgia financial institutions stratified by size and geographical location. The Committee also consulted the Mauldin & Jenkins Bank Executive Compensation Survey, a regional survey of southeastern banks also stratified by size and geographical location. These outside sources provide the Committee with a framework to evaluate the trend in bank executive compensation as well as to provide the Committee with defined local standards to determine competitive compensation components. The Committee did not use these surveys as a template for compensation decisions for salary ranges or to establish salaries, but rather as a resource to validate or redefine the assumptions of the Committee. From these resources the Committee determined the Company’s executive compensation to be consistent with comparable financial institutions located in its geographical location.
The Committee has wide discretion in its evaluation of executive management’s performance and the most effective manner in which to reward performance. There were no specific targets provided to management with defined benefits upon meeting those targets. However, the Company did adopt overall goals and targets independent from the Committee. The Committee did establish general
7
criteria upon which to evaluate and reward performance. The Committee evaluates performance of the Company for the year relative to peer groupings, such as may be available from the FDIC in the form of call reports or Uniform Bank Performance Reports, with special emphasis on core deposit growth, loan growth, expense controls, audit controls, earnings and stock pricing, all of which are metrics which characteristically can enhance shareholder value. Deposit growth, earnings and stock value in a difficult market for peer group financial stocks were the greatest contributing components in determining year end bonus awards. The Committee reviewed the Company performance in each of the areas as outlined above. The Committee weighted the performance of the Company in each area defined as a Committee goal to arrive at a pool of bonus funds to be distributed to senior and executive managers, adjusting the pool for performance above or below the Committee’s desired performance level. Based on an evaluation of the contribution of each of the executives in meeting predetermined Committee goals and their individual contributions in attaining those goals, the Committee recommended to the Board specific individual bonus payments and which were adopted by the Board as disclosed in the Summary Compensation Table below.
In 2007 the Committee recognized that the availability of stock ownership in the Company was an important component of aligning the financial interests of the executives with those of the shareholders. Additionally, the Committee evaluated the competitive market and found that a significant percentage of financial institutions have included stock ownership as an integral part of compensation programs. Because of the desire to align the financial interests of the executives with those of the shareholders as well as to maintain a compensation strategy that would both reward the executives for performance and be calculated to provide an incentive for retention, the Committee recommended that a limited amount of the Company’s treasury stock be made available for purchase by the executives. The stock purchases were offered to the executives at the prevailing fair market price. No such purchases were offered in 2008.
In 2008, the Committee determined that the financial performance of the Company was such that the cessation of certain long-standing compensation practices was warranted. To that end, the Company did not make any discretionary profit sharing contributions to the account of any employee. Year end bonuses, which had traditionally been between 7.00% and 8.00% of salaries, were reduced by at least 50%. No additional bonuses were paid to senior executives as had been prior years practice.
The Summary Compensation Table below identifies the compensation levels of certain executive officers of the Company.
Compensation Committee Report
The Compensation Committee of the Company has reviewed and discussed the Compensation Discussion and Analysis required by Item 402(b) of Regulation S-K with management and, based on such review and discussions, the Compensation Committee recommended to the Board that the Compensation Discussion and Analysis be included in this Proxy Statement.
The Compensation Committee
Mary Lynn E. Lambert, Chairperson
G.R. Foster, III
H. K. Elliott, Jr.
Edwin C. Kelley, Jr.
Robert O. Linch
Phillip H. Cook
Compensation Committee Interlocks and Insider Participation
No interlocks or insider participation exists within the Compensation Committee. The Compensation Committee is comprised solely of independent directors.
8
2008 SUMMARY COMPENSATION TABLE
Name and Principal | Year | Salary ($) | Bonus ($) | Stock Awards ($) | Option Awards ($) | Non-Equity Incentive Plan Compensation ($) | Change in Pension Value and Nonqualified Deferred Compensation Earnings ($) | All Other Compensation ($) | Total ($) | |||||||||||
David H. Gill CEO | 2008 | 285,050 | 11,402 | 65,714 | $ | 362,166 | ||||||||||||||
| 2007 | 274,050 | 141,924 | 0 | 0 | 0 | 0 | 85,580 | (1) | $ | 501,554 | ||||||||||
| 2006 | 252,200 | 150,176 | 0 | 0 | 0 | 0 | 77,677 | (1) | $ | 480,053 | ||||||||||
William C. Strom, Jr. | 2008 | 208,124 | 8,325 | 37,866 | $ | 254,315 | ||||||||||||||
Executive Vice President | 2007 | 200,124 | 88,010 | 0 | 0 | 0 | 0 | 51,127 | (2) | $ | 339,261 | |||||||||
| 2006 | 185,300 | 92,824 | 0 | 0 | 0 | 0 | 48,553 | (2) | $ | 326,677 | ||||||||||
Thomas L. Redding | 2008 | 126,500 | 4,744 | 2,600 | $ | 133,844 | ||||||||||||||
Sr. Vice President & CFO | 2007 | 121,500 | 36,133 | 0 | 0 | 0 | 0 | 12,203 | (3) | $ | 169,836 | |||||||||
| 2006 | 112,500 | 38,437 | 0 | 0 | 0 | 0 | 13,345 | (3) | $ | 164,282 | ||||||||||
M. Debra Walker | 2008 | 113,580 | 4,401 | 1,610 | $ | 119,591 | ||||||||||||||
Sr. Vice President & COO | 2007 | 109,080 | 44,454 | 0 | 0 | 0 | 0 | 11,247 | (4) | $ | 164,781 | |||||||||
| 2006 | 101,000 | 45,327 | 0 | 0 | 0 | 0 | 13,083 | (4) | $ | 159,410 | ||||||||||
| (1) | Includes director’s fees of $33,000 in 2008, $33,000 in 2007 and $32,250 in 2006. Also includes liability incurred by the Company for the Employee’s Salary Continuation Plan in the amount of $28,411 in 2008, $26,455 in 2007 and $24,925 in 2006. 401(k) match for 2008 was $4,600, for 2007 was $5,571 and for 2006 was $5,146. Profit Sharing Contribution for 2008 was $0.00, for 2007 was $20,554 and for 2006 was $15,356. |
| (2) | Includes director’s fees of $15,000 in 2008, $15,000 in 2007 and $14,250 in 2006. Also includes liability incurred by the Company for the Employee’s Salary Continuation Plan in the amount of $18,742 in 2008, $17,636 in 2007 and $16,617 in 2006. 401(k) match for 2008 was $4,124, for 2007 was $4,082 and for 2006 was $3,789. Profit Sharing Contribution for 2008 was $0.00, for 2007 was $15,009 and in 2006 was $15,356. |
| (3) | Includes 401(k) match of $2,600 for 2008, $3,110 for 2007 and $2,972 for 2006 and Profit Sharing Contribution of $0.00 for 2008, $9,113 and $10,373 in 2007 and 2006, respectively. |
| (4) | Includes 401(k) match of $1,610 for 2008, $3,066 for 2007 and $2,914 for 2006 and Profit Sharing Contribution of $0.00 for 2008, $8,181 and $10,169 in 2007 and 2006, respectively. |
Not included in Other Compensation:
| Year | Medical | Dental | Life Ins. Prem. | |||||||||
David Gill | 2008 | $ | 5,047.92 | $ | 317.40 | $ | 1,145.00 | |||||
| 2007 | $ | 4,762.00 | $ | 302.28 | $ | 1,347.00 | ||||||
| 2006 | $ | 3,807.36 | $ | 302.28 | $ | 3,007.00 | ||||||
William Strom | 2008 | $ | 6,035.28 | $ | 317.40 | $ | 1,145.00 | |||||
| 2007 | $ | 4,762.00 | $ | 302.28 | $ | 1,347.00 | ||||||
| 2006 | $ | 3,807.36 | $ | 302.28 | $ | 3,274.00 | ||||||
Tom Redding | 2008 | $ | 6,667.00 | $ | 317.40 | $ | 1,043.00 | |||||
| 2007 | $ | 5,585.00 | $ | 302.28 | $ | 1,181.00 | ||||||
| 2006 | $ | 5,074.00 | $ | 302.28 | $ | 1,728.60 | ||||||
M. Debra Walker | 2008 | $ | 1,680.00 | (annuity) | n/a | $ | 946.80 | |||||
| 2007 | $ | 1,680.00 | (annuity) | n/a | $ | 1,068.80 | ||||||
| 2006 | $ | 1,680.00 | (annuity) | n/a | $ | 1,836.12 | ||||||
9
2008 NONQUALIFIED DEFERRED COMPENSATION TABLE
Name | Executive Contributions in Last Fiscal Year ($) | Registrant Contributions in Last Fiscal Year ($) | Aggregate Earnings in Last Fiscal Year ($) | Aggregate Withdrawals / Distributions ($) | Aggregate Balance at Last Fiscal Year-End ($) | ||||||||
David H. Gill | $ | 15,000.00 | 0 | $ | 13,113.52 | 0 | $ | 231,893.46 | |||||
William C. Strom, Jr. | $ | 10,000.00 | 0 | $ | 8,742.38 | 0 | $ | 154,596.04 | |||||
2008 DIRECTOR COMPENSATION TABLE
Name | Fees Earned or Paid in Cash ($) | Stock Awards ($) | Option Awards ($) | Non-Equity Incentive Plan Compensation ($) | Change in Pension Value and Nonqualified Deferred Compensation Earnings ($) | All Other Compensation ($) | Total ($) | |||||||||
Robert O. Linch | $ | 36,375 | 0 | 0 | 0 | 0 | 0 | $ | 36,375 | |||||||
H. K. Elliott, Jr. | $ | 33,000 | 0 | 0 | 0 | 0 | 0 | $ | 33,000 | |||||||
Edwin C. Kelley, Jr. | $ | 34,250 | 0 | 0 | 0 | 0 | 0 | $ | 34,250 | |||||||
James C. Waggoner | $ | 16,000 | 0 | 0 | 0 | 0 | 0 | $ | 16,000 | |||||||
G. R. Foster, III | $ | 38,875 | 0 | 0 | 0 | 0 | 0 | $ | 38,875 | |||||||
Ronald M. Turpin | $ | 35,000 | 0 | 0 | 0 | 0 | 0 | $ | 35,000 | |||||||
Mary Lynn Lambert | $ | 17,800 | 0 | 0 | 0 | 0 | 0 | $ | 17,800 | |||||||
Paul J. Cates | $ | 17,250 | 0 | 0 | 0 | 0 | 0 | $ | 17,250 | |||||||
Phillip H. Cook | $ | 16,000 | 0 | 0 | 0 | 0 | 0 | $ | 16,000 | |||||||
MANAGEMENT’S DISCUSSION AND ANALYSIS OF FINANCIAL
CONDITION AND RESULTS OF OPERATION
Please See Appendix A.
HENRY COUNTY BANCSHARES, INC. AND SUBSIDIARIES
SELECTED FINANCIAL DATA, CONSOLIDATED FINANCIAL
STATEMENTS AND SUPPLEMENTAL DATA
Please see Appendix B.
10
Directors and Executive Officers
The Board of Directors of the Company is currently composed of the following eleven persons, each of whom serves for a term of one (1) year. Executive officers are elected annually by the Board of Directors and serve at the Board’s discretion.
The following table sets forth information with respect to the current directors, nominees and executive officers of the Company:
| NAME | AGE | POSITION | YEAR FIRST ELECTED OR APPOINTED (1) | |||
Paul J. Cates, Jr. | 67 | Director | 2002 | |||
H. K. Elliott, Jr. | 67 | Director | 1977 | |||
G. R. Foster, III | 62 | Director, Chairman of the Board | 1999 | |||
David H. Gill | 54 | President, Director | 1997 | |||
Edwin C. Kelley, Jr. | 58 | Director | 1994 | |||
Mary Lynn E. Lambert | 51 | Director | 2001 | |||
Robert O. Linch | 79 | Director | 1975 | |||
William C. Strom, Jr. | 59 | Director, Executive Vice President of the Bank and Secretary of the Company | 2005 | |||
Ronald M. Turpin | 65 | Director | 1999 | |||
James C. Waggoner | 64 | Director | 1994 | |||
Thomas L. Redding | 50 | Chief Financial Officer | — | |||
Phillip H. Cook | 54 | Director | 2007 | |||
| (1) | Refers to the year the individual first became a director of the Bank or Company. All directors of the Bank in June 1982 became directors of the Company when it was incorporated in June 1982. |
11
SECURITY OWNERSHIP OF CERTAIN BENEFICIAL
OWNERS AND MANAGEMENT
General
The following table sets forth, as of December 31, 2008, persons or groups who are known by the Company to own more than five percent (5%) of the Company’s common stock and, as of December 31, 2008, common stock ownership by directors and executive officers of the Company. Other than as noted below, management knows of no other person or group that owns more than five percent (5%) of the outstanding shares of common stock of the Company.
NAME AND ADDRESS OF BENEFICIAL OWNER | AMOUNT AND NATURE OF BENEFICIAL OWNERSHIP(1) | PERCENT OF SHARES OF COMMON STOCK OUTSTANDING | ||
Paul J. Cates, Jr. 863 McGarity Road McDonough, GA 30252 | 74,089 Shares | (2) | ||
H. K. Elliott, Jr. 2865 Camp Branch Road Buford, Georgia 30519 | 207,293 Shares | 1.46% | ||
G. R. Foster, III 950 Turner Church Road McDonough, GA 30252 | 26,750 Shares | (2) | ||
David H. Gill 109 Magnolia Place Stockbridge, GA 30281 | 135,502 Shares | (2) | ||
Edwin C. Kelley, Jr. 1540 Dogwood Drive Greensboro, GA 30642 | 78,920 Shares | (2) | ||
Mary Lynn E. Lambert 1409 Highway 42 S McDonough, GA 30252 | 112,382 Shares | (2) | ||
Robert O. Linch 230 Darwish Drive McDonough, GA 30252 | 900,224 Shares | 6.31% | ||
William C. Strom, Jr. 156 Cotton Creek Drive McDonough, GA 30252 | 26,916 Shares | (2) | ||
Ronald M. Turpin 812 Elliott Road McDonough, GA 30252 | 65,864 Shares | (2) | ||
James C. Waggoner 268 Butlers Bridge Road McDonough, GA 30252 | 57,020 Shares | (2) | ||
Thomas L. Redding 303 Landing Point Stockbridge, GA 30281 | 6,500 Shares | (2) | ||
Phillip H. Cook 5000 Lakeridge Close McDonough, GA 30253 | 10,209 Shares | (2) | ||
| All directors, nominees and officers as a group (12 persons) | 1,701,669 Shares | 11.94% |
12
| (1) | Includes shares of common stock held directly as well as by spouses or minor children, in trust and other indirect ownership, over which shares the individuals effectively exercise sole voting and investment power. |
| (2) | Less than 1% of the common stock outstanding. |
CORPORATE GOVERNANCE
Meetings and Committees of the Board of Directors
During the year ended December 31, 2008, the Board of Directors of the Company held eight meetings and the Board of Directors of The First State Bank held twelve meetings. All of the directors of the Company and The First State Bank attended at least 75% of the aggregate of such board meetings and the meetings of each committee on which they served. All of the Directors, with the exceptions of David H. Gill and William C. Strom, Jr., are independent pursuant to the NASDAQ Stock Market (“NASDAQ”) rules and listing standards regarding director independence.
Audit Committee
Henry County Bancshares, Inc. has an Audit Committee of the Board of Directors (the “Audit Committee”), which is comprised of five independent members, as independence for audit committee members is defined by the rules of NASDAQ. The Audit Committee recommends to the Board of Directors the independent accountants to be selected as the Company’s auditors and reviews the audit plan, financial statements and audit results.
The names of each member of Henry County Bancshares, Inc.’s Audit Committee are: Directors Cates, Cook, Turpin, Lambert, and Waggoner. Mr. Cook serves as Chairman of the Audit Committee. The Board of Directors has adopted a written charter for the Audit Committee, a copy of which was provided as Appendix C to last year’s proxy statement. The charter was not amended in 2008. The Company does have an Audit Committee financial expert serving on its Audit Committee. Mr. Phillip H. Cook, a certified public accountant and retired partner with the accounting firm KPMG LLP, has been determined by the Board to meet the criteria for a financial expert as provided in the SEC’s regulations pursuant to Section 407 of the Sarbanes-Oxley Act of 2002. Mr. Cook is independent as defined by the rules of NASDAQ.
The Audit Committee met four times in 2008. The Audit Committee has the responsibility of reviewing the Company’s financial statements, evaluating internal accounting controls, reviewing reports of regulatory authorities, and determining that all audits and examinations required by law are performed. The committee recommends to the Board the appointment of the independent auditors for the next fiscal year, reviews and approves the auditor’s audit plans, and reviews with the independent auditors the results of the audit and management’s responses. The Audit Committee is responsible for overseeing the entire audit function and appraising the effectiveness of internal and external audit efforts. The Audit Committee reports its findings to the Board of Directors.
Audit Committee Report
During the fiscal year 2008, Henry County Bancshares, Inc. retained its principal auditor, Mauldin & Jenkins, LLC, to provide audit and non-audit services. The Audit Committee has considered whether provisions of non-audit services by its principal auditor is compatible with maintaining auditor independence.
13
The Audit Committee has reviewed and discussed the audited financial statements as of and for the year ended December 31, 2008 with management. The Audit Committee has discussed with the independent auditors the matters required to be discussed by Statement on Auditing Standards (“SAS”) No. 61 (Codifications of Statements on Auditing Standards, AU ‘ 380),Communications with Audit Committees, as amended and adopted by the Public Company Accounting Oversight Board in Rule 3200T. The Audit Committee has received the written disclosures and the letter from the independent accountants required by Independence Standards Board Standard No. 1 (Independence Discussions with Audit Committees), as adopted by the Public Company Accounting Oversight Board in Rule 3600T, and has discussed with the independent accountants their independence. The Audit Committee has concluded that the independent auditors are independent from the Company and its management. Based on the review and discussions referred to above, the Audit Committee recommended to the Board of Directors that the audited financial statements referred to above be included in Henry County Bancshares, Inc.’s Annual Report on Form 10-K for the year 2008 for filing with the Securities and Exchange Commission.
Submitted by the members of the Audit Committee: | Paul J. Cates, Jr. | |
Phillip H. Cook | ||
Ronald M. Turpin | ||
Mary Lynn E. Lambert | ||
James C. Waggoner |
Nominating Committee
Each year, the Chairman of the Board of Directors appoints a Nominating Committee to serve a one-year term. In 2008, the Nominating Committee was composed solely of independent Directors pursuant to NASDAQ rules. The members of the Nominating Committee are: Directors Elliott, Turpin, Foster, Kelley and Linch. Director candidates are nominated by the Nominating Committee. The Committee does not currently have a formal written policy or process for identifying and evaluating director nominees. However, all director candidates must satisfy the requirements set forth by the Georgia Department of Banking and Finance and meet the following minimum criteria for a position on the Company’s Board of Directors: independence; highest personal and professional ethics and integrity; willing to devote sufficient time to fulfilling duties as a director; and impact on the diversity of the Board’s overall composition in terms of age, skills, experience in business, government and education. The Committee’s policy for consideration of a nominee recommended by shareholders is as follows: Shareholders who would like for an individual to be considered by the Nominating Committee should submit the proposed name to the committee for its consideration no later than October 1 of the calendar year preceding the next shareholder’s meeting. In order for the committee to consider the prospective nominee, a biographical summary and qualifications and such other information as must be disclosed to meet SEC reporting requirements must be provided. The Nominating Committee would then evaluate the proposed nominee using the criteria outlined above and would consider such a person in comparison to all other candidates. The Nominating Committee is not obligated to nominate any such individual for election. This information may be sent to The First State Bank, P. O. Box 928, 4806 N. Henry Boulevard, Stockbridge, Georgia. The nomination should be sent to the attention of the Chairman of the Board. No such shareholder nominations have been received by the Company for this Annual Meeting.
The Nominating Committee has a written charter, a copy of which was provided as Appendix D in last year’s proxy statement. The charter is not available on the Company’s website. The charter was not amended in 2008.
14
Compensation Committee
Executive compensation is recommended to the full board by the Company’s Senior Management Compensation Committee (the “Compensation Committee”), which in 2008 consisted of Mary Lynn E. Lambert, Chairperson, G. R. Foster, III, H. K. Elliott, Jr., Edwin C. Kelley, Jr., Phillip H. Cook and Robert O. Linch. The Compensation Committee met several times in 2008. The Committee is compromised solely of non-employee Directors, all of whom the Board has determined are independent pursuant to NASDAQ rules.
The general philosophy of the Compensation Committee is to provide executive compensation designed to enhance shareholder value, including annual compensation, consisting of salary and bonus awards, and long-term compensation, consisting of stock options and other equity based compensation. To this end, the Compensation Committee designs compensation plans and incentives to link the financial interests of the Company’s executive officers to the interest of its shareholders, to encourage support of the Company’s long-term goals, to align the executive compensation to the Company’s performance, to attract and retain talented leadership and to encourage significant ownership of the Company’s common stock by executive officers.
The Compensation Committee meets in the fall of each fiscal year to establish performance goals for the Company, including profit growth, loan and deposit growth, and loan-to-deposit ratio growth. The performance of the Bank as measured by those goals in the ensuing year is a factor given considerable weight by the Compensation Committee in recommending compensation of executive officers for the following fiscal year, including salary and bonuses.
No executive officers nor consultants played any role in determining or recommending the amount or form of executive or director compensation.
CERTAIN RELATIONSHIPS AND RELATED TRANSACTIONS
Interests of Management and Others in Certain Transactions
The Bank has followed a policy of granting various types of loans to executive officers and directors and to entities with which they are affiliated. The loans have been made in the ordinary course of business and on substantially the same terms, including interest rates and collateral, as those prevailing at the time for comparable transactions with the Bank’s other customers, and do not involve more than the normal risk of collectibility, or present other unfavorable features. As of December 31, 2008 directors and executive officers of the Company and entities with which they are affiliated were indebted to the Bank in the aggregate amount of $125,396. Also, Director Edwin C. Kelley, Jr. acted as the Company’s real estate broker in a transaction that took place in August of 2007. The Company’s wholly owned subsidiary, The First State Bank purchased two lots in Jackson, Georgia for future branch expansion. The total dollar amount of the transaction was $465,000. Mr. Kelley was paid a commission by the seller in the amount of $8,500. Otherwise, neither the Company nor the Bank has during the last two (2) years entered into, nor is there proposed, any transaction in which any director, executive officer, director nominee, or principal shareholder, or any member of their immediate family, had a direct or indirect material interest.
15
Legal Proceedings
During the previous five years, no director or executive officer was the subject of a legal proceeding (as defined below) that is material to an evaluation of the ability or integrity of any director or executive officer. A “legal proceeding” includes: (a) any bankruptcy petition filed by or against any business of which such person was a general partner or executive prior to that time; (b) any conviction in a criminal proceeding or subject to a pending criminal proceeding (excluding traffic violations and other minor offenses); (c) any order, judgment, or decree of any court of competent jurisdiction, or any Federal or State authority permanently or temporarily enjoining, barring, suspending or otherwise limiting his involvement in any type of commodities business, securities or banking activities; and (d) any finding by a court of competent jurisdiction (in a civil action), the Securities and Exchange Commission or the Commodity Futures Trading Commission of a violation of a federal or state securities or commodities law (such finding having not been reversed, suspended or vacated).
Compliance with Section 16(a) of the Securities Exchange Act of 1934
Based solely upon a review of Forms 3, 4 and 5, and amendments thereto or written representations of certain reporting persons furnished to the Company under Rule 16a-3(d) during 2008, no person who, at any time during 2008, was a director, officer or beneficial owner of more than 10% of any class of equity securities of the Company failed to file on a timely basis any reports required by Section 16(a) during the 2008 fiscal year or previously.
Independent Public Accountant
The Company has selected the firm of Mauldin & Jenkins, LLC to serve as the independent auditors to the Company for the year ending December 31, 2008. The Company does not expect a representative from this firm to attend the annual meeting.
During fiscal years 2007 and 2008, the Company retained its principal auditor, Mauldin & Jenkins, LLC, to provide services in the following categories and amounts:
| 2007 | 2008 | |||||
Audit Fees (1) | $ | 153,000 | $ | 160,860 | ||
Audit Related Fees (2) | 13,500 | 18,054 | ||||
Tax Fees (3) | 8,782 | 12,400 | ||||
All Other Fees | - | - | ||||
Total | $ | 175,282 | $ | 191,314 | ||
| (1) | Audit fees consist of fees for the audit of the Company’s financial statements and review of financial statements included in the Company’s quarterly report. |
| (2) | Audit related fees consist of fees for the audit of the Company’s employee benefit plan. |
| (3) | Tax fees consist of fees for the preparation of federal and state income tax returns. |
All non-audit services are pre-approved by the Audit Committee. None of the tax or expenses paid in connection with the principal accountant’s engagement for audited financial statements were attributable to work performed by persons other than the principal accountant’s employees.
Changes in and Disagreement with Accountants on Accounting and Financial Disclosure
The Company’s principal accountant has not changed during the Company’s two (2) most recent fiscal years or any subsequent interim period. There has been no Form 8-K filed within 24 months prior
16
to the date of the most recent financial statements reporting a change of accounting or reporting disagreements on any matter of accounting principle, practice, financial statement disclosure or auditing scope or procedure.
Shareholder Communications to the Board of Directors
Our Board of Directors has a long standing policy of providing a process for shareholders to send communications directly to the Board of Directors. Shareholders are informed if they want to send a communication to the Board or a particular director, they may either send it to David Gill’s attention or to the attention of the Chairman of the Board, and a mailbox is provided for the Chairman to receive sealed communications.
The Company does not have a formal policy on director attendance at the Company’s annual meeting; however all directors are encouraged to attend and the full board was in attendance at last year’s annual meeting.
Shareholder Proposals for the 2010 Annual Meeting of Shareholders
In order for shareholder proposals to be eligible for consideration by the Company for inclusion in the Company’s proxy statement and form of proxy relating to the annual meeting for the fiscal year 2009 (the 2010 Annual Meeting), they must deliver a written copy of their proposal to the principal executive offices of the Company no later than December 17, 2009. To ensure prompt receipt by the Company, the proposal should be sent certified mail, return receipt requested. Proposals must comply with the Company’s bylaws relating to shareholder proposals in order to be included in the Company’s proxy materials. Any shareholder who intends to propose any other matter to be acted upon at the 2009 Annual Meeting of Shareholders (but not include such proposal in the Company’s Proxy Statement) must inform the Company no later than March 7, 2010. If notice is not provided by that date, the persons named in the Company’s proxy for the 2010 Annual Meeting will be allowed to exercise their discretionary authority to vote upon any such proposal without the matter having been discussed in the Proxy Statement for the 2010 Annual Meeting.
UPON WRITTEN REQUEST, A COPY OF OUR MOST RECENT ANNUAL REPORT ON FORM 10-K, INCLUDING FINANCIAL STATEMENTS AND THE FINANCIAL SCHEDULES AS FILED WITH THE SECURITIES AND EXCHANGE COMMISSION SHALL BE FURNISHED TO SHAREHOLDERS WITHOUT CHARGE. PLEASE DIRECT YOUR WRITTEN REQUEST TO: DAVID H. GILL, HENRY COUNTY BANCSHARES, INC., P. O. BOX 928, STOCKBRIDGE, GEORGIA 30281.
March 24, 2009
17
TABLE OF APPENDICES
Appendix A Management’s Discussion and Analysis of Financial Condition and Results of Operation
Appendix B Selected Financial Data, Consolidated Financial Statements and Supplemental Data
Appendix C Performance Graph
18
APPENDIX A
MANAGEMENT’S DISCUSSION AND ANALYSIS OF FINANCIAL CONDITION AND RESULTS OF OPERATIONS
The following is a discussion of our financial condition and the financial condition of our bank subsidiary, The First State Bank and our mortgage subsidiary, First Metro Mortgage Co. at December 31, 2008 and 2007 and the results of operations for the three years in the period ended December 31, 2008. The purpose of this discussion is to focus on information about our financial condition and results of operations that are not otherwise apparent from our audited financial statements. Reference should be made to those statements and the selected financial data presented elsewhere in this report for an understanding of the following discussion and analysis.
A-1
A Warning About Forward-Looking Statements
We may from time to time make written or oral forward-looking statements, including statements contained in our filings with the Securities and Exchange Commission and reports to stockholders. Statements made by us, other than those concerning historical information, should be considered forward-looking and subject to various risks and uncertainties. Forward-looking statements are made based upon management’s belief as well as assumptions made by, and information currently available to, management pursuant to “safe harbor” provisions of the Private Securities Litigation Reform Act of 1995. Our actual results may differ materially from the results anticipated in forward-looking statements due to a variety of factors, including governmental monetary and fiscal policies, deposit levels, loan demand, loan collateral values, securities portfolio values, interest rate risk management, the effects of competition in the banking business from other commercial banks, thrifts, mortgage banking firms, consumer finance companies, credit unions, securities brokerage firms, insurance companies, money market funds and other financial institutions operating in our market area and elsewhere, including institutions operating through the Internet, changes in governmental regulation relating to the banking industry, including regulations relating to branching and acquisitions, failure of assumptions underlying the establishment of reserves for loan losses, including the value of collateral underlying delinquent loans and other factors. We caution that these factors are not exclusive. We do not undertake to update any forward-looking statement that may be made from time to time by us, or on our behalf.
Critical Accounting Policies
Our accounting and reporting policies are in accordance with accounting principles generally accepted in the United States of America as defined by the Public Company Accounting Oversight Board and conform to general practices within the banking industry. Our significant accounting policies are described in the notes to the consolidated financial statements. Certain accounting policies require management to make significant estimates and assumptions, which have a material impact on the carrying value of certain assets and liabilities, and we consider these to be critical accounting policies. The estimates and assumptions used are based on historical experience and other factors that management believes to be reasonable under the circumstances. Actual results could differ significantly from these estimates and assumptions, which could have a material impact on the carrying value of assets and liabilities at the balance sheet dates and results of operations for the reporting periods.
We believe the following are critical accounting policies in the preparation of our financial statements that require the most significant estimates and assumptions that are particularly susceptible to a significant change.
Allowance for loan losses
The allowance for loan losses represents management’s estimate of probable credit losses inherent in the loan portfolio. Estimating the amount of the allowance for loan losses requires significant judgment and the use of estimates related to the fair market value or the estimated net realizable value of underlying collateral on impaired loans, estimated losses on non-impaired loans based on historical loss experience, management’s evaluation of the current loan portfolio, and consideration of current economic trends and conditions. Loan losses are charged against the allowance, while recoveries of amounts previously charged off are credited to the allowance. A provision for loan losses is charged to operations based on management’s periodic evaluation of the factors previously mentioned, as well as other pertinent factors.
The allowance for loan losses consists of specific and general components. The components of the allowance for loan losses represent an estimate pursuant to either Statement of Financial Accounting Standards (“SFAS”) No. 5,Accounting for Contingencies, or SFAS 114,Accounting by Creditors for
A-2
Impairment of a Loan.The allocated component of the allowance for loan losses reflects expected losses resulting from analyses developed through specific credit allocations for individual problem or potential problem loans and general allocations based on historical loss experience for each loan category. The specific credit allocations are based on regular analyses of loan relationships typically in excess of $500,000 but may include a review of other loan relationships on which full collection may not be reasonably assumed. These analyses involve judgment in estimating the amount of loss associated with the specific loans, including estimating the underlying collateral values. The historical loss experience used in determining general allocations is determined using the average of actual losses incurred over the most recent five years for each type of loan. The historical loss experience is adjusted for known changes in economic conditions as well as other qualitative factors. The resulting loss allocation factors are applied to the balance of each type of loan after removing the balance of impaired loans from each category.
Although management believes its processes for determining the allowance adequately consider all the potential factors that could potentially result in credit losses, the process includes subjective elements and may be susceptible to significant change. In addition there could be potential problem loans in the portfolio that have not been identified as problems because they continue to perform as set forth in the loan agreements. Continued weaknesses in our market area could cause currently performing credits to deteriorate. To the extent actual outcomes differ from management estimates, additional provision for loan losses could be required that could adversely affect earnings or financial position in future periods.
Additional information on the Company’s loan portfolio and allowance for loan losses can be found in the sections of Management’s Discussion and Analysis titled “Risk Elements” and “Allowance for Loan Losses” and in Note 1 to the Consolidated Financial Statements.
Other Real Estate Owned
Other real estate, consisting of properties obtained through foreclosure or in satisfaction of loans, is adjusted to fair value upon transfer of the real estate held as collateral to other real estate owned. Subsequently, other real estate owned is carried at the lower of carrying value or fair value, determined on the basis of current appraisals, comparable sales, and other estimates of value obtained principally from independent sources, adjusted for estimated selling costs. At the time of foreclosure, any excess of the loan balance over fair value of the real estate held as collateral is recorded as a charge to the allowance for loan losses. Gains or losses on sale and any subsequent adjustments to the value are recorded as a component of non-interest expense.
Overview
In 2008, Henry County experienced a continued deterioration in the local economy, largely centered on depressed housing sales and real estate values as well as significant local job losses due to reductions in construction and land development activity. The recession currently being experienced nationally is exacerbated in the Company’s market area due to a significant dependence on the housing industry in the south Metropolitan Atlanta area to drive the local economy. The Company’s performance reflects the impact of slowed economic activity, depressed real estate values, reduced sales and a challenging banking environment. An exacerbating factor in attempting to resolve problem assets is the uncertainty of the local real estate market. Housing sales have fallen to approximately 10% of prior year levels. Markets are distorted by liquidation efforts resulting in great uncertainty in property values. The significant increase in distressed properties for sale coupled with a lack of liquidity in the real estate market has depressed property values significantly. The reliability of appraisals is subject to uncertainties, as there are few true arms-length sales for comparison purposes.
A-3
This set of circumstances creates two separate but equally significant situations for the Company. The first is that borrowers who depend on sale of real property for retirement of their loans are unable to generate necessary cash flow for their on-going needs. As those borrowers deplete cash reserves and exhaust other resources, it becomes increasingly difficult to meet debt service obligations. This problem results in a rising level of troubled assets. The second impact is that the Company has an increasingly difficult time in evaluating the value of collateral that supports troubled loans and serves as the bank’s last resort recovery source. Current accounting standards require that the Bank identify loans that are considered impaired and evaluate the potential for loss should the loan be satisfied by liquidation of the collateral. This evaluation forms the basis for one of the Company’s most critical accounting decisions, yet it is the most difficult to reliably quantify. The actual market value of real property, which is the underlying collateral in almost all of the Bank’s troubled assets, is exceedingly difficult to determine in the face of an illiquid market. While the Company uses appraisals and evaluations of the real property by knowledgeable individuals, including input from several members of the board of directors, the value of real estate in this market is unstable and is sometimes a moving target.
The Company’s performance in 2008 was characterized by increasing levels of problem loans, necessitating substantial additions to the allowance for loan losses. Coupled with an extremely low interest rate environment and compressed margins, the Company saw earnings decline significantly. The Company operated at a loss of $14,346,711 compared to earnings in 2007 of $8,708,726. The largest component of the change in earnings was the provision for loan losses, which totaled $24,285,750 in 2008 compared to $2,959,254 in 2007. The Company elected to charge off those portions of loans that were deemed to be ultimately uncollectible though it continues to actively attempt to collect such loans. In addition, the Company wrote down the value of owned real estate $2,910,836, reflecting the deteriorating nature of real estate values.
Nationally, the country remains in recession, with the banking segment one of the hardest hit sectors of the economy. The Company is not immune to the same issues facing many of the countries banks. The current actions of the federal government to alleviate the recession have an as yet unknown impact. Most economists do not predict any possibility of recovery in the first half of 2009. The success of the Company in resolving its troubled assets will be largely tied to the stabilization of real property values and the return of our market area to a more viable economy.
Financial Condition at December 31, 2008 and 2007
The following is a summary of our balance sheets for the periods indicated:
| December 31, | ||||||
| 2008 | 2007 | |||||
| (Dollars in Thousands) | ||||||
Cash and due from banks | $ | 14,039 | $ | 16,826 | ||
Interest-bearing deposits in banks | 1,500 | 2,732 | ||||
Federal funds sold | 14,300 | 9,500 | ||||
Securities | 65,460 | 93,781 | ||||
Loans held for sale | - | 950 | ||||
Loans, net | 515,878 | 561,730 | ||||
Premises and equipment | 9,776 | 10,341 | ||||
Other real estate | 18,398 | 10,394 | ||||
Other assets | 16,526 | 12,742 | ||||
| $ | 655,877 | $ | 718,996 | |||
Total deposits | $ | 590,477 | $ | 625,851 | ||
Other borrowings | 2,598 | 13,424 | ||||
Other liabilities | 3,460 | 4,187 | ||||
Stockholders’ equity | 59,342 | 75,534 | ||||
| $ | 655,877 | $ | 718,996 | |||
A-4
As of December 31, 2008, we had total assets of $656 million, a decrease of 8.78% from December 31, 2007. Total interest-earning assets were $615 million at December 31, 2008 as compared to $676 million at December 31, 2007 or 94% of total assets, respectively. Our primary interest-earning assets at December 31, 2008 were loans, which made up 87% of total interest-earning assets as compared to 84% at December 31, 2007. Net loans decreased by $45.8 million, primarily due to the transfer of $14.1 million to other real estate owned as a result of foreclosures during 2008 and the charge-off of impaired loans totaling $12.5 million during the fourth quarter of 2008. The remaining decrease in net outstanding loans is a result of increased allowance for loan losses of $10.0 million, as well as normal pay down activity as we have experienced a slowing of new loan production during 2008. Other real estate owned increased by $8.0 million during 2008 as transfers of loans through foreclosure of $14.1 million was offset by sales of other real estate owned of $3.2 million, and additional write downs during 2008 of $2.9 million.
Decreases in investment securities of $28.3 million, coupled with decreases in cash and due from banks of $2.8 million were primarily used to offset decreases in time deposits during 2008. Total deposits decreased $35.4 million during 2008. The decrease in deposit accounts was primarily a result of decreases in non-brokered retail time deposits of $50.8 million, offset by increases in brokered time deposits of $34.2 million. Brokered time deposits totaled $44.8 million costing a weighted average rate of 3.46% and represented less than 8% of total deposits at December 31, 2008. Interests bearing checking, savings and demand deposits have decreased $18.8 million during 2008.
The decrease in retail time deposits reflects a strategic decision by the Company to allow higher-priced time deposits where there were no other customer relationships to be withdrawn upon maturity rather than maintain higher interest rates. The bulk of these deposits matured during the first nine months of 2008, allowing the Company to replace this funding with lower cost brokered time deposits. Other borrowings decreased $10.8 million during 2008, primarily as a result of the retirement of Federal Home Loan Bank advances in the amount of $6.4 million. Our total equity decreased by $16.1 million for 2008 as a result of net losses of $14.3 million, purchases of treasury stock of $61,000, and dividends paid of $2.1 million, offset by increased unrealized gains on securities available for sale of $353,000.
The securities portfolio provides the Company with a source of liquidity and a relatively stable source of income. The Company’s investment policy focuses on the use of the securities portfolio to manage the interest rate risk created by the inherent mismatch of the loan and deposit portfolios. The Company’s asset/liability management committee meets quarterly to review economic trends and makes recommendations as to the structure of the securities portfolio based upon this review and the Company’s projected funding needs.
Our securities portfolio, consisting of U.S. Government and Agency, mortgage-backed, municipal and equity securities amounted to $65.5 million at December 31, 2008. Net unrealized gains on securities available-for-sale were $1,194,783 at December 31, 2008 as compared to net unrealized gains of $660,202 at December 31, 2007. Net unrealized losses on securities held-to-maturity were $11,029 at December 31, 2008 as compared to net unrealized losses of $21,289 at December 31, 2007. We have not specifically identified any securities for sale in future periods, which, if so designated, would require a charge to operations if the market value would not be reasonably expected to recover prior to the time of sale.
Since lending activities generate the primary source of revenue, the Company’s main objective is to adhere to sound lending practices. The Board of Directors has delegated loan policy decisions and loan approval authority to the Executive Committee of the Board of Directors. The Executive Committee is composed of five outside directors and the Chief Executive Officer. The Executive Committee establishes lending policies that include underwriting guidelines on the various types of
A-5
loans made as well as guidance on loan terms. The Company employs a loan approval process in which individual loan officers are provided with independent approval authority based upon their experience and training. When prospective loans are analyzed, both interest rate and credit quality objectives are considered in determining whether to make a given loan. Parameters are set on the amount of credit that can be extended to one borrower. The largest amount that can generally be extended to any one borrower without obtaining approval from the Executive Committee of the Board of Directors is $150,000. The Executive Committee is authorized to extend credit to one borrower on an unsecured basis of up to 15% of statutory capital or approximately $7.2 million and on a secured basis of up to 25% of statutory capital or approximately $12 million.
The Bank offers a variety of loans to retail customers in the communities we serve.
Consumer Loans:
Consumer loans in general carry a moderate degree of risk compared to other loans. They are historically more risky than traditional residential real estate but less risky than commercial loans. Risk of default is generally determined by the well being of the national and local economies. During times of economic stress there is usually some level of job loss both nationally and locally, which directly affects the ability of the consumer to repay debt. Risk on consumer type loans is generally managed through policy limitations on debt levels consumer borrowers may carry and limitations on loan terms and amounts depending upon collateral type.
Various types of consumer loans include the following:
| - | Home equity loans - open and closed end |
| - | Vehicle financing |
| - | Loans secured by deposits |
| - | Secured and unsecured personal loans |
The various types of consumer loans all carry varying degrees of risk for the Bank. Loans secured by deposits carry little or no risk and in our experience have had a zero default rate. Home equity lines carry additional risk because of the increased difficulty of converting real estate to cash in the event of a default. However, underwriting policy provides mitigation to this risk in the form of a maximum loan to value ratio of 90% on a collateral type that has historically appreciated in value. The Bank also requires the customer to carry adequate insurance coverage to pay all mortgage debt in full if the collateral is destroyed. Vehicle financing carries additional risks over loans secured by real estate in that the collateral is declining in value over the life of the loan and is mobile. Risks inherent in vehicle financing are managed by matching the loan term with the age and remaining useful life of the collateral to ensure the customer always has an equity position and is never “upside down.” Collateral is protected by requiring the customer to carry insurance showing the Bank as loss payee. The Bank also has a blanket policy that covers the Bank in the event of a lapse in the borrower’s coverage and also provides assistance in locating collateral when necessary. Secured personal loans carry additional risks over the previous types in that they are generally smaller and made to borrowers with somewhat limited financial resources and credit histories. These loans are secured by a variety of collateral with varying degrees of marketability in the event of default. Risk on these types of loans is managed primarily at the underwriting level with guidelines for debt to income ratio limitations and conservative collateral valuations. Unsecured personal loans carry the greatest degree of risk in the consumer portfolio. Without collateral, the Bank is completely dependent on the commitment of the borrower to repay and the stability of the borrower’s income stream. Again, primary risk management occurs at the underwriting stage with guidelines for debt to income ratios, time in present job and in industry and policy guidelines relative to loan size as a percentage of net worth and liquid assets.
A-6
Commercial and Industrial Loans
The Bank makes loans to small and medium sized businesses in our primary trade area for purposes such as new or upgrades to plant and equipment, inventory acquisition and various working capital purposes. Commercial loans are granted to borrowers based on cash flow, ability to repay and degree of management expertise. This type loan may be subject to many different types of risk, which will differ depending on the particular industry the borrower is involved with. General risks to an industry, or segment of an industry, are monitored by senior management on an ongoing basis, when warranted. Individual borrowers who may be at risk due to an industry condition may be more closely analyzed and reviewed at a Loan Committee or Board of Directors level. On a regular basis, commercial and industrial borrowers are required to submit statements of financial condition relative to their business to the Bank for review. These statements are analyzed for trends and the loan is assigned a credit grade accordingly. Based on this grade the loan may receive an increased degree of scrutiny by management up to and including additional loss reserves being required.
This type loan is almost always collateralized. Generally, business assets are used and may consist of general intangibles, inventory, equipment or real estate. Collateral is subject to risk relative to conversion to a liquid asset if necessary as well as risks associated with degree of specialization, mobility and general collectibility in a default situation. To mitigate this risk to collateral, it is underwritten to strict standards including valuations and general acceptability based on the Bank’s ability to monitor its ongoing health and value.
Commercial Real Estate:
The Bank grants loans to borrowers secured by commercial real estate located in our market area. In underwriting these type loans we consider the historic and projected future cash flows of the real estate, we make an assessment of the physical condition and general location of the property and the effect these factors will have on its future desirability from a tenant standpoint. We will generally lend up to a maximum 75% loan to value ratio and require a minimum debt coverage ratio of 1.25 or other compensating factors.
Commercial real estate offers some risks not found in traditional residential real estate lending. Repayment is dependent upon successful management and marketing of properties and on the level of expense necessary to maintain the property. Repayment of these loans may be adversely affected by conditions in the real estate market or the general economy. Also commercial real estate loans typically involve relatively large loan balances to single borrowers. To mitigate these risks, we monitor our loan concentration and loans are reviewed by a third party reviewer. This type loan generally has a shorter maturity than other loan types giving the Bank an opportunity to reprice, restructure or decline to renew the credit. As with other loans, commercial real estate loans are graded depending upon strength of credit and performance. A lower grade will bring increased scrutiny by management and the Board of Directors.
Construction and Development Loans:
The Bank makes residential construction and development loans to customers in our market area. Loans are granted for both speculative projects and those being built with end buyers already secured. This type loan is subject primarily to market and general economic risk caused by inventory build-up in periods of economic prosperity. During times of economic stress this type loan has typically had a greater degree of risk than other loan types. To mitigate that risk, the Board of Directors and management reviews the entire portfolio on a monthly basis. The percentage of our portfolio being built on a speculative basis is tracked very closely. On a quarterly basis the portfolio is segmented by market area to allow analysis of exposure and a comparison to current inventory levels in these areas.
A-7
To further mitigate risk, this type loan is accorded a larger percentage loan loss allowance than other loan types. Loan policy also provides for limits on speculative lending by borrower and by real estate project.
The development component of the Bank’s lending has seen significant deterioration, beginning in 2007 and continuing through 2008. While the Board and management believe that these loans were soundly underwritten at the time of their inception, the failure of the housing market with the resulting cessation of sales activity is creating an extremely adverse environment for borrowers in this category of loans. Though the Bank has curtailed additional loans to acquire and develop land, the loans contained in this segment of the portfolio continue to represent the greatest risk to the overall loan portfolio of the Bank. The ongoing carrying cost of holding these lots is an increasing burden on the borrower and the Bank. Developments that are incomplete must have stabilization efforts to ensure that environmental conditions do not run afoul of regulatory requirements as well as regular monitoring to prevent vandalism and dumping of construction and other debris. The requirement to pay real property taxes as well as interest further stresses the cash flow of borrowers. As the liquidation of these borrowing obligations is largely dependent upon the sale of vacant developed lots to builders or to retail consumers, the ability of the borrower to retire their debt obligations as well as the ability of the Bank to liquidate collateral through foreclosure and sale is very restricted.
Residential construction lending has been influenced by many of the same characteristics as development lending. While there are more opportunities for sales than for vacant developed lots, the sales activity is largely characterized by declining values due to the wholesale liquidation of residential units following foreclosure. Henry County is located in an area characterized by a high level of foreclosures and the number of houses on the market exceeds the demand by a significant number. Housing sales are dominated by investor purchases with buyers at all levels expecting significant discounts to previously established market values as well as significant sales concessions in order to consummate purchases. The Bank has greatly restricted construction lending and generally approves new construction loans where the underlying lot is currently financed by the Bank and the property is “presold” to an approved purchaser.
Loan Participations:
The Bank sells loan participations in the ordinary course of business when an originated loan exceeds its legal lending limit as defined by state banking laws. These loan participations are sold to other financial institutions without recourse. As of December 31, 2008 the Bank had $4.29 million in loan participations sold.
The Bank will also purchase loan participations from time to time from other banks in the ordinary course of business usually without recourse. Purchased loan participations are underwritten in accordance with the Bank’s loan policy and represent a source of loan growth to the Bank. Although the originating financial institution provides much of the initial underwriting documentation, management is responsible for the appropriate underwriting, approval and the on-going evaluation of the loan. One risk associated with purchasing loan participations is that the Bank often relies on information provided by the selling bank regarding collateral value and the borrower’s capacity to pay. To the extent this information is not accurate, the Bank may experience a loss on these participations. Otherwise, the Bank believes that the risk related to purchased loan participations is consistent with other similar type loans in the loan portfolio. If a purchased loan participation defaults, the Bank usually has no recourse against the selling bank but will take other commercially reasonable steps to minimize its loss. As of December 31, 2008, the Bank had purchased 35 loan participations. The total principal amount of these participations comprised approximately 4.86% of our total portfolio on December 31, 2008.
A-8
At December 31, 2008, the Bank held 14 participation loans, totaling $16.6 million purchased from The Community Bank in Loganville, Georgia. The Community Bank was placed in receivership by the State Department of Banking on November 21, 2008 and all assets are being managed by the FDIC. The Bank is working with the FDIC to collect the underlying indebtedness. Full resolution of these participations may be influenced by the FDIC’s desire to reduce their holdings through liquidation action rather than collection action. Due to these extraordinary circumstances, the Bank has given heightened scrutiny to these loans and has recorded $6.0 million in specifically identified reserves for these loans.
Through the Company’s mortgage subsidiary, First Metro Mortgage Co., first mortgage loans are originated for immediate sale to investors. The loans are sold with servicing rights attached; therefore, no servicing rights are retained by the Company. Gains and losses on the sale of loans are recognized at the settlement date and are determined by the difference between the selling price and the carrying value of the loans sold.
All loans originated by First Metro Mortgage Co. are classified as loans held for sale on the balance sheet because of the intention to immediately sell these loans. The balance of the loans held for sale represents individual mortgage loans that have been funded for which proceeds from the investor have not yet been received. Loans held for sale are carried at the lower of aggregate cost or fair value. However, because the proceeds from the investors for the sale of these loans are usually received within fourteen days, the aggregate cost and fair value of these loans are the same.
For the year ended December 31, 2008, First Metro Mortgage Co. originated 81 loans totaling $12.8 million. These mortgage banking activities are performed exclusively by First Metro Mortgage Co. No similar activities are conducted at the Bank level. All loans originated by the Bank are classified as held for investment.
We have 95% of our loan portfolio collateralized by real estate located in our primary market area of Henry County, Georgia and surrounding counties. Our real estate mortgage portfolio consists of loans collateralized by one to four-family and multifamily residential properties (12%), construction loans to build one to four-family and multifamily residential properties (52%), and nonresidential properties consisting primarily of small business commercial properties (36%).
Liquidity and Capital Resources
The purpose of liquidity management is to ensure that there are sufficient cash flows to satisfy demands for credit, deposit withdrawals, and our other needs. Traditional sources of liquidity include asset maturities and growth in core deposits. A company may achieve its desired liquidity objectives from the management of assets and liabilities and through funds provided by operations. Funds invested in short-term marketable instruments and the continuous maturing of other earning assets are sources of liquidity from the asset perspective. The liability base provides sources of liquidity through deposit growth, the maturity structure of liabilities, and accessibility to market sources of funds.
Scheduled loan payments are a relatively stable source of funds, but loan payoffs and deposit flows fluctuate significantly, being influenced by interest rates and general economic conditions and competition. We attempt to price deposits to meet asset/liability objectives consistent with local market conditions.
Management continues to emphasize programs to generate local core deposits as our primary funding source. The stability of our core deposit base is an important factor in our liquidity position. A heavy percentage of the deposit base is comprised of accounts of individuals and small businesses with comprehensive banking relationships and limited volatility. Management regularly monitors deposit flow
A-9
and evaluates alternate pricing structures to retain and grow deposits as needed. Traditional local deposit funding sources are supplemented by the use of FHLB borrowings as well as brokered deposits.
At December 31, 2008, we had loan commitments outstanding of $68 million. Because these commitments generally have fixed expiration dates and many will expire without being drawn upon, the total commitment amounts do not necessarily represent future cash requirements. If needed, we have the ability on a short-term basis to borrow and purchase federal funds from other financial institutions. We had an arrangement with one commercial bank for an overnight secured federal funds accommodation line of $12.0 million, of which none had been drawn upon as of December 31, 2008. We also have the ability to borrow up to $65 million, subject to available collateral, from the Federal Home Loan Bank.
At December 31, 2008, our capital ratios were considered well capitalized based on regulatory minimum capital requirements. Stockholders’ equity decreased by $16.1 million for 2008 as a result of net losses of $14.3 million, purchases of treasury stock of $61,000, and dividends paid of $2.1 million, offset by increased unrealized gains on securities available for sale of $353,000. For regulatory purposes, the net unrealized gains and losses on securities available-for-sale are excluded in the computation of the capital ratios.
In the future, the primary source of funds available to us will be the payment of dividends by the Bank. Banking regulations limit the amount of the dividends that may be paid without prior approval of the Bank’s regulatory agency.
At December 31, 2008, the Bank could not pay dividends without prior approval of the Bank’s regulatory agency.
The minimum capital requirements to be considered well capitalized under prompt corrective action provisions and the actual capital ratios for Henry County Bancshares, Inc. and the Bank as of December 31, 2008 are as follows:
| Actual | |||||||||
| Consolidated | Bank | Regulatory Requirements | |||||||
Leverage capital ratio | 8.43 | % | 8.40 | % | 5.00 | % | |||
Risk-based capital ratios: | |||||||||
Core capital | 10.32 | 10.28 | 6.00 | ||||||
Total capital | 11.59 | 11.55 | 10.00 | ||||||
These ratios may decline as asset growth continues, but are expected to exceed the regulatory minimum requirements to be considered well-capitalized. Any future earnings will assist in keeping these ratios at satisfactory levels above the regulatory minimum requirement to be considered well-capitalized.
We believe that our liquidity and capital resources are adequate and will meet our foreseeable short and long-term needs. We anticipate that we will have sufficient funds available to meet current loan commitments and to fund or refinance, on a timely basis, our other material commitments and liabilities. The Company continues to evaluate opportunities to raise capital to insure that our capital resources will be sufficient for any future needs.
The Bank believes that it has properly evaluated the loan portfolio for risks and has taken appropriate charges to earnings to provide sufficient reserves in the allowance for loan losses. However, should the Bank experience continued deterioration of asset quality as the recession deepens, additional reserves may be required that could lower capital levels.
A-10
Management is not aware of any other known trends, events or uncertainties, other than those discussed herein, that will have or that are reasonably likely to have a material effect on our liquidity, capital resources or operations. Management is also not aware of any current recommendations by the regulatory authorities that, if they were implemented, would have such an effect.
Effects of Inflation
The impact of inflation on banks differs from its impact on non-financial institutions. Banks, as financial intermediaries, have assets that are primarily monetary in nature and that tend to fluctuate in concert with inflation. A bank can reduce the impact of inflation if it can manage its rate sensitivity gap. This gap represents the difference between rate sensitive assets and rate sensitive liabilities. We, through our asset-liability committee, attempt to structure the assets and liabilities and manage the rate sensitivity gap, thereby seeking to minimize the potential effects of inflation. For information on the management of the Bank’s interest rate sensitive assets and liabilities, see the “Asset/Liability Management” section.
We do not engage in any transactions or have relationships or other arrangements with an unconsolidated entity such as special purpose and similar entities or other off-balance sheet arrangements. We also do not trade in energy, weather or other commodity based contracts.
Results of Operations For The Years Ended December 31, 2008, 2007 and 2006
The following is a summary of our operations for the years indicated.
| Years Ended December 31, | ||||||||||
| 2008 | 2007 | 2006 | ||||||||
| (Dollars in Thousands) | ||||||||||
Interest income | $ | 35,410 | $ | 51,577 | $ | 48,311 | ||||
Interest expense | 19,628 | 26,306 | 20,498 | |||||||
Net interest income | 15,782 | 25,271 | 27,813 | |||||||
Provision for loan losses | 24,286 | 2,959 | 477 | |||||||
Other income | 2,784 | 3,025 | 3,296 | |||||||
Other expenses | 15,198 | 11,793 | 10,614 | |||||||
Pretax income (loss) | (20,918 | ) | 13,544 | 20,018 | ||||||
Income taxes (benefit) | (6,572 | ) | 4,835 | 7,609 | ||||||
Net income (loss) | $ | (14,346 | ) | $ | 8,709 | $ | 12,409 | |||
Net Interest Income
Our results of operations are determined by our ability to manage interest income and expense effectively, to minimize loan and investment losses, to generate non-interest income, and to control operating expenses. Because interest rates are determined by market forces and economic conditions beyond our control, our ability to generate net interest income depends on our ability to obtain an adequate net interest spread between the rate we pay on interest-bearing liabilities and the rate we earn on interest-earning assets.
The net yield on average interest-earning assets decreased to 2.41% in 2008 from 3.64% in 2007. The average yield on interest-earning assets decreased to 5.42% in 2008 from 7.42 % in 2007. The net cost on average interest-bearing liabilities decreased to 3.60% in 2008 from 4.59 % in 2007. The decrease in net yield on average interest-earning assets is primarily due to a reduction in interest income on loans as a result of a 400 basis point decrease in the Prime lending rate during 2008 and the effect of loans being placed on nonaccrual during 2008.
A-11
The net yield on average interest-earning assets decreased to 3.64% in 2007 from 4.31% in 2006. The average yield on interest-earning assets decreased to 7.42% in 2007 from 7.50% in 2006. The average cost on interest-bearing liabilities increased to 4.59% in 2007 from 3.95% in 2006.
Net interest income decreased by $9.4 million in 2008 as compared to a decrease of $2.5 million in 2007 and an increase of $5.1 million in 2006 compared to 2005. As mentioned above, the decrease in net interest income during 2008 was attributed to a decrease in the Prime lending rate during 2008, as well as the negative affect our increased levels of nonperforming loans had on our net interest margin. Interest income that would have been recorded on nonaccrual loans since the end of 2007, including reversals of interest from prior periods, amounted to approximately $5.3 million during 2008, effectively lowering our net yield on average earning assets by 81 basis points during 2008. The decrease in interest expense attributed to average interest-bearing liabilities is largely the result of a lower cost of funds during 2008.
Provision for Loan Losses
The provision for loan losses increased by $21,326,496 to $24,285,750 in 2008 and increased by $2,482,394 to $2,959,254 in 2007. The amounts provided are due primarily to our assessment of the inherent risk in the loan portfolio. Please see the section titled “Allowance for Loan Losses” for a more detailed explanation of our assessment criteria as it relates to providing for loan losses. We believe that the $17.7 million in the allowance for loan losses at December 31, 2008, or 3.32% of total net outstanding loans is adequate to absorb known risks in the portfolio based upon our review of the loan portfolio. Our net charge-offs were $14.2 million, or 2.55% of average loans outstanding in 2008. The increase in net charge-offs in 2008 is primarily attributed to $12.5 million in charge-offs of fifteen real estate development loan relationships. The Company had deemed these loans impaired and had set aside specific reserves during 2008 based on collateral values securing the loans.
Our net charge-offs were minimal in 2007, 2006 and 2005 as the ratio of charged-off loans to average loans outstanding was .09%, .04% and .01%, respectively. No assurance can be given, however, that the increasing adverse economic conditions or other circumstances will not result in increased losses in our loan portfolio.
Other Income
Other income consists of service charges on deposit accounts, other service charges and fees and mortgage banking income. Other income was $2.8 million in 2008 as compared to $3.0 million in 2007. The decrease is due primarily to decreased mortgage banking income of $223,000, and to a lesser extent, other service charges and fees of $26,000. The decrease in mortgage banking income is attributed to a lesser volume of mortgage originations during 2008 compared to 2007. The decrease in other service charges and fees is primarily attributed to decreases in fees earned on our official check program.
Other income was $3.0 million in 2007 as compared to $3.3 million in 2006. The decrease is due primarily to decreased service charges on demand deposit accounts of $138,000, as well as decreases in mortgage banking income of $103,000, and to a lesser extent, other service charges and fees of $29,000. Decreases in service charges on demand deposit accounts are attributed to decreases in official check fees.
Other Expenses
Other expenses were $15.2 million in 2008 as compared to $11.8 million in 2007, an increase of $3,405,347. Gross salaries and employee benefits decreased by $426,180, primarily as a result of decreases in incentive pay and profit sharing contributions in the amount of $830,872, offset with
A-12
decreases in capitalized loan fees in the amount of $416,734. The number of full time equivalent employees was 144 at December 31, 2008 as compared to 151 at December 31, 2007. Our equipment and occupancy expenses increased by $60,179 in 2008 as compared to 2007, primarily as a result of increased property tax expenses of $35,959 as well as slight increases of $13,736 in utilities and $10,950 in building repairs and maintenance. Other real estate losses of $3,235,010 were comprised of write downs (subsequent to foreclosure) in other real estate values of $2,910,836 and losses on sales of other real estate of $324,174. Other operating expenses increased by $536,338 primarily as a result of increases in FDIC insurance premiums of $390,208, increased legal expenses of $100,650, and increased expenses attributed to carrying other real estate of $216,718, offset by decreases in advertising expenses of $77,220.
Other expenses were $11.8 million in 2007 as compared to $10.6 million in 2006, an increase of $1,148,804. Gross salaries and employee benefits increased by $712,344, primarily as a result of normal salary, incentive and benefits increases of $363,962, coupled with decreases in capitalized loan fees in the amount of $348,382. The number of full time equivalent employees was 151 at December 31, 2007 as compared to 144 at December 31, 2006. Our equipment and occupancy expenses increased by $187,456 in 2007 as compared to 2006, primarily as a result of increased building and fixture depreciation expenses of $65,002 and other occupancy expenses attributed to the opening of our Bethany Road branch in March of 2007. Other operating expenses increased by $249,004 as result of increases in stationery and supplies of $34,240, internet expenses of $31,854, ATM expenses of $48,737 and increased expenses attributed to other real estate owned of $140,969.
Income Tax
Income tax expense (benefit) totaled ($6.6 million) in 2008 as compared to $4.8 million in 2007. The effective tax rates for 2008 and 2007 were approximately 31% and 36%, respectively. The reduction in the absolute value percentages of the effective tax rates is largely the result of a $1.97 million valuation allowance recorded against deferred tax assets in 2008.
Income tax expense was $4.8 million in 2007 as compared to $7.6 million in 2006. Income tax expense as a percentage of pretax income was approximately 36% for 2007 and 38% for 2006.
A-13
SELECTED FINANCIAL INFORMATION AND STATISTICAL DATA
The tables and schedules on the following pages set forth certain financial information and statistical data with respect to: the distribution of assets, liabilities and stockholders’ equity; interest rates and interest differentials; interest rate sensitivity gap ratios; the securities portfolio; the loan portfolio including types of loans, maturities and sensitivities to changes in interest rates and information on nonperforming loans; summary of the loan loss experience and allowance for loan losses; types of deposits; and the return on equity and assets.
The following table sets forth the amount of our interest income or interest expense for each category of interest-earning assets and interest-bearing liabilities and the average interest yield/rate for total interest-earning assets and total interest-bearing liabilities, net interest spread and net yield on average interest-earning assets.
A-14
Table 1 – Distribution of Assets, Liabilities and Stockholders’ Equity Interest Rates and Interest Differentials
| Years Ended December 31, | ||||||||||||||||||||||||||||||
| 2008 | 2007 | 2006 | ||||||||||||||||||||||||||||
| Average Balances (1) | Income/ Expense | Yields/ Rates | Average Balances (1) | Income/ Expense | Yields/ Rates | Average Balances (1) | Income/ Expense | Yields/ Rates | ||||||||||||||||||||||
| (Dollars in Thousands) | ||||||||||||||||||||||||||||||
Taxable securities | $ | 72,698 | $ | 3,641 | 5.01 | % | $ | 99,206 | $ | 5,255 | 5.30 | % | $ | 71,923 | $ | 3,077 | 4.28 | % | ||||||||||||
Nontaxable securities (4) | 10,238 | 355 | 3.47 | % | 10,038 | 378 | 3.77 | % | 8,666 | 332 | 3.83 | % | ||||||||||||||||||
Federal funds sold | 11,355 | 213 | 1.88 | % | 21,641 | 1,082 | 5.00 | % | 15,492 | 780 | 5.03 | % | ||||||||||||||||||
Interest-bearing deposits in banks | 1,626 | 38 | 2.34 | % | 1,472 | 74 | 5.03 | % | 227 | 14 | 6.17 | % | ||||||||||||||||||
Loans (2) (3) | 557,646 | 31,163 | 5.59 | % | 562,478 | 44,788 | 7.96 | % | 548,046 | 44,109 | 8.05 | % | ||||||||||||||||||
Total interest-earning assets | 653,563 | 35,410 | 5.42 | % | 694,835 | 51,577 | 7.42 | % | 644,354 | 48,312 | 7.50 | % | ||||||||||||||||||
Unrealized gains (losses) on securities | 464 | (139 | ) | (607 | ) | |||||||||||||||||||||||||
Allowance for loan losses | (10,181 | ) | (5,424 | ) | (5,194 | ) | ||||||||||||||||||||||||
Cash and due from banks | 14,633 | 15,669 | 17,462 | |||||||||||||||||||||||||||
Other assets | 37,225 | 26,533 | 20,054 | |||||||||||||||||||||||||||
Total | $ | 695,704 | $ | 731,474 | $ | 676,069 | ||||||||||||||||||||||||
Interest-bearing demand & savings | $ | 149,448 | 1,715 | 1.15 | % | $ | 154,108 | 4,262 | 2.77 | % | $ | 163,912 | 4,328 | 2.64 | % | |||||||||||||||
Time deposits | 389,049 | 17,656 | 4.54 | % | 400,165 | 21,073 | 5.27 | % | 332,730 | 15,029 | 4.52 | % | ||||||||||||||||||
Borrowings | 6,647 | 257 | 3.87 | % | 19,012 | 971 | 5.11 | % | 22,379 | 1,141 | 5.10 | % | ||||||||||||||||||
Total interest-bearing liabilities | 545,144 | 19,628 | 3.60 | % | 573,285 | 26,306 | 4.59 | % | 519,021 | 20,498 | 3.95 | % | ||||||||||||||||||
Noninterest-bearing demand | 70,407 | 76,857 | 83,922 | |||||||||||||||||||||||||||
Other liabilities | 5,933 | 5,798 | 5,088 | |||||||||||||||||||||||||||
Stockholders’ equity | 74,220 | 75,534 | 68,038 | |||||||||||||||||||||||||||
Total | $ | 695,704 | $ | 731,474 | $ | 676,069 | ||||||||||||||||||||||||
Net interest income | $ | 15,782 | $ | 25,271 | $ | 27,814 | ||||||||||||||||||||||||
Net interest spread | 1.82 | % | 2.83 | % | 3.54 | % | ||||||||||||||||||||||||
Net yield on average interest-earning assets | 2.41 | % | 3.64 | % | 4.31 | % | ||||||||||||||||||||||||
| (1) | Average balances were determined using the daily average balances. |
| (2) | Average balances of loans include nonaccrual loans. |
| (3) | Interest and fees on loans include $190,000, $208,000, and $220,000 of loan fee income for the years ended December 31, 2008, 2007, and 2006, respectively. |
| (4) | Yields on nontaxable securities are not presented on a tax-equivalent basis. |
Table 2 – Rate and Volume Analysis
The following table describes the extent to which changes in interest rates and changes in volume of interest-earning assets and interest-bearing liabilities have affected our interest income and expense during the years indicated. For each category of interest-earning assets and interest-bearing liabilities, information is provided on changes attributable to (1) change in volume (change in volume multiplied by old rate); (2) change in rate (change in rate multiplied by old volume); and (3) a combination of
A-15
change in rate and change in volume. The changes in interest income and interest expense attributable to both volume and rate have been allocated proportionately to the change due to volume and the change due to rate.
| Years Ended December 31, | ||||||||||||||||||||||||
| 2008 to 2007 | 2007 to 2006 | |||||||||||||||||||||||
| Increase (decrease) due to change in | Increase (decrease) due to change in | |||||||||||||||||||||||
| Volume | Rate | Net | Volume | Rate | Net | |||||||||||||||||||
| (Dollars in Thousands) | ||||||||||||||||||||||||
Income from interest-earning assets: | ||||||||||||||||||||||||
Interest and fees on loans | $ | (382 | ) | $ | (13,243 | ) | $ | (13,625 | ) | $ | 1,153 | $ | (474 | ) | $ | 649 | ||||||||
Interest on taxable securities | (1,341 | ) | (273 | ) | (1,614 | ) | 1,338 | 840 | 2,178 | |||||||||||||||
Interest on nontaxable securities | 8 | (31 | ) | (23 | ) | 52 | (6 | ) | 46 | |||||||||||||||
Interest on federal funds sold | (375 | ) | (494 | ) | (869 | ) | 307 | (5 | ) | 302 | ||||||||||||||
Interest on interest-bearing deposits in banks | 7 | (43 | ) | (36 | ) | 64 | (4 | ) | 60 | |||||||||||||||
Total interest income | (2,083 | ) | (14,084 | ) | (16,167 | ) | 2,914 | 351 | 3,235 | |||||||||||||||
Expense from interest-bearing liabilities: | ||||||||||||||||||||||||
Interest on interest-bearing demand deposits and savings deposits | (125 | ) | (2,422 | ) | (2,547 | ) | (265 | ) | 199 | (66 | ) | |||||||||||||
Interest on time deposits | (572 | ) | (2,845 | ) | (3,417 | ) | 3,324 | 2,720 | 6,044 | |||||||||||||||
Interest on borrowings | (520 | ) | (194 | ) | (714 | ) | (172 | ) | 2 | (170 | ) | |||||||||||||
Total interest expense | (1,217 | ) | (5,461 | ) | (6,678 | ) | 2,887 | 2,921 | 5,808 | |||||||||||||||
Net interest income | $ | (866 | ) | $ | (8,623 | ) | $ | (9,489 | ) | $ | 27 | $ | (2,570 | ) | $ | (2,573 | ) | |||||||
Asset/Liability Management
Our asset/liability mix is monitored on a regular basis and a report evaluating the interest rate sensitive assets and interest rate sensitive liabilities is prepared and presented to the Board of Directors on a quarterly basis. The objective of this policy is to monitor interest rate sensitive assets and liabilities so as to minimize the impact of substantial movements in interest rates on earnings. An asset or liability is considered to be interest rate-sensitive if it will reprice or mature within the time period analyzed, usually one year or less. The interest rate-sensitivity gap is the difference between the interest-earning assets and interest-bearing liabilities scheduled to mature or reprice within such time period. A gap is considered positive when the amount of interest rate-sensitive assets exceeds the amount of interest rate-sensitive liabilities. A gap is considered negative when the amount of interest rate-sensitive liabilities exceeds the interest rate-sensitive assets. During a period of rising interest rates, a negative gap would tend to adversely affect net interest income, while a positive gap would tend to result in an increase in net interest income. Conversely, during a period of falling interest rates, a negative gap would tend to result in an increase in net interest income, while a positive gap would tend to adversely affect net interest income. If our assets and liabilities were equally flexible and moved concurrently, the impact of any increase or decrease in interest rates on net interest income would be minimal.
A simple interest rate “gap” analysis by itself may not be an accurate indicator of how net interest income will be affected by changes in interest rates. Accordingly, we also evaluate how the repayment of particular assets and liabilities is impacted by changes in interest rates. Income associated with interest-earning assets and costs associated with interest-bearing liabilities may not be affected uniformly by changes in interest rates. In addition, the magnitude and duration of changes in interest rates may have a significant impact on net interest income. For example, although certain assets and liabilities may have similar maturities or periods of repricing, they may react in different degrees to
A-16
changes in market interest rates. Interest rates on certain types of assets and liabilities fluctuate in advance of changes in general market rates, while interest rates on other types may lag behind changes in general market rates. In addition, certain assets, such as adjustable rate mortgage loans, have features (generally referred to as “interest rate caps and floors”) that limit the amount of changes in interest rates. Prepayment and early withdrawal levels also could deviate significantly from those assumed in calculating the interest rate gap. The ability of many borrowers to service their debts also may decrease during periods of rising interest rates.
Changes in interest rates also affect our liquidity position. We currently price deposits in response to market rates and it is management’s intention to continue this policy. If deposits are not priced in response to market rates, a loss of deposits could occur which would negatively affect our liquidity position.
At December 31, 2008 our cumulative one year interest rate sensitivity gap ratio was 104%. Our targeted ratio is 80% to 120% in this time horizon. This indicates that our interest-earning assets will reprice during this period at a rate slightly more than our interest-bearing liabilities.
The following table sets forth the distribution of the repricing of our interest-earning assets and interest-bearing liabilities as of December 31, 2008, the interest rate sensitivity gap (i.e., interest rate sensitive assets less interest rate sensitive liabilities), the cumulative interest rate sensitivity gap, the interest rate sensitivity gap ratio (i.e., interest rate sensitive assets divided by interest rate sensitive liabilities) and the cumulative interest rate sensitivity gap ratio.
The table also sets forth the time periods in which interest-earning assets and interest-bearing liabilities will mature or may reprice in accordance with their contractual terms. However, the table does not necessarily indicate the impact of general interest rate movements on the net interest margin since the repricing of various categories of assets and liabilities is subject to competitive pressures and the needs of our customers. In addition, various assets and liabilities indicated as repricing within the same period may in fact reprice at different times within such period and at different rates.
| Within Three Months | After Three Months But Within One Year | After One Year But Within Five Years | After Five Years | Total | ||||||||||||
| (Dollars in Thousands) | ||||||||||||||||
Interest-earning assets: | ||||||||||||||||
Interest-bearing deposits in banks | $ | 1,500 | $ | - | $ | - | $ | - | $ | 1,500 | ||||||
Federal funds sold | 14,300 | - | - | - | 14,300 | |||||||||||
Securities | 2,820 | 2,999 | 25,784 | 32,662 | 64,265 | |||||||||||
Loans | 327,010 | 61,290 | 140,983 | 4,325 | 533,608 | |||||||||||
Total interest-earning assets | 345,630 | 64,289 | 166,767 | 36,987 | 613,673 | |||||||||||
Interest-bearing liabilities: | ||||||||||||||||
Interest-bearing demand and savings | $ | 132,388 | $ | - | $ | - | $ | - | $ | 132,388 | ||||||
Time deposits | 88,534 | 171,824 | 129,378 | 26 | 389,762 | |||||||||||
Repurchase agreements | - | - | - | - | - | |||||||||||
Other borrowings | 955 | - | 1,643 | - | 2,598 | |||||||||||
Total interest-bearing liabilities | $ | 221,877 | $ | 171,824 | $ | 131,021 | $ | 26 | $ | 524,748 | ||||||
Interest rate sensitivity gap | $ | 123,753 | $ | (107,535 | ) | $ | 35,746 | $ | 36,961 | $ | 88,925 | |||||
Cumulative interest rate sensitivity gap | $ | 123,753 | $ | 16,218 | $ | 51,964 | $ | 88,925 | ||||||||
Interest rate sensitivity gap ratio | 1.56 | .37 | 1.27 | 142.2 | ||||||||||||
Cumulative interest rate sensitivity gap ratio | 1.56 | 1.04 | 1.10 | 1.17 | ||||||||||||
A-17
We actively manage the mix of asset and liability maturities to control the effects of changes in the general level of interest rates on net interest income. Except for its effect on the general level of interest rates, inflation does not have a material impact on us due to the rate variability and short-term maturities of our earning assets. In particular, approximately 59% of the loan portfolio is comprised of loans that have variable rate terms or mature within one year. Most mortgage loans are made on a variable rate basis with rates being adjusted every one to five years.
A-18
INVESTMENT PORTFOLIO
Types of Investments
The carrying amounts of securities at the dates indicated are summarized as follows:
| December 31, | |||||||||
| 2008 | 2007 | 2006 | |||||||
| (Dollars in Thousands) | |||||||||
U.S. Treasury securities | $ | - | $ | - | $ | - | |||
Government-sponsored agencies | 26,063 | 58,414 | 71,262 | ||||||
Mortgage-backed securities | 28,272 | 24,723 | 7,947 | ||||||
Municipal securities | 9,482 | 8,745 | 9,498 | ||||||
| 63,817 | 91,882 | 88,707 | |||||||
Equity securities | 1,643 | 1,898 | 2,370 | ||||||
| $ | 65,460 | $ | 93,780 | $ | 91,077 | ||||
Maturities
The amounts of debt securities, including the weighted average yield in each category as of December 31, 2008 are shown in the following table according to contractual maturity classifications (1) one year or less, (2) after one through five years, (3) after five through ten years and (4) after ten years. Equity securities are not included in the table because they have no contractual maturity.
| After one | After five | |||||||||||||||||
| One year or less | through five years | through ten years | ||||||||||||||||
| Amount | Yield (1) | Amount | Yield (1) | Amount | Yield (1) | |||||||||||||
Government-sponsored agencies | $ | 2,206 | 3.76 | % | $ | 20,815 | 4.01 | % | $ | 3,042 | 4.82 | % | ||||||
Mortgage-backed securities | 5 | 2.09 | 1,025 | 4.16 | 9,382 | 5.04 | ||||||||||||
Municipal securities | 3,628 | 3.80 | 4,253 | 3.38 | 1,079 | 4.03 | ||||||||||||
| $ | 5,839 | 3.78 | $ | 26,093 | 3.91 | $ | 13,503 | 4.91 | ||||||||||
| After ten years | Total | |||||||||||
| Amount | Yield (1) | Amount | Yield (1) | |||||||||
Government-sponsored agencies | $ | - | - | % | $ | 26,063 | 4.08 | % | ||||
Mortgage-backed securities | 17,860 | 5.22 | 28,272 | 5.12 | ||||||||
Municipal securities | 522 | 5.41 | 9,482 | 3.73 | ||||||||
| $ | 18,382 | 5.23 | $ | 63,817 | 4.49 | |||||||
| (1) | The weighted average yields were computed using coupon interest, adding discount accretion or subtracting premium amortization, as appropriate, on a ratable basis over the life of each security. |
| (2) | The weighted average yields for municipal securities are not stated on a tax-equivalent basis. |
A-19
LOAN PORTFOLIO
Types of Loans
Loans by type of collateral are presented below:
| December 31, | ||||||||||||||||||||
| 2008 | 2007 | 2006 | 2005 | 2004 | ||||||||||||||||
| (Dollars in Thousands) | ||||||||||||||||||||
Commercial | $ | 21,181 | $ | 23,752 | $ | 32,765 | $ | 36,349 | $ | 47,246 | ||||||||||
Real estate – construction | 263,052 | 325,151 | 309,565 | 260,912 | 223,907 | |||||||||||||||
Real estate – mortgage | 243,235 | 212,786 | 210,368 | 210,366 | 203,598 | |||||||||||||||
Consumer installment and other | 6,140 | 7,698 | 8,948 | 10,487 | 11,972 | |||||||||||||||
| 533,608 | 569,387 | 561,646 | 518,114 | 486,723 | ||||||||||||||||
Less allowance for loan losses | (17,730 | ) | (7,657 | ) | (5,230 | ) | (4,972 | ) | (4,489 | ) | ||||||||||
Net loans | $ | 515,878 | $ | 561,730 | $ | 556,416 | $ | 513,142 | $ | 482,234 | ||||||||||
Maturities and Sensitivities to Changes in Interest Rates
Total loans as of December 31, 2008 are shown in the following table according to contractual maturity classifications (1) one year or less, (2) after one year through five years, and (3) after five years.
| (Dollars in Thousands) | |||
Commercial | |||
One year or less | $ | 16,117 | |
After one through five years | 4,493 | ||
After five years | 571 | ||
| 21,181 | |||
Construction | |||
One year or less | 241,832 | ||
After one through five years | 9,040 | ||
After five years | 12,180 | ||
| 263,052 | |||
Other | |||
One year or less | 106,260 | ||
After one through five years | 121,851 | ||
After five years | 21,264 | ||
| 249,375 | |||
| $ | 533,608 | ||
The following table summarizes loans at December 31, 2008 with the due dates after one year for predetermined and floating or adjustable interest rates.
| (Dollars in Thousands) | |||
Predetermined interest rates | $ | 127,452 | |
Floating or adjustable interest rates | 41,947 | ||
| $ | 169,399 | ||
A-20
Risk Elements
The following table presents the aggregate of nonperforming assets for the categories indicated.
| December 31, | |||||||||||||||
| 2008 | 2007 | 2006 | 2005 | 2004 | |||||||||||
| (Dollars in Thousands) | |||||||||||||||
Loans accounted for on a nonaccrual basis | $ | 77,804 | $ | 32,744 | $ | 416 | $ | 782 | $ | 498 | |||||
Loans contractually past due ninety days or more as to interest or principal payments and still accruing | 20,066 | 4,714 | 1,001 | 4,173 | 3,251 | ||||||||||
Restructured loans | - | - | - | - | - | ||||||||||
Total nonperforming loans | $ | 97,870 | $ | 37,458 | $ | 1,417 | $ | 4,955 | $ | 3,749 | |||||
Other real estate | 18,398 | 10,394 | 1,411 | 194 | 5 | ||||||||||
Total non performing assets | $ | 116,268 | $ | 47,852 | $ | 2,828 | $ | 5,149 | $ | 3,754 | |||||
The reduction in interest income associated with nonaccrual loans during 2008 is as follows:
| (Dollars in Thousands) | |||
Interest income that would have been recorded on nonaccrual loans under original terms | $ | 6,154 | |
Interest income that was recorded on nonaccrual loans | $ | 875 | |
Nonperforming assets consist of nonaccrual loans, loans restructured due to the debtors’ financial difficulties, loans past due 90 days or more as to interest or principal and still accruing, and other real estate owned, which is real estate acquired through foreclosure or otherwise in satisfaction of loans. Nonaccrual loans are those loans on which recognition of interest income has been discontinued. Restructured loans generally allow for an extension of the original repayment period or a reduction or deferral of interest or principal because of deterioration in the financial position of the borrower.
When management believes there is sufficient doubt to the collectibility of principal or interest on any loan on its contractual terms, or generally when loans are 90 days or more past due, the accrual of interest is discontinued and the loan is designated as nonaccrual, unless the loan is well secured and in the process of collection. Interest payments received on nonaccrual loans are either applied against principal or reported as income according to management’s judgment as to the collectibility of principal. Loans are returned to an accrual status when those factors that indicated doubtful collectibility on a timely basis no longer exist.
Nonperforming assets at December 31, 2008 amounted to approximately $116.3 million, or 20.33% of total loans and other real estate. This compares to approximately $47.8 million, or 8.25% of total loans and other real estate at December 31, 2007 and $2.8 million, or .50% of total loans and other real estate at December 31, 2006.
The increase in nonperforming assets is primarily attributed to the significant slowdown in residential real estate sales that began in the summer of 2007 and has continued to deteriorate through 2008. Nonperforming loans are concentrated in our residential construction and land development portfolio, comprising 84% of total nonperforming loans. The amount of residential construction and development loans as a percentage of our total portfolio is approximately 49%, leaving a large percentage of our loan portfolio performing. With the significant slowing of home and lot sales, the prices of homes and lots have declined. Therefore, many of our customers who develop and sell residential real estate cannot service their loans because they are not generating sufficient revenue, resulting in the significant increase in nonaccrual loans.
A-21
Nonaccrual loans increased by $45.1 million or 138% during the year ended December 31, 2008. There was significant movement within these loans during 2008, as $84.6 million went on nonaccrual status, $14.1 million went into foreclosure, and $7.6 million returned to accrual status through the repayment of previously accrued interest. In addition to these changes, the Company charged off $12.6 million in nonaccrual loans during the fourth quarter of 2008 on which specific reserves had been estasblished. We also received $4.8 million in principal reductions in these loans during 2008. The ten largest nonaccrual loan relationships comprise $56.4 million or 72% of the total and all are collateralized by residential real estate.
Loans contractually past due ninety days or more as to interest or principal payments and still accruing at December 31, 2008 was $20.0 million and were comprised of three loan relationships totaling approximately $12.3 million that have been paid current subsequent to the end of 2008.
Other real estate owned increased by $8.0 million, or 77% during the year ended December 31, 2008. During the year, we foreclosed on $11.2 million, net of writedowns and sold $3.2 million of real estate. The total balance of $18.4 million is distributed as follows; residential development (46%), homes and lots (44%) and commercial real estate (10%).
The level of nonperforming assets is a matter of significant concern to the Company, which is actively working to resolve problem credits and to liquidate Bank owned real estate as appropriate purchasers can be found. The Company is represented by experienced legal counsel who is working to ensure that its interests are protected and that the Company achieves maximum collection. The senior management of the Company meets with loan officers on a weekly basis to review nonperforming loans and to ensure that the Company is following its most effective plan for reduction or restructuring of these credits. An additional committee of the Board of Directors has been formed to assist management in the evaluation and liquidation of owned real estate. With a declining housing sales market and lowering real property values, liquidation of real estate at prices favorable to the Company is difficult. The Company continues to write down property or record reserves as required by ongoing evaluations or property values.
We believe that the performance problems existing in our real estate portfolio are a direct result of softening real estate activity and not indicative of a weakness in previous or current underwriting standards regarding real estate lending.
During the third quarter of 2008, the Company took additional action with regard to the administration of nonperforming assets. The Bank created a Special Assets Division to manage and administer the Bank’s portfolio of nonperforming loans and to enhance the liquidation of owned real estate. The Bank has engaged an experienced manager for this department who has over 35 years of banking experience, including substantial time spent in special asset administration.
A-22
SUMMARY OF LOAN LOSS EXPERIENCE
The following table summarizes average loan balances for each year determined using the daily average balances during the year; changes in the allowance for loan losses arising from loans charged off and recoveries on loans previously charged off; additions to the allowance which have been charged to expense; and the ratio of net charge-offs during the year to average loans.
| December 31, | ||||||||||||||||||||
| 2008 | 2007 | 2006 | 2005 | 2004 | ||||||||||||||||
| (Dollars in Thousands) | ||||||||||||||||||||
Average amount of loans outstanding | $ | 557,646 | $ | 562,478 | $ | 548,046 | $ | 510,733 | $ | 455,993 | ||||||||||
Balance of allowance for loan losses at beginning of year | $ | 7,657 | $ | 5,230 | $ | 4,972 | $ | 4,489 | $ | 4,178 | ||||||||||
Loans charged off: | ||||||||||||||||||||
Real estate | (14,039 | ) | (466 | ) | (5 | ) | (21 | ) | (17 | ) | ||||||||||
Commercial | (128 | ) | (33 | ) | (148 | ) | (12 | ) | (45 | ) | ||||||||||
Consumer installment | (53 | ) | (51 | ) | (88 | ) | (53 | ) | (91 | ) | ||||||||||
| (14,220 | ) | (550 | ) | (241 | ) | (86 | ) | (153 | ) | |||||||||||
Recoveries of loans previously charged off: | ||||||||||||||||||||
Real estate | 4 | 1 | - | 9 | 6 | |||||||||||||||
Commercial | 1 | 1 | - | 1 | - | |||||||||||||||
Consumer installment | 2 | 16 | 22 | 13 | 15 | |||||||||||||||
| 7 | 18 | 22 | 23 | 21 | ||||||||||||||||
Net loans charged off during the year | (14,213 | ) | (532 | ) | (219 | ) | (63 | ) | (132 | ) | ||||||||||
Additions to allowance charged to expense during year | 24,286 | 2,959 | 477 | 546 | 443 | |||||||||||||||
Balance of allowance for loan losses at end of year | $ | 17,730 | $ | 7,657 | $ | 5,230 | $ | 4,972 | $ | 4,489 | ||||||||||
Ratio of net loans charged off during the year to average loans outstanding | 2.55 | % | 0.09 | % | 0.04 | % | 0.01 | % | 0.03 | % | ||||||||||
Allowance for Loan Losses
The allowance for loan losses is a reserve established through charges to earnings in the form of a provision for loan losses. The provision for loan losses is based on management’s evaluation and assessment of the allowance for loan losses. This assessment includes procedures to estimate probable losses and determine the adequacy and appropriateness of the resulting allowance balance. The allowance for loan losses consists of two components: (1) a specific amount representative of identified credit exposures for each impaired loan based on an evaluation of the borrower and underlying collateral (SFAS No. 114 component); and (2) a general amount based upon historical losses that have been adjusted to estimate current probable losses based on the use of eight specific risk factors representative of various economic conditions and characteristics of the loan portfolio, as well as additional general qualitative factors (SFAS No. 5 component).
We establish the specific amount by examining all impaired loans. Under generally accepted accounting principles, we may measure the loss either by (1) the observable market price of the loan; or (2) the present value of expected future cash flows discounted at the loan’s effective interest rate; or (3) the fair value of the collateral if the loan is collateral dependent. Because the significant majority of
A-23
our impaired loans are collateral dependent, nearly all of our specific allowances are calculated on the fair value of the collateral. As of December 31, 2008, our impaired loans totaled $94.4 million of which $46.8 million have specific loss allocations of $12.5 million recorded. As of December 31, 2007, our impaired loans totaled $37.5 million of which $29.5 million had specific loss allocations of $3.4 million recorded. These increases in nonperforming loans contributed significantly to the increases in the loan loss provision for the twelve month period ended December 31, 2008. During the twelve month period ended December 31, 2008, changes in collateral values for impaired loans resulted in increased provisions of $21.6 million. Other changes in impaired loan allowances during the twelve month period ended December 31, 2008 are the result of certain impaired loans being foreclosed upon and transferred to other real estate owned as well as any changes as a result of changes in loans considered to be impaired. Nonperforming loans are concentrated in our residential construction and land development portfolio.
The general amount of the allowance is based upon historical losses that are adjusted to estimate current probable losses using eight specific risk factors. The risk factors consist of: (1) economic factors including such matters as changes in the general economic conditions; (2) changes in local economic conditions; (3) concentrations of credit; (4) deterioration in asset values; (5) slowing pace of housing sales; (6) deterioration in lot values; (7) higher loan to values given risk; and (8) level of loans secured by real estate. These risk factors are evaluated and assigned percentages to be allocated to the portfolio, exclusive of SFAS No. 114 component, on a quarterly basis. The weighting of these risk factors varies from period to period and will impact the allowance for loan losses as changes in the risk factors increase or decrease from quarter to quarter. During the year ended December 31, 2008, changes in all risk factors resulted in an increase of approximately $2.7 million in the general amount of the allowance.
The Company has originated construction and land development loans where a component of the cost of the project was the interest required to service the debt during the construction period of the loan, sometimes known as interest reserves. The Company allows disbursements of this interest component as long as the project is progressing as originally projected and if there has been no deterioration of the financial standing of the borrower or the underlying project. If the Company makes a determination that there is such deterioration, or if the loan becomes nonperforming, the Company halts any disbursement of those funds identified for use in paying interest. In some cases, additional interest reserves may be taken by use of deposited funds or through credit lines secured by separate and additional collateral.
As of the indicated dates, we have made allocations of our allowance for loan losses to specifically correspond to the categories of loans listed below. Based on our best estimate, the allocation of the allowance for loan losses to types of loans, as of the indicated dates, is as follows:
| December 31, | ||||||||||||||||||||||||||||||
| 2008 | 2007 | 2006 | 2005 | 2004 | ||||||||||||||||||||||||||
| Amount | Percent of Loans in Each Category to Total Loans | Amount | Percent of Loans in Each Category to Total Loans | Amount | Percent of Loans in Each Category to Total Loans | Amount | Percent of Loans in Each Category to Total Loans | Amount | Percent of Loans in Each Category to Total Loans | |||||||||||||||||||||
| (Dollars in Thousands) | ||||||||||||||||||||||||||||||
Commercial | $ | 62 | 3.97 | % | $ | 637 | 4.17 | % | $ | 499 | 5.83 | % | $ | 554 | 7.01 | % | $ | 647 | 9.71 | % | ||||||||||
Real estate-construction | 15,051 | 49.30 | 5,625 | 57.10 | 2,911 | 55.12 | 2,066 | 50.35 | 1,698 | 46.00 | ||||||||||||||||||||
Real estate-mortgage | 2,549 | 45.58 | 1,310 | 37.37 | 1,570 | 37.45 | 1,827 | 40.60 | 1,526 | 41.83 | ||||||||||||||||||||
Consumer installment and other | 68 | 1.15 | 85 | 1.36 | 250 | 1.60 | 525 | 2.04 | 618 | 2.46 | ||||||||||||||||||||
Total allowance | 17,730 | 100.00 | % | 7,657 | 100.00 | % | $ | 5,230 | 100.00 | % | $ | 4,972 | 100.00 | % | $ | 4,489 | 100.00 | % | ||||||||||||
A-24
DEPOSITS
Average amounts of deposits and average rates paid thereon, classified as to noninterest-bearing demand deposits, interest-bearing demand and savings deposits and time deposits, are presented below. (1)
| Year Ended December 31, | ||||||||||||||||||
| 2008 | 2007 | 2006 | ||||||||||||||||
| Amount | Rate | Amount | Rate | Amount | Rate | |||||||||||||
| (Dollars in Thousands) | ||||||||||||||||||
Noninterest-bearing demand deposits | $ | 70,407 | - | % | $ | 76,857 | - | % | $ | 83,922 | - | % | ||||||
Interest-bearing demand and savings deposits | 149,448 | 1.15 | 154,108 | 2.77 | 163,912 | 2.64 | ||||||||||||
Time deposits | 389,049 | 4.54 | 400,165 | 5.27 | 332,730 | 4.52 | ||||||||||||
Total deposits | $ | 608,904 | $ | 631,130 | $ | 580,564 | ||||||||||||
| (1) | Average balances were determined using the daily average balances. |
The amounts of time certificates of deposit issued in amounts of $100,000 or more as of December 31, 2008 are shown below by category, which is based on time remaining until maturity of (1) three months or less, (2) over three through six months (3) over six through twelve months, and (4) over twelve months.
| (Dollars in Thousands) | |||
Three months or less | $ | 27,084 | |
Over three through six months | 23,818 | ||
Over six through twelve months | 35,728 | ||
Over twelve months | 48,086 | ||
Total | $ | 134,716 | |
RETURN ON EQUITY AND ASSETS
The following rate of return information for the periods indicated is presented below.
| Years Ended December 31, | |||||||||
| 2008 | 2007 | 2006 | |||||||
Return on assets (1) | (2.06 | )% | 1.19 | % | 1.84 | % | |||
Return on equity (2) | (19.33 | ) | 11.53 | 18.24 | |||||
Dividend payout ratio (3) | N/A | 45.90 | 35.63 | ||||||
Equity to assets ratio (4) | 10.67 | 10.33 | 10.06 | ||||||
| (1) | Net income divided by average total assets. |
| (2) | Net income divided by average equity. |
| (3) | Dividends declared per share divided by earnings per share. |
| (4) | Average equity divided by average total assets. |
A-25
QUANTITATIVE AND QUALITATIVE DISCLOSURES ABOUT MARKET RISK
We are exposed only to U.S. dollar interest rate changes and accordingly, we manage exposure by considering the possible changes in the net interest margin. We do not have any trading instruments nor do we classify any portion of the investment portfolio as held for trading. We do not engage in any hedging activities or enter into any derivative instruments with a higher degree of risk than mortgage-backed securities that are commonly pass through securities. Finally, we have no exposure to foreign currency exchange rate risk, commodity price risk, and other market risks. Interest rates play a major part in the net interest income of a financial institution. The sensitivity to rate changes is known as “interest rate risk.” The repricing of interest earning assets and interest-bearing liabilities can influence the changes in net interest income. As part of our asset/liability management program, the timing of repriced assets and liabilities is referred to as Gap management. It is our policy to maintain a Gap ratio in the one-year time horizon of .80 to 1.20.
GAP management alone is not enough to properly manage interest rate sensitivity, because interest rates do not respond at the same speed or at the same level to market rate changes. For example, savings and money market rates are more stable than loans tied to a “Prime” rate and thus respond with less volatility to a market rate change.
We use a third party simulation model to monitor changes in net interest income due to changes in market rates. The model of rising, falling and stable interest rate scenarios allow management to monitor and adjust interest rate sensitivity to minimize the impact of market rate swings. The analysis of impact on net interest margins as well as market value of equity over a twelve-month period is subjected to a 200 basis point increase and decrease in rate. The 4th quarter model reflects an increase of 29% in net interest income and a 7% increase in economic value of equity for a 200 basis point increase in rates. The same model shows a 10% decrease in net interest income and a 17% decrease in economic value of equity for a 200 basis point decrease in rates. Our investment committee monitors changes on a quarterly basis, measures the changing values based on the model’s performance and determines an appropriate interest rate policy for management to follow in order to minimize the impact on earnings and market value of equity in the projected rate environment.
A-26
APPENDIX B
SELECTED FINANCIAL DATA
The following table presents selected historical consolidated financial information for us and our subsidiaries and is derived from the consolidated financial statements and related notes included in this annual report. This information is only a summary and should be read in conjunction with our historical financial statements and related notes. All amounts are in thousands, except per share data.
| As of and For the Year Ended December 31, | ||||||||||||||||
| 2008 | 2007 | 2006 | 2005 | 2004 | ||||||||||||
Total Loans | $ | 533,609 | $ | 569,388 | $ | 561,646 | $ | 518,114 | $ | 486,723 | ||||||
Total Deposits | 590,477 | 625,851 | 594,873 | 545,247 | 470,313 | |||||||||||
Total Borrowings | 2,598 | 13,424 | 24,222 | 19,988 | 42,058 | |||||||||||
Total Assets | 655,877 | 718,996 | 694,311 | 631,033 | 570,528 | |||||||||||
Interest Income | 35,410 | 51,577 | 48,311 | 36,602 | 28,685 | |||||||||||
Interest Expense | 19,628 | 26,306 | 20,498 | 13,859 | 10,022 | |||||||||||
Net Interest Income | 15,782 | 25,271 | 27,813 | 22,743 | 18,663 | |||||||||||
Provision for Loan Losses | 24,286 | 2,959 | 477 | 546 | 443 | |||||||||||
Net Interest Income (Loss) After Provision | (8,504 | ) | 22,312 | 27,336 | 22,197 | 18,220 | ||||||||||
Non Interest Income | 2,784 | 3,025 | 3,296 | 3,983 | 4,322 | |||||||||||
Non Interest Expense | 15,198 | 11,793 | 10,614 | 10,239 | 9,548 | |||||||||||
Income (Loss) Before Income Taxes | (20,918 | ) | 13,544 | 20,018 | 15,941 | 12,994 | ||||||||||
Provision (Benefit) for Income Taxes | (6,572 | ) | 4,835 | 7,609 | 5,665 | 4,611 | ||||||||||
Net Income (Loss) | (14,346 | ) | 8,709 | 12,409 | 10,276 | 8,383 | ||||||||||
Net Income (Loss) Per Share | (1.01 | ) | .61 | .87 | .72 | .59 | ||||||||||
Cash Dividends Declared | 0.15 | 0.28 | 0.31 | 0.245 | 0.205 | |||||||||||
Book Value Per Share | 4.17 | 5.30 | 4,97 | 4.39 | 3.93 | |||||||||||
Weighted Average Shares | 14,245,715 | 14,314,171 | 14,303,517 | 14,303,368 | 14,311,557 | |||||||||||
B-1
QUARTERLY DATA
| Years Ended December 31, | |||||||||||||||||||||||||||
| 2008 | 2007 | ||||||||||||||||||||||||||
| Fourth Quarter | Third Quarter | Second Quarter | First Quarter | Fourth Quarter | Third Quarter | Second Quarter | First Quarter | ||||||||||||||||||||
| (In thousands, except per share data) | |||||||||||||||||||||||||||
Interest income | $ | 7,015 | $ | 8,665 | $ | 8,585 | $ | 11,145 | $ | 12,234 | $ | 12,840 | $ | 13,523 | $ | 12,980 | |||||||||||
Interest expense | 4,180 | 4,557 | 4,964 | 5,927 | 6,809 | 6,792 | 6,624 | 6,081 | |||||||||||||||||||
Net interest income | 2,835 | 4,108 | 3,621 | 5,218 | 5,425 | 6,048 | 6,899 | 6,899 | |||||||||||||||||||
Provision for loan losses | 16,000 | 5,650 | 1,526 | 1,110 | 1,525 | 1,258 | 164 | 12 | |||||||||||||||||||
Net interest income (loss) after provision for loan losses | (13,165 | ) | (1,542 | ) | 2,095 | 4,108 | 3,900 | 4,790 | 6,735 | 6,887 | |||||||||||||||||
Noninterest income | 638 | 696 | 738 | 712 | 690 | 762 | 789 | 784 | |||||||||||||||||||
Noninterest expenses | 4,752 | 3,585 | 3,772 | 3,089 | 3,221 | 2,955 | 2,857 | 2,760 | |||||||||||||||||||
Income (loss) before income taxes | (17,279 | ) | (4,431 | ) | (939 | ) | 1,731 | 1,369 | 2,597 | 4,667 | 4,911 | ||||||||||||||||
Provision (benefit) for income taxes | (4,891 | ) | (1,820 | ) | (502 | ) | 641 | 326 | 936 | 1,705 | 1,868 | ||||||||||||||||
Net income (loss) | $ | (12,388 | ) | $ | (2,611 | ) | $ | (437 | ) | $ | 1,090 | $ | 1,043 | $ | 1,661 | $ | 2,962 | $ | 3,043 | ||||||||
Earnings (losses) per share | $ | (.88 | ) | $ | (.18 | ) | $ | (.03 | ) | $ | .08 | $ | .07 | $ | .12 | $ | .21 | $ | .21 | ||||||||
B-2
HENRY COUNTY BANCSHARES, INC.
AND SUBSIDIARIES
CONSOLIDATED FINANCIAL REPORT
DECEMBER 31, 2008
| Page | ||
| B-4 | ||
FINANCIAL STATEMENTS | ||
| B-5 | ||
| B-6 | ||
| B-7 | ||
| B-8 | ||
| B-9 | ||
| B-10 - B32 | ||
B-3
REPORT OF INDEPENDENT REGISTERED PUBLIC ACCOUNTING FIRM
To the Board of Directors
Henry County Bancshares, Inc.
Stockbridge, Georgia
We have audited the consolidated balance sheets ofHenry County Bancshares, Inc. and subsidiaries as of December 31, 2008 and 2007, and the related consolidated statements of operations, comprehensive income (loss), stockholders’ equity and cash flows for each of the three years in the period ended December 31, 2008. These financial statements are the responsibility of the Company’s management. Our responsibility is to express an opinion on these financial statements based on our audits.
We conducted our audits in accordance with the standards of the Public Company Accounting Oversight Board (United States). Those standards require that we plan and perform the audit to obtain reasonable assurance about whether the financial statements are free of material misstatement. An audit includes examining, on a test basis, evidence supporting the amounts and disclosures in the financial statements. An audit also includes assessing the accounting principles used and significant estimates made by management, as well as evaluating the overall financial statement presentation. We believe that our audits provide a reasonable basis for our opinion.
In our opinion, the consolidated financial statements referred to above present fairly, in all material respects, the financial position of Henry County Bancshares, Inc. and subsidiaries as of December 31, 2008 and 2007, and the results of their operations and their cash flows for each of the three years in the period ended December 31, 2008, in conformity with U.S. generally accepted accounting principles.
We have also audited, in accordance with the standards of the Public Company Accounting Oversight Board (United States), Henry County Bancshares, Inc. and subsidiaries’ internal control over financial reporting as of December 31, 2008, based on criteria established in Internal Control - Integrated Framework issued by the Committee of Sponsoring Organizations of the Treadway Commission (COSO), and our report dated March 16, 2009 expressed an unqualified opinion on the effectiveness of Henry County Bancshares, Inc. and subsidiaries’ internal control over financial reporting.
| /s/ MAULDIN & JENKINS, LLC |
Atlanta, Georgia
March 16, 2009
B-4
AND SUBSIDIARIES
CONSOLIDATED BALANCE SHEETS
DECEMBER 31, 2008 AND 2007
| 2008 | 2007 | |||||||
| Assets | ||||||||
Cash and due from banks | $ | 14,039,311 | $ | 16,826,236 | ||||
Interest-bearing deposits in banks | 1,499,648 | 2,731,987 | ||||||
Federal funds sold | 14,300,000 | 9,500,000 | ||||||
Securities available for sale | 60,455,998 | 87,717,716 | ||||||
Securities held to maturity, at cost (fair value 2008 - $3,349,682; | 3,360,711 | 4,164,690 | ||||||
Restricted equity securities, at cost | 1,643,251 | 1,897,751 | ||||||
Loans held for sale | - | 950,405 | ||||||
Loans | 533,608,559 | 569,387,551 | ||||||
Less allowance for loan losses | 17,730,410 | 7,657,387 | ||||||
Loans, net | 515,878,149 | 561,730,164 | ||||||
Premises and equipment | 9,776,484 | 10,341,368 | ||||||
Other real estate | 18,397,754 | 10,394,433 | ||||||
Other assets | 16,526,168 | 12,741,299 | ||||||
Total assets | $ | 655,877,474 | $ | 718,996,049 | ||||
| Liabilities and Stockholders’ Equity | ||||||||
Liabilities: | ||||||||
Deposits: | ||||||||
Noninterest-bearing | $ | 68,210,136 | $ | 71,388,083 | ||||
Interest-bearing | 522,266,489 | 554,463,038 | ||||||
Total deposits | 590,476,625 | 625,851,121 | ||||||
Other borrowings | 2,598,266 | 13,424,498 | ||||||
Other liabilities | 3,459,932 | 4,186,288 | ||||||
Total liabilities | 596,534,823 | 643,461,907 | ||||||
Commitments and contingencies (Note 11) | ||||||||
Stockholders’ equity: | ||||||||
Preferred stock, no par value; 10,000,000 shares authorized; none issued | ||||||||
Common stock, par value $2.50; 30,000,000 shares authorized; 14,388,749.60 issued | 35,971,874 | 35,971,874 | ||||||
Surplus | 739,560 | 739,560 | ||||||
Retained earnings | 24,161,264 | 40,644,829 | ||||||
Accumulated other comprehensive income | 788,557 | 435,733 | ||||||
Treasury stock, 143,060 and 138,560 shares, respectively | (2,318,604 | ) | (2,257,854 | ) | ||||
Total stockholders’ equity | 59,342,651 | 75,534,142 | ||||||
Total liabilities and stockholders’ equity | $ | 655,877,474 | $ | 718,996,049 | ||||
See Notes to Consolidated Financial Statements.
B-5
AND SUBSIDIARIES
CONSOLIDATED STATEMENTS OF OPERATIONS
YEARS ENDED DECEMBER 31, 2008, 2007 AND 2006
| 2008 | 2007 | 2006 | ||||||||
Interest income: | ||||||||||
Loans, including fees | $ | 31,162,823 | $ | 44,788,448 | $ | 44,108,552 | ||||
Taxable securities | 3,641,099 | 5,254,842 | 3,077,351 | |||||||
Nontaxable securities | 355,272 | 377,994 | 332,024 | |||||||
Deposits in banks | 38,025 | 73,735 | 13,719 | |||||||
Federal funds sold | 212,529 | 1,081,871 | 780,048 | |||||||
Total interest income | 35,409,748 | 51,576,890 | 48,311,694 | |||||||
Interest expense: | ||||||||||
Deposits | 19,371,408 | 25,335,743 | 19,357,142 | |||||||
Other borrowings | 257,034 | 970,692 | 1,141,326 | |||||||
Total interest expense | 19,628,442 | 26,306,435 | 20,498,468 | |||||||
Net interest income | 15,781,306 | 25,270,455 | 27,813,226 | |||||||
Provision for loan losses | 24,285,750 | 2,959,254 | 476,860 | |||||||
Net interest income (expense) after | (8,504,444 | ) | 22,311,201 | 27,336,366 | ||||||
Other income: | ||||||||||
Service charges on deposit accounts | 1,361,700 | 1,354,352 | 1,492,460 | |||||||
Other service charges and fees | 1,044,900 | 1,070,729 | 1,099,671 | |||||||
Mortgage banking income | 377,325 | 600,346 | 703,566 | |||||||
Total other income | 2,783,925 | 3,025,427 | 3,295,697 | |||||||
Other expenses: | ||||||||||
Salaries and employee benefits | 6,965,255 | 7,391,435 | 6,649,091 | |||||||
Equipment and occupancy expenses | 1,946,498 | 1,886,319 | 1,698,863 | |||||||
Other real estate losses | 3,235,010 | 25,521 | - | |||||||
Other operating expenses | 3,051,076 | 2,489,217 | 2,265,734 | |||||||
Total other expenses | 15,197,839 | 11,792,492 | 10,613,688 | |||||||
Income (loss) before income taxes | (20,918,358 | ) | 13,544,136 | 20,018,375 | ||||||
Income tax expense (benefit) | (6,571,647 | ) | 4,835,410 | 7,609,083 | ||||||
Net income (loss) | $ | (14,346,711 | ) | $ | 8,708,726 | $ | 12,409,292 | |||
Earnings (losses) per share | $ | (1.01 | ) | $ | 0.61 | $ | 0.87 | |||
See Notes to Consolidated Financial Statements.
B-6
AND SUBSIDIARIES
CONSOLIDATED STATEMENTS OF COMPREHENSIVE INCOME (LOSS)
YEARS ENDED DECEMBER 31, 2008, 2007 AND 2006
| 2008 | 2007 | 2006 | ||||||||
Net income (loss) | $ | (14,346,711 | ) | $ | 8,708,726 | $ | 12,409,292 | |||
Other comprehensive income: | ||||||||||
Net unrealized holding gains arising during period, net of tax expense of $181,757, $306,532 and $123,730, respectively | 352,824 | 595,032 | 240,182 | |||||||
Comprehensive income (loss) | $ | (13,993,887 | ) | $ | 9,303,758 | $ | 12,649,474 | |||
See Notes to Consolidated Financial Statements.
B-7
AND SUBSIDIARIES
CONSOLIDATED STATEMENTS OF STOCKHOLDERS’ EQUITY
YEARS ENDED DECEMBER 31, 2008, 2007 AND 2006
| Common Stock | Surplus | Retained Earnings | Accumulated Other Comprehensive Income (Loss) | Treasury Stock | Total Stockholders’ Equity | ||||||||||||||||||||||
| Shares | Par Value | Shares | Cost | ||||||||||||||||||||||||
Balance, December 31, 2005 | 7,237,066 | $ | 18,092,664 | $ | 739,560 | $ | 45,880,738 | $ | (399,481 | ) | 85,382 | $ | (1,565,614 | ) | $ | 62,747,867 | |||||||||||
Net income | - | - | - | 12,409,292 | - | - | - | 12,409,292 | |||||||||||||||||||
Two for one common stock split | 7,151,684 | 17,879,210 | - | (17,879,210 | ) | - | - | - | - | ||||||||||||||||||
Cash dividends declared, $.31 per share | - | - | - | (4,434,044 | ) | - | - | - | (4,434,044 | ) | |||||||||||||||||
Reissuance of treasury stock | - | - | - | (34,713 | ) | - | (18,100 | ) | 270,013 | 235,300 | |||||||||||||||||
Other comprehensive income | - | - | - | - | 240,182 | - | - | 240,182 | |||||||||||||||||||
Balance, December 31, 2006 | 14,388,750 | 35,971,874 | 739,560 | 35,942,063 | (159,299 | ) | 67,282 | (1,295,601 | ) | 71,198,597 | |||||||||||||||||
Net income | - | - | - | 8,708,726 | - | - | - | 8,708,726 | |||||||||||||||||||
Cash dividends declared, $.28 per share | - | - | - | (4,005,960 | ) | - | - | - | (4,005,960 | ) | |||||||||||||||||
Purchase of treasury stock | - | - | - | - | - | 81,000 | (1,093,500 | ) | (1,093,500 | ) | |||||||||||||||||
Reissuance of treasury stock | - | - | - | - | - | (9,722 | ) | 131,247 | 131,247 | ||||||||||||||||||
Other comprehensive income | - | - | - | - | 595,032 | - | - | 595,032 | |||||||||||||||||||
Balance, December 31, 2007 | 14,388,750 | 35,971,874 | 739,560 | 40,644,829 | 435,733 | 138,560 | (2,257,854 | ) | 75,534,142 | ||||||||||||||||||
Net loss | - | - | - | (14,346,711 | ) | - | - | - | (14,346,711 | ) | |||||||||||||||||
Cash dividends declared, $.15 per share | - | - | - | (2,136,854 | ) | - | - | - | (2,136,854 | ) | |||||||||||||||||
Purchase of treasury stock | - | - | - | - | - | 4,500 | (60,750 | ) | (60,750 | ) | |||||||||||||||||
Other comprehensive income | - | - | - | - | 352,824 | - | - | 352,824 | |||||||||||||||||||
Balance, December 31, 2008 | 14,388,750 | $ | 35,971,874 | $ | 739,560 | $ | 24,161,264 | $ | 788,557 | 143,060 | $ | (2,318,604 | ) | $ | 59,342,651 | ||||||||||||
See Notes to Consolidated Financial Statements.
B-8
AND SUBSIDIARIES
CONSOLIDATED STATEMENTS OF CASH FLOWS
YEARS ENDED DECEMBER 31, 2008, 2007 AND 2006
| 2008 | 2007 | 2006 | ||||||||||
OPERATING ACTIVITIES | ||||||||||||
Net income (loss) | $ | (14,346,711 | ) | $ | 8,708,726 | $ | 12,409,292 | |||||
Adjustments to reconcile net income (loss) to net cash provided by operating activities: | ||||||||||||
Depreciation | 679,326 | 677,546 | 601,386 | |||||||||
Provision for loan losses | 24,285,750 | 2,959,254 | 476,860 | |||||||||
Loss on sale of other real estate | 324,174 | 25,521 | 3,722 | |||||||||
Writedowns of other real estate | 2,910,836 | - | - | |||||||||
Deferred income taxes | (2,493,799 | ) | (1,802,382 | ) | (36,405 | ) | ||||||
Net (increase) decrease in loans held for sale | 950,405 | (284,339 | ) | 155,934 | ||||||||
(Increase) decrease in interest receivable | 3,991,591 | (378,096 | ) | (1,679,023 | ) | |||||||
Increase (decrease) in interest payable | (745,167 | ) | 304,628 | 1,079,952 | ||||||||
Increase in taxes receivable | (5,712,405 | ) | (409,125 | ) | - | |||||||
Decrease in income taxes payable | - | (115,783 | ) | (129,585 | ) | |||||||
Net other operating activities | 266,798 | (53,260 | ) | 376,411 | ||||||||
Net cash provided by operating activities | 10,110,798 | 9,632,690 | 13,258,544 | |||||||||
INVESTING ACTIVITIES | ||||||||||||
Purchases of securities available for sale | (50,789,539 | ) | (116,222,164 | ) | (137,258,378 | ) | ||||||
Proceeds from maturities of securities available for sale | 78,585,838 | 113,785,371 | 123,591,856 | |||||||||
Purchases of securities held to maturity | - | (1,346,140 | ) | (4,215,000 | ) | |||||||
Proceeds from maturities of securities held to maturity | 803,979 | 1,509,789 | 182,446 | |||||||||
Retirement (purchases) of restricted equity securities | 254,500 | 471,900 | (312,200 | ) | ||||||||
Net (increase) decrease in federal funds sold | (4,800,000 | ) | (4,000,000 | ) | 4,100,000 | |||||||
Net (increase) decrease in interest-bearing deposits in banks | 1,232,339 | (2,437,224 | ) | 93,315 | ||||||||
Net (increase) decrease in loans | 8,383,821 | (18,099,042 | ) | (45,179,650 | ) | |||||||
Proceeds from sale of other real estate | 1,944,113 | 816,747 | 208,281 | |||||||||
Purchase of premises and equipment | (114,442 | ) | (1,082,791 | ) | (1,495,921 | ) | ||||||
Net cash provided by (used in) investing activities | 35,500,609 | (26,603,554 | ) | (60,285,251 | ) | |||||||
FINANCING ACTIVITIES | ||||||||||||
Net increase (decrease) in deposits | (35,374,496 | ) | 30,977,707 | 49,626,285 | ||||||||
Net proceeds from (repayment) of other borrowings | (10,826,232 | ) | (10,797,184 | ) | 4,233,330 | |||||||
Dividends paid | (2,136,854 | ) | (4,005,960 | ) | (4,434,044 | ) | ||||||
Purchase of treasury stock | (60,750 | ) | (1,093,500 | ) | - | |||||||
Reissuance of treasury stock | - | 131,247 | 235,300 | |||||||||
Net cash provided by (used in) financing activities | (48,398,332 | ) | 15,212,310 | 49,660,871 | ||||||||
Net increase (decrease) in cash and due from banks | (2,786,925 | ) | (1,758,554 | ) | 2,634,164 | |||||||
Cash and due from banks at beginning of year | 16,826,236 | 18,584,790 | 15,950,626 | |||||||||
Cash and due from banks at end of year | $ | 14,039,311 | $ | 16,826,236 | $ | 18,584,790 | ||||||
SUPPLEMENTAL DISCLOSURES | ||||||||||||
Cash paid for: | ||||||||||||
Interest | $ | 20,373,609 | $ | 26,001,807 | $ | 19,418,516 | ||||||
Income taxes | $ | 1,479,657 | $ | 7,018,299 | $ | 7,630,923 | ||||||
NONCASH TRANSACTIONS | ||||||||||||
Other real estate acquired in settlement of loans | $ | 14,110,681 | $ | 9,899,879 | $ | 1,597,669 | ||||||
Financed sales of other real estate owned | $ | 928,237 | $ | 73,845 | $ | 169,262 | ||||||
See Notes to Consolidated Financial Statements.
B-9
AND SUBSIDIARIES
NOTES TO CONSOLIDATED FINANCIAL STATEMENTS
| NOTE 1. | SUMMARY OF SIGNIFICANT ACCOUNTING POLICIES |
Nature of Business
Henry County Bancshares, Inc. (the “Company”) is a bank holding company whose principal activity is the ownership and management of its wholly-owned subsidiary, The First State Bank, (the “Bank”) and the Bank’s wholly-owned subsidiary, First Metro Mortgage Co. (“First Metro”). The Bank is a commercial bank located in Stockbridge, Henry County, Georgia with six other branches located in Henry County. The Bank provides a full range of banking services in its primary market area of Henry County and surrounding counties. First Metro is also located in Stockbridge and provides mortgage loan origination services in the same primary market area as the Bank.
Basis of Presentation and Accounting Estimates
The consolidated financial statements include the accounts of the Company and its subsidiaries. Significant intercompany transactions and balances have been eliminated in consolidation.
In preparing the consolidated financial statements in accordance with accounting principles generally accepted in the United States of America, management is required to make estimates and assumptions that affect the reported amounts of assets and liabilities and the disclosure of contingent assets and liabilities as of the balance sheet date and the reported amounts of revenues and expenses during the reporting period. Actual results could differ from those estimates.
Material estimates that are particularly susceptible to significant change in the near term relate to the determination of the allowance for loan losses, the valuation of foreclosed real estate, and deferred income taxes. The determination of the adequacy of the allowance for loan losses is based on estimates that are susceptible to significant changes in the economic environment and market conditions. In connection with the determination of the estimated losses on loans and the valuation of foreclosed real estate, management obtains independent appraisals for significant collateral.
Cash, Due From Banks and Cash Flows
For purposes of reporting cash flows, cash and due from banks include cash on hand, cash items in process of collection and amounts due from banks. Cash flows from loans, federal funds sold, interest-bearing deposits in banks, deposits and other borrowings are reported net.
The Bank is required to maintain reserve balances in cash or on deposit with the Federal Reserve Bank, based on a percentage of deposits. The Bank did not have any reserve requirement at December 31, 2008 or at December 31, 2007.
Securities
Debt securities that management has the positive intent and ability to hold to maturity are classified as held to maturity and recorded at amortized cost. Securities not classified as
B-10
NOTES TO CONSOLIDATED FINANCIAL STATEMENTS
| NOTE 1. | SUMMARY OF SIGNIFICANT ACCOUNTING POLICIES (Continued) |
Securities (Continued)
held to maturity, including equity securities with readily determinable fair values, are classified as available for sale and recorded at fair value with unrealized gains and losses excluded from earnings and reported in other comprehensive income, net of the related deferred tax effect. Equity securities without a readily determinable fair value are classified as available for sale and recorded at cost.
The amortization of premiums and accretion of discounts are recognized in interest income using the interest method over the life of the securities. Realized gains and losses, determined on the basis of the cost of specific securities sold, are included in earnings on the trade date. Declines in the fair value of held to maturity and available for sale securities below their cost that are deemed to be other than temporary are reflected in earnings as realized losses.
Loans Held for Sale
Loans held for sale consist of mortgage loans originated by the Company, which the Company intends to sell into the secondary market and are carried at the lower of cost or fair value, as determined by the aggregate outstanding commitments from investors. These loans are sold with servicing rights attached; therefore, no servicing rights are retained by the Company.
The Company sells mortgage loans to investors under various blanket agreements. Under the agreements, investors generally have a limited right of recourse to the Company for normal representations and warranties and, in some cases, delinquencies within the first three to six months, which lead to loan default and foreclosure. These recourse provisions represent off-balance sheet risks in the normal course of business. Any liability applicable to loans sold with recourse would be included in other liabilities. No recourse liability was required at December 31, 2008 or December 31, 2007.
Mortgage banking income in the statement of income includes gains and losses on the sale of loans and miscellaneous fees received from borrowers. Gains and losses on the sale of loans are recognized at the settlement date and are determined by the difference between the selling price and the carrying value of the loans sold.
Loans
Loans are reported at their outstanding principal balances less the allowance for loan losses. Interest income is accrued on the outstanding principal balance.
Loan origination fees and certain direct costs are netted and recognized in income over the life of the loans using a method which approximates a level yield.
The accrual of interest on loans is discontinued when, in management’s opinion, the borrower may be unable to meet payments as they become due, unless the loan is well-secured and in process of collection. All interest accrued but not collected for loans that are placed on nonaccrual or charged off is reversed against interest income, unless
B-11
NOTES TO CONSOLIDATED FINANCIAL STATEMENTS
| NOTE 1. | SUMMARY OF SIGNIFICANT ACCOUNTING POLICIES (Continued) |
Loans (Continued)
management believes that the accrued interest is recoverable through the liquidation of collateral. Interest income on nonaccrual loans is recognized on the cost-recovery method, until the loans are returned to accrual status. Loans are returned to accrual status when all the principal and interest amounts are brought current and future payments are reasonably assured.
A loan is considered impaired when it is probable, based on current information and events, the Company will be unable to collect all principal and interest payments due in accordance with the contractual terms of the loan agreement. Factors considered by management in determining impairment include payment status, collateral value, and the probability of collecting scheduled principal and interest payments when due. Loans that experience insignificant payment delays and payment shortfalls generally are not classified as impaired. Management determines the significance of payment delays and payment shortfalls on a case-by-case basis, taking into consideration all of the circumstances surrounding the loan and the borrower, including the length of delay, the reasons for the delay, the borrower’s prior payment record, and the amount of shortfall in relation to the principal and interest owed. Impaired loans are measured by either the present value of expected future cash flows discounted at the loan’s effective interest rate, the loan’s obtainable market price, or the fair value of the collateral if the loan is collateral dependent. The amount of impairment, if any, and any subsequent changes are included in the allowance for loan losses. Interest on accruing impaired loans is recognized as long as such loans do not meet the criteria for nonaccrual status. Large groups of smaller balance homogeneous loans are collectively evaluated for impairment.
Allowance for Loan Losses
The allowance for loan losses is established through a provision for loan losses charged to expense. Loan losses are charged against the allowance when management believes the collectibility of the principal is unlikely. Subsequent recoveries, if any, are credited to the allowance.
The allowance is an amount that management believes will be adequate to absorb estimated losses relating to specifically identified loans, as well as probable credit losses inherent in the balance of the loan portfolio, based on an evaluation of the collectibility of existing loans and prior loss experience. This evaluation also takes into consideration such factors as changes in the nature and volume of the loan portfolio, overall portfolio quality, review of specific problem loans, concentrations and current economic conditions that may affect the borrower’s ability to pay. This evaluation does not include the effects of expected losses on specific loans or groups of loans that are related to future events or expected changes in economic conditions. While management uses the best information available to make its evaluation, future adjustments to the allowance may be necessary if there are any significant changes in economic conditions. In addition, regulatory agencies, as an integral part of their examination process, periodically review the Company’s allowance for loan losses, and may require the Company to make additions to the allowance based on their judgment about information available to them at the time of their examinations.
B-12
NOTES TO CONSOLIDATED FINANCIAL STATEMENTS
| NOTE 1. | SUMMARY OF SIGNIFICANT ACCOUNTING POLICIES (Continued) |
Allowance for Loan Losses (Continued)
The allowance consists of specific, general and unallocated components. The specific component relates to loans that are deemed impaired under Statement of Financial Accounting Standards (“SFAS”) No. 114. For such loans that are deemed impaired, an allowance is established when the discounted cash flows (or collateral value or observable market price) of the impaired loan is lower than the carrying value of that loan. The general component covers loans assessed under Statement of Financial Accounting Standards (“SFAS”) No. 5 and is based on a number of qualitative factors.
Premises and Equipment
Land is carried at cost. Premises and equipment are carried at cost less accumulated depreciation. Depreciation is computed principally by the straight-line method over the estimated useful lives of the assets.
Other Real Estate Owned
Other real estate, consisting of properties obtained through foreclosure or in satisfaction of loans, is adjusted to fair value upon transfer of the real estate held as collateral to other real estate owned. Subsequently, other real estate owned is carried at the lower of carrying value or fair value, determined on the basis of current appraisals, comparable sales, and other estimates of value obtained principally from independent sources, adjusted for estimated selling costs. At the time of foreclosure, any excess of the loan balance over fair value of the real estate held as collateral is recorded as a charge to the allowance for loan losses. Gains or losses on sale and any subsequent adjustments to the value are recorded as a component of non-interest expense. The carrying amount of other real estate owned at December 31, 2008 and 2007 was $18,397,754 and $10,394,433, respectively.
Income Taxes
Deferred income tax assets and liabilities are determined using the balance sheet method. Under this method, the net deferred tax asset or liability is determined based on the tax effects of the temporary differences between the book and tax bases of the various balance sheet assets and liabilities and gives current recognition to changes in tax rates and laws. Due to uncertainties as to when the Company will have taxable income in the future, a valuation allowance of $1,970,151 has been recorded against deferred tax assets. The balance of deferred tax assets after the recording of the valuation allowance is equal to the amount of tax refunds that are recoverable in open carryback years.
Earnings (Losses) Per Share
Earnings (losses) per share are computed by dividing net income (loss) by the weighted average number of shares outstanding. Weighted average shares outstanding were 14,245,715, 14,314,171, and 14,303,517 for the years ending December 31, 2008, 2007 and 2006, respectively. Weighted average shares outstanding for the year ending December 31, 2006 has been adjusted for a two for one stock split in the form of a 100% stock dividend declared and paid on December 14, 2006.
B-13
NOTES TO CONSOLIDATED FINANCIAL STATEMENTS
| NOTE 1. | SUMMARY OF SIGNIFICANT ACCOUNTING POLICIES (Continued) |
Comprehensive Income (Loss)
Accounting principles generally require that recognized revenue, expenses, gains and losses be included in net income (losses). Although certain changes in assets and liabilities, such as unrealized gains and losses on available for sale securities, are reported as a separate component of the equity section of the balance sheet, such items, along with net income (loss), are components of comprehensive income (loss).
Reclassifications
Certain items on the consolidated balance sheets and the consolidated statements of cash flows for the years ended December 31, 2007 and 2006 have been reclassified, with no effect on total assets or on net income, to be consistent with the classifications adopted for the year ended December 31, 2008.
| NOTE 2. | SECURITIES |
The amortized cost and fair value of securities are summarized as follows:
| Amortized Cost | Gross Unrealized Gains | Gross Unrealized Losses | Fair Value | ||||||||||
Securities Available for Sale | |||||||||||||
December 31, 2008: | |||||||||||||
Government-sponsored agencies | $ | 25,719,945 | $ | 342,801 | $ | - | $ | 26,062,746 | |||||
State and municipal securities | 6,035,312 | 94,578 | (8,203 | ) | 6,121,687 | ||||||||
Mortgage-backed securities | 27,505,958 | 848,033 | (82,426 | ) | 28,271,565 | ||||||||
| $ | 59,261,215 | $ | 1,285,412 | $ | (90,629 | ) | $ | 60,455,998 | |||||
December 31, 2007: | |||||||||||||
Government-sponsored agencies | $ | 58,103,044 | $ | 312,825 | $ | (2,099 | ) | $ | 58,413,770 | ||||
State and municipal securities | 4,549,874 | 45,506 | (9,816 | ) | 4,585,564 | ||||||||
Mortgage-backed securities | 24,404,596 | 376,922 | (63,136 | ) | 24,718,382 | ||||||||
| $ | 87,057,514 | $ | 735,253 | $ | (75,051 | ) | $ | 87,717,716 | |||||
Securities Held to Maturity | |||||||||||||
December 31, 2008: | |||||||||||||
State and municipal securities | $ | 3,360,000 | $ | 14,612 | $ | (25,644 | ) | $ | 3,348,968 | ||||
Mortgage-backed securities | 711 | 3 | - | 714 | |||||||||
| $ | 3,360,711 | $ | 14,615 | $ | (25,644 | ) | $ | 3,349,682 | |||||
December 31, 2007: | |||||||||||||
State and municipal securities | $ | 4,160,000 | $ | 20,540 | $ | (41,880 | ) | $ | 4,138,660 | ||||
Mortgage-backed securities | 4,690 | 51 | - | 4,741 | |||||||||
| $ | 4,164,690 | $ | 20,591 | $ | (41,880 | ) | $ | 4,143,401 | |||||
B-14
NOTES TO CONSOLIDATED FINANCIAL STATEMENTS
| NOTE 2. | SECURITIES (Continued) |
Restricted equity securities are summarized as follows:
| December 31, | ||||||
| 2008 | 2007 | |||||
Federal Home Loan Bank stock | $ | 1,367,900 | $ | 1,622,400 | ||
Correspondent bank stock | 275,351 | 275,351 | ||||
| $ | 1,643,251 | $ | 1,897,751 | |||
Securities with a carrying value of $31,500,000 and $59,372,000 at December 31, 2008 and 2007, respectively, were pledged to secure public deposits and for other purposes required or permitted by law.
There were no sales of securities available for sale for the years ended December 31, 2008, 2007, and 2006.
The amortized cost and fair value of debt securities as of December 31, 2008 by contractual maturity are shown below. Maturities may differ from contractual maturities in mortgage-backed securities because the mortgages underlying the securities may be called or repaid without penalty. Therefore, these securities are not included in the maturity categories in the following summary.
| Securities Available for Sale | Securities Held to Maturity | |||||||||||
| Amortized Cost | Fair Value | Amortized Cost | Fair Value | |||||||||
Due in one year or less | $ | 3,498,085 | $ | 3,519,215 | $ | 2,315,000 | $ | 2,319,070 | ||||
Due from one to five years | 23,686,336 | 24,022,256 | 1,045,000 | 1,029,898 | ||||||||
Due from five to ten years | 4,064,842 | 4,120,413 | - | - | ||||||||
Due after ten years | 505,994 | 522,549 | - | - | ||||||||
Mortgage-backed securities | 27,505,958 | 28,271,565 | 711 | 714 | ||||||||
| $ | 59,261,215 | $ | 60,455,998 | $ | 3,360,711 | $ | 3,349,682 | |||||
In 2003, the FASB Emerging Issues Task Force released Issue 03-01,The Meaning of Other-Than-Temporary Impairment and Its Application to Certain Investments. The issue requires disclosure of certain information about other than temporary impairments in the market value of securities. The market value of securities is based on quoted market values and is significantly affected by the interest rate environment.
Management evaluates securities for other-than-temporary impairment at least on a quarterly basis, and more frequently when economic or market concerns warrant such evaluation. Consideration is given to (1) the length of time and the extent to which the fair value has been less than cost, (2) the financial condition and near-term prospects of the issuer, and (3) the intent and ability of the Company to retain its investment in the issuer for a period of time sufficient to allow for any anticipated recovery in fair value.
B-15
NOTES TO CONSOLIDATED FINANCIAL STATEMENTS
| NOTE 2. | SECURITIES (Continued) |
Information pertaining to securities with gross unrealized losses at December 31, 2008 and 2007 aggregated by investment category and length of time that individual securities have been in a continuous loss position, follows:
| Less Than Twelve Months | Over Twelve Months | |||||||||||
| Gross Unrealized Losses | Fair Value | Gross Unrealized Losses | Fair Value | |||||||||
December 31, 2008 | ||||||||||||
Government-sponsored agencies | $ | - | $ | - | $ | - | $ | - | ||||
State and municipal securities | 8,203 | 197,790 | 25,644 | 574,356 | ||||||||
Mortgage-backed securities | 36,898 | 2,995,680 | 45,528 | 842,900 | ||||||||
| $ | 45,101 | $ | 3,193,470 | $ | 71,172 | $ | 1,417,256 | |||||
December 31, 2007 | ||||||||||||
Government-sponsored agencies | $ | 1,693 | $ | 998,307 | $ | 406 | $ | 999,277 | ||||
State and municipal securities | 399 | 185,101 | 51,298 | 2,218,702 | ||||||||
Mortgage-backed securities | 1,321 | 1,160,580 | 61,814 | 1,074,484 | ||||||||
| $ | 3,413 | $ | 2,343,988 | $ | 113,518 | $ | 4,292,463 | |||||
The unrealized losses on the Company’s investment in State and municipal securities are caused by changes in interest rates. The Company’s investments in State and municipal securities consist primarily of general obligations of municipalities located in the state of Georgia. Because the decline in market value is attributable to changes in interest rates and not credit quality, and because the Company has the ability and intent to hold those investments until a recovery of fair value, which may be maturity, the Company does not consider those investments to be other-than-temporarily impaired at December 31, 2008 and December 31, 2007.
The unrealized losses on the Company’s investment in federal agency mortgage-backed securities were also caused by changes in interest rates. The Company purchased those investments at a discount relative to their face amount, and the contractual cash flows of those investments are guaranteed by an agency of the U.S. government. Accordingly, it is expected that the securities would not be settled at a price less than the amortized cost of the Company’s investment. Because the decline in market value is attributable to changes in interest rates and not credit quality, and because the Company has the ability and intent to hold those investments until a recovery of fair value, which may be maturity, the Company does not consider those investments to be other-than-temporarily impaired at December 31, 2008 and December 31, 2007.
B-16
NOTES TO CONSOLIDATED FINANCIAL STATEMENTS
| NOTE 3. | LOANS |
The composition of loans is summarized as follows:
| December 31, | ||||||||
| 2008 | 2007 | |||||||
Real estate - commercial | $ | 181,255,000 | $ | 170,791,000 | ||||
Real estate - construction | 263,052,000 | 325,151,000 | ||||||
Real estate - 1-4 family | 61,980,000 | 41,996,000 | ||||||
Commercial | 21,181,000 | 23,752,000 | ||||||
Consumer | 6,209,559 | 7,740,551 | ||||||
| 533,677,559 | 569,430,551 | |||||||
Deferred loan fees | (69,000 | ) | (43,000 | ) | ||||
Allowance for loan losses | (17,730,410 | ) | (7,657,387 | ) | ||||
Loans, net | $ | 515,878,149 | $ | 561,730,164 | ||||
Changes in the allowance for loan losses are as follows:
| Years Ended December 31, | ||||||||||||
| 2008 | 2007 | 2006 | ||||||||||
Balance, beginning of year | $ | 7,657,387 | $ | 5,229,838 | $ | 4,971,852 | ||||||
Provision for loan losses | 24,285,750 | 2,959,254 | 476,860 | |||||||||
Loans charged off | (14,219,949 | ) | (550,280 | ) | (240,608 | ) | ||||||
Recoveries of loans previously charged off | 7,222 | 18,575 | 21,734 | |||||||||
Balance, end of year | $ | 17,730,410 | $ | 7,657,387 | $ | 5,229,838 | ||||||
The following is a summary of information pertaining to impaired loans, nonaccrual loans, and past due loans:
| December 31, | ||||||
| 2008 | 2007 | |||||
Impaired loans without a valuation allowance | $ | 47,637,030 | $ | 8,057,715 | ||
Impaired loans with a valuation allowance | 46,766,863 | 29,486,642 | ||||
Total impaired loans | $ | 94,403,893 | $ | 37,544,357 | ||
Valuation allowance related to impaired loans | $ | 12,495,573 | $ | 3,427,489 | ||
Total nonaccrual loans | $ | 77,804,171 | $ | 32,743,802 | ||
Total loans past due ninety days or more and still accruing | $ | 20,066,000 | $ | 4,714,000 | ||
The average recorded investment in impaired loans for 2008, 2007, and 2006 was $68,560,833, $15,671,333, and $1,035,750, respectively. Interest income recognized on impaired loans for cash payments received was $874,784 for 2008. Interest income recognized on impaired loans for cash payments received was not material for 2007 and 2006.
B-17
NOTES TO CONSOLIDATED FINANCIAL STATEMENTS
| NOTE 3. | LOANS (Continued) |
In the ordinary course of business, the Company has granted loans to certain related parties, including directors, executive officers, and their affiliates. The interest rates on these loans were substantially the same as rates prevailing at the time of the transaction and repayment terms are customary for the type of loan. Changes in related party loans for the year ended December 31, 2008 are as follows:
Balance, beginning of year | $ | 172,435 | ||
Advances | 96,514 | |||
Repayments | (143,553 | ) | ||
Balance, end of year | $ | 125,396 | ||
| NOTE 4. | OTHER REAL ESTATE OWNED |
A summary of other real estate owned is presented as follows:
| Years Ended December 31, | ||||||||
| 2008 | 2007 | |||||||
Balance, beginning of year | $ | 10,394,433 | $ | 1,410,667 | ||||
Additions | 14,110,681 | 9,899,879 | ||||||
Disposals | (2,268,287 | ) | (842,268 | ) | ||||
Internally financed sales | (928,237 | ) | (73,845 | ) | ||||
Writedowns | (2,910,836 | ) | - | |||||
Balance, end of year | $ | 18,397,754 | $ | 10,394,433 | ||||
Expenses applicable to other real estate owned include the following:
| Years Ended December 31, | |||||||||
| 2008 | 2007 | 2006 | |||||||
Net loss on sales of other real estate | $ | 324,174 | $ | 25,521 | $ | 3,722 | |||
Writedowns of other real estate | 2,910,836 | - | - | ||||||
Operating expenses, net of rental income | 323,875 | 163,359 | 24,790 | ||||||
| $ | 3,558,885 | $ | 188,880 | $ | 28,512 | ||||
| NOTE 5. | PREMISES AND EQUIPMENT |
Premises and equipment are summarized as follows:
| December 31, | ||||||||
| 2008 | 2007 | |||||||
Land | $ | 2,674,015 | $ | 2,674,015 | ||||
Buildings | 10,436,470 | 10,436,470 | ||||||
Equipment | 4,826,360 | 4,711,918 | ||||||
| 17,936,845 | 17,822,403 | |||||||
Accumulated depreciation | (8,160,361 | ) | (7,481,035 | ) | ||||
| $ | 9,776,484 | $ | 10,341,368 | |||||
B-18
NOTES TO CONSOLIDATED FINANCIAL STATEMENTS
| NOTE 6. | DEPOSITS |
The aggregate amount of time deposits in denominations of $100,000 or more at December 31, 2008 and 2007 was $134,716,000 and $170,521,000, respectively. The scheduled maturities of time deposits at December 31, 2008 are as follows:
2009 | $ | 260,357,919 | |
2010 | 72,442,436 | ||
2011 | 11,259,719 | ||
2012 | 8,387,112 | ||
2013 | 37,288,994 | ||
2014 | 25,758 | ||
| $ | 389,761,938 | ||
The Company had brokered time deposits of $44,795,000 and $10,548,000 at December 31, 2008 and December 31, 2007, respectively.
Overdraft demand deposits reclassified to loans totaled $179,000 and $10,000 at December 31, 2008 and 2007, respectively.
| NOTE 7. | OTHER BORROWINGS |
Other borrowings consist of the following:
| December 31, | ||||||
| 2008 | 2007 | |||||
Advance from Federal Home Loan Bank with interest at | $ | - | $ | 5,000,000 | ||
Advance from Federal Home Loan Bank with interest at | 1,000,000 | 1,000,000 | ||||
Advance from Federal Home Loan Bank with interest at | - | 1,000,000 | ||||
Advance from Federal Home Loan Bank with interest at | 642,857 | 1,071,429 | ||||
Treasury, tax and loan note option account, with interest at | 955,409 | 353,069 | ||||
Federal funds purchased and securities sold under | - | 5,000,000 | ||||
| $ | 2,598,266 | $ | 13,424,498 | |||
The advances from the Federal Home Loan Bank are secured by Federal Home Loan Bank stock of $1,367,900, and Federal Home Loan Bank Agency bonds in the amount of $6,576,000.
Securities sold under agreements to repurchase, which are secured borrowings, generally mature within thirty days from the transaction date. Securities sold under repurchase agreements are reflected at the amount of cash received in connection with the transactions. The Company may be required to provide additional collateral based on the fair value of the underlying securities. The Company monitors the fair value of the underlying securities on a daily basis.
The Company has an available unused line of credit with a financial institution totaling $12,000,000 at December 31, 2008.
B-19
NOTES TO CONSOLIDATED FINANCIAL STATEMENTS
| NOTE 8. | MORTGAGE BANKING INCOME |
Mortgage banking income consists of the following:
| Years Ended December 31, | |||||||||
| 2008 | 2007 | 2006 | |||||||
Gains on sale of loans | $ | 183,012 | $ | 270,095 | $ | 330,959 | |||
Other fees from borrowers | 194,313 | 330,251 | 372,607 | ||||||
| $ | 377,325 | $ | 600,346 | $ | 703,566 | ||||
| NOTE 9. | EMPLOYEE BENEFIT PLANS |
The Company has a noncontributory profit-sharing plan and a 401(k) retirement plan covering substantially all employees. Contributions to the plans charged to expense during 2008, 2007 and 2006 amounted to $84,325, $434,018 and $417,816, respectively.
The Company also has deferred compensation agreements with certain key officers. Amounts charged to expense under these agreements totaled $59,844, $56,320, and $53,064 for the years ended December 31, 2008, 2007 and 2006, respectively.
| NOTE 10. | INCOME TAXES |
The allocation of income tax expense (benefit) between current and deferred income taxes is as follows:
| Years Ended December 31, | ||||||||||||
| 2008 | 2007 | 2006 | ||||||||||
Current | ||||||||||||
Federal | $ | (3,525,605 | ) | $ | 6,104,827 | $ | 6,888,902 | |||||
State | (552,243 | ) | 532,965 | 756,586 | ||||||||
Deferred | ||||||||||||
Federal | (3,523,117 | ) | (1,541,583 | ) | (15,021 | ) | ||||||
State | (940,833 | ) | (260,799 | ) | (21,384 | ) | ||||||
Valuation allowance | 1,970,151 | - | - | |||||||||
Income tax expense (benefit) | $ | (6,571,647 | ) | $ | 4,835,410 | $ | 7,609,083 | |||||
The Company’s income tax expense (benefit) differs from the amounts computed by applying the federal income tax statutory rates to income (loss) before income taxes. A reconciliation of the differences is as follows:
| Years Ended December 31, | ||||||||||||
| 2008 | 2007 | 2006 | ||||||||||
Income taxes (benefit) at federal statutory | $ | (7,321,426 | ) | $ | 4,740,448 | $ | 7,006,431 | |||||
Tax-exempt interest | (108,823 | ) | (123,637 | ) | (109,750 | ) | ||||||
State income taxes (benefit) | (1,189,659 | ) | 117,266 | 580,302 | ||||||||
Rate adjustment | - | - | - | |||||||||
Valuation allowance | 1,970,151 | - | - | |||||||||
Surtax exemption | (98,330 | ) | (23,357 | ) | - | |||||||
Other items, net | 176,440 | 124,690 | 132,100 | |||||||||
Income tax expense (benefit) | $ | (6,571,647 | ) | $ | 4,835,410 | $ | 7,609,083 | |||||
B-20
NOTES TO CONSOLIDATED FINANCIAL STATEMENTS
| NOTE 10. | INCOME TAXES (Continued) |
The components of deferred income taxes are as follows:
| December 31, | |||||||
| 2008 | 2007 | ||||||
Deferred tax assets: | |||||||
Loan loss reserves | $ | 6,857,991 | $ | 2,961,820 | |||
Deferred compensation | 247,636 | 234,768 | |||||
Deferred loan fees | 26,472 | 16,681 | |||||
Other real estate expenses | 929,134 | 64,114 | |||||
Nonaccrual loan interest | - | 717,189 | |||||
Unused state tax credits | 332,930 | - | |||||
Contributions | 2,862 | - | |||||
| 8,397,025 | 3,994,572 | ||||||
Valuation allowance | (1,970,151 | ) | - | ||||
| 6,426,874 | 3,994,572 | ||||||
Deferred tax liabilities: | |||||||
Securities available for sale | 406,226 | 224,469 | |||||
Depreciation | 43,723 | 105,221 | |||||
| 449,949 | 329,690 | ||||||
Net deferred tax assets | $ | 5,976,925 | $ | 3,664,882 | |||
| NOTE 11. | COMMITMENTS AND CONTINGENCIES |
Loan Commitments
The Company is a party to financial instruments with off-balance sheet risk in the normal course of business to meet the financing needs of its customers. These financial instruments include commitments to extend credit and standby letters of credit. They involve, to varying degrees, elements of credit risk and interest rate risk in excess of the amount recognized in the balance sheets. The majority of all commitments to extend credit and standby letters of credit are variable rate instruments.
The Company’s exposure to credit loss in the event of nonperformance by the other party to the financial instrument for commitments to extend credit and standby letters of credit is represented by the contractual amount of those instruments. The Company uses the same credit policies in making commitments and conditional obligations as it does for on-balance sheet instruments. A summary of the Company’s commitments is as follows:
| December 31, | ||||||
| 2008 | 2007 | |||||
Commitments to extend credit | $ | 68,193,838 | $ | 75,223,974 | ||
Other standby letters of credit | 6,259,448 | 6,559,617 | ||||
| $ | 74,453,286 | $ | 81,783,591 | |||
Commitments to extend credit are agreements to lend to a customer as long as there is no violation of any condition established in the contract. Commitments generally have
B-21
NOTES TO CONSOLIDATED FINANCIAL STATEMENTS
| NOTE 11. | COMMITMENTS AND CONTINGENCIES (Continued) |
Loan Commitments (Continued)
fixed expiration dates or other termination clauses and may require payment of a fee. Since many of the commitments are expected to expire without being drawn upon, the total commitment amounts do not necessarily represent future cash requirements. The amount of collateral obtained, if deemed necessary by the Company upon extension of credit, is based on management’s credit evaluation of the party. Collateral held varies, but may include accounts receivable, inventory, property and equipment, residential real estate, and income-producing commercial properties.
Standby letters of credit are conditional commitments issued by the Company to guarantee the performance of a customer to a third party. Those guarantees are primarily issued to support public and private borrowing arrangements. The credit risk involved in issuing letters of credit is essentially the same as that involved in extending loans to customers. Collateral held varies as specified above and is required in instances which the Company deems necessary.
At December 31, 2008 and 2007, the carrying amount of liabilities related to the Company’s obligation to perform under financial standby letters of credit was insignificant. The Company has not been required to perform on any financial standby letters of credit, and the Company has not incurred any losses on financial standby letters of credit for the years ended December 31, 2008 and 2007.
Contingencies
In the normal course of business, the Company is involved in various legal proceedings. In the opinion of management, any liability resulting from such proceedings would not have a material adverse effect on the Company’s financial statements.
| NOTE 12. | CONCENTRATIONS OF CREDIT |
The Company originates primarily commercial, commercial real estate, residential real estate, and consumer loans to customers in Henry County and surrounding counties. The ability of the majority of the Company’s customers to honor their contractual loan obligations is dependent on the economy in these areas.
Ninety-five percent of the Company’s loan portfolio is concentrated in loans secured by real estate, of which a substantial portion is secured by real estate in the Company’s primary market area. Additionally, forty-nine percent of the Company’s loan portfolio is concentrated in real estate construction loans. Accordingly, the ultimate collectibility of the loan portfolio and recovery of other real estate owned are susceptible to changes in market conditions in the Company’s primary market area. The other significant concentrations of credit by type of loan are set forth in Note 3.
The Company, as a matter of policy, does not generally extend credit to any single borrower or group of related borrowers in excess of 25% of statutory capital, or approximately $12,000,000.
B-22
NOTES TO CONSOLIDATED FINANCIAL STATEMENTS
| NOTE 13. | REGULATORY MATTERS |
The Bank is subject to certain restrictions on the amount of dividends that may be declared without prior regulatory approval. At December 31, 2008, no dividends could be declared without prior regulatory approval.
The Company and the Bank are subject to various regulatory capital requirements administered by the federal banking agencies. Failure to meet minimum capital requirements can initiate certain mandatory, and possibly additional discretionary actions by regulators that, if undertaken, could have a direct material effect on the consolidated financial statements. Under capital adequacy guidelines and the regulatory framework for prompt corrective action, the Company and Bank must meet specific capital guidelines that involve quantitative measures of the assets, liabilities, and certain off-balance sheet items as calculated under regulatory accounting practices. Capital amounts and classification are also subject to qualitative judgments by the regulators about components, risk weightings, and other factors.
Quantitative measures established by regulation to ensure capital adequacy require the Company and the Bank to maintain minimum amounts and ratios of Total and Tier I capital to risk-weighted assets, as defined, and of Tier I capital to average assets, as defined. As a result of the findings of the FDIC in its most recent examination of the Bank, the Bank’s Directors entered into an informal agreement with the FDIC and Georgia Department of Banking and Finance to improve the condition of the Bank. Specifically, the agreement provides for reducing adversely classified assets, upgrading the overall quality of the loan portfolio, maintaining a Tier I leverage capital ratio of not less than 8% and a Total Risk Based capital ratio of not less than 10%, maintaining an adequate reserve for loan losses, prohibiting dividends without prior regulatory approval, improving liquidity, and adopting a revised strategic plan covering the next three years. The Bank has agreed to submit certain of these plans and programs to the regulators for review and comment. Failure to adequately address the provisions contained in the agreement may result in a formal enforcement action by the regulatory agencies. The Bank presently exceeds the capital ratios and is complying with the reporting provisions of the agreement.
As of December 31, 2008, the most recent notification from the Federal Deposit Insurance Corporation categorized the Bank as well capitalized under the regulatory framework for prompt corrective action. To be categorized as well capitalized, the Bank must maintain minimum Total risk-based, Tier I risk-based, and Tier I leverage ratios as set forth in the following table. There are no conditions or events since that notification that management believes have changed the Bank’s category. Prompt corrective action provisions are not applicable to bank holding companies.
B-23
NOTES TO CONSOLIDATED FINANCIAL STATEMENTS
| NOTE 13. | REGULATORY MATTERS (Continued) |
The Company and Bank’s actual capital amounts and ratios are presented in the following table.
| Actual | For Capital Adequacy Purposes | To Be Well Capitalized Under Prompt Corrective Action Provisions | ||||||||||||||||
| Amount | Ratio | Amount | Ratio | Amount | Ratio | |||||||||||||
| (Dollars in Thousands) | ||||||||||||||||||
As of December 31, 2008: | ||||||||||||||||||
Total Capital to Risk | ||||||||||||||||||
Weighted Assets: | ||||||||||||||||||
Consolidated | $ | 65,778 | 11.59 | % | $ | 45,408 | 8.00 | % | N/A | N/A | ||||||||
Bank | $ | 65,541 | 11.55 | % | $ | 45,396 | 8.00 | % | $ | 56,745 | 10.00 | % | ||||||
Tier I Capital to Risk | ||||||||||||||||||
Weighted Assets: | ||||||||||||||||||
Consolidated | $ | 58,554 | 10.32 | % | $ | 22,704 | 4.00 | % | N/A | N/A | ||||||||
Bank | $ | 58,317 | 10.28 | % | $ | 22,698 | 4.00 | % | $ | 34,047 | 6.00 | % | ||||||
Tier I Capital to | ||||||||||||||||||
Average Assets: | ||||||||||||||||||
Consolidated | $ | 58,554 | 8.43 | % | $ | 27,786 | 4.00 | % | N/A | N/A | ||||||||
Bank | $ | 58,317 | 8.40 | % | $ | 27,780 | 4.00 | % | $ | 34,725 | 5.00 | % | ||||||
| Actual | For Capital Adequacy Purposes | To Be Well Capitalized Under Prompt Corrective Action Provisions | ||||||||||||||||
| Amount | Ratio | Amount | Ratio | Amount | Ratio | |||||||||||||
| (Dollars in Thousands) | ||||||||||||||||||
As of December 31, 2007: | ||||||||||||||||||
Total Capital to Risk | ||||||||||||||||||
Weighted Assets: | ||||||||||||||||||
Consolidated | $ | 82,756 | 13.37 | % | $ | 49,510 | 8.00 | % | N/A | N/A | ||||||||
Bank | $ | 82,426 | 13.32 | % | $ | 49,497 | 8.00 | % | $ | 61,871 | 10.00 | % | ||||||
Tier I Capital to Risk | ||||||||||||||||||
Weighted Assets: | ||||||||||||||||||
Consolidated | $ | 75,099 | 12.13 | % | $ | 24,755 | 4.00 | % | N/A | N/A | ||||||||
Bank | $ | 74,769 | 12.08 | % | $ | 24,748 | 4.00 | % | $ | 37,123 | 6.00 | % | ||||||
Tier I Capital to | ||||||||||||||||||
Average Assets: | ||||||||||||||||||
Consolidated | $ | 75,099 | 9.89 | % | $ | 30,369 | 4.00 | % | N/A | N/A | ||||||||
Bank | $ | 74,769 | 9.85 | % | $ | 30,363 | 4.00 | % | $ | 37,953 | 5.00 | % | ||||||
B-24
NOTES TO CONSOLIDATED FINANCIAL STATEMENTS
| NOTE 14. | FAIR VALUES |
On January 1, 2008, the Company adopted Statement of Financial Accounting Standards No. 157,Fair Value Measurements (“SFAS No. 157”). SFAS No. 157 defines fair value, establishes a framework for measuring fair value, and expands disclosures about fair value measurements. SFAS No. 157 applies to reported balances that are required or permitted to be measured at fair value under existing accounting pronouncements; accordingly, the standard does not require any new fair value measurements of reported balances. On February 12, 2008, the FASB issued Staff Position 157-2 which defers the effective date of Statement 157 for certain nonfinancial assets and liabilities to fiscal years beginning after November 15, 2008 and interim periods within those fiscal years.
On October 10, 2008, the FASB issued FSP FAS 157-3, “Determining the Fair Value of a Financial Asset When the Market for that Asset Is Not Active.”This FSP clarified the application of SFAS No. 157 in a market that is not active and reiterated that the results of distressed sales or forced liquidations are not determinative when measuring fair value. It emphasized that when determining fair value, the use of management’s internal assumptions concerning future cash flows discounted at an appropriate risk-adjusted interest rate is acceptable when relevant observable market data do not exist. In some situations, multiple inputs from a variety of sources may provide the best evidence of fair value. The FSP also described how the use of broker quotes should be considered when assessing the relevance of observable and unobservable inputs. The impact of this statement is minimal, as this FSP provides clarification to existing guidance.
As defined in SFAS No. 157, fair value is the price that would be received to sell an asset or paid to transfer a liability in an orderly transaction between market participants at the measurement date. In determining fair value, the Company uses various methods including market, income and cost approaches. Based on these approaches, the Company often utilizes certain assumptions that market participants would use in pricing the asset or liability, including assumptions about market risk and/or risks inherent in the inputs to the valuation technique. These inputs can be readily observable, market corroborated, or generally unobservable inputs. The Company utilizes valuation techniques that maximize the use of observable inputs and minimize the use of unobservable inputs. Based on the observability of the inputs used in the valuation techniques the Company is required to provide the following information according to fair value hierarchy. The fair value hierarchy ranks the quality and reliability of the information used to determine fair values. Financial assets and liabilities carried at fair value will be classified and disclosed in one of the following categories:
Level 1 Quoted prices in active markets for identical assets or liabilities. Level 1 assets and liabilities include debt and equity securities traded in an active market, as well as certain U.S. Treasury and U.S. Government-sponsored enterprise debt securities that are highly liquid and are actively traded in over-the-counter markets.
Level 2 Observable inputs other than Level 1 prices such as quoted prices for similar assets and liabilities; quoted prices in markets that are not active; or other inputs that are observable or can be corroborated by observable market data for substantially the full term of the assets and liabilities. Level 2 assets and liabilities include debt securities with quoted prices that are traded less frequently than exchange-traded instruments or whose value is determined using a pricing model with inputs that are observable in the market or can be derived principally from or corroborated by observable market data.
B-25
NOTES TO CONSOLIDATED FINANCIAL STATEMENTS
| NOTE 14. | FAIR VALUES (Continued) |
Level 3 Unobservable inputs that are supported by little or no market activity and that are significant to the fair value of the assets or liabilities. Level 3 assets and liabilities include financial instruments whose value is determined using pricing models, discounted cash flow methodologies, or similar techniques, as well as instruments for which the determination of fair value requires significant management judgment or estimation.
Assets Measured at Fair Value on a Recurring Basis
Following is a description of the valuation methodologies used for instruments measured at fair value on a recurring basis and recognized in the accompanying balance sheet, as well as the general classification of such instruments pursuant to the valuation hierarchy.
Available for Sale Securities
Where quoted market prices are available in an active market, securities are classified within Level 1 of the valuation hierarchy. Level 1 securities would include highly liquid government bonds, mortgage products and exchange traded equities. If quoted market prices are not available, then fair values are estimated by using pricing models, quoted prices of securities with similar characteristics or discounted cash flows. Level 2 securities include U. S. agency securities, mortgage-backed agency securities, obligations of state and political subdivisions and certain corporate, asset backed and other securities. In certain cases where Level 1 or Level 2 inputs are not available, securities are classified within Level 3 of the hierarchy.
The following table presents financial assets measured at fair value on a recurring basis:
| Fair Value Measurements at December 31, 2008 | ||||||||||||
| Assets/Liabilities Measured at Fair Value December 31, 2008 | Quoted Prices In Active Markets for Identical Assets (Level 1) | Significant Other Observable Inputs (Level 2) | Significant Unobservable Inputs (Level 3) | |||||||||
Available for sale securities | $ | 60,455,998 | $ | 320,000 | $ | 60,135,998 | $ | - | ||||
Assets Measured at Fair Value on a Nonrecurring Basis
Following is a description of the valuation methodologies used for instruments measured at fair value on a nonrecurring basis and recognized in the accompanying balance sheet, as well as the general classification of such instruments pursuant to the valuation hierarchy.
Impaired Loans
The Company does not record loans at fair value on a recurring basis. However, from time to time, a loan is considered impaired and an allowance for loan losses is established. Once a loan is identified as individually impaired, management measures the impairment in accordance with Statement of Financial Accounting Standards No. 114, Accounting by Creditors for Impairment of a Loan (“SFAS 114’). The fair value of impaired loans is estimated using one of several methods, including the present value of
B-26
NOTES TO CONSOLIDATED FINANCIAL STATEMENTS
| NOTE 14. | FAIR VALUES (Continued) |
Assets Measured at Fair Value on a Nonrecurring Basis (Continued)
future cash flows discounted at the loan’s effective interest rate or a loan’s observable market price, or the fair value of the collateral if the loan is collateral dependent. In accordance with SFAS 114, impaired loans where an allowance is established based on fair value of collateral require classification in the fair value hierarchy.
The Company measures the fair value of collateral dependent loans based on the fair value of collateral securing these loans. These measurements are classified as Level 3 within the valuation hierarchy. All impaired loans are secured by real estate. The fair value of these real estate properties is generally determined based upon appraisals performed by a certified or licensed appraiser using inputs such as absorption rates, capitalization rates, and comparables. Management also considers other factors or recent developments which could result in adjustments to the valuation. Impaired loans are reviewed and evaluated on at least a quarterly basis for additional impairment and adjusted accordingly, based on the same factors identified above. For the year ended December 31, 2008, a nonrecurring change in fair value of $22.2 million has been recorded on those loans considered impaired at December 31, 2008.
Other Real Estate Owned
Foreclosed assets are adjusted to fair value upon transfer of the loans to other real estate owned. Subsequently, other real estate owned is carried at the lower of carrying value or fair value. Fair value is based upon independent market prices, appraised values of the collateral or management’s estimation of the value of the collateral. When the fair value of the collateral is based on an observable market price, the Company records the other real estate owned as nonrecurring Level 2. When a current appraisal is not available or management determines the fair value is further impaired below the appraised value and there is no observable market price, the Company records the other real estate owned as nonrecurring Level 3. As a result of continued deterioration in the appraised values of our other real estate owned as evidenced by current market conditions, the Company recorded additional write-downs of $2.9 million through a charge to earnings during the twelve months ending December 31, 2008.
The following table presents the assets and liabilities carried on the balance sheet by caption and by level within the FAS No. 157 valuation hierarchy (as described above) as of December 31, 2008, for which a nonrecurring change in fair value has been recorded during the year ended December 31, 2008:
| Fair Value Measurements at December 31, 2008 | ||||||||||||
| Assets/Liabilities Measured at Fair Value December 31, 2008 | Quoted Prices In Active Markets for Identical Assets (Level 1) | Significant Other Observable Inputs (Level 2) | Significant Unobservable Inputs (Level 3) | |||||||||
Impaired loans | $ | 71,936,348 | $ | - | $ | - | $ | 71,936,348 | ||||
Other real estate owned | $ | 18,397,754 | $ | - | $ | - | $ | 18,397,754 | ||||
B-27
NOTES TO CONSOLIDATED FINANCIAL STATEMENTS
| NOTE 14. | FAIR VALUES (Continued) |
Fair Values of Financial Instruments
In February, 2007, the FASB issued SFAS No. 159,The Fair Value Option for Financial Assets and Financial Liabilities, including an amendment of FASB Statement No. 115.SFAS No. 159 allows companies to report selected financial assets and liabilities at fair value. The changes in fair value are recognized in earnings and the assets and liabilities measured under this methodology are required to be displayed separately on the balance sheet. While SFAS No. 159 became effective for the Company beginning January 1, 2008, the Company has not elected the fair value option that is offered by this statement.
The fair value of a financial instrument is the current amount that would be exchanged between willing parties, other than in a forced liquidation. Fair value is best determined based upon quoted market prices. However, in many instances, there are no quoted market prices for the Company’s various financial instruments. In cases where quoted market prices are not available, fair value is based on discounted cash flows or other valuation techniques. These techniques are significantly affected by the assumptions used, including the discount rate and estimates of future cash flows. Accordingly, the fair value estimates may not be realized in an immediate settlement of the instrument. FASB Statement No. 107,Disclosures about Fair Value of Financial Instruments, excludes certain financial instruments from its disclosure requirements. Accordingly, the aggregate fair value amounts presented may not necessarily represent the underlying fair value of the Company.
The following methods and assumptions were used by the Company in estimating the fair value of its financial instruments:
Cash, Due From Banks, Interest-bearing Deposits in Banks and Federal Funds Sold: The carrying amount of cash, due from banks, interest-bearing deposits in banks and federal funds sold approximates fair values.
Securities: Fair values of securities are based on available quoted market prices. The carrying values of equity securities with no readily determinable fair value approximate fair values.
Loans and Loans Held For Sale: The carrying amount of variable-rate loans that reprice frequently and have no significant change in credit risk approximates fair value. The fair value of fixed-rate loans is estimated based on discounted contractual cash flows, using interest rates currently being offered for loans with similar terms to borrowers with similar credit quality. The fair value of impaired loans is estimated based on discounted contractual cash flows or underlying collateral values, where applicable. The carrying amounts of loans held for sale approximate fair value.
Deposits: The carrying amount of demand deposits, savings deposits, and variable-rate certificates of deposit approximates fair value. The fair value of fixed-rate certificates of deposit is estimated based on discounted contractual cash flows using interest rates currently being offered for certificates of similar maturities.
Repurchase Agreements and Other Borrowings: The carrying amount of variable rate borrowings and securities sold under repurchase agreements approximate fair
B-28
NOTES TO CONSOLIDATED FINANCIAL STATEMENTS
| NOTE 14. | FAIR VALUES (Continued) |
Fair Values of Financial Instruments (Continued)
value. The fair value of fixed rate other borrowings are estimated based on discounted contractual cash flows using the current incremental borrowing rates for similar type borrowing arrangements.
Accrued Interest: The carrying amounts of accrued interest approximates their fair value.
Off-Balance Sheet Instruments: The carrying amount of commitments to extend credit and standby letters of credit approximates fair value and is not significant. The carrying amount of the off-balance sheet financial instruments is based on fees charged to enter into such agreements.
The carrying amount and estimated fair value of the Company’s financial instruments were as follows:
| December 31, 2008 | December 31, 2007 | |||||||||||
| Carrying Amount | Fair Value | Carrying Amount | Fair Value | |||||||||
Financial assets: | ||||||||||||
Cash and due from banks, interest-bearing deposits in banks and federal funds sold | $ | 29,838,959 | $ | 29,838,959 | $ | 29,058,223 | $ | 29,058,223 | ||||
Securities available for sale | 60,455,998 | 60,455,998 | 87,717,716 | 87,717,716 | ||||||||
Securities held to maturity | 3,360,711 | 3,349,682 | 4,164,690 | 4,143,401 | ||||||||
Restricted equity securities | 1,643,251 | 1,643,251 | 1,897,751 | 1,897,751 | ||||||||
Loans held for sale | - | - | 950,405 | 950,405 | ||||||||
Loans, net | 515,878,149 | 520,205,733 | 561,730,164 | 563,021,108 | ||||||||
Accrued interest receivable | 3,164,328 | 3,164,328 | 7,155,919 | 7,155,919 | ||||||||
Financial liabilities: | ||||||||||||
Deposits | 590,476,625 | 599,314,687 | 625,851,121 | 629,444,479 | ||||||||
Other borrowings | 2,598,266 | 2,600,000 | 13,424,498 | 13,600,000 | ||||||||
Accrued interest payable | 2,701,015 | 2,701,015 | 3,446,182 | 3,446,182 | ||||||||
B-29
NOTES TO CONSOLIDATED FINANCIAL STATEMENTS
| NOTE 15. | SUPPLEMENTAL SEGMENT INFORMATION |
The Company has two reportable segments: commercial banking and mortgage loan origination. The commercial banking segment provides traditional banking services offered through the Bank. The mortgage loan origination segment provides mortgage loan origination services offered through First Metro.
The accounting policies of the segments are the same as those described in the summary of significant accounting policies. The Company evaluates performance based on profit and loss from operations before income taxes not including nonrecurring gains and losses.
The Company accounts for intersegment revenues and expenses as if the revenue/expense transactions were to third parties, that is, at current market prices.
The Company’s reportable segments are strategic business units that offer different products and services. They are managed separately because each segment has different types and levels of credit and interest rate risk.
| INDUSTRY SEGMENTS | ||||||||||||||||||||
For the Year Ended December 31, 2008 | Commercial Banking | Mortgage | All Other | Eliminations | Total | |||||||||||||||
Interest income | $ | 35,436,579 | $ | 8,204 | $ | - | $ | (35,035 | ) | $ | 35,409,748 | |||||||||
Interest expense | 19,636,646 | 26,831 | - | (35,035 | ) | 19,628,442 | ||||||||||||||
Net interest income (expense) | 15,799,933 | (18,627 | ) | - | - | 15,781,306 | ||||||||||||||
Intersegment net interest income (expense) | 18,627 | (18,627 | ) | - | - | - | ||||||||||||||
Other revenue from all sources | 2,418,540 | 377,325 | 12,900 | - | 2,808,765 | |||||||||||||||
Intersegment other revenues (expenses) | 24,840 | (24,840 | ) | - | - | - | ||||||||||||||
Depreciation | 672,737 | 345 | 6,244 | - | 679,326 | |||||||||||||||
Provision for loan losses | 24,285,750 | - | - | - | 24,285,750 | |||||||||||||||
Segment loss | (20,622,466 | ) | (244,410 | ) | (51,482 | ) | - | (20,918,358 | ) | |||||||||||
Segment assets | 656,245,974 | 634,887 | 250,388 | (1,253,775 | ) | 655,877,474 | ||||||||||||||
Expenditures for premises and equipment | 114,442 | - | - | - | 114,442 | |||||||||||||||
| INDUSTRY SEGMENTS | ||||||||||||||||||
For the Year Ended December 31, 2007 | Commercial Banking | Mortgage | All Other | Eliminations | Total | |||||||||||||
Interest income | $ | 51,637,930 | $ | 17,133 | $ | - | $ | (78,173 | ) | $ | 51,576,890 | |||||||
Interest expense | 26,323,568 | 61,040 | - | (78,173 | ) | 26,306,435 | ||||||||||||
Net interest income (expense) | 25,314,362 | (43,907 | ) | - | - | 25,270,455 | ||||||||||||
Intersegment net interest income (expense) | 43,907 | (43,907 | ) | - | - | - | ||||||||||||
Other revenue from all sources | 2,437,321 | 600,346 | 12,600 | - | 3,050,267 | |||||||||||||
Intersegment other revenues (expenses) | 24,840 | (24,840 | ) | - | - | - | ||||||||||||
Depreciation | 670,723 | 579 | 6,244 | - | 677,546 | |||||||||||||
Provision for loan losses | 2,959,254 | - | - | - | 2,959,254 | |||||||||||||
Segment profit (loss) | 13,787,632 | (197,525 | ) | (45,971 | ) | - | 13,544,136 | |||||||||||
Segment assets | 719,528,021 | 1,740,446 | 381,964 | (2,654,382 | ) | 718,996,049 | ||||||||||||
Expenditures for premises and equipment | 1,082,791 | - | - | - | 1,082,791 | |||||||||||||
B-30
NOTES TO CONSOLIDATED FINANCIAL STATEMENTS
| NOTE 15. | SUPPLEMENTAL SEGMENT INFORMATION (Continued) |
| INDUSTRY SEGMENTS | ||||||||||||||||||
For the Year Ended December 31, 2006 | Commercial Banking | Mortgage | All Other | Eliminations | Total | |||||||||||||
Interest income | $ | 48,369,210 | $ | 16,857 | $ | - | $ | (74,373 | ) | $ | 48,311,694 | |||||||
Interest expense | 20,515,325 | 57,516 | - | (74,373 | ) | 20,498,468 | ||||||||||||
Net interest income (expense) | 27,853,885 | (40,659 | ) | - | - | 27,813,226 | ||||||||||||
Intersegment net interest income (expense) | 40,659 | (40,659 | ) | - | - | - | ||||||||||||
Other revenue from all sources | 2,604,371 | 703,566 | 12,600 | - | 3,320,537 | |||||||||||||
Intersegment other revenues (expenses) | 24,840 | (24,840 | ) | - | - | - | ||||||||||||
Depreciation | 592,515 | 1,209 | 7,662 | - | 601,386 | |||||||||||||
Provision for loan losses | 476,860 | - | - | - | 476,860 | |||||||||||||
Segment profit (loss) | 20,258,542 | (179,419 | ) | (60,748 | ) | - | 20,018,375 | |||||||||||
Segment assets | 695,051,272 | 1,583,299 | 1,130,481 | (3,654,236 | ) | 694,310,816 | ||||||||||||
Expenditures for premises and equipment | 1,495,921 | - | - | - | 1,495,921 | |||||||||||||
| NOTE 16. | PARENT COMPANY FINANCIAL INFORMATION |
The following information presents the condensed balance sheets as of December 31, 2008 and 2007 and statements of operations and cash flows for Henry County Bancshares, Inc. for the years ended December 31, 2008, 2007 and 2006.
| CONDENSED BALANCE SHEETS | ||||||
| December 31, | ||||||
| 2008 | 2007 | |||||
Assets | ||||||
Cash | $ | 89,535 | $ | 216,999 | ||
Investment in subsidiaries | 59,105,402 | 75,204,573 | ||||
Premises and equipment | 140,940 | 147,184 | ||||
Other assets | 19,913 | 17,780 | ||||
Total assets | $ | 59,355,790 | $ | 75,586,536 | ||
Liabilities and Stockholders’ Equity | ||||||
Other liabilities | $ | 13,139 | $ | 52,394 | ||
Stockholders’ equity | 59,342,651 | 75,534,142 | ||||
| Total liabilities and stockholders’ equity | $ | 59,355,790 | $ | 75,586,536 | ||
B-31
NOTES TO CONSOLIDATED FINANCIAL STATEMENTS
| NOTE 16. | PARENT COMPANY FINANCIAL INFORMATION (Continued) |
CONDENSED STATEMENTS OF OPERATIONS
| Years Ended December 31, | ||||||||||||
| 2008 | 2007 | 2006 | ||||||||||
Income | ||||||||||||
Dividends from bank subsidiary | $ | 2,136,854 | $ | 4,255,961 | $ | 4,434,044 | ||||||
Rental income | 12,900 | 12,600 | 12,600 | |||||||||
| 2,149,754 | 4,268,561 | 4,446,644 | ||||||||||
Expense | ||||||||||||
Depreciation | 6,244 | 6,244 | 7,662 | |||||||||
Other expenses | 58,139 | 52,326 | 65,686 | |||||||||
Total expenses | 64,383 | 58,570 | 73,348 | |||||||||
Income before income tax benefits and equity in undistributed income (loss) of subsidiaries | 2,085,371 | 4,209,991 | 4,373,296 | |||||||||
Income tax benefits | (19,913 | ) | (17,780 | ) | (23,497 | ) | ||||||
Income before undistributed income (loss) of subsidiaries | 2,105,284 | 4,227,771 | 4,396,793 | |||||||||
Equity in undistributed income (loss) of subsidiaries | (16,451,995 | ) | 4,480,955 | 8,012,499 | ||||||||
Net income (loss) | $ | (14,346,711 | ) | $ | 8,708,726 | $ | 12,409,292 | |||||
CONDENSED STATEMENTS OF CASH FLOWS
| Years Ended December 31, | ||||||||||||
| 2008 | 2007 | 2006 | ||||||||||
OPERATING ACTIVITIES | ||||||||||||
Net income (loss) | $ | (14,346,711 | ) | $ | 8,708,726 | $ | 12,409,292 | |||||
Adjustments to reconcile net income (loss) to net cash provided by operating activities: | ||||||||||||
Depreciation | 6,244 | 6,244 | 7,662 | |||||||||
Undistributed (income) loss of subsidiaries | 16,451,995 | (4,480,955 | ) | (8,012,499 | ) | |||||||
Net other operating activities | (41,388 | ) | (2,361 | ) | 38,313 | |||||||
Net cash provided by operating activities | 2,070,140 | 4,231,654 | 4,442,768 | |||||||||
FINANCING ACTIVITIES | ||||||||||||
Dividends paid | (2,136,854 | ) | (4,005,960 | ) | (4,434,044 | ) | ||||||
Reissuance of treasury stock | — | 131,247 | 235,300 | |||||||||
Purchase of treasury stock | (60,750 | ) | (1,093,500 | ) | — | |||||||
Net cash used in financing activities | (2,197,604 | ) | (4,968,213 | ) | (4,198,744 | ) | ||||||
Net increase (decrease) in cash | (127,464 | ) | (736,559 | ) | 244,024 | |||||||
Cash at beginning of year | 216,999 | 953,558 | 709,534 | |||||||||
Cash at end of year | $ | 89,535 | $ | 216,999 | $ | 953,558 | ||||||
B-32
APPENDIX C
PERFORMANCE GRAPH
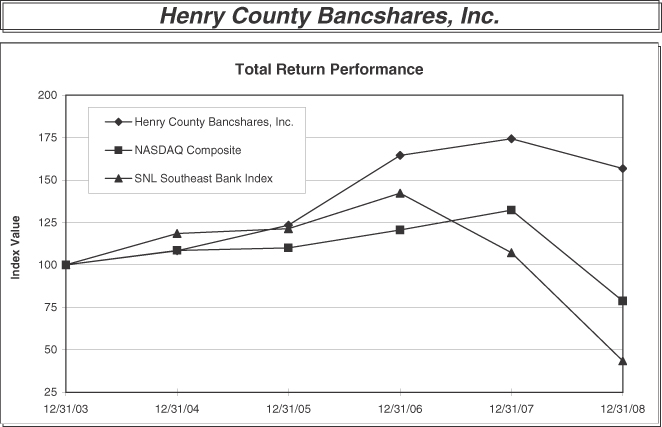
| Period Ending | ||||||||||||
Index | 12/31/03 | 12/31/04 | 12/31/05 | 12/31/06 | 12/31/07 | 12/31/08 | ||||||
Henry County Bancshares, Inc. | 100.00 | 108.38 | 123.47 | 164.51 | 174.32 | 156.84 | ||||||
NASDAQ Composite | 100.00 | 108.59 | 110.08 | 120.56 | 132.39 | 78.72 | ||||||
SNL Southeast Bank Index | 100.00 | 118.59 | 121.39 | 142.34 | 107.23 | 43.41 | ||||||
The graph presented above compares the cumulative total stockholder return on Henry County Bancshares, Inc.’s common stock to the cumulative total return of the NASDAQ Composite and the SNL Southeast Bank Index for the five fiscal years, which commenced January 1, 2004 and ended December 31, 2008. The cumulative total stockholder return assumes the investment of $100 in Henry County Bancshares, Inc.’s common stock and in each index on December 31, 2003 and assumes reinvestment of dividends. Because the Company’s stock is not listed on any exchange and there is no established public trading market, the stock price used for this graph is based solely on the limited information voluntarily furnished to management concerning known private transactions occurring in 2008. The Company, therefore, makes no representations the stock price, which is solely based on this limited information, accurately reflects the actual fair market value of the Company’s common stock. The NASDAQ Composite Index is a publicly available measure of over 3,000 companies including NASDAQ domestic and international based common type stocks listed on The Nasdaq Stock Market. The SNL Southeast Bank Index is a compilation of the total stockholder return of all publicly-traded bank holding companies headquartered in the Southeastern United States.
C-1
PROXY SOLICITED FOR ANNUAL MEETING OF SHAREHOLDERS OF
HENRY COUNTY BANCSHARES, INC.
TO BE HELD ON APRIL 21, 2009
THIS PROXY IS SOLICITED ON BEHALF OF THE BOARD OF DIRECTORS.
The undersigned hereby constitutes and appoints David H. Gill and William C. Strom, Jr., and each of them, his or her true and lawful agents and proxies with full power of substitution in each, to represent and vote, as indicated below, all of the shares of common stock of Henry County Bancshares, Inc. that the undersigned would be entitled to vote at the Annual Meeting of Shareholders of the Company to be held at 4806 N. Henry Boulevard, Stockbridge, Georgia 30281, on April 21, 2009 at 6:30 p.m. local time, and at any adjournment, upon the matters described in the accompanying Notice of Annual Meeting of Shareholders and Proxy Statement, receipt of which is acknowledged. These proxies are directed to vote on the matters described in the Notice of Annual Meeting of Shareholders and Proxy Statement as follows:
This proxy, when properly executed, will be voted in the manner directed herein by the undersigned shareholder. If no direction is made, this proxy will be voted: (i) “FOR” Proposal No. 1 to elect the eleven identified directors to serve on the Board of Directors each for a one year term.
1. PROPOSAL to elect the eleven identified directors to serve for a one year term.
Paul J. Cates, Jr. | Edwin C. Kelley, Jr. | Ronald M. Turpin | ||
H. K. Elliott, Jr. | Mary Lynn E. Lambert | James C. Waggoner | ||
G. R. Foster, III | Robert O. Linch | Phillip H. Cook | ||
David H. Gill | William C. Strom, Jr. |
¨ | FOR all nominees listed (except as marked to the contrary) | ¨ | WITHHOLD AUTHORITY to vote for all nominees |
INSTRUCTION: To withhold authority to vote for any individual nominee(s), write that nominees’ name(s) in the space provided below.
Dated: , 2009 |
Signature of Shareholder |
Please print name |
Signature of Shareholder |
Please print name |
Please sign exactly as name or names appear on your stock certificate. Where more than one owner is shown on your stock certificate, each owner should sign. Persons signing in a fiduciary or representative capacity shall give full title. If a corporation, please sign in full corporate name by authorized officer. If a partnership, please sign in partnership name by authorized person.