Exhibit 99.(c)(3)
Link to searchable text of slide shown above
Link to searchable text of slide shown above

Link to searchable text of slide shown above

Link to searchable text of slide shown above
Link to searchable text of slide shown above

Link to searchable text of slide shown above

Link to searchable text of slide shown above
Link to searchable text of slide shown above

Link to searchable text of slide shown above
Link to searchable text of slide shown above
Link to searchable text of slide shown above

Link to searchable text of slide shown above
Link to searchable text of slide shown above

Link to searchable text of slide shown above

Link to searchable text of slide shown above

Link to searchable text of slide shown above
Link to searchable text of slide shown above
Link to searchable text of slide shown above
Link to searchable text of slide shown above

Link to searchable text of slide shown above

Link to searchable text of slide shown above
Link to searchable text of slide shown above
Link to searchable text of slide shown above
Link to searchable text of slide shown above
Link to searchable text of slide shown above
Link to searchable text of slide shown above
Link to searchable text of slide shown above

Link to searchable text of slide shown above
Link to searchable text of slide shown above
Link to searchable text of slide shown above

Link to searchable text of slide shown above
Link to searchable text of slide shown above
Link to searchable text of slide shown above
Link to searchable text of slide shown above

Link to searchable text of slide shown above

Link to searchable text of slide shown above

Link to searchable text of slide shown above

Link to searchable text of slide shown above

Link to searchable text of slide shown above
Link to searchable text of slide shown above
Link to searchable text of slide shown above

Link to searchable text of slide shown above

Link to searchable text of slide shown above
Link to searchable text of slide shown above
Link to searchable text of slide shown above

Link to searchable text of slide shown above
Searchable text section of graphics shown above
Project Heron
Presentation to the Board of Directors
PRELIMINARY | SUBJECT TO FURTHER REVIEW AND EVALUATION
October 30, 2005
DRAFT
THESE MATERIALS MAY NOT BE USED OR RELIED UPON FOR ANY PURPOSE OTHER THAN AS SPECIFICALLY CONTEMPLATED BY A WRITTEN AGREEMENT WITH CREDIT SUISSE FIRST BOSTON AND MORGAN STANLEY.
Table of Contents
| |||
|
|
| |
| |||
|
| ||
|
| ||
|
|
| |
| |||
|
|
| |
| |||
| |||
| |||
| |||
1
2
Initial September 1 Offer
• On September 1, 2005, the Neptune CEO transmitted a written letter to the chair of the independent committee of the Heron Board
• $40 per share in cash via merger
• No diligence or financing contingencies
• Willing to condition merger on approval of a majority of the public shares
• Body of offer letter:
“In connection with the Heron Board’s consideration of the serious issues Heron faces, you inquired of our plans for our investment in the Company, including specifically whether we had any interest at this time in acquiring the outstanding shares in the Company that we do not already own. We advised you that absent additional due diligence we would not be able to assess any potential change in our position in the Company but that we would be willing to undertake such due diligence if that were acceptable to the Independent Directors. With your agreement we have conducted our due diligence and we now have a deeper understanding of the Company and the pending situation. As Heron’s largest shareholder, Heron’s current situation is naturally a matter of concern to us, and so we have considered how we can best protect our investment in the Company. As is evident from Neptune’s long history with Heron, we have no intention of selling our interest.
Based on our due diligence review, we have concluded that the best result for all concerned, including Heron, its shareholders and Neptune, would be for Neptune to acquire the shares in Heron that it does not already own. We believe that Heron, as a wholly-owned subsidiary of Neptune, would be better positioned to deal with the legal, regulatory and business issues that it is facing. Despite the challenges facing Heron’s vaccine business today, the acquisition would enable us to build a strategic platform in vaccines. Heron’s public shareholders would benefit from such a transaction as it would provide them with an immediate premium for their shares and eliminate their investment risk.
Accordingly, we are pleased to propose a transaction in which Neptune would enter into a cash merger agreement pursuant to which the public shareholders of Heron would receive $40.00 per share in cash. This price represents a 12% premium to Heron’s one week weighted average closing price. As an indication of our confidence that this transaction will be well received by Heron’s public shareholders, Neptune is willing to condition the merger on the approval of a majority of the public shares.
Of course, our proposal is subject to the approval of the Independent Directors and to the execution of definitive documentation. We are prepared to move quickly and to negotiate a customary merger agreement with Heron’s Independent Directors and its advisors. We have substantially completed our due diligence work and our merger terms will not include any due diligence or financing conditions, but only customary and usual closing conditions. We do not anticipate any significant obstacles to negotiating and consummating a mutually beneficial transaction promptly.
As I am sure you appreciate, consistent with our obligations under the U.S. federal securities laws, this letter will become publicly available when we forthwith file it with an amendment to our Schedule 13D.”
3
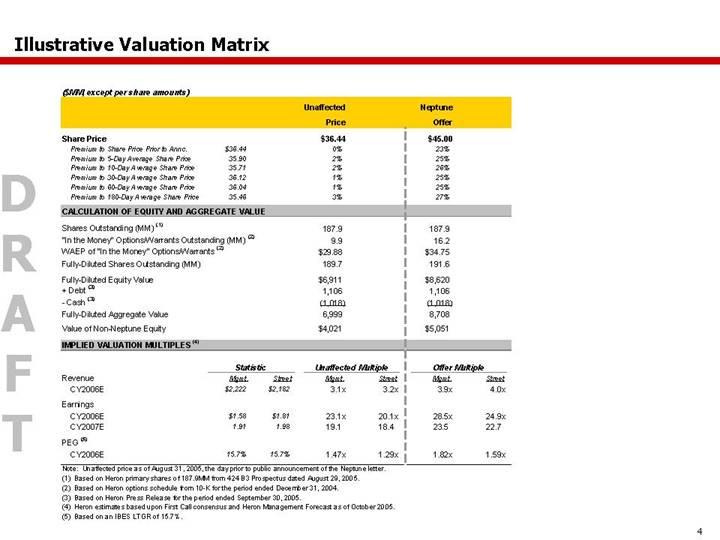
Illustrative Valuation Matrix
($MM, except per share amounts)
|
|
|
|
|
| Unaffected |
|
|
| Neptune |
|
|
| ||||
|
|
|
|
|
| Price |
|
|
| Offer |
|
|
| ||||
Share Price |
|
|
|
|
| $ | 36.44 |
|
|
| $ | 45.00 |
|
|
| ||
Premium to Share Price Prior to Annc. |
| $ | 36.44 |
|
|
| 0 | % |
|
| 23 | % |
|
| |||
Premium to 5-Day Average Share Price |
| 35.90 |
|
|
| 2 | % |
|
| 25 | % |
|
| ||||
Premium to 10-Day Average Share Price |
| 35.71 |
|
|
| 2 | % |
|
| 26 | % |
|
| ||||
Premium to 30-Day Average Share Price |
| 36.12 |
|
|
| 1 | % |
|
| 25 | % |
|
| ||||
Premium to 60-Day Average Share Price |
| 36.04 |
|
|
| 1 | % |
|
| 25 | % |
|
| ||||
Premium to 180-Day Average Share Price |
| 35.46 |
|
|
| 3 | % |
|
| 27 | % |
|
| ||||
|
|
|
|
|
|
|
|
|
|
|
|
|
| ||||
CALCULATION OF EQUITY AND AGGREGATE VALUE |
|
|
|
|
|
|
|
|
|
|
|
|
| ||||
|
|
|
|
|
|
|
|
|
|
|
|
|
| ||||
Shares Outstanding (MM) (1) |
|
|
|
|
| 187.9 |
|
|
| 187.9 |
|
|
| ||||
“In the Money” Options/Warrants Outstanding (MM) (2) |
|
|
|
|
| 9.9 |
|
|
| 16.2 |
|
|
| ||||
WAEP of “In the Money” Options/Warrants (2) |
|
|
|
|
| $ | 29.88 |
|
|
| $ | 34.75 |
|
|
| ||
Fully-Diluted Shares Outstanding (MM) |
|
|
|
|
| 189.7 |
|
|
| 191.6 |
|
|
| ||||
|
|
|
|
|
|
|
|
|
|
|
|
|
| ||||
Fully-Diluted Equity Value |
|
|
|
|
| $ | 6,911 |
|
|
| $ | 8,620 |
|
|
| ||
+ Debt (3) |
|
|
|
|
| 1,106 |
|
|
| 1,106 |
|
|
| ||||
- Cash (3) |
|
|
|
|
| (1,018 | ) |
|
| (1,018 | ) |
|
| ||||
Fully-Diluted Aggregate Value |
|
|
|
|
| 6,999 |
|
|
| 8,708 |
|
|
| ||||
Value of Non-Neptune Equity |
|
|
|
|
| $ | 4,021 |
|
|
| $ | 5,051 |
|
|
| ||
|
|
|
|
|
|
|
|
|
|
|
|
|
| ||||
IMPLIED VALUATION MULTIPLES (4) |
|
|
|
|
|
|
|
|
|
|
|
|
| ||||
|
|
|
|
|
|
|
|
|
|
|
|
|
| ||||
|
| Statistic |
| Unaffected Multiple |
| Offer Multiple |
| ||||||||||
|
| Mgmt. |
| Street |
| Mgmt. |
| Street |
| Mgmt. |
| Street |
| ||||
Revenue |
|
|
|
|
|
|
|
|
|
|
|
|
| ||||
CY2006E |
| $ | 2,222 |
| $ | 2,182 |
| 3.1 | x | 3.2 | x | 3.9 | x | 4.0 | x | ||
|
|
|
|
|
|
|
|
|
|
|
|
|
| ||||
Earnings |
|
|
|
|
|
|
|
|
|
|
|
|
| ||||
CY2006E |
| $ | 1.58 |
| $ | 1.81 |
| 23.1 | x | 20.1 | x | 28.5 | x | 24.9 | x | ||
CY2007E |
| 1.91 |
| 1.98 |
| 19.1 |
| 18.4 |
| 23.5 |
| 22.7 |
| ||||
|
|
|
|
|
|
|
|
|
|
|
|
|
| ||||
PEG (5) |
|
|
|
|
|
|
|
|
|
|
|
|
| ||||
CY2006E |
| 15.7 | % | 15.7 | % | 1.47 | x | 1.29 | x | 1.82 | x | 1.59 | x | ||||
Note: Unaffected price as of August 31, 2005, the day prior to public announcement of the Neptune letter.
(1) Based on Heron primary shares of 187.9MM from 424 B3 Prospectus dated August 29, 2005.
(2) Based on Heron options schedule from 10-K for the period ended December 31, 2004.
(3) Based on Heron Press Release for the period ended September 30, 2005.
(4) Heron estimates based upon First Call consensus and Heron Management Forecast as of October 2005.
(5) Based on an IBES LTGR of 15.7%.
4
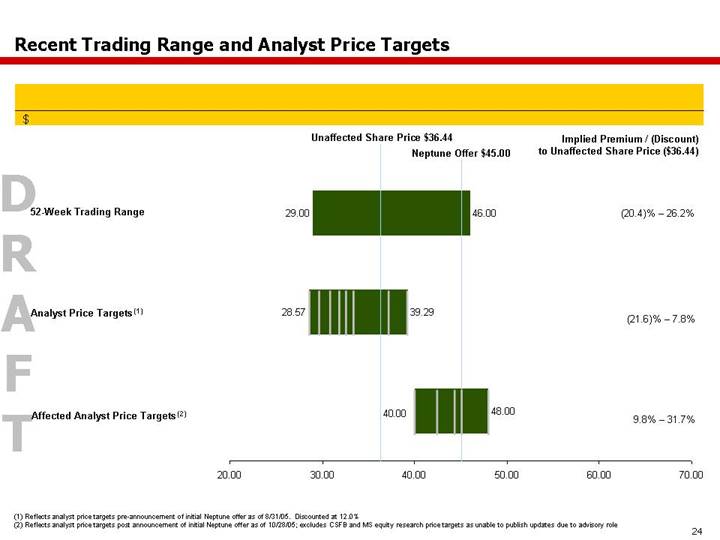
Recent Trading Range and Analyst Price Targets
$
|
| Implied Premium / (Discount) |
|
52-Week Trading Range |
| (20.4)% – 26.2% |
|
|
|
|
|
Analyst Price Targets (1) | [CHART] | (21.6)% – 7.8% |
|
|
|
|
|
Affected Analyst Price Targets (2) |
| 9.8% – 31.7% |
|
(1) Reflects analyst price targets pre-announcement of initial Neptune offer as of 8/31/05. Discounted at 12.0%
(2) Reflects analyst price targets post announcement of initial Neptune offer as of 10/28/05; excludes CSFB and MS equity research price targets as unable to publish updates due to advisory role
5
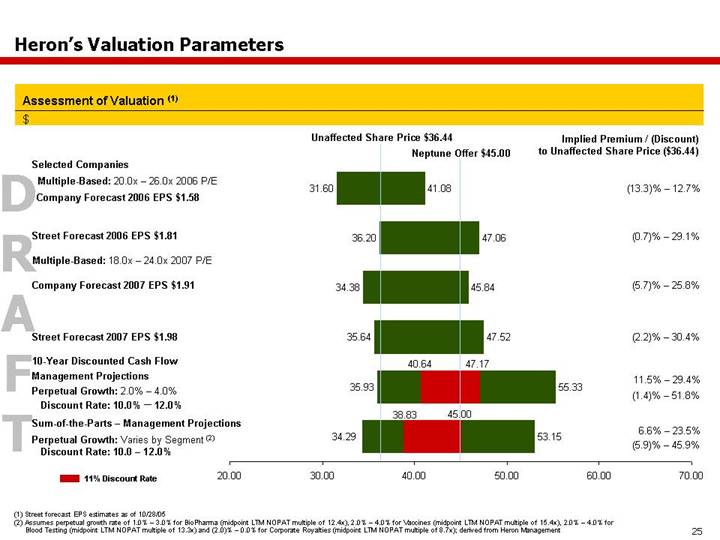
Heron’s Valuation Parameters
Assessment of Valuation (1)
$
|
| Implied Premium / (Discount) |
|
Selected Companies |
|
|
|
|
|
|
|
Multiple-Based: 20.0x – 26.0x 2006 P/E |
|
|
|
Company Forecast 2006 EPS $1.58 |
| (13.3)% – 12.7% |
|
|
|
|
|
Street Forecast 2006 EPS $1.81 |
| (0.7)% – 29.1% |
|
|
|
|
|
Multiple-Based: 18.0x – 24.0x 2007 P/E |
|
|
|
|
|
|
|
Company Forecast 2007 EPS $1.91 |
| (5.7)% – 25.8% |
|
| [CHART] |
|
|
Street Forecast 2007 EPS $1.98 |
| (2.2)% – 30.4% |
|
|
|
|
|
10-Year Discounted Cash Flow |
|
|
|
Perpetual Growth: 2.0% – 4.0% |
| 11.5% – 29.4% |
|
|
|
|
|
Sum-of-the-Parts – Management Projections |
|
|
|
|
|
|
|
Perpetual Growth: Varies by Segment (2) |
| 6.6% – 23.5% |
|
(1) Street forecast EPS estimates as of 10/28/05
(2) Assumes perpetual growth rate of 1.0% – 3.0% for BioPharma (midpoint LTM NOPAT multiple of 12.4x), 2.0% – 4.0% for Vaccines (midpoint LTM NOPAT multiple of 15.4x), 2.0% – 4.0% for Blood Testing (midpoint LTM NOPAT multiple of 13.3x) and (2.0)% – 0.0% for Corporate Royalties (midpoint LTM NOPAT multiple of 8.7x); derived from Heron Management
6
A. Update on Heron Business Situation
7
Heron Business Update - Post-Neptune Offer on Sep 1
Heron Financial Update - 3rd Quarter 2005
Business Review
• On 10/25, Heron announced initiation of phase I/II study of influenza cell culture vaccine in the United States
• On 10/17, Heron announced that it had received all approvals and clearance for FLUVIRIN from the FDA and MHRA, and that it had begun shipment of FLUVIRIN to U.S. customers
• Heron stated to the street that the total number of FLUVIRIN vaccine doses it will produce for the 2005-2006 influenza season will be below its previously stated range of 18-26M doses, due to production delays related to remediation as well as lower output associated with adaptation to new processes and procedures implemented in remediation
• Accordingly, Heron also noted that it expects its financial results to be below its previously stated guidance
• In its 3rd quarter earnings call, Heron indicated that it would have capacity to produce 40M doses for the 2006/07 season
• On 10/13, Heron and Xoma announced initiation of phase I clinical trials for CHIR-12.12 in multiple myeloma
• On 10/5, Heron and Nektar announced initiation of a phase III trial evaluating tobramycin inhalation powder (TIP) in the treatment of lung infections caused by Psuedomonas aeruginosa in cystic fibrosis patients
• On 10/5 Gen-Probe announced that the FDA had informed Heron’s partner, Gen-Probe, that it considered the PROCLEIX TIGRIS system “not substantially equivalent” to the PROCLEIX Enhanced Semi-Automated System for screening donated human blood with the PROCLEIX ULTRIO Assay
• Gen-Probe has discussed this determination with the FDA and is scheduling a series of meetings to resolve the issues
• Heron has stated that it continues to expect approval of PROCLEIX TIGRIS during 1H:06
• PROCLEIX ULTRIO Assay BLA likely to be delayed into 2006 as well
Financial Review
• Biopharma: Net product sales increased 4% from the comparable year-ago period to $137 million, driven principally by TOBI and Betaseron offset by a decline in Proleukin sales. Generally in-line with Street expectations.
• Vaccines: Net product sales were generally lower than Street expectations due to the fact that most analysts did not adjust for the suspension in Begrivac sales in 2005. Net product sales were $153 million, a decrease of 12% from the comparable year-ago period due principally to no Begrivac sales offset by strong sales in most other vaccine lines.
• Blood Testing: Generally in-line with guidance and expectations. Revenues were $138 million, a decrease of 2% from the comparable year-ago period, driven principally by the introduction of PROCLEIX ULTRIO and PROCLEIX TIGRIS into a number of ex-U.S. markets and an increase in donations in the United States.
8
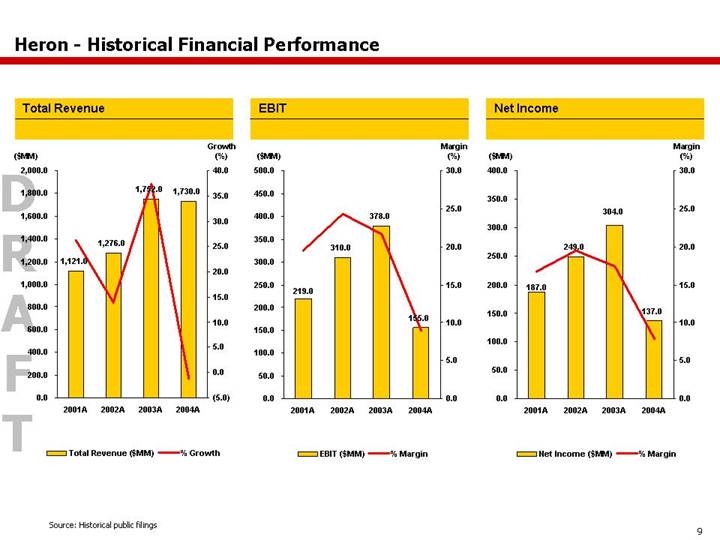
Heron - Historical Financial Performance
Total Revenue
[CHART]
EBIT
[CHART]
Net Income
[CHART]
Source: Historical public filings
9
Financial Projection Overview
• Heron management has developed its forecast using customary biotechnology financial analysis providing for probabilities of success based on stage of development of individual product candidates
• Only product candidates in clinical development were modeled
• During 1H:05, CSFB and Morgan Stanley conducted a series of meetings with Heron management to diligence projections for the consolidated Company and its major lines of business
• Management presented the projections to the Board of Heron
• Since then, Heron’s business forecast has changed and accordingly additional changes to the management forecast were provided to CSFB and Morgan Stanley
• Revenues from the vaccines business were further reduced due to Begrivac vaccine contamination issues in the summer 2005
• Overall forecast for biopharma were further reduced due to PULMUNIQ setback and increased competition against Proleukin
• CSFB and Morgan Stanley have continued to conduct diligence meetings with Heron
10
Heron Management Forecast - Revenue Contribution
Total Revenue
2006
$2,222MM
[CHART]
2006 Revenues
Biopharma: |
| $ | 612MM |
|
Vaccines: |
| $ | 921MM |
|
Blood Testing: |
| $ | 609MM |
|
Corporate: |
| $ | 81MM |
|
2009
$3,184MM
[CHART]
2009 Revenues
Biopharma: |
| $ | 852MM |
|
Vaccines: |
| $ | 1,340MM |
|
Blood Testing: |
| $ | 887MM |
|
Corporate: |
| $ | 105MM |
|
2012
$4,254MM
[CHART]
2012 Revenues
Biopharma: |
| $ | 1,450MM |
|
Vaccines: |
| $ | 1,710MM |
|
Blood Testing: |
| $ | 1,008MM |
|
Corporate: |
| $ | 85MM |
|
Source: Heron Management Forecast as of October 2005.
11
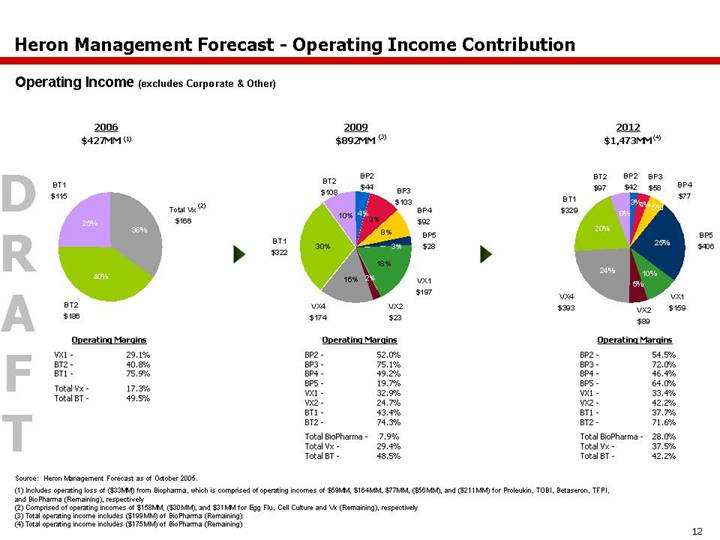
Heron Management Forecast - Operating Income Contribution
Operating Income (excludes Corporate & Other)
2006
$427MM (1)
[CHART]
Operating Margins
VX1 - |
| 29.1 | % |
BT2 - |
| 40.8 | % |
BT1 - |
| 75.9 | % |
|
|
|
|
Total Vx - |
| 17.3 | % |
Total BT - |
| 49.5 | % |
2009
$892MM (3)
[CHART]
Operating Margins
BP2 - |
| 52.0 | % |
BP3 - |
| 75.1 | % |
BP4 - |
| 49.2 | % |
BP5 - |
| 19.7 | % |
VX1 - |
| 32.9 | % |
VX2 - |
| 24.7 | % |
BT1 - |
| 43.4 | % |
BT2 - |
| 74.3 | % |
|
|
|
|
Total BioPharma - |
| 7.9 | % |
Total Vx - |
| 29.4 | % |
Total BT - |
| 48.5 | % |
2012
$1,473MM (4)
[CHART]
Operating Margins
BP2 - |
| 54.5 | % |
BP3 - |
| 72.0 | % |
BP4 - |
| 46.4 | % |
BP5 - |
| 64.0 | % |
VX1 - |
| 33.4 | % |
VX2 - |
| 42.2 | % |
BT1 - |
| 37.7 | % |
BT2 - |
| 71.6 | % |
|
|
|
|
Total BioPharma - |
| 28.0 | % |
Total Vx - |
| 37.5 | % |
Total BT - |
| 42.2 | % |
Source: Heron Management Forecast as of October 2005.
(1) Includes operating loss of ($33MM) from Biopharma, which is comprised of operating incomes of $59MM, $164MM, $77MM, ($56MM), and ($211MM) for Proleukin, TOBI, Betaseron, TFPI, and BioPharma (Remaining), respectively
(2) Comprised of operating incomes of $158MM, ($30MM), and $31MM for Egg Flu, Cell Culture and Vx (Remaining), respectively
(3) Total operating income includes ($199MM) of BioPharma (Remaining)
(4) Total operating income includes ($175MM) of BioPharma (Remaining)
12
Heron – Forecasted Revenue and Operating Profile
Total Revenue
[CHART]
EBIT
[CHART]
Net Income
[CHART]
Source: Heron Management Forecast as of October 2005.
13
Heron Management Forecast - Consolidated Income Statement
($ and shares in millions, except per share amounts)
Heron
Income Statement
|
| Fiscal Year Ending December 31 |
| ||||||||||||||||||||||||||||
|
| 2006E |
| 2007E |
| 2008E |
| 2009E |
| 2010E |
| 2011E |
| 2012E |
| 2013E |
| 2014E |
| 2015E |
| ||||||||||
Total Revenue |
| $ | 2,222.2 |
| $ | 2,436.6 |
| $ | 2,675.3 |
| $ | 3,183.9 |
| $ | 3,663.4 |
| $ | 4,010.1 |
| $ | 4,254.1 |
| $ | 4,080.7 |
| $ | 4,161.4 |
| $ | 4,211.1 |
|
% Growth |
| 11.9 | % | 9.6 | % | 9.8 | % | 19.0 | % | 15.1 | % | 9.5 | % | 6.1 | % | -4.1 | % | 2.0 | % | 1.2 | % | ||||||||||
|
|
|
|
|
|
|
|
|
|
|
|
|
|
|
|
|
|
|
|
|
| ||||||||||
COGS |
| 833.8 |
| 891.9 |
| 971.4 |
| 1,132.4 |
| 1,221.6 |
| 1,345.5 |
| 1,417.5 |
| 1,446.4 |
| 1,483.7 |
| 1,405.2 |
| ||||||||||
% Growth |
| 15.2 | % | 7.0 | % | 8.9 | % | 16.6 | % | 7.9 | % | 10.1 | % | 5.3 | % | 2.0 | % | 2.6 | % | -5.3 | % | ||||||||||
|
|
|
|
|
|
|
|
|
|
|
|
|
|
|
|
|
|
|
|
|
| ||||||||||
Gross Profit |
| 1,388.5 |
| 1,544.7 |
| 1,703.9 |
| 2,051.5 |
| 2,441.8 |
| 2,664.5 |
| 2,836.6 |
| 2,634.4 |
| 2,677.7 |
| 2,805.9 |
| ||||||||||
% Margin |
| 62.5 | % | 63.4 | % | 63.7 | % | 64.4 | % | 66.7 | % | 66.4 | % | 66.7 | % | 64.6 | % | 64.3 | % | 66.6 | % | ||||||||||
|
|
|
|
|
|
|
|
|
|
|
|
|
|
|
|
|
|
|
|
|
| ||||||||||
R&D |
| 482.2 |
| 503.9 |
| 537.7 |
| 502.9 |
| 514.2 |
| 556.1 |
| 601.4 |
| 603.2 |
| 613.7 |
| 627.8 |
| ||||||||||
% Margin |
| 21.7 | % | 20.7 | % | 20.1 | % | 15.8 | % | 14.0 | % | 13.9 | % | 14.1 | % | 14.8 | % | 14.7 | % | 14.9 | % | ||||||||||
% Growth |
| 11.0 | % | 4.5 | % | 6.7 | % | -6.5 | % | 2.2 | % | 8.1 | % | 8.2 | % | 0.3 | % | 1.7 | % | 2.3 | % | ||||||||||
|
|
|
|
|
|
|
|
|
|
|
|
|
|
|
|
|
|
|
|
|
| ||||||||||
S&M |
| 300.8 |
| 326.1 |
| 395.8 |
| 439.4 |
| 471.8 |
| 502.8 |
| 509.6 |
| 498.0 |
| 512.6 |
| 526.8 |
| ||||||||||
% Margin |
| 13.5 | % | 13.4 | % | 14.8 | % | 13.8 | % | 12.9 | % | 12.5 | % | 12.0 | % | 12.2 | % | 12.3 | % | 12.5 | % | ||||||||||
% Growth |
| 6.0 | % | 8.4 | % | 21.4 | % | 11.0 | % | 7.4 | % | 6.6 | % | 1.3 | % | -2.3 | % | 2.9 | % | 2.8 | % | ||||||||||
|
|
|
|
|
|
|
|
|
|
|
|
|
|
|
|
|
|
|
|
|
| ||||||||||
G&A |
| 202.0 |
| 210.5 |
| 223.3 |
| 244.9 |
| 267.2 |
| 290.4 |
| 316.2 |
| 315.7 |
| 328.4 |
| 339.7 |
| ||||||||||
% Margin |
| 9.1 | % | 8.6 | % | 8.3 | % | 7.7 | % | 7.3 | % | 7.2 | % | 7.4 | % | 7.7 | % | 7.9 | % | 8.1 | % | ||||||||||
% Growth |
| -9.7 | % | 4.2 | % | 6.1 | % | 9.7 | % | 9.1 | % | 8.7 | % | 8.9 | % | -0.2 | % | 4.0 | % | 3.5 | % | ||||||||||
|
|
|
|
|
|
|
|
|
|
|
|
|
|
|
|
|
|
|
|
|
| ||||||||||
Other Expenses |
| 14.1 |
| 14.5 |
| 9.6 |
| 1.3 |
| 0.4 |
| 0.4 |
| 0.4 |
| 0.4 |
| 0.4 |
| 0.4 |
| ||||||||||
% Growth |
| 40.7 | % | 2.5 | % | -33.5 | % | -86.7 | % | -66.5 | % | -0.6 | % | 0.0 | % | 0.0 | % | 0.0 | % | 0.0 | % | ||||||||||
|
|
|
|
|
|
|
|
|
|
|
|
|
|
|
|
|
|
|
|
|
| ||||||||||
EBITDA |
| 546.8 |
| 649.0 |
| 701.9 |
| 1,048.5 |
| 1,367.7 |
| 1,515.8 |
| 1,621.4 |
| 1,435.5 |
| 1,432.6 |
| 1,535.5 |
| ||||||||||
% Margin |
| 24.6 | % | 26.6 | % | 26.2 | % | 32.9 | % | 37.3 | % | 37.8 | % | 38.1 | % | 35.2 | % | 34.4 | % | 36.5 | % | ||||||||||
Depreciation |
| 127.2 |
| 129.8 |
| 136.6 |
| 159.7 |
| 167.0 |
| 190.8 |
| 205.3 |
| 212.1 |
| 205.5 |
| 220.3 |
| ||||||||||
Amortization |
| 30.2 |
| 29.5 |
| 27.8 |
| 25.8 |
| 12.4 |
| 10.3 |
| 7.2 |
| 6.3 |
| 4.5 |
| 4.1 |
| ||||||||||
|
|
|
|
|
|
|
|
|
|
|
|
|
|
|
|
|
|
|
|
|
| ||||||||||
Operating Income |
| 389.4 |
| 489.7 |
| 537.5 |
| 863.1 |
| 1,188.2 |
| 1,314.8 |
| 1,408.9 |
| 1,217.1 |
| 1,222.5 |
| 1,311.1 |
| ||||||||||
% Margin |
| 17.5 | % | 20.1 | % | 20.1 | % | 27.1 | % | 32.4 | % | 32.8 | % | 33.1 | % | 29.8 | % | 29.4 | % | 31.1 | % | ||||||||||
% Growth |
| 25.3 | % | 25.8 | % | 9.7 | % | 60.6 | % | 37.7 | % | 10.7 | % | 7.2 | % | -13.6 | % | 0.4 | % | 7.2 | % | ||||||||||
|
|
|
|
|
|
|
|
|
|
|
|
|
|
|
|
|
|
|
|
|
| ||||||||||
Net Other Income (Expense) |
| 29.1 |
| 19.6 |
| 11.6 |
| 10.1 |
| 15.7 |
| 41.8 |
| 64.8 |
| 81.9 |
| 89.0 |
| 89.0 |
| ||||||||||
Minority Interest |
| (3.0 | ) | (3.0 | ) | (3.0 | ) | (3.0 | ) | (3.0 | ) | (3.0 | ) | (3.0 | ) | (3.0 | ) | (3.0 | ) | (3.0 | ) | ||||||||||
|
|
|
|
|
|
|
|
|
|
|
|
|
|
|
|
|
|
|
|
|
| ||||||||||
Pre-tax Income |
| 415.5 |
| 506.3 |
| 546.0 |
| 870.1 |
| 1,200.9 |
| 1,353.6 |
| 1,470.7 |
| 1,296.0 |
| 1,308.6 |
| 1,397.1 |
| ||||||||||
% Margin |
| 18.7 | % | 20.8 | % | 20.4 | % | 27.3 | % | 32.8 | % | 33.8 | % | 34.6 | % | 31.8 | % | 31.4 | % | 33.2 | % | ||||||||||
|
|
|
|
|
|
|
|
|
|
|
|
|
|
|
|
|
|
|
|
|
| ||||||||||
Income Tax Expense |
| (103.9 | ) | (126.6 | ) | (136.5 | ) | (217.5 | ) | (300.2 | ) | (338.4 | ) | (367.7 | ) | (324.0 | ) | (327.1 | ) | (349.3 | ) | ||||||||||
Effective Tax Rate |
| 25.0 | % | 25.0 | % | 25.0 | % | 25.0 | % | 25.0 | % | 25.0 | % | 25.0 | % | 25.0 | % | 25.0 | % | 25.0 | % | ||||||||||
|
|
|
|
|
|
|
|
|
|
|
|
|
|
|
|
|
|
|
|
|
| ||||||||||
Net Income |
| 311.6 |
| 379.8 |
| 409.5 |
| 652.6 |
| 900.7 |
| 1,015.2 |
| 1,103.1 |
| 972.0 |
| 981.4 |
| 1,047.8 |
| ||||||||||
Share Outstanding |
| 197.5 |
| 198.7 |
| 199.5 |
| 200.4 |
| 202.1 |
| 203.5 |
| 204.5 |
| 205.5 |
| 206.4 |
| 207.4 |
| ||||||||||
EPS |
| $ | 1.58 |
| $ | 1.91 |
| $ | 2.05 |
| $ | 3.26 |
| $ | 4.46 |
| $ | 4.99 |
| $ | 5.39 |
| $ | 4.73 |
| $ | 4.75 |
| $ | 5.05 |
|
Note: Heron consolidated income statement includes corporate royalties and expenses
Source: Heron Management Forecast as of October 2005.
14
Street versus Heron Management Forecast
Total Revenues
($ in millions) |
| 2006E |
| 2007E |
| 2008E |
| 2009E |
| 2010E |
| |||||
Piper Jaffray (10/26/05) |
| $ | 2,109.9 |
| $ | 2,314.1 |
| $ | 2,670.9 |
| $ | 2,861.4 |
|
|
| |
SG Cowen (10/26/05) |
| 2,290.0 |
| 2,565.0 |
| 2,857.0 |
| 3,102.0 |
| 3,292.0 |
| |||||
UBS (10/26/05) |
| 2,118.0 |
| 2,277.0 |
|
|
|
|
|
|
| |||||
Banc of America (10/26/05) |
| 2,098.8 |
| 2,323.2 |
| 2,564.2 |
|
|
|
|
| |||||
Goldman Sachs (10/26/05) |
| 2,130.0 |
| 2,262.0 |
|
|
|
|
|
|
| |||||
Merrill Lynch (10/26/05) |
| 2,175.8 |
| 2,286.4 |
| 2,385.0 |
|
|
|
|
| |||||
Average |
| $ | 2,153.8 |
| $ | 2,338.0 |
| $ | 2,619.3 |
| $ | 2,981.7 |
| $ | 3,292.0 |
|
% Growth |
| 16.1 | % | 8.6 | % | 12.0 | % | 13.8 | % | 10.4 | % | |||||
Forecast |
| $ | 2,222.2 |
| $ | 2,436.6 |
| $ | 2,675.3 |
| $ | 3,183.9 |
| $ | 3,663.4 |
|
% Growth |
| 11.9 | % | 9.6 | % | 9.8 | % | 19.0 | % | 15.1 | % | |||||
Variance |
| $ | 68.4 |
| $ | 98.6 |
| $ | 56.0 |
| $ | 202.2 |
| $ | 371.4 |
|
% Difference |
| 3.2 | % | 4.2 | % | 2.1 | % | 6.8 | % | 11.3 | % | |||||
Operating Income
($ in millions) |
| 2006E |
| 2007E |
| 2008E |
| 2009E |
| 2010E |
| |||||
Piper Jaffray (10/26/05) |
| $ | 383.1 |
| $ | 462.0 |
| $ | 575.2 |
| $ | 626.5 |
|
|
| |
SG Cowen (10/26/05) |
| 445.0 |
| 568.0 |
| 672.0 |
| 754.0 |
| 841.0 |
| |||||
UBS (10/26/05) |
| 407.0 |
| 456.0 |
|
|
|
|
|
|
| |||||
Banc of America (10/26/05) |
| 370.9 |
| 417.7 |
| 524.5 |
|
|
|
|
| |||||
Merrill Lynch (10/26/05) |
| 449.6 |
| 446.9 |
| 451.8 |
|
|
|
|
| |||||
Goldman Sachs (10/26/05) |
| 447.0 |
| 498.0 |
|
|
|
|
|
|
| |||||
Average |
| $ | 417.1 |
| $ | 474.8 |
| $ | 555.9 |
| $ | 690.2 |
| $ | 841.0 |
|
% Growth |
| 98.9 | % | 13.8 | % | 17.1 | % | 24.2 | % | 21.8 | % | |||||
Forecast |
| $ | 389.4 |
| $ | 489.7 |
| $ | 537.5 |
| $ | 863.1 |
| $ | 1,188.2 |
|
% Growth |
| 25.2 | % | 25.8 | % | 9.8 | % | 60.6 | % | 37.7 | % | |||||
Variance |
| $ | (27.7 | ) | $ | 14.9 |
| $ | (18.4 | ) | $ | 172.9 |
| $ | 347.2 |
|
% Difference |
| (6.6 | )% | 3.1 | % | (3.3 | )% | 25.0 | % | 41.3 | % | |||||
EPS(2)
|
| 2006E |
| 2007E |
| 2008E |
| 2009E |
| 2010E |
| ||||||||
Deutsche Bank (10/26/05) |
| $ | 2.66 |
|
|
|
|
|
|
|
|
| |||||||
SG Cowen (10/26/05) |
| 1.90 |
| 2.30 |
| 2.65 |
| 2.90 |
| 3.15 |
| ||||||||
UBS (10/26/05) |
| 1.55 |
| 1.78 |
|
|
|
|
|
|
| ||||||||
Banc of America (10/26/05) |
| 1.71 |
| 1.89 |
| 2.30 |
|
|
|
|
| ||||||||
Prudential (07/27/05) |
| 1.80 |
| 2.21 |
|
|
|
|
|
|
| ||||||||
Goldman Sachs (10/26/05) |
| 1.89 |
| 2.09 |
|
|
|
|
|
|
| ||||||||
Merrill Lynch (10/26/05) |
| 1.83 |
| 1.86 |
| 1.88 |
|
|
|
|
| ||||||||
Piper Jaffray (10/26/05) |
| 1.61 |
| 1.84 |
| 2.29 |
| 2.50 |
|
|
| ||||||||
Citigroup (10/25/05) |
| 1.80 |
| 1.90 |
|
|
|
|
|
|
| ||||||||
JP Morgan (10/25/05) |
| 1.71 |
|
|
|
|
|
|
|
|
| ||||||||
Average(2) |
| $ | 1.76 |
| $ | 1.98 |
| $ | 2.28 |
| $ | 2.70 |
| $ | 3.15 |
| |||
% Growth |
| 68.4 | % | 13.0 | % | 14.9 | % | 18.4 | % | 16.7 | % | ||||||||
Forecast |
| $ | 1.58 |
| $ | 1.91 |
| $ | 2.05 |
| $ | 3.26 |
| $ | 4.46 |
| |||
% Growth |
| 13.7 | % | 20.9 | % | 7.3 | % | 59.0 | % | 36.8 | % | ||||||||
Variance |
| $ | (0.18 | ) | $ | (0.07 | ) |
| $ | (0.23 | ) | $ | 0.56 |
| $ | 1.31 |
| ||
% Difference |
| (10.0 | )% | (3.7 | )% | (10.1 | %) | 20.7 | % | 41.6 | % | ||||||||
Revenues
BioPharma
($ in millions) |
| 2006E |
| 2007E |
| 2008E |
| 2009E |
| 2010E |
| |||||
Merrill Lynch (10/26/05) |
| 536.3. |
| $ | 553.4 |
| $ | 561.5 |
|
|
|
|
| |||
Piper Jaffray (10/26/05) |
| 547.8 |
| 566.3 |
| 796.5 |
| 815.0 |
|
|
| |||||
UBS (10/26/05) |
| 570.0 |
| 612.0 |
|
|
|
|
|
|
| |||||
SG Cowen (10/26/05) |
| 595.0 |
| 640.0 |
| 695.0 |
| 735.0 |
| 775.0 |
| |||||
Goldman Sachs (10/26/05) |
| 515.0 |
| 514.0 |
|
|
|
|
|
|
| |||||
Average |
| $ | 556.9 |
| $ | 577.1 |
| $ | 684.3 |
| $ | 775.0 |
| $ | 775.0 |
|
% Growth |
| 3.5 | % | 3.6 | % | 18.6 | % | 13.2 | % | 0.0 | % | |||||
Forecast(1) |
| $ | 549.5 |
| $ | 606.4 |
| $ | 651.6 |
| $ | 811.7 |
| $ | 1,047.8 |
|
% Growth |
| 0.3 | % | 10.4 | % | 7.5 | % | 24.6 | % | 29.1 | % | |||||
Variance |
| $ | (7.4 | ) | $ | 29.3 |
| $ | (32.7 | ) | $ | 36.7 |
| $ | 272.8 |
|
% Difference |
| (1.3 | %) | 5.1 | % | (4.8 | )% | 4.7 | % | 35.2 | % | |||||
Vaccines
($ in millions) |
| 2006E |
| 2007E |
| 2008E |
| 2009E |
| 2010E |
| |||||
SG Cowen (10/26/05) |
| $ | 845.0 |
| $ | 1,005.0 |
| $ | 1,130.0 |
| $ | 1,250.0 |
| $ | 1,320.0 |
|
Piper Jaffray (10/26/05) |
| 747.6 |
| 876.3 |
| 965.0 |
| 1,061.0 |
|
|
| |||||
Goldman Sachs (10/26/05) |
| 781.0 |
| 865.0 |
|
|
|
|
|
|
| |||||
UBS (10/26/05) |
| 745.0 |
| 821.0 |
|
|
|
|
|
|
| |||||
Merrill Lynch (10/26/05) |
| 782.5 |
| 830.4 |
| 881.6 |
|
|
|
|
| |||||
Average |
| $ | 780.2 |
| $ | 879.5 |
| $ | 992.2 |
| $ | 1,155.5 |
| $ | 1,320.0 |
|
% Growth |
| 37.7 | % | 12.7 | % | 12.8 | % | 16.5 | % | 14.2 | % | |||||
Forecast(1) |
| $ | 904.6 |
| $ | 980.8 |
| $ | 1,077.4 |
| $ | 1,324.7 |
| $ | 1,564.7 |
|
% Growth |
| 37.1 | % | 8.4 | % | 9.8 | % | 23.0 | % | 18.1 | % | |||||
Variance |
| $ | 124.4 |
| $ | 101.3 |
| $ | 85.2 |
| $ | 169.2 |
| $ | 244.7 |
|
% Difference |
| 15.9 | % | 11.5 | % | 8.6 | % | 14.6 | % | 18.5 | % | |||||
Blood Testing
($ in millions) |
| 2006E |
| 2007E |
| 2008E |
| 2009E |
| 2010E |
| |||||
SG Cowen (10/26/05) |
| $ | 380.0 |
| $ | 420.0 |
| $ | 485.0 |
| $ | 535.0 |
| $ | 585.0 |
|
Piper Jaffray (10/26/05) |
| 353.5 |
| 419.2 |
| 494.0 |
| 554.1 |
|
|
| |||||
Merrill Lynch (10/26/05) |
| 360.6 |
| 429.0 |
| 474.1 |
|
|
|
|
| |||||
Goldman Sachs (10/26/05) |
| 370.0 |
| 413.0 |
|
|
|
|
|
|
| |||||
UBS (10/26/05) |
| 337.0 |
| 376.0 |
|
|
|
|
|
|
| |||||
Average |
| $ | 360.2 |
| $ | 411.4 |
| $ | 484.4 |
| $ | 544.5 |
| $ | 585.0 |
|
% Growth |
| 17.9 | % | 14.2 | % | 17.7 | % | 12.4 | % | 7.4 | % | |||||
Forecast(1) |
| $ | 389.1 |
| $ | 499.5 |
| $ | 575.2 |
| $ | 688.2 |
| $ | 768.5 |
|
% Growth |
| 25.6 | % | 28.4 | % | 15.2 | % | 19.6 | % | 11.7 | % | |||||
Variance |
| $ | 28.9 |
| $ | 88.1 |
| $ | 90.8 |
| $ | 143.7 |
| $ | 183.5 |
|
% Difference |
| 8.0 | % | 21.4 | % | 18.8 | % | 26.4 | % | 31.4 | % | |||||
Source: Heron Management Forecast as of October 2005 and Street analyst forecasts as indicated
(1) Forecast represents only net product sales and blood testing revenues exclude NAT royalties and Ortho Joint Business profits, royalties and contract revenues.
(2) Average EPS excludes Deutsche Bank estimates.
15
B. Overview of Trading Performance
16
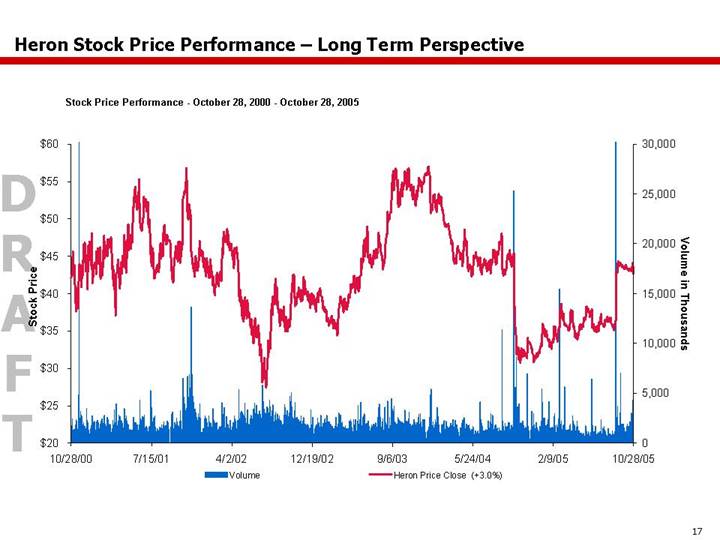
Heron Stock Price Performance – Long Term Perspective
Stock Price Performance - October 28, 2000 - October 28, 2005
[CHART]
17
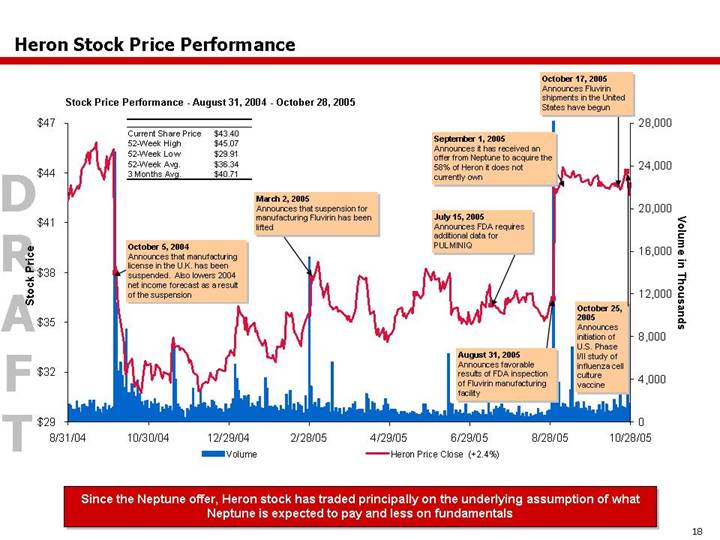
Heron Stock Price Performance
Stock Price Performance - August 31, 2004 - October 28, 2005
Current Share Price |
| $ | 43.40 |
|
52-Week High |
| $ | 45.07 |
|
52-Week Low |
| $ | 29.91 |
|
52-Week Avg. |
| $ | 36.34 |
|
3 Months Avg. |
| $ | 40.71 |
|
[CHART]
Since the Neptune offer, Heron stock has traded principally on the underlying assumption of what Neptune is expected to pay and less on fundamentals
18
Heron Stock Price Performance Compared to Relevant Indices
Stock Price Performance - August 31, 2004 - October 28, 2005
|
| Performance Since |
| ||||||
|
| 8/31/2004 |
| 12/31/2004 |
| 3/31/2005 |
| 6/30/2005 |
|
Stock Price Performance |
|
|
|
|
|
|
|
|
|
Heron |
| 2.4 | % | 30.2 | % | 23.8 | % | 24.4 | % |
NASDAQ |
| 13.7 | % | (3.9 | )% | 4.5 | % | 1.6 | % |
AMEX Biotech Index |
| 25.3 | % | 14.1 | % | 26.1 | % | 10.1 | % |
Large Cap Biotech |
| 37.4 | % | 25.9 | % | 37.4 | % | 16.1 | % |
Large Cap Biotech (excl. DNA) |
| 20.3 | % | 11.2 | % | 28.6 | % | 20.6 | % |
Large Pharma |
| (6.6 | )% | (0.9 | )% | 2.2 | % | (2.2 | )% |
[CHART]
Large Cap Biotech includes AMGN, BIIB, DNA, GENZ, GILD, MEDI
Large Pharma includes AZN, BMY, GSK, LLY, MRK, NVS, PFE, RHHBY
19
98% of Heron Shares Traded during the Year Prior to Announcement Traded at or below $45
August 31, 2004 to August 31, 2005 (1 Year prior to Unaffected Date)
[CHART]
|
| $30.00 - $33.00 |
| $33.00 - $36.00 |
| $36.00 - $39.00 |
| $39.00 - $42.00 |
| $42.00 - $45.00 |
| $45.00 - $48.00 |
|
Volume |
| 108,449,920 |
| 173,688,768 |
| 137,625,856 |
| 0 |
| 27,976,354 |
| 7,314,170 |
|
% of Shares Traded |
| 23.8 | % | 38.2 | % | 30.2 | % | 0.0 | % | 6.1 | % | 1.6 | % |
Cumulative % Traded |
| 23.8 | % | 62.0 | % | 92.2 | % | 92.2 | % | 98.4 | % | 100.0 | % |
% of Shares Outstanding (1) |
| 99.9 | % | 160.0 | % | 126.8 | % | 0.0 | % | 25.8 | % | 6.7 | % |
|
|
|
|
|
|
|
|
|
|
|
|
|
|
Cumulative Volume |
| 108,449,920 |
| 282,138,688 |
| 419,764,544 |
| 419,764,544 |
| 447,740,898 |
| 455,055,068 |
|
Multiple of Shares Outstanding (1) |
| 1.0 | x | 2.6 | x | 3.9 | x | 3.9 | x | 4.1 | x | 4.2 | x |
(1) | Excludes shares held by Neptune. Assumes a total of 187,879,648 shares outstanding less 79,320,078 shares held by Neptune. Neptune share ownership information is from Schedule 13D dated September 1, 2005. |
20
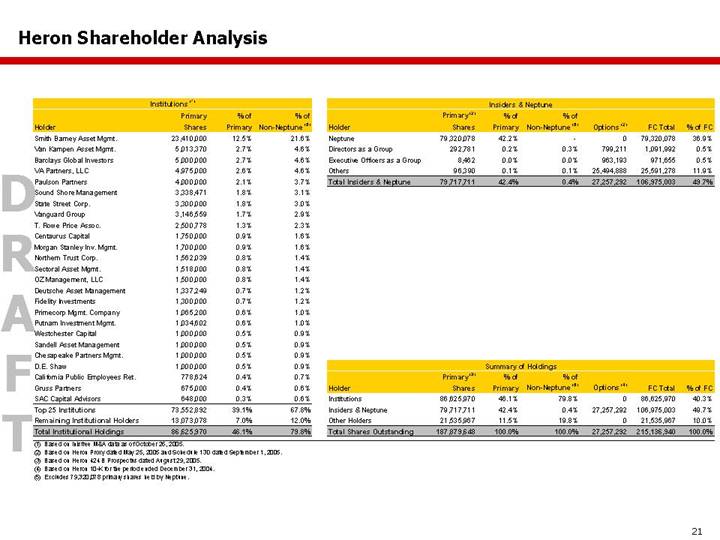
Heron Shareholder Analysis
|
| Institutions (1) |
| ||||
|
| Primary |
| % of |
| % of |
|
Holder |
| Shares |
| Primary |
| Non-Neptune (5) |
|
Smith Barney Asset Mgmt. |
| 23,410,000 |
| 12.5 | % | 21.6 | % |
Van Kampen Asset Mgmt. |
| 5,013,370 |
| 2.7 | % | 4.6 | % |
Barclays Global Investors |
| 5,000,000 |
| 2.7 | % | 4.6 | % |
VA Partners, LLC |
| 4,975,000 |
| 2.6 | % | 4.6 | % |
Paulson Partners |
| 4,000,000 |
| 2.1 | % | 3.7 | % |
Sound Shore Management |
| 3,338,471 |
| 1.8 | % | 3.1 | % |
State Street Corp. |
| 3,300,000 |
| 1.8 | % | 3.0 | % |
Vanguard Group |
| 3,146,559 |
| 1.7 | % | 2.9 | % |
T. Rowe Price Assoc. |
| 2,500,778 |
| 1.3 | % | 2.3 | % |
Centaurus Capital |
| 1,750,000 |
| 0.9 | % | 1.6 | % |
Morgan Stanley Inv. Mgmt. |
| 1,700,000 |
| 0.9 | % | 1.6 | % |
Northern Trust Corp. |
| 1,562,039 |
| 0.8 | % | 1.4 | % |
Sectoral Asset Mgmt. |
| 1,518,000 |
| 0.8 | % | 1.4 | % |
OZ Management, LLC |
| 1,500,000 |
| 0.8 | % | 1.4 | % |
Deutsche Asset Management |
| 1,337,249 |
| 0.7 | % | 1.2 | % |
Fidelity Investments |
| 1,300,000 |
| 0.7 | % | 1.2 | % |
Primecorp Mgmt. Company |
| 1,065,200 |
| 0.6 | % | 1.0 | % |
Putnam Investment Mgmt. |
| 1,034,602 |
| 0.6 | % | 1.0 | % |
Westchester Capital |
| 1,000,000 |
| 0.5 | % | 0.9 | % |
Sandell Asset Management |
| 1,000,000 |
| 0.5 | % | 0.9 | % |
Chesapeake Partners Mgmt. |
| 1,000,000 |
| 0.5 | % | 0.9 | % |
D.E. Shaw |
| 1,000,000 |
| 0.5 | % | 0.9 | % |
California Public Employees Ret. |
| 778,624 |
| 0.4 | % | 0.7 | % |
Gruss Partners |
| 675,000 |
| 0.4 | % | 0.6 | % |
SAC Capital Advisors |
| 648,000 |
| 0.3 | % | 0.6 | % |
Top 25 Institutions |
| 73,552,892 |
| 39.1 | % | 67.8 | % |
Remaining Institutional Holders |
| 13,073,078 |
| 7.0 | % | 12.0 | % |
Total Institutional Holdings |
| 86,625,970 |
| 46.1 | % | 79.8 | % |
|
| Insiders & Neptune |
| ||||||||||
Holder |
| Primary (2) |
| % of |
| % of |
| Options (2) |
| FC Total |
| % of FC |
|
Neptune |
| 79,320,078 |
| 42.2 | % | — |
| 0 |
| 79,320,078 |
| 36.9 | % |
Directors as a Group |
| 292,781 |
| 0.2 | % | 0.3 | % | 799,211 |
| 1,091,992 |
| 0.5 | % |
Executive Officers as a Group |
| 8,462 |
| 0.0 | % | 0.0 | % | 963,193 |
| 971,655 |
| 0.5 | % |
Others |
| 96,390 |
| 0.1 | % | 0.1 | % | 25,494,888 |
| 25,591,278 |
| 11.9 | % |
Total Insiders & Neptune |
| 79,717,711 |
| 42.4 | % | 0.4 | % | 27,257,292 |
| 106,975,003 |
| 49.7 | % |
|
| Summary of Holdings |
| ||||||||||
|
| Primary (3) |
| % of |
| % of |
|
|
|
|
|
|
|
Holder |
| Shares |
| Primary |
| Non-Neptune (5) |
| Options (4) |
| FC Total |
| % of FC |
|
Institutions |
| 86,625,970 |
| 46.1 | % | 79.8 | % | 0 |
| 86,625,970 |
| 40.3 | % |
Insiders & Neptune |
| 79,717,711 |
| 42.4 | % | 0.4 | % | 27,257,292 |
| 106,975,003 |
| 49.7 | % |
Other Holders |
| 21,535,967 |
| 11.5 | % | 19.8 | % | 0 |
| 21,535,967 |
| 10.0 | % |
Total Shares Outstanding |
| 187,879,648 |
| 100.0 | % | 100.0 | % | 27,257,292 |
| 215,136,940 |
| 100.0 | % |
(1) | Based on Inisfree M&A data as of October 26, 2005. |
(2) | Based on Heron Proxy dated May 25, 2005 and Schedule 13D dated September 1, 2005. |
(3) | Based on Heron 424 B Prospectus dated August 29, 2005. |
(4) | Based on Heron 10-K for the period ended December 31, 2004. |
(5) | Excludes 79,320,078 primary shares held by Neptune. |
21
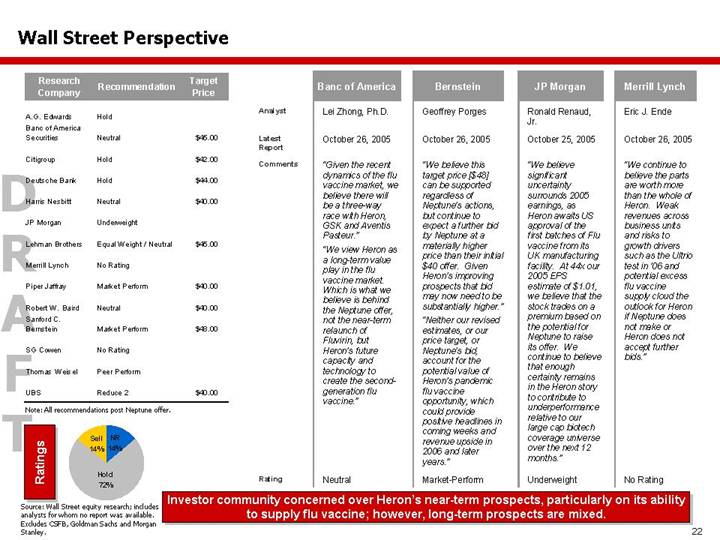
Wall Street Perspective
Research |
|
|
| Target |
| |
Company |
| Recommendation |
| Price |
| |
|
|
|
|
|
| |
A.G. Edwards |
| Hold |
|
|
| |
|
|
|
|
|
| |
Banc of America Securities |
| Neutral |
| $ | 45.00 |
|
|
|
|
|
|
| |
Citigroup |
| Hold |
| $ | 42.00 |
|
|
|
|
|
|
| |
Deutsche Bank |
| Hold |
| $ | 44.00 |
|
|
|
|
|
|
| |
Harris Nesbitt |
| Neutral |
| $ | 40.00 |
|
|
|
|
|
|
| |
JP Morgan |
| Underweight |
|
|
| |
|
|
|
|
|
| |
Lehman Brothers |
| Equal Weight / Neutral |
| $ | 45.00 |
|
|
|
|
|
|
| |
Merrill Lynch |
| No Rating |
|
|
| |
|
|
|
|
|
| |
Piper Jaffray |
| Market Perform |
| $ | 40.00 |
|
|
|
|
|
|
| |
Robert W. Baird |
| Neutral |
| $ | 40.00 |
|
|
|
|
|
|
| |
Sanford C. Bernstein |
| Market Perform |
| $ | 48.00 |
|
|
|
|
|
|
| |
SG Cowen |
| No Rating |
|
|
| |
|
|
|
|
|
| |
Thomas Weisel |
| Peer Perform |
|
|
| |
|
|
|
|
|
| |
UBS |
| Reduce 2 |
| $ | 40.00 |
|
Note: All recommendations post Neptune offer.
Ratings
[CHART]
Source: Wall Street equity research; includes analysts for whom no report was available. Excludes CSFB, Goldman Sachs and Morgan Stanley.
|
| Banc of America |
| Bernstein |
| JP Morgan |
| Merrill Lynch |
|
|
|
|
|
|
|
|
|
Analyst |
| Lei Zhong, Ph.D. |
| Geoffrey Porges |
| Ronald Renaud, Jr. |
| Eric J. Ende |
|
|
|
|
|
|
|
|
|
Latest Report |
| October 26, 2005 |
| October 26, 2005 |
| October 25, 2005 |
| October 26, 2005 |
|
|
|
|
|
|
|
|
|
Comments |
| “Given the recent dynamics of the flu vaccine market, we believe there will be a three-way race with Heron, GSK and Aventis Pasteur.” |
| “We believe this target price [$48] can be supported regardless of Neptune’s actions, but continue to expect a further bid by Neptune at a materially higher price than their initial $40 offer. Given Heron’s improving prospects that bid may now need to be substantially higher.” |
| “We believe significant uncertainty surrounds 2005 earnings, as Heron awaits US approval of the first batches of Flu vaccine from its UK manufacturing facility. At 44x our 2005 EPS estimate of $1.01, we believe that the stock trades on a premium based on the potential for Neptune to raise its offer. We continue to believe that enough certainty remains in the Heron story to contribute to underperformance relative to our large cap biotech coverage universe over the next 12 months.” |
| “We continue to believe the parts are worth more than the whole of Heron. Weak revenues across business units and risks to growth drivers such as the Ultrio test in ‘06 and potential excess flu vaccine supply cloud the outlook for Heron if Neptune does not make or Heron does not accept further bids.” |
|
|
|
|
|
|
|
|
|
Rating |
| Neutral |
| Market-Perform |
| Underweight |
| No Rating |
Investor community concerned over Heron’s near-term prospects, particularly on its ability to supply flu vaccine; however, long-term prospects are mixed.
22
3. Preliminary Financial Analysis
23
Recent Trading Range and Analyst Price Targets
$
|
| Implied Premium / (Discount) |
|
52-Week Trading Range |
| (20.4)% – 26.2% |
|
|
|
|
|
Analyst Price Targets (1) | [CHART] | (21.6)% – 7.8% |
|
|
|
|
|
Affected Analyst Price Targets (2) |
| 9.8% – 31.7% |
|
(1) | Reflects analyst price targets pre-announcement of initial Neptune offer as of 8/31/05. Discounted at 12.0% |
(2) | Reflects analyst price targets post announcement of initial Neptune offer as of 10/28/05; excludes CSFB and MS equity research price targets as unable to publish updates due to advisory role |
24
Heron’s Valuation Parameters
Assessment of Valuation (1)
$
|
| Implied Premium / (Discount) |
|
Selected Companies |
|
|
|
|
|
|
|
Multiple-Based: 20.0x – 26.0x 2006 P/E |
|
|
|
Company Forecast 2006 EPS $1.58 |
| (13.3)% – 12.7% |
|
|
|
|
|
Street Forecast 2006 EPS $1.81 |
| (0.7)% – 29.1% |
|
|
|
|
|
Multiple-Based: 18.0x – 24.0x 2007 P/E |
|
|
|
|
|
|
|
Company Forecast 2007 EPS $1.91 |
| (5.7)% – 25.8% |
|
| [CHART] |
|
|
Street Forecast 2007 EPS $1.98 |
| (2.2)% – 30.4% |
|
|
|
|
|
10-Year Discounted Cash Flow |
|
|
|
Perpetual Growth: 2.0% – 4.0% |
| 11.5% – 29.4% |
|
|
|
|
|
Sum-of-the-Parts – Management Projections |
|
|
|
|
|
|
|
Perpetual Growth: Varies by Segment (2) |
| 6.6% – 23.5% |
|
(1) | Street forecast EPS estimates as of 10/28/05 |
(2) | Assumes perpetual growth rate of 1.0% – 3.0% for BioPharma (midpoint LTM NOPAT multiple of 12.4x), 2.0% – 4.0% for Vaccines (midpoint LTM NOPAT multiple of 15.4x), 2.0% – 4.0% for Blood Testing (midpoint LTM NOPAT multiple of 13.3x) and (2.0)% – 0.0% for Corporate Royalties (midpoint LTM NOPAT multiple of 8.7x); derived from Heron Management |
25
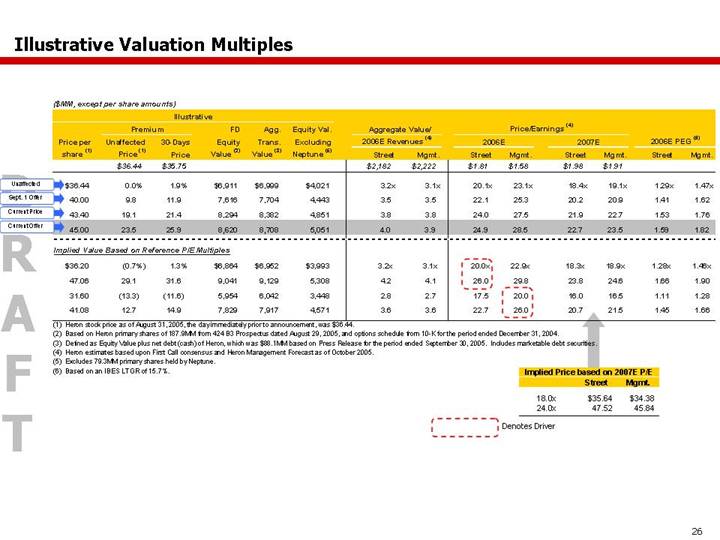
Illustrative Valuation Multiples
($MM, except per share amounts)
|
| Illustrative |
|
|
|
|
|
|
|
|
| ||||||||||||||||||||||
|
| Price per |
| Premium |
| FD |
| Agg. |
| Equity Val. |
| Aggregate Value/ |
| Price/Earnings (4) |
|
|
|
|
| ||||||||||||||
Unaffected |
| 30-Days |
| Equity |
| Trans. |
| Excluding |
| 2006E Revenues (4) |
| 2006E |
| 2007E |
| 2006E PEG (6) | |||||||||||||||||
|
| share (1) |
| Price (1) |
| Price |
| Value (2) |
| Value (3) |
| Neptune (5) |
| Street |
| Mgmt. |
| Street |
| Mgmt. |
| Street |
| Mgmt. |
| Street |
| Mgmt. |
| ||||
|
|
|
| $36.44 |
| $35.75 |
|
|
|
|
|
|
| $2,182 |
| $2,222 |
| $1.81 |
| $1.58 |
| $1.98 |
| $1.91 |
|
|
|
|
| ||||
|
|
|
|
|
|
|
|
|
|
|
|
|
|
|
|
|
|
|
|
|
|
|
|
|
|
|
|
|
| ||||
Unaffected |
| $ | 36.44 |
| 0.0 | % | 1.9 | % | $ | 6,911 |
| $ | 6,999 |
| $ | 4,021 |
| 3.2 | x | 3.1 | x | 20.1 | x | 23.1 | x | 18.4 | x | 19.1 | x | 1.29 | x | 1.47 | x |
Sept. 1 Offer |
| 40.00 |
| 9.8 |
| 11.9 |
| 7,616 |
| 7,704 |
| 4,443 |
| 3.5 |
| 3.5 |
| 22.1 |
| 25.3 |
| 20.2 |
| 20.9 |
| 1.41 |
| 1.62 |
| ||||
Current Price |
| 43.40 |
| 19.1 |
| 21.4 |
| 8,294 |
| 8,382 |
| 4,851 |
| 3.8 |
| 3.8 |
| 24.0 |
| 27.5 |
| 21.9 |
| 22.7 |
| 1.53 |
| 1.76 |
| ||||
Current Offer |
| 45.00 |
| 23.5 |
| 25.9 |
| 8,620 |
| 8,708 |
| 5,051 |
| 4.0 |
| 3.9 |
| 24.9 |
| 28.5 |
| 22.7 |
| 23.5 |
| 1.59 |
| 1.82 |
| ||||
|
| Implied Value Based on Reference P/E Multiples |
|
|
|
|
|
|
|
|
|
|
|
|
|
|
|
|
|
|
|
|
| ||||||||||
|
| $ | 36.20 |
| (0.7 | )% | 1.3 | % | $ | 6,864 |
| $ | 6,952 |
| $ | 3,993 |
| 3.2 | x | 3.1 | x | 20.0 | x | 22.9 | x | 18.3 | x | 18.9 | x | 1.28 | x | 1.46 | x |
|
| 47.06 |
| 29.1 |
| 31.6 |
| 9,041 |
| 9,129 |
| 5,308 |
| 4.2 |
| 4.1 |
| 26.0 |
| 29.8 |
| 23.8 |
| 24.6 |
| 1.66 |
| 1.90 |
| ||||
|
| 31.60 |
| (13.3 | ) | (11.6 | ) | 5,954 |
| 6,042 |
| 3,448 |
| 2.8 |
| 2.7 |
| 17.5 |
| 20.0 |
| 16.0 |
| 16.5 |
| 1.11 |
| 1.28 |
| ||||
|
| 41.08 |
| 12.7 |
| 14.9 |
| 7,829 |
| 7,917 |
| 4,571 |
| 3.6 |
| 3.6 |
| 22.7 |
| 26.0 |
| 20.7 |
| 21.5 |
| 1.45 |
| 1.66 |
| ||||
(1) | Heron stock price as of August 31, 2005, the day immediately prior to announcement, was $36.44. |
(2) | Based on Heron primary shares of 187.9MM from 424 B3 Prospectus dated August 29, 2005, and options schedule from 10-K for the period ended December 31, 2004. |
(3) | Defined as Equity Value plus net debt (cash) of Heron, which was $88.1MM based on Press Release for the period ended September 30, 2005. Includes marketable debt securities. |
(4) | Heron estimates based upon First Call consensus and Heron Management Forecast as of October 2005. |
(5) | Excludes 79.3MM primary shares held by Neptune. |
(6) | Based on an IBES LTGR of 15.7%. |
|
| Implied Price based on 2007E P/E |
| ||||
|
| Street |
| Mgmt. |
| ||
18.0x |
| $ | 35.64 |
| $ | 34.38 |
|
24.0x |
| 47.52 |
| 45.84 |
| ||
Denotes Driver
26
Heron Trading Multiples Relative to its Peers
2006 P/E Multiples
[CHART]
2006 P/E/G Multiples
[CHART]
27
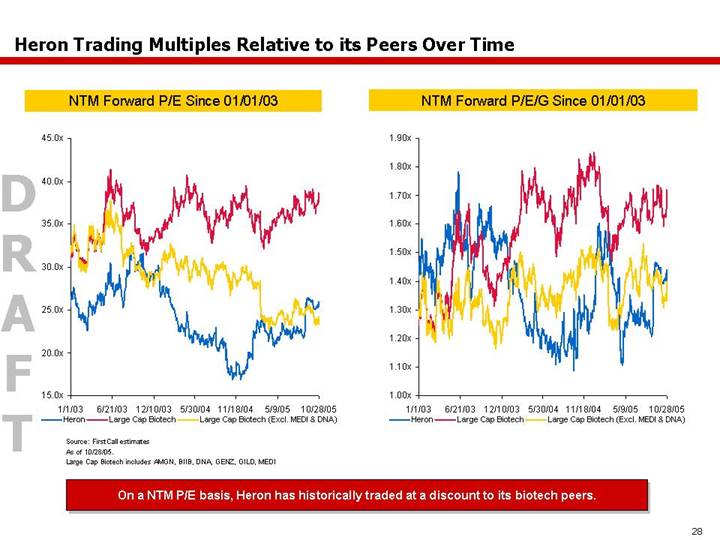
Heron Trading Multiples Relative to its Peers Over Time
NTM Forward P/E Since 01/01/03
[CHART]
NTM Forward P/E/G Since 01/01/03
[CHART]
Source: FirstCall estimates
As of 10/28/05.
Large Cap Biotech includes AMGN, BIIB, DNA, GENZ, GILD, MEDI
On a NTM P/E basis, Heron has historically traded at a discount to its biotech peers.
28
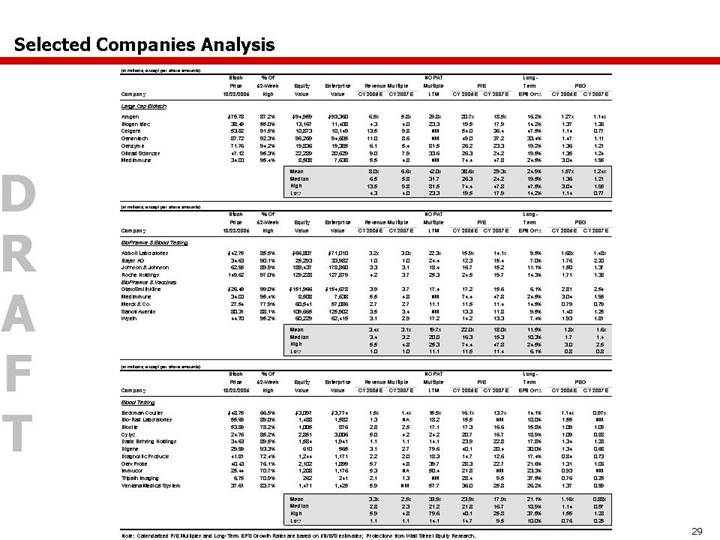
Selected Companies Analysis
(in millions, except per share amounts)
|
| Stock |
| % Of |
|
|
|
|
|
|
|
|
| NOPAT |
|
|
|
|
| Long- |
|
|
|
|
| |||
|
| Price |
| 52-Week |
| Equity |
| Enterprise |
| Revenue Multiple |
| Multiple |
| P/E |
| Term |
| PEG |
| |||||||||
Company |
| 10/28/2005 |
| High |
| Value |
| Value |
| CY 2006E |
| CY 2007E |
| LTM |
| CY 2006E |
| CY 2007E |
| EPS Grw. |
| CY 2006E |
| CY 2007E |
| |||
Large Cap Biotech |
|
|
|
|
|
|
|
|
|
|
|
|
|
|
|
|
|
|
|
|
|
|
|
|
| |||
|
|
|
|
|
|
|
|
|
|
|
|
|
|
|
|
|
|
|
|
|
|
|
|
|
| |||
Amgen |
| $ | 75.78 |
| 87.2 | % | $ | 94,959 |
| $ | 93,360 |
| 6.5 | x | 5.8 | x | 29.8 | x | 20.7 | x | 18.5 | x | 16.2 | % | 1.27 | x | 1.14 | x |
Biogen Idec |
| 38.49 |
| 55.0 | % | 13,167 |
| 11,408 |
| 4.3 |
| 4.0 |
| 23.3 |
| 19.5 |
| 17.9 |
| 14.2 | % | 1.37 |
| 1.26 |
| |||
Celgene |
| 53.82 |
| 91.5 | % | 10,873 |
| 10,149 |
| 13.5 |
| 9.8 |
| NM |
| 54.0 |
| 36.4 |
| 47.5 | % | 1.14 |
| 0.77 |
| |||
Genentech |
| 87.72 |
| 92.3 | % | 96,269 |
| 94,605 |
| 11.0 |
| 8.6 |
| NM |
| 49.0 |
| 37.2 |
| 33.4 | % | 1.47 |
| 1.11 |
| |||
Genzyme |
| 71.76 |
| 94.2 | % | 19,836 |
| 19,385 |
| 6.1 |
| 5.4 |
| 81.5 |
| 26.2 |
| 23.3 |
| 19.2 | % | 1.36 |
| 1.21 |
| |||
Gilead Sciences |
| 47.12 |
| 95.3 | % | 22,289 |
| 20,629 |
| 9.0 |
| 7.9 |
| 33.6 |
| 26.3 |
| 24.2 |
| 19.5 | % | 1.35 |
| 1.24 |
| |||
MedImmune |
| 34.00 |
| 95.4 | % | 8,508 |
| 7,638 |
| 5.5 |
| 4.8 |
| NM |
| 74.4 |
| 47.8 |
| 24.5 | % | 3.04 |
| 1.95 |
| |||
|
|
|
|
|
| Mean |
|
|
| 8.0 | x | 6.6 | x | 42.0 | x | 38.6 | x | 29.3 | x | 24.9 | % | 1.57 | x | 1.24 | x | |||
|
|
|
|
|
| Median |
|
|
| 6.5 |
| 5.8 |
| 31.7 |
| 26.3 |
| 24.2 |
| 19.5 | % | 1.36 |
| 1.21 |
| |||
|
|
|
|
|
| High |
|
|
| 13.5 |
| 9.8 |
| 81.5 |
| 74.4 |
| 47.8 |
| 47.5 | % | 3.04 |
| 1.95 |
| |||
|
|
|
|
|
| Low |
|
|
| 4.3 |
| 4.0 |
| 23.3 |
| 19.5 |
| 17.9 |
| 14.2 | % | 1.14 |
| 0.77 |
| |||
(in millions, except per share amounts)
|
| Stock |
| % Of |
|
|
|
|
|
|
|
|
| NOPAT |
|
|
|
|
| Long- |
|
|
|
|
| |||
|
| Price |
| 52-Week |
| Equity |
| Enterprise |
| Revenue Multiple |
| Multiple |
| P/E |
| Term |
| PEG |
| |||||||||
Company |
| 10/28/2005 |
| High |
| Value |
| Value |
| CY 2006E |
| CY 2007E |
| LTM |
| CY 2006E |
| CY 2007E |
| EPS Grw. |
| CY 2006E |
| CY 2007E |
| |||
BioPharma & Blood Testing |
|
|
|
|
|
|
|
|
|
|
|
|
|
|
|
|
|
|
|
|
|
|
|
|
| |||
|
|
|
|
|
|
|
|
|
|
|
|
|
|
|
|
|
|
|
|
|
|
|
|
|
| |||
Abbott Laboratories |
| $ | 42.75 |
| 85.5 | % | $ | 66,807 |
| $ | 71,010 |
| 3.2 | x | 3.0 | x | 22.3 | x | 15.9 | x | 14.1 | x | 9.5 | % | 1.68 | x | 1.48 | x |
Bayer AG |
| 34.63 |
| 90.1 | % | 25,293 |
| 33,982 |
| 1.0 |
| 1.0 |
| 24.4 |
| 12.3 |
| 15.4 |
| 7.0 | % | 1.76 |
| 2.20 |
| |||
Johnson & Johnson |
| 62.95 |
| 89.9 | % | 189,437 |
| 178,860 |
| 3.3 |
| 3.1 |
| 18.4 |
| 16.7 |
| 15.2 |
| 11.1 | % | 1.50 |
| 1.37 |
| |||
Roche Holdings |
| 149.62 |
| 97.0 | % | 129,228 |
| 127,879 |
| 4.2 |
| 3.7 |
| 25.3 |
| 24.5 |
| 19.7 |
| 14.3 | % | 1.71 |
| 1.38 |
| |||
BioPharma & Vaccines |
|
|
|
|
|
|
|
|
|
|
|
|
|
|
|
|
|
|
|
|
|
|
|
|
| |||
GlaxoSmithKline |
| $ | 26.49 |
| 99.0 | % | $ | 151,966 |
| $ | 154,678 |
| 3.9 |
| 3.7 |
| 17.4 |
| 17.2 |
| 15.6 |
| 6.1 | % | 2.81 |
| 2.54 |
|
MedImmune |
| 34.00 |
| 95.4 | % | 8,508 |
| 7,638 |
| 5.5 |
| 4.8 |
| NM |
| 74.4 |
| 47.8 |
| 24.5 | % | 3.04 |
| 1.95 |
| |||
Merck & Co. |
| 27.54 |
| 77.9 | % | 60,541 |
| 57,086 |
| 2.7 |
| 2.7 |
| 11.1 |
| 11.5 |
| 11.4 |
| 14.5 | % | 0.79 |
| 0.79 |
| |||
Sanofi Aventis |
| 80.31 |
| 88.1 | % | 109,665 |
| 125,902 |
| 3.5 |
| 3.4 |
| NM |
| 13.3 |
| 11.8 |
| 9.5 | % | 1.40 |
| 1.25 |
| |||
Wyeth |
| 44.70 |
| 95.2 | % | 60,229 |
| 62,415 |
| 3.1 |
| 2.9 |
| 17.2 |
| 14.2 |
| 13.3 |
| 7.4 | % | 1.93 |
| 1.81 |
| |||
|
|
|
|
|
| Mean |
|
|
| 3.4 | x | 3.1 | x | 19.7 | x | 22.0 | x | 18.0 | x | 11.5 | % | 1.8 | x | 1.6 | x | |||
|
|
|
|
|
| Median |
|
|
| 3.4 |
| 3.2 |
| 20.0 |
| 16.3 |
| 15.3 |
| 10.3 | % | 1.7 |
| 1.4 |
| |||
|
|
|
|
|
| High |
|
|
| 5.5 |
| 4.8 |
| 25.3 |
| 74.4 |
| 47.8 |
| 24.5 | % | 3.0 |
| 2.5 |
| |||
|
|
|
|
|
| Low |
|
|
| 1.0 |
| 1.0 |
| 11.1 |
| 11.5 |
| 11.4 |
| 6.1 | % | 0.8 |
| 0.8 |
| |||
(in millions, except per share amounts)
|
| Stock |
| % Of |
|
|
|
|
|
|
|
|
| NOPAT |
|
|
|
|
| Long- |
|
|
|
|
| |||
|
| Price |
| 52-Week |
| Equity |
| Enterprise |
| Revenue Multiple |
| Multiple |
| P/E |
| Term |
| PEG |
| |||||||||
Company |
| 10/28/2005 |
| High |
| Value |
| Value |
| CY 2006E |
| CY 2007E |
| LTM |
| CY 2006E |
| CY 2007E |
| EPS Grw. |
| CY 2006E |
| CY 2007E |
| |||
Blood Testing |
|
|
|
|
|
|
|
|
|
|
|
|
|
|
|
|
|
|
|
|
|
|
|
|
| |||
|
|
|
|
|
|
|
|
|
|
|
|
|
|
|
|
|
|
|
|
|
|
|
|
|
| |||
Beckman Coulter |
| $ | 48.75 |
| 66.5 | % | $ | 3,097 |
| $ | 3,774 |
| 1.5 | x | 1.4 | x | 15.5 | x | 16.1 | x | 13.7 | x | 14.1 | % | 1.14 | x | 0.97 | x |
Bio-Rad Laboratories |
| 55.69 |
| 89.0 | % | 1,488 |
| 1,582 |
| 1.3 |
| NA |
| 18.2 |
| 15.5 |
| NM |
| 10.0 | % | 1.55 |
| NM |
| |||
Biosite |
| 53.89 |
| 78.2 | % | 1,005 |
| 876 |
| 2.8 |
| 2.5 |
| 17.1 |
| 17.3 |
| 16.6 |
| 15.8 | % | 1.09 |
| 1.05 |
| |||
Cytyc |
| 24.76 |
| 85.2 | % | 2,851 |
| 3,006 |
| 5.0 |
| 4.2 |
| 24.2 |
| 20.7 |
| 16.7 |
| 18.9 | % | 1.09 |
| 0.88 |
| |||
Dade Behring Holdings |
| 34.63 |
| 89.5 | % | 1,584 |
| 1,941 |
| 1.1 |
| 1.1 |
| 14.1 |
| 23.9 |
| 22.8 |
| 17.8 | % | 1.34 |
| 1.28 |
| |||
Digene |
| 29.99 |
| 93.3 | % | 610 |
| 565 |
| 3.1 |
| 2.7 |
| 79.6 |
| 40.1 |
| 20.4 |
| 30.0 | % | 1.34 |
| 0.68 |
| |||
Diagnostic Products |
| 41.81 |
| 72.4 | % | 1,244 |
| 1,171 |
| 2.2 |
| 2.0 |
| 18.3 |
| 14.7 |
| 12.6 |
| 17.4 | % | 0.84 |
| 0.73 |
| |||
Gen-Probe |
| 40.43 |
| 76.1 | % | 2,102 |
| 1,899 |
| 5.7 |
| 4.8 |
| 39.7 |
| 28.3 |
| 22.7 |
| 21.6 | % | 1.31 |
| 1.06 |
| |||
Immucor |
| 25.44 |
| 70.7 | % | 1,208 |
| 1,176 |
| 5.3 |
| NA |
| 50.4 |
| 21.8 |
| NM |
| 23.3 | % | 0.93 |
| NM |
| |||
Tripath Imaging |
| 6.75 |
| 70.9 | % | 262 |
| 241 |
| 2.1 |
| 1.3 |
| NM |
| 28.4 |
| 9.5 |
| 37.5 | % | 0.76 |
| 0.25 |
| |||
Ventana Medical System |
| 37.61 |
| 83.7 | % | 1,471 |
| 1,425 |
| 5.9 |
| NM |
| 57.7 |
| 36.0 |
| 25.8 |
| 26.2 | % | 1.37 |
| 0.99 |
| |||
|
|
|
|
|
|
|
|
|
|
|
|
|
|
|
|
|
|
|
|
|
|
|
|
|
| |||
|
|
|
|
|
| Mean |
|
|
| 3.3 | x | 2.5 | x | 33.5 | x | 23.9 | x | 17.9 | x | 21.1 | % | 1.16 | x | 0.88 | x | |||
|
|
|
|
|
| Median |
|
|
| 2.8 |
| 2.3 |
| 21.2 |
| 21.8 |
| 16.7 |
| 18.9 | % | 1.14 |
| 0.97 |
| |||
|
|
|
|
|
| High |
|
|
| 5.9 |
| 4.8 |
| 79.6 |
| 40.1 |
| 25.8 |
| 37.5 | % | 1.55 |
| 1.28 |
| |||
|
|
|
|
|
| Low |
|
|
| 1.1 |
| 1.1 |
| 14.1 |
| 14.7 |
| 9.5 |
| 10.0 | % | 0.76 |
| 0.25 |
| |||
Note: Calendarized P/E Multiples and Long-Term EPS Growth Rates are based on I/B/E/S estimates; Projections from Wall Street Equity Research.
29
(in millions, except per share amounts)
|
| Stock |
| % Of |
|
|
|
|
|
|
|
|
| NOPAT |
|
|
|
|
| Long- |
|
|
|
|
| |||
|
| Price |
| 52-Week |
| Equity |
| Enterprise |
| Revenue Multiple |
| Multiple |
| P/E |
| Term |
| PEG |
| |||||||||
Company |
| 10/28/2005 |
| High |
| Value |
| Value |
| CY 2006E |
| CY 2007E |
| LTM |
| CY 2006E |
| CY 2007E |
| EPS Grw. |
| CY 2006E |
| CY 2007E |
| |||
Vaccines |
|
|
|
|
|
|
|
|
|
|
|
|
|
|
|
|
|
|
|
|
|
|
|
|
| |||
|
|
|
|
|
|
|
|
|
|
|
|
|
|
|
|
|
|
|
|
|
|
|
|
|
| |||
Acambis |
| $ | 3.81 |
| 72.4 | % | $ | 409 |
| $ | 286 |
| 1.9 | x | NM |
| NM |
| NM |
| NM |
| NM |
| NM |
| NM |
|
Berna Biotech AG |
| 10.33 |
| 94.9 | % | 388 |
| 306 |
| 1.7 |
| 1.4 |
| NM |
| 51.0 |
| NM |
| 3.0 | % | NM |
| NM |
| |||
CSL Limited |
| 27.57 |
| 90.8 | % | 5,108 |
| 5,318 |
| 2.5 |
| 2.4 |
| 7.0 |
| 18.6 |
| NM |
| 16.4 | % | 1.13 |
| NM |
| |||
Nabi Biopharmaceuticals |
| 11.75 |
| 73.4 | % | 718 |
| 704 |
| 4.2 |
| 3.0 |
| NM |
| NM |
| NM |
| NM |
| NM |
| NM |
| |||
|
|
|
|
|
|
|
|
|
|
|
|
|
|
|
|
|
|
|
|
|
|
|
|
|
| |||
|
|
|
|
|
| Mean |
|
|
| 2.6 | x | 2.2 | x | 7.0 | x | 34.8 | x | NM |
| 9.7 | % | 1.13 | x | NM |
| |||
|
|
|
|
|
| Median |
|
|
| 2.2 |
| 2.4 |
| 7.0 |
| 34.8 |
| NM |
| 9.7 | % | 1.13 |
| NM |
| |||
|
|
|
|
|
| High |
|
|
| 4.2 |
| 3.0 |
| 7.0 |
| 51.0 |
| — |
| 16.4 | % | 1.13 |
| — |
| |||
|
|
|
|
|
| Low |
|
|
| 1.7 |
| 1.4 |
| 7.0 |
| 18.6 |
| — |
| 3.0 | % | 1.13 |
| — |
| |||
(in millions, except per share amounts)
|
| Stock |
| % Of |
|
|
|
|
|
|
|
|
| NOPAT |
|
|
|
|
| Long- |
|
|
|
|
| |||
|
| Price |
| 52-Week |
| Equity |
| Enterprise |
| Revenue Multiple |
| Multiple |
| P/E |
| Term |
| PEG |
| |||||||||
Company |
| 10/28/2005 |
| High |
| Value |
| Value |
| CY 2006E |
| CY 2007E |
| LTM |
| CY 2006E |
| CY 2007E |
| EPS Grw. |
| CY 2006E |
| CY 2007E |
| |||
Biotech |
|
|
|
|
|
|
|
|
|
|
|
|
|
|
|
|
|
|
|
|
|
|
|
|
| |||
|
|
|
|
|
|
|
|
|
|
|
|
|
|
|
|
|
|
|
|
|
|
|
|
|
| |||
Allergan |
| $ | 88.57 |
| 92.8 | % | $ | 12,574 |
| $ | 11,758 |
| 4.8 | x | 4.4 | x | 28.7 | x | 23.6 | x | 20.1 | x | 17.5 | % | 1.35 | x | 1.15 | x |
Biogen Idec |
| 38.49 |
| 55.0 | % | 13,167 |
| 11,408 |
| 4.3 |
| 4.0 |
| 23.3 |
| 19.5 |
| 17.9 |
| 14.2 | % | 1.37 |
| 1.26 |
| |||
Celgene |
| 53.82 |
| 91.5 | % | 10,873 |
| 10,149 |
| 13.5 |
| 9.8 |
| NM |
| 54.0 |
| 36.4 |
| 47.5 | % | 1.14 |
| 0.77 |
| |||
Cephalon |
| 45.36 |
| 86.8 | % | 2,660 |
| 5,581 |
| 3.8 |
| 3.8 |
| 34.1 |
| 14.5 |
| 13.2 |
| 19.4 | % | 0.75 |
| 0.68 |
| |||
Elan |
| 7.97 |
| 26.2 | % | 3,476 |
| 4,042 |
| 7.6 |
| 6.7 |
| NM |
| NM |
| NM |
| 15.8 | % | NM |
| NM |
| |||
Forest Laboratories |
| 37.35 |
| 78.7 | % | 12,935 |
| 11,104 |
| 3.3 |
| 3.1 |
| 14.2 |
| 14.5 |
| 12.4 |
| 13.0 | % | 1.11 |
| 0.95 |
| |||
Genzyme |
| 71.76 |
| 94.2 | % | 19,836 |
| 19,385 |
| 6.1 |
| 5.4 |
| 81.5 |
| 26.2 |
| 23.3 |
| 19.2 | % | 1.36 |
| 1.21 |
| |||
Gilead Sciences |
| 47.12 |
| 95.3 | % | 22,289 |
| 20,629 |
| 9.0 |
| 7.9 |
| 33.6 |
| 26.3 |
| 24.2 |
| 19.5 | % | 1.35 |
| 1.24 |
| |||
MedImmune |
| 34.00 |
| 95.4 | % | 8,508 |
| 7,638 |
| 5.5 |
| 4.8 |
| NM |
| 74.4 |
| 47.8 |
| 24.5 | % | 3.04 |
| 1.95 |
| |||
Millennium Pharmaceuticals |
| 8.96 |
| 66.3 | % | 2,781 |
| 2,381 |
| 4.7 |
| 4.1 |
| NM |
| NM |
| NM |
| 15.0 | % | NM |
| NM |
| |||
Serono |
| 16.21 |
| 82.7 | % | 7,171 |
| 5,579 |
| 2.0 |
| 1.7 |
| NM |
| 15.5 |
| 13.6 |
| 18.0 | % | 0.86 |
| 0.75 |
| |||
|
|
|
|
|
|
|
|
|
|
|
|
|
|
|
|
|
|
|
|
|
|
|
|
|
| |||
|
|
|
|
|
| Mean |
|
|
| 5.9 | x | 5.1 | x | 35.9 | x | 29.8 | x | 23.2 | x | 20.3 | % | 1.37 | x | 1.11 | x | |||
|
|
|
|
|
| Median |
|
|
| 4.8 |
| 4.4 |
| 31.1 |
| 23.6 |
| 20.1 |
| 18.0 | % | 1.35 |
| 1.15 |
| |||
|
|
|
|
|
| High |
|
|
| 13.5 |
| 9.8 |
| 81.5 |
| 74.4 |
| 47.8 |
| 47.5 | % | 3.04 |
| 1.95 |
| |||
|
|
|
|
|
| Low |
|
|
| 2.0 |
| 1.7 |
| 14.2 |
| 14.5 |
| 12.4 |
| 13.0 | % | 0.75 |
| 0.68 |
| |||
Note: Calendarized P/E Multiples and Long-Term EPS Growth Rates are based on I/B/E/S estimates; Projections from Wall Street Equity Research.
30
Heron Consolidated Discounted Cash Flow Analysis – Summary
[CHART]
31
Heron Consolidated Discounted Cash Flow Analysis
Long-Term Discounted Cash Flow Analysis |
|
|
|
|
|
|
|
|
|
|
|
|
|
|
|
|
|
|
| |||||||||
Perpetual Growth Rate (%) |
| 2.0 |
| 3.0 |
| 4.0 |
| |||||||||||||||||||||
Discount Rate |
| 10.0% |
| 11.0% |
| 12.0% |
| 10.0% |
| 11.0% |
| 12.0% |
| 10.0% |
| 11.0% |
| 12.0% |
| |||||||||
|
|
|
|
|
|
|
|
|
|
|
|
|
|
|
|
|
|
|
| |||||||||
Present Value of (1) |
|
|
|
|
|
|
|
|
|
|
|
|
|
|
|
|
|
|
| |||||||||
Cash Flows - Year 1 |
| $ | 36 |
| $ | 36 |
| $ | 36 |
| $ | 36 |
| $ | 36 |
| $ | 36 |
| $ | 36 |
| $ | 36 |
| $ | 36 |
|
Cash Flows - Year 2-11 |
| 3,751 |
| 3,549 |
| 3,362 |
| 3,751 |
| 3,549 |
| 3,362 |
| 3,751 |
| 3,549 |
| 3,362 |
| |||||||||
Terminus |
| 5,216 |
| 4,245 |
| 3,501 |
| 6,020 |
| 4,823 |
| 3,928 |
| 7,092 |
| 5,565 |
| 4,462 |
| |||||||||
Aggregate Value |
| $ | 9,003 |
| $ | 7,831 |
| $ | 6,899 |
| $ | 9,807 |
| $ | 8,408 |
| $ | 7,326 |
| $ | 10,879 |
| $ | 9,151 |
| $ | 7,860 |
|
|
|
|
|
|
|
|
|
|
|
|
|
|
|
|
|
|
|
|
| |||||||||
Equity Value (3) |
| $ | 8,915 |
| $ | 7,743 |
| $ | 6,811 |
| $ | 9,719 |
| $ | 8,320 |
| $ | 7,238 |
| $ | 10,791 |
| $ | 9,063 |
| $ | 7,772 |
|
Implied Share Price(2) |
| $ | 46.45 |
| $ | 40.64 |
| $ | 35.93 |
| $ | 50.30 |
| $ | 43.53 |
| $ | 38.09 |
| $ | 55.33 |
| $ | 47.17 |
| $ | 40.79 |
|
Premium over Pre-Announcement |
| 27.5 | % | 11.5 |
| (1.4 | )% | 38.0 |
| 19.5 | % | 4.5 |
| 51.8 | % | 29.4 |
| 11.9 | % | |||||||||
|
|
|
|
|
|
|
|
|
|
|
|
|
|
|
|
|
|
|
| |||||||||
Terminal Value Analysis |
|
|
|
|
|
|
|
|
|
|
|
|
|
|
|
|
|
|
| |||||||||
% Value in Terminus |
| 57.9 | % | 54.2 |
| 50.7 | % | 61.4 |
| 57.4 | % | 53.6 |
| 65.2 | % | 60.8 |
| 56.8 | % | |||||||||
% Value in Cash Flows |
| 42.1 | % | 45.8 |
| 49.3 | % | 38.6 |
| 42.6 | % | 46.4 |
| 34.8 | % | 39.2 |
| 43.2 | % | |||||||||
|
|
|
|
|
|
|
|
|
|
|
|
|
|
|
|
|
|
|
| |||||||||
Implied Terminal Multiples |
|
|
|
|
|
|
|
|
|
|
|
|
|
|
|
|
|
|
| |||||||||
LTM Sales Multiple |
| 3.3 | x | 2.9 | x | 2.7 | x | 3.8 | x | 3.3 | x | 3.0 | x | 4.5 | x | 3.9 | x | 3.4 | x | |||||||||
LTM EBITDA Multiple |
| 9.0 |
| 8.1 |
| 7.3 |
| 10.4 |
| 9.2 |
| 8.2 |
| 12.3 |
| 10.6 |
| 9.3 |
| |||||||||
LTM NOPAT Multiple |
| 14.1 |
| 12.6 |
| 11.4 |
| 16.3 |
| 14.3 |
| 12.8 |
| 19.2 |
| 16.5 |
| 14.5 |
| |||||||||
Source: Heron Management Forecast as of October 2005
(1) Valuation as of 9/30/05 assuming mid-period convention
(2) Based on fully diluted share count and pre-announcement share price of $36.44 as of 8/31/05
(3) Assumes current net debt of $88.1MM as of 3Q05 earnings release
32
Discounted Cash Flow Sensitivity Analysis
Deviation from Midpoint Valuation (1)
$
Overall Company |
| % from Base Value ($43.53) |
|
Discount Rate -/+1.0% (Base 11.0%) |
| (12.5)% – 15.6% |
|
Perpetual Growth Rate -/+1.0% (Base 3.0%) |
| (6.6)% – 8.4% |
|
Portfolio |
|
|
|
TFPI Probability 0% – 100% |
| (25.4)% – 15.6% |
|
Flu Cell Culture Probability 0% – 100% | [CHART] | (8.8)% – 13.1% |
|
Increase U.S. FCC POS to 60% |
| 0.0% – 5.2% |
|
Flu Cell Culture Probability 0% with Increase in Egg Flu Penetration |
| (5.2)% – 0.0% |
|
Pandemic Stockpile Scenario (2) |
| 0.0% – 8.9% |
|
Pandemic Preparedness Scenario (3) |
| 0.0% – 9.3% |
|
(1) Base DCF value of $43.53 assumes a discount rate of 11.0% and a perpetual growth rate of 3.0%
(2) Assumes additional 160MM doses (2 doses each for 80MM people) of egg flu pandemic stockpile in 2008 and 2011 with price per dose of $9.68 ($5.18 bulk, $3.50 premium, $1.00 fill & finish)
(3) Assumes US flu cell culture accelerated by three years due to government pressure; US POS increased to match EU POS of 75%
Source: Heron Management Forecast as of October 2005
33
Heron Sum-of-the-Parts Analysis
Perpetual Growth Methodology (1)
Sum-of-the-Parts Valuation
$
[CHART]
(1) Assumes a discount rate of 11.0%
(2) As of August 31, 2005
(3) Assumes perpetual growth rate of 2.0% for BioPharma, 3.0% for Vaccines, 3.0% for Blood Testing and (1.0)% for Corporate Royalties
Source: Heron Management Forecast as of October 2005
34
35
36
Weighted Average Cost of Capital
($MM, except per share amounts)
|
| Stock |
|
|
| FD Capitalization (1) |
|
|
| Beta (2) |
| Cost of (4) |
| Current |
| WACC Assuming Varying Levels |
| |||||||||||||
Company |
| 10/28/05 |
| Equity |
| Equity % |
| Debt |
| Debt % |
| Equity |
| Asset (3) |
| Equity |
| Asset |
| WACC (3),(4),(5) |
| 0.0% |
| 11.8% |
| 20.0% |
| |||
|
|
|
|
|
|
|
|
|
|
|
|
|
|
|
|
|
|
|
|
|
|
|
|
|
|
|
| |||
Heron |
| $ | 43.40 |
| $ | 8,294 |
| 88.2 | % | $ | 1,106 |
| 11.8 | % | 0.994 |
| 0.915 |
| 11.9 | % | 11.3 | % | 10.9 | % | 11.3 | % | 10.9 | % | 10.7 | % |
|
|
|
|
|
|
|
|
|
|
|
|
|
|
|
|
|
|
|
|
|
|
|
|
|
|
|
| |||
Biotech |
|
|
|
|
|
|
|
|
|
|
|
|
|
|
|
|
|
|
|
|
|
|
|
|
|
|
| |||
Allergan Inc |
| $ | 88.57 |
| $ | 12,574 |
| 99.5 | % | $ | 57 |
| 0.5 | % | 0.695 |
| 0.693 |
| 9.7 | % | 9.7 | % | 9.7 | % | 9.7 | % | 9.4 | % | 9.2 | % |
Biogen Idec Inc |
| 38.49 |
| 13,167 |
| 99.7 | % | 42 |
| 0.3 | % | 1.526 |
| 1.523 |
| 15.7 | % | 15.7 | % | 15.6 | % | 15.7 | % | 15.1 | % | 14.7 | % | |||
Celgene Corp |
| 53.82 |
| 10,873 |
| 100.0 | % | 0 |
| 0.0 | % | 1.444 |
| 1.444 |
| 15.1 | % | 15.1 | % | 15.1 | % | 15.1 | % | 14.6 | % | 14.2 | % | |||
Cephalon Inc |
| 45.36 |
| 2,660 |
| 56.0 | % | 2,090 |
| 44.0 | % | 1.259 |
| 0.833 |
| 13.8 | % | 10.7 | % | 9.4 | % | 10.7 | % | 10.4 | % | 10.1 | % | |||
Elan Corp Plc -Adr |
| 7.97 |
| 3,476 |
| 66.3 | % | 1,763 |
| 33.7 | % | 1.954 |
| 1.470 |
| 18.8 | % | 15.3 | % | 13.8 | % | 15.3 | % | 14.8 | % | 14.4 | % | |||
Forest Laboratories -Cl A |
| 37.35 |
| 12,935 |
| 100.0 | % | 0 |
| 0.0 | % | 1.038 |
| 1.038 |
| 12.2 | % | 12.2 | % | 12.2 | % | 12.2 | % | 11.8 | % | 11.5 | % | |||
Genzyme Corp |
| 71.76 |
| 19,836 |
| 97.5 | % | 499 |
| 2.5 | % | 1.024 |
| 1.008 |
| 12.1 | % | 12.0 | % | 11.9 | % | 12.0 | % | 11.6 | % | 11.3 | % | |||
Gilead Sciences Inc |
| 47.12 |
| 22,289 |
| 100.0 | % | 0 |
| 0.0 | % | 1.150 |
| 1.150 |
| 13.0 | % | 13.0 | % | 13.0 | % | 13.0 | % | 12.5 | % | 12.2 | % | |||
Medimmune Inc |
| 34.00 |
| 8,508 |
| 94.4 | % | 505 |
| 5.6 | % | 1.208 |
| 1.163 |
| 13.4 | % | 13.1 | % | 12.9 | % | 13.1 | % | 12.6 | % | 12.3 | % | |||
Millennium Pharmaceuticals |
| 8.96 |
| 2,781 |
| 93.6 | % | 189 |
| 6.4 | % | 1.883 |
| 1.803 |
| 18.3 | % | 17.7 | % | 17.3 | % | 17.7 | % | 17.1 | % | 16.6 | % | |||
Serono Sa -Adr |
| 16.21 |
| 7,171 |
| 91.6 | % | 653 |
| 8.4 | % | 0.727 |
| 0.686 |
| 9.9 | % | 9.6 | % | 9.4 | % | 9.6 | % | 9.3 | % | 9.1 | % | |||
Median |
|
|
|
|
| 97.5 | % |
|
| 2.5 | % | 1.208 |
| 1.150 |
| 13.4 | % | 13.0 | % | 12.9 | % | 13.0 | % | 12.5 | % | 12.2 | % | |||
Mean |
|
|
|
|
| 90.8 | % |
|
| 9.2 | % | 1.264 |
| 1.165 |
| 13.8 | % | 13.1 | % | 12.8 | % | 13.1 | % | 12.6 | % | 12.3 | % | |||
BioPharma & Blood Testing |
|
|
|
|
|
|
|
|
|
|
|
|
|
|
|
|
|
|
|
|
|
|
|
|
|
|
| |||
Johnson & Johnson |
| $ | 62.95 |
| $ | 189,437 |
| 98.6 | % | $ | 2,633 |
| 1.4 | % | 0.574 |
| 0.569 |
| 8.8 | % | 8.8 | % | 8.8 | % | 8.8 | % | 8.5 | % | 8.3 | % |
Abbott Laboratories |
| 42.75 |
| 66,807 |
| 92.1 | % | 5,737 |
| 7.9 | % | 0.653 |
| 0.618 |
| 9.4 | % | 9.2 | % | 9.0 | % | 9.2 | % | 8.9 | % | 8.7 | % | |||
Bayer Ag |
| 34.63 |
| 25,293 |
| 74.4 | % | 8,692 |
| 25.6 | % | 0.867 |
| 0.709 |
| 10.9 | % | 9.8 | % | 9.1 | % | 9.8 | % | 9.5 | % | 9.3 | % | |||
Roche Hldgs Ag |
| 149.62 |
| 129,228 |
| 89.8 | % | 14,705 |
| 10.2 | % | 0.634 |
| 0.590 |
| 9.3 | % | 9.0 | % | 8.7 | % | 9.0 | % | 8.7 | % | 8.5 | % | |||
Median |
|
|
|
|
| 90.9 | % |
|
| 9.1 | % | 0.644 |
| 0.604 |
| 9.3 | % | 9.1 | % | 8.9 | % | 9.1 | % | 8.8 | % | 8.6 | % | |||
Mean |
|
|
|
|
| 88.7 | % |
|
| 11.3 | % | 0.682 |
| 0.622 |
| 9.6 | % | 9.2 | % | 8.9 | % | 9.2 | % | 8.9 | % | 8.7 | % | |||
BioPharma & Vaccines |
|
|
|
|
|
|
|
|
|
|
|
|
|
|
|
|
|
|
|
|
|
|
|
|
|
|
| |||
Glaxosmithkline Plc -Adr |
| $ | 26.49 |
| $ | 151,966 |
| 95.6 | % | $ | 6,920 |
| 4.4 | % | 0.380 |
| 0.369 |
| 7.4 | % | 7.4 | % | 7.3 | % | 7.4 | % | 7.2 | % | 7.0 | % |
Medimmune Inc |
| 34.00 |
| 8,508 |
| 94.4 | % | 505 |
| 5.6 | % | 1.208 |
| 1.163 |
| 13.4 | % | 13.1 | % | 12.9 | % | 13.1 | % | 12.6 | % | 12.3 | % | |||
Merck & Co |
| 27.54 |
| 60,541 |
| 89.4 | % | 7,167 |
| 10.6 | % | 0.858 |
| 0.797 |
| 10.9 | % | 10.4 | % | 10.1 | % | 10.4 | % | 10.1 | % | 9.9 | % | |||
Sanofi-Aventis -Adr |
| 80.31 |
| 109,665 |
| 87.9 | % | 15,044 |
| 12.1 | % | 0.612 |
| 0.562 |
| 9.1 | % | 8.7 | % | 8.5 | % | 8.7 | % | 8.5 | % | 8.3 | % | |||
Wyeth |
| 44.70 |
| 60,229 |
| 88.3 | % | 7,956 |
| 11.7 | % | 0.635 |
| 0.585 |
| 9.3 | % | 8.9 | % | 8.6 | % | 8.9 | % | 8.6 | % | 8.5 | % | |||
Median |
|
|
|
|
| 89.4 | % |
|
| 10.6 | % | 0.635 |
| 0.585 |
| 9.3 | % | 8.9 | % | 8.6 | % | 8.9 | % | 8.6 | % | 8.5 | % | |||
Mean |
|
|
|
|
| 91.1 | % |
|
| 8.9 | % | 0.739 |
| 0.695 |
| 10.0 | % | 9.7 | % | 9.5 | % | 9.7 | % | 9.4 | % | 9.2 | % | |||
Large Cap Biotech |
|
|
|
|
|
|
|
|
|
|
|
|
|
|
|
|
|
|
|
|
|
|
|
|
|
|
| |||
Amgen Inc |
| $ | 75.78 |
| $ | 94,959 |
| 96.0 | % | $ | 3,952 |
| 4.0 | % | 1.075 |
| 1.047 |
| 12.4 | % | 12.2 | % | 12.1 | % | 12.2 | % | 11.8 | % | 11.5 | % |
Biogen Idec Inc |
| 38.49 |
| 13,167 |
| 99.7 | % | 42 |
| 0.3 | % | 1.526 |
| 1.523 |
| 15.7 | % | 15.7 | % | 15.6 | % | 15.7 | % | 15.1 | % | 14.7 | % | |||
Celgene Corp |
| 53.82 |
| 10,873 |
| 100.0 | % | 0 |
| 0.0 | % | 1.444 |
| 1.444 |
| 15.1 | % | 15.1 | % | 15.1 | % | 15.1 | % | 14.6 | % | 14.2 | % | |||
Genentech Inc |
| 87.72 |
| 96,269 |
| 97.5 | % | 2,485 |
| 2.5 | % | 1.237 |
| 1.217 |
| 13.6 | % | 13.5 | % | 13.4 | % | 13.5 | % | 13.0 | % | 12.7 | % | |||
Genzyme Corp |
| 71.76 |
| 19,836 |
| 97.5 | % | 499 |
| 2.5 | % | 1.024 |
| 1.008 |
| 12.1 | % | 12.0 | % | 11.9 | % | 12.0 | % | 11.6 | % | 11.3 | % | |||
Gilead Sciences Inc |
| 47.12 |
| 22,289 |
| 100.0 | % | 0 |
| 0.0 | % | 1.150 |
| 1.150 |
| 13.0 | % | 13.0 | % | 13.0 | % | 13.0 | % | 12.5 | % | 12.2 | % | |||
Medimmune Inc |
| 34.00 |
| 8,508 |
| 94.4 | % | 505 |
| 5.6 | % | 1.208 |
| 1.163 |
| 13.4 | % | 13.1 | % | 12.9 | % | 13.1 | % | 12.6 | % | 12.3 | % | |||
Median |
|
|
|
|
| 97.5 | % |
|
| 2.5 | % | 1.208 |
| 1.163 |
| 13.4 | % | 13.1 | % | 13.0 | % | 13.1 | % | 12.6 | % | 12.3 | % | |||
Mean |
|
|
|
|
| 97.9 | % |
|
| 2.1 | % | 1.238 |
| 1.222 |
| 13.6 | % | 13.5 | % | 13.4 | % | 13.5 | % | 13.0 | % | 12.7 | % | |||
Overall Median |
|
|
|
|
| 95.6 | % |
|
| 4.4 | % | 1.075 |
| 1.038 |
| 12.4 | % | 12.2 | % | 12.1 | % | 12.2 | % | 11.8 | % | 11.5 | % | |||
Overall Mean |
|
|
|
|
| 92.4 | % |
|
| 7.6 | % | 1.074 |
| 1.012 |
| 12.4 | % | 12.0 | % | 11.7 | % | 12.0 | % | 11.6 | % | 11.3 | % | |||
(1) Converts treated as debt.
(2) Based on BARRA research dated September 30, 2005.
(3) Based on marginal tax rate of 35%.
(4) Based on a 20-Year Interpolated U.S. Treasury yield of 4.70% as of October 23, 2005, and equity market risk premium of 7.20%. (Source: Bloomberg and Ibbotson)
(5) Based on 6.0% cost of debt.
37
38
Other Metrics - Select Biotechnology Precedent Acquisitions
Biotechnology Precedent Transactions
Date |
|
|
|
|
| Offer |
| Transaction Value |
| % Premium from |
| Aggregate Value / Revenue |
| Implied P/E |
| |||||||||||||||
Ann. |
| Acquiror |
| Target |
| Per Share |
| Equity |
| Aggregate |
| 1 Day Prior |
| 1 Month Prior |
| 3 Month Prior |
| LTM |
| 1-yr. Fwd. |
| 2-yr. Fwd. |
| 1-yr. Fwd. |
| 2-yr. Fwd. |
| |||
9/7/2005 |
| GlaxoSmithKline |
| ID Biomedical |
| $ | 29.54 |
| $ | 1,428 |
| $ | 1,506 |
| 13.0 | % | 42.7 | % | 74.7 | % | 63.7 | x | 26.9 | x | 6.8 | x | NM |
| NM |
|
8/22/2005 |
| OSI Pharma |
| Eyetech |
| 20.00 |
| 935 |
| 673 |
| 43.0 | % | 64.1 | % | (15.8 | )% | 5.8 | x | 2.7 | x | 1.6 | x | NM |
| 21.7 | x | |||
7/21/2005 |
| MGI Pharma |
| Guilford |
| 3.75 |
| 178 |
| 266 |
| 57.5 | % | 41.1 | % | 53.6 | % | 5.3 | x | 5.8 | x | 6.3 | x | NM |
| NM |
| |||
6/16/2005 |
| Pfizer |
| Vicuron |
| 29.10 |
| 1,915 |
| 1,788 |
| 84.2 | % | 67.2 | % | 71.3 | % | NM |
| NM |
| 17.3 | x | NM |
| NM |
| |||
5/4/2005 |
| Genzyme |
| Bone Care International |
| 33.00 |
| 725 |
| 606 |
| 38.5 | % | 26.5 | % | 11.8 | % | 8.2 | x | 6.1 | x | 5.0 | x | 46.2 | x | 29.9 | x | |||
4/29/2005 |
| GlaxoSmithKline |
| Corixa Corp |
| 4.40 |
| 300 |
| 333 |
| 47.7 | % | 37.5 | % | 19.9 | % | 13.3 | x | 9.9 | x | 8.8 | x | NM |
| NM |
| |||
4/21/2005 |
| Shire Pharmaceuticals |
| Transkaryotic Therapies |
| 37.00 |
| 1,570 |
| 1,509 |
| 13.4 | % | 54.5 | % | 43.8 | % | 19.3 | x | 15.8 | x | 14.1 | x | NM |
| NM |
| |||
4/19/2005 |
| Jazz Pharmaceuticals |
| Orphan Medical |
| 10.75 |
| 125 |
| 112 |
| 25.7 | % | 8.8 | % | 26.3 | % | 4.7 | x | 3.3 | x | 2.5 | x | NM |
| 44.8 | x | |||
6/14/2004 |
| QLT |
| Atrix |
| 38.50 |
| 787 |
| 683 |
| 27.2 | % | 27.9 | % | 38.8 | % | 13.6 | x | 10.0 | x | 7.3 | x | 60.0 | x | 26.8 | x | |||
5/18/2004 |
| UCB |
| Celltech |
| 19.44 |
| 2,687 |
| 2,413 |
| 27.9 | % | 20.2 | % | 20.1 | % | 3.9 | x | NA |
| NA |
| NM |
| NM |
| |||
3/29/2004 |
| Amgen |
| Tularik |
| 25.00 |
| 1,457 |
| 1,285 |
| 47.1 | % | 35.9 | % | 47.1 | % | 41.9 | x | 37.7 | x | 33.4 | x | NM |
| NM |
| |||
2/26/2004 |
| Genzyme Corp. |
| Ilex Oncology |
| 26.00 |
| 1,050 |
| 889 |
| 22.0 | % | 9.0 | % | 26.3 | % | 25.6 | x | 23.8 | x | 12.8 | x | NM |
| NM |
| |||
12/21/2003 |
| Pfizer |
| Esperion |
| 35.00 |
| 1,281 |
| 1,198 |
| 54.2 | % | 57.6 | % | 70.6 | % | NM |
| NA |
| NA |
| NM |
| NM |
| |||
8/4/2003 |
| Genzyme |
| Sangstat |
| 22.50 |
| 611 |
| 532 |
| 45.4 | % | 59.0 | % | 86.1 | % | 4.2 | x | NA |
| NA |
| NM |
| NM |
| |||
5/19/2003 |
| Chiron |
| PowderJect |
| 9.00 |
| 878 |
| 789 |
| 6.5 | % | 32.5 | % | 40.1 | % | 3.0 | x | 3.0 | x | 2.6 | x | 21.4 | x | 15.4 | x | |||
2/10/2003 |
| Johnson & Johnson |
| Scios |
| 45.00 |
| 2,351 |
| 2,356 |
| 6.6 | % | 25.4 | % | 52.5 | % | 30.5 | x | 12.1 | x | 8.7 | x | NM |
| NM |
| |||
12/17/2001 |
| Amgen |
| Immunex |
| 29.15 |
| 16,677 |
| 15,660 |
| 13.8 | % | 12.0 | % | 70.6 | % | 16.3 | x | 12.5 | x | 8.5 | x | NM |
| NM |
| |||
12/6/2001 |
| Millennium |
| COR Therapeutics |
| 35.00 |
| 2,102 |
| 2,069 |
| 77.3 | % | 64.0 | % | 29.0 | % | 16.5 | x | 10.7 | x | 9.2 | x | NM |
| 48.6 | x | |||
12/3/2001 |
| MedImmune |
| Aviron |
| 47.41 |
| 1,607 |
| 1,392 |
| 28.0 | % | 47.9 | % | 95.1 | % | 41.2 | x | 93.3 | x | 11.5 | x | NM |
| NM |
| |||
3/27/2001 |
| Johnson & Johnson |
| Alza |
| 41.83 |
| 12,004 |
| 11,000 |
| 8.0 | % | 1.4 | % | (3.0 | )% | 11.1 | x | 5.7 | x | 8.1 | x | 42.3 | x | 34.0 | x | |||
12/11/2000 |
| Shire |
| BioChem Pharma |
| 37.00 |
| 4,004 |
| 3,732 |
| 39.6 | % | 52.1 | % | 89.6 | % | 17.2 | x | 16.9 | x | 18.3 | x | NM |
| NM |
| |||
9/11/2000 |
| Elan |
| Dura |
| 35.00 |
| 1,757 |
| 1,820 |
| 22.3 | % | 49.3 | % | 155.7 | % | 5.5 | x | 5.7 | x | 5.7 | x | 53.0 | x | 47.9 | x | |||
9/11/2000 |
| Genzyme General |
| GelTex |
| 47.50 |
| 1,050 |
| 938 |
| 27.1 | % | 33.8 | % | 122.2 | % | NM |
| NM |
| NM |
| NM |
| NM |
| |||
8/14/2000 |
| Chiron |
| Pathogenesis |
| 38.50 |
| 697 |
| 660 |
| 17.6 | % | 38.7 | % | 96.8 | % | 8.7 | x | 7.7 | x | 6.3 | x | NM |
| 60.2 | x | |||
3/6/2000 |
| Elan |
| Liposome Comp. |
| 15.28 |
| 742 |
| 679 |
| 6.3 | % | 20.4 | % | 42.1 | % | 7.6 | x | 6.8 | x | 6.5 | x | 50.2 | x | 46.9 | x | |||
|
|
|
|
|
|
|
|
|
| Mean: |
| 32.0 | % | 37.2 | % | 54.6 | % | 16.7 | x | 15.8 | x | 9.6 | x | 45.5 | x | 37.6 | x | |||
|
|
|
|
|
|
|
|
|
| Median: |
| 27.2 | % | 37.5 | % | 47.1 | % | 12.2 | x | 10.0 | x | 8.1 | x | 48.2 | x | 39.4 | x | |||
Source: FactSet and company filings
39
Other Metrics - Premiums Paid in Minority Squeeze Outs
1 -Day Premiums Paid in Precedent Squeeze Out Transactions
[CHART]
Note: Total number of deals includes some squeeze outs where pre-transaction ownership was not disclosed
Spot Price Premiums at Various Ownership Levels (1)
|
| All Transactions |
| <60% Ownership |
| 60-70% Ownership |
| 70-80% Ownership |
| >80% Ownership |
| ||||||||||
|
| 1-Day |
| 1-Month |
| 1-Day |
| 1-Month |
| 1-Day |
| 1-Month |
| 1-Day |
| 1-Month |
| 1-Day |
| 1-Month |
|
75th Percentile |
| 35 | % | 42 | % | 42 | % | 34 | % | 26 | % | 42 | % | 46 | % | 52 | % | 27 | % | 51 | % |
Mean |
| 25 | % | 29 | % | 34 | % | 27 | % | 22 | % | 33 | % | 30 | % | 38 | % | 21 | % | 28 | % |
Median |
| 20 | % | 25 | % | 25 | % | 19 | % | 20 | % | 29 | % | 27 | % | 27 | % | 15 | % | 24 | % |
25th Percentile |
| 10 | % | 12 | % | 18 | % | 16 | % | 13 | % | 19 | % | 11 | % | 16 | % | 4 | % | 7 | % |
Note: Boxed items are represented in graph.
(1) Represents acquiror’s pre-transaction ownership in target.
40
41
BioPharma Segment P&L
BioPharma |
| POS |
| 2006 |
| 2007 |
| 2008 |
| 2009 |
| 2010 |
| 2011 |
| 2012 |
| 2013 |
| 2014 |
| 2015 |
|
|
|
|
|
|
|
|
|
|
|
|
|
|
|
|
|
|
|
|
|
|
|
|
|
REVENUE (Pos-Adj.) |
|
|
|
|
|
|
|
|
|
|
|
|
|
|
|
|
|
|
|
|
|
|
|
Proleukin |
| 100% |
| 107.0 |
| 95.1 |
| 87.4 |
| 83.6 |
| 80.5 |
| 78.5 |
| 77.2 |
| 76.2 |
| 76.0 |
| 75.5 |
|
TOBI |
| 100% |
| 229.2 |
| 239.5 |
| 175.7 |
| 137.0 |
| 96.2 |
| 83.3 |
| 80.9 |
| 79.0 |
| 77.6 |
| 76.6 |
|
Betaseron |
| 100% |
| 150.8 |
| 182.9 |
| 180.9 |
| 187.2 |
| 177.0 |
| 177.5 |
| 165.5 |
| 113.3 |
| 86.0 |
| 68.4 |
|
TFPI |
| 61% |
| 0.0 |
| 0.0 |
| 23.5 |
| 141.1 |
| 356.0 |
| 465.2 |
| 633.7 |
| 635.5 |
| 673.7 |
| 727.4 |
|
258 |
| 15% |
| 0.0 |
| 0.0 |
| 0.0 |
| 0.0 |
| 3.9 |
| 12.3 |
| 35.9 |
| 54.3 |
| 67.5 |
| 78.5 |
|
12.12 |
| 17% |
| 0.0 |
| 0.0 |
| 0.0 |
| 0.0 |
| 0.0 |
| 8.9 |
| 30.1 |
| 60.6 |
| 84.3 |
| 95.1 |
|
TIP |
| 75% |
| 0.0 |
| 0.0 |
| 71.9 |
| 120.0 |
| 170.7 |
| 192.8 |
| 205.1 |
| 220.4 |
| 234.7 |
| 256.4 |
|
CSI |
| NA |
| 0.0 |
| 0.0 |
| 0.0 |
| 0.0 |
| 0.0 |
| 0.0 |
| 0.0 |
| 0.0 |
| 0.0 |
| 0.0 |
|
Other Products |
|
|
| 62.6 |
| 88.9 |
| 112.3 |
| 142.9 |
| 163.6 |
| 176.2 |
| 194.1 |
| 206.2 |
| 239.1 |
| 273.2 |
|
Net Product Sales |
|
|
| 549.5 |
| 606.4 |
| 651.6 |
| 811.7 |
| 1,047.8 |
| 1,194.7 |
| 1,422.4 |
| 1,445.4 |
| 1,538.8 |
| 1,651.3 |
|
Joint Business |
|
|
| 0.0 |
| 0.0 |
| 0.0 |
| 0.0 |
| 0.0 |
| 0.0 |
| 0.0 |
| 0.0 |
| 0.0 |
| 0.0 |
|
Collaborative Agreements |
|
|
| 1.0 |
| 1.0 |
| 1.0 |
| 1.0 |
| 1.0 |
| 1.0 |
| 1.0 |
| 1.0 |
| 1.0 |
| 1.0 |
|
Royalties |
|
|
| 52.2 |
| 35.0 |
| 37.9 |
| 39.4 |
| 35.0 |
| 26.4 |
| 26.6 |
| 26.8 |
| 22.5 |
| 22.6 |
|
Other Revenues |
|
|
| 9.2 |
| 9.6 |
| 9.3 |
| 0.3 |
| 0.3 |
| 0.3 |
| 0.3 |
| 0.3 |
| 0.3 |
| 0.3 |
|
|
|
|
|
|
|
|
|
|
|
|
|
|
|
|
|
|
|
|
|
|
|
|
|
TOTAL BioPharma REVENUE (Pos-Adj) |
|
|
| 612.0 |
| 652.0 |
| 699.9 |
| 852.4 |
| 1,084.1 |
| 1,222.5 |
| 1,450.3 |
| 1,473.4 |
| 1,562.7 |
| 1,675.2 |
|
% Growth |
|
|
| -5.2 | % | 6.5 | % | 7.3 | % | 21.8 | % | 27.2 | % | 12.8 | % | 18.6 | % | 1.6 | % | 6.1 | % | 7.2 | % |
|
|
|
|
|
|
|
|
|
|
|
|
|
|
|
|
|
|
|
|
|
|
|
|
TOTAL BioPharma COGS (Pos-Adj) |
|
|
| 158.5 |
| 177.3 |
| 207.5 |
| 235.0 |
| 261.2 |
| 310.5 |
| 359.7 |
| 380.6 |
| 387.1 |
| 396.1 |
|
% Growth |
|
|
| 3.9 | % | 11.9 | % | 17.0 | % | 13.2 | % | 11.1 | % | 18.9 | % | 15.9 | % | 5.8 | % | 1.7 | % | 2.3 | % |
|
|
|
|
|
|
|
|
|
|
|
|
|
|
|
|
|
|
|
|
|
|
|
|
TOTAL BioPharma GROSS PROFIT (Pos-Adj.) |
|
|
| 453.4 |
| 474.6 |
| 492.4 |
| 617.5 |
| 823.0 |
| 912.0 |
| 1,090.6 |
| 1,092.8 |
| 1,175.6 |
| 1,279.1 |
|
% Margin |
|
|
| 74.1 | % | 72.8 | % | 70.3 | % | 72.4 | % | 75.9 | % | 74.6 | % | 75.2 | % | 74.2 | % | 75.2 | % | 76.4 | % |
|
|
|
|
|
|
|
|
|
|
|
|
|
|
|
|
|
|
|
|
|
|
|
|
TOTAL BioPharma Research & Development (Pos-Adj |
|
|
| 297.2 |
| 305.1 |
| 337.6 |
| 290.7 |
| 287.3 |
| 330.5 |
| 372.8 |
| 389.1 |
| 401.3 |
| 425.2 |
|
% Margin |
|
|
| 48.6 | % | 46.8 | % | 48.2 | % | 34.1 | % | 26.5 | % | 27.0 | % | 25.7 | % | 26.4 | % | 25.7 | % | 25.4 | % |
% Growth |
|
|
| 10.7 | % | 2.6 | % | 10.7 | % | -13.9 | % | -1.2 | % | 15.0 | % | 12.8 | % | 4.4 | % | 3.1 | % | 5.9 | % |
|
|
|
|
|
|
|
|
|
|
|
|
|
|
|
|
|
|
|
|
|
|
|
|
TOTAL BioPharma S&M (Pos-Adj) |
|
|
| 144.9 |
| 162.7 |
| 206.9 |
| 216.3 |
| 222.5 |
| 227.6 |
| 241.2 |
| 253.4 |
| 269.6 |
| 291.3 |
|
% Margin |
|
|
| 23.7 | % | 25.0 | % | 29.6 | % | 25.4 | % | 20.5 | % | 18.6 | % | 16.6 | % | 17.2 | % | 17.3 | % | 17.4 | % |
% Growth |
|
|
| 0.4 | % | 12.3 | % | 27.2 | % | 4.5 | % | 2.9 | % | 2.3 | % | 6.0 | % | 5.1 | % | 6.4 | % | 8.0 | % |
|
|
|
|
|
|
|
|
|
|
|
|
|
|
|
|
|
|
|
|
|
|
|
|
TOTAL BioPharma G&A (Pos-Adj) |
|
|
| 31.3 |
| 32.3 |
| 37.0 |
| 42.7 |
| 53.6 |
| 60.0 |
| 69.8 |
| 73.5 |
| 77.9 |
| 82.7 |
|
% Margin |
|
|
| 5.1 | % | 5.0 | % | 5.3 | % | 5.0 | % | 4.9 | % | 4.9 | % | 4.8 | % | 5.0 | % | 5.0 | % | 4.9 | % |
% Growth |
|
|
| 5.6 | % | 3.1 | % | 14.5 | % | 15.4 | % | 25.5 | % | 11.9 | % | 16.4 | % | 5.3 | % | 6.0 | % | 6.1 | % |
|
|
|
|
|
|
|
|
|
|
|
|
|
|
|
|
|
|
|
|
|
|
|
|
Other Operating Expenses |
|
|
| 12.9 |
| 13.3 |
| 8.5 |
| 0.2 |
| 0.2 |
| 0.2 |
| 0.2 |
| 0.2 |
| 0.2 |
| 0.2 |
|
|
|
|
|
|
|
|
|
|
|
|
|
|
|
|
|
|
|
|
|
|
|
|
|
Biopharma Corporate Overhead Allocation |
|
|
| 0.0 |
| 0.0 |
| 0.0 |
| 0.0 |
| 0.0 |
| 0.0 |
| 0.0 |
| 0.0 |
| 0.0 |
| 0.0 |
|
|
|
|
|
|
|
|
|
|
|
|
|
|
|
|
|
|
|
|
|
|
|
|
|
TOTAL BioPharma OPERATING EXPENSES |
|
|
| 486.4 |
| 513.4 |
| 590.0 |
| 549.9 |
| 563.6 |
| 618.2 |
| 684.0 |
| 716.3 |
| 749.1 |
| 799.4 |
|
|
|
|
|
|
|
|
|
|
|
|
|
|
|
|
|
|
|
|
|
|
|
|
|
TOTAL BioPharma EXPENSES |
|
|
| 644.9 |
| 690.7 |
| 797.6 |
| 784.9 |
| 824.8 |
| 928.7 |
| 1,043.7 |
| 1,096.9 |
| 1,136.2 |
| 1,195.5 |
|
|
|
|
|
|
|
|
|
|
|
|
|
|
|
|
|
|
|
|
|
|
|
|
|
BioPharma OPERATING INCOME (LOSS) |
|
|
| (32.9 | ) | (38.7 | ) | (97.7 | ) | 67.5 |
| 259.4 |
| 293.7 |
| 406.6 |
| 376.5 |
| 426.5 |
| 479.7 |
|
% Margin |
|
|
| NM |
| NM |
| NM |
| 7.9 | % | 23.9 | % | 24.0 | % | 28.0 | % | 25.6 | % | 27.3 | % | 28.6 | % |
% Growth |
|
|
| -173.8 | % | 17.6 | % | 152.1 | % | -169.2 | % | 284.0 | % | 13.2 | % | 38.4 | % | -7.4 | % | 13.3 | % | 12.5 | % |
Source: Heron Management Forecast as of October 2005
42
Vaccines Segment P&L
Vaccines |
| POS |
| 2006 |
| 2007 |
| 2008 |
| 2009 |
| 2010 |
| 2011 |
| 2012 |
| 2013 |
| 2014 |
| 2015 |
|
|
|
|
|
|
|
|
|
|
|
|
|
|
|
|
|
|
|
|
|
|
|
|
|
REVENUE (Pos-Adj.) |
|
|
|
|
|
|
|
|
|
|
|
|
|
|
|
|
|
|
|
|
|
|
|
Egg Flu |
| 100% |
| 545.2 |
| 588.3 |
| 659.7 |
| 598.3 |
| 618.3 |
| 598.3 |
| 476.9 |
| 394.0 |
| 255.5 |
| 116.8 |
|
WW Flu Cell Culture |
| 30% US / 75% EU |
| 0.0 |
| 0.0 |
| 0.0 |
| 92.7 |
| 125.5 |
| 150.3 |
| 209.8 |
| 253.4 |
| 326.6 |
| 397.0 |
|
Men B NZ |
| 100% |
| 3.0 |
| 2.4 |
| 2.4 |
| 2.4 |
| 2.4 |
| 2.4 |
| 2.4 |
| 2.4 |
| 2.4 |
| 2.4 |
|
Men B EU |
| 25% |
| 0.0 |
| 0.0 |
| 0.0 |
| 31.9 |
| 100.4 |
| 8.1 |
| 6.6 |
| 5.7 |
| 4.9 |
| 4.2 |
|
Men B US |
| 25% |
| 0.0 |
| 0.0 |
| 0.0 |
| 169.6 |
| 276.0 |
| 32.9 |
| 34.3 |
| 19.3 |
| 16.6 |
| 14.3 |
|
Men ABCYW |
| 15% |
| 0.0 |
| 0.0 |
| 0.0 |
| 0.0 |
| 0.0 |
| 477.9 |
| 483.7 |
| 283.6 |
| 248.4 |
| 215.2 |
|
Men ABCYW-HIB |
| NA |
| 0.0 |
| 0.0 |
| 0.0 |
| 0.0 |
| 0.0 |
| 0.0 |
| 0.0 |
| 0.0 |
| 0.0 |
| 0.0 |
|
HCV Therapeutic |
| 11% |
| 0.0 |
| 0.0 |
| 0.0 |
| 0.0 |
| 0.0 |
| 0.0 |
| 54.2 |
| 60.5 |
| 63.6 |
| 66.6 |
|
HCV Prophylactic |
| 19% |
| 0.0 |
| 0.0 |
| 0.0 |
| 0.0 |
| 0.0 |
| 0.0 |
| 8.6 |
| 17.0 |
| 65.8 |
| 62.5 |
|
Other Products |
|
|
| 356.4 |
| 390.1 |
| 415.3 |
| 429.8 |
| 442.1 |
| 416.6 |
| 413.0 |
| 412.5 |
| 415.1 |
| 420.2 |
|
Net Product Sales |
|
|
| 904.6 |
| 980.8 |
| 1,077.4 |
| 1,324.7 |
| 1,564.7 |
| 1,686.7 |
| 1,689.5 |
| 1,448.4 |
| 1,398.9 |
| 1,299.3 |
|
|
|
|
|
|
|
|
|
|
|
|
|
|
|
|
|
|
|
|
|
|
|
|
|
Collaborative Agreements |
|
|
| 0.0 |
| 1.0 |
| 0.0 |
| 0.0 |
| 0.0 |
| 0.0 |
| 0.0 |
| 0.0 |
| 0.0 |
| 0.0 |
|
Royalties |
|
|
| 3.9 |
| 3.4 |
| 2.9 |
| 1.4 |
| 1.4 |
| 1.0 |
| 0.0 |
| 0.0 |
| 0.0 |
| 0.0 |
|
Other Revenue |
|
|
| 12.1 |
| 13.1 |
| 14.1 |
| 13.9 |
| 16.4 |
| 20.8 |
| 20.8 |
| 25.8 |
| 25.8 |
| 30.2 |
|
Other Revenues |
|
|
| 15.9 |
| 17.5 |
| 17.0 |
| 15.2 |
| 17.7 |
| 21.8 |
| 20.8 |
| 25.8 |
| 25.8 |
| 30.2 |
|
|
|
|
|
|
|
|
|
|
|
|
|
|
|
|
|
|
|
|
|
|
|
|
|
TOTAL VACCINES REVENUE (Pos-Adj) |
|
|
| 920.5 |
| 998.3 |
| 1,094.4 |
| 1,339.9 |
| 1,582.4 |
| 1,708.4 |
| 1,710.2 |
| 1,474.1 |
| 1,424.7 |
| 1,329.5 |
|
% Growth |
|
|
| 19.0 | % | 8.4 | % | 9.6 | % | 22.4 | % | 18.1 | % | 8.0 | % | 0.1 | % | -13.8 | % | -3.4 | % | -6.7 | % |
|
|
|
|
|
|
|
|
|
|
|
|
|
|
|
|
|
|
|
|
|
|
|
|
TOTAL VACCINES COGS (Pos-Adj) |
|
|
| 450.2 |
| 450.8 |
| 467.4 |
| 549.3 |
| 571.8 |
| 600.1 |
| 610.7 |
| 594.2 |
| 599.9 |
| 488.4 |
|
% Margin |
|
|
| 48.9 | % | 45.2 | % | 42.7 | % | 41.0 | % | 36.1 | % | 35.1 | % | 35.7 | % | 40.3 | % | 42.1 | % | 36.7 | % |
% Growth |
|
|
| 15.5 | % | 0.1 | % | 3.7 | % | 17.5 | % | 4.1 | % | 4.9 | % | 1.8 | % | -2.7 | % | 1.0 | % | -18.6 | % |
|
|
|
|
|
|
|
|
|
|
|
|
|
|
|
|
|
|
|
|
|
|
|
|
TOTAL VACCINES GROSS PROFIT (Pos-Adj.) |
|
|
| 470.4 |
| 547.5 |
| 627.0 |
| 790.6 |
| 1,010.6 |
| 1,108.3 |
| 1,099.5 |
| 879.9 |
| 824.8 |
| 841.0 |
|
% Margin |
|
|
| 51.1 | % | 54.8 | % | 57.3 | % | 59.0 | % | 63.9 | % | 64.9 | % | 64.3 | % | 59.7 | % | 57.9 | % | 63.3 | % |
TOTAL VACCINES Research & Development (Pos-Adj) |
|
|
| 150.1 |
| 151.5 |
| 159.0 |
| 169.0 |
| 170.2 |
| 165.0 |
| 167.3 |
| 150.8 |
| 147.1 |
| 136.3 |
|
R&D as % of Total Revenue |
|
|
| 16.3 | % | 15.2 | % | 14.5 | % | 12.6 | % | 10.8 | % | 9.7 | % | 9.8 | % | 10.2 | % | 10.3 | % | 10.3 | % |
% Growth |
|
|
| 6.0 | % | 0.9 | % | 5.0 | % | 6.2 | % | 0.7 | % | -3.1 | % | 1.4 | % | -9.9 | % | -2.5 | % | -7.3 | % |
|
|
|
|
|
|
|
|
|
|
|
|
|
|
|
|
|
|
|
|
|
|
|
|
TOTAL VACCINES S&M (Pos-Adj) |
|
|
| 110.7 |
| 114.7 |
| 133.6 |
| 160.4 |
| 183.2 |
| 206.5 |
| 197.8 |
| 169.6 |
| 163.8 |
| 152.2 |
|
S&M as % of Product Sales |
|
|
| 12.2 | % | 11.7 | % | 12.4 | % | 12.1 | % | 11.7 | % | 12.2 | % | 11.7 | % | 11.7 | % | 11.7 | % | 11.7 | % |
% Growth |
|
|
| -0.9 | % | 3.6 | % | 16.5 | % | 20.1 | % | 14.2 | % | 12.7 | % | -4.2 | % | -14.3 | % | -3.4 | % | -7.1 | % |
|
|
|
|
|
|
|
|
|
|
|
|
|
|
|
|
|
|
|
|
|
|
|
|
TOTAL VACCINES G&A (Pos-Adj) |
|
|
| 50.3 |
| 53.7 |
| 56.3 |
| 66.7 |
| 73.0 |
| 83.9 |
| 93.7 |
| 83.2 |
| 84.7 |
| 83.8 |
|
G&A as % Total Revenue |
|
|
| 5.5 | % | 5.4 | % | 5.1 | % | 5.0 | % | 4.6 | % | 4.9 | % | 5.5 | % | 5.6 | % | 5.9 | % | 6.3 | % |
% Growth |
|
|
| -6.8 | % | 6.8 | % | 4.9 | % | 18.5 | % | 9.5 | % | 14.9 | % | 11.7 | % | -11.3 | % | 1.9 | % | -1.1 | % |
|
|
|
|
|
|
|
|
|
|
|
|
|
|
|
|
|
|
|
|
|
|
|
|
Other Operating Expenses |
|
|
| 0.2 |
| 0.2 |
| 0.1 |
| 0.1 |
| 0.0 |
| 0.0 |
| 0.0 |
| 0.0 |
| 0.0 |
| 0.0 |
|
|
|
|
|
|
|
|
|
|
|
|
|
|
|
|
|
|
|
|
|
|
|
|
|
Vaccines Corporate Overhead Allocation |
|
|
| 0.0 |
| 0.0 |
| 0.0 |
| 0.0 |
| 0.0 |
| 0.0 |
| 0.0 |
| 0.0 |
| 0.0 |
| 0.0 |
|
|
|
|
|
|
|
|
|
|
|
|
|
|
|
|
|
|
|
|
|
|
|
|
|
TOTAL VACCINES OPERATING EXPENSES |
|
|
| 311.3 |
| 320.0 |
| 349.1 |
| 396.2 |
| 426.5 |
| 455.4 |
| 458.9 |
| 403.6 |
| 395.6 |
| 372.2 |
|
|
|
|
|
|
|
|
|
|
|
|
|
|
|
|
|
|
|
|
|
|
|
|
|
TOTAL VACCINES EXPENSES |
|
|
| 761.4 |
| 770.8 |
| 816.5 |
| 945.5 |
| 998.3 |
| 1,055.4 |
| 1,069.6 |
| 997.8 |
| 995.6 |
| 860.6 |
|
|
|
|
|
|
|
|
|
|
|
|
|
|
|
|
|
|
|
|
|
|
|
|
|
VACCINES OPERATING INCOME (LOSS) |
|
|
| 159.1 |
| 227.5 |
| 277.9 |
| 394.4 |
| 584.1 |
| 653.0 |
| 640.6 |
| 476.3 |
| 429.1 |
| 468.8 |
|
% Margin |
|
|
| 17.3 | % | 22.8 | % | 25.4 | % | 29.4 | % | 36.9 | % | 38.2 | % | 37.5 | % | 32.3 | % | 30.1 | % | 35.3 | % |
% Growth |
|
|
| 112.3 | % | 43.0 | % | 22.2 | % | 41.9 | % | 48.1 | % | 11.8 | % | -1.9 | % | -25.7 | % | -9.9 | % | 9.3 | % |
Source: Heron Management Forecast as of October 2005
43
Blood Testing Segment P&L
BLOOD TESTING |
| POS |
| 2006 |
| 2007 |
| 2008 |
| 2009 |
| 2010 |
| 2011 |
| 2012 |
| 2013 |
| 2014 |
| 2015 |
|
|
|
|
|
|
|
|
|
|
|
|
|
|
|
|
|
|
|
|
|
|
|
|
|
REVENUE (Pos-Adj.) |
|
|
|
|
|
|
|
|
|
|
|
|
|
|
|
|
|
|
|
|
|
|
|
NAT |
|
|
|
|
|
|
|
|
|
|
|
|
|
|
|
|
|
|
|
|
|
|
|
Current Products |
|
|
|
|
|
|
|
|
|
|
|
|
|
|
|
|
|
|
|
|
|
|
|
Duplex |
| 100% |
| 89.2 |
| 23.9 |
| 25.6 |
| 25.6 |
| 23.1 |
| 20.6 |
| 18.2 |
| 15.7 |
| 13.2 |
| 10.8 |
|
dHBV |
| 100% |
| 1.3 |
| 0.0 |
| 0.0 |
| 0.0 |
| 0.0 |
| 0.0 |
| 0.0 |
| 0.0 |
| 0.0 |
| 0.0 |
|
Ultrio |
| 100% |
| 229.0 |
| 353.5 |
| 380.7 |
| 383.4 |
| 353.8 |
| 318.4 |
| 271.8 |
| 231.1 |
| 190.9 |
| 151.5 |
|
WNV |
| 100% |
| 43.3 |
| 57.6 |
| 57.6 |
| 57.6 |
| 53.7 |
| 48.0 |
| 42.2 |
| 36.5 |
| 30.8 |
| 25.1 |
|
Total Current Products Revenue |
|
|
| 362.8 |
| 435.0 |
| 463.9 |
| 466.5 |
| 430.6 |
| 386.9 |
| 332.2 |
| 283.4 |
| 234.9 |
| 187.3 |
|
|
|
|
|
|
|
|
|
|
|
|
|
|
|
|
|
|
|
|
|
|
|
|
|
New Products |
|
|
|
|
|
|
|
|
|
|
|
|
|
|
|
|
|
|
|
|
|
|
|
Blood Type Conversion |
| 35% |
| 0.0 |
| 0.0 |
| 12.7 |
| 33.2 |
| 61.9 |
| 85.7 |
| 99.4 |
| 111.9 |
| 116.1 |
| 117.3 |
|
Bacterial Detection |
| NA |
| 0.0 |
| 0.0 |
| 0.0 |
| 0.0 |
| 0.0 |
| 0.0 |
| 0.0 |
| 0.0 |
| 0.0 |
| 0.0 |
|
Parvo |
| 75% |
| 0.0 |
| 0.3 |
| 3.0 |
| 13.2 |
| 11.8 |
| 10.5 |
| 9.1 |
| 7.7 |
| 6.4 |
| 5.1 |
|
Prion |
| 50% |
| 0.0 |
| 37.7 |
| 68.8 |
| 74.1 |
| 83.7 |
| 90.5 |
| 89.4 |
| 90.6 |
| 90.6 |
| 90.6 |
|
Next Generation NAT |
| 100% |
| 0.0 |
| 0.0 |
| 0.0 |
| 74.1 |
| 153.2 |
| 253.2 |
| 308.8 |
| 381.9 |
| 465.0 |
| 548.1 |
|
Total New Products Revenue |
|
|
| 0.0 |
| 38.0 |
| 84.5 |
| 194.6 |
| 310.6 |
| 439.9 |
| 506.6 |
| 592.1 |
| 678.1 |
| 761.0 |
|
|
|
|
|
|
|
|
|
|
|
|
|
|
|
|
|
|
|
|
|
|
|
|
|
Total Instrument & Service Revenue |
|
|
| 28.2 |
| 16.3 |
| 19.7 |
| 13.8 |
| 9.4 |
| 8.3 |
| 7.7 |
| 6.8 |
| 6.0 |
| 4.5 |
|
|
|
|
|
|
|
|
|
|
|
|
|
|
|
|
|
|
|
|
|
|
|
|
|
Other Plasma Sales |
|
|
| 0.0 |
| 0.0 |
| 0.0 |
| 0.0 |
| 0.0 |
| 0.0 |
| 0.0 |
| 0.0 |
| 0.0 |
| 0.0 |
|
|
|
|
|
|
|
|
|
|
|
|
|
|
|
|
|
|
|
|
|
|
|
|
|
Total NAT Product Revenue |
|
|
| 391.0 |
| 489.3 |
| 568.1 |
| 674.9 |
| 750.6 |
| 835.1 |
| 846.5 |
| 882.3 |
| 919.0 |
| 952.9 |
|
|
|
|
|
|
|
|
|
|
|
|
|
|
|
|
|
|
|
|
|
|
|
|
|
Plasma Royalties (Homebrew) |
|
|
| 11.0 |
| 11.0 |
| 18.8 |
| 8.3 |
| 6.6 |
| 6.0 |
| 6.0 |
| 6.0 |
| 6.0 |
| 6.0 |
|
|
|
|
|
|
|
|
|
|
|
|
|
|
|
|
|
|
|
|
|
|
|
|
|
Whole Blood and Plasma Royalties (Roche) |
|
|
| 54.4 |
| 50.2 |
| 46.0 |
| 56.8 |
| 18.8 |
| 18.8 |
| 18.9 |
| 18.9 |
| 19.0 |
| 19.1 |
|
|
|
|
|
|
|
|
|
|
|
|
|
|
|
|
|
|
|
|
|
|
|
|
|
Total NAT Royalty Revenue |
|
|
| 65.4 |
| 61.1 |
| 64.8 |
| 65.1 |
| 25.4 |
| 24.8 |
| 24.9 |
| 24.9 |
| 25.0 |
| 25.1 |
|
|
|
|
|
|
|
|
|
|
|
|
|
|
|
|
|
|
|
|
|
|
|
|
|
Grants for R&D (Other) |
|
|
| 1.0 |
| 1.0 |
| 1.0 |
| 1.0 |
| 1.0 |
| 1.0 |
| 1.0 |
| 1.0 |
| 1.0 |
| 1.0 |
|
|
|
|
|
|
|
|
|
|
|
|
|
|
|
|
|
|
|
|
|
|
|
|
|
TOTAL NAT REVENUE |
|
|
| 457.4 |
| 551.5 |
| 634.0 |
| 741.0 |
| 777.0 |
| 860.9 |
| 872.4 |
| 908.2 |
| 945.0 |
| 979.0 |
|
% Growth |
|
|
| 26.5 | % | 20.6 | % | 15.0 | % | 16.9 | % | 4.9 | % | 10.8 | % | 1.3 | % | 4.1 | % | 4.0 | % | 3.6 | % |
|
|
|
|
|
|
|
|
|
|
|
|
|
|
|
|
|
|
|
|
|
|
|
|
ORTHO JOINT BUSINESS |
|
|
|
|
|
|
|
|
|
|
|
|
|
|
|
|
|
|
|
|
|
|
|
Product Sales |
|
|
| 26.3 |
| 26.5 |
| 26.8 |
| 27.1 |
| 27.3 |
| 27.6 |
| 27.9 |
| 28.2 |
| 28.4 |
| 28.7 |
|
Hep Retro Amortization (Royalty) |
|
|
| 5.0 |
| 5.0 |
| 5.0 |
| 5.0 |
| 2.5 |
| 0.0 |
| 0.0 |
| 0.0 |
| 0.0 |
| 0.0 |
|
Contract Revenues |
|
|
| 10.1 |
| 10.2 |
| 10.3 |
| 10.4 |
| 10.5 |
| 10.6 |
| 10.7 |
| 10.8 |
| 10.9 |
| 11.0 |
|
Joint Business Profits |
|
|
| 109.8 |
| 107.6 |
| 105.4 |
| 103.3 |
| 101.2 |
| 99.2 |
| 97.2 |
| 95.3 |
| 93.4 |
| 91.5 |
|
TOTAL ORTHO REVENUE |
|
|
| 151.2 |
| 149.3 |
| 147.5 |
| 145.8 |
| 141.6 |
| 137.4 |
| 135.8 |
| 134.3 |
| 132.8 |
| 131.3 |
|
|
|
|
|
|
|
|
|
|
|
|
|
|
|
|
|
|
|
|
|
|
|
|
|
TOTAL BLOOD TESTING REVENUE |
|
|
| 608.6 |
| 700.8 |
| 781.5 |
| 886.8 |
| 918.6 |
| 998.4 |
| 1,008.2 |
| 1,042.5 |
| 1,077.7 |
| 1,110.2 |
|
% Growth |
|
|
| 13.6 | % | 15.2 | % | 11.5 | % | 13.5 | % | 3.6 | % | 8.7 | % | 1.0 | % | 3.4 | % | 3.4 | % | 3.0 | % |
|
|
|
|
|
|
|
|
|
|
|
|
|
|
|
|
|
|
|
|
|
|
|
|
TOTAL BLOOD TESTING COGS |
|
|
| 225.1 |
| 263.8 |
| 296.4 |
| 348.1 |
| 388.6 |
| 435.0 |
| 447.1 |
| 471.5 |
| 496.7 |
| 520.7 |
|
% Growth |
|
|
| 23.7 | % | 17.2 | % | 12.4 | % | 17.4 | % | 11.6 | % | 11.9 | % | 2.8 | % | 5.5 | % | 5.3 | % | 4.8 | % |
|
|
|
|
|
|
|
|
|
|
|
|
|
|
|
|
|
|
|
|
|
|
|
|
TOTAL BLOOD TESTING GROSS PROFIT (Pos-Adj.) |
|
|
| 383.5 |
| 437.1 |
| 485.1 |
| 538.7 |
| 530.0 |
| 563.4 |
| 561.1 |
| 571.0 |
| 581.1 |
| 589.5 |
|
% Margin |
|
|
| 63.0 | % | 62.4 | % | 62.1 | % | 60.7 | % | 57.7 | % | 56.4 | % | 55.7 | % | 54.8 | % | 53.9 | % | 53.1 | % |
|
|
|
|
|
|
|
|
|
|
|
|
|
|
|
|
|
|
|
|
|
|
|
|
TOTAL BLOOD TESTING R&D |
|
|
| 32.1 |
| 44.6 |
| 38.2 |
| 40.3 |
| 53.7 |
| 57.5 |
| 58.2 |
| 59.9 |
| 61.9 |
| 62.7 |
|
% Margin |
|
|
| 5.3 | % | 6.4 | % | 4.9 | % | 4.5 | % | 5.8 | % | 5.8 | % | 5.8 | % | 5.7 | % | 5.7 | % | 5.6 | % |
% Growth |
|
|
| 2.0 | % | 39.0 | % | -14.4 | % | 5.4 | % | 33.2 | % | 7.1 | % | 1.2 | % | 3.0 | % | 3.2 | % | 1.3 | % |
|
|
|
|
|
|
|
|
|
|
|
|
|
|
|
|
|
|
|
|
|
|
|
|
TOTAL BLOOD TESTING S&M |
|
|
| 45.2 |
| 48.7 |
| 55.3 |
| 62.6 |
| 66.1 |
| 68.8 |
| 70.5 |
| 74.9 |
| 79.2 |
| 83.4 |
|
% Margin |
|
|
| 7.4 | % | 6.9 | % | 7.1 | % | 7.1 | % | 7.2 | % | 6.9 | % | 7.0 | % | 7.2 | % | 7.3 | % | 7.5 | % |
% Growth |
|
|
| 7.8 | % | 7.7 | % | 13.6 | % | 13.3 | % | 5.5 | % | 4.1 | % | 2.5 | % | 6.2 | % | 5.7 | % | 5.3 | % |
|
|
|
|
|
|
|
|
|
|
|
|
|
|
|
|
|
|
|
|
|
|
|
|
TOTAL BLOOD TESTING G&A |
|
|
| 4.9 |
| 5.2 |
| 5.4 |
| 5.7 |
| 6.0 |
| 6.3 |
| 6.6 |
| 7.0 |
| 7.3 |
| 7.7 |
|
% Margin |
|
|
| 0.8 | % | 0.7 | % | 0.7 | % | 0.6 | % | 0.7 | % | 0.6 | % | 0.7 | % | 0.7 | % | 0.7 | % | 0.7 | % |
% Growth |
|
|
| -2.8 | % | 5.0 | % | 5.0 | % | 5.0 | % | 5.0 | % | 5.0 | % | 5.0 | % | 5.0 | % | 5.0 | % | 5.0 | % |
|
|
|
|
|
|
|
|
|
|
|
|
|
|
|
|
|
|
|
|
|
|
|
|
Blood Testing Corporate Overhead Allocation |
|
|
| 0.0 |
| 0.0 |
| 0.0 |
| 0.0 |
| 0.0 |
| 0.0 |
| 0.0 |
| 0.0 |
| 0.0 |
| 0.0 |
|
|
|
|
|
|
|
|
|
|
|
|
|
|
|
|
|
|
|
|
|
|
|
|
|
TOTAL OPERATING EXPENSES |
|
|
| 82.2 |
| 98.5 |
| 98.9 |
| 108.6 |
| 125.8 |
| 132.6 |
| 135.3 |
| 141.8 |
| 148.4 |
| 153.7 |
|
|
|
|
|
|
|
|
|
|
|
|
|
|
|
|
|
|
|
|
|
|
|
|
|
TOTAL EXPENSES |
|
|
| 307.3 |
| 362.2 |
| 395.4 |
| 456.8 |
| 514.4 |
| 567.6 |
| 582.4 |
| 613.3 |
| 645.0 |
| 674.5 |
|
|
|
|
|
|
|
|
|
|
|
|
|
|
|
|
|
|
|
|
|
|
|
|
|
BLOOD TESTING OPERATING INCOME (LOSS) |
|
|
| 301.2 |
| 338.6 |
| 386.1 |
| 430.0 |
| 404.2 |
| 430.8 |
| 425.8 |
| 429.1 |
| 432.7 |
| 435.8 |
|
% Margin |
|
|
| 49.5 | % | 48.3 | % | 49.4 | % | 48.5 | % | 44.0 | % | 43.1 | % | 42.2 | % | 41.2 | % | 40.1 | % | 39.2 | % |
% Growth |
|
|
| 9.5 | % | 12.4 | % | 14.1 | % | 11.4 | % | -6.0 | % | 6.6 | % | -1.2 | % | 0.8 | % | 0.8 | % | 0.7 | % |
Source: Heron Management Forecast as of October 2005
44
Credit Suisse First Boston (“CSFB”) and Morgan Stanley do not provide any tax advice. Any tax statement herein regarding any US federal tax is not intended or written to be used, and cannot be used, by any taxpayer for the purpose of avoiding any penalties. Any such statement herein was written to support the marketing or promotion of the transaction(s) or matter(s) to which the statement relates. Each taxpayer should seek advice based on the taxpayer’s particular circumstances from an independent tax advisor.
These materials have been provided to you by CSFB and Morgan Stanley in connection with an actual or potential mandate or engagement and may not be used or relied upon for any purpose other than as specifically contemplated by a written agreement with CSFB and Morgan Stanley. In addition, these materials may not be disclosed, in whole or in part, or summarized or otherwise referred to except as agreed in writing by CSFB and Morgan Stanley. The information used in preparing these materials was obtained from or through you or your representatives or from public sources. CSFB and Morgan Stanley assume no responsibility for independent verification of such information and has relied on such information being complete and accurate in all material respects. To the extent such information includes estimates and forecasts of future financial performance (including estimates of potential cost savings and synergies) prepared by or reviewed or discussed with the managements of your company and/or other potential transaction participants or obtained from public sources, we have assumed that such estimates and forecasts have been reasonably prepared on bases reflecting the best currently available estimates and judgments of such managements (or, with respect to estimates and forecasts obtained from public sources, represent reasonable estimates). These materials were designed for use by specific persons familiar with the business and the affairs of your company and CSFB and Morgan Stanley assume no obligation to update or otherwise revise these materials. Nothing contained herein should be construed as tax, accounting or legal advice. You (and each of your employees, representatives or other agents) may disclose to any and all persons, without limitation of any kind, the tax treatment and tax structure of the transactions contemplated by these materials and all materials of any kind (including opinions or other tax analyses) that are provided to you relating to such tax treatment and structure. For this purpose, the tax treatment of a transaction is the purported or claimed U.S. federal income tax treatment of the transaction and the tax structure of a transaction is any fact that may be relevant to understanding the purported or claimed U.S. federal income tax treatment of the transaction.
CSFB and Morgan Stanley have adopted policies and guidelines designed to preserve the independence of its research analysts. CSFB’s and Morgan Stanley’s policies prohibit employees from directly or indirectly offering a favorable research rating or specific price target, or offering to change a research rating or price target, as consideration for or an inducement to obtain business or other compensation. CSFB’s and Morgan Stanley’s policies prohibit research analysts from being compensated for their involvement in investment banking transactions except to the extent such participation is intended to benefit investor clients.
Credit Suisse First Boston or CSFB is the trade name for the investment banking business of Credit Suisse, a Swiss bank, and references to Credit Suisse First Boston or CSFB herein include all of the subsidiaries and affiliates of Credit Suisse operating under the Credit Suisse First Boston division of Credit Suisse Group. For more information on our structure, please follow the below link: http://www.creditsuisse.com/en/who_we_are/ourstructure.html.
45