Exhibit 99.a(8)

Link to searchable text of slide shown above
Link to searchable text of slide shown above
Link to searchable text of slide shown above
Link to searchable text of slide shown above
Link to searchable text of slide shown above
Link to searchable text of slide shown above
Link to searchable text of slide shown above
Link to searchable text of slide shown above

Link to searchable text of slide shown above
Link to searchable text of slide shown above
Link to searchable text of slide shown above
Link to searchable text of slide shown above
Link to searchable text of slide shown above
Link to searchable text of slide shown above
Link to searchable text of slide shown above
Link to searchable text of slide shown above
Link to searchable text of slide shown above
Link to searchable text of slide shown above
Link to searchable text of slide shown above
Link to searchable text of slide shown above
Link to searchable text of slide shown above
Link to searchable text of slide shown above
Link to searchable text of slide shown above
Link to searchable text of slide shown above
Link to searchable text of slide shown above
Link to searchable text of slide shown above
Link to searchable text of slide shown above
Link to searchable text of slide shown above
Link to searchable text of slide shown above
Link to searchable text of slide shown above

Link to searchable text of slide shown above
Link to searchable text of slide shown above

Link to searchable text of slide shown above
Link to searchable text of slide shown above
Link to searchable text of slide shown above
Link to searchable text of slide shown above

Link to searchable text of slide shown above
Link to searchable text of slide shown above
Link to searchable text of slide shown above
Link to searchable text of slide shown above
Link to searchable text of slide shown above
Link to searchable text of slide shown above
Link to searchable text of slide shown above
Link to searchable text of slide shown above
Link to searchable text of slide shown above
Link to searchable text of slide shown above
Link to searchable text of slide shown above
Link to searchable text of slide shown above
Link to searchable text of slide shown above
Link to searchable text of slide shown above
Link to searchable text of slide shown above
Link to searchable text of slide shown above
Link to searchable text of slide shown above
Link to searchable text of slide shown above
Link to searchable text of slide shown above
Link to searchable text of slide shown above
Link to searchable text of slide shown above
Link to searchable text of slide shown above
Link to searchable text of slide shown above
Link to searchable text of slide shown above
Link to searchable text of slide shown above
Link to searchable text of slide shown above
Link to searchable text of slide shown above
Link to searchable text of slide shown above
Link to searchable text of slide shown above

Link to searchable text of slide shown above
Link to searchable text of slide shown above
Link to searchable text of slide shown above
Link to searchable text of slide shown above
Link to searchable text of slide shown above
Searchable text section of graphics shown above
Project Nevada Discussion Materials
Goldman, Sachs & Co.
28-Oct-2005
Table of Contents
I. | Review of Nevada | |
II. | Stock Trading and Ownership Analysis | |
III. | Analysis of Financial Projections | |
IV. | Valuation Analysis | |
V. | Tactical Considerations | |
Appendix A: | Review of Key Products | |
Appendix B: | Nevada Capital Structure | |
Appendix C: | Key Management & Director Profiles | |
I. Review of Nevada
1
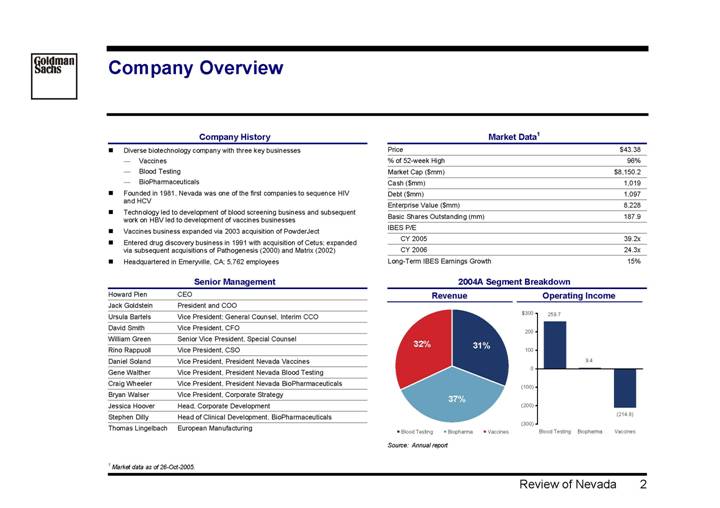
Company Overview
Company History
• Diverse biotechnology company with three key businesses
• Vaccines
• Blood Testing
• BioPharmaceuticals
• Founded in 1981, Nevada was one of the first companies to sequence HIV and HCV
• Technology led to development of blood screening business and subsequent work on HBV led to development of vaccines businesses
• Vaccines business expanded via 2003 acquisition of PowderJect
• Entered drug discovery business in 1991 with acquisition of Cetus; expanded via subsequent acquisitions of Pathogenesis (2000) and Matrix (2002)
• Headquartered in Emeryville, CA; 5,762 employees
Senior Management
Howard Pien |
| CEO |
Jack Goldstein |
| President and COO |
Ursula Bartels |
| Vice President; General Counsel, Interim CCO |
David Smith |
| Vice President, CFO |
William Green |
| Senior Vice President, Special Counsel |
Rino Rappuoll |
| Vice President, CSO |
Daniel Soland |
| Vice President, President Nevada Vaccines |
Gene Walther |
| Vice President, President Nevada Blood Testing |
Craig Wheeler |
| Vice President, President Nevada BioPharmaceuticals |
Bryan Walser |
| Vice President, Corporate Strategy |
Jessica Hoover |
| Head, Corporate Development |
Stephen Dilly |
| Head of Clinical Development, BioPharmaceuticals |
Thomas Lingelbach |
| European Manufacturing |
Market Data(1)
Price |
| $ | 43.38 |
|
% of 52-week High |
| 96 | % | |
Market Cap ($mm) |
| $ | 8,150.2 |
|
Cash ($mm) |
| 1,019 |
| |
Debt ($mm) |
| 1,097 |
| |
Enterprise Value ($mm) |
| 8,228 |
| |
Basic Shares Outstanding (mm) |
| 187.9 |
| |
IBES P/E |
|
|
| |
CY 2005 |
| 39.2 | x | |
CY 2006 |
| 24.3 | x | |
Long-Term IBES Earnings Growth |
| 15 | % | |
(1) Market data as of 26-Oct-2005.
2004A Segment Breakdown | |
| |
Revenue | Operating Income |
|
|
[CHART] | [CHART] |
Source: Annual report
2
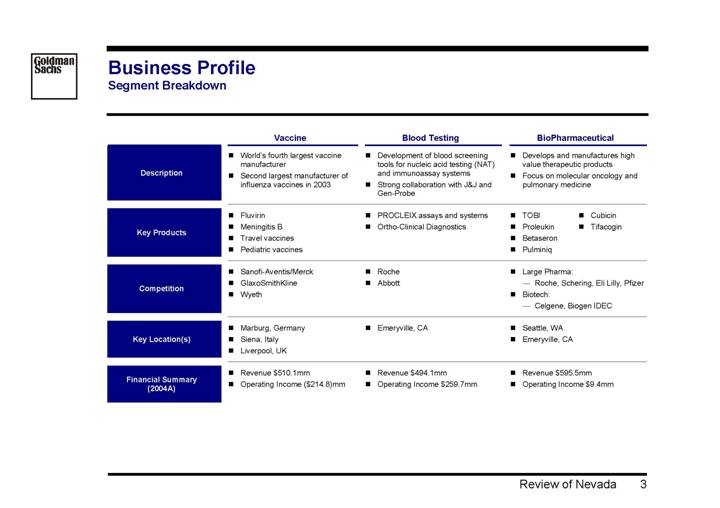
Business Profile
Segment Breakdown
|
| Vaccine |
| Blood Testing |
| BioPharmaceutical |
| |
Description |
| • World’s fourth largest vaccine manufacturer • Second largest manufacturer of influenza vaccines in 2003 |
| • Development of blood screening tools for nucleic acid testing (NAT) and immunoassay systems • Strong collaboration with J&J and Gen-Probe |
| • Develops and manufactures high value therapeutic products • Focus on molecular oncology and pulmonary medicine |
| |
|
|
|
|
|
|
|
| |
Key Products |
| • Fluvirin • Meningitis B • Travel vaccines • Pediatric vaccines |
| • PROCLEIX assays and systems • Ortho-Clinical Diagnostics |
| • TOBI • Proleukin • Betaseron • Pulminiq • Cubicin • Tifacogin |
|
|
|
|
|
|
|
|
|
| |
Competition |
| • Sanofi-Aventis/Merck • GlaxoSmithKline • Wyeth |
| • Roche • Abbott |
| • Large Pharma: • Roche, Schering, Eli Lilly, Pfizer • Biotech: • Celgene, Biogen IDEC |
| |
|
|
|
|
|
|
|
| |
Key Location(s) |
| • Marburg, Germany • Siena, Italy • Liverpool, UK |
| • Emeryville, CA |
| • Seattle, WA • Emeryville, CA |
| |
|
|
|
|
|
|
|
| |
Financial Summary |
| • Revenue $510.1mm • Operating Income |
| • Revenue $494.1mm • Operating Income $259.7mm |
| • Revenue $595.5mm • Operating Income $9.4mm |
| |
3
Key Value Drivers
Vaccines
• Reinstatement of FDA license on Fluvirin
• Build replacement egg-based manufacturing facility
• Development of next generation flu technology (cell culture based)
• Build meningitis franchise (development of MenB; launch of Men ACWY and ABCWY)
• Maintaining reputation and franchise value by returning to market this year
Blood Testing
• Patent expiration on critical IP over 2010-2020
• Driving platform value beyond IP position
• Value-add relative to partners (Gen-Probe)
• Platform for expansion into other diagnostic applications
BioPharmaceuticals
• Clinical success of tifacogin (pulmonary)
• Pulmonary franchise extension replacing TOBI with TIP
• Betaseron product rights arrangement with Schering beyond 2008 contract expiration
• Oncology pipeline
4
II. Stock Trading and Ownership Analysis
5
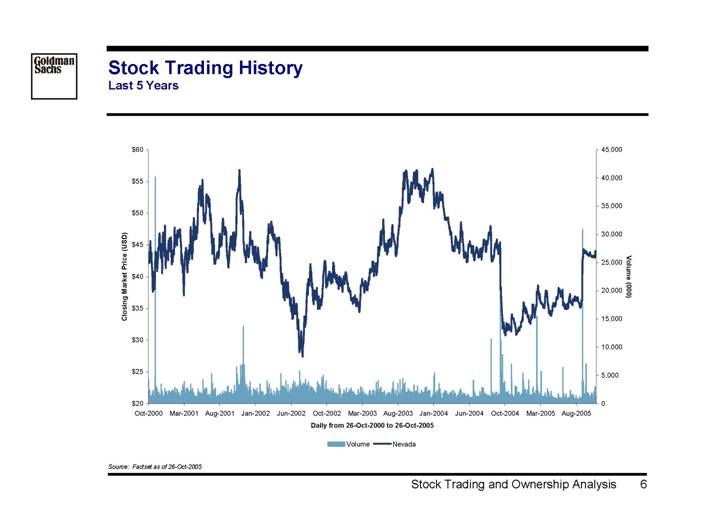
Stock Trading History
Last 5 Years
[CHART]
Source: Factset as of 26-Oct-2005
6
Shares Traded at Various Prices
Since 01-Sep-2005 Offer |
| 3 Months Prior to Offer |
|
|
|
[CHART] |
| [CHART] |
|
|
|
6 Months Prior to Offer |
| 1 Year Prior to Offer |
|
|
|
[CHART] |
| [CHART] |
Source: Datastream
Note: Total shares traded as percent of shares outstanding
7
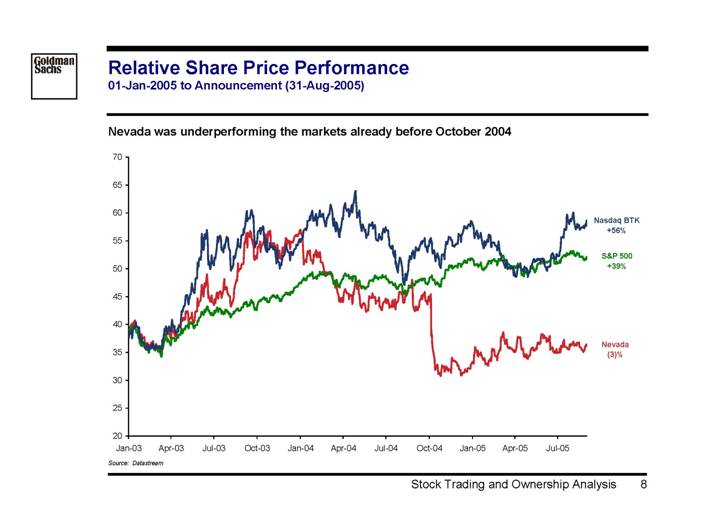
Relative Share Price Performance
01-Jan-2005 to Announcement (31-Aug-2005)
Nevada was underperforming the markets already before October 2004
[CHART]
Source: Datastream
8
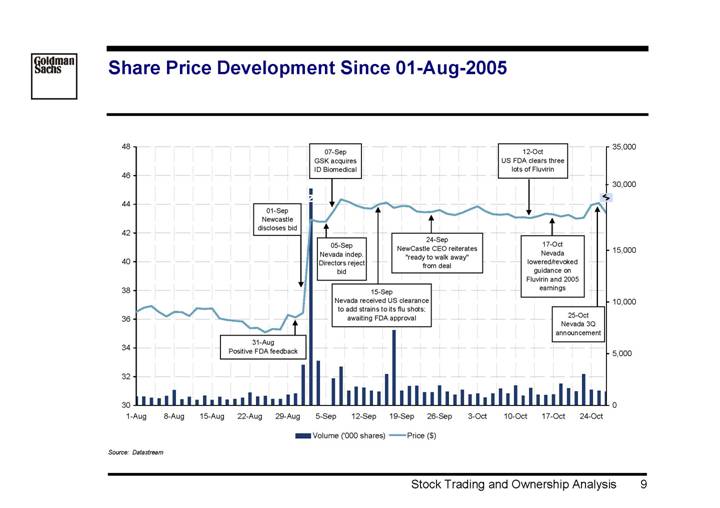
Share Price Development Since 01-Aug-2005
[CHART]
Source: Datastream
9
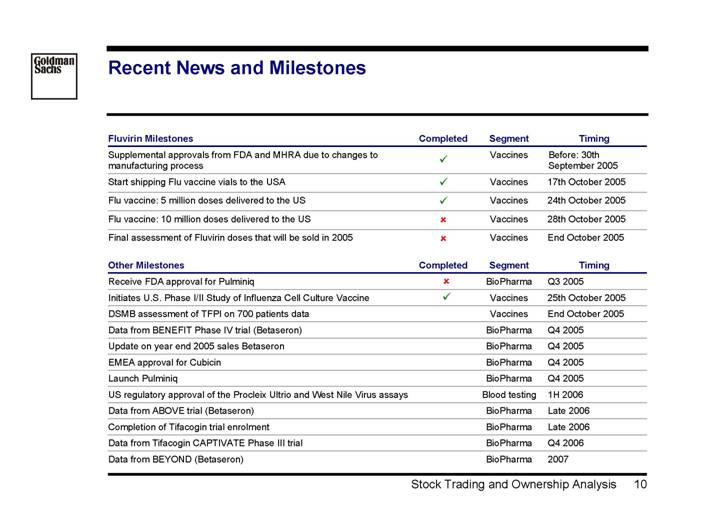
Recent News and Milestones
Fluvirin Milestones |
| Completed |
| Segment |
| Timing |
|
Supplemental approvals from FDA and MHRA due to changes to manufacturing process |
| ý |
| Vaccines |
| Before: 30th September 2005 |
|
Start shipping Flu vaccine vials to the USA |
| ý |
| Vaccines |
| 17th October 2005 |
|
Flu vaccine: 5 million doses delivered to the US |
| ý |
| Vaccines |
| 24th October 2005 |
|
Flu vaccine: 10 million doses delivered to the US |
| o |
| Vaccines |
| 28th October 2005 |
|
Final assessment of Fluvirin doses that will be sold in 2005 |
| o |
| Vaccines |
| End October 2005 |
|
|
|
|
|
|
|
|
|
Other Milestones |
| Completed |
| Segment |
| Timing |
|
Receive FDA approval for Pulminiq |
| o |
| BioPharma |
| Q3 2005 |
|
Initiates U.S. Phase I/II Study of Influenza Cell Culture Vaccine |
| ý |
| Vaccines |
| 25th October 2005 |
|
DSMB assessment of TFPI on 700 patients data |
|
|
| Vaccines |
| End October 2005 |
|
Data from BENEFIT Phase IV trial (Betaseron) |
|
|
| BioPharma |
| Q4 2005 |
|
Update on year end 2005 sales Betaseron |
|
|
| BioPharma |
| Q4 2005 |
|
EMEA approval for Cubicin |
|
|
| BioPharma |
| Q4 2005 |
|
Launch Pulminiq |
|
|
| BioPharma |
| Q4 2005 |
|
US regulatory approval of the Procleix Ultrio and West Nile Virus assays |
|
|
| Blood testing |
| 1H 2006 |
|
Data from ABOVE trial (Betaseron) |
|
|
| BioPharma |
| Late 2006 |
|
Completion of Tifacogin trial enrolment |
|
|
| BioPharma |
| Late 2006 |
|
Data from Tifacogin CAPTIVATE Phase III trial |
|
|
| BioPharma |
| Q4 2006 |
|
Data from BEYOND (Betaseron) |
|
|
| BioPharma |
| 2007 |
|
10
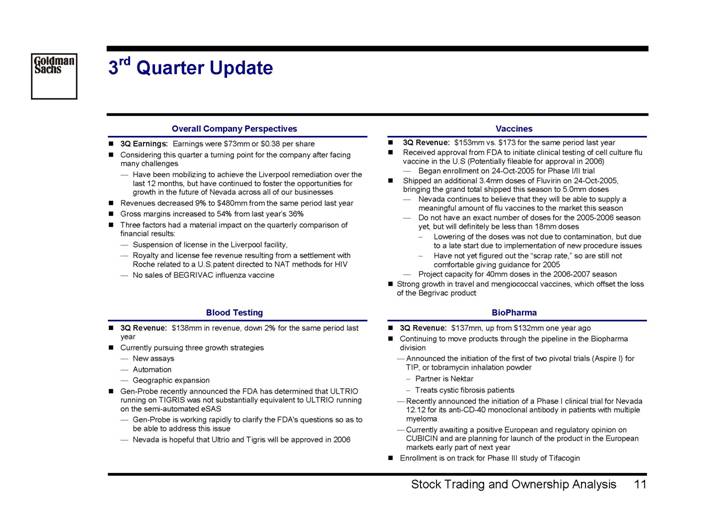
3rd Quarter Update
Overall Company Perspectives
• 3Q Earnings: Earnings were $73mm or $0.38 per share
• Considering this quarter a turning point for the company after facing many challenges
• Have been mobilizing to achieve the Liverpool remediation over the last 12 months, but have continued to foster the opportunities for growth in the future of Nevada across all of our businesses
• Revenues decreased 9% to $480mm from the same period last year
• Gross margins increased to 54% from last year’s 36%
• Three factors had a material impact on the quarterly comparison of financial results:
• Suspension of license in the Liverpool facility,
• Royalty and license fee revenue resulting from a settlement with Roche related to a U.S.patent directed to NAT methods for HIV
• No sales of BEGRIVAC influenza vaccine
Blood Testing
• 3Q Revenue: $138mm in revenue, down 2% for the same period last year
• Currently pursuing three growth strategies
• New assays
• Automation
• Geographic expansion
• Gen-Probe recently announced the FDA has determined that ULTRIO running on TIGRIS was not substantially equivalent to ULTRIO running on the semi-automated eSAS
• Gen-Probe is working rapidly to clarify the FDA’s questions so as to be able to address this issue
• Nevada is hopeful that Ultrio and Tigris will be approved in 2006
Vaccines
• 3Q Revenue: $153mm vs. $173 for the same period last year
• Received approval from FDA to initiate clinical testing of cell culture flu vaccine in the U.S (Potentially fileable for approval in 2006)
• Began enrollment on 24-Oct-2005 for Phase I/II trial
• Shipped an additional 3.4mm doses of Fluvirin on 24-Oct-2005, bringing the grand total shipped this season to 5.0mm doses
• Nevada continues to believe that they will be able to supply a meaningful amount of flu vaccines to the market this season
• Do not have an exact number of doses for the 2005-2006 season yet, but will definitely be less than 18mm doses
• Lowering of the doses was not due to contamination, but due to a late start due to implementation of new procedure issues
• Have not yet figured out the “scrap rate,” so are still not comfortable giving guidance for 2005
• Project capacity for 40mm doses in the 2006-2007 season
• Strong growth in travel and mengiococcal vaccines, which offset the loss of the Begrivac product
BioPharma
• 3Q Revenue: $137mm, up from $132mm one year ago
• Continuing to move products through the pipeline in the Biopharma division
• Announced the initiation of the first of two pivotal trials (Aspire I) for TIP, or tobramycin inhalation powder
• Partner is Nektar
• Treats cystic fibrosis patients
• Recently announced the initiation of a Phase I clinical trial for Nevada 12.12 for its anti-CD-40 monoclonal antibody in patients with multiple myeloma
• Currently awaiting a positive European and regulatory opinion on CUBICIN and are planning for launch of the product in the European markets early part of next year
• Enrollment is on track for Phase III study of Tifacogin
11
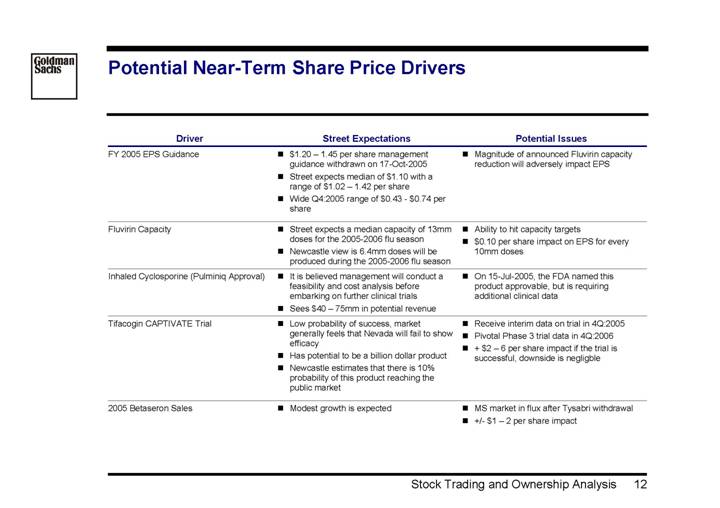
Potential Near-Term Share Price Drivers
Driver |
| Street Expectations |
| Potential Issues |
FY 2005 EPS Guidance |
| • $1.20 – 1.45 per share management guidance withdrawn on 17-Oct-2005 • Street expects median of $1.10 with a range of $1.02 – 1.42 per share • Wide Q4:2005 range of $0.43 – $0.74 per share |
| • Magnitude of announced Fluvirin capacity reduction will adversely impact EPS |
|
|
|
|
|
Fluvirin Capacity |
| • Street expects a median capacity of 13mm doses for the 2005-2006 flu season • Newcastle view is 6.4mm doses will be produced during the 2005-2006 flu season |
| • Ability to hit capacity targets • $0.10 per share impact on EPS for every 10mm doses |
|
|
|
|
|
Inhaled Cyclosporine (Pulminiq Approval) |
| • It is believed management will conduct a feasibility and cost analysis before embarking on further clinical trials • Sees $40 – 75mm in potential revenue |
| • On 15-Jul-2005, the FDA named this product approvable, but is requiring additional clinical data |
|
|
|
|
|
Tifacogin CAPTIVATE Trial |
| • Low probability of success, market generally feels that Nevada will fail to show efficacy • Has potential to be a billion dollar product • Newcastle estimates that there is 10% probability of this product reaching the public market |
| • Receive interim data on trial in 4Q:2005 • Pivotal Phase 3 trial data in 4Q:2006 • + $2 – 6 per share impact if the trial is successful, downside is negligble |
|
|
|
|
|
2005 Betaseron Sales |
| • Modest growth is expected |
| • MS market in flux after Tysabri withdrawal • +/- $1 – 2 per share impact |
12
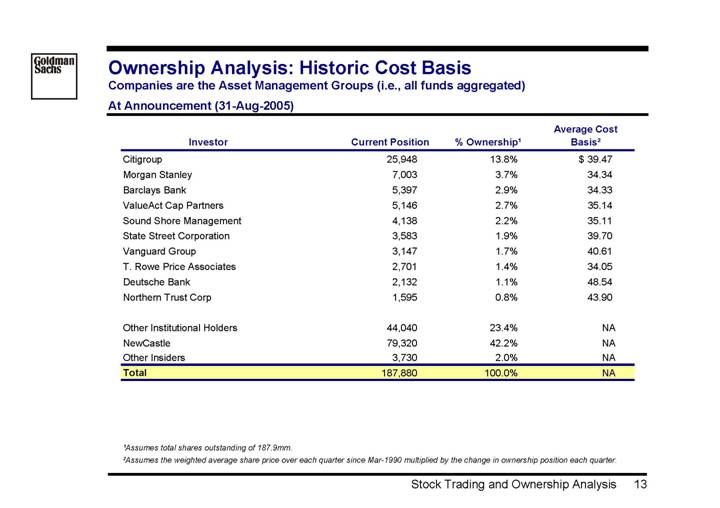
Ownership Analysis: Historic Cost Basis
Companies are the Asset Management Groups (i.e., all funds aggregated)
At Announcement (31-Aug-2005)
Investor |
| Current Position |
| % Ownership(1) |
| Average Cost |
| |
Citigroup |
| 25,948 |
| 13.8 | % | $ | 39.47 |
|
Morgan Stanley |
| 7,003 |
| 3.7 | % | 34.34 |
| |
Barclays Bank |
| 5,397 |
| 2.9 | % | 34.33 |
| |
ValueAct Cap Partners |
| 5,146 |
| 2.7 | % | 35.14 |
| |
Sound Shore Management |
| 4,138 |
| 2.2 | % | 35.11 |
| |
State Street Corporation |
| 3,583 |
| 1.9 | % | 39.70 |
| |
Vanguard Group |
| 3,147 |
| 1.7 | % | 40.61 |
| |
T. Rowe Price Associates |
| 2,701 |
| 1.4 | % | 34.05 |
| |
Deutsche Bank |
| 2,132 |
| 1.1 | % | 48.54 |
| |
Northern Trust Corp |
| 1,595 |
| 0.8 | % | 43.90 |
| |
|
|
|
|
|
|
|
| |
Other Institutional Holders |
| 44,040 |
| 23.4 | % | NA |
| |
NewCastle |
| 79,320 |
| 42.2 | % | NA |
| |
Other Insiders |
| 3,730 |
| 2.0 | % | NA |
| |
Total |
| 187,880 |
| 100.0 | % | NA |
| |
(1) Assumes total shares outstanding of 187.9mm.
(2) Assumes the weighted average share price over each quarter since Mar-1990 multiplied by the change in ownership position each quarter.
13
III. Analysis of Financial Projections
14
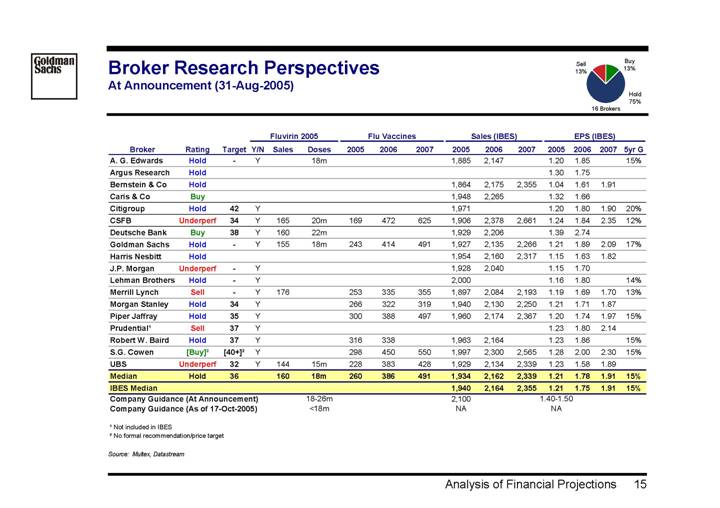
Broker Research Perspectives
At Announcement (31-Aug-2005)
[CHART]
|
|
|
|
|
| Fluvirin 2005 |
| Flu Vaccines |
| Sales (IBES) |
| EPS (IBES) |
| ||||||||||||||||||
Broker |
| Rating |
| Target |
| Y/N |
| Sales |
| Doses |
| 2005 |
| 2006 |
| 2007 |
| 2005 |
| 2006 |
| 2007 |
| 2005 |
| 2006 |
| 2007 |
| 5yr G |
|
A. G. Edwards |
| Hold |
| — |
| Y |
|
|
| 18m |
|
|
|
|
|
|
| 1,885 |
| 2,147 |
|
|
| 1.20 |
| 1.85 |
|
|
| 15 | % |
Argus Research |
| Hold |
|
|
|
|
|
|
|
|
|
|
|
|
|
|
|
|
|
|
|
|
| 1.30 |
| 1.75 |
|
|
|
|
|
Bernstein & Co |
| Hold |
|
|
|
|
|
|
|
|
|
|
|
|
|
|
| 1,864 |
| 2,175 |
| 2,355 |
| 1.04 |
| 1.61 |
| 1.91 |
|
|
|
Caris & Co |
| Buy |
|
|
|
|
|
|
|
|
|
|
|
|
|
|
| 1,948 |
| 2,265 |
|
|
| 1.32 |
| 1.66 |
|
|
|
|
|
Citigroup |
| Hold |
| 42 |
| Y |
|
|
|
|
|
|
|
|
|
|
| 1,971 |
|
|
|
|
| 1.20 |
| 1.80 |
| 1.90 |
| 20 | % |
CSFB |
| Underperf |
| 34 |
| Y |
| 165 |
| 20m |
| 169 |
| 472 |
| 625 |
| 1,906 |
| 2,378 |
| 2,661 |
| 1.24 |
| 1.84 |
| 2.35 |
| 12 | % |
Deutsche Bank |
| Buy |
| 38 |
| Y |
| 160 |
| 22m |
|
|
|
|
|
|
| 1,929 |
| 2,206 |
|
|
| 1.39 |
| 2.74 |
|
|
|
|
|
Goldman Sachs |
| Hold |
| — |
| Y |
| 155 |
| 18m |
| 243 |
| 414 |
| 491 |
| 1,927 |
| 2,135 |
| 2,266 |
| 1.21 |
| 1.89 |
| 2.09 |
| 17 | % |
Harris Nesbitt |
| Hold |
|
|
|
|
|
|
|
|
|
|
|
|
|
|
| 1,954 |
| 2,160 |
| 2,317 |
| 1.15 |
| 1.63 |
| 1.82 |
|
|
|
J.P. Morgan |
| Underperf |
| — |
| Y |
|
|
|
|
|
|
|
|
|
|
| 1,928 |
| 2,040 |
|
|
| 1.15 |
| 1.70 |
|
|
|
|
|
Lehman Brothers |
| Hold |
| — |
| Y |
|
|
|
|
|
|
|
|
|
|
| 2,000 |
|
|
|
|
| 1.16 |
| 1.80 |
|
|
| 14 | % |
Merrill Lynch |
| Sell |
| — |
| Y |
| 176 |
|
|
| 253 |
| 335 |
| 355 |
| 1,897 |
| 2,084 |
| 2,193 |
| 1.19 |
| 1.69 |
| 1.70 |
| 13 | % |
Morgan Stanley |
| Hold |
| 34 |
| Y |
|
|
|
|
| 266 |
| 322 |
| 319 |
| 1,940 |
| 2,130 |
| 2,250 |
| 1.21 |
| 1.71 |
| 1.87 |
|
|
|
Piper Jaffray |
| Hold |
| 35 |
| Y |
|
|
|
|
| 300 |
| 388 |
| 497 |
| 1,960 |
| 2,174 |
| 2,367 |
| 1.20 |
| 1.74 |
| 1.97 |
| 15 | % |
Prudential(1) |
| Sell |
| 37 |
| Y |
|
|
|
|
|
|
|
|
|
|
|
|
|
|
|
|
| 1.23 |
| 1.80 |
| 2.14 |
|
|
|
Robert W. Baird |
| Hold |
| 37 |
| Y |
|
|
|
|
| 316 |
| 338 |
|
|
| 1,963 |
| 2,164 |
|
|
| 1.23 |
| 1.86 |
|
|
| 15 | % |
S.G. Cowen |
| [Buy](2) |
| [40+ | ](2) | Y |
|
|
|
|
| 298 |
| 450 |
| 550 |
| 1,997 |
| 2,300 |
| 2,565 |
| 1.28 |
| 2.00 |
| 2.30 |
| 15 | % |
UBS |
| Underperf |
| 32 |
| Y |
| 144 |
| 15m |
| 228 |
| 383 |
| 428 |
| 1,929 |
| 2,134 |
| 2,339 |
| 1.23 |
| 1.58 |
| 1.89 |
|
|
|
Median |
| Hold |
| 36 |
|
|
| 160 |
| 18m |
| 260 |
| 386 |
| 491 |
| 1,934 |
| 2,162 |
| 2,339 |
| 1.21 |
| 1.78 |
| 1.91 |
| 15 | % |
IBES Median |
|
|
|
|
|
|
|
|
|
|
|
|
|
|
|
|
| 1,940 |
| 2,164 |
| 2,355 |
| 1.21 |
| 1.75 |
| 1.91 |
| 15 | % |
Company Guidance (At Announcement) |
|
|
|
|
|
|
|
|
| 18-26m |
|
|
|
|
|
|
| 2,100 |
|
|
|
|
| 1.40-1.50 |
|
|
|
|
|
|
|
Company Guidance (As of 17-Oct-2005) |
|
|
|
|
|
|
|
|
| <18m |
|
|
|
|
|
|
| NA |
|
|
|
|
| NA |
|
|
|
|
|
|
|
(1) Not included in IBES
(2) No formal recommendation/price target
Source: Multex, Datastream
15
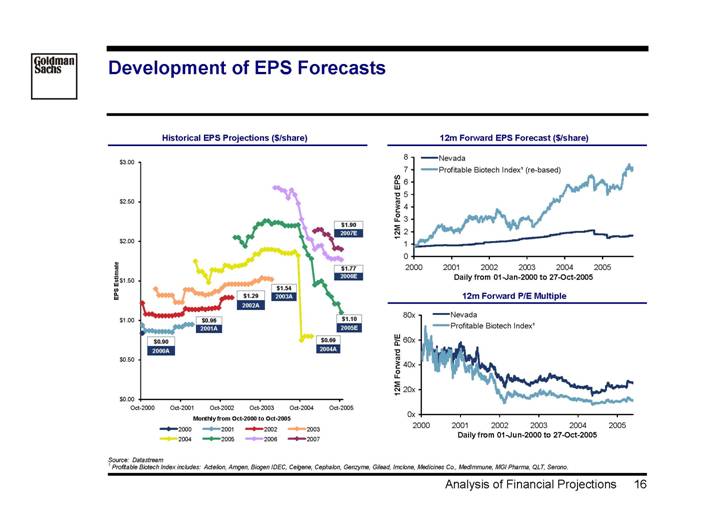
Development of EPS Forecasts
Historical EPS Projections ($/share) |
| 12m Forward EPS Forecast ($/share) |
|
|
|
[CHART] |
| [CHART] |
|
|
|
|
| 12m Forward P/E Multiple |
|
|
|
|
| [CHART] |
Source: Datastream
(1) Profitable Biotech Index includes: Actelion, Amgen, Biogen IDEC, Celgene, Cephalon, Genzyme, Gilead, Imclone, Medicines Co., MedImmune, MGI Pharma, QLT, Serono.
16
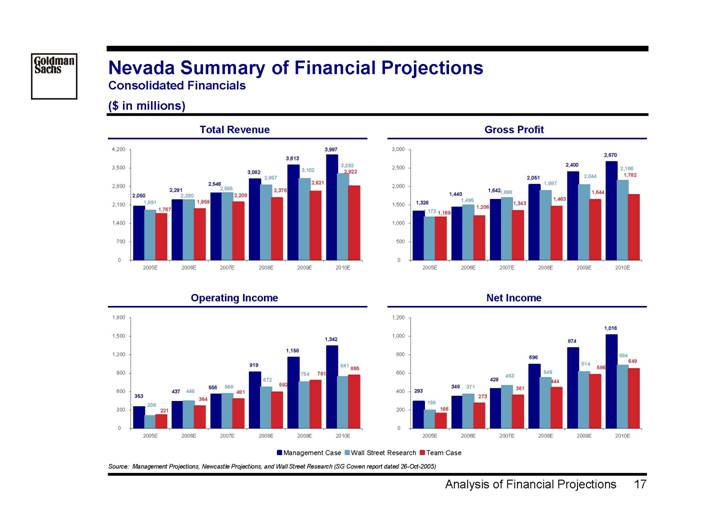
Nevada Summary of Financial Projections
Consolidated Financials
($ in millions)
Total Revenue |
| Gross Profit |
|
|
|
[CHART] |
| [CHART] |
|
|
|
Operating Income |
| Net Income |
|
|
|
[CHART] |
| [CHART] |
Source: Management Projections, Newcastle Projections, and Wall Street Research (SG Cowen report dated 26-Oct-2005)
17
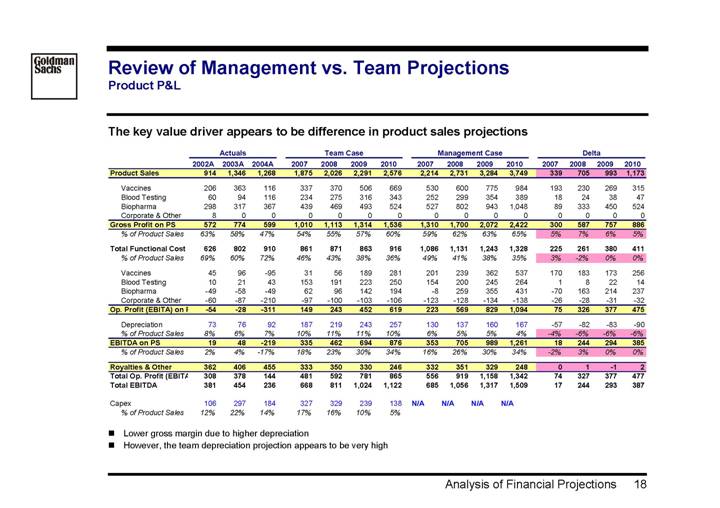
Review of Management vs. Team Projections
Product P&L
The key value driver appears to be difference in product sales projections
|
| Actuals |
| Team Case |
| Management Case |
| Delta |
| ||||||||||||||||||||||
|
| 2002A |
| 2003A |
| 2004A |
| 2007 |
| 2008 |
| 2009 |
| 2010 |
| 2007 |
| 2008 |
| 2009 |
| 2010 |
| 2007 |
| 2008 |
| 2009 |
| 2010 |
|
Product Sales |
| 914 |
| 1,346 |
| 1,268 |
| 1,875 |
| 2,026 |
| 2,291 |
| 2,576 |
| 2,214 |
| 2,731 |
| 3,284 |
| 3,749 |
| 339 |
| 705 |
| 993 |
| 1,173 |
|
|
|
|
|
|
|
|
|
|
|
|
|
|
|
|
|
|
|
|
|
|
|
|
|
|
|
|
|
|
|
|
|
Vaccines |
| 206 |
| 363 |
| 116 |
| 337 |
| 370 |
| 506 |
| 669 |
| 530 |
| 600 |
| 775 |
| 984 |
| 193 |
| 230 |
| 269 |
| 315 |
|
Blood Testing |
| 60 |
| 94 |
| 116 |
| 234 |
| 275 |
| 316 |
| 343 |
| 252 |
| 299 |
| 354 |
| 389 |
| 18 |
| 24 |
| 38 |
| 47 |
|
Biopharma |
| 298 |
| 317 |
| 367 |
| 439 |
| 469 |
| 493 |
| 524 |
| 527 |
| 802 |
| 943 |
| 1,048 |
| 89 |
| 333 |
| 450 |
| 524 |
|
Corporate & Other |
| 8 |
| 0 |
| 0 |
| 0 |
| 0 |
| 0 |
| 0 |
| 0 |
| 0 |
| 0 |
| 0 |
| 0 |
| 0 |
| 0 |
| 0 |
|
Gross Profit on PS |
| 572 |
| 774 |
| 599 |
| 1,010 |
| 1,113 |
| 1,314 |
| 1,536 |
| 1,310 |
| 1,700 |
| 2,072 |
| 2,422 |
| 300 |
| 587 |
| 757 |
| 886 |
|
% of Product Sales |
| 63 | % | 58 | % | 47 | % | 54 | % | 55 | % | 57 | % | 60 | % | 59 | % | 62 | % | 63 | % | 65 | % | 5 | % | 7 | % | 6 | % | 5 | % |
|
|
|
|
|
|
|
|
|
|
|
|
|
|
|
|
|
|
|
|
|
|
|
|
|
|
|
|
|
|
|
|
Total Functional Cost |
| 626 |
| 802 |
| 910 |
| 861 |
| 871 |
| 863 |
| 916 |
| 1,086 |
| 1,131 |
| 1,243 |
| 1,328 |
| 225 |
| 261 |
| 380 |
| 411 |
|
% of Product Sales |
| 69 | % | 60 | % | 72 | % | 46 | % | 43 | % | 38 | % | 36 | % | 49 | % | 41 | % | 38 | % | 35 | % | 3 | % | -2 | % | 0 | % | 0 | % |
|
|
|
|
|
|
|
|
|
|
|
|
|
|
|
|
|
|
|
|
|
|
|
|
|
|
|
|
|
|
|
|
Vaccines |
| 45 |
| 96 |
| -95 |
| 31 |
| 56 |
| 189 |
| 281 |
| 201 |
| 239 |
| 362 |
| 537 |
| 170 |
| 183 |
| 173 |
| 256 |
|
Blood Testing |
| 10 |
| 21 |
| 43 |
| 153 |
| 191 |
| 223 |
| 250 |
| 154 |
| 200 |
| 245 |
| 264 |
| 1 |
| 8 |
| 22 |
| 14 |
|
Biopharma |
| -49 |
| -58 |
| -49 |
| 62 |
| 96 |
| 142 |
| 194 |
| -8 |
| 259 |
| 355 |
| 431 |
| -70 |
| 163 |
| 214 |
| 237 |
|
Corporate & Other |
| -60 |
| -87 |
| -210 |
| -97 |
| -100 |
| -103 |
| -106 |
| -123 |
| -128 |
| -134 |
| -138 |
| -26 |
| -28 |
| -31 |
| -32 |
|
Op. Profit (EBITA) on |
| -54 |
| -28 |
| -311 |
| 149 |
| 243 |
| 452 |
| 619 |
| 223 |
| 569 |
| 829 |
| 1,094 |
| 75 |
| 326 |
| 377 |
| 475 |
|
|
|
|
|
|
|
|
|
|
|
|
|
|
|
|
|
|
|
|
|
|
|
|
|
|
|
|
|
|
|
|
|
Depreciation |
| 73 |
| 76 |
| 92 |
| 187 |
| 219 |
| 243 |
| 257 |
| 130 |
| 137 |
| 160 |
| 167 |
| -57 |
| -82 |
| -83 |
| -90 |
|
% of Product Sales |
| 8 | % | 6 | % | 7 | % | 10 | % | 11 | % | 11 | % | 10 | % | 6 | % | 5 | % | 5 | % | 4 | % | -4 | % | -6 | % | -6 | % | -6 | % |
EBITDA on PS |
| 19 |
| 48 |
| -219 |
| 335 |
| 462 |
| 694 |
| 876 |
| 353 |
| 705 |
| 989 |
| 1,261 |
| 18 |
| 244 |
| 294 |
| 385 |
|
% of Product Sales |
| 2 | % | 4 | % | -17 | % | 18 | % | 23 | % | 30 | % | 34 | % | 16 | % | 26 | % | 30 | % | 34 | % | -2 | % | 3 | % | 0 | % | 0 | % |
|
|
|
|
|
|
|
|
|
|
|
|
|
|
|
|
|
|
|
|
|
|
|
|
|
|
|
|
|
|
|
|
Royalties & Other |
| 362 |
| 406 |
| 455 |
| 333 |
| 350 |
| 330 |
| 246 |
| 332 |
| 351 |
| 329 |
| 248 |
| 0 |
| 1 |
| -1 |
| 2 |
|
Total Op. Profit (EBITA |
| 308 |
| 378 |
| 144 |
| 481 |
| 592 |
| 781 |
| 865 |
| 556 |
| 919 |
| 1,158 |
| 1,342 |
| 74 |
| 327 |
| 377 |
| 477 |
|
Total EBITDA |
| 381 |
| 454 |
| 236 |
| 668 |
| 811 |
| 1,024 |
| 1,122 |
| 685 |
| 1,056 |
| 1,317 |
| 1,509 |
| 17 |
| 244 |
| 293 |
| 387 |
|
|
|
|
|
|
|
|
|
|
|
|
|
|
|
|
|
|
|
|
|
|
|
|
|
|
|
|
|
|
|
|
|
Capex |
| 106 |
| 297 |
| 184 |
| 327 |
| 329 |
| 239 |
| 138 |
| N/A |
| N/A |
| N/A |
| N/A |
|
|
|
|
|
|
|
|
|
% of Product Sales |
| 12 | % | 22 | % | 14 | % | 17 | % | 16 | % | 10 | % | 5 | % |
|
|
|
|
|
|
|
|
|
|
|
|
|
|
|
|
• Lower gross margin due to higher depreciation
• However, the team depreciation projection appears to be very high
18
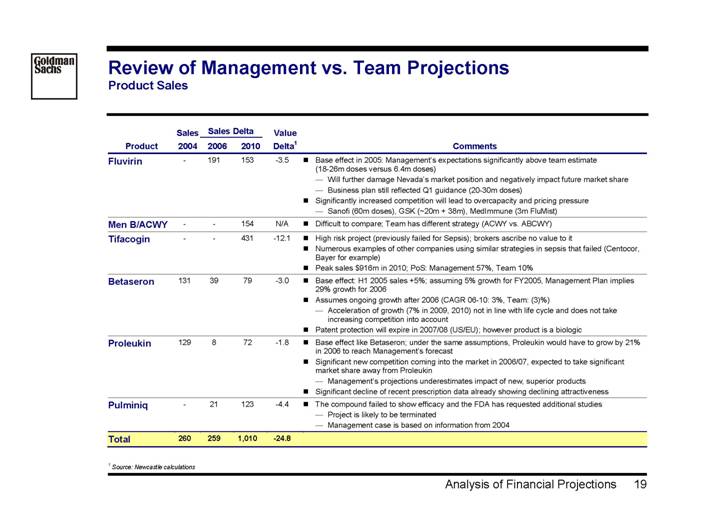
Review of Management vs. Team Projections
Product Sales
|
| Sales |
| Sales Delta |
| Value |
|
|
| ||
Product |
| 2004 |
| 2006 |
| 2010 |
| Delta(1) |
| Comments |
|
Fluvirin |
| — |
| 191 |
| 153 |
| -3.5 |
| • Base effect in 2005: Management’s expectations significantly above team estimate (18-26m doses versus 6.4m doses) |
|
|
|
|
|
|
|
|
|
|
| • Will further damage Nevada’s market position and negatively impact future market share |
|
|
|
|
|
|
|
|
|
|
| • Business plan still reflected Q1 guidance (20-30m doses) |
|
|
|
|
|
|
|
|
|
|
| • Significantly increased competition will lead to overcapacity and pricing pressure |
|
|
|
|
|
|
|
|
|
|
| • Sanofi (60m doses), GSK (~20m + 38m), MedImmune (3m FluMist) |
|
Men B/ACWY |
| — |
| — |
| 154 |
| N/A |
| • Difficult to compare; Team has different strategy (ACWY vs. ABCWY) |
|
Tifacogin |
| — |
| — |
| 431 |
| -12.1 |
| • High risk project (previously failed for Sepsis); brokers ascribe no value to it |
|
|
|
|
|
|
|
|
|
|
| • Numerous examples of other companies using similar strategies in sepsis that failed (Centocor, Bayer for example) |
|
|
|
|
|
|
|
|
|
|
| • Peak sales $916m in 2010; PoS: Management 57%, Team 10% |
|
Betaseron |
| 131 |
| 39 |
| 79 |
| -3.0 |
| • Base effect: H1 2005 sales +5%; assuming 5% growth for FY2005, Management Plan implies 29% growth for 2006 |
|
|
|
|
|
|
|
|
|
|
| • Assumes ongoing growth after 2006 (CAGR 06-10: 3%, Team: (3)%) |
|
|
|
|
|
|
|
|
|
|
| • Acceleration of growth (7% in 2009, 2010) not in line with life cycle and does not take increasing competition into account |
|
|
|
|
|
|
|
|
|
|
| • Patent protection will expire in 2007/08 (US/EU); however product is a biologic |
|
Proleukin |
| 129 |
| 8 |
| 72 |
| -1.8 |
| • Base effect like Betaseron; under the same assumptions, Proleukin would have to grow by 21% in 2006 to reach Management’s forecast |
|
|
|
|
|
|
|
|
|
|
| • Significant new competition coming into the market in 2006/07, expected to take significant market share away from Proleukin |
|
|
|
|
|
|
|
|
|
|
| • Management’s projections underestimates impact of new, superior products |
|
|
|
|
|
|
|
|
|
|
| • Significant decline of recent prescription data already showing declining attractiveness |
|
Pulminiq |
| — |
| 21 |
| 123 |
| -4.4 |
| • The compound failed to show efficacy and the FDA has requested additional studies |
|
|
|
|
|
|
|
|
|
|
| • Project is likely to be terminated |
|
|
|
|
|
|
|
|
|
|
| • Management case is based on information from 2004 |
|
Total |
| 260 |
| 259 |
| 1,010 |
| -24.8 |
|
|
|
(1) Source: Newcastle calculations
19
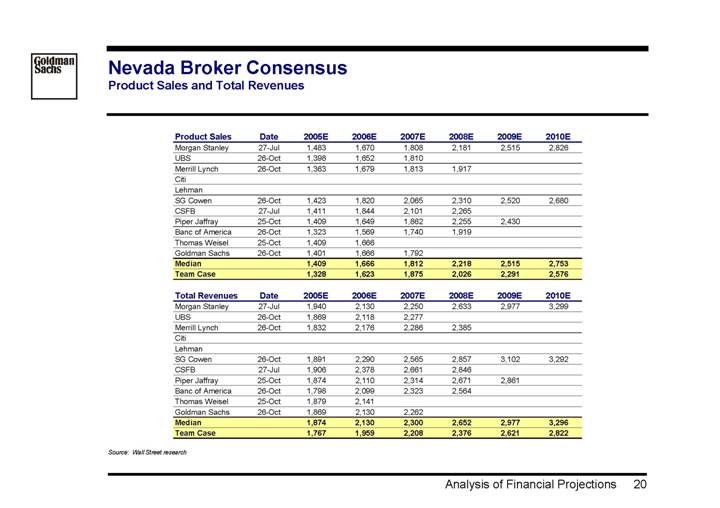
Nevada Broker Consensus
Product Sales and Total Revenues
Product Sales |
| Date |
| 2005E |
| 2006E |
| 2007E |
| 2008E |
| 2009E |
| 2010E |
|
Morgan Stanley |
| 27-Jul |
| 1,483 |
| 1,670 |
| 1,808 |
| 2,181 |
| 2,515 |
| 2,826 |
|
UBS |
| 26-Oct |
| 1,398 |
| 1,652 |
| 1,810 |
|
|
|
|
|
|
|
Merrill Lynch |
| 26-Oct |
| 1,363 |
| 1,679 |
| 1,813 |
| 1,917 |
|
|
|
|
|
Citi |
|
|
|
|
|
|
|
|
|
|
|
|
|
|
|
Lehman |
|
|
|
|
|
|
|
|
|
|
|
|
|
|
|
SG Cowen |
| 26-Oct |
| 1,423 |
| 1,820 |
| 2,065 |
| 2,310 |
| 2,520 |
| 2,680 |
|
CSFB |
| 27-Jul |
| 1,411 |
| 1,844 |
| 2,101 |
| 2,265 |
|
|
|
|
|
Piper Jaffray |
| 25-Oct |
| 1,409 |
| 1,649 |
| 1,862 |
| 2,255 |
| 2,430 |
|
|
|
Banc of America |
| 26-Oct |
| 1,323 |
| 1,569 |
| 1,740 |
| 1,919 |
|
|
|
|
|
Thomas Weisel |
| 25-Oct |
| 1,409 |
| 1,666 |
|
|
|
|
|
|
|
|
|
Goldman Sachs |
| 26-Oct |
| 1,401 |
| 1,666 |
| 1,792 |
|
|
|
|
|
|
|
Median |
|
|
| 1,409 |
| 1,666 |
| 1,812 |
| 2,218 |
| 2,515 |
| 2,753 |
|
Team Case |
|
|
| 1,328 |
| 1,623 |
| 1,875 |
| 2,026 |
| 2,291 |
| 2,576 |
|
|
|
|
|
|
|
|
|
|
|
|
|
|
|
|
|
Total Revenues |
| Date |
| 2005E |
| 2006E |
| 2007E |
| 2008E |
| 2009E |
| 2010E |
|
Morgan Stanley |
| 27-Jul |
| 1,940 |
| 2,130 |
| 2,250 |
| 2,633 |
| 2,977 |
| 3,299 |
|
UBS |
| 26-Oct |
| 1,869 |
| 2,118 |
| 2,277 |
|
|
|
|
|
|
|
Merrill Lynch |
| 26-Oct |
| 1,832 |
| 2,176 |
| 2,286 |
| 2,385 |
|
|
|
|
|
Citi |
|
|
|
|
|
|
|
|
|
|
|
|
|
|
|
Lehman |
|
|
|
|
|
|
|
|
|
|
|
|
|
|
|
SG Cowen |
| 26-Oct |
| 1,891 |
| 2,290 |
| 2,565 |
| 2,857 |
| 3,102 |
| 3,292 |
|
CSFB |
| 27-Jul |
| 1,906 |
| 2,378 |
| 2,661 |
| 2,846 |
|
|
|
|
|
Piper Jaffray |
| 25-Oct |
| 1,874 |
| 2,110 |
| 2,314 |
| 2,671 |
| 2,861 |
|
|
|
Banc of America |
| 26-Oct |
| 1,798 |
| 2,099 |
| 2,323 |
| 2,564 |
|
|
|
|
|
Thomas Weisel |
| 25-Oct |
| 1,879 |
| 2,141 |
|
|
|
|
|
|
|
|
|
Goldman Sachs |
| 26-Oct |
| 1,869 |
| 2,130 |
| 2,262 |
|
|
|
|
|
|
|
Median |
|
|
| 1,874 |
| 2,130 |
| 2,300 |
| 2,652 |
| 2,977 |
| 3,296 |
|
Team Case |
|
|
| 1,767 |
| 1,959 |
| 2,208 |
| 2,376 |
| 2,621 |
| 2,822 |
|
Source: Wall Street research
20
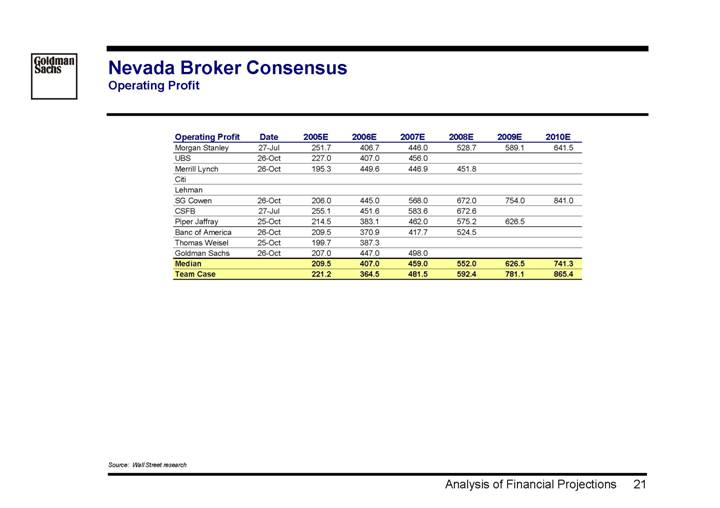
Nevada Broker Consensus
Operating Profit
Operating Profit |
| Date |
| 2005E |
| 2006E |
| 2007E |
| 2008E |
| 2009E |
| 2010E |
|
Morgan Stanley |
| 27-Jul |
| 251.7 |
| 406.7 |
| 446.0 |
| 528.7 |
| 589.1 |
| 641.5 |
|
UBS |
| 26-Oct |
| 227.0 |
| 407.0 |
| 456.0 |
|
|
|
|
|
|
|
Merrill Lynch |
| 26-Oct |
| 195.3 |
| 449.6 |
| 446.9 |
| 451.8 |
|
|
|
|
|
Citi |
|
|
|
|
|
|
|
|
|
|
|
|
|
|
|
Lehman |
|
|
|
|
|
|
|
|
|
|
|
|
|
|
|
SG Cowen |
| 26-Oct |
| 206.0 |
| 445.0 |
| 568.0 |
| 672.0 |
| 754.0 |
| 841.0 |
|
CSFB |
| 27-Jul |
| 255.1 |
| 451.6 |
| 583.6 |
| 672.6 |
|
|
|
|
|
Piper Jaffray |
| 25-Oct |
| 214.5 |
| 383.1 |
| 462.0 |
| 575.2 |
| 626.5 |
|
|
|
Banc of America |
| 26-Oct |
| 209.5 |
| 370.9 |
| 417.7 |
| 524.5 |
|
|
|
|
|
Thomas Weisel |
| 25-Oct |
| 199.7 |
| 387.3 |
|
|
|
|
|
|
|
|
|
Goldman Sachs |
| 26-Oct |
| 207.0 |
| 447.0 |
| 498.0 |
|
|
|
|
|
|
|
Median |
|
|
| 209.5 |
| 407.0 |
| 459.0 |
| 552.0 |
| 626.5 |
| 741.3 |
|
Team Case |
|
|
| 221.2 |
| 364.5 |
| 481.5 |
| 592.4 |
| 781.1 |
| 865.4 |
|
Source: Wall Street research
21
Greypage
22
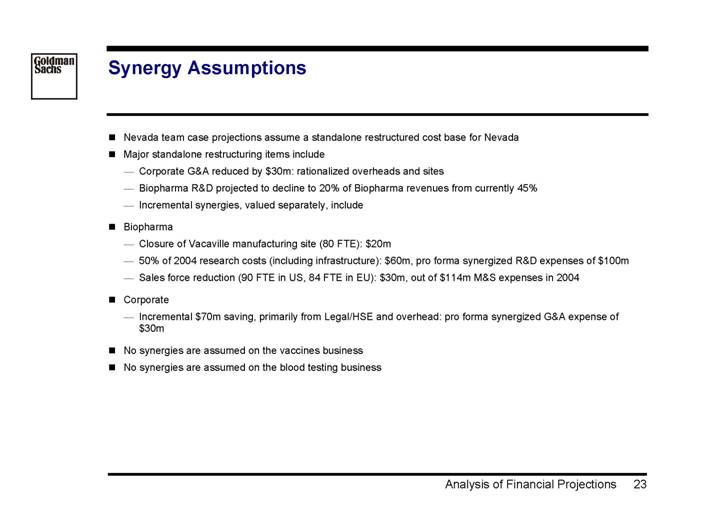
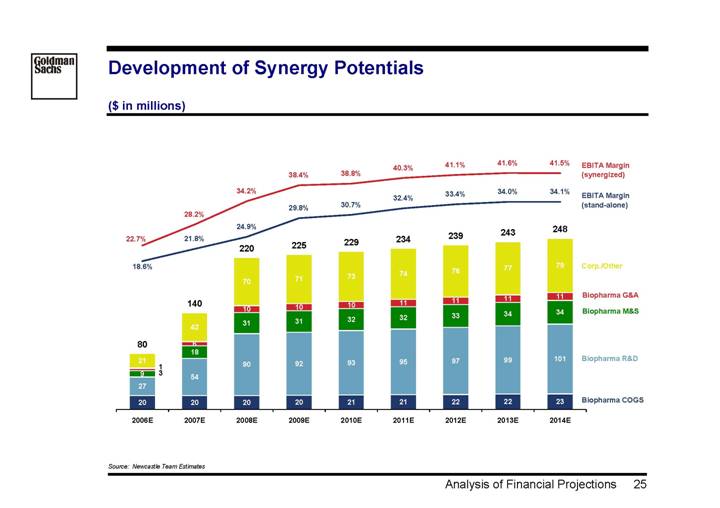
Synergy Assumptions
• Nevada team case projections assume a standalone restructured cost base for Nevada
• Major standalone restructuring items include
• Corporate G&A reduced by $30m: rationalized overheads and sites
• Biopharma R&D projected to decline to 20% of Biopharma revenues from currently 45%
• Incremental synergies, valued separately, include
• Biopharma
• Closure of Vacaville manufacturing site (80 FTE): $20m
• 50% of 2004 research costs (including infrastructure): $60m, pro forma synergized R&D expenses of $100m
• Sales force reduction (90 FTE in US, 84 FTE in EU): $30m, out of $114m M&S expenses in 2004
• Corporate
• Incremental $70m saving, primarily from Legal/HSE and overhead: pro forma synergized G&A expense of $30m
• No synergies are assumed on the vaccines business
• No synergies are assumed on the blood testing business
23
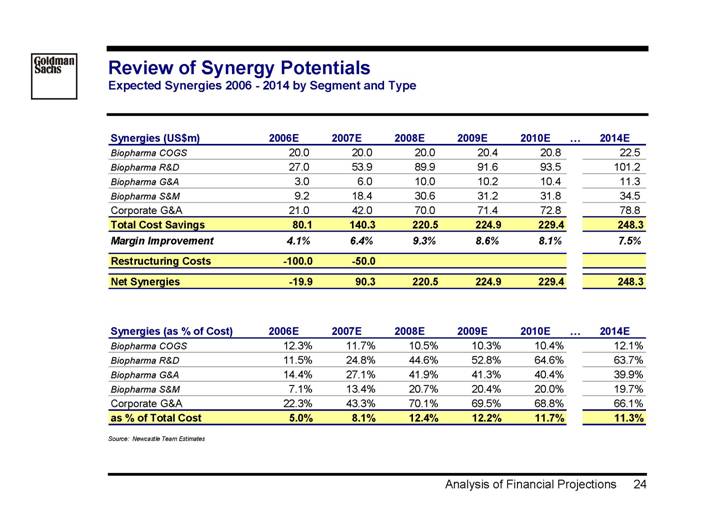
Review of Synergy Potentials
Expected Synergies 2006 - 2014 by Segment and Type
Synergies (US$m) |
| 2006E |
| 2007E |
| 2008E |
| 2009E |
| 2010E |
| 2014E |
|
Biopharma COGS |
| 20.0 |
| 20.0 |
| 20.0 |
| 20.4 |
| 20.8 |
| 22.5 |
|
Biopharma R&D |
| 27.0 |
| 53.9 |
| 89.9 |
| 91.6 |
| 93.5 |
| 101.2 |
|
Biopharma G&A |
| 3.0 |
| 6.0 |
| 10.0 |
| 10.2 |
| 10.4 |
| 11.3 |
|
Biopharma S&M |
| 9.2 |
| 18.4 |
| 30.6 |
| 31.2 |
| 31.8 |
| 34.5 |
|
Corporate G&A |
| 21.0 |
| 42.0 |
| 70.0 |
| 71.4 |
| 72.8 |
| 78.8 |
|
Total Cost Savings |
| 80.1 |
| 140.3 |
| 220.5 |
| 224.9 |
| 229.4 |
| 248.3 |
|
Margin Improvement |
| 4.1 | % | 6.4 | % | 9.3 | % | 8.6 | % | 8.1 | % | 7.5 | % |
Restructuring Costs |
| -100.0 |
| -50.0 |
|
|
|
|
|
|
|
|
|
Net Synergies |
| -19.9 |
| 90.3 |
| 220.5 |
| 224.9 |
| 229.4 |
| 248.3 |
|
|
|
|
|
|
|
|
|
|
|
|
|
|
|
Synergies (as % of Cost) |
| 2006E |
| 2007E |
| 2008E |
| 2009E |
| 2010E |
| 2014E |
|
Biopharma COGS |
| 12.3 | % | 11.7 | % | 10.5 | % | 10.3 | % | 10.4 | % | 12.1 | % |
Biopharma R&D |
| 11.5 | % | 24.8 | % | 44.6 | % | 52.8 | % | 64.6 | % | 63.7 | % |
Biopharma G&A |
| 14.4 | % | 27.1 | % | 41.9 | % | 41.3 | % | 40.4 | % | 39.9 | % |
Biopharma S&M |
| 7.1 | % | 13.4 | % | 20.7 | % | 20.4 | % | 20.0 | % | 19.7 | % |
Corporate G&A |
| 22.3 | % | 43.3 | % | 70.1 | % | 69.5 | % | 68.8 | % | 66.1 | % |
as % of Total Cost |
| 5.0 | % | 8.1 | % | 12.4 | % | 12.2 | % | 11.7 | % | 11.3 | % |
Source: Newcastle Team Estimates
24
Development of Synergy Potentials
($ in millions)
[CHART]
Source: Newcastle Team Estimates
25
IV. Valuation Analysis
26
Approach to Valuation
• Valuation based on sum-of-parts approach to reflect the different business characteristics of each (sub-)segment
• Focus on DCF valuation
• Limited availability of comparable valuation benchmarks
• Some businesses have only limited franchise value / no terminal value (e.g. Blood Testing) and reflect more a stream of cash flows (i.e., royalty and license fees)
• Significantly changing profitability in near-to-mid term (i.e., Biopharmaceuticals, Vaccines) makes LTM/current multiples less meaningful
• DCF methodology reflects different characteristics of the businesses
• Vaccines: Strong franchise value with a number of short-to-mid term catalysts (Fluvirin, Meningitis ACWY)
• Biopharmaceuticals: Limited topline growth prospects but significant profitability improvement potential (i.e., R&D)
• Blood Testing: Limited franchise value, assuming no terminal value post patent expiry (NAT) or contract termination (Immunodiagnostics)
• Royalties and License Fees: Cash flow stream linked to IP, no terminal value
• Valuation based on Newcastle Team projections (“Team Case”)
• Cost synergies are separately valued, assuming a sustainable improvement of Nevada’s cost structure (i.e. with terminal value)
• Main sources of synergies are the Biopharmaceuticals segment as well as Corporate G&A
27
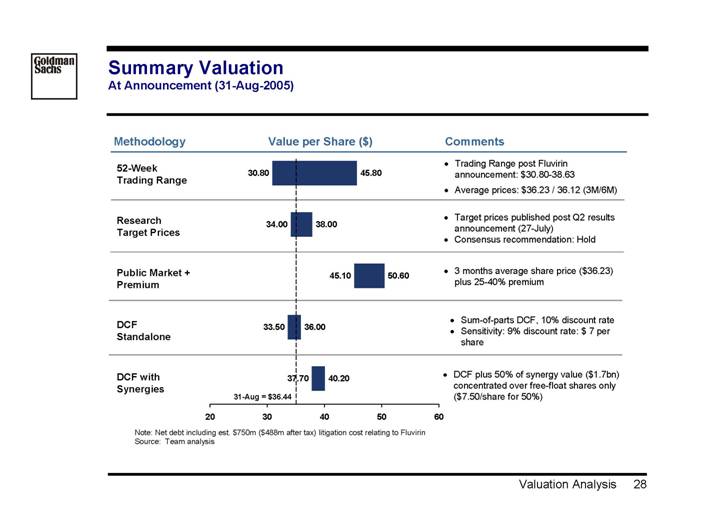
Summary Valuation
At Announcement (31-Aug-2005)
Methodology |
| Value per Share ($) |
| Comments |
52-Week Trading Range |
|
|
| • Trading Range post Fluvirin announcement: $30.80-38.63 • Average prices: $36.23 / 36.12 (3M/6M) |
|
|
|
|
|
Research Target Prices |
|
|
| • Target prices published post Q2 results announcement (27-July) |
|
|
|
| • Consensus recommendation: Hold |
|
| [CHART] |
|
|
Public Market + Premium |
|
|
| • 3 months average share price ($36.23) plus 25-40% premium |
|
|
|
|
|
DCF Standalone |
|
|
| • Sum-of-parts DCF, 10% discount rate |
|
|
|
| • Sensitivity: 9% discount rate: $ 7 per share |
|
|
|
|
|
DCF with Synergies |
|
|
| • DCF plus 50% of synergy value ($1.7bn) concentrated over free-float shares only ($7.50/share for 50%) |
Note: Net debt including est. $750m ($488m after tax) litigation cost relating to Fluvirin
Source: Team analysis
28
Analysis at Various Prices: Team Projections
Offer Value per Share ($) |
|
|
| 36.44 |
| 40.00 |
| 41.00 |
| 42.00 |
| 43.00 |
| 44.00 |
| 45.00 |
| 46.00 |
| 47.00 |
| |
Premium to Current |
|
|
| 0 | % | 10 | % | 13 | % | 15 | % | 18 | % | 21 | % | 23 | % | 26 | % | 29 | % | |
Premium to 3M Avg. |
|
|
| 1 | % | 11 | % | 14 | % | 16 | % | 19 | % | 22 | % | 25 | % | 27 | % | 30 | % | |
Enterprise Value ($ m) |
|
|
| 7,515 |
| 8,229 |
| 8,431 |
| 8,634 |
| 8,839 |
| 9,047 |
| 9,255 |
| 9,464 |
| 9,674 |
| |
Equity Value ($ m) |
|
|
| 6,919 |
| 7,633 |
| 7,836 |
| 8,038 |
| 8,243 |
| 8,451 |
| 8,660 |
| 8,869 |
| 9,079 |
| |
Tender Value ($m) |
|
|
| 4,029 |
| 4,461 |
| 4,584 |
| 4,707 |
| 4,833 |
| 4,961 |
| 5,090 |
| 5,220 |
| 5,351 |
| |
|
|
|
|
|
|
|
|
|
|
|
|
|
|
|
|
|
|
|
|
|
| |
EV/Sales |
|
|
|
|
|
|
|
|
|
|
|
|
|
|
|
|
|
|
|
|
| |
2005E |
| 1,767 |
| 4.3 | x | 4.7 | x | 4.8 | x | 4.9 | x | 5.0 | x | 5.1 | x | 5.2 | x | 5.4 | x | 5.5 | x | |
2006E |
| 1,959 |
| 3.8 | x | 4.2 | x | 4.3 | x | 4.4 | x | 4.5 | x | 4.6 | x | 4.7 | x | 4.8 | x | 4.9 | x | |
|
|
|
|
|
|
|
|
|
|
|
|
|
|
|
|
|
|
|
|
|
| |
EV/EBITDA |
|
|
|
|
|
|
|
|
|
|
|
|
|
|
|
|
|
|
|
|
| |
2005E |
| 348 |
| 21.6 | x | 23.6 | x | 24.2 | x | 24.8 | x | 25.4 | x | 26.0 | x | 26.6 | x | 27.2 | x | 27.8 | x | |
2006E |
| 521 |
| 14.4 | x | 15.8 | x | 16.2 | x | 16.6 | x | 17.0 | x | 17.4 | x | 17.8 | x | 18.2 | x | 18.6 | x | |
|
|
|
|
|
|
|
|
|
|
|
|
|
|
|
|
|
|
|
|
|
| |
EV/EBIT |
|
|
|
|
|
|
|
|
|
|
|
|
|
|
|
|
|
|
|
|
| |
2005E |
| 221 |
| 34.0 | x | 37.2 | x | 38.1 | x | 39.0 | x | 40.0 | x | 40.9 | x | 41.8 | x | 42.8 | x | 43.7 | x | |
2006E |
| 364 |
| 20.6 | x | 22.6 | x | 23.1 | x | 23.7 | x | 24.3 | x | 24.8 | x | 25.4 | x | 26.0 | x | 26.5 | x | |
|
|
|
|
|
|
|
|
|
|
|
|
|
|
|
|
|
|
|
|
|
| |
Pro-Forma P/E 2006E |
|
|
|
|
|
|
|
|
|
|
|
|
|
|
|
|
|
|
|
|
| |
Team Case 2006E |
| 1.40 |
| 26.0 | x | 28.5 | x | 29.2 | x | 29.9 | x | 30.6 | x | 31.3 | x | 32.0 | x | 32.8 | x | 33.5 | x | |
IBES 2006E |
| 1.77 |
| 20.6 | x | 22.6 | x | 23.2 | x | 23.7 | x | 24.3 | x | 24.9 | x | 25.4 | x | 26.0 | x | 26.6 | x | |
|
|
|
|
|
|
|
|
|
|
|
|
|
|
|
|
|
|
|
|
|
| |
Synergised Multiples 2005E |
|
|
|
|
|
|
|
|
|
|
|
|
|
|
|
|
|
|
|
|
| |
| EBITDA |
| 569 |
| 13.2 | x | 14.5 | x | 14.8 | x | 15.2 | x | 15.5 | x | 15.9 | x | 10.1 | x | 10.3 | x | 10.6 | x |
| EBIT |
| 442 |
| 17.0 | x | 18.6 | x | 19.1 | x | 19.6 | x | 20.0 | x | 20.5 | x | 11.7 | x | 12.0 | x | 12.2 | x |
Notes:
• 187.5m basic shares outstanding, 31.2m stock options outstanding with an average exercise price of $39.40.
• $596m adjusted net debt ($1m net cash & investments, $(488)m Fluvirin litigation cost (after tax), $(10)m bond repayment premium (after tax), $(48)m est. value of minority interest, $(52)m other liabilities)
• Tender Value reflects value of fully diluted shares less shares owned by Newcastle (79.32m shares).
Source: Team analysis
29
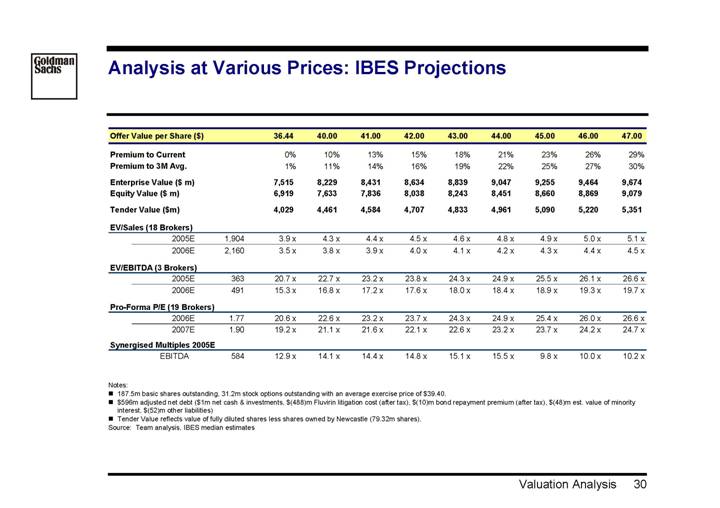
Analysis at Various Prices: IBES Projections
Offer Value per Share ($) |
|
|
| 36.44 |
| 40.00 |
| 41.00 |
| 42.00 |
| 43.00 |
| 44.00 |
| 45.00 |
| 46.00 |
| 47.00 |
|
Premium to Current |
|
|
| 0 | % | 10 | % | 13 | % | 15 | % | 18 | % | 21 | % | 23 | % | 26 | % | 29 | % |
Premium to 3M Avg. |
|
|
| 1 | % | 11 | % | 14 | % | 16 | % | 19 | % | 22 | % | 25 | % | 27 | % | 30 | % |
Enterprise Value ($ m) |
|
|
| 7,515 |
| 8,229 |
| 8,431 |
| 8,634 |
| 8,839 |
| 9,047 |
| 9,255 |
| 9,464 |
| 9,674 |
|
Equity Value ($ m) |
|
|
| 6,919 |
| 7,633 |
| 7,836 |
| 8,038 |
| 8,243 |
| 8,451 |
| 8,660 |
| 8,869 |
| 9,079 |
|
Tender Value ($m) |
|
|
| 4,029 |
| 4,461 |
| 4,584 |
| 4,707 |
| 4,833 |
| 4,961 |
| 5,090 |
| 5,220 |
| 5,351 |
|
|
|
|
|
|
|
|
|
|
|
|
|
|
|
|
|
|
|
|
|
|
|
EV/Sales (18 Brokers) |
|
|
|
|
|
|
|
|
|
|
|
|
|
|
|
|
|
|
|
|
|
2005E |
| 1,904 |
| 3.9 | x | 4.3 | x | 4.4 | x | 4.5 | x | 4.6 | x | 4.8 | x | 4.9 | x | 5.0 | x | 5.1 | x |
2006E |
| 2,160 |
| 3.5 | x | 3.8 | x | 3.9 | x | 4.0 | x | 4.1 | x | 4.2 | x | 4.3 | x | 4.4 | x | 4.5 | x |
|
|
|
|
|
|
|
|
|
|
|
|
|
|
|
|
|
|
|
|
|
|
EV/EBITDA (3 Brokers) |
|
|
|
|
|
|
|
|
|
|
|
|
|
|
|
|
|
|
|
|
|
2005E |
| 363 |
| 20.7 | x | 22.7 | x | 23.2 | x | 23.8 | x | 24.3 | x | 24.9 | x | 25.5 | x | 26.1 | x | 26.6 | x |
2006E |
| 491 |
| 15.3 | x | 16.8 | x | 17.2 | x | 17.6 | x | 18.0 | x | 18.4 | x | 18.9 | x | 19.3 | x | 19.7 | x |
|
|
|
|
|
|
|
|
|
|
|
|
|
|
|
|
|
|
|
|
|
|
Pro-Forma P/E (19 Brokers) |
|
|
|
|
|
|
|
|
|
|
|
|
|
|
|
|
|
|
|
|
|
2006E |
| 1.77 |
| 20.6 | x | 22.6 | x | 23.2 | x | 23.7 | x | 24.3 | x | 24.9 | x | 25.4 | x | 26.0 | x | 26.6 | x |
2007E |
| 1.90 |
| 19.2 | x | 21.1 | x | 21.6 | x | 22.1 | x | 22.6 | x | 23.2 | x | 23.7 | x | 24.2 | x | 24.7 | x |
|
|
|
|
|
|
|
|
|
|
|
|
|
|
|
|
|
|
|
|
|
|
Synergised Multiples 2005E |
|
|
|
|
|
|
|
|
|
|
|
|
|
|
|
|
|
|
|
|
|
EBITDA |
| 584 |
| 12.9 | x | 14.1 | x | 14.4 | x | 14.8 | x | 15.1 | x | 15.5 | x | 9.8 | x | 10.0 | x | 10.2 | x |
Notes:
• 187.5m basic shares outstanding, 31.2m stock options outstanding with an average exercise price of $39.40.
• $596m adjusted net debt ($1m net cash & investments, $(488)m Fluvirin litigation cost (after tax), $(10)m bond repayment premium (after tax), $(48)m est. value of minority interest, $(52)m other liabilities)
• Tender Value reflects value of fully diluted shares less shares owned by Newcastle (79.32m shares).
Source: Team analysis, IBES median estimates
30
Public Market Valuation
2006E P/E Ratio |
| 2006E PEG Ratio |
|
|
|
[CHART] |
| [CHART] |
|
|
|
2007E P/E Ratio |
| 2007E PEG Ratio |
|
|
|
[CHART] |
| [CHART] |
Source: Factset as of 25-Oct-2005; SEC filings.
31
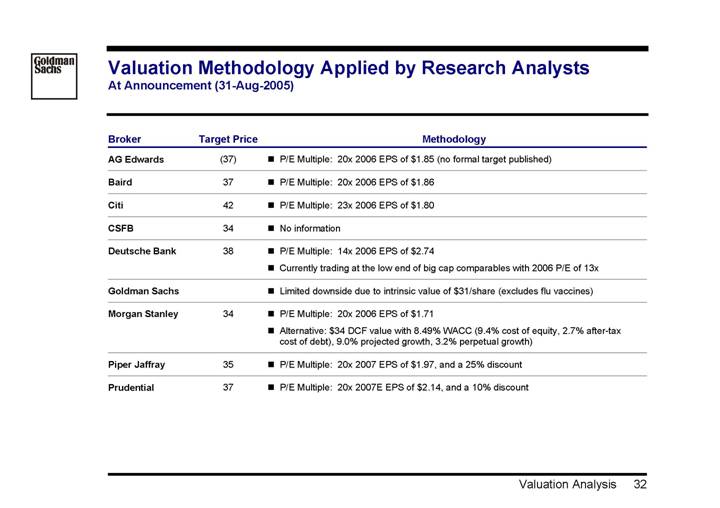
Valuation Methodology Applied by Research Analysts
At Announcement (31-Aug-2005)
Broker |
| Target Price |
| Methodology |
AG Edwards |
| (37 | ) | • P/E Multiple: 20x 2006 EPS of $1.85 (no formal target published) |
|
|
|
|
|
Baird |
| 37 |
| • P/E Multiple: 20x 2006 EPS of $1.86 |
|
|
|
|
|
Citi |
| 42 |
| • P/E Multiple: 23x 2006 EPS of $1.80 |
|
|
|
|
|
CSFB |
| 34 |
| • No information |
|
|
|
|
|
Deutsche Bank |
| 38 |
| • P/E Multiple: 14x 2006 EPS of $2.74 |
|
|
|
| • Currently trading at the low end of big cap comparables with 2006 P/E of 13x |
|
|
|
|
|
Goldman Sachs |
|
|
| • Limited downside due to intrinsic value of $31/share (excludes flu vaccines) |
|
|
|
|
|
Morgan Stanley |
| 34 |
| • P/E Multiple: 20x 2006 EPS of $1.71 |
|
|
|
| • Alternative: $34 DCF value with 8.49% WACC (9.4% cost of equity, 2.7% after-tax cost of debt), 9.0% projected growth, 3.2% perpetual growth) |
|
|
|
|
|
Piper Jaffray |
| 35 |
| • P/E Multiple: 20x 2007 EPS of $1.97, and a 25% discount |
|
|
|
|
|
Prudential |
| 37 |
| • P/E Multiple: 20x 2007E EPS of $2.14, and a 10% discount |
32
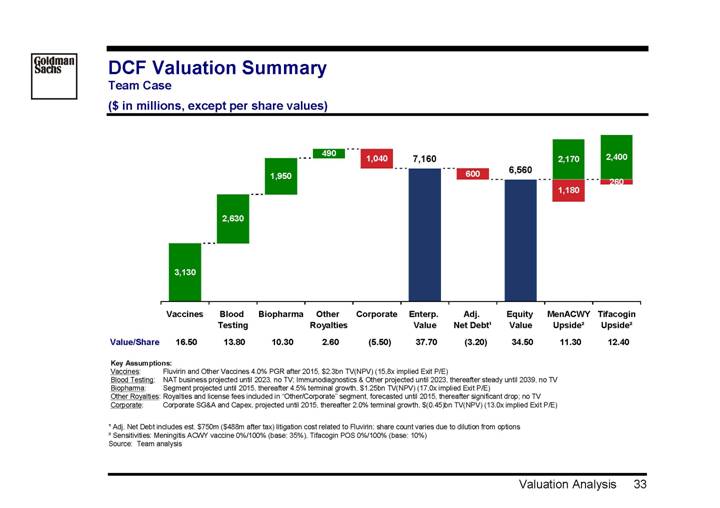
DCF Valuation Summary
Team Case
($ in millions, except per share values)
[CHART]
|
|
|
| Blood |
|
|
| Other |
|
|
| Enterp. |
| Adj. |
| Equity |
| MenACWY |
| Tifacogin |
|
|
| Vaccines |
| Testing |
| Biopharma |
| Royalties |
| Corporate |
| Value |
| Net Debt(1) |
| Value |
| Upside(2) |
| Upside(2) |
|
Value/Share |
| 16.50 |
| 13.80 |
| 10.30 |
| 2.60 |
| (5.50 | ) | 37.70 |
| (3.20 | ) | 34.50 |
| 11.30 |
| 12.40 |
|
Key Assumptions: | ||
Vaccines: |
| Fluvirin and Other Vaccines 4.0% PGR after 2015, $2.3bn TV(NPV) (15,8x implied Exit P/E) |
Blood Testing: |
| NAT business projected until 2023, no TV; Immunodiagnostics & Other projected until 2023, thereafter steady until 2039, no TV |
Biopharma: |
| Segment projected until 2015, thereafter 4.5% terminal growth, $1.25bn TV(NPV) (17,0x implied Exit P/E) |
Other Royalties: |
| Royalties and license fees included in “Other/Corporate” segment, forecasted until 2015, thereafter significant drop; no TV |
Corporate: |
| Corporate SG&A and Capex, projected until 2015, thereafter 2.0% terminal growth, $(0.45)bn TV(NPV) (13.0x implied Exit P/E) |
(1) Adj. Net Debt includes est. $750m ($488m after tax) litigation cost related to Fluvirin; share count varies due to dilution from options
(2) Sensitivities: Meningitis ACWY vaccine 0%/100% (base: 35%), Tifacogin POS 0%/100% (base: 10%)
Source: Team analysis
33
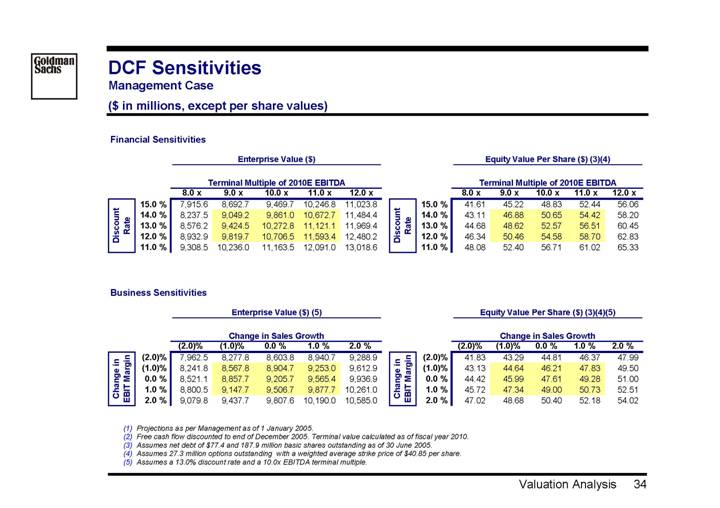
DCF Sensitivities
Management Case
($ in millions, except per share values)
Financial Sensitivities
|
| Enterprise Value ($) |
| ||||||||
|
| Terminal Multiple of 2010E EBITDA |
| ||||||||
|
| 8.0 x |
| 9.0 x |
| 10.0 x |
| 11.0 x |
| 12.0 x |
|
Discount Rate |
|
|
|
|
|
|
|
|
|
|
|
15.0 | % | 7,915.6 |
| 8,692.7 |
| 9,469.7 |
| 10,246.8 |
| 11,023.8 |
|
14.0 | % | 8,237.5 |
| 9,049.2 |
| 9,861.0 |
| 10,672.7 |
| 11,484.4 |
|
13.0 | % | 8,576.2 |
| 9,424.5 |
| 10,272.8 |
| 11,121.1 |
| 11,969.4 |
|
12.0 | % | 8,932.9 |
| 9,819.7 |
| 10,706.5 |
| 11,593.4 |
| 12,480.2 |
|
11.0 | % | 9,308.5 |
| 10,236.0 |
| 11,163.5 |
| 12,091.0 |
| 13,018.6 |
|
|
| Equity Value Per Share ($) (3)(4) |
| ||||||||
|
| Terminal Multiple of 2010E EBITDA |
| ||||||||
|
| 8.0 x |
| 9.0 x |
| 10.0 x |
| 11.0 x |
| 12.0 x |
|
Discount Rate |
|
|
|
|
|
|
|
|
|
|
|
15.0 | % | 41.61 |
| 45.22 |
| 48.83 |
| 52.44 |
| 56.06 |
|
14.0 | % | 43.11 |
| 46.88 |
| 50.65 |
| 54.42 |
| 58.20 |
|
13.0 | % | 44.68 |
| 48.62 |
| 52.57 |
| 56.51 |
| 60.45 |
|
12.0 | % | 46.34 |
| 50.46 |
| 54.58 |
| 58.70 |
| 62.83 |
|
11.0 | % | 48.08 |
| 52.40 |
| 56.71 |
| 61.02 |
| 65.33 |
|
Business Sensitivities
|
| Enterprise Value ($) (5) |
| ||||||||
|
| Change in Sales Growth |
| ||||||||
|
| (2.0)% |
| (1.0)% |
| 0.0% |
| 1.0% |
| 2.0% |
|
Change in |
|
|
|
|
|
|
|
|
|
|
|
(2.0 | )% | 7,962.5 |
| 8,277.8 |
| 8,603.8 |
| 8,940.7 |
| 9,288.9 |
|
(1.0 | )% | 8,241.8 |
| 8,567.8 |
| 8,904.7 |
| 9,253.0 |
| 9,612.9 |
|
0.0 | % | 8,521.1 |
| 8,857.7 |
| 9,205.7 |
| 9,565.4 |
| 9,936.9 |
|
1.0 | % | 8,800.5 |
| 9,147.7 |
| 9,506.7 |
| 9,877.7 |
| 10,261.0 |
|
2.0 | % | 9,079.8 |
| 9,437.7 |
| 9,807.6 |
| 10,190.0 |
| 10,585.0 |
|
|
| Equity Value Per Share ($) (3)(4)(5) |
| ||||||||
|
| Change in Sales Growth |
| ||||||||
|
| (2.0)% |
| (1.0)% |
| 0.0% |
| 1.0% |
| 2.0% |
|
Change in |
|
|
|
|
|
|
|
|
|
|
|
(2.0 | )% | 41.83 |
| 43.29 |
| 44.81 |
| 46.37 |
| 47.99 |
|
(1.0 | )% | 43.13 |
| 44.64 |
| 46.21 |
| 47.83 |
| 49.50 |
|
0.0 | % | 44.42 |
| 45.99 |
| 47.61 |
| 49.28 |
| 51.00 |
|
1.0 | % | 45.72 |
| 47.34 |
| 49.00 |
| 50.73 |
| 52.51 |
|
2.0 | % | 47.02 |
| 48.68 |
| 50.40 |
| 52.18 |
| 54.02 |
|
(1) Projections as per Management as of 1 January 2005.
(2) Free cash flow discounted to end of December 2005. Terminal value calculated as of fiscal year 2010.
(3) Assumes net debt of $77.4 and 187.9 million basic shares outstanding as of 30 June 2005.
(4) Assumes 27.3 million options outstanding with a weighted average strike price of $40.85 per share.
(5) Assumes a 13.0% discount rate and a 10.0x EBITDA terminal multiple.
34
Summary Break-Up Valuation Consideration
|
|
|
| Value |
| Value / |
|
|
|
Business |
| Metric |
| ($mm) |
| Share ($)(1) |
| Comments |
|
NAT |
| 25.0-26.5x |
| 2.3 – 2.4 |
| 11.90 – 12.60 |
| • GenProbe P/E (29.4x 2006E); IBES 5yr Growth: 23% (Team: 22%) • Applying a 10-15% discount due to lack of franchise value |
|
ImmunoDx JV |
| DCF |
| 1.0 – 1.1 |
| 5.50 – 6.00 |
| • Valued on DCF basis (cash flow until 2023, effectively a royalty) |
|
Total Blood Testing |
|
|
| 3.3 – 3.6 |
| 17.40 – 18.60 |
|
|
|
|
|
|
|
|
|
|
|
|
|
Total Vaccines |
| GSK/IDBE |
| 1.9 – 2.3 |
| 10.00 – 12.00 |
| • Valued based on transaction EBITDA multiples (13.8x 07E / 9.3x 08E) |
|
|
|
|
|
|
|
|
|
|
|
BioPharma |
| 15-16x |
| 2.0 – 2.1 |
| 10.30 – 11.00 |
| • Apply BigPharma P/E multiple to “normalized profit” (15% R&D) |
|
|
|
|
|
|
|
|
|
|
|
Royalties & Other |
| DCF |
| 1.0 – 1.0 |
| 5.10 – 5.30 |
| • Blood Testing $1.80, Vaccines $0.40, BioPharma $0.70, Other $2.30 |
|
|
|
|
|
|
|
|
|
|
|
Corporate |
| 15-16x 2006E NI |
| (1.1) – (1.1) |
| (5.50) – (5.90) |
| • Apply BigPharma P/E multiple |
|
|
|
|
|
|
|
|
|
|
|
Total Enterprise Value |
|
|
| 7.1 – 7.9 |
| 37.30 – 41.00 |
|
|
|
|
|
|
|
|
|
|
|
|
|
Net Debt |
|
|
| (0.1) |
| (0.60) |
| • Includes value adjustments (unearned revenues) |
|
|
|
|
|
|
|
|
|
|
|
Litigation Liability |
|
|
| (0.5) |
| (2.50) |
| • Assuming $750m NPV of litigation liabilities |
|
|
|
|
|
|
|
|
|
|
|
Total Equity Value |
|
|
| 6.5 – 7.3 |
| 34.20 – 37.90 |
|
|
|
(1) Assuming 191.5m diluted shares.
35
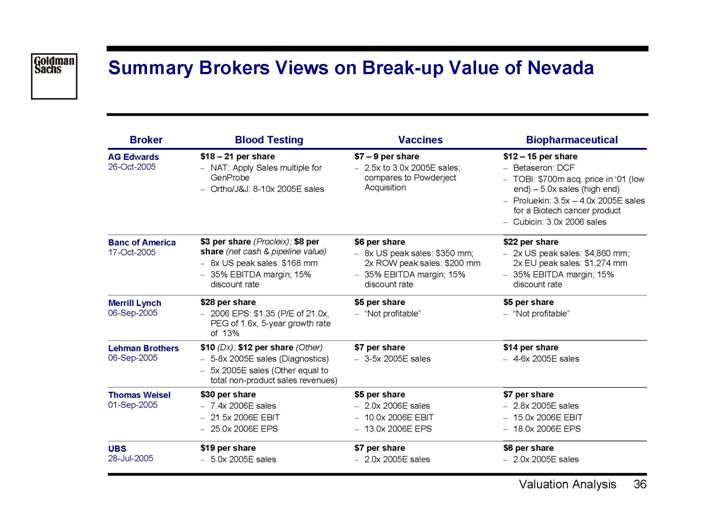
Summary Brokers Views on Break-up Value of Nevada
Broker |
| Blood Testing |
| Vaccines |
| Biopharmaceutical |
AG Edwards |
| $18 – 21 per share |
| $7 – 9 per share |
| $12 – 15 per share |
26-Oct-2005 |
| • NAT: Apply Sales multiple for GenProbe • Ortho/J&J: 8-10x 2005E sales |
| • 2.5x to 3.0x 2005E sales; compares to Powderject Acquisition |
| • Betaseron: DCF • TOBI: $700m acq. price in ‘01 (low end) – 5.0x sales (high end) • Proluekin: 3.5x – 4.0x 2005Esales for a Biotech cancer product • Cubicin: 3.0x 2006 sales |
|
|
|
|
|
|
|
Banc of America |
| $3 per share (Procleix); $8 per |
| $6 per share |
| $22 per share |
17-Oct-2005 |
| share (net cash & pipeline value) • 8x US peak sales: $168 mm • 35% EBITDA margin; 15% discount rate |
| • 8x US peak sales: $350 mm; 2x ROW peak sales: $200 mm • 35% EBITDA margin; 15% discount rate |
| • 2x US peak sales: $4,860 mm; 2x EU peak sales: $1,274 mm • 35% EBITDA margin; 15% discount rate |
|
|
|
|
|
|
|
Merrill Lynch |
| $28 per share |
| $5 per share |
| $5 per share |
06-Sep-2005 |
| • 2006 EPS: $1.35 (P/E of 21.0x, PEG of 1.6x, 5-year growth rate of 13% |
| • “Not profitable” |
| • “Not profitable” |
|
|
|
|
|
|
|
|
|
|
|
|
|
|
Lehman Brothers |
| $10 (Dx); $12 per share (Other) |
| $7 per share |
| $14 per share |
06-Sep-2005 |
| • 5-8x 2005E sales (Diagnostics) |
| • 3-5x 2005E sales |
| • 4-6x 2005E sales |
|
| • 5x 2005E sales (Other equal to total non-product sales revenues) |
|
|
|
|
|
|
|
|
|
|
|
Thomas Weisel |
| $30 per share |
| $5 per share |
| $7 per share |
01-Sep-2005 |
| • 7.4x 2006E sales |
| • 2.0x 2006E sales |
| • 2.8x 2005E sales |
|
| • 21.5x 2006E EBIT |
| • 10.0x 2006E EBIT |
| • 15.0x 2006E EBIT |
|
| • 25.0x 2006E EPS |
| • 13.0x 2006E EPS |
| • 18.0x 2006E EPS |
|
|
|
|
|
|
|
UBS |
| $19 per share |
| $7 per share |
| $6 per share |
28-Jul-2005 |
| • 5.0x 2005E sales |
| • 2.0x 2005E sales |
| • 2.0x 2005E sales |
36
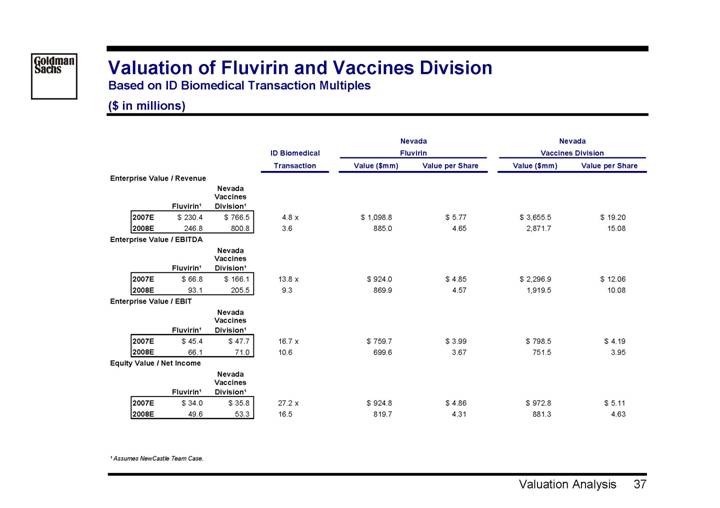
Valuation of Fluvirin and Vaccines Division
Based on ID Biomedical Transaction Multiples
($ in millions)
|
|
|
|
|
|
|
| Nevada |
| Nevada |
| ||||||||||
|
|
|
|
|
| ID Biomedical |
| Fluvirin |
| Vaccines Division |
| ||||||||||
|
|
|
|
|
| Transaction |
| Value ($mm) |
| Value per Share |
| Value ($mm) |
| Value per Share |
| ||||||
Enterprise Value / Revenue |
|
|
|
|
|
|
|
|
|
|
| ||||||||||
|
|
|
| Nevada |
|
|
|
|
|
|
|
|
|
|
| ||||||
|
|
|
| Vaccines |
|
|
|
|
|
|
|
|
|
|
| ||||||
|
| Fluvirin(1) |
| Division(1) |
|
|
|
|
|
|
|
|
|
|
| ||||||
2007E |
| $ | 230.4 |
| $ | 766.5 |
| 4.8 | x | $ | 1,098.8 |
| $ | 5.77 |
| $ | 3,655.5 |
| $ | 19.20 |
|
2008E |
| 246.8 |
| 800.8 |
| 3.6 |
| 885.0 |
| 4.65 |
| 2,871.7 |
| 15.08 |
| ||||||
|
|
|
|
|
|
|
|
|
|
|
|
|
|
|
| ||||||
Enterprise Value / EBITDA |
|
|
|
|
|
|
|
|
|
|
| ||||||||||
|
|
|
| Nevada |
|
|
|
|
|
|
|
|
|
|
| ||||||
|
|
|
| Vaccines |
|
|
|
|
|
|
|
|
|
|
| ||||||
|
| Fluvirin(1) |
| Division(1) |
|
|
|
|
|
|
|
|
|
|
| ||||||
2007E |
| $ | 66.8 |
| $ | 166.1 |
| 13.8 | x | $ | 924.0 |
| $ | 4.85 |
| $ | 2,296.9 |
| $ | 12.06 |
|
2008E |
| 93.1 |
| 205.5 |
| 9.3 |
| 869.9 |
| 4.57 |
| 1,919.5 |
| 10.08 |
| ||||||
|
|
|
|
|
|
|
|
|
|
|
|
|
|
|
| ||||||
Enterprise Value / EBIT |
|
|
|
|
|
|
|
|
|
|
| ||||||||||
|
|
|
| Nevada |
|
|
|
|
|
|
|
|
|
|
| ||||||
|
|
|
| Vaccines |
|
|
|
|
|
|
|
|
|
|
| ||||||
|
| Fluvirin(1) |
| Division(1) |
|
|
|
|
|
|
|
|
|
|
| ||||||
2007E |
| $ | 45.4 |
| $ | 47.7 |
| 16.7 | x | $ | 759.7 |
| $ | 3.99 |
| $ | 798.5 |
| $ | 4.19 |
|
2008E |
| 66.1 |
| 71.0 |
| 10.6 |
| 699.6 |
| 3.67 |
| 751.5 |
| 3.95 |
| ||||||
|
|
|
|
|
|
|
|
|
|
|
|
|
|
|
| ||||||
Equity Value / Net Income |
|
|
|
|
|
|
|
|
|
|
| ||||||||||
|
|
|
| Nevada |
|
|
|
|
|
|
|
|
|
|
| ||||||
|
|
|
| Vaccines |
|
|
|
|
|
|
|
|
|
|
| ||||||
|
| Fluvirin(1) |
| Division(1) |
|
|
|
|
|
|
|
|
|
|
| ||||||
2007E |
| $ | 34.0 |
| $ | 35.8 |
| 27.2 | x | $ | 924.8 |
| $ | 4.86 |
| $ | 972.8 |
| $ | 5.11 |
|
2008E |
| 49.6 |
| 53.3 |
| 16.5 |
| 819.7 |
| 4.31 |
| 881.3 |
| 4.63 |
| ||||||
(1) Assumes NewCastle Team Case.
37
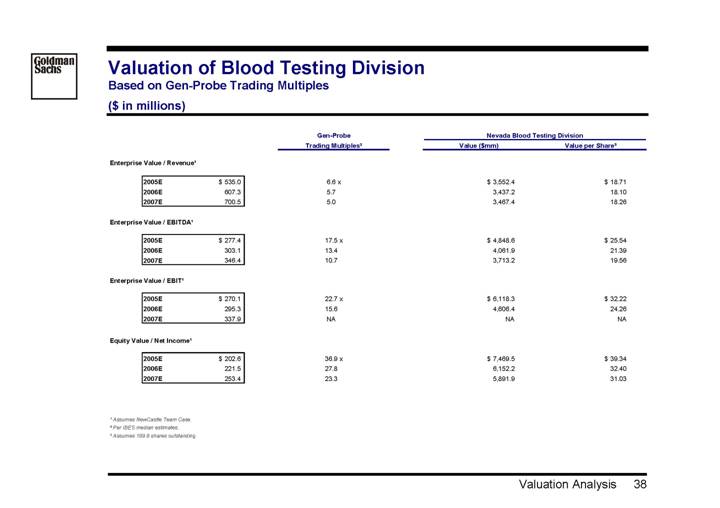
Valuation of Blood Testing Division
Based on Gen-Probe Trading Multiples
($ in millions)
|
| Gen-Probe |
| Nevada Blood Testing Division |
| |||||||
|
| Trading Multiples(2) |
| Value ($mm) |
| Value per Share(3) |
| |||||
|
|
|
|
|
|
|
| |||||
Enterprise Value / Revenue(1) |
|
|
|
|
|
|
| |||||
|
|
|
|
|
|
|
| |||||
2005E |
| $ | 535.0 |
| 6.6 | x | $ | 3,552.4 |
| $ | 18.71 |
|
2006E |
| 607.3 |
| 5.7 |
| 3,437.2 |
| 18.10 |
| |||
2007E |
| 700.5 |
| 5.0 |
| 3,467.4 |
| 18.26 |
| |||
|
|
|
|
|
|
|
| |||||
Enterprise Value / EBITDA(1) |
|
|
|
|
|
|
| |||||
|
|
|
|
|
|
|
| |||||
2005E |
| $ | 277.4 |
| 17.5 | x | $ | 4,848.6 |
| $ | 25.54 |
|
2006E |
| 303.1 |
| 13.4 |
| 4,061.9 |
| 21.39 |
| |||
2007E |
| 346.4 |
| 10.7 |
| 3,713.2 |
| 19.56 |
| |||
|
|
|
|
|
|
|
| |||||
Enterprise Value / EBIT(1) |
|
|
|
|
|
|
| |||||
|
|
|
|
|
|
|
| |||||
2005E |
| $ | 270.1 |
| 22.7 | x | $ | 6,118.3 |
| $ | 32.22 |
|
2006E |
| 295.3 |
| 15.6 |
| 4,606.4 |
| 24.26 |
| |||
2007E |
| 337.9 |
| NA |
| NA |
| NA |
| |||
|
|
|
|
|
|
|
| |||||
Equity Value / Net Income(1) |
|
|
|
|
|
|
| |||||
|
|
|
|
|
|
|
| |||||
2005E |
| $ | 202.6 |
| 36.9 | x | $ | 7,469.5 |
| $ | 39.34 |
|
2006E |
| 221.5 |
| 27.8 |
| 6,152.2 |
| 32.40 |
| |||
2007E |
| 253.4 |
| 23.3 |
| 5,891.9 |
| 31.03 |
| |||
(1) Assumes NewCastle Team Case.
(2) Per IBES median estimates.
(3) Assumes 189.9 shares outstanding.
38
Grey Page
39
Pro-Forma Impact Analysis
|
| $40 Offer Price |
| $45 Offer Price |
| ||||||||||||
NewCastle Group Accretion / (Dilution) |
| 2005E |
| 2006E |
| 2007E |
| 2008E |
| 2005E |
| 2006E |
| 2007E |
| 2008E |
|
|
|
|
|
|
|
|
|
|
|
|
|
|
|
|
|
|
|
NewCastle Pre-Transaction Net Income |
| 5,886 |
| 6,887 |
| 7,636 |
| 8,688 |
| 5,886 |
| 6,887 |
| 7,636 |
| 8,688 |
|
Consolidation effect of existing 42% |
|
|
| -120 |
| -120 |
| -120 |
|
|
| -120 |
| -120 |
| -120 |
|
NewCastle Revised Pre-Transaction Net Income |
| 5,886 |
| 6,766 |
| 7,515 |
| 8,568 |
| 5,886 |
| 6,766 |
| 7,515 |
| 8,568 |
|
NewCastle Revised Pre-Transaction EPS |
| 2.45 |
| 2.82 |
| 3.13 |
| 3.57 |
| 2.45 |
| 2.82 |
| 3.13 |
| 3.57 |
|
|
|
|
|
|
|
|
|
|
|
|
|
|
|
|
|
|
|
Target EBIT After-Tax (100%) |
| 41 |
| 273 |
| 361 |
| 444 |
| 41 |
| 273 |
| 361 |
| 444 |
|
Income from Associates lost |
| -18 |
| -116 |
| -153 |
| -188 |
| -18 |
| -116 |
| -153 |
| -188 |
|
After-Tax Synergies |
|
|
| 60 |
| 105 |
| 165 |
| 0 |
| 60 |
| 105 |
| 165 |
|
After-Tax Interest Expense on Debt |
| -19 |
| -75 |
| -75 |
| -75 |
| -21 |
| -85 |
| -85 |
| -85 |
|
Impact on Cash Earnings (pre-restruct. cost) |
| 5 |
| 142 |
| 238 |
| 346 |
| 3 |
| 133 |
| 229 |
| 337 |
|
Pro Forma EPS |
| 2.40 |
| 2.82 |
| 3.16 |
| 3.64 |
| 2.40 |
| 2.81 |
| 3.15 |
| 3.62 |
|
Accretion / (Dilution) to Cash Earnings |
| -2.0 | % | 0.0 | % | 1.0 | % | 1.9 | % | -2.3 | % | -0.4 | % | 0.6 | % | 1.5 | % |
|
|
|
|
|
|
|
|
|
|
|
|
|
|
|
|
|
|
Increm. Amortization (after tax) |
| -71 |
| -164 |
| -164 |
| -164 |
| -71 |
| -164 |
| -164 |
| -164 |
|
Incremental Impact to IFRS Earnings (pre-restr.) |
| -66 |
| -22 |
| 74 |
| 182 |
| -68 |
| -31 |
| 65 |
| 173 |
|
Pro Forma EPS |
| 2.37 |
| 2.75 |
| 3.10 |
| 3.57 |
| 2.37 |
| 2.74 |
| 3.08 |
| 3.56 |
|
Accretion / (Dilution) to IFRS Earnings |
| -3.2 | % | -2.4 | % | -1.1 | % | 0.0 | % | -3.5 | % | -2.8 | % | -1.5 | % | -0.4 | % |
|
|
|
|
|
|
|
|
|
|
|
|
|
|
|
|
|
|
Post Restructuring Cost |
|
|
|
|
|
|
|
|
|
|
|
|
|
|
|
|
|
Accretion / (Dilution) to Cash Earnings |
| -2.0 | % | -1.1 | % | 0.5 | % | 1.9 | % | -2.3 | % | -1.5 | % | 0.1 | % | 1.5 | % |
Accretion / (Dilution) to IFRS Earnings |
| -3.2 | % | -3.5 | % | -1.6 | % | 0.0 | % | -3.5 | % | -3.9 | % | -2.0 | % | -0.4 | % |
Assumes Newcastle would fully consolidate Nevada regardless of transaction from Jan-2006, therefore only 58% of amortization included;
$5.25bn of the excess purchase price are allocated to identifiable intangible assets, amortized over 12 years;
$221m cost synergies, phased in 36%/64%/100% from 2006-08 and taxed with 25% effective rate;
Interest expense (5% pre-/3% post-tax) and amortization taxed at 35% statutory rate. Closing assumed on 30-Sep-2005;
Source: IBES consensus estimates for NewCastle Net Income, Newcastle Team Case for Nevada financials
40
Pro-Forma Impact Analysis
Before Transaction Related Charges
Offer Value per Share ($) |
| 36.44 |
| 40.00 |
| 41.00 |
| 42.00 |
| 43.00 |
| 44.00 |
| 45.00 |
| 46.00 |
| 47.00 |
|
|
|
|
|
|
|
|
|
|
|
|
|
|
|
|
|
|
|
|
|
Premium to Current |
| 0 | % | 10 | % | 13 | % | 15 | % | 18 | % | 21 | % | 23 | % | 26 | % | 29 | % |
Premium to 3M Avg. |
| 1 | % | 11 | % | 14 | % | 16 | % | 19 | % | 22 | % | 25 | % | 27 | % | 30 | % |
|
|
|
|
|
|
|
|
|
|
|
|
|
|
|
|
|
|
|
|
Enterprise Value ($ m) |
| 7,515 |
| 8,229 |
| 8,431 |
| 8,634 |
| 8,839 |
| 9,047 |
| 9,255 |
| 9,464 |
| 9,674 |
|
Equity Value ($ m) |
| 6,919 |
| 7,633 |
| 7,836 |
| 8,038 |
| 8,243 |
| 8,451 |
| 8,660 |
| 8,869 |
| 9,079 |
|
|
|
|
|
|
|
|
|
|
|
|
|
|
|
|
|
|
|
|
|
Tender Value ($m) |
| 4,029 |
| 4,461 |
| 4,584 |
| 4,707 |
| 4,833 |
| 4,961 |
| 5,090 |
| 5,220 |
| 5,351 |
|
|
| Cash EPS Accretion/Dilution (Pre Restr.) |
| ||||||||||||||||
0% Equity Contribution |
|
|
| ||||||||||||||||
2006E |
| — |
| 1.0 | % | 0.9 | % | 0.9 | % | 0.8 | % | 0.8 | % | 0.7 | % | 0.7 | % | 0.6 | % |
2007E |
| — |
| 2.2 | % | 2.1 | % | 2.1 | % | 2.0 | % | 2.0 | % | 1.9 | % | 1.9 | % | 1.8 | % |
2008E |
| — |
| 3.2 | % | 3.1 | % | 3.1 | % | 3.0 | % | 3.0 | % | 2.9 | % | 2.9 | % | 2.9 | % |
|
|
|
|
|
|
|
|
|
|
|
|
|
|
|
|
|
|
|
|
50% Equity Contribution |
|
|
|
|
|
|
|
|
|
|
|
|
|
|
|
|
|
|
|
2006E |
| — |
| (0.0 | )% | (0.1 | )% | (0.2 | )% | (0.3 | )% | (0.3 | )% | (0.4 | )% | (0.5 | )% | (0.6 | )% |
2007E |
| — |
| 1.0 | % | 0.9 | % | 0.9 | % | 0.8 | % | 0.7 | % | 0.6 | % | 0.5 | % | 0.5 | % |
2008E |
| — |
| 1.9 | % | 1.8 | % | 1.7 | % | 1.6 | % | 1.6 | % | 1.5 | % | 1.4 | % | 1.3 | % |
|
|
|
|
|
|
|
|
|
|
|
|
|
|
|
|
|
|
|
|
100% Equity Contribution |
|
|
|
|
|
|
|
|
|
|
|
|
|
|
|
|
|
|
|
2006E |
| — |
| (1.0 | )% | (1.1 | )% | (1.2 | )% | (1.3 | )% | (1.4 | )% | (1.5 | )% | (1.6 | )% | (1.7 | )% |
2007E |
| — |
| (0.1 | )% | (0.2 | )% | (0.3 | )% | (0.4 | )% | (0.5 | )% | (0.6 | )% | (0.7 | )% | (0.8 | )% |
2008E |
| — |
| 0.6 | % | 0.5 | % | 0.4 | % | 0.3 | % | 0.2 | % | 0.1 | % | 0.0 | % | (0.1 | )% |
Notes:
• Assumes Newcastle would fully consolidate Nevada regardless of transaction from Jan-2006, therefore only 58% of amortization included;
• $5.25bn of the excess purchase price are allocated to identifiable intangible assets, amortized over 12 years;
• $221m cost synergies, phased in 36%/64%/100% from 2006-08 and taxed with 25% effective rate;
• Interest expense (5% pre-/3% post-tax) and amortization taxed at 35% statutory rate. Closing assumed on 30-Sep-2005;
Source: IBES consensus estimates for Newcastle Net Income, Newcastle Team Case for Nevada financials
41
Pro-Forma Impact Analysis
Post Purchase Accounting Adjustments / Pre Restructuring Charges
Offer Value per Share ($) |
| 36.44 |
| 40.00 |
| 41.00 |
| 42.00 |
| 43.00 |
| 44.00 |
| 45.00 |
| 46.00 |
| 47.00 |
|
|
|
|
|
|
|
|
|
|
|
|
|
|
|
|
|
|
|
|
|
Premium to Current |
| 0 | % | 10 | % | 13 | % | 15 | % | 18 | % | 21 | % | 23 | % | 26 | % | 29 | % |
Premium to 3M Avg. |
| 1 | % | 11 | % | 14 | % | 16 | % | 19 | % | 22 | % | 25 | % | 27 | % | 30 | % |
Enterprise Value ($m) |
| 7,515 |
| 8,229 |
| 8,431 |
| 8,634 |
| 8,839 |
| 9,047 |
| 9,255 |
| 9,464 |
| 9,674 |
|
Equity Value ($m) |
| 6,919 |
| 7,633 |
| 7,836 |
| 8,038 |
| 8,243 |
| 8,451 |
| 8,660 |
| 8,869 |
| 9,079 |
|
Tender Value ($m) |
| 4,029 |
| 4,461 |
| 4,584 |
| 4,707 |
| 4,833 |
| 4,961 |
| 5,090 |
| 5,220 |
| 5,351 |
|
|
| Book EPS Accretion/Dilution (Pre Restr.) |
| ||||||||||||||||
0% Equity Contribution |
|
|
| ||||||||||||||||
2006E |
| — |
| (1.4 | )% | (1.5 | )% | (1.5 | )% | (1.6 | )% | (1.7 | )% | (1.7 | )% | (1.8 | )% | (1.8 | )% |
2007E |
| — |
| (0.0 | )% | (0.1 | )% | (0.1 | )% | (0.2 | )% | (0.2 | )% | (0.3 | )% | (0.3 | )% | (0.4 | )% |
2008E |
| — |
| 1.2 | % | 1.2 | % | 1.2 | % | 1.1 | % | 1.1 | % | 1.0 | % | 1.0 | % | 0.9 | % |
|
|
|
|
|
|
|
|
|
|
|
|
|
|
|
|
|
|
|
|
50% Equity Contribution |
|
|
|
|
|
|
|
|
|
|
|
|
|
|
|
|
|
|
|
2006E |
| — |
| (2.4 | )% | (2.5 | )% | (2.6 | )% | (2.6 | )% | (2.7 | )% | (2.8 | )% | (2.9 | )% | (3.0 | )% |
2007E |
| — |
| (1.1 | )% | (1.2 | )% | (1.3 | )% | (1.4 | )% | (1.4 | )% | (1.5 | )% | (1.6 | )% | (1.7 | )% |
2008E |
| — |
| (0.0 | )% | (0.1 | )% | (0.2 | )% | (0.2 | )% | (0.3 | )% | (0.4 | )% | (0.5 | )% | (0.5 | )% |
|
|
|
|
|
|
|
|
|
|
|
|
|
|
|
|
|
|
|
|
100% Equity Contribution |
|
|
|
|
|
|
|
|
|
|
|
|
|
|
|
|
|
|
|
2006E |
| — |
| (3.3 | )% | (3.4 | )% | (3.5 | )% | (3.6 | )% | (3.7 | )% | (3.8 | )% | (3.9 | )% | (4.0 | )% |
2007E |
| — |
| (2.2 | )% | (2.3 | )% | (2.4 | )% | (2.5 | )% | (2.6 | )% | (2.7 | )% | (2.8 | )% | (2.9 | )% |
2008E |
| — |
| (1.2 | )% | (1.3 | )% | (1.4 | )% | (1.5 | )% | (1.6 | )% | (1.7 | )% | (1.8 | )% | (1.9 | )% |
Notes:
• Assumes Newcastle would fully consolidate Nevada regardless of transaction from Jan-2006, therefore only 58% of amortization included;
• $5.25bn of the excess purchase price are allocated to identifiable intangible assets, amortized over 12 years;
• $221m cost synergies, phased in 36%/64%/100% from 2006-08 and taxed with 25% effective rate;
• Interest expense (5% pre-/3% post-tax) and amortization taxed at 35% statutory rate. Closing assumed on 30-Sep-2005;
Source: IBES consensus estimates for Newcastle Net Income, Newcastle Team Case for Nevada financials
42
V. Tactical Considerations
43
Overview of Tactical Considerations
Negotiating Framework | • | Approach to valuation | |
|
| • | Fundamental value (DCF vs. Sum-of-the-parts) |
|
| • | Shareholder perspective (Institutions vs. Arbs) |
| • | Validity of projections | |
|
| • | Management plan (Base case; Sensitivities) |
|
| • | Team case |
| • | Nevada update | |
|
| • | Key diligence questions |
|
| • | Updated financial projections |
|
| • | Lack of 2005 guidance |
|
|
|
|
Tactical Approach | • | Negotiating roles | |
|
| • | Principals |
|
| • | Bankers |
| • | Valuation presentation | |
|
| • | Official bid/ask |
|
| • | Bankers discussed range |
| • | Sequencing | |
|
| • | Due diligence update |
|
| • | Valuation approach |
|
| • | Merger agreement negotiation |
|
| • | Price negotiations |
|
|
|
|
Timing | • | Board meeting(s) | |
| • | Disclosure requirements | |
| • | NewCastle preferred announcement date | |
| • | Pace of negotiations | |
44
Brokers’ Views on Take-out of Nevada
Post 3rd Quarter Earnings Announcement (25-Oct-2005)
|
| Pre-Announcement |
| Expected |
|
|
|
| ||||||
Broker |
| Rec. |
| Target |
| Deal Price |
| Comments |
| |||||
Lehman Bros. 27-Oct-2005 |
| Hold |
| $ | 45 |
|
| $ | 45 |
| • | The important issue short term is whether NewCastle will increase the $40 per share bid for the Nevada shares that it does not currently own. At the time of the initial bid, it was not certain – but was expected - that Nevada would actually be selling flu vaccine this season… we still believe that NewCastle is likely to increase its bid to about $45, an outcome already priced into CHIR shares at current levels |
| |
|
|
|
|
|
|
|
|
|
|
| ||||
Bernstein 26-Oct-2005 |
| Hold |
| $ | 48 |
| $45-$50 |
| • | We believe this target price can be supported regardless of NewCastle’ actions, but continue to expect a further bid by NewCastle at a materially higher price than their initial $40 offer. Given Nevada’s improving prospects that bid may now need to be substantially higher… Nevada’s stock price is currently driven largely by the prospects for a materially higher bid by NewCastle. We believe such a bid is likely, and anticipate that it will be in the range of $45 to $50 |
| |||
|
|
|
|
|
|
|
|
|
|
| ||||
UBS 26-Oct-2005 |
| Under- perform |
| $ | 40 |
| — |
| • | The possible takeover by NewCastle has taken longer to resolve than we expected and has buoyed the stock in the face of, in our opinion, deteriorating fundamentals |
| |||
|
|
|
|
|
|
|
|
|
|
| ||||
SG Cowen 26-Oct-2005 |
| — |
| — |
| — |
| • | Although the likelihood of a NewCastle acquisition may begin to wane over time, we believe NewCastle’s $40 per share offer sets a support level for Nevada shares… Although Nevada has rebuffed the offer as inadequate, we believe renegotiation discussions with NewCastle may be ongoing |
| ||||
|
|
|
|
|
|
|
|
|
|
| ||||
AG Edwards 26-Oct-2005 |
| Hold |
| — |
| “$46 is a fair ceiling” |
| • | We see relatively weak performance by Nevada, as demonstrated in this quarter as strengthening the hand of NewCastle in these negotiations… while $40 is a sensible price for a passive interest in the company, we believe a 15-20% premium is reasonable for a controlling interest and feel $46 is a fair ceiling |
| ||||
|
|
|
|
|
|
|
|
|
|
| ||||
Thomas Weisel 25-Oct-2005 |
| Hold |
| — |
| $43-$45 |
| • | We believe the main focus of investors remains the potential for NewCastle to increase its original buy-out offer for Nevada. We continue to believe that a bid in the $43-45 range (3.8- 3.9x 2006E revenue) is necessary for a merger to be approved |
| ||||
45
Brokers’ Views on Take-out of Nevada
Post Revision of Fluvirin Guidance (17-Oct-2005)
|
| Pre-Announcement |
| Expected |
|
|
|
| ||||
Broker |
| Rec. |
| Target |
| Deal Price |
| Comments |
| |||
Bernstein 18-Oct-2005 |
| Hold |
| $ | 48 |
| $48-$50 |
| • | We continue to anticipate that NewCastle will seek to complete its acquisition of Nevada, but also expect that to occur at a materially higher price than the company’s recent $40 offer. Given other deal activity in the sector we now believe a final price as high as $48 to $50 is likely Our new target price reflects the full value we believe exists for an acquirer in Nevada’s three businesses, with expected cost savings in SG&A and R&D of $50-75mm per year each |
| |
| ||||||||||||
| ||||||||||||
| ||||||||||||
| ||||||||||||
| ||||||||||||
|
|
|
|
|
|
|
|
|
|
| ||
Baird 18-Oct-2005 |
| Hold |
| $ | 40 |
| — |
| • | Our price target of $40 is based on NewCastle’ cash offer for the remaining shares of Nevada... We do not expect to see any other competing bids for Nevada |
| |
| ||||||||||||
|
|
|
|
|
|
|
|
|
|
| ||
Banc of America 18-Oct-2005 |
| Hold |
| $ | 45 |
| — |
| • | NewCastle’ offer does not fully reflect the value of the company. We believe that an offer of $45 per share could be the next bid but may not be enough to convince Nevada’s management in accepting the offer... We believe that it [NewCastle’s offer] was driven by the favorable results of the FDA’s inspection of Fluvirin’s manufacturing facility in August |
| |
| ||||||||||||
| ||||||||||||
| ||||||||||||
|
|
|
|
|
|
|
|
|
|
| ||
AG Edwards 18-Oct-2005 |
| Hold |
| — |
| “$46 is a fair ceiling” |
| • | NewCastle’ bid falls in the middle of our sum-of-the-parts valuation that ranges from a low-end of $36 per share to a high-end of $43 per share... while $40 is a sensible price for a passive interest in the company, we believe a 15-20% premium is reasonable for a controlling interest and feel $46 is a fair ceiling |
| ||
| ||||||||||||
| ||||||||||||
| ||||||||||||
|
|
|
|
|
|
|
|
|
|
| ||
Deutsche Bank 17-Oct-2005 |
| Buy |
| $ | 38 |
| — |
| • | Although Nevada shares are currently trading above our price target, we note significant sector volatility and unusual circumstances surrounding NewCastle’ bid to acquire Nevada at $40 per share. Furthermore, we think a 14 multiple is justified given the recent string of manufacturing disappointments and resulting risk to our projected long-term EPS growth |
| |
| ||||||||||||
| ||||||||||||
| ||||||||||||
|
|
|
|
|
|
|
|
|
|
| ||
UBS 17-Oct-2005 |
| Under- perform |
| $ | 40 |
| — |
| • | We maintain our price target of $40, in-line with the NewCastle bid... If NewCastle were to withdraw its bid, we believe Nevada shares could trade back to pre-bid levels |
| |
| ||||||||||||
|
|
|
|
|
|
|
|
|
|
| ||
JPMorgan 17-Oct-2005 |
| Under- perform |
| — |
| — |
| • | We believe that despite trading in-line with its peers at 35x our 2005 estimate of $1.05, we believe the stock trades on a premium based on the potential for NewCastle to raise its offer |
| ||
| ||||||||||||
46
Brokers’ Views on Take-out of Nevada
Post Announcement of Offer (31-Aug-2005)
|
| Pre-Announcement |
| Expected |
|
|
|
| ||||
Broker |
| Rec. |
| Target |
| Deal Price |
| Comments |
| |||
Bernstein 12-Sep-2005 |
| Hold |
| — |
| $44-$46 |
| • | Given our recent accretion analysis for NewCastle’ bid, we believe Newcastle is likely to persist in their bid up to a price of at least $50 per share for the remaining Nevada shares and our analysis of the testing business’ outlook and the comparables value of the vaccines business, both support such a higher bid |
| ||
| ||||||||||||
| ||||||||||||
| ||||||||||||
|
|
|
|
|
|
|
|
|
|
| ||
Lehman Bros. 09-Sep-2005 |
| Hold |
| $ | 36 |
| $ | 45 |
| • | Our analysis of previous minority squeeze out deals and our sum of parts methodology both suggest that the initial $40 per share offer for Nevada by NewCastle will get bumped to $45. We expect that to occur in the next two months |
|
| ||||||||||||
| ||||||||||||
|
|
|
|
|
|
|
|
|
|
| ||
Merrill Lynch 06-Sep-2005 |
| Sell |
| — |
| — |
| • | While Newcastle could raise its bid by a couple of dollars, it remains unclear whether a modestly higher bid would be adequate to Nevada’s board. In contrast, we estimate the fundamental fair value for the Nevada shares under current management is closer to $32-34. Thus, we believe Nevada shareholders would get more value and reduce risk through an all-cash acquisition by Newcastle than if existing management continued to run the business |
| ||
| ||||||||||||
| ||||||||||||
| ||||||||||||
| ||||||||||||
|
|
|
|
|
|
|
|
|
|
| ||
SG Cowen 06-Sep-2005 |
| [Buy] |
| [$40+] |
| “at least mid $40s” |
| • | We believe the board’s decision [to reject the offer] is justified and continue to view Nevada shares as worth at least mid $40s assuming some contribution from Fluvirin... we think it likely that Newcastle will elect to counter with a higher |
| ||
| ||||||||||||
| ||||||||||||
|
|
|
|
|
|
|
|
|
|
| ||
Thomas Weisel 06-Sep-2005 |
| — |
| — |
| $43-$45 |
| • | We believe an offer in the $43-45 range (3.8-3.9x 2006E revenue) is necessary for a merger to be approved. It is unclear whether Newcastle may up its bid or if another potential acquirer may step in. We believe a bidding war among possible suitors is unlikely |
| ||
| ||||||||||||
| ||||||||||||
|
|
|
|
|
|
|
|
|
|
| ||
AG Edwards 02-Sep-2005 |
| Hold |
| — |
| “$46 is a fair ceiling” |
| • | Newcastle has been a conservative acquirer so if the firm increases its bid for Nevada we do not expect a substantial premium. Our sum-of-the-parts valuation suggests that the company is fairly valued with a range of $37-$44 per share... we believe a 15-20% premium is reasonable for a controlling interest and feel $46 is a fair ceiling |
| ||
| ||||||||||||
| ||||||||||||
| ||||||||||||
|
|
|
|
|
|
|
|
|
|
| ||
Citigroup 01-Sep-2005 |
| Hold |
| $ | 42 |
| — |
| • | We believe it is unlikely that there will be other offers/bidders as Newcastle already owns 42% of Nevada... and recommend taking profits at or above our target price of $42 per share |
| |
|
|
| ||||||||||
47
|
| Pre-Announcement |
| Expected |
|
|
|
| |||
Broker |
| Rec. |
| Target |
| Deal Price |
| Comments |
| ||
UBS 01-Sep-2005 |
| Under- perform |
| $ | 32 |
| — |
| • | We believe that it is unlikely for Newcastle to significantly increase their $40 bid... (1) Nevada is a more of a financial than a strategic investment for NVS; (2) Nevada acquisition would come with some baggage, limiting NVS management tolerance for a higher acquisition premium; (3) Nevada acquisition could complicate NVS’s stated goal of merging with Roche in the future; (4) Independent Nevada Board members asked NVS to consider its plans for its investment in Nevada |
|
| |||||||||||
| |||||||||||
| |||||||||||
| |||||||||||
| |||||||||||
|
|
|
|
|
|
|
|
|
|
| |
JPMorgan 01-Sep-2005 |
| Under- perform |
| — |
| — |
| • | We do not expect any bidding war for Nevada. We also would not rule out Nevada trying to seek alternative strategies in an attempt to remain somewhat independent. That said, we think a Newcastle acquisition is very likely the best outcome for Nevada shareholders |
| |
| |||||||||||
| |||||||||||
|
|
|
|
|
|
|
|
|
|
| |
Harris Nesbitt 01-Sep-2005 |
| Hold |
| — |
| $44-$46 |
| • | In our view, the 10% premium to Nevada’s closing price yesterday is too low given that the stock is currently weighed down by flu vaccine concerns... Removing that uncertainty, our valuation is closer to $44-$46 per share. We believe the deal is more likely to get done closer to a 30% premium (~$47 per share) to yesterday’s closing price, a premium similar to what Nevada paid for PowderJect in 2003 |
| |
| |||||||||||
| |||||||||||
| |||||||||||
| |||||||||||
48
Pricing Matrix
Offer Price($) |
|
|
| 40 |
| 41 |
| 42 |
| 43 |
| 44 |
| 45 |
| 46 |
|
|
|
|
|
|
|
|
|
|
|
|
|
|
|
|
|
|
|
Premia Paid |
|
|
|
|
|
|
|
|
|
|
|
|
|
|
|
|
|
Unaffected |
| 36.44 |
| 9.8 | % | 12.5 | % | 15.3 | % | 18.0 | % | 20.7 | % | 23.5 | % | 26.2 | % |
1 Week |
| 36.18 |
| 10.6 | % | 13.3 | % | 16.1 | % | 18.9 | % | 21.6 | % | 24.4 | % | 27.1 | % |
1 Month |
| 36.18 |
| 10.5 | % | 13.3 | % | 16.1 | % | 18.8 | % | 21.6 | % | 24.4 | % | 27.1 | % |
3 Months |
| 36.07 |
| 10.9 | % | 13.7 | % | 16.4 | % | 19.2 | % | 22.0 | % | 24.8 | % | 27.5 | % |
6 Months |
| 36.22 |
| 10.4 | % | 13.2 | % | 16.0 | % | 18.7 | % | 21.5 | % | 24.2 | % | 27.0 | % |
12 Months |
| 35.61 |
| 12.3 | % | 15.1 | % | 17.9 | % | 20.7 | % | 23.6 | % | 26.4 | % | 29.2 | % |
|
|
|
|
|
|
|
|
|
|
|
|
|
|
|
|
|
|
Post 15-Jul |
| 36.11 |
| 10.8 | % | 13.5 | % | 16.3 | % | 19.1 | % | 21.8 | % | 24.6 | % | 27.4 | % |
Post 15-Jun |
| 35.93 |
| 11.3 | % | 14.1 | % | 16.9 | % | 19.7 | % | 22.5 | % | 25.2 | % | 28.0 | % |
Post 2-Mar |
| 36.08 |
| 10.9 | % | 13.6 | % | 16.4 | % | 19.2 | % | 21.9 | % | 24.7 | % | 27.5 | % |
Post 13-Oct-04 |
| 34.65 |
| 15.4 | % | 18.3 | % | 21.2 | % | 24.1 | % | 27.0 | % | 29.9 | % | 32.7 | % |
|
|
|
|
|
|
|
|
|
|
|
|
|
|
|
|
|
|
2006 P/E |
|
|
|
|
|
|
|
|
|
|
|
|
|
|
|
|
|
2006E EPS |
|
|
|
|
|
|
|
|
|
|
|
|
|
|
|
|
|
|
| 1.60 |
| 25.0 | x | 25.6 | x | 26.3 | x | 26.9 | x | 27.5 | x | 28.1 | x | 28.8 | x |
|
| 1.65 |
| 24.2 | x | 24.8 | x | 25.5 | x | 26.1 | x | 26.7 | x | 27.3 | x | 27.9 | x |
|
| 1.70 |
| 23.5 | x | 24.1 | x | 24.7 | x | 25.3 | x | 25.9 | x | 26.5 | x | 27.1 | x |
I/B/E/S |
| 1.75 |
| 22.9 | x | 23.4 | x | 24.0 | x | 24.6 | x | 25.1 | x | 25.7 | x | 26.3 | x |
|
| 1.80 |
| 22.2 | x | 22.8 | x | 23.3 | x | 23.9 | x | 24.4 | x | 25.0 | x | 25.6 | x |
|
| 1.85 |
| 21.6 | x | 22.2 | x | 22.7 | x | 23.2 | x | 23.8 | x | 24.3 | x | 24.9 | x |
|
| 1.90 |
| 21.1 | x | 21.6 | x | 22.1 | x | 22.6 | x | 23.2 | x | 23.7 | x | 24.2 | x |
Note: IBES as of 31-Aug-2005
49
Premiums to Average Cost Basis
Top 10 Nevada Institutional Shareholders at Announcement
Current Price (26-Oct-2005) |
| $ 43.38 |
|
|
| Average |
|
|
|
|
|
|
|
|
|
|
|
|
| |
Price |
| Cost Basis |
| $ 40.00 |
| $ 42.00 |
| $ 44.00 |
| $ 46.00 |
| $ 48.00 |
| $ 50.00 |
| |
Citigroup |
| $ | 39.47 |
| 1.3 | % | 6.4 | % | 11.5 | % | 16.5 | % | 21.6 | % | 26.7 | % |
Morgan Stanley |
| 34.34 |
| 16.5 | % | 22.3 | % | 28.1 | % | 33.9 | % | 39.8 | % | 45.6 | % | |
Barclays Bank |
| 34.33 |
| 16.5 | % | 22.3 | % | 28.2 | % | 34.0 | % | 39.8 | % | 45.6 | % | |
ValueAct Cap Partners |
| 35.14 |
| 13.8 | % | 19.5 | % | 25.2 | % | 30.9 | % | 36.6 | % | 42.3 | % | |
Sound Shore Management |
| 35.11 |
| 13.9 | % | 19.6 | % | 25.3 | % | 31.0 | % | 36.7 | % | 42.4 | % | |
State Street Corporation |
| 39.70 |
| 0.7 | % | 5.8 | % | 10.8 | % | 15.9 | % | 20.9 | % | 25.9 | % | |
Vanguard Group |
| 40.61 |
| (1.5 | )% | 3.4 | % | 8.3 | % | 13.3 | % | 18.2 | % | 23.1 | % | |
T. Rowe Price Associates |
| 34.05 |
| 17.5 | % | 23.4 | % | 29.2 | % | 35.1 | % | 41.0 | % | 46.9 | % | |
Deutsche Bank |
| 48.54 |
| (17.6 | )% | (13.5 | )% | (9.4 | )% | (5.2 | )% | (1.1 | )% | 3.0 | % | |
Northern Trust Corp |
| 43.90 |
| (8.9 | )% | (4.3 | )% | 0.2 | % | 4.8 | % | 9.3 | % | 13.9 | % | |
|
|
|
|
|
|
|
|
|
|
|
|
|
|
|
| |
High |
| $ | 48.54 |
| 17.5 | % | 23.4 | % | 29.2 | % | 35.1 | % | 41.0 | % | 46.9 | % |
Mean |
| 38.52 |
| 5.2 | % | 10.5 | % | 15.8 | % | 21.0 | % | 26.3 | % | 31.5 | % | |
Median |
| 37.30 |
| 7.6 | % | 13.0 | % | 18.4 | % | 23.7 | % | 29.1 | % | 34.5 | % | |
Low |
| 34.05 |
| (17.6 | )% | (13.5 | )% | (9.4 | )% | (5.2 | )% | (1.1 | )% | (3.0 | )% | |
50
Expected Value and Risk/Return
Spread Calculation (Return) | ||||
|
|
|
|
|
NewCastle Price (Ask) |
| $ | 53.72 |
|
Nevada Price (Ask) |
| $ | 42.66 |
|
Expected Closing Date |
| 01/31/06 |
| |
Expected Time to Closing in Years |
| 0.26 |
| |
Cash per Nevada |
| 40.00 |
| |
Exchange Ratio NewCastle per Nevada |
| 0.0000 |
| |
Deal Price |
| $ | 40.00 |
|
Current Gross Spread |
| $ | (2.66 | ) |
|
|
|
| |
Net Spread Calculation |
|
|
| |
Gross Spread |
| $ | (2.66 | ) |
Dividend Effect |
| — |
| |
Rebate Earned on NewCastle Short @ 2.00% |
| $ | 0.00 |
|
Net Spread |
| $ | (2.66 | ) |
|
|
|
| |
Annualized Return as a % of Nevada |
| -23.7 | % | |
Risk | ||||
| ||||
NewCastle Pre-Announce Price |
| $ | 48.75 |
|
Nevada Pre-Announce Price |
| $ | 36.44 |
|
S&P Price |
| 1,178.9 |
| |
Announcement Date |
| 08/31/05 |
| |
NewCastle Beta |
| 0.64 |
| |
Nevada Beta |
| 1.06 |
| |
S&P on Announcement |
| 1,220.33 |
| |
|
|
|
| |
Adjusted Risk Calculation |
|
|
| |
NewCastle Adjusted Price |
| $ | 47.69 |
|
Nevada Adjusted Price |
| $ | 29.50 |
|
Downside Risk |
| $ | 13.16 |
|
Upside Risk |
| $ | 0.00 |
|
Total Risk |
| $ | 13.16 |
|
|
|
|
| |
Breakeven Probability |
| 125.3 | % | |
Risk/Reward |
| NM |
| |
Expected Value Calculation
|
|
|
| Transaction |
| Present |
| Expected |
| |||
|
| Probability |
| Value |
| Value |
| Value |
| |||
Current Bid |
| 10.0 | % | $ | 40.00 |
| $ | 39.34 |
| $ | 3.93 |
|
Improved Bid |
| 40.0 | % | 45.00 |
| 44.26 |
| 17.70 |
| |||
Improved Bid |
| 25.0 | % | 50.00 |
| 49.18 |
| 12.29 |
| |||
Failure |
| 25.0 | % | 36.00 |
| 35.41 |
| 8.85 |
| |||
|
|
|
|
|
|
|
|
|
| |||
Expected Value |
|
|
|
|
|
|
| $ | 42.78 |
| ||
51
US Minority Buy-ins (Squeeze Out)
2002 - 2005YTD; > $100 Million Transaction Size
|
|
|
|
|
| At Announcem. |
|
|
| Premium Paid (%) |
|
|
| ||||||
Date |
|
|
|
|
| % |
| % |
|
|
| 1 Week |
| 1 Day |
| 4 Weeks |
|
|
|
Announced |
| Target Name |
| Acquiror Name |
| Held |
| Sought |
| Value |
| Prior |
| Prior |
| Prior |
| Cash/ Stock |
|
|
|
|
|
|
|
|
|
|
| ($mil) |
|
|
|
|
|
|
|
|
|
10-Oct-05 |
| Micro Therapeutics Inc |
| ev3 Inc |
| 69.9 |
| 30.1 |
| 116 |
| 40.8 |
| 33.0 |
| 31.7 |
| Stock Only |
|
12-Sep-05 |
| WFS Financial Inc |
| Wachovia Corp,Charlotte,NC |
| 84.0 |
| 16.0 |
| 486 |
| 11.5 |
| 13.8 |
| 28.2 |
| Stock Only |
|
1-Sep-05 |
| 7-Eleven Inc |
| IYG Holding Co |
| 69.7 |
| 30.3 |
| 1,117 |
| 13.6 |
| 14.7 |
| (1.1 | ) | Cash Only |
|
3-Mar-05 |
| Siliconix Inc |
| Vishay Intertechnology Inc |
| 80.4 |
| 19.6 |
| 231 |
| 39.0 |
| 36.5 |
| 28.9 |
| Stock Only |
|
21-Feb-05 |
| Eon Labs Inc |
| Novartis AG |
| 66.4 |
| 33.6 |
| 933 |
| 7.8 |
| 11.0 |
| 23.5 |
| Cash Only |
|
27-Jan-05 |
| Genencor International Inc |
| Danisco A/S |
| 84.0 |
| 16.0 |
| 184 |
| 22.4 |
| 23.9 |
| 15.8 |
| Cash Only |
|
18-Jan-05 |
| UnitedGlobalCom Inc |
| Liberty Media Intl Inc |
| 52.2 |
| 47.8 |
| 3,576 |
| 3.5 |
| (0.6 | ) | 0.2 |
| Mixed |
|
10-Jan-05 |
| Fox Entertainment Group Inc |
| News Corp Inc |
| 76.6 |
| 23.4 |
| 6,874 |
| 7.0 |
| 7.4 |
| 11.6 |
| Stock Only |
|
2-Aug-04 |
| Cox Communications Inc |
| Cox Enterprises Inc |
| 61.4 |
| 38.6 |
| 8,390 |
| 24.6 |
| 26.0 |
| 25.2 |
| Cash Only |
|
24-May-04 |
| WFS Financial Inc |
| Westcorp |
| 84.0 |
| 14.0 |
| 310 |
| 6.2 |
| 3.5 |
| 5.1 |
| Cash Only |
|
15-Jan-04 |
| Phosphate Resource Partners LP |
| IMC Global Inc |
| 51.6 |
| 48.4 |
| 111 |
| 12.1 |
| 2.7 |
| 16.8 |
| Stock Only |
|
7-Nov-03 |
| barnesandnoble.com Inc |
| Barnes & Noble Inc |
| 74.8 |
| 25.2 |
| 122 |
| 32.6 |
| 35.6 |
| 27.1 |
| Cash Only |
|
2-Jun-03 |
| Ribapharm Inc |
| ICN Pharmaceuticals Inc |
| 79.6 |
| 20.4 |
| 187 |
| 23.8 |
| 23.0 |
| 50.2 |
| Cash Only |
|
23-May-03 |
| Fidelity Natl Info Solutions |
| Fidelity Natl Finl Inc |
| 57.2 |
| 42.8 |
| 392 |
| 24.8 |
| 24.1 |
| 37.3 |
| Stock Only |
|
10-Apr-03 |
| Hotels.com |
| USA Interactive |
| 62.3 |
| 37.7 |
| 1,237 |
| 9.8 |
| 13.0 |
| 28.0 |
| Stock Only |
|
20-Aug-02 |
| Pure Resources Inc |
| Union Oil Co of California |
| 57.9 |
| 42.1 |
| 434 |
| 27.0 |
| 20.7 |
| 22.4 |
| Stock Only |
|
26-Jul-02 |
| International Specialty Prods |
| Samuel J Heyman |
| 77.9 |
| 22.1 |
| 138 |
| 1.7 |
| 4.3 |
| 33.8 |
| Cash Only |
|
26-Jul-02 |
| Tremont Corp |
| Valhi Inc |
| 64.6 |
| 35.4 |
| 127 |
| 114.6 |
| 96.4 |
| 118.8 |
| Stock Only |
|
17-Jun-02 |
| Fortress Group Inc |
| Lennar Corp |
| 73.1 |
| 26.9 |
| 112 |
| 18.7 |
| 16.8 |
| 20.7 |
| Cash Only |
|
18-Mar-02 |
| McAfee.com Corp |
| Network Associates Inc |
| 68.5 |
| 31.5 |
| 230 |
| (11.3 | ) | (0.7 | ) | (5.1 | ) | Mixed |
|
19-Feb-02 |
| Travelocity.com Inc |
| Sabre Holdings Corp |
| 65.5 |
| 34.5 |
| 447 |
| 40.3 |
| 45.8 |
| 22.5 |
| Cash Only |
|
15-Feb-02 |
| NRG Energy Inc |
| Xcel Energy Inc |
| 73.0 |
| 27.0 |
| 673 |
| 34.0 |
| 28.6 |
| (3.1 | ) | Stock Only |
|
4-Feb-02 |
| Intimate Brands Inc(Limited) |
| Limited Inc |
| 81.8 |
| 18.2 |
| 1,645 |
| 18.0 |
| 10.2 |
| 24.8 |
| Stock Only |
|
|
|
|
|
|
|
|
|
|
|
|
|
|
|
|
|
|
|
|
|
|
| 2002-2005YTD |
| Median |
| 69.9 |
| 30.1 |
|
|
| 18.7 |
| 16.8 |
| 23.5 |
|
|
|
|
|
|
| Mean |
| 70.3 |
| 29.6 |
|
|
| 22.7 |
| 21.3 |
| 24.5 |
|
|
|
|
|
|
| Low |
| 51.6 |
| 14.0 |
|
|
| (11.3 | ) | (0.7 | ) | (5.1 | ) |
|
|
|
|
|
| High |
| 84.0 |
| 48.4 |
|
|
| 114.6 |
| 96.4 |
| 118.8 |
|
|
|
52
Premium Analysis
Biotech Transactions >$100mm, 2001 – 2005YTD
|
|
|
|
|
| Enterprise |
| LTM |
| Premium to |
| Premium to |
|
|
| |
Date |
|
|
|
|
| Consideration |
| Sales |
| 1 day prior |
| 20 days prior |
| Cash or |
| |
Announced |
| Acquiror |
| Target |
| ($ mm) (a) |
| Multiple |
| Price (%) |
| Price (%) |
| Stock |
| |
07-Sep-2005 |
| GlaxoSmithKline |
| ID Biomedial |
| $ | 1,917.6 |
| 25.5 | x | 13.5 | % | 43.5 | % | Cash |
|
19-Aug-2005 |
| OSI Pharmaceuticals |
| Eyetech (Pending) |
| 935.0 |
| 8.0 |
| 43.0 | % | 64.1 | % | Cash / Stock |
| |
16-Jun-2005 |
| Pfizer |
| Vicuron (Pending) |
| 1,900.0 |
| 219.9 |
| 83.5 | % | 73.0 | % | Cash |
| |
01-May-2005 |
| Genzyme |
| Bone Care (Pending) |
| 536.1 |
| 12.3 |
| 34.8 | % | 24.6 | % | Cash |
| |
01-Apr-2005 |
| GlaxoSmithKline |
| Corixa (Pending) |
| 333.5 |
| 13.4 |
| (4.2 | )% | 51.7 | % | Cash |
| |
01-Apr-2005 |
| Shire Pharmaceuticals |
| Transkryotic Therapies (Pending) |
| 1,400.0 |
| 14.5 |
| 21.6 | % | 49.4 | % | Cash |
| |
14-Jun-2004 |
| QLT |
| Atrix Laboratories |
| 753.0 |
| 13.6 |
| 27.2 | % | 27.6 | % | Cash / Stock |
| |
18-May-2004 |
| UCB |
| Celltech |
| 2,445.2 |
| 4.2 |
| 27.6 | % | 22.0 | % | Cash |
| |
29-Mar-2004 |
| Amgen (e) |
| Tularik |
| 1,291.0 |
| 37.0 |
| 47.1 | % | 33.0 | % | Stock |
| |
26-Feb-2004 |
| Genzyme |
| ILEX Oncology |
| 947.4 |
| 27.2 |
| 25.0 | % | 10.5 | % | Stock |
| |
19-Dec-2003 |
| Pfizer |
| Esperion Therapeutics |
| 1,170.6 |
| N.A. |
| 54.2 | % | 62.0 | % | Cash |
| |
21-Nov-2003 |
| Eli Lilly |
| Applied Molecular Evolution |
| 380.9 |
| 45.4 |
| 53.1 | % | 56.0 | % | Cash / Stock |
| |
04-Aug-2003 |
| Genzyme |
| SangStat |
| 528.4 |
| 4.2 |
| 45.3 | % | 53.6 | % | Cash |
| |
23-Jun-2003 |
| IDEC Pharmaceuticals |
| Biogen |
| 5,943.5 |
| 5.0 |
| 2.3 | % | 10.7 | % | Stock |
| |
17-Jun-2003 |
| Cell Therapeutics |
| Novuspharma |
| 141.5 |
| 21.4 |
| 35.1 | % | 68.3 | % | Stock |
| |
20-May-2003 |
| Chiron |
| PowderJect Pharmaceuticals |
| 786.0 |
| 4.3 |
| 3.8 | % | 17.6 | % | Cash |
| |
26-Feb-2003 |
| Celltech |
| Oxford GlycoSciences |
| 160.5 |
| 9.8 |
| 19.3 | % | 26.4 | % | Cash |
| |
20-Feb-2003 |
| NPS Pharmaceuticals |
| Enzon Pharmaceuticals |
| 1,021.4 |
| 5.5 |
| 26.0 | % | (5.1 | )% | Stock |
| |
10-Feb-2003 |
| Johnson & Johnson |
| Scios |
| 2,332.7 |
| 30.2 |
| 6.6 | % | 25.0 | % | Cash |
| |
04-Dec-2002 |
| Gilead Sciences |
| Triangle Pharmaceuticals |
| 464.0 |
| 26.3 |
| 33.3 | % | 71.9 | % | Cash |
| |
31-Jul-2002 |
| Versicor |
| Biosearch Italia |
| 151.6 |
| 22.4 |
| 34.7 | % | 74.7 | % | Stock |
| |
26-Jun-2002 |
| Serono |
| Genset |
| 106.4 |
| 6.1 |
| 116.0 | % | 189.9 | % | Cash |
| |
23-May-2002 |
| Berna Biotech |
| Rhein Biotech |
| 250.2 |
| 3.3 |
| 28.6 | % | 67.2 | % | Cash / Stock |
| |
17-Dec-2001 |
| Amgen |
| Immunex |
| 15,883.9 |
| 16.5 |
| 13.8 | % | 5.3 | % | Cash / Stock |
| |
06-Dec-2001 |
| Millennium Pharmaceuticals |
| COR Therapeutics |
| 1,980.8 |
| 15.8 |
| 77.3 | % | 66.3 | % | Stock |
| |
03-Dec-2001 |
| MedImmune |
| Aviron |
| 1,412.5 |
| 41.8 |
| 28.0 | % | 45.7 | % | Stock |
| |
19-Nov-2001 |
| Exelixis |
| Genomica |
| 110.0 |
| 72.1 |
| 41.3 | % | 72.2 | % | Stock |
| |
19-Sep-2001 |
| Bristol-Myers Squibb |
| ImClone (19.9%) |
| 1,015.3 |
| 176.2 |
| 40.0 | % | 57.0 | % | Cash |
| |
13-Jun-2001 |
| Celera Genomics |
| Axys Pharmaceuticals |
| 174.4 |
| 20.2 |
| 34.8 | % | 52.5 | % | Stock |
| |
29-May-2001 |
| Sequenom |
| Gemini Genomics |
| 176.3 |
| 111.7 |
| 26.3 | % | 84.6 | % | Stock |
| |
11-May-2001 |
| Merck & Co. |
| Rosetta Inpharmatics |
| 458.2 |
| 31.4 |
| 81.6 | % | 131.0 | % | Stock |
| |
30-Apr-2001 |
| Vertex Pharmaceuticals |
| Aurora Biosciences |
| 467.0 |
| 7.1 |
| 44.5 | % | 59.6 | % | Stock |
| |
27-Mar-2001 |
| Johnson & Johnson |
| ALZA |
| 10,506.0 |
| 9.7 |
| 39.2 | % | 1.4 | % | Stock |
| |
|
|
|
|
|
|
|
|
|
|
|
|
|
|
|
| |
|
|
|
| Mean |
| 1,760.0 |
| 33.2 |
| 36.5 | % | 51.3 | % |
|
| |
|
|
|
| Median |
| 786.0 |
| 16.2 |
| 34.7 | % | 52.5 | % |
|
| |
Note: Deals marked as “Pending” are based on preliminary information. Transaction information may change as a result of new information around closing. EBIT & EBITDA multiples exclude non-recurring charges
(a) Foreign company valuations converted to $US using the applicable exchange rate on date of announcement.
(b) Cephalon-Salmedix enterprise value includes $160mm up front purchase price and $40mm earn out contingent on regulatory milestones.
(c) Terms for the Pfizer-Idun transaction were not publicly disclosed.
(d) $190mm purchase price includes $10mm upfront, plus $145mm cash over next 5 years and $20mm in stock in 2009 (based on future stock price). BioMarin will also assume $15mm in liabilities of Medicis.
Sales and EBIT multiples based on 2004E Orapred sales and 30% EBIT margin per Wall St. Research.
(e) Amgen acquired the remaining 78.7% interest or 52.7mm shares which it did not already own in Tularik for $25 in common stock per share.
53
Appendix A: Review of Key Products
54
Broker Views on Selected Products: Fluvirin / Flu Vaccines
($ in millions)
|
| Peak |
| Annual Estimated Sales |
| ||||||||||||||||||||
Broker |
| Sales |
| 2004A |
| 2005E |
| 2006E |
| 2007E |
| 2008E |
| 2009E |
| 2010E |
| ||||||||
CSFB |
| $ | 0 |
| $ | 153 |
| $ | 169 |
| $ | 472 |
| $ | 625 |
|
|
|
|
|
|
| |||
Goldman Sachs |
| 0 |
| 153 |
| 243 |
| 414 |
| 491 |
|
|
|
|
|
|
| ||||||||
Merrill Lynch |
| 0 |
| 153 |
| 171 |
| 417 |
| 441 |
| 467 |
|
|
|
|
| ||||||||
Morgan Stanley |
| 0 |
| 153 |
| 266 |
| 322 |
| 319 |
|
|
|
|
|
|
| ||||||||
Piper Jaffray |
| 0 |
| 153 |
| 203 |
| 388 |
| 497 |
| 570 |
| 648 |
|
|
| ||||||||
Robert Baird |
| 0 |
| 153 |
| 242 |
| 338 |
|
|
|
|
|
|
|
|
| ||||||||
SG Cowen |
| 0 |
| 153 |
| 210 |
| 450 |
| 550 |
| 625 |
| 690 |
| 720 |
| ||||||||
Smith Barney (Citi) |
| 0 |
| 153 |
|
|
|
|
|
|
|
|
|
|
|
|
| ||||||||
UBS |
| 0 |
| 153 |
| 199 |
| 354 |
| 399 |
|
|
|
|
|
|
| ||||||||
Median |
| $ | 0 |
| $ | 153 |
| $ | 207 |
| $ | 401 |
| $ | 491 |
| $ | 570 |
| $ | 669 |
| $ | 720 |
|
Management Case |
|
|
| $ | 153 |
|
|
| $ | 547 |
| $ | 590 |
| $ | 657 |
| $ | 687 |
| $ | 740 |
| ||
Team Case |
| $ | 0 |
| $ | 153 |
| $ | 153 |
| $ | 292 |
| $ | 400 |
| $ | 425 |
| $ | 451 |
| $ | 529 |
|
Broker Views
• Market Consensus for 2005/06: Nevada will return to the market with 18m doses and generate $160m sales (median values)
• Morgan Stanley: Streets expectations for Fluvirin’s return this year are high, and we believe there is little upside left from a positive opinion. Our long-term view remains that this market is under considerable competitive threats…We believe Nevada’s long-term competitive position in the flu vaccine market has deteriorated significantly over the past year with the numerous issues
• CSFB: Looking beyond next flu season, increasing competition in the flu vaccine market could depress Fluvirin demand and margins. Among US market entrants that we expect in the 2005-07 timeframe: Solvay, Baxter, ID Biomedical, GSK, and Protein Sciences
• Lehman Bros: We believe that the previously anticipated growth and profitability expected with the US flu vaccine business will never be achievable…We think that the overall unit volume growth in the US over the next several years will not achieve the 16% compound growth achieved in the 90’s.
55
|
| 2005E Flu Vaccines |
| 2005E Flu Vaccines |
| |||||
|
| Pre Offer Announcement |
| Post 3Q Announcement |
| |||||
Broker |
| Fluvirin Doses |
| Flu Sales |
| Fluvirin Doses |
| Flu Sales |
| |
A. G. Edwards |
| 18m |
|
|
| 12m |
| $ | 125 |
|
Bernstein & Co |
|
|
|
|
|
|
| 198 |
| |
CSFB |
| 20m |
| 169 |
|
|
|
|
| |
Deutsche Bank |
| 22m |
|
|
| 13m |
|
|
| |
Goldman Sachs |
| 18m |
| 243 |
| 15m |
| 171 |
| |
J.P. Morgan |
|
|
|
|
| 10m |
| 215 |
| |
Lehman Brothers |
|
|
|
|
| 12-15m |
|
|
| |
Merrill Lynch |
|
|
| 253 |
| 15m |
|
|
| |
Morgan Stanley |
|
|
| 266 |
|
|
|
|
| |
Piper Jaffray |
|
|
| 300 |
| 10m |
| 203 |
| |
Robert W. Baird |
|
|
| 316 |
|
|
| 242 |
| |
S.G. Cowen |
|
|
| 298 |
|
|
| 210 |
| |
UBS |
| 15m |
| 228 |
| 15m |
| 199 |
| |
Median |
| 18m |
| 260 |
| 13m |
| 201 |
| |
Company Guidance (At Announcement) |
| 18-26m |
|
|
| <18m |
| NA |
| |
56
Broker Views on Selected Products: Tifacogin
Product Background
• A coagulation inhibitor (Recombinant Tissue Factor Pathway Inhibitor, or TFPI)
• Currently in Phase III development for severe community-acquired pneumonia (CAP)
• CAB is a severe condition requiring ICU admission (30% mortality), affecting 300k patients p.a. in the US
• Compound was previously in development for sepsis, but failed to show efficacy
• Previously co-developed with Pfizer; in October 2003, Nevada acquired all rights to the compound
Broker Views
• No research analyst has the compound included in their projection
• A.G. Edwards: We believe the market generally feels that Nevada will fail in its effort to prove Tifacogin will help Community acquired Pneumonia (CAP) patients given that the drug failed to show efficacy in a 2001 sepsis trial known asthe OPTIMIST study. However, given the size of the CAP market, should the trial be successful we estimate the positive value increase to be roughly $2-$6 per share; Peak Sales Estimate: $680m
• CSFB: We assign a low probability of success to a Phase 3 tifacogin CAP study (interim analysis Q4:05E)
• Deutsche Bank: Is currently in Phase III trials (2100 patients), with an interim safety and futility analysis by the Data Monitoring Board expected in 2H05 and expected to complete patient enrollment in YE06
• Morgan Stanley: We view this as a high-risk trial and are currently not including Tifacogin in our estimates
• Lehman Bros. (Pharma Book): $300m peak sales (2014); Launch 20008; PoS 25%
57
Broker Views on Selected Products: Meningitis Vaccines
($ in millions)
|
| Peak |
| Annual Estimated Sales |
| ||||||||||||||||||||
Broker |
| Sales |
| 2004A |
| 2005E |
| 2006E |
| 2007E |
| 2008E |
| 2009E |
| 2010E |
| ||||||||
CSFB |
| — |
| $ | 28 |
| $ | 56 |
| $ | 50 |
| $ | 60 |
| $ | 70 |
|
|
|
|
| |||
Goldman Sachs |
| — |
| 28 |
| 43 |
| 38 |
| 34 |
|
|
|
|
|
|
| ||||||||
Merrill Lynch |
| — |
| 28 |
| 44 |
| 35 |
| 35 |
| 34 |
|
|
|
|
| ||||||||
Morgan Stanley |
| — |
| 28 |
| 43 |
| 33 |
| 33 |
| 312 |
| 546 |
| 749 |
| ||||||||
Piper Jaffray |
| — |
| 28 |
| 46 |
| 25 |
| 25 |
| 20 |
| 15 |
|
|
| ||||||||
Robert Baird |
| 1,000 |
| 28 |
| 46 |
| 50 |
|
|
|
|
|
|
|
|
| ||||||||
SG Cowen |
| — |
| 28 |
| 44 |
| 40 |
| 40 |
| 40 |
| 50 |
| 50 |
| ||||||||
Smith Barney (Citi) |
| 1,400 |
|
|
|
|
|
|
|
|
|
|
|
|
|
|
| ||||||||
UBS |
| — |
| 28 |
| 46 |
| 50 |
| 65 |
|
|
|
|
|
|
| ||||||||
Median |
| $ | 1,200 |
| $ | 28 |
| $ | 45 |
| $ | 39 |
| $ | 35 |
| $ | 40 |
| $ | 50 |
| $ | 399 |
|
Management Case |
|
|
|
|
|
|
|
|
|
|
|
|
|
|
|
|
| ||||||||
Team Case |
| $ | 446 |
| — |
| — |
| — |
| — |
| — |
| $ | 116 |
| $ | 225 |
| |||||
Selected Comments:
• Deutsche Bank: Meningococcal vaccine revenue of $13.6 million (up 171.2% year-over-year) was meaningfully higher than our estimate of $6.0 million, relating to MenZB (meningitis B vaccine) sales to New Zealand’s Ministry of Health
• Robert Baird: We see the ACWY meningococcal vaccine being a possible $1 billion opportunity toward the end of the decade
• SmithBarney: According to Nevada, the potential market opportunity for the worldwide meningitis franchise is approximately $2 billion with the U.S. and European markets representing approximately $1 billion
58
Betaseron Projections: Management Case
($ in millions)
[CHART]
Note: 2005 Nevada amount is extrapolation based on H12005 growth rate over H12004 applied to 2004A.
59
Broker Views on Selected Products: Betaseron
($ in millions)
|
| Peak |
| Annual Estimated Sales |
| ||||||||||||||||||||
Broker |
| Sales |
| 2004A |
| 2005E |
| 2006E |
| 2007E |
| 2008E |
| 2009E |
| 2010E |
| ||||||||
A.G. Edwards |
| — |
| $ | 131 |
| $ | 140 |
|
|
|
|
|
|
|
|
|
|
| ||||||
CSFB |
| 131 |
| 131 |
| 129 |
| 122 |
| 116 |
| 110 |
|
|
|
|
| ||||||||
Goldman Sachs |
| — |
| 131 |
| 137 |
| 126 |
| 119 |
|
|
|
|
|
|
| ||||||||
Merrill Lynch |
| — |
| 131 |
| 138 |
| 135 |
| 131 |
| 127 |
|
|
|
|
| ||||||||
Morgan Stanley |
| — |
| 131 |
| 125 |
| 128 |
| 135 |
| 136 |
| 138 |
| 139 |
| ||||||||
Piper Jaffray |
| — |
| 131 |
| 141 |
| 144 |
| 148 |
| 362 |
| 363 |
|
|
| ||||||||
Robert Baird |
| — |
| 131 |
| 139 |
| 153 |
|
|
|
|
|
|
|
|
| ||||||||
SG Cowen |
| — |
| 131 |
| 138 |
| 145 |
| 150 |
| 160 |
| 165 |
| 170 |
| ||||||||
Smith Barney (Citi) |
| — |
| 131 |
| 134 |
|
|
|
|
|
|
|
|
|
|
| ||||||||
UBS |
| — |
| 131 |
| 142 |
| 150 |
| 155 |
|
|
|
|
|
|
| ||||||||
Median |
| $ | 131 |
| $ | 131 |
| $ | 138 |
| $ | 139 |
| $ | 135 |
| $ | 136 |
| $ | 165 |
| $ | 155 |
|
Management Case |
|
|
| $ | 131 |
|
|
| $ | 177 |
| $ | 172 |
| $ | 177 |
| $ | 188 |
| $ | 201 |
| ||
Team Case |
| $ | 143 |
| $ | 131 |
| $ | 134 |
| $ | 139 |
| $ | 143 |
| $ | 143 |
| $ | 136 |
| $ | 122 |
|
Selected Comments:
• A.G. Edwards: While our belief is that Betaseron sales will experience some growth we think that the share price could see a $1-$2 drop should Betaseron sales decline and could rise $1-$2 if 2005 Betaseron sales show modest growth
• Deutsche Bank: Revenue of $38.1 million (up 20.6% yearover- year) were significantly above our estimate of $25.5 million, related to inventory ordering patterns, an 8% price increase in December 2004 and a growing multiple sclerosis market
• SmithBarney: Betaseron sales of $38.1 million (excluding royalty payments on Betaferon of $16.9 million) for the second quarter were higher than our estimate of $31.9 million. Our Betaseron sales estimate is revised to $134 million from $128 million for fiscal 2005
60
Proleukin Projections: Management Case
($ in millions)
[CHART]
Note: 2005 Nevada amount is extrapolation based on H12005 growth rate over H12004 applied to 2004A.
61
Broker Views on Selected Products: Proleukin
($ in millions)
|
| Peak |
| Annual Estimated Sales |
| ||||||||||||||||||||
Broker |
| Sales |
| 2004A |
| 2005E |
| 2006E |
| 2007E |
| 2008E |
| 2009E |
| 2010E |
| ||||||||
CSFB |
| — |
| $ | 129 |
| $ | 132 |
| $ | 150 |
| $ | 160 |
| $ | 170 |
|
|
|
|
| |||
Goldman Sachs |
| — |
| 129 |
| 122 |
| 115 |
| 108 |
|
|
|
|
|
|
| ||||||||
Merrill Lynch |
| — |
| 129 |
| 138 |
| 135 |
| 131 |
| 127 |
|
|
|
|
| ||||||||
Morgan Stanley |
| — |
| 129 |
| 129 |
| 136 |
| 138 |
| 141 |
| 144 |
| 147 |
| ||||||||
Piper Jaffray |
| — |
| 129 |
| 121 |
| 114 |
| 107 |
| 101 |
| 95 |
|
|
| ||||||||
Robert Baird |
| 130 |
| 129 |
| 123 |
| 118 |
|
|
|
|
|
|
|
|
| ||||||||
SG Cowen |
| 130 |
| 129 |
| 125 |
| 130 |
| 130 |
| 130 |
| 130 |
| 1,303 |
| ||||||||
Smith Barney (Citi) |
| — |
| 129 |
| 125 |
|
|
|
|
|
|
|
|
|
|
| ||||||||
UBS |
| — |
| 129 |
| 124 |
| 126 |
| 128 |
|
|
|
|
|
|
| ||||||||
Median |
| $ | 130 |
| $ | 129 |
| $ | 125 |
| $ | 128 |
| $ | 130 |
| $ | 130 |
| $ | 130 |
| $ | 725 |
|
Management Case |
| $ | 154 |
| $ | 129 |
|
| �� | $ | 143 |
| $ | 151 |
| $ | 154 |
| $ | 145 |
| $ | 130 |
| |
Team Case |
| $ | 138 |
| $ | 129 |
| $ | 133 |
| $ | 135 |
| $ | 138 |
| $ | 107 |
| $ | 83 |
| $ | 58 |
|
Selected Comments:
• Deutsche Bank: Is currently in Phase III trials (2100 patients), with an interim safety and futility analysis by the Data Monitoring Board expected in 2H05 and expected to complete patient enrollment in YE06
• SmithBarney: Proleukin sales totaled $31.7 million for the quarter, lower than our forecasts of $35.8 million, due to the decrease in patient demand in the U.S as a result of increased competition. Nevada indicated it implemented a price increase of 3% as of June 2005. We have revised our Proleukin sales estimates to $125 million from $129 million for fiscal 2005
62
Broker Views on Selected Products: Pulminiq
($ in millions)
|
| Peak |
| Annual Estimated Sales |
| |||||||||||||||||||
Broker |
| Sales |
| 2004A |
| 2005E |
| 2006E |
| 2007E |
| 2008E |
| 2009E |
| 2010E |
| |||||||
CSFB |
| — |
| — |
| — |
| — |
| — |
| — |
| — |
| — |
| |||||||
Morgan Stanley |
| — |
| — |
| — |
| — |
| — |
| — |
| — |
| — |
| |||||||
SG Cowen |
| — |
| — |
| — |
| 25 |
| 40 |
| 60 |
| 70 |
| 80 |
| |||||||
Smith Barney (Citi) |
| $40-75 |
| — |
| — |
| — |
| — |
| — |
| — |
| — |
| |||||||
Median |
| — |
| — |
| — |
| — |
| — |
| — |
| — |
| — |
| |||||||
Management Case |
|
|
| $ | 0 |
| $ | 0 |
| $ | 21 |
| $ | 65 |
| $ | 103 |
| $ | 119 |
| $ | 123 |
|
Team Case |
| $0 |
| $ | 0 |
| $ | 0 |
| $ | 0 |
| $ | 0 |
| $ | 0 |
| $ | 0 |
| $ | 0 |
|
Selected Comments:
• CSFB: We do not include PULMINIQ in our CHIR operating model. If approved, we view lung transplant as a tiny market opportunity
• Deutsche Bank: Following FDA’s determination that additional clinical data would be required for approval, is the subject of ongoing internal research discussions. We believe management will likely conduct a feasibility and cost analysis before embarking on further clinical trials
• SmithBarney: We believe Nevada is proceeding cautiously due to the relatively small market opportunity for this product (~$40 million to $75 million), and we await a further update in the near-term. We expect Nevada may meet with the FDA again before making a final decision on Pulminiq’s future. We have yet to include any sales of Pulminiq in our financial model
63
Appendix B: Nevada Capital Structure
64
Nevada Balance Sheet
($ in millions)
|
| (Unaudited)(1) |
|
|
| ||
|
| 30-Sep-05 |
| 31-Dec-04 |
| ||
Current Assets: |
|
|
|
|
| ||
Cash and Cash Equivalents |
| $ | 580.1 |
| $ | 603.6 |
|
Accounts Receivable |
| 383.9 |
| 402.1 |
| ||
Inventories |
| 268.6 |
| 221.2 |
| ||
Current Net Deferred Income Tax Asset |
|
|
| 71.3 |
| ||
Derivative Financial Intruments |
|
|
| 5.0 |
| ||
Other Current Assets |
| 209.5 |
| 90.9 |
| ||
Total Current Assets |
| 1,442.1 |
| 1,394.0 |
| ||
|
|
|
|
|
| ||
Non-current Investments |
| 437.7 |
| 409.4 |
| ||
PP&E, net |
| 824.1 |
| 799.4 |
| ||
Purchased Technologies, net |
|
|
| 216.0 |
| ||
Goodwill |
|
|
| 861.4 |
| ||
Other Intangible Assets, net |
|
|
| 457.7 |
| ||
Investments in Equity Securities |
|
|
| 101.0 |
| ||
Non-current Notes Receivable |
|
|
| 7.5 |
| ||
Other Current and Non-Current Assets |
| 1,512.9 |
| 59.1 |
| ||
|
|
|
|
|
| ||
Total Non-Current Assets |
| 2,337.0 |
| 2,502.0 |
| ||
|
|
|
|
|
| ||
Total Assets |
| $ | 4,216.8 |
| $ | 4,305.5 |
|
|
| (Unaudited)(1) |
|
|
| ||
|
| 30-Sep-05 |
| 31-Dec-04 |
| ||
Current Liabilities: |
|
|
|
|
| ||
Accounts Payable |
|
|
| $ | 129.9 |
| |
Accrued Expenses |
|
|
| 79.1 |
| ||
Current Portion of Long-term Debt |
|
|
| 2.7 |
| ||
Current Portion of Unearned Revenue |
|
|
| 35.7 |
| ||
Income Taxes Payable |
|
|
| 16.4 |
| ||
Other Current Liabilities |
|
|
| 170.7 |
| ||
Total Current Liabiliities |
| 459.5 |
| 434.4 |
| ||
|
|
|
|
|
| ||
Long-term Debt |
| 1,095.2 |
| 1,093.6 |
| ||
Other Non-Current liabilities |
| 141.4 |
| 175.8 |
| ||
Total Liabilities |
| 1,696.1 |
| 1,703.7 |
| ||
|
|
|
|
|
| ||
Common Stock |
|
|
| 1.9 |
| ||
Additional Paid-in Capital |
|
|
| 2,527.7 |
| ||
Deferred Stock Compensation |
|
|
| (13.8 | ) | ||
Accumulated Deficit & Income, net |
|
|
| 318.6 |
| ||
Treasury Stock |
|
|
| (232.6 | ) | ||
Shareholders Equity |
| 2,520.7 |
| 2,601.8 |
| ||
|
|
|
|
|
| ||
Total Liabilities and Equity |
| $ | 4,216.8 |
| $ | 4,305.5 |
|
(1) Unaudited data per 25-Oct-2005 press release.
65
Analysis of Nevada Debt Instruments
Converts & LYONs(1)
|
|
|
|
|
|
|
|
|
|
|
|
|
| 2 3/4% Convertible |
|
| 1 5/8% Convertible |
|
| LYONs |
|
|
|
|
|
|
|
|
|
|
|
|
|
| • | $385 million |
| • | $500 million |
| • | $80.1 million |
|
Description of |
| • | Coupon of 2.750% |
| • | Coupon of 1.625% |
| • | Coupon of 0.000% |
|
Instrument |
| • | Due June 2034 |
| • | Due August 2033 |
| • | Due June 2031 |
|
|
| • | Conversion Price of $67.00 per Share |
| • | Conversion Price of |
| • | Price at Issue of $55.05 |
|
|
|
|
| $68.44 per Share |
| • | Next Put June 2006 |
| ||
|
| • | Parity at 56.19 |
| • | Parity at 55.01 |
| • | Put Price of $60.80 |
|
|
| • | Trading at 98.50 |
| • | Trading at 97.75 |
| • | Parity at 30.55 |
|
|
|
|
|
|
|
|
| • | Trading at 58.63 |
|
|
|
|
|
|
|
|
|
|
|
|
|
| • | Convert for Shares plus |
| • | Convert for Shares |
| • | Put for accreted value |
|
Treatment of Change |
|
| makewhole |
| • | Put for Par |
|
|
|
|
in Control |
| • | Put for Par plus |
|
|
|
|
|
|
|
|
|
| makewhole |
|
|
|
|
|
|
|
|
|
|
|
|
|
|
|
|
|
|
|
| • | Below $67.00 per share; |
| • | Below $68.44 per share; put for par |
| • | Below $82.56 per share; put for accreted value |
|
Likely Treatment |
|
| put for par plus makewhole |
|
| |||||
|
|
| payment |
|
|
|
|
|
|
|
|
|
|
|
|
|
|
|
|
|
|
|
| • | Put: $385 million |
| • | Put: $500 million |
| • | Put: $47.7 million |
|
Cost to NewCastle at |
| • | Makewhole: $0.5 million |
| • | Total Cost: $500 million |
| • | Total Cost: $47.7million |
|
$45.00 / share |
| • | Total Cost: $400 million |
|
|
|
|
|
|
|
(1) Trading data and parity as of 27-Oct-2005.
66
Appendix C: Key Management & Director Profiles
67
Key Management & Director Profiles
Name |
|
| Experience |
|
Vaughn D. Bryson Director since June 1997 |
| • | 32-year employee of Eli Lilly and Company, where he served as President and Chief Executive Officer (1991 - June 1993), Executive Vice President (1986 – 1991) and a member of the board of directors of Lilly from 1984 until his retirement in 1993 |
|
| ||||
|
| • | Vice Chairman of Vector Securities International, a healthcare focused investment banking firm (April 1994 - December 1996) |
|
|
| • | Director of Ariad Pharmaceuticals, Inc. (February 1995 – May 2003) and Quintiles Transnational Corporation |
|
|
| • | Graduated from the University of North Carolina and remains an active and substantial donor to the university |
|
|
|
|
|
|
J. Richard Fredericks |
| • | Served as United States Ambassador to Switzerland and Liechtenstein from 1999 to 2001 |
|
| • | Currently serves as Chairman of Dionis Capital, a New York based-hedge fund focusing on the financial services industry; a Managing Director of Main Management, a money management firm which invests exclusively in Exchange Traded Funds; and an Entrepreneur in Residence at Weston Presidio, a venture capital firm |
| |
|
|
| ||
|
|
|
| |
|
| • | Joined Montgomery Securities (now Banc of America Securities) as a partner in 1977 and later became Senior Managing Director in Investmet Research, covering the banking and financial services area. In 1995 he changed roles to oversee the firm’s investment banking effort for the financial industry in the areas of commercial banking, thrifts, and financial technology |
|
|
|
|
| |
|
|
|
| |
|
| • | Began his career with Dean Witter in 1970 as a securities analyst and joined Shuman, Agnew and Company five years later as a partner in the same capacity |
|
|
|
|
|
|
Pieter J. Strijkert, M.D. |
| • | Chairman of the Board of Crucell N.V. |
|
| • | Member of the Management Board of Gist-Brocades N.V., a fermentation and pharmaceutical company headquartered in The Netherlands, (1985 – 1995) |
| |
|
|
|
| |
|
| • | Director of Paratek Pharmaceuticals, Inc. (1998 – present); Chairman of the supervisory boards of deVGen N.V. and PamGene B.V. (2000 –2003); Chairman of the supervisory boards of IntroGene (1994 – 2000) and U-BiSys (1998 - 2000) |
|
|
|
|
|
|
Lewis W. Coleman |
| • | President of the Gordon and Betty Moore Foundation in San Francisco, CA, an educational and scientific research foundation |
|
| • | Former Chairman and Executive Committee member of Banc of America Securities, formerly Montgomery Securities (1998 – 2000). Spent 10 years at BankAmerica Corporation in San Francisco where he served as Chief Credit Officer in the wholesale banking division, then Head of Capital Markets, responsible for all trading activity. He also served as Head of the World Banking Group before becoming Bank of America’s Vice Chairman of the Board and Chief Financial Officer |
| |
|
|
|
| |
|
|
|
| |
|
|
|
| |
|
| • | Spent 13 years with Wells Fargo & Co. in wholesale and retail banking; departed as Chairman of the Credit Policy Committee |
|
|
| • | Director of Northrup Grumman Corp |
|
|
| • | Serves on numerous private company and civic boards and is actively involved in community affairs in San Francisco. |
|
|
|
|
|
|
Ed Penhoet, PhD. |
| • | President of the Gordon and Betty Moore Foundation. |
|
| • | Director of Alta Partners since 2000. Helped fund Biovitrum, Eyetech, Metabolex, Renovis, Scynexis and Zymogenetics. |
| |
| • | Former President and Chief Executive Officer of Nevada from the time he co-founded the company in 1981 until April 1998. |
| |
|
| • | For 10 years prior to founding Nevada, Ed was a faculty member of the Biochemistry Department of the University of California, Berkeley. Ed is the immediate past Dean of the School of Public Health at the University of California, Berkeley. He is a member of the Institute of Medicine of the National Academy of Sciences and has co-authored more than 50 scientific articles and papers. Ed earned his A.B. in Biology from Stanford University in 1963 and his Ph.D. in Biochemistry from the University of Washington in 1968. He was a post-doctoral fellow at the University of California, San Diego, from 1968 to 1970. |
|
|
|
|
| |
|
|
|
| |
|
|
|
| |
|
|
|
| |
|
|
|
|
|
Denise M. O’Leary |
| • | General Partner at Menlo Ventures, a private venture capital firm (1987 – 1997) |
|
| • | Director of American West Holdings Corporation and Medtronic, Inc. Previously served on the Board of Directors of ALZA Corporation and Del Monte Foods Company |
| |
|
|
| ||
| • | Trustee of Stanford University and Chair of the Board of Stanford Hospital and Clinics |
| |
| • | A member of the Board of Directors of Lucile Packard Children’s Hospital at Stanford |
|
68