Exhibit 13.1
 |
MARKET FOR UNION BANKSHARE'S COMMON STOCK AND RELATED STOCKHOLDER MATTERS
On March 12, 2012, there were 4,457,204 shares of common stock outstanding held by 637 stockholders of record. The number of stockholders does not reflect the number of beneficial owners, including persons or entities who may hold the stock in nominee or “street name.”
Union Bankshares' common stock is listed on the NASDAQ Global Market trading under the symbol UNB.
| 2011 | 2010 | ||||||||||||||||||||||
| High | Low | Dividends | High | Low | Dividends | ||||||||||||||||||
| First Quarter | $ | 22.39 | $ | 17.95 | $ | 0.25 | $ | 19.82 | $ | 17.00 | $ | 0.25 | |||||||||||
| Second Quarter | $ | 20.00 | $ | 18.80 | $ | 0.25 | $ | 19.00 | $ | 17.44 | $ | 0.25 | |||||||||||
| Third Quarter | $ | 19.99 | $ | 18.75 | $ | 0.25 | $ | 18.48 | $ | 17.40 | $ | 0.25 | |||||||||||
| Fourth Quarter | $ | 19.80 | $ | 18.11 | $ | 0.25 | $ | 18.25 | $ | 17.73 | $ | 0.25 | |||||||||||
On January 18, 2012, the Company declared a regular dividend of $0.25 per share to stockholders of record as of January 28, 2012 payable February 9, 2012.
| The Renovated Railroad Street Office | |
 |
In the fall of 2011 a major refurbishment of the exterior, installation of a ramp providing handicap access and new signage was completed at our Railroad Street, St. Johnsbury office. These improvements were dedicated to the Hovey Family who was very much a part of the former Citizens Savings Bank and Trust Company acquired in 1999 by Union Bankshares.
We are proud to have undertaken this initiative, have received numerous positive comments from the public and recently received the Northeast Kingdom Chamber of Commerce Kingdom Improvement Award.
LETTER TO SHAREHOLDERS
March 30, 2012
Dear Shareholders,
We experienced another successful year and increased our total assets by $100 million, added three branch offices and increased our sold but serviced loan portfolio to over $208 million. More on these achievements are included in this year's annual report and below.
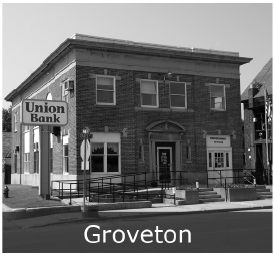
On May 27, 2011 we completed the acquisition of the three Northway Bank branches located in Littleton, Groveton and North Woodstock, NH. This transaction added over $67 million to our balance sheet, 18 new staff members and thousands of new customers. The transition to Union for the employees and customers of Northway went very well and we are experiencing the positive benefits of this transaction.
Interest rates continue at historic lows which has kept us very busy as the refinancing of residential mortgages has not subsided. During the year we originated and sold over $80 million in residential mortgage loans. As this portfolio increases so do the servicing fees which reached $500 thousand in 2011.
We have also experienced an increase, in the latter part of 2011 and into 2012, in residential lending for home purchases and construction loan transactions. This appears to be in all our markets and is perhaps a sign the economy is improving.
During 2011, and for the next three to five years, we will be implementing new procedures, policies, disclosures and activities designed to comply with the myriad of new regulations Congress and the regulators have deemed necessary. There is no doubt our costs for regulatory compliance and rule implementation will increase and we have taken the necessary steps and made the commitment to full compliance. There is however an opportunity for those community banks who “get it right” to grow their franchises in the face of these challenges.
During the past year, we have been transitioning the duties of chief executive officer to David Silverman. This will be completed immediately following this year's annual meeting on May 16th. Ken Gibbons will be retiring from the Company after 21 years as CEO and will remain as Chairman of the Board. David Silverman will add the CEO responsibilities to his current duties as President at that time. This transition has gone very smoothly as the Company continues its strong financial performance, community support and leadership in 2012 and the years to come.
We want to express our sincere appreciation and gratitude to our shareholders, customers and employees. Your investment, business and diligent efforts during the past year again contributed to the growth and strength of Union Bank. Thank you!
Sincerely,
 | |
| Kenneth D. Gibbons | |
| Chairman & Chief Executive Officer | |
 | |
| David S. Silverman | |
| President | |
Union Bankshares, Inc.1
Union Bankshares, Inc. Board of Directors
Cynthia D. Borck Owner Consulting Services Information |  |  | ||
Steven J. Bourgeois CEO Strategic Initiatives for Business LLC | ||||
Kenneth D. Gibbons Chairman and CEO Union Bankshares, Inc. and Union Bank |  |  | ||
Timothy W. Sargent Attorney/Owner Sargent Law Office | ||||
John H. Steel Founder Steel Construction |  |  | ||
David S. Silverman President Union Bankshares, Inc. and Union Bank | ||||
Schuyler W. Sweet Owner Stony River Properties, LLC |  |  | ||
Neil J. Van Dyke President Golden Eagle Resort | ||||
Union Bankshares, Inc.2
SHAREHOLDER ASSISTANCE & INVESTOR INFORMATION
If you need assistance with a change in registration of certificates, combining your certificates into one, reporting lost certificates, non-receipt or loss of dividend checks, assistance regarding direct deposit of dividends, information about the Company, or to receive copies of financial reports, please contact either:
| JoAnn A. Tallman, Assistant Secretary | Registrar & Transfer Company | |||
| Union Bankshares, Inc. | Attn: Stock Transfer Department | |||
| P.O. Box 667 | 10 Commerce Drive | |||
| Morrisville, VT 05661-0667 | Cranford, NJ 07016 | |||
| Phone: | 802-888-6600 | Phone: | 1-800-368-5948 | |
| Fax: | 802-888-4921 | Fax: | 1-908-497-2318 | |
| Email: | ubexec@unionbankvt.com | E-mail: | info@rtco.com | |
NASDAQ Stock Market Ticker Symbol: UNB
Corporate Name: Union Bankshares, Inc.
To view additional information about the Company or to receive alerts when public filings are posted, please view the Investor Relations page at www.unionbankvt.com.
Union Bankshares, Inc., operates as a one bank holding company for Union Bank, which provides commercial, municipal, trust and retail banking services in northern Vermont and northwestern New Hampshire. As of December 31, 2011, the company operated 13 community banking locations in Lamoille, Caledonia and Franklin counties of Vermont; four community banking locations in Grafton and Coös counties of New Hampshire; and one loan center in South Burlington, (Chittenden County), Vermont; as well as 34 ATMs throughout northern Vermont and northwestern New Hampshire. Union Bank was founded in 1891 in Morrisville, Vermont, where the Bank’s and holding company headquarters are located.
Union Bank promotes personal service and banking expertise within the communities it serves, with a focus on small- to middle-market businesses, local municipalities, non-profits, retail and trust customers. To leverage its local expertise, Union Bank continues to enhance its niche capabilities and focuses on expanding to additional neighboring communities.
Union Bankshares, through Union Bank, is committed to the communities it serves, and encourages employee participation in community events and charitable services. The Company views small businesses as foundations for thriving local economies; these businesses provide jobs, attract other businesses and create wealth. Currently, Union Bank employs 180 people, many of whom are leaders in community organizations throughout the Bank’s service area.
| • | Union Bankshares’ growing asset base of over $552 million provides the financial strength to successfully serve its constituents |
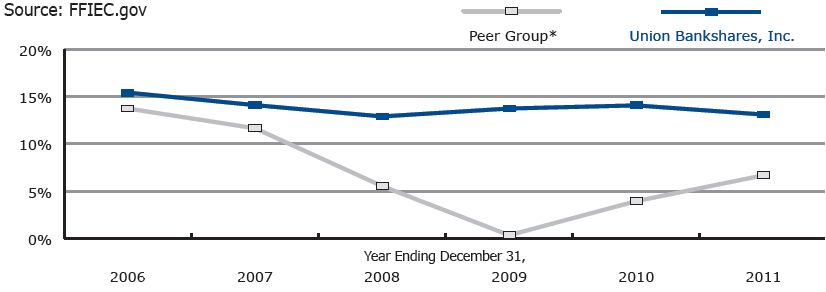
| • | The Company reported a Return on Average Equity of 12.33% or greater and a Return on Average Assets of 1.04% or greater for each of the last five years |
| • | Union Bank has scored an "Outstanding" rating on ALL its CRA (Community Reinvestment Act) examinations since 1995 |
| • | Union Bank has been an SBA "Preferred Lender" since 1987 |
Union Bankshares, Inc.3
SELECTED FINANCIAL DATA
| At or For The Years Ended December 31 | |||||||||||||||
| 2011 | 2010 | 2009 | 2008 | 2007 | |||||||||||
| (Dollars in thousands, except per share data) | |||||||||||||||
| Balance Sheet Data | |||||||||||||||
| Total assets | $ | 552,751 | $ | 452,995 | $ | 447,522 | $ | 440,104 | $ | 393,264 | |||||
| Investment securities | 46,954 | 24,280 | 24,649 | 27,834 | 33,822 | ||||||||||
| Loans, net of unearned income | 429,384 | 382,071 | 358,167 | 353,310 | 318,194 | ||||||||||
| Allowance for loan losses | (4,226 | ) | (3,755 | ) | (3,493 | ) | (3,556 | ) | (3,378 | ) | |||||
| Deposits | 473,439 | 376,660 | 368,827 | 364,370 | 323,961 | ||||||||||
| Borrowed funds | 29,015 | 28,986 | 30,993 | 27,416 | 20,328 | ||||||||||
| Stockholders' equity (1) | 40,339 | 41,725 | 41,180 | 39,150 | 42,074 | ||||||||||
| Income Statement Data | |||||||||||||||
| Total interest income | $ | 23,669 | $ | 22,907 | $ | 23,217 | $ | 24,721 | $ | 26,273 | |||||
| Total interest expense | (3,908 | ) | (4,117 | ) | (5,294 | ) | (7,177 | ) | (8,228 | ) | |||||
| Net interest and dividend income | 19,761 | 18,790 | 17,923 | 17,544 | 18,045 | ||||||||||
| Provision for loan losses | (775 | ) | (520 | ) | (400 | ) | (335 | ) | (265 | ) | |||||
| Noninterest income | 7,125 | 5,649 | 5,521 | 4,329 | 4,249 | ||||||||||
| Noninterest expenses | (19,773 | ) | (16,630 | ) | (16,397 | ) | (15,412 | ) | (14,409 | ) | |||||
| Income before provision for income taxes | 6,338 | 7,289 | 6,647 | 6,126 | 7,620 | ||||||||||
| Provision for income taxes | (1,119 | ) | (1,702 | ) | (1,420 | ) | (1,020 | ) | (1,965 | ) | |||||
| Net income | $ | 5,219 | $ | 5,587 | $ | 5,227 | $ | 5,106 | $ | 5,655 | |||||
| Per Common Share Data | |||||||||||||||
| Net income (2) | $ | 1.17 | $ | 1.25 | $ | 1.17 | $ | 1.14 | $ | 1.25 | |||||
| Cash dividends paid | 1.00 | 1.00 | 1.00 | 1.12 | 1.12 | ||||||||||
| Book value (1) | 9.05 | 9.36 | 9.23 | 8.75 | 9.34 | ||||||||||
| Weighted average number of shares outstanding | 4,456,842 | 4,458,193 | 4,466,760 | 4,488,888 | 4,521,380 | ||||||||||
| Number of shares outstanding | 4,457,204 | 4,455,704 | 4,461,208 | 4,474,598 | 4,502,969 | ||||||||||
| (1) | Stockholders' equity includes unrealized gains or losses, net of applicable income taxes, on investment securities classified as “available-for-sale” and the unfunded liability for pension benefits, net of taxes for the defined benefit pension plan. |
| (2) | Computed using the weighted average number of shares outstanding for the period. |
Union Bankshares, Inc.4
Key Financial Indicators
| Return on Average Equity | ||
 | ||
| Return on Average Assets | ||
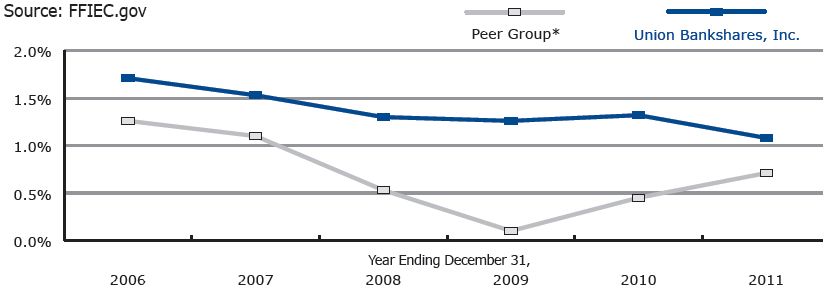 | ||
| *Peer Group is "All US Banks with $300M-$1B in Assets" (approximately 1,170 banks) | ||
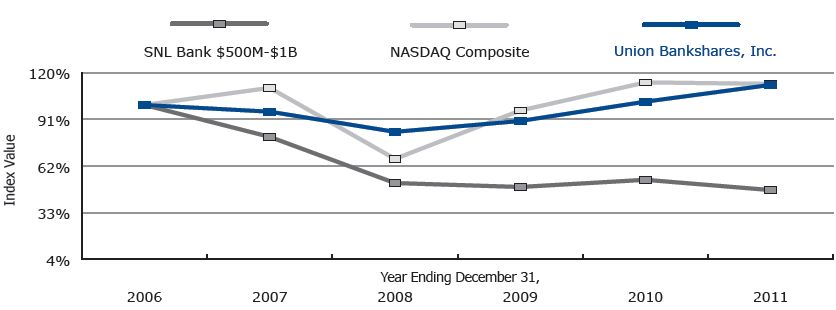
| Total Return Performance | ||
| Source: SNL Financial LC | ||
 | ||
Union Bankshares, Inc.5
Working Together
| A Memorable Memorial Day | |
This story begins well before Memorial Day, 2011. It begins with our long-term plans and the desire to grow our footprint through acquisition. Setting our sights on New Hampshire made good sense based on our geographic reach, our personal knowledge of the area and familiarity with the business climate. At the same time, Northway Bank decided since they did not have a strong branch presence in an adjacent or nearby market to the Littleton, Groveton and North Woodstock branches, those customers might be well served if their banking needs were met by another community bank-particularly one that had a presence in adjacent markets. Northway selected Union Bank as they knew Union had the resources, market knowledge and presence, and were very committed to making banking a great experience for their customers.
Northway and Union Bank have philosophies and systems in common. We both make the customer and community priority one. Our product lines, though not exact, are similar; we use the same vendor for our Information Technology (IT) platforms; we share a commitment to tight security. The Banks worked together to negotiate a fair transaction to transfer the Littleton, North Woodstock and Groveton branches from Northway.
A key component of the evaluation process to purchase was a thorough review of the loan portfolio. A hands-on process known as due diligence entailed a panel of lenders driving to Northway's operation center and reading through a significant sampling of the loan portfolio. An analysis was prepared and the decision was made to move forward with the purchase.
Another element of the decision was assessing the physical properties. Site surveys and building inspections had to precede a final purchase decision. It was determined that the properties were sound, and we set about learning the building systems. Vendors were chosen for the utilities: heat, electric, landscaping and plowing to name just a few. Facilities worked closely with IT to ensure our systems would be amply supported.
Purchasing three bank branches and bringing them online is no small feat. The intricacies of the negotiations, the laying out of the welcome mat, the importing of the accounts, the change out of physical mate-rials, the turning of the switch from one system to another and a myriad other details need to be anticipated, managed and tended to. Both banks worked diligently to delineate every facet of the transaction.
Welcome to the Union Bank Family!
A dinner with the soon-to-be new employees turned into a fun, informal way to meet each other. We wanted to let these employees know what they could expect from us and start to prove to them that Union Bank is committed to them, to their success and to our success in the area. Simply put, we wanted them to know that they could place their confidence in us as we would be placing our confidence in them.
Reaching out to staff was quickly followed by reaching out to those customers whose accounts we would be acquiring. Starting three months prior, our key lenders spent two to three days each week meeting with business owners. They saw these meetings as an opportunity to start forging solid relationships, to learn more about the needs, concerns and hopes of the local business people. It was imperative to everyone that the customers enjoyed a seamless transition and Northway was right there helping to make the introductions and smoothing the way. To that end, systems such as electronic banking and merchant services were tested and retested to ensure that our commercial customers would experience a smooth transition.
At the branch level, a host of branch personnel worked on making the retail customers transition seamless as well. The customers quickly saw that they were in good hands-and that the good hands they were in were the very same hands that helped them when the name on the door was Northway.
Union Bankshares, Inc.6
Behind the Scenes!
Deposit operations and loan servicing had the job of converting each Northway deposit and loan account (business and personal) to our account offering. Our security manager oversaw the security aspects of the transaction. That includes the online security, the facility security as well as security training for all the new personnel. Every Bank handles security slightly differently, but the changes were minimal.
As the three-day conversion weekend drew closer, schedules were created for the transition of each branch. Everything had to transition on this weekend. These three days were the culmination of months of preparation. Bank signs were swapped out. ATMs were converted. Cash was counted and verified, submitted to accounting at both banks and signed off on. Furniture was moved. Office supplies were stocked, phone and data lines were switched, oil and gas tanks were prorated, trucks were emptied, problems were solved and cheers were heard. Come end of day Monday, the orchestration of the vendors, trucks, cranes, handcarts, boxes, people, software and accounting was flawless.
We are thankful to our friends at Northway who worked together with us to make the outcome of the transition smooth, pleasant and positive.
 |  |  | ||
| Making a Difference | |
Our employees are not new to the notion of community service, giving countless hours of their expertise and time. With the challenges of small town life and hard economic times, our local communities are critically dependent upon their involvement. From fundraising for cancer patients to celebrating the home-town, community is simply who they are.
The following organizations illustrate just some of the ways our employees touch lives and make a difference in the communities we serve.
March of Dimes: Union Bank has supported the March of Dimes' efforts since 1975 to help moms have full-term pregnancies and research the problems that threaten the health of babies. The annual March for Babies is one of several fundraisers that the Bank participates in to help with March of Dimes' mission. Barbara Olden, St. Johnsbury Branch Manager and Champion for the March of Dimes, has been involved for 21 years. She often serves as Team Captain for the Bank's Walking Team. Melissa Greene, Hardwick Branch Manager, helps coordinate the sale of March of Dimes Bean Bags for babies in our branches throughout the year.
Union Bankshares, Inc.7
LACiNg Up for Cancer: A diagnosis of cancer brings financial burdens well beyond the scope of health insurance. LACiNg Up for Cancer was designed to help assist Lamoille area residents facing these financial challenges. Funds are used for a variety of needs generated by the disease beyond treatment including rent and gas for traveling to treatments. Deb Partlow, Senior Trust Officer, is the Event Champion within the Bank. Many other employees participate by walking on the Union Bank Team to raise funds and giving personally as well. The Bank itself serves as a Corporate Sponsor.
United Way: Lorraine Willet, Training Manager, champions the United Way efforts within Union Bank. She is the current President of the local United Way Board and has been involved for over nine years. Passionate about the difference the United Way makes, Lorraine sees even greater importance in its work with today's economy. Last year the United Way contributed to the efforts of various organizations working towards more affordable housing and ensuring that people in need have enough to eat and can heat their homes.
This is just a sampling of the many ways that our employees step up to make a difference. We all benefit from their exemplary dedication to our community and our collective quality of life.
| 'Ken Do' Attitudes | |
At the annual meeting, the position of CEO of both Union Bankshares and Union Bank will transfer from Ken Gibbons to David Silverman. Ken will remain Chairman of both Companies' Boards, his wisdom never more than a phone call away. We are excited for Ken as he embarks on what we know will be a very active retirement. He leaves us ready for the transition for many reasons, just some of which are captured below.
Robyn Masi, our Branch Manager in Stowe, has worked with Ken for nearly 20 years. Robyn had this to say about her growth through the organization:
"Not only has he been a great role model, but a wonderful mentor for me. I had the pleasure to work directly under him for a brief time, and the knowledge I gained during that time was tremendous. He has taken the time, many times, to meet with me and teach me about different parts of the banking world. Without his leadership and guidance, I know I would not be where I am today. He will be greatly missed and I will never forget the valuable lessons he has taught me, both personally and professionally, as I have "grown up" with Union Bank."
Chris Latulip has been with Union Bank since 2010. She is the Regional Vice President for our New Hampshire territory. Chris saw first-hand how important it is to be accessible.
"Ken knew it was better to develop a team around him than to manage from the top down. He shows so much respect for everyone at Union Bank, and he takes the time to genuinely thank us. We have confidence in what we do, because Ken has taught us that without each and everyone of us, Union Bank couldn't be what it is today. It is important to Ken to have an open door policy; to know his staff, to be abreast of what is happening, but in a quiet way. My management style is a reflection of that model."
Tracey Holbrook is our Regional Vice President for northeastern Vermont. She began her career with us just out of college when she took a part-time teller position.
"I am a stronger person because of Ken. He has never let me, or anyone else, take the easy route. He makes us work hard and then raises the bar. I have learned that satisfactory is not good enough. At the same time, Ken has never left us to reach our goals alone. He has always been right there, guiding, pushing and helping us get to the next level... and the next."
Union Bankshares, Inc.8
As our CFO since 1989, Marsha Mongeon has a long history of working with Ken on a daily basis. Ken has taught her to see the people beyond the numbers.
"Ken has taught me that the first responsibility is to the shareholders. I used to look at numbers in a vacuum, but now I step back and ask myself 'what is best for our shareholders?' And equally as important is how Union Bank is perceived in the community. Ken has demonstrated that it's pitching in that matters. It doesn't matter if the job is heading a fund drive or flipping the burgers. What's important is getting involved and sharing your talents."
We also asked some community members if they would share their thoughts on Ken.
Melvyn Patashnick, CEO, Copley Health Systems, Inc.
"Ken cares about our community; he demonstrates it regularly with both his personal and professional actions. After many years as a trustee of the hospital, Ken continues to serve as a community member on several hospital committees. He has been instrumental in ensuring the long-term fiscal health of our community hospital. We count on Ken's solid advice and valuable perspective to fulfill our mission of promoting wellness and providing access to health care services regardless of ability to pay."
Darcy Carter, District Director, SBA Vermont District Office
"When I think of the qualities that make a great colleague and a true professional with a legacy, I think this is a person that I trust will tell me the truth and who will ask the truth of me. This person will have reasoning and principle behind decisions and will follow through on commitments. This person will be skilled and wise from experience, and ready to share knowledge, successes and failures, with the broader community. This is a familiar face I cross the room to see at events, who is ready with candid insights and who genuinely enjoys doing business together in Vermont. We wish Ken the very best and thank him for his great partnership over the years."
David Silverman sums it up for all of us:
"Though Ken will be leaving the day-to-day banking business behind, his imprint on the Company will last for years to come through the staff he has had a hand in recruiting, encouraging and mentoring. Many of us have learned valuable lessons from Ken as he has instilled a strong work ethic, desire to achieve and professional integrity throughout our ranks. We are grateful to Ken for developing a strong team as his legacy, one that is prepared to meet the future challenges and opportunities we will face together."
Union Bankshares, Inc.9
 | |
REPORT OF INDEPENDENT REGISTERED PUBLIC ACCOUNTING FIRM
The Board of Directors and Shareholders
Union Bankshares, Inc. and Subsidiary
We have audited the accompanying consolidated balance sheets of Union Bankshares, Inc. and Subsidiary (the Company) as of December 31, 2011 and 2010, and the related consolidated statements of income, changes in stockholders' equity, and cash flows for the years then ended. These consolidated financial statements are the responsibility of the Company's management. Our responsibility is to express an opinion on these consolidated financial statements based on our audits.
We conducted our audits in accordance with standards of the Public Company Accounting Oversight Board (United States). Those standards require that we plan and perform the audit to obtain reasonable assurance about whether the financial statements are free of material misstatement. The Company is not required to have, nor were we engaged to perform, an audit of its internal control over financial reporting. Our audits included consideration of internal control over financial reporting as a basis for designing audit procedures that are appropriate in the circumstances, but not for the purpose of expressing an opinion on the effectiveness of the Company's internal control over financial reporting. Accordingly, we express no such opinion. An audit includes examining, on a test basis, evidence supporting the amounts and disclosures in the financial statements. An audit also includes assessing the accounting principles used and significant estimates made by management, as well as evaluating the overall financial statement presentation. We believe that our audits provide a reasonable basis for our opinion.
In our opinion, the consolidated financial statements referred to above present fairly, in all material respects, the consolidated financial position of Union Bankshares, Inc. and Subsidiary as of December 31, 2011 and 2010, and the consolidated results of their operations and their consolidated cash flows for the years then ended, in conformity with accounting principles generally accepted in the United States of America.
 | |
Portland, Maine
March 28, 2012
Vermont Registration No. 92-0000278
 | ||
Union Bankshares, Inc.10
UNION BANKSHARES, INC. AND SUBSIDIARY
CONSOLIDATED BALANCE SHEETS
December 31, 2011 and 2010
| 2011 | 2010 | |||||
| Assets | (Dollars in thousands) | |||||
| Cash and due from banks | $ | 5,871 | $ | 5,447 | ||
| Federal funds sold and overnight deposits | 18,510 | 8,845 | ||||
| Cash and cash equivalents | 24,381 | 14,292 | ||||
| Interest bearing deposits in banks | 24,020 | 14,041 | ||||
| Investment securities available-for-sale | 42,954 | 23,780 | ||||
Investment securities held-to-maturity (fair value $4.0 million and $502 thousand at December 31, 2011 and December 31, 2010, respectively) | 4,000 | 500 | ||||
| Loans held for sale | 4,888 | 5,611 | ||||
| Loans | 424,319 | 376,272 | ||||
| Allowance for loan losses | (4,226 | ) | (3,755 | ) | ||
| Net deferred loan costs | 177 | 188 | ||||
| Net loans | 420,270 | 372,705 | ||||
| Accrued interest receivable | 1,810 | 1,560 | ||||
| Premises and equipment, net | 9,163 | 7,842 | ||||
| Core deposit intangible | 1,608 | — | ||||
| Goodwill | 2,223 | — | ||||
| Investment in real estate limited partnerships | 4,473 | 2,344 | ||||
| Company-owned life insurance | 3,676 | 1,569 | ||||
| Other assets | 9,285 | 8,751 | ||||
| Total assets | $ | 552,751 | $ | 452,995 | ||
| Liabilities and Stockholders’ Equity | ||||||
| Liabilities | ||||||
| Deposits | ||||||
| Noninterest bearing | $ | 76,656 | $ | 64,526 | ||
| Interest bearing | 239,058 | 180,386 | ||||
| Time | 157,725 | 131,748 | ||||
| Total deposits | 473,439 | 376,660 | ||||
| Borrowed funds | 29,015 | 28,986 | ||||
| Liability for defined benefit pension plan | 5,679 | 2,451 | ||||
| Accrued interest and other liabilities | 4,279 | 3,173 | ||||
| Total liabilities | 512,412 | 411,270 | ||||
| Commitments and Contingencies (Notes 8,15,16,17,18 and 21) | ||||||
| Stockholders’ Equity | ||||||
Common stock, $2.00 par value; 7,500,000 shares authorized; 4,923,286 shares issued at December 31, 2011 and 4,921,786 shares issued at December 31, 2010 | 9,847 | 9,844 | ||||
| Additional-paid-in capital | 276 | 244 | ||||
| Retained earnings | 38,385 | 37,623 | ||||
Treasury stock at cost; 466,082 shares at December 31, 2011 and December 31, 2010 | (3,823 | ) | (3,823 | ) | ||
| Accumulated other comprehensive loss | (4,346 | ) | (2,163 | ) | ||
| Total stockholders' equity | 40,339 | 41,725 | ||||
| Total liabilities and stockholders' equity | $ | 552,751 | $ | 452,995 | ||
See accompanying notes to consolidated financial statements.
Union Bankshares, Inc.11
UNION BANKSHARES, INC. AND SUBSIDIARY
CONSOLIDATED STATEMENTS OF INCOME
Years Ended December 31, 2011 and 2010
| 2011 | 2010 | |||||
| Interest income | (Dollars in thousands except per share data) | |||||
| Interest and fees on loans | $ | 22,269 | $ | 21,462 | ||
| Interest on debt securities: | ||||||
| Taxable | 716 | 710 | ||||
| Tax exempt | 326 | 298 | ||||
| Dividends | 15 | 4 | ||||
| Interest on federal funds sold and overnight deposits | 34 | 22 | ||||
| Interest on interest bearing deposits in banks | 309 | 411 | ||||
| Total interest income | 23,669 | 22,907 | ||||
| Interest expense | ||||||
| Interest on deposits | 2,825 | 2,977 | ||||
| Interest on short-term borrowed funds | 18 | 18 | ||||
| Interest on long-term debt | 1,065 | 1,122 | ||||
| Total interest expense | 3,908 | 4,117 | ||||
Net interest income | 19,761 | 18,790 | ||||
| Provision for loan losses | 775 | 520 | ||||
Net interest income after provision for loan losses | 18,986 | 18,270 | ||||
| Noninterest income | ||||||
| Trust income | 557 | 490 | ||||
| Service fees | 4,367 | 4,028 | ||||
| Net gains on sales of investment securities available-for-sale | 183 | 98 | ||||
| Net gains on sales of loans held for sale | 1,566 | 736 | ||||
| Other income | 452 | 297 | ||||
| Total noninterest income | 7,125 | 5,649 | ||||
| Noninterest expenses | ||||||
| Salaries and wages | 7,743 | 6,559 | ||||
| Pension and other employee benefits | 3,153 | 2,828 | ||||
| Occupancy expense, net | 1,121 | 937 | ||||
| Equipment expense | 1,220 | 1,057 | ||||
| ATM and debit card expense | 613 | 447 | ||||
| Communications | 363 | 261 | ||||
| Advertising and public relations | 466 | 283 | ||||
| Vermont franchise tax | 429 | 414 | ||||
| FDIC insurance assessment | 376 | 499 | ||||
| Equity in losses of limited partnerships | 515 | 426 | ||||
| Branch acquisition expenses | 407 | 13 | ||||
| Other expenses | 3,367 | 2,906 | ||||
| Total noninterest expenses | 19,773 | 16,630 | ||||
Income before provision for income taxes | 6,338 | 7,289 | ||||
| Provision for income taxes | 1,119 | 1,702 | ||||
Net income | $ | 5,219 | $ | 5,587 | ||
| Earnings per common share | $ | 1.17 | $ | 1.25 | ||
| Dividends per common share | $ | 1.00 | $ | 1.00 | ||
See accompanying notes to consolidated financial statements.
Union Bankshares, Inc.12
UNION BANKSHARES, INC. AND SUBSIDIARY
CONSOLIDATED STATEMENTS OF CHANGES IN STOCKHOLDERS' EQUITY
Years Ended December 31, 2011 and 2010
| Common Stock | ||||||||||||||||||||
Shares, net of treasury | Amount | Additional paid-in capital | Retained earnings | Treasury stock | Accumulated other comprehensive loss | Total stockholders’ equity | ||||||||||||||
| (Dollars in thousands) | ||||||||||||||||||||
| Balances, December 31, 2009 | 4,461,208 | $ | 9,844 | $ | 219 | $ | 36,494 | $ | (3,724 | ) | $ | (1,653 | ) | $ | 41,180 | |||||
| Comprehensive income: | ||||||||||||||||||||
| Net income | — | — | — | 5,587 | — | — | 5,587 | |||||||||||||
Other comprehensive loss, net of tax: | ||||||||||||||||||||
Change in net unrealized gain on investment securities available-for-sale, net of reclassification adjustment and tax effects | — | — | — | — | — | (184 | ) | (184 | ) | |||||||||||
Change in net unrealized loss on unfunded defined benefit pension plan liability, net of reclassification adjustment and tax effects | — | — | — | — | — | (326 | ) | (326 | ) | |||||||||||
Total other comprehensive loss | (510 | ) | ||||||||||||||||||
| Total comprehensive income | 5,077 | |||||||||||||||||||
Cash dividends declared ($1.00 per share) | — | — | — | (4,458 | ) | — | — | (4,458 | ) | |||||||||||
Stock based compensation expense | — | — | 25 | — | — | — | 25 | |||||||||||||
| Purchase of treasury stock | (5,504 | ) | — | — | — | (99 | ) | — | (99 | ) | ||||||||||
| Balances, December 31, 2010 | 4,455,704 | 9,844 | 244 | 37,623 | (3,823 | ) | (2,163 | ) | 41,725 | |||||||||||
| Comprehensive income: | ||||||||||||||||||||
| Net income | — | — | — | 5,219 | — | — | 5,219 | |||||||||||||
Other comprehensive income (loss), net of tax: | ||||||||||||||||||||
Change in net unrealized gain on investment securities available-for-sale, net of reclassification adjustment and tax effects | — | — | — | — | — | 718 | 718 | |||||||||||||
Change in net unrealized loss on unfunded defined benefit plan liability, net of reclassification adjustment and tax effects | — | — | — | — | — | (2,901 | ) | (2,901 | ) | |||||||||||
Total other comprehensive loss | (2,183 | ) | ||||||||||||||||||
| Total comprehensive income | 3,036 | |||||||||||||||||||
| Issuance of common stock | 1,500 | 3 | 23 | — | — | — | 26 | |||||||||||||
Cash dividends declared ($1.00 per share) | — | — | — | (4,457 | ) | — | — | (4,457 | ) | |||||||||||
| Stock based compensation expense | — | — | 9 | — | — | — | 9 | |||||||||||||
| Balances, December 31, 2011 | 4,457,204 | $ | 9,847 | $ | 276 | $ | 38,385 | $ | (3,823 | ) | $ | (4,346 | ) | $ | 40,339 | |||||
See accompanying notes to consolidated financial statements.
Union Bankshares, Inc.13
UNION BANKSHARES, INC. AND SUBSIDIARY
CONSOLIDATED STATEMENTS OF CASH FLOWS
Years Ended December 31, 2011 and 2010
| 2011 | 2010 | |||||
| (Dollars in thousands) | ||||||
| Cash Flows From Operating Activities | ||||||
| Net income | $ | 5,219 | $ | 5,587 | ||
| Adjustments to reconcile net income to net cash provided by operating activities: | ||||||
| Depreciation | 692 | 660 | ||||
| Provision for loan losses | 775 | 520 | ||||
| Deferred income tax provision (benefit) | 595 | (96 | ) | |||
| Net amortization of investment securities | 63 | 25 | ||||
| Equity in losses of limited partnerships | 515 | 426 | ||||
| Stock based compensation expense | 9 | 25 | ||||
| Net decrease (increase) in unamortized loan costs | 11 | (111 | ) | |||
| Proceeds from sales of loans held for sale | 81,939 | 53,399 | ||||
| Origination of loans held for sale | (79,650 | ) | (49,011 | ) | ||
| Net gains on sales of loans held for sale | (1,566 | ) | (736 | ) | ||
| Net losses on disposals of premises and equipment | 1 | 6 | ||||
| Net gains on sale of investment securities available-for-sale | (183 | ) | (98 | ) | ||
| Net gains on sales of repossessed property | (4 | ) | — | |||
| Write-downs of impaired assets | 278 | 9 | ||||
| Net gains on sales of other real estate owned | (133 | ) | (38 | ) | ||
| (Increase) decrease in accrued interest receivable | (53 | ) | 74 | |||
| Amortization of core deposit intangible | 100 | — | ||||
| (Increase) decrease in other assets | (150 | ) | 738 | |||
| Contribution to defined benefit pension plan | (2,000 | ) | (1,250 | ) | ||
| Increase in other liabilities | 900 | 1,128 | ||||
| Net cash provided by operating activities | 7,358 | 11,257 | ||||
| Cash Flows From Investing Activities | ||||||
| Interest bearing deposits in banks | ||||||
| Proceeds from maturities and redemptions | 7,985 | 18,543 | ||||
| Purchases | (17,964 | ) | (9,609 | ) | ||
| Investment securities held-to-maturity | ||||||
| Proceeds from maturities, calls and paydowns | 2,000 | 1,500 | ||||
| Purchases | (5,500 | ) | (2,000 | ) | ||
| Investment securities available-for-sale | ||||||
| Proceeds from sales | 2,326 | 1,097 | ||||
| Proceeds from maturities, calls and paydowns | 11,134 | 11,745 | ||||
| Purchases | (31,426 | ) | (12,180 | ) | ||
| Net increase in loans | (16,055 | ) | (28,895 | ) | ||
| Recoveries of loans charged off | 44 | 57 | ||||
| Purchases of premises and equipment | (1,497 | ) | (896 | ) | ||
| Investments in limited partnerships | (1,752 | ) | (179 | ) | ||
| Purchase of company-owned life insurance | (2,000 | ) | — | |||
| Purchase of nonmarketable equity securities | (54 | ) | — | |||
| Proceeds from sales of other real estate owned | 517 | 422 | ||||
| Proceeds from sales of repossessed property | 4 | 28 | ||||
| Cash acquired, net of cash paid, in branch acquisitions | 29,607 | — | ||||
Net cash used by investing activities | (22,631 | ) | (20,367 | ) | ||
Union Bankshares, Inc.14
| Cash Flows From Financing Activities | ||||||
| Advances of long-term debt | — | 2,978 | ||||
| Repayment of long-term debt | (4,639 | ) | (1,544 | ) | ||
| Net increase (decrease) in short-term borrowings outstanding | 1,444 | (3,440 | ) | |||
| Net increase in noninterest bearing deposits | 8,571 | 4,397 | ||||
| Net increase in interest bearing deposits | 25,160 | 6,386 | ||||
| Net decrease in time deposits | (743 | ) | (2,950 | ) | ||
| Issuance of common stock | 26 | — | ||||
| Purchase of treasury stock | — | (99 | ) | |||
| Dividends paid | (4,457 | ) | (4,458 | ) | ||
| Net cash provided by financing activities | 25,362 | 1,270 | ||||
| Net increase (decrease) in cash and cash equivalents | 10,089 | (7,840 | ) | |||
| Cash and cash equivalents | ||||||
| Beginning of year | 14,292 | 22,132 | ||||
| End of year | $ | 24,381 | $ | 14,292 | ||
| Supplemental Disclosures of Cash Flow Information | ||||||
| Interest paid | $ | 3,942 | $ | 4,285 | ||
| Income taxes paid | $ | 725 | $ | 1,605 | ||
| Supplemental Schedule of Noncash Investing and Financing Activities | ||||||
| Other real estate acquired in settlement of loans | $ | 1,127 | $ | 1,484 | ||
| Other assets acquired in settlement of loans | $ | 40 | $ | 26 | ||
| Loans originated to finance the sale of other real estate owned | $ | 597 | $ | 376 | ||
| Investment in limited partnerships acquired by capital contributions payable | $ | 893 | $ | — | ||
| Assets acquired and liabilities assumed in branch acquisitions (Note 9): | ||||||
| Loans and other non-cash assets, excluding goodwill and core deposit intangible | $ | 33,624 | $ | — | ||
| Deposits and other liabilities | $ | 67,162 | $ | — | ||
See accompanying notes to consolidated financial statements.
Union Bankshares, Inc.15
UNION BANKSHARES, INC. AND SUBSIDIARY
NOTES TO CONSOLIDATED FINANCIAL STATEMENTS
Note 1. Significant Accounting Policies
Basis of financial statement presentation
The accounting and reporting policies of Union Bankshares, Inc. and Subsidiary (the “Company”) are in conformity with U.S. generally accepted accounting principles (“GAAP”) and general practices within the banking industry. The following is a description of the more significant policies.
The consolidated financial statements include the accounts of Union Bankshares, Inc., and its wholly owned subsidiary, Union Bank (“Union”) headquartered in Morrisville, Vermont. All significant intercompany transactions and balances have been eliminated. The Company utilizes the accrual method of accounting for financial reporting purposes.
The Company meets the qualification requirements under Securities and Exchange Commission rules for smaller reporting companies and, pursuant to such rules, has elected to present audited statements of income, cash flows and changes in stockholders' equity for each of the most recent two, rather than three, fiscal years.
Certain amounts in the 2010 financial statements have been reclassified to conform to the current year presentation.
Nature of operations
The Company provides a variety of financial services to individuals, municipalities, commercial and nonprofit customers through its branches, ATMs, telebanking and internet banking systems in northern Vermont and northwestern New Hampshire. This market area encompasses primarily retail consumers, small businesses, municipalities, agricultural producers and the tourism industry. The Company's primary deposit products are checking, savings, money market accounts, certificates of deposit and individual retirement accounts and its primary lending products are commercial, real estate, municipal and consumer loans.
Concentration of risk
The Company's operations are affected by various risk factors, including interest rate risk, credit risk, and risk from geographic concentration of its deposit taking and lending activities. Management attempts to manage interest rate risk through various asset/liability management techniques designed to match maturities/repricing of assets and liabilities. Loan policies and administration are designed to provide assurance that loans will only be granted to creditworthy borrowers, although credit losses are expected to occur because of subjective factors and factors beyond the control of the Company. Although national economic conditions have been volatile during the last three years, local economic conditions have been somewhat more stable. The Company has a diversified loan portfolio with a substantial portion of the Company's loans secured by real estate and/or partially guaranteed by a U.S. Government agency. Most of its lending activities are conducted within the northern Vermont and northwestern New Hampshire market area where it is located. As a result, the Company and its borrowers may be especially vulnerable to the consequences of changes in the local economy and real estate market conditions. Notes 5 and 6 discuss the types of lending in which the Company engages.
Use of estimates in preparation of financial statements
The preparation of consolidated financial statements in conformity with GAAP requires management to make estimates and assumptions that affect the reported amounts of assets and liabilities and disclosures of contingent
Union Bankshares, Inc.16
assets and liabilities at the date of the consolidated financial statements and the reported amounts of revenues and expenses during the reporting period. Actual results could materially differ from those estimates. Material estimates that are particularly susceptible to significant change in the near term and involve inherent uncertainties relate to the determination of the allowance for losses on loans, the valuation of real estate acquired in connection with foreclosures or in satisfaction of loans, deferred tax assets, judgments regarding valuation and impairment of investment securities and other assets as well as pension plan accounting. These estimates involve a significant degree of complexity and subjectivity and the amount of the change that is reasonably possible, should any of these estimates prove inaccurate, cannot be estimated.
Presentation of cash flows
For purposes of presentation in the consolidated statements of cash flows, cash and cash equivalents includes cash on hand, amounts due from banks (including cash items in process of clearing), federal funds sold (generally purchased and sold for one day periods) and overnight deposits.
Trust operations
Assets held by the Trust & Asset Management Group of Union in a fiduciary or agency capacity, other than trust cash on deposit with Union, are not included in these consolidated financial statements because they are not assets of Union or the Company.
Fair value measurements
The Company utilizes the Financial Accounting Standards Board (“FASB”) Accounting Standards Codification (“ASC”) Topic 820, Fair Value Measurements and Disclosures, as guidance for accounting for assets and liabilities carried at fair value. This standard defines fair value as the price that would be received, without adjustment for transaction costs, to sell an asset or paid to transfer a liability in an orderly transaction between market participants at the measurement date. Fair value is a market based measurement that should be determined based on assumptions that market participants would use in pricing an asset or liability. The guidance in FASB ASC Topic 820 establishes a three-level fair value hierarchy, which prioritizes the inputs used in measuring fair value. A financial instrument's level within the fair value hierarchy is based on the lowest level of input that is significant to the fair value measurement.
The three levels of the fair value hierarchy are:
| • | Level 1 - Unadjusted quoted prices in active markets that are accessible at the measurement date for identical, unrestricted assets or liabilities; |
| • | Level 2 - Quoted prices for similar assets or liabilities in active markets, quoted prices in markets that are not active, or inputs that are observable, either directly or indirectly, for substantially the full term of the asset or liability; |
| • | Level 3 - Prices or valuation techniques that require inputs that are both significant to the fair value measurement and unobservable (i.e., supported by little or no market activity). |
Investment securities
Investment securities purchased and held primarily for resale in the near future are classified as trading securities and are reported at fair value with unrealized gains and losses included in earnings. Debt securities the Company has the positive intent and ability to hold to maturity are classified as held-to-maturity and reported at amortized cost. Debt and equity securities not classified as either held-to-maturity or trading are classified as available-for-sale. Investments classified as available-for-sale are reported at fair value.
Union Bankshares, Inc.17
Accretion of discounts and amortization of premiums arising at acquisition on investment securities are included in income using the effective interest method over the life of the securities to maturity or call date. Unrealized gains and losses on investment securities available-for-sale are excluded from earnings and reported in Accumulated other comprehensive income (loss), net of tax and reclassification adjustment, as a separate component of stockholders' equity. The specific identification method is used to determine realized gains and losses on sales of available-for-sale or trading securities.
An unrealized loss is generally deemed to be other than temporary and a credit loss on a debt security is deemed to exist if the present value of the expected future cash flows is less than the amortized cost basis of the security. The credit loss component of an other than temporary write down is reflected in earnings as realized losses in other income. The remaining portion of the impairment loss is recognized in other comprehensive income (loss), provided the Company does not intend to sell the underlying debt security and it is “more likely than not” that the Company will not have to sell the debt security prior to recovery.
Loans held for sale
Loans originated and intended for sale in the secondary market are carried at the lower of cost or estimated fair value in the aggregate. The estimated fair value of loans held for sale is based on current price quotes that determine the amount that the loans could be sold for in the secondary market. Loans transferred from held for sale to portfolio are transferred at the lower of cost or fair value in the aggregate. Sales are normally made without recourse. Gains and losses on the disposition of loans held for sale are determined on the specific identification basis. Net unrealized losses are recognized through a valuation allowance by charges to income.
Loans
Loans receivable that management has the intent and ability to hold for the foreseeable future or until maturity or payoff are reported at their unpaid principal balances, adjusted for any charge-offs, the allowance for loan losses, and any deferred fees or costs on originated loans and unamortized premiums or discounts on purchased loans.
Loan interest income is accrued daily on outstanding balances. The following accounting policies, related to accrual and nonaccrual loans, apply to all loan segments and classes. The Company considers its loan segments and loan classes to be the same. The accrual of interest is discontinued when a loan is specifically determined to be impaired and/or management believes, after considering collection efforts and other factors, that the borrowers' financial condition is such that collection of interest is doubtful. Normally, any unpaid interest previously accrued on those loans is reversed against current period interest income. A loan may be restored to accrual status when its financial status has significantly improved and there is no principal or interest past due. A loan may also be restored to accrual status if the borrower makes six consecutive monthly payments or the lump sum equivalent. Income on nonaccrual loans is generally not recognized unless a loan is placed back in accrual status or after all principal has been collected. Interest income generally is not recognized on impaired loans unless the likelihood of further loss is remote. Interest payments received on such loans are generally applied as a reduction of the loan principal balance. Delinquency status is determined based on contractual terms for all loan segments and classes.
Loans purchased in the branch acquisition are recorded at the estimated fair market value at the time of purchase. The estimated fair value contains both accretable and nonaccretable components. The accretable component is amortized as an adjustment to the related loan yield over the average life of the loan. The nonaccretable component represents probable loss due to credit risk and is reviewed by management periodically and adjusted as deemed necessary.
Union Bankshares, Inc.18
Loan origination fees and direct loan origination costs are deferred and amortized as an adjustment of the related loan's yield using methods that approximate the interest method. The Company generally amortizes these amounts over the estimated average life of the related loans.
Allowance for loan losses
The allowance for loan losses is established for estimated losses in the loan portfolio through a provision for loan losses charged to earnings. For all loan classes, loan losses are charged against the allowance when management believes the loan balance is uncollectible or in accordance with federal guidelines. Subsequent recoveries, if any, are credited to the allowance.
The allowance for loan losses is maintained at a level believed by management to be appropriate to absorb probable credit losses inherent in the loan portfolio as of the balance sheet date. The amount of the allowance is based on management's periodic evaluation of the collectability of the loan portfolio, including the nature, volume and risk characteristics of the portfolio, credit concentrations, trends in historical loss experience, estimated value of any underlying collateral, specific impaired loans and economic conditions. While management uses available information to recognize losses on loans, future additions to the allowance for loan losses may be necessary based on changes in economic conditions or other relevant factors.
In addition, various regulatory agencies, as an integral part of their examination process, regularly review the Company's allowance for loan losses. Such agencies may require the Company to recognize additions to the allowance for loan losses based on their judgments about information available to them at the time of their examination, which may not be currently available to management.
The allowance consists of specific, general and unallocated components. The specific component relates to the loans that are classified as either substandard or doubtful. For such loans, the level of allowance allocable to those loans is determined through estimating probable loss for each individual credit based on its specific risk attributes. Loans are also evaluated for impairment and may be classified as impaired when management believes it is probable that the Company will not collect all the contractual interest and principal payments as scheduled in the loan agreement. Impaired loans may also include troubled loans that are restructured. A troubled debt restructuring occurs when the Company, for economic or legal reasons related to the borrower's financial difficulties, grants a concession to the borrower that would otherwise not be granted. Troubled debt restructuring may include the transfer of assets to the Company in partial satisfaction of a troubled loan, a modification of a loan's terms (such as reduction of stated interest rates below market rates, extension of maturity that does not conform to the Company's policies or procedures, reduction of face amount of the loan, reduction of accrued interest, reduction or deferment of cash payments in the near future), or a combination of both. A specific reserve amount is allocated to the allowance for individual loans that have been classified as impaired on the basis of the fair value of the collateral for collateral dependent loans, an observable market price, or the present value of anticipated future cash flows. The Company recognizes the change in present value attributable to the passage of time as provision for loan losses. Large groups of smaller balance homogeneous loans are collectively evaluated for impairment. Accordingly, the Company does not separately identify individual consumer, residential or small balance commercial loans for impairment evaluation, unless such loans are subject to a restructuring agreement or have been identified as impaired as part of a larger customer relationship.
The general component represents the level of allowance allocable to each loan portfolio segment with similar risk characteristics and is determined based on historical loss experience, adjusted for qualitative factors, for each class of loan. The Company considers its loan segments and loan classes to be the same. Management deems a five year average to be an appropriate time frame on which to base historical losses for each portfolio segment. Qualitative factors considered include underwriting, economic and market conditions, portfolio composition, collateral values, delinquencies, lender experience and legal issues. The qualitative factors are determined based on the various risk
Union Bankshares, Inc.19
characteristics of each portfolio segment. Risk characteristics relevant to each portfolio segment are as follows:
| • | Residential real estate - Loans in this segment are collateralized by owner-occupied 1-4 family residential real estate, second and vacation 1-4 family homes, 1-4 family investment properties, home equity and second mortgage loans. Repayment is dependent on the credit quality of the individual borrower. The overall health of the economy, including unemployment rates and housing prices, could have an affect on the credit quality of this segment. |
| • | Construction real estate - Loans in this segment include residential and commercial construction properties, land and land development loans. Repayment is dependent on the credit quality of the individual borrower and/or the underlying cash flows generated by the properties being constructed. The overall health of the economy, including unemployment rates, housing prices, vacancy rates and material costs, could have an affect on the credit quality of this segment. |
| • | Commercial real estate - Loans in this segment are primarily properties occupied by businesses or income-producing properties. The underlying cash flows generated by the properties may be adversely impacted by a downturn in the economy as evidenced by a general slowdown in business or increased vacancy rates which, in turn, could have an affect on the credit quality of this segment. Management requests business financial statements at least annually and monitors the cash flows of these loans. |
| • | Commercial - Loans in this segment are made to businesses and are generally secured by non real estate assets of the business. Repayment is expected from the cash flows of the business. A weakened economy, and resultant decreased consumer spending, could have an affect on credit quality of this segment. |
| • | Consumer - Loans in this segment are made to individuals for personal expenditures, such as an automobile purchase, and include unsecured loans. Repayment is primarily dependent on the credit quality of the individual borrower. The overall health of the economy, including unemployment, could have an affect on the credit quality of this segment. |
| • | Municipal - Loans in this segment are made to municipalities located within the Company's service area. Repayment is primarily dependent on taxes or other funds collected annually by the municipalities. Management considers there to be minimal risk surrounding the credit quality of this segment. |
An unallocated component is maintained to cover uncertainties that could affect management's estimate of probable losses. The unallocated component of the allowance reflects the margin of imprecision inherent in the underlying assumptions used in the methodologies for estimating specific and general losses in the portfolio.
All evaluations are inherently subjective as they require estimates that are susceptible to significant revision as more information becomes available or as changes occur in economic conditions or other relevant factors.
Other real estate owned
Real estate properties acquired through or in lieu of loan foreclosure are to be sold and are initially recorded based on an independent appraisal or a broker price opinion at the estimated fair value less estimated selling costs at the date of acquisition establishing a new carrying basis. Thereafter, valuations are periodically performed by management, and the real estate is carried in Other assets at the lower of carrying amount or fair value, less estimated cost to sell. Costs of significant property improvements are capitalized, whereas revenue and expenses from operations and changes in valuation are charged to Other expenses on the Company's statement of income.
Union Bankshares, Inc.20
Premises and equipment
Premises and equipment are stated at cost, less accumulated depreciation. Depreciation is computed principally by the straight line method over the estimated useful lives of the assets. The cost of assets sold or otherwise disposed of and the related accumulated depreciation are eliminated from the accounts and the resulting gains or losses are reflected in the statement of income. Maintenance and repairs are charged to current expense as incurred and the costs of major renewals and betterments are capitalized. Construction in progress is stated at cost, which includes the cost of construction and other direct costs attributable to the construction. No provision for depreciation is made on construction in progress until such time as the relevant assets are completed and put into use.
Intangible assets
Intangible assets include goodwill, which represents the excess of the purchase price over the fair value of net assets acquired in the 2011 acquisition of three New Hampshire branch offices, as well as a core deposit intangible related to the deposits acquired (see Note 9). The core deposit intangible is amortized on a straight line basis over the estimated average life of the core deposit base of 10 years. The Company evaluates the valuation and amortization of the core deposit intangible if events occur that could result in possible impairment. In accordance with current authoritative guidance, the Company assesses qualitative factors to determine whether the existence of events or circumstances leads to a determination that it is more likely than not that the fair value of the Company is less than its carrying amount, which could result in goodwill impairment.
Federal Home Loan Bank stock
As a member of the Federal Home Loan Bank (“FHLB”) of Boston, Union is required to invest in Class B common stock of the FHLB of Boston. The Class B common stock has a five year notice requirement for redemption and there is no guarantee of future redemption. Also, there is the possibility of future capital calls by the FHLB of Boston on member banks to ensure compliance with its capital plan. FHLB of Boston stock is reported in Other assets at its par value of $1.9 million at December 31, 2011 and 2010. The stock is nonmarketable, and is redeemable by the FHLB of Boston at par value.
Company-owned life insurance
Company-owned life insurance (“COLI”) represents life insurance on the lives of certain current or former directors or employees who have provided positive consent allowing the Company to be the beneficiary of such policies. The Company utilizes COLI as tax-efficient funding for the benefit obligations to its employees and directors, including obligations under one of the Company's nonqualified deferred compensation plans. See Note 15. The Company is the primary beneficiary of the insurance policies. Increases in the cash value of the policies, as well as any gain on insurance proceeds received, are recorded in Other income, and are not currently subject to income taxes. COLI is recorded at the cash value of the policies, less any applicable cash surrender charges of which there are currently none. The Company reviews the financial strength of the insurance carriers prior to the purchase of COLI to ensure minimum credit ratings of at least investment grade. The financial strength of the carriers is reviewed annually and COLI with any individual carrier is limited by Company policy to 10% of capital plus reserves.
Union Bankshares, Inc.21
Servicing assets
Servicing assets are recognized as separate assets when servicing rights are acquired through purchase or sale of loans with servicing rights retained. Capitalized servicing rights are reported in Other assets, are initially recorded at estimated fair market value and are amortized against noninterest income in proportion to, and over the period of, the estimated future net servicing income of the underlying loans. The estimated fair value of capitalized servicing rights represents the present value of the future servicing fees arising from the right to service loans that have been previously sold. Servicing assets are evaluated regularly for impairment based upon the fair value of the rights as compared to amortized cost. Impairment is determined by stratifying rights by predominant characteristics, such as interest rates and terms. Fair value of a stratum is determined using prices for similar assets with similar characteristics, when available, or based upon discounted cash flows using market-based assumptions.
Impairment is recognized through a valuation allowance for an individual stratum, to the extent that estimated fair value is less than the capitalized amount for the stratum.
Investment in real estate limited partnerships
The Company has purchased various limited partnership interests in affordable housing partnerships. These partnerships were established to acquire, own and rent residential housing for elderly, low or moderate income residents in northeastern and central Vermont or in northwestern New Hampshire. The investments are accounted for under a method approximating the equity method of accounting. These equity investments are recorded at cost and adjusted for the Company's proportionate share of the partnerships' undistributed earnings or losses through the statement of income.
Pension plans
Union maintains a noncontributory defined benefit pension plan covering all eligible employees who meet certain service requirements. The costs of this plan, based on actuarial computations of current and estimated future benefits for employees, are charged to Pension and other employee benefits.
Union also has a contributory 401(k) pension plan covering all employees who meet certain service requirements. The plan is voluntary, and Union, through the discretionary matching component of the plan, contributed fifty cents for every dollar contributed by participants, up to six percent of each participant's salary in 2011 and 2010.
Advertising costs
The Company expenses advertising costs as incurred and they are included in Advertising and public relations in the Company's income statement.
Earnings per common share
Earnings per common share for the period are computed based on the weighted average number of shares of common stock issued, retroactively adjusted for stock splits and stock dividends and reduced for shares held in treasury. The weighted average shares outstanding were 4,456,842 and 4,458,193 for the years ended December 31, 2011 and 2010, respectively. There were options with respect to 14,000 shares and 15,000 shares outstanding at December 31, 2011 and December 31, 2010, respectively, excluded from the computation of diluted earnings per share since dilution resulting from these stock options would be immaterial.
Union Bankshares, Inc.22
Income taxes
The Company prepares its federal income tax return on a consolidated basis. Federal income taxes are allocated to members of the consolidated group based on taxable income. The Company recognizes income taxes under the asset and liability method. This involves estimating the Company's actual current tax exposure as well as assessing temporary differences resulting from differing treatment of items, such as timing of the deduction of expenses, for tax and GAAP purposes. These differences result in deferred tax assets and liabilities, which are netted and included in Other assets. Deferred tax assets and liabilities are measured using enacted tax rates expected to apply to taxable income in the years in which those temporary differences are expected to be recovered or settled. The Company must also assess the likelihood that any deferred tax assets will be recovered from future taxable income and to the extent that recovery is not likely, a valuation allowance must be established. Significant management judgment is required in determining the provision for income taxes and deferred tax assets and liabilities. Affordable housing tax credits are recognized as a reduction of the Provision for income taxes in the year they are earned.
Off-balance-sheet financial instruments
In the ordinary course of business, the Company is a party to off-balance-sheet financial instruments consisting of commitments to originate credit, unused lines of credit including commitments under credit card arrangements, commitments to purchase investment securities, commitments to invest in real estate limited partnerships, commercial letters of credit, standby letters of credit and risk-sharing commitments on certain sold loans. Such financial instruments are recorded in the financial statements when they become fixed and certain.
Comprehensive income (loss)
Accounting principles generally require that recognized revenue, expenses, gains and losses be included in net income or loss. Certain changes in assets and liabilities, such as the after tax effect of unrealized gains and losses on investment securities available-for-sale that are not other than temporarily impaired and the unfunded liability for the defined benefit pension plan, are not reflected in the statement of income. The cumulative effect of such items, net of tax effect, is reported as a separate component of the equity section of the balance sheet (Accumulated other comprehensive income or loss). Other comprehensive income or loss, along with net income, comprises the Company's total comprehensive income or loss.
Transfers of financial assets
Transfers of financial assets are accounted for as sales when control over the assets has been surrendered. Control over transferred assets is deemed to be surrendered when the assets have been isolated from the Company, the transferee obtains the right (free of conditions that constrain it from taking advantage of that right) to pledge or exchange the transferred assets, and the Company does not maintain effective control over the transferred assets through an agreement to repurchase them before their maturity.
Stock option plan
The Company recognizes stock-based compensation expense based on the grant date estimated fair value of stock-based awards over the vesting period of the awards. The stock to be issued upon exercise of options granted shall consist of authorized but unissued shares of the Company's $2.00 par value common stock and/or shares of such common stock held in treasury.
Union Bankshares, Inc.23
Recent accounting pronouncements
In January 2010, the FASB issued an Accounting Standards Update ("ASU"), Fair Value Measurements and Disclosures: Improving Disclosures about Fair Value Measurements, to amend the disclosure requirements and clarify existing requirements related to recurring and nonrecurring fair value measurements and employers’ disclosures about postretirement benefit plan assets. The guidance requires new disclosures regarding transfers of assets and liabilities between Level 1 (quoted prices in active market for identical assets or liabilities) and Level 2 (significant other observable inputs) of the fair value measurement hierarchy, including the reasons and the timing of the transfers. Additionally, the guidance requires a rollforward of activities, separately reporting purchases, sales, issuance, and settlements, for assets and liabilities measured using significant unobservable inputs (Level 3 fair value measurements). The new disclosure requirements apply to interim and annual reporting periods beginning after December 15, 2009, except for the new rules regarding purchases, sales, issuances and settlements associated with Level 3 measurements which are effective for fiscal years beginning after December 15, 2010, and for interim periods within those fiscal years. Other than requiring additional disclosures, adoption of this accounting standard did not have a material effect on the Company’s consolidated financial statements. See Note 19.
In January 2011, the FASB issued an ASU, Deferral of the Effective Date of Disclosures about Troubled Debt Restructuring, for public-entity creditors to temporarily delay the effective date of the disclosures about troubled debt restructurings to allow time for FASB to complete its deliberations of what constitutes a troubled debt restructuring. The Company adopted the required portions of the accounting standard as of December 31, 2010 with no material impact on the Company's consolidated financial statements. In April 2011, the FASB issued an ASU, A Creditor's Determination of Whether a Restructuring is a Troubled Debt Restructuring, which provides companies new criteria for determining whether a particular loan modification represents a troubled debt restructuring for accounting purposes and it signals when a company should also record an impairment loss associated with the same loan. This new guidance was effective for quarterly and annual reports for periods beginning on or after June 15, 2011. Adoption of the standard did not have a material effect on the Company's consolidated financial statements.
In April 2011, the FASB issued an ASU, Reconsideration of Effective Controls for Repurchase Agreements, to improve the accounting for repurchase agreements and other agreements that both entitle and obligate a transferor to repurchase or redeem financial assets before their maturity. The update removes the transferor's ability criterion from the consideration of effective control for repurchase or other agreements. The guidance in this ASU is effective for the first interim or annual period beginning on or after December 15, 2011. Management has reviewed the ASU and does not believe that it will have a material effect on the Company's consolidated financial statements.
In May 2011, the FASB issued an ASU, Amendments to Achieve Common Fair Value Measurement and Disclosure Requirements in U.S. GAAP and IFRSs, to improve the comparability of fair value measurements presented and disclosed in financial statements prepared in accordance with GAAP and International Financial Reporting Standards (IFRS). The amendments in this update explain how to measure fair value. They do not require additional fair value measurements and are not intended to establish valuation standards or affect valuation practices outside of financial reporting. The amendments change the wording used to describe many of the requirements in GAAP for measuring fair value and for disclosing information about fair value measurements. The amendments in this ASU are to be applied prospectively and are effective for interim and annual periods beginning after December 15, 2011. Early application is not permitted. Management is currently reviewing the ASU but does not believe that it will have a material effect on the Company's consolidated financial statements.
In June 2011, the FASB issued an ASU, Presentation of Comprehensive Income, to improve the comparability, consistency and transparency of financial reporting, to increase the prominence of items reported in other comprehensive income and to facilitate convergence of GAAP and IFRS. The ASU eliminates the option to present components of other comprehensive income as part of the statement of changes in stockholders' equity and requires that all nonowner changes in stockholders' equity be presented either in a single continuous statement of
Union Bankshares, Inc.24
comprehensive income or in two separate but consecutive statements. In both formats, an entity is required to present each component of net income along with total net income, each component of other comprehensive income along with a total for other comprehensive income, and a total amount for comprehensive income. The entity is required to present on the face of the financial statements reclassification adjustments for items that are reclassified from other comprehensive income to net income in the statements where the components of net income and other comprehensive income are presented. The amendments in the ASU are to be applied retrospectively and are effective for annual and interim periods beginning after December 15, 2011 except for the presentation requirements of reclassifications of items out of accumulated other comprehensive income which have been delayed indefinitely by an ASU issued by FASB in December 2011. Management is currently reviewing the ASU to determine which of the two remaining formats will be used in the Company's future consolidated financial statements.
In September 2011, the FASB issued an ASU, Intangibles - Goodwill and Other (Topic 350): Testing Goodwill for Impairment, to address concerns about the cost and complexity of the required test to determine if goodwill is impaired, or inflated on the balance sheet and in need of a writedown. The ASU amends Topic 350 to permit an entity the option to first assess qualitative factors to determine whether it is more likely than not (50% threshold) that the fair value of a reporting unit is less than its carrying amount as a basis for determining whether it is necessary to perform the two-step goodwill impairment test. The amendments are effective for annual and interim goodwill impairment tests performed for fiscal years beginning after December 15, 2011. Early adoption is permitted, including for annual and interim goodwill impairment tests performed as of a date before September 15, 2011, if an entity's financial statements for the most recent annual or interim periods have not yet been issued. Management adopted the ASU as of September 30, 2011. (See Note 9.)
In December 2011, the FASB issued an ASU, Disclosures about Offsetting Assets and Liabilities, to enhance disclosures required to facilitate comparison between those entities that prepare their financial statements on the basis of GAAP and those entities that prepare their financial statements on the basis of IFRS by requiring improved information about financial instruments and derivative instruments that are either (1) offset in accordance with either Topic 210-20-45 (Balance Sheet Offsets) or Topic 815-10-45 (Derivatives & Hedging) or (2) subject to an enforceable master netting arrangement or similar agreement, irrespective of whether they are offset in accordance with either Topic 210-20-45 or Topic 815-10-45. The amendments in the ASU are to be applied retrospectively for all comparative periods presented and are effective for annual and interim periods beginning on or after January 1, 2013. Management is currently reviewing the ASU but does not believe that it will have a material effect on the Company's consolidated financial statements.
Note 2. Restrictions on Cash and Due From Banks
The nature of the Company's business requires that it maintain amounts due from correspondent banks which, at times, may exceed federally insured limits. The balances in these accounts at December 31, were as follows:
| 2011 | 2010 | |||||
| (Dollars in thousands) | ||||||
| Noninterest bearing accounts | $ | 1,143 | $ | 1,281 | ||
| Federal Reserve Bank of Boston | 19,368 | 9,678 | ||||
| FHLB of Boston | 351 | 322 | ||||
No losses have been experienced in these accounts and the Company believes it is not exposed to any significant risk with respect to the accounts.
Union Bankshares, Inc.25
The Company was required to maintain contracted clearing balances of $1.0 million at both December 31, 2011 and 2010, which are included in the Federal Reserve Bank of Boston balances above. Balances in excess of the contracted clearing amount at the Federal Reserve Bank of Boston and a portion of the funds at the FHLB of Boston are classified as overnight deposits as they earn interest. The Company is required to maintain vault cash or noninterest bearing reserve balances with Federal Reserve Bank of Boston. Total reserve balances required at December 31, 2011 and 2010 were $546 thousand and $360 thousand, respectively, which were both satisfied by vault cash.
Note 3. Interest Bearing Deposits in Banks
Interest bearing deposits in banks consist of certificates of deposit purchased from various financial institutions. Deposits at each institution are generally maintained at or below the Federal Deposit Insurance Corporation (“FDIC”) insurable limit of $250 thousand. Certificates are held with rates ranging from 0.40% to 5.50% and mature at various dates through 2016, with $7.7 million scheduled to mature in 2012.
Note 4. Investment Securities
Investment securities as of the balance sheet dates consisted of the following:
| December 31, 2011 | Amortized Cost | Gross Unrealized Gains | Gross Unrealized Losses | Fair Value | ||||||||
| (Dollars in thousands) | ||||||||||||
| Available-for-sale | ||||||||||||
| Debt securities: | ||||||||||||
| U.S. Government-sponsored enterprises | $ | 17,456 | $ | 99 | $ | (18 | ) | $ | 17,537 | |||
| Agency mortgage-backed | 3,326 | 61 | (1 | ) | 3,386 | |||||||
| State and political subdivisions | 11,813 | 1,018 | (1 | ) | 12,830 | |||||||
| Corporate | 8,127 | 179 | (13 | ) | 8,293 | |||||||
| Total debt securities | 40,722 | 1,357 | (33 | ) | 42,046 | |||||||
| Marketable equity securities | 746 | 39 | (12 | ) | 773 | |||||||
| Mutual funds | 135 | — | — | 135 | ||||||||
| Total | $ | 41,603 | $ | 1,396 | $ | (45 | ) | $ | 42,954 | |||
| Held-to-maturity | ||||||||||||
| U.S. Government-sponsored enterprises | $ | 4,000 | $ | 1 | $ | (3 | ) | $ | 3,998 | |||
Union Bankshares, Inc.26
| December 31, 2010 | Amortized Cost | Gross Unrealized Gains | Gross Unrealized Losses | Fair Value | ||||||||
| (Dollars in thousands) | ||||||||||||
| Available-for-sale | ||||||||||||
| Debt securities: | ||||||||||||
| U.S. Government-sponsored enterprises | $ | 4,521 | $ | 1 | $ | (63 | ) | $ | 4,459 | |||
| Agency mortgage-backed | 4,735 | 87 | (11 | ) | 4,811 | |||||||
| State and political subdivisions | 9,373 | 175 | (155 | ) | 9,393 | |||||||
| Corporate | 4,737 | 274 | (39 | ) | 4,972 | |||||||
| Total debt securities | 23,366 | 537 | (268 | ) | 23,635 | |||||||
| Marketable equity securities | 50 | 1 | (6 | ) | 45 | |||||||
| Mutual funds | 100 | — | — | 100 | ||||||||
| Total | $ | 23,516 | $ | 538 | $ | (274 | ) | $ | 23,780 | |||
| Held-to-maturity | ||||||||||||
| U.S. Government-sponsored enterprises | $ | 500 | $ | 2 | $ | — | $ | 502 | ||||
Investment securities with a carrying amount of $11.2 million and $1.5 million at December 31, 2011 and 2010, respectively, were pledged as collateral for public deposits, customer repurchase agreements and for other purposes as required or permitted by law.
Information pertaining to investment securities with gross unrealized losses as of the balance sheet dates, aggregated by investment category and length of time that individual securities have been in a continuous loss position, follows:
| December 31, 2011 | Less Than 12 Months | Over 12 Months | Total | |||||||||||||||
Fair Value | Gross Unrealized Loss | Fair Value | Gross Unrealized Loss | Fair Value | Gross Unrealized Loss | |||||||||||||
| (Dollars in thousands) | ||||||||||||||||||
| Debt securities: | ||||||||||||||||||
U.S. Government-sponsored enterprises | $ | 7,389 | $ | (21 | ) | $ | — | $ | — | $ | 7,389 | $ | (21 | ) | ||||
| Agency mortgage-backed | — | — | 361 | (1 | ) | 361 | (1 | ) | ||||||||||
| State and political subdivisions | 347 | (1 | ) | — | — | 347 | (1 | ) | ||||||||||
| Corporate | 3,075 | (13 | ) | — | — | 3,075 | (13 | ) | ||||||||||
| Total debt securities | 10,811 | (35 | ) | 361 | (1 | ) | 11,172 | (36 | ) | |||||||||
| Marketable equity securities | 193 | (7 | ) | 10 | (5 | ) | 203 | (12 | ) | |||||||||
| Total | $ | 11,004 | $ | (42 | ) | $ | 371 | $ | (6 | ) | $ | 11,375 | $ | (48 | ) | |||
Union Bankshares, Inc.27
| December 31, 2010 | Less Than 12 Months | Over 12 Months | Total | |||||||||||||||
Fair Value | Gross Unrealized Loss | Fair Value | Gross Unrealized Loss | Fair Value | Gross Unrealized Loss | |||||||||||||
| (Dollars in thousands) | ||||||||||||||||||
| Debt securities: | ||||||||||||||||||
U.S. Government-sponsored enterprises | $ | 3,937 | $ | (63 | ) | $ | — | $ | — | $ | 3,937 | $ | (63 | ) | ||||
| Agency mortgage-backed | 862 | (11 | ) | — | — | 862 | (11 | ) | ||||||||||
| State and political subdivisions | 4,314 | (155 | ) | — | — | 4,314 | (155 | ) | ||||||||||
| Corporate | 202 | (39 | ) | — | — | 202 | (39 | ) | ||||||||||
| Total debt securities | 9,315 | (268 | ) | — | — | 9,315 | (268 | ) | ||||||||||
| Marketable equity securities | — | — | 8 | (6 | ) | 8 | (6 | ) | ||||||||||
| Total | $ | 9,315 | $ | (268 | ) | $ | 8 | $ | (6 | ) | $ | 9,323 | $ | (274 | ) | |||
The Company evaluates all investment securities on a quarterly basis, and more frequently when economic conditions warrant, to determine if an other than temporary impairment exists. A debt security is considered impaired if the fair value is lower than its amortized cost basis at the report date. If impaired, management then assesses whether the unrealized loss is other than temporary. An unrealized loss on a debt security is generally deemed to be other than temporary and a credit loss is deemed to exist if the present value of the expected future cash flows is less than the amortized cost basis of the debt security. The credit loss component of an other than temporary impairment write-down is recorded, net of tax effect, through net income as a component of net other than temporary impairment losses in the consolidated statement of income, while the remaining portion of the impairment loss is recognized in other comprehensive income (loss), provided the Company does not intend to sell the underlying debt security and it is "more likely than not" that the Company will not have to sell the debt security prior to recovery.
Management considers the following factors in determining whether an other than temporary impairment exists and the period over which the debt security is expected to recover:
| • | The length of time, and extent to which, the fair value has been less than the amortized cost; |
| • | Adverse conditions specifically related to the security, issuer, industry, or geographic area; |
| • | The historical and implied volatility of the fair value of the security; |
| • | The payment structure of the debt security and the likelihood of the issuer being able to make payments that may increase in the future; |
| • | Failure of the issuer of the security to make scheduled interest or principal payments; |
| • | Any changes to the rating of the security by a rating agency; |
| • | Recoveries or additional declines in fair value subsequent to the balance sheet date; and |
| • | The nature of the issuer, including whether it is a private company, public entity or government-sponsored enterprise, and the existence or likelihood of any government or third party guaranty. |
At December 31, 2011, held-to-maturity and available-for-sale securities, consisting of nine U.S. Government-sponsored enterprise securities, one agency collateralized mortgage obligation, one tax exempt municipal security, six corporate bonds and five marketable equity securities had aggregate unrealized losses of $48 thousand. One marketable equity security and one agency collateralized mortgage obligation had unrealized losses greater than twelve months and the Company has the ability to hold such securities for the foreseeable future. No declines were deemed by management to be other than temporary at December 31, 2011.
Union Bankshares, Inc.28
The Company's investment securities are exposed to various risks, such as interest rate, market and credit. The ongoing credit and liquidity crisis in the United States and globally continues to have far reaching implications for financial markets. Due to the level of risk associated with certain investment securities and the level of uncertainty related to changes in the value of investment securities, it is at least reasonably possible that changes in risks, further deterioration in credit quality and/or the continuation of the current imbalances in liquidity that exist in the financial marketplace would materially affect the amounts reported in the consolidated financial statements in future periods.
Proceeds from the sale of securities available-for-sale were $2.3 million and $1.1 million in 2011 and 2010, respectively. Gross realized gains from the sale of securities available-for-sale were $183 thousand and $98 thousand and there were no gross realized losses in either 2011 or 2010. The specific identification method is used to determine realized gains and losses on sales of available-for-sale securities.
The amortized cost and estimated fair value of debt securities by contractual scheduled maturity as of December 31, 2011, were as follows:
Amortized Cost | Fair Value | |||||
| (Dollars in thousands) | ||||||
| Available-for-sale | ||||||
| Due in one year or less | $ | 500 | $ | 503 | ||
| Due from one to five years | 12,198 | 12,365 | ||||
| Due from five to ten years | 12,218 | 12,660 | ||||
| Due after ten years | 12,480 | 13,132 | ||||
| 37,396 | 38,660 | |||||
| Agency mortgage-backed securities | 3,326 | 3,386 | ||||
| Total debt securities available-for-sale | $ | 40,722 | $ | 42,046 | ||
| Held-to-maturity | ||||||
| Due from one to five years | $ | 1,000 | $ | 1,001 | ||
| Due from five to ten years | 2,000 | 1,998 | ||||
| Due after ten years | 1,000 | 999 | ||||
| Total debt securities held-to-maturity | $ | 4,000 | $ | 3,998 | ||
Actual maturities may differ for certain debt securities that may be called by the issuer prior to the contractual maturity. Actual maturities may differ from contractual maturities in agency mortgage-backed securities because the mortgages underlying the securities may be prepaid, usually without any penalties. Therefore, these agency mortgage-backed securities are shown separately and not included in the contractual maturity categories in the above maturity summary.
Note 5. Loans Held for Sale and Loan Servicing
At December 31, 2011 and 2010, Loans held for sale consisted of conventional residential mortgages and commercial real estate mortgages originated for subsequent sale. At December 31, 2011 and 2010, the estimated fair value of these loans was in excess of their carrying value, and therefore no valuation reserve was necessary for loans held for sale.
Commercial and mortgage loans serviced for others are not included in the accompanying balance sheets. The unpaid principal balances of commercial and mortgage loans serviced for others were $208.1 million and $166.0 million at December 31, 2011 and 2010, respectively. Loans sold during 2011 consisted of $293 thousand in qualifying small
Union Bankshares, Inc.29
business loans and $80.1 million in residential loans, resulting in total loans sold of $80.4 million. The net gains realized in 2011 on the sale of those loans amounted to $21 thousand and $1.5 million, respectively. Loans sold in 2010 totaled $52.7 million and consisted of $1.1 million in qualifying small business loans, $294 thousand in credit card loans and $51.3 million in residential loans, resulting in net gains of $64 thousand, $10 thousand and $662 thousand, respectively. There were no guarantees to repurchase loans for any amount at December 31, 2011, but there were contractual risk sharing commitments on certain sold loans totaling $92 thousand as of such date.
The Company generally retains the servicing rights on loans sold. At December 31, 2011 and 2010, the unamortized balance of servicing rights on loans sold with servicing retained was $818 thousand and $650 thousand, respectively, and is included in Other assets. The estimated fair value of these servicing rights was in excess of their carrying value at both December 31, 2011 and 2010, and therefore no impairment reserve was necessary. Loan servicing rights of $481 thousand and $383 thousand were capitalized in 2011 and 2010, respectively. Amortization of servicing rights was $312 thousand and $263 thousand for 2011 and 2010, respectively.
Note 6. Loans
The composition of Net loans at December 31, was as follows:
| 2011 | 2010 | |||||
| (Dollars in thousands) | ||||||
| Residential real estate | $ | 147,426 | $ | 132,533 | ||
| Construction real estate | 28,077 | 18,578 | ||||
| Commercial real estate | 189,770 | 167,056 | ||||
| Commercial | 21,128 | 20,604 | ||||
| Consumer | 6,134 | 6,046 | ||||
| Municipal | 31,784 | 31,455 | ||||
| Gross loans | 424,319 | 376,272 | ||||
| Allowance for loan losses | (4,226 | ) | (3,755 | ) | ||
| Net deferred loan costs | 177 | 188 | ||||
| Net loans | $ | 420,270 | $ | 372,705 | ||
The loans acquired in the May 27, 2011 branch acquisition (see Note 9) were recorded at fair value at the time of acquisition. The net carrying amount of the acquired loans included in the December 31, 2011 loan balances above total $27.9 million. The fair value adjustment is being amortized as an adjustment to the related loan yield over the estimated average life of the loans.
Residential real estate loans aggregating $9.9 million and $9.6 million at December 31, 2011 and 2010, respectively, were pledged as collateral on deposits of municipalities. Qualified first mortgages held by Union may also be pledged as collateral for borrowings from the FHLB of Boston under a blanket lien.
Union Bankshares, Inc.30
A summary of current, past due and nonaccrual loans as of the balance sheet dates follows:
| December 31, 2011 | Current | 30-89 Days | Over 90 Days and accruing | Nonaccrual | Total | ||||||||||
| (Dollars in thousands) | |||||||||||||||
| Residential real estate | $ | 140,330 | $ | 3,819 | $ | 606 | $ | 2,671 | $ | 147,426 | |||||
| Construction real estate | 26,849 | 961 | 175 | 92 | 28,077 | ||||||||||
| Commercial real estate | 182,122 | 5,165 | 1,104 | 1,379 | 189,770 | ||||||||||
| Commercial | 20,629 | 376 | 12 | 111 | 21,128 | ||||||||||
| Consumer | 6,045 | 34 | — | 55 | 6,134 | ||||||||||
| Municipal | 31,784 | — | — | — | 31,784 | ||||||||||
| Total | $ | 407,759 | $ | 10,355 | $ | 1,897 | $ | 4,308 | $ | 424,319 | |||||
| December 31, 2010 | Current | 30-89 Days | Over 90 Days and accruing | Nonaccrual | Total | ||||||||||
| (Dollars in thousands) | |||||||||||||||
| Residential real estate | $ | 123,573 | $ | 6,446 | $ | 587 | $ | 1,927 | $ | 132,533 | |||||
| Construction real estate | 18,369 | 116 | 45 | 48 | 18,578 | ||||||||||
| Commercial real estate | 163,524 | 2,729 | 173 | 630 | 167,056 | ||||||||||
| Commercial | 20,295 | 161 | — | 148 | 20,604 | ||||||||||
| Consumer | 5,953 | 53 | 1 | 39 | 6,046 | ||||||||||
| Municipal | 31,455 | — | — | — | 31,455 | ||||||||||
| Total | $ | 363,169 | $ | 9,505 | $ | 806 | $ | 2,792 | $ | 376,272 | |||||
Aggregate interest on nonaccrual loans not recognized was $903 thousand and $677 thousand for the years ended December 31, 2011 and 2010, respectively.
Note 7. Allowance for Loan Losses and Credit Quality
Changes in the Allowance for loan losses, by class of loans, for the years ended December 31, were as follows:
| 2011 | Residential Real Estate | Construction Real Estate | Commercial Real Estate | Commercial | Consumer, Municipal and Unallocated | Total | ||||||||||||
| (Dollars in thousands) | ||||||||||||||||||
| Balance, December 31, 2010 | $ | 1,033 | $ | 240 | $ | 2,117 | $ | 250 | $ | 115 | $ | 3,755 | ||||||
| Provision (credit) for loan losses | 242 | 144 | 430 | (31 | ) | (10 | ) | 775 | ||||||||||
Recoveries of amounts charged off | 3 | — | — | 14 | 27 | 44 | ||||||||||||
| 1,278 | 384 | 2,547 | 233 | 132 | 4,574 | |||||||||||||
| Amounts charged off | (28 | ) | (17 | ) | (269 | ) | (1 | ) | (33 | ) | (348 | ) | ||||||
| Balance, December 31, 2011 | $ | 1,250 | $ | 367 | $ | 2,278 | $ | 232 | $ | 99 | $ | 4,226 | ||||||
Union Bankshares, Inc.31
| 2010 | Residential Real Estate | Construction Real Estate | Commercial Real Estate | Commercial | Consumer, Municipal and Unallocated | Total | ||||||||||||
| (Dollars in thousands) | ||||||||||||||||||
| Balance, December 31, 2009 | $ | 976 | $ | 240 | $ | 1,959 | $ | 235 | $ | 83 | $ | 3,493 | ||||||
| Provision for loan losses | 184 | 89 | 203 | 21 | 23 | 520 | ||||||||||||
Recoveries of amounts charged off | 7 | — | — | 21 | 29 | 57 | ||||||||||||
| 1,167 | 329 | 2,162 | 277 | 135 | 4,070 | |||||||||||||
| Amounts charged off | (134 | ) | (89 | ) | (45 | ) | (27 | ) | (20 | ) | (315 | ) | ||||||
| Balance, December 31, 2010 | $ | 1,033 | $ | 240 | $ | 2,117 | $ | 250 | $ | 115 | $ | 3,755 | ||||||
As described in Note 6, the $27.9 million remaining net carrying amount of the loans purchased in the branch acquisitions of May 27, 2011 was recorded at the loans' estimated fair value as of such date and, consequently, there was no related adjustment to the allowance for loan losses with respect to the acquired loans at December 31, 2011.
The allocation of the Allowance for loan losses, summarized on the basis of the Company's impairment methodology by class of loan, as of the balance sheet dates was as follows:
| December 31, 2011 | Residential Real Estate | Construction Real Estate | Commercial Real Estate | Commercial | Consumer, Municipal and Unallocated | Total | ||||||||||||
| (Dollars in thousands) | ||||||||||||||||||
Individually evaluated for impairment | $ | 328 | $ | 12 | $ | 293 | $ | 41 | $ | 11 | $ | 685 | ||||||
Collectively evaluated for impairment | 922 | 355 | 1,985 | 191 | 88 | 3,541 | ||||||||||||
| Total allocated | $ | 1,250 | $ | 367 | $ | 2,278 | $ | 232 | $ | 99 | $ | 4,226 | ||||||
| December 31, 2010 | Residential Real Estate | Construction Real Estate | Commercial Real Estate | Commercial | Consumer, Municipal and Unallocated | Total | ||||||||||||
| (Dollars in thousands) | ||||||||||||||||||
Individually evaluated for impairment | $ | 199 | $ | 12 | $ | 295 | $ | 39 | $ | 20 | $ | 565 | ||||||
Collectively evaluated for impairment | 834 | 228 | 1,822 | 211 | 95 | 3,190 | ||||||||||||
| Total allocated | $ | 1,033 | $ | 240 | $ | 2,117 | $ | 250 | $ | 115 | $ | 3,755 | ||||||
Despite the allocation shown in the tables above, the Allowance for loan losses is general in nature and is available to absorb losses from any loan type.
Union Bankshares, Inc.32
The recorded investment in loans, summarized on the basis of the Company's impairment methodology by class of loan, as of the balance sheet dates was as follows:
| December 31, 2011 | Residential Real Estate | Construction Real Estate | Commercial Real Estate | Commercial | Consumer | Municipal | Total | ||||||||||||||
| (Dollars in thousands) | |||||||||||||||||||||
Individually evaluated for impairment | $ | 2,810 | $ | 92 | $ | 6,499 | $ | 355 | $ | 33 | $ | — | $ | 9,789 | |||||||
Collectively evaluated for impairment | 132,115 | 27,976 | 169,576 | 19,971 | 5,724 | 31,234 | 386,596 | ||||||||||||||
| 134,925 | 28,068 | 176,075 | 20,326 | 5,757 | 31,234 | 396,385 | |||||||||||||||
| Acquired loans | 12,501 | 9 | 13,695 | 802 | 377 | 550 | 27,934 | ||||||||||||||
| Total | $ | 147,426 | $ | 28,077 | $ | 189,770 | $ | 21,128 | $ | 6,134 | $ | 31,784 | $ | 424,319 | |||||||
| December 31, 2010 | Residential Real Estate | Construction Real Estate | Commercial Real Estate | Commercial | Consumer | Municipal | Total | ||||||||||||||
| (Dollars in thousands) | |||||||||||||||||||||
Individually evaluated for impairment | $ | 1,789 | $ | 48 | $ | 5,224 | $ | 146 | $ | 30 | $ | — | $ | 7,237 | |||||||
Collectively evaluated for impairment | 130,744 | 18,530 | 161,832 | 20,458 | 6,016 | 31,455 | 369,035 | ||||||||||||||
| Total | $ | 132,533 | $ | 18,578 | $ | 167,056 | $ | 20,604 | $ | 6,046 | $ | 31,455 | $ | 376,272 | |||||||
Risk ratings are assigned to loans and are subject to ongoing monitoring by lending and credit personnel, with such ratings updated annually or more frequently if warranted. During 2011, the Company updated the method utilized to determine the assignment of loan risk ratings and bring the loan rating system into better alignment with the regulatory classifications. This update resulted in loans assigned the M rating of Monitor to only be monitored on the watch list and to no longer be individually evaluated for impairment as they were in 2010. This update applies only to the assignment of loan risk ratings and had no impact on the determination of the amount allocated to the allowance for loan losses in comparison to the methodology utilized in the prior year. The following is an overview of the Company's loan rating system:
1-3 Rating - Pass
Risk-rating grades "1" through "3" comprise those loans ranging from lower than average credit risk, defined as borrowers with high liquidity, excellent financial condition, strong management, favorable industry trends or loans secured by highly liquid assets through loans with marginal credit risk, defined as borrowers that while creditworthy, exhibit some characteristics which require special attention by the account officer.
4/M Rating - Satisfactory/Monitor
Borrowers exhibit potential credit weaknesses or downward trends warranting management's attention. While potentially weak, these borrowers are currently marginally acceptable; no loss of principal or interest is envisioned. When warranted, these credits may be monitored on the watch list.
Union Bankshares, Inc.33
5-8 Rating - Substandard
Borrowers exhibit well defined weaknesses that jeopardize the orderly liquidation of debt. The loan may be inadequately protected by the net worth and paying capacity of the obligor and/or the underlying collateral is inadequate.
The following tables summarize the loan ratings applied to the Company's loans by class as of the balance sheet dates:
| December 31, 2011 | Residential Real Estate | Construction Real Estate | Commercial Real Estate | Commercial | Consumer | Municipal | Total | ||||||||||||||
| (Dollars in thousands) | |||||||||||||||||||||
| Pass | $ | 127,338 | $ | 26,928 | $ | 135,764 | $ | 17,179 | $ | 5,652 | $ | 31,234 | $ | 344,095 | |||||||
| Satisfactory/Monitor | 4,777 | 1,048 | 33,812 | 2,792 | 72 | — | 42,501 | ||||||||||||||
| Substandard | 2,810 | 92 | 6,499 | 355 | 33 | — | 9,789 | ||||||||||||||
| 134,925 | 28,068 | 176,075 | 20,326 | 5,757 | 31,234 | 396,385 | |||||||||||||||
| Acquired loans | 12,501 | 9 | 13,695 | 802 | 377 | 550 | 27,934 | ||||||||||||||
| Total | $ | 147,426 | $ | 28,077 | $ | 189,770 | $ | 21,128 | $ | 6,134 | $ | 31,784 | $ | 424,319 | |||||||
| December 31, 2010 | Residential Real Estate | Construction Real Estate | Commercial Real Estate | Commercial | Consumer | Municipal | Total | ||||||||||||||
| (Dollars in thousands) | |||||||||||||||||||||
| Pass | $ | 128,646 | $ | 17,999 | $ | 142,530 | $ | 19,640 | $ | 5,991 | $ | 31,455 | $ | 346,261 | |||||||
| Satisfactory/Monitor | 2,098 | 531 | 19,302 | 818 | 25 | — | 22,774 | ||||||||||||||
| Substandard | 1,789 | 48 | 5,224 | 146 | 30 | — | 7,237 | ||||||||||||||
| Total | $ | 132,533 | $ | 18,578 | $ | 167,056 | $ | 20,604 | $ | 6,046 | $ | 31,455 | $ | 376,272 | |||||||
Acquired loans are risk rated, as appropriate, according to the Company's loan rating system, but such ratings are not taken into account in establishing the allowance for loan losses. Rather, in accordance with applicable accounting principles, acquired loans are initially recorded at fair value, determined based upon an estimate of the amount and timing of both principal and interest cash flows expected to be collected and discounted using a market interest rate, which includes an estimate of future credit losses expected to be incurred over the life of the portfolio. The primary credit quality indicator for acquired loans is whether there has been a decrease in expected cash flows. Monitoring of this portfolio is ongoing to determine if there is evidence of deterioration in credit quality since acquisition. As of December 31, 2011, there was no allowance for loan losses for acquired loans.
Union Bankshares, Inc.34
The following table provides information with respect to impaired loans by class of loan as of and for the year ended December 31, 2011:
| December 31, 2011 | For The Year Ended December 31, 2011 | ||||||||||||||
| Recorded Investment (1) | Principal Balance (1) | Related Allowance | Average Recorded Investment | Interest Income Recognized | |||||||||||
| (Dollars in thousands) | |||||||||||||||
| With an allowance recorded: | |||||||||||||||
| Residential real estate | $ | 241 | $ | 243 | $ | 55 | |||||||||
| Commercial real estate | 1,907 | 1,930 | 21 | ||||||||||||
| 2,148 | 2,173 | 76 | |||||||||||||
| With no allowance recorded: | |||||||||||||||
| Residential real estate | 177 | 252 | — | ||||||||||||
| Commercial real estate | 318 | 374 | — | ||||||||||||
| 495 | 626 | — | |||||||||||||
| Total: | |||||||||||||||
| Residential real estate | 418 | 495 | 55 | $ | 375 | $ | 5 | ||||||||
| Commercial real estate | 2,225 | 2,304 | 21 | 2,347 | 81 | ||||||||||
| Total | $ | 2,643 | $ | 2,799 | $ | 76 | $ | 2,722 | $ | 86 | |||||
____________________
| (1) | Government guarantees on impaired loans as of December 31, 2011 were $88 thousand. |
The following table provides information with respect to impaired loans by class of loan as of and for the year ended December 31, 2010:
| December 31, 2010 | For The Year Ended December 31, 2010 | ||||||||||||||
| Recorded Investment (1) | Principal Balance (1) | Related Allowance | Average Recorded Investment | Interest Income Recognized | |||||||||||
| (Dollars in thousands) | |||||||||||||||
| With an allowance recorded: | |||||||||||||||
| Residential real estate | $ | 301 | $ | 356 | $ | 43 | |||||||||
| Commercial real estate | 1,970 | 1,974 | 40 | ||||||||||||
| 2,271 | 2,330 | 83 | |||||||||||||
| With no allowance recorded: | |||||||||||||||
| Commercial real estate | 346 | 399 | — | ||||||||||||
| Total: | |||||||||||||||
| Residential real estate | 301 | 356 | 43 | $ | 229 | $ | — | ||||||||
| Commercial real estate | 2,316 | 2,373 | 40 | 2,585 | 85 | ||||||||||
| Commercial | — | — | — | 2 | — | ||||||||||
| Total | $ | 2,617 | $ | 2,729 | $ | 83 | $ | 2,816 | $ | 85 | |||||
____________________
| (1) | Government guarantees on impaired loans as of December 31, 2010 were $110 thousand. |
Union Bankshares, Inc.35
Troubled debt restructured loans as of December 31, 2011 by class of loan include a commercial real estate loan that received a concession with the extension of a due date that was not considered a market transaction to the Company, and residential real estate loans that represent loan modifications in which a concession was provided to the borrower, such as due date or maturity date extensions, interest rate reductions or the forgiveness of accrued interest. Troubled loans, that are restructured and meet established thresholds, are classified as impaired and a specific reserve amount is allocated to the allowance on the basis of the fair value of the collateral for collateral dependent loans, an observable market price, or the present value of anticipated future cash flows.
The following table provides new troubled debt restructure activity by loan type for the year ended December 31, 2011:
| New Troubled Debt Restructurings During the | ||||||||
| Year Ended December 31, 2011 | ||||||||
| Number of Contracts | Pre-Modification Outstanding Recorded Investment | Post-Modification Outstanding Recorded Investment | ||||||
| (Dollars in thousands) | ||||||||
| Residential Real Estate: | ||||||||
Interest rate reduction, forgiveness of accrued interest, protective advance for delinquent taxes, and extension of due date | 1 | $ | 238 | $ | 246 | |||
There were no troubled debt restructured loans modified within the previous twelve months that had subsequently defaulted during the year ended December 31, 2011. Troubled debt restructured loans are considered defaulted at 90 days past due.
At December 31, 2011 and 2010, the Company was not committed to lend any additional funds to borrowers whose loans were nonperforming, impaired or restructured.
Note 8. Premises and Equipment
The major classes of premises and equipment and accumulated depreciation at December 31, were as follows:
| 2011 | 2010 | |||||
| (Dollars in thousands) | ||||||
| Land and land improvements | $ | 2,163 | $ | 1,841 | ||
| Building and improvements | 8,513 | 7,629 | ||||
| Furniture and equipment | 6,405 | 6,056 | ||||
| Construction in progress and deposits on equipment | 245 | 88 | ||||
| 17,326 | 15,614 | |||||
| Less accumulated depreciation | (8,163 | ) | (7,772 | ) | ||
| $ | 9,163 | $ | 7,842 | |||
Depreciation included in Occupancy and Equipment expenses amounted to $692 thousand and $660 thousand for the years ended December 31, 2011 and 2010, respectively.
Union Bankshares, Inc.36
The Company is obligated under noncancelable operating leases for premises that expire in various years through the year 2016. Options to renew for additional periods are available with these leases. Future minimum rental commitments for these leases with original or remaining terms of one year or more at December 31, 2011 were as follows:
| (Dollars in thousands) | |||
| 2012 | $ | 205 | |
| 2013 | 97 | ||
| 2014 | 55 | ||
| 2015 | 38 | ||
| 2016 | 38 | ||
| $ | 433 | ||
Rent expense for 2011 and 2010 amounted to $190 thousand and $115 thousand, respectively. Occupancy expense is shown in the consolidated statements of income, net of rental income of $97 thousand and $121 thousand in 2011 and 2010, respectively.
Note 9. Branch Acquisitions
On May 27, 2011, Union acquired three New Hampshire branch offices of Northway Bank. In the transaction, Union assumed deposit relationships, and acquired performing loans, branch cash, two owned bank branches and leasehold rights to a third branch, and other assets as illustrated below. Union paid a 6% premium on assumed deposits, loans were acquired at par, and the banking facilities were purchased at the most recent tax assessed value. The acquisition allows Union to expand its New Hampshire community banking franchise into western Coos County and to expand its presence in northern Grafton County. The transaction was accounted for as a business combination under current regulatory guidelines.
The May 27, 2011 acquisition-date estimated fair values of assets acquired and liabilities assumed were as follows:
| Assets: | (Dollars in thousands) | ||
| Cash | $ | 29,607 | |
| Loans | 32,910 | ||
| Bank premises and equipment | 517 | ||
| Accrued interest receivable | 197 | ||
| Core deposit intangible | 1,708 | ||
| Goodwill | 2,223 | ||
| Liabilities: | |||
| Deposits | (67,015 | ) | |
| Accrued interest and other liabilities | (147 | ) | |
The purchase premium of $4.2 million was allocated to assets acquired and liabilities assumed based on estimates of fair value at the date of acquisition. The fair value of the deposit accounts assumed was compared to the carrying amounts received and the difference of $1.7 million was recorded as Core deposit intangible. The core deposit intangible, which is amortizable and deductible for tax purposes, is evaluated for impairment whenever circumstances warrant. The excess of the purchase price over the fair value of the assets acquired, liabilities assumed, and the amount allocated for core deposit intangible was recorded as goodwill.
Union Bankshares, Inc.37
The loans acquired were recorded at fair value at the time of acquisition. The fair value of the loans acquired resulted in a loan premium of $545 thousand which is included in the loan balances above, less a nonaccretable credit risk component of $318 thousand. The loan premium will be amortized as an adjustment to the related loan yield over the estimated average life of the loans. Loan premium amortization of $54 thousand has been charged to Interest and fees on loans on the Company's statement of income for the year ended December 31, 2011
Acquisition expenses incurred by the Company were approximately $407 thousand for the year ended December 31, 2011. These one-time expenses are included on the consolidated statements of income under the caption "Branch acquisition expenses."
The Company recorded goodwill of $2.2 million in connection with the branch transaction. The goodwill is not amortizable but is deductible for tax purposes. Management assesses qualitative factors to determine whether the existence of events or circumstances leads to a determination that it is more likely than not that the fair value of the company is less than its carrying amount. Management is not aware of any such events or circumstances that would cause it to conclude that the fair value of the Company is less than its carrying amount.
The core deposit intangible is subject to amortization over the estimated 10 year average life of the acquired core deposit base. The amortization expense is included in other noninterest expense in the consolidated statements of income and is deductible for tax purposes. Amortization expense for the core deposit intangible was $100 thousand from the acquisition date to December 31, 2011. As of December 31, 2011, the remaining amortization expense related to the core deposit intangible, absent any future impairment, is expected to be as follows:
| (Dollars in thousands) | |||
| 2012 | $ | 171 | |
| 2013 | 171 | ||
| 2014 | 171 | ||
| 2015 | 171 | ||
| 2016 | 171 | ||
| Thereafter | 753 | ||
| Total | $ | 1,608 | |
Management will evaluate the core deposit intangible for impairment if conditions warrant.
The amounts of revenue and expenses related to the acquired branches since the May 27, 2011 acquisition date are included in the consolidated statements of income of the Company as follows:
| For The Year Ended December 31, 2011 | |||
| (Dollars in thousands) | |||
| Interest and fees on loans | $ | 1,004 | |
| Interest on deposits and borrowed funds | 319 | ||
Net interest income | 685 | ||
| Provision for loan losses | — | ||
Net interest income after provision for loan losses | 685 | ||
| Noninterest income | 82 | ||
| Noninterest expenses | 972 | ||
Loss before income tax benefit | (205 | ) | |
| Income tax benefit | (70 | ) | |
Net loss | $ | (135 | ) |
Union Bankshares, Inc.38
Disclosure of the proforma revenue and earnings of the combined entity for the current and prior reporting periods as though the acquisition had occurred at the beginning of the prior annual reporting period is not considered practicable. Retrospective application to January 1, 2011 and January 1, 2010 requires assumptions about management's intent in prior periods that cannot be independently substantiated. It is impossible to objectively distinguish information about significant estimates of amounts that provide evidence of circumstances that existed on the dates at which those amounts would be recognized, measured, or disclosed under retrospective application and would have been available when the financial statements for that prior period were issued. The Company is unable to obtain certain information from the seller regarding transfer of deposits among branches and deposit activity since January 1, 2010. It is impracticable to estimate historical information.
Note 10. Other Real Estate Owned
There were 11 properties valued at $1.5 million in other real estate owned at December 31, 2011 and nine properties valued at $1.6 million at December 31, 2010, which were included in Other assets. There was an allowance for losses on other real estate owned of $91 thousand and $47 thousand which have been netted out of the foregoing values at December 31, 2011 and 2010, respectively, and have been charged to earnings in Other expenses on the statement of income in the applicable period.
Note 11. Investment in Real Estate Limited Partnerships
The Company has purchased from time to time various limited partnership interests established to acquire, own and rent residential housing for elderly, low or moderate income individuals in northern Vermont and northwestern New Hampshire. The carrying values of investments carried at equity were $4.5 million and $2.3 million at December 31, 2011 and 2010, respectively. The capital contributions payable related to these investments were $893 thousand and $0 at December 31, 2011 and 2010, respectively, and are included in Accrued interest and other liabilities. The provision for undistributed net losses of the partnerships charged to earnings was $515 thousand for 2011 and $426 thousand for 2010. The federal income tax credits related to these investments were $455 thousand and $380 thousand for the years ended December 31, 2011 and 2010, respectively, and recorded as a reduction of the Provision for income taxes.
Note 12. Deposits
The following is a summary of interest bearing deposits at December 31:
| 2011 | 2010 | |||||
| (Dollars in thousands) | ||||||
| Interest bearing checking accounts | $ | 88,332 | $ | 64,317 | ||
| Savings and money market accounts | 150,726 | 116,069 | ||||
| Time deposits, $100,000 and over | 74,557 | 62,910 | ||||
| Other time deposits | 83,168 | 68,838 | ||||
| $ | 396,783 | $ | 312,134 | |||
Union Bankshares, Inc.39
The following is a summary of time deposits by maturity at December 31, 2011:
| (Dollars in thousands) | |||
| 2012 | $ | 115,564 | |
| 2013 | 23,585 | ||
| 2014 | 12,629 | ||
| 2015 | 2,819 | ||
| 2016 | 3,128 | ||
| $ | 157,725 | ||
Note 13. Borrowed Funds
Borrowed funds were comprised of option advance borrowings from the FHLB of Boston of $22.3 million and $29.0 million and secured customer repurchase agreement sweeps of $6.7 million and $0 at December 31, 2011 and 2010, respectively.
The FHLB option advance borrowings are a mix of straight and callable bullets, balloons and amortizers with maturities through 2027. All of the FHLB borrowings had fixed interest rates ranging from 2.25% to 5.61% at December 31, 2011 and ranging from 0.23% to 5.61% at December 31, 2010. The weighted average interest rates on the borrowings were 4.06% and 4.15% at December 31, 2011 and 2010, respectively.
The contractual payments due for FHLB option advance borrowings as of December 31, 2011 were as follows:
| (Dollars in thousands) | |||
| 2012 | $ | 1,376 | |
| 2013 | 4,891 | ||
| 2014 | 931 | ||
| 2015 | 3,710 | ||
| 2016 | 1,343 | ||
| Thereafter | 10,096 | ||
| $ | 22,347 | ||
As of December 31, 2011, the Bank's total FHLB borrowing capacity, based on its holding of FHLB stock, was $29.9 million of which $7.6 million was unused and available for additional borrowings of either a short-term or long-term nature.
Collateral on FHLB borrowings consists of FHLB of Boston stock purchased by Union, all funds placed on deposit with the FHLB of Boston, qualified first mortgages held by Union, and any additional holdings which may be pledged as security.
Union also maintains a line of credit with a correspondent bank for the purchase of overnight federal funds. As of December 31, 2011, the total available amount on this line was $7.0 million, with no outstanding borrowings. Interest on these borrowings is chargeable at the federal funds rate at the time of the borrowing and is payable daily. Union had no borrowings from the Federal Reserve discount window or on any repurchase agreements at December 31, 2011 or 2010.
Union Bankshares, Inc.40
At December 31, 2011, secured customer repurchase agreement sweeps amounted to $6.7 million. These agreements are collateralized by U.S. Government-sponsored enterprise securities with a book value and fair value of $7.5 million at December 31, 2011. The average daily balance of these repurchase agreement sweeps was $2.7 million during 2011 with a weighted average interest rate of 0.59%. The maximum borrowings outstanding on these agreements during 2011 was $7.4 million. These repurchase agreements mature the next business day and carried a weighted average interest rate of 0.58% as of December 31, 2011. There were no overnight secured customer repurchase agreement sweeps at December 31, 2010 or at anytime during 2010.
Note 14. Income Taxes
The components of the Provision for income taxes for the years ended December 31 were as follows:
| 2011 | 2010 | |||||
| (Dollars in thousands) | ||||||
| Current tax provision | $ | 524 | $ | 1,798 | ||
| Deferred tax provision (benefit) | 595 | (96 | ) | |||
| $ | 1,119 | $ | 1,702 | |||
The total provision for income taxes differs from the amounts computed at the statutory federal income tax rate of 34% primarily due to the following for the years ended December 31:
| 2011 | 2010 | |||||
| (Dollars in thousands) | ||||||
| Computed “expected” tax expense | $ | 2,155 | $ | 2,478 | ||
| Tax exempt interest | (424 | ) | (402 | ) | ||
| Increase in cash surrender value of life insurance | (36 | ) | (26 | ) | ||
| Tax credits | (557 | ) | (380 | ) | ||
| Other | (19 | ) | 32 | |||
| $ | 1,119 | $ | 1,702 | |||
Union Bankshares, Inc.41
Listed below are the significant components of the net deferred tax asset at December 31:
| 2011 | 2010 | |||||
| (Dollars in thousands) | ||||||
| Components of the deferred tax asset | ||||||
| Bad debts | $ | 1,239 | $ | 1,078 | ||
| Nonaccrual loan interest | 307 | 230 | ||||
| Deferred compensation | 417 | 442 | ||||
| Net pension liability | 1,931 | 833 | ||||
| Core deposit intangible | 11 | — | ||||
| Other | 110 | 73 | ||||
| Total deferred tax asset | 4,015 | 2,656 | ||||
| Components of the deferred tax liability | ||||||
| Depreciation | (521 | ) | (353 | ) | ||
| Mortgage servicing rights | (278 | ) | (221 | ) | ||
| Limited partnership investments | (211 | ) | (6 | ) | ||
| Unrealized gain on investment securities available-for-sale | (460 | ) | (90 | ) | ||
| Goodwill | (29 | ) | — | |||
| Total deferred tax liability | (1,499 | ) | (670 | ) | ||
| Net deferred tax asset | $ | 2,516 | $ | 1,986 | ||
Deferred tax assets are recognized subject to management's judgment that it is more likely than not that the deferred tax asset will be realized. Based on the temporary taxable items, historical taxable income and estimates of future taxable income, the Company believes that it is more likely than not that the deferred tax assets at December 31, 2011 will be realized and therefore no valuation allowance is warranted.
Net deferred income tax assets are included in Other assets in the balance sheet at December 31, 2011 and 2010.
Based on management's evaluation, management has concluded that there were no significant uncertain tax positions requiring recognition in the Company's financial statements at December 31, 2011 and 2010. Although the Company is not currently the subject of a tax examination by the Internal Revenue Service (IRS), the Company's tax years ended December 31, 2008 through 2010 are open to examination by the IRS under the applicable statute of limitations. The 2011 tax return has not yet been filed.
The Company may from time to time be assessed interest and/or penalties by federal or state tax jurisdictions, although any such assessments historically have been minimal and immaterial to the Company's financial results. In the event that the Company receives an assessment for interest and/or penalties, it will be classified in the financial statements as Other expenses.
Note 15. Employee Benefit Plans
Defined Benefit Pension Plan: Union sponsors a noncontributory defined benefit pension plan covering all eligible employees. The plan provides defined benefits based on years of service and final average salary. There was a $576 thousand minimum required contribution under the ERISA guidelines for 2011 and none for 2010. Union measures defined benefit plan assets and obligations as of December 31, its fiscal year-end.
Union Bankshares, Inc.42
Union's policy is to accrue annually an amount equal to the actuarially calculated expense for current and estimated future benefits. Union made tax deductible voluntary contributions of $1.4 million and $1.3 million to the pension plan in 2011 and 2010, respectively, over and above the minimum required, which are included in employer contributions below. Information pertaining to the activity in the plan is as follows:
Obligations and funded status at December 31:
| 2011 | 2010 | |||||
| (Dollars in thousands) | ||||||
| Change in projected benefit obligation | ||||||
| Projected benefit obligation at beginning of year | $ | 15,230 | $ | 13,184 | ||
| Service cost | 680 | 578 | ||||
| Interest cost | 838 | 773 | ||||
| Actuarial loss | 3,400 | 986 | ||||
| Benefits paid | (325 | ) | (291 | ) | ||
| Projected benefit obligation at end of year | 19,823 | 15,230 | ||||
| Change in fair value of plan assets | ||||||
| Fair value of plan assets at beginning of year | 12,779 | 10,745 | ||||
| Actuarial (loss) gain on plan assets | (310 | ) | 1,075 | |||
| Employer contributions | 2,000 | 1,250 | ||||
| Benefits paid | (325 | ) | (291 | ) | ||
| Fair value of plan assets at end of year | 14,144 | 12,779 | ||||
| Net liability for pension benefits | $ | (5,679 | ) | $ | (2,451 | ) |
| 2011 | 2010 | |||||
| (Dollars in thousands) | ||||||
| Accumulated benefit obligation at December 31 | $ | 15,556 | $ | 11,983 | ||
The impact of the pension activity for 2011 and 2010 on other comprehensive income (loss) is detailed in Note 23.
The Company uses the alternate amortization method for prior service costs, as provided in FASB ASC Topic 715, Employers' Accounting for Pensions.
Net periodic pension benefit cost for 2011 and 2010 consisted of the following components:
| 2011 | 2010 | |||||
| (Dollars in thousands) | ||||||
| Service cost | $ | 680 | $ | 578 | ||
| Interest cost on projected benefit obligation | 838 | 773 | ||||
| Expected return on plan assets | (876 | ) | (731 | ) | ||
| Amortization of prior service cost | 6 | 6 | ||||
| Amortization of net actuarial loss | 185 | 143 | ||||
| Net periodic pension benefit cost | $ | 833 | $ | 769 | ||
Union Bankshares, Inc.43
It is estimated that the net periodic pension benefit cost for 2012 will include approximately $6 thousand of amortization of prior service cost and $545 thousand of amortization of net actuarial loss.
Weighted average assumptions used to determine pension benefit obligation at December 31, 2011 and 2010 were a rate of compensation increase of 4.25% for 2011 and 4.50% for 2010 and a discount rate of 4.41% at December 31, 2011 and 5.56% at December 31, 2010.
Weighted average assumptions used to determine net periodic pension benefit cost for the years ended December 31, 2011 and 2010 were a discount rate of 5.56% and 6.00%, respectively, a rate of compensation increase of 4.50% for both years and an expected long-term rate of return on plan assets of 6.75% for both years.
The overall expected long-term rate of return on assets is consistent with future expected long-term rate of inflation assumptions as well as consideration of historical asset returns and the current financial marketplace. The return is more conservative than the plan's long-term actual results and is at a level that management believes is sustainable. The 2011 pension benefit obligation discount rate is based on the plan's expected benefit payment stream utilizing December 2011 benchmark pension liability index yield curve spot rates and a review of published high quality bond indices.
Union's pension plan asset allocations at December 31, 2011 and 2010, by asset category based on their fair values were as follows:
| Asset Category | 2011 | 2010 | ||
| Cash and cash equivalents | 5.2 | % | 11.0 | % |
| Interest bearing deposits in banks | 8.6 | % | 9.1 | % |
| Debt securities | 19.1 | % | 19.3 | % |
| Equity securities | 17.8 | % | 11.8 | % |
| Mutual and exchange traded funds | 49.3 | % | 48.8 | % |
| Total | 100.0 | % | 100.0 | % |
The investment philosophy for the pension plan is to prudently invest the assets of the plan and future contributions received in a diversified manner that will ensure the future pension benefits due to participants and beneficiaries over a long-term horizon as well as provide liquidity to pay current benefits. The Trustees of the plan seek to protect the pension plan assets through prudent asset allocation, FDIC insurance on a portion of plan assets, selection of professional asset management and periodic reviews. Investments in stocks and fixed income investments are diversified in a way which is consistent with risk tolerance, investment objectives and current financial market risks.
In order to achieve this goal the investment objective is to maintain a mix of growth and income investments allocated as follows, with no more than 20% of the equity portion of the portfolio invested in foreign equities:
| Equity securities and international mutual funds | 55-70% |
| Debt securities | 30-45% |
| Cash and cash equivalents | 0-5% |
There are no securities of the Company or Union held by the pension plan. The assets of the plan are managed by the Trust & Asset Management Group of Union with the advice of its registered investment adviser, under the guidance of the plan's Trustees. The estimated employer contribution for 2012 is $576 thousand.
Union Bankshares, Inc.44
The fair values of the Company's pension plan investments at December 31, 2011 and 2010, segregated by fair value hierarchy level, are summarized below:
| Fair Value Measurements | ||||||||||||
| December 31, 2011 | ||||||||||||
| Fair Value | Quoted Prices in Active Markets for Identical Assets (Level 1) | Significant Other Observable Inputs (Level 2) | Significant Unobservable Inputs (Level 3) | |||||||||
| (Dollars in thousands) | ||||||||||||
| Interest bearing deposits in banks | $ | 1,219 | $ | 547 | $ | 672 | $ | — | ||||
| U.S. Government | 739 | — | 739 | — | ||||||||
| U.S. Government-sponsored enterprises | 211 | — | 211 | — | ||||||||
| Agency mortgage-backed | 100 | — | 100 | — | ||||||||
| Corporate bonds | 1,645 | 104 | 1,541 | — | ||||||||
| Marketable equity securities: | ||||||||||||
| Information technology | 407 | 407 | — | — | ||||||||
| Financial | 294 | 294 | — | — | ||||||||
| Industrials | 279 | 279 | — | — | ||||||||
| Healthcare | 432 | 432 | — | — | ||||||||
| Consumer | 637 | 637 | — | — | ||||||||
| Energy | 288 | 288 | — | — | ||||||||
| Other | 182 | 182 | — | — | ||||||||
| Mutual and exchange traded funds | 6,935 | 6,935 | — | — | ||||||||
| Total | $ | 13,368 | $ | 10,105 | $ | 3,263 | $ | — | ||||
| Fair Value Measurements | ||||||||||||
| December 31, 2010 | ||||||||||||
| Fair Value | Quoted Prices in Active Markets for Identical Assets (Level 1) | Significant Other Observable Inputs (Level 2) | Significant Unobservable Inputs (Level 3) | |||||||||
| (Dollars in thousands) | ||||||||||||
| Interest bearing deposits in banks | $ | 1,165 | $ | — | $ | 1,165 | $ | — | ||||
| U.S. Government | 981 | — | 981 | — | ||||||||
| U.S. Government-sponsored enterprises | 103 | — | 103 | — | ||||||||
| Agency mortgage-backed | 419 | — | 419 | — | ||||||||
| Corporate bonds | 925 | — | 925 | — | ||||||||
| Marketable equity securities: | ||||||||||||
| Information technology | 266 | 266 | — | — | ||||||||
| Financial | 279 | 279 | — | — | ||||||||
| Industrials | 188 | 188 | — | — | ||||||||
| Healthcare | 223 | 223 | — | — | ||||||||
| Consumer | 323 | 323 | — | — | ||||||||
| Energy | 234 | 234 | — | — | ||||||||
| Mutual and exchange traded funds | 6,238 | 6,238 | — | — | ||||||||
| Total | $ | 11,344 | $ | 7,751 | $ | 3,593 | $ | — | ||||
Union Bankshares, Inc.45
The fair values of the pension plan assets are determined by an independent pricing service which, given the nature of the assets within the portfolio, is able to utilize quoted prices in an active market to value the majority of the assets held. The market inputs sought for assets without a specific quote listed, in approximate order of priority, include benchmark yields, reported trades, broker/dealer quotes, issuer spreads, two-sided markets, benchmark securities, bids, offers and reference data including market research publications that vary by asset class. For certain security types, additional inputs may be used, or some standard inputs may not be applicable. There were no significant transfers in or out of levels 1 and 2 for the year ended December 31, 2011.
The following table summarizes the estimated future benefit payments expected to be paid under the Plan:
| (Dollars in thousands) | |||||
| 2012 | $ | 465 | |||
| 2013 | 513 | ||||
| 2014 | 594 | ||||
| 2015 | 610 | ||||
| 2016 | 615 | ||||
| Years 2017 to 2021 | 3,823 | ||||
Nonqualified Deferred Compensation Plans: The Company and Union have two nonqualified deferred compensation plans for directors and certain key officers. The 2008 Amended and Restated Nonqualified Deferred Compensation Plan of Union Bankshares, Inc. (“2008 Plan”) replaced a 1990 Plan that was not compliant with section 409A of the Internal Revenue Code. The 2008 amendments also included an increase in the amounts to be accrued under the 2008 Plan, subject to vesting requirements in 2009 and 2010, in order to align projected payouts under the 2008 Plan with original commitments made to participants. The Company accrued an expense of $8 thousand in 2011 and $79 thousand in 2010 under the 2008 Plan. The benefit obligations under the 2008 Plan represent general unsecured obligations of the Company and no assets are segregated for such payments. However, the Company and Union have purchased life insurance contracts on the lives of each participant in order to fund these benefits. The benefits accrued under this 2008 Plan aggregated $1.1 and $1.2 million at December 31, 2011 and 2010, respectively, and are included in Accrued interest and other liabilities. The cash surrender value of the life insurance policies purchased to fund the 2008 Plan aggregated $1.6 million at both December 31, 2011 and 2010 and is included in Company-owned life insurance in the Company's consolidated balance sheets.
An Executive Nonqualified Excess Plan was adopted in 2006 for directors and certain key officers. The 2006 Plan is a defined contribution plan which provides a means by which participants may elect to defer receipt of current compensation from the Company or its subsidiary in order to provide retirement or other benefits as selected in the individual adoption agreements. Participants may select among designated reference investments consisting of investment funds, with the performance of the participant's account mirroring the selected reference investment. Distributions are made only upon a qualifying distribution event, which may include a separation from service, death, disability or unforeseeable emergency, or upon a date specified in the participant's deferral election form. The 2006 Plan is intended to comply with the provisions of Section 409A of the Internal Revenue Code. The 2006 Plan is unfunded, representing a general unsecured obligation of the Company of $128 and $100 thousand as of December 31, 2011 and 2010, respectively.
401(k) Plan: Union maintains a defined contribution 401(k) plan under which employees may elect to make tax deferred contributions of up to the IRS maximum from their annual salary. All employees meeting service requirements are eligible to participate in the plan. Company contributions are fully vested after three years of service. Union's employer matching contributions to the plan are at the discretion of the Board of Directors. Employer matching contributions to the plan were $168 and $142 thousand for 2011 and 2010, respectively.
Union Bankshares, Inc.46
Short Term Incentive Performance Plan: On February 3, 2012, the Company adopted the Union Bank Short Term Incentive Performance Plan and adopted annual performance and award targets under the Plan for 2012. Participants will be designated each year by the Union Board, upon recommendation of the Compensation Committee. The performance period is a calendar year, and financial results utilized in establishing performance targets and calculating awards are on a Bank-only basis. Awards (if any) are paid in cash within two and one-half months after the end of the calendar year. Participants do not have a vested right in any award prior to payout.
Note 16. Stock Option Plan
Under the 2008 Incentive Stock Option Plan (“Plan”), the Company's Board of Directors may grant to certain key employees incentive stock options to purchase shares of the Company's common stock. As of December 31, 2011, of the 50,000 shares authorized for option grants under the plan, 37,000 shares remain available for future option grants. The Company's 1998 Incentive Stock Option Plan expired in 2008. As of December 31, 2011, 2,500 options granted under the 1998 Plan remained outstanding and exercisable, with the last of such options expiring December 18, 2012.
The exercise price of the options under both plans is equal to the market price of the stock at the date of grant; therefore, the intrinsic value of the options at the date of the grant is $0. All options have a one year requisite service period, vest after one year, and have a five year contractual term. There were 3,000 options granted in 2011 and 6,000 options granted in 2010. The compensation cost that has been charged against income for the 2008 Plan was $9 thousand for 2011 and $25 thousand for 2010.
The fair value of each option award is estimated on the date of grant using a Black-Scholes based option valuation model. The estimated weighted average grant date fair values for options granted during 2011 and 2010 and the weighted average assumptions used are presented in the following table:
| 2011 | 2010 | |||||
| Fair value per share | $ | 5.20 | $ | 4.17 | ||
| Expected volatility | 52.18 | % | 50.95 | % | ||
| Expected dividends | 5.10 | % | 5.83 | % | ||
| Risk free interest rate | 0.97 | % | 1.32 | % | ||
| Expected term (in years) | 3.00 | 2.75 | ||||
| Vesting periods (in years) | 1.00 | 1.00 | ||||
Expected volatilities are based on historical volatilities of the market value of the Company's stock, and, possibly, other factors. The Company uses historical data to estimate option exercise and employee termination within the valuation model. The expected term of options granted is estimated from past exercise activity, and represents the period of time that granted options are expected to be outstanding. The risk free interest rate for periods within the contractual life of the option is based on the U.S. Treasury yield curve at the time of grant. The expected dividend rate is estimated by annualizing the last dividend paid divided by the closing price of the Company's stock on the grant date of the option.
Union Bankshares, Inc.47
The following summarizes the option activity under the Plans for the year ended December 31, 2011:
| Shares | Weighted Average Exercise Price | Weighted Average Remaining Contractual Term | Period End Aggregate Intrinsic Value | |||||||
| Outstanding at January 1, 2011 | 15,000 | $ | 20.45 | |||||||
| Granted | 3,000 | $ | 19.60 | |||||||
| Exercised | (1,500 | ) | $ | 17.15 | ||||||
| Forfeited/Expired | (2,500 | ) | $ | 22.50 | ||||||
| Outstanding at December 31, 2011 | 14,000 | $ | 18.84 | 2.67 | — | |||||
| Exercisable at December 31, 2011 | 11,000 | $ | 18.64 | 2.20 | — | |||||
Proceeds of $26 thousand were received from the exercise of options for 1,500 shares at $17.15 per share during 2011. The total intrinsic value of the options exercised was $3 thousand. There were no options exercised during 2010.
As of December 31, 2011, there was $6 thousand of unrecognized compensation cost related to nonvested stock based compensation arrangements granted under the 2008 Plan which will be recognized in 2012.
Note 17. Financial Instruments With Off-Balance-Sheet Risk
The Company is a party to financial instruments with off-balance-sheet risk in the normal course of business to meet the financing needs of its customers and to reduce its own exposure to fluctuations in interest rates. These financial instruments include commitments to extend credit, standby letters of credit, interest rate caps and floors written on adjustable-rate loans, commitments to participate in or sell loans, commitments to buy or sell securities, guarantees on certain sold loans and risk-sharing commitments on certain sold loans under the Mortgage Partnership Finance (MPF) program with the FHLB of Boston. At December 31, 2011 and 2010, the Company had binding loan commitments to sell residential mortgages at fixed rates totaling $4.4 million and $169 thousand, respectively. The Company also had a binding loan commitment to sell a commercial real estate loan for $155 thousand at December 31, 2010. The fair market value of these commitments is not material to the Company's financial statements.
Such instruments involve, to varying degrees, elements of credit and interest rate risk in excess of the amount recognized in the balance sheet. The contract or notional amounts of those instruments reflect the extent of involvement the Company has in particular classes of financial instruments and the potential impact on the Company's future financial position, financial performance and cash flow.
The Company's exposure to credit loss in the event of nonperformance by the other party to the financial instrument for commitments to extend credit and standby letters of credit is represented by the contractual notional amount of those instruments. The Company uses the same credit policies in making commitments and conditional obligations as it does for on-balance-sheet instruments. For interest rate caps and floors embedded in adjustable-rate loans, the contract or notional amounts do not represent exposure to credit loss. The Company controls the risk of interest rate cap agreements through credit approvals, limits and monitoring procedures. Interest rate caps and floors on adjustable rate loans permit the Company to manage its interest rate risk and cash flow risk on these loans within parameters established by Company policy.
Union Bankshares, Inc.48
The Company generally requires collateral or other security to support financial instruments with credit risk. The following table shows financial instruments outstanding whose contract amount represents credit risk at December 31:
Contract or Notional Amount | ||||||
| 2011 | 2010 | |||||
| (Dollars in thousands) | ||||||
| Commitments to originate loans | $ | 10,176 | $ | 15,654 | ||
| Unused lines of credit | 59,650 | 44,720 | ||||
| Standby and commercial letters of credit | 1,811 | 1,494 | ||||
| Credit card arrangement | 933 | 838 | ||||
| MPF credit enhancement obligation, net (See Note 18) | 86 | 86 | ||||
| Commitment to purchase investment securities | 504 | — | ||||
| Total | $ | 73,160 | $ | 62,792 | ||
Commitments to extend credit are agreements to lend to a customer as long as there is no violation of any condition established in the contract. Commitments generally have fixed expiration dates within 90 days of the commitment. Unused lines of credit are generally renewable at least annually except for home equity lines which usually have a specified draw period followed by a specified repayment period. Unused lines may have other termination clauses and may require payment of a fee.
Since many of the commitments and lines are expected to expire without being drawn upon, the total commitment amounts do not necessarily represent future cash requirements. The Company evaluates each customer's credit worthiness on a case-by-case basis. The amount of collateral obtained, if deemed necessary by the Company, upon issuance of a commitment to extend credit is based on management's credit evaluation of the customer. Collateral held varies but may include real estate, accounts receivable, inventory, property, plant and equipment and income-producing commercial properties.
Standby letters of credit are conditional commitments issued by the Company to guarantee the performance of a customer to a third party. Those guarantees are issued to support customer's private borrowing arrangements or guarantee the customer's contractual performance on behalf of a third party. The credit risk involved in issuing letters of credit is essentially the same as that involved in extending loans to customers and the Company evaluates each customer's credit worthiness on a case-by-case basis. The fair value of standby letters of credit has not been included in the Company's balance sheets for either year as the fair value is immaterial.
The Company did not hold or issue derivative instruments or hedging instruments during the years ended December 31, 2011 and 2010. The commitment to purchase investment securities reflects management's strategy to put funds to work that were in overnight deposit accounts at December 31, 2011.
Note 18. Commitments and Contingencies
Contingent Liabilities: The Company sells 1-4 family residential loans under the MPF program with FHLB of Boston. Under this program the Company shares in the credit risk of each mortgage, while receiving fee income in return. The Company is responsible for a Credit Enhancement Obligation (CEO) based on the credit quality of these loans. FHLB of Boston funds a First Loss Account (FLA) based on the Company's outstanding MPF mortgage balances. This creates a laddered approach to sharing in any losses. In the event of default, homeowner's equity and private mortgage insurance, if any, are the first sources of repayment; the FHLB of Boston's FLA funds are then utilized, followed by the member's CEO, with the balance the responsibility of FHLB of Boston. These loans meet specific underwriting standards
Union Bankshares, Inc.49
of the FHLB of Boston. The Company had sold $5.0 million in loans through the MPF program that had an outstanding balance of $2.4 million as of December 31, 2011.
The volume of loans sold to the MPF program and the corresponding credit obligation are closely monitored by management. As of December 31, 2011, the notional amount of the maximum contingent contractual liability related to this program was $92 thousand of which $6 thousand has been recorded as a reserve through Accrued interest and other liabilities.
Legal Contingencies: In the normal course of business, the Company is involved in various legal and other proceedings. In the opinion of management, after consulting with the Company's legal counsel, any liability resulting from such proceedings is not expected to have a material adverse effect on the Company’s financial statements.
Note 19. Fair Value Measurements
The following is a description of the valuation methodologies used for the Company’s financial assets that are measured on a recurring basis at estimated fair value:
Investment securities available-for-sale: Certain corporate debt securities, marketable equity securities and mutual funds have been valued using unadjusted quoted prices from active markets and therefore have been classified as level 1. However, the majority of the Company’s investment securities available-for-sale have been valued utilizing level 2 inputs. For these securities, the Company obtains fair value measurements from an independent pricing service. The fair value measurements consider observable data that may include market maker bids, quotes and pricing models. Inputs to the pricing models include recent trades, benchmark interest rates, spreads and actual and projected cash flows.
Assets measured at fair value on a recurring basis at December 31, 2011 and 2010, segregated by fair value hierarchy level, are summarized below:
| Fair Value Measurements | ||||||||||||
Fair Value | Quoted Prices in Active Markets for Identical Assets (Level 1) | Significant Other Observable Inputs (Level 2) | Significant Unobservable Inputs (Level 3) | |||||||||
| (Dollars in thousands) | ||||||||||||
| December 31, 2011: | ||||||||||||
| Investment securities available-for-sale | ||||||||||||
| Debt securities: | ||||||||||||
| U.S. Government-sponsored enterprises | $ | 17,537 | $ | — | $ | 17,537 | $ | — | ||||
| Agency mortgage-backed | 3,386 | — | 3,386 | — | ||||||||
| State and political subdivisions | 12,830 | — | 12,830 | — | ||||||||
| Corporate | 8,293 | 6,229 | 2,064 | — | ||||||||
| Total debt securities | 42,046 | 6,229 | 35,817 | — | ||||||||
| Marketable equity securities | 773 | 773 | — | — | ||||||||
| Mutual funds | 135 | 135 | — | — | ||||||||
| Total | $ | 42,954 | $ | 7,137 | $ | 35,817 | $ | — | ||||
Union Bankshares, Inc.50
| Fair Value Measurements | ||||||||||||
Fair Value | Quoted Prices in Active Markets for Identical Assets (Level 1) | Significant Other Observable Inputs (Level 2) | Significant Unobservable Inputs (Level 3) | |||||||||
| (Dollars in thousands) | ||||||||||||
| December 31, 2010: | ||||||||||||
| Investment securities available-for-sale | ||||||||||||
| Debt securities: | ||||||||||||
| U.S. Government-sponsored enterprises | $ | 4,459 | $ | — | $ | 4,459 | $ | — | ||||
| Agency mortgage-backed | 4,811 | — | 4,811 | — | ||||||||
| State and political subdivisions | 9,393 | — | 9,393 | — | ||||||||
| Corporate | 4,972 | 2,105 | 2,867 | — | ||||||||
| Total debt securities | 23,635 | 2,105 | 21,530 | — | ||||||||
| Marketable equity securities | 45 | 45 | — | — | ||||||||
| Mutual funds | 100 | 100 | — | — | ||||||||
| Total | $ | 23,780 | $ | 2,250 | $ | 21,530 | $ | — | ||||
There were no significant transfers in or out of Levels 1 or 2 for the year ended December 31, 2011. Certain other assets and liabilities are measured at fair value on a nonrecurring basis, that is, the instruments are not measured at fair value on an ongoing basis but are subject to fair value adjustments in certain circumstances (for example, when there is evidence of impairment). Assets and liabilities measured at fair value on a nonrecurring basis in periods after initial recognition, such as investment securities held-to-maturity, other real estate owned, impaired loans and mortgage servicing rights, were not significant at December 31, 2011 or 2010. The Company has not elected to apply the fair value method to any financial assets or liabilities other than those situations where other accounting pronouncements require fair value measurements.
FASB ASC Topic 825, Financial Instruments, requires disclosure of the estimated fair value of financial instruments. Fair value is best determined based upon quoted market prices. However, in many instances, there are no quoted market prices for the Company’s various financial instruments. In cases where quoted market prices are not available, fair values are based on estimates using present value or other valuation techniques. Those techniques are significantly affected by the assumptions used, including the discount rate and estimates of future cash flows. Management’s estimates and assumptions are inherently subjective and involve uncertainties and matters of significant judgment. Changes in assumptions could dramatically affect the estimated fair values.
Accordingly, the fair value estimates may not be realized in an immediate settlement of the instrument. Certain financial instruments and all nonfinancial instruments may be excluded from disclosure requirements. Thus, the aggregate fair value amounts presented may not necessarily represent the actual underlying fair value of all such instruments of the Company.
The following methods and assumptions were used by the Company in estimating its fair value disclosures for financial instruments:
Cash and cash equivalents: The carrying amounts reported in the balance sheet for cash and cash equivalents approximate those assets' fair values.
Union Bankshares, Inc.51
Interest bearing deposits in banks: Fair values for interest bearing deposits in banks are based on discounted present values of cash flows.
Investment securities: Fair values for investment securities are based on quoted market prices, where available. If quoted market prices are not available, fair value measurements consider observable data which may include market maker bids, quotes and pricing models. Inputs to the pricing models include recent trades, benchmark interest rates, spreads and actual and projected cash flows.
Loans and loans held for sale: Fair values of loans are estimated for portfolios of loans with similar financial characteristics and segregated by loan type. For variable-rate loans that reprice frequently and with no significant change in credit risk, fair values are based on carrying amounts. The fair values for other loans (for example, fixed-rate residential, commercial real estate, rental property mortgage loans as well as commercial and industrial loans) are estimated using discounted cash flow analysis, based on interest rates currently being offered for loans with similar terms to borrowers of similar credit quality. Loan fair value estimates include judgments regarding future cash flows, future expected loss experience and risk characteristics. The carrying amounts reported in the balance sheet for loans that are held for sale approximate their estimated fair values. Fair values for impaired loans are estimated using discounted cash flow analysis or underlying collateral values, where applicable.
Accrued interest receivable and payable: The carrying amounts of accrued interest approximate their fair values.
Nonmarketable equity securities: The carrying amounts of the securities approximate their fair value.
Deposits: The fair values disclosed for demand deposits or nonmaturity deposits (for example, checking and savings accounts) are, by definition, equal to the amount payable on demand at the reporting date (that is, their carrying amounts). The carrying amounts of variable-rate time deposits approximate their estimated fair values at the reporting date. The fair values for fixed-rate time deposits are estimated using a discounted cash flow calculation that applies interest rates currently being offered on time deposits to a schedule of aggregated contractual maturities on such time deposits.
Borrowed funds: The fair values of the Company’s long-term debt instruments are estimated using discounted cash flow analysis based on interest rates currently being offered on similar debt instruments. The fair values of the Company’s short-term debt instruments approximate the carrying amounts reported in the balance sheet.
Off-balance-sheet financial instruments: Fair values for off-balance-sheet, credit-related financial instruments are based on fees currently charged to enter into similar agreements, taking into account the remaining terms of the agreements and the counterparties’ credit standing. The only commitments to extend credit that are normally longer than one year in duration are the home equity lines whose interest rates are variable quarterly. The only fees collected for commitments are an annual fee on credit card arrangements and often a flat fee on commercial lines of credit and standby letters of credit. The fair value of off-balance-sheet financial instruments is not significant.
Union Bankshares, Inc.52
As of the balance sheet dates, the estimated fair values and related carrying amounts of the Company's significant financial instruments were as follows:
| December 31, 2011 | December 31, 2010 | |||||||||||
Carrying Amount | Estimated Fair Value | Carrying Amount | Estimated Fair Value | |||||||||
| Financial assets | (Dollars in thousands) | |||||||||||
| Cash and cash equivalents | $ | 24,381 | $ | 24,381 | $ | 14,292 | $ | 14,292 | ||||
| Interest bearing deposits in banks | 24,020 | 24,324 | 14,041 | 14,292 | ||||||||
| Investment securities | 46,954 | 46,952 | 24,280 | 24,282 | ||||||||
| Loans and loans held for sale, net | 425,158 | 415,823 | 378,316 | 373,718 | ||||||||
| Accrued interest receivable | 1,810 | 1,810 | 1,560 | 1,560 | ||||||||
| Nonmarketable equity securities | 1,976 | 1,976 | 1,922 | 1,922 | ||||||||
| Financial liabilities | ||||||||||||
| Deposits | $ | 473,439 | $ | 474,509 | $ | 376,660 | $ | 376,729 | ||||
| Borrowed funds | 29,015 | 33,696 | 28,986 | 30,780 | ||||||||
| Accrued interest payable | 356 | 356 | 389 | 389 | ||||||||
The carrying amounts in the preceding table are included in the balance sheet under the applicable captions.
Note 20. Transactions with Related Parties
The Company has had, and may be expected to have in the future, banking transactions in the ordinary course of business with principal stockholders, directors, principal officers, their immediate families and affiliated companies in which they are principal stockholders (commonly referred to as related parties), all of which have been, in the opinion of management, on the same terms, including interest rates and collateral, as those prevailing at the time for comparable transactions with unrelated parties and which do not represent more than the normal risk of collectability or present other unfavorable features.
Aggregate loan transactions with related parties for the years ended December 31 were as follows:
| 2011 | 2010 | |||||
| (Dollars in thousands) | ||||||
| Balance, January 1, | $ | 3,952 | $ | 1,928 | ||
| New loans and advances on lines | 2,058 | 3,212 | ||||
| Repayments | (1,904 | ) | (3,163 | ) | ||
| Other, net | (314 | ) | 1,975 | |||
| Balance, December 31, | $ | 3,792 | $ | 3,952 | ||
| Balance available on lines of credit or loan commitments | $ | 814 | $ | 788 | ||
None of these loans are past due, are in nonaccrual status or have been restructured to provide a reduction or deferral of interest or principal because of deterioration in the financial position of the borrower. There were no loans to a related party that were considered classified at December 31, 2011 or 2010.
Union Bankshares, Inc.53
Deposit accounts with related parties were $935 thousand and $1.8 million at December 31, 2011 and 2010, respectively. The Union Bank Defined Benefit Pension Plan also invested $77 thousand in FDIC insured certificates of deposit and had an operating demand deposit account with Union totaling $22 thousand at December 31, 2010. The Union Bank Defined Benefit Pension Plan had no certificate of deposit investments with Union and the operating demand deposit account with Union had no balance at December 31, 2011.
Note 21. Regulatory Capital Requirements
The Company (on a consolidated basis) and Union are subject to various regulatory capital requirements administered by the federal banking agencies. Failure to meet minimum capital requirements can initiate certain mandatory - and possibly additional discretionary - actions by regulators that, if undertaken, could have a direct material effect on the Company's and Union's financial statements. Under capital adequacy guidelines and the regulatory framework for prompt corrective action, the Company and Union must meet specific capital guidelines that involve quantitative measures of assets, liabilities and certain off-balance-sheet items as calculated under regulatory accounting practices. The Company's and Union's capital amounts and classification are also subject to qualitative judgments by the regulators about components, risk weightings and other factors.
Quantitative measures established by regulation to ensure capital adequacy require the Company and Union to maintain minimum amounts and ratios (set forth in the table below) of total and Tier I capital (as defined in the regulations) to risk-weighted assets (as defined), and of Tier I capital (as defined) to average assets (as defined). Management believes that, as of December 31, 2011 and 2010, the Company and Union met all capital adequacy requirements to which they were subject.
As of December 31, 2011 and 2010, the most recent notification from the FDIC categorized Union as well capitalized under the regulatory framework for prompt corrective action. To be categorized as well capitalized an insured depository institution must maintain minimum total risk based, Tier I risk based, and Tier I leverage ratios as set forth in the table below. There are no conditions or events since the date of the most recent notification that management believes might result in an adverse change to Union's regulatory capital category. Prompt corrective action provisions are not applicable to bank holding companies.
Union's and the Company's actual capital amounts and ratios are presented in the following tables:
| Actual | Minimum For Capital Requirement | Minimum To be Well Capitalized Under Prompt Corrective Action Provisions | |||||||||||||
| Amount | Ratio | Amount | Ratio | Amount | Ratio | ||||||||||
| (Dollars in thousands) | |||||||||||||||
| As of December 31, 2011 | |||||||||||||||
| Total capital to risk weighted assets | |||||||||||||||
| Union | $ | 44,910 | 12.2 | % | $ | 29,570 | 8.0 | % | $ | 36,963 | 10.0 | % | |||
| Company | 45,091 | 12.2 | % | 29,641 | 8.0 | % | N/A | N/A | |||||||
| Tier I capital to risk weighted assets | |||||||||||||||
| Union | $ | 40,671 | 11.0 | % | $ | 14,789 | 4.0 | % | $ | 22,184 | 6.0 | % | |||
| Company | 40,852 | 11.0 | % | 14,828 | 4.0 | % | N/A | N/A | |||||||
| Tier I capital to average assets | |||||||||||||||
| Union | $ | 40,671 | 7.5 | % | $ | 21,634 | 4.0 | % | $ | 27,042 | 5.0 | % | |||
| Company | 40,852 | 7.5 | % | 21,672 | 4.0 | % | N/A | N/A | |||||||
Union Bankshares, Inc.54
| Actual | Minimum For Capital Requirement | Minimum To be Well Capitalized Under Prompt Corrective Action Provisions | |||||||||||||
| Amount | Ratio | Amount | Ratio | Amount | Ratio | ||||||||||
| (Dollars in thousands) | |||||||||||||||
| As of December 31, 2010 | |||||||||||||||
| Total capital to risk weighted assets | |||||||||||||||
| Union | $ | 47,478 | 15.1 | % | $ | 25,137 | 8.0 | % | $ | 31,422 | 10.0 | % | |||
| Company | 47,639 | 15.1 | % | 25,206 | 8.0 | % | N/A | N/A | |||||||
| Tier I capital to risk weighted assets | |||||||||||||||
| Union | $ | 43,723 | 13.9 | % | $ | 12,573 | 4.0 | % | $ | 18,860 | 6.0 | % | |||
| Company | 43,884 | 13.9 | % | 12,601 | 4.0 | % | N/A | N/A | |||||||
| Tier I capital to average assets | |||||||||||||||
| Union | $ | 43,723 | 9.7 | % | $ | 18,012 | 4.0 | % | $ | 22,514 | 5.0 | % | |||
| Company | 43,884 | 9.7 | % | 18,041 | 4.0 | % | N/A | N/A | |||||||
Dividends paid by Union are the primary source of funds available to the Company for payment of dividends to its stockholders. Union is subject to certain requirements imposed by federal banking laws and regulations, which among other things, establish minimum levels of capital and restrict the amount of dividends that may be distributed by Union to the Company.
Note 22. Treasury Stock
The basis for the carrying value of the Company's treasury stock is the purchase price of the shares at the time of purchase. The Board of Directors previously authorized the repurchase of up to 100,000 shares of common stock, or approximately 2.2%, of the Company's outstanding shares at the authorization date, for an aggregate repurchase cost not to exceed $2.15 million. Shares were repurchased in the open market or in negotiated transactions. The repurchase program ended during the first quarter of 2010 when the 100,000 share level was reached, for a total cost of $2.0 million since the inception of the program, including 500 shares repurchased in 2010, for a total cost of $9 thousand.
On May 20, 2010, Union Bankshares, Inc. announced the adoption of a limited stock repurchase plan to authorize the repurchase of up to 2,500 shares of its common stock each calendar quarter in open market purchases or privately negotiated transactions, as management may deem advisable and as market conditions may warrant. The repurchase authorization for a calendar quarter expires at the end of that quarter to the extent it has not been exercised, and is not carried forward into future quarters. The quarterly repurchase program was reauthorized in December 2011 and will expire on December 31, 2012. The Company repurchased 5,004 shares under this program, for a total cost of $90 thousand in 2010 and no shares in 2011.
In total, during 2010 the Company repurchased 5,504 shares of its common stock at prices ranging from $17.45 to $18.51 per share, for a total of $99 thousand under the authorized repurchase programs.
Union Bankshares, Inc.55
Note 23. Other Comprehensive Income (Loss)
The following comprised Total comprehensive income for the years ended December 31:
| 2011 | 2010 | |||||
| (Dollars in thousands) | ||||||
| Net income | $ | 5,219 | $ | 5,587 | ||
| Investment securities available-for-sale: | ||||||
Net unrealized holding gains (losses) arising during the period on investment securities available-for-sale, net of tax of $432 thousand and $(62) thousand | 839 | (119 | ) | |||
Reclassification adjustment for net gains on investment securities available-for- sale realized in net income, net of tax of $(62) thousand and $(33) thousand | (121 | ) | (65 | ) | ||
| Total | 718 | (184 | ) | |||
| Defined benefit pension plan: | ||||||
| Net unrealized actuarial loss, net of tax of $(1.6) million and $(218) thousand | (3,027 | ) | (424 | ) | ||
Reclassification adjustment for amortization of net actuarial loss realized in net income, net of tax of $63 thousand and $48 thousand | 122 | 94 | ||||
Reclassification adjustment for amortization of prior service cost realized in net income, net of tax of $2 thousand in both years | 4 | 4 | ||||
| Total | (2,901 | ) | (326 | ) | ||
| Total other comprehensive loss | (2,183 | ) | (510 | ) | ||
| Total comprehensive income | $ | 3,036 | $ | 5,077 | ||
The components of Accumulated other comprehensive loss, net of tax, at December 31 are:
| 2011 | 2010 | |||||
| (Dollars in thousands) | ||||||
| Net unrealized gain on investment securities available-for-sale | $ | 892 | $ | 174 | ||
| Defined benefit pension plan: | ||||||
| Net unrealized actuarial loss | (5,231 | ) | (2,327 | ) | ||
| Net unrealized prior service cost | (7 | ) | (10 | ) | ||
| Total | $ | (4,346 | ) | $ | (2,163 | ) |
Note 24. Subsequent Events
Subsequent events represent events or transactions occurring after the balance sheet date but before the financial statements are issued. Financial statements are considered “issued” when they are widely distributed to shareholders and others for general use and reliance in a form and format that complies with GAAP. Events occurring subsequent to December 31, 2011 have been evaluated as to their potential impact to the consolidated financial statements.
Specifically, there are two types of subsequent events:
| • | Those comprising events or transactions providing additional evidence about conditions that existed at the balance sheet date, including estimates inherent in the financial statement preparation process (referred to as recognized subsequent events). |
| • | Those comprising events that provide evidence about conditions not existing at the balance sheet date but, rather, that arose after such date (referred to as nonrecognized subsequent events). |
Union Bankshares, Inc.56
On January 18, 2012, Union Bankshares, Inc. declared a $0.25 per share regular quarterly cash dividend payable February 9, 2012 to stockholders of record on January 28, 2012.
On February 3, 2012, Union Bankshares, Inc. approved the Union Bank Short Term Incentive Performance Plan and adopted annual performance and award targets under the Plan for 2012.
Note 25. Condensed Financial Information (Parent Company Only)
The following condensed financial statements are for Union Bankshares, Inc. (Parent Company Only), and should be read in conjunction with the consolidated financial statements of Union Bankshares, Inc. and Subsidiary.
UNION BANKSHARES, INC. (PARENT COMPANY ONLY)
CONDENSED BALANCE SHEETS
Years Ended December 31, 2011 and 2010
| 2011 | 2010 | |||||
| (Dollars in thousands) | ||||||
| ASSETS | ||||||
| Cash | $ | 69 | $ | 128 | ||
| Investment securities available-for-sale | 121 | 109 | ||||
| Investment in subsidiary - Union | 40,159 | 41,562 | ||||
| Other assets | 788 | 734 | ||||
| Total assets | $ | 41,137 | $ | 42,533 | ||
| LIABILITIES AND STOCKHOLDERS' EQUITY | ||||||
| LIABILITIES | ||||||
| Other liabilities | $ | 798 | $ | 808 | ||
| Total liabilities | 798 | 808 | ||||
| STOCKHOLDERS' EQUITY | ||||||
| Common stock, $2.00 par value; 7,500,000 shares authorized; 4,923,286 shares issued at December 31, 2011 and 4,921,786 shares issued at December 31, 2010 | 9,847 | 9,844 | ||||
| Additional paid-in capital | 276 | 244 | ||||
| Retained earnings | 38,385 | 37,623 | ||||
Treasury stock at cost; 466,082 shares at December 31, 2011 and December 31, 2010 | (3,823 | ) | (3,823 | ) | ||
| Accumulated other comprehensive loss | (4,346 | ) | (2,163 | ) | ||
| Total stockholders' equity | 40,339 | 41,725 | ||||
| Total liabilities and stockholders' equity | $ | 41,137 | $ | 42,533 | ||
The investment in the subsidiary bank is carried under the equity method of accounting. The investment in subsidiary and cash, which is on deposit with Union, have been eliminated in consolidation.
Union Bankshares, Inc.57
UNION BANKSHARES, INC. (PARENT COMPANY ONLY)
CONDENSED STATEMENTS OF INCOME
Years Ended December 31, 2011 and 2010
| 2011 | 2010 | |||||
| (Dollars in thousands) | ||||||
| Revenues | ||||||
| Dividends - bank subsidiary - Union | $ | 4,650 | $ | 4,786 | ||
| Other dividends | 1 | 1 | ||||
| Other income | 22 | 22 | ||||
| Total revenues | 4,673 | 4,809 | ||||
| Expenses | ||||||
| Interest | 26 | 24 | ||||
| Stock based compensation expense | 9 | 25 | ||||
| Administrative and other | 307 | 370 | ||||
| Total expenses | 342 | 419 | ||||
Income before applicable income tax benefit and equity in undistributed net income of subsidiary | 4,331 | 4,390 | ||||
| Applicable income tax benefit | (111 | ) | (133 | ) | ||
| Income before equity in undistributed net income of subsidiary | 4,442 | 4,523 | ||||
| Equity in undistributed net income - Union | 777 | 1,064 | ||||
| Net income | $ | 5,219 | $ | 5,587 | ||
UNION BANKSHARES, INC. (PARENT COMPANY ONLY)
CONDENSED STATEMENTS OF CASH FLOWS
Years Ended December 31, 2011 and 2010
| 2011 | 2010 | |||||
| (Dollars in thousands) | ||||||
| CASH FLOWS FROM OPERATING ACTIVITIES | ||||||
| Net income | $ | 5,219 | $ | 5,587 | ||
Adjustments to reconcile net income to net cash provided by operating activities: | ||||||
| Equity in undistributed net income of Union | (777 | ) | (1,064 | ) | ||
| Stock based compensation expense | 9 | 25 | ||||
| Increase in other assets | (55 | ) | (39 | ) | ||
| (Decrease) increase in other liabilities | (10 | ) | 39 | |||
| Net cash provided by operating activities | 4,386 | 4,548 | ||||
| CASH FLOWS FROM INVESTING ACTIVITIES | ||||||
| Purchases of investment securities available-for-sale | (14 | ) | (16 | ) | ||
| CASH FLOWS FROM FINANCING ACTIVITIES | ||||||
| Dividends paid | (4,457 | ) | (4,458 | ) | ||
| Issuance of common stock | 26 | — | ||||
| Purchase of treasury stock | — | (99 | ) | |||
| Net cash used by financing activities | (4,431 | ) | (4,557 | ) | ||
| Net decrease in cash | (59 | ) | (25 | ) | ||
| CASH | ||||||
| Beginning of year | 128 | 153 | ||||
| End of year | $ | 69 | $ | 128 | ||
| SUPPLEMENTAL SCHEDULE OF CASH FLOW INFORMATION | ||||||
| Interest paid | $ | 26 | $ | 24 | ||
Union Bankshares, Inc.58
Note 26. Quarterly Financial Data (Unaudited)
A summary of financial data for each of the four quarters of 2011 and 2010 is presented below:
| Quarters in 2011 Ended | ||||||||||||
| March 31, | June 30, | Sept. 30, | Dec. 31, | |||||||||
| (Dollars in thousands, except per share data) | ||||||||||||
| Interest income | $ | 5,498 | $ | 5,734 | $ | 6,118 | $ | 6,319 | ||||
| Interest expense | 961 | 1,002 | 1,016 | 929 | ||||||||
| Net interest income | 4,537 | 4,732 | 5,102 | 5,390 | ||||||||
| Provision for loan losses | 150 | 150 | 150 | 325 | ||||||||
| Noninterest income | 1,401 | 1,657 | 2,012 | 2,055 | ||||||||
| Noninterest expenses | 4,580 | 5,019 | 5,145 | 5,029 | ||||||||
| Net income | 1,028 | 1,031 | 1,427 | 1,733 | ||||||||
| Earnings per common share | $ | 0.23 | $ | 0.23 | $ | 0.32 | $ | 0.39 | ||||
| Quarters in 2010 Ended | ||||||||||||
| March 31, | June 30, | Sept. 30, | Dec. 31, | |||||||||
| (Dollars in thousands, except per share data) | ||||||||||||
| Interest income | $ | 5,644 | $ | 5,721 | $ | 5,728 | $ | 5,814 | ||||
| Interest expense | 1,056 | 1,036 | 1,030 | 995 | ||||||||
| Net interest income | 4,588 | 4,685 | 4,698 | 4,819 | ||||||||
| Provision for loan losses | 90 | 90 | 200 | 140 | ||||||||
| Noninterest income | 1,165 | 1,484 | 1,556 | 1,444 | ||||||||
| Noninterest expenses | 4,085 | 4,078 | 4,137 | 4,330 | ||||||||
| Net income | 1,219 | 1,526 | 1,460 | 1,382 | ||||||||
| Earnings per common share | $ | 0.27 | $ | 0.34 | $ | 0.33 | $ | 0.31 | ||||
Union Bankshares, Inc.59
MANAGEMENT'S DISCUSSION AND ANALYSIS OF FINANCIAL CONDITION
AND RESULTS OF OPERATIONS
GENERAL
The following discussion and analysis by management focuses on those factors that, in management's view, had a material effect on the consolidated financial position of Union Bankshares, Inc. ("the Company," "our," "we," "us") and its subsidiary, Union Bank (Union), as of December 31, 2011 and 2010, and its results of operations for the years ended December 31, 2011 and 2010. This discussion is being presented to provide a narrative explanation of the consolidated financial statements and should be read in conjunction with the consolidated financial statements and related notes and with other financial data in the Company's Annual Report on Form 10-K for the year ended December 31, 2011. The purpose of this presentation is to enhance overall financial disclosures and to provide information about historical financial performance and developing trends as a means to assess to what extent past performance can be used to evaluate the prospects for future performance. The Company meets the qualification requirements under Securities and Exchange Commission (SEC) rules for smaller reporting companies, and pursuant to such rules, has elected to present audited statements of income, cash flows and changes in stockholders' equity for each of the preceding two, rather than three, fiscal years. Management is not aware of the occurrence of any events after December 31, 2011 which would materially affect the information presented.
FORWARD-LOOKING STATEMENTS
The Company may from time to time make written or oral statements that are considered “forward-looking statements” within the meaning of the Private Securities Litigation Reform Act of 1995. Forward-looking statements may include financial projections, statements of plans and objectives for future operations, estimates of future economic performance or conditions and assumptions relating thereto. The Company may include forward-looking statements in its filings with the Securities and Exchange Commission (SEC), in its reports to stockholders, including this Annual Report, in press releases, other written materials, and in statements made by senior management to analysts, rating agencies, institutional investors, representatives of the media and others.
Forward-looking statements reflect management's current expectations and are subject to uncertainties, both general and specific, and risk exists that actual results will differ from those predictions, forecasts, projections and other estimates contained in forward-looking statements. These risks cannot be readily quantified. When management uses any of the words “believes,” “expects,” “anticipates,” “intends,” "projects," "potential," “plans,” “seeks,” “estimates,” "targets," "goals," “may,” “could,” “would,” “should,” or similar expressions, they are making forward-looking statements. Many possible events or factors, including those beyond the control of management, could affect the future financial results and performance of the Company. This could cause results or performance to differ materially from those expressed in forward-looking statements. Management has discussed some of the more likely factors that might affect forward-looking statements in this report on Form 10-K. The possible events or factors that might affect the forward-looking statements include, but are not limited to, the following:
| • | Changing bank regulatory conditions, policies or programs in Vermont, New Hampshire or the United States, that could lead to restrictions on activities of banks or changes in laws concerning accounting, taxes, financial reporting, consumer protection, banking and other aspects of the financial services industry, in particular, increase in deposit insurance premiums, assessments or taxes, healthcare and other entitlement program reforms, price controls on services provided, regulation or prohibition of certain income producing activities, changes in the secondary market for bank loan and other products, changes in lien enforcement, or imposition of fair market value accounting; |
| • | General economic conditions including uses of monetary, fiscal or tax policy to stimulate the economy, changes in business conditions or economic instability globally, nationally, or in our market area, including interest rate fluctuations, market fluctuations and perceptions, job creation and unemployment rates, ability to attract or retain customers, real estate market conditions including the valuation of collateral, and inflation or deflation and their effects on the Company or its customers; |
Union Bankshares, Inc.60
| • | Competitive factors, including competition with community, regional and national financial institutions or tax-advantaged credit unions, that may lead to pricing pressures that reduce yields earned on loans or increase rates paid to depositors, loss of valued customers, key employees, increased technology expenditures, increased or decreased liquidity, or other losses; |
| • | Increasing or decreasing interest rate environments, including changes in the slope and level of the yield curve that could lead to decreases in net interest margin, lower net interest and fee income, including lower gains on sales of loans, and changes in the value of our investment securities and pension plan assets, especially if those changes vary from assumptions made by management; and |
| • | Acts or threats of terrorism, war, theft, fraud or natural disasters that could affect the Company's reputation, the business or economic conditions for the Company or its customers, including cyber security breaches and computer viruses. |
When evaluating forward-looking statements to make decisions with respect to the Company, investors and others are cautioned to consider these and other risks and uncertainties, including the events and circumstances discussed under “Recent Developments” below, and are reminded not to place undue reliance on such statements and should not consider any such list of factors to be a complete list of risks or uncertainties. Forward-looking statements speak only as of the date they are made and the Company undertakes no obligation to update them to reflect new or changed information or events, except as may be required by federal securities laws.
RECENT DEVELOPMENTS
Economic data continues to suggest a slow but positive trend towards economic recovery in our market as well as nationally. Total nonagricultural employment in both Vermont and New Hampshire has improved over 1.5% since a year ago and both the number and percentage of unemployed have decreased. In Vermont the statewide unemployment rate has dropped from 5.8% in December 2010 to 5.1% in December 2011, while in New Hampshire it has dropped from 5.6% to 5.1% over the same period. These are the lowest the unemployment rates have been since October of 2008. These rates compare favorably with the national rate of 8.5%. The number of business and consumer bankruptcy filings in 2011 have decreased 31% in Vermont from the prior year to the lowest rate since 2007 with 96% of the filings being consumer and New Hampshire's filings have decreased 13% with 90% of the filings being consumer in the same time frame. Both states have started to see a resurgence in housing permits but the 2011 numbers still lag pre-recession levels. The home price index for December 2011 shows modest appreciation in prices in Vermont while New Hampshire still shows a slight reduction. The percent of delinquent and foreclosed mortgages in Vermont continues to increase slowly but the New Hampshire percentage has started to decrease based on the most recent data available. Vermont and New Hampshire continue to have some of the lowest residential foreclosure and delinquency rates in the country. Demand for construction and purchase mortgage loans was stronger during 2011 than it had been in recent years. The portions of Vermont and New Hampshire served by our branch network did not, with a few exceptions, experience the devastation from Hurricane Irene in August 2011 as did other parts of the two states.
Interest rates remain near historic lows, which has allowed many consumers and commercial customers to reduce their monthly debt payments by refinancing their loans. The Federal Open Market Committee of the Federal Reserve currently anticipates that economic conditions are likely to warrant exceptionally low levels for the federal funds rate until early 2014. Inflation appears controlled but recent global unrest and the related rise in the price of oil may cause an inflationary spiral. Most financial institutions that accepted government support have repaid those funds and the U.S. financial markets appear to be operating more independently now. The positive growth in stock market values has also added to a boost in consumer confidence.
In response to the earlier financial crisis affecting the banking and financial markets, the resulting recession and the changing political environment, many new laws, regulations and programs have been adopted or proposed. We will not attempt to discuss them all within this Annual Report but will mention the ones that continue to have or will have a financial impact on the Company.
Union Bankshares, Inc.61
There have been some positive developments during the last year that have or will impact the Company as follows:
| • | The purchase of three New Hampshire branches in May 2011 and the resulting expansion of our New Hampshire market. |
| • | The April 2011 change in the Federal Deposit Insurance Corporation ("FDIC") insurance assessment base from total deposits to average total assets less tangible equity has reduced Union's assessment costs and has put community banks, which generally rely more heavily on deposits as a funding source, on a more level playing field with national and regional financial institutions. Unfortunately, continuing bank failures (none in Vermont or New Hampshire) continue to weigh on the industry and will keep FDIC assessment rates high for all banks. |
| • | The Financial Accounting Standards Board ("FASB"), citing outreach activities in which "almost all" constituents believe that amortized cost is significantly more relevant for purposes of measuring most loans, agreed to consider amortized cost as a primary attribute (in addition to fair value) for measuring financial instruments. If this change is adopted, loans and debt securities that are held as part of the "customer financing activities of a bank" may continue to be recorded at amortized cost, thereby reducing volatility in a company's financial statements while providing its readers with the most current information. |
| • | Starting July 2011, banks were permitted to pay interest on business checking accounts. Although it may increase our overall cost of funds, this change allows us to compete with nonbanks for business customer funds. Union has developed an interest-bearing deposit product available to business customers. |
| • | The growing recognition by the banking regulators that a one size fits all approach to regulations may not be in the industry's best interest or be adequate to address the attendant risks in each company's business model may bring some regulatory relief to community banks, as evidenced by the new Basel III capital standards and recent risk monitoring and mitigation guidance issued by the federal banking regulators. |
There have been new laws, regulations, and actions proposed or enacted during 2011, or that are still pending that may be problematic for the Company in terms of future earnings and/or operating efficiency. The following are the most relevant:
| • | The Dodd-Frank Consumer Protection and Wall Street Reform Act of 2010 (the "Dodd-Frank Act") represents the most significant revision of financial regulations in decades and bankers continue to be faced with assessing the rules applicable to them, implementing those rules, training of staff and informing customers, as well as assessing the financial impact to their companies. There are still numerous provisions of the Dodd-Frank Act that originally had an effective date of July 21, 2011 for which final regulations or guidance have not yet been issued. |
| • | All ATM's must meet the new Americans with Disabilities Act accessibility standards by March 15, 2012 and we have replaced nonconforming ATM's. |
| • | The establishment of the Consumer Financial Protection Bureau created by the Dodd-Frank Act may lead to conflicting regulatory guidance for community banks and increase regulatory costs and burdens. |
| • | State and national health care reform initiatives may increase employer costs to provide employer sponsored group health care plans to eligible employees. In May 2011, the Governor of Vermont signed a bill into law to provide universal health care through a single payer system. The manner in which the Vermont universal health care mandate will be funded and implemented remains unclear at this time. |
| • | The Durbin amendment to the Dodd-Frank Act, which required the Federal Reserve to set rates for debit card transaction interchange fees, became effective in October 2011. The final rule's interchange fee standard has two components - a base fee cap of 21 cents plus 5 basis points of the transaction amount to cover fraud losses. Even though banks with assets of $10 billion or less are exempt from the interchange pricing provision, the pricing rules will impact the competitive environment for payment systems. |
Union Bankshares, Inc.62
| • | Starting July 2011, banks had to promptly honor customers' requests to decline overdraft coverage from nonelectronic transactions, give consumers the opportunity to affirmatively choose the overdraft payment product that will best meet their needs, monitor accounts and take meaningful and effective action to limit overdraft use by customers as a form of short-term, high-cost credit, institute appropriate daily limits on overdraft fees and not process transactions in a manner designed to maximize the cost for consumers. According to research statistics, only 23% of consumers overdrew their accounts in the past year and most said they only paid one or two fees but banks must conform their practices in accordance with this new guidance. |
| • | Among the new regulations imposed by the Dodd-Frank Act are new residential mortgage provisions that mandate more extensive disclosures, require lenders to offer terms that reasonably reflect the consumers' ability to repay a loan, prohibit mandatory arbitration provisions, add new customer protections for high-cost mortgages and set escrow account and appraisal standards. The relevant regulations promulgated to date regarding these provisions have been implemented by Union. |
| • | As required by SEC regulations, the Company now files its financial statements both in EDGAR format and in eXtensible Business Reporting Language (XBRL), and posts such XBRL information on its website. Ongoing compliance with this mandate requires administrative resources and results in additional costs. |
| • | The Basel III Capital Framework will increase minimum capital levels and add a new capital conservation buffer in the coming years. The Company's ratios continue to be over those minimums. Basel III will also implement a leverage ratio starting in 2013, a liquidity coverage ratio in 2015 and a net stable funding ratio in 2018, but these ratios have yet to be defined. |
| • | On December 31, 2012, the temporary unlimited coverage for noninterest bearing transaction accounts by the FDIC will expire. |
The cost of doing business has continued to increase dramatically in this regulatory environment as the number and extent of new regulations and the speed with which they must be implemented put a strain on bank software and other service providers and staff as well as on customers. Also, the cost of mitigating long term interest rate risk by selling loans to the secondary market continued to increase during 2011 and it is anticipated that this cost will continue to grow as the government sponsored entities continue to work through their own financial problems.
It is not completely clear at this time what impact current or future government sponsored programs, regulations or legislation will have on the Company, its customers or the U.S. and global financial markets, but additional regulatory complexity and allocation of Company resources to deal with it are likely.
RISK FACTORS
The Company, like other financial institutions, is subject to a number of risks, many of which are outside of the Company's direct control, though efforts are made to manage those risks while optimizing returns. Managing those risks is an essential part of successfully managing a financial institution. Risk identification and monitoring are key elements in overall risk management. Among the risks assumed are: (1) credit risk, which is the risk that loan customers or other counterparties will be unable to perform their contractual obligations, (2) market risk, which is the risk that changes in market rates and prices will adversely affect the Company's financial condition or results of operation, (3) liquidity risk, which is the risk that the Company will have insufficient funds or access to funds to meet operational needs, (4) operational risk, which is the risk of loss resulting from inadequate or failed internal processes, people and systems, or from external events, and (5) regulatory risk, which is the risk of loss resulting from new or changing regulations which increases operating costs or restricts business practices.
CRITICAL ACCOUNTING POLICIES
The Company has established various accounting policies which govern the application of U.S. Generally Accepted Accounting Principles (GAAP) in the preparation of the Company's financial statements. Certain accounting policies involve significant judgments and assumptions by management which have a material impact on the reported amount
Union Bankshares, Inc.63
of assets, liabilities, capital, revenues and expenses and related disclosures of contingent assets and liabilities in the consolidated financial statements and accompanying notes. The SEC has defined a company's critical accounting policies as the ones that are most important to the portrayal of the company's financial condition and results of operations, and which require the company to make its most difficult and subjective judgments, often as a result of the need to make estimates on matters that are inherently uncertain. Based on this definition, the Company has identified the accounting policies and judgments most critical to the Company. The judgments and assumptions used by management are based on historical experience and other factors, which are believed to be reasonable under the circumstances. Because of the nature of the judgments and assumptions made by management, actual results could differ from estimates and have a material impact on the carrying value of assets, liabilities, capital, or the results of operations of the Company.
Allowance for loan losses
The Company believes the allowance for loan losses is a critical accounting policy that requires the most significant judgments and estimates used in the preparation of its consolidated financial statements. The appropriate level of the allowance for loan losses is determined quarterly using a consistent, systematic methodology, which analyzes the risk inherent in the loan portfolio. In addition to evaluating the collectability of specific loans when determining the appropriate level of the allowance, management also takes into consideration other qualitative factors such as changes in the mix and size of the loan portfolio, historical loss experience, the amount of delinquencies and loans adversely classified, industry trends and the impact of the local and regional economy on the Company's borrowers. Changes in these qualitative factors may cause management's estimate of the allowance for loan losses to increase or decrease and result in adjustments to the Company's provision for loan losses in future periods. For additional information, see FINANCIAL CONDITION- Allowance for Loan Losses below.
Other than temporary impairment of securities
Given the volatility of the financial markets over the last three years, the decision to recognize other than temporary impairment on investment securities has become more difficult as complete information is not always available and market conditions and other relevant factors are subject to rapid changes. The other than temporary impairment decision is a critical accounting policy for the Company. Accounting guidance requires a company to perform periodic reviews of individual securities in their investment portfolios to determine whether a decline in the value of a security is other than temporary. A review of other than temporary impairment requires companies to make certain judgments regarding the cause and materiality of the decline, its effect on the financial statements and the probability, extent and timing of a valuation recovery, the company's intent and ability to continue to hold the security, and, with respect to debt securities, the likelihood that the company will have to sell the security before its value recovers. Pursuant to these requirements, management assesses valuation declines to determine the extent to which such changes are attributable to (1) fundamental factors specific to the issuer, such as the nature of the issuer and its financial condition, business prospects or other factors or (2) market-related factors, such as interest rates or equity market declines. Declines in the fair value of securities below their costs that are deemed by management to be other than temporary are (1) if equity securities, recorded in earnings as realized losses and (2) if debt securities, recorded in earnings as realized losses to the extent they are deemed credit losses, with noncredit losses recorded in Other comprehensive income (loss). Once an other than temporary loss on a debt or equity security is realized, subsequent gains in the value of the security may not be recognized in income until the security is sold.
Goodwill and branch acquisition
Assets acquired and liabilities assumed are based on fair value estimates. Intangible assets include goodwill, which is the excess of the purchase price over the fair value of net assets acquired. Goodwill is not amortizable. The core deposit intangible resulting from the May 2011 branch purchase, which is an identified intangible asset having a finite useful life, is amortized on a straight line basis over the estimated average life of the core deposit base of 10 years.
Union Bankshares, Inc.64
The Company evaluates the valuation and amortization of the core deposit intangible asset if events occur that could result in possible impairment. Goodwill is evaluated for impairment at least annually, or more frequently as events or circumstances warrant.
Pension liabilities
The Company's defined benefit pension obligation and net periodic benefit cost are actuarially determined based on the following assumptions: discount rate, current and expected future return on plan assets, change in Social Security wage base rate, anticipated mortality rates, Consumer Price Index rate, and rate of increase in compensation levels. The determination of the defined benefit pension obligation and net periodic benefit cost is a critical accounting estimate as it requires the use of estimates and judgments related to the amount and timing of expected future cash outflows for benefit payments and cash inflows for maturities and returns on plan assets as well as Company contributions. Changes in estimates, assumptions and actual results could have a material impact on the Company's financial condition and/or results of operations.
Other
The Company also has other key accounting policies, which involve the use of estimates, judgments and assumptions, that are significant to understanding the results of operations, including the valuation of deferred tax assets, investment securities and other real estate owned (OREO). The most significant accounting policies followed by the Company are presented in Note 1 to the financial statements and in the section below under the caption “FINANCIAL CONDITION” and the subcaptions “Allowance for Loan Losses”, ”Investment Activities” and “Liability for Pension Benefits”. Although management believes that its estimates, assumptions and judgments are reasonable, they are based upon information presently available and can be impacted by events outside the control of the Company. Actual results may differ significantly from these estimates under different assumptions, judgments or conditions.
OVERVIEW
On May 27, 2011, Union Bank completed its acquisition of three New Hampshire branch offices. In the transaction, Union assumed deposit relationships, performing loans, branch cash, two owned bank branches and leasehold rights to a third branch as well as certain other branch assets. Union paid a 6% premium on assumed deposits, loans were acquired at par, and the banking facilities were purchased at the most recent tax assessed value. The pre-tax branch acquisition expenses totaled $407 thousand for 2011. The branch acquisition expenses are mainly legal, data conversion, professional and marketing fees expended to facilitate the purchase of the three New Hampshire branches. There were also expenses incurred to replace customer checkbooks and branch supplies. The branch acquisition included $29.6 million in cash that provided liquidity and has been subsequently invested in interest earning assets.
The prime rate remained at 3.25% throughout 2010 and 2011 while the discount rate was raised from 0.50% to 0.75% in February 2010. The target federal funds range remained at the 0.00% to 0.25% range throughout both years. This is the lowest that the prime rate has been since 1955. The combination of low interest rates and the turmoil in the financial markets over the last three years has added to the challenging environment in which the Company and its sole subsidiary, Union, operates. A regulatory review of Union was satisfactorily completed during the third quarter of 2011 and a Community Reinvestment Act review in 2010 resulted in a rating of outstanding.
The Company's asset quality remained strong compared to the banking industry as a whole, when measured by net charge-offs of 0.08% to average loans not held for sale in 2011, but the level was up slightly from 0.07% in 2010. Net income is down $368 thousand, or 6.6%, to $5.2 million for 2011 from $5.6 million for 2010. Earnings are still solid and above the peer group average with a return on average assets of 1.04% and a return on average equity of 12.47% for 2011. The Company also out-performed the SNL Bank $250 million-$500 million index for 2011 and over the last five years has had a higher total return performance than the SNL Bank $250 million-$500 million index.
Union Bankshares, Inc.65
Earnings per share decreased to $1.17 in 2011 from $1.25 in 2010. Dividends per share of $1.00 were paid out in both 2011 and 2010. The Company remained well capitalized under regulatory guidelines after payment of dividends. The Company's return on average equity decreased in 2011 to 12.47% from 2010 at 13.37%. The decline in the Company's capital ratio was due to the reduction in net income for 2011. A large part of the reduction was due to the one time branch acquisition expenses.
Historically, the largest and most variable source of income for the Company is net interest income. The results of operations for the years ended December 31, 2011 and 2010 reflect the impact of changes in rates as well as growth in the volume and change in composition of both interest earning assets and interest bearing liabilities during these periods.
The Company's average assets grew by $59.9 million, or 13.5%, during 2011 to an average of $503.6 million from $443.6 million in 2010. A large portion of the increase was due to the New Hampshire branch acquisitions. Net interest income increased from $18.8 million in 2010 to $19.8 million in 2011. The net $971 thousand increase resulted from two factors: (1) an increase of $2.3 million between years due to the increased volume of interest earning assets over and above the increased volume of interest bearing liabilities, and (2) a decrease between years of $1.3 million due to the cumulative effect of the decrease in rates earned on interest earning assets over and above the decrease in rates paid on interest bearing liabilities. See Yields Earned and Rates Paid and the Rate/ Volume Analysis tables on page 70 and page 71, respectively, for further details.
Average earning assets grew from $418.0 million in 2010 to $473.3 million in 2011, or 13.2%. Residential real estate and other retail loan originations exceeded $127 million in 2011, excluding loans acquired in the branch acquisitions, compared to originations of $71 million in 2010, and new commercial real estate loan growth was strong. The Company continued to manage growth and interest rate risk during 2011 through the sale of $80.1 million in long-term fixed-rate residential loans, the sale of $293 thousand in commercial real estate loans and net participations out of $4.1 million in commercial real estate loans. The Company realized $1.6 million in net gains on sales of loans held for sale in 2011 compared to $736 thousand in 2010. The historically low prime rate and low long-term mortgage rates throughout 2011 drove customer refinancings and also contributed to the 33 basis point, or 7.1%, decrease in the net interest margin, to 4.29% for 2011 as compared to 4.62% for 2010.
Despite the weakened economy, loan demand was steady in 2011, with total loan growth of $47.3 million, or 12.4%, over 2010, net of loan sales of $80.4 million in 2011 compared to loan sales of $52.7 million for 2010. Residential real estate loans grew $14.9 million, or 11.2%, net of loans sold, commercial real estate loans grew $22.7 million, or 13.6%, and construction real estate loans grew $9.5 million, or 51.1%. A portion of the increase in the loan portfolio is due to the expansion of the branch network through the three branches acquired in northwestern New Hampshire. The net carrying value of the acquired loans included in the December 31, 2011 loan balances totaled $27.9 million. Loans in nonaccrual status were up between years at $4.3 million at December 31, 2011 versus $2.8 million at December 31, 2010. Other nonperforming loans increased to $1.9 million at December 31, 2011 from $806 thousand at December 31, 2010; $730 thousand of those loans at December 31, 2011 were covered by guarantees of U.S. government agencies. The ratio of net charge-offs to average loans not held for sale was 0.08% for 2011 compared to 0.07% for 2010. The Company's ratio of allowance for loan losses to loans not held for sale was 1.00% at both December 31, 2011 and 2010. The December 31, 2011 allowance for loan losses to loans not purchased and not held for sale was 1.07%. The ratio of allowance for loan losses to nonperforming loans had decreased to 68.11% at December 31, 2011 from 104.36% at December 31, 2010. The increase in the 2011 provision to $775 thousand from $520 thousand in 2010 reflects the increased volume of loans, the composition of the loan portfolio, net charge offs, the general economy and management's assessment of credit quality.
Union Bankshares, Inc.66
Deposits at year end, December 31, 2011 were up $96.8 million, or 25.7%. This increase reflected the acquisition of deposit accounts with balances of $67.0 million at the time of acquisition, of which $3.2 million were in the form of deposits linked to overnight collateralized repurchase sweeps. The deposits and overnight collateralized repurchase sweeps at the acquired branches have increased $4.4 million since May 27, 2011. In addition to the acquired deposits, all deposit categories except time deposits have grown since December 31, 2010. Average deposit growth for the year was $58.1 million, or 15.8%, as the economic turmoil and volatile financial markets over the last three years sent deposit dollars back to the safety of FDIC insured depository institutions and the stability of a local community bank. The growth in average deposits was $10.6 million, or 3.0%, in 2010. Interest rates paid on deposits and interest rates earned on loans have dropped steadily over the last three years and these factors combined to decrease the net interest spread 28 basis points from 4.39% in 2010 to 4.11% in 2011, as the average rate paid on interest bearing liabilities dropped 21 basis points from 1.21% to 1.00% from 2010 to 2011, while the average rate earned on interest earning assets dropped 49 basis points from 5.60% to 5.11% over the same time frame. The Company increased the average volume in all categories of interest earning assets except interest bearing deposits in banks. The growth in deposits was utilized to support the growth in interest-earning assets, as the growth in deposits exceeded loan growth, in large part due to the amount of deposits assumed in the branch acquisition versus the amount of the loans acquired.
The Company continues to focus on customer service and its core business of community banking to provide products and services to the communities it serves, including the markets for its newly acquired branches in Groveton, Littleton and North Woodstock, New Hampshire, and to enhance the delivery of products and services by adopting new technologies as appropriate.
The Company's total capital decreased from $41.7 million at December 31, 2010 to $40.3 million at December 31, 2011. The decrease in total capital is mainly due to the annual adjustment to the Company's pension plan based on the projected benefit obligations of the plan. For additional details regarding the effects of this adjustment see Liability for Pension Benefits and Capital Resources. Capital ratios, while continuing to meet the regulatory guidelines for well capitalized, all dropped as of December 31, 2011 due to the application of accounting standards required for branch acquisitions. The total risk based capital ratio at December 31, 2010 was 15.12% and had dropped to 12.17% at December 31, 2011 . The regulatory guideline for well capitalized is 10.0% and the minimum requirement is 8.0%. The Company's pension benefit obligations and net periodic benefit cost are actuarially determined annually by an independent, certified actuary. The Company had a net unfunded liability for pension benefits for its defined benefit pension plan of $5.7 million at December 31, 2011. At December 31, 2010, there was a net unfunded pension liability of $2.5 million. The main reason for the increase in the pension liability between years was attributable to the decrease in the discount rate utilized to calculate the present value of the pension obligation from 5.56% at December 31, 2010 to 4.41% at December 31, 2011 and the losses on plan investments for the year. The effect of these items was partially offset by a decrease in the expected rate of compensation increases from 4.50% in 2010 to 4.25% for 2011 and the $2.0 million contribution to the plan by Union in 2011. The 2011 actuarially computed net periodic benefit cost expensed in 2011 was $833 thousand compared to $769 thousand in 2010, or an increase of 8.3%. The accounting requirements mandate that all calculations are as of the last day of the fiscal year. The anticipated 2012 expense will be $1.4 million compared to the 2011 expense of $833 thousand and the 2010 expense of $769 thousand. See Liability for Pension Benefits on Page 88 for further information.
The regulatory environment of the past few years, including the federal Sarbanes-Oxley Act of 2002 and the changes discussed in Recent Developments, has placed an extensive burden on small publicly traded companies as there are few significant differences in the requirements because of size, complexity of operations and products, nor is any relief provided to banking companies despite the significant regulatory oversight to which the banking industry is already subject from states, the FDIC and the Federal Reserve. The additional requirements add to operating costs and divert management somewhat from the objectives of growing and strengthening the business. Banks also spend a significant amount of time and dollars complying with the US Patriot Act and the Bank Secrecy Act to protect the U.S. financial system and their customers against identity theft, anti-money laundering, and terrorism. The cost of doing business as a community bank continued to increase throughout 2011 and there does not seem to be any relief in sight for the future.
Union Bankshares, Inc.67
The following per share information and key ratios depict several measurements of performance or financial condition for or at the years ended December 31, 2011 and 2010, respectively:
| 2011 | 2010 | |||||
| Return on average assets (ROA) | 1.04 | % | 1.26 | % | ||
| Return on average equity (ROE) | 12.47 | % | 13.37 | % | ||
| Net interest margin (1) | 4.29 | % | 4.62 | % | ||
| Efficiency ratio (2) | 72.61 | % | 67.32 | % | ||
| Net interest spread (3) | 4.11 | % | 4.39 | % | ||
| Total loans to deposits ratio | 90.66 | % | 101.39 | % | ||
| Net loan charge-offs to average loans not held for sale | 0.08 | % | 0.07 | % | ||
| Allowance for loan losses to loans not held for sale (4) | 1.00 | % | 1.00 | % | ||
| Nonperforming assets to total assets (5) | 1.39 | % | 1.15 | % | ||
| Equity to assets | 7.30 | % | 9.19 | % | ||
| Total capital to risk weighted assets | 12.17 | % | 15.12 | % | ||
| Book value per common share | $ | 9.05 | $ | 9.36 | ||
| Earnings per common share | $ | 1.17 | $ | 1.25 | ||
| Dividends paid per common share | $ | 1.00 | $ | 1.00 | ||
| Dividend payout ratio (6) | 85.47 | % | 80.00 | % | ||
____________________
| (1) | The ratio of tax equivalent net interest income to average earning assets. See page 70 for more information. |
| (2) | The ratio of noninterest expense ($19.8 million in 2011 and $16.6 million in 2010) to tax equivalent net interest income ($20.3 million in 2011 and $19.3 million in 2010) and noninterest income ($7.1 million in 2011 and $5.6 million in 2010) excluding securities gains ($183 thousand in 2011 and $98 thousand in 2010). |
| (3) | The difference between the average rate earned on earning assets and the average rate paid on interest bearing liabilities. See page 70 for more information. |
| (4) | Calculation includes the net carrying amount of loans recorded at fair value from the branch acquisitions as of December 31, 2011 ($27.9 million). Excluding such loans, the allowance for loan losses to loans not purchased and not held for sale was 1.07% at December 31, 2011. |
| (5) | Nonperforming assets are loans or investment securities that are in nonaccrual or 90 or more days past due as well as other real estate or assets owned. |
| (6) | Cash dividends declared and paid per common share divided by consolidated net income per share. |
RESULTS OF OPERATIONS
The Company's net income for the year ended December 31, 2011, was $5.2 million compared with net income of $5.6 million for the year 2010. Pressure on the net interest margin continued due to the prevailing low interest rate environment and the net interest margin decreased 33 basis points from 4.62% for 2010 to 4.29% for 2011. Earnings per share decreased to $1.17 in 2011 from $1.25 in 2010, reflecting the combined effect of the following income and expense items: Net interest income increased $971 thousand, or 5.2%, with a 13.2% growth in average interest earning assets, accounting for a 15¢ increase in earnings per share. The Provision for loan losses increased $255 thousand, or 49.0%, accounting for a 4¢ decrease in earnings per share. Noninterest income increased $1.5 million, or 26.1%, accounting for a 22¢ increase in earnings per share. Noninterest expense increased $3.1 million, or 18.9%, accounting for a 46¢ decrease in earnings per share. Of the $3.1 million increase in total noninterest expense, $394 thousand, or 6¢ per share, represented the increase in direct branch acquisition expenses between periods. The provision for income taxes decreased $583 thousand, or 34.3%, accounting for a 13¢ increase in earnings per share.
Union Bankshares, Inc.68
Net Interest Income. The largest component of the Company’s operating income is net interest income, which is the difference between interest and dividend income received from interest earning assets and the interest expense paid on interest bearing liabilities. The Company's level of net interest income can fluctuate over time due to changes in the level and mix of interest earning assets and interest bearing liabilities and from changes in the yields earned and costs of funds. The Company’s net interest income increased $971 thousand, or 5.2%, to $19.8 million for the year ended December 31, 2011, from $18.8 million for the year ended December 31, 2010. This increase was due primarily to the increase in interest income of $762 thousand from $22.9 million in 2010 to $23.7 million in 2011 and the decrease in interest expense of $209 thousand from $4.1 million in 2010 to $3.9 million in 2011. Both years reflected the historically low 3.25% prime rate. Yields dropped as adjustable rate loans repriced at lower rates, existing loans were refinanced and new loans and investments originated at lower rates. However, the effect of this continuing decrease in yields was offset by the growth in average interest earning assets to $473.3 million in 2011 from $418.0 million in 2010.
On average for the year, 94.0% of assets earned interest in 2011 compared to 93.8% in 2010. The net interest spread decreased to 4.11% for the year ended December 31, 2011, from 4.39% for the year ended December 31, 2010, as the continued low flat interest rate environment caused rates to drop more rapidly on interest earning assets than on interest paying liabilities, where rates were already near historic lows coming into 2011. The net interest margin for the 2011 period decreased 33 basis points to 4.29% from 4.62% for the 2010 period, reflecting the change in the composition of interest earning assets during 2011 mainly due to the impact of the May 2011 branch acquisitions and the effect of a decrease in average interest rates earned on interest earning assets, which was only partially offset by the decrease in the average interest paid on interest bearing liabilities.
Yields Earned and Rates Paid. The following table shows for the periods indicated the total amount of income recorded from average interest earning assets, the related average tax equivalent yields, the interest expense associated with average interest bearing liabilities, the related average rates paid, and the resulting tax equivalent net interest spread and margin. Yield and rate information is average information for the year, and is calculated by dividing the tax equivalent income or expense item for the year by the average balance of the appropriate balance sheet item for that year. Net interest margin is tax equivalent net interest income divided by average earning assets. Nonaccrual loans or investments are included in asset balances for the appropriate periods, but recognition of interest on such loans or investments is discontinued and any remaining accrued interest receivable is reversed in conformity with federal regulations.
Tax exempt interest income amounted to $1.3 million and $1.2 million for the years ended December 31, 2011 and 2010, respectively. The following table presents the effect of tax-exempt income on the calculation of the net interest income, using a marginal tax rate of 34% for 2011 and 2010:
| Years Ended December 31, | ||||||
| 2011 | 2010 | |||||
| (Dollars in thousands) | ||||||
| Net interest income as presented | $ | 19,761 | $ | 18,790 | ||
| Effect of tax-exempt interest | ||||||
| Investment securities | 136 | 126 | ||||
| Loans | 390 | 374 | ||||
| Net interest income, tax equivalent | $ | 20,287 | $ | 19,290 | ||
Union Bankshares, Inc.69
The following table presents an analysis of net interest income and illustrates interest income earned and interest expense paid for each major component of interest earning assets and interest bearing liabilities:
| Years Ended December 31, | ||||||||||||||||
| 2011 | 2010 | |||||||||||||||
Average Balance | Interest Earned/ Paid | Average Yield/ Rate | Average Balance | Interest Earned/ Paid | Average Yield/ Rate | |||||||||||
| (Dollars in thousands) | ||||||||||||||||
| Average Assets: | ||||||||||||||||
| Federal funds sold and overnight deposits | $ | 18,578 | $ | 34 | 0.18 | % | $ | 13,390 | $ | 22 | 0.16 | % | ||||
| Interest bearing deposits in banks | 16,596 | 309 | 1.86 | % | 17,852 | 411 | 2.30 | % | ||||||||
| Investment securities (1), (2) | 34,625 | 1,051 | 3.44 | % | 24,564 | 1,012 | 4.63 | % | ||||||||
| Loans, net (1), (3) | 401,625 | 22,269 | 5.64 | % | 360,261 | 21,462 | 6.06 | % | ||||||||
| Nonmarketable equity securities (4) | 1,924 | 6 | 0.29 | % | 1,922 | — | — | |||||||||
| Total interest earning assets (1) | 473,348 | 23,669 | 5.11 | % | 417,989 | 22,907 | 5.60 | % | ||||||||
| Cash and due from banks | 5,683 | 5,097 | ||||||||||||||
| Premises and equipment | 8,513 | 7,915 | ||||||||||||||
| Other assets | 16,022 | 12,637 | ||||||||||||||
| Total assets | $ | 503,566 | $ | 443,638 | ||||||||||||
| Average Liabilities and Stockholders' Equity: | ||||||||||||||||
| Interest bearing checking accounts | $ | 74,862 | $ | 171 | 0.23 | % | $ | 62,094 | $ | 139 | 0.22 | % | ||||
| Savings/money market accounts | 141,136 | 554 | 0.39 | % | 120,469 | 624 | 0.52 | % | ||||||||
| Time deposits | 144,494 | 2,100 | 1.45 | % | 130,384 | 2,214 | 1.70 | % | ||||||||
| Borrowed funds | 29,621 | 1,083 | 3.61 | % | 27,066 | 1,140 | 4.16 | % | ||||||||
| Total interest bearing liabilities | 390,113 | 3,908 | 1.00 | % | 340,013 | 4,117 | 1.21 | % | ||||||||
| Noninterest bearing deposits | 66,389 | 55,829 | ||||||||||||||
| Other liabilities | 5,195 | 6,019 | ||||||||||||||
| Total liabilities | 461,697 | 401,861 | ||||||||||||||
| Stockholders' equity | 41,869 | 41,777 | ||||||||||||||
| Total liabilities and stockholders’ equity | $ | 503,566 | $ | 443,638 | ||||||||||||
| Net interest income | $ | 19,761 | $ | 18,790 | ||||||||||||
| Net interest spread (1) | 4.11 | % | 4.39 | % | ||||||||||||
| Net interest margin (1) | 4.29 | % | 4.62 | % | ||||||||||||
____________________
| (1) | Average yields reported on a tax equivalent basis using a marginal tax rate of 34%. |
| (2) | Average balances of investment securities are calculated on the amortized cost basis and include nonaccrual securities, if applicable. |
| (3) | Includes loans held for sale as well as nonaccrual loans, unamortized costs and unamortized premiums and is net of the allowance for loan losses. |
| (4) | Dividends on the Federal Home Loan Bank (FHLB) of Boston stock were suspended effective the fourth quarter of 2008 and resumed during the first quarter of 2011. |
Union Bankshares, Inc.70
Rate/Volume Analysis. The following table describes the extent to which changes in average tax equivalent interest rates and changes in volume of average interest earning assets and interest bearing liabilities have affected the Company's interest income and interest expense during the period indicated. For each category of interest earning assets and interest bearing liabilities, information is provided on changes attributable to:
| • | changes in volume (change in volume multiplied by prior rate); |
| • | changes in rate (change in rate multiplied by prior volume); and |
| • | total change in rate and volume. |
Changes attributable to both rate and volume have been allocated proportionately to the change due to volume and the change due to rate.
Year Ended December 31, 2011 Compared to Year Ended December 31, 2010 Increase/(Decrease) Due to Change In | |||||||||
| Volume | Rate | Net | |||||||
| (Dollars in thousands) | |||||||||
| Interest earning assets: | |||||||||
| Federal funds sold and overnight deposits | $ | 10 | $ | 2 | $ | 12 | |||
| Interest bearing deposits in banks | (27 | ) | (75 | ) | (102 | ) | |||
| Investment securities | 390 | (351 | ) | 39 | |||||
| Loans, net | 2,391 | (1,584 | ) | 807 | |||||
| FHLB of Boston stock | — | 6 | 6 | ||||||
| Total interest earning assets | $ | 2,764 | $ | (2,002 | ) | $ | 762 | ||
| Interest bearing liabilities: | |||||||||
| Interest bearing checking accounts | $ | 28 | $ | 4 | $ | 32 | |||
| Savings/money market accounts | 96 | (166 | ) | (70 | ) | ||||
| Time deposits | 225 | (339 | ) | (114 | ) | ||||
| Borrowed funds | 100 | (157 | ) | (57 | ) | ||||
| Total interest bearing liabilities | $ | 449 | $ | (658 | ) | $ | (209 | ) | |
| Net change in net interest income | $ | 2,315 | $ | (1,344 | ) | $ | 971 | ||
Interest and Dividend Income. The Company’s interest and dividend income increased $762 thousand, or 3.3%, to $23.7 million for the year ended December 31, 2011, from $22.9 million for the year ended December 31, 2010. Average earning assets increased $55.4 million, or 13.2%, from $418.0 million at December 31, 2010 to $473.3 million at December 31, 2011. Average loans were $401.6 million for the year ended December 31, 2011 compared to $360.3 million for the year ended December 31, 2010, which is an increase of $41.4 million, or 11.5%. The effect of the increase in average loan volume, which included average loans in the branches acquired of $18.4 million, was partially offset by the 42 basis point decrease in average yield. The average yield on the loan portfolio decreased from 6.06% for the year ended December 31, 2010 to 5.64% for the year ended December 31, 2011, as the prime rate remained flat at 3.25% for both 2011 and 2010. The continued low rate environment throughout 2011 resulted in many customers refinancing or new customers receiving loans at lower interest rates, while at the same time adjustable rate loans repriced downward. This yield reduction accounted for a $1.6 million drop in loan interest income, which was more than offset by an increase of $2.4 million due to increased volume resulting in total loan interest income of $22.3 million for 2011 compared to $21.5 million for 2010. The Company has continued the sale of qualified residential loans to mitigate long-term interest rate risk.
Union Bankshares, Inc.71
The average balance of investments (including mortgage-backed securities) increased $10.1 million, or 41.0%, from $24.6 million for the year ended December 31, 2010, to $34.6 million for the year ended December 31, 2011. The yield on the investment portfolio decreased from 4.63% for 2010 to 3.44% for 2011, or 119 basis points. The average balance of federal funds sold and overnight deposits increased $5.2 million, or 38.7%, from $13.4 million for the year ended December 31, 2010 to $18.6 million for the year ended December 31, 2011. The average yield on federal funds sold and overnight deposits increased slightly, from 0.16% for 2010 to 0.18% for 2011, as the Federal Funds target rate set by the Federal Open Market Committee of the Federal Reserve dropped to between 0.00% and 0.25% in late 2008 and stayed at that level throughout 2010 and 2011. The average balance of interest bearing deposits in banks decreased $1.3 million, or 7.0%, to $16.6 million for the year ended December 31, 2011 from $17.9 million for the year ended December 31, 2010. These deposits are FDIC insured. The average yield on interest bearing deposits in banks decreased from 2.30% for 2010 to 1.86% for 2011, or 44 basis points, reflecting the low interest rate environment during the last two years and the shortness of the duration of the portfolio as we anticipate an eventual rise in interest rates. The FHLB of Boston implemented a quarterly dividend restriction under their 2009 capital plan which eliminated the dividends received by Union on its Class B common stock investment, in 2010. However, the FHLB of Boston resumed the payment of dividends in March 2011 at a modest rate, resulting in a yield for 2011 of 0.29%. Interest income from nonloan instruments decreased $45 thousand, or 3.1%, between years, with $1.4 million in income for both 2011 and 2010, reflecting the overall decrease in average yields on interest bearing deposits and investment securities. The average volume of nonloan interest bearing asset categories increased from $57.7 million for the year ended December 31, 2010 to $71.7 million for the year ended December 31, 2011 but the increased volume was not enough to offset the drop in yields.
Interest Expense. The Company’s interest expense decreased $209 thousand, or 5.1%, to $3.9 million for the year ended December 31, 2011, from $4.1 million for the year ended December 31, 2010. The decrease was attributable to lower rates on all interest bearing liabilities except certain interest bearing checking accounts acquired with the New Hampshire branch acquisitions despite a rise in the average balances in all categories for the year ended December 31, 2011.
Interest expense on deposits decreased $152 thousand, or 5.1%, from $3.0 million for the year ended December 31, 2010 to $2.8 million for the year ended December 31, 2011. Interest rates paid in 2011 decreased for all categories of interest bearing liabilities except interest bearing checking accounts. Interest rates dropped significantly during the last two years as it became apparent that the low interest rate environment was not going to be of a short duration. Average interest bearing liabilities increased $50.1 million, or 14.7%, from $340.0 million for the year ended December 31, 2010 to $390.1 million for the year ended December 31, 2011, including an increase of $35.7 million attributable to the interest bearing deposits in the branches acquired on May 27, 2011. Average interest bearing checking accounts increased $12.8 million, or 20.6%, from $62.1 million for the year ended December 31, 2010 to $74.9 million for the year ended December 31, 2011. The average volume of interest bearing checking accounts in the acquired branches was $8.5 million for the year ended December 31, 2011. The average balances of savings and money market accounts increased $20.7 million, or 17.2%, from $120.5 million for the year ended December 31, 2010 to $141.1 million for the year ended December 31, 2011. The average volume of savings and money market accounts in the acquired branches was $11.4 million for the year ended December 31, 2011. Average time deposits increased $14.1 million, or 10.8%, to $144.5 million for 2011 from $130.4 million for 2010. The average volume of time deposits in the branches acquired was $15.8 million for the year ended December 31, 2011. The average rate paid on interest bearing deposits decreased 17 basis points from 0.95% in 2010 to 0.78% in 2011. The average balance of borrowed funds increased $2.6 million, or 9.4%, from $27.1 million for the year ended December 31, 2010, to $29.6 million for the year ended December 31, 2011. The average rate paid for borrowed funds decreased from 4.16% for the year ended December 31, 2010 to 3.61% for the year ended December 31, 2011.
Provision for Loan Losses. The provision for loan losses increased from $520 thousand in 2010 to $775 thousand in 2011 due to increased loan volume in 2011 and management's evaluation of the collectability of the loan portfolio through its assessment of credit quality, composition and size of the loan portfolio, historical loss experience and current economic conditions and risks, including the impact of the loan demand, the real estate market in our region, and general economic conditions. Refer to Asset Quality and Allowance for Loan Losses sections below for a more in depth discussion.
Union Bankshares, Inc.72
Noninterest Income. The following table sets forth changes from 2010 to 2011 for the components of noninterest income:
| For The Years Ended December 31, | ||||||||||
| 2011 | 2010 | $ Variance | % Variance | |||||||
| (Dollars in thousands) | ||||||||||
| Trust income | $ | 557 | $ | 490 | $ | 67 | 13.7 | |||
| Service fees | 4,367 | 4,028 | 339 | 8.4 | ||||||
| Net gains on sales of loans held for sale | 1,566 | 736 | 830 | 112.8 | ||||||
| Other income | 452 | 297 | 155 | 52.2 | ||||||
| Subtotal | 6,942 | 5,551 | 1,391 | 25.1 | ||||||
| Net gains on sales of investment securities available-for-sale | 183 | 98 | 85 | 86.7 | ||||||
| Total noninterest income | $ | 7,125 | $ | 5,649 | $ | 1,476 | 26.1 | |||
Noninterest income before gains and losses on investment securities available-for-sale was $6.9 million, or 22.7%, of total income for the year ended December 31, 2011, versus $5.6 million, or 19.5%, of total income for the year ended December 31, 2010. This increase between years reflects increased income in every category, as described below.
Trust income. The increase in trust income for 2011 compared to 2010 was primarily due to the increase in assets under management in 2011. Fees are normally charged on asset values.
Service fees. The increase in service fees for 2011 compared to 2010 was primarily due to the increase in ATM/Debit card fees and related interchange income, which in total rose from $1.34 million in 2010 to $1.63 million in 2011. A main reason for this increase was due to the growth in the volume of electronic transactions. There was also an increase of $68 thousand, or 16.0%, in loan servicing fees from $429 thousand for 2010 to $497 thousand for 2011 due to the increased volume of loans serviced for third parties. In addition, there was an increase in merchant program income from $468 thousand in 2010 to $519 thousand in 2011 due to the increase in merchant transactions. These increases were partially offset by a drop in overdraft fees from $1.2 million in 2010 to $1.1 million in 2011. Due to a change in applicable law, customers were unable to overdraft their deposit account by electronic transactions in the later part of 2011 and it appears that they were more fiscally responsible with their account management in 2011.
Net gains on sales of loans held for sale. Net gains increased from 2010 to 2011 by $830 thousand, or 112.8%, with an increase in total loans sold to $80.4 million in 2011 from $52.7 million in 2010 and with strong gains due to the continuing low interest rate environment, the pace of refinancings and the continuing expansion of Union's market.
Other income. The increase between 2011 and 2010 is related to the $48 thousand increase in net mortgage servicing rights due to the increase in loans sold during 2011, the $140 thousand recognized in 2011 from utilization of Vermont state tax credits compared to $44 thousand in 2010 and the $32 thousand increase in income from life insurance as $2 million in additional Company owned life insurance was purchased in July 2011. These increases were partially offset by the $26 thousand decrease in income from sales of gas royalties and oil leases.
Net gains on sales of investment securities available-for-sale. Available-for-sale debt securities of $2.3 million were sold in 2011 for a gain of $183 thousand, compared to available-for-sale debt securities totaling $1.1 million sold in 2010 for a net gain of $98 thousand.
Union Bankshares, Inc.73
Noninterest Expense. The following table sets forth changes from 2010 to 2011 for components of noninterest expense:
| For The Years Ended December 31, | |||||||||||
| 2011 | 2010 | $ Variance | % Variance | ||||||||
| (Dollars in thousands) | |||||||||||
| Salaries and wages | $ | 7,743 | $ | 6,559 | $ | 1,184 | 18.1 | ||||
| Pension and employee benefits | 3,153 | 2,828 | 325 | 11.5 | |||||||
| Occupancy expense, net | 1,121 | 937 | 184 | 19.6 | |||||||
| Equipment expense | 1,220 | 1,057 | 163 | 15.4 | |||||||
| ATM and debit card expense | 613 | 447 | 166 | 37.1 | |||||||
| Communications | 363 | 261 | 102 | 39.1 | |||||||
| Advertising and public relations | 466 | 283 | 183 | 64.7 | |||||||
| Vermont franchise tax | 429 | 414 | 15 | 3.6 | |||||||
| FDIC insurance assessment | 376 | 499 | (123 | ) | (24.6 | ) | |||||
| Equity in losses of limited partnerships | 515 | 426 | 89 | 20.9 | |||||||
| Branch acquisition expenses | 407 | 13 | 394 | 3,030.8 | |||||||
| Professional fees | 417 | 355 | 62 | 17.5 | |||||||
| Supplies and printing | 394 | 319 | 75 | 23.5 | |||||||
| Expenses of OREO and other assets owned, net | 302 | 241 | 61 | 25.3 | |||||||
| Director and advisory board fees | 262 | 299 | (37 | ) | (12.4 | ) | |||||
| Postage and shipping | 250 | 240 | 10 | 4.2 | |||||||
| Amortization of core deposit intangible | 100 | — | 100 | — | |||||||
| Other expenses | 1,642 | 1,452 | 190 | 13.1 | |||||||
| Total noninterest expense | $ | 19,773 | $ | 16,630 | $ | 3,143 | 18.9 | ||||
Salaries and wages. The salaries and wages increase in 2011 over 2010 was due primarily to regular salary activity, the increase in staffing for the new loan production office in South Burlington, Vermont which opened in the third quarter of 2010, the addition of staff at the three branches acquired in May 2011, and the addition of a number of new positions due to growth and increasing regulatory requirements.
Pension and employee benefits. A portion of the increase was due to the rise in the cost of the Company’s medical plan from $1.2 million for 2010, to $1.3 million for 2011, mainly due to more employees and family members participating in the plan in 2011, including some employees at the loan production office opened in August 2010, employees at the three acquired branches and employees' children between the ages of 18 and 26 regardless of their student or marital status due to the federal health care reform law. Employer payroll and unemployment taxes increased $132 thousand from $538 thousand for 2010 to $670 thousand for 2011 reflecting higher staffing levels resulting in increased salaries and wages and increased maximum wage bases and rates charged for Vermont and New Hampshire unemployment taxes. The defined benefit pension plan, which represents the actuarily computed pension expense for the year determined as of the last day of the previous calendar year, also increased $64 thousand from $769 thousand for 2010 to $833 thousand for 2011.
Occupancy expense, net. The increase between years is mainly due to the addition of the leased space in August 2010 for the loan production office, the addition of three New Hampshire branches in May 2011, as well as higher fuel and utility costs.
Equipment expense. The increase in equipment expense for 2011 versus 2010 was primarily due to increased costs for software licenses and hardware maintenance contracts.
Union Bankshares, Inc.74
ATM and debit card expense. The increase between 2010 and 2011 is mainly due to the increase of $166 thousand in ATM/debit card expenses due to the growth in volume of electronic transactions.
Communications. Upgraded data and phone communication lines in 2010 and 2011 along with the addition of the loan production office and three acquired branches added $102 thousand in communication expenses.
Advertising and public relations. The increase between years of $183 thousand, or 64.7%, is mainly due to outsourcing advertising and public relations, beginning in the third quarter of 2010, to a professional firm that has assisted in the development of a strategic marketing plan, including updating Union Bank's website at www.unionbankvt.com.
FDIC insurance assessment. The decrease in assessment for 2011 was due to a change in the assessment formula which had been previously based on total deposits and effective April 1, 2011 was changed to a base of average total assets less tangible equity. The benefit of this change in the assessment formula was partially offset by the growth in net assets as a result of the addition of the loan production office, the branch acquisitions in May 2011 and organic growth.
Equity in losses of affordable housing investments. New investments in limited partnerships were recorded during 2011 which has increased the expense for equity in losses. The increased expenses are offset on an after tax basis by the increased tax credits recorded, which reduced income tax expense.
Branch acquisition expenses. The branch acquisition expenses for 2011 are mainly data conversion, legal, professional and marketing fees expended to facilitate the purchase of the three New Hampshire branches. There were also expenses incurred to replace customer checkbooks and branch supplies.
Expenses of OREO and other assets owned, net. Expenses for 2011 included $278 thousand in the write-down of value of seven OREO properties to their fair market value less estimated costs to sell, while the expenses for 2010 included write-downs of only $4 thousand. The 2011 expenses are net of a recovery of $111 thousand during the second half of 2011 resulting from settlement of a prior year's foreclosure action.
Amortization of core deposit intangible. As a result of the branch purchases in May 2011, a core deposit intangible of $1.7 million was recorded and is being amortized over the estimated 10 year estimated average life of the core deposit base.
Other expenses. Expenses of the Trust and Asset Management Group increased $35 thousand to $286 thousand for 2011 from $251 thousand for 2010 as the number of customers served continues to expand. The 2011 results included $177 thousand in prepayment penalties on the early payoff of FHLB of Boston advances while the 2010 results included a prepayment penalty of only $41 thousand. The prepayment penalties were offset by the gain on sale of investment securities available-for-sale for 2011. Management believes that prepayment of the long-term advances will reduce future interest expense and reliance on borrowed funds at interest rates that were higher than currently available.
Income Tax Expense. The Company has provided for current and deferred federal income taxes for the current and all prior periods presented. The Company's provision for income taxes decreased to $1.1 million for 2011 from $1.7 million for 2010. This is mainly the result of the decrease in federal income taxes from the decreased taxable income, a $46 thousand reduction in income tax expense related to the tax treatment of limited housing partnerships, and higher federal tax credits. The federal tax credits from investments in affordable housing limited partnerships increased to $455 thousand for 2011, versus $380 thousand for 2010. In 2011, there was an additional $99 thousand federal rehabilitation credit on the rehabilitation of a building owned by the Company. The Company’s effective tax rate for 2011 was 17.7% compared to 23.4% for 2010.
Union Bankshares, Inc.75
FINANCIAL CONDITION
At December 31, 2011, the Company had total consolidated assets of $552.8 million, including gross loans and loans held for sale (“total loans”) of $429.2 million, deposits of $473.4 million and stockholders' equity of $40.3 million. The Company’s total assets increased $99.8 million, or 22.0%, to $552.8 million at December 31, 2011, from $453.0 million at December 31, 2010. A large portion of the increase was due to the acquisition of the three New Hampshire branches on May 27, 2011.
Total net loans and loans held for sale increased a total of $46.8 million, or 12.4%, to $425.2 million, or 76.9% of total assets, at December 31, 2011, including $27.9 million of loans at December 31, 2011 acquired with the branch acquisitions, compared to $378.3 million, or 83.5% of total assets, at December 31, 2010. The $18.9 million increase in 2011, not associated with the loans acquired, resulted mainly from growth of $9.5 million in construction real estate loans, $9.0 million in commercial real estate loans and $2.4 million in residential real estate loans. These increases were offset by small decreases in commercial, consumer and municipal loans. Loan demand was strong during the year but growth of the loan portfolio was moderated significantly by management's decision to continue to sell the majority of qualified lower rate residential loans into the secondary market during 2011 to mitigate future interest rate risk and to participate out or sell some commercial real estate loans to mitigate the level of credit and interest rate risk.
Federal funds sold and overnight deposits increased $9.7 million to $18.5 million at December 31, 2011 from $8.8 million at December 31, 2010. Interest bearing deposits in banks increased $10.0 million, or 71.1%, from $14.0 million at December 31, 2010 to $24.0 million at December 31, 2011. Investment securities available-for-sale increased $19.2 million, or 80.6%, from $23.8 million at December 31, 2010 to $43.0 million at December 31, 2011, with investment securities held-to-maturity increasing $3.5 million from $500 thousand at December 31, 2010 to $4.0 million at December 31, 2011. Total nonloan interest bearing assets increased to 15.8% of total assets at December 31, 2011 compared to 10.7% at December 31, 2010, as the Company increased its federal funds sold and overnight deposits, interest bearing deposits in banks and the investment securities portfolio as a result of a net cash inflow of $29.6 million from the acquisition of the three branches, in which assumed deposits exceeded purchased loans. Over time, more of these assets will be converted to loans as Union's presence in the New Hampshire markets is expanded.
Deposits increased $96.8 million, or 25.7%, to $473.4 million at December 31, 2011, from $376.7 million at December 31, 2010, with total deposits in the acquired branches of $64.7 million. Noninterest bearing deposits increased $12.1 million, or 18.8%, from $64.5 million at December 31, 2010 to $76.7 million at December 31, 2011, including $4.8 million of noninterest bearing deposits in the branches acquired. Interest bearing deposits increased $58.7 million, or 32.5%, from $180.4 million at December 31, 2010 to $239.1 million at December 31, 2011, including $33.8 million of interest bearing deposits in the branches acquired. Time deposits increased $26.0 million, or 19.7%, from $131.7 million at December 31, 2010, to $157.7 million at December 31, 2011, including $26.2 million of time deposits in the branches acquired. (See average balances and rates in the Yields Earned and Rates Paid table on page 70.)
The continuing low interest rate environment and aggressive rate competition from in-market and out-of-market financial institutions makes deposit accounts increasingly difficult to attract and retain. Noninterest bearing deposit account relationships are especially difficult to develop due to the customer's anticipated cost and inconvenience associated with new checks, debit cards, direct deposits and automated clearing house transaction changes. Therefore, the May 27, 2011 acquisition of the three New Hampshire branches with total deposits of $67.0 million as of the acquisition date, including $3.5 million in noninterest bearing deposits, in markets contiguous to Union's, is viewed by management and the Board of Directors as a strong strategic move for the Company, by increasing deposits and expanding the Company's New Hampshire market area. Total deposits and overnight collateralized repurchase agreement sweeps at the acquired branches grew to $71.4 million at December 31, 2011 from the $64.7 million acquired on May 27, 2011.
Union Bankshares, Inc.76
Borrowed funds from the FHLB of Boston decreased $6.7 million, or 23.1%, at December 31, 2011, from $29.0 million at December 31, 2010 to $22.3 million at December 31, 2011, mainly due to the repayment of $2.2 million in long-term FHLB advances, the payoff of a $2 million short-term FHLB of Boston advance outstanding at December 31, 2010 and normal monthly payments on FHLB of Boston amortizing advances. This decrease in FHLB of Boston advances was offset by the addition of $6.7 million in overnight secured customer repurchase agreement sweeps as of December 31, 2011.
Total stockholders’ equity decreased $1.4 million to $40.3 million at December 31, 2011 from $41.7 million at December 31, 2010. This decrease reflected the combined effect of net income of $5.2 million, the issuance of 1,500 shares of common stock totaling $26 thousand from the exercise of incentive stock options, a $9 thousand increase due to stock based compensation, an increase of $718 thousand in the net unrealized holding gain on investment securities available-for-sale component, a increase of $2.9 million in the net unfunded defined benefit pension liability component of other comprehensive loss, and cash dividend payments of $4.5 million.
Loan Portfolio. The Company's loan portfolio (including loans held for sale) primarily consists of adjustable-rate and fixed-rate mortgage loans secured by one-to-four family, multi-family residential or commercial real estate. As of December 31, 2011, the gross loan portfolio totaled $429.2 million, or 77.6%, of assets compared to $381.9 million, or 84.3%, of assets as of December 31, 2010. Total loans have increased $47.3 million, or 12.4%, since December 31, 2010, despite the sale of $80.4 million of loans held for sale during 2011, resulting in a gain on sale of loans of $1.6 million and the net participation of an additional $4.1 million of commercial real estate loans. Sales of loans in 2010 totaled $52.7 million for a gain of $736 thousand. A portion of the increase in the loan portfolio between periods is due to the expansion of the branch network through the three branches acquired in northwestern New Hampshire. The net carrying value of the acquired loans included in the December 31, 2011 loan balances total $27.9 million. The Company has also experienced organic loan growth in these branches since the acquisition on May 27, 2011. Management expects to continue to sell and/ or participate loans to manage interest rate risk, credit exposure or liquidity needs in the future, especially in light of the continuing low interest rate environment. Although competition for good loans is strong, the Company has been able to originate loans to both current and new customers while maintaining credit quality.
The composition of the Company's loan portfolio at year-end for each of the last five years was as follows:
| 2011 | 2010 | 2009 | 2008 | 2007 | |||||||||||
| $ | % | $ | % | $ | % | $ | % | $ | % | ||||||
| (Dollars in thousands) | |||||||||||||||
| Residential real estate | 147,426 | 34.4 | 132,533 | 34.7 | 123,915 | 34.6 | 128,292 | 36.3 | 115,303 | 36.2 | |||||
| Construction real estate | 28,077 | 6.6 | 18,578 | 4.9 | 19,391 | 5.4 | 19,038 | 5.4 | 20,190 | 6.4 | |||||
| Commercial real estate | 189,770 | 44.2 | 167,056 | 43.7 | 159,095 | 44.4 | 153,821 | 43.5 | 134,658 | 42.3 | |||||
| Commercial | 21,128 | 4.9 | 20,604 | 5.4 | 15,597 | 4.4 | 18,833 | 5.3 | 19,537 | 6.1 | |||||
| Consumer | 6,134 | 1.4 | 6,046 | 1.6 | 6,967 | 1.9 | 6,735 | 1.9 | 7,175 | 2.3 | |||||
| Tax exempt loans | 31,784 | 7.4 | 31,455 | 8.2 | 23,862 | 6.7 | 23,519 | 6.7 | 13,731 | 4.3 | |||||
| Loans held for sale | 4,888 | 1.1 | 5,611 | 1.5 | 9,262 | 2.6 | 3,178 | 0.9 | 7,711 | 2.4 | |||||
| Total loans | 429,207 | 100.0 | 381,883 | 100.0 | 358,089 | 100.0 | 353,416 | 100.0 | 318,305 | 100.0 | |||||
For residential loans, the Company generally does not lend more than 80% of the appraised value of the home without a government guaranty or the borrower purchasing private mortgage insurance, and does not lend more than 100% of the appraised value. Although the Company lends up to 80% of the collateral value on commercial real estate loans to strong borrowers, the majority of commercial real estate loans do not exceed 75% of the appraised collateral value. However, the loan to value may go up to 90% on loans with government guarantees or other mitigating circumstances. Vermont and northwestern New Hampshire have not experienced the steep decline in real estate values that have
Union Bankshares, Inc.77
been prevalent in other areas of the country but the market to sell properties remains slow given the impact of the decline in the financial markets, uncertainty of the current economic environment and the number of properties on the market. Real estate secured loans represented $370.2 million, or 86.3%, of total loans at December 31, 2011 compared to $323.8 million, or 84.8%, of total loans at December 31, 2010.
The Company does not make loans that are interest only, have teaser rates or that result in negative amortization of the principal, except for construction and other short-term loans for either commercial or consumer purposes where the credit risk is evaluated on a borrower by borrower basis. The Company evaluates the borrower's ability to pay on variable-rate loans over a variety of interest rate scenarios, not just the rate at origination.
The Company originates and sells residential mortgages into the secondary market, with most of the sales made to Freddie Mac and occasionally to the Vermont Housing Finance Agency (VHFA) or the New Hampshire Housing Finance Agency (NHHFA). In 2008, the Company entered into a contract with the FHLB of Boston Mortgage Partnership Finance Program (MPF) to sell up to $5 million in loans. This contract was completed in early 2009 and a second $5 million contract was executed for future sales but has not yet been utilized. These loans are classified as held for sale at the time of origination or when a decision is made to sell the loans. During the first quarter of 2011, the Company received approval to originate and sell Federal Housing Administration (FHA) and Veterans Administration (VA) residential mortgage loans. These loan products increase the Company's ability to serve the borrowing needs of residents in the communities we serve. Loans held for sale are accounted for at the lower of cost or fair value and are reviewed at least quarterly based on current market pricing.
The Company serviced a residential real estate mortgage portfolio of $338.6 million and $286.2 million at December 31, 2011 and 2010, respectively. Of that portfolio, $186.3 million at December 31, 2011 and $148.2 million at December 31, 2010 was serviced for unaffiliated third parties. Additionally, the Company originates commercial real estate and commercial loans under various Small Business Administration (SBA), U.S. Department of Agriculture Rural Development Authority (USDA) and Vermont Economic Development Authority (VEDA) programs that provide an agency guarantee for a portion of the loan amount. There was $4.6 million guaranteed under these various programs at December 31, 2011. The Company occasionally sells the guaranteed portion of the loan to other financial concerns and will retain servicing rights, which generates fee income. These loans are classified as held for sale as they are identified and accounted for at the lower of cost or fair value and priced at least quarterly by an independent party. The Company serviced approximately $3.2 million of commercial and commercial real estate loans for unaffiliated third parties as of December 31, 2011 and $3.5 million at December 31, 2010.
The Company capitalizes its loan servicing rights on loans sold with servicing retained and recognizes gains and losses on the sale of the principal portion of these notes as they occur. The unamortized balance of servicing rights on loans sold with servicing retained was $818 thousand as of December 31, 2011 and $650 thousand as of December 31, 2010, with an estimated market value in excess of their carrying value at both year ends. Management periodically evaluates and measures the servicing assets for impairment.
In the ordinary course of business, the Company occasionally sells participations in a portion of commercial, municipal or real estate loans to other financial institutions on a nonrecourse basis for liquidity or credit concentration management purposes. The total of loans participated out as of December 31, 2011 was $18.6 million and $14.4 million at December 31, 2010.
The majority of the Company's loan portfolio is secured by real estate located throughout the Company's primary market area of northern Vermont and northwestern New Hampshire. Underlying real estate values for both residential and commercial properties have decreased slightly in the Company's market area during the last couple of years, though a quick sale may result in a steeper discount should such a sale of real estate collateral become necessary. Although the Company's loan portfolio consists of different segments, there is a portion of the loan portfolio centered in tourism related loans. The tourism industry has been affected by the weakened economy and below average snowfall this winter season. The Company has implemented risk management strategies to mitigate exposure in this industry
Union Bankshares, Inc.78
through utilizing government guaranty programs as well as participations with other financial institutions as discussed above. Additionally, the loan portfolio contains many loans to seasoned and well established businesses and/or well secured loans which further reduce the Company's risk. Management closely follows the local and national economies and their impact on the local businesses, especially on the tourism industry, as part of the Company's risk management program.
The following table breaks down by classification the contractual maturities of the gross loans held in portfolio and for sale as of December 31, 2011:
Within 1 Year | 2-5 Years | Over 5 Years | |||||||||
| (Dollars in thousands) | |||||||||||
| Residential real estate | |||||||||||
| Fixed-rate | $ | 958 | $ | 3,118 | $ | 62,558 | |||||
| Variable-rate | 2,519 | 1,883 | 81,278 | ||||||||
| Construction real estate | |||||||||||
| Fixed-rate | 13,830 | 1,096 | 2,681 | ||||||||
| Variable-rate | 2,516 | 1,960 | 5,994 | ||||||||
| Commercial real estate | |||||||||||
| Fixed-rate | 279 | 6,471 | 6,099 | ||||||||
| Variable-rate | 17,854 | 17,687 | 141,380 | ||||||||
| Commercial | |||||||||||
| Fixed-rate | 2,090 | 3,981 | 3,687 | ||||||||
| Variable-rate | 4,344 | 3,577 | 3,449 | ||||||||
| Municipal | |||||||||||
| Fixed-rate | 15,961 | 893 | 7,444 | ||||||||
| Variable-rate | — | — | 7,486 | ||||||||
| Consumer & Other | |||||||||||
| Fixed-rate | 1,883 | 3,660 | 352 | ||||||||
| Variable-rate | 63 | 127 | 49 | ||||||||
| Total | $ | 62,297 | $ | 44,453 | $ | 322,457 | |||||
Asset Quality. The Company, like all financial institutions, is exposed to certain credit risks including those related to the value of the collateral that secures its loans and the ability of borrowers to repay their loans. The underlying value of real estate collateral has not seen as much of a decline in Vermont and northwestern New Hampshire as has been experienced in other parts of the country and the Company’s conservative loan policies have been prudent for both the Company and its customers. Renewed market volatility, high unemployment rates and weakness in the general economic condition of the country or our market area, may have a negative effect on our customers’ ability to make their loan payments on a timely basis and/or on underlying collateral values. Management closely monitors the Company’s loan and investment portfolios, other real estate and other assets owned for potential problems and reports to the Company’s and the subsidiary’s Boards of Directors at regularly scheduled meetings. Repossessed assets and loans or investments that are 90 days or more past due are considered to be nonperforming assets. Board approved policies set forth portfolio diversification levels to mitigate concentration risk and the Company participates large credits out to other financial institutions to further mitigate that risk.
Union Bankshares, Inc.79
The Company's Board of Directors has set forth well-defined lending policies (which are periodically reviewed and revised as appropriate) that include conservative individual lending limits for officers, aggregate and advisory board approval levels, Board approval for large credit relationships, a quality control program, a loan review program and other limits or standards deemed necessary and prudent. The Company's loan review department is supervised by an experienced former regulatory examiner and staffed by other experienced personnel. The Company's loan review program encompasses a review process for loan documentation and underwriting for select loans as well as a monitoring process for credit extensions to assess the credit quality and degree of risk in the loan portfolio. Management performs, and shares with the Board of Directors, periodic concentration analyses based on various factors such as industries, collateral types, location, large credit sizes and officer portfolio loads. The Company has established underwriting guidelines to be followed by its officers; material exceptions are required to be approved by a senior loan officer or the Board of Directors. The Company monitors its delinquency levels for any adverse trends. There can be no assurance, however, that the Company's loan portfolio will not become subject to increasing pressures from deteriorating borrower financial strength or declining collateral values due to general or local economic conditions. The Company did not target sub-prime borrowers and has not experienced an elevated delinquency in this area.
Restructured loans include the Company's troubled debt restructurings that involved forgiving a portion of interest or principal, refinancing at a rate materially less than the market rate, rescheduling loan payments, or granting other concessions to a borrower due to financial or economic reasons related to the debtor's financial difficulties that the Company would not ordinarily grant. Restructured loans do not include qualifying restructured loans that have complied with the terms of their restructure agreement for a satisfactory period of time. There was one commercial real estate loan and three residential real estate loans totaling $2.2 million restructured at December 31, 2011 and one commercial real estate and two residential real estate restructured loans totaling $2.0 million at December 31, 2010. Restructured loans are considered impaired when evaluating a specific loan loss reserve allocation.
Loans on which the accrual of interest has been discontinued are designated as nonaccrual loans. Management reviews the loan portfolio continuously for evidence of problem loans. Such loans are placed under close supervision with consideration given to placing the loan on nonaccrual status. Loans are designated as nonaccrual when reasonable doubt exists as to the full collection of interest and principal. Normally, when a loan is placed on nonaccrual status, all interest previously accrued but not collected is reversed against current period interest income. Income on such loans is then recognized only to the extent that cash is received and where the future collection of interest and principal is probable. Generally, interest accrual is resumed on such loans only when they are brought fully current with respect to interest and principal and when, in the judgment of management, the loans are estimated to be fully collectible as to both principal and interest. The aggregate interest on nonaccrual loans not recognized for the years ended December 31, 2011 and 2010 was $903 thousand and $677 thousand, respectively.
The following chart details the composition of the Company's nonperforming assets as of December 31:
| 2011 | 2010 | |||||||
| (Dollars in thousands) | ||||||||
| Nonaccrual loans | $ | 4,308 | $ | 2,792 | ||||
| Loans past due 90 days or more and still accruing interest | 1,897 | 806 | ||||||
| Total nonperforming loans | 6,205 | 3,598 | ||||||
| Other real estate owned (OREO) | 1,476 | 1,609 | ||||||
| Total nonperforming assets | $ | 7,681 | $ | 5,207 | ||||
The Company had guarantees of U.S. or Vermont government agencies on the above nonperforming loans totaling $730 thousand at December 31, 2011 and $129 thousand at December 31, 2010. There were five loans in process of foreclosure at December 31, 2011 included in the nonperforming loans.
Union Bankshares, Inc.80
The following table reviews certain asset quality ratios monitored by Company's management at December 31:
| 2011 | 2010 | |||||
| Allowance for loan losses to loans not held for sale (1) | 1.00 | % | 1.00 | % | ||
| Allowance for loan losses to nonperforming loans | 68.11 | % | 104.36 | % | ||
| Nonperforming loans to total loans | 1.45 | % | 0.94 | % | ||
| Nonperforming assets to total assets | 1.39 | % | 1.15 | % | ||
| Delinquent loans (30 days to nonaccruing) to total loans | 3.86 | % | 3.43 | % | ||
| Net charge-offs to average loans not held for sale | 0.08 | % | 0.07 | % | ||
| Loan loss provision to net charge-offs | 254.93 | % | 201.42 | % | ||
____________________
| (1) | Calculation includes the net carrying amount of loans recorded at fair value from the branch acquisitions as of December 31, 2011 ($27.9 million). Excluding such loans, the allowance for loan losses to loans not purchased and not held for sale was 1.07% at December 31, 2011. |
Nonperforming loans have increased in terms of dollars and percentages from December 31, 2010 with the allowance for loan losses as a percentage to nonperforming loans decreasing. Even though the nonperforming and delinquency ratios have risen in comparison to December 31, 2010, they are still considered by management to be at favorable levels. The Company's success at keeping the ratios at favorable levels in these challenging economic conditions is the result of continued focus on maintaining strict underwriting standards, as well as our practice, as a community bank, of actively working with troubled borrowers to resolve the borrower's delinquency, while maintaining the safe and sound credit practices of the Bank and safeguarding our strong capital position.
At December 31, 2011, the Company had loans rated substandard that were on a performing status totaling $4.1 million, representing eleven customer relationships, compared to $1.7 million at December 31, 2010, representing four customer relationships. In management's view, such loans represent a higher degree of risk of becoming nonperforming loans in the future. While still on a performing status, in accordance with the Company's credit policy, loans are internally classified when a review indicates the existence of any of the following conditions, making the likelihood of collection questionable:
| • | the financial condition of the borrower is unsatisfactory; |
| • | repayment terms have not been met; |
| • | the borrower has sustained losses that are sizable, either in absolute terms or relative to net worth; |
| • | confidence is diminished; |
| • | loan covenants have been violated; |
| • | collateral is inadequate; or |
| • | other unfavorable factors are present. |
The Company actively works with customers who may be delinquent or who may have financial difficulties. One of the benefits of being a community financial institution is our employees' and Boards' knowledge of the community and borrowers, which allows us to be proactive in working closely with our loan customers. The Company's delinquency rates have historically run higher than similar institutions nationally, while losses have been lower. Although management believes that its nonperforming and internally classified loans are generally well-secured and that probable credit losses inherent in the loan portfolio are provided for in the Company's allowance for loan losses, there can be no assurance that future deterioration in economic conditions and/or collateral values, or changes in other relevant factors will not result in future credit losses.
Except for those nonperforming loans discussed above, the Company's management is not aware of any loans as of December 31, 2011, for which known financial problems of the borrower would cause serious doubts as to the borrower's
Union Bankshares, Inc.81
ability to materially comply with the present loan repayment terms, nor are there any known events that would result in any other loans being designated as nonperforming as of December 31, 2011. However, a combination of economic conditions in the Company's market has the potential to create a situation where any borrower's status can quickly change. Real estate and other asset values declined over the last three years, along with sales of homes and building permits, and any recovery in the real estate market remains tentative even though improvement has been seen in our markets. Deterioration in the value of collateral securing the Company's loans could put pressure on loan to value ratios. Additionally, economic conditions resulting in higher unemployment rates and business failures are still a concern and could result in an increase in loan default rates. The Company's management is focused on the impact that the prolonged recession may have on its borrowers and will continue to monitor and evaluate the effects of the troubled housing market and economy on the Company's loan portfolio.
Vermont and New Hampshire continue to have some of the lowest residential foreclosure rates in the United States. On occasion the Company acquires residential or commercial real estate properties through or in lieu of loan foreclosure. These properties are held for sale and are initially recorded as OREO at fair value less estimated selling costs at the date of the Company’s acquisition of the property, with fair value based on an appraisal for more significant properties and on a broker’s price opinion for minor properties. Holding costs and declines in fair value after acquisition of the property result in charges against income. The Company had eleven residential, land development or commercial real estate properties classified as OREO at December 31, 2011 valued at $1.5 million, and nine properties valued at $1.6 million so classified on December 31, 2010. Of the eleven properties in OREO at December 31, 2011, two of the properties have since been sold at a minimal loss. Further softening in the local real estate market would make the potential to recover all principal and related costs for OREO properties uncertain.
Allowance for Loan Losses. Some of the Company’s loan customers ultimately do not make all of their contractually scheduled payments, requiring the Company to charge off a portion or all of the remaining principal balance due. The Company maintains an allowance for loan losses to absorb such losses. The allowance is maintained at a level believed by management to be appropriate to absorb probable credit losses inherent in the loan portfolio; however, actual loan losses may vary from current estimates.
The allowance for loan losses is evaluated quarterly using a consistent, systematic methodology, which analyzes the risk inherent in the loan portfolio. In addition to evaluating the collectability of specific loans when determining the appropriate level of the allowance, management also takes into consideration other qualitative factors such as changes in the mix and size of the loan portfolio, credit concentrations, historic loss experience, the amount of delinquencies and loans adversely classified, industry trends, and the impact of the local and regional economy on the Company's borrowers as well as the estimated value of any underlying collateral. The appropriate level of the allowance for loan losses is assessed by an allocation process whereby specific loss allocations are made against certain adversely classified loans and general loss allocations are made against segments of the loan portfolio that have similar attributes. Although the allowance for loan losses is assessed by allocating reserves by loan category, the total allowance for possible loan losses is available for future losses which may occur within one or more loan categories.
The allowance is increased by a provision for loan losses charged to earnings, and reduced by charge-offs, net of recoveries. The provision for loan losses represents management's estimate of the current period credit cost associated with maintaining an appropriate allowance for loan losses. Based on an evaluation of the loan portfolio and other relevant qualitative factors, management presents a quarterly analysis of the appropriate level of the allowance to the Board of Directors, indicating any changes in the allowance since the last review and any recommendations as to adjustments in the allowance. Additionally, bank regulatory agencies regularly review the Company's allowance for loan losses, including the methodology for determining the allowance, as an integral part of their examination process.
Union Bankshares, Inc.82
Credit quality of the commercial portfolio is quantified by a credit rating system designed to parallel regulatory criteria and categories of loan risk and has historically been well received by the various regulatory authorities. Individual loan officers monitor their loans to ensure appropriate rating assignments are made on a timely basis. Risk ratings and quality of commercial and retail credit portfolios are also assessed on a regular basis by an internal independent Loan Review Department. Loan Review personnel conduct ongoing portfolio analyses and individual credit reviews to evaluate loan risk and compliance with lending policies.
The level of allowance allocable to each loan portfolio category with similar risk characteristics is determined based on historical charge-offs, adjusted for qualitative risk factors. A quarterly analysis of various qualitative factors, including portfolio characteristics, national and local economic trends, overall market conditions, and levels of, and trends in, delinquencies and non-performing loans, helps to ensure that areas with the potential risk for loss are considered in management's allowance estimate. In addition, when other individual loans are identified by management as representing an elevated risk of loss, the level of allowance allocable to those loans is determined through estimating probable loss for each individual credit based on its specific risk attributes. Nonaccrual loans are also evaluated for specific impairment when Union's loan exposure is greater than $100 thousand or Union's exposure for an entire customer relationship is greater than $150 thousand. These loans may be classified as impaired when management believes it is probable that the Company will not collect all the contractual interest and principal payments as scheduled in the loan agreement. A specific reserve amount is allocated to the allowance for individual loans that have been classified as impaired on the basis of the fair value of the collateral for collateral dependent loans, an observable market price, or the present value of anticipated future cash flows.
The composition of the Company’s loan portfolio remained relatively unchanged from December 31, 2010, and there was no material change in the Company’s lending programs or terms during the year.
The following table reflects activity in the allowance for loan losses for the years ended December 31:
| 2011 | 2010 | 2009 | 2008 | 2007 | |||||||||||
| (Dollars in thousands) | |||||||||||||||
| Balance at the beginning of period | $ | 3,755 | $ | 3,493 | $ | 3,556 | $ | 3,378 | $ | 3,338 | |||||
| Charge-offs | |||||||||||||||
| Real Estate | 314 | 268 | 379 | 50 | 99 | ||||||||||
| Commercial | 1 | 27 | 101 | 54 | 79 | ||||||||||
| Consumer and other | 33 | 20 | 43 | 102 | 90 | ||||||||||
| Total charge-offs | 348 | 315 | 523 | 206 | 268 | ||||||||||
| Recoveries | |||||||||||||||
| Real Estate | 3 | 7 | 10 | 2 | 10 | ||||||||||
| Commercial | 14 | 21 | 15 | 8 | 3 | ||||||||||
| Consumer and other | 27 | 29 | 35 | 39 | 30 | ||||||||||
| Total recoveries | 44 | 57 | 60 | 49 | 43 | ||||||||||
| Net charge-offs | (304 | ) | (258 | ) | (463 | ) | (157 | ) | (225 | ) | |||||
| Provision for loan losses | 775 | 520 | 400 | 335 | 265 | ||||||||||
| Balance at end of period | $ | 4,226 | $ | 3,755 | $ | 3,493 | $ | 3,556 | $ | 3,378 | |||||
Provision charged to income as a percent of average loans | 0.19 | % | 0.15 | % | 0.11 | % | 0.10 | % | 0.09 | % | |||||
Union Bankshares, Inc.83
The following table shows (net of loans held for sale) the internal breakdown by risk component of the Company's allowance for loan losses and the percentage of loans in each category to total loans in the respective portfolios at December 31:
| 2011 | 2010 | 2009 | 2008 | 2007 | ||||||||||||||||
| $ | % | $ | % | $ | % | $ | % | $ | % | |||||||||||
| (Dollars in thousands) | ||||||||||||||||||||
| Real Estate: | ||||||||||||||||||||
| Residential | 1,250 | 34.7 | 1,033 | 35.2 | 976 | 35.5 | 933 | 36.7 | 710 | 35.7 | ||||||||||
| Construction | 367 | 6.6 | 240 | 4.9 | 240 | 5.6 | 223 | 5.4 | 202 | 6.5 | ||||||||||
| Commercial | 2,278 | 47.2 | 2,117 | 47.3 | 1,959 | 47.8 | 1,917 | 43.9 | 2,011 | 42.9 | ||||||||||
| Other Loans: | ||||||||||||||||||||
| Commercial | 232 | 5.0 | 250 | 5.5 | 235 | 4.5 | 391 | 5.4 | 277 | 5.3 | ||||||||||
Consumer, municipal, other and unallocated | 99 | 6.5 | 115 | 7.1 | 83 | 6.6 | 92 | 8.6 | 178 | 9.6 | ||||||||||
| Total | 4,226 | 100.0 | 3,755 | 100.0 | 3,493 | 100.0 | 3,556 | 100.0 | 3,378 | 100.0 | ||||||||||
Ratio of net charge offs to average loans not held for sale | 0.08 | % | 0.07 | % | 0.13 | % | 0.05 | % | 0.07 | % | ||||||||||
Ratio of allowance for loan losses to loans not held for sale | 1.00 | % | 1.00 | % | 1.00 | % | 1.02 | % | 1.09 | % | ||||||||||
Ratio of allowance for loan losses to nonperforming loans (1) | 68.11 | % | 104.36 | % | 81.69 | % | 48.75 | % | 60.47 | % | ||||||||||
____________________
| (1) | Nonperforming loans includes loans in nonaccrual status plus loans past due 90 days or more and still accruing. |
Management of the Company believes, in its best estimate, that the allowance for loan losses at December 31, 2011, is appropriate to cover probable credit losses inherent in the Company’s loan portfolio as of such date. However, there can be no assurance that the Company will not sustain losses in future periods which could be greater than the size of the allowance at December 31, 2011. In addition, our banking regulators, as an integral part of their examination process, periodically review our allowance for loan losses. Such agencies may require us to recognize adjustments to the allowance based on their judgments about information available to them at the time of their examination. A large adjustment to the allowance for losses in future periods may require increased provisions to replenish the allowance, which could negatively affect earnings.
While the Company recognizes that further economic slowdown or financial and credit market turmoil may adversely impact its borrowers' financial performance and ultimately their ability to repay their loans, management continues to be cautiously optimistic about the collectability of the Company's loan portfolio.
Investment Activities. The investment portfolio is used to generate interest income, manage liquidity and mitigate interest rate sensitivity. At December 31, 2011, the reported value of investment securities available-for-sale was $43.0 million, or 7.8% of assets, compared to $23.8 million, or 5.2% of assets at December 31, 2010. At December 31, 2011, there was $4.0 million of investment securities classified as held-to-maturity, compared to $500 thousand at December 31, 2010. The Company had no investments classified as trading. The Company has increased its investment portfolio as one method of reducing excess liquidity as a result of the cash inflow from the branch acquisition. Current accounting guidance requires banks to recognize all appreciation or depreciation of the investment portfolio on the balance sheet for available-for-sale securities even though a gain or loss has not been realized. Investment
Union Bankshares, Inc.84
securities classified as available-for-sale are marked-to-market, with any unrealized gain or loss after estimated taxes charged to the equity portion of the balance sheet through the Accumulated other comprehensive income (loss) component of stockholders' equity. The reported value of investment securities available-for-sale at December 31, 2011 reflects a net unrealized gain of $1.4 million.
At December 31, 2011, seventeen debt securities and five marketable equity securities had unrealized losses of $48 thousand with aggregate depreciation of 1.1% from the Company's amortized cost basis. Securities are evaluated at least quarterly for other than temporary impairment and at December 31, 2011, in management's estimation no security was other than temporarily impaired. Management's evaluation of other than temporary impairments is subject to risks and uncertainties and is intended to determine the appropriate amount and timing of recognition of any impairment charge. The assessment of whether such impairment for debt securities has occurred is based on management's best estimate of the cash flows expected to be collected at the individual security level. We regularly monitor our investment portfolio to ensure that securities that may be other than temporarily impaired are identified in a timely manner and that any impairment charge is recognized in the proper period and, with respect to debt securities, that the impairment is properly allocated between credit losses recognized in earnings and noncredit unrealized losses recognized in other comprehensive income (loss). Further deterioration in credit quality, imbalances in liquidity in the financial marketplace or a quick rise in interest rates might adversely affect the fair values of the Company's investment portfolio and may increase the potential that certain unrealized losses will be designated as other than temporary in future periods, resulting in write-downs.
At December 31, 2011, the Company had no investments in a single company or entity (other than U.S. Government-sponsored enterprise securities) that had an aggregate book value in excess of 2% of our equity. As of December 31, 2011, all mortgage-backed securities the Company owned were issued by Government National Mortgage Association (GNMA), Federal National Mortgage Association (Fannie Mae) or the Federal Home Loan Mortgage Corporation (Freddie Mac). Although the Fannie Mae and Freddie Mac debt securities are not explicitly guaranteed by the federal government, one of the stated purposes of the U.S. Treasury's September, 2008 conservatorship and capital support of the two institutions was to stabilize the market in their debt securities, and that purpose was again evident in legislation passed by Congress in late 2009 which effectively lifted any dollar ceiling on the implicit U.S. Treasury guaranty of Fannie Mae and Freddie Mac debt securities.
The following tables show as of December 31 the amortized cost, fair value and weighted average yield on a tax equivalent basis of the Company's investment debt securities portfolio maturing within the stated periods:
| December 31, 2011 | Maturities | ||||||||||||||||
Within One Year | One to Five Years | Five to Ten Years | Over Ten Years | Total Cost | Weighted Average Yield | ||||||||||||
| (Dollars in thousands) | |||||||||||||||||
| Investment securities available-for-sale: | |||||||||||||||||
| U.S. Government-sponsored enterprises | $ | — | $ | 5,709 | $ | 5,750 | $ | 5,997 | $ | 17,456 | 1.98 | % | |||||
| Agency mortgage-backed | — | 138 | 1,087 | 2,101 | 3,326 | 2.27 | % | ||||||||||
| State and political subdivisions | — | 623 | 4,707 | 6,483 | 11,813 | 5.29 | % | ||||||||||
| Corporate debt | 500 | 5,866 | 1,761 | — | 8,127 | 3.11 | % | ||||||||||
| Investment securities held-to-maturity: | |||||||||||||||||
| U.S. Government-sponsored enterprises | — | 1,000 | 2,000 | 1,000 | 4,000 | 1.63 | % | ||||||||||
| Total investment debt securities | $ | 500 | $ | 13,336 | $ | 15,305 | $ | 15,581 | $ | 44,722 | 2.98 | % | |||||
| Fair value | $ | 503 | $ | 13,509 | $ | 15,779 | $ | 16,253 | $ | 46,044 | |||||||
| Weighted average yield | 5.13 | % | 2.06 | % | 3.09 | % | 3.57 | % | 2.98 | % | |||||||
Union Bankshares, Inc.85
| December 31, 2010 | Maturities | ||||||||||||||||
Within One Year | One to Five Years | Five to Ten Years | Over Ten Years | Total Cost | Weighted Average Yield | ||||||||||||
| (Dollars in thousands) | |||||||||||||||||
| Investment securities available-for-sale: | |||||||||||||||||
| U.S. Government-sponsored enterprises | $ | — | $ | 1,000 | $ | 2,500 | $ | 1,021 | $ | 4,521 | 2.00 | % | |||||
| Agency mortgage-backed | 740 | 498 | 956 | 2,541 | 4,735 | 2.80 | % | ||||||||||
| State and political subdivisions | 502 | 190 | 2,585 | 6,096 | 9,373 | 5.47 | % | ||||||||||
| Corporate debt | 750 | 2,503 | 1,484 | — | 4,737 | 5.40 | % | ||||||||||
| Investment securities held-to-maturity: | |||||||||||||||||
| U.S. Government-sponsored enterprises | — | — | 500 | — | 500 | 2.00 | % | ||||||||||
| Total investment debt securities | $ | 1,992 | $ | 4,191 | $ | 8,025 | $ | 9,658 | $ | 23,866 | 4.19 | % | |||||
| Fair value | $ | 2,014 | $ | 4,358 | $ | 8,192 | $ | 9,572 | $ | 24,137 | |||||||
| Weighted average yield | 3.47 | % | 4.08 | % | 4.18 | % | 4.42 | % | 4.19 | % | |||||||
The tables above exclude marketable equity securities with a book value of $746 thousand and a market value of $773 thousand at December 31, 2011, and a book value of $50 thousand and a market value of $45 thousand at December 31, 2010, which have no maturity but may be sold by the Company at any time. The table also excludes mutual funds with a book and market value of $135 thousand at December 31, 2011 and of $100 thousand at December 31, 2010.
Federal Home Loan Bank of Boston Stock. Union is a member of the FHLB of Boston with an investment of $1.9 million in its Class B common stock at both December 31, 2011 and 2010. The Class B common stock has a five year notice requirement for redemption and there is no guarantee of future redemption. Also, there is the possibility of future capital calls by the FHLB of Boston on member banks to ensure compliance with its capital plan. Union's investment in FHLB stock is carried as an Other asset at cost and is nonmarketable. Similar to evaluating investment securities available-for-sale for other than temporary impairment, the Company has evaluated its investment in the FHLB of Boston. The FHLB of Boston has taken a number of steps to strengthen its capital position in and preserve its capital in the wake of significant other than temporary impairment charges it has recorded in its investment portfolio since the fourth quarter of 2008. The FHLB of Boston remains in compliance with all regulatory capital ratios as of December 31, 2011 and 2010. Dividend payments on the FHLB of Boston Class B common stock were suspended between December 2008 and February 2011, when they resumed at a modest rate. A moratorium on excess stock repurchases was implemented at the same time and lifted in February 2012 along with an increase in the amount of dividend paid. Management's most recent evaluation of the Company's holdings of FHLB of Boston common stock concluded that the investment is not impaired at December 31, 2011.
Union Bankshares, Inc.86
Deposits. The following table shows information concerning the Company's average deposits by account type and the weighted average nominal rates at which interest was paid on such deposits for the years ended December 31:
| 2011 | 2010 | |||||||||||
Average Amount | Percent of Total Deposits | Average Rate | Average Amount | Percent of Total Deposits | Average Rate | |||||||
| (Dollars in thousands) | ||||||||||||
| Nontime deposits: | ||||||||||||
| Noninterest bearing deposits | $ | 66,389 | 15.6 | — | $ | 55,829 | 15.1 | — | ||||
| Interest bearing checking accounts | 74,862 | 17.5 | 0.23 | % | 62,094 | 16.8 | 0.22 | % | ||||
| Money Market accounts | 85,694 | 20.1 | 0.49 | % | 73,484 | 19.9 | 0.66 | % | ||||
| Savings accounts | 55,442 | 13.0 | 0.24 | % | 46,985 | 12.8 | 0.30 | % | ||||
| Total nontime deposits | 282,387 | 66.2 | 0.26 | % | 238,392 | 64.6 | 0.32 | % | ||||
| Time deposits: | ||||||||||||
| Less than $100,000 | 78,167 | 18.3 | 1.40 | % | 71,205 | 19.3 | 1.67 | % | ||||
| $100,000 and over | 66,327 | 15.5 | 1.52 | % | 59,179 | 16.1 | 1.73 | % | ||||
| Total time deposits | 144,494 | 33.8 | 1.45 | % | 130,384 | 35.4 | 1.70 | % | ||||
| Total deposits | $ | 426,881 | 100.0 | 0.66 | % | $ | 368,776 | 100.0 | 0.81 | % | ||
The Company does not normally accept brokered certificates of deposit except through participation with the Certificate of Deposit Account Registry Service ("CDARS") of Promontory Interfinancial Network, LLC. The Company had $5.9 million of reciprocal time deposits of $250,000 or less on the balance sheet placed through CDARS at December 31, 2011 and $9.8 million at December 31, 2010 as the safety of FDIC insurance coverage continues to be important to customers, especially for those taking money out of the volatile stock market or other financial investments. These deposits are considered “brokered” deposits for certain regulatory purposes. The Company also participates in Promontory Interfinancial Network's Insured Cash Sweep ("ICS") program. ICS is a service through which Union can offer its customers a savings product with access to multi-million dollar FDIC insurance while receiving reciprocal deposits from other banks. Like the exchange of certificate of deposit accounts through CDARS, exchange of savings deposits through ICS in effect permits Union to retain the full amount of the customer's deposits on Union's balance sheet. There was $1.8 million in ICS money market deposits on the balance sheet at December 31, 2011 and none at December 31, 2010. None of the Company’s CDARS or ICS deposits, as of the respective balance sheet dates, represent purchased deposits as all such deposits were matched dollar for dollar with Union's customer deposits which were placed in other participating financial institutions in order to provide our customers with full FDIC insurance coverage.
Deposits grew $96.8 million, or 25.7%, from $376.7 million at December 31, 2010 to $473.4 million at December 31, 2011, of which $64.7 million is attributable to the three New Hampshire branches acquired on May 27, 2011. Total average deposits grew $58.1 million, or 15.8%, between years with average nontime deposits growing $44.0 million, or 18.5%, during the same time frame. The average for the year ended December 31, 2011 of the deposits acquired on May 27, 2011 amounted to $38.4 million. On average, all categories of deposits, except time deposits, grew between years exclusive of the deposits in the acquired branches. Time deposits have trended towards very short duration or migrated to nontime deposits because of the low interest rate environment and the perceived customer desire to be in a position to take advantage of the inevitable rise in interest rates. Time deposits, exclusive of the deposits in the acquired branches, have decreased slightly and management believes that most of the funds have flowed into money market accounts where current interest rates are higher than on short-term certificates of deposit.
Union Bankshares, Inc.87
The Dodd-Frank Act permanently raised FDIC deposit insurance coverage to $250 thousand per depositor per insured depository institution for each account ownership category. At December 31, 2011, the Company had deposit accounts with less than $250 thousand totaling $356.7 million, or 75.3% of its deposits, which now have permanent FDIC insurance protection. There was an additional $18.7 million in noninterest bearing and IOLTA deposit accounts greater than $250 thousand at December 31, 2011 with unlimited FDIC insurance until December 31, 2012. An additional $14.1 million of municipal deposits which were over the FDIC insurance coverage limit at December 31, 2011 have been collateralized by Union by investment securities or loans. The collateralization service is provided by Union to customer's based on management's approval and is executed in accordance with applicable state laws or regulations.
The following table provides a maturity distribution of the Company’s time deposits in denominations of $100 thousand or more at December 31:
| 2011 | 2010 | |||||
| (Dollars in thousands) | ||||||
| Three months or less | $ | 9,922 | $ | 6,732 | ||
| Over three months through six months | 33,154 | 28,441 | ||||
| Over six months through twelve months | 17,140 | 16,751 | ||||
| Over twelve months | 14,341 | 10,986 | ||||
| $ | 74,557 | $ | 62,910 | |||
Borrowings. Advances from the FHLB of Boston are another key source of funds to support earning assets. These funds are also used to manage the Bank's interest rate and liquidity risk exposures. The Company's borrowed funds at December 31, 2011 were comprised of borrowings from the FHLB of Boston of $22.3 million, at a weighted average rate of 4.06%, and overnight secured customer repurchase agreement sweeps of $6.7 million, at a weighted average rate of 0.58%. At December 31, 2010, borrowed funds were comprised solely of FHLB of Boston advances of $29.0 million, at a weighted average rate of 4.15%. The decline in FHLB borrowings between years included the maturity during 2011 of $2.0 million in short term funding at 0.23% and the maturity of a $1.7 million amortizing advance at 5.51%. The Company also made scheduled monthly payments on long-term amortizing advances of $938 thousand and prepaid a $1.0 million bullet advance with an interest rate of 3.19% that did not mature until 2013, a $307 thousand amortizing advance at 4.54% that did not mature until 2017 and a $707 thousand amortizing advance at 4.67% that did not mature until 2015. The prepayments resulted in penalties paid for the year ended December 31, 2011 of $177 thousand, which is included in Other expenses on the Company's income statement. The Company had no overnight federal funds purchased on December 31, 2011 or 2010. Average borrowings outstanding for 2011 were $29.6 million, compared to average borrowings outstanding for 2010 of $27.1 million. The weighted average interest rate on the Company's borrowings dropped from 4.16% for 2010 to 3.61% for 2011, reflecting the low interest rate environment that prevailed throughout both years.
Liability for Pension Benefits. The Company had a Liability for defined pension benefit plan of $5.7 million at December 31, 2011, compared to $2.5 million at December 31, 2010. The increase in the pension liability between years is mainly due to the decrease in the discount rate from 5.56% at December 31, 2010 to 4.41% at December 31, 2011 and the loss on investments for the year. These negative effects were partially offset by the decrease in the anticipated rate of future compensation increases from 4.50% for 2010 to 4.25% for 2011 and a $2.0 million contribution to the plan by Union Bank during 2011. The investments of the plan that were in the “market” were not immune to the turmoil experienced over the last three years and their value fluctuated accordingly, with a net loss of 1.55% for 2011 and a cumulative net gain for the last three years of 9.44%, but only a 0.40% cumulative net gain for the last five years. Although weighted average asset allocations at December 31, 2011 were conservative in response to the market volatility, in light of the plan's long-term (40 + years) horizon, the investments are managed for the long-term. Offsetting the pension liability at December 31, 2011, the Company had deferred tax assets of $2.7 million, and Accumulated other comprehensive loss, net of tax, of $5.2 million. The Accumulated other comprehensive loss has no impact on regulatory capital amounts or ratios or the Company's legal lending limit. Note 15 to the Consolidated Financial Statements includes further discussion and information on the Company's employee benefits.
Union Bankshares, Inc.88
The Company's defined pension benefit obligation and net periodic benefit cost are actuarially determined based on the following assumptions: discount rate, current and expected future return on plan assets, change in the Social Security wage base rate, the Consumer Price Index rate, anticipated mortality rates and the expected rate of increase in compensation levels. While a change in any of the assumptions would have an impact on financial condition and future results of operations, a change in the discount rate and future rate of return on plan assets could be material. A discount rate is used both to determine the present value of future benefit obligations and the net periodic benefit cost. The expected rate of return on plan assets is only used to determine net periodic benefit cost.
The 2011 pension benefit obligation discount rate utilized is based on the plan's expected benefit payment stream utilizing December 2011 benchmark pension liability index yield curve spot rates. In light of the persistent low interest rate environment, the discount rate at December 31, 2011 was 4.41% down from 5.56% at December 31, 2010.
The Company bases its expected rate of return on plan assets on past history, current earning rates available on investments and economic forecasts of where rates are headed in the future. The expected rate of return is conservative as the plan has typically taken short-term risk by investing more heavily in equity and international mutual fund markets which over the long-term have proven to be good decisions. Through the end of 2011, our actual net annual investment returns over the last 20 years had a high of 20.73% and a low of negative 26.93%. The latest one year return, as of December 31, 2011, was a loss of 1.55%. Therefore, the expectation of a 6.75% return, which is consistent with the 2.50% inflation assumption, is balanced by our discount rate of 4.41% since the plan has a very long-term (40+ years) horizon. The net periodic pension cost (or pension plan expense on the Company's income statement) was $833 thousand for 2011 and $769 thousand for 2010. The pension plan expense for 2012 will approximate $1.4 million, as calculated by the actuary as of December 31, 2011.
OTHER FINANCIAL CONSIDERATIONS
Market Risk and Asset and Liability Management. Market risk is the potential of loss in a financial instrument arising from adverse changes in market prices, interest rates, foreign currency exchange rates, commodity prices and equity prices. As of December 31, 2011, the Company did not have any market risk sensitive instruments acquired for trading purposes. The Company’s market risk arises primarily from interest rate risk inherent in its lending, investing, deposit taking and borrowing activities, as yields on assets change in a different time period or to a different extent from that of interest costs on liabilities. Many other factors also affect the Company’s exposure to changes in interest rates, such as national, regional and local economic and financial conditions, financial market conditions, legislative and regulatory actions, competitive pressures, customer preferences including loan prepayments and/or early withdrawal of time deposits, and historical pricing relationships.
The earnings of the Company and its subsidiary are affected not only by general economic, financial and credit market conditions, but also by the monetary and fiscal policies of the United States and its agencies, particularly the Federal Reserve System. The monetary policies of the Federal Reserve System influence to a significant extent the overall growth of loans, investments, deposits and borrowings; the level of interest rates earned on assets and paid for liabilities; and interest rates charged on loans and paid on deposits. The nature and impact of future changes in monetary policies are often not predictable. The dramatic change in the financial markets in a very short window of time during 2008 proved that monetary policies are not foolproof and that “exotic” investment vehicles that had been allowed to proliferate over the previous twenty years were often not solidly based or understood, monitored, and policed by the appropriate regulatory agency. The Company did not invest in any of the “exotic” vehicles directly but had invested in a few companies and agencies that were hurt by their investments or operating practices. Few predicted the 500 basis point drop in the prime rate between September 2007 and December 2008 or the stagnation of the financial markets and the economy in the last four months of 2008 that continued throughout 2009 and 2010 and that has only slowly started to recover.
Union Bankshares, Inc.89
A key element in the process of managing market risk involves direct involvement by senior management and oversight by the Board of Directors as to the level of risk assumed by the Company in its balance sheet. The Board of Directors reviews and approves risk management policies, including risk limits and guidelines, and reviews at least quarterly the current position in relationship to those limits and guidelines. Daily oversight functions are delegated to the Asset Liability Management Committee (ALCO). The ALCO, consisting of senior business and finance officers, actively measures, monitors, controls and manages the interest rate risk exposure that can significantly impact the Company's financial position and operating results. The ALCO sets liquidity targets based on the Company's financial condition and existing and projected economic and market conditions. Liquidity ratios and cash flow reports are reviewed monthly by both senior management and the Board of Directors of Union. The Company attempts to structure its balance sheet to maximize net interest income and shareholder value, while controlling its exposure to interest rate risk. Strategies might include selling or participating out loans held for sale, selling or purchasing investments available-for-sale, match funding new loans with FHLB of Boston advances or purchasing or selling brokered deposits through CDARS. The ALCO formulates strategies to manage interest rate risk by evaluating the impact on earnings and capital of such factors as current interest rate forecasts and economic indicators, potential changes in such forecasts and indicators, liquidity, competitive pressures and various business strategies. The ALCO's methods for evaluating interest rate risk include an analysis of the Company's interest rate sensitivity “gap”, which provides a static analysis of the maturity and repricing characteristics of the Company's entire balance sheet, and a simulation analysis, which calculates projected net interest income based on alternative balance sheet and interest rate scenarios, including “rate shock” scenarios involving immediate substantial increases or decreases in market rates of interest.
Members of ALCO meet at least weekly to set loan and deposit rates, make investment decisions, monitor liquidity and evaluate loan demand and review opportunities to sell residential or commercial loans into the secondary market. Deposit runoff is monitored daily and loan prepayments evaluated monthly. The Company historically has maintained a substantial portion of its loan portfolio on a variable-rate basis (68.1% at December 31, 2011) and plans to continue this Asset/Liability/Management (ALM) strategy in the future. The majority of the variable-rate loan portfolio has interest rate floors and caps which are taken into account by the Company's ALM modeling software to predict interest rate sensitivity, including prepayment risk. The utilization of interest rate floors embedded in variable rate loans has become Company policy for loans originated since the beginning of 2009 due to historic low interest rates. As of December 31, 2011, $43.0 million, or 91.5%, of the investment portfolio was classified as available-for-sale and the modified duration was relatively short. The Company does not utilize any exotic derivative products or invest in any "high risk" instruments.
Interest rates have stayed at historic lows throughout 2010 and 2011. There continues to be a significant amount of uncertainty in the financial markets. Although improvement in the economic outlook is hopeful, modeling software is limited to mathematically provable results. Given these facts, management believes it is especially important to know your customers and your market and to have an experienced team of employees with varied experience in the financial field. Union Bankshares has operated successfully for 120 years, throughout a variety of challenging economic environments.
Union Bankshares, Inc.90
The Company’s interest rate sensitivity analysis (simulation) as of December 2010 for a flat rate environment (the prime rate at both December 31, 2010 and December 31, 2011 was 3.25%) projected the following 2011 results compared to the actual:
2011 Projected | 2011 Actual | % Variance | ||||||
| (Dollars in thousands) | ||||||||
| Interest and fees on loans | $ | 22,482 | $ | 22,269 | (0.9 | ) | ||
| Other interest income | 1,267 | 1,400 | 10.5 | |||||
| Interest expense | (3,798 | ) | (3,908 | ) | (2.9 | ) | ||
| Net interest income | $ | 19,951 | $ | 19,761 | (1.0 | ) | ||
| Net income | $ | 5,523 | $ | 5,219 | (5.5 | ) | ||
| Return on average assets | 1.19 | % | 1.04 | % | (12.6 | ) | ||
| Return on average equity | 12.27 | % | 12.47 | % | 1.6 | |||
Net interest income for 2011 was $19.8 million, $190 thousand or 1.0%, lower than projected as interest rates on loans, investment securities and interest bearing deposits saw continued downward pressure due to market rate influences. The Company had cash inflows in the amount of $26.9 million as a result of the branch acquisitions in May of 2011 which were mainly invested in nonloan interest earning assets of short duration and due to the interest rate environment, low yields.
Actual net income for 2011 was lower than projected by $304 thousand, due to changes in several components since the projections were performed. Among those are the lower net interest margin, $407 thousand in one-time expenses incurred in 2011 for the branch acquisitions, a $512 thousand increase in salaries expense, a $125 thousand increase in the provision for loan loss, and write-downs of $278 thousand on OREO properties due to subsequent reductions in their estimated fair market value. These negative variances were partially offset by a positive variance of $698 thousand in the net gain on sale of loans, a $111 thousand recovery received from an OREO property that was written down in a previous year, a $385 thousand increase in service charge income and a $183 thousand net gain on sale of available for sale securities.
Commitments, Contingent Liabilities, and Off-Balance-Sheet Arrangements. The Company is a party to financial instruments with off-balance-sheet risk in the normal course of business to meet the financing needs of its customers, to reduce its own exposure to fluctuations in interest rates, and to implement its strategic objectives. These financial instruments include commitments to extend credit, standby letters of credit, interest rate caps and floors written on adjustable-rate loans, commitments to participate in or sell loans, commitments to buy or sell securities, certificates of deposit or other investment instruments and risk-sharing commitments or guarantees on certain sold loans. Such instruments involve, to varying degrees, elements of credit and interest rate risk in excess of the amount recognized on the balance sheet. The contractual or notional amounts of these instruments reflect the extent of involvement the Company has in a particular class of financial instrument.
The Company's maximum exposure to credit loss in the event of nonperformance by the counter party (in the case of financial instruments for commitments to extend credit) and the account party (in the case of standby letters of credit) is represented by the contractual notional amount of those instruments. The Company uses the same credit policies in making commitments and conditional obligations as it does for on-balance sheet instruments. For interest rate caps and floors written on adjustable-rate loans, the contractual or notional amounts do not represent the Company’s exposure to credit loss. The Company controls the risk of interest rate cap agreements through credit approvals, limits and monitoring procedures. The Company generally requires collateral or other security to support financial instruments with credit risk.
Union Bankshares, Inc.91
The following table details the contractual or notional amount of financial instruments that represented credit risk at December 31, 2011:
| Contract or Notional Amount | |||||||||||||||||||||
| 2012 | 2013 | 2014 | 2015 | 2016 | Thereafter | Total | |||||||||||||||
| (Dollars in thousands) | |||||||||||||||||||||
| Commitments to originate loans | $ | 10,176 | $ | — | $ | — | $ | — | $ | — | $ | — | $ | 10,176 | |||||||
| Unused lines of credit | 48,758 | 7,420 | 3,407 | 25 | — | 40 | 59,650 | ||||||||||||||
| Standby letters of credit | 1,503 | 290 | 18 | — | — | — | 1,811 | ||||||||||||||
| Credit card arrangement | 933 | — | — | — | — | — | 933 | ||||||||||||||
FHLB of Boston MPF credit enhancement obligation, net | 86 | — | — | — | — | — | 86 | ||||||||||||||
Commitment to purchase investment securities | 504 | — | — | — | — | — | 504 | ||||||||||||||
| Total | $ | 61,960 | $ | 7,710 | $ | 3,425 | $ | 25 | $ | — | $ | 40 | $ | 73,160 | |||||||
Commitments to originate loans are agreements to lend to a customer as long as there is no violation of any condition established in the contract. Commitments generally have a fixed expiration date or other termination clause and may require payment of a fee. Approximately $6.2 million of the unused lines of credit outstanding at December 31, 2011 relate to real estate construction loans that are expected to fund within the next twelve months. The remaining lines primarily relate to revolving lines of credit for other real estate or commercial loans. Many of these lines may expire without being fully drawn upon and therefore the commitment amounts do not necessarily represent future cash needs.
Unused lines of credit increased $14.9 million from $44.7 million at December 31, 2010 to $59.7 million at December 31, 2011, or 33.4%. Some of the larger lines have underlying participation agreements in place with other financial institutions in order to permit the Company to support larger dollar borrowers needs without bearing all the credit risk in the Company's balance sheet. Commitments to originate loans decreased $5.5 million, or 35.0%, from $15.7 million at December 31, 2010 to $10.2 million at December 31, 2011.
The Company may, from time-to-time, enter into commitments to purchase, participate or sell loans, securities, certificates of deposit, or other investment instruments which involve market and interest rate risk. At December 31, 2011, the Company had binding loan commitments to sell residential mortgage loans at fixed rates totaling $4.4 million.
The Company sells 1-4 family residential mortgage loans under a loss-sharing program with FHLB of Boston, the Mortgage Partnership Finance program (MPF) when management believes it is the most economically viable solution. Under this program the Company shares in the credit risk of each mortgage, while receiving fee income in return. The Company is responsible for a Credit Enhancement Obligation (CEO) based on the credit quality of these loans. FHLB of Boston funds a First Loss Account (FLA) based on the Company's outstanding MPF mortgage balances. This creates a laddered approach to sharing in any losses. In the event of default, homeowner's equity and private mortgage insurance, if any, are the first sources of repayment; the FHLB of Boston's FLA funds are then utilized, followed by the member's CEO, with the balance the responsibility of FHLB of Boston. These loans must meet specific underwriting standards of the FHLB of Boston. As of December 31, 2011, the Company had $5.0 million in loans sold through the MPF program and a contract for delivery of an additional $5.0 million of future loan sales. The volume of loans sold to the MPF program and the corresponding credit obligation are closely monitored by management. As of December 31, 2011, the notional amount of the maximum contingent contractual liability related to this program was $91 thousand, of which $5 thousand was recorded as a reserve through Other liabilities.
Union Bankshares, Inc.92
Contractual Obligations: The Company has various financial obligations, including contractual obligations that may require future cash payments. The following table presents, as of December 31, 2011, significant fixed and determinable contractual obligations to third parties by payment date:
| Payments Due By Period | |||||||||||||||
Less than 1 year | 2 & 3 years | 4 & 5 years | Thereafter | Total | |||||||||||
| (Dollars in thousands) | |||||||||||||||
| Operating lease commitments | $ | 205 | $ | 152 | $ | 76 | $ | — | $ | 433 | |||||
| Contractual payments on borrowed funds (1) | 8,044 | 5,822 | 5,054 | 10,095 | 29,015 | ||||||||||
| Deposits without stated maturity (2) (1) | 315,714 | — | — | — | 315,714 | ||||||||||
| Certificates of deposit (2) (1) | 115,564 | 36,214 | 5,947 | — | 157,725 | ||||||||||
| Pension plan contributions (3) | 576 | — | — | — | 576 | ||||||||||
| Deferred compensation payouts (4) | 170 | 256 | 173 | 518 | 1,117 | ||||||||||
| Total | $ | 440,273 | $ | 42,444 | $ | 11,250 | $ | 10,613 | $ | 504,580 | |||||
____________________
| (1) | The amounts exclude interest payable, as amounts other than the $355 thousand accrued interest currently payable are not able to be estimated. |
| (2) | While Union has a contractual obligation to depositors should they wish to withdraw all or some of the funds on deposit, management believes, based on historical analysis as well as current conditions in the financial markets, that the majority of these deposits will remain on deposit for the foreseeable future. |
| (3) | Anticipated funding obligations for pension plan contributions after 2012 are excluded due to the significant variability in the assumptions required to project the amount and timing of future cash contributions. |
| (4) | The amounts exclude $116 thousand, where the payment period begins at the individual's retirement which is not determinable. |
The Company’s subsidiary bank is required (as are all banks) to maintain vault cash or a noninterest bearing reserve balance as established by Federal Reserve regulations. The Bank’s average total required reserve for the 14 day maintenance period including December 31, 2011 was $546 thousand, which was satisfied by vault cash. The Company has also committed to maintain a noninterest bearing contracted clearing balance of $1.0 million at December 31, 2011 with the Federal Reserve Bank of Boston.
Interest Rate Sensitivity "Gap" Analysis. An interest rate sensitivity "gap" is defined as the difference between interest earning assets and interest bearing liabilities maturing or repricing within a given time period. A gap is considered positive when the amount of interest rate sensitive assets exceeds the amount of interest rate sensitive liabilities. A gap is considered negative when the amount of interest rate sensitive liabilities exceeds the amount of interest rate sensitive assets. During a period of rising interest rates, a negative gap would tend to adversely affect net interest income, while a positive gap would tend to result in an increase in net interest income. During a period of falling interest rates, a negative gap would tend to result in an increase in net interest income, while a positive gap would tend to affect net interest income adversely. Because different types of assets and liabilities with the same or similar maturities may react differently to changes in overall market interest rates or conditions, changes in interest rates may affect net interest income positively or negatively even if an institution were perfectly matched in each maturity category.
The Company prepares its interest rate sensitivity “gap” analysis by scheduling interest earning assets and interest bearing liabilities into periods based upon the next date on which such assets and liabilities could mature or reprice. The amount of assets and liabilities shown within a particular period was determined in accordance with the contractual terms of the assets and liabilities, except that:
| • | adjustable-rate loans, investment securities, variable rate interest bearing deposits in banks, variable-rate time deposits, FHLB of Boston advances and other secured borrowings are included in the period when they are |
Union Bankshares, Inc.93
first scheduled to adjust and not in the period in which they mature;
| • | fixed-rate mortgage-related securities and residential loans reflect estimated prepayments, which were estimated based on analyses of broker estimates, the results of a prepayment model utilized by the Company, and empirical data; |
| • | other nonmortgage related fixed-rate loans reflect scheduled contractual amortization, with no estimated prepayments; and |
| • | interest bearing checking, money market and savings deposits, which do not have contractual maturities, reflect estimated levels of attrition, which are based on detailed studies by the Company of the sensitivity of each such category of deposit to changes in interest rates. |
Management believes that these assumptions approximate actual experience and considers them reasonable. However, the interest rate sensitivity of the Company’s assets and liabilities in the following table could vary substantially if different assumptions were used, callable investment options were modeled, prepayment speeds changed or actual experience differs from the historical experience on which the assumptions are based.
The following table shows the Company's rate sensitivity analysis as of December 31, 2011:
| Cumulative repriced within | ||||||||||||||||||
3 Months or Less | 4 to 12 Months | 1 to 3 Years | 3 to 5 Years | Over 5 Years | Total | |||||||||||||
| (Dollars in thousands, by repricing date) | ||||||||||||||||||
| Interest sensitive assets: | ||||||||||||||||||
| Overnight deposits | $ | 18,510 | $ | — | $ | — | $ | — | $ | — | $ | 18,510 | ||||||
| Interest bearing deposits in banks | 1,587 | 6,565 | 14,622 | 1,246 | — | 24,020 | ||||||||||||
| Investment securities (1)(3) | 3,649 | 493 | 2,944 | 5,489 | 33,469 | 46,044 | ||||||||||||
| Loans and loans held for sale (2)(3) | 166,707 | 78,596 | 83,874 | 59,839 | 36,142 | 425,158 | ||||||||||||
| Total interest sensitive assets | $ | 190,453 | $ | 85,654 | $ | 101,440 | $ | 66,574 | $ | 69,611 | $ | 513,732 | ||||||
| Interest sensitive liabilities: | ||||||||||||||||||
| Time deposits | $ | 23,565 | $ | 92,139 | $ | 36,074 | $ | 5,947 | $ | — | $ | 157,725 | ||||||
| Money markets | 40,035 | — | — | — | 49,443 | 89,478 | ||||||||||||
| Regular savings | 22,200 | — | — | — | 39,047 | 61,247 | ||||||||||||
| Interest bearing checking | 53,806 | — | — | — | 34,527 | 88,333 | ||||||||||||
| Borrowed funds | 6,884 | 1,159 | 5,822 | 5,054 | 10,096 | 29,015 | ||||||||||||
| Total interest sensitive liabilities | $ | 146,490 | $ | 93,298 | $ | 41,896 | $ | 11,001 | $ | 133,113 | $ | 425,798 | ||||||
| Net interest rate sensitivity gap | $ | 43,963 | $ | (7,644 | ) | $ | 59,544 | $ | 55,573 | $ | (63,502 | ) | $ | 87,934 | ||||
| Cumulative net interest rate sensitivity gap | $ | 43,963 | $ | 36,319 | $ | 95,863 | $ | 151,436 | $ | 87,934 | ||||||||
Cumulative net interest rate sensitivity gap as a percentage of total assets | 8.0 | % | 6.6 | % | 17.3 | % | 27.4 | % | 15.9 | % | ||||||||
Cumulative net interest rate sensitivity gap as a percentage of total interest sensitive assets | 8.6 | % | 7.1 | % | 18.7 | % | 29.5 | % | 17.1 | % | ||||||||
Cumulative net interest rate sensitivity gap as a percentage of total interest sensitive liabilities | 10.3 | % | 8.5 | % | 22.5 | % | 35.6 | % | 20.7 | % | ||||||||
____________________
| (1) | Investment securities exclude marketable equity securities and mutual funds with a fair value of $773 thousand and $135 thousand, respectively, that may be sold by the Company at any time. Also excluded from the table above are nonmarketable securities with a carrying amount of $2.0 million. The Company is required to hold these securities with correspondent banking institutions. |
| (2) | Balances shown include deferred unamortized loan costs of $177 thousand. |
| (3) | Estimated repayment assumptions considered in Asset/Liability model. |
Union Bankshares, Inc.94
Simulation Analysis. In its simulation analysis, the Company uses computer software to simulate the estimated impact on net interest income under various interest rate scenarios, balance sheet trends and strategies over a relatively short time horizon. These simulations incorporate assumptions about balance sheet dynamics such as loan and deposit growth, product pricing, prepayment speeds on mortgage related assets, principal maturities or calls on other financial instruments and changes in the funding mix. While such assumptions are inherently uncertain as actual rate changes
and balance sheet growth rarely follow any given forecast and asset/liability pricing and other model inputs usually do not remain constant in their historical relationships, management believes that these assumptions are reasonable. Based on the results of these simulations, the Company is able to quantify its estimate of interest rate risk and develop and implement appropriate strategies.
The following chart reflects the cumulative results of the Company's latest simulation analysis for the next twelve months on net interest income, net income, return on average assets and return on average equity. Shocks are intended to capture interest rate risk under extreme conditions by immediately shifting to the new level. The projection utilizes a proportional rate shock of up 300 basis points and down 100 basis points from the December 31, 2011 prime rate of 3.25%. A 300 basis point shock is the highest internal slope monitored. This slope range was determined to be the most relevant during this economic cycle. It should be noted that given the current prime rate and other key rates at December 31, 2011, the floor rates on various loans and deposits may have already been reached or will be hit in a down 100 basis point environment which is handled by the simulation model. What the model cannot take into account is what rates the Company will find necessary to accept on loans or pay on deposits given the current competitive, low interest rate environment.
| INTEREST RATE SENSITIVITY SIMULATION ANALYSIS | ||||||||||||||||
| December 31, 2011 | ||||||||||||||||
| (Dollars in thousands) | ||||||||||||||||
Year Ending | Prime Rate | Net Interest Income | Change % | Net Income | Return on Average Assets | Return on Average Equity | ||||||||||
| December-2012 | 6.25 | % | $ | 28,241 | 25.04 | % | $ | 9,630 | 1.72 | % | 20.05 | % | ||||
| 3.25 | % | 22,586 | — | % | 5,752 | 1.03 | % | 12.47 | % | |||||||
| 2.25 | % | 21,087 | (6.64 | )% | 4,717 | 0.85 | % | 10.35 | % | |||||||
The resulting projected cumulative effect of these estimates on net interest income for the year ending December 31, 2012 are within the approved ALCO guidelines. The return on assets in the flat and down 100 basis point shock are lower than the Board guideline of 1.25%. The return on equity in the down 100 basis point shock is lower than the Board guideline of 12.00%. The simulation of earnings do not incorporate any management actions, which might moderate the negative consequences of interest rate deviations. Therefore, they do not reflect likely actual results, but serve as conservative estimates of interest rate risk. Any further drops in interest rates would not be in the best interests of the Company. Noninterest income and expenses in the simulation are based on the budget for 2012 and will change over the course of the next twelve months as management actions are taken in response to current economic conditions and operational changes.
Liquidity. Managing liquidity risk is essential to maintaining both depositor confidence and stability in earnings. Liquidity is a measurement of the Company’s ability to meet potential cash requirements, including ongoing commitments to fund deposit withdrawals, repay borrowings, fund investment and lending activities, and funding other general business purposes. The Company’s principal sources of funds are deposits, amortization, prepayment and maturity of loans, securities, interest bearing deposits and other short-term investments, sales of securities and loans available-for-sale, and earnings and funds provided from operations. Maintaining a relatively stable funding base, which is achieved by diversifying funding sources, competitively pricing deposit products, and extending the contractual maturity of liabilities, reduces the Company’s exposure to rollover risk on deposits and limits reliance on volatile short-term purchased funds.
Union Bankshares, Inc.95
Short-term funding needs arise from declines in deposits or other funding sources, funding of loan commitments, draws on unused lines of credit and requests for new loans. The Company’s strategy is to fund assets, to the maximum extent possible, with core deposits which provide a sizable source of relatively stable and low-cost funds. The Company has seasonal short-term funding needs which are normally satisfied by short-term FHLB of Boston advances or utilization of Federal Funds Purchased lines.
The acquisition of the three New Hampshire branches on May 27, 2011 brought in $67.0 million in total deposits, of which over 50% were in a market where Union was already present, with the balance in two other local markets with communities similar to Union's existing markets. This purchase and assumption resulted in $29.6 million in cash inflow, which was invested in interest earning assets. Since the acquisition date, Union has seen deposit and overnight customer repurchase agreement sweep growth in these three branches of $4.4 million, or 6.6%, by December 31, 2011.
For the year ended December 31, 2011, the Company’s ratio of average loans to average deposits dropped to 90.7% compared to 101.4% for the year ended December 31, 2010, as the acquisition of the branches provided $32.9 million in loans but $67.0 million in deposits. Loan demand, exclusive of the loans obtained through the branch acquisitions, was stronger in 2011 than in 2010.
As a member of the FHLB of Boston, Union has access to preapproved lines of credit up to $7.6 million at December 31, 2011 over and above the $22.3 million term advances already drawn on the lines, based on a FHLB of Boston estimate as of that date. With the purchase of required FHLB of Boston Class B common stock and evaluation by the FHLB of Boston of the underlying collateral available, line availability could rise to approximately $36.7 million. This line of credit can be used for either short-term or long-term liquidity or other needs.
In addition to its borrowing arrangements with the FHLB of Boston, Union maintains a preapproved $7.0 million Federal Funds line of credit with an upstream correspondent bank, a $15 million repurchase agreement line of credit and access to the Federal Reserve discount window, which would require pledging of qualified assets. There were no balances outstanding on the Federal Funds purchase line, repurchase agreement line or at the discount window at December 31, 2011.
Union is a member of the CDARS and the ICS programs of Promontory Interfinancial Network, which allow Union to provide higher FDIC deposit insurance to customers by exchanging time and/or money market deposits with other members and also allow Union to purchase deposits from other members as another source of funding. There were no purchased deposits at either December 31, 2011 or December 31, 2010, although Union had exchanged $7.7 million and $9.8 million of deposits, respectively, with other CDARS/ICS members at those dates in order to provide our customers with full FDIC insurance coverage.
Union maintains an IDEAL Way Line of Credit with the FHLB of Boston. The total line available was $551 thousand at December 31, 2011 and 2010. There were no borrowings against this line of credit at either year-end. Interest on these borrowings is chargeable at a rate determined by the FHLB of Boston and payable monthly. Should Union utilize this line of credit, qualified portions of the loan and investment portfolios would collateralize these borrowings.
While scheduled loan and securities payments and FHLB of Boston advances are relatively predictable sources of funds, deposit flows and prepayments on loans and mortgage-backed securities are greatly influenced by market interest rates, economic conditions and competition. The Company's liquidity is actively managed on a daily basis, monitored by the ALCO, and reviewed monthly with the subsidiary's Board of Directors. The ALCO measures the Company's marketable assets and credit available to fund liquidity requirements and compares the adequacy of that aggregate amount against the aggregate amount of the Company's interest sensitive or volatile liabilities, such as core deposits and time deposits in excess of $100,000, borrowings and term deposits with short maturities, and credit commitments outstanding. The primary objective is to manage the Company's liquidity position and funding sources
Union Bankshares, Inc.96
in order to ensure that it has the ability to meet its ongoing commitments to its depositors, to fund loan commitments and unused lines of credit and to maintain a portfolio of investment securities.
The Company’s management monitors current and projected cash flows and adjusts positions as necessary to maintain adequate levels of liquidity. Although approximately 73.3% of the Company’s time deposits will mature within twelve months, that level is consistent with the preceding nineteen quarters, which ranged from 70.2% to 87.8%. The deposit gathering activities of financial institutions generally have been affected by the low interest rates which earlier in the recession made customers reluctant to lock in funds for a longer term but short-term rates have dropped so low during the last three years that some customers extend out in order to receive a better rate. Since the federal funds target rate has remained unchanged at a historic low of 0.00% to 0.25% during the last three years, as customers' time deposits matured, the rollover interest rate available to those customers is most often lower than their previous deposit rate and therefore the cost of funding has continued to drop. This phenomenon is happening throughout the banking industry and the Company is optimistic that it can maintain and grow its customer deposit base through good customer service, new deposit products offered, competitive but prudent pricing strategy and the continued expansion of the branch network. Management believes the introduction of more electronic options for deposit products and their off premise utilization through the internet will also assist in the growth of the deposit base. The relationships developed with local municipalities, businesses and retail customers and the variety of deposit products offered should, in management's view, help to ensure that Union will retain a substantial portion of these deposits. Management will continue to offer a competitive but prudent pricing strategy to facilitate retention of such deposits. The Federal Open Market Committee of the Federal Reserve anticipates keeping interest rates low until at least 2014. In the future, when interest rates begin to rise, the increase in rates may lead to early redemptions by customers which will present its own liquidity issue which will have to be managed. Funds moving from FDIC insured deposits back into the financial market is also something that we monitor and can cause a liquidity concern.
A reduction in total deposits could be offset by other funding sources, such as purchases of federal funds, utilization of the repurchase agreement line of credit, utilization of the Federal Reserve discount window, purchases of brokered deposits such as one-way CDARS or ICS deposits, short-or-long-term FHLB borrowings, or liquidation of investment securities available-for-sale or loans held for sale. Such steps could result in an increase in the Company’s cost of funds or a decrease in the yield earned on assets and therefore adversely impact the net interest spread and margin. Management believes the Company has sufficient liquidity to meet all reasonable borrower, depositor, and creditor needs in the present economic environment. However, any projections of future cash needs and flows are subject to substantial uncertainty. Customer behavior in the new branches acquired will continue to be closely monitored as the majority of these customers are new to Union Bank. Management continually evaluates opportunities to buy/sell securities available-for-sale and loans held for sale, to participate out loans and lines of credit, obtain credit facilities from lenders and restructure debt for strategic reasons or to further strengthen the Company's financial position.
Capital Resources. Capital management is designed to maintain an optimum level of capital in a cost-effective structure that meets target regulatory ratios, supports management’s internal assessment of economic capital, funds the Company’s business strategies and builds long-term stockholder value. Dividends are generally in line with long-term trends in earnings per share and conservative earnings projections, while sufficient profits are retained to support anticipated business growth, fund strategic investments and provide continued support for deposits. The Company and its subsidiary continue to be considered well capitalized under the capital adequacy requirements to which they are subject. The Company continues to evaluate growth opportunities both through internal growth or potential acquisitions. The high dividend payouts and treasury stock purchases during the last few years, as well as the recent acquisition of the three New Hampshire branches reflect the Board’s desire to utilize our capital for the benefit of the stockholders.
Union Bankshares, Inc.97
The total dollar value of the Company’s stockholders’ equity decreased from $41.7 million at December 31, 2010 to $40.3 million at December 31, 2011, reflecting net income of $5.2 million for 2011, a $9 thousand increase due to the issuance of stock options, a $26 thousand increase due to the issuance of 1,500 shares of common stock resulting from the exercise of 1,500 incentive stock options, an increase in the net unrealized other comprehensive gain of $718 thousand on investment securities available-for-sale, an increase of $2.9 million in the net other comprehensive loss attributable to the unfunded defined benefit pension liability, and cash dividends paid of $4.5 million.
The Company has 7,500,000 shares of $2.00 par value common stock authorized. As of December 31, 2011, the Company had 4,923,286 shares issued, of which 4,457,204 were outstanding and 466,082 were held in treasury. Also as of December 31, 2011, there were outstanding employee incentive stock options with respect to 2,500 shares of the Company's common stock, granted under the Company's 1998 Incentive Stock Option Plan, all of which were exercisable, and options with respect to 11,500 shares granted under the 2008 Incentive Stock Option Plan, of which 8,500 were exercisable. The 2008 Plan authorizes the issuance of incentive stock options with respect to up to 50,000 shares (subject to antidilution adjustments). As of December 31, 2011 options with respect to 37,000 shares were available for future grants.
In May 2010, the Company adopted a limited stock repurchase plan to authorize the repurchase of up to 2,500 shares of its common stock each calendar quarter in open market purchases or privately negotiated transactions, as management may deem advisable and as market conditions may warrant. The repurchase authorization for a calendar quarter expires at the end of that quarter to the extent it has not been exercised, and is not carried forward into future quarters. The quarterly repurchase program was reauthorized in December 2011 and will expire on December 31, 2012. The Company repurchased 5,004 shares under this program, for a total cost of $90 thousand in 2010 and no shares in 2011. In addition, during the first quarter of 2010, the Company repurchased 500 shares under a prior repurchase program, for a total cost of $9 thousand.
For the Company, total capital to risk weighted assets decreased to 12.2% at December 31, 2011 from 15.1% at December 31, 2010 due to the combined effect of the 2011 earnings impact of the one-time branch acquisition costs, the expanded asset base and the applicable regulatory accounting treatment of the intangible assets. Tier I capital to risk weighted assets was 11.0% at December 31, 2011 and 13.9% at December 31, 2010 and Tier I capital to average assets was 7.5% at December 31, 2011 and 9.7% at December 31, 2010. Union is categorized as well capitalized under the regulatory framework and the Company is well over the minimum capital requirements. The Company remains focused on long-term growth and above-average shareholder return. It has become more important than ever in today's economic environment for banks to ensure and plan ahead to maintain strong capital reserves.
Impact of Inflation and Changing Prices. The Company's consolidated financial statements have been prepared in accordance with GAAP, which allow for the measurement of financial position and results of operations in terms of historical dollars, without considering changes in the relative purchasing power of money over time due to inflation. Banks have asset and liability structures that are essentially monetary in nature, and their general and administrative costs constitute relatively small percentages of total expenses. Thus, increases in the general price levels for goods and services have a relatively minor effect on the Company's total expenses but could have an impact on our loan customers' financial condition. Interest rates have a more significant impact on the Company's financial performance than the effect of general inflation. During the last three years, the Federal Reserve maintained a target federal funds rate of 0.00% to 0.25% while the U.S. prime rate, which is the base rate that banks use in pricing short-term maturity commercial loans to their best, or most creditworthy, customers remained at 3.25%. The target federal funds rate, which is likely to remain unchanged at least until 2014, has never been this low and the last time the prime rate was at 3.25% was in 1955. These market rates are out of the Company's control but have a dramatic impact on net interest income.
Union Bankshares, Inc.98
Interest rates do not necessarily move in the same direction or change in the same magnitude as the prices of goods and services, although periods of increased inflation may accompany a rising interest rate environment. Inflation in the price of goods and services, while not having a substantial impact on the operating results of the Company, does affect all customers and therefore may impact their ability to keep funds on deposit or make loan payments in a timely fashion. The Company is aware of this risk and evaluates that risk along with others in making business decisions. Unprecedented deficit spending by federal, state and local governments and control of the money supply by the Federal Reserve may have unanticipated impacts on interest rates or inflation in future periods that could have an unfavorable impact on the future operating results of the Company.
Regulatory Matters. The Company and Union are subject to periodic examinations by the various regulatory agencies. These examinations include, but are not limited to, procedures designed to review lending practices, risk management, credit quality, liquidity, compliance and capital adequacy. During 2011, the Vermont Department of Banking and the Federal Reserve Bank of Boston and during 2010, the FDIC, performed various examinations of the Company and Union pursuant to their regular, periodic regulatory reviews. No comments were received from these bodies that would have a material adverse effect on the Company’s or Union’s liquidity, financial position, capital resources, or results of operations.
Form 10-K. A copy of the Company's Form 10-K Report for the year ended December 31, 2011 filed with the Securities and Exchange Commission may be obtained without charge upon written request to:
Marsha A. Mongeon, Treasurer and Chief Financial Officer
Union Bankshares, Inc.
P.O. Box 667
Morrisville, VT 05661-0667
Or may be accessed on the Investor Relations page at www.unionbankvt.com.
Corporate Name: Union Bankshares, Inc.
Corporate Transfer Agent: Registrar & Transfer Company, 10 Commerce Drive, Cranford, NJ 07016
Union Bankshares, Inc.99
| DIRECTORS - UNION BANKSHARES, INC. | OFFICERS - UNION BANK | ||
| Kenneth D. Gibbons - Chairman | Tracy Pierce Ash - Assistant Treasurer | Littleton | |
| Cynthia D. Borck | Rhonda L. Bennett - Vice President | Morrisville | |
| Steven J. Bourgeois | Therese H. Butler - Assistant Vice President | Morrisville | |
| Timothy W. Sargent | Stacey L.B. Chase - Assistant Treasurer | Morrisville | |
| David S. Silverman | Jeffrey S. Ciochetto - Senior Vice President | Morrisville | |
| John H. Steel | Jeffrey G. Coslett - Senior Vice President | Morrisville | |
| Schuyler W. Sweet | John Currier - Assistant Vice President | Groveton | |
| Neil J. Van Dyke | Michael C. Curtis - Vice President | St. Albans | |
| Peter J. Eley - Sr. Vice Pres., Managing Trust Officer | Morrisville | ||
| OFFICERS - UNION BANKSHARES, INC. | Kenneth D. Gibbons - Chairman & CEO | Morrisville | |
| Kenneth D. Gibbons - Chairman & CEO | Don D. Goodhue - Vice President | Morrisville | |
| David S. Silverman - President | Melissa A. Greene - Assistant Vice President | Hardwick | |
| Marsha A. Mongeon - Vice President/Treasurer/CFO | Karyn J. Hale - Vice President | Morrisville | |
| John H. Steel - Secretary | Claire A. Hindes - Assistant Vice President | Morrisville | |
| JoAnn A. Tallman - Assistant Secretary | Robert D. Hofmann - Senior Vice President | Morrisville | |
| Patricia N. Hogan - Vice President | Morrisville | ||
| DIRECTORS - UNION BANK | Tracey D. Holbrook - Regional Vice President | St. Johnsbury | |
| Kenneth D. Gibbons - Chairman | Lura L. Jacques - Assistant Vice President, Trust Officer | St. Albans | |
| Cynthia D. Borck | Lynne P. Jewett - Assistant Vice President | Morrisville | |
| Steven J. Bourgeois | Stephen H. Kendall - Vice President | Morrisville | |
| Timothy W. Sargent | Susan O. Laferriere - Vice President | St. Johnsbury | |
| David S. Silverman | Dennis J. Lamothe - Vice President | St. Johnsbury | |
| John H. Steel | Susan F. Lassiter - Vice President | Jeffersonville | |
| Schuyler W. Sweet | Christine S. Latulip - Regional Vice President | Littleton | |
| Neil J. Van Dyke | Edward L. Levite - Senior Loan Originator | South Burlington | |
| Virginia M. Locke - Assistant Vice President | Littleton | ||
| Carrie R. Locklin - Assistant Vice President | Morrisville | ||
| REGIONAL ADVISORY BOARD MEMBERS | Robyn A. Masi - Vice President | Stowe | |
| Judy F. Aydelott - Northern New Hampshire | Sherrie A. Menard - Assistant Vice President | Morrisville | |
| Joel S. Bourassa - Northern New Hampshire | Marsha A. Mongeon - Senior Vice President, CFO | Morrisville | |
| Steven J. Bourgeois - St. Albans | Karen Carlson Noyes - Vice President | Morrisville | |
| J.R. Alexis Clouatre - St. Johnsbury | Barbara A. Olden - Vice President | St. Johnsbury | |
| Dwight A. Davis - St. Johnsbury | Deborah J. Partlow - Asst. Vice Pres., Senior Trust Officer | Morrisville | |
| Kirk Dwyer - St. Johnsbury | Bradley S. Prior - Assistant Treasurer | Morrisville | |
| Stanley T. Fillion - Northern New Hampshire | Craig S. Provost - Vice President | Stowe | |
| Rosemary H. Gingue - St. Johnsbury | Robert J. Richardson - Vice President | Morrisville | |
| Kenneth D. Gibbons - All | David S. Silverman - President | Morrisville | |
| Coleen K. Kohaut - St. Albans | Judy R. Smith - Assistant Vice President | St. Albans | |
| Justin P. Lavely - St. Johnsbury | John H. Steel - Secretary | Morrisville | |
| Daniel J. Luneau - St. Albans | Curtis C. Swan - Assistant Vice President | Fairfax | |
| Nancy J. Poulos - St. Johnsbury | JoAnn A. Tallman - Assistant Secretary | Morrisville | |
| Samuel H. Ruggiano - St. Albans | Francis E. Welch - Assistant Vice President | Morrisville | |
| Schuyler W. Sweet - Northern New Hampshire | Martha J. Wilkins - Assistant Treasurer | Lyndonville | |
| Norrine A. Williams - Northern New Hampshire | Lorraine G. Willett - Assistant Vice President | Morrisville | |
 | |||||
| VERMONT | |||||
| DANVILLE | 421 Route 2 East | 802-684-2211 | |||
| FAIRFAX | Jct. Routes 104 & 128 | 802-849-2600 | |||
| HARDWICK | 103 VT Route 15 | 802-472-8100 | |||
| JEFFERSONVILLE | 44 Main Street | 802-644-6600 | |||
| JOHNSON | 198 Lower Main Street | 802-635-6600 | |||
| LYNDONVILLE | 183 Depot Street | 802-626-3100 | |||
| MORRISVILLE | 20 Lower Main Street | 802-888-6600 | |||
| 65 Northgate Plaza | 802-888-6860 | ||||
| ST. ALBANS | 15 Mapleville Depot | 802-524-9000 | |||
| ST. JOHNSBURY | 364 Railroad Street | 802-748-3131 | |||
| 325 Portland Street | 802-748-3121 | ||||
| 1998 Memorial Drive | 802-748-2454 | ||||
| S. BURLINGTON | Loan Center | ||||
| 30 Kimball Avenue | 802-865-1000 | ||||
| STOWE | 47 Park Street | 802-253-6600 | |||
| NEW HAMPSHIRE | |||||
| GROVETON | 3 State Street | 603-636-1611 | |||
| LITTLETON | 263 Dells Road | 603-444-7136 | |||
| 76 Main Street | 603-444-5321 | ||||
| N. WOODSTOCK | 155 Main Street | 603-745-2488 | |||
| 866-862-1891 | www.unionbankvt.com | ||||