UNITED STATES
SECURITIES AND EXCHANGE COMMISSION
WASHINGTON, D.C. 20549
FORM 10-K
| x | | ANNUAL REPORT PURSUANT TO SECTION 13 OR 15(d) OF SECURITIES EXCHANGE ACT OF 1934 |
For the fiscal year ended December 31, 2008
or
| ¨ | | TRANSITION REPORT PURSUANT TO SECTION 13 OR 15(d) OF THE SECURITIES EXCHANGE ACT OF 1934 |
For the transition period from to
Commission file number 0-26016
PALMETTO BANCSHARES, INC.
(Exact name of registrant as specified in its charter)
| | |
| South Carolina | | 74-2235055 |
| (State or other jurisdiction of incorporation or organization) | | (IRS Employer Identification No.) |
| |
| 301 Hillcrest Drive, Laurens, South Carolina | | 29360 |
| (Address of principal executive offices) | | (Zip Code) |
| |
| (864) 984–4551 | | palmettobank.com |
| (Registrant’s telephone number) | | (Registrant’s subsidiary’s web site) |
Securities registered pursuant to Section 12(b) of the Act: None
Securities registered pursuant to Section 12(g) of the Act:
Common Stock, par value $5.00 per share
(Title of class)
Indicate by check mark if the registrant is a well-known seasoned issuer, as defined in Rule 405 of the Securities Act. Yes ¨ No x
Indicate by check mark if the registrant is not required to file reports pursuant to Section 13 or Section 15(d) of the Act. Yes ¨ No x
Indicate by check mark whether the registrant (1) has filed all reports required to be filed by Section 13 or 15(d) of the Securities Exchange Act of 1934 during the preceding 12 months (or for such shorter period that the registrant was required to file such reports), and (2) has been subject to such filing requirements for the past 90 days. Yes x No ¨
Indicate by check mark if disclosure of delinquent filers pursuant to Item 405 of Regulation S-K is not contained herein, and will not be contained, to the best of registrant’s knowledge, in definitive proxy or information statements incorporated by reference in Part III of this Form 10-K or any amendment to this Form 10-K. ¨
Indicate by check mark whether the registrant is a large accelerated filer, an accelerated filer, a non-accelerated filer, or a smaller reporting company. See the definitions of “large accelerated filer,” “accelerated filer,” and “smaller reporting company” in Rule 12b-2 of the Act.
| | |
Large accelerated filer ¨ | | Accelerated filer x |
Non-accelerated filer ¨ | | Smaller reporting company ¨ |
Indicate by check mark whether the registrant is a shell company (as defined by Rule 12b-2 of the Act). Yes ¨ No x
The aggregate market value of the voting and nonvoting common equity held by nonaffiliates of the registrant (computed by reference to the price at which the common equity was most recently sold) was $232,612,800 as of the last business day of the registrant’s most recently completed second fiscal quarter. See Part II, Item 5.
6,450,090 shares of the registrant’s common stock were outstanding as of March 12, 2009.
DOCUMENTS INCORPORATED BY REFERENCE
The Company’s Proxy Statement dated April 20, 2009 with respect to an Annual Meeting of Shareholders to be held May 19, 2009 is incorporated by reference in Part II and Part III of this Form 10-K.
PALMETTO BANCSHARES, INC. AND SUBSIDIARY
2008 ANNUAL REPORT ON FORM 10-K
TABLE OF CONTENTS
2
PART I
CAUTIONARY STATEMENT REGARDING FORWARD-LOOKING STATEMENTS
This Report, including information included or incorporated by reference in this document, contains statements which constitute forward-looking statements within the meaning of Section 27A of the Securities Act of 1933 and Section 21E of the Securities Exchange Act of 1934. These statements are estimates or forecasts about Palmetto Bancshares and its subsidiary, the Bank, which includes its brokerage subsidiary, Palmetto Capital (the “Company”), and its markets based on the Company’s assumptions and estimates and are not guarantees of future performance. The Company’s actual results may differ materially from those anticipated in any forward-looking statements, as they will depend on many factors about which the Company is unsure, including many factors which are beyond its control. The words “may,” “would,” “could,” “will,” “expect,” “anticipate,” “believe,” “intend,” “plan,” and “estimate,” as well as similar expressions, are meant to identify such forward-looking statements. Potential risks and uncertainties that could cause the Company’s actual results to differ from those anticipated in any forward-looking statements include, but are not limited to, those described below under Item 1A. Risk Factors and the following:
| | • | | Significant increases in competitive pressure in the banking and financial services industries; |
| | • | | Changes in the interest rate environment which could reduce anticipated or actual margins; |
| | • | | Changes in political conditions or the legislative or regulatory environment; |
| | • | | General economic conditions, either nationally or regionally and especially in the Company’s primary service area, becoming less favorable than expected resulting in, among other things, a deterioration in credit quality; |
| | • | | Changes occurring in business conditions and inflation; |
| | • | | Changes in monetary and tax policies; |
| | • | | The level of allowance for loan loss; |
| | • | | The rate of delinquencies and amounts of loans charged-offs; |
| | • | | The rates of loan growth and the lack of seasoning of the Company’s loan portfolio; |
| | • | | Adverse changes in asset quality and resulting credit risk-related losses and expenses; |
| | • | | Loss of consumer confidence and economic disruptions resulting from terrorist activities; |
| | • | | Changes in the securities markets; and |
| | • | | Other risks and uncertainties detailed from time to time in the Company’s filings with the Securities and Exchange Commission (“SEC”). |
The Company undertakes no obligation to publicly update or otherwise revise any forward-looking statements, whether as a result of new information, future events, or otherwise.
Development and Description of Business
Organization
Palmetto Bancshares. Palmetto Bancshares, Inc. (“Palmetto Bancshares”) is a regional financial services bank holding company organized in 1982 under the laws of South Carolina and headquartered in Laurens, South
3
Carolina. Palmetto Bancshares provides, through its subsidiary, a broad array of commercial banking, consumer banking, trust and investment management, and brokerage services throughout its market area primarily in northwest South Carolina (the “Upstate”).
Since Palmetto Bancshares is a holding company and does not conduct operations, its primary sources of liquidity are dividends upstreamed from its subsidiary bank, funds received through stock option exercises, and funds received through the offering of commercial paper as an alternative investment tool for its commercial customers (referred to as its master note program).
Subsidiary of Palmetto Bancshares. The Palmetto Bank (the “Bank”) was organized under South Carolina law in 1906. Palmetto Bancshares owns all of the Bank’s stock. The Bank primarily acts as a financial intermediary by attracting deposits from the general public and using those funds, together with borrowed funds, to originate loans and invest in securities.
Significant services offered by the Bank include:
| | • | | Commercial Banking. The Bank provides commercial banking services to corporations and other business clients. Loans are made for a wide variety of corporate purposes, including financing industrial and commercial properties, construction related to industrial and commercial properties, equipment, inventories and accounts receivable, and acquisition financing. The Bank also provides cash management and merchant services. |
| | • | | Consumer Banking. The Bank provides consumer banking services, including checking accounts, savings programs, automated teller machines, overdraft facilities, installment and real estate loans, home equity loans and lines of credit, drive-in and night deposit services, and safe deposit facilities. |
| | • | | Trust and Investment Management. The Bank provides trust, investment, agency, and custodial services for individual and corporate clients. These services include the administration of estates and personal trusts, as well as the management of investment accounts for individuals, employee benefit plans, and charitable foundations. At December 31, 2008, the estimated fair value of trust assets was approximately $214 million. |
Additionally, in conjunction originating residential mortgage loans, the Company offers mortgage-servicing services to the secondary market.
Subsidiary of The Palmetto Bank. Palmetto Capital, Inc. (“Palmetto Capital”) is a wholly owned subsidiary of the Bank and provides brokerage services relating to stocks, treasury and municipal bonds, mutual funds, and insurance annuities, as well as college and retirement planning through a third party arrangement with Raymond James. At December 31, 2008, the estimated fair value of brokerage assets was approximately $168 million.
Throughout this report, the “Company” refers to Palmetto Bancshares and its subsidiary, the Bank, which includes its brokerage subsidiary, Palmetto Capital, except where the context indicates otherwise.
The Company’s corporate offices and operations center are currently located at 301 Hillcrest Drive, Laurens, South Carolina 29360, and its main telephone number is 864.984.4551. The Company will relocate its corporate headquarters to downtown Greenville, South Carolina during March 2009. The Company’s operations center will remain at its existing Laurens location.
4
The following table summarizes the Company’s consolidated assets, revenues, and net income at the dates and for the periods indicated (in thousands).
| | | | | | | |
| | | At and for the years ended December 31, |
| | | 2008 | | 2007 | | 2006 |
Total consolidated assets | | $ | 1,370,000 | | 1,248,177 | | 1,153,136 |
Total consolidated revenues | | | 97,239 | | 101,016 | | 94,328 |
Total consolidated net income | | | 13,599 | | 16,015 | | 15,241 |
Business Segments
The Company adheres to the provisions of the Financial Accounting Standards Board’s (“FASB”) Statement of Financial Accounting Standards (“SFAS”) No. 131, “Disclosures About Segments of an Enterprise and Related Information.” Operating segments are components of an enterprise about which separate financial information is available that are evaluated regularly by the chief operating decision maker in deciding how to allocate resources and assess performance. SFAS No. 131 requires that a public enterprise report a measure of segment profit or loss, certain specific revenue and expense items for each segment, segment assets, and information about the way that the operating segments were determined, among other items.
The Company considers business segments by analyzing distinguishable components that are engaged in providing individual products, services, or groups of related products or services and that are subject to risks and returns that are different from those of other business segments. When determining whether products and services are related, the Company considers the nature of the products or services, the nature of the production processes, the type or class of customer for which the products or services are designed, and the methods used to distribute the products or provide the services.
The Bank offers mortgage-banking services. These services have similar production processes and are targeted to similar customers using similar distribution channels as those employed for the entire Bank loan portfolio. Additionally, decisions are not made by chief decision makers based on the results of these services alone. Instead, decisions with regard to mortgage-banking services are typically made in conjunction with decisions made with regard to the entire loan portfolio. Therefore, the Company has concluded that mortgage-banking services do not represent an operating segment separate from the banking segment.
Additionally, the Bank and its subsidiary offer trust and investment management and brokerage services to customers through similar distribution channels utilized by the Bank. These services are not routinely evaluated separately from the Bank’s other services. At December 31, 2008, fees for such services represented approximately 3% of the Company’s total revenues. Based on these factors, trust and investment management and brokerage services do not represent an operating segment separate from the banking segment.
At December 31, 2008, the Company determined that it had one reportable operating segment, banking.
Mission and Strategy
The Company’s mission as an independent Upstate financial institution is to achieve superior long-term shareholder value, exercise exemplary corporate citizenship, promote and reward employee development, and consistently deliver quality service to its customers. Management believes that it has successfully increased shareholder value over time due to customer satisfaction, strong financial results, consistent execution of the Company’s business model, and sound management of business risks.
The Company’s executive team continually evaluates strategies to improve income. Specifically, the Company strives to identify and maintain those assets and liabilities that allow it to increase net interest income while reducing exposure to risk from interest rate fluctuations and maintaining capital adequacy in the well capitalized category.
5
The Company’s primary source of revenue is net interest income. The Company earns interest income on its interest-earning assets, primarily comprised of loans and investment securities. Offsetting this interest income is interest expense paid to the Company’s depositors and funding sources. Growing lower cost deposit account balances is critical to maximizing the Company’s net interest income. The Company has traditionally relied on customer deposits to fund asset growth. Recently, however, loan assets have tended to be fixed-rate for at least three to five years and depositors want to keep maturities short. Consequently, the Company’s ability to manage interest rate risk has been limited with regard to uses and sources of funds. As a result, the Company has increasingly used borrowed funds to fund asset growth. Although the Company often obtains borrowed funds at rates that are higher than rates for traditional deposit funding, borrowed funds are a source of diversification that can be used as leverage in deposit pricing, and borrowed funds have maturity characteristics that best meet the interest rate characteristics of its assets and liabilities. The Company will likely continue to employ a mix of deposits and borrowed funds to support interest-earning asset growth.
Among other tools, the Company uses marginal cost analysis when considering funding options. Management believes that marginal cost analysis is the key to incorporating borrowed funds into deposit pricing. Although alternative funding sources do not always result in lower interest expense paid on interest-bearing liabilities, among other uses, management believes that borrowed funding alternatives can increase the Company’s net interest income by employing these funds in higher yielding interest-earning assets.
As part of the Company’s strategy to increase net interest income, historically, the Company has strived to invest in high quality, commercial real estate loans and commercial business loans because those loans generally have higher yields than other portfolio alternatives and tend to have shorter terms to maturity or adjustable interest rates. However, growth of these types of loans typically involves increased risk. See Item 1A. Risk Factors for a discussion regarding the material risks and uncertainties that impact the Company’s loan portfolio.
To a lesser extent, the Company generates income through noninterest sources such as fees charged on deposit accounts and income generated through the Company’s mortgage-banking, trust and investment management, and brokerage services. Management continually explores opportunities to enhance noninterest income.
One way in which the Company seeks to capitalize on its existing banking office network for income growth, both interest and noninterest, is by developing additional products and services to offer to existing and potential customers and increasing the number of products customers buy from the Company. Management believes that the Company’s cross-sell strategy facilitates growth in strong and weak economic cycles, as growth can be achieved by expanding the number of products current customers have with the Company. The Company sets targets for growth in deposit accounts annually in an effort to cross-sell and increase the number of products per banking relationship. The Company strives for an average of three or more products per retail-banking household. Currently the average retail-banking household has 3.09 products with the Company.
The Company uses traditional marketing techniques such as direct mailings and advertising to attract new customers. New customers provide the Company with both interest opportunities and a new avenue for the generation of fee income. In addition, new deposit customers are key to providing a mix of lower-cost funding sources.
The Company incurs expenses for salaries and benefits paid to Company personnel as well as other general operating expenses. Identifying cost saving opportunities throughout all of the Company’s operations is a priority.
While these initiatives represent strategies pursued, they may not increase the Company’s income for long periods of time, if at all.
See Item 1A. Risk Factors for a discussion regarding the material risks and uncertainties that may impact the Company’s implementation and success of its strategies.
6
Market
The Company is a locally oriented, community based financial services institution. Its local market orientation is reflected in its management and advisory boards, which are comprised of local business persons, professionals, and other community representatives, who assist the Company’s management in identifying and responding to banking needs within the Company’s market. Despite this community-based market focus, the Company believes it offers many of the products available from larger competitors.
The Company’s primary market area is located within northwest South Carolina. The Company originates the majority of its loans and deposits in its market area.
The Upstate’s ability to attract both small local companies and major internationally recognized corporations is the result of what the Company believes is an uncommon cooperation between city government and the private sector. The Company believes that the Upstate’s entrepreneurial spirit and strong workforce creates an incredible magnet for business. The Upstate is home to such international corporations as Fluor, BMW, and Michelin North America.
Located adjacent to major transportation corridors and centrally located between Charlotte, North Carolina and Atlanta, Georgia, the Upstate provides a diversified, broad economic base. The economy of the Company’s market area consists of a wide variety of industries including, among others, manufacturing, services, construction, retail, telecommunications, and healthcare. The Company believes that it is not dependent on any one or a few types of commerce due to the area’s diverse economic base. The Company’s customer base is similarly diverse.
Despite being in what the Company believes are some of the best growth markets in South Carolina, the Company faces the risk of being particularly sensitive to changes in the state and local economies. The recent weakening in the state and local economies has impacted the Company’s loan demand and its ability to attract deposit growth.
The Company continually explores opportunities for market expansion and recognizes that opportunities may arise both within and outside of the Company’s current market area. During the first quarter of 2008, the Company executed an operating building lease and an operating lease for additional office space as part of its plan to expand into north central South Carolina in the Piedmont region. The Company upfitted these leased banking offices and opened its first banking office in Rock Hill, York County during the third quarter of 2008.
See Item 1A. Risk Factors for a discussion regarding the material risks and uncertainties that may impact the Company’s market.
Distribution Channels
The Company, through the Bank, is primarily engaged in the business of commercial and consumer banking through 29 banking offices in the counties of Laurens, Greenville, Spartanburg, Greenwood, Anderson, Cherokee, Abbeville, Pickens, Oconee, and York. In addition to its banking offices, at December 31, 2008, the Bank had 38 automatic teller machine locations (including ten at nonbanking office locations) and six limited service banking offices located in retirement centers in the Upstate. The Company provides its commercial banking, consumer banking, trust and investment management, and brokerage services to customers through its banking office network. Additionally, Palmetto Capital maintains separate investment office locations in Greenville and Laurens Counties.
The Company provides customers with access to their funds through extended weekday hours at banking offices, Saturday banking at select banking offices, an automatic teller machine network that incorporates regional and national networks, a call center, and Internet banking.
See Item 1A. Risk Factors for a discussion regarding the material risks and uncertainties that may impact the Company’s distribution channels.
7
Competition
The Company faces substantial competition. Competitors include national banks, regional banks, and other community banks. The Company also faces competition from many other types of financial institutions, including savings and loan associations, finance companies, credit unions, mortgage banks, and other financial intermediaries as well as full service brokerage firms and discount brokerage firms with regard to the services offered by Palmetto Capital. The Company also faces competition from out-of-state financial intermediaries that have opened loan production offices or that solicit deposits in the market areas served by the Company. In addition to historical competitors, in recent years, money market, stock, and fixed income mutual funds have attracted an increasing share of household savings. Consequently, the Company considers these funds to be competitors. The Company competes with major financial companies that have greater resources than the Company has, which affords them a marketplace advantage by enabling them to maintain numerous locations and mount extensive promotional and advertising campaigns. Additionally, due to their size, many competitors may offer a broader range of products and services as well as better pricing for those products and services than the Company offers. In addition, banks and other financial institutions with larger capitalization and financial intermediaries not subject to bank regulatory restrictions may have larger lending limits that allow them to serve the lending needs of larger customers. Because larger competitors have advantages in attracting business from larger corporations, the Company does not generally compete for that business. Instead, it concentrates its efforts on attracting the business of individuals and small and medium-size businesses. With regard to such accounts, the Company generally competes on the basis of customer service and responsiveness to customer needs, the convenience of banking offices and hours, and the availability and pricing of its products and services.
The following table summarizes the Bank’s deposit market share information, as of June 30, 2008, the most recent date for which data is available from the Federal Deposit Insurance Corporation (the “FDIC”).
| | | | | | | | | |
| | | Metropolitan area |
| | | Greenville | | | Anderson | | Spartanburg | | Combined |
Ranking among all institutions | | 6 | | | 10 | | 9 | | 7 |
Total institutions | | 35 | | | 21 | | 18 | | 42 |
Market share among all institutions | | 4.85 | % | | 4.27 | | 3.78 | | 4.56 |
| | | | |
Ranking among South Carolina headquartered institutions | | 2 | | | 6 | | 5 | | 3 |
Total South Carolina headquartered institutions | | 26 | | | 15 | | 13 | | 33 |
Market share among South Carolina headquartered institutions | | 8.27 | % | | 7.78 | | 7.24 | | 8.13 |
With regard to the entire state of South Carolina, according to the FDIC, as of June 30, 2008, the Bank’s market share ranks 10th out of 109 institutions and 6th out of 92 South Carolina headquartered institutions.
Employees
At December 31, 2008, the Company had 415 full-time equivalent employees, none of whom were subject to collective bargaining agreements, compared with 409 full-time equivalent employees at December 31, 2007.
Supervision and Regulation
General
Palmetto Bancshares and its subsidiary are subject to extensive regulation under federal and state laws. The regulatory framework is intended primarily for the protection of depositors, federal deposit insurance funds, and the banking system as a whole and not for the protection of security holders.
Set forth below is a summary of the significant laws and regulations applicable to Palmetto Bancshares and its subsidiary. The description is qualified in its entirety by reference to the full text of the statutes, regulations, and policies that are described. Those statutes, regulations, and policies are continually under review by
8
Congress, state legislatures, and federal and state regulatory agencies. A change in statutes, regulations, or regulatory policies applicable to Palmetto Bancshares and its subsidiary could have a material adverse impact on the Company’s business, financial condition, results of operations, and cash flows.
See Item 1A. Risk Factors for a discussion regarding the material risks and uncertainties that may impact the Company’s supervision and regulation.
Recent Legislative and Regulatory Initiatives to Address Financial and Economic Crises
The Congress, the United States (“U.S.”) Department of the Treasury, and the federal banking regulators, including the FDIC, have taken broad action since early September 2008 to address volatility in the U.S. banking system.
In October 2008, the Emergency Economic Stabilization Act of 2008 (“EESA”) was enacted. The EESA authorizes the U.S. Department of the Treasury to purchase from financial institutions and their holding companies up to $700 billion in mortgage loans, mortgage-related securities and certain other financial instruments, including debt and equity securities issued by financial institutions and their holding companies through the troubled asset relief program (“TARP”). The TARP intends to restore confidence and stability to the U.S. banking system and to encourage financial institutions to increase lending to customers and to each other. The U.S. Department of the Treasury has allocated $250 billion towards the TARP Capital Purchase Program (“CPP”). Under the CPP, U.S. Department of the Treasury will purchase debt or equity securities from participating institutions. The TARP also will include direct purchases or guarantees of troubled assets of financial institutions. Participants in the CPP are subject to executive compensation limits and are encouraged to expand their lending and mortgage loan modifications.
On November 20, 2008, the Company issued a press release announcing its intention not to participate in the U.S. Department of the Treasury’s CPP. A copy of the press release is furnished as Exhibit 99 to the Current Report on Form 8-K filed on November 24, 2008. This information may be accessed at www.sec.gov.
The EESA also increased FDIC deposit insurance on most accounts from $100,000 to $250,000. This increase is in place until the end of 2009 and is not covered by deposit insurance premiums paid by the banking industry.
Following a systemic risk determination, the FDIC established a Temporary Liquidity Guarantee Program (“TLGP”) on October 14, 2008. The TLGP includes the Transaction Account Guarantee Program (“TAGP”), which provides unlimited deposit insurance coverage through December 31, 2009 for noninterest-bearing transaction accounts (typically business checking accounts) and certain funds swept into noninterest-bearing savings accounts. Institutions participating in the TAGP are charged a 10 basis points fee (annualized) on the balance of each covered account in excess of $250,000, until the expiration of the TAGP. The TLGP also includes the Debt Guarantee Program (“DGP”), under which the FDIC guarantees certain senior unsecured debt of FDIC insured institutions and their holding companies. The unsecured debt must be issued on or after October 14, 2008 and not later than June 30, 2009, and the guarantee is effective through the earlier of the maturity date or June 30, 2012. The DGP coverage limit is generally 125% of the eligible entity’s eligible debt outstanding on September 30, 2008 and scheduled to mature on or before June 30, 2009 or, for certain insured institutions, 2% of their liabilities as of September 30, 2008. Depending on the term of the debt maturity, the nonrefundable DGP fee ranges from 50 to 100 basis points (annualized) for covered debt outstanding until the earlier of maturity or June 30, 2012. The TAGP and DGP are in effect for all eligible entities, unless the entity opted out on or before December 5, 2008. The Company chose to participate in the TAGP and opted out of the DGP.
On February 17, 2009, the American Recovery and Reinvestment Act (the “Recovery Act”) was signed into law in an effort to, among other things, create jobs and stimulate growth in the U.S. economy. The Recovery Act
9
specifies appropriations of approximately $787 billion for a wide range of Federal programs and will increase or extend certain benefits payable under the Medicaid, unemployment compensation, and nutrition assistance programs. The Recovery Act also reduces individual and corporate income taxes and makes a variety of other changes to tax laws. The Recovery Act also imposes certain limitations on compensation paid by participants in the TARP, which includes programs under TARP such as the CPP, in which the Company did not participate.
Regulatory Agencies
Palmetto Bancshares is a legal entity separate and distinct from its subsidiary, is regulated under the Bank Holding Company Act of 1956, as amended (“BHCA”), and is subject to inspection, examination, and supervision by the Federal Reserve System (the “Federal Reserve”). Palmetto Bancshares is also under the jurisdiction of the SEC and is subject to the disclosure and regulatory requirements of the Securities Act of 1933, as amended, and the Securities Exchange Act of 1934, as amended.
The Bank is a FDIC insured, state-chartered banking organization and is subject to various statutory requirements and rules and regulations promulgated and enforced primarily by the Federal Reserve, as its primary federal regulator, the FDIC, as its deposit insurer, and the South Carolina State Board of Financial Institutions (the “State Board”). The Bank is also a member of the Federal Home Loan Bank System (“FHLB”). The Bank is subject to various statutes, rules, and regulations that govern the insurance of deposits, required reserves, allowable investments, loans, mergers, consolidations, issuance of securities, payment of dividends, establishment of banking offices, and other aspects of the business of the Bank. Palmetto Bancshares must file reports with the Federal Reserve, and the Bank must file reports with the FDIC concerning its activities and financial condition in addition to obtaining regulatory approvals prior to entering into certain transactions such as mergers with, or acquisitions of, other financial institutions. The Federal Reserve, the State Board, and / or the FDIC conduct periodic examinations to test the applicable entity’s safety and soundness and compliance with various regulatory requirements. This regulation and supervision establishes a comprehensive framework of permitted activities in which the Company can engage and is intended primarily for the protection of the federal deposit insurance funds and depositors. The regulatory structure also gives the regulatory authorities extensive discretion in connection with their supervisory and enforcement activities and examination policies, including policies with respect to the classification of assets and the establishment of adequate loan loss reserves for regulatory purposes.
Holding Company Activities
BHCA. Palmetto Bancshares is a bank holding company. In general, the BHCA limits the business of bank holding companies to banking, managing or controlling banks, and other activities that the Federal Reserve has determined to be closely related to banking.
The BHCA generally limits acquisitions by bank holding companies that are not qualified as financial holding companies to commercial banks and companies engaged in activities that the Federal Reserve has determined to be so closely related to banking as to be a proper incident thereto.
The BHCA also regulates acquisitions of commercial banks and prohibits Palmetto Bancshares from acquiring direct or indirect control of more than 5% of any class of outstanding voting stock, or substantially all of the assets of, any bank or merging or consolidating with another bank holding company without prior approval of the Federal Reserve. The BHCA also prohibits Palmetto Bancshares from engaging in or acquiring ownership or control of more than 5% of the outstanding voting stock of any company engaged in a nonbanking business unless that business is determined by the Federal Reserve to be closely related to banking or managing or controlling banks.
Generally, a bank headquartered in one state may merge with a bank headquartered in another state. After a bank has established banking offices in a state through an interstate merger transaction, the bank may establish and acquire additional banking offices in the state where a bank headquartered in that state could have established or acquired banking offices under applicable federal or state law.
10
In addition, and subject to certain exceptions, the BHCA and the Change in Bank Control Act, together with regulations promulgated thereunder, require Federal Reserve approval prior to any person or company acquiring control of a bank holding company. Control is conclusively presumed to exist if an individual or company acquires 25% or more of any class of voting securities of a bank holding company. Following the relaxing of these restrictions by the Federal Reserve in September 2008, control will be rebuttably presumed to exist if a person acquires more than 33% of the total equity of a bank or bank holding company, of which it may own, control, or have the power to vote not more than 15% of any class of voting securities.
Source of Strength Doctrine and other Responsibilities with Respect to the Bank. There are a number of obligations and restrictions imposed by law and regulatory policy on bank holding companies with regard to their depository institution subsidiaries that are designed to minimize potential loss to depositors and to the FDIC insurance funds in the event that the depository institution becomes in danger of defaulting under its obligations to repay deposits. Under a policy of the Federal Reserve, a bank holding company is required to serve as a source of financial strength to its subsidiary depository institutions and to commit resources to support such institutions in circumstances where it might not do so absent such policy. The Federal Reserve also has the authority under the BHCA to require a bank holding company to terminate any activity or relinquish control of a nonbank subsidiary (other than a nonbank subsidiary of a bank) upon the Federal Reserve’s determination that such activity or control constitutes a serious risk to the financial soundness or stability of any subsidiary depository institution of the bank holding company. Further, federal law grants federal bank regulatory authorities additional discretion to require a bank holding company to divest itself of any bank or nonbank subsidiary if the agency determines that divestiture may aid the depository institution’s financial condition.
The State Board of Financial Institutions. As a bank holding company registered under the South Carolina BHCA, Palmetto Bancshares is subject to regulation by the State Board of Financial Institutions. Palmetto Bancshares must file with the State Board periodic reports with respect to its financial condition, results of income, management, and relationships between Palmetto Bancshares and the Bank. Additionally, Palmetto Bancshares must obtain approval from the State Board of Financial Institutions prior to engaging in acquisitions of banking or nonbanking institutions or assets.
Dividends
The holders of the Company’s common stock are entitled to receive dividends, when and if declared by the Company’s Board of Directors, out of funds legally available for such dividends. Palmetto Bancshares is a legal entity separate and distinct from the Bank and depends on the payment of dividends from the Bank. Palmetto Bancshares and the Bank are subject to regulatory policies and requirements relating to the payment of dividends, including requirements to maintain adequate capital above regulatory minimums. Federal regulatory authorities are authorized to determine under certain circumstances that the payment of dividends by a bank holding company or a bank would be an unsafe or unsound practice and to prohibit payment of those dividends. Federal regulatory authorities have indicated that banking organizations should generally pay dividends only out of current income. In addition, as a South Carolina chartered bank, the Bank is subject to limitations on the amount of dividends that it is permitted to pay.
See Item 5. Market For Registrant’s Common Equity, Related Shareholder Matters and Issuer Purchases of Equity Securities for a further discussion regarding matters related to the Company’s common stock dividends.
Capital Adequacy and Prompt Corrective Action
Banks and bank holding companies are subject to various regulatory capital requirements administered by state and federal banking agencies. Capital adequacy guidelines and, additionally for banks, prompt corrective action regulations, involve quantitative measures of assets, liabilities, and certain off-balance sheet agreements calculated under regulatory accounting practices. Capital amounts and classifications are also subject to qualitative judgments by regulators about components, risk-weighting, and other factors.
11
The Federal Reserve and the FDIC have substantially similar risk-based capital ratio and leverage ratio guidelines for banking organizations. The guidelines are intended to ensure that banking organizations have adequate capital given the risk levels of assets and off-balance sheet agreements. Under the guidelines, banking organizations are required to maintain minimum ratios for Tier 1 capital, as defined below, and total capital to risk-weighted assets (including certain off-balance sheet agreements such as letters of credit). For purposes of calculating the ratios, a banking organization’s assets and some of its specified off-balance sheet agreements are assigned to various risk categories. A depository institution’s or holding company’s capital, in turn, is classified in one of the following three tiers, depending on type:
| | • | | Core Capital (Tier 1). Tier 1 capital includes common equity, retained earnings, qualifying noncumulative perpetual preferred stock, a limited amount of qualifying cumulative perpetual preferred stock at the holding company level, minority interests in equity accounts of consolidated subsidiaries, qualifying trust preferred securities less goodwill, most intangible assets, and certain other assets. |
| | • | | Supplementary Capital (Tier 2). Tier 2 capital includes, among other things, perpetual preferred stock and trust preferred securities not meeting the Tier 1 definition, qualifying mandatory convertible debt securities, qualifying subordinated debt, and allowances for loan losses, subject to limitations. |
| | • | | Market Risk Capital (Tier 3). Tier 3 capital includes qualifying unsecured subordinated debt. |
Palmetto Bancshares, like other bank holding companies, currently is required to maintain Tier 1 capital and total capital (the sum of Tier 1, Tier 2, and Tier 3 capital) equal to at least 4.0% and 8.0%, respectively, of its total risk-weighted assets (including various off-balance sheet agreements such as letters of credit). At least half of the total capital is required to be Tier 1 capital. In determining the amount of risk-weighted assets, all assets, including certain off-balance sheet agreements, are multiplied by a risk-weight ranging from 0% to 100% based on the risk inherent in the type of asset. The Bank, like other depository institutions, is required to maintain similar capital levels under capital adequacy guidelines. For a depository institution to be considered well capitalized under the regulatory framework for prompt corrective action, its Tier 1 and total capital ratios must be at least 6.0% and 10.0% on a risk-weighted basis, respectively.
Bank holding companies and banks subject to the market risk capital guidelines are required to incorporate market and interest rate risk components into their risk-based capital standards. Palmetto Bancshares and the Bank are not subject to the market risk capital guidelines.
In addition to the risk-based capital guidelines, bank holding companies and banks are also required to comply with minimum leverage ratio requirements. The Federal Reserve has adopted a minimum Tier 1 (leverage) capital ratio under which a bank holding company must maintain a minimum level of Tier 1 capital to its total adjusted quarterly average assets (as defined for regulatory purposes) of at least 3% in the case of bank holding companies that have the highest regulatory examination ratios and are not contemplating significant growth or expansion. All other bank holding companies are required to maintain a Tier 1 (leverage) capital ratio of at least 4%, unless an appropriate regulatory authority specifies a different minimum. For a depository institution to be considered well capitalized under the regulatory framework for prompt corrective action, its leverage ratio must be at least 5%. The Federal Reserve has not advised Palmetto Bancshares of any specific minimum leverage ratio applicable to it. The FDIC also requires state-chartered, nonmember banks to maintain a minimum leverage ratio similar to that adopted by the Federal Reserve. Under the FDIC’s leverage capital requirement, the Bank is required to maintain a minimum Tier 1 (leverage) capital ratio of not less than 4%.
The Federal Deposit Insurance Act, as amended (the “FDIA”), requires, among other things, the federal banking agencies to take prompt corrective action with respect to depository institutions that do not meet minimum capital requirements. The FDIA sets forth the following five capital tiers: well capitalized, adequately capitalized, undercapitalized, significantly undercapitalized, and critically undercapitalized. A depository institution’s capital tier depends upon how its capital levels compares with various relevant capital measures and certain other factors, as established by regulation. The relevant capital measures are the total capital ratio, the Tier 1 capital ratio, and the leverage ratio.
12
Under the regulations adopted by the federal regulatory authorities, a bank will be categorized as:
| | • | | Well capitalized if the institution has a total risk-based capital ratio of 10.0% or greater, a Tier 1 risk-based capital ratio of 6.0% or greater, a leverage ratio of 5.0% or greater, and is not subject to any order or written directive by any such regulatory authority to meet and maintain a specific capital level for any capital measure. |
| | • | | Adequately capitalized if the institution has a total risk-based capital ratio of 8.0% or greater, a Tier 1 risk-based capital ratio of 4.0% or greater, a leverage ratio of 4.0% or greater, and is not categorized as well capitalized. |
| | • | | Undercapitalized if the institution has a total risk-based capital ratio that is less than 8.0%, a Tier 1 risk-based capital ratio of less than 4.0%, or a leverage ratio of less than 4.0%. |
| | • | | Significantly undercapitalized if the institution has a total risk-based capital ratio of less than 6.0%, a Tier 1 risk-based capital ratio of less than 3.0%, or a leverage ratio of less than 3.0%. |
| | • | | Critically undercapitalized if the institution’s tangible equity is equal to or less than 2.0% of average quarterly tangible assets. |
In addition, an institution may be downgraded to, or deemed to be in, a capital category that is lower than indicated by its capital ratios if it is determined to be in an unsafe or unsound condition or if it receives an unsatisfactory examination rating with respect to certain matters. A bank’s capital category is determined solely for the purpose of applying prompt corrective action regulations, and the capital category may not constitute an accurate representation of a bank’s overall financial condition or prospects for other purposes.
The FDIA generally prohibits a depository institution from making any capital distributions (including payment of a dividend) or paying any management fee to its parent holding company if the depository institution would thereafter be categorized as undercapitalized. Undercapitalized institutions are subject to growth limitations and are required to submit a capital restoration plan. The agencies may not accept a capital restoration plan without determining, among other things, that the plan is based on realistic assumptions and is likely to succeed in restoring the depository institution’s capital. In addition, for a capital restoration plan to be acceptable, the depository institution’s parent holding company must guarantee that the institution will comply with the capital restoration plan. The aggregate liability of the parent holding company is limited to the lesser of an amount equal to 5.0% of the depository institution’s total assets at the time it became categorized as undercapitalized or the amount that is necessary (or would have been necessary) to bring the institution into compliance with all capital standards applicable with respect to such institution as of the time it fails to comply with the plan. If a depository institution fails to submit an acceptable plan, it is categorized as significantly undercapitalized.
Significantly undercapitalized categorized depository institutions may be subject to a number of requirements and restrictions, including orders to sell sufficient voting stock to become categorized as adequately capitalized, requirements to reduce total assets, and cessation of receipt of deposits from correspondent banks. Critically undercapitalized categorized institutions are subject to the appointment of a receiver or conservator.
As of December 31, 2008, the Company and the Bank were categorized as well capitalized under the regulatory framework based on the most recent notification from federal banking agencies. See Item 8. Financial Statements and Supplementary Data, Note 19 for further discussion regarding the capital ratios and leverage ratio of Palmetto Bancshares and the Bank.
Federal Deposit Insurance Corporation Improvement Act of 1991 (“FDICIA”)
FDICIA and regulations implementing the FDICIA require, among other things, that management report on the institution’s responsibility for preparing financial statements, establishing and maintaining an internal control structure and procedures for financial reporting, and compliance with designated laws and regulations concerning
13
safety and soundness. The final regulations also require that independent registered public accounting firms attest to, and report separately on, assertions in management’s reports regarding compliance with such laws and regulations using FDIC approved audit procedures. These regulations apply to financial institutions with greater than $1 billion in assets at the beginning of their fiscal year. Accordingly, the Bank is subject to these regulations.
Deposit Insurance
The Bank’s deposits are insured up to applicable limits by the Deposit Insurance Fund (“DIF”) of the FDIC and are subject to deposit insurance assessments. The FDIC amended its risk-based assessment system for 2007 to implement authority granted by the Federal Deposit Insurance Reform Act of 2005 (“Reform Act”). The DIF is the successor to the Bank Insurance Fund and the Savings Association Insurance Fund, which were merged effective March 31, 2006. As insurer, the FDIC imposes deposit insurance premiums and is authorized to conduct examinations of and to require reporting by FDIC insured institutions. It also may prohibit any FDIC insured institution from engaging in any activity the FDIC determines by regulation or order to pose a serious risk to the insurance fund. The FDIC also has the authority to initiate enforcement actions against financial institutions and may terminate the deposit insurance if it determines that the institution has engaged in unsafe or unsound practices or is in an unsafe or unsound condition.
Under regulations effective January 1, 2007, the FDIC adopted a new risk-based premium system that provides for quarterly assessments based on an insured institution’s ranking in one of four risk categories based upon supervisory and capital evaluations. Assessment rates depend upon the category to which an institution is assigned. Risk Category I, which contains the least risky depository institutions, is expected to include more than 90% of all institutions. Unlike the other categories, Risk Category I contains further risk differentiation based on the FDIC’s analysis of financial ratios, examination component ratings, and other information. Through December 31, 2008, rates ranged from five to seven basis points per $100 of deposits for the healthiest institutions (Risk Category I) to 43 basis points of assessable deposits for the riskiest institutions (Risk Category IV).
Under a proposal announced by the FDIC on October 7, 2008, the assessment rate schedule would be raised uniformly by seven basis points (annualized) beginning on January 1, 2009. Beginning with the second quarter of 2009, base assessment rates before adjustments would range from 10 to 45 basis points, and further changes would be made to the deposit insurance assessment system, including requiring riskier institutions to pay a larger share. The proposal would impose higher assessment rates on institutions with a significant reliance on secured liabilities and on institutions that rely significantly on brokered deposits (but, for well-managed and well capitalized institutions, only when accompanied by rapid asset growth). The proposal would reduce assessment rates for institutions that hold long-term unsecured debt and, for smaller institutions, high levels of Tier 1 capital. In addition, on February 27, 2009, the FDIC adopted an interim rule to raise 2009 second quarter deposit insurance premiums for Risk Category I banks from 10 to 14 basis points to 12 to 16 basis points. The FDIC also proposed to impose a 20-basis point special emergency assessment payable September 30, 2009. Additionally, the FDIC board authorized the FDIC to implement an additional 10 basis-point premium in any quarter. The FDIC subsequently announced that it would reduce the emergency assessment if Congress passes a bill allowing the agency to borrow more from the U.S. Department of the Treasury. The FDIC is currently seeking comment on the interim rule. The Company anticipates its future insurance costs to be higher than in previous periods. However, the Company is not currently able to accurately estimate the amount of additional cost.
Under the Reform Act, which became law in 2006, the Bank received a one-time assessment credit of $576 thousand that could be applied against future premiums, beginning in 2007, subject to certain limitations. Any remaining credit was to be used to offset up to 90% of subsequent annual assessments through 2010. As of December 31, 2007, approximately $154 thousand of the credit remained available to offset future deposit insurance assessments. This credit was not available to offset Financing Corporation (“FICO”) assessments. FDIC insured institutions are required to pay FICO assessments, in order to fund the interest on bonds issued to
14
resolve financial institutions’ failures in the 1980s. The Company fully utilized this credit in 2008. During the year ended December 31, 2008, the Company expensed $786 thousand in FICO and FDIC assessments, compared with $179 thousand expensed during the same period of 2007, which was comprised totally of FICO assessments. FICO assessments, which may be revised based upon the level of deposits, will continue until the bonds mature in the years 2017 through 2019.
Under the Reform Act, the FDIC may pay dividends to insured institutions once the DIF reserve ratio equals or exceeds 1.35% of estimated insured deposits.
The EESA increased FDIC deposit insurance on most accounts from $100,000 to $250,000. This increase is in place until the end of 2009 and is not covered by deposit insurance premiums paid by the banking industry.
As described previously in Recent Legislative and Regulatory Initiatives to Address Financial and Economic Crises, the FDIC established the TLGP on October 14, 2008, which includes the TAGP and the DGP. The TAGP and DGP are in effect for all eligible entities, unless the entity opted out on or before December 5, 2008. The Company chose to participate in the TAGP and opted out of the DGP.
The FDIC may terminate the deposit insurance of any insured depository institution, including the Bank, if it determines after a hearing that the institution has engaged in unsafe or unsound practices, is in an unsafe or unsound condition to continue operations, or has violated any applicable law, regulation, rule, order, or condition imposed by the FDIC. It also may suspend deposit insurance temporarily during the hearing process for the permanent termination of insurance if the institution has no tangible capital. If insurance of accounts is terminated, the accounts at the institution at the time of the termination, less subsequent withdrawals, shall continue to be insured for a period of six months to two years, as determined by the FDIC. Management of the bank is not aware of any practice, condition, or violation that might lead to termination of the bank’s deposit insurance.
Depositor Preference
The FDIA provides that, in the event of the liquidation or other resolution of an insured depository institution, the claims of depositors of the institution, including the claims of the FDIC as subrogee of insured depositors and certain claims for administrative expenses of the FDIC as a receiver, will have priority over other general unsecured claims against the institution. If an insured depository institution fails, insured and uninsured depositors, along with the FDIC, will have priority in payment ahead of unsecured, nondeposit creditors, including Palmetto Bancshares, with respect to any extensions of loans they have made to such insured depository institution.
Community Reinvestment Act of 1977 (“CRA”)
The CRA requires depository institutions to assist in meeting the lending needs of their market areas consistent with safe and sound banking practice. Under the CRA, each depository institution is required to help meet the lending needs of its market areas by, among other things, providing loans to low and moderate income individuals and communities. The CRA does not establish specific lending requirements or programs for financial institutions nor does it limit an institution’s discretion to develop the types of products and services that it believes are best suited to its particular community consistent with the CRA. A financial institution’s performance is periodically evaluated in the context of information about the institution (financial condition and business strategies), its community (demographic and economic data), and its competitors. Upon completion of a CRA examination, the FDIC rates the overall CRA performance of the financial institution using a four-tiered rating system. These ratings consist of outstanding, satisfactory, needs to Improve, and substantial noncompliance. For a financial holding company to commence any new activity permitted by the BHCA or to acquire any company engaged in any new activity permitted by the BHCA, each insured depository institution subsidiary of the financial holding company must have received a rating of at least satisfactory in its most recent
15
examination under the CRA. Furthermore, banking regulators take into account CRA ratings when considering approval of a proposed transaction. The CRA requires public disclosure of an institution’s CRA rating. The Bank’s latest CRA rating was satisfactory.
Financial Privacy
In accordance with the Gramm-Leach-Bliley Financial Modernization Act of 1999, federal banking regulators adopted rules that limit the ability of banks and other financial institutions to disclose nonpublic information about consumers to nonaffiliated third parties. These limitations require disclosure of privacy policies to consumers and, in some circumstances, allow consumers to prevent disclosure of certain personal information to a nonaffiliated third party.
Anti-Money Laundering and the USA Patriot Act of 2001 (the “USA Patriot Act”)
A major focus of governmental policy on financial institutions in recent years has been combating money laundering and terrorist financing. The USA Patriot Act substantially broadened the scope of U.S. anti-money laundering laws and regulations by imposing significant new compliance and due diligence obligations, creating new crimes and penalties, and expanding the extra-territorial jurisdiction of the U.S. The U.S. Department of the Treasury has issued a number of regulations that apply various requirements of the USA Patriot Act to financial institutions and broker-dealer subsidiaries. These regulations require that financial institutions maintain appropriate policies, procedures, and controls to detect, prevent, and report money laundering and terrorist financing and to verify the identity of their customers. Certain regulations impose specific due diligence requirements on financial institutions that maintain correspondent or private banking relationships with nonU.S. financial institutions or persons. Failure of a financial institution to maintain and implement adequate programs to combat money laundering and terrorist financing or to comply with all of the relevant laws or regulations can result in serious legal and reputational consequences for the institution.
Office of Foreign Assets Control Regulation
The U.S. has imposed economic sanctions that impact transactions with designated foreign countries, nationals, and others. Such sanctions are typically known as the OFAC rules based on their administration by the U.S. Department of the Treasury Office of Foreign Assets Control (“OFAC”). The OFAC administered sanctions take many different forms. Generally, however, they contain one or more of the following elements:
| | • | | Restrictions on trade with, or investment in, a sanctioned country, including prohibitions against direct or indirect imports from and exports to a sanctioned country and prohibitions on U.S. persons engaging in financial transactions relating to making investments in, or providing investment-related advice or assistance to, a sanctioned country. |
| | • | | A blocking of assets in which the government or specially designated nationals of the sanctioned country have an interest, by prohibiting transfers of property subject to U.S. jurisdiction (including property in the possession or control of U.S. persons). Blocked assets (e.g., property and bank deposits) cannot be paid out, withdrawn, set off, or transferred in any manner without a license from OFAC. |
Failure to comply with these sanctions can result in serious legal and reputational consequences for the institution.
Available Information
Under the Securities Exchange Act of 1934, the Company is required to file annual, quarterly, and current reports, proxy statements, and other information with the SEC. One may access, read, and copy any document the Company files with the SEC at the SEC’s Public Reference Room at 450 Fifth Street N.W., Washington, D.C. 20549. The public may obtain information on the operation of the Public Reference Room by calling the SEC at 1-800-SEC-0330. The Company files reports electronically with the SEC. The SEC maintains
16
an Internet site that contains reports, proxy and information statements, and other information regarding issuers that file reports electronically. This site may be accessed at www.sec.gov. Documents filed by the Company electronically with the SEC may be accessed through this website.
The Company currently makes reports filed with the SEC available, free of charge, through its website (www.palmettobank.com) through a link to the SEC’s website.
Additionally, the Company has adopted a code of ethics that applies to its executive management and senior financial officers. Because management is currently developing a new website that will make the Company’s reports filed with the SEC available without having to navigate from the Bank’s main website, the code of ethics is currently not available on the Company’s website. The code of ethics is, however, available through the SEC’s website as an exhibit to the Company’s Current Report on Form 8-K, filed on January 14, 2008, that announced its adoption. The Company also intends to include various corporate governance and investor relations information on its newly reengineered website. When the website is completed, the Company intends to disclose any amendments to, or waivers from, any provisions of its code of ethics that applied to its principal executive officer, principal financial officer, and principal accounting officer or controller on the website. No such amendments to, or waivers from, any provisions of its code of ethics that applied to its executive management and senior financial officers were reported during 2008. The address for the Company’s website is www.palmettobank.com. The Company will provide a printed copy of any of the aforementioned documents to any requesting shareholder. Such requests should be directed to 301 Hillcrest Drive, Laurens, South Carolina 29360 Attention: Chief Financial Officer.
An investment in the Company’s common stock is subject to risks inherent in its business. The material risks and uncertainties that management believes impact the Company are described below. Before making an investment decision, one should carefully consider the risks and uncertainties described below, together with all of the other information included or incorporated by reference in this report. The risks and uncertainties described below are not the only ones the Company faces. Additional risks and uncertainties may also impair the Company’s business operations. This report is qualified in its entirety by these risk factors.
If any of the following risks actually occurs, the Company’s business, financial condition, results of operations, or cash flows could be materially and adversely impacted. If this were to happen, the value of the Company’s common stock could decline, and investors could lose all or part of their investment.
Economic Risk
General
All facets of the Company’s operations are impacted by general business and economic conditions in the Upstate of South Carolina, the U.S. and abroad. These conditions include short-term and long-term interest rates, inflation, money supply, political issues, legislative and regulatory changes, fluctuations in both debt and equity capital markets, broad trends in industry and finance, and the strength of the U.S. economy and the local economies in which the Company operates, all of which are beyond the Company’s control. In 2007, the housing and real estate sectors experienced an economic slowdown that progressed into a recession in 2008. Unlike larger national or regional banks that are more geographically diversified, the Company primarily provides its services to customers within its market area. Continued weakness or weakening in business and economic conditions, caused by inflation, recession, acts of terrorism, unemployment, changes in securities markets, or other factors, will result in further deterioration in the Company’s asset quality, loan collateral values, and / or the demand for the Company’s products and services.
17
Current Conditions in the Financial Markets and Economic Conditions Generally
Negative developments in the latter half of 2007 and in 2008 in the financial services industry have resulted in uncertainty in the financial markets in general and a related general economic downturn, which have continued into 2009. In addition, as a consequence of the current recession in the U.S., businesses across a wide range of industries face serious difficulties due to the lack of consumer spending and the extreme lack of liquidity in the global credit markets. Unemployment has also increased significantly.
Further negative market developments may decrease consumer confidence levels even more causing adverse changes in payment patterns, and increases in delinquencies and default rates, which may impact the Company’s charge-off levels and provision for loan losses. This would likely exacerbate the adverse impacts of these difficult market conditions on the Company and others in the financial services industry.
As a result of these financial economic crises, many lending institutions, including the Company, have experienced declines in the performance of their loans. Moreover, competition among depository institutions for deposits and quality loans has increased significantly. In addition, the values of real estate collateral supporting many commercial loans and home mortgages have declined and may continue to decline. Broadly speaking, bank and bank holding company stock prices have been negatively impacted, as has the ability of banks and bank holding companies to raise capital or borrow in the debt markets. As a result, there is a potential for new federal or state laws and regulations regarding lending and funding practices and liquidity standards, and bank regulatory agencies are expected to be very aggressive in responding to concerns and trends identified in examinations and to, among other things, issue formal or informal enforcement actions or orders. The impact of new legislation in response to those developments may negatively impact the Company’s operations by restricting its business operations, including its ability to originate or sell loans, and may adversely impact the Company’s financial performance or stock price.
Concerned about the stability of the financial markets generally and the strength of counterparties, many lenders and institutional investors have reduced or ceased providing funding to borrowers, including to other financial institutions. This tightening of credit has led to an increased level of commercial and consumer delinquencies, lack of consumer confidence, increased market volatility and widespread reduction of business activity generally. The resulting economic pressure on consumers and lack of confidence in the financial markets has adversely impacted the Company’s business, financial condition, results of operations, and cash flows. The Company does not expect that the difficult conditions in the financial markets are likely to improve in the near future. If these conditions worsen, the Company will be adversely impacted.
The capital and credit markets have been experiencing volatility and disruption for more than a year. In recent months, the volatility and disruption have reached unprecedented levels. In some cases, the markets have produced downward pressure on stock prices and credit availability for certain issuers without regard to those issuers’ underlying financial strength. If current levels of market disruption and volatility continue or worsen, the Company’s ability to access capital may be adversely impacted which, in turn, would adversely impact the Company’s business, financial condition, results of operations, and cash flows.
Overall, during the past year, the general business environment has had an adverse impact on the Company’s business, and there can be no assurance that the environment will improve in the near term. Until conditions improve, the Company expects that its business, financial condition, results of operations, and cash flows will be adversely impacted.
The Current U.S. Financial Industry
There can be no assurance that recently enacted legislation and other measures undertaken by the U.S. Department of the Treasury, the Federal Reserve, and other governmental agencies will help stabilize the U.S. financial system or improve the housing market.
18
On October 3, 2008, then President Bush signed into law the EESA, which, among other measures, authorized the U.S. Department of the Treasury Secretary to establish the TARP. The EESA gives broad authority to U.S. Department of the Treasury to purchase, manage, modify, sell, and insure the troubled mortgage related assets that triggered the current economic crisis as well as other troubled assets. The EESA includes additional provisions directed at bolstering the economy, including:
| | • | | Authority for the Federal Reserve to pay interest on depository institution balances; |
| | • | | Mortgage loss mitigation and homeowner protection measures; |
| | • | | Temporary increase in FDIC insurance coverage from $100,000 to $250,000 through December 31, 2009; and |
| | • | | Authority for the SEC to suspend mark-to-market accounting requirements for any issuer or class of category of transactions. |
The EESA authorizes the U.S. Department of the Treasury to purchase from financial institutions and their holding companies up to $700 billion in mortgage loans, mortgage-related securities and certain other financial instruments, including debt and equity securities issued by financial institutions and their holding companies through the TARP. The TARP intends to restore confidence and stability to the U.S. banking system and to encourage financial institutions to increase lending to customers and to each other. The U.S. Department of the Treasury has allocated $250 billion towards the TARP CPP. Under the CPP, the U.S. Department of the Treasury will purchase debt or equity securities from participating institutions. The TARP also will include direct purchases or guarantees of troubled assets of financial institutions. Finally, the CPP provides access to capital to financial institutions through a standardized program to acquire preferred stock (accompanied by warrants) from eligible financial institutions that will serve as Tier 1 capital.
The EESA also contains a number of significant employee benefit and executive compensation provisions, some of which apply to employee benefit plans generally, and others of which are imposed on financial institutions that participate in the TARP program.
The EESA followed, and has been followed by, numerous actions by the Federal Reserve, Congress, the U.S. Department of the Treasury, the SEC and others to address the current liquidity and credit crisis that has followed the subprime meltdown that commenced in 2007. These measures include homeowner relief that encourage loan restructuring and modification, the establishment of significant liquidity and credit facilities for financial institutions and investment banks, the lowering of the federal funds rate, including a 175-200 basis point decrease in the fourth quarter of 2008, emergency action against short selling practices, a temporary guaranty program for money market funds, the establishment of a commercial paper funding facility to provide back-stop liquidity to commercial paper issuers, and coordinated international efforts to address illiquidity and other weaknesses in the banking sector.
In addition, the Internal Revenue Service (“IRS”) has issued an unprecedented wave of guidance in response to the credit crisis, including a relaxation of limits on the ability of financial institutions that undergo an “ownership change” to utilize their pre-change net operating losses and net unrealized built-in losses. The relaxation of these limits may make it significantly more attractive to acquire financial institutions that have a tax basis in their loan portfolios that significantly exceeds the fair value of those portfolios.
In October 2008, the FDIC announced the establishment of the TLGP to provide full deposit insurance for all noninterest bearing transaction accounts and guarantees of certain newly issued senior unsecured debt issued by FDIC insured institutions and their holding companies. Insured institutions were automatically covered by this program for the period commencing October 14, 2008 and continued to be covered as long as they did not opt out of the program by December 5, 2008. Under the program, the FDIC guarantees timely payment of newly issued senior unsecured debt issued on or before June 30, 2009. The debt includes all newly issued unsecured senior debt (e.g., promissory notes, commercial paper and inter-bank funding). The aggregate coverage for an
19
institution could not exceed 125% of its debt outstanding on September 30, 2008 that was scheduled to mature before June 30, 2009, or for certain insured institutions, 2% of liabilities as of September 30, 2008. The guarantee extends to June 30, 2012 even if the maturity of the debt is after that date. The Company chose to participate in the transaction account guarantee program but opted out of the debt guarantee program.
On February 17, 2009, the Recovery Act was signed into law in an effort to, among other things, create jobs and stimulate growth in the U.S. economy. The Recovery Act specifies appropriations of approximately $787 billion for a wide range of Federal programs and will increase or extend certain benefits payable under the Medicaid, unemployment compensation, and nutrition assistance programs. The Recovery Act also reduces individual and corporate income taxes and makes a variety of other changes to tax laws. The Recovery Act also imposes certain limitations on compensation paid by participants in the TARP, which includes programs under TARP such as the CPP, in which the Company did not participate.
The actual impact that the EESA and related measures undertaken to alleviate the credit crisis will have on the financial markets remains unknown. The failure of such measures to help stabilize the financial markets and a continuation or worsening of current financial market conditions would materially and adversely impact the Company’s business, financial condition, and results of operations. There can be no assurance regarding the specific impact that such measures may have on the Company or whether (or to what extent) the Company will benefit from such programs.
Risk of Downturn in the Economy on Small- to Medium-Sized Business Target Markets
The Company targets the banking and financial services needs of small- and medium-sized businesses. These businesses generally have fewer financial resources in terms of capital borrowing capacity than larger entities. If general economic conditions continue to negatively impact these businesses in the markets in which the Company operates, its business, financial condition, results of operation, and cash flows may be adversely impacted.
Interest Rate Risk
Risk to Net Interest Income
Net interest income is the difference between interest income earned on interest-earning assets and interest expense paid on interest-bearing liabilities. Interest rates are highly sensitive to many factors that are beyond the Company’s control, including general economic conditions and policies of various governmental and regulatory agencies, particularly the Federal Reserve.
The Company is subject to interest rate risk because:
| | • | | Assets and liabilities may mature or reprice at different times (for example, if assets reprice faster than liabilities and interest rates are generally falling, net income will initially decline); |
| | • | | Assets and liabilities may reprice at the same time but by different amounts (for example, when the general level of interest rates is falling, the Company may reduce rates paid on transaction and savings deposit accounts by an amount that is less than the general decline in market interest rates); |
| | • | | Short-term and long-term market interest rates may change by different amounts (for example, the shape of the yield curve may impact new loan yields and funding costs differently); or |
| | • | | The remaining maturity of various assets or liabilities may shorten or lengthen as interest rates change (for example, if long-term mortgage interest rates decline sharply, mortgage-backed securities held in the investment securities available for sale portfolio may prepay significantly earlier than anticipated – which could reduce portfolio income). |
Interest rates may also have a direct or indirect impact on loan demand, credit losses, mortgage origination volume, the mortgage-servicing rights portfolio, the value of the Company’s pension plan assets and liability, and other financial instruments directly or indirectly impacting net income.
20
Any substantial, unexpected, prolonged change in market interest rates could have a material adverse impact on the Company’s business, financial condition, results of operations, and cash flows. See Item 7A. Quantitative And Qualitative Disclosures About Market Risk contained herein for discussion regarding the impact that changing interest rates would have on the Company’s net interest income over the coming 12 month period.
Loan Prepayment Risks Impacting Mortgage Instruments
Loan prepayment rates are impacted by changes in interest rates charged on mortgage loans as well as, to a lesser extent, by consumer behavior, conditions in the housing and financial markets, and general economic conditions. Although changes in prepayment rates are difficult to predict, prepayment rates tend to increase when market interest rates decline. Since December 31, 2007, the Federal Reserve reduced the prime and federal funds interest rate by 400-425 basis points. The Company anticipates that this decline in interest rates may result in an increase in loan prepayments in the foreseeable future. Significant risks resulting from increased loan prepayments include the following:
Deferred Fees and Costs Impact. The Company recognizes deferred loan origination fees and costs by adjusting interest income over the contractual life of the individual loans. As prepayments occur, the rate at which net deferred loan origination fees and costs are expensed accelerates.
Premiums Paid on Mortgage-Backed Securities Impact. The Company recognizes premiums paid on mortgage-backed securities as an adjustment to interest income over the life of the investment security based on the rate of repayment of the investment securities. Prepayment on the loans underlying a mortgage-backed security shortens the life of the security thereby increasing the rate at which premiums are expensed.
Mortgage-Servicing Rights Portfolio Impact. The Company’s mortgage-servicing rights portfolio represents the estimated present value of fees that the Company expects to receive on mortgages that it services over an expected term. If prepayments increase above expected levels, the value of the servicing asset decreases because the amount of future fees expected to be received by the Company decreases. The Company may be required to recognize this decrease in value by taking a charge against net income. The Company has experienced an increase in prepayments of mortgages at times in the past as interest rates have decreased dramatically, which has impacted the value of its servicing asset. The Company believes, based on historical experience, that the amount of prepayments and related charges should decrease if interest rates increase.
Funds Reinvestment Risk. With regard to the Company’s loan portfolio, it may be unable to reinvest prepayment proceeds at rates comparable to the prepaid instruments, particularly in periods of declining interest rates.
Lending Activities Risk
There are inherent risks associated with the Company’s lending activities. These risks include, among other things, the impact of changes in interest rates on borrowers and changes in the economic conditions in the specific markets in which the Company operates, as well as changes in economic conditions regionally, nationally, and internationally. Increases in interest rates and / or weakening economic conditions could adversely impact the ability of borrowers to pay their loans or the value of the collateral securing those loans.
See Item 7. Management’s Discussion and Analysis of Financial Condition and Results of Operations for a discussion regarding the Company’s underwriting and monitoring policies and procedures for mitigating risks inherent in the Company’s lending activities.
Repayment and Collateral Risk
The Company could experience loan losses because borrowers, guarantors, and / or related parties may fail to perform in accordance with the terms of their loans and the Company’s underwriting and loan monitoring
21
policies and procedures adopted to address loan loss risks may not prevent unexpected losses. In an economic downturn, the Company’s ability to assess the creditworthiness of its customers may be impaired if the models and approaches the Company uses to select, manage, and underwrite its customers become less predictive of future behaviors.
At December 31, 2008, approximately 71% of the Company’s loan portfolio consisted of commercial and industrial loans and loans secured by construction, land development, other land, and nonfarm nonresidential real estate. Loans secured by construction, land development, other land, and nonfarm nonresidential real estate are generally viewed as having more risk of default than loans secured by residential real estate or consumer loans because repayment of the loans often depends on the successful operation of the property, the income stream of the borrowers, the accuracy of the estimate of the property’s value at completion of construction, and the estimated cost of construction. Commercial and industrial loans are generally more risky than loans secured by residential real estate or consumer loans because those loans are typically not secured by real estate collateral. An adverse development with respect to one lending relationship can expose the Company to a significantly greater risk of loss compared with a single-family residential mortgage loan because the Company typically has more than one loan with such borrowers. Additionally, these loans typically involve larger loan balances to single borrowers or groups of related borrowers compared with single-family residential mortgage loans. Therefore, the deterioration of one or a few of these loans could cause a significant decline in the related asset quality. A decline in asset quality could result in a loss of income from these loans, an increase in the provision for loan losses, and an increase in loans charged-off, all of which could result in a material adverse impact on the Company’s business, financial condition, results of operations, and cash flows. Management believes that the Company’s construction, land development, other land, and nonfarm nonresidential real estate collateral is diverse in terms of type. This diversity, management believes, reduces the Company’s exposure to adverse economic events that impact any single industry.
Although they represent a relatively small portion of the Company’s loan portfolio, the Company is subject to risk with regard to its installment loans, particularly loans that are unsecured or secured by rapidly depreciating assets. In such cases, any repossessed collateral for a defaulted installment loan may not provide an adequate source of repayment of the outstanding loan balance. In addition, installment loan collections depend on the borrower’s continuing financial stability and are more likely to be adversely impacted by job loss, divorce, illness, and / or personal bankruptcy. Additionally, the application of federal and state legislation and / or regulatory action may reduce the amount that the Company’s borrowers are required to pay or limit the Company’s ability to foreclose on properties or other collateral, which makes foreclosure less economically feasible.
Real Estate Market Risk
While the Company does not have any subprime loans, at December 31, 2008, approximately 86% of the Company’s loan portfolio was secured by real estate. Although the Company believes that there is generally less risk associated with loans secured by real estate than with those not secured by real estate, a downturn in the real estate markets could directly impact the collateral securing the Company’s loan portfolio. The Company’s loan portfolio secured by real estate has been adversely impacted by to the dramatic declines in the housing market over the past year, with falling home prices and increasing foreclosures. As of December 31, 2008, the majority of the Company’s loan portfolio secured by real estate consisted of loans secured by properties located in northwest South Carolina. The Company anticipates that further decline in the real estate markets in South Carolina will result in decreased underlying collateral values and increased potential losses in the event of default.
Inadequate Allowance for Loan Losses to Cover Actual Losses, Need for Further Increases in Provisions for Loan Losses, and Future Charge-Off Risk
The Company maintains an allowance for loan losses, which is a reserve established through a provision for loan losses charged to expense. The allowance for loan losses represents management’s best estimate of probable
22
incurred losses within the existing portfolio of loans. The allowance is necessary to reserve for estimated loan losses and risks inherent in the loan portfolio. The level of the allowance reflects management’s continuing evaluation of specific credit risks, loan loss experience, current loan portfolio quality, present economic, political, and regulatory conditions, industry concentrations, and other unidentified losses inherent in the current loan portfolio.
The determination of the appropriate level of the allowance for loan losses inherently involves a high degree of subjectivity and judgment and requires management to make significant estimates of current credit risks and future trends, all of which may undergo material changes. Changes in economic conditions impacting borrowers, new information regarding existing loans, identification of additional problem loans and other factors, both within and outside of the Company’s control, may require an increase in the allowance for loan losses. Increases in nonperforming loans have a significant impact on the Company’s allowance for loan losses. Generally, nonperforming loans reflect operating difficulties of individual borrowers resulting from weakness in the economy. If current trends in the real estate markets continue, the Company expects that it will continue to experience increased delinquencies and credit losses, particularly with respect to loans secured by construction, land development, other land, and nonfarm nonresidential real estate. Moreover, the Company expects that the current recession will negatively impact economic conditions in its market areas, and that it could experience significantly higher delinquencies and credit losses.
Bank regulatory agencies periodically review the Company’s allowance for loan losses and may require an increase in the provision for loan losses or the recognition of further loan charge-offs, if their judgments differ from those of management. If charge-offs in future periods exceed the allowance for loan losses, the Company will need additional provisions to increase the allowance for loan losses. Furthermore, growth in the loan portfolio would generally lead to an increase in the provision for loan losses.
Any increases in the allowance for loan losses will result in a decrease in net income and capital and may have a material adverse impact on the Company’s business, financial condition, results of operations and cash flows.
See Item 7. Management’s Discussion and Analysis of Financial Condition and Results of Operations – Financial Condition for a further discussion regarding the Company’s accounting policies related to, factors impacting, and methodology for analyzing the adequacy of the Company’s allowance for loan losses.
Investment Securities Market Risk
Dramatic declines in the housing market over the past year have negatively impacted the market for some investment securities and resulted in significant writedowns of asset values by financial institutions, including government-sponsored entities, major commercial and investment banks, and regional financial institutions such as the Company. As previously discussed, the Company’s investment securities are particularly exposed to downturns in the U.S. housing market. As a result, the market for some of the investment securities held in the Company’s portfolio has become volatile over the past twelve months. Further, the current difficult market conditions may also result in credit downgrades of mortgage and bond issues that may reduce the fair value of the Company’s investment portfolio and may result in a determination that the Company’s investment securities are other-than-temporarily impaired, which could cause it to writedown the carrying value of the portfolio and would reduce its net income. Such reductions to net income would also result in a material adverse impact on the Company’s capital levels.
Liquidity and Funding Risk
The goal of liquidity management is to ensure that the Company can meet customer loan requests, customer deposit maturities and withdrawals and other cash commitments under both normal operating conditions and under unpredictable circumstances of industry or market stress. To achieve this goal, the Company’s Asset / Liability Committee establishes liquidity guidelines that require sufficient asset-based liquidity to cover potential funding requirements and to avoid over-dependence on volatile, less reliable funding markets.
23
Liquidity is essential to the Company’s business. An inability to raise funds through traditional deposits, borrowings, the sale of securities or loans, and other sources could have a substantial negative impact on the Company’s liquidity. The Company’s access to funding sources in amounts adequate to finance its activities and with terms acceptable to it could be impaired by factors that impact the Company specifically or the financial services industry in general. Factors that could detrimentally impact access to liquidity sources include a decrease in the level of the Company’s business activity as a result of a downturn in the markets in which the Company’s loans are concentrated or regulatory action against the Company. The Company’s ability to borrow could also be impaired by factors that are not specific to it, such as the current disruption in the financial markets and negative views and expectations about the prospects for the financial services industry as a result of the recent turmoil and continued deterioration in credit markets.
The Company relies on traditional and nontraditional deposits, advances from the FHLB and other borrowings to fund its operations. Although the Company has historically been able to replace maturing deposits and advances, it might not be able to replace such funds in the future if, among other things, the Company’s results of operations or financial condition worsen, if the results of operations or financial condition of the FHLB or other correspondent banks with whom the Company is associated worsen or if market conditions deteriorate further.
Although the Company considers its sources of funds adequate for its liquidity needs, there can be no assurance in this regard, and the Company may be compelled to seek additional sources of financing in the future. The Company may seek additional debt in the future to achieve its business objectives, in connection with future acquisitions or for other reasons. There can be no assurance that additional borrowings, if sought, would be available to the Company or, if available, would be on favorable terms. Bank and holding company stock prices have been negatively impacted by the recent adverse economic conditions, as has the ability of banks and holding companies to raise capital or borrow in the debt markets. If additional financing sources are unavailable or not available on reasonable terms, the Company’s business, financial condition, results of operations, cash flows, and future prospects could be materially adversely impacted.
The Company actively monitors the depository institutions that hold its federal funds sold and due from banks cash balances. The Company cannot provide assurances that access to its cash and cash equivalents and federal funds sold will not be impacted by adverse conditions in the financial markets. The Company’s emphasis is primarily on safety of principal, and management diversifies cash, due from banks, and federal funds sold among counterparties to minimize exposure relating to any one of these entities. The Company routinely reviews the financials of its counterparties as part of the Company’s risk management process. Balances in the Company’s accounts with financial institutions in the U.S. may exceed the FDIC insurance limits. While the Company monitors and adjusts the balances in its accounts as appropriate, these balances could be impacted if the financial institutions fail.
Asset Growth Restriction Risk
Minimum capital adequacy requirements restrain asset growth by requiring that asset growth be funded by a commensurate amount of additional capital. Some of the alternatives available for increasing minimum capital ratio levels include increased retained earnings, sale of additional stock, and reduced asset growth. Retained earnings may be increased through a combination of higher income and lower cash dividend payouts. An increase in retained earnings improves capital ratios assuming the increase exceeds asset growth. Historically, the Company’s primary source of capital has been through retained earnings. The Company has not historically sold additional stock to avoid shareholder dilution. If the Company does not sell additional stock when increased retained earnings are not sufficient to address capital requirements, the Company may be required to reduce asset growth to remain well capitalized as defined by the applicable regulatory framework. Restraining asset growth could result in a material adverse impact on the Company’s business, financial condition, results of operations, and cash flows.
See Item 1. Business for a discussion regarding the capital adequacy requirements for Palmetto Bancshares and the Bank.
24
Capital Risk
The Company is required by federal and state regulatory authorities to maintain adequate levels of capital to support its operations. In addition, although it has not historically chosen to do so, the Company may elect to raise additional capital to support its business or to finance acquisitions. A number of financial institutions have recently raised considerable amounts of capital as a result of deterioration in their results of operations and financial condition resulting from recent economic conditions, which may diminish the Company’s ability to raise additional capital.
The Company’s ability to raise additional capital, if needed, will depend on conditions in the capital markets, economic conditions, and a number of other factors, many of which are outside the Company’s control. Accordingly, the Company cannot be assured of its ability to raise additional capital if needed or on terms acceptable to it. The Company’s business, financial condition, results of operations, cash flows, and future prospects would be materially adversely impacted if the Company cannot raise additional capital when needed.
Deposit Insurance Assessment Risk
As discussed in Item 1. Business, the Bank’s deposits are insured up to applicable limits by the DIF of the FDIC and are subject to deposit insurance assessments to maintain the deposit insurance. Current economic conditions have increased bank failures and expectations for further failures. In the case of a bank failure, the FDIC ensures payments of deposits up to insured limits from the DIF.
In October 2008, the FDIC published a restoration plan designed to replenish the DIF over a period of five years and to increase the deposit insurance reserve ratio of insured deposits by December 31, 2013. In order to implement the restoration plan, the FDIC proposed an assessment rate schedule that would raise assessment rates uniformly by seven basis points (annualized) beginning on January 1, 2009. Beginning with the second quarter of 2009, base assessment rates before adjustments would range from 10 to 45 basis points, and further changes would be made to the deposit insurance assessment system, including requiring riskier institutions to pay a larger share. The proposal would impose higher assessment rates on institutions with a significant reliance on secured liabilities and on institutions that rely significantly on brokered deposits (but, for well-managed and well capitalized institutions, only when accompanied by rapid asset growth). The proposal would reduce assessment rates for institutions that hold long-term unsecured debt and, for smaller institutions, high levels of Tier 1 capital. In addition, on February 27, 2009, the FDIC adopted an interim rule to raise 2009 second quarter deposit insurance premiums for Risk Category I banks from 10 to 14 basis points to 12 to 16 basis points. The FDIC also proposed to impose a 20-basis point special emergency assessment payable September 30, 2009. Additionally, the FDIC board authorized the FDIC to implement an additional 10 basis-point premium in any quarter. The FDIC subsequently announced that it would reduce the emergency assessment if Congress passes a bill allowing the agency to borrow more from the U.S. Department of the Treasury. The FDIC is currently seeking comment on the interim rule. The Company anticipates its future insurance costs to be higher than in previous periods. However, the Company is not currently able to accurately estimate the amount of additional cost.
The FDIC may terminate the deposit insurance of any insured depository institution, including the Bank, if it determines after a hearing that the institution has engaged in unsafe or unsound practices, is in an unsafe or unsound condition to continue operations, or has violated any applicable law, regulation, rule, order, or condition imposed by the FDIC. It also may suspend deposit insurance temporarily during the hearing process for the permanent termination of insurance if the institution has no tangible capital. If insurance of accounts is terminated, the accounts at the institution at the time of the termination, less subsequent withdrawals, shall continue to be insured for a period of six months to two years, as determined by the FDIC. Management of the bank is not aware of any practice, condition, or violation that might lead to termination of the bank’s deposit insurance.
Management cannot predict what insurance assessment rates will be in the future. Either an increase in the Risk Category of the Bank or adjustments to the base assessment rates could have a material adverse impact on the Company’s business, financial condition, results of operations, and cash flows.
25
Monetary Policy Risk
Changes made by the Federal Reserve in monetary policy, including changes in interest rates, could influence not only the interest income the Company earns on loans and securities and the interest expense it pays on deposits and borrowed funds, but could also impact the Company’s ability to originate loans and obtain deposits, the fair value of the Company’s financial assets and liabilities, and the average duration of the Company’s mortgage-servicing rights and mortgage-backed securities portfolios. Federal Reserve policies also can adversely impact borrowers, potentially increasing the risk that they may fail to repay their loans. Changes in Federal Reserve policies, which are beyond the Company’s control and are difficult to predict or anticipate, could result in a material adverse impact on the Company’s business, financial condition, results of operations, and cash flows.
Risk of Failure to Comply with Government Regulation and Supervision
The Company’s operations are subject to extensive regulation by federal, state, and local governmental authorities. Given the current disruption in the financial markets, the Company expects that the government will pass new regulations and laws that will impact the Company. Compliance with such regulations may increase the Company’s costs and limit its ability to pursue business opportunities. Failure to comply with laws, regulations, and policies could result in sanctions by regulatory agencies, civil money penalties, and damage to the Company’s reputation. While the Company has policies and procedures in place that are designed to prevent violations of these laws, regulations, and policies, there can be no assurance that such violations will not occur.
See Item 1. Business for a discussion regarding Palmetto Bancshares’ and the Bank’s supervision and regulation.
Loss of Key Personnel Risk
The Company depends on a limited number of key management personnel. The loss of key personnel could have a material adverse impact on its operations because other officers may not have the experience and expertise to readily replace these individuals. As a result, the Board of Directors may have to search outside of the Company for qualified permanent replacements. This search may be prolonged and the Company cannot provide assurance that it would be able to locate and hire qualified replacements.
Limited Public Trading Market Stock Risk
The Company’s common stock is not traded or authorized for quotation on any exchanges or on Nasdaq. The Company facilitates trades of its common stock, matching interested buyers and sellers. The liquidity of the Company’s common stock depends upon the presence in the marketplace of willing buyers and sellers. The Company cannot provide assurance that shareholders will be able to sell their shares at the volumes, prices, or times that they desire.
The Company currently does not intend to seek listing of its common stock on a securities exchange, and the Company does not intend to seek authorization for trading of the shares on Nasdaq. The Company believes that, from time to time, it has shareholders who desire to sell their shares of the Company’s common stock but are unable to do so at the price desired because of a lack of willing buyers at that price. Moreover, it may be particularly difficult for shareholders who desire to sell large blocks of the Company’s stock to find buyers for that stock at desired prices.
A stock that is not listed on a securities exchange or authorized for Nasdaq trading might not be accepted as collateral for loans. If accepted as collateral, the stock’s value could nevertheless be substantially discounted. Consequently, investors should regard the Company’s common stock as a long-term investment and should be prepared to bear the economic risk of an investment in the common stock for an indefinite period. Investors who need or desire to dispose of all or a part of their investments in the common stock cannot do so except by private, direct negotiations with third parties.
26
| ITEM 1B. UNRESOLVED | STAFF COMMENTS |
None.
General
At December 31, 2008 and 2007, the total net book value of the premises and equipment owned, excluding those held for sale, by the Company was $26.3 million and $25.1 million, respectively. None of the Company’s owned properties are subject to mortgages or liens.
In 2008, the Company classified two parcels of land with a carrying amount of approximately $1.7 million at December 31, 2008, as held for sale. These parcels will be purchased within the next twelve months from the Company, at the carrying amount, in conjunction with the construction of the Company’s corporate headquarters in downtown Greenville.
Management evaluates, on an ongoing basis, the suitability and adequacy of all of its properties and has active programs of relocating, remodeling, consolidating, or closing properties, as necessary, to maintain efficient and attractive facilities. Management believes that all of the Company’s properties are suitable and adequate for their intended purposes. Additionally, all of the Company’s properties are protected by alarm and security systems that meet or exceed regulatory standards.
See Item 7. Management’s Discussion and Analysis of Financial Condition and Results of Operations, Item 8. Financial Statements and Supplementary Data, Note 1, and Item 8. Financial Statements and Supplementary Data, Note 5 for a further discussion regarding the Company’s premises and equipment.
Corporate Offices and Operations Center
The Company’s corporate offices and operations center are currently located in a Company owned 55,000 square foot building at 301 Hillcrest Drive, Laurens, South Carolina 29360. The Company will relocate its corporate headquarters to downtown Greenville, South Carolina during March 2009. This relocation of the corporate offices will not impact the Company’s operations center, which will remain at the existing Laurens location.
Banking Offices
At December 31, 2008, the Bank operated 29 full-service banking offices in the following counties: Laurens County (4), Greenville County (9), Spartanburg County (5), Greenwood County (4), Anderson County (2), Cherokee County (2), Pickens County (1), Oconee County (1), and York County (1). Of its 29 full-service banking offices at December 31, 2008, seven were leased and 22 were owned. With regard to these offices, during 2008, the Bank:
| | • | | Completed renovations of the Company’s Woodruff Road (Greenville County) and Montague (Greenwood County) banking offices, |
| | • | | Completed construction and celebrated the grand opening of its relocated Pendleton office in Anderson County. Ownership of the Bank’s previous Pendleton banking office is discussed in Other Properties, and |
| | • | | Executed an operating building lease and upfitted this leased banking office as part of its plans to expand into York County in north central South Carolina. The Company opened its first Rock Hill banking office during the third quarter of 2008. This leased banking office is included within the Bank’s seven leased offices disclosed above. |
In addition to its 29 full-service banking offices at December 31, 2008, the Bank operated six limited service banking offices located in retirement centers in the Upstate.
27
The temporary building utilized for banking operations in downtown Greenville during construction of the Company’s new corporate headquarters is included in the 29 full-service banking offices at December 31, 2008 and is included in the Bank’s 22 owned offices disclosed above. As disclosed in the Bank’s lease agreement for its new downtown Greenville banking office, this real property and improvements will be sold to the lessor in March 2009.
Additionally, the Bank has ground leases with regard to four of its banking office locations.
Other Properties
In addition to the banking offices at December 31, 2008 as discussed above, during 2008, the Bank:
| | • | | Consolidated its existing banking office network, reducing the number of banking offices by four. Three of these consolidated banking offices continue to be leased and one is owned. Management is currently considering its options with regard to these locations, |
| | • | | As noted above, during 2008, the Bank completed construction and celebrated the grand opening of its relocated Pendleton office in Anderson County. The Bank owns its previous Pendleton banking office. Management is currently considering its options with regard to this location, |
| | • | | Purchased property at the intersection of West Wade Hampton Boulevard and Middletown Way in Greenville County on which to construct and relocate its existing Greer banking office. The Company expects to celebrate its grand opening during the second quarter of 2009, and |
| | • | | Executed an operating lease for additional office space and upfitted this leased office space as part of its expansion into York County in north central South Carolina. The Company opened its first Rock Hill banking office during the third quarter of 2008. |
During construction of the corporate headquarters in 2008, the Company continued to pay operating lease payments on a month-to-month basis with the Lessor with regard to its previous downtown Greenville banking office. Upon occupancy, these lease payments will be replaced with those required by the build-to-suit operating lease agreement dated May 2, 2007. Additionally, during construction of the Company’s new downtown Greenville banking office, on a month-to-month basis, at December 31, 2008, the Bank leased additional office space and parking. The Company will continue to lease parking spaces, on a month-to-month basis, once the headquarters is complete and the new lease agreement is in effect.
The Bank subleases to a third party its previous Blackstock Road banking office that it leases from a third party.
Automatic Teller Machines
At December 31, 2008, the Bank operated 38 automatic teller machines, including ten in nonbanking offices.
During 2008, the Bank added a nonbanking office automatic teller machine at Woodmont Village Shopping Center on Highway 25 in Moonville, South Carolina and a banking office automatic teller machine in conjunction with the grand opening of its Rock Hill banking office.
The Bank has ground leases with regard to nine of its automatic teller machines, all of which are located at nonbanking office locations.
Palmetto Capital Independent Offices
During the year ended December 31, 2008, Palmetto Capital utilized two Palmetto Capital offices independent of banking offices, one of which is leased.
28
The Company is currently subject to various legal proceedings and claims that have arisen in the ordinary course of its business. In the opinion of management, based on consultation with legal counsel, any reasonably foreseeable outcome of such current litigation would not materially impact the Company’s financial condition or results of operations.
| ITEM 4. SUBMISSION | OF MATTERS TO A VOTE OF SECURITY HOLDERS |
No matters were submitted to a vote of security holders during the fourth quarter of the fiscal year ended December 31, 2008.
29
PART II
| ITEM 5. | MARKET FOR REGISTRANT’S COMMON EQUITY, RELATED SHAREHOLDER MATTERS AND ISSUER PURCHASES OF EQUITY SECURITIES |
Common Stock Market Prices and Dividends
The Company’s common stock is not listed on an exchange or any over-the-counter service. Historically, the Company has utilized an annual independent market valuation to assist the Company in establishing the market value per share of a minority block of the outstanding common shares of Palmetto Bancshares, Inc. for use in conjunction with stock options. The Company believed that this was the best method to value its common stock based on the lack of an active public trading market in the stock. However, beginning in 2007, management determined that an average trading price valuation method, based on the last five known trades of the stock, was a more appropriate estimate of the fair value of the Company’s common stock. Management’s determination was based on increased volume of private sales and purchases of the Company’s stock.
As of December 31, 2008, there were 6,446,090 shares of the Company’s common stock outstanding held by approximately 1,672 shareholders of record. As previously discussed, there is currently no public trading market in the Company’s common stock and private trading of the Company’s common stock has been limited and sporadic. Local buyers and sellers have privately negotiated many of the trades of which the Company is aware. Because there is no an established market for the Company’s common stock, management may not be aware of all prices at which the Company’s common stock has been traded. Additionally, management has not determined whether the trades of which the Company is aware were the result of arm’s-length negotiations between the parties. Based on information available to the Company, management believes transactions in the Company’s common stock and dividend information can be fairly summarized as follows for the periods indicated.
| | | | | | | |
| | | High | | Low | | Cash dividend |
2008 | | | | | | | |
First quarter | | $ | 41.00 | | 41.00 | | 0.20 |
Second quarter | | | 42.00 | | 41.00 | | 0.20 |
Third quarter | | | 42.00 | | 42.00 | | 0.20 |
Fourth quarter | | | 42.00 | | 42.00 | | 0.20 |
| | | |
2007 | | | | | | | |
First quarter | | $ | 39.00 | | 38.00 | | 0.19 |
Second quarter | | | 40.00 | | 39.00 | | 0.19 |
Third quarter | | | 40.00 | | 40.00 | | 0.19 |
Fourth quarter | | | 41.00 | | 40.00 | | 0.20 |
For the years ended December 31, 2008 and 2007, the Company paid quarterly cash dividends totaling $5.2 million, or $0.80 per common share, and $4.9 million, or $0.77 per common share, respectively. The Company has historically paid dividends on a quarterly basis. The Company’s Board of Directors currently plans to declare regular cash dividends. However, there can be no assurance that the Company will continue to pay dividends because they are dependent on the Company’s financial condition, results of operations, and cash flows, and capital and dividend regulations.
See Item 1. Business for a discussion regarding supervision and regulations regarding dividends.
30
Equity Based Compensation Plan Information
The following table summarizes information regarding equity based compensation awards outstanding and available for future grants at the date indicated.
| | | | | | | |
| | | December 31, 2008 |
| | | (a)
Number of
securities to be
issued upon exercise
of outstanding options | | (b)
Weighted average
exercise price of
outstanding options | | (c)
Number of securities
remaining available for
future issuances
under equity compensation
plans (excluding securities
reflected in column (a)) |
Equity based compensation plans approved by shareholders | | 169,330 | | $ | 20.98 | | — |
Equity based compensation plans not approved by shareholders | | — | | | — | | — |
| | | | | | | |
Total equity compensation plans | | 169,330 | | $ | 20.98 | | — |
| | | | | | | |
See Item 8. Financial Statements and Supplementary Data, Note 1 and Note 13 for a discussion regarding matters related to the Company’s equity based compensation.
31
Total Shareholder Return
The following graph sets forth the performance of Palmetto Bancshares’ common stock for the five year period ended December 31, 2008 as compared to the S&P 500 Index, and the SNL $1B—$5B Bank Index. The graph assumes $100 originally invested on December 31, 2003 and that all subsequent dividends were reinvested in additional shares. The performance graph represents past performance and should not be considered to be an indication of future performance.
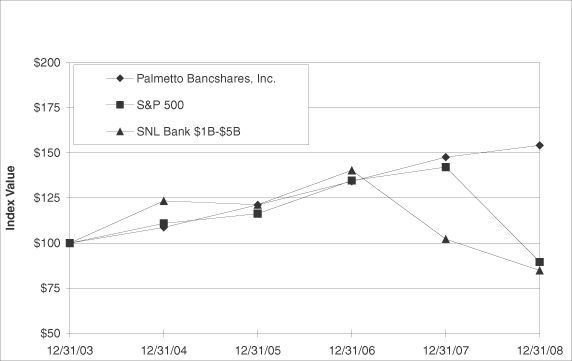
The following table summarizes the cumulative total return for the Company, the S&P 500 Index, and the SNL $1B—$5B Bank Index at the dates indicated.
| | | | | | | | | | | | | |
| | | 12/31/2003 | | 12/31/2004 | | 12/31/2005 | | 12/31/2006 | | 12/31/2007 | | 12/31/2008 |
Palmetto Bancshares, Inc. | | $ | 100.00 | | 108.66 | | 121.19 | | 134.23 | | 147.63 | | 154.15 |
S & P 500 | | | 100.00 | | 110.88 | | 116.33 | | 134.70 | | 142.10 | | 89.53 |
SNL $1B—$5B Bank | | | 100.00 | | 123.42 | | 121.31 | | 140.38 | | 102.26 | | 84.81 |
As discussed above, there is no public trading market for the Company’s common stock. The Company can give no assurances that the value set forth above for the Company’s common stock represents the fair market value of the stock.
32
ITEM 6. SELECTED FINANCIAL DATA
The following consolidated selected financial data should be read in conjunction with Item 7. Management’s Discussion and Analysis of Financial Condition and Results of Operations and Item 8. Financial Statements and Supplementary Data. (dollars in thousands, except common and per share data)
| | | | | | | | | | | | |
| | | At and for the years ended December 31, |
| | | 2008 | | | 2007 | | 2006 | | 2005 | | 2004 |
STATEMENTS OF INCOME | | | | | | | | | | | | |
Interest income | | $ | 78,341 | | | 83,637 | | 76,446 | | 62,783 | | 51,029 |
Interest expense | | | 26,606 | | | 32,758 | | 27,297 | | 17,279 | | 11,177 |
| | | | | | | | | | | | |
Net interest income | | | 51,735 | | | 50,879 | | 49,149 | | 45,504 | | 39,852 |
Provision for loan losses | | | 5,619 | | | 988 | | 1,625 | | 2,400 | | 2,150 |
| | | | | | | | | | | | |
Net interest income after provision for loan losses | | | 46,116 | | | 49,891 | | 47,524 | | 43,104 | | 37,702 |
Noninterest income | | | 18,898 | | | 17,379 | | 17,882 | | 17,003 | | 16,410 |
Noninterest expense | | | 43,951 | | | 42,856 | | 42,203 | | 39,385 | | 36,432 |
| | | | | | | | | | | | |
Net income before provision for income taxes | | | 21,063 | | | 24,414 | | 23,203 | | 20,722 | | 17,680 |
Provision for income taxes | | | 7,464 | | | 8,399 | | 7,962 | | 6,942 | | 5,569 |
| | | | | | | | | | | | |
Net income | | $ | 13,599 | | | 16,015 | | 15,241 | | 13,780 | | 12,111 |
| | | | | | | | | | | | |
COMMON AND PER SHARE DATA | | | | | | | | | | | | |
Net income per common share: | | | | | | | | | | | | |
Basic | | $ | 2.11 | | | 2.51 | | 2.40 | | 2.18 | | 1.93 |
Diluted | | | 2.09 | | | 2.47 | | 2.37 | | 2.15 | | 1.90 |
Cash dividends per common share | | | 0.80 | | | 0.77 | | 0.73 | | 0.66 | | 0.58 |
Book value per common share | | | 17.96 | | | 17.17 | | 15.76 | | 14.05 | | 12.82 |
Outstanding common shares | | | 6,446,090 | | | 6,421,765 | | 6,367,450 | | 6,331,335 | | 6,297,285 |
Weighted average common shares outstanding—basic | | | 6,438,071 | | | 6,390,858 | | 6,353,752 | | 6,317,110 | | 6,272,594 |
Weighted average common shares outstanding—diluted | | | 6,519,849 | | | 6,477,663 | | 6,421,742 | | 6,417,358 | | 6,378,787 |
Dividend payout ratio | | | 37.89 | % | | 30.76 | | 30.45 | | 30.27 | | 30.07 |
| | | | | |
YEAR-END BALANCES | | | | | | | | | | | | |
Assets | | $ | 1,370,000 | | | 1,248,177 | | 1,153,136 | | 1,075,015 | | 993,102 |
Investment securities available for sale, at fair value | | | 125,596 | | | 95,715 | | 116,567 | | 125,988 | | 143,733 |
Total loans | | | 1,165,895 | | | 1,049,775 | | 947,583 | | 869,323 | | 776,397 |
Deposits (including traditional and nontraditional) | | | 1,114,591 | | | 1,096,400 | | 1,028,996 | | 938,026 | | 860,895 |
Other short-term borrowings | | | 79,785 | | | 30,000 | | 6,000 | | 17,900 | | 16,000 |
Long-term borrowings | | | 52,000 | | | — | | 10,000 | | 23,000 | | 30,000 |
Shareholders’ equity | | | 115,776 | | | 110,256 | | 100,376 | | 88,941 | | 80,762 |
| | | | | |
AVERAGE BALANCES | | | | | | | | | | | | |
Assets | | $ | 1,322,541 | | | 1,182,850 | | 1,114,553 | | 1,043,897 | | 932,672 |
Interest-earning assets | | | 1,246,278 | | | 1,109,516 | | 1,037,265 | | 976,859 | | 871,668 |
Investment securities available for sale, at fair value | | | 123,551 | | | 104,757 | | 120,395 | | 132,709 | | 134,854 |
Total loans | | | 1,113,355 | | | 989,128 | | 898,028 | | 833,353 | | 730,430 |
Deposits (including traditional and nontraditional) | | | 1,106,253 | | | 1,049,446 | | 993,913 | | 895,635 | | 823,064 |
Securities sold under agreement to repurchase | | | — | | | — | | — | | — | | 2,508 |
Other short-term borrowings | | | 48,543 | | | 13,036 | | 2,987 | | 30,843 | | 9,633 |
Long-term borrowings | | | 41,415 | | | 4,521 | | 15,841 | | 26,145 | | 16,475 |
Shareholders’ equity | | | 116,222 | | | 106,615 | | 95,077 | | 85,790 | | 76,566 |
| | | | | |
PERFORMANCE RATIOS | | | | | | | | | | | | |
Return on average assets | | | 1.03 | % | | 1.35 | | 1.37 | | 1.32 | | 1.30 |
Return on average shareholders’ equity | | | 11.70 | | | 15.02 | | 16.03 | | 16.06 | | 15.82 |
Net interest margin | | | 4.15 | | | 4.59 | | 4.74 | | 4.66 | | 4.57 |
| | | | | |
SIGNIFICANT CAPITAL RATIOS | | | | | | | | | | | | |
Average shareholders’ equity as a percentage of average assets | | | 8.79 | % | | 9.01 | | 8.53 | | 8.22 | | 8.21 |
Shareholders’ equity as a percentage of total assets at year-end | | | 8.45 | | | 8.83 | | 8.70 | | 8.27 | | 8.13 |
Tier 1 risk-based capital | | | 9.55 | | | 9.61 | | 9.37 | | 9.36 | | 9.43 |
Total risk-based capital | | | 10.44 | | | 10.27 | | 10.19 | | 10.28 | | 10.38 |
Tier 1 leverage ratio | | | 8.70 | | | 8.97 | | 8.59 | | 8.08 | | 7.76 |
| | | | | |
ASSET QUALITY RATIOS | | | | | | | | | | | | |
Allowance for loan losses as a percentage of ending loans (1) | | | 0.95 | % | | 0.71 | | 0.90 | | 0.97 | | 0.99 |
Nonaccrual loans as a percentage of loans and foreclosed assets (1) | | | 3.69 | | | 0.46 | | 0.74 | | 1.14 | | 0.30 |
Nonperforming assets as a percentage of total assets | | | 3.67 | | | 1.04 | | 0.69 | | 1.12 | | 0.51 |
Net loans charged-off as a percentage of average loans (1) | | | 0.18 | | | 0.21 | | 0.17 | | 0.19 | | 0.27 |
| (1) | | Loans calculated excluding mortgage loans held for sale, net of unearned income, excluding allowance for loan losses. |
33
| ITEM 7. MANAGEMENT’S | DISCUSSION AND ANALYSIS OF FINANCIAL CONDITION AND RESULTS OF OPERATIONS |
The following discussion and analysis presents the more significant factors impacting the Company’s financial condition as of December 31, 2008 and 2007 and results of operations and cash flows for the years ended December 31, 2008, 2007, and 2006. This discussion should be read in conjunction with, and is intended to supplement, all of the other Items presented in this Annual Report on Form 10-K. Percentage calculations contained herein have been calculated based on actual not rounded results.
Critical Accounting Policies and Estimates
General
The Company’s accounting and financial reporting policies are in conformity, in all material respects, to accounting principles generally accepted in the U.S. and to general practices within the financial services industry. The preparation of financial statements in conformity with such principles requires management to make estimates and assumptions that impact the reported amounts of assets and liabilities, the disclosure of contingent assets and liabilities during the reporting period, and the reported amounts of income and expense during the reporting period. While the Company bases estimates on historical experience, current information, and other factors deemed to be relevant, actual results could differ from those estimates. Management, in conjunction with the Company’s independent registered public accounting firm, has discussed the development and selection of the critical accounting estimates discussed herein with the Audit Committee of the Company’s Board of Directors.
The Company considers accounting policies and estimates to be critical to the Company’s financial condition, results of operations, or cash flows if the accounting policy or estimate requires management to make assumptions about matters that are highly uncertain and for which different estimates that management reasonably could have used for the accounting estimate in the current period, or changes in the accounting estimate that are reasonably likely to occur from period to period, could have a material impact on the Company’s financial condition, results of operations, or cash flows.
The Company’s significant accounting policies are discussed in Item 8. Financial Statements and Supplementary Data, Note 1. Of those significant accounting policies, the Company has determined that accounting for its allowance for loan losses, mortgage-servicing rights portfolio, defined benefit pension plan, and determination of fair value of financial instruments are deemed critical because of the valuation techniques used and the sensitivity of the amounts recorded in the Company’s Consolidated Financial Statements to the methods, assumptions, and estimates underlying these balances. Accounting for these critical areas requires subjective and complex judgments and could be subject to revision as new information becomes available.
Allowance for Loan Losses
The Company considers its accounting policies related to the allowance for loan losses to be critical, as these policies involve considerable subjective judgment and estimation by management. The allowance for loan losses is a reserve established through a provision for loan losses charged to expense. The allowance for loan losses represents management’s best estimate of probable losses that have been incurred within the existing portfolio of loans. The allowance for loan losses is necessary to reserve for estimated loan losses and risks inherent in the loan portfolio. The Company’s allowance for loan loss methodology is based on guidance provided in SEC Staff Accounting Bulletin (“SAB”) No. 102, “Selected Loan Loss Allowance Methodology and Documentation Issues” and includes allocations calculated in accordance with SFAS No. 114, “Accounting by Creditors for Impairment of a Loan,” as amended by SFAS No. 118,“Accounting by Creditors for Impairment of a Loan-Income Recognition and Disclosures—an amendment of FASB Statement No. 114,” and allocations determined in accordance with SFAS No. 5, “Accounting for Contingencies.” Accordingly, the methodology is based on historical loss experience by type of loans, specific homogeneous risk pools, and specific loss
34
allocations. The Company’s process for determining the appropriate level of the allowance for loan losses is designed to account for asset deterioration as it occurs. The provision for loan losses reflects loan quality trends, including the levels of and trends related to nonaccrual loans, potential problem loans, criticized loans, and net loans charged-off or recovered, among other factors.
The level of the allowance for loan losses reflects management’s continuing evaluation of specific lending risks, loan loss experience, current loan portfolio quality, present economic, political and regulatory conditions, and unidentified losses inherent in the current loan portfolio. Portions of the allowance for loan losses may be allocated for specific loans. However, the entire allowance for loan losses is available for any loan that, in management’s judgment, should be charged-off. While management utilizes its best judgment and information available, the ultimate adequacy of the allowance for loan losses is dependent upon a variety of factors beyond the Company’s control, including the performance of the Company’s loan portfolio, the economy, changes in interest rates, and the view of the regulatory authorities toward loan classifications.
The Company records allowances for losses on specific loans when, based on current information and events, it is probable that it will be unable to collect all amounts due according to the contractual terms of the loan. Specific allowances for loans considered individually significant and that exhibit probable or observed weaknesses are determined by analyzing the borrower’s ability to repay amounts owed, collateral deficiencies, the relative risk grade of the loan, and economic conditions impacting the borrower’s industry, among other things. If after review, a specific allowance is not assigned to the loan, and the loan is not considered to be impaired, the loan is included with a pool of similar loans that is assigned a historical allowance calculated based on historical loss experience.
Historical allowances are calculated based on the historical loss experience of specific types of loans. The Company calculates historical loss ratios for pools of similar loans with similar characteristics based on the proportion of actual loans charged-off to the total population of loans in the pool. Management is currently using a five year lookback period when computing historical loss rates to determine the allocated component of the allowance for loan losses. A historical allowance is established for each pool of similar loans based upon the product of the historical loss ratio and the total dollar amount of the loans in the pool. The Company’s pools of similar loans include similarly risk-graded groups of commercial and industrial loans, real estate loans, general consumer loans, and bankcard loans.
General allowances are based on general economic conditions and other qualitative risk factors both internal and external to the Company. In general, these allowances are determined by evaluating, among other things, the experience, ability and effectiveness of the Bank’s lending management and staff, the effectiveness of the Company’s loan policies, procedures and internal controls, changes in asset quality, changes in loan portfolio volume, the composition and concentrations of the loan portfolio, the impact of competition on loan structuring and pricing, the effectiveness of the internal loan review function, the impact of environmental risks on portfolio risks, and the impact of rising interest rates on portfolio risk.
Loans identified as losses by management, internal loan review, and / or bank examiners are charged-off. Furthermore, consumer loan accounts are charged-off based on regulatory requirements.
In addition to the Company’s portfolio review process as discussed elsewhere in this item, various regulatory agencies, as an integral part of their examination process, periodically review the Company’s allowance for loan losses. Such agencies may require the Company to recognize additions to the allowance for loan losses based on their judgments and information available to them at the time of their examination. While the Company uses available information to recognize inherent losses on loans, future adjustments to the allowance for loan losses may be necessary based on changes in economic conditions and other factors and the impact of such changes on the Bank’s borrowers.
35
Management considers its allowance for loan losses at December 31, 2008, appropriate and adequate to cover current losses in the loan portfolio. However, underlying assumptions may be impacted in future periods by changes in economic conditions, the impact of regulatory examinations, and the discovery of information with respect to borrowers, which was not known to management at the time of the issuance of the Company’s Consolidated Financial Statements. Therefore, management’s assumptions may or may not prove valid. There can be no assurance that loan losses in future periods will not exceed the current allowance for loan losses amount or that future increases in the allowance for loan losses will not be required. Additionally, no assurance can be given that management’s ongoing evaluation of the loan portfolio, in light of changing economic conditions and other relevant factors, will not require significant future additions to the allowance for loan losses, thus adversely impacting the Company’s business, financial condition, results of operations, and cash flows.
See Item 1A. Risk Factors contained herein for discussion regarding the material risks and uncertainties that management believes impact the Company allowance for loan losses.
Mortgage-Servicing Rights Portfolio
The value of the Company’s mortgage-servicing rights portfolio represents another accounting estimate that depends heavily on current economic conditions, especially the interest rate environment and management’s judgments. The Company utilizes the expertise of a third party consultant on a quarterly basis to assess the portfolio’s value including, but not limited to, capitalization, impairment, and amortization rates. The consultant estimates the amount and timing of prepayment rates, loan loss experience, costs to service loans, and discount rates to estimate the fair value of the Company’s mortgage-servicing rights portfolio. Amortization of the mortgage-servicing rights portfolio is based on the ratio of net servicing income received in the current period to total net servicing income projected to be realized from the mortgage-servicing rights portfolio. Projected net servicing income is determined based on the estimated future balance of the underlying mortgage loan portfolio that declines over time from prepayments and scheduled loan amortization. Future prepayment rates are estimated based on current interest rate levels, other economic conditions, market forecasts, and relevant characteristics of the mortgage-servicing rights portfolio, such as loan types, interest rate stratification, and recent prepayment experience. Management believes that the modeling techniques and assumptions used by the consultant are reasonable; however, such assumptions may or may not prove valid. Thus, there can be no assurance that mortgage-servicing rights portfolio capitalization, amortization, and impairment in future periods will not exceed the current capitalization, amortization, and impairment amounts. Moreover, no assurance can be given that changing economic conditions and other relevant factors impacting the Company’s mortgage-servicing rights portfolio will not cause actual occurrences to differ from underlying assumptions thus adversely impacting the Company’s business, financial condition, results of operations, and cash flows.
Defined Benefit Pension Plan
The Company accounts for its defined benefit pension plans in accordance with SFAS No. 87, “Employers’ Accounting for Pensions,” and SFAS No. 158, “Employers’ Accounting for Defined Benefit Pension and Other Postretirement Plans, an amendment of FASB Statements No. 87, 88, 106, and 132(R),” which require that amounts recognized in financial statements be determined on an actuarial basis. Pension assumptions are significant inputs to the actuarial models that measure pension benefit obligations and related impacts on income. In particular, the assumed discount rate and expected return on assets are important elements of defined benefit pension plan expense and asset / liability measurement with regard to the plan. The Company evaluates these critical assumptions annually. Lower discount rates increase present values and subsequent year pension expense, while higher discount rates decrease present values and subsequent year pension expense. To determine the expected long-term rate of return on defined benefit pension plan assets, the Company considers asset allocations and historical returns on various categories of plan assets. Both of these key assumptions are sensitive to changes. Additionally, management periodically evaluates other assumptions involving demographic factors, such as retirement age, mortality, and turnover and updates such factors to reflect experience and expectations for the future.
36
Effective 2008, the Company ceased accruing pension benefits for employees under the Company’s noncontributory, defined benefit pension plan. Although no previously accrued benefits were lost, employees do not accrue benefits for service subsequent to 2007. Therefore, at December 31, 2007 and 2008, the Company’s pension obligation was lower than in previous periods.
Amounts recognized within the Company’s Consolidated Financial Statements with regard to this change to its defined benefit pension plan were also computed on an actuarial basis. Because of the considerable judgment necessary to make all such assumptions, actual results in any given year may differ from actuarial assumptions.
Fair Valuation of Financial Instruments
The Company uses fair value measurements to record fair value adjustments to certain financial instruments and to determine fair value disclosures. Additionally, from time to time, the Company may be required to record at fair value other assets on a nonrecurring basis. These nonrecurring fair value adjustments typically involve application of lower-of-cost-or-market accounting or writedowns of individual assets. Further, the Company includes in Notes to Financial Statements information about the extent to which fair value is used to measure assets and liabilities, the valuation methodologies used, and its impact to income. Additionally, for financial instruments not recorded at fair value, the Company discloses the estimate of their fair value.
SFAS No. 157, “Fair Value Measurements,” defines fair value as the price that would be received to sell the financial asset or paid to transfer the financial liability in an orderly transaction between market participants at the measurement date.
SFAS No. 157 establishes a three-level hierarchy for disclosure of assets and liabilities recorded at fair value. The classification of assets and liabilities within the hierarchy is based on whether the inputs to the valuation methodology used for measurement are observable or unobservable. Observable inputs reflect market-derived or market-based information obtained from independent sources, while unobservable inputs reflect the Company’s estimates about market data.
| | • | | Level 1 – Valuation is based upon quoted prices for identical instruments traded in active markets. Level 1 instruments include securities traded on active exchange markets, such as the New York Stock Exchange, as well as U.S. Treasury and other U.S. government securities that are traded by dealers or brokers in active over-the-counter markets. |
| | • | | Level 2 – Valuation is based upon quoted prices for similar instruments in active markets, quoted prices for identical or similar instruments in markets that are not active, and model-based valuation techniques, such as matrix pricing, for which all significant assumptions are observable in the market. Level 2 instruments include securities traded in less active dealer or broker markets and mortgage loans held for sale that are valued based on prices for other mortgage whole loans with similar characteristics. |
| | • | | Level 3 – Valuation is generated from model-based techniques that use significant assumptions not observable in the market. These unobservable assumptions reflect the Company’s estimates of assumptions market participants would use in pricing the asset or liability. Valuation techniques include use of option pricing models, discounted cash flow models, and similar techniques. |
In accordance with SFAS No. 157, it is the Company’s policy to maximize the use of observable inputs and minimize the use of unobservable inputs when developing fair value measurements. When available, management uses quoted market prices to measure fair value. If market prices are not available, fair value measurement is based upon models that use primarily market-based or independently-sourced market parameters. Most of the Company’s financial instruments use either of the foregoing methodologies, collectively Level 1 and Level 2 measurements, to determine fair value adjustments recorded to its financial statements. However, in certain cases, when market observable inputs for model-based valuation techniques may not be readily available, management is required to make judgments about assumptions market participants would use in estimating the fair value of the financial instrument.
37
The degree of management judgment involved in determining the fair value of a financial instrument is dependent upon the availability of quoted market prices or observable market parameters. For financial instruments that trade actively and have quoted market prices or observable market parameters, there is minimal subjectivity involved in measuring fair value. When observable market prices and parameters are not fully available, management judgment is necessary to estimate fair value. In addition, changes in the market conditions may reduce the availability of quoted prices or observable data. For example, reduced liquidity in the capital markets or changes in secondary market activities could result in observable market inputs becoming unavailable. When significant adjustments are required to available observable inputs, it may be appropriate to utilize an estimate based primarily on unobservable inputs. When an active market for a security does not exist, the use of management estimates that incorporate current market participant expectations of future cash flows, and include appropriate risk premiums, is acceptable.
Significant judgment may be required to determine whether certain assets measured at fair value are included in Level 2 or Level 3. If fair value measurement is based upon recent observable market activity of such assets or comparable assets (other than forced or distressed transactions) that occur in sufficient volume and do not require significant adjustment using unobservable inputs, those assets are classified as Level 2. If not, they are classified as Level 3. Making this assessment requires significant judgment. At December 31, 2008, $54.6 million of investment securities available for sale were classified as Level 3 because significant inputs to the valuation became unobservable, largely due to reduced levels of market liquidity.
Highlights
Regulatory Action
The Congress, U.S. Department of the Treasury, and federal banking regulators, including the FDIC, have taken broad action since early September 2008 to address volatility in the U.S. banking system.
In October 2008, the EESA was enacted. The EESA authorizes the U.S. Department of the Treasury to purchase from financial institutions and their holding companies up to $700 billion in mortgage loans, mortgage-related securities and certain other financial instruments, including debt and equity securities issued by financial institutions and their holding companies through the TARP. The TARP intends to restore confidence and stability to the U.S. banking system and to encourage financial institutions to increase lending to customers and to each other. The U.S. Department of the Treasury has allocated $250 billion towards the TARP CPP. Under the CPP, the U.S. Department of the Treasury will purchase debt or equity securities from participating institutions. Participants in the CPP are subject to executive compensation limits and are encouraged to expand their lending and mortgage loan modifications. The TARP also will include direct purchases or guarantees of troubled assets of financial institutions.
On November 20, 2008, the Company issued a press release announcing its intention not to participate in the U.S. Department of the Treasury’s CPP. A copy of the press release is furnished as Exhibit 99 to the Current Report on Form 8-K filed on November 24, 2008. This information may be accessed at www.sec.gov.
The EESA also increased FDIC deposit insurance on most accounts from $100,000 to $250,000. This increase is in place until the end of 2009 and is not covered by deposit insurance premiums paid by the banking industry.
Following a systemic risk determination, the FDIC established a TLGP on October 14, 2008. The TLGP includes the TAGP, which provides unlimited deposit insurance coverage through December 31, 2009 for noninterest-bearing transaction accounts (typically business checking accounts) and certain funds swept into noninterest-bearing savings accounts. Institutions participating in the TAGP are charged a 10 basis points fee (annualized) on the balance of each covered account in excess of $250,000, until the expiration of the TAGP. The TLGP also includes the DGP, under which the FDIC guarantees certain senior unsecured debt of FDIC insured institutions and their holding companies. The unsecured debt must be issued on or after October 14, 2008 and not
38
later than June 30, 2009, and the guarantee is effective through the earlier of the maturity date or June 30, 2012. The DGP coverage limit is generally 125% of the eligible entity’s eligible debt outstanding on September 30, 2008 and scheduled to mature on or before June 30, 2009 or, for certain insured institutions, 2% of their liabilities as of September 30, 2008. Depending on the term of the debt maturity, the nonrefundable DGP fee ranges from 50 to 100 basis points (annualized) for covered debt outstanding until the earlier of maturity or June 30, 2012. The TAGP and DGP are in effect for all eligible entities, unless the entity opted out on or before December 5, 2008. The Company chose to participate in the TAGP and opted out of the DGP.
On February 17, 2009, the Recovery Act was signed into law in an effort to, among other things, create jobs and stimulate growth in the U.S. economy. The Recovery Act specifies appropriations of approximately $787 billion for a wide range of Federal programs and will increase or extend certain benefits payable under the Medicaid, unemployment compensation, and nutrition assistance programs. The Recovery Act also reduces individual and corporate income taxes and makes a variety of other changes to tax laws. The Recovery Act also imposes certain limitations on compensation paid by participants in the TARP, which includes programs under TARP such as the CPP, in which the Company did not participate.
Subprime Lending Crisis
The subprime mortgage financial crisis is the result of the sharp rise in foreclosures in the subprime mortgage market that began in the U.S. in 2006 and that has become a global financial crisis throughout 2007 and 2008. Management believes that rising interest rates, which increased the monthly payments on adjustable rate mortgages, together with declines in property values left many homeowners unable or unwilling to meet financial commitments and lenders without a means to recoup their losses. Many observers believe this has resulted in a severe lending crunch, threatening the solvency of a number of private banks and other financial institutions.
Although the Company offers adjustable rate mortgages, it sells the majority of these loans on the secondary market. Additionally, the Company has not participated in, and does not participate in a subprime lending program. Therefore, the Company believes that the subprime lending crisis is unlikely to directly harm its business. As discussed in Item 1A. Risk Factors, however, the broader instability in the financial markets and economy have had, and will likely continue to have, a material adverse impact on the Company’s business, financial condition, results of operation, and cash flows.
Strategy
The Company is experiencing tight net interest margins and believes that growth and service strategies can offset the tighter net interest margin with volume. Therefore, the Company’s strategy is to grow its customer base by expanding its footprint and to maintain and develop existing relationships. During 2008, the Bank opened a new banking office in Rock Hill. The Company hopes to achieve positive outcomes in the future through the continued development of its geographic footprint, investing in infrastructure and technology, and continuing to focus on customer relations.
Executive Summary
Total assets increased during the year ended December 31, 2008, primarily due to an increase in the loan and investment securities portfolios.
Loans continue to be the largest component of the Company’s mix of assets. Total loans increased $116.1 million, or 11.1%, at December 31, 2008 over December 31, 2007, primarily as a result of growth within the commercial real estate portfolio.
Investment securities available for sale increased $29.9 million, or 31.2%, at December 31, 2008 over December 31, 2007, primarily within the collateralized mortgage obligation sector of the portfolio. The Company began investing in private label collateralized mortgage obligations during the first quarter of 2008 because
39
management believed that they were undervalued due to the market discount that has been applied to the entire mortgage related marketplace. Additionally, during the second quarter of 2008, the remaining U.S. Treasury and agency securities in the Company’s portfolio matured. Because interest spreads within this sector became extremely narrow, the Company reinvested these maturing funds in collateralized mortgage obligations as well.
Traditional deposit accounts continue to be the Company’s primary source of funding. Traditional deposit accounts increased $11.5 million, or 1.1%, during the year ended December 31, 2008. Nontraditional deposit accounts increased $6.7 million, or 17.8%, over the same period. The combination of increasing competition and alternative investment options has made it more difficult to grow deposits accounts.
To supplement funding of asset growth provided through deposit accounts, management has primarily employed proceeds from maturing investment securities. Total borrowed funding increased $101.8 million during the year ended December 31, 2008 to $131.8 million. At December 31, 2008, the Company had $31.5 million in secured FHLB borrowing availability and $31.7 million in unused unsecured correspondent banking availability. Management is not aware of any changes in the availability of such borrowed funding as a result of the current economic environment.
Beginning in late March 2008 and continuing into early April 2008, the Company advanced a series of long-term FHLB borrowings intended to supplement net interest income through investments in available for sale securities. Although FHLB borrowings do not always result in lower interest expense, management believes that such funding can increase net interest income if employed in higher yield interest-earning assets. The Company used these long-term FHLB borrowings to invest in collateralized mortgage obligations. The impact of these transactions supplemented net interest income growth during the year ended December 31, 2008.
Net income decreased $2.4 million, or 15.1%, for the year ended December 31, 2008 over the year ended December 31, 2007.
Net interest income for the year ended December 31, 2008 was $51.7 million, an increase of $856 thousand, or 1.7%, compared with the year ended December 31, 2007. The following table summarizes the dollar amount of changes in interest income and interest expense attributable to changes in average volume of interest-earning assets and interest-bearing liabilities, respectively, and the dollar amount of changes in interest income and interest expense attributable to changes in average interest rates when comparing the year ended December 31, 2007 to the year ended December 31, 2008 (in thousands). The impact of the combination of rate and volume change has been divided proportionately between the rate change and volume change.
| | | | | | | | | |
| | | Change in
volume | | Change in
rate | | | Total
change | |
Total interest income | | $ | 14,314 | | (19,610 | ) | | (5,296 | ) |
Total interest expense | | | 3,883 | | (10,035 | ) | | (6,152 | ) |
| | | | | | | | | |
Net interest income | | $ | 10,431 | | (9,575 | ) | | 856 | |
| | | | | | | | | |
Net interest margin for the year ended December 31, 2008 was 4.15% compared with 4.59% for the year ended December 31, 2007. During the second half of 2007 and continuing through 2008, the financial markets experienced significant volatility resulting from the continued fallout of subprime lending and the global liquidity crises. A multitude of government initiatives along with rate cuts by the Federal Reserve have been designed to improve liquidity for the distressed financial markets and stabilize the banking system. The relationship between declining interest-earning assets yields and more slowly declining interest-bearing liability costs has caused, and may continue to cause, net interest margin compression.
The provision for loan losses is determined by management as the amount to be added to the allowance for loan losses after net loans charged-offs have been deducted to bring the allowance to a level which, in management’s best estimate, is necessary to absorb probable losses within the existing loan portfolio. The
40
provision for loan losses totaled $5.6 million for the year ended December 31, 2008 compared with $988 thousand for the year ended December 31, 2007 and $1.6 million for the year ended December 31, 2006. The provision for loan losses reflects loan quality trends, including the levels of and trends related to nonaccrual loans, potential problem loans, criticized loans, and net loans charged-off or recovered, among other factors. The provision for loan losses also reflects the totality of actions taken on all loans for a particular period. See Financial Condition – Lending Activities, included elsewhere in this item, for further discussion regarding the Company’s accounting policies related to, factors impacting, and methodology for analyzing the adequacy of the Company’s allowance for loan losses and, therefore, its provision for loan losses.
Noninterest income increased $1.5 million, or 8.7%, during the year ended December 31, 2008 over the year ended December 31, 2007 primarily due to increases in service charges on deposit accounts, net, an increase in mortgage-banking income, and an increase in other noninterest income.
Noninterest expense increased $1.1 million, or 2.6%, during the year ended December 31, 2008 over the year ended December 31, 2007. This increase resulted primarily from an increase in other noninterest expense, offset partially by a decrease in salaries and other personnel expense.
Asset Quality
The following table summarizes the material trends in asset quality at the dates and for the periods indicated.
| | | | | |
| | | At and for the years ended
December 31, |
| | | 2008 | | | 2007 |
Nonaccrual loans as a percentage of loans and foreclosed assets (1) | | 3.69 | % | | 0.46 |
Nonaccrual loans as a percentage of total assets | | 3.14 | | | 0.39 |
Nonperforming assets as a percentage of loans and foreclosed assets (1) | | 4.31 | | | 1.23 |
Nonperforming assets as a percentage of total assets | | 3.67 | | | 1.04 |
Impaired loans as a percentage of loans and foreclosed assets (1) | | 3.21 | | | 0.73 |
Impaired loans as a percentage of total assets | | 2.73 | | | 0.61 |
Net loans charged-off as a percentage of average loans (1) | | 0.18 | | | 0.21 |
| (1) | | Loans calculated excluding mortgage loans held for sale, net of unearned income, excluding allowance for loan losses. |
The majority of the Company’s nonaccrual loans, nonperforming assets, and impaired loans at December 31, 2008 had underlying real estate collateral.
Approximately 82% of the 2008 net nonaccrual additions were contained within 12 loans. All of these loans were included in the Company’s SFAS No. 114 analysis at December 31, 2008 resulting in specific allowance for loss reserves totaling $3.9 million.
Increases in nonaccrual loans, nonperforming assets, and impaired loans collateralized by real estate resulted from the adverse conditions in the real estate markets and economy in general. Until conditions improve in the real estate markets, the Company likely will continue to hold more nonaccrual loans, nonperforming assets, and impaired loans, as it is currently the most economic option available.
Management believes that the current economic and real estate market conditions will result in elevated credit costs.
41
Allowance for Loan Losses
The allowance for loan losses increased from $7.4 million at December 31, 2007 to $11.0 million at December 31, 2008, increasing from 0.71% to 0.95% of loans, respectively, calculated using loans excluding mortgage loans held for sale and the allowance for loan losses, net of unearned income. The increase in the allowance for loan losses during this period was due primarily to the increase in the level of nonaccrual and impaired loans during 2008. The Company’s loss exposure on its nonaccrual and impaired loans was mitigated by collateral the Company holds with respect to these loans. The value of this collateral, however, further deteriorated during 2008, which caused an increase in both nonaccrual loans and the related allocated allowance for loan losses. The allocated allowance for loan losses associated with impaired loans is computed based upon related collateral value of the loans. The collateral values are determined by recent appraisals but are generally discounted significantly by management based on historical collateral dispositions, changes in market conditions since the last valuation, and management’s knowledge of the client and the client’s business. Approximately $4.5 million, or 40%, of the $11.0 million allowance for loan losses at December 31, 2008 relates to loans specifically reserved. This compares to a specific reserve of $1.2 million, or 16% of the total allowance for loan losses at December 31, 2007. The increase in the percentage of the portfolio from specific reserves is attributable to a higher overall balance of impaired loans at December 31, 2008 as compared to 2007, along with lower collateral values assigned to many properties in the real estate portfolio. The general reserve was approximately $6.5 million at December 31, 2008, compared with $6.3 at December 31, 2007.
Management considers its allowance for loan losses at December 31, 2008, appropriate and adequate to cover current losses in the loan portfolio. However, underlying assumptions may be impacted in future periods by changes in economic conditions, the impact of regulatory examinations, and the discovery of information with respect to borrowers, which was not known to management at the time of the issuance of the Company’s Consolidated Financial Statements. Therefore, management’s assumptions may or may not prove valid. Thus, there can be no assurance that loan losses in future periods will not exceed the current allowance for loan losses amount or that future increases in the allowance for loan losses will not be required. Additionally, no assurance can be given that management’s ongoing evaluation of the loan portfolio, in light of changing economic conditions and other relevant factors, will not require significant future additions to the allowance for loan losses, thus adversely impacting the Company’s business, financial condition, results of operations, and cash flows.
Other Highlights
Corporate Headquarters Relocation. The Company’s corporate offices and operations center are currently located in Laurens, South Carolina. The Company will relocate its corporate headquarters to downtown Greenville, South Carolina during March 2009. This relocation of the corporate offices will not impact the Company’s operations center, which will remain at its existing Laurens location.
Other Property Highlights. During 2008, the Bank:
| | • | | Consolidated its existing banking office network, reducing the number of banking offices by four. |
| | • | | Completed renovations of the Company’s Woodruff Road (Greenville County) and Montague (Greenwood County) banking offices. |
| | • | | Completed construction and celebrated the grand opening of its relocated Pendleton office in Anderson County. |
| | • | | Purchased property at the intersection of West Wade Hampton Boulevard and Middletown Way in Greenville County on which to construct and relocate its existing Greer banking office. The Company expects to celebrate its grand opening during the second quarter of 2009. |
| | • | | Executed an operating building lease and an operating lease for additional office space and upfitted these leased banking offices as part of its plans to expand into York County in north central South Carolina. The Company opened its first Rock Hill banking office during the third quarter of 2008. |
42
| | • | | Opened a new limited service banking office located in a retirement center in Greenville County. |
| | • | | Added a nonbanking office automatic teller machine at Woodmont Village Shopping Center on Highway 25 in Moonville, South Carolina and a banking office automatic teller machine in conjunction with the grand opening of its Rock Hill banking office. |
Financial Condition
Overview
PALMETTO BANCSHARES, INC. AND SUBSIDIARY
Consolidated Balance Sheets
(dollars in thousands)
| | | | | | | | | | | | | |
| | | December 31, | | | Dollar
variance | | | Percent
variance | |
| | | 2008 | | | 2007 | | | |
Assets | | | | | | | | | | | | | |
Cash and cash equivalents | | | | | | | | | | | | | |
Cash and due from banks | | $ | 29,305 | | | 42,450 | | | (13,145 | ) | | (31.0 | )% |
Federal funds sold | | | — | | | 9,782 | | | (9,782 | ) | | (100.0 | ) |
| | | | | | | | | | | | | |
Total cash and cash equivalents | | | 29,305 | | | 52,232 | | | (22,927 | ) | | (43.9 | ) |
FHLB stock, at cost | | | 6,566 | | | 2,617 | | | 3,949 | | | 150.9 | |
Investment securities available for sale, at fair value | | | 125,596 | | | 95,715 | | | 29,881 | | | 31.2 | |
Mortgage loans held for sale | | | 7,415 | | | 5,005 | | | 2,410 | | | 48.2 | |
Loans | | | 1,158,480 | | | 1,044,770 | | | 113,710 | | | 10.9 | |
Less: allowance for loan losses | | | (11,000 | ) | | (7,418 | ) | | (3,582 | ) | | 48.3 | |
| | | | | | | | | | | | | |
Loans, net | | | 1,147,480 | | | 1,037,352 | | | 110,128 | | | 10.6 | |
Premises and equipment, net | | | 26,347 | | | 25,133 | | | 1,214 | | | 4.8 | |
Premises held for sale | | | 1,651 | | | — | | | 1,651 | | | 100.0 | |
Goodwill | | | 3,691 | | | 3,691 | | | — | | | — | |
Core deposit intangibles, net | | | 34 | | | 79 | | | (45 | ) | | (57.0 | ) |
Accrued interest receivable | | | 5,466 | | | 6,655 | | | (1,189 | ) | | (17.9 | ) |
Other | | | 16,449 | | | 19,698 | | | (3,249 | ) | | (16.5 | ) |
| | | | | | | | | | | | | |
Total assets | | $ | 1,370,000 | | | 1,248,177 | | | 121,823 | | | 9.8 | % |
| | | | | | | | | | | | | |
Liabilities and shareholders’ equity | | | | | | | | | | | | | |
Liabilities | | | | | | | | | | | | | |
Deposits | | | | | | | | | | | | | |
Noninterest-bearing | | $ | 133,248 | | | 135,111 | | | (1,863 | ) | | (1.4 | )% |
Interest-bearing | | | 937,031 | | | 923,683 | | | 13,348 | | | 1.4 | |
| | | | | | | | | | | | | |
Total deposits | | | 1,070,279 | | | 1,058,794 | | | 11,485 | | | 1.1 | |
Retail repurchase agreements | | | 16,357 | | | 11,280 | | | 5,077 | | | 45.0 | |
Commercial paper (Master notes) | | | 27,955 | | | 26,326 | | | 1,629 | | | 6.2 | |
Other short-term borrowings | | | 79,785 | | | 30,000 | | | 49,785 | | | 166.0 | |
Long-term borrowings | | | 52,000 | | | — | | | 52,000 | | | 100.0 | |
Accrued interest payable | | | 1,857 | | | 2,042 | | | (185 | ) | | (9.1 | ) |
Other | | | 5,991 | | | 9,479 | | | (3,488 | ) | | (36.8 | ) |
| | | | | | | | | | | | | |
Total liabilities | | | 1,254,224 | | | 1,137,921 | | | 116,303 | | | 10.2 | |
| | | | | | | | | | | | | |
Shareholders’ equity | | | | | | | | | | | | | |
Common stock | | | 32,230 | | | 32,109 | | | 121 | | | 0.4 | |
Capital surplus | | | 2,095 | | | 1,664 | | | 431 | | | 25.9 | |
Retained earnings | | | 87,568 | | | 79,221 | | | 8,347 | | | 10.5 | |
Accumulated other comprehensive loss, net of tax | | | (6,117 | ) | | (2,738 | ) | | (3,379 | ) | | 123.4 | |
| | | | | | | | | | | | | |
Total shareholders’ equity | | | 115,776 | | | 110,256 | | | 5,520 | | | 5.0 | |
| | | | | | | | | | | | | |
Total liabilities and shareholders’ equity | | $ | 1,370,000 | | | 1,248,177 | | | 121,823 | | | 9.8 | % |
| | | | | | | | | | | | | |
Average assets increased 11.8% during the year ended December 31, 2008 over the year ended December 31, 2007, and average interest-earning assets increased 12.3% over the same periods.
43
Investment Activities
General. The primary objective of the Company’s management of the investment portfolio is to maintain a portfolio of high quality, highly liquid investments yielding competitive returns. The Company is required under federal regulations to maintain adequate liquidity to ensure safe and sound operations. The Company maintains investment balances based on a continuing assessment of cash flows, the level of loan production, current interest rate risk strategies, and the assessment of the potential future direction of market interest rate changes. Investment securities differ in terms of default, interest rate, liquidity, and expected rate of return risk.
Composition. The following table summarizes the composition of the Company’s investment securities available for sale portfolio at the dates indicated (dollars in thousands).
| | | | | | | | | | | | | | |
| | | December 31, 2008 | | | December 31, 2007 | | December 31, 2006 |
| | | Total | | % of total | | | Total | | % of total | | Total | | % of total |
U.S. Treasury and federal agencies | | $ | — | | — | % | | 20,743 | | 21.7 | | 42,383 | | 36.4 |
State and municipal | | | 50,830 | | 40.5 | | | 52,159 | | 54.5 | | 48,014 | | 41.2 |
Collateralized mortgage obligations | | | 54,639 | | 43.5 | | | — | | — | | — | | — |
Other mortgage-backed (federal agencies) | | | 20,127 | | 16.0 | | | 22,813 | | 23.8 | | 26,170 | | 22.4 |
| | | | | | | | | | | | | | |
Total investment securities available for sale | | $ | 125,596 | | 100.0 | % | | 95,715 | | 100.0 | | 116,567 | | 100.0 |
| | | | | | | | | | | | | | |
Average balances of investment securities available for sale increased to $123.6 million during the year ended December 31, 2008 from $104.8 million during the same period of 2007. During 2008, the Company advanced a series of long-term FHLB borrowings intended to support net interest income through investments in available for sale securities. Although FHLB borrowings may result in higher interest expense than funding from deposit accounts, use of such funding can increase net interest income if employed in higher yield interest-earning assets. The Company used these long-term FHLB borrowings and the funds from maturing U.S. Treasury and federal agencies to invest in collateralized mortgage obligations. The impact of these transactions supplemented net interest income growth during the year ended December 31, 2008. Collateralized mortgage obligations are a mortgage-backed security sub-type in which the mortgages are ordered into tranches by some quality (such as repayment time) with each tranche sold as a separate security. These securities, in addition to the Company’s other investment securities available for sale, are accounted for in accordance with SFAS No. 115, “Accounting for Certain Investments in Debt and Equity Securities.” At December 31, 2008, the fair value of the investment securities available for sale portfolio represented 9.2% of total assets, an increase from 7.7% at December 31, 2007.
Investment Securities Pledged. Public depositors from state and local municipalities typically require that the Bank pledge investment grade securities to the accounts to ensure repayment. Although the funds are usually a low cost, relatively stable source of funding for the Bank, availability depends on the particular government’s fiscal policies and cash flow needs.
Approximately 55% of the investment securities portfolio, at fair value, was pledged to secure public deposits and trust assets at December 31, 2008 as compared with 80% at December 31, 2007. Of the Company’s $69.1 million pledged available for sale investment securities balance at December 31, 2008, $47.0 million of the investment securities portfolio, at fair value, was securing public deposits and trust assets at December 31, 2008. Of the Company’s $76.6 million pledged available for sale investment securities balance at December 31, 2007, $40.4 million of available for sale investment securities was securing public deposits and trust assets.
To borrow from the FHLB, members must pledge collateral to secure advances and letters of credit. Acceptable collateral includes a variety of single-family residential loans, commercial real estate loans, home equity lines of credit, and multifamily residential loans as well as a number of types of securities. Approximately $41.6 million, or 33%, of the investment securities portfolio, at fair value, was pledged to collateralize FHLB
44
advances and letters of credit as of December 31, 2008 of which $37.5 million was utilized as lendable collateral. In order to compute lendable collateral amounts, investment security market values are multiplied by a collateral value percentage. No investment securities were pledged at December 31, 2007 to collateralize FHLB advances and letters of credit.
Unrealized Position. The following table summarizes the amortized cost and fair value composition of the Company’s investment securities available for sale portfolio at the dates indicated (dollars in thousands).
| | | | | | | | | | | | | |
| | | December 31, 2008 | | December 31, 2007 | | December 31, 2006 |
| | | Amortized
cost | | Fair
value | | Amortized
cost | | Fair
value | | Amortized
cost | | Fair
value |
U.S. Treasury and federal agencies | | $ | — | | — | | 20,725 | | 20,743 | | 42,554 | | 42,383 |
State and municipal | | | 50,297 | | 50,830 | | 52,677 | | 52,159 | | 48,780 | | 48,014 |
Collateralized mortgage obligations | | | 58,033 | | 54,639 | | — | | — | | — | | — |
Other mortgage-backed (federal agencies) | | | 19,876 | | 20,127 | | 22,722 | | 22,813 | | 26,362 | | 26,170 |
| | | | | | | | | | | | | |
Total investment securities available for sale | | $ | 128,206 | | 125,596 | | 96,124 | | 95,715 | | 117,696 | | 116,567 |
| | | | | | | | | | | | | |
State and municipal investment securities are debt investment securities issued by a state, municipality, or county in order to finance its capital expenditures. The most substantial risk associated with buying state and municipal investment securities is the financial risk associated with the municipality from which the securities are purchased. Although municipal bonds in smaller municipalities can sometimes be difficult to sell quickly, the Company does not currently anticipate that it will liquidate this portfolio in the near term.
During 2008, the Company began investing in private label collateralized mortgage obligations. These collateralized mortgage obligations are issued by third parties that originate mortgage loans. Collateralized mortgage obligations are a mortgage-backed security sub-type in which the mortgages are ordered into tranches by some quality (such as repayment time) with each tranche sold as a separate security. These mortgage-backed securities separate the mortgage pools into short, medium, and long-term tranches. The Company has purchased the A tranche of these securities. The Company’s collateralized mortgage obligations are all fixed rate and are paid a fixed rate of interest at regular intervals. Monthly fluctuations in income occur only as there are changes in amortization or accretions due to changes in prepayment speeds.
Other mortgage-backed investment securities include investment instruments that represent ownership of an undivided interest in a group of mortgages. Principal and interest from the individual mortgages are used to pay principal and interest on the mortgage-backed investment security. Monthly income from other mortgage-backed investment securities may fluctuate as interest rates change due to the volume of mortgage prepayments.
The Company uses prices from third party pricing services and, to a lesser extent, indicative (non-binding) quotes from third party brokers, to measure fair value of the Company’s investment securities. See Item 8. Financial Statements and Supplementary Data, Note 17 for further discussion regarding the amount and fair value hierarchy classification of investment securities measured at fair value using a third party pricing service and those measured at fair value using broker quotes. The Company utilizes multiple third party pricing services and brokers to obtain fair values; however, management generally obtains one price / quote for each individual security. For securities priced by third party pricing services, management determines the most appropriate and relevant pricing service for each security class and has that vendor provide the price for each security in the class. The Company records the unadjusted value provided by the third party pricing service / broker in its Consolidated Financial Statements, subject to the Company’s internal price verification procedures. Based upon management’s internal price verification procedures and review of fair value methodology documentation provided by third party pricing services, the Company has concluded that the fair values for its investment securities available for sale at December 31, 2008 were consistent with the guidance in SFAS No. 157. At December 31, 2008, all collateralized mortgage obligations were valued using level three inputs as no active trading market existed at that time.
45
Other-Than-Temporary Impairment Analysis. Management conducts other-than-temporary impairment analysis on a quarterly basis or more often if a potential loss-triggering event occurs. The Company recognizes other-than-temporary impairment when it is probable that it will be unable to collect all amounts due according to the contractual terms of the security and the fair value of the investment security is less than its amortized cost. The initial indication of other-than-temporary impairment for investment securities is a decline in the market value below the amount recorded for an investment and the severity and duration of the decline. In determining whether an impairment is other-than-temporary, management considers the length of time and the extent to which the market value has been below cost, recent events specific to the issuer, including investment downgrades by rating agencies and economic conditions of its industry, and the Company’s ability and intent to hold the investment for a period of time, including maturity, sufficient to allow for any anticipated recovery. Management also considers the cause of the price decline (general level of interest rates and industry- and issuer-specific factors), the issuer’s financial condition, near-term prospects and current ability to make future payments in a timely manner, the issuer’s ability to service debt, any change in agencies’ ratings at evaluation date from acquisition date and any likely imminent action, and for collateralized mortgage obligations, the credit performance of the underlying collateral, including delinquency rates, cumulative losses to date, and the remaining credit enhancement compared to expected credit losses of the security.
The following tables summarizes the gross unrealized losses, fair value, and the number of securities in each category of investment securities available for sale, aggregated by investment category and length of time that individual securities have been in a continuous unrealized loss position, at the dates indicated (dollars in thousands).
| | | | | | | | | | | | | | | | | | | | |
| | | December 31, 2008 |
| | | Less than 12 months | | 12 months or longer | | Total |
| | | # | | Fair value | | Gross
unrealized
losses | | # | | Fair value | | Gross
unrealized
losses | | # | | Fair value | | Gross
unrealized
losses |
State and municipal | | 12 | | $ | 5,441 | | $ | 101 | | 1 | | 423 | | 1 | | 13 | | 5,864 | | 102 |
Collateralized mortgage obligations | | 13 | | | 52,603 | | | 3,417 | | — | | — | | — | | 13 | | 52,603 | | 3,417 |
Other mortgage-backed (federal agencies) | | 4 | | | 1,336 | | | 15 | | 1 | | 838 | | 4 | | 5 | | 2,174 | | 19 |
| | | | | | | | | | | | | | | | | | | | |
Total investment securities available for sale | | 29 | | $ | 59,380 | | $ | 3,533 | | 2 | | 1,261 | | 5 | | 31 | | 60,641 | | 3,538 |
| | | | | | | | | | | | | | | | | | | | |
| |
| | | December 31, 2007 |
| | | Less than 12 months | | 12 months or longer | | Total |
| | | # | | Fair value | | Gross
unrealized
losses | | # | | Fair value | | Gross
unrealized
losses | | # | | Fair value | | Gross
unrealized
losses |
U.S. Treasury and federal agencies | | — | | $ | — | | $ | — | | 2 | | 3,476 | | 8 | | 2 | | 3,476 | | 8 |
State and municipal | | 16 | | | 6,135 | | | 79 | | 98 | | 38,760 | | 494 | | 114 | | 44,895 | | 573 |
Other mortgage-backed (federal agencies) | | 1 | | | 733 | | | — | | 15 | | 10,655 | | 105 | | 16 | | 11,388 | | 105 |
| | | | | | | | | | | | | | | | | | | | |
Total investment securities available for sale | | 17 | | $ | 6,868 | | $ | 79 | | 115 | | 52,891 | | 607 | | 132 | | 59,759 | | 686 |
| | | | | | | | | | | | | | | | | | | | |
46
The change in investment securities available for sale in a gross unrealized losses position at December 31, 2008 was largely due to wide asset spreads resulting from an illiquid market, causing these assets to be valued at significant discounts from cost. The fair value is expected to recover as the bonds approach their maturity date or repricing date or if market yields for such investments decline further. Gross unrealized losses increased $2.9 million from December 31, 2007 to December 31, 2008 primarily as a result of the collateralized mortgage obligation sector of the investment securities portfolio. Partially offsetting this increase in gross unrealized losses were improvements within the state and municipal and other mortgage-backed sectors.
Any decline in the fair value of available for sale securities below cost that are deemed to be other-than-temporary is reflected in income as realized losses. As of December 31, 2008, the Company has received all principal and interest payments, believes that the principal and interest on these securities are fully recoverable, and has the ability and intent to hold the securities for a period of time sufficient for a recovery of cost. Accordingly, management believes the gross unrealized losses detailed in the preceding table are temporary, and, therefore, were not other-than-temporarily impaired at December 31, 2008.
The fair values of the Company’s investment securities portfolio could decline in the future if the underlying performance of the collateral for collateralized mortgage obligations or other securities deteriorate and the Company’s credit enhancement levels do not provide sufficient protection to contractual principal and interest. As a result, there is risk that other-than-temporary impairments may occur in the future given the current economic environment.
Ratings. The following table summarizes Moody’s ratings, by segment of the investment securities available for sale, at December 31, 2008. A AAA rating is based not on the credit of the issuer, but rather on the structure of the securities and the credit quality of the collateral.
| | | | | | | |
| | | State and
municipal | | | Collateralized
mortgage obligations | | Other mortgage-backed
(federal agencies) |
A1 | | 11 | % | | — | | — |
A2 | | 5 | | | — | | — |
A3 | | 8 | | | — | | — |
Aa1 | | 11 | | | — | | — |
Aa2 | | 6 | | | — | | — |
Aa3 | | 33 | | | — | | — |
Aaa | | 2 | | | 95 | | 100 |
Baa1 | | 14 | | | — | | — |
Baa2 | | 2 | | | — | | — |
Not rated | | 8 | | | 5 | | — |
| | | | | | | |
Total | | 100 | % | | 100 | | 100 |
| | | | | | | |
Of the state and municipal investment securities not rated by Moody’s at December 31, 2008, 15% of the securities were rated AA+, 66% were rated AA, 10% were rated A, and 9%, or $378 thousand, were not rated by Standard and Poor’s Ratings.
Of the collateralized mortgage obligations not rated by Moody’s at December 31, 2008, 100% of the securities were rated AAA by Standard and Poor’s or Fitch Ratings.
47
Maturities. The following table summarizes the maturity distribution schedule with corresponding weighted-average yields of amortized cost of investment securities available for sale at and for the period ended December 31, 2008 (dollars in thousands). Weighted-average yields have not been computed on a fully taxable-equivalent basis. Mortgage-backed securities are included in maturity categories based on their stated maturity date. Expected maturities may differ from contractual maturities because issuers may have the right to call or prepay obligations.
| | | | | | |
| | | Amortized
cost | | Book Yield | |
State and municipal | | | | | | |
In one year or less | | $ | 4,016 | | 3.4 | % |
After 1 through 5 years | | | 20,906 | | 3.3 | |
After 5 through 10 years | | | 24,180 | | 3.6 | |
After 10 years | | | 1,195 | | 4.0 | |
| | | | | | |
Total state and municipal | | | 50,297 | | 3.5 | |
Collateralized mortgage obligations | | | | | | |
In one year or less | | | — | | — | |
After 1 through 5 years | | | — | | — | |
After 5 through 10 years | | | — | | — | |
After 10 years | | | 58,033 | | 5.9 | |
| | | | | | |
Total collateralized mortgage obligations | | | 58,033 | | 5.9 | |
Other mortgage-backed (federal agencies) | | | | | | |
In one year or less | | | 3,480 | | 5.1 | |
After 1 through 5 years | | | 530 | | 5.2 | |
After 5 through 10 years | | | 7,334 | | 5.1 | |
After 10 years | | | 8,532 | | 5.6 | |
| | | | | | |
Total other mortgage-backed (federal agencies) | | | 19,876 | | 5.3 | |
| | | | | | |
Total investment securities available for sale | | $ | 128,206 | | 4.8 | % |
| | | | | | |
The weighted-average life of investment securities available for sale was 3.9 years at December 31, 2008. Since approximately 60% of the portfolio is collateralized mortgage obligations or other mortgage-backed securities, the expected remaining maturity may differ from contractual maturity because borrowers generally have the right to prepay obligations before the underlying mortgages mature.
Concentrations of Risk. The Company did not own any state and municipal investment securities with fair values exceeding 2% of total shareholders’ equity at December 31, 2008. The Company owned five state and municipal security issuers issued securities with fair values exceeding 1% of total shareholders’ equity at December 31, 2008, ranging from 1.0% to 1.9%. Although not all state and municipal investment securities are rated AAA, all are within the Company’s ratings standards outlined in its Investment Policy which requires rated bonds to be balanced to average “Aa” to “A” by one of the major bond rating agencies. Furthermore, all municipals purchased are required by the Bank’s Investment Policy to have a minimum A rating at the time of purchase.
The company’s collateralized mortgage obligations, by issuer, ranged from 1.8% of total shareholders’ equity at December 31, 2008 to 8.0% of total shareholders’ equity at December 31, 2008.
48
The following table summarizes issuer fair value concentration of other mortgage-backed investment securities, by issuer, at December 31, 2008 (dollars in thousands).
| | | | | | | | |
| | | Federal
National
Mortgage
Association | | | Federal
Home Loan
Mortgage
Corporation | | Total |
Other mortgage-backed (federal agencies) | | $ | 16,755 | | | 3,372 | | 20,127 |
As a percentage of shareholders’ equity | | | 14.5 | % | | 2.9 | | 17.4 |
During the third quarter of 2008, the U.S. government stepped in to help rescue the Federal National Mortgage Association and the Federal Home Loan Mortgage Corporation. The government put both entities into conservatorships under the control of their regulator, the Federal Housing Finance Agency.
Lending Activities
Composition. The following table summarizes the Company’s loans, gross, categorized by the FDIC code, excluding mortgage loans held for sale, at the dates indicated (dollars in thousands).
| | | | | | | | | | |
| | | December 31, 2008 | | | December 31, 2007 |
| | | Total | | % of total | | | Total | | % of total |
Secured by real estate | | | | | | | | | | |
Construction, land development, and other land loans | | $ | 235,216 | | 20.3 | % | | 131,149 | | 12.6 |
Farmland | | | 882 | | 0.1 | | | 1,004 | | 0.1 |
Single-family residential | | | 217,734 | | 18.8 | | | 209,168 | | 20.0 |
Multifamily residential | | | 36,349 | | 3.1 | | | 28,660 | | 2.7 |
Nonfarm nonresidential | | | 510,180 | | 44.1 | | | 499,807 | | 47.8 |
Commercial and industrial | | | 73,609 | | 6.4 | | | 77,555 | | 7.4 |
Obligations of states and political subdivisions of the U.S. | | | 2,602 | | 0.2 | | | 3,339 | | 0.3 |
General consumer | | | 60,626 | | 5.2 | | | 68,887 | | 6.6 |
Credit line | | | 6,215 | | 0.5 | | | 5,189 | | 0.5 |
Bankcards | | | 12,416 | | 1.1 | | | 11,978 | | 1.2 |
Others | | | 2,651 | | 0.2 | | | 8,034 | | 0.8 |
| | | | | | | | | | |
Loans, gross | | $ | 1,158,480 | | 100.0 | % | | 1,044,770 | | 100.0 |
| | | | | | | | | | |
49
The following table summarizes loans, gross, by loan purpose, excluding mortgage loans held for sale, at the dates indicated (dollars in thousands).
| | | | | | | | | | | | | | | | | | | | | | |
| | | December 31, |
| | | 2008 | | | 2007 | | 2006 | | 2005 | | 2004 |
| | | Total | | % of total | | | Total | | % of total | | Total | | % of total | | Total | | % of total | | Total | | % of total |
Commercial business | | $ | 154,304 | | 13.3 | % | | 145,634 | | 13.9 | | 112,264 | | 11.9 | | 90,345 | | 10.4 | | 90,708 | | 11.7 |
Commercial real estate | | | 740,420 | | 63.9 | | | 639,144 | | 61.2 | | 593,377 | | 62.7 | | 561,575 | | 64.8 | | 478,943 | | 61.9 |
Installment | | | 23,547 | | 2.0 | | | 25,315 | | 2.4 | | 22,139 | | 2.3 | | 18,677 | | 2.2 | | 19,910 | | 2.6 |
Installment real estate | | | 85,506 | | 7.4 | | | 75,721 | | 7.3 | | 66,161 | | 7.0 | | 55,682 | | 6.4 | | 51,846 | | 6.7 |
Indirect | | | 34,566 | | 3.0 | | | 39,502 | | 3.8 | | 43,634 | | 4.6 | | 30,481 | | 3.5 | | 16,383 | | 2.1 |
Credit line | | | 2,090 | | 0.2 | | | 2,188 | | 0.2 | | 1,982 | | 0.2 | | 2,022 | | 0.2 | | 2,012 | | 0.3 |
Prime access | | | 64,384 | | 5.5 | | | 54,164 | | 5.2 | | 53,883 | | 5.7 | | 54,296 | | 6.3 | | 45,656 | | 5.9 |
Residential mortgage | | | 36,611 | | 3.2 | | | 40,842 | | 3.9 | | 35,252 | | 3.7 | | 34,453 | | 4.0 | | 52,669 | | 6.8 |
Bankcards | | | 12,470 | | 1.1 | | | 12,702 | | 1.2 | | 12,001 | | 1.3 | | 12,182 | | 1.4 | | 11,310 | | 1.5 |
Business manager | | | 152 | | — | | | 326 | | — | | 370 | | — | | 230 | | — | | 552 | | 0.1 |
Other | | | 1,934 | | 0.2 | | | 2,045 | | 0.2 | | 1,795 | | 0.2 | | 2,064 | | 0.3 | | 1,474 | | 0.2 |
Loans in process | | | 2,141 | | 0.2 | | | 6,511 | | 0.6 | | 2,397 | | 0.3 | | 3,413 | | 0.4 | | 1,089 | | 0.1 |
Deferred loans fees and costs | | | 355 | | — | | | 676 | | 0.1 | | 658 | | 0.1 | | 761 | | 0.1 | | 702 | | 0.1 |
| | | | | | | | | | | | | | | | | | | | | | |
Loans, gross | | $ | 1,158,480 | | 100.0 | % | | 1,044,770 | | 100.0 | | 945,913 | | 100.0 | | 866,181 | | 100.0 | | 773,254 | | 100.0 |
| | | | | | | | | | | | | | | | | | | | | | |
Underwriting. General. There are inherent risks associated with the Company’s lending activities. Prudent risk taking requires sound policies intended to manage the risk within the portfolio and control processes intended to ensure compliance with those policies. Management reviews and approves these policies and procedures on a regular basis. Management believes that active monitoring of high quality assets within the Company’s loan portfolio is critical to the Company’s business.
The Company does not loan in excess of 100% of collateral value, offer loan payment arrangements resulting in negative amortization, engage in lending practices subjecting borrowers to substantial payment increases (e.g. principal deferral periods, loans with initial interest-only periods, etc.), nor does it offer loan payment arrangements with minimum payments that are less than accrued interest.
Loan Scoring and Approval. The Company’s loan approval process is multi-layered and incorporates a computer-based scoring analysis for virtually all loans. The Company has established and follows guidelines with regard to the scoring and approval of loans.
Monitoring. Compliance with the Company’s underwriting policies and procedures is monitored through a loan approval and documentation review process and the resulting exception reports.
The Company performs, either internally or through the use of an external third party, independent loan reviews to validate the Company’s loan risk program on a periodic basis. Although all of the Company’s loans within its loan portfolio are included in the population from which to select loans subject to review, commercial real estate loans are given more weight in the loan review selection process as a result of their risk characteristics and their concentration within the Company’s loan portfolio. Summary loan review reports are submitted quarterly to the Officer’s Credit Committee. The loan review process complements and reinforces the risk identification and assessment decisions made by the Company and the Company’s policies and procedures.
Validation. The Company’s underwriting policies and processes are validated through the ongoing analysis of asset quality trends. A reporting system supplements the monitoring process by providing management with frequent reports related to loan production, quality, and concentrations.
50
Commercial Business. Commercial business loans are underwritten after evaluating and understanding the borrower’s ability to operate profitably while prudently expanding the borrower’s business. Underwriting standards are designed to promote relationship banking rather than transactional banking. If the Company believes that the borrower’s management possesses sound ethics and solid business acumen, the Company’s management examines current and projected cash flows to determine the likelihood that the borrower will repay its obligations as agreed. Commercial business loans are primarily made based on the projected cash flows of the borrower and secondarily on the underlying collateral provided by the borrower. The actual cash flows of borrowers, however, may not be as expected, and the collateral securing loans may fluctuate in value. Most commercial business loans are secured by the assets being financed or other business assets, such as accounts receivable or inventory, and generally incorporate a personal guarantee. However, the Company makes some short-term loans on an unsecured basis. In the case of loans secured by accounts receivable, the availability of funds for the repayment of these loans may depend substantially on the ability of the borrower to collect amounts due from its customers. As a result of these factors, management believes that commercial business loans generally involve greater risk than real estate loans.
The Company’s commercial business loans are generally made with terms that do not exceed five years. Such loans typically have interest rates that change at periods ranging from one day to one year based on the prime lending rate as the interest rate index or that are fixed at the time of commitment.
Commercial Real Estate. Commercial real estate loans are subject to underwriting standards and processes similar to commercial business loans with additional standards with regard to real estate collateral. These loans are viewed primarily as cash flow loans and secondarily as loans secured by real estate. Management monitors and evaluates commercial real estate loans based on collateral type. In addition, management tracks the level of owner occupied commercial real estate loans versus nonowner occupied loans.
The Company makes commercial real estate loans to businesses within most industry sectors. Interest rates charged on these real estate loans are determined by market conditions existing at the time of the loan commitment. Generally, loans have adjustable rates, although the rate may be fixed for three to five years of the term of the loan depending on market conditions, collateral, and the Company’s relationship with the borrower. Amortization of commercial and installment real estate loans varies but typically does not exceed 20 years. It is the Company’s policy to have collateral securing real estate loans appraised.
From time to time, the Company originates loans to developers and builders that are secured by nonowner occupied properties. Such loans are typically approved based on predetermined loan-to-collateral values. Construction loans are underwritten utilizing feasibility studies, independent appraisal reviews, sensitivity analysis of absorption and lease rates, and / or financial analysis of the developers and property owners. Construction loans are generally based upon estimates of costs and value associated with the complete project and often involve the disbursement of funds with repayment dependent on the success of the ultimate project. Sources of repayment for these types of loans may be precommitted permanent loans from approved long-term lenders, sales of developed property, or an interim loan commitment from the Company until permanent financing is obtained. The Company monitors these loans by conducting onsite inspections. The Company believes that these loans have higher risks than other real estate loans because their repayment is sensitive to interest rate changes, governmental regulation of real property, general economic and market conditions, and the availability of long-term financing.
Installment Real Estate. Underwriting standards for single-family real estate purpose loans within the installment real estate loan portfolio category (for example, home equity loans) are heavily influenced by statutory requirements, which include, but are not limited to, a maximum loan-to-value percentage.
As part of its residential lending program, the Company originates residential construction loans to finance the construction of individual, owner occupied houses with 80% loan-to-value ratios to qualified builders, although higher loan-to-value ratios may be utilized at the discretion of the Company. Such loans involve
51
additional risks because loan funds are advanced based on the security of the project under construction. The Company typically structures these construction loans to be converted to preapproved permanent loans at the completion of the construction phase. Loan proceeds are disbursed in increments as construction progresses and as inspections warrant. These construction loans are generally at a competitive fixed or adjustable-rate of interest for one or two year terms. The Company also offers lot loans intended for residential use that may be on a fixed or adjustable-rate basis.
It is the Company’s policy to have collateral securing real estate loans appraised.
Residential Mortgages. The Company’s mortgage lenders make both fixed-rate and adjustable-rate single-family mortgage loans with terms generally ranging from 10 to 30 years. Adjustable-rate mortgage loans currently offered by the Company have interest rates that adjust annually or adjust annually after being fixed for a period of several years in accordance with a designated index. The Company may offer loans that have interest rates that adjust annually or adjust annually after being fixed for a period of three to seven years in accordance with a designated index (although the Company currently does not offer these loans). Adjustable-rate mortgage loans may be originated with a limit on any increase or decrease in the interest rate per year further limited by the amount by which the interest rate can increase or decrease over the life of the loan. In order to encourage the origination of adjustable-rate mortgage loans with interest rates that adjust annually, the Company, like many of its competitors, generally offers a more attractive rate of interest on such loans than on fixed-rate mortgage loans.
A large percentage of the Company’s originated single-family mortgage loans are underwritten pursuant to guidelines that permit the sale of these loans in the secondary market to government or private agencies. The Company participates in secondary market activities by selling whole loans and participations in loans primarily to the FHLB under its Mortgage Partnership Program and the Federal Home Loan Mortgage Corporation (“FHLMC”). This practice enables the Company to satisfy the demand for these loans in its local communities, to meet asset and liability objectives of the Company, and to develop a source of fee income through the servicing of these loans. The Company may sell fixed-rate, adjustable-rate, and balloon-term loans. Based on current interest rates as well as other factors, the Company intends to sell selected originations of conforming 30 year and 15 year fixed-rate mortgage loans.
When the Company originates and underwrites single-family mortgage loans to be retained in the Company’s residential mortgage portfolio, if the loan exceeds 80% of the collateral value, the Company requires private mortgage insurance that protects the Company against losses of at least 20% of the mortgage loan amount.
It is the Company’s policy to have collateral securing real estate loans appraised.
Consumer. Management believes that the Company’s loan scoring and approval policies and procedures, as outlined previously, coupled with relatively small loan amounts that are spread across many individual borrowers, minimize risk within the consumer sectors of the Company’s loan portfolio.
Concentrations of Risk. The Company strives to maintain a diversified loan portfolio to spread risk and reduce exposure to economic downturns that may occur.
Borrower Concentration. Management does not believe that the Company’s loan portfolio is concentrated in loans to any single borrower or a relatively small number of borrowers.
Geographic Concentration. As discussed in Item 1A. Risk Factors, unlike larger national or regional banks that are more geographically diversified, the Company primarily provides its services to customers within its market area. Deterioration in local economic conditions could result in declines in asset quality, loan collateral values, and / or the demand for the Company’s products and services, among other things.
52
Although the Company’s geographic concentration limits the Company to the economic risks within its market area, the Company’s lack of geographic diversification may make it particularly sensitive to adverse impacts of negative economic conditions that impact its market area.
The following table summarizes loans secured by commercial real estate, categorized by FDIC code, at December 31, 2008 (dollars in thousands).
| | | | | | | | |
| | | Total | | % of Bank’s
loan portfolio,
gross | | | % of Bank’s
tier 1 capital |
Secured by commercial real estate | | | | | | | | |
Construction, land development, and other land loans | | $ | 235,216 | | 20.3 | % | | 199.6 |
Multifamily residential | | | 36,349 | | 3.2 | | | 30.8 |
Nonfarm nonresidential | | | 510,180 | | 44.0 | | | 432.8 |
| | | | | | | | |
Total loans secured by commercial real estate | | $ | 781,745 | | 67.5 | % | | 663.2 |
| | | | | | | | |
The following table further categorizes loans secured by commercial real estate, categorized by FDIC code, at December 31, 2008 (dollars in thousands).
| | | | | | | | |
| | | Total | | % of Bank’s
loan portfolio,
gross | | | % of Bank’s
tier 1 capital |
Development commercial real estate loans | | | | | | | | |
Loans secured by: | | | | | | | | |
Land—unimproved (commercial or residential) | | $ | 24,941 | | 2.1 | % | | 21.2 |
Land development—commercial | | | 150,579 | | 13.0 | | | 127.7 |
Commercial construction: | | | | | | | | |
Hotel / motel | | | 31,196 | | 2.7 | | | 26.5 |
Multifamily | | | 20,455 | | 1.8 | | | 17.3 |
| | | | | | | | |
Total development commercial real estate loans | | | 227,171 | | 19.6 | | | 192.7 |
Existing and other commercial real estate loans | | | | | | | | |
Loans secured by existing real estate: | | | | | | | | |
Hotel / motel | | | 113,224 | | 9.8 | | | 96.1 |
Retail | | | 32,067 | | 2.8 | | | 27.2 |
Office | | | 18,053 | | 1.5 | | | 15.3 |
Multifamily | | | 73,854 | | 6.4 | | | 62.7 |
Industrial and warehouse | | | 12,436 | | 1.1 | | | 10.5 |
Healthcare | | | 43,457 | | 3.7 | | | 36.9 |
Miscellaneous commercial | | | 125,825 | | 10.9 | | | 106.7 |
Residential construction—speculative | | | 10,677 | | 0.9 | | | 9.1 |
| | | | | | | | |
Total existing and other commercial real estate loans | | | 429,593 | | 37.1 | | | 364.5 |
Commercial real estate owner occupied and residential loans | | | | | | | | |
Loans secured by: | | | | | | | | |
Commercial—owner occupied | | | 124,737 | | 10.8 | | | 105.8 |
Residential construction—contract | | | 244 | | — | | | 0.2 |
| | | | | | | | |
Total commercial real estate owner occupied and residential loans | | | 124,981 | | 10.8 | | | 106.0 |
| | | | | | | | |
Total loans secured by commercial real estate | | $ | 781,745 | | 67.5 | % | | 663.2 |
| | | | | | | | |
53
The Company believes that the properties securing its commercial real estate portfolio are diverse in terms of type. This diversity reduces the Company’s exposure to adverse economic events that impact any single industry.
Maturities and Sensitivities of Loans to Changes in Interest Rates. The following table summarizes the Company’s total loan portfolio, including mortgage loans held for sale, by FDIC code, at December 31, 2008 that, based on contractual terms, were due during the periods noted. Loans having no stated maturity and no stated schedule of repayments are reported as due in one year or less. In addition, due to the fact that the Company’s equity lines of credit are mortgage loans intended to be long-term real estate consumer products, all such loans are reported as due after five years. The table also summarizes the Company’s loan portfolio at December 31, 2008 with regard to fixed-rate and variable-rate maturity or repricing terms due in periods after one year (in thousands).
| | | | | | | | | | | | | |
| | | Maturity | | Rate structure for
loans with maturities
or repricing terms
over one year |
| | | Due in one
year or less | | Due after one
year through
five years | | Due after five
years | | Total | | Fixed-
rate | | Variable-
rate |
Secured by real estate | | | | | | | | | | | | | |
Construction, land development, and other land loans | | $ | 183,138 | | 32,335 | | 19,743 | | 235,216 | | 52,078 | | — |
Farmland | | | 17 | | 265 | | 600 | | 882 | | 865 | | — |
Single-family residential | | | 60,262 | | 38,792 | | 126,095 | | 225,149 | | 122,469 | | 42,418 |
Multifamily residential | | | 28,742 | | 6,203 | | 1,404 | | 36,349 | | 7,607 | | — |
Nonfarm nonresidential | | | 234,548 | | 232,638 | | 42,994 | | 510,180 | | 275,632 | | — |
Commercial and industrial | | | 41,144 | | 29,642 | | 2,823 | | 73,609 | | 32,465 | | — |
Obligations of states and political subdivisions of the U.S. | | | 217 | | 1,892 | | 493 | | 2,602 | | 2,385 | | — |
General consumer | | | 6,747 | | 45,980 | | 7,937 | | 60,664 | | 53,917 | | — |
Credit line | | | 3,228 | | 2,987 | | — | | 6,215 | | 2,987 | | — |
Bankcards | | | 12,416 | | — | | — | | 12,416 | | — | | — |
Others | | | 2,576 | | 37 | | — | | 2,613 | | 37 | | — |
| | | | | | | | | | | | | |
Total | | $ | 573,035 | | 390,771 | | 202,089 | | 1,165,895 | | 550,442 | | 42,418 |
| | | | | | | | | | | | | |
Asset Quality. Delinquent Loans. The Company determines past due and delinquent status based on contractual terms. When a borrower fails to make a scheduled loan payment, the Company attempts to cure the default through several methods including, but not limited to, collection contact and assessment of late fees. If these methods do not result in the borrower remitting the past due payment, further action may be taken. Interest on loans deemed past due continues to accrue until the loan is placed in nonaccrual status. The Company places loans in nonaccrual status prior to any amount being charged-off.
Nonperforming Assets. Nonaccrual loans are those loans that management has determined offer a more than normal risk of future uncollectibility. In most cases, loans are automatically placed in nonaccrual status by the loan system when the loan payment becomes 90 days delinquent and no acceptable arrangement has been made between the Company and the borrower. Loans may be manually placed in nonaccrual status on the loan system if management determines that some factor other than delinquency (such as bankruptcy proceedings) cause the Company to believe that more than a normal amount of risk exists with regard to collectability. When the loan is placed in nonaccrual status, accrued interest income is reversed based on the effective date of nonaccrual status. Thereafter, interest income on the nonaccrual loans is recognized only as received. The Company classifies nonaccrual loans as substandard or lower. When the probability of future collectability on a nonaccrual loan declines from probable to possible, the Company may take additional collection measures including commencing
54
foreclosure action, if necessary. Specific steps must be taken when commencing foreclosure action on loans secured by real estate. Notice of default is required to be recorded and mailed. If the default is not cured within a specified time period, a notice of sale is posted, mailed, and advertised, and a sale is then conducted. The Company typically excludes bankcard balances from the nonaccrual process noted above. Due to the nature of the portfolio, the Company does not believe that it is necessarily probable that collectability of these loans is remote when delinquencies exceed 90 days. For this reason, these balances often continue to accrue income after they have become greater than 90 days delinquent.
The following table summarizes trends in nonperforming assets at the dates indicated (dollars in thousands). Nonaccrual loans are categorized by FDIC code.
| | | | | | | | | | | | |
| | | December 31, |
| | | 2008 | | | 2007 | | 2006 | | 2005 | | 2004 |
Secured by real estate | | | | | | | | | | | | |
Construction, land development, and other land loans | | $ | 15,409 | | | 1,783 | | — | | — | | 22 |
Farmland | | | — | | | — | | — | | — | | — |
Single-family residential | | | 2,569 | | | 781 | | 1,398 | | 1,243 | | 837 |
Multifamily residential | | | 231 | | | — | | — | | — | | — |
Nonfarm nonresidential | | | 23,725 | | | 1,563 | | 4,873 | | 7,922 | | 846 |
Commercial and industrial | | | 763 | | | 567 | | 549 | | 631 | | 353 |
General consumer | | | 271 | | | 116 | | 179 | | 117 | | 265 |
| | | | | | | | | | | | |
Total nonaccrual loans | | | 42,968 | | | 4,810 | | 6,999 | | 9,913 | | 2,323 |
Real estate acquired in settlement of loans | | | 6,719 | | | 7,743 | | 600 | | 1,954 | | 2,413 |
Repossessed automobiles acquired in settlement of loans | | | 564 | | | 403 | | 319 | | 167 | | 282 |
| | | | | | | | | | | | |
Total foreclosed assets | | | 7,283 | | | 8,146 | | 919 | | 2,121 | | 2,695 |
| | | | | | | | | | | | |
Total nonperforming assets | | $ | 50,251 | | | 12,956 | | 7,918 | | 12,034 | | 5,018 |
| | | | | | | | | | | | |
Loans past due 90 days and still accruing (1) | | $ | 206 | | | 236 | | 260 | | 207 | | 147 |
| | | | | | | | | | | | |
Loans (2) | | $ | 1,158,480 | | | 1,044,770 | | 945,913 | | 866,181 | | 773,254 |
Total assets | | | 1,370,000 | | | 1,248,177 | | 1,153,136 | | 1,075,015 | | 993,102 |
Nonaccrual loans as a percentage of: | | | | | | | | | | | | |
loans and foreclosed assets (2) | | | 3.69 | % | | 0.46 | | 0.74 | | 1.14 | | 0.30 |
total assets | | | 3.14 | | | 0.39 | | 0.61 | | 0.92 | | 0.23 |
Nonperforming assets as a percentage of: | | | | | | | | | | | | |
loans and foreclosed assets (2) | | | 4.31 | % | | 1.23 | | 0.84 | | 1.39 | | 0.65 |
total assets | | | 3.67 | | | 1.04 | | 0.69 | | 1.12 | | 0.51 |
| (1) | | Substantially all of these loans are bankcard loans |
| (2) | | Calculated using loans excluding mortgage loans held for sale, net of unearned, excluding the allowance for loan losses |
Of the $50.3 million in nonperforming assets at December 31, 2008, approximately 97% of the Company’s exposure had underlying real estate collateral.
55
The following table summarizes the changes in nonaccrual loans during the year ended December 31, 2008 (in thousands).
| | | | |
Nonaccrual loans, December 31, 2007 | | $ | 4,810 | |
Less: December 31, 2007 nonaccrual loans removed from nonaccrual during 2008 | | | (2,925 | ) |
Less: Change in balance of December 31, 2007 nonaccrual loans still in nonaccrual status at December 31, 2008 | | | (46 | ) |
Plus: 2008 nonaccrual additions, net | | | 41,129 | |
| | | | |
Nonaccrual loans, December 31, 2008 | | $ | 42,968 | |
| | | | |
Approximately 82% of the $41.1 million of the 2008 net nonaccrual additions was contained within 12 loans. The following table further summarizes these additions during 2008 by FDIC code including number of loans and carrying loan value within each category (dollars in thousands).
| | | | | |
| | | # | | Carrying
value |
Commercial and industrial | | 8 | | $ | 13,164 |
Secured by nonfarm nonresidential real estate | | 4 | | | 20,686 |
| | | | | |
Total | | 12 | | $ | 33,850 |
| | | | | |
All of these loans were included in the Company’s SFAS No. 114 analysis at December 31, 2008 resulting in specific allowance for loss reserves totaling $3.9 million.
Increases in nonaccrual loans collateralized by real estate resulted from the conditions in the real estate markets and economy in general. Until conditions improve in the real estate markets, the Company likely will continue to hold more nonperforming assets, as it is currently the most economic option available.
The following table summarizes the total additional amount of interest that would have been reported in income for the periods indicated had loans classified as nonaccrual at each of these dates performed in accordance with their original terms and the amount of total interest collected during each of these periods relative to loans classified as nonaccrual at each of the year-ends (in thousands).
| | | | | |
| | | For the years ended
December 31, |
| | | 2008 | | 2007 |
Foregone interest | | $ | 1,456 | | 284 |
Interest collected | | | 19 | | 15 |
Real estate and personal property acquired by the Company in settlement of loans is classified within other assets on the Consolidated Balance Sheets until it is sold. When real estate property is acquired, it is recorded at the lower of cost or estimated fair value less cost to sell at the date of acquisition with any resulting writedowns being taken through the allowance for loan losses. Fair values of these properties are reviewed regularly, and writedowns are recorded when it is determined that the carrying value of the property exceeds the fair value less estimated costs to sell. Gains and losses on the sale of real estate property acquired in settlement of loans and writedowns resulting from periodic reevaluation are charged against income. Costs relating to the development and improvement of real estate property, when material, are capitalized. Costs relating to holding the property, when material, are charged against income.
56
The following table summarizes the changes in the real estate acquired in settlement of loans portfolio at the dates and for the periods indicated (in thousands).
| | | | | | | | | | |
| | | At and for the years ended
December 31, | |
| | | 2008 | | | 2007 | | | 2006 | |
Real estate acquired in settlement of loans, beginning of period | | $ | 7,743 | | | 600 | | | 1,954 | |
Plus: New real estate acquired in settlement of loans | | | 2,778 | | | 10,030 | | | 294 | |
Less: Sales / recoveries of real estate acquired in settlement of loans | | | (3,634 | ) | | (2,707 | ) | | (1,451 | ) |
Less: Provision charged to expense | | | (168 | ) | | (180 | ) | | (197 | ) |
| | | | | | | | | | |
Real estate acquired in settlement of loans, end of period | | $ | 6,719 | | | 7,743 | | | 600 | |
| | | | | | | | | | |
One loan relationship comprises approximately 62% of the real estate acquired in settlement of loans portfolio. With regard to this relationship, the lead bank is managing the operations of the property and is currently working with an external firm to market the property. The Bank was a 20% participant in the loan relationship and is now a 20% owner of the collateral property. Expenses related to the holding of this property within the real estate acquired in settlement of loans portfolio totaled $392 thousand during the year ended December 31, 2008. The relationship was carried at market value at December 31, 2008 based on management’s best judgment and information available at that time. Approximately $3.1 million of the $3.6 million sold from the portfolio during the year ended December 31, 2008 was related to one property with respect to which the Company realized no loss.
Management believes that it effectively manages the Company’s real estate acquired in settlement of loans, particularly considering the increasing level of foreclosures in the industry. Management believes that there will always remain a core level of delinquent loans and real estate and personal property acquired in settlement of loans from normal lending operations. In addition, in the current economic climate, the Company may experience an increase in delinquent loans and real estate and personal property acquired in settlement of loans.
SFAS No. 15, “Accounting by Debtors and Creditors for Troubled Debt Restructurings,” establishes standards of financial accounting and reporting by the debtor and the creditor for troubled debt restructurings. Additionally, it requires that adjustments in payment terms from a troubled debt restructuring generally be considered adjustments of the yield (effective interest rate) of the loan. So long as the aggregate payments (both principal and interest) to be received by the creditor are not less than the creditor’s carrying amount of the loan, the creditor recognizes no loss, but instead recognizes a lower yield over the term of the restructured debt. Similarly, the debtor recognizes no gain unless the aggregate future payments (including amounts contingently payable) are less than the debtor’s recorded liability. Troubled debt restructurings include loans with respect to which, due to deterioration in the borrower’s financial condition, the original terms have been modified in favor of the borrower or principal or interest has been forgiven. Troubled debt restructurings entered into by the Company during 2008 were reviewed by the Company to ensure loan classifications were in accordance with applicable regulations. Any allocations identified during the review based on probable losses have been included in the Company’s allowance for loan losses for the applicable period. At December 31, 2008 and 2007, the principal balance of such loans totaled $1.2 million.
Potential problem loans consist of loans that are generally performing in accordance with contractual terms but with respect to which management has concerns about the ability of the borrower to continue to comply with repayment terms because of the borrower’s potential operating or financial difficulties. Management monitors these loans closely and reviews performance on a regular basis. As of December 31, 2008, the Company had potential problem loans totaling $19.3 million that were not already categorized as nonaccrual.
Allowance for Loan Losses. Methodology. Management analyzes the adequacy of the allowance for loan losses on a monthly basis using an internal analysis model. No less than quarterly but often on a more frequent basis, the Company’s allowance for loan losses model and conclusions are reviewed and approved by senior
57
management. The allowance for loan losses is a reserve established through a provision for loan losses charged to expense. The allowance for loan losses represents management’s best estimate of probable losses that have been incurred within the existing portfolio of loans. The allowance for loan losses is necessary to reserve for estimated loan losses and risks inherent in the loan portfolio. The Company’s allowance for loan loss methodology is based on guidance provided in SAB No. 102 and includes allocations calculated in accordance with SFAS No. 114, as amended by SFAS No. 118, and allocations calculated in accordance with SFAS No. 5. Accordingly, the methodology is based on historical loss experience by type of loans, specific homogeneous risk pools, and specific loss allocations. The Company’s process for determining the appropriate level of the allowance for loan losses is designed to account for asset deterioration as it occurs. The provision for loan losses reflects loan quality trends, including the levels of and trends related to nonaccrual loans, potential problem loans, criticized loans, and net loans charged-off or recovered, among other factors.
The level of the allowance for loan losses reflects management’s continuing evaluation of specific lending risks, loan loss experience, current loan portfolio quality, present economic, political and regulatory conditions, and unidentified losses inherent in the current loan portfolio. Portions of the allowance for loan losses may be allocated for specific loans. However, the entire allowance for loan losses is available for any loan that, in management’s judgment, should be charged-off. While management utilizes its best judgment and information available to it, the ultimate adequacy of the allowance for loan losses depends on a variety of factors beyond the Company’s control, including the performance of the Company’s loan portfolio, the economy, changes in interest rates, and the view of the regulatory authorities toward loan classifications.
The Company records allowances for losses on specific loans when, based on current information and events, it is probable that the Company will be unable to collect all amounts due according to the contractual terms of the loan. Specific allowances for loans considered individually significant and that exhibit probable or observed weaknesses are determined by analyzing the borrower’s ability to repay amounts owed, collateral deficiencies, the relative risk grade of the loan, and economic conditions impacting the borrower’s industry, among other things. If, after review, a specific allowance is not assigned to the loan, and the loan is not considered to be impaired, the loan is included with a pool of similar loans that is assigned a historical allowance calculated based on historical loss experience.
Historical allowances are calculated based on the historical loss experience of specific types of loans. The Company calculates historical loss ratios for pools of similar loans with similar characteristics based on the proportion of actual loans charged-off to the total population of loans in the pool. Management is currently using a five year lookback period when computing historical loss rates to determine the allocated component of the allowance for loan losses. A historical allowance is established for each pool of similar loans based upon the product of the historical loss ratio and the total dollar amount of the loans in the pool. The Company’s pools of similar loans include similarly risk-graded groups of commercial and industrial loans, real estate loans, general consumer loans, and bankcard loans.
General allowances are based on general economic conditions and other qualitative risk factors both internal and external to the Company. In general, these allowances are determined by evaluating, among other things, the experience, ability and effectiveness of the Bank’s lending management and staff, the effectiveness of the Company’s loan policies, procedures and internal controls, changes in asset quality, changes in loan portfolio volume, the composition and concentrations of the loan portfolio, the impact of competition on loan structuring and pricing, the effectiveness of the internal loan review function, the impact of environmental risks on portfolio risks, and the impact of rising interest rates on portfolio risk.
Loans identified as losses by management, internal loan review, or bank examiners are charged-off. In addition, consumer loan accounts are charged-off based on regulatory requirements.
In addition to the Company’s portfolio review process, various regulatory agencies periodically review the Company’s allowance for loan losses. These agencies may require the Company to recognize additions to the
58
allowance for loan losses based on their judgments and information available to them at the time of their examinations. While the Company uses available information to recognize inherent losses on loans, future adjustments to the allowance for loan losses may be necessary based on changes in economic conditions and other factors and the impact of such changes and other factors on the Bank’s borrowers.
Loans held for sale are carried at the lower of cost or fair value. Typically, the carrying amount approximates fair value due to the Company’s practice of selling these loans within 60 days of origination. Therefore, these instruments are not included in the assumptions related to the allowance for loan losses model.
Impaired Loans. The following table summarizes information relative to the Company’s impaired loans at the dates and for the periods indicated (in thousands).
| | | | | |
| | | At and for the years ended
December 31, |
| | | 2008 | | 2007 |
Impaired loans, at year end | | $ | 37,468 | | 7,667 |
Impaired loans subject to specific reserve allocation, at year end | | | 21,413 | | 7,413 |
Specific allowance allocation on impaired loans, at year end | | | 4,453 | | 1,668 |
Average impaired loans | | | 22,568 | | 7,781 |
Average impaired loans are calculated using an annual simple average. As reported in the Company’s Annual Report on Form 10-K for the year ended December 31, 2007, the average balance of impaired loans during 2006 was $10.6 million.
The increase in impaired loans from December 31, 2007 to December 31, 2008 resulted from the addition of a relatively small number of large balance loan relationships. Eleven loan relationships secured by construction, land development and other land real estate totaling $19.8 million were considered impaired at December 31, 2008 while six loan relationships secured by commercial nonfarm nonresidential real estate totaling $17.7 million were considered impaired at December 31, 2008. The average impaired loan relationship at December 31, 2008 totaled $2.2 million.
One loan relationship secured by construction, land development and other land real estate totaling $1.6 million was considered impaired at December 31, 2007 while eight loan relationships secured by commercial nonfarm nonresidential real estate totaling $4.8 million and two loan relationships secured by one to four family residential real estate totaling $1.2 million were considered impaired at December 31, 2007. The average impaired loan relationship at December 31, 2007 totaled $697 thousand.
59
Activity. The following table summarizes activity within the allowance for loan losses, by FDIC code, at the dates and for the periods indicated (dollars in thousands). Loans charged-off and recovered are charged or credited to the allowance for loan losses at the time realized.
| | | | | | | | | | | | |
| | | At and for the years ended December 31, |
| | | 2008 | | | 2007 | | 2006 | | 2005 | | 2004 |
Allowance for loan losses, beginning of period | | $ | 7,418 | | | 8,527 | | 8,431 | | 7,619 | | 7,463 |
| | | | | |
Provision for loan losses | | | 5,619 | | | 988 | | 1,625 | | 2,400 | | 2,150 |
| | | | | |
Loans charged-off | | | | | | | | | | | | |
Secured by real estate | | | 16 | | | — | | — | | — | | — |
Construction, land development, and other land loans | | | | | | | | | | | | |
Farmland | | | — | | | — | | — | | — | | — |
Single-family residential | | | 367 | | | 371 | | 247 | | 415 | | 232 |
Multifamily residential | | | — | | | — | | — | | 1 | | 20 |
Nonfarm nonresidential | | | 182 | | | 496 | | 191 | | 241 | | 236 |
Commercial and industrial | | | 430 | | | 505 | | 453 | | 244 | | 549 |
General consumer and other | | | 1,174 | | | 991 | | 791 | | 891 | | 1,113 |
| | | | | | | | | | | | |
Total loans charged-off | | | 2,169 | | | 2,363 | | 1,682 | | 1,792 | | 2,150 |
Recoveries | | | | | | | | | | | | |
Secured by real estate | | | | | | | | | | | | |
Construction, land development, and other land loans | | | — | | | — | | — | | — | | — |
Farmland | | | — | | | — | | — | | — | | — |
Single-family residential | | | 11 | | | 39 | | 15 | | — | | — |
Multifamily residential | | | — | | | — | | — | | — | | — |
Nonfarm nonresidential | | | 9 | | | 13 | | 6 | | 35 | | 4 |
Commercial and industrial | | | 18 | | | 54 | | 37 | | 35 | | 49 |
General consumer and other | | | 94 | | | 160 | | 95 | | 134 | | 103 |
| | | | | | | | | | | | |
Total recoveries | | | 132 | | | 266 | | 153 | | 204 | | 156 |
| | | | | | | | | | | | |
Net loans charged-off | | | 2,037 | | | 2,097 | | 1,529 | | 1,588 | | 1,994 |
| | | | | | | | | | | | |
Allowance for loan losses, end of period | | $ | 11,000 | | | 7,418 | | 8,527 | | 8,431 | | 7,619 |
| | | | | | | | | | | | |
Average loans (1) | | $ | 1,107,007 | | | 986,518 | | 895,062 | | 828,545 | | 725,555 |
Ending loans (1) | | | 1,158,480 | | | 1,044,770 | | 945,913 | | 866,181 | | 773,254 |
Nonaccrual loans | | | 42,968 | | | 4,810 | | 6,999 | | 9,913 | | 2,323 |
Net loans charged-offs as a percentage of average loans (1) | | | 0.18 | % | | 0.21 | | 0.17 | | 0.19 | | 0.27 |
Allowance for loan losses as a percentage of ending loans (1) | | | 0.95 | | | 0.71 | | 0.90 | | 0.97 | | 0.99 |
Allowance for loan losses as a percentage of nonaccrual loans | | | 25.60 | | | 154.22 | | 121.83 | | 85.05 | | 327.98 |
60
The following table summarizes the allocation of the allowance for loan losses at December 31, 2008, by FDIC code (dollars in thousands).
| | | | | | | | | |
| | | Allowance
allocation ($) | | Allowance
allocation | | | % of loans to
loans, gross | |
Secured by real estate | | | | | | | | | |
Construction, land development, and other land loans | | $ | 4,387 | | 39.9 | % | | 20.3 | % |
Farmland | | | 1 | | — | | | 0.1 | |
Single-family residential | | | 528 | | 4.8 | | | 18.8 | |
Multifamily residential | | | 39 | | 0.4 | | | 3.1 | |
Nonfarm nonresidential | | | 4,069 | | 37.0 | | | 44.1 | |
Commercial and industrial | | | 511 | | 4.6 | | | 6.4 | |
Obligations of states and political subdivisions of the U.S. | | | — | | — | | | 0.2 | |
General consumer | | | — | | — | | | 5.2 | |
Credit line | | | 729 | | 6.6 | | | 0.5 | |
Bankcards | | | — | | — | | | 1.1 | |
Others | | | 337 | | 3.1 | | | 0.2 | |
Unallocated | | | 399 | | 3.6 | | | — | |
| | | | �� | | | | | |
Total allowance | | $ | 11,000 | | 100.0 | % | | 100.0 | % |
| | | | | | | | | |
The provision for loan losses reflects loan quality trends, including the levels of and trends related to nonaccrual loans, potential problem loans, criticized loans, and net loans charged-off or recovered, among other factors. The provision for loan losses also reflects the totality of actions taken on all loans for a particular period. Management believes that the current economic and real estate market conditions will result in elevated credit costs.
Management believes that its allowance for loan losses at December 31, 2008 is appropriate and adequate to cover current losses in the loan portfolio. However, underlying assumptions may be impacted in future periods by changes in economic conditions, the impact of regulatory examinations, and the discovery of information with respect to borrowers, which was not known to management at the time of the issuance of the Company’s Consolidated Financial Statements. Therefore, management’s assumptions may or may not prove valid. Thus, there can be no assurance that loan losses in future periods will not exceed the current allowance for loan losses amount or that future increases in the allowance for loan losses will not be required. Additionally, no assurance can be given that management’s ongoing evaluation of the loan portfolio, in light of changing economic conditions and other relevant factors, will not require significant future additions to the allowance for loan losses, thus adversely impacting the Company’s business, financial condition, results of operations, and cash flows.
Deposit Activities
Traditional deposit accounts have historically been the primary source of funds for the Company. Traditional deposit accounts also provide a customer base for the sale of additional financial products and services and fee income through service charges. The Company sets targets for growth in deposit accounts annually in an effort to increase the number of products per banking relationship. Deposits are attractive sources of funding because of their stability and generally low cost as compared with other funding sources.
61
The following table summarizes the Company’s traditional deposit composition at the dates indicated (dollars in thousands).
| | | | | | | | | | | | | | | | | | | | | | |
| | | December 31, |
| | | 2008 | | | 2007 | | 2006 | | 2005 | | 2004 |
| | | Total | | % of total | | | Total | | % of total | | Total | | % of total | | Total | | % of total | | Total | | % of total |
Noninterest-bearing transaction deposit accounts | | $ | 133,248 | | 12.5 | % | | 135,111 | | 12.8 | | 133,623 | | 13.4 | | 131,157 | | 14.5 | | 124,489 | | 15.0 |
Interest-bearing transaction deposit accounts | | | 364,315 | | 34.0 | | | 387,248 | | 36.6 | | 313,613 | | 31.6 | | 220,472 | | 24.4 | | 185,072 | | 22.4 |
| | | | | | | | | | | | | | | | | | | | | | |
Transaction deposit accounts | | | 497,563 | | 46.5 | | | 522,359 | | 49.4 | | 447,236 | | 45.0 | | 351,629 | | 38.9 | | 309,561 | | 37.4 |
Money market deposit accounts | | | 93,746 | | 8.8 | | | 118,681 | | 11.2 | | 124,874 | | 12.6 | | 111,380 | | 12.4 | | 95,608 | | 11.6 |
Savings deposit accounts | | | 36,623 | | 3.4 | | | 34,895 | | 3.3 | | 41,887 | | 4.2 | | 45,360 | | 5.0 | | 44,972 | | 5.4 |
Time deposit accounts | | | 442,347 | | 41.3 | | | 382,859 | | 36.1 | | 379,584 | | 38.2 | | 395,014 | | 43.7 | | 377,306 | | 45.6 |
| | | | | | | | | | | | | | | | | | | | | | |
Total traditional deposit accounts | | $ | 1,070,279 | | 100.0 | % | | 1,058,794 | | 100.0 | | 993,581 | | 100.0 | | 903,383 | | 100.0 | | 827,447 | | 100.0 |
| | | | | | | | | | | | | | | | | | | | | | |
Management does not believe that its dependence on traditional deposit account funding changed materially from December 31, 2007 to December 31, 2008. At December 31, 2008, traditional deposit accounts as a percentage of liabilities were 85.3% compared with 93.0% at December 31, 2007. The decline in the percentage of funding provided by traditional deposit accounts during 2008 resulted in the Company relying more heavily on alternative funding sources from which to fund a portion of loan demand.
62
The table set forth below summarizes the average balances of interest-bearing traditional deposit accounts by type and the weighted average rates paid thereon for the periods indicated (dollars in thousands).
| | | | | | | | | | | | | | | | | | | | |
| | | For the years ended December 31, |
| | | 2008 | | | 2007 | | 2006 |
| | | Average
balance | | Interest
expense | | Weighted
average
rate paid | | | Average
balance | | Interest
expense | | Weighted
average
rate paid | | Average
balance | | Interest
expense | | Weighted
average
rate paid |
Transaction deposit accounts | | $ | 374,382 | | 4,966 | | 1.33 | % | | 358,118 | | 10,152 | | 2.83 | | 263,476 | | 5,424 | | 2.06 |
Money market deposit accounts | | | 105,834 | | 1,922 | | 1.82 | | | 115,563 | | 3,977 | | 3.44 | | 125,396 | | 3,979 | | 3.17 |
Savings deposit accounts | | | 37,692 | | 129 | | 0.34 | | | 40,184 | | 139 | | 0.35 | | 45,239 | | 147 | | 0.32 |
Time deposit accounts | | | 400,516 | | 16,677 | | 4.16 | | | 360,025 | | 15,964 | | 4.43 | | 387,939 | | 15,430 | | 3.98 |
| | | | | | | | | | | | | | | | | | | | |
Total interest-bearing traditional deposit accounts | | $ | 918,424 | | 23,694 | | 2.58 | % | | 873,890 | | 30,232 | | 3.46 | | 822,050 | | 24,980 | | 3.04 |
| | | | | | | | | | | | | | | | | | | | |
Jumbo Time Deposit Accounts. Jumbo time deposit accounts are accounts with balances totaling $100,000 or greater at the date indicated. Jumbo time deposit accounts totaled 16.2% of total interest-bearing liabilities at December 31, 2008. The following table summarizes the Company’s jumbo time deposit accounts by maturity at December 31, 2008 (in thousands).
| | | |
Three months or less | | $ | 59,287 |
Over three months through six months | | | 24,954 |
Over six months through twelve months | | | 40,592 |
| | | |
Twelve months or less | | | 124,833 |
Over twelve months | | | 55,250 |
| | | |
Total jumbo time deposit accounts | | $ | 180,083 |
| | | |
Jumbo time deposit accounts totaled $150.4 million at December 31, 2007. Management believes the temporary increase in FDIC insurance for deposited funds, the volatility in the financial stock markets, and targeted promotions contributed to the increase in jumbo time deposit accounts from December 31, 2007 to December 31, 2008.
Borrowing Activities
In addition to traditional deposit accounts, the Company borrows funds to assist in meeting deposit withdrawal requirements and to fund growth of interest-earning assets in excess of traditional deposit growth.
Borrowings as a percentage of total liabilities increased from 5.69% at December 31, 2007 to 14.0% at December 31, 2008. Management believes this increased reliance on borrowed funds resulted primarily from traditional deposit accounts being inadequate to fund asset growth.
63
The following table summarizes the Company’s borrowings composition at the dates indicated (dollars in thousands).
| | | | | | | | | | |
| | | December 31, 2008 | | | December 31, 2007 |
| | | Total | | % of total | | | Total | | % of total |
Retail repurchase agreements | | $ | 16,357 | | 9.3 | % | | 11,280 | | 16.7 |
Commercial paper | | | 27,955 | | 15.9 | | | 26,326 | | 38.9 |
| | | | | | | | | | |
Total nontraditional deposit accounts | | | 44,312 | | 25.2 | | | 37,606 | | 55.6 |
Other short-term borrowings | | | 79,785 | | 45.3 | | | 30,000 | | 44.4 |
Long-term borrowings | | | 52,000 | | 29.5 | | | — | | — |
| | | | | | | | | | |
Total wholesale funding | | | 131,785 | | 74.8 | | | 30,000 | | 44.4 |
| | | | | | | | | | |
Total borrowed funds | | $ | 176,097 | | 100.0 | % | | 67,606 | | 100.0 |
| | | | | | | | | | |
The following table provides further detail with respect to the Company’s borrowings composition at the dates and for the periods indicated (dollars in thousands).
| | | | | | | | |
| | | At and for the years ended
December 31, |
| | | 2008 | | | 2007 | | 2006 |
Retail repurchase agreements | | | | | | | | |
Amount outstanding at year-end | | $ | 16,357 | | | 11,280 | | 14,427 |
Average amount outstanding during year | | | 18,063 | | | 13,347 | | 17,639 |
Maximum amount outstanding at any month-end | | | 21,817 | | | 13,772 | | 23,344 |
Rate paid at year-end* | | | 0.25 | % | | 2.63 | | 3.63 |
Weighted average rate paid during the year | | | 1.37 | | | 4.04 | | 4.14 |
| | | |
Commercial paper | | | | | | | | |
Amount outstanding at year-end | | $ | 27,955 | | | 26,326 | | 20,988 |
Average amount outstanding during year | | | 32,415 | | | 27,295 | | 21,009 |
Maximum amount outstanding at any month-end | | | 37,487 | | | 32,667 | | 25,720 |
Rate paid at year-end* | | | 0.25 | % | | 2.81 | | 3.81 |
Weighted average rate paid during the year | | | 1.11 | | | 4.07 | | 4.13 |
| | | |
Other short-term borrowings—federal funds purchased from correspondent banks | | | | | | | | |
Amount outstanding at year-end | | $ | 35,785 | | | 18,000 | | 6,000 |
Average amount outstanding during year | | | 13,240 | | | 3,610 | | 847 |
Maximum amount outstanding at any month-end | | | 38,171 | | | 18,000 | | 6,000 |
Rate paid at year-end | | | 0.68 | % | | 4.32 | | 5.50 |
Weighted average rate paid during the year | | | 2.27 | | | 5.50 | | 5.19 |
| | | |
Other short-term borrowings—FHLB | | | | | | | | |
Amount outstanding at year-end | | $ | 44,000 | | | 12,000 | | — |
Average amount outstanding during year | | | 35,303 | | | 9,426 | | 2,140 |
Maximum amount outstanding at any month-end | | | 59,000 | | | 24,000 | | 10,900 |
Rate paid at year-end | | | 0.46 | % | | 4.56 | | — |
Weighted average rate paid during the year | | | 2.29 | | | 5.36 | | 4.63 |
| | | |
Long-term borrowings—FHLB | | | | | | | | |
Amount outstanding at year-end | | $ | 52,000 | | | — | | 10,000 |
Average amount outstanding during year | | | 41,415 | | | 4,521 | | 15,841 |
Maximum amount outstanding at any month-end | | | 52,000 | | | 10,000 | | 23,000 |
Rate paid at year-end | | | 2.90 | % | | — | | 3.85 |
Weighted average rate paid during the year | | | 2.89 | | | 3.83 | | 3.64 |
| * | | Rates paid are tiered based on level of deposit. Rate presented represents the average rate for all tiers offered at year-end. |
64
The Federal Reserve influences the general market rates of interest paid on interest-bearing liabilities. The Company’s borrowings portfolio is impacted by changes in the intended federal funds interest rate. The following table summarizes the actions taken by the Federal Reserve with regard to the intended federal funds interest rate for the three year period ended December 31, 2008.
| | | |
| | | Federal funds rate | |
Rate, at December 31, 2005 | | 4.25 | % |
Increases in rate | | 1.00 | |
| | | |
Rate, at December 31, 2006 | | 5.25 | |
Decreases in rate | | (1.00 | ) |
| | | |
Rate, at December 31, 2007 | | 4.25 | |
Decreases in rate | | (4.00-4.25 | ) |
| | | |
Rate, at December 31, 2008 | | 0-0.25 | % |
| | | |
Commercial Paper. The Company offers commercial paper as an alternative investment tool for its commercial customers. Through a master note arrangement between Palmetto Bancshares and the Bank, Palmetto Master Notes are issued as an alternative investment for commercial sweep accounts. These master notes are unsecured but are backed by the full faith and credit of Palmetto Bancshares. The commercial paper is issued only in conjunction with deposits in the Bank’s automated sweep accounts.
Wholesale Funding. The Company has found wholesale funding to be a logical answer to funding growth of interest-earning assets when other funding sources prove inadequate. Wholesale funding options include federal funds lines from correspondent banks and FHLB advances. Such funding provides the Company with the ability to access the exact type of funding needed, at the exact time, in the exact quantity, and at market rates. This provides the Company with the flexibility to tailor borrowings to its specific needs. Wholesale funding utilization may be categorized as either other short-term borrowings or long-term borrowings depending on maturity terms. Wholesale short-term borrowings are those having maturities less than one year when executed. Long-term borrowings are those having maturities greater than one year when executed. Interest rates on such borrowings vary from time to time in response to general economic conditions.
Federal Funds Accommodations. In addition to short-term FHLB borrowings, other short-term borrowings include federal funds purchasing activities that represent day-to-day unsecured lending of excess reserve funds between banks. If the Bank needs funds to meet its obligations, it can purchase the excess funds of a correspondent bank. The primary federal funds purchased market is overnight but maturities may extend a few days or weeks. During the first quarter of 2008, a correspondent bank increased the Bank’s existing federal funds accommodation by $5 million. During the third quarter of 2008, the Company terminated one of its correspondent banking relationships, thereby reducing its overall federal funds accommodation by $5 million. Additionally, during the fourth quarter of 2008, two correspondent banks increased the Bank’s existing federal funds accommodation by $7.5 million, and an additional correspondent bank extended the Bank an unsecured discretionary federal funds accommodation in the amount of $10 million.
The following table summarizes the Company’s federal funds accommodations utilization and availability at the dates indicated (in thousands).
| | | | | | | |
| | | December 31, | |
| | | 2008 | | | 2007 | |
Available federal funds accommodation sources | | $ | 67,500 | | | 50,000 | |
Utilized federal funds accommodation sources | | | (35,785 | ) | | (18,000 | ) |
| | | | | | | |
Available federal funds accommodation sources | | $ | 31,715 | | | 32,000 | |
| | | | | | | |
65
FHLB Borrowings. FHLB borrowings are a source of funding that the Company may utilize if it has unused FHLB borrowing capacity and collateral to secure FHLB borrowings.
The FHLB generally establishes credit availability for each creditworthy institution. Credit availability is not a formal commitment to extend credit but an indication of the amount of credit the FHLB is willing to extend to a borrower. The FHLB monitors each borrower’s credit availability on a periodic basis and may make adjustments to the credit availability as needed. The amount of a borrower’s credit availability depends on a number of factors, including, but not limited to, the continued financial soundness of the borrower and the adequacy of the amount of collateral available to secure new advances. The FHLB, in its sole discretion, may rescind a borrower’s credit availability at any time.
The FHLB has generally established an overall credit limit for each borrower. This limit is designed to limit the FHLB’s credit exposure with respect to an individual borrower, while encouraging borrowers to diversify funding sources. Generally, this credit limit may not exceed 50 percent of the borrower’s total assets. In addition, a borrower’s eligibility to borrow in excess of 30 percent of assets is subject to eligibility criteria outlined in the FHLB’s Credit and Collateral Policy. The Company’s current credit availability is 20% of total assets. The Company may utilize 100% of this availability for advances convertible from variable to fixed.
To borrow from the FHLB, members must pledge collateral to secure advances and letters of credit. Acceptable collateral includes a variety of single-family residential loans, commercial real estate loans, home equity lines of credit, and multifamily residential loans as well as a number of types of securities.
The following table summarizes the Company’s FHLB borrowed funds utilization and availability at the dates indicated (in thousands).
| | | | | | | |
| | | December 31, | |
| | | 2008 | | | 2007 | |
Available lendable loan collateral value to serve against FHLB advances | | $ | 159,060 | | | 105,535 | |
Available lendable investment security collateral value to serve against FHLB advances | | | 37,481 | | | — | |
Advances and letters of credit outstanding: | | | | | | | |
Short-term advances | | | (44,000 | ) | | (12,000 | ) |
Long-term advances | | | (52,000 | ) | | — | |
Letters of credit | | | (69,000 | ) | | (69,000 | ) |
| | | | | | | |
Total advances and letters of credit outstanding | | | (165,000 | ) | | (81,000 | ) |
| | | | | | | |
Available lendable collateral value to serve against FHLB advances | | $ | 31,541 | | | 24,535 | |
| | | | | | | |
FHLB letters of credit provide an attractive alternative to traditional collateral. FHLB letters of credit are attractive because they enhance member liquidity (substituting letters of credit for securities as collateral for public unit deposits) and because residential mortgage loans can be used as collateral for letters of credit. However, using FHLB letters of credit reduces the Company’s available credit based on qualifying loans to serve as collateral. The Company uses the FHLB letter of credit for collateralization of public deposits.
The following table summarizes the Company’s long-term FHLB borrowing advances at December 31, 2008 (dollars in thousands). The Company’s long-term FHLB advances do not have embedded call options.
| | | | | | | | | | | | |
| | | | | | | | | | | | Total |
Balance | | $ | 5,000 | | | 12,000 | | 30,000 | | 5,000 | | 52,000 |
Interest rate | | | 2.57 | % | | 2.75 | | 2.89 | | 3.61 | | 2.90 |
Maturity date | | | 3/8/2010 | | | 4/2/2010 | | 3/7/2011 | | 4/2/2013 | | |
The FHLB may assess fees and charges to cover costs relating to the receipt, holding, redelivery, and reassignment of the Company’s collateral. The FHLB publishes a schedule of these fees and charges on its
66
website. In addition, the FHLB may assess fees to cover collateral verification reviews performed by, or on behalf of, the FHLB. Historically, any such fees have not been significant nor does the Company anticipate such future fees, if assessed, will be significant.
Any FHLB advance with a fixed interest rate is subject to a prepayment fee in the event of full or partial repayment prior to maturity or the expiration of any interim interest rate period. Historically, the Company has not made full or partial repayment prior to maturity or the expiration of any interim interest rate period.
Capital
General. The following table summarizes capital key performance indicators at the dates and for the periods indicated (dollars in thousands, except common and per share data).
| | | | | | |
| | | At and for the years ended
December 31, |
| | | 2008 | | | 2007 |
Total shareholders’ equity | | $ | 115,776 | | | 110,256 |
Average shareholders’ equity | | | 116,222 | | | 106,615 |
| | |
Total shareholders’ equity as a percentage of total assets | | | 8.5 | % | | 8.8 |
Average shareholders’ equity as a percentage of average total assets | | | 8.8 | | | 9.0 |
| | |
Cash dividends per common share | | $ | 0.80 | | | 0.77 |
Dividend payout ratio | | | 37.89 | % | | 30.76 |
The Company’s dividend payout ratio calculates the percentage of income paid to shareholders in the form of dividends.
Accumulated Other Comprehensive Loss. The following table summarizes the components of accumulated other comprehensive loss, for the periods indicated (in thousands).
| | | | | | | | | | | | | | | | |
| | | Impact
of SFAS
No. 158 | | | Impact of
curtailment | | | Total
impact of
defined
benefit
pension
plan | | | Impact of
investment
securities
available
for sale | | | Total | |
Accumulated other comprehensive income (loss), after income tax impact, December 31, 2006 | | $ | — | | | — | | | — | | | (695 | ) | | (695 | ) |
Accumulated other comprehensive income (loss), before income tax impact | | $ | (6,334 | ) | | 2,508 | | | (3,826 | ) | | 720 | | | (3,106 | ) |
Income tax impact | | | 2,218 | | | (878 | ) | | 1,340 | | | (277 | ) | | 1,063 | |
| | | | | | | | | | | | | | | | |
Accumulated other comprehensive income (loss), after income tax impact | | $ | (4,116 | ) | | 1,630 | | | (2,486 | ) | | 443 | | | (2,043 | ) |
| | | | | | | | | | | | | | | | |
Accumulated other comprehensive income (loss), after income tax impact, December 31, 2007 | | $ | (4,116 | ) | | 1,630 | | | (2,486 | ) | | (252 | ) | | (2,738 | ) |
| | | | | | | | | | | | | | | | |
Accumulated other comprehensive income (loss), before income tax impact | | $ | (3,092 | ) | | — | | | (3,092 | ) | | (2,201 | ) | | (5,293 | ) |
Income tax impact | | | 1,082 | | | — | | | 1,082 | | | 832 | | | 1,914 | |
| | | | | | | | | | | | | | | | |
Accumulated other comprehensive income (loss), after income tax impact | | $ | (2,010 | ) | | — | | | (2,010 | ) | | (1,369 | ) | | (3,379 | ) |
| | | | | | | | | | | | | | | | |
Accumulated other comprehensive income (loss), after income tax impact, December 31, 2008 | | $ | (6,126 | ) | | 1,630 | | | (4,496 | ) | | (1,621 | ) | | (6,117 | ) |
| | | | | | | | | | | | | | | | |
67
Regulatory Capital Requirements. The Company and the Bank are required to meet regulatory capital requirements that currently include several measures of capital. As of December 31, 2008, the Company and the Bank were categorized as well capitalized under the regulatory framework based on the most recent notification from federal banking agencies.
Derivative Activities
The Company uses derivatives to manage exposure to risk and to assist customers with their risk management objectives. Derivative transactions are measured in terms of the notional amount, but this amount is not, when viewed in isolation, a meaningful measure of the risk profile of the instruments. The notional amount is generally not exchanged, but is used only as the basis on which interest and other payments are determined. The Company’s approach to managing interest rate risk includes the use of derivatives.
The Company offers derivatives to its customers but usually offsets exposure from such contracts by purchasing other financial contracts. The customer accommodations and any offsetting financial contracts are treated as freestanding derivatives. To a lesser extent, the Company takes positions based on market expectations or to benefit from price differentials between financial instruments and markets.
The Company uses freestanding derivatives to hedge the risk of changes in derivative loan commitments, with the resulting gain or loss reflected in income. Interest rate lock commitments for residential mortgage loans that the Company intends to sell are considered freestanding derivatives. The Company’s interest rate exposure on these derivative loan commitments is hedged with freestanding derivatives such as forwards contracts. The commitments and freestanding derivatives are carried at fair value with changes in fair value, if material, included in income. For interest rate lock commitments issued prior to January 1, 2008, the Company recorded a zero fair value for the derivative loan commitment at inception consistent with SAB No. 105, “Application of Accounting Principles to Loan Commitments.” Effective January 1, 2008, the Company was required by SAB No. 109, “Written Loan Commitments Recorded at Fair Value Through Earnings,” to include, at inception and during the life of the loan commitment, the expected net future cash flows related to the associated servicing of the loan as part of the fair value measurement of derivative loan commitments. The implementation of SAB No. 109 did not have a material impact on the Company’s financial position, results of operations, or cash flows or the valuation of its loan commitments. Changes subsequent to inception are based on changes in fair value of the underlying loan resulting from the exercise of the commitment and changes in the probability that the loan will not fund within the terms of the commitment (referred to as a fall-out factor). The value of the underlying loan is impacted primarily by changes in interest rates and the passage of time. However, changes in investor demand, such as concerns about credit risk, can also cause changes in the spread relationships between underlying loan value and the derivative financial instruments that cannot be hedged. The aggregate fair value of derivative loan commitments and freestanding derivatives at December 31, 2008 and 2007 were immaterial.
To a lesser extent, the Company takes positions based on market expectations or to benefit from price differentials between financial instruments and markets. These derivatives are not linked to specific assets and liabilities in the Consolidated Balance Sheet or to forecasted transactions in an accounting hedge relationship and, therefore, do not qualify for hedge accounting. The Company may also enter into freestanding derivatives for risk management that do not otherwise qualify for hedge accounting. If applicable, such derivatives are carried at fair value with changes in fair value recorded as part of income.
Liquidity
General
Liquidity measures the Company’s ability to meet current and future cash flow needs as they become due. The liquidity of a financial institution reflects its ability to accommodate possible outflows in deposit accounts, meet loan requests and commitments, maintain reserve requirements, pay operating expenses, provide funds for dividends and debt service, manage operations on an ongoing basis, capitalize on new business opportunities, and
68
take advantage of interest rate market opportunities. The ability of a financial institution to meet its current financial obligations is a function of its balance sheet structure, its ability to liquidate assets, and its access to alternative sources of funds. The Company seeks to ensure its funding needs are met by maintaining a level of liquid funds through balance sheet management.
Asset liquidity is provided by liquid assets which are readily marketable or pledgeable or which will mature in the near future. The Company’s liquid assets include cash, interest-bearing deposits in banks, investment securities available for sale, and federal funds sold. Liability liquidity is provided by access to funding sources, which include deposits and borrowed funds. Each of the Company’s sources of liquidity is subject to various factors beyond the control of the Company.
Cash Flow Needs
In the normal course of business, the Company enters into various transactions, some of which, in accordance with accounting principles generally accepted in the U.S., are not recorded in its Consolidated Balance Sheets. These transactions may involve, to varying degrees, elements of credit risk and interest rate risk in excess of the amounts recognized in the Consolidated Balance Sheets, if any.
Lending Commitments. Unused lending availability is not recorded in the Company’s Consolidated Balance Sheets until funds are advanced. For commercial customers, lending commitments generally take the form of unused revolving credit arrangements to finance customers’ working capital requirements. For retail customers, lending commitments are generally unused lines of credit secured by residential property. At December 31, 2008, unused lending availability totaled $286.7 million.
Standby Letters of Credit. Standby letters of credit represent an obligation of the Company to a third party contingent upon the failure of the Company’s customer to perform under the terms of an underlying contract with the third party or an obligation of the Company to guarantee or stand as surety for the benefit of the third party. Under the terms of a standby letter of credit, generally, drafts will be drawn only when the underlying event fails to occur. The Company has legal recourse to its customers for amounts paid, and these obligations can be secured or unsecured depending on the customers’ creditworthiness. Commitments under standby letters of credit are typically for one year or less. The Company applies the same credit standards used in the lending process when extending letters of credit and evaluates its obligation to perform as a guarantor and records liabilities as deemed necessary. At December 31, 2008, the Company recorded no liability for its obligation to perform as a guarantor under standby letters of credit. The maximum potential amount of undiscounted future payments related to standby letters of credit at December 31, 2008 was $8.6 million compared with $11.2 million at December 31, 2007. Past experience indicates that standby letters of credit will expire unused. However, through its various sources of liquidity, the Company believes that it has the resources available to meet these obligations should the need arise. Additionally, the Company does not believe that the current fair value of such guarantees was material at December 31, 2008.
Derivatives.See Derivatives, included elsewhere in this item, for further discussion regarding the Company’s off-balance sheet arrangements and commitments related to its derivative loan commitments and freestanding derivatives.
Dividend Obligations. The holders of the Company’s common stock are entitled to receive dividends, when and if declared by the Company’s Board of Directors, out of funds legally available for such dividends. Palmetto Bancshares is a legal entity separate and distinct from the Bank and depends on the payment of dividends from the Bank. Palmetto Bancshares and the Bank are subject to regulatory policies and requirements relating to the payment of dividends, including requirements to maintain adequate capital above regulatory minimums. The appropriate federal regulatory authorities are authorized to determine under certain circumstances that the payment of dividends by a bank holding company or a bank would be an unsafe or unsound practice and to prohibit payment of those dividends. The appropriate federal regulatory authorities have indicated that banking
69
organizations should generally pay dividends only out of current income. In addition, as a South Carolina chartered bank, the Bank is subject to legal limitations on the amount of dividends it is permitted to pay.
For the years ended December 31, 2008 and 2007, cash dividends were declared by the Company’s Board of Directors and paid totaling $5.2 million, or $0.80 per common share, and $4.9 million, or $0.77 per common share, respectively. The Company has historically paid dividends on a quarterly basis. These dividends equate to dividend payout ratios of 37.89% and 30.76% for the same periods. The Company’s dividend payout ratio calculates the percentage of income paid to shareholders in the form of dividends. The Company’s Board of Directors is currently committed to continuing to pay regular cash dividends. However, there can be no assurance as to future dividends because they are dependent on the Company’s financial condition, results of operations, cash flows, as well as capital and dividend regulations.
Long-Term Contractual Obligations. In addition to the contractual commitments and arrangements previously described, which, depending on the nature of the obligation, may or may not require use of the Company’s resources, the Company enters into other contractual obligations in the ordinary course of business. The following table summarizes these contractual obligations at December 31, 2008 (in thousands) except obligations for employee benefit plans. See Item 8. Financial Statements and Supplementary Data, Note 12 for further discussion regarding the Company’s employee benefit plans.
| | | | | | | | | | | |
Other contractual obligations | | Less than
one year | | Over one
through
three
years | | Over
three
through
five years | | Over five
years | | Total |
Real property operating lease obligations | | $ | 1,842 | | 3,759 | | 3,288 | | 15,871 | | 24,760 |
Time deposit accounts | | | 300,621 | | 137,531 | | 3,071 | | 1,124 | | 442,347 |
Long-term borrowings | | | — | | 47,000 | | 5,000 | | — | | 52,000 |
| | | | | | | | | | | |
Total other contractual obligations | | $ | 302,463 | | 188,290 | | 11,359 | | 16,995 | | 519,107 |
| | | | | | | | | | | |
Obligations under noncancelable real property operating lease agreements noted above are payable over several years with the longest obligation expiring in 2029. Option periods that the Company has not yet exercised are not included in the preceding table.
Real property operating lease obligations summarized in the preceding table:
| | • | | Are net of payments to be received under a sublease agreement with a third party with regard to the Company’s previous Blackstock Road banking office for which it is contracted under a lease agreement as Lessee. |
| | • | | Include obligations with regard to three banking offices that were consolidated during 2008 that are leased by the Company. Management is considering options with regard to these leased locations. |
| | • | | Include obligations through June 2009, the end of the contractual lease period, with regard to the Greer banking office existing at December 31, 2008. |
| | • | | Do not include periodic increases in lease payments for the Rock Hill operating building lease and operating lease for additional office space. Lease payment increases for periods subsequent to February 2009 cannot be determined as lease payments depend on consumer price index changes. Management does not believe that future minimum lease payments relative to these locations will significantly differ from current obligations at December 31, 2008. Therefore, current lease obligations have been used to determine the operating lease obligations in the preceding table. Obligations under these operating lease agreements are payable over several years with the building lease expiring in 2015 and the additional office space lease expiring in 2011. |
| | • | | Do not include the additional office space and parking leases in downtown Greenville which are paid month-to-month during construction of the Company’s new downtown Greenville banking office as |
70
| | there are no written contractual obligation continuing into 2009. However, the Company does believe it will continue to lease parking spaces once the headquarters is complete and the new lease agreement is in effect. |
The Company will relocate its corporate headquarters to downtown Greenville, South Carolina during March 2009. During 2007, the Company executed a build-to-suit operating lease agreement in conjunction with its new corporate headquarters. Under the terms of the lease agreement, the Lessor will purchase from the Bank two parcels of land and improvements thereon adjacent to the Lessor’s land (one of which houses the temporary downtown Greenville banking office during construction). The Lessor will combine the original premises and the newly purchased lessee property and will complete site work, construct improvements, and lease the resulting premises to the Company under the terms and conditions of the 2007 lease agreement. During construction of the corporate headquarters in 2008, the Company has continued to pay operating lease payments on a month-to-month basis with the Lessor with regard to its previous downtown Greenville banking office. Upon occupancy, these lease payments will be replaced with those required by the build-to-suit operating lease agreement dated May 2, 2007. For purposes of the preceding table, the Company has assumed occupancy during March 2009. Therefore, the real property operating lease obligations in the preceding table include the Company’s obligations to the real property operating lease related to the new corporate headquarters beginning in March 2009 and the old corporate headquarters until that time.
Building and ground lease rental expenses related to the Company’s corporate offices, banking offices, nonbanking office automatic teller machine locations, Palmetto Capital independent offices, and other properties totaled $912 thousand, $824 thousand, and $744 thousand for the years ended December 31, 2008, 2007, and 2006, respectively. Offsetting this expense were sublease payments totaling $18 thousand for the years ended December 31, 2008 and 2007 and $55 thousand for the year ended December 31, 2006.
The Company enters into agreements with third parties with respect to the leasing, servicing, and maintenance of equipment. However, because the Company believes that these agreements are immaterial when considered individually, or in the aggregate, with regard to the Company’s Consolidated Financial Statements, the Company has not included such agreements in the preceding contractual obligations table. Therefore, management believes that noncompliance with terms of such agreements would not have a material impact on the Company’s business, financial condition, results of operations, and cash flows. Furthermore, as most such commitments are entered into for a 12-month period with option extensions, long-term obligations beyond 2009 cannot be reasonably estimated at this time.
Short-Term Contractual and Noncontractual Obligations. The Company enters into binding agreements for property services (with regard to construction). However, those premises and equipment commitments are considered to be short-term in nature because they do not extend over more than one year.
The Company anticipates that it will spend approximately $4 million, a portion of which is contractual, with regard to the upfitting of the new corporate headquarters facility, of which approximately $425 thousand had been spent as of December 31, 2008. The Company expects remaining obligations to be funded during the first quarter of 2009.
During 2008, the Bank purchased property at the intersection of West Wade Hampton Boulevard and Middleton Way in Greenville County on which to construct and relocate its existing Greer banking office. The Company expects to celebrate its grand opening during the second quarter of 2009. The Company estimates that this relocation, including premises, furnishings, and equipment, will cost between $2 million and $2.5 million of which, at December 31, 2008, the Company had expended approximately $1.5 million. The remaining costs, which are comprised of both contractual and noncontractual obligations, are expected to be expended prior to the branch office’s opening.
71
In addition to the short-term contractual and noncontractual capital expenditures anticipated during 2009 described above, annually, in conjunction with the Company’s budgeting process, capital expenditures are approved for the coming year. During the budgeting process for 2009, the Board of Directors approved $1.5 million in capital expenditures. Approved expenditures include expenditures with regard to the upkeep and maintenance of existing properties and upgrades to the Company’s information systems. Generally, purchase obligations are not made in advance of such purchases. In addition, management anticipates that expenditures will be required during 2009 that could not have been expected and, therefore, were not approved in the budgeting process. Funds to fulfill both budgeted and nonbudgeted commitments will come from operational cash flows of the Company.
Although the Company expects to make capital expenditures in years subsequent to 2009, capital expenditures are reviewed by management on an annual basis. Therefore, the Company cannot estimate such capital expenditures obligations for years subsequent to 2009.
72
Income Review
Overview
PALMETTO BANCSHARES, INC. AND SUBSIDIARY
Consolidated Statements of Income
(dollars in thousands, except common and per share data)
| | | | | | | | | | | | | | |
| | | For the years ended December 31, | | 2008 to 2007 comparison | |
| | | | | Dollar
variance | | | Percent
variance | |
| | | 2008 | | | 2007 | | 2006 | | |
Interest income | | | | | | | | | | | | | | |
Interest earned and fees on loans | | $ | 72,036 | | | 78,412 | | 70,339 | | (6,376 | ) | | (8.1 | )% |
Interest earned on investment securities available for sale | | | 6,010 | | | 4,392 | | 4,852 | | 1,618 | | | 36.8 | |
Dividends earned on FHLB stock | | | 189 | | | 155 | | 184 | | 34 | | | 21.9 | |
Other | | | 106 | | | 678 | | 1,071 | | (572 | ) | | (84.4 | ) |
| | | | | | | | | | | | | | |
Total interest income | | | 78,341 | | | 83,637 | | 76,446 | | (5,296 | ) | | (6.3 | ) |
| | | | | |
Interest expense | | | | | | | | | | | | | | |
Interest paid on deposits | | | 23,694 | | | 30,232 | | 24,980 | | (6,538 | ) | | (21.6 | ) |
Interest paid on retail repurchase agreements | | | 247 | | | 539 | | 731 | | (292 | ) | | (54.2 | ) |
Interest paid on commercial paper | | | 359 | | | 1,110 | | 867 | | (751 | ) | | (67.7 | ) |
Interest paid on other short-term borrowings | | | 1,108 | | | 704 | | 143 | | 404 | | | 57.4 | |
Interest paid on long-term borrowings | | | 1,198 | | | 173 | | 576 | | 1,025 | | | 592.5 | |
| | | | | | | | | | | | | | |
Total interest expense | | | 26,606 | | | 32,758 | | 27,297 | | (6,152 | ) | | (18.8 | ) |
| | | | | | | | | | | | | | |
Net interest income | | | 51,735 | | | 50,879 | | 49,149 | | 856 | | | 1.7 | |
| | | | | |
Provision for loan losses | | | 5,619 | | | 988 | | 1,625 | | 4,631 | | | 468.7 | |
| | | | | | | | | | | | | | |
Net interest income after provision for loan losses | | | 46,116 | | | 49,891 | | 47,524 | | (3,775 | ) | | (7.6 | ) |
| | | | | | | | | | | | | | |
Noninterest income | | | | | | | | | | | | | | |
Service charges on deposit accounts, net | | | 8,596 | | | 8,050 | | 8,086 | | 546 | | | 6.8 | |
Fees for trust and investment management and brokerage services | | | 2,996 | | | 3,115 | | 3,231 | | (119 | ) | | (3.8 | ) |
Mortgage-banking income | | | 2,145 | | | 1,797 | | 1,772 | | 348 | | | 19.4 | |
Investment securities gains | | | 1 | | | — | | 34 | | 1 | | | 100.0 | |
Other | | | 5,160 | | | 4,417 | | 4,759 | | 743 | | | 16.8 | |
| | | | | | | | | | | | | | |
Total noninterest income | | | 18,898 | | | 17,379 | | 17,882 | | 1,519 | | | 8.7 | |
| | | | | |
Noninterest expense | | | | | | | | | | | | | | |
Salaries and other personnel | | | 23,513 | | | 25,548 | | 23,591 | | (2,035 | ) | | (8.0 | ) |
Occupancy | | | 3,293 | | | 2,969 | | 2,840 | | 324 | | | 10.9 | |
Furniture and equipment | | | 3,823 | | | 3,685 | | 3,935 | | 138 | | | 3.7 | |
(Gain) loss on disposition of premises, furniture, and equipment | | | (2 | ) | | 346 | | 9 | | (348 | ) | | (100.6 | ) |
Marketing | | | 1,280 | | | 1,131 | | 1,436 | | 149 | | | 13.2 | |
Amortization of core deposit intangibles | | | 45 | | | 48 | | 48 | | (3 | ) | | (6.3 | ) |
Other | | | 11,999 | | | 9,129 | | 10,344 | | 2,870 | | | 31.4 | |
| | | | | | | | | | | | | | |
Total noninterest expense | | | 43,951 | | | 42,856 | | 42,203 | | 1,095 | | | 2.6 | |
| | | | | | | | | | | | | | |
Net income before provision for income taxes | | | 21,063 | | | 24,414 | | 23,203 | | (3,351 | ) | | (13.7 | ) |
| | | | | |
Provision for income taxes | | | 7,464 | | | 8,399 | | 7,962 | | (935 | ) | | (11.1 | ) |
| | | | | | | | | | | | | | |
Net income | | $ | 13,599 | | | 16,015 | | 15,241 | | (2,416 | ) | | (15.1 | )% |
| | | | | | | | | | | | | | |
Common and per share data | | | | | | | | | | | | | | |
Net income—basic | | $ | 2.11 | | | 2.51 | | 2.40 | | (0.40 | ) | | (15.9 | )% |
Net income—diluted | | | 2.09 | | | 2.47 | | 2.37 | | (0.38 | ) | | (15.4 | ) |
Cash dividends | | | 0.80 | | | 0.77 | | 0.73 | | 0.03 | | | 3.9 | |
Book value | | | 17.96 | | | 17.17 | | 15.76 | | 0.79 | | | 4.6 | |
| | | | | |
Weighted average common shares outstanding—basic | | | 6,438,071 | | | 6,390,858 | | 6,353,752 | | | | | | |
Weighted average common shares outstanding—diluted | | | 6,519,849 | | | 6,477,663 | | 6,421,742 | | | | | | |
73
Net interest margin for the year ended December 31, 2008 was 4.15% compared with 4.59% and 4.74% for the years ended December 31, 2007 and 2006, respectively. Average interest-earning assets increased $136.8 million, or 12.3% during fiscal year 2008.
Income resulted in a return on average shareholders’ equity of 11.70%, 15.02% and 16.03% for the years ended December 31, 2008, 2007, and 2006, respectively. Return on average assets was 1.03%, 1.35%, and 1.37% for the same periods.
Net Interest Income
General. Net interest income is the difference between interest income earned on interest-earning assets, primarily loans and investment securities, and interest expense paid on interest-bearing deposits and other interest-bearing liabilities. This measure represents the largest component of income for the Company. The net interest margin measures how effectively the Company manages the difference between the interest income earned on interest-earning assets and the interest expense paid for funds to support those assets. Changes in interest rates earned on interest-earning assets and interest rates paid on interest-bearing liabilities, the rate of growth of the interest-earning assets and interest-bearing liabilities base, the ratio of interest-earning assets to interest-bearing liabilities, and the management of interest rate sensitivity factor into fluctuations within net interest income.
74
Average Balance Sheets and Net Interest Income / Margin Analysis. The following table summarizes the Company’s average balance sheets and net interest income / margin analysis for the periods indicated (dollars in thousands). The Company’s interest yield earned on interest-earning assets and interest rate paid on interest-bearing liabilities shown in the table are derived by dividing interest income and expense by the average balances of interest-earning assets or interest-bearing liabilities, respectively. The following table does not include a tax-equivalent adjustment to net interest income for interest-earning assets earning tax-exempt income to a comparable yield on a taxable basis.
| | | | | | | | | | | | | | | | | | | | | | | | | | | | | | |
| | | For the years ended December 31, | |
| | | 2008 | | | 2007 | | | 2006 | |
| | | Average
balance | | | Income/
expense | | Yield/
rate | | | Average
balance | | | Income/
expense | | Yield/
rate | | | Average
balance | | | Income/
expense | | Yield/
rate | |
Assets | | | | | | | | | | | | | | | | | | | | | | | | | | | | | | |
Interest-earnings assets | | | | | | | | | | | | | | | | | | | | | | | | | | | | | | |
Loans (1) | | $ | 1,113,355 | | | $ | 72,036 | | 6.47 | % | | $ | 989,128 | | | $ | 78,412 | | 7.93 | % | | $ | 898,028 | | | $ | 70,339 | | 7.83 | % |
Investment securities available for sale, taxable (2) | | | 71,778 | | | | 4,204 | | 5.86 | | | | 54,330 | | | | 2,592 | | 4.77 | | | | 66,713 | | | | 2,916 | | 4.37 | |
Investment securities available for sale, nontaxable (2) | | | 51,773 | | | | 1,806 | | 3.49 | | | | 50,427 | | | | 1,800 | | 3.57 | | | | 53,682 | | | | 1,936 | | 3.61 | |
FHLB stock | | | 5,640 | | | | 189 | | 3.35 | | | | 2,724 | | | | 155 | | 5.69 | | | | 2,931 | | | | 184 | | 6.28 | |
Other | | | 3,732 | | | | 106 | | 2.84 | | | | 12,907 | | | | 678 | | 5.25 | | | | 15,911 | | | | 1,071 | | 6.73 | |
| | | | | | | | | | | | | | | | | | | | | | | | | | | | | | |
Total interest-earning assets | | | 1,246,278 | | | | 78,341 | | 6.29 | | | | 1,109,516 | | | | 83,637 | | 7.54 | | | | 1,037,265 | | | | 76,446 | | 7.37 | |
| | | | | | | | | | | | | | | | | | | | | | | | | | | | | | |
Noninterest-earning assets | | | | | | | | | | | | | | | | | | | | | | | | | | | | | | |
Cash and due from banks | | | 31,548 | | | | | | | | | | 31,736 | | | | | | | | | | 40,590 | | | | | | | |
Allowance for loan losses | | | (7,611 | ) | | | | | | | | | (8,344 | ) | | | | | | | | | (8,681 | ) | | | | | | |
Premises and equipment, net | | | 24,704 | | | | | | | | | | 24,835 | | | | | | | | | | 23,767 | | | | | | | |
Premises held for sale | | | 1,651 | | | | | | | | | | — | | | | | | | | | | — | | | | | | | |
Goodwill, net | | | 3,688 | | | | | | | | | | 3,688 | | | | | | | | | | 3,688 | | | | | | | |
Core deposit intangibles, net | | | 57 | | | | | | | | | | 103 | | | | | | | | | | 151 | | | | | | | |
Accrued interest receivable | | | 6,012 | | | | | | | | | | 6,049 | | | | | | | | | | 5,434 | | | | | | | |
Other | | | 16,214 | | | | | | | | | | 15,267 | | | | | | | | | | 12,339 | | | | | | | |
| | | | | | | | | | | | | | | | | | | | | | | | | | | | | | |
Total noninterest-earning assets | | | 76,263 | | | | | | | | | | 73,334 | | | | | | | | | | 77,288 | | | | | | | |
| | | | | | | | | | | | | | | | | | | | | | | | | | | | | | |
Total assets | | $ | 1,322,541 | | | | | | | | | $ | 1,182,850 | | | | | | | | | $ | 1,114,553 | | | | | | | |
| | | | | | | | | | | | | | | | | | | | | | | | | | | | | | |
Liabilities and Shareholders’ Equity | | | | | | | | | | | | | | | | | | | | | | | | | | | | | | |
Liabilities | | | | | | | | | | | | | | | | | | | | | | | | | | | | | | |
Interest-bearing liabilities | | | | | | | | | | | | | | | | | | | | | | | | | | | | | | |
Transaction deposit accounts | | $ | 374,382 | | | $ | 4,966 | | 1.33 | % | | $ | 358,118 | | | $ | 10,152 | | 2.83 | % | | $ | 263,476 | | | $ | 5,424 | | 2.06 | % |
Money market deposit accounts | | | 105,834 | | | | 1,922 | | 1.82 | | | | 115,563 | | | | 3,977 | | 3.44 | | | | 125,396 | | | | 3,979 | | 3.17 | |
Savings deposit accounts | | | 37,692 | | | | 129 | | 0.34 | | | | 40,184 | | | | 139 | | 0.35 | | | | 45,239 | | | | 147 | | 0.32 | |
Time deposit accounts | | | 400,516 | | | | 16,677 | | 4.16 | | | | 360,025 | | | | 15,964 | | 4.43 | | | | 387,939 | | | | 15,430 | | 3.98 | |
| | | | | | | | | | | | | | | | | | | | | | | | | | | | | | |
Total interest-bearing deposits | | | 918,424 | | | | 23,694 | | 2.58 | | | | 873,890 | | | | 30,232 | | 3.46 | | | | 822,050 | | | | 24,980 | | 3.04 | |
| | | | | | | | | |
Retail repurchase agreements | | | 18,063 | | | | 247 | | 1.37 | | | | 13,347 | | | | 539 | | 4.04 | | | | 17,639 | | | | 731 | | 4.14 | |
Commercial paper (Master notes) | | | 32,415 | | | | 359 | | 1.11 | | | | 27,295 | | | | 1,110 | | 4.07 | | | | 21,009 | | | | 867 | | 4.13 | |
Other short-term borrowings | | | 48,543 | | | | 1,108 | | 2.28 | | | | 13,036 | | | | 704 | | 5.40 | | | | 2,987 | | | | 143 | | 4.79 | |
Long-term borrowings | | | 41,415 | | | | 1,198 | | 2.89 | | | | 4,521 | | | | 173 | | 3.83 | | | | 15,841 | | | | 576 | | 3.64 | |
| | | | | | | | | | | | | | | | | | | | | | | | | | | | | | |
Total interest-bearing liabilities | | | 1,058,860 | | | | 26,606 | | 2.51 | | | | 932,089 | | | | 32,758 | | 3.51 | | | | 879,526 | | | | 27,297 | | 3.10 | |
| | | | | | | | | | | | | | | | | | | | | | | | | | | | | | |
Noninterest-bearing liabilities | | | | | | | | | | | | | | | | | | | | | | | | | | | | | | |
Noninterest-bearing deposits | | | 137,351 | | | | | | | | | | 134,914 | | | | | | | | | | 133,215 | | | | | | | |
Accrued interest payable | | | 2,309 | | | | | | | | | | 2,496 | | | | | | | | | | 2,248 | | | | | | | |
Other | | | 7,799 | | | | | | | | | | 6,736 | | | | | | | | | | 4,487 | | | | | | | |
| | | | | | | | | | | | | | | | | | | | | | | | | | | | | | |
Total noninterest-bearing liabilities | | | 147,459 | | | | | | | | | | 144,146 | | | | | | | | | | 139,950 | | | | | | | |
| | | | | | | | | | | | | | | | | | | | | | | | | | | | | | |
Total liabilities | | | 1,206,319 | | | | | | | | | | 1,076,235 | | | | | | | | | | 1,019,476 | | | | | | | |
Shareholders’ equity | | | 116,222 | | | | | | | | | | 106,615 | | | | | | | | | | 95,077 | | | | | | | |
| | | | | | | | | | | | | | | | | | | | | | | | | | | | | | |
Total liabilities and shareholders’ equity | | $ | 1,322,541 | | | | | | | | | $ | 1,182,850 | | | | | | | | | $ | 1,114,553 | | | | | | | |
| | | | | | | | | | | | | | | | | | | | | | | | | | | | | | |
NET INTEREST INCOME / NET YIELD ON INTEREST-EARNING ASSETS | | | | | | $ | 51,735 | | 4.15 | % | | | | | | $ | 50,879 | | 4.59 | % | | | | | | $ | 49,149 | | 4.74 | % |
| | | | | | | | | | | | | | | | | | | | | | | | | | | | | | |
| (1) | | Calculated including mortgage loans held for sale, excluding the allowance for loan losses. Nonaccrual loans are included in average balances for yield computations. The impact of foregone interest income as a result of loans on nonaccrual was not considered in the above analysis. All loans and deposits are domestic. |
| (2) | | The average balances for investment securities include the applicable unrealized gain or loss recorded for available for sale securities. |
75
Federal Reserve Rate Influences. The Federal Reserve influences the general market rates of interest earned on interest-earning assets and interest paid on interest-bearing liabilities. The Company’s loan portfolio is impacted by changes in the prime interest rate, and its borrowings portfolio is impacted by changes in the federal funds interest rate. The following table summarizes the actions taken by the Federal Reserve with regard to the prime interest rate and the federal funds interest rate for the three year period ended December 31, 2008.
| | | | | | | | | | | | |
| | | Prime rate | | | Federal funds rate | |
| | | Change | | | Balance | | | Change | | | Balance | |
Rate, at December 31, 2005 | | | | | 7.25 | % | | | | | 4.25 | |
Increases in rate | | | | | | | | | | | | |
January 31, 2006 | | 0.25 | | | | | | 0.25 | | | | |
March 28, 2006 | | 0.25 | | | | | | 0.25 | | | | |
May 10, 2006 | | 0.25 | | | | | | 0.25 | | | | |
June 29, 2006 | | 0.25 | | | | | | 0.25 | | | | |
| | | | | | | | | | | | |
Total increases in rate | | | | | 1.00 | | | | | | 1.00 | |
| | | | | | | | | | | | |
Rate, at December 31, 2006 | | | | | 8.25 | | | | | | 5.25 | |
| | | | | | | | | | | | |
Decreases in rate | | | | | | | | | | | | |
September 18, 2007 | | (0.50 | ) | | | | | (0.50 | ) | | | |
October 31, 2007 | | (0.25 | ) | | | | | (0.25 | ) | | | |
December 11, 2007 | | (0.25 | ) | | | | | (0.25 | ) | | | |
| | | | | | | | | | | | |
Total decreases in rate | | | | | (1.00 | ) | | | | | (1.00 | ) |
| | | | | | | | | | | | |
Rate, at December 31, 2007 | | | | | 7.25 | | | | | | 4.25 | |
| | | | | | | | | | | | |
Decreases in rate | | | | | | | | | | | | |
January 22, 2008 | | (0.75 | ) | | | | | (0.75 | ) | | | |
January 30, 2008 | | (0.50 | ) | | | | | (0.50 | ) | | | |
March 18, 2008 | | (0.75 | ) | | | | | (0.75 | ) | | | |
April 30, 2008 | | (0.25 | ) | | | | | (0.25 | ) | | | |
October 8, 2008 | | (0.50 | ) | | | | | (0.50 | ) | | | |
October 29, 2008 | | (0.50 | ) | | | | | (0.50 | ) | | | |
December 16, 2008 | | (0.75-1.00 | ) | | | | | (0.75-1.00 | ) | | | |
| | | | | | | | | | | | |
Total decreases in rate | | | | | (4.00-4.25 | ) | | | | | (4.00-4.25 | ) |
| | | | | | | | | | | | |
Rate, at December 31, 2008 | | | | | 3.00-3.25 | % | | | | | 0.00-0.25 | |
| | | | | | | | | | | | |
76
Rate / Volume Analysis. The following rate / volume analysis summarizes the dollar amount of changes in interest income and interest expense attributable to changes in volume and the amount attributable to changes in rate when comparing the periods indicated (in thousands). The impact of the combination of rate and volume change has been divided proportionately between the rate change and volume change.
| | | | | | | | | | |
| | | For the year ended
December 31, 2008 compared
with the year ended
December 31, 2007 | |
| | | Change in
volume | | | Change
in rate | | | Total
change | |
Interest-earnings assets | | | | | | | | | | |
Loans, net of unearned (1) | | $ | 13,752 | | | (20,128 | ) | | (6,376 | ) |
Investment securities available for sale (2) | | | 855 | | | 763 | | | 1,618 | |
FHLB stock | | | 55 | | | (21 | ) | | 34 | |
Other | | | (348 | ) | | (224 | ) | | (572 | ) |
| | | | | | | | | | |
Total interest income | | $ | 14,314 | | | (19,610 | ) | | (5,296 | ) |
| | | |
Interest-bearing liabilities | | | | | | | | | | |
Interest-bearing deposits | | $ | 1,721 | | | (8,259 | ) | | (6,538 | ) |
Retail repurchase agreements | | | 334 | | | (626 | ) | | (292 | ) |
Commercial paper | | | 260 | | | (1,011 | ) | | (751 | ) |
Other short-term borrowings | | | 512 | | | (108 | ) | | 404 | |
Long-term borrowings | | | 1,056 | | | (31 | ) | | 1,025 | |
| | | | | | | | | | |
Total interest expense | | $ | 3,883 | | | (10,035 | ) | | (6,152 | ) |
| | | | | | | | | | |
Net interest income | | $ | 10,431 | | | (9,575 | ) | | 856 | |
| | | | | | | | | | |
| |
| | | For the year ended
December 31, 2007 compared
with the year ended
December 31, 2006 | |
| | | Change in
volume | | | Change
in rate | | | Total
change | |
Interest-earnings assets | | | | | | | | | | |
Loans, net of unearned (1) | | $ | 7,213 | | | 860 | | | 8,073 | |
Investment securities available for sale (2) | | | (668 | ) | | 208 | | | (460 | ) |
FHLB stock | | | (13 | ) | | (16 | ) | | (29 | ) |
Other | | | (182 | ) | | (211 | ) | | (393 | ) |
| | | | | | | | | | |
Total interest income | | $ | 6,350 | | | 841 | | | 7,191 | |
Interest-bearing liabilities | | | | | | | | | | |
Interest-bearing deposits | | $ | 1,420 | | | 3,832 | | | 5,252 | |
Retail repurchase agreements | | | (173 | ) | | (19 | ) | | (192 | ) |
Commercial paper | | | 256 | | | (13 | ) | | 243 | |
Other short-term borrowings | | | 541 | | | 20 | | | 561 | |
Long-term borrowings | | | (435 | ) | | 32 | | | (403 | ) |
| | | | | | | | | | |
Total interest expense | | $ | 1,609 | | | 3,852 | | | 5,461 | |
| | | | | | | | | | |
Net interest income | | $ | 4,741 | | | (3,011 | ) | | 1,730 | |
| | | | | | | | | | |
| (1) | | Calculated including mortgage loans held for sale, excluding the allowance for loan losses. Nonaccrual loans are included in average balances for yield computations. The impact of foregone interest income as a result of loans on nonaccrual was not considered in the above analysis. |
| (2) | | The average balances for investment securities include the applicable unrealized gain or loss recorded for available for sale securities. |
77
Provision for Loan Losses
The provision for loan losses is determined by management as the amount to be added to the allowance for loan losses after net loans charged-offs have been deducted to bring the allowance to a level which, in management’s best estimate, is necessary to absorb probable losses within the existing loan portfolio. The provision for loan losses totaled $5.6 million for the year ended December 31, 2008 compared with $988 thousand for the year ended December 31, 2007 and $1.6 million for the year ended December 31, 2006. See Financial Condition – Lending Activities, included elsewhere in this item, for further discussion regarding the Company’s accounting policies related to, factors impacting, and methodology for analyzing the adequacy of the Company’s allowance for loan losses and, therefore, its provision for loan losses.
Noninterest Income
General. The following table summarizes the components of noninterest income for the periods indicated (in thousands).
| | | | | | | |
| | | For the years ended
December 31, |
| | | 2008 | | 2007 | | 2006 |
Service charges on deposit accounts, net | | $ | 8,596 | | 8,050 | | 8,086 |
Fees for trust and investment management and brokerage services | | | 2,996 | | 3,115 | | 3,231 |
Mortgage-banking income | | | 2,145 | | 1,797 | | 1,772 |
Investment securities gains | | | 1 | | — | | 34 |
Other | | | 5,160 | | 4,417 | | 4,759 |
| | | | | | | |
Total noninterest income | | $ | 18,898 | | 17,379 | | 17,882 |
| | | | | | | |
Service Charges on Deposit Accounts. Service charges on deposit accounts, net comprise a significant component of noninterest income and totaled 1.7% of average transaction deposit accounts during 2008, 1.6% of average transaction deposit accounts during 2007, and 2.0% of average transaction deposit accounts during 2006.
Management believes that the service charges on deposit accounts, net as a percentage of total average transaction deposit accounts, increased from the year ended December 31, 2007 when compared to the same period of 2008 as a result of an increase in nonsufficient funds and overdraft activity. In response to decreasing deposit levels, institutions in the financial services industry have increasingly been providing services for free in an effort to lure deposits away from competitors and retain existing balances. Services that the Company initially developed as fee income opportunities, such as Internet banking and bill payment service, are now provided to customers free of charge. Consequently, opportunities to earn additional income from service charges for such services has been more limited, which management believes somewhat offset the increase in nonsufficient funds and overdraft activity fee income.
Fees for Trust and Investment Management and Brokerage Services. The following table summarizes the composition of fees for trust and investment management and brokerage services for the periods indicated (in thousands).
| | | | | | | |
| | | For the years ended
December 31, |
| | | 2008 | | 2007 | | 2006 |
Fees for trust and investment management services | | $ | 2,311 | | 2,446 | | 2,526 |
Fees for brokerage services | | | 685 | | 669 | | 705 |
| | | | | | | |
Total fees for trust and investment management and brokerage services | | $ | 2,996 | | 3,115 | | 3,231 |
| | | | | | | |
78
Despite the substantial decline in the S&P 500, primarily within the fourth quarter of 2008, fees for trust and investment management and brokerage services for the year ended December 31, 2008 decreased only $119 thousand, or 3.8% to $3.0 million from $3.1 million for the year ended December 31, 2007. The slight decline in fees for trust and investment management services over these periods was consistent with the changes in market valuation at the end of 2008, thereby reducing the base on which fees are earned.
The following table summarizes trust and investment management and brokerage assets under management at the dates indicated (in thousands).
| | | | | | | |
| | | December 31, |
| | | 2008 | | 2007 | | 2006 |
Trust and investment management assets | | $ | 214,389 | | 312,503 | | 313,220 |
Brokerage assets | | | 167,923 | | 207,336 | | 169,462 |
| | | | | | | |
Total trust and investment management and brokerage assets | | $ | 382,312 | | 519,839 | | 482,682 |
| | | | | | | |
Mortgage-Banking Income. The Company sells most of the residential mortgage loans it originates in the secondary market and retains servicing rights. Mortgage loans serviced for the benefit of others amounted to $377.3 million, $346.3 million, and $325.1 million at December 31, 2008, 2007, and 2006 respectively.
The following table summarizes the components of mortgage-banking income for the periods indicated (dollars in thousands).
| | | | | | | | |
| | | For the years ended
December 31, |
| | | 2008 | | | 2007 | | 2006 |
Mortgage-servicing fees | | $ | 901 | | | 834 | | 783 |
Gain on sale of mortgage loans held for sale | | | 994 | | | 796 | | 772 |
Other mortgage-banking income | | | 250 | | | 167 | | 217 |
| | | | | | | | |
Total mortgage-banking income, net | | $ | 2,145 | | | 1,797 | | 1,772 |
| | | | | | | | |
Mortgage-servicing fees as a percentage of mortgage loans serviced for the benefit of others at period end | | | 0.24 | % | | 0.24 | | 0.24 |
Other. Other noninterest income increased $743 thousand, or 17%, from December 31, 2007 to December 31, 2008. During 2007, in conjunction with a change in service providers, the recording of merchant / cardholder services was changed from a net income and expense method to a gross income and expense method. This change impacted the comparability of other noninterest income during the year ended December 31, 2008 compared with the year ended December 31, 2007.
79
Within the Consolidated Statements of Income included in Item 8., merchant / cardholder income is included in other noninterest income on the Consolidated Statements of Income, and merchant / cardholder expense accounts are included in other noninterest expense on the Consolidated Statements of Income. Although the fluctuation in merchant / cardholder income, net had relatively little impact on the Company’s Consolidated Statements of Income over the years noted, the change in recording method impacted the breakout within other noninterest income and other noninterest expense. The following table adjusts reported other noninterest income for this account for the periods indicated (in thousands).
| | | | | | | | | | |
| | | For the years ended
December 31, | |
| | | 2008 | | | 2007 | | | 2006 | |
Other noninterest income | | $ | 5,160 | | | 4,417 | | | 4,759 | |
Merchant / cardholder income | | | (1,853 | ) | | (963 | ) | | (1,358 | ) |
| | | | | | | | | | |
Other noninterest income, adjusted | | $ | 3,307 | | | 3,454 | | | 3,401 | |
| | | | | | | | | | |
After adjusting for this change, other noninterest income decreased $146 thousand, or 4.2%, during the year ended December 31, 2008 when compared with the year ended December 31, 2007. Automatic teller machine income increased $185 thousand, or 17.6%, during the year ended December 31, 2008 over the year ended December 31, 2007. This increase was impacted by an increase in noncustomer transaction fees, which increased $0.50 per transaction effective March 2008. Additional transaction volume also contributed to the increase. The increase in automatic teller machine fee income was offset by the following fluctuations in miscellaneous income:
| | • | | Included within other noninterest income for the year ended December 31, 2008 was a pretax first quarter gain of approximately $226 thousand, recorded in the first quarter of 2008, resulting from the mandatory redemption of the Company’s Class B Visa, Inc. shares as part of Visa’s initial public offering. The Company continues to own 8,386 shares of Visa Class B shares that are convertible into Class A shares. The amount of Class A shares the Company could realize upon conversion of its remaining Class B shares may change depending upon whether additional amounts of money need to be reserved by Visa to settle outstanding litigation. The Class B shares carry a three-year lock-up provision and may not be converted or redeemed during that period. The Company obtained its ownership of Visa shares, and resulting proportionate share of the Visa litigation settlement, by being a long-time Visa member. The Company’s ownership proportion is based upon its percentage of total fees paid to Visa over this period. |
| | • | | Included within other noninterest income for the year ended December 31, 2007 was a pretax third quarter gain of approximately $487 thousand resulting from the Company’s sale of its MasterCard stock. During the third quarter of 2007, the Bank converted its shares of Class B common stock on a one-for-one basis into shares of Class A common stock for subsequent sale to public investors. |
80
Noninterest Expense
General. The Company continues to be disciplined about its efforts to manage expenses. The following table summarizes the components of noninterest expense for the periods indicated (in thousands).
| | | | | | | | |
| | | For the years ended
December 31, |
| | | 2008 | | | 2007 | | 2006 |
Salaries and other personnel | | $ | 23,513 | | | 25,548 | | 23,591 |
Occupancy | | | 3,293 | | | 2,969 | | 2,840 |
Furniture and equipment | | | 3,823 | | | 3,685 | | 3,935 |
(Gain) loss on disposition of premises, furniture, and equipment | | | (2 | ) | | 346 | | 9 |
Marketing | | | 1,280 | | | 1,131 | | 1,436 |
Amortization of core deposit intangibles | | | 45 | | | 48 | | 48 |
Other | | | 11,999 | | | 9,129 | | 10,344 |
| | | | | | | | |
Total noninterest expense | | $ | 43,951 | | | 42,856 | | 42,203 |
| | | | | | | | |
Salaries and Other Personnel. Comprising 53.5% of noninterest expense during fiscal year 2008 and 59.6% of noninterest expense during fiscal year 2007, salaries and other personnel expense decreased by $2.0 million during 2008 when compared with 2007.
The following table summarizes nonrecurring transactions in 2007, all of which were disclosed in the Company’s Annual Report on Form 10-K for the Year Ended December 31, 2007, which represented the majority of the fluctuation in salaries and other personnel expense for the year ended December 31, 2008 when compared with the year ended December 31, 2007 (in thousands).
| | | | | | | | | |
| | | For the years ended December 31, | | | Dollar
variance | |
| | | 2008 | | 2007 | | |
Cash surrender value of life insurance income | | $ | — | | 901 | | | (901 | ) |
401(k) error contribution expense | | | — | | (1,583 | ) | | 1,583 | |
Pension income (expense) | | | 603 | | (652 | ) | | 1,255 | |
| | | | | | | | | |
| | $ | 603 | | (1,334 | ) | | 1,937 | |
| | | | | | | | | |
The Company uses split-dollar life insurance arrangements to provide retirement and death benefits to key employees. FASB Technical Bulletin No. 85-4, “Accounting for Purchases of Life Insurance,” requires that the amount that could be realized under the insurance contract as of the date of the statement of financial position be reported as an asset. Prior to 2008, the Company recorded the amount that could be realized under the insurance contract as of the date of the statement of financial position as expense in the Bank’s Consolidated Statement of Income. During 2007, the Company recorded cash surrender value of approximately $900 thousand in other assets on the Consolidated Balance Sheets with an offsetting entry to income (as these amounts had been expensed since the agreements’ inception) with regard to these policies.
During 2007, in conjunction with the audit of the Company’s 401(k) Plan, an administrative error was discovered that had resulted in participants being denied the opportunity to fully defer the appropriate amount of compensation under the plan. During the third and fourth quarters of 2007, the Company calculated and accrued the denied deferral amount and the resulting employer match, including missed earnings, totaling $1.6 million through December 31, 2007. These amounts were recorded within salaries and other personnel expense for the year ended December 31, 2007.
During the fourth quarter of 2007, the Company notified employees that, effective 2008, it would cease accruing pension benefits for employees with regard to the Company’s noncontributory, defined benefit pension
81
plan. Although no previously accrued benefits will be lost, employees will no longer accrue benefits for service subsequent to 2007. See Item 8. Financial Statements and Supplementary Data, Note 12 for discussion regarding the expense components for the Company’s defined benefit pension plan, at and for the periods indicated.
Employee and officer salaries remained relatively unchanged from the year ended December 31, 2007 to the year ended December 31, 2008 because the Company gained efficiencies by consolidating four branches during the second quarter of 2008. The resulting expense savings were partially offset by the expense of annual merit raises for employees and officers and new officer positions, including positions created in connection with the opening of the new Rock Hill banking office. The Bank opened its Rock Hill banking office during the third quarter of 2008.
Loss on Disposition of Premises, Furniture, and Equipment. The Company wrote off $346 thousand in leasehold improvements and equipment during the third quarter of 2007 in conjunction with the demolition of its previous downtown Greenville banking office.
Marketing. During 2006, the Company incurred additional marketing costs related to its 100-year anniversary celebration. Absent these specific 2006 expenses, marketing expenses over the three year period ended December 31, 2008 has remained relatively unchanged.
Other. Other noninterest expense increased by $2.9 million to $12.0 million during the year ended December 31, 2008 from $9.1 million during the year ended December 31, 2007. As noted above, during 2007, in conjunction with a change in service providers, the recording of merchant / cardholder services was changed from a net income and expense method to a gross income and expense method. This change impacted the comparability of other noninterest expense during the year ended December 31, 2008 compared with the year ended December 31, 2007. The following table adjusts reported other noninterest expense for these accounts for the periods indicated (in thousands).
| | | | | | | | | | |
| | | For the years ended December 31, | |
| | | 2008 | | | 2007 | | | 2006 | |
Other noninterest expense | | $ | 11,999 | | | 9,129 | | | 10,344 | |
Merchant / cardholder expense | | | (1,146 | ) | | (197 | ) | | (649 | ) |
| | | | | | | | | | |
Other noninterest expense, adjusted | | $ | 10,853 | | | 8,932 | | | 9,695 | |
| | | | | | | | | | |
After adjusting for this account, other noninterest expense increased $1.9 million, or 21.5%, during the year ended December 31, 2008 when compared with the year ended December 31, 2007. The following table summarizes significant fluctuations within other noninterest expense, adjusted for the periods indicated (in thousands).
| | | | | | | |
| | | For the years ended December 31, |
| | | 2008 | | 2007 | | 2006 |
FDIC assessment | | $ | 786 | | 179 | | 117 |
Mortgage servicing rights amortization expense | | | 881 | | 511 | | 604 |
Real estate acquired in settlement of loans writedowns | | | 516 | | 164 | | 146 |
Sundry losses | | | 267 | | 151 | | 435 |
| | | | | | | |
| | $ | 2,450 | | 1,005 | | 1,302 |
| | | | | | | |
In connection with the FDIC’s adoption in 2006 of final regulations that set deposit insurance assessment rates and took effect in 2007, the Bank received a one-time assessment credit of $576 thousand that could be applied against future premiums, beginning in 2007, subject to certain limitations. Any remaining credit could be
82
used to offset up to 90% of subsequent annual assessments through 2010. FDIC premiums increased during the year ended December 31, 2008 over the year ended December 31, 2007 because the Company utilized the remaining $154 thousand of its one-time assessment credit against deposit insurance assessments during the first quarter of 2008. During the year ended December 31, 2008, the Company expensed $786 thousand in FICO and FDIC assessments compared with $179 thousand expensed during the same period of 2007, which was comprised totally of FICO assessments.
Mortgage servicing rights amortization expense increased by $370 thousand for the year ended December 31, 2008 over the year ended December 31, 2007. Since December 31, 2007, the Federal Reserve has decreased rates by 400 to 425 basis points. This decline in interest rates has resulted in an increase in loan prepayments, and therefore increased amortization within the mortgage-servicing rights portfolio. Amortization had declined over the two year period ended December 31, 2007 because that period was characterized by rising interest rates.
Expenses related to real estate acquired in settlement of loans during the year ended December 31, 2008 totaled $516 thousand, substantially all of which was related to a commercial real estate property within the portfolio with respect to which the Bank owns a participation interest. The lead bank is managing the operations of the property and is currently working with an external firm to market the property. The Bank was a 20% participant in the loan relationship and is now a 20% owner of the collateral property. Therefore, the Bank must cover 20% of the costs related to the property.
During the second quarter of 2006, as a result of a software upgrade, the Company experienced a temporary delay in check processing and electronic check processing. At December 31, 2006, the Bank had exposure, and reserved for within other noninterest expense in the Consolidated Statements of Income, approximately $174 thousand of sundry losses related to items uncollected at that date. Subsequently, in 2007, the Bank collected virtually all of these items. Therefore, this reserve was reversed during the first quarter of 2007.
Provision for Income Taxes
Income tax expense totaled $7.5 million for the year ended December 31, 2008, compared with $8.4 million for the year ended December 31, 2007, and $8.0 million for the year ended December 31, 2006. The Company’s effective tax rate was 35.4% in 2008, 34.4% in 2007, and 34.3% in 2006.
Recently Issued / Adopted Accounting Pronouncements
See Item 8. Financial Statements and Supplementary Data, Note 1 for a discussion regarding recently issued and recently adopted accounting pronouncements and their expected impact on the Company’s business, financial condition, results of operations, and cash flows.
83
| ITEM 7A. QUANTITATIVE | AND QUALITATIVE DISCLOSURES ABOUT MARKET RISK |
Market risk refers to the risk of loss arising from adverse changes in interest rates, foreign currency exchange rates, commodity prices, and other relevant market rates and prices, such as equity prices. Due to the nature of its operations, the Company is primarily exposed to interest rate risk and, to a lesser extent, liquidity risk.
Interest rate risk on the Company’s balance sheets consists of reprice, option, and basis risks. Reprice risk results from differences in the maturity, or repricing, of asset and liability portfolios. Option risk arises from “embedded options” present in many financial instruments, such as loan prepayment options, deposit early withdrawal options, and interest rate options. These options allow customers opportunities to benefit when market interest rates change, which typically results in higher expense or lower income for the Company. Basis risk refers to the potential for changes in the underlying relationship between market rates and indices, which subsequently result in a narrowing of the profit spread on an earning asset or liability. Basis risk is also present in administered rate liabilities, such as savings accounts, negotiable order of withdrawal accounts, and money market accounts with respect to which historical pricing relationships to market rates may change due to the level or directional change in market interest rates.
The Company seeks to avoid fluctuations in its net interest margin and to maximize net interest income within acceptable levels of risk through periods of changing interest rates. Accordingly, the Company’s Asset and Liability Committee monitors the Company’s interest rate sensitivity and liquidity on an ongoing basis. The Company’s Asset and Liability Committee oversees market risk management and establishes risk measures, limits, and policy guidelines for managing the amount of interest rate risk and its impact on net interest income and capital. The Committee uses a variety of measures to gain a comprehensive view of the magnitude of interest rate risk, the distribution of risk, the level of risk over time, and the exposure to changes in certain interest rate relationships.
The Company utilizes a simulation model as the primary quantitative tool in measuring the amount of interest rate risk associated with changing market rates. The model measures the impact on net interest income relative to a base case scenario of hypothetical fluctuations in interest rates over the next 12 months. These simulations incorporate assumptions regarding balance sheet growth and mix, pricing, and the repricing and maturity characteristics of the existing and projected balance sheet. Other interest rate related risks such as prepayment, basis and option risk are also considered in the model.
The Asset and Liability Committee continuously monitors and manages the balance between interest rate-sensitive assets and liabilities. The objective is to manage the impact of fluctuating market rates on net interest income within acceptable levels. In order to meet this objective and mitigate potential market risk, management may lengthen or shorten the duration of assets or liabilities.
As of December 31, 2008, the following table summarizes the forecasted impact on net interest income using a base case scenario given upward and downward movement in interest rates of 100 basis points and 200 basis points based on forecasted assumptions of nominal interest rates, balance sheet growth rates (derived from targeted budget projections), and deposit and loan repricing rates (based upon past interest rate cycles). The Company bases estimates on historical interest rate cycles, current targeted budget projections, and other factors deemed to be relevant. However, underlying assumptions may be impacted in future periods, which were not known to management at the time of the issuance of the Company’s Consolidated Financial Statements. Therefore, management’s assumptions may or may not prove valid. No assurance can be given that changing economic conditions and other relevant factors impacting the Company’s net interest income will not cause actual occurrences to differ from underlying assumptions.
| | | |
Interest rate scenario (1) | | Percentage change in net
interest income from base | |
Up 200 basis points | | (6.77 | )% |
Up 100 basis points | | (3.34 | ) |
Down 100 basis points | | 2.10 | |
Down 200 basis points | | 2.85 | |
| (1) | | The rising 100 and 200 basis points and falling 100 and 200 basis point interest rate scenarios assume a twelve month parallel change in interest rates along the entire yield curve taking into account rate caps and floors. |
84
There are material limitations with the model presented above, which include, but are not limited to:
| | • | | It presents the balance sheet in a static position. When assets and liabilities mature or reprice, they keep the same characteristics. |
| | • | | The computation of prospective impacts of hypothetical interest rate changes are based on numerous assumptions and should not be relied upon as indicative of actual results; and |
| | • | | The computations do not contemplate any additional actions the Company could undertake in response to changes in interest rates. |
85
| ITEM 8. FINANCIAL | STATEMENTS AND SUPPLEMENTARY DATA |
MANAGEMENT’S REPORT ON INTERNAL CONTROL OVER FINANCIAL REPORTING
To provide reasonable assurance regarding the reliability of financial reporting and the preparation of financial statements for external purposes in accordance with generally accepted accounting principles, management is responsible for establishing and maintaining effective internal control management. In establishing such internal controls, management weighs the costs of such systems against the benefits it believes such systems will provide. All internal control systems, no matter how well designed, have inherent limitations. Therefore, even those systems determined to be effective can provide only reasonable assurance with respect to financial statement preparation and presentation. Also, projections of any evaluation of effectiveness to future periods are subject to the risk that controls may become inadequate because of changes in conditions, or that the degree of compliance with the policies or procedures may deteriorate.
Management of the Company is responsible for establishing and maintaining adequate internal control over financial reporting and for assessing the effectiveness of internal control over financial reporting, as such term is defined in Exchange Act Rules 13a-15(f) and 15d-15(f). Management has assessed the effectiveness of the Company’s internal control over financial reporting based on the criteria established in “Internal Control—Integrated Framework,” issued by the Committee of Sponsoring Organizations (“COSO”) of the Treadway Commission. Based on that assessment and criteria, management has determined that the Company has maintained effective internal control over financial reporting as of December 31, 2008.
Elliott Davis, LLC, the independent registered public accounting firm that audited the Consolidated Financial Statements of the Company included in its Annual Report on Form 10-K for the year ended December 31, 2008, has issued an audit report on our internal control over financial reporting. Their report, which expresses an unqualified opinion, is included in this Annual Report on Form 10-K. Elliott Davis, LLC’s audit was performed in accordance with standards of the Public Company Accounting Oversight Board (United States).
| | |
 | |  |
| L. Leon Patterson | | Paul W. Stringer |
| Chairman and Chief Executive Officer | | President and Chief Operating Officer |
| | (Chief Accounting Officer) |
86
REPORT OF INDEPENDENT REGISTERED PUBLIC ACCOUNTING FIRM
To the Board of Directors and Shareholders
Palmetto Bancshares, Inc.
Laurens, South Carolina
We have audited the accompanying consolidated balance sheets of Palmetto Bancshares, Inc. and subsidiary (the “Company”) as of December 31, 2008 and 2007, and the related consolidated statements of income, changes in shareholders’ equity and comprehensive income and cash flows for each of the three years in the period ended December 31, 2008. These consolidated financial statements are the responsibility of the Company’s management. Our responsibility is to express an opinion on these consolidated financial statements based on our audits.
We conducted our audits in accordance with the standards of the Public Company Accounting Oversight Board (United States). Those standards require that we plan and perform the audit to obtain reasonable assurance about whether the financial statements are free of material misstatement. An audit includes examining, on a test basis, evidence supporting the amounts and disclosures in the financial statements. An audit also includes assessing the accounting principles used and significant estimates made by management, as well as evaluating the overall financial statement presentation. We believe that our audits provide a reasonable basis for our opinion.
In our opinion, the consolidated financial statements referred to above present fairly, in all material respects, the financial position of Palmetto Bancshares, Inc. and subsidiary as of December 31, 2008 and 2007, and the results of their operations and their cash flows for each of the three years in the period ended December 31, 2008 in conformity with U.S. generally accepted accounting principles.
We also have audited, in accordance with the standards of the Public Company Accounting Oversight Board (United States), the Company’s internal control over financial reporting as of December 31, 2008, based on criteria established inInternal Control—Integrated Framework issued by the Committee of Sponsoring Organizations of the Treadway Commission and our report dated March 12, 2009 expressed an unqualified opinion on the effectiveness of Palmetto Bancshares, Inc. and subsidiary’s internal control over financial reporting.

Greenville, South Carolina
March 12, 2009
87
REPORT OF INDEPENDENT REGISTERED PUBLIC ACCOUNTING FIRM
To the Board of Directors and Shareholders
Palmetto Bancshares, Inc.
Laurens, South Carolina
We have audited the internal control over financial reporting of Palmetto Bancshares, Inc and subsidiary (the “Company”) as of December 31, 2008, based on criteria established inInternal Control—Integrated Framework issued by the Committee of Sponsoring Organizations of the Treadway Commission (the “COSO criteria”). The Company’s management is responsible for maintaining effective internal control over financial reporting, and for its assessment of the effectiveness of internal control over financial reporting included in the accompanying Management’s Report on Internal Control over Financial Reporting. Our responsibility is to express an opinion on the effectiveness of the Company’s internal control over financial reporting based on our audit.
We conducted our audit in accordance with the standards of the Public Company Accounting Oversight Board (United States). Those standards require that we plan and perform the audit to obtain reasonable assurance about whether effective internal control over financial reporting was maintained in all material respects. Our audit included obtaining an understanding of internal control over financial reporting, assessing the risk that a material weakness exists, testing and evaluating the design and operating effectiveness of internal control based on the assessed risk. Our audit also included performing such other procedures as we considered necessary in the circumstances. We believe that our audit provides a reasonable basis for our opinion.
A company’s internal control over financial reporting is a process designed to provide reasonable assurance regarding the reliability of financial reporting and the preparation of financial statements for external purposes in accordance with generally accepted accounting principles. A company’s internal control over financial reporting includes those policies and procedures that (1) pertain to the maintenance of records that, in reasonable detail, accurately and fairly reflect the transactions and dispositions of the assets of the company; (2) provide reasonable assurance that transactions are recorded as necessary to permit preparation of financial statements in accordance with generally accepted accounting principles, and that receipts and expenditures of the company are being made only in accordance with authorizations of management and directors of the company; and (3) provide reasonable assurance regarding prevention or timely detection of unauthorized acquisition, use, or disposition of the company’s assets that could have a material impact on the financial statements.
Because of its inherent limitations, internal control over financial reporting may not prevent or detect misstatements. Also, projections of any evaluation of effectiveness to future periods are subject to the risk that controls may become inadequate because of changes in conditions, or that the degree of compliance with the policies or procedures may deteriorate.
In our opinion, the Company maintained, in all material respects, effective internal control over financial reporting as of December 31, 2008, based on the COSO criteria.
We also have audited, in accordance with the standards of the Public Company Accounting Oversight Board (United States), the consolidated balance sheets of the Company as of December 31, 2008 and 2007 and the related consolidated statements of income, changes in shareholders’ equity and comprehensive income, and cash flows for each of the three years in the period ended December 31, 2008 and our report dated March 12, 2009 expressed an unqualified opinion thereon.
Greenville, South Carolina
March 12, 2009
88
PALMETTO BANCSHARES, INC. AND SUBSIDIARY
Consolidated Balance Sheets
(dollars in thousands, except per share data)
| | | | | | | |
| | | December 31, | |
| | | 2008 | | | 2007 | |
Assets | | | | | | | |
Cash and cash equivalents | | | | | | | |
Cash and due from banks | | $ | 29,305 | | | 42,450 | |
Federal funds sold | | | — | | | 9,782 | |
| | | | | | | |
Total cash and cash equivalents | | | 29,305 | | | 52,232 | |
| | |
FHLB stock, at cost | | | 6,566 | | | 2,617 | |
Investment securities available for sale, at fair value | | | 125,596 | | | 95,715 | |
Mortgage loans held for sale | | | 7,415 | | | 5,005 | |
| | |
Loans, gross | | | 1,158,480 | | | 1,044,770 | |
Less: allowance for loan losses | | | (11,000 | ) | | (7,418 | ) |
| | | | | | | |
Loans, net | | | 1,147,480 | | | 1,037,352 | |
| | |
Premises and equipment, net | | | 26,347 | | | 25,133 | |
Premises held for sale | | | 1,651 | | | — | |
Goodwill, net | | | 3,691 | | | 3,691 | |
Core deposit intangibles, net | | | 34 | | | 79 | |
Accrued interest receivable | | | 5,466 | | | 6,655 | |
Other | | | 16,449 | | | 19,698 | |
| | | | | | | |
Total assets | | $ | 1,370,000 | | | 1,248,177 | |
| | | | | | | |
Liabilities and shareholders’ equity | | | | | | | |
Liabilities | | | | | | | |
Deposits | | | | | | | |
Noninterest-bearing | | $ | 133,248 | | | 135,111 | |
Interest-bearing | | | 937,031 | | | 923,683 | |
| | | | | | | |
Total deposits | | | 1,070,279 | | | 1,058,794 | |
| | |
Retail repurchase agreements | | | 16,357 | | | 11,280 | |
Commercial paper (Master notes) | | | 27,955 | | | 26,326 | |
Other short-term borrowings | | | 79,785 | | | 30,000 | |
Long-term borrowings | | | 52,000 | | | — | |
Accrued interest payable | | | 1,857 | | | 2,042 | |
Other | | | 5,991 | | | 9,479 | |
| | | | | | | |
Total liabilities | | | 1,254,224 | | | 1,137,921 | |
| | | | | | | |
Commitments and contingencies (Note 15) | | | | | | | |
| | |
Shareholders’ equity | | | | | | | |
Common stock—par value $5.00 per share; authorized 10,000,000 shares; issued and outstanding 6,446,090 and 6,421,765 at December 31, 2008 and 2007, respectively | | | 32,230 | | | 32,109 | |
Capital surplus | | | 2,095 | | | 1,664 | |
Retained earnings | | | 87,568 | | | 79,221 | |
Accumulated other comprehensive loss, net of tax | | | (6,117 | ) | | (2,738 | ) |
| | | | | | | |
Total shareholders’ equity | | | 115,776 | | | 110,256 | |
| | | | | | | |
Total liabilities and shareholders’ equity | | $ | 1,370,000 | | | 1,248,177 | |
| | | | | | | |
See Notes to Consolidated Financial Statements
89
PALMETTO BANCSHARES, INC. AND SUBSIDIARY
Consolidated Statements of Income
(dollars in thousands, except common and per share data)
| | | | | | | | |
| | | For the years ended December 31, |
| | | 2008 | | | 2007 | | 2006 |
Interest income | | | | | | | | |
Interest earned and fees on loans | | $ | 72,036 | | | 78,412 | | 70,339 |
Interest earned on investment securities available for sale | | | | | | | | |
U.S. Treasury and federal agencies (taxable) | | | 235 | | | 1,390 | | 1,963 |
State and municipal (nontaxable) | | | 1,806 | | | 1,800 | | 1,936 |
Mortgage-backed (taxable) | | | 3,969 | | | 1,202 | | 953 |
Dividends earned on FHLB stock | | | 189 | | | 155 | | 184 |
Other | | | 106 | | | 678 | | 1,071 |
| | | | | | | | |
Total interest income | | | 78,341 | | | 83,637 | | 76,446 |
| | | | | | | | |
Interest expense | | | | | | | | |
Interest paid on deposits | | | 23,694 | | | 30,232 | | 24,980 |
Interest paid on retail repurchase agreements | | | 247 | | | 539 | | 731 |
Interest paid on commercial paper | | | 359 | | | 1,110 | | 867 |
Interest paid on other short-term borrowings | | | 1,108 | | | 704 | | 143 |
Interest paid on long-term borrowings | | | 1,198 | | | 173 | | 576 |
| | | | | | | | |
Total interest expense | | | 26,606 | | | 32,758 | | 27,297 |
| | | | | | | | |
Net interest income | | | 51,735 | | | 50,879 | | 49,149 |
Provision for loan losses | | | 5,619 | | | 988 | | 1,625 |
| | | | | | | | |
Net interest income after provision for loan losses | | | 46,116 | | | 49,891 | | 47,524 |
Noninterest income | | | | | | | | |
Service charges on deposit accounts, net | | | 8,596 | | | 8,050 | | 8,086 |
Fees for trust and investment management and brokerage services | | | 2,996 | | | 3,115 | | 3,231 |
Mortgage-banking income | | | 2,145 | | | 1,797 | | 1,772 |
Investment securities gains | | | 1 | | | — | | 34 |
Other | | | 5,160 | | | 4,417 | | 4,759 |
| | | | | | | | |
Total noninterest income | | | 18,898 | | | 17,379 | | 17,882 |
| | | | | | | | |
| | | |
Noninterest expense | | | | | | | | |
Salaries and other personnel | | | 23,513 | | | 25,548 | | 23,591 |
Occupancy | | | 3,293 | | | 2,969 | | 2,840 |
Furniture and equipment | | | 3,823 | | | 3,685 | | 3,935 |
(Gain) loss on disposition of premises, furniture, and equipment | | | (2 | ) | | 346 | | 9 |
Marketing | | | 1,280 | | | 1,131 | | 1,436 |
Amortization of core deposit intangibles | | | 45 | | | 48 | | 48 |
Other | | | 11,999 | | | 9,129 | | 10,344 |
| | | | | | | | |
Total noninterest expense | | | 43,951 | | | 42,856 | | 42,203 |
| | | | | | | | |
Net income before provision for income taxes | | | 21,063 | | | 24,414 | | 23,203 |
Provision for income taxes | | | 7,464 | | | 8,399 | | 7,962 |
| | | | | | | | |
Net income | | $ | 13,599 | | | 16,015 | | 15,241 |
| | | | | | | | |
Common and per share data | | | | | | | | |
Net income—basic | | $ | 2.11 | | | 2.51 | | 2.40 |
Net income—diluted | | | 2.09 | | | 2.47 | | 2.37 |
Cash dividends | | | 0.80 | | | 0.77 | | 0.73 |
Book value | | | 17.96 | | | 17.17 | | 15.76 |
| | | |
Weighted average common shares outstanding—basic | | | 6,438,071 | | | 6,390,858 | | 6,353,752 |
Weighted average common shares outstanding—diluted | | | 6,519,849 | | | 6,477,663 | | 6,421,742 |
See Notes to Consolidated Financial Statements
90
PALMETTO BANCSHARES, INC. AND SUBSIDIARY
Consolidated Statements of Changes in Shareholders’ Equity and Comprehensive Income (Loss)
(dollars in thousands, except per share data)
| | | | | | | | | | | | | | | | | | | | |
| | | Shares of
common
stock | | Common
stock | | Capital
surplus | | Retained
earnings | | | Accumulated
other
comprehensive
income (loss), net | | | Total | |
Balance at December 31, 2005 | | 6,331,335 | | $ | 31,656 | | $ | 659 | | $ | 57,532 | | | $ | (906 | ) | | $ | 88,941 | |
Net income | | | | | | | | | | | 15,241 | | | | | | | | 15,241 | |
Other comprehensive income (loss), net of tax | | | | | | | | | | | | | | | | | | | | |
Investment securities available for sale | | | | | | | | | | | | | | | | | | | | |
Change in unrealized position during the period, net of tax impact of $145 | | | | | | | | | | | | | | | 232 | | | | | |
Reclassification adjustment included in net income, net of tax impact of $13 | | | | | | | | | | | | | | | (21 | ) | | | | |
Net unrealized gains on investment securities available for sale | | | | | | | | | | | | | | | | | | | 211 | |
| | | | | | | | | | | | | | | | | | | | |
Comprehensive income | | | | | | | | | | | | | | | | | | | 15,452 | |
Cash dividend declared and paid ($0.73 per share) | | | | | | | | | | | (4,641 | ) | | | | | | | (4,641 | ) |
Compensation expense related to stock option plan | | | | | | | | 163 | | | | | | | | | | | 163 | |
Common stock issued pursuant to stock option plan | | 36,115 | | | 181 | | | 280 | | | | | | | | | | | 461 | |
| | | | | | | | | | | | | | | | | | | | |
Balance at December 31, 2006 | | 6,367,450 | | $ | 31,837 | | $ | 1,102 | | $ | 68,132 | | | $ | (695 | ) | | $ | 100,376 | |
| | | | | | | | | | | | | | | | | | | | |
Net income | | | | | | | | | | | 16,015 | | | | | | | | 16,015 | |
Other comprehensive income (loss), net of tax | | | | | | | | | | | | | | | | | | | | |
Investment securities available for sale | | | | | | | | | | | | | | | | | | | | |
Change in unrealized position during the period, net of tax impact of $277 | | | | | | | | | | | | | | | 443 | | | | 443 | |
Defined benefit pension plan | | | | | | | | | | | | | | | | | | | | |
Impact of adoption of FASB No. 158, net of tax impact of $2,218 | | | | | | | | | | | | | | | (4,116 | ) | | | | |
Impact of defined benefit pension plan curtailment, net of tax impact of $878 | | | | | | | | | | | | | | | 1,630 | | | | | |
Net unrealized loss relating to the defined benefit pension plan | | | | | | | | | | | | | | | | | | | (2,486 | ) |
| | | | | | | | | | | | | | | | | | | | |
Comprehensive income | | | | | | | | | | | | | | | | | | | 13,972 | |
Cash dividend declared and paid ($0.77 per share) | | | | | | | | | | | (4,926 | ) | | | | | | | (4,926 | ) |
Compensation expense related to stock option plan | | | | | | | | 132 | | | | | | | | | | | 132 | |
Common stock issued pursuant to stock option plan | | 54,315 | | | 272 | | | 430 | | | | | | | | | | | 702 | |
| | | | | | | | | | | | | | | | | | | | |
Balance at December 31, 2007 | | 6,421,765 | | $ | 32,109 | | $ | 1,664 | | $ | 79,221 | | | $ | (2,738 | ) | | $ | 110,256 | |
| | | | | | | | | | | | | | | | | | | | |
Net income | | | | | | | | | | | 13,599 | | | | | | | | 13,599 | |
Other comprehensive income (loss), net of tax | | | | | | | | | | | | | | | | | | | | |
Investment securities available for sale | | | | | | | | | | | | | | | | | | | | |
Change in unrealized position during the period, net of tax impact of $832 | | | | | | | | | | | | | | | (1,368 | ) | | | | |
Reclassification adjustment included in net income, net of tax impact of $0 | | | | | | | | | | | | | | | (1 | ) | | | | |
Net unrealized loss on investment securities available for sale | | | | | | | | | | | | | | | | | | | (1,369 | ) |
Defined benefit pension plan | | | | | | | | | | | | | | | | | | | | |
Impact of FASB No. 158, net of tax impact of $1,082 | | | | | | | | | | | | | | | (2,010 | ) | | | (2,010 | ) |
| | | | | | | | | | | | | | | | | | | | |
Comprehensive income | | | | | | | | | | | | | | | | | | | 10,220 | |
Cumulative effect of adoption of new accounting standard (See Note 1) | | | | | | | | | | | (99 | ) | | | | | | | (99 | ) |
Cash dividend declared and paid ($0.80 per share) | | | | | | | | | | | (5,153 | ) | | | | | | | (5,153 | ) |
Compensation expense related to stock option plan | | | | | | | | 94 | | | | | | | | | | | 94 | |
Excess tax benefit from equity-based awards | | | | | | | | 78 | | | | | | | | | | | 78 | |
Common stock issued pursuant to stock option plan | | 24,325 | | | 121 | | | 259 | | | | | | | | | | | 380 | |
| | | | | | | | | | | | | | | | | | | | |
Balance at December 31, 2008 | | 6,446,090 | | $ | 32,230 | | $ | 2,095 | | $ | 87,568 | | | $ | (6,117 | ) | | $ | 115,776 | |
| | | | | | | | | | | | | | | | | | | | |
See Notes to Consolidated Financial Statements
91
PALMETTO BANCSHARES, INC. AND SUBSIDIARY
Consolidated Statements of Cash Flows
(in thousands)
| | | | | | | | | | |
| | | For the years ended
December 31, | |
| | | 2008 | | | 2007 | | | 2006 | |
Operating activities | | | | | | | | | | |
Net income | | $ | 13,599 | | | 16,015 | | | 15,241 | |
Adjustments to reconcile net income to net cash provided by operating activities | | | | | | | | | | |
Depreciation | | | 1,972 | | | 1,950 | | | 2,033 | |
(Gains) Losses on dispositions of premises, furniture, and equipment | | | 2 | | | (346 | ) | | (9 | ) |
Amortization of core deposit intangibles | | | 45 | | | 48 | | | 48 | |
Amortization of unearned discounts / premiums on investment securities available for sale, net | | | 16 | | | 74 | | | (103 | ) |
Amortization (accretion) of unearned discounts / premiums on mortgage-backed investment securities available for sale, net | | | (2 | ) | | 175 | | | 140 | |
Investment securities gains | | | (1 | ) | | — | | | (34 | ) |
Provision for loan losses | | | 5,619 | | | 988 | | | 1,625 | |
Originations of mortgage loans held for sale | | | (78,962 | ) | | (60,876 | ) | | (44,348 | ) |
Proceeds from sale of mortgage loans held for sale | | | 77,701 | | | 67,665 | | | 46,592 | |
Gains on sales of mortgage loans held for sale, net | | | (994 | ) | | (796 | ) | | (772 | ) |
Writedowns and losses on sales of real estate acquired in settlement of loans | | | 168 | | | 180 | | | 197 | |
Compensation expense related to stock options granted | | | 94 | | | 132 | | | 163 | |
Deferred income tax (benefit) expense | | | (1,418 | ) | | 728 | | | 768 | |
Excess tax benefit from stock-based awards | | | 78 | | | — | | | — | |
Decrease (increase) in interest receivable and other assets, net | | | 897 | | | (2,037 | ) | | (1,590 | ) |
Decrease (increase) in accrued interest payable and other liabilities, net | | | (1,015 | ) | | 3,029 | | | (152 | ) |
| | | | | | | | | | |
Net cash provided by operating activities | | | 17,799 | | | 26,929 | | | 19,799 | |
| | | | | | | | | | |
| | | |
Investing activities | | | | | | | | | | |
Proceeds from sales of investment securities available for sale | | | 1 | | | — | | | 13,073 | |
Proceeds from maturities of investment securities available for sale | | | 22,789 | | | 40,090 | | | 14,297 | |
Purchases of investment securities available for sale | | | — | | | (22,333 | ) | | (11,545 | ) |
Purchases of mortgage-backed investment securities available for sale | | | (66,537 | ) | | (1,646 | ) | | (11,207 | ) |
Repayments on mortgage-backed investment securities available for sale | | | 11,652 | | | 5,212 | | | 5,143 | |
Purchases of FHLB stock | | | (5,029 | ) | | (1,170 | ) | | (158 | ) |
Redemptions of FHLB stock | | | 1,080 | | | 1,152 | | | 1,345 | |
Increase in loans, net | | | (118,680 | ) | | (120,312 | ) | | (81,556 | ) |
Proceeds on sale of real estate acquired in settlement of loans | | | 3,634 | | | 2,707 | | | 1,451 | |
Purchases of premises and equipment, net | | | (4,839 | ) | | (2,243 | ) | | (3,842 | ) |
| | | | | | | | | | |
Net cash used in investing activities | | | (155,929 | ) | | (98,543 | ) | | (72,999 | ) |
| | | | | | | | | | |
Financing activities | | | | | | | | | | |
(Decrease) increase in transaction, money market, and savings deposit accounts, net | | | (48,003 | ) | | 61,938 | | | 105,628 | |
Increase (decrease) in time deposit accounts, net | | | 59,488 | | | 3,275 | | | (15,430 | ) |
Increase (decrease) in retail repurchase agreements, net | | | 5,077 | | | (3,147 | ) | | (2,301 | ) |
Increase in commercial paper, net | | | 1,629 | | | 5,338 | | | 3,073 | |
Increase (decrease) in other short-term borrowings | | | 49,785 | | | 24,000 | | | (11,900 | ) |
Increase in long-term borrowings | | | 52,000 | | | — | | | — | |
Repayments of long-term borrowings | | | — | | | (10,000 | ) | | (13,000 | ) |
Proceeds from exercise of stock options | | | 380 | | | 702 | | | 461 | |
Cash dividends paid on common stock | | | (5,153 | ) | | (4,926 | ) | | (4,641 | ) |
| | | | | | | | | | |
Net cash provided by financing activities | | | 115,203 | | | 77,180 | | | 61,890 | |
| | | | | | | | | | |
Net increase (decrease) in cash and cash equivalents | | | (22,927 | ) | | 5,566 | | | 8,690 | |
Cash and cash equivalents, beginning of period | | | 52,232 | | | 46,666 | | | 37,976 | |
| | | | | | | | | | |
Cash and cash equivalents, end of period | | $ | 29,305 | | | 52,232 | | | 46,666 | |
| | | | | | | | | | |
Supplemental cash flow disclosures | | | | | | | | | | |
Cash paid during the period for: | | | | | | | | | | |
Interest expense | | $ | 26,791 | | | 32,300 | | | 26,988 | |
| | | | | | | | | | |
Income taxes | | | 9,588 | | | 6,968 | | | 7,426 | |
| | | | | | | | | | |
Significant noncash activities | | | | | | | | | | |
Net unrealized losses on investment securities available for sale, net of tax | | $ | (1,369 | ) | | 443 | | | 211 | |
| | | | | | | | | | |
Loans transferred to real estate acquired in settlement of loans, at fair value | | | 2,778 | | | 10,030 | | | 295 | |
| | | | | | | | | | |
Premises reclassified as held for sale, at fair value | | | 1,651 | | | — | | | — | |
| | | | | | | | | | |
Impact of FASB No. 158, net of tax | �� | | (2,010 | ) | | (4,116 | ) | | — | |
| | | | | | | | | | |
Impact of defined benefit pension plan curtailment, net of tax | | | — | | | 1,630 | | | — | |
| | | | | | | | | | |
Loans transferred from held for investment to held for sale | | | 155 | | | 9,328 | | | — | |
| | | | | | | | | | |
See Notes to Consolidated Financial Statements
92
PALMETTO BANCSHARES, INC. AND SUBSIDIARY
Notes To Consolidated Financial Statements
1. Summary of Significant Accounting Policies
Nature of Operations
Palmetto Bancshares is a regional financial services bank holding company organized in 1982 under the laws of South Carolina currently headquartered in Laurens, South Carolina. Palmetto Bancshares provides, through its subsidiary, a broad array of commercial banking, consumer banking, trust and investment management, and brokerage services throughout its market area primarily within northwest South Carolina.
Principles of Consolidation / Basis of Presentation
The accompanying Consolidated Financial Statements include the accounts of the Company, which includes its wholly owned subsidiary, the Bank, and the Bank’s wholly owned subsidiary, Palmetto Capital. In management’s opinion, all significant intercompany accounts and transactions have been eliminated in consolidation, and all adjustments necessary for a fair presentation of the financial condition and results of operations for periods presented have been included. Any such adjustments are of a normal and recurring nature. Assets held by the Company or its subsidiary in a fiduciary or agency capacity for customers are not included in the Company’s Consolidated Financial Statements because those items do not represent assets of the Company or its subsidiary. The accounting and financial reporting policies of the Company conform, in all material respects, to accounting principles generally accepted in the United States of America and to general practices within the financial services industry.
Business Segments
The Company adheres to the provisions of the SFAS No. 131. Operating segments are components of an enterprise about which separate financial information is available that are evaluated regularly by the chief operating decision makers in deciding how to allocate resources and assess performance. SFAS No. 131 requires that a public enterprise report a measure of segment profit or loss, certain specific revenue and expense items for each segment, segment assets, and information about the way that the operating segments were determined, among other items.
The Company considers business segments by analyzing distinguishable components that are engaged in providing individual products, services or groups of related products or services and that are subject to risks and returns that are different from those of other business segments. To this end, when determining whether products and services are related, the Company considers the nature of the products or services, the nature of the production processes, the type or class of customer for which the products or services are designed, and the methods used to distribute the products or provide the services.
The Bank offers mortgage-banking services. These services have similar production processes and are targeted to similar customers using similar distribution channels as those employed for the entire Bank loan portfolio. Additionally, decisions are not made by chief decision makers based on the results of these services alone. Instead, decisions with regard to mortgage-banking services are typically made in conjunction with decisions made with regard to the entire loan portfolio. Therefore, the Company has concluded that mortgage-banking services do not represent an operating segment separate from the banking segment.
Additionally, the Bank and its subsidiary offer trust and investment management and brokerage services to customers through similar distribution channels utilized by the Bank. These services are not routinely evaluated separately from the Bank’s other services. At December 31, 2008, fees for such services represented approximately 3% of the Company’s total revenues. Based on these factors, trust and investment management and brokerage services do not represent an operating segment separate from the banking segment.
93
PALMETTO BANCSHARES, INC. AND SUBSIDIARY
Notes To Consolidated Financial Statements—(Continued)
At December 31, 2008 and 2007, the Company determined it had one reportable operating segment, banking. Therefore, separate segment information is not presented within this Annual Report on Form 10-K as management believes that the Company’s Financial Statements and Supplementary Data report the information required by SFAS No. 131 with regard to the Company’s operating segment, banking.
Use of Estimates
In preparing its Consolidated Financial Statements, the Company’s management makes estimates and assumptions that impact the reported amounts of assets and liabilities and the disclosure of contingent assets and liabilities as of the date of the Consolidated Financial Statements and for the years presented. Actual results could differ from these estimates and assumptions. Therefore, the results of operations for the year ended December 31, 2008 are not necessarily indicative of the results of operations that may be expected in future periods.
Reclassifications
Certain amounts previously presented in the Company’s Consolidated Financial Statements for prior periods have been reclassified to conform to current classifications. All such reclassifications had no impact on the prior years’ net income or retained earnings as previously reported.
94
PALMETTO BANCSHARES, INC. AND SUBSIDIARY
Notes To Consolidated Financial Statements—(Continued)
Balance Sheet. The following table summarizes the Company’s Consolidated Balance Sheet at the date indicated, as then reported, prior to the reclassification.
PALMETTO BANCSHARES, INC. AND SUBSIDIARY
Consolidated Balance Sheet
(in thousands)
| | | | |
| | | December 31,
2007 | |
Assets | | | | |
Cash and cash equivalents | | | | |
Cash and due from banks | | $ | 41,769 | |
Federal funds sold | | | 10,463 | |
| | | | |
Total cash and cash equivalents | | | 52,232 | |
FHLB stock, at cost | | | 2,617 | |
Investment securities available for sale, at fair value | | | 95,715 | |
Mortgage loans held for sale | | | 5,006 | |
Loans | | | 1,044,770 | |
Less: allowance for loan losses | | | (7,418 | ) |
| | | | |
Loans, net | | | 1,037,352 | |
Premises and equipment, net | | | 25,133 | |
Goodwill | | | 3,691 | |
Core deposit intangibles | | | 79 | |
Accrued interest receivable | | | 6,655 | |
Other | | | 19,697 | |
| | | | |
Total assets | | $ | 1,248,177 | |
| | | | |
Liabilities and shareholders’ equity | | | | |
Liabilities | | | | |
Deposits | | | | |
Noninterest-bearing | | $ | 135,111 | |
Interest-bearing | | | 923,683 | |
| | | | |
Total deposits | | | 1,058,794 | |
Retail repurchase agreements | | | 11,280 | |
Commercial paper (Master notes) | | | 26,326 | |
Other short-term borrowings | | | 30,000 | |
Long-term borrowings | | | — | |
Accrued interest payable | | | 2,042 | |
Other | | | 9,479 | |
| | | | |
Total liabilities | | | 1,137,921 | |
| | | | |
Shareholders’ equity | | | | |
Common stock | | | 32,109 | |
Capital surplus | | | 1,664 | |
Retained earnings | | | 79,221 | |
Accumulated other comprehensive loss, net of tax | | | (2,738 | ) |
| | | | |
Total shareholders’ equity | | | 110,256 | |
| | | | |
Total liabilities and shareholders’ equity | | $ | 1,248,177 | |
| | | | |
95
PALMETTO BANCSHARES, INC. AND SUBSIDIARY
Notes To Consolidated Financial Statements—(Continued)
Cash and cash equivalents are comprised of cash and due from bank balances as well as federal funds sold to correspondent banks. Federal funds sold are essentially uncollateralized loans to other financial institutions. During 2007, interest-bearing cash balances held at the FHLB were reported within federal funds sold. During 2008, management concluded that, although such balances were interest-bearing, they were not federal funds sold. Within this Annual Report on Form 10-K, prior period FHLB balances have been reclassified and are reported within cash and due from banks.
The Company originates certain mortgage loans with the intention of selling them in the secondary market. A lag may occur between the time that the sale proceeds are received by the Company and the time that all paperwork is received and the appropriate entries are made to the Company’s records. Sale proceeds received are recorded in a clearing account. At December 31, 2007, this clearing account was reported within other in the assets section of the Consolidated Balance Sheet. During 2008, management concluded that because the sales proceeds relate to loans no longer held for sale, the clearing account should be offset against mortgage loans held for sale. Within this Annual Report on Form 10-K, prior period balances have been reclassified and are reported with mortgage loans held for sale.
96
PALMETTO BANCSHARES, INC. AND SUBSIDIARY
Notes To Consolidated Financial Statements—(Continued)
Statements of Income. The following table summarizes the Company’s Consolidated Statements of Income for the periods indicated, as then reported in the Company’s Annual Report on Form 10-K for the year ended December 31, 2007.
PALMETTO BANCSHARES, INC. AND SUBSIDIARY
Consolidated Statements of Income
(in thousands)
| | | | | |
| | | For the years ended
December 31, |
| | | 2007 | | 2006 |
Interest income | | | | | |
Interest and fees on loans | | $ | 78,412 | | 70,339 |
Interest on investment securities available for sale | | | 4,392 | | 4,852 |
Interest on federal funds sold | | | 678 | | 1,071 |
Dividends on FHLB stock | | | 155 | | 184 |
| | | | | |
Total interest income | | | 83,637 | | 76,446 |
Interest expense | | | | | |
Interest on deposits | | | 30,232 | | 24,980 |
Interest on retail repurchase agreements | | | 539 | | 731 |
Interest on commercial paper | | | 1,110 | | 867 |
Interest on other short-term borrowings | | | 704 | | 143 |
Interest on long-term borrowings | | | 173 | | 576 |
| | | | | |
Total interest expense | | | 32,758 | | 27,297 |
| | | | | |
Net interest income | | | 50,879 | | 49,149 |
Provision for loan losses | | | 988 | | 1,625 |
| | | | | |
Net interest income after provision for loan losses | | | 49,891 | | 47,524 |
| | | | | |
Noninterest income | | | | | |
Service charges on deposit accounts | | | 8,050 | | 8,086 |
Fees for trust and brokerage services | | | 3,115 | | 3,231 |
Mortgage-banking income | | | 1,286 | | 1,168 |
Investment securities gains | | | — | | 34 |
Other | | | 4,417 | | 4,759 |
| | | | | |
Total noninterest income | | | 16,868 | | 17,278 |
Noninterest expense | | | | | |
Salaries and other personnel | | | 25,548 | | 23,591 |
Occupancy | | | 1,548 | | 1,537 |
Premises, furniture, and equipment leases and rentals | | | 1,278 | | 1,332 |
Premises, furniture, and equipment depreciation | | | 1,950 | | 2,033 |
Other premises, furniture, and equipment | | | 1,878 | | 1,873 |
Loss on disposition of premises, furniture, and equipment | | | 346 | | 9 |
Marketing | | | 1,131 | | 1,436 |
Amortization of core deposit intangibles | | | 48 | | 48 |
Other | | | 8,618 | | 9,740 |
| | | | | |
Total noninterest expense | | | 42,345 | | 41,599 |
| | | | | |
Net income before provision for income taxes | | | 24,414 | | 23,203 |
Provision for income taxes | | | 8,399 | | 7,962 |
| | | | | |
Net income | | $ | 16,015 | | 15,241 |
| | | | | |
97
PALMETTO BANCSHARES, INC. AND SUBSIDIARY
Notes To Consolidated Financial Statements—(Continued)
Within this Annual Report on Form 10-K, occupancy, premises, furniture, and equipment balances that were previously reported separately within the noninterest expense section of the Consolidated Statements of Income were aggregated due to such desegregated balances not meeting materiality thresholds for presentation on the face of the Company’s Consolidated Statements of Income. The following table compares such previously reported Consolidated Statements of Income classifications to current classifications for the periods indicated (in thousands).
| | | | | |
| | | For the years
ended
December 31, |
| | | 2007 | | 2006 |
As previously reported | | | | | |
Occupancy | | $ | 1,548 | | 1,537 |
Premises, furniture, and equipment leases and rentals | | | 1,278 | | 1,332 |
Premises, furniture, and equipment depreciation | | | 1,950 | | 2,033 |
Other premises, furniture, and equipment | | | 1,878 | | 1,873 |
| | | | | |
| | $ | 6,654 | | 6,775 |
| | | | | |
As currently reported | | | | | |
Occupancy | | $ | 2,969 | | 2,840 |
Furniture and equipment | | | 3,685 | | 3,935 |
| | | | | |
| | $ | 6,654 | | 6,775 |
| | | | | |
Additionally, during 2008, in an effort to provide more transparent information to readers of the Company’s financial statements, management reclassified certain expenses relating to the mortgage-servicing rights portfolio. For years that ended prior to December 31, 2008, such amounts were reported net of mortgage banking income within the noninterest income section on the Consolidated Statements of Income. Within this Annual Report on Form 10-K for the year ended December 31, 2008, such expenses have been reclassified, resulting in prior period reclassifications, and are reported gross within the other noninterest expense financial statement line item within the Consolidated Statements of Income.
Statement of Cash Flows. As previously noted, during 2007, the clearing account in which mortgage loan sales proceeds are recorded until the paperwork is processed was reported within other in the assets section of the Consolidated Balance Sheet. During 2008, the clearing account began being offset against mortgage loans held for sale. Within this Annual Report on Form 10-K, prior year balances have been reclassified and are reported within mortgage loans held for sale. This reclassification impacted the reporting of cash flows relative to mortgage loans held for sale for the years ended December 31, 2007 and 2006.
FHLB Stock
The FHLB System is under the jurisdiction of the Federal Housing Finance Board. The Bank, as a member of the FHLB, is required to acquire and hold shares of capital stock in the FHLB. A member’s FHLB capital stock requirement is an amount equal to the sum of a membership requirement and an activity-based requirement as described in the FHLB’s Capital Plan. No ready market exists for this stock and it has no quoted market value. However, redemption of this stock has historically been at par value. The carrying value of FHLB stock approximates fair value.
98
PALMETTO BANCSHARES, INC. AND SUBSIDIARY
Notes To Consolidated Financial Statements—(Continued)
In September 2008, the FHLB notified members of a change to its dividend declaration and payment schedule beginning in the fourth quarter of 2008. The FHLB initiated this change so that the dividend can be declared and paid to member accounts after net income is calculated for the preceding quarter. At that time, the FHLB informed members that it would declare any fourth quarter 2008 dividend at the end of January 2009.
In December 2008, based upon currently available information, the FHLB of Atlanta announced that it expected to pay an annualized dividend in the range of 0.00 to 1.00 percent for the quarter ending Dec. 31, 2008. The FHLB’s Board of Directors chose dividend guidance for the fourth quarter of 2008 that was lower than dividends paid in previous quarters to reflect a conservative financial management approach during this period of continued volatility in the financial markets. Subsequent to that notice, the FHLB reported in its third quarter financial report the impact of recording an other-than-temporary impairment charge related to three private label mortgage-backed securities. In light of the critical importance the other-than-temporary impairment analysis has on determining net income for the fourth quarter of 2008, the FHLB’s Board of Directors agreed on January 30, 2009 to defer declaration of a dividend for the fourth quarter. It was concluded that once the FHLB’s analysis is complete and results for the quarter are calculated, the FHLB’s Board of Directors will make a decision regarding the fourth quarter dividend. This decision likely will occur in late March. Based upon currently available information, the FHLB did not change is previous estimate of its expectations to pay an annualized dividend in the range of 0.00 to 1.00 percent for the quarter ending December 31, 2008.
In February 2009, the Company was notified of the FHLB Atlanta’s annual process of recalculating its membership stock purchase requirement, which is based on assets of member financial institutions as of December 31, 2008. Specifically, the membership stock requirement and the activity-based stock requirement will remain unchanged. Changes to the policy include an increase in the B1 membership requirement cap from $25 million to $26 million on March 30, 2009, and effective immediately, a change in the process for evaluating and approving excess activity-based stock repurchases from a daily to a quarterly review cycle.
Investment Securities Available for Sale
The Company accounts for its investment securities in accordance with SFAS No. 115. SFAS No. 115 addresses accounting and reporting requirements for investments in equity securities that have readily determinable fair values other than those accounted for under the equity method, those accounted for as investments in consolidated subsidiaries, and all investments in debt securities. Under SFAS No. 115, investments are classified into three categories. Held to maturity investment securities include debt securities that the Company has the intent and ability to hold until maturity and are reported at amortized cost. Trading investment securities include debt and equity securities that are bought and held for the purpose of sale in the near term and are reported at fair value with unrealized gains and losses included in income. Available for sale investment securities include debt and equity investment securities that, at the time of purchase, the Company determines may be sold at a future date or that the Company does not have the intent or ability to hold to maturity. Available for sale investment securities are reported at fair value with unrealized gains and losses excluded from income and reported as a separate component of shareholders’ equity, net of income taxes. Unrealized losses on available for sale investment securities reflecting a decline in value determined to be other-than-temporary are charged to expense. Realized gains or losses on available for sale investment securities are computed on a specific identification basis.
Fair value measurement is based upon quoted prices, if available. If quoted prices are not available, fair values are measured using third party, pricing models or other model-based valuation techniques such as the present value of future cash flows, adjusted for the security’s credit rating, prepayment assumptions, and other factors such as credit loss assumptions. In the event that pricing occurs in an illiquid or abnormal market, pricing of assets of other relevant issuers of similarly structured securities where data is more readily available may be employed.
99
PALMETTO BANCSHARES, INC. AND SUBSIDIARY
Notes To Consolidated Financial Statements—(Continued)
The Company conducts other-than-temporary impairment analysis on a quarterly basis or more often if a potential loss-triggering event occurs. The Company recognizes other-than-temporary impairment when it is probable that it will be unable to collect all amounts due according to the contractual terms of the security and the fair value of the investment security is less than its amortized cost. The other-than-temporary impairment loss, if any, is recorded in noninterest income. The initial indicator of other-than-temporary impairment for both debt and equity securities is a decline in market value below the amount recorded for an investment, and the severity and duration of the decline. In determining whether an impairment is other-than-temporary, the Company considers the length of time and the extent to which market value has been less than cost, any recent events specific to the issuer and economic conditions of its industry, and the Company’s ability and intent to hold the investment for a period of time, including maturity, sufficient to allow for any anticipated recovery in the fair value of the security.
The Company evaluates its investment securities portfolio for other-than-temporary impairment using the process described above. Additionally, in determining if there was evidence of credit deterioration, the Company evaluates the severity of decline in market value below cost, the period of time for which the decline in fair value has existed, and the financial condition and near-term prospects of the issuer, including any specific events which may influence the operations of the issuer. The Company considers investment securities to be impaired on an other-than-temporary basis if it is probable that the issuer will be unable to make its contractual payments or if the Company no longer believes the security will recover within the estimated recovery period. For debt securities, the Company also considers the cause of the price decline such as the general level of interest rates and industry and issuer-specific factors, the issuer’s financial condition, near-term prospects and current ability to make future payments in a timely manner, the issuer’s ability to service debt, any change in agencies’ ratings at evaluation date from acquisition date and any likely imminent action, and for asset-backed securities, the credit performance of the underlying collateral, including delinquency rates, cumulative losses to date, and the remaining credit enhancement compared to expected credit losses.
The securities portfolio is an integral part of the Company’s balance sheet management process. It manages these investments to provide liquidity, manage interest rate risk, and maximize portfolio yield within capital risk limits approved by management and the Board of Directors and monitored by the Asset / Liability Committee. The Company recognizes realized gains and losses on the sale of these securities in noninterest income using the specific identification method.
Unamortized premiums and discounts are recognized in interest income over the contractual life of the security using the interest method. As principal repayments are received on securities (primarily mortgage-backed securities) a pro-rata portion of the unamortized premium or discount is recognized in interest income.
See Note 3 for further discussion regarding the Company’s investment securities available for sale portfolio.
Loans
Loans are reported at their outstanding principal balances net of any unearned income, charge-offs, unamortized deferred fees and costs on originated loans. Unearned income, deferred fees and costs, and discounts and premiums are amortized to income over the contractual life of the loan.
The Company pledges loans to secure borrowings from the FHLB as part of its liquidity management strategy.
The accrual of interest is discontinued when, in the opinion of management, there is an indication that the borrower may be unable to meet future payments as they become due, generally when a loan becomes 90 days
100
PALMETTO BANCSHARES, INC. AND SUBSIDIARY
Notes To Consolidated Financial Statements—(Continued)
delinquent. The accrual of interest on some loans, however, may continue even after the loan becomes 90 days delinquent in special circumstances deemed appropriate by management. When interest accrual is discontinued, all unpaid accrued interest is reversed. While a loan is in nonaccrual status, interest is recognized as cash is received. Loans are returned to accrual status when the loan is brought current and ultimate collectability of principal and interest is no longer in doubt.
While the Company originates adjustable-rate loans for its own portfolio, fixed-rate loans are generally made on terms that will permit sale in the secondary market. The Company participates in secondary market activities by selling whole loans and participations in loans to the FHLB under its Mortgage Partnership Program, to the FHLMC, and to other institutional investors. This practice enables the Company to satisfy the demand for these loans in its local communities, to meet asset and liability objectives of management, and to develop a source of fee income through the servicing of loans.
Mortgage loans originated with the intent of sale are reported at the lower of cost or estimated fair value on an aggregate loan basis. Net unrealized losses, if necessary, are provided for in a valuation allowance charged to income. Gains or losses realized on the sale of mortgage loans are recognized at the time of sale and are determined by the difference between the net sale proceeds and the carrying value of loans sold.
Loan Fees and Costs. In accordance with SFAS No. 91, “Accounting for Nonrefundable Fees and Costs Associated with Originating or Acquiring Loans and Initial Direct Costs of Leases—an amendment of FASB Statements No. 13, 60, and 65 and a rescission of FASB Statement No. 17,” nonrefundable fees and certain direct costs associated with the origination of loans are deferred and recognized as a yield adjustment over the contractual life of the related loans, or if the related loan is held for resale, until the loan is sold. Recognition of deferred fees and costs is discontinued on nonaccrual loans until they return to accrual status or are charged-off.
See Note 4 for further discussion regarding the Company’s loan portfolio.
Transfer of Financial Assets
Transfers of financial assets are accounted for as sales when control over the assets has been surrendered. Control over the transferred assets is deemed to be surrendered when the assets have been isolated from the Company, the transferee obtains the right (free of conditions that constrain it from taking advantage of that right) to pledge or exchange the transferred assets, and the Company does not maintain effective control over the transferred assets through an agreement to repurchase them before their maturity. The Company reviews all sales of loans by evaluating specific terms in the sales documents and believes that the criteria discussed herein with regard to qualification for sales treatment has been met as loans have been transferred for cash and the notes and mortgages for all loans in each sale are endorsed and assigned to the transferee. As stated in the commitment document, the Company has no recourse with these loans except in the case of fraud. The Company typically retains mortgage-servicing rights related to sold loans.
Allowance for Loan Losses
Management analyzes the adequacy of the allowance for loan losses on a monthly basis using an internal analysis model. No less than quarterly but often on a more frequent basis, the Company’s allowance for loan losses model and conclusions are reviewed and approved by senior management. The allowance for loan losses is a reserve established through a provision for loan losses charged to expense. The allowance for loan losses represents management’s best estimate of probable losses that have been incurred within the existing portfolio of loans. The allowance for loan losses is necessary to reserve for estimated loan losses and risks inherent in the loan portfolio. The Company’s allowance for loan loss methodology is based on guidance provided in
101
PALMETTO BANCSHARES, INC. AND SUBSIDIARY
Notes To Consolidated Financial Statements—(Continued)
SAB No. 102 and includes allocations calculated in accordance with SFAS No. 114, as amended by SFAS No. 118, and allocations calculated in accordance with SFAS No. 5. Accordingly, the methodology is based on historical loss experience by type of loans, specific homogeneous risk pools, and specific loss allocations. The Company’s process for determining the appropriate level of the allowance for loan losses is designed to account for asset deterioration as it occurs. The provision for loan losses reflects loan quality trends, including the levels of and trends related to nonaccrual loans, potential problem loans, criticized loans, and net loans charged-off or recovered, among other factors.
The level of the allowance for loan losses reflects management’s continuing evaluation of specific lending risks, loan loss experience, current loan portfolio quality, present economic, political and regulatory conditions, and unidentified losses inherent in the current loan portfolio. Portions of the allowance for loan losses may be allocated for specific loans. However, the entire allowance for loan losses is available for any loan that, in management’s judgment, should be charged-off. While management utilizes its best judgment and information available to it, the ultimate adequacy of the allowance for loan losses depends on a variety of factors beyond the Company’s control, including the performance of the Company’s loan portfolio, the economy, changes in interest rates, and the view of the regulatory authorities toward loan classifications.
The Company records allowances for losses on specific loans when, based on current information and events, it is probable that the Company will be unable to collect all amounts due according to the contractual terms of the loan. Specific allowances for loans considered individually significant and that exhibit probable or observed weaknesses are determined by analyzing the borrower’s ability to repay amounts owed, collateral deficiencies, the relative risk grade of the loan, and economic conditions impacting the borrower’s industry, among other things. If, after review, a specific allowance is not assigned to the loan, and the loan is not considered to be impaired, the loan is included with a pool of similar loans that is assigned a historical allowance calculated based on historical loss experience.
Historical allowances are calculated based on the historical loss experience of specific types of loans. The Company calculates historical loss ratios for pools of similar loans with similar characteristics based on the proportion of actual loans charged-off to the total population of loans in the pool. Management is currently using a five year lookback period when computing historical loss rates to determine the allocated component of the allowance for loan losses. A historical allowance is established for each pool of similar loans based upon the product of the historical loss ratio and the total dollar amount of the loans in the pool. The Company’s pools of similar loans include similarly risk-graded groups of commercial and industrial loans, real estate loans, general consumer loans, and bankcard loans.
General allowances are based on general economic conditions and other qualitative risk factors both internal and external to the Company. In general, these allowances are determined by evaluating, among other things, the experience, ability and effectiveness of the Bank’s lending management and staff, the effectiveness of the Company’s loan policies, procedures and internal controls, changes in asset quality, changes in loan portfolio volume, the composition and concentrations of the loan portfolio, the impact of competition on loan structuring and pricing, the effectiveness of the internal loan review function, the impact of environmental risks on portfolio risks, and the impact of rising interest rates on portfolio risk.
Loans identified as losses by management, internal loan review, or bank examiners are charged-off. In addition, consumer loan accounts are charged-off based on regulatory requirements.
In addition to the Company’s portfolio review process, various regulatory agencies periodically review the Company’s allowance for loan losses. These agencies may require the Company to recognize additions to the allowance for loan losses based on their judgments and information available to them at the time of their
102
PALMETTO BANCSHARES, INC. AND SUBSIDIARY
Notes To Consolidated Financial Statements—(Continued)
examinations. While the Company uses available information to recognize inherent losses on loans, future adjustments to the allowance for loan losses may be necessary based on changes in economic conditions and other factors and the impact of such changes and other factors on the Bank’s borrowers.
Loans held for sale are carried at the lower of cost or fair value. Typically, the carrying amount approximates fair value due to the Company’s practice of selling these loans within 60 days of origination. Therefore, these instruments are not included in the assumptions related to the allowance for loan losses model.
See Note 4 for further discussion regarding the Company’s allowance for loan losses.
Impaired Loans. The Bank accounts for its impaired loans in accordance with SFAS No. 114, as amended by SFAS No. 118, which requires that creditors value, at their respective fair values, all specifically reviewed nonhomogenous loans with respect to which it is probable that the creditors will be unable to collect all amounts due according to the terms of the loan agreements. Fair value may be determined based upon the present value of expected cash flows, the market price of the loan, if available, or the value of the underlying collateral. Expected cash flows are required to be discounted at the loan’s effective interest rate.
The Company considers a loan to be impaired when, based upon current information and events, management believes it is probable that the Company will be unable to collect all amounts due according to the contractual terms of the loan agreement. The Company’s impaired loans include loans identified as impaired through review of its nonhomogeneous portfolio and troubled debt restructurings. SFAS No. 114 states that the pronouncement need not be applied to large groups of smaller-balance homogeneous loans that are collectively evaluated for impairment. Thus, the Company determined that SFAS No. 114 does not apply to its installment, credit card, or residential mortgage loan portfolios, except that it may choose to apply such provision to certain specific larger loans as determined by management. Specific allowance for loan losses amounts are established on impaired loans, if deemed necessary, for the difference between the loan amount and the fair value less estimated selling costs. Impaired loans may be left on accrual status while the Company is pursuing repayment of the loan. Impairment losses are recognized through a charge to the allowance for loan losses and a corresponding charge to the provision for loan losses. Adjustments to impairment losses due to changes in the fair value of the collateral properties for impaired loans are also recognized through a charge to the allowance for loan losses and a corresponding charge to the provision for loan losses. When an impaired loan is sold, transferred to the Company’s real estate acquired in settlement of loans portfolio, or written-down, any specific allowance for loan losses amounts is removed, as it is no longer necessary to properly record the loan at its fair value.
The Company considers a loan to be impaired when, based on current information and events, the Company determines that it will not be able to collect all amounts due according to the loan contract, including scheduled interest payments.
When the Company identifies a loan as impaired, management measures the impairment based on an observable market price or the current fair value of the collateral, less selling costs when foreclosure is probable. The present value of expected future cash flows, discounted at the loan’s effective interest rate, may also be utilized.
If the Company determines that the value of the impaired loan is less than the recorded investment in the loan (net of previous charge-offs, deferred loan fees or costs and unamortized premium or discount), it recognizes impairment through a specific allowance reserve or a charge-off to the allowance.
Troubled Debt Restructurings. In situations where, for economic or legal reasons related to a borrower’s financial difficulties, the Company grants a concession to the borrower that it would not otherwise consider, the
103
PALMETTO BANCSHARES, INC. AND SUBSIDIARY
Notes To Consolidated Financial Statements—(Continued)
related loan is classified as a troubled debt restructuring. The restructuring of a loan may include the transfer from the borrower to the company of real estate, receivables from third parties, other assets, or an equity interest in the borrower in full or partial satisfaction of the loan, a modification of the loan terms, or a combination of the above.
See Note 4 for further discussion regarding the Company’s impaired loans.
Premises and Equipment, net
Land is reported at cost. Building and improvements, furniture and equipment, and software are carried at cost, less accumulated depreciation, computed principally by the straight-line method based on the estimated useful lives of the related asset. Estimated lives range from twelve to thirty-nine years for buildings and improvements and from five to twelve years for furniture and equipment. Estimated lives range from three to five years for computer software. Estimated lives of Bank automobiles are typically five years. Leasehold improvements are generally depreciated over the lesser of the term of the respective lease or the estimated useful lives of the improvements.
Depreciation with regard to improvements to premises and equipment leased by the Company is recorded in accordance with Emerging Issues Task Force Abstract No. 05-06, “Determining the Amortization Period for Leasehold Improvements Purchased after Lease Inception or Acquired in a Business Combination.”
Maintenance and repairs of such premises and equipment are charged to expense as incurred. Improvements that extend the useful lives of the respective assets are capitalized. Accelerated depreciation is utilized on certain assets for income tax purposes as allowed by taxing authorities.
See Note 5 for further discussion regarding the Company’s premises and equipment, net.
Impairment of Long-Lived Assets
The Company periodically reviews the carrying value of its long-lived assets including, but not limited to, premises and equipment, for impairment when events or circumstances indicate that the carrying amount of such assets may not be fully recoverable. For long-lived assets to be held and used, impairments are recognized when the carrying amount of a long-lived asset is not recoverable and exceeds its fair value. The carrying amount of a long-lived asset is not recoverable if it exceeds the sum of the undiscounted cash flows expected to result from the use and eventual disposition of the asset. An impairment loss is the amount by which the carrying amount of a long-lived asset exceeds its fair value.
Long-lived assets to be sold are classified as held for sale and are no longer depreciated. Certain criteria must be met in order for the long-lived asset to be classified as held for sale, including that a sale is probable and expected to occur within a one year period. Long-lived assets classified as held for sale are recorded at the lower of carrying amount or fair value less the estimated costs to sell. During 2008, the Company classified two parcels of land with a carrying amount approximating $1.7 million at December 31, 2008, as held for sale. These parcels are expected to be purchased from the Company during the first quarter of 2009, at the carrying amount, in conjunction with the construction of the Company’s corporate headquarters in downtown Greenville. The Company had long-lived asset classified as held for sale at December 31, 2007.
During 2008, the Company consolidated its existing banking office network, reducing the number of banking offices by four. Three of the consolidated banking offices were leased, and the company owned one. Additionally, during 2008, the Company relocated its existing Pendleton banking office in Anderson
104
PALMETTO BANCSHARES, INC. AND SUBSIDIARY
Notes To Consolidated Financial Statements—(Continued)
County. This banking office was also owned. Management is currently considering options with regard to the previous Pendleton banking office that is owned by the Company and the premises relating to the consolidated banking offices (three of which are leased and one of which is owned by the Company). Therefore, at December 31, 2008, the long-lived assets associated with these locations have not been classified as held for sale. Such assets will continue to be depreciated until which time it is determined that a sale is probable and expected to occur within a one year period. The book value of these properties totaled $607 thousand at December 31, 2008.
The Company recorded no impairment loss relative to its long-lived assets for the years ended December 31, 2008, 2007, and 2006.
Long-lived assets to be disposed of by abandonment or in an exchange for similar productive long-lived assets are classified as held for sale and used until disposed. The Company had no such assets at December 31, 2008 or 2007.
Goodwill and Core Deposit Intangibles
Intangible assets are acquired assets that lack physical substance but can be distinguished from goodwill because of contractual or other legal rights or because the asset is capable of being sold or exchanged either on its own or in combination with a related contract, asset, or liability. The Company’s intangible assets include goodwill and core deposit intangibles.
Goodwill represents the excess of the cost of businesses acquired over the fair value of the net assets acquired. Goodwill is assigned to reporting units. Goodwill is then tested for impairment at least annually, or on an interim basis if an event occurs or circumstances arise that would more likely than not reduce the fair value of the reporting unit below its carrying value. Once an impairment loss is recognized, future increases in fair value do not result in the reversal of previously recognized losses. The Company performs its annual impairment testing as of June 30. The Company’s impairment testing as of June 30, 2008, 2007, and 2006 indicated that no impairment charge was required as of those dates.
The Company amortizes core deposit intangibles on an accelerated basis based on useful lives not exceeding 10 years. The Company reviews such intangibles for impairment whenever events or changes in circumstances indicate that their carrying amounts may not be recoverable. Impairment is indicated if the sum of undiscounted estimated future net cash flows is less than the carrying value of the asset. Impairment is permanently recognized by writing down the asset to the extent that the carrying value exceeds the estimated fair value.
See Note 6 for further discussion regarding the Company’s core deposit intangibles.
Mortgage-Servicing Rights Portfolio
The Company accounts for its mortgage-servicing rights portfolio in accordance with SFAS No. 156, “Accounting for Servicing of Financial Assets—an amendment of FASB Statement No. 140,” which requires the Company to recognize a servicing asset or servicing liability each time it undertakes an obligation to service a financial asset by entering into a servicing contract when the transfer of financial assets meets the requirements for sale accounting, when the servicer’s financial assets are transferred to a qualifying special-purpose entity in a guaranteed mortgage securitization in which the transferor retains all of the resulting securities and classifies them as either available-for-sale securities or trading securities in accordance with SFAS No. 115, or when a transfer occurs as a result of an acquisition or assumption of an obligation to service a financial asset that does not relate to financial assets of the servicer or its consolidated affiliates. This Statement requires all separately recognized servicing assets and servicing liabilities to be initially measured at fair value, if practicable, and
105
PALMETTO BANCSHARES, INC. AND SUBSIDIARY
Notes To Consolidated Financial Statements—(Continued)
permits an entity to choose either the amortization or fair value measurement method for each class of separately recognized servicing assets and servicing liabilities. The Company determines the fair value of mortgage- servicing rights at the date of transfer using the present value of estimated future net servicing income, using assumptions that market participants use in their estimates of values. SFAS No. 156 also requires separate presentation of servicing assets and servicing liabilities subsequently measured at fair value in the statement of financial position and additional disclosures for all separately recognized servicing assets and servicing liabilities. Gain or loss on sale of loans depends on proceeds received and the previous carrying amount of the financial assets transferred and any interests the Company continues to hold, if any, based on relative fair value at the date of transfer. Effective on January 1, 2007, the Company elected the amortization measurement method for the measurement of servicing assets and liabilities. The Company’s mortgage-servicing rights portfolio is included in other assets on the Consolidated Balance Sheets.
The Company utilizes the expertise of a third party consultant on a quarterly basis to assess the portfolio’s fair value including, but not limited to, capitalization, impairment, and amortization rates. The consultant estimates the amount and timing of prepayment rates, loan loss experience, costs to service loans, and discount rates to determine an estimate of the fair value of the Company’s mortgage-servicing rights portfolio. Management believes that the modeling techniques and assumptions used by the consultant are reasonable. Amortization of the mortgage-servicing rights portfolio is based on the ratio of net servicing income received in the current period to total net servicing income projected to be realized from the mortgage-servicing rights portfolio. Projected net servicing income is determined based on the estimated future balance of the underlying mortgage loan portfolio that declines over time from prepayments and scheduled loan amortization. Future prepayment rates are estimated based on current interest rate levels, other economic conditions, market forecasts, and relevant characteristics of the mortgage-servicing rights portfolio, such as loan types, interest rate stratification, and recent prepayment experience. Impairment valuations are based on projections using a discounted cash flow method that includes assumptions regarding prepayments, interest rates, servicing costs, and other factors. Impairment is measured on a disaggregated basis for each stratum of the mortgage-servicing rights portfolio, which is segregated based on predominate risk characteristics, including interest rate and loan type. The Company’s established impairment valuation allowance records estimated impairment for the mortgage-servicing rights portfolio. Subsequent increases in value are recognized by the Company to the extent of the impairment valuation allowance.
See Note 7 for further discussion regarding the Company’s mortgage-servicing rights portfolio.
Real Estate Acquired in Settlement of Loans
Real estate acquired in settlement of loans is recorded, when acquired, in other assets on the Consolidated Balance Sheets at the lower of cost or fair value minus estimated selling costs, establishing a new cost basis. Fair value of such real estate is reviewed regularly and writedowns are recorded when it is determined that the carrying value of the real estate exceeds the fair value less estimated costs to sell. Writedowns resulting from the periodic reevaluation of such properties, costs related to holding such properties, and gains and losses on the sale of foreclosed properties are charged against the Company’s income. Costs relating to the development and improvement of such property are capitalized.
See Note 8 for further discussion regarding the Company’s real estate acquired in settlement of loans.
FHLB Borrowings
FHLB borrowings are a source of funding that the Company may utilize if it has unused FHLB borrowing capacity and collateral to secure FHLB borrowings. The Company uses these borrowings to fund increases in
106
PALMETTO BANCSHARES, INC. AND SUBSIDIARY
Notes To Consolidated Financial Statements—(Continued)
interest-earning assets in times of declines in alternative funding sources. Short-term borrowings typically represent overnight borrowings, and long-term borrowings typically have maturities greater than one year when made. Interest rates on such borrowings vary in response to general economic conditions.
The FHLB generally establishes credit availability for each creditworthy institution. Credit availability is not a formal commitment to extend credit but an indication of the amount of credit the FHLB is willing to extend to a borrower. The FHLB monitors each borrower’s credit availability on a periodic basis and may make adjustments to the credit availability as needed. The amount of a borrower’s credit availability depends on a number of factors, including, but not limited to, the continued financial soundness of the borrower and the adequacy of the amount of collateral available to secure new advances. The FHLB, in its sole discretion, may rescind a borrower’s credit availability at any time.
The FHLB has generally established an overall credit limit for each borrower. This limit is designed to limit the FHLB’s credit exposure with respect to an individual borrower, while encouraging borrowers to diversify funding sources. Generally, this credit limit may not exceed 50 percent of the borrower’s total assets. In addition, a borrower’s eligibility to borrow in excess of 30 percent of assets is subject to eligibility criteria outlined in the FHLB’s Credit and Collateral Policy. The Company’s current credit availability is 20% of total assets. The Company may utilize 100% of this availability for advances convertible from variable to fixed.
To borrow from the FHLB, members must pledge collateral to secure advances and letters of credit. Acceptable collateral includes a variety of single-family residential loans, commercial real estate loans, home equity lines of credit, and multifamily residential loans as well as a number of types of securities.
The FHLB may assess fees and charges to cover costs relating to the receipt, holding, redelivery, and reassignment of the Company’s collateral. The FHLB publishes a schedule of these fees and charges on its website. In addition, the FHLB may assess fees to cover collateral verification reviews performed by, or on behalf of, the FHLB. Historically, any such fees have not been significant nor does the Company anticipate such future fees, if assessed, will be significant.
Any FHLB advance with a fixed interest rate is subject to a prepayment fee in the event of full or partial repayment prior to maturity or the expiration of any interim interest rate period. Historically, the Company has not made full or partial repayment prior to maturity or the expiration of any interim interest rate period.
See Note 10 for further discussion regarding the Company’s borrowings from the FHLB.
Comprehensive Income
The Company reports comprehensive income in accordance with SFAS No. 130, “Reporting Comprehensive Income,” which establishes standards for the reporting and presentation of comprehensive income and its components in financial statements. In accordance with SFAS No. 130, the Company has elected to disclose changes in comprehensive income in its Consolidated Statements of Changes in Shareholders’ Equity and Comprehensive Income. Comprehensive income includes all changes in shareholders’ equity during a period, except those resulting from transactions with shareholders.
107
PALMETTO BANCSHARES, INC. AND SUBSIDIARY
Notes To Consolidated Financial Statements—(Continued)
Accumulated Other Comprehensive Loss. The following table summarizes the components of accumulated other comprehensive loss, for the periods indicated (in thousands).
| | | | | | | | | | | | | | | | |
| | | Impact
of SFAS
No. 158 | | | Impact of
curtailment | | | Total
impact of
defined
benefit
pension
plan | | | Impact of
investment
securities
available
for sale | | | Total | |
Accumulated other comprehensive income (loss), after income tax impact, December 31, 2006 | | $ | — | | | — | | | — | | | (695 | ) | | (695 | ) |
Accumulated other comprehensive income (loss), before income tax impact | | $ | (6,334 | ) | | 2,508 | | | (3,826 | ) | | 720 | | | (3,106 | ) |
Income tax impact | | | 2,218 | | | (878 | ) | | 1,340 | | | (277 | ) | | 1,063 | |
| | | | | | | | | | | | | | | | |
Accumulated other comprehensive income (loss), after income tax impact | | $ | (4,116 | ) | | 1,630 | | | (2,486 | ) | | 443 | | | (2,043 | ) |
| | | | | | | | | | | | | | | | |
Accumulated other comprehensive income (loss), after income tax impact, December 31, 2007 | | $ | (4,116 | ) | | 1,630 | | | (2,486 | ) | | (252 | ) | | (2,738 | ) |
| | | | | | | | | | | | | | | | |
Accumulated other comprehensive income (loss), before income tax impact | | $ | (3,092 | ) | | — | | | (3,092 | ) | | (2,201 | ) | | (5,293 | ) |
Income tax impact | | | 1,082 | | | — | | | 1,082 | | | 832 | | | 1,914 | |
| | | | | | | | | | | | | | | | |
Accumulated other comprehensive income (loss), after income tax impact | | $ | (2,010 | ) | | — | | | (2,010 | ) | | (1,369 | ) | | (3,379 | ) |
| | | | | | | | | | | | | | | | |
Accumulated other comprehensive income (loss), after income tax impact, December 31, 2008 | | $ | (6,126 | ) | | 1,630 | | | (4,496 | ) | | (1,621 | ) | | (6,117 | ) |
| | | | | | | | | | | | | | | | |
Income Taxes
The Company files consolidated federal and state income tax returns. Federal income tax expense or benefit has been allocated to subsidiaries on a separate return basis. The Company accounts for income taxes in accordance with SFAS No. 109, “Accounting for Income Taxes,” as interpreted by FASB Interpretation (“FIN”) No. 48, “Accounting for Uncertainty in Income Taxes – an interpretation of FASB Statement No. 109,” resulting in two components of income tax expense: current and deferred. Current income tax expense approximates taxes to be paid or refunded for the current period and includes income tax expense related to the Company’s uncertain tax positions. The Company determines deferred income taxes using the balance sheet method. Under this method, the net deferred tax asset or liability is based on the tax impacts of the differences between the book and tax bases of assets and liabilities, and recognizes enacted changes in tax rates and laws in the period in which they occur. Deferred income tax expense results from changes in deferred tax assets and liabilities between periods. Deferred tax assets are recognized subject to management’s judgment that realization is more likely than not. A tax position that meets the more likely than not recognition threshold is measured to determine the amount of benefit to recognize. The tax position is measured at the largest amount of benefit that is greater than 50% likely of being realized upon settlement. Interest and penalties, if any, are recognized as a component of income tax expense.
See Note 11 for further discussion regarding the Company’s income taxes.
108
PALMETTO BANCSHARES, INC. AND SUBSIDIARY
Notes To Consolidated Financial Statements—(Continued)
Net Income per Common Share
Basic income per common share is based on net income divided by the weighted average number of common shares outstanding during the period. Diluted income per share reflects the potential dilution that could occur if securities or other contracts to issue common stock, such as stock options, result in the issuance of common stock that share in the income of the Company. A reconciliation of the weighted average shares used in calculating basic income per common share and the weighted average common shares used in calculating diluted income per common share for the reported periods is provided in Note 14.
Employee Benefit Plan—Defined Benefit Pension Plan
Historically, as part of its comprehensive employment program, the Company offered a noncontributory, defined benefit pension plan that covered all full-time employees having at least twelve months of continuous service and having attained age 21. The plan was originally designed to produce a designated retirement benefit, and benefits were fully vested after five years of service. No vesting occurred until five years of service had been achieved. The Company’s trust department administers the plan’s assets. Contributions to the plan were made as required by the Employee Retirement Income Security Act of 1974.
The Company accounts for its defined benefit pension plans using an actuarial model required by SFAS No. 87. This model allocates pension costs over the service period of employees in the plan. The underlying principle is that employees render service ratably over this period and, therefore, the income statement impacts of pensions should follow a similar pattern.
SFAS No. 158 was issued in September 2006 and became effective for the Company on December 31, 2007. SFAS No. 158 requires the Company to recognize the funded status of its pension and postretirement benefit plans on the balance sheet. Additionally, SFAS No. 158 required the Company to use a year end measurement date beginning in 2008. The Company conformed its pension asset and pension and postretirement liabilities to SFAS No. 158 and recorded a corresponding reduction of $4.1 million, after-tax, to the December 31, 2007, balance of accumulated other comprehensive income (loss) in stockholders’ equity relative to the adoption of SFAS No. 158. SFAS No. 158 does not change the amount of net periodic benefit expense charged to income.
One of the principal components of the net periodic pension expense calculation is the expected long-term rate of return on plan assets. The use of an expected long-term rate of return on plan assets may cause the Company to recognize pension income returns that are greater or less than the actual returns of plan assets in any given year.
The expected long-term rate of return is designed to approximate the actual long-term rate of return over time and is not expected to change significantly. Therefore, the pattern of income / expense recognition should closely match the stable pattern of services provided by the Company’s employees over the life of the Company’s pension obligation. To ensure that the expected rate of return is reasonable, management considers such factors as long-term historical return experience for major asset class categories and considers any material forward-looking return expectations for these major asset classes. Differences between expected and actual returns in each year, if any, are included in the net actuarial gain or loss amount, which is recognized in other comprehensive income. The Company generally amortizes any net actuarial gain or loss in excess of a predetermined corridor (as defined in SFAS No. 87) in net periodic pension expense calculations over the coming five years. Expected returns on defined benefit pension plan assets are developed by the Company in conjunction with input from external advisors and take into account long-term expectations for future returns and investment strategy.
109
PALMETTO BANCSHARES, INC. AND SUBSIDIARY
Notes To Consolidated Financial Statements—(Continued)
The Company uses a discount rate to determine the present value of its future benefit obligations. The discount rate reflects the rates available at the measurement date on long-term, high-quality, fixed-income debt instruments and is reset annually on the measurement date.
During the fourth quarter of 2007, the Company notified employees that, effective 2008, it would cease accruing pension benefits for employees with regard to the Company’s noncontributory, defined benefit pension plan. Although no previously accrued benefits will be lost, employees will no longer accrue benefits for service subsequent to 2007.
See Note 12 for further discussion regarding the Company’s defined benefit pension plan.
Equity Based Compensation—Stock Option Plan
Prior to January 1, 2006, employee compensation expense under the Company’s stock option plan was reported only if options were granted below market price at grant date in accordance with the intrinsic value method of Accounting Principles Board (“APB”) Opinion No. 25, “Accounting for Stock Issued to Employees,” and related interpretations. Because the exercise price of the Company’s employee stock options always equaled the market price of the underlying stock on the date of grant, no compensation expense was recognized on equity based awards granted. The Company adopted the provisions of SFAS No. 123R, “Share Based Payment,” on January 1, 2006. SFAS No. 123R eliminates the ability to account for equity based compensation using APB No. 25 and requires that such transactions be recognized as compensation cost in the income statement based on their fair value on the measurement date, which, for the Company, is the date of the grant. The Company transitioned to fair value based accounting for equity based compensation using a modified version of prospective application (“modified prospective application”). Under the modified prospective application, as it is applicable to the Company, SFAS No. 123R applies to new awards and to awards modified, repurchased, or cancelled after January 1, 2006. Additionally, compensation cost for the portion of awards for which the requisite service has not been rendered (generally referring to nonvested awards) that were outstanding as of January 1, 2006 will be recognized as the remaining requisite service is rendered during the period of and / or the periods after the adoption of SFAS No. 123R. The attribution of compensation cost for those earlier awards is based on the same method and on the same grant date fair values previously determined for the pro forma disclosures required for companies that did not previously adopt the fair value accounting method for equity based employee compensation.
See Note 13 for further discussion regarding the Company’s stock option plan.
Derivative Financial Instruments and Hedging Activities
The Company uses derivatives to manage exposure to risk and to assist customers with their risk management objectives. Derivative transactions are measured in terms of the notional amount, but this amount is not, when viewed in isolation, a meaningful measure of the risk profile of the instruments. The notional amount is generally not exchanged, but is used only as the basis on which interest and other payments are determined. The Company’s approach to managing interest rate risk includes the use of derivatives.
The Company offers derivatives to its customers but usually offsets exposure from such contracts by purchasing other financial contracts. The customer accommodations and any offsetting financial contracts are treated as freestanding derivatives. To a lesser extent, the Company takes positions based on market expectations or to benefit from price differentials between financial instruments and markets.
110
PALMETTO BANCSHARES, INC. AND SUBSIDIARY
Notes To Consolidated Financial Statements—(Continued)
The Company uses freestanding derivatives to hedge the risk of changes in derivative loan commitments, with the resulting gain or loss reflected in income. Interest rate lock commitments for residential mortgage loans that the Company intends to sell are considered freestanding derivatives. The Company’s interest rate exposure on these derivative loan commitments is hedged with freestanding derivatives such as forwards contracts. The commitments and freestanding derivatives are carried at fair value with changes in fair value, if material, included in income. For interest rate lock commitments issued prior to January 1, 2008, the Company recorded a zero fair value for the derivative loan commitment at inception consistent with SAB No. 105. Effective January 1, 2008, the Company was required by SAB No. 109 to include, at inception and during the life of the loan commitment, the expected net future cash flows related to the associated servicing of the loan as part of the fair value measurement of derivative loan commitments. The implementation of SAB No. 109 did not have a material impact on the Company’s financial position, results of operations, or cash flows or the valuation of its loan commitments. Changes subsequent to inception are based on changes in fair value of the underlying loan resulting from the exercise of the commitment and changes in the probability that the loan will not fund within the terms of the commitment (referred to as a fall-out factor). The value of the underlying loan is impacted primarily by changes in interest rates and the passage of time. However, changes in investor demand, such as concerns about credit risk, can also cause changes in the spread relationships between underlying loan value and the derivative financial instruments that cannot be hedged. The aggregate fair value of derivative loan commitments and freestanding derivatives at December 31, 2008 and 2007 were immaterial.
To a lesser extent, the Company takes positions based on market expectations or to benefit from price differentials between financial instruments and markets. These derivatives are not linked to specific assets and liabilities in the Consolidated Balance Sheet or to forecasted transactions in an accounting hedge relationship and, therefore, do not qualify for hedge accounting. The Company may also enter into freestanding derivatives for risk management that do not otherwise qualify for hedge accounting. If applicable, such derivatives are carried at fair value with changes in fair value recorded as part of income.
See Note 16 for further discussion regarding the Company’s derivative financial instruments.
Fair Valuation of Financial Instruments
The Company uses fair value measurements to record fair value adjustments to certain financial instruments and to determine fair value disclosures. Additionally, from time to time, the Company may be required to record at fair value other assets on a nonrecurring basis. These nonrecurring fair value adjustments typically involve application of lower-of-cost-or-market accounting or writedowns of individual assets. Further, the Company includes in Notes to Financial Statements information about the extent to which fair value is used to measure assets and liabilities, the valuation methodologies used, and its impact to income. Additionally, for financial instruments not recorded at fair value, the Company discloses the estimate of their fair value.
SFAS No. 157 defines fair value as the price that would be received to sell the financial asset or paid to transfer the financial liability in an orderly transaction between market participants at the measurement date.
SFAS No. 157 establishes a three-level hierarchy for disclosure of assets and liabilities recorded at fair value. The classification of assets and liabilities within the hierarchy is based on whether the inputs to the valuation methodology used for measurement are observable or unobservable. Observable inputs reflect market-derived or market-based information obtained from independent sources, while unobservable inputs reflect the Company’s estimates about market data.
| | • | | Level 1 – Valuation is based upon quoted prices for identical instruments traded in active markets. Level 1 instruments include securities traded on active exchange markets, such as the New York Stock Exchange, as well as U.S. Treasury and other U.S. government securities that are traded by dealers or brokers in active over-the-counter markets. |
111
PALMETTO BANCSHARES, INC. AND SUBSIDIARY
Notes To Consolidated Financial Statements—(Continued)
| | • | | Level 2 – Valuation is based upon quoted prices for similar instruments in active markets, quoted prices for identical or similar instruments in markets that are not active, and model-based valuation techniques, such as matrix pricing, for which all significant assumptions are observable in the market. Level 2 instruments include securities traded in less active dealer or broker markets and mortgage loans held for sale that are valued based on prices for other mortgage whole loans with similar characteristics. |
| | • | | Level 3 – Valuation is generated from model-based techniques that use significant assumptions not observable in the market. These unobservable assumptions reflect the Company’s estimates of assumptions market participants would use in pricing the asset or liability. Valuation techniques include use of option pricing models, discounted cash flow models, and similar techniques. |
In accordance with SFAS No. 157, it is the Company’s policy to maximize the use of observable inputs and minimize the use of unobservable inputs when developing fair value measurements. When available, management uses quoted market prices to measure fair value. If market prices are not available, fair value measurement is based upon models that use primarily market-based or independently-sourced market parameters. Most of the Company’s financial instruments use either of the foregoing methodologies, collectively Level 1 and Level 2 measurements, to determine fair value adjustments recorded to its financial statements. However, in certain cases, when market observable inputs for model-based valuation techniques may not be readily available, management is required to make judgments about assumptions market participants would use in estimating the fair value of the financial instrument.
The degree of management judgment involved in determining the fair value of a financial instrument is dependent upon the availability of quoted market prices or observable market parameters. For financial instruments that trade actively and have quoted market prices or observable market parameters, there is minimal subjectivity involved in measuring fair value. When observable market prices and parameters are not fully available, management judgment is necessary to estimate fair value. In addition, changes in the market conditions may reduce the availability of quoted prices or observable data. For example, reduced liquidity in the capital markets or changes in secondary market activities could result in observable market inputs becoming unavailable. When significant adjustments are required to available observable inputs, it may be appropriate to utilize an estimate based primarily on unobservable inputs. When an active market for a security does not exist, the use of management estimates that incorporate current market participant expectations of future cash flows, and include appropriate risk premiums, is acceptable.
Significant judgment may be required to determine whether certain assets measured at fair value are included in Level 2 or Level 3. If fair value measurement is based upon recent observable market activity of such assets or comparable assets (other than forced or distressed transactions) that occur in sufficient volume and do not require significant adjustment using unobservable inputs, those assets are classified as Level 2. If not, they are classified as Level 3. Making this assessment requires significant judgment. At December 31, 2008, $54.6 million of investment securities available for sale were classified as Level 3 because significant inputs to the valuation became unobservable, largely due to reduced levels of market liquidity.
SFAS No. 107, “Disclosures about Fair Value of Financial Instruments,” requires disclosure of fair value information about financial instruments, whether or not recognized in the Company’s Consolidated Balance Sheets, when it is practicable to estimate fair value. Disclosures include estimated fair values for financial instruments for which it is practicable to estimate fair value. These estimates are made at a specific point in time based on relevant market data and information about the financial instruments. These estimates do not reflect any premium or discount that could result from offering the Company’s entire holdings of a particular financial instrument for sale at one time, nor do they attempt to estimate the value of anticipated future business related to the instruments. SFAS No. 107 defines a financial instrument as cash, evidence of an ownership interest in an
112
PALMETTO BANCSHARES, INC. AND SUBSIDIARY
Notes To Consolidated Financial Statements—(Continued)
entity or contractual obligations, which require the exchange of cash, or other financial instruments. Certain items are specifically excluded from the disclosure requirements, including the Company’s common stock, premises and equipment, accrued interest receivable and payable, and other assets and liabilities. Accordingly, the aggregate fair value amounts presented do not represent the underlying value of the Company.
See Note 17 for further discussion regarding the Company’s fair value of financial instruments.
Recently Adopted Accounting Pronouncements
Following is a summary of applicable accounting pronouncements adopted by the Company during the year ended December 31, 2008.
In September 2006, the FASB issued SFAS No. 157 that provides guidance for using fair value to measure assets and liabilities but does not expand the use of fair value in any circumstance. SFAS No. 157 also requires expanded disclosures about the extent to which a company measures assets and liabilities at fair value, the information used to measure fair value, and the impact of fair value measurements on an entity’s financial statements. The statement applies when other standards require or permit assets and liabilities to be measured at fair value. SFAS No. 157 was effective for the Company for fiscal and interim periods beginning on January 1, 2008. Subsequently, in February 2008, the FASB issued FASB Staff Position (“FSP”) No. 157-2, “Effective Date of FASB Statement No. 157,” which delayed the effective date of SFAS No. 157 for nonrecurring, nonfinancial instruments to fiscal years beginning after November 15, 2008. The Company adopted SFAS No. 157 for recurring instruments and nonrecurring, financial instruments on January 1, 2008. Because SFAS No. 157 provides guidance and amends only the disclosure requirements for fair value measurements, its adoption did not have a material impact on the Company’s financial position, results of operations, or cash flows.
In February 2007, the FASB issued SFAS No. 159, “The Fair Value Option for Financial Assets and Financial Liabilities—Including an amendment of FASB Statement No. 115.” SFAS No. 159 permits entities to choose to measure eligible items at fair value at specified election dates. Unrealized gains and losses on items for which the fair value option has been elected are reported in income at each subsequent reporting date. The fair value option may be applied instrument by instrument, with certain exceptions, is irrevocable (unless a new election date occurs), and is applied only to entire instruments and not to portions of instruments. SFAS No. 159 was effective for the Company on January 1, 2008. The Company did not elect the fair value option for any financial assets or liabilities as of January 1, 2008. Its adoptions did not have a material impact on the Company’s financial position, results of operations, or cash flows.
In March 2007, the FASB ratified the consensus reached by the Emerging Issues Task Force (“EITF”) in Issue No. 06-10, “Accounting for Collateral Assignment Split-Dollar Life Insurance Arrangements.” The EITF’s consensus concluded that an employer should recognize a liability for the postretirement benefit related to a collateral assignment split-dollar life insurance arrangement in accordance with either SFAS No. 106,“Employers’ Accounting for Postretirement Benefits Other Than Pension,” (if, in substance, a postretirement benefit plan exists) or APB Opinion No. 12, “Omnibus Opinion—1967,” (if the arrangement is, in substance, an individual deferred compensation contract) if the employer has agreed to maintain a life insurance policy during the employee’s retirement or provide the employee with a death benefit based on the substantive agreement with the employee. Additionally, the EITF concluded that an employer should recognize and measure an asset based on the nature and substance of the collateral assignment split-dollar life insurance arrangement. The EITF observed that in determining the nature and substance of the arrangement, the employer should assess what future cash flows the employer is entitled to, if any, as well as the employee’s obligation and ability to repay the employer. The consensus in this Issue is effective for fiscal years beginning after December 15, 2007, including interim periods within those
113
PALMETTO BANCSHARES, INC. AND SUBSIDIARY
Notes To Consolidated Financial Statements—(Continued)
fiscal years with earlier application permitted. The consensus further directed entities to recognize the impacts of applying the consensus in this Issue through either a change in accounting principle through a cumulative-effect adjustment to retained earnings or to other components of equity or net assets in the statement of financial position as of the beginning of the year of adoption or a change in accounting principle through retrospective application to all prior periods. The Company adopted EITF No. 06-10 on January 1, 2008 as a change in accounting principle through a cumulative-effect adjustment to retained earnings totaling $99 thousand.
In November 2007, the SEC issued SAB No. 109, which expressed the views of the staff regarding written loan commitments that are accounted for at fair value through income under generally accepted accounting principles. SAB No. 105 provided the views of the staff regarding derivative loan commitments that are accounted for at fair value through income pursuant to SFAS No. 133, “Accounting for Derivative Instruments and Hedging Activities.” SAB No. 105 stated that in measuring the fair value of a derivative loan commitment, the staff believed it would be inappropriate to incorporate the expected net future cash flows related to the associated servicing of the loan. This SAB superseded SAB No. 105 and expressed the current view of the staff that, consistent with the guidance in SFAS No. 156 and SFAS No. 159, the expected net future cash flows related to the associated servicing of the loan should be included in the measurement of all written loan commitments that are accounted for at fair value through income. SAB No. 105 also indicated that the staff believed that internally developed intangible assets (such as customer relationship intangible assets) should not be recorded as part of the fair value of a derivative loan commitment. This SAB retained the staff view and broadens its application to all written loan commitments that are accounted for at fair value through income. The staff expected registrants to apply the views in SAB No. 109 on a prospective basis to derivative loan commitments issued or modified in fiscal quarters beginning after December 15, 2007. The guidance within SAB No. 109 was effective on January 1, 2008. The Company adopted the guidance of SAB No. 109 on January 1, 2008. Its adoption did not have a material impact on the Company’s financial position, results of operations, or cash flows.
In May 2008, the FASB issued SFAS No. 162, “The Hierarchy of Generally Accepted Accounting Principles.” SFAS No. 162 identifies the sources of accounting principles and the framework for selecting the principles to be used in the preparation of financial statements of nongovernmental entities that are presented in conformity with generally accepted accounting principles (“GAAP”) in the U.S. (the GAAP hierarchy). SFAS No. 162 became effective November 15, 2008. The FASB stated that it did not expect SFAS No. 162 would result in a change in current practice. Because SFAS No. 162 only identifies the sources of accounting principles and the framework for selecting the principles to be used in the preparation of financial statements of nongovernmental entities that are presented in conformity with GAAP in the U.S., the adoption of this statement did not have a material impact on the Company’s financial position, results of operations, or cash flows.
The SEC’s Office of the Chief Accountant and the staff of the FASB issued press release 2008-234 on September 30, 2008 (the “Press Release”) to provide clarifications on fair value accounting. The Press Release included guidance on the use of management’s internal assumptions and the use of market quotes. It also reiterates the factors in SEC SAB Topic 5M which should be considered when determining other-than-temporary impairment: the length of time and extent to which the market value has been less than cost, financial condition and near-term prospects of the issuer, and the intent and ability of the holder to retain its investment for a period of time sufficient to allow for any anticipated recovery in market value. Because the Press Release was only issued to provide clarifications on fair value accounting, the applicable of this literature did not, in and of itself, have a material impact on the Company’s financial position, results of operations, or cash flows.
In October 2008, the FASB issued FSP No. 157-3, “Determining the Fair Value of a Financial Asset When the Market for That Asset is Not Active,” which clarified the application of SFAS No. 157 in an inactive market and provided an example to illustrate key considerations in determining fair value of a financial asset when the market for that asset is not active. FSP No. 157-3 stated that an entity should not automatically conclude that a
114
PALMETTO BANCSHARES, INC. AND SUBSIDIARY
Notes To Consolidated Financial Statements—(Continued)
particular transaction price is determinative of fair value. Further, FSP No. 157-3 stated that in a dislocated market, judgment is required to evaluate whether individual transactions are forced liquidations or distressed sales. When relevant observable market information is not available, a valuation approach that incorporates management’s judgments about the assumptions that market participants would use in pricing the asset in a current sale transaction would be acceptable. FSP No. 157-3 also indicated that quotes from brokers or pricing services may be relevant inputs when measuring fair value but are not necessarily determinative in the absence of an active market for the asset. Further, FSP No. 157-3 stated that in weighing a broker quote as an input to a fair value measurement, an entity should place less reliance on quotes that do not reflect the result of market transactions. Further, the nature of the quote should be considered when weighing the available evidence. FSP No. 157-3 was effective immediately after issuance and applies to prior periods for which financial statements have not been issued, including interim or annual periods ending on or before September 30, 2008. Accordingly, the Company adopted FSP No. 157-3 prospectively, beginning on July 1, 2008. Its adoption did not result in an other-than-temporary impairment charge relative to any of the Company’s investment securities available for sale nor did it have a material impact on the Company’s financial position, results of operations, or cash flows.
In December 2008, the FASB issued FSP SFAS No. 140-4 and FIN No. 46(R)-8, “Disclosures by Public Entities (Enterprises) about Transfers of Financial Assets and Interests in Variable Interest Entities.” The Staff Position was issued to require public entities to disclose additional information about transfers of financial assets and to require public enterprises to provide additional disclosures about their involvement with variable interest entities. The Staff Position also requires certain disclosures for public enterprises that are sponsors and servicers of qualifying special purpose entities. The Staff Position is effective for the first reporting period ending after December 15, 2008. The Company does not anticipate that its adoption will have a material impact on its financial position, results of operations, or cash flows.
In January 2009, the FASB issued FSP EITF No. 99-20-1, “Amendments to the Impairment Guidance of EIFT Issue No. 99-20.” Prior to the Staff Position, other-than-temporary impairment was determined by using either EITF No. 99-20, “Recognition of Interest Income and Impairment on Purchased Beneficial Interests and Beneficial Interests that Continue to be Held by a Transferor in Securitized Financial Assets,” or SFAS No. 115 depending on the type of security. EITF No. 99-20 required the use of market participant assumptions regarding future cash flows regarding the probability of collecting all cash flows previously projected. SFAS No. 115 determined impairment to be other than temporary if it was probable that the holder would be unable to collect all amounts due according to the contractual terms. To achieve a more consistent determination of other-than-temporary impairment, the Staff Position amended EITF No. 99-20 to determine any other-than-temporary impairment based on the guidance in SFAS No. 115, allowing management to use more judgment in determining any other-than-temporary impairment. The Staff Position is effective for interim and annual reporting periods ending after December 15, 2008 and shall be applied prospectively. Retroactive application is not permitted. Management has reviewed the Company’s security portfolio and evaluated the portfolio for any other-than-temporary impairment as discussed in Note 3.
Recently Issued Applicable Accounting Pronouncements
In December 2007, the FASB issued SFAS No. 141(R), “Business Combinations,” which replaces SFAS No. 141, “Business Combinations.” SFAS No. 141(R) establishes principles and requirements for how an acquirer in a business combination recognizes and measures in its financial statements the identifiable assets acquired, the liabilities assumed, and any controlling interest, recognizes and measures goodwill acquired in the business combination or a gain from a bargain purchase, and determines what information to disclose to enable users of the financial statements to evaluate the nature and financial impacts of the business combination. SFAS No. 141(R) is effective for acquisitions by the Company taking place on or after January 1, 2009. Early adoption is prohibited. Accordingly, a calendar year end company is required to record and disclose business combinations following
115
PALMETTO BANCSHARES, INC. AND SUBSIDIARY
Notes To Consolidated Financial Statements—(Continued)
existing accounting guidance until January 1, 2009. The Company will assess the impact SFAS No. 141(R) would have on its financial position, results of operations, or cash flows if and when a future acquisition occurs.
In December 2007, the FASB issued SFAS No. 160, “Noncontrolling Interests in Consolidated Financial Statements—an amendment of ARB No. 51.” SFAS No. 160 establishes new accounting and reporting standards for the noncontrolling interest in a subsidiary and for the deconsolidation of a subsidiary. Before this statement, limited guidance existed for reporting noncontrolling interests (minority interest). As a result, diversity in practice exists. In some cases minority interest is reported as a liability and in others it is reported in the mezzanine section between liabilities and equity. Specifically, SFAS No. 160 requires the recognition of a noncontrolling interest (minority interest) as equity in the consolidated financials statements and separate from the parent’s equity. The amount of net income attributable to the noncontrolling interest is to be included in consolidated net income on the face of the income statement. SFAS No. 160 clarifies that changes in a parent’s ownership interest in a subsidiary that do not result in deconsolidation are equity transactions if the parent retains its controlling financial interest. In addition, this statement requires that a parent recognize gain or loss in net income when a subsidiary is deconsolidated. Such gain or loss will be measured using the fair value of the noncontrolling equity investment on the deconsolidation date. SFAS No. 160 also includes expanded disclosure requirements regarding the interests of the parent and its noncontrolling interests. SFAS No. 160 is effective for the Company on January 1, 2009. The Company does not anticipate that the adoption of SFAS No. 160 will have a material impact on its financial position, results of operations, or cash flows.
In February 2008, the FASB issued FSP No. 157-2, which delayed the effective date of SFAS No. 157 for nonrecurring, nonfinancial instruments to fiscal years beginning after November 15, 2008. Therefore, the effective date of the application of SFAS No. 157 for such instruments is January 1, 2009. Because SFAS No. 157 provides guidance and amends only the disclosure requirements for fair value measurements, its adoption did not have a material impact on the Company’s financial position, results of operations, or cash flows.
In February 2008, the FASB issued FSP No. 140-3, “Accounting for Transfers of Financial Assets and Repurchase Financing Transactions.” FSP No. 140-3 provides guidance on accounting for a transfer of a financial asset and the transferor’s repurchase financing of the asset and presumes that an initial transfer of a financial asset and a repurchase financing are considered part of the same arrangement (linked transaction) under SFAS No. 140, “Accounting for Transfers and Servicing of Financial Assets and Extinguishments of Liabilities-a replacement of FASB Statement No. 125.” However, if certain criteria are met, the initial transfer and repurchase financing are not to be evaluated as a linked transaction but are to be evaluated separately under SFAS No. 140. FSP No. 140-3 is effective for the Company for fiscal and interim periods beginning January 1, 2009. Earlier application is not permitted. The Company does not anticipate that the adoption of FSP No. 140-3 will have a material impact on its financial position, results of operations, or cash flows.
In March 2008, the FASB issued SFAS No. 161, “Disclosures about Derivative Instruments and Hedging Activities—an amendment of FASB Statement No. 133,” which requires enhanced disclosures about an entity’s derivative and hedging activities and thereby improves the transparency of financial reporting. It is intended to enhance the disclosure framework in SFAS No. 133 by requiring that objectives for using derivative instruments be disclosed in terms of underlying risk and accounting designation. This disclosure is intended to convey the purpose of derivative use in terms of the risks that the entity is intending to manage. SFAS No. 161 is effective for the Company on January 1, 2009. Because SFAS No. 161 amends only the disclosure requirements for derivative instruments and hedged items, the Company does not anticipate that its adoption will have a material impact on its financial position, results of operations, or cash flows.
116
PALMETTO BANCSHARES, INC. AND SUBSIDIARY
Notes To Consolidated Financial Statements—(Continued)
In April 2008, the FASB issued FSP No. 142-3, “Determination of the Useful Life of Intangible Assets.” FSP No. 142-3 amends the factors that should be considered in developing renewal or extension assumptions used to determine the useful life of a recognized intangible asset under SFAS No. 142. FSP No. 142-3 is intended to improve the consistency between the useful life of a recognized intangible asset under SFAS No. 142 and the period of expected cash flows used to measure the fair value of the asset under SFAS No. 141(R) and other U.S. generally accepted accounting principles. FSP No. 142-3 is effective for the Company for fiscal and interim periods beginning January 1, 2009. Earlier application is not permitted. The Company is currently evaluating the impact that the adoption of FSP No. 142-3 may have on its financial position, results of operations, or cash flows.
In May 2008, the FASB issued FSP APB No. 14-1, “Accounting for Convertible Debt Instruments That May Be Settled in Cash upon Conversion (Including Partial Cash Settlement).” The Staff Position specifies that issuers of convertible debt instruments that may be settled in cash upon conversion should separately account for the liability and equity components in a manner that will reflect the entity’s nonconvertible debt borrowing rate when interest cost is recognized in subsequent periods. FSP APB No. 14-1provides guidance for initial and subsequent measurement as well as derecognition provisions. The Staff Position is effective as of January 1, 2009. the Company does not anticipate that its adoption will have a material impact on its financial position, results of operations, or cash flows.
In June 2008, the FASB issued FSP EITF No. 03-6-1, “Determining Whether Instruments Granted in Share-Based Payment Transactions are Participating Securities.” The Staff Position provides that unvested share-based payment awards that contain nonforfeitable rights to dividends or dividend equivalents are participating securities and must be included in the income per share computation. FSP EITF No. 03-6-1 is effective January 1, 2009. The Company is currently evaluating the impact that the adoption of FSP EITF No. 03-6-1 may have on its financial position, results of operations, or cash flows.
In September 2008, the FASB issued FSP No. 133-1 and FIN No. 45-4, “Disclosures about Credit Derivatives and Certain Guarantees: An Amendment of FASB Statement No. 133 and FASB Interpretation No. 45; and Clarification of the Effective Date of FASB Statement No. 161.” The Staff Position is effective for reporting periods (annual or interim) ending after November 15, 2008. FSP No. 133-1 and FIN No. 45-4 amends SFAS No. 133 to require the seller of credit derivatives to disclose the nature of the credit derivative, the maximum potential amount of future payments, fair value of the derivative, and the nature of any recourse provisions. Disclosures must be made for entire hybrid instruments that have embedded credit derivatives. The Staff Position also amends FIN No. 45, “Guarantor’s Accounting and Disclosure Requirements for Guarantees, Including Indirect Guarantees of Indebtedness to Others,” to require disclosure of the current status of the payment / performance risk of the credit derivative guarantee. If an entity utilizes internal groupings as a basis for the risk, how the groupings are determined must be disclosed as well as how the risk is managed. The Staff Position encourages that the amendments be applied in periods earlier that the effective date to facilitate comparisons at initial adoption. After initial adoption, comparative disclosures are required only for subsequent periods. FSP No. 133-1 and FIN No. 45-4 clarifies the effective date of SFAS No. 161 such that required disclosures should be provided for any reporting period (annual or quarterly interim) beginning after November 15, 2008. The Company is currently evaluating the impact that the adoption of FSP SFAS No. 133-1 and FIN No. 45-4 may have on its financial position, results of operations, or cash flows. However, because such pronouncements amend only the disclosure requirements for credit derivatives and certain guarantees, the Company does not anticipate that its adoption will have a material impact on its financial position, results of operations, or cash flows.
In December 2008, the FASB issued FSP SFAS No. 132(R)-1, “Employers’ Disclosures about Postretirement Benefit Plan Assets.” The Staff Position provides guidance on an employer’s disclosures about plan assets of a defined benefit pension or other postretirement plan to provide the users of financial statements
117
PALMETTO BANCSHARES, INC. AND SUBSIDIARY
Notes To Consolidated Financial Statements—(Continued)
with an understanding of how investment allocation decisions are made, including the factors that are pertinent to an understanding of investment policies and strategies, the major categories of plan assets, the inputs and valuation techniques used to measure the fair value of plan assets, the impact of fair value measurements using significant unobservable inputs (Level 3) on changes in plan assets for the period, and significant concentrations of risk within plan assets. FSP SFAS No. 132(R)-1 is effective for fiscal years ending after December 15, 2009. The Staff Position will require the Company to provide additional disclosures related it to its benefit plans. However, because such pronouncements amend only the disclosure requirements for plan assets of a defined benefit pension or other postretirement plan, the Company does not anticipate that its adoption will have a material impact on its financial position, results of operations, or cash flows.
Other accounting standards that have been issued or proposed by the FASB or other standards-setting bodies are not expected to have a material impact on the Company’s financial position, results of operations or cash flows.
2. Cash and Cash Equivalents
Noninterest-Earning Deposits with Financial Institutions
Included in cash and due from banks line item in the Consolidated Financial Statements is $8.9 million and $12.1 million at December 31, 2008 and 2007, respectively, of noninterest-earning deposits with financial institutions.
Required Reserve Balances
The Company is required to maintain average reserve balances computed by applying prescribed percentages to its various types of deposits. At December 31, 2008, the Federal Reserve required that the Company maintain $9.9 million in reserve balances. The Company satisfied this requirement with vault cash; however, $1.0 million was required to be maintained with the Federal Reserve as a clearing balance requirement.
The EESA accelerated, to October 1, 2008, the effective date for the Federal Reserve’s authority to pay interest on account balances that depository institutions hold at the Federal Reserve banks. The provisions to pay interest on such balances were contained in the Financial Services Regulatory Relief Act of 2006 with an original implementation date of October 1, 2011. Accordingly, interest is now paid on balances held to satisfy reserve requirements and on balances held in excess of required reserve balances and clearing balances commencing with the maintenance period beginning on October 9, 2008. The interest rate paid on required reserve balances is the average targeted federal funds rate established by the Federal Open Market Committee over each reserve maintenance period less 10 basis points. The Federal Reserve anticipates that paying interest on required reserve balances should essentially eliminate the opportunity cost of holding required reserves, promoting efficiency in the banking sector. The rate paid on excess balances was set initially as the lowest targeted federal funds rate for each reserve maintenance period less 75 basis points. The formula for the interest rate on excess balances may be adjusted subsequently in light of experience and evolving market conditions. The payment of interest on excess reserves permits the Federal Reserve to expand its balance sheet as necessary to provide the liquidity to support financial stability while implementing the monetary policy that is appropriate in light of the Federal Reserve System’s macroeconomic objectives of maximum employment and price stability.
On October 22, 2008, the Federal Reserve announced that it would alter the formula used to determine the interest rate paid to depository institutions on excess balances. Under the new formula, the rate on excess balances was set equal to the lowest Federal Open Market Committee target rate in effect during the reserve maintenance period less 35 basis points. This change became effective for the maintenance periods beginning
118
PALMETTO BANCSHARES, INC. AND SUBSIDIARY
Notes To Consolidated Financial Statements—(Continued)
Thursday, October 23. The Federal Reserve judged that a narrower spread between the target funds rate and the rate on excess balances would help foster trading in the funds market at rates closer to the target rate. Additionally, it agreed to continue to evaluate the appropriate setting of the rate on excess balances in light of evolving market conditions and make further adjustments as needed.
Concentrations and Restrictions on Cash and Cash Equivalents
In an effort to manage its associated risks, the Company generally does not maintain deposits with other financial institutions in amounts that exceed federal deposit insurance coverage. Furthermore, federal funds sold are essentially uncollateralized loans to other financial institutions that are not subject to federal deposit insurance coverage. Therefore, management regularly evaluates the risk associated with the counterparties to these transactions to ensure that the Company does not expose itself to any significant risks with regard to it cash and cash equivalents.
3. Investment Securities Available for Sale
The following tables summarize the amortized cost, gross unrealized gains, gross unrealized losses, and fair values of investment securities available for sale at the dates indicated (in thousands).
| | | | | | | | | | |
| | | December 31, 2008 |
| | | Amortized
cost | | Gross
unrealized
gains | | Gross
unrealized
losses | | | Fair
value |
State and municipal | | $ | 50,297 | | 635 | | (102 | ) | | 50,830 |
Collateralized mortgage obligations | | | 58,033 | | 23 | | (3,417 | ) | | 54,639 |
Other mortgage-backed (federal agencies) | | | 19,876 | | 270 | | (19 | ) | | 20,127 |
| | | | | | | | | | |
Total investment securities available for sale | | $ | 128,206 | | 928 | | (3,538 | ) | | 125,596 |
| | | | | | | | | | |
| |
| | | December 31, 2007 |
| | | Amortized
cost | | Gross
unrealized
gains | | Gross
unrealized
losses | | | Fair
value |
U.S. Treasury and federal agencies | | $ | 20,725 | | 26 | | (8 | ) | | 20,743 |
State and municipal | | | 52,677 | | 55 | | (573 | ) | | 52,159 |
Other mortgage-backed (federal agencies) | | | 22,722 | | 196 | | (105 | ) | | 22,813 |
| | | | | | | | | | |
Total investment securities available for sale | | $ | 96,124 | | 277 | | (686 | ) | | 95,715 |
| | | | | | | | | | |
State and municipal investment securities are debt investment securities issued by a state, municipality, or county in order to finance its capital expenditures. The most substantial risk associated with buying state and municipal investment securities is the financial risk associated with the municipality from which the securities are purchased. Although municipal bonds in smaller municipalities can sometimes be difficult to sell quickly, the Company does not currently anticipate that it will liquidate this portfolio in the near term.
During 2008, the Company began investing in private label collateralized mortgage obligations. These collateralized mortgage obligations are issued by third parties that originate mortgage loans. Collateralized mortgage obligations are a mortgage-backed security sub-type in which the mortgages are ordered into tranches by some quality (such as repayment time) with each tranche sold as a separate security. These mortgage-backed securities separate the mortgage pools into short, medium, and long-term tranches. The Company has purchased the A tranche of these securities. The Company’s collateralized mortgage obligations are all fixed rate and are
119
PALMETTO BANCSHARES, INC. AND SUBSIDIARY
Notes To Consolidated Financial Statements—(Continued)
paid a fixed rate of interest at regular intervals. Monthly fluctuations in income occur only as there are changes in amortization or accretions due to changes in prepayment speeds.
Other mortgage-backed investment securities include investment instruments that represent ownership of an undivided interest in a group of mortgages. Principal and interest from the individual mortgages are used to pay principal and interest on the mortgage-backed investment security. Monthly income from other mortgage-backed investment securities may fluctuate as interest rates change due to the volume of mortgage prepayments.
The Company uses prices from third party pricing services and, to a lesser extent, indicative (non-binding) quotes from third party brokers, to measure fair value of the Company’s investment securities. See Note 17 for further discussion regarding the amount and fair value hierarchy classification of investment securities measured at fair value using a third party pricing service and those measured at fair value using broker quotes. The Company utilizes multiple third party pricing services and brokers to obtain fair values’, however, management generally obtains one price / quote for each individual security. For securities priced by third party pricing services, management determines the most appropriate and relevant pricing service for each security class and has that vendor provide the price for each security in the class. The Company records the unadjusted value provided by the third party pricing service / broker in its Consolidated Financial Statements, subject to the Company’s internal price verification procedures. Based upon management’s internal price verification procedures and review of fair value methodology documentation provided by third party pricing services, the Company has concluded that the fair values for its investment securities available for sale at December 31, 2008 were consistent with the guidance in SFAS No. 157. At December 31, 2008, all collateralized mortgage obligations were valued using level three inputs as no active trading market existed at that time.
Other-Than-Temporary Impairment Analysis
Management conducts other-than-temporary impairment analysis on a quarterly basis or more often if a potential loss-triggering event occurs. The Company recognizes other-than-temporary impairment when it is probable that it will be unable to collect all amounts due according to the contractual terms of the security and the fair value of the investment security is less than its amortized cost. The initial indication of other-than-temporary impairment for investment securities is a decline in the market value below the amount recorded for an investment and the severity and duration of the decline. In determining whether an impairment is other-than-temporary, management considers the length of time and the extent to which the market value has been below cost, recent events specific to the issuer, including investment downgrades by rating agencies and economic conditions of its industry, and the Company’s ability and intent to hold the investment for a period of time, including maturity, sufficient to allow for any anticipated recovery. Management also considers the cause of the price decline (general level of interest rates and industry- and issuer-specific factors), the issuer’s financial condition, near-term prospects and current ability to make future payments in a timely manner, the issuer’s ability to service debt, any change in agencies’ ratings at evaluation date from acquisition date and any likely imminent action, and for collateralized mortgage obligations, the credit performance of the underlying collateral, including delinquency rates, cumulative losses to date, and the remaining credit enhancement compared to expected credit losses of the security.
120
PALMETTO BANCSHARES, INC. AND SUBSIDIARY
Notes To Consolidated Financial Statements—(Continued)
The following tables summarizes the gross unrealized losses, fair value, and the number of securities in each category of investment securities available for sale, aggregated by investment category and length of time that individual securities have been in a continuous unrealized loss position, at the dates indicated (dollars in thousands).
| | | | | | | | | | | | | | | | | | | | |
| | | December 31, 2008 |
| | | Less than 12 months | | 12 months or longer | | Total |
| | | # | | Fair
value | | Gross
unrealized
losses | | # | | Fair
value | | Gross
unrealized
losses | | # | | Fair
value | | Gross
unrealized
losses |
State and municipal | | 12 | | $ | 5,441 | | $ | 101 | | 1 | | 423 | | 1 | | 13 | | 5,864 | | 102 |
Collateralized mortgage obligations | | 13 | | | 52,603 | | | 3,417 | | — | | — | | — | | 13 | | 52,603 | | 3,417 |
Other mortgage-backed (federal agencies) | | 4 | | | 1,336 | | | 15 | | 1 | | 838 | | 4 | | 5 | | 2,174 | | 19 |
| | | | | | | | | | | | | | | | | | | | |
Total investment securities available for sale | | 29 | | $ | 59,380 | | $ | 3,533 | | 2 | | 1,261 | | 5 | | 31 | | 60,641 | | 3,538 |
| | | | | | | | | | | | | | | | | | | | |
| |
| | | December 31, 2007 |
| | | Less than 12 months | | 12 months or longer | | Total |
| | | # | | Fair
value | | Gross
unrealized
losses | | # | | Fair
value | | Gross
unrealized
losses | | # | | Fair
value | | Gross
unrealized
losses |
U.S. Treasury and federal agencies | | — | | $ | — | | $ | — | | 2 | | 3,476 | | 8 | | 2 | | 3,476 | | 8 |
State and municipal | | 16 | | | 6,135 | | | 79 | | 98 | | 38,760 | | 494 | | 114 | | 44,895 | | 573 |
Other mortgage-backed (federal agencies) | | 1 | | | 733 | | | — | | 15 | | 10,655 | | 105 | | 16 | | 11,388 | | 105 |
| | | | | | | | | | | | | | | | | | | | |
Total investment securities available for sale | | 17 | | $ | 6,868 | | $ | 79 | | 115 | | 52,891 | | 607 | | 132 | | 59,759 | | 686 |
| | | | | | | | | | | | | | | | | | | | |
The change in investment securities available for sale in a gross unrealized losses position at December 31, 2008 was largely due to wide asset spreads resulting from an illiquid market, causing these assets to be valued at significant discounts from cost. The fair value is expected to recover as the bonds approach their maturity date or repricing date or if market yields for such investments decline further. Gross unrealized losses increased $2.9 million from December 31, 2007 to December 31, 2008 primarily as a result of the collateralized mortgage obligation sector of the investment securities portfolio. Partially offsetting this increase in gross unrealized losses were improvements within the state and municipal and other mortgage-backed sectors.
Any decline in the fair value of available for sale securities below cost that are deemed to be other-than-temporary is reflected in income as realized losses. As of December 31, 2008, the Company has received all principal and interest payments, believes that the principal and interest on these securities are fully recoverable, and has the ability and intent to hold the securities for a period of time sufficient for a recovery of cost. Accordingly, management believes the gross unrealized losses detailed in the preceding table are temporary, and, therefore, were not other-than-temporarily impaired at December 31, 2008.
The fair values of the Company’s investment securities portfolio could decline in the future if the underlying performance of the collateral for collateralized mortgage obligations or other securities deteriorate and the Company’s credit enhancement levels do not provide sufficient protection to contractual principal and interest. As a result, there is risk that other-than-temporary impairments may occur in the future given the current economic environment.
121
PALMETTO BANCSHARES, INC. AND SUBSIDIARY
Notes To Consolidated Financial Statements—(Continued)
Ratings
The following table summarizes Moody’s ratings, by segment of the investment securities available for sale, at December 31, 2008. A AAA rating is based not on the credit of the issuer, but rather on the structure of the securities and the credit quality of the collateral.
| | | | | | | |
| | | State and
municipal | | | Collateralized
mortgage
obligations | | Other mortgage-
backed (federal
agencies) |
A1 | | 11 | % | | — | | — |
A2 | | 5 | | | — | | — |
A3 | | 8 | | | — | | — |
Aa1 | | 11 | | | — | | — |
Aa2 | | 6 | | | — | | — |
Aa3 | | 33 | | | — | | — |
Aaa | | 2 | | | 95 | | 100 |
Baa1 | | 14 | | | — | | — |
Baa2 | | 2 | | | — | | — |
Not rated | | 8 | | | 5 | | — |
| | | | | | | |
Total | | 100 | % | | 100 | | 100 |
| | | | | | | |
Of the state and municipal investment securities not rated by Moody’s at December 31, 2008, 15% of the securities were rated AA+, 66% were rated AA, 10% were rated A, and 9%, or $378 thousand, were not rated by Standard and Poor’s Ratings.
Of the collateralized mortgage obligations not rated by Moody’s at December 31, 2008, 100% of the securities were rated AAA by Standard and Poor’s or Fitch Ratings.
Investment Securities Maturities
The amortized cost and estimated fair value of investment securities available for sale at December 31, 2008 are summarized in the table below by contractual maturity (in thousands). Expected maturities may differ from contractual maturities because issuers may have the right to call or prepay obligations. Collateralized mortgage obligations and other mortgage-backed securities are shown separately since they are not due at a single maturity date.
| | | | | |
| | | Amortized
cost | | Estimated
fair value |
Due in one year or less | | $ | 4,016 | | 4,028 |
Due after one year through five years | | | 20,906 | | 21,180 |
Due after five year through ten years | | | 24,180 | | 24,442 |
Due after ten years | | | 1,195 | | 1,180 |
Collateralized mortgage obligations | | | 58,033 | | 54,639 |
Other mortgage-backed securities (federal agencies) | | | 19,876 | | 20,127 |
| | | | | |
Total investment securities available for sale | | $ | 128,206 | | 125,596 |
| | | | | |
The weighted-average life of investment securities available for sale was 3.9 years at December 31, 2008. Since approximately 60% of the portfolio is collateralized mortgage obligations or other mortgage-backed securities, the expected remaining maturity may differ from contractual maturity because borrowers generally have the right to prepay obligations before the underlying mortgages mature.
122
PALMETTO BANCSHARES, INC. AND SUBSIDIARY
Notes To Consolidated Financial Statements—(Continued)
Concentrations of Risk
The Company did not own any state and municipal investment securities with fair values exceeding 2% of total shareholders’ equity at December 31, 2008. The Company owned five state and municipal security issuers issued securities with fair values exceeding 1% of total shareholders’ equity at December 31, 2008 ranging from 1.0% to 1.9%. Although not all state and municipal investment securities are rated AAA, all are within the Company’s ratings standards outlined in its Investment Policy which requires rated bonds to be balanced to average “Aa” to “A” by one of the major bond rating agencies. Furthermore, all municipals purchased are required by the Bank’s Investment Policy to have a minimum A rating at the time of purchase.
The company’s collateralized mortgage obligations, by issuer, ranged from 1.8% of total shareholders’ equity at December 31, 2008 to 8.0% of total shareholders’ equity at December 31, 2008.
The following table summarizes issuer fair value concentration of other mortgage-backed investment securities, by issuer, at December 31, 2008 (dollars in thousands).
| | | | | | | | |
| | | Federal
National
Mortgage
Association | | | Federal Home
Loan Mortgage
Corporation | | Total |
Other mortgage-backed (federal agencies) | | $ | 16,755 | | | 3,372 | | 20,127 |
As a percentage of shareholders’ equity | | | 14.5 | % | | 2.9 | | 17.4 |
During the third quarter of 2008, the U.S. government stepped in to help rescue the Federal National Mortgage Association and the Federal Home Loan Mortgage Corporation. The government put both entities into conservatorships under the control of their regulator, the Federal Housing Finance Agency.
Investment Securities Gains
The following table summarizes the gross realized gains and losses of investment securities available for sale for the periods indicated (in thousands).
| | | | | | | | |
| | | For the years ended
December 31, | |
| | | 2008 | | 2007 | | 2006 | |
Realized gains | | $ | 1 | | — | | 92 | |
Realized losses | | | — | | — | | (58 | ) |
| | | | | | | | |
Net realized gains | | $ | 1 | | — | | 34 | |
| | | | | | | | |
Pledged
Approximately 55% of the investment securities portfolio, at fair value, was pledged to secure public deposits and trust assets at December 31, 2008 as compared with 80% at December 31, 2007. Of the Company’s $69.1 million pledged available for sale investment securities balance at December 31, 2008, $47.0 million of the investment securities portfolio, at fair value, was securing public deposits and trust assets at December 31, 2008. Of the Company’s $76.6 million pledged available for sale investment securities balance at December 31, 2007, $40.4 million of available for sale investment securities was securing public deposits and trust assets.
To borrow from the FHLB, members must pledge collateral to secure advances and letters of credit. Acceptable collateral includes a variety of single-family residential loans, commercial real estate loans, home
123
PALMETTO BANCSHARES, INC. AND SUBSIDIARY
Notes To Consolidated Financial Statements—(Continued)
equity lines of credit, and multifamily residential loans as well as a number of types of securities. Approximately $41.6 million, or 33%, of the investment securities portfolio, at fair value, was pledged to collateralize FHLB advances and letters of credit as of December 31, 2008 of which $37.5 million was utilized as lendable collateral. In order to compute lendable collateral amounts, investment security market values are multiplied by a collateral value percentage. No investment securities were pledged at December 31, 2007 to collateralize FHLB advances and letters of credit.
4. Loans
Composition
The following table summarizes the Company’s loans, gross, categorized by the FDIC code, excluding mortgage loans held for sale, at the dates indicated (dollars in thousands).
| | | | | | | | | | |
| | | December 31, 2008 | | | December 31, 2007 |
| | | Total | | % of total | | | Total | | % of total |
Secured by real estate | | | | | | | | | | |
Construction, land development, and other land loans | | $ | 235,216 | | 20.3 | % | | 131,149 | | 12.6 |
Farmland | | | 882 | | 0.1 | | | 1,004 | | 0.1 |
Single-family residential | | | 217,734 | | 18.8 | | | 209,168 | | 20.0 |
Multifamily residential | | | 36,349 | | 3.1 | | | 28,660 | | 2.7 |
Nonfarm nonresidential | | | 510,180 | | 44.1 | | | 499,807 | | 47.8 |
Commercial and industrial | | | 73,609 | | 6.4 | | | 77,555 | | 7.4 |
Obligations of states and political subdivisions of the U.S. | | | 2,602 | | 0.2 | | | 3,339 | | 0.3 |
General consumer | | | 60,626 | | 5.2 | | | 68,887 | | 6.6 |
Credit line | | | 6,215 | | 0.5 | | | 5,189 | | 0.5 |
Bankcards | | | 12,416 | | 1.1 | | | 11,978 | | 1.2 |
Others | | | 2,651 | | 0.2 | | | 8,034 | | 0.8 |
| | | | | | | | | | |
Loans, gross | | $ | 1,158,480 | | 100.0 | % | | 1,044,770 | | 100.0 |
| | | | | | | | | | |
Loans included in the table are net of participations sold and mortgage loans sold and serviced for others. Mortgage loans serviced for the benefit of others amounted to $377.3 million, $346.3 million, and $325.1 million at December 31, 2008, 2007, and 2006 respectively.
Pledged
To borrow from the FHLB, members must pledge collateral to secure advances and letters of credit. Acceptable collateral includes a variety of residential, multifamily, home equity lines and second mortgages, and commercial loans as well as a number of types of securities. Approximately $379.4 million, or 33%, of the loans, gross, excluding mortgage loans held for sale, were pledged to collateralize FHLB advances and letters of credit at December 31, 2008, of which $159.1 million was available as lendable collateral. In order to compute lendable collateral amounts, pledged loan unpaid principal balances are reduced by a collateral verification review extrapolation factor before being multiplied by a collateral value percentage.
Concentrations of Risk
Borrower Concentration. Management does not believe that the Company’s loan portfolio is concentrated in loans to any single borrower or a relatively small number of borrowers.
124
PALMETTO BANCSHARES, INC. AND SUBSIDIARY
Notes To Consolidated Financial Statements—(Continued)
Geographic Concentration. Unlike larger national or regional banks that are more geographically diversified, the Company primarily provides its services to customers within Upstate South Carolina. Deterioration in local economic conditions could result in declines in asset quality, loan collateral values, and the demand for the Company’s products and services, among other things. Although the Company’s geographic concentration limits the Company to the economic risks within its market area, the Company’s lack of geographic diversification may make it particularly susceptible to the adverse impacts of negative economic conditions that impact the Upstate.
The following table summarizes loans secured by commercial real estate, categorized by FDIC code, at December 31, 2008 (dollars in thousands).
| | | | | | | | |
| | | Total | | % of Bank’s
loan portfolio,
gross | | | % of Bank’s
tier 1 capital |
Secured by commercial real estate | | | | | | | | |
Construction, land development, and other land loans | | $ | 235,216 | | 20.3 | % | | 199.6 |
Multifamily residential | | | 36,349 | | 3.2 | | | 30.8 |
Nonfarm nonresidential | | | 510,180 | | 44.0 | | | 432.8 |
| | | | | | | | |
Total loans secured by commercial real estate | | $ | 781,745 | | 67.5 | % | | 663.2 |
| | | | | | | | |
The following table further categorizes loans secured by commercial real estate, categorized by FDIC code, at December 31, 2008 (dollars in thousands).
| | | | | | | | |
| | | Total | | % of Bank’s
loan portfolio,
gross | | | % of Bank’s
tier 1 capital |
Development commercial real estate loans | | | | | | | | |
Loans secured by: | | | | | | | | |
Land—unimproved (commercial or residential) | | $ | 24,941 | | 2.1 | % | | 21.2 |
Land development—commercial | | | 150,579 | | 13.0 | | | 127.7 |
Commercial construction: | | | | | | | | |
Hotel / motel | | | 31,196 | | 2.7 | | | 26.5 |
Multifamily | | | 20,455 | | 1.8 | | | 17.3 |
| | | | | | | | |
Total development commercial real estate loans | | | 227,171 | | 19.6 | | | 192.7 |
| | | |
Existing and other commercial real estate loans | | | | | | | | |
Loans secured by existing real estate: | | | | | | | | |
Hotel / motel | | | 113,224 | | 9.8 | | | 96.1 |
Retail | | | 32,067 | | 2.8 | | | 27.2 |
Office | | | 18,053 | | 1.5 | | | 15.3 |
Multifamily | | | 73,854 | | 6.4 | | | 62.7 |
Industrial and warehouse | | | 12,436 | | 1.1 | | | 10.5 |
Healthcare | | | 43,457 | | 3.7 | | | 36.9 |
Miscellaneous commercial | | | 125,825 | | 10.9 | | | 106.7 |
Residential construction—speculative | | | 10,677 | | 0.9 | | | 9.1 |
| | | | | | | | |
Total existing and other commercial real estate loans | | | 429,593 | | 37.1 | | | 364.5 |
| | | |
Commercial real estate owner occupied and residential loans | | | | | | | | |
Loans secured by: | | | | | | | | |
Commercial—owner occupied | | | 124,737 | | 10.8 | | | 105.8 |
Residential construction—contract | | | 244 | | — | | | 0.2 |
| | | | | | | | |
Total commercial real estate owner occupied and residential loans | | | 124,981 | | 10.8 | | | 106.0 |
| | | | | | | | |
Total loans secured by commercial real estate | | $ | 781,745 | | 67.5 | % | | 663.2 |
| | | | | | | | |
125
PALMETTO BANCSHARES, INC. AND SUBSIDIARY
Notes To Consolidated Financial Statements—(Continued)
The Company believes that the properties securing its commercial real estate portfolio are diverse in terms of type. This diversity reduces the Company’s exposure to adverse economic events that impact any single industry.
Lending Practices. The Company does not loan in excess of 100% of collateral value, offer loan payment arrangements resulting in negative amortization, engage in lending practices subjecting borrowers to substantial payment increases (e.g. principal deferral periods, loans with initial interest-only periods, etc.), nor does it offer loan payment arrangements with minimum payments that are less than accrued interest.
Asset Quality
Nonaccrual Loans and Loans Past Due 90 Days and Still Accruing. The following table summarizes nonaccrual loans and loans past due 90 days and still accruing interest at the dates indicated (in thousands).
| | | | | |
| | | December 31, |
| | | 2008 | | 2007 |
Nonaccrual loans | | $ | 42,968 | | 4,810 |
Loans past due 90 days and still accruing (1) | | | 206 | | 236 |
| | | | | |
| | $ | 43,174 | | 5,046 |
| | | | | |
| (1) | | Substantially all of these loans are bankcard loans |
The following table summarizes the total additional amount of interest that would have been reported in income for the periods indicated had loans classified as nonaccrual at each of these dates performed in accordance with their original terms and the amount of total interest collected during each of these periods relative to loans classified as nonaccrual at each of the year-ends (in thousands).
| | | | | |
| | | For the years ended
December 31, |
| | | 2008 | | 2007 |
Foregone interest | | $ | 1,456 | | 284 |
Interest collected | | | 19 | | 15 |
Troubled Debt Restructurings. Troubled debt restructurings entered into by the Company during 2008 were reviewed by the Company to ensure loan classifications were in accordance with applicable regulations. Any allocations identified during the review based on probable losses have been included in the Company’s allowance for loan losses for the applicable period. At December 31, 2008 and 2007, the principal balance of such loans totaled $1.2 million.
Allowance for Loan Losses
The following table summarizes the activity impacting the allowance for loan losses for the periods indicated (in thousands).
| | | | | | | | | | |
| | | For the years ended
December 31, | |
| | | 2008 | | | 2007 | | | 2006 | |
Allowance for loan losses, beginning of year | | $ | 7,418 | | | 8,527 | | | 8,431 | |
Provision for loan losses | | | 5,619 | | | 988 | | | 1,625 | |
Loans charged-off | | | (2,169 | ) | | (2,363 | ) | | (1,682 | ) |
Loan recoveries | | | 132 | | | 266 | | | 153 | |
| | | | | | | | | | |
Net loans charged-off | | | (2,037 | ) | | (2,097 | ) | | (1,529 | ) |
| | | | | | | | | | |
Allowance for loan losses, end of year | | $ | 11,000 | | | 7,418 | | | 8,527 | |
| | | | | | | | | | |
126
PALMETTO BANCSHARES, INC. AND SUBSIDIARY
Notes To Consolidated Financial Statements—(Continued)
Impaired Loans. The following table summarizes information relative to the Company’s impaired loans at the dates and for the periods indicated (in thousands).
| | | | | |
| | | At and for the years ended
December 31, |
| | | 2008 | | 2007 |
Impaired loans, at year end | | $ | 37,468 | | 7,667 |
Impaired loans subject to specific reserve allocation, at year end | | | 21,413 | | 7,413 |
Specific allowance allocation on impaired loans, at year end | | | 4,453 | | 1,668 |
Average impaired loans | | | 22,568 | | 7,781 |
Average impaired loans are calculated using an annual simple average. As reported in the Company’s Annual Report on Form 10-K for the year ended December 31, 2007, the average balance of impaired loans during 2006 was $10.6 million.
5. Premises and Equipment, Net
Composition
The following table summarizes the Company’s premises and equipment balances at the dates indicated (in thousands).
| | | | | | | |
| | | December 31, | |
| | | 2008 | | | 2007 | |
Land | | $ | 6,530 | | | 6,817 | |
Buildings | | | 19,668 | | | 18,440 | |
Leasehold improvements | | | 2,884 | | | 2,247 | |
Furniture and equipment | | | 19,412 | | | 18,054 | |
Software | | | 3,495 | | | 3,273 | |
Bank automobiles | | | 941 | | | 939 | |
| | | | | | | |
Premises and equipment, gross | | | 52,930 | | | 49,770 | |
Accumulated depreciation | | | (26,583 | ) | | (24,637 | ) |
| | | | | | | |
Premises and equipment, net | | $ | 26,347 | | | 25,133 | |
| | | | | | | |
127
PALMETTO BANCSHARES, INC. AND SUBSIDIARY
Notes To Consolidated Financial Statements—(Continued)
Loss on Disposition of Premises, Furniture, and Equipment
During 2007, the Company executed a build-to-suit operating lease agreement in conjunction with its new corporate headquarters in Greenville County. Under the terms of the lease agreement, the Company’s new headquarters is being constructed on the site of the Company’s previous downtown Greenville banking office that is leased from the same lessor. The following table summarizes the leasehold improvements and equipment written-off during 2007 (in thousands) in conjunction with the demolition of the Company’s old downtown Greenville banking office for the period indicated.
| | | | |
| | | For the year ended
December 31, 2007 | |
Assets written-off, gross | | | | |
Leasehold improvements | | $ | 715 | |
Equipment | | | 396 | |
| | | | |
Total assets written-off, gross | | | 1,111 | |
Accumulated depreciation on assets written-off | | | | |
Leasehold improvements | | | (384 | ) |
Equipment | | | (381 | ) |
| | | | |
Total accumulated depreciation written-off | | | (765 | ) |
| | | | |
Loss on disposition of premises, furniture, and equipment | | $ | 346 | |
| | | | |
Accumulated Depreciation Activity
The following table summarizes the activity impacting accumulated depreciation for the periods indicated (in thousands).
| | | | | | | |
| | | For the years ended
December 31, | |
| | | 2008 | | | 2007 | |
Accumulated depreciation, beginning of year | | $ | 24,637 | | | 23,597 | |
| | |
Depreciation | | | | | | | |
Buildings | | | 552 | | | 491 | |
Leasehold improvements | | | 142 | | | 123 | |
Furniture and equipment | | | 918 | | | 946 | |
Software | | | 179 | | | 205 | |
Bank automobiles | | | 181 | | | 185 | |
| | | | | | | |
Total depreciation | | | 1,972 | | | 1,950 | |
| | |
Disposals | | | (26 | ) | | (910 | ) |
| | | | | | | |
Accumulated depreciation, end of year | | $ | 26,583 | | | 24,637 | |
| | | | | | | |
128
PALMETTO BANCSHARES, INC. AND SUBSIDIARY
Notes To Consolidated Financial Statements—(Continued)
6. Core Deposit Intangibles
The following table summarizes the gross carrying amount, accumulated amortization, and net carrying amount of intangible assets with finite lives at the dates indicated (in thousands).
| | | | | | | |
| | | December 31, | |
| | | 2008 | | | 2007 | |
Core deposit intangibles, gross | | $ | 1,779 | | | 1,779 | |
Less: accumulated amortization | | | (1,745 | ) | | (1,700 | ) |
| | | | | | | |
Core deposit intangibles, net | | $ | 34 | | | 79 | |
| | | | | | | |
Amortization expense related to core deposit intangibles totaled $45 thousand during 2008 and $48 thousand during each of 2007 and 2006. The Company expects to fully amortize the remaining core deposit intangibles in 2009.
7. Mortgage-Servicing Rights Portfolio
The Company sells certain of its originated fixed-rate and adjustable-rate mortgage loans and retains servicing rights. All of the Company’s loan sales have been without provision for recourse. Mortgage loans serviced for the benefit of others amounted to $377.3 million and $346.3 million at December 31, 2008 and 2007, respectively. Mortgage loans serviced for the benefit of others are held by the Company or its subsidiary in a fiduciary or agency capacity for customers and, therefore, are not included in the Company’s Consolidated Financial Statements as such items do not represent assets of the Company or its subsidiary.
The aggregate fair value of the Company’s mortgage-servicing rights portfolio at December 31, 2008 and 2007 was $3.2 million and $3.6 million, respectively.
The amount of servicing fees earned by the Company during the years ended December 31, 2008, 2007, and 2006 was $901 thousand, $834 thousand, and $783 thousand, respectively. Servicing fees are included in mortgage-banking income on the Consolidated Statements of Income.
Activity
The following table summarizes the changes in the Company’s mortgage-servicing rights portfolio for the periods indicated (in thousands).
| | | | | | | |
| | | For the years ended
December 31, | |
| | | 2008 | | | 2007 | |
Mortgage-servicing rights portfolio, net of valuation allowance, beginning of period | | $ | 2,949 | | | 2,648 | |
Capitalized mortgage-servicing rights | | | 884 | | | 819 | |
Mortgage-servicing rights portfolio amortization | | | (881 | ) | | (511 | ) |
Change in mortgage-servicing rights portfolio valuation allowance | | | (20 | ) | | (7 | ) |
| | | | | | | |
Mortgage-servicing rights portfolio, net of valuation allowance, end of period | | $ | 2,932 | | | 2,949 | |
| | | | | | | |
Mortgage-servicing rights amortization and valuation allowances are included in mortgage-banking income on the Consolidated Statements of Income.
129
PALMETTO BANCSHARES, INC. AND SUBSIDIARY
Notes To Consolidated Financial Statements—(Continued)
See Consolidated Statements of Cash Flows for a summary of activity impacting the Company’s mortgage-servicing rights portfolio.
Amortization
The following table summarizes the Company’s estimated amortization expense of its mortgage-servicing rights portfolio outstanding at December 31, 2008 for the periods indicated (in thousands).
| | | |
During the years ended December 31, |
2009 | | $ | 931 |
2010 | | | 707 |
2011 | | | 530 |
2012 | | | 392 |
2013 | | | 285 |
Thereafter | | | 87 |
| | | |
| | $ | 2,932 |
| | | |
Valuation Allowance
The following table summarizes the activity impacting the valuation allowance for impairment of the mortgage-servicing rights portfolio for the periods indicated (in thousands).
| | | | | | | | |
| | | For the years ended
December 31, | |
| | | 2008 | | 2007 | | 2006 | |
Valuation allowance, beginning of period | | $ | 10 | | 3 | | 34 | |
Aggregate (additions charged to) and reductions credited from operations | | | 20 | | 7 | | (31 | ) |
| | | | | | | | |
Valuation allowance, end of period | | $ | 30 | | 10 | | 3 | |
| | | | | | | | |
8. Real Estate and Personal Property Acquired in Settlement of Loans
Composition
The following table summarizes real estate and personal property acquired in settlement of loans, which are included in other assets on the Consolidated Balance Sheets at the dates indicated (in thousands).
| | | | | |
| | | December 31, |
| | | 2008 | | 2007 |
Real estate acquired in settlement of loans | | $ | 6,719 | | 7,743 |
Repossessed automobiles acquired in settlement of loans | | | 564 | | 403 |
| | | | | |
Total property acquired in settlement of loans | | $ | 7,283 | | 8,146 |
| | | | | |
130
PALMETTO BANCSHARES, INC. AND SUBSIDIARY
Notes To Consolidated Financial Statements—(Continued)
Activity
The following table summarizes the changes in the real estate acquired in settlement of loans portfolio at and for the periods indicated (in thousands).
| | | | | | | | | | |
| | | At and for the years ended
December 31, | |
| | | 2008 | | | 2007 | | | 2006 | |
Real estate acquired in settlement of loans, beginning of period | | $ | 7,743 | | | 600 | | | 1,954 | |
Plus: New real estate acquired in settlement of loans | | | 2,778 | | | 10,030 | | | 294 | |
Less: Sales / recoveries of real estate acquired in settlement of loans | | | (3,634 | ) | | (2,707 | ) | | (1,451 | ) |
Less: Provision charged to expense | | | (168 | ) | | (180 | ) | | (197 | ) |
| | | | | | | | | | |
Real estate acquired in settlement of loans, end of period | | $ | 6,719 | | | 7,743 | | | 600 | |
| | | | | | | | | | |
9. Deposits
Composition
The following table summarizes the Company’s traditional deposit composition at the dates indicated (in thousands).
| | | | | |
| | | December 31, |
| | | 2008 | | 2007 |
Transaction deposit accounts | | $ | 497,563 | | 522,359 |
Money market deposit accounts | | | 93,746 | | 118,681 |
Savings deposit accounts | | | 36,623 | | 34,895 |
Time deposit accounts $100,000 and greater | | | 180,083 | | 150,398 |
Time deposit accounts less than $100,000 | | | 262,264 | | 232,461 |
| | | | | |
Total traditional deposit accounts | | $ | 1,070,279 | | 1,058,794 |
| | | | | |
At December 31, 2008, $1.2 million of overdrawn transaction deposit accounts had been reclassified as loan balances, compared with $809 thousand at December 31, 2007.
Time Deposit Account Maturities
The following table summarizes the maturities of time deposit accounts outstanding at December 31, 2008 during the periods indicated (in thousands).
| | | |
During the years ended December 31, |
2009 | | $ | 300,621 |
2010 | | | 81,625 |
2011 | | | 55,906 |
2012 | | | 2,202 |
2013 | | | 869 |
Thereafter | | | 1,124 |
| | | |
| | $ | 442,347 |
| | | |
131
PALMETTO BANCSHARES, INC. AND SUBSIDIARY
Notes To Consolidated Financial Statements—(Continued)
Jumbo Time Deposit Accounts
Jumbo time deposit accounts are accounts with balances totaling $100,000 or greater at the date indicated. The following table summarizes the Company’s jumbo time deposit accounts by maturity at December 31, 2008 (in thousands).
| | | |
Three months or less | | $ | 59,287 |
Over three months through six months | | | 24,954 |
Over six months through twelve months | | | 40,592 |
| | | |
Twelve months or less | | | 124,833 |
Over twelve months | | | 55,250 |
| | | |
Total jumbo time deposit accounts | | $ | 180,083 |
| | | |
Jumbo time deposit accounts totaled $150.4 million at December 31, 2007.
Interest Expense on Deposit Accounts
The following table summarizes the Company’s interest expense on traditional deposit accounts for the periods indicated (in thousands).
| | | | | | | |
| | | For the years ended
December 31, |
| | | 2008 | | 2007 | | 2006 |
Transaction deposit accounts | | $ | 4,966 | | 10,152 | | 5,424 |
Money market deposit accounts | | | 1,922 | | 3,977 | | 3,979 |
Savings deposit accounts | | | 129 | | 139 | | 147 |
Time deposit accounts | | | 16,677 | | 15,964 | | 15,430 |
| | | | | | | |
Total interest expense on traditional deposit accounts | | $ | 23,694 | | 30,232 | | 24,980 |
| | | | | | | |
132
PALMETTO BANCSHARES, INC. AND SUBSIDIARY
Notes To Consolidated Financial Statements—(Continued)
10. Borrowings
The following table provides further detail with respect to the Company’s borrowings composition at the dates and for the periods indicated (dollars in thousands).
| | | | | | | | |
| | | At and for the years ended
December 31, |
| | | 2008 | | | 2007 | | 2006 |
Retail repurchase agreements | | | | | | | | |
Amount outstanding at year-end | | $ | 16,357 | | | 11,280 | | 14,427 |
Average amount outstanding during year | | | 18,063 | | | 13,347 | | 17,639 |
Maximum amount outstanding at any month-end | | | 21,817 | | | 13,772 | | 23,344 |
Rate paid at year-end* | | | 0.25 | % | | 2.63 | | 3.63 |
Weighted average rate paid during the year | | | 1.37 | | | 4.04 | | 4.14 |
| | | |
Commercial paper | | | | | | | | |
Amount outstanding at year-end | | $ | 27,955 | | | 26,326 | | 20,988 |
Average amount outstanding during year | | | 32,415 | | | 27,295 | | 21,009 |
Maximum amount outstanding at any month-end | | | 37,487 | | | 32,667 | | 25,720 |
Rate paid at year-end* | | | 0.25 | % | | 2.81 | | 3.81 |
Weighted average rate paid during the year | | | 1.11 | | | 4.07 | | 4.13 |
| | | |
Other short-term borrowings—federal funds purchased from correspondent banks | | | | | | | | |
Amount outstanding at year-end | | $ | 35,785 | | | 18,000 | | 6,000 |
Average amount outstanding during year | | | 13,240 | | | 3,610 | | 847 |
Maximum amount outstanding at any month-end | �� | | 38,171 | | | 18,000 | | 6,000 |
Rate paid at year-end | | | 0.68 | % | | 4.32 | | 5.50 |
Weighted average rate paid during the year | | | 2.27 | | | 5.50 | | 5.19 |
| | | |
Other short-term borrowings—FHLB | | | | | | | | |
Amount outstanding at year-end | | $ | 44,000 | | | 12,000 | | — |
Average amount outstanding during year | | | 35,303 | | | 9,426 | | 2,140 |
Maximum amount outstanding at any month-end | | | 59,000 | | | 24,000 | | 10,900 |
Rate paid at year-end | | | 0.46 | % | | 4.56 | | — |
Weighted average rate paid during the year | | | 2.29 | | | 5.36 | | 4.63 |
| | | |
Long-term borrowings—FHLB | | | | | | | | |
Amount outstanding at year-end | | $ | 52,000 | | | — | | 10,000 |
Average amount outstanding during year | | | 41,415 | | | 4,521 | | 15,841 |
Maximum amount outstanding at any month-end | | | 52,000 | | | 10,000 | | 23,000 |
Rate paid at year-end | | | 2.90 | % | | — | | 3.85 |
Weighted average rate paid during the year | | | 2.89 | | | 3.83 | | 3.64 |
| * | | Rates paid are tiered based on level of deposit. Rate presented represents the average rate for all tiers offered at year-end. |
FHLB Borrowings
To borrow from the FHLB, members must pledge collateral to secure advances and letters of credit. Acceptable collateral includes a variety of single-family residential loans, commercial real estate loans, home equity lines of credit, and multifamily residential loans as well as a number of types of securities. The following table summarizes the Company’s FHLB borrowed funds utilization and availability at the dates indicated (in thousands).
133
PALMETTO BANCSHARES, INC. AND SUBSIDIARY
Notes To Consolidated Financial Statements—(Continued)
| | | | | | | |
| | | December 31, | |
| | | 2008 | | | 2007 | |
Available lendable loan collateral value to serve against FHLB advances | | $ | 159,060 | | | 105,535 | |
Available lendable investment security collateral value to serve against FHLB advances | | | 37,481 | | | — | |
| | |
Advances and letters of credit outstanding: | | | | | | | |
Short-term advances | | | (44,000 | ) | | (12,000 | ) |
Long-term advances | | | (52,000 | ) | | — | |
Letters of credit | | | (69,000 | ) | | (69,000 | ) |
| | | | | | | |
Total advances and letters of credit outstanding | | | (165,000 | ) | | (81,000 | ) |
| | | | | | | |
Available lendable collateral value to serve against FHLB advances | | $ | 31,541 | | | 24,535 | |
| | | | | | | |
At December 31, 2008, of its approximately $196.5 million available credit based lendable collateral value to serve against advances from the FHLB, the Company employed short-term and long-term advances totaling $96.0 million and $69.0 million in a letter of credit. At December 31, 2008, the Company had approximately $31.5 million available credit based lendable collateral value to serve against advances from the FHLB.
Federal Funds Accommodations
During the first quarter of 2008, a correspondent bank increased the Bank’s existing federal funds accommodation by $5 million. During the third quarter of 2008, the Company terminated one of its correspondent banking relationships, thereby reducing its overall federal funds accommodation by $5 million. Additionally, during the fourth quarter of 2008, two correspondent banks increased the Bank’s existing federal funds accommodation by $7.5 million, and an additional correspondent bank extended the Bank an unsecured discretionary federal funds accommodation in the amount of $10 million.
The following table summarizes the Company’s federal funds accommodations utilization and availability at the dates indicated (in thousands).
| | | | | | | |
| | | December 31, | |
| | | 2008 | | | 2007 | |
Available federal funds accomodation sources | | $ | 67,500 | | | 50,000 | |
Utilized federal funds accomodation sources | | | (35,785 | ) | | (18,000 | ) |
| | | | | | | |
Available federal funds accomodation sources | | $ | 31,715 | | | 32,000 | |
| | | | | | | |
134
PALMETTO BANCSHARES, INC. AND SUBSIDIARY
Notes To Consolidated Financial Statements—(Continued)
11. Income Taxes
The following table summarizes income tax expense attributable to continuing operations for the periods indicated (in thousands).
| | | | | | | | |
| | | For the years ended
December 31, |
| | | 2008 | | | 2007 | | 2006 |
Current | | | | | | | | |
Federal | | $ | 8,272 | | | 6,947 | | 6,511 |
State | | | 610 | | | 724 | | 683 |
| | | | | | | | |
Total current | | | 8,882 | | | 7,671 | | 7,194 |
Deferred | | | | | | | | |
Federal | | | (1,418 | ) | | 728 | | 768 |
| | | | | | | | |
Total current and deferred | | $ | 7,464 | | | 8,399 | | 7,962 |
| | | | | | | | |
The excess tax benefit from equity based awards recorded in shareholders’ equity was $78 thousand during the year ended December 31, 2008.
The Company had a net deferred tax asset of $607 thousand for 2008 and a net deferred tax liability of $2.7 million for 2007. The following table summarizes the Company’s net deferred tax asset (liability) and the tax impacts of temporary differences that gave rise to significant portions of these deferred tax assets and liabilities at the dates indicated (in thousands).
| | | | | | | |
| | | December 31, | |
| | | 2008 | | | 2007 | |
Deferred tax assets | | | | | | | |
Allowance for loan losses reserve | | $ | 3,850 | | | 2,596 | |
Unrealized loss on investment securities available for sale | | | 989 | | | 157 | |
Pension asset adjustment | | | 174 | | | — | |
Other | | | 711 | | | 328 | |
| | | | | | | |
Total deferred tax assets, gross | | | 5,724 | | | 3,081 | |
| | |
Deferred tax liabilities | | | | | | | |
Premises and equipment, due to depreciation differences | | | (1,095 | ) | | (1,014 | ) |
Basis of intangible assets for financial reporting purposes in excess of basis for tax purposes | | | (537 | ) | | (404 | ) |
Deferred loan costs deducted for tax purposes as incurred | | | (155 | ) | | (276 | ) |
Deferred loan fees recognized under the principal reduction method for tax purposes | | | (2,054 | ) | | (2,108 | ) |
Pension asset adjustment | | | — | | | (693 | ) |
Mortgage-servicing rights | | | (1,026 | ) | | (1,032 | ) |
Other | | | (250 | ) | | (279 | ) |
| | | | | | | |
Total deferred tax liabilities, gross | | | (5,117 | ) | | (5,806 | ) |
| | | | | | | |
Deferred tax asset (liability), net | | $ | 607 | | | (2,725 | ) |
| | | | | | | |
The Company established no valuation reserve at December 31, 2008 or 2007 as it is management’s belief that it is more likely than not that the remaining deferred tax assets will be realized based on the Company’s history of income, sources of taxable income in carry back periods, and its ability to implement tax-planning strategies.
135
PALMETTO BANCSHARES, INC. AND SUBSIDIARY
Notes To Consolidated Financial Statements—(Continued)
A portion of the $3.3 million change in 2008 from the net deferred tax liability to the net deferred asset relates to the change in the unrealized losses on investment securities available for sale. A current period deferred tax credit of $832 thousand related to the change in unrealized gains on investment securities available for sale of $2.2 million has been recorded directly to shareholders’ equity.
In accordance with SFAS No. 158, as of December 31, 2008, a current period deferred tax credit of $1.1 million was recorded against a charge of $3.1 million to shareholders’ equity relative to the Company’s noncontributory defined benefit pension plan.
The remainder of the change in 2008 from the net deferred tax liability to the net deferred tax asset results from the current period deferred tax credit to income of $1.4 million.
The following table reconciles the Company’s statutory federal income tax rate to the effective income tax rate for the periods indicated.
| | | | | | | | | |
| | | For the years ended
December 31, | |
| | | 2008 | | | 2007 | | | 2006 | |
U.S. federal income tax rate | | 35.0 | % | | 35.0 | | | 35.0 | |
Changes from statutory rates resulting from: | | | | | | | | | |
Tax-exempt interest income | | (3.1 | ) | | (2.7 | ) | | (3.1 | ) |
Expenses not deductible for tax purposes | | 0.9 | | | 1.1 | | | 0.9 | |
State taxes, net of Federal income tax benefit | | 1.9 | | | 1.9 | | | 1.9 | |
Other | | 0.7 | | | (0.9 | ) | | (0.4 | ) |
Effective tax rate | | 35.4 | % | | 34.4 | | | 34.3 | |
The Company recognizes interest and penalties as a component of income tax expense.
The Company is subject to U.S. federal and South Carolina state income tax. With few exceptions, Palmetto Bancshares and its subsidiary are not subject to federal and state income tax examinations for taxable years prior to 2005.
Tax authorities in various jurisdictions routinely examine the Company. During 2008, the IRS is examined the Company’s returns for tax years 2006 through 2007. The Company is also currently subject to examination by state taxing authorities.
At December 31, 2008 and 2007, the Company had no unrecognized tax benefits as a result of the requirements of FIN No. 48.
12. Employee Benefit Plans
Defined Benefit Pension Plan
Historically, as part of its comprehensive employment program, the Company offered a noncontributory, defined benefit pension plan that covered all full-time employees having at least twelve months of continuous service and having attained age 21. The plan was originally designed to produce a designated retirement benefit, and benefits were fully vested after five years of service. No vesting occurred until five years of service had been achieved. The Company’s trust department administers the plan’s assets. Contributions to the plan were made as required by the Employee Retirement Income Security Act of 1974.
136
PALMETTO BANCSHARES, INC. AND SUBSIDIARY
Notes To Consolidated Financial Statements—(Continued)
During the fourth quarter of 2007, the Company notified employees that, effective 2008, it would cease accruing pension benefits for employees with regard to the Company’s noncontributory, defined benefit pension plan. Although no previously accrued benefits will be lost, employees will no longer accrue benefits for service subsequent to 2007.
Accounting Policy. As noted in Note 1 contained herein, the Company accounts for its defined benefit pension plans in accordance with SFAS No. 87 and SFAS No. 158.
The Company follows the disclosure requirements of SFAS No. 132(R), “Employers’ Disclosures about Pensions and Other Postretirement Benefits,” which revises employers’ disclosures about pension plans and other postretirement benefit plans. This literature changes the measurement or recognition of those plans required by SFAS No. 87 and SFAS No. 106.
The Company adopted SFAS No. 158, recognized the funded status of its defined benefit postretirement plan, and provided the additional required disclosures beginning with the year ended December 31, 2007. This Statement required, among other things, the recognition of the overfunded or underfunded status of pension and other postretirement benefit plans on the balance sheet. Under SFAS No. 158, gains and losses, prior service costs and credits, and any remaining transition amounts under SFAS No. 87 and SFAS No. 106 that had not yet been recognized through net periodic benefit cost are recognized in accumulated other comprehensive income, net of tax impacts, until they are amortized as a component of net periodic cost. In accordance with SFAS No. 158, unless a business entity remeasures both its plan assets and benefit obligations during the fiscal year, the funded status it reports in its Consolidated Interim Balance Sheet shall be the same asset or liability recognized in the previous year end Consolidated Balance Sheet adjusted for subsequent accruals of net periodic benefit cost that exclude the amortization of amounts previously recognized in other comprehensive income and contributions to a funded plan, or benefit payments. SFAS No. 158 does not change the amount of net periodic benefit expense charged to income. The Company conformed its pension asset and pension and postretirement liabilities to SFAS No. 158 and recorded a corresponding reduction of $4.1 million, after-tax, to the December 31, 2007, balance of accumulated other comprehensive income (loss) in stockholders’ equity relative to the adoption of SFAS No. 158. The Company recorded a reduction of $2.0 million, after-tax, to accumulated other comprehensive income (loss) in stockholders’ equity in order to recognize the underfunded status of the Company’s defined benefit pension plan at December 31, 2008.
137
PALMETTO BANCSHARES, INC. AND SUBSIDIARY
Notes To Consolidated Financial Statements—(Continued)
Defined Benefit Pension Plan Funded Status. The following table summarizes the combined change in benefit obligation, defined benefit pension plan assets, and funded status of the Company’s defined benefit pension plan at the dates and for the periods indicated (in thousands) including the impact of the curtailment of accrued pension benefits and the adoption of SFAS No. 158.
| | | | | | | |
| | | At and for the years
ended December 31, | |
| | | 2008 | | | 2007 | |
Change in benefit obligation | | | | | | | |
Benefit obligation, beginning of period | | $ | 13,934 | | | 14,692 | |
Service cost | | | — | | | 722 | |
Interest cost | | | 683 | | | 868 | |
Impact of plan curtailment | | | — | | | (2,508 | ) |
Net actuarial loss (gain) | | | (1,788 | ) | | 598 | |
Benefits paid | | | (1,559 | ) | | (438 | ) |
| | | | | | | |
Benefit obligation, end of period | | | 11,270 | | | 13,934 | |
| | |
Change in plan assets | | | | | | | |
Fair value of plan assets, beginning of period | | | 15,914 | | | 14,798 | |
Return on plan assets | | | (3,594 | ) | | 455 | |
Employer contribution | | | 13 | | | 1,099 | |
Benefits paid | | | (1,559 | ) | | (438 | ) |
| | | | | | | |
Fair value of plan assets, end of period | | | 10,774 | | | 15,914 | |
| | | | | | | |
Funded status / Accrued asset (liability) recognized, net, end of year | | $ | (496 | ) | | 1,980 | |
| | | | | | | |
The Company’s accrued asset (liability) recognized, net at December 31, 2008 and 2007 is included in other assets on the Consolidated Balance Sheets.
Cost of Defined Benefit Pension Plan. The following table summarizes the adjusted net periodic (income) expense components for the Company’s defined benefit pension plan, which is included in salaries and other personnel expense on the Consolidated Statements of Income, for the periods indicated (in thousands).
| | | | | | | | | | |
| | | For the years ended
December 31, | |
| | | 2008 | | | 2007 | | | 2006 | |
Service cost | | $ | — | | | 722 | | | 643 | |
Interest cost | | | 683 | | | 868 | | | 802 | |
Expected return on plan assets | | | (1,267 | ) | | (1,358 | ) | | (1,193 | ) |
Amortization of prior service cost | | | — | | | 5 | | | 4 | |
Amortization of net actuarial (gain) loss | | | (19 | ) | | 278 | | | 281 | |
| | | | | | | | | | |
Net periodic pension (income) expense | | $ | (603 | ) | | 515 | | | 537 | |
| | | | | | | | | | |
The service cost component of net periodic pension cost is the actuarial present value of benefits attributed by the plan’s benefit formula to services rendered by employees during the period. As a result of the Company’s decision to curtail the plan effective on January 1, 2008, no costs relative to this component of net periodic pension cost were necessary during 2008 since employees did not accrue benefits for services rendered during the period.
The actuarial loss is the unanticipated change in the unfunded liability over a given year, i.e. the excess of the actual unfunded liability over the predicted unfunded liability resulting from unanticipated events. The net
138
PALMETTO BANCSHARES, INC. AND SUBSIDIARY
Notes To Consolidated Financial Statements—(Continued)
actuarial loss decreased at December 31, 2008 due to the reduction in liability resulting from the plan curtailment, as this curtailment had not been previously anticipated. The fluctuation in amortization of the net actuarial (gain) loss during the year ended December 31, 2008 reflects this fluctuation in the net actuarial (gain) loss balance.
Defined Benefit Pension Plan Assumptions. The following table summarizes the assumptions used in computing the benefit obligations and the adjusted net periodic (income) expense for the Company’s defined benefit pension plan for the periods indicated.
| | | | | | | |
| | | For the years ended
December 31, |
| | | 2008 | | | 2007 | | 2006 |
Discount rate | | 5.70 | % | | 5.80 | | 6.00 |
Rate of increase in compensation levels | | 3.50 | | | 3.50 | | 4.00 |
Expected long-term rate of return on plan assets | | 8.00 | | | 9.00 | | 9.00 |
Defined Benefit Pension Plan Assets. The following table summarizes the defined benefit pension plan’s weighted average asset allocations at the dates indicated, by asset category.
| | | | | |
| | | December 31, |
| | | 2008 | | | 2007 |
Cash | | 7 | % | | 9 |
Equity securities | | 41 | | | 34 |
Debt securities | | 52 | | | 57 |
| | | | | |
Total securities | | 100 | % | | 100 |
| | | | | |
The investment objectives of the defined benefit pension plan assets are designed to maintain full funding with respect to the projected benefit obligation and to maximize returns in order to minimize contributions within reasonable and prudent levels of risk. The precise amount for which these obligations will be settled depends on future events, including the life expectancy of the defined benefit pension plan’s members and salary inflation. The obligations are estimated using actuarial assumptions, based on the current economic environment. The defined benefit pension plan’s investment strategy balances the requirement to generate return, using higher-returning assets, with the need to control risk using less volatile assets. Risks include, but are not limited to, inflation, volatility in equity values, and changes in interest rates that could cause the defined benefit pension plan to become underfunded, thereby increasing the defined benefit pension plan’s dependence on contributions from the Company.
Plan assets are managed by professional investment firms as well as by investment professionals that are employees of the Company as approved by the Board of Directors. The Compensation Committee of the Board of Directors is responsible for maintaining the investment policy of the defined benefit pension plan, approving the appointment of the investment manager, and reviewing the performance of the defined benefit pension plan assets at least annually.
Investments within the defined benefit pension plan are diversified with the intent to minimize the risk of large losses to the defined benefit pension plan. The total portfolio is constructed and maintained to provide prudent diversification within each investment category, and the Company assumes that the volatility of the portfolio will be similar to the market as a whole. The asset allocation ranges represent a long-term perspective. Therefore, rapid unanticipated market shifts may cause the asset mix to fall outside the policy range. Such divergences should be short-term in nature.
139
PALMETTO BANCSHARES, INC. AND SUBSIDIARY
Notes To Consolidated Financial Statements—(Continued)
Adjustments to Accumulated Other Comprehensive Income (Loss). The following table summarizes the cumulative adjustments made to accumulated other comprehensive income (loss) during 2008 and 2007 relative to the Company’s defined benefit pension plan (in thousands).
| | | | | | | | | | |
| | | Impact
of
SFAS
No. 158 | | | Impact of
curtailment | | | Total impact
of defined
benefit
pension plan | |
Accumulated other comprehensive income (loss), after income tax impact, December 31, 2006 | | $ | — | | | — | | | — | |
Accumulated other comprehensive income (loss), before income tax impact | | $ | (6,334 | ) | | 2,508 | | | (3,826 | ) |
Income tax impact | | | 2,218 | | | (878 | ) | | 1,340 | |
| | | | | | | | | | |
Accumulated other comprehensive income (loss), after income tax impact | | $ | (4,116 | ) | | 1,630 | | | (2,486 | ) |
| | | | | | | | | | |
Accumulated other comprehensive income (loss), after income tax impact, December 31, 2007 | | $ | (4,116 | ) | | 1,630 | | | (2,486 | ) |
| | | | | | | | | | |
Accumulated other comprehensive income (loss), before income tax impact | | $ | (3,092 | ) | | — | | | (3,092 | ) |
Income tax impact | | | 1,082 | | | — | | | 1,082 | |
| | | | | | | | | | |
Accumulated other comprehensive income (loss), after income tax impact | | $ | (2,010 | ) | | — | | | (2,010 | ) |
| | | | | | | | | | |
Accumulated other comprehensive income (loss), after income tax impact, December 31, 2008 | | $ | (6,126 | ) | | 1,630 | | | (4,496 | ) |
| | | | | | | | | | |
Current and Future Expected Contributions. Contributions to defined benefit pension plan assets totaled $13 thousand during fiscal year 2008 as compared to $1.1 million during 2007. The decrease is a result of the ceasing of accrued pension benefits for employees with regard to its noncontributory, defined benefit pension plan in 2007. The Company’s actuary is currently analyzing the actual impact that the defined benefit pension plan curtailment will have on future contributions.
Expected Future Defined Benefit Pension Plan Payments. The following table summarizes the benefits expected to be paid for the periods indicated (in thousands).
| | | |
During the years ended December 31, |
2009 | | $ | 636 |
2010 | | | 680 |
2011 | | | 714 |
2012 | | | 775 |
2013 | | | 845 |
2014 - 2018 | | | 3,530 |
The expected benefits to be paid are based on the same assumptions used to measure the Company’s benefit obligation at December 31, 2008.
401(k) Plan
Employees are given the opportunity to participate in the Company’s 401(k) plan designed to supplement an employee’s retirement income. Under the plan, the Company makes contributions to a trust fund that will pay the
140
PALMETTO BANCSHARES, INC. AND SUBSIDIARY
Notes To Consolidated Financial Statements—(Continued)
employee benefits at retirement. Employees are eligible to participate in this plan after completing one year of service and reaching age 21. Employees may withhold from one percent to fifteen percent of compensation with certain limitations for deposit into the trust fund. Employees may terminate deferrals at any time. The Company makes matching contributions to each employee based on the employee’s deferral in a percentage set by the Company prior to the end of each plan year.
Matching Contributions. During the years ended December 31, 2008, 2007, and 2006, the Company made matching contributions to its employee 401(k) plan totaling $327 thousand, $302 thousand, and $257 thousand, respectively.
Plan Error. During 2007, in conjunction with the audit of the Company’s 401(k) Plan, an administrative error was discovered that resulted in participants being denied the opportunity to fully defer the appropriate amount of compensation under the plan. During 2007, the Company calculated and accrued the denied deferral amount and the resulting employer match, including missed earnings. Those amounts totaled approximately $1.6 million through December 31, 2007. Those amounts were recorded within salaries and other personnel expense on the Consolidated Statements of Income for the year ended December 31, 2007. The Company contributed these amounts to each participant’s account during the fourth quarter of 2007.
Collateral Split-Dollar Life Insurance Arrangements
On January 1, 2008, the Company changed its accounting policy and recognized a cumulative-effect adjustment to retained earnings totaling $99 thousand related to accounting for certain collateral split-dollar life insurance arrangements in connection with the adoption of EITF No. 06-10. Deferred compensation expense related to such collateral split-dollar life insurance arrangements was less than $1 thousand for the year ended December 31, 2008.
Bank-Owned Life Insurance
The Company has purchased life insurance policies on certain key employees. Such policies are recorded in other assets on the Consolidated Balance Sheets at their cash surrender value, or the amount that can be realized. At December 31, 2008, the cash surrender value of such policies totaled $1.6 million.
13. Equity Based Compensation
Stock Option Plan
General. Since 1987, the Company has adopted several plans pursuant to which the Company may grant incentive and nonincentive stock options to certain key employees and directors of the Company. The Company’s shareholders have approved all of the plans. The Board determines the option price and term of the options on the grant date. The option price must be at least 100% of fair value of the Company’s common stock as of the grant date, and the term of the options shall not be greater than 10 years. Historically, the Company has utilized an annual independent market valuation to assist the Company in establishing the market value per share of a minority block of the outstanding common shares of Palmetto Bancshares, Inc. for use in conjunction with stock options. The Company believed that this was the best method to value its common stock based on the lack of an active public trading market in the stock. However, beginning in 2007, management determined that an average trading price valuation method, based on the last five known trades of the stock, was a more appropriate estimate of the fair value of the Company’s common stock. Management’s determination was based upon increased volume of private sales and purchases of the Company’s stock. Therefore, the Company changed the method used to value its common stock held from the annual independent stock appraisal method to the average trading price method during 2007.
141
PALMETTO BANCSHARES, INC. AND SUBSIDIARY
Notes To Consolidated Financial Statements—(Continued)
Under the Palmetto Bancshares, Inc. 1997 Stock Compensation Plan, the Company may grant nonqualified stock options and incentive stock options.
The Palmetto Bancshares, Inc. 1997 Stock Compensation Plan originally provided for the issuance of 175,000 common shares, which were doubled in conjunction with a stock split in 2000 and increased by 100,000 in 2003. As provided in the Palmetto Bancshares, Inc. 1997 Stock Compensation Plan, as of close of business on December 8, 2007, the plan terminated, and no options were granted under the plan after that date. However, the termination did not impact options previously granted under the plan. All options expire at various dates through December 31, 2016. Of these, 169,330 remained outstanding at December 31, 2008 with exercise prices ranging from $13.00 to $30.40. All options granted have a vesting term of five years and an exercise period of ten years.
Determining Fair Value.
| | • | | Valuation and Amortization Method. The Company estimates the fair value of stock options granted using the Black-Scholes option-pricing formula. This fair value is then amortized on a straight-line basis over the requisite service periods of the awards, which is generally the vesting period. |
| | • | | Dividend Yields. The Company estimates the expected dividend based on historical dividends declared per year, giving consideration for any anticipated changes and the estimated stock price over the expected term based on historical experience when using the Black-Scholes option-pricing formula to determine the fair value of options granted. |
| | • | | Expected Volatility. As of January 16, 2007, all options under the plan had been granted. As noted above, prior to April 2007, the Company used an annual independent stock appraisal to assist the Company in establishing the fair value per share of its common stock. The Company used these fair market valuations of the common stock to determine the estimated volatility factor for the Black-Scholes option-pricing formula. |
| | • | | Risk-Free Interest Rate. The Company bases the risk-free interest rate used in the Black-Scholes option pricing formula on the implied yield currently available on U.S. Department of the Treasury zero coupon issues with the same or substantially equivalent remaining term as the expected term of the option. |
| | • | | Expected Term. The expected term represents the period that the Company’s stock option awards are expected to be outstanding. The Company bases the expected term of options on its historical share option exercise experience. |
The following table summarizes the stock option awards granted by the Company, the fair value of each award granted as estimated on the date of grant using the Black-Scholes option-pricing model, and the weighted average assumptions used for such grants for the grant date indicated.
| | | | |
Grant Date | | 1/16/2007 | |
Stock option awards granted | | | 800 | |
Option price | | $ | 30.40 | |
Fair value of each stock option award granted | | $ | 6.24 | |
| |
Expected dividend yields | | | 2.5 | % |
Expected volatility | | | 13 | % |
Risk-free interest rate | | | 5 | % |
Expected term (years) | | | 10 | |
Vesting period (years) | | | 5 | |
142
PALMETTO BANCSHARES, INC. AND SUBSIDIARY
Notes To Consolidated Financial Statements—(Continued)
Stock Option Compensation Expense. The compensation cost that was charged against pretax income during 2008 for stock options was $94 thousand. The total income tax benefit recognized in the Consolidated Statements of Income with regard to the deductible portion of this compensation cost was $6 thousand. The compensation cost that was charged against pretax net income during 2007 for stock options was $132 thousand. The total income tax benefit recognized in the Consolidated Statements of Income with regard to the deductible portion of this compensation cost was $6 thousand. Management estimated that forfeitures would not be significant and is recognizing compensation costs for all equity based awards.
At December 31, 2008 and 2007, based on options outstanding at that time, the total compensation cost related to nonvested stock option awards granted under the Company’s stock option plan but not yet recognized was $95 thousand and $188 thousand, respectively, before the impact of income taxes. Stock option compensation expense is recognized on a straight-line basis over the vesting period of the option. This remaining compensation cost related to nonvested stock option awards at December 31, 2008 is expected to be recognized over a remaining period of three years.
Stock Option Activity. The following table summarizes stock option activity for the Palmetto Bancshares, Inc. 1997 Stock Compensation Plan for the periods indicated.
| | | | | | |
| | | Stock options
outstanding | | | Weighted-
average
exercise price |
Outstanding at December 31, 2005 | | 252,785 | | | $ | 16.63 |
Granted | | 35,000 | | | | 27.30 |
Exercised | | (36,115 | ) | | | 12.77 |
| | | | | | |
Outstanding at December 31, 2006 | | 251,670 | | | | 18.67 |
| | | | | | |
Granted | | 800 | | | | 30.40 |
Exercised | | (54,315 | ) | | | 12.93 |
| | | | | | |
Outstanding at December 31, 2007 | | 198,155 | | | | 20.29 |
| | | | | | |
Granted | | — | | | | — |
Forfeited | | (4,500 | ) | | | 20.00 |
Exercised | | (24,325 | ) | | | 15.61 |
| | | | | | |
Outstanding at December 31, 2008 | | 169,330 | | | $ | 20.98 |
| | | | | | |
Cash received from stock option exercises under the Company’s stock option plan for the years ended December 31, 2008, 2007, and 2006 was $380 thousand, $702 thousand, and $461 thousand, respectively.
Stock Options Outstanding. The following table summarizes information regarding stock options outstanding and exercisable at December 31, 2008.
| | | | | | | | | | | | | | | | |
| | | Options outstanding | | Options exercisable |
Exercise price or range of exercise prices | | Number of
stock
options
outstanding
at 12/31/08 | | Weighted-
average
remaining
contractual
life (years) | | Weighted-
average
exercise
price | | Number of
stock
options
exercisable
at 12/31/08 | | Weighted-
average
exercise
price |
13.00 to 13.50 | | 25,920 | | 1.30 | | $ | 13.15 | | 25,920 | | $ | 13.15 |
15.00 to 20.00 | | 54,410 | | 3.40 | | | 17.02 | | 54,410 | | | 17.02 |
23.30 to 26.60 | | 55,200 | | 5.40 | | | 24.63 | | 48,600 | | | 24.36 |
27.30 to 30.40 | | 33,800 | | 7.02 | | | 27.37 | | 19,320 | | | 27.35 |
| | | | | | | | | | | | | | | | |
Total | | 169,330 | | 4.46 | | | 20.98 | | 148,250 | | | 20.10 |
| | | | | | | | | | | | | | | | |
143
PALMETTO BANCSHARES, INC. AND SUBSIDIARY
Notes To Consolidated Financial Statements—(Continued)
The total intrinsic value of stock options exercised during the years ended December 31, 2008, 2007, and 2006 was $631 thousand, $1.5 million, and $525 thousand, respectively. The intrinsic value of stock options outstanding and exercisable at December 31, 2008 and 2007 was $3.2 million and $3.5 million, respectively.
Restricted Stock Plan
On February 19, 2008, the Company’s Board of Directors adopted, subject to shareholder approval, the Palmetto Bancshares, Inc. 2008 Restricted Stock Plan, which provides for the grant of stock awards to the Company’s employees, officers, and directors. The Company’s shareholders approved the Palmetto Bancshares, Inc. 2008 Restricted Stock Plan on April 15, 2008. A total of 250,000 shares of common stock have been reserved for issuance pursuant to awards under the plan, subject to its anti-dilution provisions. The first awards were granted in January 2009.
The Company measures compensation cost for restricted stock awards at fair value and recognizes compensation expense over the service period for awards expected to vest. The fair value of restricted stock is based on the number of shares granted and the quoted price of the Company’s common stock. In addition, the estimation of restricted stock awards that will ultimately vest requires judgment, and to the extent actual results or updated estimates differ from current estimates, such amounts will be recorded as a cumulative adjustment in the period estimates are revised.
Shares of restricted stock granted to employees under the 2008 Restricted Stock Plan are subject to restrictions as to continuous employment for a specified time period following the date of grant. During this period, the holder is entitled to full voting rights and dividends.
14. Net Income per Common Share
The following table summarizes the Company’s reconciliation of the numerators and denominators of the basic and diluted net income per common share computations for the periods indicated.
| | | | | | | |
| | | For the years ended December 31, |
| | | 2008 | | 2007 | | 2006 |
Weighted average common shares outstanding—basic | | | 6,438,071 | | 6,390,858 | | 6,353,752 |
Dilutive impact resulting from potential common share issuances | | | 81,778 | | 86,805 | | 67,990 |
| | | | | | | |
Weighted average common shares outstanding—diluted | | | 6,519,849 | | 6,477,663 | | 6,421,742 |
| | | | | | | |
Per Share Data | | | | | | | |
Net income—basic | | $ | 2.11 | | 2.51 | | 2.40 |
Net income—diluted | | | 2.09 | | 2.47 | | 2.37 |
At December 31, 2008, all outstanding options were included in the calculation of diluted net income per common share because the exercise price of all options was lower than the average market price as determined by the average trading price of the last five known trades of the Company’s common stock.
15. Other Commitments and Contingencies
In the normal course of business, the Company enters into various transactions, some of which, in accordance with accounting principles generally accepted in the U.S., are not recorded in its Consolidated Balance Sheets. These transactions may involve, to varying degrees, elements of credit risk and interest rate risk in excess of the amounts recognized in the Consolidated Balance Sheets, if any.
144
PALMETTO BANCSHARES, INC. AND SUBSIDIARY
Notes To Consolidated Financial Statements—(Continued)
Lending Commitments. Unused lending availability is not recorded in the Company’s Consolidated Balance Sheets until funds are advanced. For commercial customers, lending commitments generally take the form of unused revolving credit arrangements to finance customers’ working capital requirements. For retail customers, lending commitments are generally unused lines of credit secured by residential property. At December 31, 2008, unused lending availability totaled $286.7 million.
Standby Letters of Credit. Standby letters of credit represent an obligation of the Company to a third party contingent upon the failure of the Company’s customer to perform under the terms of an underlying contract with the third party or an obligation of the Company to guarantee or stand as surety for the benefit of the third party. Under the terms of a standby letter of credit, generally, drafts will be drawn only when the underlying event fails to occur. The Company has legal recourse to its customers for amounts paid, and these obligations can be secured or unsecured depending on the customers’ creditworthiness. Commitments under standby letters of credit are typically for one year or less. The Company applies the same credit standards used in the lending process when extending letters of credit and evaluates its obligation to perform as a guarantor and records liabilities as deemed necessary. At December 31, 2008, the Company recorded no liability for its obligation to perform as a guarantor under standby letters of credit. The maximum potential amount of undiscounted future payments related to standby letters of credit at December 31, 2008 was $8.6 million compared with $11.2 million at December 31, 2007. Past experience indicates that standby letters of credit will expire unused. However, through its various sources of liquidity, the Company believes that it has the resources available to meet these obligations should the need arise. Additionally, the Company does not believe that the current fair value of such guarantees was material at December 31, 2008.
Derivatives.See Note 16 for further discussion regarding the Company’s off-balance sheet arrangements and commitments related to derivative loan commitments and its forward loan sales commitments.
Long-Term Contractual Obligations. In addition to the contractual commitments and arrangements previously described, which, depending on the nature of the obligation, may or may not require use of the Company’s resources, the Company enters into other contractual obligations in the ordinary course of business. The following table summarizes future contractual payments relative to real property operating lease obligations of the Company, by period, as of December 31, 2008 (in thousands). Option periods that the Company has not yet exercised are not included in the table below.
| | | |
During the years ended December 31, |
2009 | | $ | 1,842 |
2010 | | | 1,950 |
2011 | | | 1,809 |
2012 | | | 1,706 |
2013 | | | 1,582 |
Thereafter | | | 15,871 |
| | | |
| | $ | 24,760 |
| | | |
Obligations under noncancelable real property operating lease agreements noted above are payable over several years with the longest obligation expiring in 2029. Option periods that the Company has not yet exercised are not included in the preceding table.
Real property operating lease obligations summarized in the preceding table:
| | • | | Are net of payments to be received under a sublease agreement with a third party with regard to the Company’s previous Blackstock Road banking office for which it is contracted under a lease agreement as Lessee. |
145
PALMETTO BANCSHARES, INC. AND SUBSIDIARY
Notes To Consolidated Financial Statements—(Continued)
| | • | | Include obligations with regard to three banking offices that were consolidated during 2008 that are leased by the Company. Management is considering options with regard to these leased locations. |
| | • | | Include obligations through June 2009, the end of the contractual lease period, with regard to the Greer banking office existing at December 31, 2008. |
| | • | | Do not include periodic increases in lease payments for the Rock Hill operating building lease and operating lease for additional office space. Lease payment increases for periods subsequent to February 2009 cannot be determined as lease payments depend on consumer price index changes. Management does not believe that future minimum lease payments relative to these locations will significantly differ from current obligations at December 31, 2008. Therefore, current lease obligations have been used to determine the operating lease obligations in the preceding table. Obligations under these operating lease agreements are payable over several years with the building lease expiring in 2015 and the additional office space lease expiring in 2011. |
| | • | | Do not include the additional office space and parking leases in downtown Greenville which are paid month-to-month during construction of the Company’s new downtown Greenville banking office as there are no written contractual obligation continuing into 2009. However, the Company does believe it will continue to lease parking spaces once the headquarters is complete and the new lease agreement is in effect. |
The Company will relocate its corporate headquarters to downtown Greenville, South Carolina during March 2009. During 2007, the Company executed a build-to-suit operating lease agreement in conjunction with its new corporate headquarters. Under the terms of the lease agreement, the Lessor will purchase from the Bank two parcels of land and improvements thereon adjacent to the Lessor’s land (one of which houses the temporary downtown Greenville banking office during construction). The Lessor will combine the original premises and the newly purchased lessee property and will complete site work, construct improvements, and lease the resulting premises to the Company under the terms and conditions of the 2007 lease agreement. During construction of the corporate headquarters in 2008, the Company has continued to pay operating lease payments on a month-to-month basis with the Lessor with regard to its previous downtown Greenville banking office. Upon occupancy, these lease payments will be replaced with those required by the build-to-suit operating lease agreement dated May 2, 2007. For purposes of the preceding table, the Company has assumed occupancy during March 2009. Therefore, the real property operating lease obligations in the preceding table include the Company’s obligations to the real property operating lease related to the new corporate headquarters beginning in March 2009 and the old corporate headquarters until that time.
Building and ground lease rental expenses related to the Company’s corporate offices, banking offices, nonbanking office automatic teller machine locations, Palmetto Capital independent offices, and other properties totaled $912 thousand, $824 thousand, and $744 thousand for the years ended December 31, 2008, 2007, and 2006, respectively. Offsetting this expense were sublease payments totaling $18 thousand for the years ended December 31, 2008 and 2007 and $55 thousand for the year ended December 31, 2006.
The Company enters into agreements with third parties with respect to the leasing, servicing, and maintenance of equipment. However, because the Company believes that these agreements are immaterial when considered individually, or in the aggregate, with regard to the Company’s Consolidated Financial Statements, the Company has not included such agreements in the preceding contractual obligations table. Therefore, management believes that noncompliance with terms of such agreements would not have a material impact on the Company’s business, financial condition, results of operations, and cash flows. Furthermore, as most such commitments are entered into for a 12-month period with option extensions, long-term obligations beyond 2009 cannot be reasonably estimated at this time.
146
PALMETTO BANCSHARES, INC. AND SUBSIDIARY
Notes To Consolidated Financial Statements—(Continued)
Short-Term Contractual and Noncontractual Obligations. The Company enters into binding agreements for property services (with regard to construction). However, those premises and equipment commitments are considered to be short-term in nature because they do not extend over more than one year.
The Company anticipates that it will spend approximately $4 million, a portion of which is contractual, with regard to the upfitting of the new corporate headquarters facility, of which approximately $425 thousand had been spent as of December 31, 2008. The Company expects remaining obligations to be funded during the first quarter of 2009.
During 2008, the Bank purchased property at the intersection of West Wade Hampton Boulevard and Middleton Way in Greenville County on which to construct and relocate its existing Greer banking office. The Company expects to celebrate its grand opening during the second quarter of 2009. The Company estimates that this relocation, including premises, furnishings, and equipment, will cost between $2 million and $2.5 million of which, at December 31, 2008, the Company had expended approximately $1.5 million. The remaining costs, which are comprised of both contractual and noncontractual obligations, are expected to be expended prior to the branch office’s opening.
In addition to the short-term contractual and noncontractual capital expenditures anticipated during 2009 described above, annually, in conjunction with the Company’s budgeting process, capital expenditures are approved for the coming year. During the budgeting process for 2009, the Board of Directors approved $1.5 million in capital expenditures. Approved expenditures include expenditures with regard to the upkeep and maintenance of existing properties and upgrades to the Company’s information systems. Generally, purchase obligations are not made in advance of such purchases. In addition, management anticipates that expenditures will be required during 2009 that could not have been expected and, therefore, were not approved in the budgeting process. Funds to fulfill both budgeted and nonbudgeted commitments will come from operational cash flows of the Company.
Although the Company expects to make capital expenditures in years subsequent to 2009, capital expenditures are reviewed by management on an annual basis. Therefore, the Company cannot estimate such capital expenditures obligations for years subsequent to 2009.
Legal Proceedings
The Company is currently subject to various legal proceedings and claims that have arisen in the ordinary course of its business. In the opinion of management, based on consultation with external legal counsel, any reasonably foreseeable outcome of such current litigation would not materially impact the Company’s financial condition or results of operations.
16. Derivative Financial Instruments and Hedging Activities
The aggregate fair value of derivative loan commitments and freestanding derivatives at December 31, 2008 and 2007 were immaterial. See Note 1 for discussion of the Company’s accounting policies regarding its derivative instruments.
17. Disclosures Regarding Fair Value of Financial Instruments
The Company uses fair value measurements to record fair value adjustments to certain assets and liabilities and to determine fair value disclosures. In addition to instruments recorded at fair value on a recurring basis, from time to time, the Company may be required to record at fair value other assets on a nonrecurring basis.
147
PALMETTO BANCSHARES, INC. AND SUBSIDIARY
Notes To Consolidated Financial Statements—(Continued)
Effective on January 1, 2008, the Company adopted SFAS No. 157. SFAS No. 157 defines fair value, establishes a consistent framework for measuring fair value and expands disclosure requirements for fair value measurements. Additionally, SFAS No. 157 amended SFAS No. 107, and, therefore, the Company follows SFAS No. 157 in determination of SFAS No. 107 fair value disclosure amounts. All related fair value disclosures are included herein.
Fair Value Hierarchy
Under SFAS No. 157, the Company groups its assets and liabilities at fair value in three levels, based on the markets in which the assets and liabilities are traded and the reliability of the assumptions used to determine fair value. These levels are:
| | • | | Level 1 – Valuation is based upon quoted prices for identical instruments traded in active markets. |
| | • | | Level 2 – Valuation is based upon quoted prices for similar instruments in active markets, quoted prices for identical or similar instruments in markets that are not active, and model-based valuation techniques for which all significant assumptions are observable in the market. |
| | • | | Level 3 – Valuation is generated from model-based techniques that use significant assumptions not observable in the market. These unobservable assumptions reflect estimates or assumptions that market participants would use in pricing the asset or liability. Valuation techniques include use of option pricing models, discounted cash flow models and similar techniques. |
Determination of Fair Value
Under SFAS No. 157, the Company bases its fair values on the price that would be received to sell an asset or paid to transfer a liability in an orderly transaction between market participants at the measurement date. It is the Company’s policy to maximize the use of observable inputs and minimize the use of unobservable inputs when developing fair value measurements, in accordance with the fair value hierarchy in SFAS No. 157.
Fair value measurements for assets and liabilities where there exists limited or no observable market data and, therefore, are based primarily upon the Company’s own estimates, are often calculated based on current pricing policy, the economic and competitive environment, the characteristics of the asset or liability and other such factors. Therefore, the results cannot be determined with precision and may not be realized in an actual sale or immediate settlement of the asset or liability. Additionally, there may be inherent weaknesses in any calculation technique, and changes in the underlying assumptions used, including discount rates and estimates of future cash flows that could significantly impact the results of current or future values.
The Company incorporates lack of liquidity into its fair value measurement based on the type of asset measured and the valuation methodology used. For example, for applicable investment securities, management uses unadjusted broker quotes or vendor prices to measure fair value, which inherently reflect any lack of liquidity in the market as the fair value measurement represents an exit price from a market participant viewpoint.
Following is a description of valuation methodologies used for assets and liabilities recorded at fair value and for estimating fair value for financial instruments not recorded at fair value (SFAS No. 107 disclosures).
Cash And Due From Banks And Federal Funds Sold. Cash and due from banks and federal funds sold are carried at historical cost. The carrying amount is a reasonable estimate of fair value because of the relatively short time between the origination of the instrument and its expected realization.
Investment Securities Available For Sale. Investment securities available for sale are recorded at fair value on a recurring basis. Fair value measurement is based upon quoted prices, if available. Such instruments are classified within Level 1 of the fair value hierarchy.
148
PALMETTO BANCSHARES, INC. AND SUBSIDIARY
Notes To Consolidated Financial Statements—(Continued)
When instruments are traded in secondary markets and quoted market prices do not exist for such securities, the Company generally relies on prices obtained from pricing services or brokers (collectively, vendors). Vendors compile prices from various sources and often apply matrix pricing for similar securities when no price is observable. The Company reviews pricing methodologies provided by the vendors in order to determine if observable market information is being used, versus unobservable inputs. Valuing financial instruments involves judgments acquired from knowledge of a particular market and is not perfunctory. While securities available for sale traded in secondary markets are typically valued using a vendor price, these prices are reviewed and, if deemed inappropriate by a trader who has the most knowledge of a particular market, can be adjusted. Securities measured with these internal valuation techniques are generally classified as Level 2 of the hierarchy and often involve using quoted market prices for similar securities, pricing models, or discounted cash flow analyses using inputs observable in the market where available. Examples may include municipal bonds, U.S. government and agency mortgage-backed securities.
Where significant inputs are unobservable in the market due to limited activity or a less liquid market, securities valued using models with such inputs are classified as Level 3 of the fair value hierarchy. Securities classified as Level 3 include private collateralized mortgage obligations. Where prices are not readily available, management’s best estimate is used.
Mortgage Loans Held For Sale. Mortgage loans held for sale are carried at the lower of cost or fair value. The fair value of mortgage loans held for sale is based on what secondary markets are currently offering for portfolios with similar characteristics. The carrying amount is a reasonable estimate of fair value because of the relatively short time between the origination of the instrument and its sale.
Loans. For the carrying value of loans, see Note 1. The Company does not record loans at fair value on a recurring basis. Therefore, valuation techniques discussed herein for loans are primarily for estimating fair value for SFAS No. 107 disclosure purposes. However, from time to time, the Company records nonrecurring fair value adjustments to loans to reflect partial writedowns that are based on the observable market price or current appraised value of the collateral, or the full charge-off of the loan carrying value.
The fair value estimates for SFAS No. 107 purposes differentiate loans based on their financial characteristics, such as product classification, loan category, pricing features, and remaining maturity. Prepayment and credit loss estimates are evaluated by product and loan rate.
The fair value of commercial and commercial real estate loans is calculated by discounting contractual cash flows, adjusted for credit loss estimates, using discount rates that reflect the Company’s current pricing for loans with similar characteristics and remaining maturity.
For single-family mortgage loans junior lien mortgages, fair value is calculated by discounting contractual cash flows, adjusted for prepayment and credit loss estimates, using discount rates based on current industry pricing (where readily available) or the Company’s own estimate of an appropriate risk-adjusted discount rate for loans of similar size, type, remaining maturity and repricing characteristics.
For bankcard loans, the portfolio’s yield is equal to the Company’s current pricing and, therefore, the fair value is equal to book value adjusted for estimates of credit losses inherent in the portfolio at the balance sheet date.
For all other consumer loans, the fair value is generally calculated by discounting the contractual cash flows, adjusted for prepayment and credit loss estimates, based on the current rates the Company offers for loans with similar characteristics.
149
PALMETTO BANCSHARES, INC. AND SUBSIDIARY
Notes To Consolidated Financial Statements—(Continued)
Loan commitments and standby letters of credit are not included in the SFAS No. 107 disclosure herein. These instruments generate ongoing fees at the Company’s current pricing levels. In situations where the credit quality of the counterparty to a commitment has declined, a reserve is recorded. A reasonable estimate of the fair value of these instruments is the carrying value of deferred fees plus the related reserve.
Real Estate Acquired in Settlement of Loans. Real estate acquired in settlement of loans is adjusted to fair value less costs to sell upon transfer of the loans to real estate acquired in settlement of loans. Subsequently, real estate acquired in settlement of loans assets are carried at the lower of carrying value or fair value less costs to sell. Fair value is generally based upon third party market prices or appraised values of the collateral and, accordingly, the Company classifies real estate acquired in settlement of loans as Level 2.
Deposits.Deposits are carried at historical cost. SFAS No. 107 states that the fair value of deposits with no stated maturity, such as noninterest-bearing demand deposits, interest-bearing checking, and market rate and other savings, is equal to the amount payable on demand at the measurement date. The fair value of time deposits is calculated based on the discounted value of contractual cash flows. The discount rate is estimated using the rates currently offered for like wholesale deposits with similar remaining maturities.
Other Short-Term Liabilities. Other short-term liabilities are carried at historical cost and include retail repurchase agreements, commercial paper, federal funds purchased, and short-term FHLB borrowings. The carrying amount is a reasonable estimate of fair value because of the relatively short time between the origination of the instrument and its expected realization.
Long-Term Borrowings. Long-term borrowings are carried at amortized cost. However, the Company is required to estimate the fair value of long-term borrowings under SFAS No. 107. Generally, the discounted cash flow method is used to estimate the fair value of the Company’s long-term borrowings. Contractual cash flows are discounted using rates currently offered for new notes with similar remaining maturities and, therefore, these discount rates include the Company’s current spread levels. The fair value estimates generated are corroborated against observable market prices.
Financial Assets and Liabilities Recorded at Fair Value on a Recurring Basis
The following table summarizes assets and liabilities measured at fair value on a recurring basis at December 31, 2008 (in thousands).
| | | | | | | | | |
| | | Level 1 | | Level 2 | | Level 3 | | Total |
Investment securities available for sale | | $ | — | | 70,957 | | 54,639 | | 125,596 |
For investment securities available for sale, the Company obtains fair value measurements from brokers or third party pricing services. The following table summarizes the detail by level at December 31, 2008 (in thousands).
| | | | | | | | | |
| | | Level 1 | | Level 2 | | Level 3 | | Total |
Brokers | | | | | | | | | |
Investment securities available for sale | | $ | — | | — | | 54,639 | | 54,639 |
Third party pricing services | | | | | | | | | |
Investment securities available for sale | | $ | — | | 70,957 | | — | | 70,957 |
150
PALMETTO BANCSHARES, INC. AND SUBSIDIARY
Notes To Consolidated Financial Statements—(Continued)
The following table summarizes the changes in Level 3 assets and liabilities measured at fair value on a recurring basis during 2008 (in thousands).
| | | | |
| | | Investment securities
available for sale | |
Balance, December 31, 2007 | | $ | — | |
Total unrealized gain (loss) included in: | | | | |
Net income | | | — | |
Accumulated other comprehensive income (loss) | | | (3,394 | ) |
Purchases, sales, issuances and settlements, net | | | 58,033 | |
Transfers in and (out) of level three | | | — | |
| | | | |
Balance, December 31, 2008 | | $ | 54,639 | |
| | | | |
Assets and Liabilities Recorded at Fair Value on a Nonrecurring Basis
The Company may be required, from time to time, to measure certain assets at fair value on a nonrecurring basis in accordance with GAAP. The valuation methodologies used to measure these fair value adjustments were described previously in this footnote. The following table summarizes the level of valuation assumptions used to determine each adjustment and the carrying value of the related individual assets or portfolios at December 31, 2008 (in thousands).
| | | | | | | | | |
| | | Level 1 | | Level 2 | | Level 3 | | Total |
Loans (1) | | $ | — | | 33,015 | | — | | 33,015 |
Real estate acquired in settlement of loans (2) | | | — | | 6,719 | | — | | 6,719 |
| (1) | | Represents carrying value and related writedowns of loans for which adjustments are based on the appraised value of the collateral. |
| (2) | | Represents the fair value and related losses of real estate acquired in settlement of loans that were measured at fair value subsequent to their initial classification as such. |
Fair Value Option
In February 2007, the FASB issued SFAS No. 159, which permits entities to choose to measure eligible items at fair value at specified election dates. Unrealized gains and losses on items for which the fair value option has been elected are reported in income at each subsequent reporting date. The fair value option may be applied instrument by instrument, with certain exceptions, is irrevocable (unless a new election date occurs), and is applied only to entire instruments and not to portions of instruments. The main intent of SFAS No. 159 was to mitigate the difficulty in determining reported income caused by a mixed-attribute model (that is, reporting some assets at fair value and others using a different valuation method such as amortized cost). The project is separated into two phases. This first phase addresses the creation of a fair value option for financial assets and liabilities. A second phase will address creating a fair value option for selected nonfinancial items. SFAS No. 159 was effective for the Company on January 1, 2008. The Company did not elect the fair value option for any financial assets or liabilities as of January 1, 2008. Therefore, its adoptions did not have a material impact on the Company’s financial position, results of operations, or cash flows.
151
PALMETTO BANCSHARES, INC. AND SUBSIDIARY
Notes To Consolidated Financial Statements—(Continued)
SFAS No. 107 Disclosures
The following table summarizes fair value estimates as of December 31, 2008 and 2007, for financial instruments, as defined by SFAS No. 107, excluding short-term financial assets and liabilities, for which carrying amounts approximate fair value, and excluding financial instruments recorded at fair value on a recurring basis at the dates indicated (in thousands). The carrying amounts in the following table are recorded in the balance sheet under the indicated captions.
In accordance with SFAS No. 107, the Company has not included assets and liabilities that are not financial instruments in its disclosure, such as the value of the long-term relationships with the Company’s deposit, credit card and trust customers, amortized mortgage-servicing rights, premises and equipment, net, goodwill, net, core deposit intangibles, net, deferred taxes and other liabilities. Additionally, the amounts in the table have not been updated since year end, therefore the valuations may have changed since that point in time. For these reasons, the total of the fair value calculations presented does not represent, and should not be construed to represent, the underlying value of the Company.
| | | | | | | | | |
| | | December 31, 2008 | | December 31, 2007 |
| | | Carrying
amount | | Estimated
fair value | | Carrying
amount | | Estimated
fair value |
Financial assets | | | | | | | | | |
Loans, net | | $ | 1,147,480 | | 1,092,067 | | 1,037,352 | | 1,049,084 |
| | | | |
Financial liabilities | | | | | | | | | |
Deposits | | $ | 1,070,279 | | 1,078,464 | | 1,058,794 | | 1,063,378 |
Long-term borrowings | | | 52,000 | | 49,808 | | — | | — |
18. Holding Company Condensed Financial Information
Since Palmetto Bancshares is a holding company and does not conduct operations, its primary sources of liquidity are dividends upstreamed from its subsidiary bank, funds received through stock option exercises, and funds received through the offering of commercial paper as an alternative investment tool for its commercial customers (referred to as its master note program). Through the master note arrangement between the holding company and the Bank, Palmetto Master Notes are issued as an alternative investment for commercial sweep accounts. These master notes are unsecured but are backed by the full faith and credit of Palmetto Bancshares. The commercial paper is issued only in conjunction with deposits to automated sweep accounts at the Bank level.
152
PALMETTO BANCSHARES, INC. AND SUBSIDIARY
Notes To Consolidated Financial Statements—(Continued)
The following tables summarize the holding company’s financial condition, results of operations, and cash flows at the dates and for the periods indicated (in thousands).
Condensed Balance Sheets
| | | | | |
| | | December 31, |
| | | 2008 | | 2007 |
Assets | | | | | |
Cash and cash equivalents | | $ | — | | 153 |
Due from subsidiary | | | 27,949 | | 26,323 |
Investment in subsidiary | | | 115,067 | | 109,389 |
Goodwill | | | 704 | | 704 |
Other | | | 11 | | 13 |
| | | | | |
Total assets | | $ | 143,731 | | 136,582 |
| | | | | |
Liabilities and shareholders’ equity | | | | | |
Commercial paper | | $ | 27,955 | | 26,326 |
Shareholders’ equity | | | 115,776 | | 110,256 |
| | | | | |
Total liabilities and shareholders’ equity | | $ | 143,731 | | 136,582 |
| | | | | |
Condensed Statements of Income
| | | | | | | | | | |
| | | For the years ended
December 31, | |
| | | 2008 | | | 2007 | | | 2006 | |
Interest income from commercial paper (Master notes) | | $ | 359 | | | 1,110 | | | 867 | |
Dividends received from subsidiary | | | 4,616 | | | 4,348 | | | 3,432 | |
Equity in undistributed earnings of subsidiary | | | 8,984 | | | 11,746 | | | 11,981 | |
Interest expense on commercial paper (Master notes) | | | (359 | ) | | (1,110 | ) | | (867 | ) |
Other operating income | | | — | | | 22 | | | 43 | |
Compensation expense related to stock options granted | | | — | | | — | | | (163 | ) |
Other operating expense | | | (1 | ) | | (101 | ) | | (52 | ) |
| | | | | | | | | | |
Net income | | $ | 13,599 | | | 16,015 | | | 15,241 | |
| | | | | | | | | | |
153
PALMETTO BANCSHARES, INC. AND SUBSIDIARY
Notes To Consolidated Financial Statements—(Continued)
Condensed Statements of Cash Flows
| | | | | | | | | | |
| | | For the years ended
December 31, | |
| | | 2008 | | | 2007 | | | 2006 | |
Operating Activities | | | | | | | | | | |
Net income | | $ | 13,599 | | | 16,015 | | | 15,241 | |
Adjustments to reconcile net income to net cash provided by (used in) operating activities | | | | | | | | | | |
Increase in due from subsidiary | | | (1,626 | ) | | (5,335 | ) | | (3,073 | ) |
Compensation expense related to stock options granted | | | — | | | — | | | 163 | |
Increase in equity in undistributed earnings of subsidiary | | | (8,984 | ) | | (11,746 | ) | | (11,981 | ) |
(Increase) decrease in other assets | | | 2 | | | (13 | ) | | — | |
| | | | | | | | | | |
Net cash provided by (used in) operating activities | | | 2,991 | | | (1,079 | ) | | 350 | |
| | | |
Financing Activities | | | | | | | | | | |
Increase in commercial paper | | | 1,629 | | | 5,338 | | | 3,073 | |
Proceeds from stock option activity | | | 380 | | | 702 | | | 461 | |
Cash dividends declared and paid on common stock | | | (5,153 | ) | | (4,926 | ) | | (4,641 | ) |
| | | | | | | | | | |
Net cash provided by (used in) financing activities | | | (3,144 | ) | | 1,114 | | | (1,107 | ) |
| | | |
Net increase (decrease) in cash and cash equivalents | | | (153 | ) | | 35 | | | (757 | ) |
Cash and cash equivalents, beginning of the period | | | 153 | | | 118 | | | 875 | |
| | | | | | | | | | |
Cash and cash equivalents, end of the period | | $ | — | | | 153 | | | 118 | |
| | | | | | | | | | |
19. Regulatory Capital Requirements and Dividend Restrictions
Capital Requirements
The Company and the Bank are subject to various regulatory capital requirements administered by the federal banking agencies. Failure to meet minimum capital requirements can initiate certain mandatory and possible additional discretionary actions by regulators that, if undertaken, could have a direct material impact on the Company’s and the Bank’s financial statements. Under capital adequacy guidelines and the regulatory framework for prompt corrective action, the Bank must meet specific capital guidelines that involve quantitative measures of the assets, liabilities, and certain off balance sheet items as calculated under regulatory accounting practices. The Bank’s capital amounts and classification are also subject to qualitative judgments by the regulators about components, risk-weightings, and other factors.
Quantitative measures established by regulation to ensure capital adequacy require the Company and Bank to maintain minimum amounts and ratios (set forth in the table below) of Total and Tier 1 capital to risk-weighted assets and of Tier 1 capital to average assets. Total capital includes Tier 1 and Tier 2 capital. Tier 2 capital consists of the allowance for loan losses subject to certain limitations. Management believes, as of December 31, 2008, that the Company and Bank exceed all well capitalized requirements to which they are subject.
154
PALMETTO BANCSHARES, INC. AND SUBSIDIARY
Notes To Consolidated Financial Statements—(Continued)
The following table summarizes the Company’s and the Bank’s actual and required capital ratios at the dates indicated (dollars in thousands). As of December 31, 2008, the Company and the Bank were categorized as well capitalized under the regulatory framework based on the most recent notification from federal banking agencies. As of December 31, 2008, management knew of no conditions or events since the most recent notification from federal banking agencies that would change the Company’s or the Bank’s category.
| | | | | | | | | | | | | | |
| | | Actual | | | For capital
adequacy
purposes | | To be well
capitalized under
prompt corrective
action provisions |
| | | amount | | ratio | | | amount | | ratio | | amount | | ratio |
December 31, 2008 | | | | | | | | | | | | | | |
Total capital to risk-weighted assets | | | | | | | | | | | | | | |
Company | | $ | 128,876 | | 10.44 | % | | 98,750 | | 8.00 | | n/a | | n/a |
Bank | | | 128,872 | | 10.44 | | | 98,750 | | 8.00 | | 123,437 | | 10.00 |
Tier 1 capital to risk-weighted assets | | | | | | | | | | | | | | |
Company | | | 117,876 | | 9.55 | | | 49,375 | | 4.00 | | n/a | | n/a |
Bank | | | 117,872 | | 9.55 | | | 49,375 | | 4.00 | | 74,062 | | 6.00 |
Tier 1 leverage ratio | | | | | | | | | | | | | | |
Company | | | 117,876 | | 8.70 | | | 54,220 | | 4.00 | | n/a | | n/a |
Bank | | | 117,872 | | 8.69 | | | 54,240 | | 4.00 | | 67,800 | | 5.00 |
| | | | | | |
December 31, 2007 | | | | | | | | | | | | | | |
Total capital to risk-weighted assets | | | | | | | | | | | | | | |
Company | | $ | 116,349 | | 10.27 | % | | 90,669 | | 8.00 | | n/a | | n/a |
Bank | | | 116,186 | | 10.25 | | | 90,669 | | 8.00 | | 113,337 | | 10.00 |
Tier 1 capital to risk-weighted assets | | | | | | | | | | | | | | |
Company | | | 108,931 | | 9.61 | | | 45,335 | | 4.00 | | n/a | | n/a |
Bank | | | 108,768 | | 9.60 | | | 45,335 | | 4.00 | | 68,002 | | 6.00 |
Tier 1 leverage ratio | | | | | | | | | | | | | | |
Company | | | 108,931 | | 8.97 | | | 48,591 | | 4.00 | | n/a | | n/a |
Bank | | | 108,768 | | 8.94 | | | 48,652 | | 4.00 | | 60,815 | | 5.00 |
Dividend Restrictions
The holders of the Company’s common stock are entitled to receive dividends, when and if declared by the Company’s Board of Directors, out of funds legally available for such dividends. Palmetto Bancshares is a legal entity separate and distinct from the Bank and depends on the payment of dividends from the Bank. Palmetto Bancshares and the Bank are subject to regulatory policies and requirements relating to the payment of dividends, including requirements to maintain adequate capital above regulatory minimums. Federal regulatory authorities are authorized to determine under certain circumstances that the payment of dividends by a bank holding company or a bank would be an unsafe or unsound practice and to prohibit payment of those dividends. Federal regulatory authorities have indicated that banking organizations should generally pay dividends only out of current income. In addition, as a South Carolina chartered bank, the Bank is subject to limitations on the amount of dividends that it is permitted to pay.
155
PALMETTO BANCSHARES, INC. AND SUBSIDIARY
Notes To Consolidated Financial Statements—(Continued)
20. Quarterly Financial Data (Unaudited)
The following tables summarize selected financial data regarding results of operations for the periods indicated (in thousands, except common and per share data).
| | | | | | | | | | | | |
| | | For the year ended December 31, 2008 |
| | | First
quarter | | Second
quarter | | Third
quarter | | Fourth
quarter | | | Total |
Interest income | | $ | 20,240 | | 20,050 | | 19,716 | | 18,335 | | | 78,341 |
Interest expense | | | 7,691 | | 6,428 | | 6,505 | | 5,982 | | | 26,606 |
| | | | | | | | | | | | |
Net interest income | | | 12,549 | | 13,622 | | 13,211 | | 12,353 | | | 51,735 |
Provision for loan losses | | | 488 | | 687 | | 687 | | 3,757 | | | 5,619 |
| | | | | | | | | | | | |
Net interest income after provision for loan losses | | | 12,061 | | 12,935 | | 12,524 | | 8,596 | | | 46,116 |
| | | | | | | | | | | | |
Investment securities gains | | | — | | 1 | | — | | — | | | 1 |
Other noninterest income | | | 4,905 | | 4,773 | | 4,589 | | 4,630 | | | 18,897 |
Noninterest expense | | | 11,383 | | 11,040 | | 10,834 | | 10,694 | | | 43,951 |
| | | | | | | | | | | | |
Net income before provision for income taxes | | | 5,583 | | 6,669 | | 6,279 | | 2,532 | | | 21,063 |
Provision for income taxes | | | 1,937 | | 2,340 | | 2,222 | | 965 | | | 7,464 |
| | | | | | | | | | | | |
Net income | | $ | 3,646 | | 4,329 | | 4,057 | | 1,567 | | | 13,599 |
| | | | | | | | | | | | |
Common and per share data | | | | | | | | | | | | |
Net income—basic | | $ | 0.57 | | 0.67 | | 0.63 | | 0.24 | | | 2.11 |
| | | | | | | | | | | | |
Net income—diluted | | | 0.56 | | 0.66 | | 0.62 | | 0.25 | | | 2.09 |
| | | | | | | | | | | | |
| |
| | | For the year ended December 31, 2007 |
| | | First
quarter | | Second
quarter | | Third
quarter | | Fourth
quarter | | | Total |
Interest income | | $ | 20,198 | | 20,696 | | 21,293 | | 21,450 | | | 83,637 |
Interest expense | | | 7,735 | | 7,988 | | 8,538 | | 8,497 | | | 32,758 |
| | | | | | | | | | | | |
Net interest income | | | 12,463 | | 12,708 | | 12,755 | | 12,953 | | | 50,879 |
Provision for loan losses | | | 367 | | 433 | | 400 | | (212 | ) | | 988 |
| | | | | | | | | | | | |
Net interest income after provision for loan losses | | | 12,096 | | 12,275 | | 12,355 | | 13,165 | | | 49,891 |
| | | | | | | | | | | | |
Investment securities gains | | | — | | — | | — | | — | | | — |
Other noninterest income | | | 3,965 | | 4,178 | | 4,764 | | 4,472 | | | 17,379 |
Noninterest expense | | | 10,275 | | 10,184 | | 11,543 | | 10,854 | | | 42,856 |
| | | | | | | | | | | | |
Net income before provision for income taxes | | | 5,786 | | 6,269 | | 5,576 | | 6,783 | | | 24,414 |
Provision for income taxes | | | 2,025 | | 2,204 | | 1,680 | | 2,490 | | | 8,399 |
| | | | | | | | | | | | |
Net income | | $ | 3,761 | | 4,065 | | 3,896 | | 4,293 | | | 16,015 |
| | | | | | | | | | | | |
Common and per share data | | | | | | | | | | | | |
Net income—basic | | $ | 0.59 | | 0.64 | | 0.61 | | 0.67 | | | 2.51 |
| | | | | | | | | | | | |
Net income—diluted | | | 0.58 | | 0.63 | | 0.60 | | 0.66 | | | 2.47 |
| | | | | | | | | | | | |
156
PALMETTO BANCSHARES, INC. AND SUBSIDIARY
Notes To Consolidated Financial Statements—(Continued)
21. Related Party Transactions
SFAS No. 57, “Related Party Disclosures,” provides guidance regarding transactions with related parties. Transactions between related parties occur in the normal course of business and are considered to be related party transactions even though they may not be given accounting recognition.
Generally accepted accounting principles require certain disclosures regarding material related party transactions. Financial statements must include disclosures of material related party transactions, other than compensation arrangements, expense allowances, and other similar items in the ordinary course of business.
Intercompany Transactions
The Company has determined that the Company’s trust department is considered related with respect to SFAS No. 57 disclosure requirements because the department manages the assets of the Company’s applicable employee benefit plans.
Transactions of Management and Others
The information required by this item is set forth in the definitive Proxy Statement of the Company filed in connection with its 2009 Annual Meeting of the Shareholders, which is incorporated herein by reference.
Certain Business Relationships
The information required by this item, if any, is set forth in the definitive Proxy Statement of the Company filed in connection with its 2009 Annual Meeting of the Shareholders, which is incorporated herein by reference.
157
| ITEM 9. | CHANGES IN AND DISAGREEMENTS WITH ACCOUNTANTS ON ACCOUNTING AND FINANCIAL DISCLOSURE |
None.
| ITEM 9A. | CONTROLS AND PROCEDURES |
Evaluation of Disclosure Controls and Procedures
An evaluation of the Company’s disclosure controls and procedures (as defined in Section 13(a)-14(c) of the Securities Exchange Act of 1934) was carried out under the supervision and with the participation of the Company’s Chief Executive Officer, the President and Chief Operating Officer (Chief Accounting Officer) and several other members of the Company’s senior management as of December 31, 2008. The Company’s Chief Executive Officer and the President and Chief Operating Officer (Chief Accounting Officer) concluded that the Company’s disclosure controls and procedures were effective as of December 31, 2008 in ensuring that the information required to be disclosed by the Company in the reports it files or submits under the Securities Exchange Act of 1934 is (i) accumulated and communicated to the Company’s management (including the Chief Executive Officer and the President and Chief Operating Officer (Chief Accounting Officer)) in a timely manner, and is (ii) recorded, processed, summarized, and reported within the time periods specified in the SEC’s rules and forms.
See Item 8. Financial Statements and Supplementary Data, which includes management’s report on internal control over financial reporting and the attestation report thereon issued by Elliott Davis, LLC, and which is incorporated herein by reference.
Fourth Quarter Internal Control Changes
During the fourth quarter of 2008, the Company did not make any changes in its internal controls over financial reporting that has materially impacted or is reasonably likely to materially impact those controls.
| ITEM 9B. | OTHER INFORMATION |
None.
158
PART III
ITEM 10. DIRECTORS, EXECUTIVE OFFICERS AND CORPORATE GOVERNANCE
The information required by this item is set forth in the definitive Proxy Statement of the Company filed in connection with its 2009 Annual Meeting of the Shareholders, which is incorporated herein by reference.
ITEM 11. EXECUTIVE COMPENSATION
The information required by this item is set forth in the definitive Proxy Statement of the Company filed in connection with its 2009 Annual Meeting of the Shareholders, which is incorporated herein by reference.
ITEM 12. SECURITY OWNERSHIP OF CERTAIN BENEFICIAL OWNERS AND MANAGEMENT AND RELATED STOCKHOLDER MATTERS
A portion of the information required by this item is set forth in Item 5 of this Annual Report on Form 10-K. Additional information required by this item is set forth in the definitive Proxy Statement of the Company filed in connection with its 2009 Annual Meeting of Shareholders, which is incorporated herein by reference.
ITEM 13. CERTAIN RELATIONSHIPS AND RELATED TRANSACTIONS, AND DIRECTOR INDEPENDENCE
The information required by this item is set forth in the definitive Proxy Statement of the Company filed in connection with its 2009 Annual Meeting of the Shareholders, which is incorporated herein by reference.
ITEM 14. PRINCIPAL ACCOUNTING FEES AND SERVICES
The information required by this item is set forth in the definitive Proxy Statement of the Company filed in connection with its 2009 Annual Meeting of the Shareholders, which is incorporated herein by reference.
159
PART IV
| ITEM 15. EXHIBITS, | FINANCIAL STATEMENT SCHEDULES |
| | (a) | | (1) All Financial Statements |
See Item 8. Financial Statements and Supplementary Data
| | (2) | | Financial Statement Schedules |
All schedules to the Consolidated Financial Statements required by Article 9 of Regulation S-X and all other schedules to the financial statements of the Company required by Article 5 of Regulation S-X are not required under the related instructions or are inapplicable and, therefore, have been omitted, or the required information is contained in the Consolidated Financial Statements or the notes thereto, which are included in Item 8 hereof.
| | |
Exhibit No. | | Description |
| 3.1.1 | | Articles of Incorporation filed on May 13, 1982 in the office of the Secretary of State of South Carolina: Incorporated by reference to Exhibit 3 to the Company’s Registration Statement on Form S-4, Commission File No. 33-19367, filed with the Securities and Exchange Commission on December 30, 1987 |
| |
| 3.1.2 | | Articles of Amendment filed on May 5, 1988 in the office of the Secretary of State of South Carolina: Incorporated by reference to Exhibit 4.1.2 to the Company’s Registration Statement on Form S-8, Commission File No. 33-51212, filed with the Securities and Exchange Commission on August 20, 1992 |
| |
| 3.1.3 | | Articles of Amendment filed on January 26, 1989 in the office of the Secretary of State of South Carolina: Incorporated by reference to Exhibit 4.1.3 to the Company’s Registration Statement on Form S-8, Commission File No. 33-51212, filed with the Securities and Exchange Commission on August 20, 1992 |
| |
| 3.1.4 | | Articles of Amendment filed on April 23, 1990 in the office of the Secretary of State of South Carolina: Incorporated by reference to Exhibit 4.1.4 to the Company’s Registration Statement on Form S-8, Commission File No. 33-51212, filed with the Securities and Exchange Commission on August 20, 1992 |
| |
| 3.1.5 | | Articles of Amendment filed on October 16, 1996 in the office of the Secretary of State of South Carolina: Incorporated by reference to Exhibit 3.1.5 to the Company’s Quarterly Report on Form 10-Q for the fiscal quarter ended September 30, 1996 |
| |
| 3.1.6 | | Articles of Amendment filed on May 17, 1999 in the office of the Secretary of State of South Carolina: Incorporated by reference to Exhibit 3.1.6 of the Company’s Quarterly Report on Form 10-Q for the quarter ended June 30, 1999 |
| |
| 3.2.1 | | By-Laws adopted on April 10, 1990: Incorporated by reference to Exhibit 3.2.1 to the Company’s Annual Report on Form 10-K for the year ended December 31, 1996 |
| |
| 3.2.2 | | Amendment to By-Laws dated April 12, 1994: Incorporated by reference to Exhibit 3.2.2 to the Company’s Annual Report on Form 10-K for the year ended December 31, 1996 |
| |
| 3.2.3 | | Amendment to By-Laws dated January 19, 1999: Incorporated by reference to Exhibit 3.2.3 to the Company’s Annual Report on Form 10-K for the year ended December 31, 1998 |
| |
| 4.1 | | Articles of Incorporation of the Registrant: Included in Exhibits 3.1.1 - .6 |
| |
| 4.2 | | Bylaws of the Registrant: Included in Exhibit 3.2.1 - .3 |
160
| | |
Exhibit No. | | Description |
| 4.3 | | Specimen Certificate for Common Stock: Incorporated by reference to Exhibit 4.3 to the Company’s Registration Statement on Form S-8, Commission File No. 33-51212, filed with the Securities and Exchange Commission on August 20, 1992 |
| |
| 10.1* | | Palmetto Bancshares, Inc. Stock Option Plan: Incorporated by reference to Exhibit 10 (a) to the Company’s Registration Statement on Form S-4, Commission File No. 33-19367, filed with the Securities and Exchange Commission on May 2, 1988 |
| |
| 10.2* | | The Palmetto Bank Pension Plan and Trust Agreement: Incorporated by reference to Exhibit 10 (c) to the Company’s Registration Statement on Form S-4, Commission File No. 33-19367, filed with the Securities and Exchange Commission on May 2, 1988 |
| |
| 10.3* | | The Palmetto Bank Officer Incentive Compensation Plan: Incorporated by reference to Exhibit 10.3 to the Company’s Annual Report on Form 10-K for the year ended December 31, 2000 |
| |
| 10.4.1* | | Palmetto Bancshares, Inc. 1997 Stock Compensation Plan, as amended to date: Incorporated by reference to Exhibit 10.1 to the Company’s Annual Report on Form 10-K for the year ended December 31, 1997 |
| |
| 10.4.2* | | Amendment to the Palmetto Bancshares, Inc.’s 1997 Stock Compensation Plan: Incorporated by reference to Exhibit 10.4.1 to the Company’s Annual Report on Form 10-K for the year ended December 31, 2003 |
| |
| 10.5* | | Palmetto Bancshares, Inc. 2008 Restricted Stock Plan: Incorporated by reference to Appendix A to Company’s Proxy Statement on Schedule 14A, filed with the Securities and Exchange Commission on March 17, 2008 |
| |
| 10.6 | | Lease Agreement dated as of May 2, 2007 between The Palmetto Bank and Charles E. Howard and Doris H. Howard: Incorporated by reference to Exhibit 10.1 to the Company’s Current Report on Form 8-K filed on June 26, 2007 |
| |
| 21.1^ | | List of Subsidiaries of the Registrant |
| |
| 23.1^ | | Consent of Elliott Davis, LLC |
| |
| 31.1^ | | L. Leon Patterson’s Certification Pursuant to Section 302 of the Sarbanes-Oxley Act of 2002 |
| |
| 31.2^ | | Paul W. Stringer’s Certification Pursuant to Section 302 of the Sarbanes-Oxley Act of 2002 |
| |
| 32^ | | Certifications Pursuant to Section 906 of the Sarbanes-Oxley Act of 2002 |
| * | | Management contract or compensatory plan or arrangement |
| ^ | | Filed with this Annual Report on Form 10-K |
Copies of exhibits are available upon written request to Corporate Secretary, Palmetto Bancshares, Inc., Post Office Box 49, Laurens, South Carolina 29360.
161
SIGNATURES
Pursuant to the requirements of Section 13 or 15(d) of the Securities Exchange Act of 1934, the registrant has duly caused this report to be signed on its behalf by the undersigned, thereunto duly authorized.
| | |
| | PALMETTO BANCSHARES, INC. |
| |
| By: | | /s/ L. LEON PATTERSON |
| | L. Leon Patterson Chairman and Chief Executive Officer Palmetto Bancshares, Inc. |
| |
| |
| | /s/ PAUL W. STRINGER |
| | Paul W. Stringer President and Chief Operating Officer, Chief Accounting Officer Palmetto Bancshares, Inc. |
| |
| |
Date: March 16, 2009
Pursuant to the requirements of the Securities Exchange Act of 1934, this report has been signed below and on the dates by the following persons on behalf of the registrant and in the capacities indicated.
| | | | |
Signature | | Title | | Date |
| | |
/s/ L. LEON PATTERSON L. Leon Patterson | | Director Chairman Chief Executive Officer Palmetto Bancshares, Inc. | | March 16, 2009 |
| | |
/s/ PAUL W. STRINGER Paul W. Stringer | | Director President Chief Operating Officer Chief Accounting Officer Palmetto Bancshares, Inc. | | March 16, 2009 |
| | |
/s/ W. FRED DAVIS, JR. W. Fred Davis, Jr. | | Director | | March 16, 2009 |
| | |
/s/ DAVID P. GEORGE, JR. David P. George, Jr. | | Director | | March 16, 2009 |
| | |
/s/ MICHAEL D. GLENN Michael D. Glenn | | Director | | March 16, 2009 |
| | |
/s/ JOHN T. GRAMLING, II John T. Gramling, II | | Director | | March 16, 2009 |
| | |
/s/ JOHN D. HOPKINS, JR. John D. Hopkins, Jr. | | Director | | March 16, 2009 |
162
| | | | |
Signature | | Title | | Date |
| | |
/s/ SAM B. PHILLIPS, JR. Sam B. Phillips, Jr. | | Director | | March 16, 2009 |
| | |
/s/ ALBERT V. SMITH Albert V. Smith | | Director | | March 16, 2009 |
| | |
/s/ ANN B. SMITH Ann B. Smith | | Director | | March 16, 2009 |
| | |
/s/ EDWARD KEITH SNEAD, III Edward Keith Snead, III | | Director | | March 16, 2009 |
| | |
/s/ JANE S. SOSEBEE Jane S. Sosebee | | Director | | March 16, 2009 |
| | |
/s/ L. STEWART SPINKS L. Stewart Spinks | | Director | | March 16, 2009 |
| | |
/s/ J. DAVID WASSON, JR. J. David Wasson, Jr. | | Director | | March 16, 2009 |
163
EXHIBIT INDEX
| | |
Exhibit No. | | Description |
| 21.1 | | List of Subsidiaries of the Registrant |
| |
| 23.1 | | Consent of Elliott Davis, LLC |
| |
| 31.1 | | L. Leon Patterson’s Certification Pursuant to Section 302 of the Sarbanes-Oxley Act of 2002 |
| |
| 31.2 | | Paul W. Stringer’s Certification Pursuant to Section 302 of the Sarbanes-Oxley Act of 2002 |
| |
| 32 | | Certifications Pursuant to Section 906 of the Sarbanes-Oxley Act of 2002 |
164