UNITED STATES
SECURITIES AND EXCHANGE COMMISSION
WASHINGTON, D.C. 20549
FORM 10-K
(X)ANNUAL REPORT PURSUANT TO SECTION 13 OR 15(d) OF SECURITIES EXCHANGE ACT OF 1934
For the fiscal year ended December 31, 2014
or
( )TRANSITION REPORT PURSUANT TO SECTION 13 OR 15(d) OF THE SECURITIES EXCHANGE ACT OF 1934
For the transition period from __________ to __________
Commission file number 0-26016
PALMETTO BANCSHARES, INC.
(Exact name of registrant as specified in its charter)
South Carolina | 74-2235055 |
(State or other jurisdiction of incorporation or organization) | (IRS Employer Identification No.) |
| |
306 East North Street, Greenville, South Carolina | 29601 |
(Address of principal executive offices) | (Zip Code) |
| |
(800) 725-2265
(Registrant’s telephone number)
Securities registered pursuant to Section 12(b) of the Act: None
Securities registered pursuant to Section 12(g) of the Act:
Common Stock, par value $0.01 per share
(Title of class)
Indicate by check mark if the registrant is a well-known seasoned issuer, as defined in Rule 405 of the Securities Act. Yes [ ] No [x]
Indicate by check mark if the registrant is not required to file reports pursuant to Section 13 or Section 15(d) of the Act. Yes [ ] No [x]
Indicate by check mark whether the registrant (1) has filed all reports required to be filed by Section 13 or 15(d) of the Securities Exchange Actof 1934 during the preceding 12 months (or for such shorter period that the registrant was required to file such reports), and (2) has been subject to suchfiling requirements for the past 90 days. Yes [x] No [ ]
Indicate by check mark whether the registrant has submitted electronically and posted on its corporate Web site, if any, every Interactive DataFile required to be submitted and posted pursuant to Rule 405 of Regulation S-T (§232.405 of this chapter) during the preceding 12 months (or for suchshorter period that the registrant was required to submit and post such files). Yes [x] No [ ]
Indicate by check mark if disclosure of delinquent filers pursuant to Item 405 of Regulation S-K (§229.405 of this chapter) is not contained herein,and will not be contained, to the best of registrant's knowledge, in definitive proxy or information statements incorporated by reference in Part III of thisForm 10-K or any amendment to this Form 10-K. [ ]
Indicate by check mark whether the registrant is a large accelerated filer, an accelerated filer, a nonaccelerated filer, or a smaller reporting company.See definitions of "large accelerated filer," "accelerated filer," and "smaller reporting company" in Rule 12b-2 of the Exchange Act.
Large accelerated filer [ ] | | Accelerated filer [ ] |
Nonaccelerated filer [ ] | | Smaller reporting company [x] |
Indicate by check mark whether the registrant is a shell company (as defined by Rule 12b-2 of the Act). Yes [ ] No [x]
The aggregate market value of the voting and nonvoting common equity held by nonaffiliates of the registrant (computed by reference to theprice at which the stock was most recently sold) was $63,140,845 as of the last business day of the registrant's most recently completed second fiscalquarter.
12,814,574 shares of the registrant’s common stock were outstanding as of February 23, 2015.
DOCUMENTS INCORPORATED BY REFERENCE
The Company’s Proxy Statement with respect to an Annual Meeting of Shareholders to be held May 21, 2015 is incorporated by referencein Part III of this Form 10-K.
PALMETTO BANCSHARES, INC. AND SUBSIDIARY
2014 Annual Report on Form 10-K
Table of Contents
PART I | |
| | Forward-Looking Statements | 1 |
| | Item 1. | Business | 2 |
| | | | Development and Description of Business | 2 |
| | | | Supervision and Regulation | 8 |
| | | | Available Information | 17 |
| | Item 1A. | Risk Factors | 17 |
| | Item 1B. | Unresolved Staff Comments | 29 |
| | Item 2. | Properties | 29 |
| | Item 3. | Legal Proceedings | 29 |
| | Item 4. | Mine Safety Disclosures | 29 |
| | | | | |
PART II | |
| | Item 5. | Market for Registrant's Common Equity, Related Stockholder Matters and Issuer Purchases of Equity Securities | 30 |
| | | | Common Stock Market Prices | 30 |
| | | | Dividends | 30 |
| | | | Equity-Based Compensation Plan Information | 31 |
| | | | Total Shareholder Return | 31 |
| | Item 6. | Selected Financial Data | 33 |
| | Item 7. | Management's Discussion and Analysis of Financial Condition and Results of Operations | 34 |
| | | | Criticial Accounting Policies and Estimates | 34 |
| | | | Executive Summary | 39 |
| | | | Financial Condition | 42 |
| | | | Derivative Activities | 58 |
| | | | Liquidity | 58 |
| | | | Earnings Review | 60 |
| | | | Impact of Inflation and Changing Prices | 69 |
| | Item 7A. | Quantitative and Qualitative Disclosures About Market Risk | 69 |
| | Item 8. | Financial Statements and Supplementary Data | 71 |
| | | | Management's Report on Internal Control Over Financial Reporting | 71 |
| | | | Report of Independent Registered Public Accounting Firm | 72 |
| | | | Report of Independent Registered Public Accounting Firm | 73 |
| | | | Consolidated Balance Sheets | 74 |
| | | | Consolidated Statements of Income (Loss) | 75 |
| | | | Consolidated Statements of Comprehensive Income (Loss) | 76 |
| | | | Consolidated Statements of Changes in Shareholders' Equity | 77 |
| | | | Consolidated Statements of Cash Flows | 78 |
| | | | Note 1 - Summary of Significant Accounting Policies | 79 |
| | | | Note 2 - Cash and Cash Equivalents | 89 |
| | | | Note 3 - Trading Account Assets | 89 |
| | | | Note 4 - Investment Securities Available for Sale | 90 |
| | | | Note 5 - Loans | 92 |
| | | | Note 6 - Other Loans Held for Sale and Valuation Allowance | 101 |
| | | | Note 7 - Premises and Equipment, net | 102 |
| | | | Note 8 - Servicing Rights | 102 |
| | | | Note 9 - Foreclosed Real Estate and Repossessed Personal Property | 103 |
| | | | Note 10 - Bank-Owned Life Insurance | 104 |
| | | | Note 11 - Deposits | 104 |
| | | | Note 12 - Borrowings | 105 |
| | | | Note 13 - Shareholders' Equity | 106 |
| | | | Note 14 - Income Taxes | 107 |
| | | | Note 15 - Benefit Plans | 109 |
| | | | Note 16 - Equity-Based Compensation | 112 |
| | | | Note 17 - Average Share Information | 117 |
| | | | Note 18 - Commitments, Guarantees and Other Contingencies | 117 |
| | | | Note 19 - Derivative Financial Instruments and Hedging Activities | 119 |
| | | | Note 20 - Fair Value Measurements | 119 |
| | | | Note 21 - Regulatory Capital Requirements | 122 |
| | | | Note 22 - Holding Company Condensed Financial Information | 122 |
| | | | Note 23 - Related Party Transactions | 124 |
| | | | Note 24 - Quarterly Financial Data (Unaudited) | 124 |
| | Item 9. | Changes in and Disagreements with Accountants on Accounting and Financial Disclosure | 125 |
| | Item 9A. | Controls and Procedures | 125 |
| | Item 9B. | Other Information | 125 |
| | | | | |
PART III | |
| | Item 10. | Directors, Executive Officers and Corporate Governance | 126 |
| | Item 11. | Executive Compensation | 126 |
| | Item 12. | Security Ownership of Certain Beneficial Owners and Management and Related Stockholder Matters | 126 |
| | Item 13. | Certain Relationships and Related Transactions, and Director Independence | 126 |
| | Item 14. | Principal Accounting Fees and Services | 126 |
| | | | | |
PART IV | |
| | Item 15. | Exhibits, Financial Statement Schedules | 127 |
| | | | | |
SIGNATURES | 128 |
| | | | | |
EXHIBIT INDEX | 130 |
PART I
Throughout this Annual Report on Form 10-K, the “Company,” “we,” “us,” or “our” refers to Palmetto Bancshares, Inc. and its consolidated subsidiary, The Palmetto Bank (the “Bank”), except where the context indicates otherwise.
FORWARD-LOOKING STATEMENTS
This report, including information included in or incorporated by reference into this document, contains statements which constitute forward-looking statements within the meaning of Section 27A of the Securities Act of 1933 and Section 21E of the Securities Exchange Act of 1934. Forward-looking statements relate to the financial condition, results of operations, plans, objectives, future performance and business of the Company. Forward-looking statements are based on many assumptions and estimates and are not guarantees of future performance. Our actual results may differ materially from those anticipated in any forward-looking statements as they will depend on factors about which we are unsure including many factors which are beyond our control. The words “may,” “would,” “could,” “should,” “will,” “expect,” “anticipate,” “predict,” “project,” “potential,” “continue,” “assume,” “believe,” “intend,” “plan,” “forecast,” “goal” and “estimate,” as well as similar expressions, are meant to identify such forward-looking statements. Factors that may cause our actual results to differ materially from those anticipated in our forward-looking statements include, but are not limited to:
| | ● | Credit losses as a result of declining real estate values, increasing interest rates, increasing unemployment, changes in payment behavior, loan concentrations or other factors, |
| | ● | Changes in the amount of our loan portfolio collateralized by real estate and weaknesses in the real estate market, |
| | ● | Sales of problem assets at discounted prices to accelerate the resolution of problem assets, |
| | ● | The rate of loan delinquencies and amounts of loan charge-offs and recoveries, |
| | ● | Adverse changes in asset quality and resulting credit-related losses and expenses, |
| | ● | Our allowance for loan losses and the amount of loan loss provisions required in future periods, |
| | ● | The rate of loan growth in recent years and the lack of seasoning of a portion of our loan portfolio, |
| | ● | Changes in availability of wholesale funding sources including increases in collateral margin requirements or reductions in eligible collateral, |
| | ● | Our reliance on available secondary funding sources to meet our liquidity needs, such as Federal Home Loan Bank (“FHLB”) advances, Federal Reserve System (“Federal Reserve”) Discount Window (“Discount Window”) borrowings, brokered deposits, sales of investment securities and loans and lines of credit from correspondent banks, |
| | ● | Our expectations regarding our operating revenues, expenses, effective tax rates and other results of operations, |
| | ● | Changes in the interest-rate environment which could reduce net interest margins or result in deposits being withdrawn from the Bank, |
| | ● | Increased cybersecurity risk, including potential network breaches, business disruptions or financial losses, |
| | ● | Fraud committed by third parties, including cybersecurity risks associated with transactions initiated through our electronic banking products and services, whether initiated by clients or the Bank, |
| | ● | Changes in political conditions and the legislative or regulatory environment including the impact of ongoing financial reform legislation on the banking and financial services industries, |
| | ● | Potential limitations on our ability to utilize net operating loss and net realized built-in loss carryforwards for income tax purposes, |
| | ● | Risks associated with income taxes including the potential for adverse adjustments and the inability to fully realize deferred tax benefits, |
| | ● | Our ability to maintain appropriate levels of capital including levels required under the capital rules implementing Basel III, |
| | ● | Our ability to comply with regulatory rules and restrictions and potential regulatory actions if we fail to comply, |
| | ● | Results of examinations by our regulatory authorities including the possibility that the regulatory authorities may, among other things, require us to increase our allowance for loan losses or write down assets, |
| | ● | General economic conditions, either nationally or regionally and especially in our primary markets, becoming less favorable than expected, resulting in, among other things, reduced loan production and, therefore, interest income and deterioration in credit quality, |
| | ● | Our ability to attract and retain key personnel, |
| | ● | Our ability to retain our existing clients including our deposit relationships, |
| | ● | Our current and future products, services, applications and functionality and plans to promote them, |
| | ● | Risks associated with a failure in, or breach of, our operations, security systems or infrastructure, or those of our third-party vendors or business partners, |
| | ● | Changes in accounting policies and practices, |
| | ● | Our ability to maintain effective internal control over financial reporting, |
| | ● | Potential corporate transactions, including mergers and acquisitions and securities offerings, and the impact on the market value of our common stock and integration risk, |
| | ● | The impact on the market value of our common stock based on the volume of trading activity, our continued listing on a national stock exchange and inclusion in the Russell 2000 index, |
| | ● | Loss of consumer confidence and economic disruptions resulting from terrorist activities or other military actions and/or |
| | ● | Other risks and uncertainties detailed in this Annual Report on Form 10-K and, from time to time, in our other filings with the SEC. |
The Company does not undertake and specifically disclaims any obligation to update any forward-looking statements to reflect occurrences or unanticipated events or circumstances after the date of such statements except as required by federal securities laws.
ITEM 1.BUSINESS
Development and Description of Business
Organization
Palmetto Bancshares, Inc. is a South Carolina bank holding company organized in 1982 and headquartered in Greenville, South Carolina. The Company serves as the bank holding company for the Bank, which began operations in 1906. Through its Retail, Commercial and Wealth Management businesses, the Bank specializes in providing financial solutions to consumers and businesses with deposit and cash management products, loans (including consumer, Small Business Administration (“SBA”), commercial, corporate, mortgage, credit card and automobile), lines of credit, trust, brokerage, private banking, financial planning and insurancethroughout its primary market area of nine counties located in northwest South Carolina which includes the counties of Abbeville, Anderson, Cherokee, Greenville, Greenwood, Laurens, Oconee, Pickens and Spartanburg (commonly referred to as the “Upstate”).
As a holding company without any current stand-alone operations, the Company’s primary sources of liquidity are proceeds from debt and equity securities offerings and dividends received from the Bank.
The following table summarizes the Company’s consolidated assets, revenues and net income (loss) at the dates and for the periods indicated (in thousands).
| | | At and for the years ended December 31, | |
| | | 2014 | | | 2013 | | | 2012 | |
Total consolidated assets | | $ | 1,118,811 | | | $ | 1,090,229 | | | $ | 1,145,456 | |
Total consolidated revenues, net of interest expense | | | 52,665 | | | | 55,114 | | | | 67,282 | |
Total consolidated net income (loss) | | | 9,355 | | | | 27,731 | | | | (1,864 | ) |
The Bank was organized in Laurens, South Carolina under South Carolina law in 1906 and relocated its headquarters to Greenville, South Carolina in 2009 with its operations center remaining in Laurens. The Company owns all of the Bank’s common stock. The Bank primarily acts as a financial intermediary by attracting deposits from the general public and using those funds, together with borrowed funds in the wholesale market, primarily to originate loans and invest in securities.
Impact of the Financial Crisis and Great Recession
Beginning in 2009, the Company’s financial results were significantly impacted by the recession of December 2007 through June 2009 (commonly referred to as the “Great Recession”) and its aftermath. While the economy has steadily improved since then, overall economic conditions continue to present challenges for the banking industry and the Company. In response to these challenges, in June 2009 the Board of Directors and management adopted and began executing a proactive and aggressive Strategic Project Plan to address issues related to credit quality, liquidity, earnings and capital. The Strategic Project Plan included significant strategic changes to the Company’s operations, including, among other things:
| | ● | Reducing problem assets, losses from which resulted in overall annual losses in 2009 through 2012, |
| | ● | Raising $114 million in capital through a private placement transaction consummated in 2010 (the “Private Placement”), |
| | ● | Repositioning the balance sheet from an asset/liability management standpoint, |
| | ● | Rationalizing our branch network and headcount, |
| | ● | Refining our infrastructure, technology platform and process improvements, |
| | ● | Focusing on expense reductions and efficiency, |
| | ● | Refining our organization structure and lines of business and reconstituting our executive management and senior leadership team, |
| | ● | Implementing new products and services including electronic delivery and specialized lending niches such as SBA, Corporate Banking, Commercial & Industrial and Private Banking, |
| | ● | Developing tailored go-to-market strategies and expertise and |
| | ● | Returning to profitability on an annual basis beginning in 2013. |
The Strategic Project Plan also positioned the Bank to be well prepared for a Consent Order, effective June 10, 2010, between the Bank and the Federal Deposit Insurance Corporation (the “FDIC”), as our primary federal regulator and deposit insurer, and the South Carolina State Board of Financial Institutions (the “State Board”), our chartering agency (collectively, the “Supervisory Authorities”), which was subsequently terminated on January 30, 2013 (with all remaining regulatory restrictions terminated in 2014). As a result of our efforts, the Company returned to quarterly profitability in third quarter 2012 and annual profitability beginning in 2013. We expect the Company to remain profitable going forward. Further, we believe the Company’s earnings will be more stable and predictable on a going-forward basis. However, the Company’s performance is subject to numerous risks and uncertainties, many of which are beyond our control, and we can provide no assurances regarding the sustainability of, or improvement in, future earnings. In addition, the pace of future problem asset resolution activities may vary and, as a result, the level of credit-related expenses may fluctuate from period to period.
Market
The Company is a locally-oriented, community-based financial services institution. Our local market orientation is reflected in the composition of our Board of Directors, management and local community advisory boards, which are generally comprised of local business persons, professionals and other community representatives who assist us in identifying and responding to banking needs within our market. Our overall strategy is to operate with local decision making and knowledge while also offering many of the products and services available from larger competitors.
Our primary market area is located in the Upstate of South Carolina. We currently originate substantially all of our loans and deposits in our primary market area with out-of-market loans only originated to existing borrowers in our primary market area or purchased from other financial institutions. Out-of-market loans purchased from other financial institutions are subjected to our current underwriting standards. Loan purchases are generally made infrequently and only to supplement organic loan origination activity within our markets.
The Upstate’s ability to attract both small, local companies and major internationally-recognized corporations is the result of cooperation between city and state governments and the private sector. We believe that the Upstate’s entrepreneurial spirit and strong workforce creates a business-friendly environment. Major industries of commerce in the Upstate include the automobile industry, which is concentrated primarily along the corridor between Greenville and Spartanburg around the BMW manufacturing facility in Greer, South Carolina. The Greenville Health System and Bon Secours St. Francis Health System represent the healthcare and pharmaceuticals industry in the area. The Upstate is also home to a large amount of private sector and university-based research including research and development facilities for Michelin, Fuji and General Electric and research centers to support the automotive, life sciences, plastics and photonics industries. Clemson University, BMW, IBM, Microsoft and Michelin have combined their resources to create International Center for Automotive Research, a research park that specializes in the development of automotive technology. The Upstate also benefits from being an academic center and is home to collegiate and university education facilities such as Clemson University, Furman University, Presbyterian College, University of South Carolina – Upstate, Anderson University, Lander University, Bob Jones University, Wofford College and Converse College, among others.
Located adjacent to major transportation corridors such as Interstates 85 and 26 and centrally located between Charlotte, North Carolina and Atlanta, Georgia, the Upstate provides a diversified, broad economic base. We believe that our primary market area is not dependent on any one or a few types of commerce due to the area’s diverse economic base. Our client base is similarly diverse, although, as a community bank, our loan portfolio includes concentrations in construction and commercial real estate.
Despite being in these growth markets in South Carolina, we are sensitive to changes in the state and local economies. South Carolina has not been immune to the economic challenges and slow recovery of the Great Recession and its aftermath. During this period, unemployment rose in our markets, and property values declined. The Upstate has experienced steady improvement in unemployment and stabilization of property values since the end of the Great Recession. According to the United States (the “U.S.”) Department of Labor, as of February 23, 2015, unemployment rates, not seasonally adjusted, at December 31, 2014 for counties in our market areas were as follows: Abbeville 6.6%, Anderson 5.4%, Cherokee 6.7%, Greenville 5.0%, Greenwood 6.4%, Laurens 6.4%, Oconee 6.2%, Pickens 5.3% and Spartanburg 5.5%. As of February 23, 2015, the average state unemployment rate, seasonally adjusted, for South Carolina at December 31, 2014 was 6.5% compared to 5.6% for the U.S. While improved, the elevated levels of unemployment over historical levels could adversely impact credit quality.
Distribution Channels
We are primarily engaged in the business of commercial and retail banking through our 25 branches in the Upstate. At December 31, 2014, we also had 27 automatic teller machines (“ATMs”) including three deposit-accepting ATMs and seven limited service offices located in retirement centers and other facilities in the Upstate.
Our branches serve as physical locations where clients can apply for and obtain various loan products, and we also accept residential mortgage loan applications online through our website. We also offer loans to finance the purchase of new and used automobiles through a network of auto dealerships in and contiguous to our market (commonly referred to as “indirect lending”) as well as loans to small business through U.S. SBA programs. While the branches are an important distribution channel, we also offer 24/7/365 service to our clients through weekday hours at branches, Saturday banking at select branches, an ATM network that incorporates regional and national networks, a telephone client contact center, online and mobile banking (including mobile deposits) and treasury management such as wire transfer, ACH and remote deposit capture.
For the past several years, we have been realigning our organizational structure and more specifically delineating our businesses for improved accountability and go-to-market strategies. However, financial information for these businesses has been separated to a limited extent, and, therefore, we do not have disaggregated financial information that meets the criteria to be considered reportable segments. Accordingly, at December 31, 2014, the Company had one reportable segment, which was banking.
Competition
We face substantial competition from national, regional and other community banks. We also face competition from many other types of financial institutions including savings and loan associations, finance companies, credit unions, mortgage banks and other financial intermediaries as well as full-service and discount brokerage firms. Out-of-state financial intermediaries that have opened loan production offices or that solicit deposits in our market areas also provide competition. In addition, money market and stock and fixed income mutual funds have attracted an increasing share of household savings.
We compete with many other financial institutions, some of which are larger and have greater resources available than those of the Company, which enables them to maintain numerous locations and conduct extensive promotional and advertising campaigns. Due to their size, some of these competitors may offer a broader range of products and services as well as better pricing for those products and services than we offer. In addition, banks and other financial institutions with larger capitalization and financial intermediaries that are not subject to bank regulatory restrictions may have larger lending limits that allow them to serve the lending needs of larger customers. Because larger competitors have certain advantages in attracting business from larger corporations, we generally concentrate our efforts on attracting and servicing the business of individuals and small and medium-size businesses. We generally compete on the basis of local relationships, responsive service, the convenience of our service channels (branches, client contact center, mobile and online banking and cash management products), broad suite of our products and services and competitive pricing.
We also compete with nonfinancial companies and/or nontraditional financial institutions that offer payment, lending and other financial services. These companies may not be subject to the same regulatory restrictions as the Company and the banking industry in general.
The following table summarizes the Bank’s deposit market share in our market areas, as of June 30, 2014, the most recent date for which data is available from the FDIC.
County | | Ranking among all institutions | | Total institutions | | Market share among all institutions | | Ranking among South Carolina headquartered institutions | | Total South Carolina headquartered institutions | | Market share among South Carolina headquartered institutions |
Abbeville | | | 5 | | | | 6 | | | | 10.62 | % | | | 4 | | | | 4 | | | | 16.56 | % |
Anderson | | | 11 | | | | 21 | | | | 4.48 | | | | 6 | | | | 12 | | | | 10.08 | |
Cherokee | | | 5 | | | | 7 | | | | 10.55 | | | | 2 | | | | 2 | | | | 22.10 | |
Greenville | | | 10 | | | | 31 | | | | 3.34 | | | | 5 | | | | 16 | | | | 9.82 | |
Greenwood | | | 4 | | | | 7 | | | | 11.93 | | | | 2 | | | | 3 | | | | 23.61 | |
Laurens | | | 1 | | | | 8 | | | | 33.40 | | | | 1 | | | | 3 | | | | 63.61 | |
Oconee | | | 11 | | | | 13 | | | | 1.48 | | | | 6 | | | | 7 | | | | 2.18 | |
Pickens | | | 12 | | | | 15 | | | | 1.05 | | | | 6 | | | | 6 | | | | 2.75 | |
Spartanburg | | | 10 | | | | 19 | | | | 3.47 | | | | 5 | | | | 9 | | | | 10.20 | |
Total | | | 7 | | | | 42 | | | | 4.53 | | | | 2 | | | | 25 | | | | 11.58 | |
According to FDIC data, as of June 30, 2014, the Bank’s market share in South Carolina ranks 9 out of 91 institutions and 3 out of 66 South Carolina headquartered institutions.
Teammates
At December 31, 2014, we had 286 full-time equivalent employees (which we refer to as “teammates”), none of whom were subject to collective bargaining agreements, compared with 302 full-time equivalent teammates at December 31, 2013. Based on the current and expected future size, scope of business activities and electronic distribution channels of the Company, we believe we have the proper alignment of teammate roles and responsibilities. We consider our teammate relations to be good.
Lending Activities
There are inherent risks associated with our lending activities. Prudent risk taking requires sound policies intended to manage the risk within the loan portfolio and control processes intended to ensure compliance with those policies. We review our lending policies and procedures and credit administration function on a regular basis. Current policies and procedures include centralized controls over construction draws, appropriate lending limit approval authorities, general prohibition of out-of-market loan originations to borrowers for which we do not have a previously existing relationship, employment of personnel with expertise in credit administration and special assets management and internal and external training in areas of underwriting and financial statement analysis. During 2014 and first quarter 2015, the Company purchased loans from other financial institutions to supplement organic loan originations. The purchased loans were originated by another financial institution to borrowers and secured by property generally located outside our market. Loan purchases were subjected to the same underwriting standards as our organic loan originations, and we may continue to purchase loans in the future.
We do not generally originate loans in excess of 100% of collateral value, offer loan payment arrangements resulting in negative amortization, engage in lending practices subjecting borrowers to substantial payment increases (e.g. principal deferral periods, loans with initial interest-only periods, etc.) or offer loan payment arrangements with minimum payments that are less than accrued interest.
We follow established guidelines with regard to the scoring and approval of loans. Our loan approval process is multilayered and incorporates a computer-based scoring analysis for all consumer loans (with required approvals for policy or rate exceptions) and all commercial loans of $500 thousand or less when the total credit exposure is less than $750 thousand. All commercial loans with total credit exposure greater than or equal to $750 thousand are reviewed and approved by individuals within the approval hierarchy and, if greater than $5 million, by our Officer’s Credit Committee.
We perform, internally and through the use of an independent third party that reports to the Credit Committee of the Board of Directors, independent loan reviews to validate our loan risk ratings on a periodic basis. Although all of the loans within our loan portfolio are subject to review, commercial real estate loans are given more focus in the loan review selection process as a result of their risk characteristics and concentration of such loans within our loan portfolio. In addition, loans in newer lines of business or those originated though new loan officers are also subject to review to ensure compliance with our credit policies and procedures. Loan review reports are submitted to the Officer’s Credit Committee and the Credit Committee of the Board of Directors, and the third-party loan review firm meets independently with the Credit Committee of the Board of Directors. The loan review process compliments and reinforces our risk identification and assessment decisions.
Compliance with our underwriting policies and procedures is monitored through a loan approval, documentation and exception reporting review process. Our underwriting monitoring procedures include detailed loan reviews, written workout plans for problem loans, monitoring of borrower and industry sectors, hiring and reassignment of personnel with expertise in credit administration and special assets management and active marketing and reduction of problem assets. We also maintain internal loan reporting and reporting to the Board of Directors.
Commercial Real Estate. Commercial real estate loans are subject to underwriting standards and processes similar to commercial business loans with additional standards with regard to real estate collateral. These loans are primarily underwritten based on the cash flow of the borrower or property with the sale of the underlying collateral as a secondary repayment source. We monitor and evaluate commercial real estate loans based on collateral type. In addition, we analyze commercial real estate loans based on whether the loan is secured by owner-occupied or nonowner-occupied real estate collateral.
When originating or renewing commercial real estate loans, we follow loan-to-value policies that are consistent with regulatory guidelines. Exceptions to these policies, other than as part of pre-established products or programs with pre-approved exception guidelines, must be approved in writing by the appropriate level of management and the Officers’ Credit Committee. Exceptions resulting in loan-to-value ratios of 90% or greater require appropriate credit enhancements such as additional collateral or mortgage insurance. In general, our loan-to-value limits for new or renewed commercial real estate loans are as follows:
Loan category | | Loan-to-value limit | |
Raw land | | | 65 | % | |
Land development | | | 75 | | |
Construction - commercial, multifamily and other nonresidential | | | 80 | | |
Construction - single-family residential | | | 85 | | |
Improved property | | | 85 | | |
Owner-occupied, single-family residential and home equity | | | 90 | | |
We make commercial real estate loans to businesses within varying industry sectors. Interest rates charged on these real estate loans are determined by market conditions existing at the time of the loan commitment and the overall relationship profitability as estimated through a third-party relationship pricing model. Generally, loans have adjustable rates although the rate may be fixed, generally for three to five years, for the term of the loan depending on market conditions, collateral and our relationship with the client. Amortization of commercial and installment real estate loans varies but typically does not exceed 20 years. Normally, we have collateral securing real estate loans appraised by independent third-party appraisers prior to originating the loan.
We originate loans to developers and builders that are secured by nonowner-occupied properties. Such loans are typically approved based on predetermined loan-to-collateral values. Construction loans are underwritten utilizing feasibility studies, independent appraisal reviews, sensitivity analysis of absorption and lease rates and/or financial analyses of the developers and property owners. Construction loans are generally based upon estimates of costs and values associated with the completed projects and often involve the disbursement of funds with repayment dependent on the success of the underlying project. Sources of repayment for these types of loans may be precommitted permanent loans from approved long-term lenders, sales of developed property or an interim loan commitment from us until permanent financing is obtained. We monitor these loans by conducting onsite inspections and provide centralized oversight and disbursement of construction draws. In addition, we review advance requests before funds are advanced to clients. We believe that these loans have higher risks than other real estate loans because repayment is sensitive to interest-rate changes, governmental regulation of real property, general economic and market conditions and the availability of long-term financing particularly in the current economic environment. We incurred a higher level of charge-offs on these types of loans from 2009 through 2013 primarily as a result of the Great Recession.
Single-Family Residential. Underwriting standards for single-family residential real estate loans are regulated by statutory requirements, which include, but are not limited to, maximum loan-to-value percentages.
We make both fixed-rate and adjustable-rate single-family mortgage loans with terms generally ranging from 10 to 30 years through our Mortgage line of business. We may offer loans that have interest rates that adjust annually or adjust annually after being fixed for a period of several years in accordance with a designated index. Adjustable-rate mortgage loans may be originated with a limit on any annual changes in the interest rate further limited by the amount by which the interest rate can change over the life of the loan.
A large percentage of our originated single-family mortgage loans are underwritten pursuant to guidelines that permit the sale of these loans to government or private agencies in the secondary market. We participate in secondary market activities by selling whole loans and participations in loans primarily to the Federal Home Loan Mortgage Corporation while retaining the servicing of the underlying loans. This practice enables us to satisfy demand for these loans in our local communities, meet our asset and liability management objectives and develop a source of fee income through the servicing of these loans. We may sell fixed-rate and adjustable-rate loans. In certain loan sales, we provide recoursewhereby we are required to repurchase loans on the occurrence of certain specific events such as noncompliance with underwriting requirements. During 2014, 2013 and 2012, repurchased mortgage loans have not been material to our business, financial condition, results of operations and cash flows.
To protect against declines in collateral value, when we originate and underwrite single-family mortgage loans exceeding 80% of collateral value that are to be retained in our residential mortgage portfolio, we generally require private mortgage insurance that protects us against losses of at least 20% of the mortgage loan amount. In the fourth quarter 2014, we introduced a first time home buyer mortgage program that allows up to 97% loan-to-value, conventional interest rates, flexible down payment sources, local decision making and in-house underwriting. Originations to date have not been significant.
Second mortgages on single-family residential loans (often referred to as home equity loans and home equity lines of credit) are generally underwritten using an automated credit scoring model that assesses the applicant’s credit history, income levels, debt-to-income ratio, collateral values and other policy issues when evaluating whether or not to extend credit. The loans are generally subject to greater credit risk than first mortgages on single-family residential properties because of their subordinated nature. The loan-to-value ratios of home equity loans and lines of credit are calculated at inception of the credit using appraisals obtained in compliance with our standard appraisal policies and take into account the first mortgage loan balance. Updates to the appraised value and recalculation of the loan-to-value ratio are generally performed at maturity and in conjunction with any modification or request for subordination in relation to a refinancing of the first mortgage. In addition, we periodically update the credit scores of existing home equity borrowers to identify potential deterioration in the borrowers’ repayment ability. Our update performed in 2014 did not indicate any substantial deterioration in home equity borrower credit scores.
Commercial and Industrial. Commercial and industrial loans are underwritten after evaluating and understanding the client’s ability to operate profitably, including the potential expansion of the client’s business. Underwriting standards are designed to promote relationship banking rather than transactional banking. We examine current and projected cash flows to determine the likelihood that the client will repay its obligations as agreed. Commercial and industrial loans are primarily made based on the projected cash flows of the client and secondarily on the underlying collateral. The actual cash flows of clients, however, may not be as expected, and the collateral securing loans may fluctuate in value. Most commercial and industrial loans are secured by the assets being financed or other business assets, such as accounts receivable, inventory or property and equipment, and generally incorporate a personal guarantee. However, we make some short-term loans on an unsecured basis. In the case of secured loans, the availability of funds for the repayment of these loans may depend substantially on the ability of the client to collect amounts due from its customers or to liquidate inventory at sufficient prices. Our procedures for monitoring loans secured by commercial and industrial collateral include centralized monitoring of most accounts receivable and inventory lines. Generally, as each loan matures and is considered for renewal, we prepare a defined monitoring schedule for accounts receivable and inventory collateral and track it centrally for adherence to our policy. Results are reported to the Officers’ Credit Committee on a quarterly basis.
Our commercial and industrial loans are generally made with terms that do not exceed five years. Such loans may have fixed or variable interest rates with variable rates changing at frequencies ranging from one day to one year based on the prime lending rate. We also offer a Libor-based pricing option on commercial and industrial loans although the aggregate amount of Libor-based loans was not significant at December 31, 2014.
Indirect Automobile. We make automobile loans on an indirect basis through 86 third-party new and used automobile dealers. Once a loan application is submitted by a dealer, we order a credit report, score the potential borrower, determine the vehicle’s value and underwrite the application. If the application is approved, the loan is made by the dealer and then sold to the Bank.
Our loan policy allows for terms up to 75 months, a loan to value ratio of 125% and debt to income ratio of 50%. All exceptions to the policy and any score overrides are reported to the Officer’s Credit Committee on a monthly basis. Interest rates are fixed for the term of the loan. The dealer is authorized to increase the interest rate at the time of origination by up to 300 basis points, depending on the term, over the approved rate and earns a reserve payment of a percentage of the excess interest. A flat fee is paid to the dealer if the loan is closed at the interest rate provided with the loan approval.
In the fourth quarter 2014, we purchased a pool of indirect auto loans for $22.1 million. The loans purchased were subjected to our normal internal due diligence and underwriting guidelines prior to purchase.
OtherConsumer. Our loan scoring and approval policies and procedures, as outlined previously, relatively small loan amounts, a shorter life relative to commercial loans and loans that are spread across many individual borrowers minimize risk within the consumer sector of our loan portfolio.
Supervision and Regulation
General
We are subject to extensive regulation under federal and state laws. Set forth below is a summary of the significant laws and regulations applicable to the Company and the Bank. The description is qualified in its entirety by reference to the full text of the statutes, regulations and policies that are described. Those statutes, regulations and policies are continually under review by federal and state governments and regulatory agencies. A change in statutes, regulations or regulatory policies applicable to the Company or the Bank could have a material adverse impact on our business, financial condition, results of operations and cash flows.
Recent Legislative and Regulatory Initiatives to Address Financial and Economic Crises
The U.S. Congress, U.S. Department of the Treasury (the “U.S. Treasury”), the federal banking regulators, including the FDIC as well as the SEC, have taken broad actions since 2008 to address volatility and risk in the U.S. banking system. These actions include:
| | ● | Homeowner relief that encourages loan restructuring and modification, |
| | ● | The establishment of significant liquidity, capital and credit facilities for financial institutions and banks, |
| | ● | The lowering of the federal funds rate and maintaining the rate at a historically low level, |
| | ● | Actions against short-term selling practices, |
| | ● | A temporary guarantee program for money market funds, |
| | ● | The establishment of a commercial paper funding facility to provide back-stop liquidity to commercial paper issuers and |
| | ● | Coordinated international efforts to address illiquidity and other weaknesses in the banking sector. |
The Dodd-Frank Wall Street Reform and Consumer Protection Act (the “Dodd-Frank Act”) was signed into law in July 2010. The Dodd-Frank Act impacts financial institutions in numerous ways including:
| | ● | The creation of a Financial Stability Oversight Council responsible for monitoring and managing systemic risk, |
| | ● | Granting additional authority to the Board of Governors of the Federal Reserve to regulate certain types of nonbank financial companies, |
| | ● | Granting new authority to the FDIC as liquidator and receiver, |
| | ● | Changing the manner in which deposit insurance assessments are made, |
| | ● | Requiring regulators to modify capital standards, |
| | ● | Establishing the Bureau of Consumer Financial Protection (the “CFPB”), |
| | ● | Capping interchange fees that banks charge merchants for debit card transactions, |
| | ● | Imposing more stringent requirements on mortgage lenders and |
| | ● | Limiting banks’ proprietary trading activities. |
There are many provisions in the Dodd-Frank Act mandating regulators to adopt new regulations and conduct studies upon which future regulation may be based. While some have been issued, many remain to be issued. It is anticipated that these new regulations will increase our compliance costs and could have unforeseen consequences as additional provisions of the legislation are implemented.
Regulatory Agencies
The Company is a legal entity separate and distinct from the Bank, is regulated under the Bank Holding Company Act of 1956 (“BHCA”) and is subject to inspection, examination and supervision by the Federal Reserve. Because we are a public company, we are also under the jurisdiction of the SEC and subject to their disclosure and regulatory requirements including the Securities Exchange Act of 1934.
The Bank is a FDIC-insured, state-chartered banking organization and is subject to various statutory requirements and rules and regulations promulgated and enforced primarily by the Supervisory Authorities. The Bank is subject to various statutes, rules and regulations that govern the insurance of deposits, minimum capital levels, required reserves, allowable investments, loans, mergers, consolidations, issuance of securities, payment of dividends, establishment of branches and other aspects of the business of the Bank. The Company must file reports with the Federal Reserve and the SEC, and the Bank must file reports with the FDIC and State Board, regarding our activities and financial condition in addition to obtaining regulatory approvals prior to entering into certain transactions such as mergers with, or acquisitions of, other financial institutions. The Federal Reserve, the State Board, and/or the FDIC conduct periodic examinations to test the applicable entity’s safety and soundness and compliance with various regulatory requirements. This regulation and supervision establishes a comprehensive framework of permitted activities in which we can engage and is intended primarily for the protection of the federal deposit insurance fund and depositors. The regulatory structure also gives the regulatory authorities extensive discretion in connection with their supervisory and enforcement activities and examination policies including policies with respect to the classification of assets, the establishment of adequate loan loss reserves and minimum capital levels for regulatory purposes.
Holding Company Activities
In general, the BHCA limits the business of bank holding companies to banking, managing or controlling banks and other activities that the Federal Reserve determines to be closely related to banking as to be a proper incident to the business of banking. The BHCA generally limits acquisitions by bank holding companies that are not qualified as financial holding companies to commercial banks and companies engaged in activities that the Federal Reserve has determined to be so closely related to banking as to be a proper incident thereto.
The BHCA also regulates acquisitions of commercial banks and prohibits us from acquiring direct or indirect control of more than 5% of any class of outstanding voting stock or substantially all of the assets of any bank or merging or consolidating with another bank holding company without prior approval of the Federal Reserve. The BHCA also prohibits us from engaging in or acquiring ownership or control of more than 5% of the outstanding voting stock of any company engaged in a nonbanking business unless that business is determined by the Federal Reserve to be closely related to banking or managing or controlling banks. Further, under South Carolina law, it is unlawful without the prior approval of the State Board for any South Carolina bank holding company to acquire direct or indirect ownership or control of more than 5% of the voting shares of any bank or any other bank holding company, to acquire all or substantially all of the assets of a bank or any other bank holding company or to merge or consolidate with any other bank holding company.
The Federal Reserve requires bank holding companies to serve as a source of financial strength to its subsidiary depository institutions and to commit resources to support such institutions in circumstances where it might not do so absent such policy. Under the Federal Deposit Insurance Corporation Improvement Act of 1991 (“FDICIA”), to avoid receivership of its insured depository institution subsidiary, a bank holding company is required to guarantee the compliance of any insured depository institution subsidiary that may become undercapitalized within the terms of any capital restoration plan filed by such subsidiary with its appropriate federal banking agency up to the lesser of an amount equal to 5% of the institution’s total assets at the time the institution became undercapitalized or the amount which is necessary (or would have been necessary) to bring the institution into compliance with all applicable capital standards as of the time the institution fails to comply with such capital restoration plan.
As a bank holding company registered under the South Carolina Banking and Branching Efficiency Act, we must file with the State Board periodic reports with respect to our financial condition, results of operations, management and relationships between the Company and the Bank. Additionally, we must obtain approval from the State Board prior to engaging in acquisitions of banking or nonbanking institutions or assets.
Dividends
As a bank holding company, the Company’s ability to declare and pay dividends is dependent on certain federal and state regulatory considerations including the guidelines of the Federal Reserve. In general, the Federal Reserve’s policies provide that dividends should be paid only out of current earnings and only if the prospective rate of earnings retention by the bank holding company appears consistent with the organization’s capital needs, asset quality and overall financial condition. Under the prompt corrective action regulations, the ability of a bank holding company to pay dividends may be restricted if a subsidiary bank becomes undercapitalized.
Our ability to pay dividends is also dependent upon the ability of the Bank to pay dividends, which is subject to regulatory restrictions. In general, a South Carolina state bank may not pay dividends from its capital, and all dividends must be paid out of undivided profits then on hand, after deducting expenses, including reserves for losses and bad debts. Subject to any regulatory restrictions, the Bank is authorized to pay cash dividends up to 100% of net income in any calendar year without obtaining prior approval from the State Board provided that the Bank received a composite rating of one or two at its last federal or state regulatory examination. In addition, under the FDICIA, the Bank may not pay a dividend if, after paying the dividend, the Bank would be undercapitalized.
For additional disclosures related to our common stock dividends, see Item 5. Market for Registrant’s Common Equity, Related Shareholder Matters and Issuer Purchases of Equity Securities and Item 8. Financial Statements and Supplementary Data, Note 13, Shareholders’ Equity and Note 21, Regulatory Capital Requirements and Dividend Restrictions.
Basel Capital Standards
The Basel Committee on Banking Supervision (the “BCBS”), an international forum for cooperation on banking supervisory matters, promulgates capital standards for banking organizations. On July 9, 2013, federal bank regulatory agencies issued a final rule that will revise their risk-based capital requirements and the method for calculating risk-weighted assets to make them consistent with agreements that were reached by the Basel Committee on Banking Supervision (“Basel III”) and certain provisions of the Dodd-Frank Act. The final rule applies to all depository institutions, top-tier bank holding companies with total consolidated assets of $500 million or more (such as the Company) and top-tier savings and loan holding companies.
The rule imposes higher risk-based capital and leverage requirements than those currently in place. Specifically, the rule imposes the following minimum capital requirements:
| | ● | A new common equity Tier 1 risk-based capital ratio of 4.5%, |
| | ● | A Tier 1 risk-based capital ratio of 6% (increased from the current 4% requirement), |
| | ● | A total risk-based capital ratio of 8% (unchanged from current requirements), |
| | ● | A leverage ratio of 4% and |
| | ● | A new supplementary leverage ratio of 3% applicable to advanced approaches banking organizations resulting in a leverage ratio requirement of 7% for such institutions. |
The rule also includes changes in what constitutes regulatory capital, some of which are subject to a transition period. These changes include the phasing-out of certain instruments as qualifying capital. In addition, Tier 2 capital is no longer limited to the amount of Tier 1 capital included in total capital. Mortgage servicing rights, certain deferred tax assets and investments in unconsolidated subsidiaries over designated percentages of common stock will be required to be deducted from capital, subject to a transition period. Finally, common equity Tier 1 capital will include accumulated other comprehensive income (which includes all unrealized gains and losses on available for sale debt and equity securities), subject to a transition period and a one-time opt-out election.
The new capital requirements also include changes in the risk-weights of assets to better reflect credit risk and other risk exposures. These include a 150% risk weight (up from 100%) for certain high volatility commercial real estate acquisition, development and construction loans and non-residential mortgage loans that are 90 days past due or otherwise on nonaccrual status, a 20% (up from 0%) credit conversion factor for the unused portion of a commitment with an original maturity of one year or less that is not unconditionally cancellable, a 250% risk weight (up from 100%) for mortgage servicing rights and deferred tax assets that are not deducted from capital and increased risk-weights (from 0% to up to 600%) for equity exposures.
Finally, the rule limits capital distributions and certain discretionary bonus payments if the banking organization does not hold a “capital conservation buffer” consisting of 2.5% of common equity Tier 1 capital to risk-weighted assets in addition to the amount necessary to meet its minimum risk-based capital requirements.
The final rule became effective on January 1, 2015. The capital conservation buffer requirement will be phased in beginning January 1, 2016, at 0.625% of risk-weighted assets, increasing each year until fully implemented at 2.5% on January 1, 2019. It is our belief that, as of December 31, 2014, the Company and the Bank would have met all capital adequacy requirements under the final rule on a fully phased-in basis if such requirements were currently effective.
The federal banking agencies have not proposed rules implementing the final liquidity framework of Basel III and have not determined to what extent they will apply to U.S. banks that are not large, internationally active banks.
The ultimate impact of the rule on the Company and the Bank is currently being reviewed and is dependent upon when certain requirements of the rule will be fully phased in. We believe that the final rule will not have a material impact on our business, financial condition, results of operations and cash flows. At this point we cannot determine the ultimate impact that the fully phased-in rule will have upon our business, financial condition, results of operations and cash flows.
Volcker Rule
Section 619 of the Dodd-Frank Act, known as the “Volcker Rule,” prohibits any bank, bank holding company or affiliate (referred to collectively as “banking entities”) from engaging in two types of activities: “proprietary trading” and the ownership or sponsorship of private equity or hedge funds that are referred to as “covered funds.” On December 10, 2013, our primary federal regulators, the Federal Reserve and the FDIC, together with other federal banking agencies, the SEC and the Commodity Futures Trading Commission, finalized a regulation to implement the Volcker Rule. The deadline for compliance with the Volcker Rule is July 21, 2015.
Capital Adequacy and Prompt Corrective Action
Banks and bank holding companies are subject to various regulatory capital requirements administered by state and federal banking agencies. Capital adequacy guidelines and, additionally for banks, prompt corrective action regulations involve quantitative measures of assets, liabilities and certain off-balance sheet agreements calculated under regulatory accounting practices. Capital amounts and classifications are also subject to qualitative judgments by regulators about components, risk-weighting and other factors.
The Federal Reserve and the FDIC have substantially similar risk-based capital ratio and leverage ratio guidelines for banking organizations. The guidelines are intended to ensure that banking organizations have adequate capital given the risk levels of assets and off-balance sheet agreements. Under the guidelines, banking organizations are required to maintain minimum ratios for Tier 1 capital, as defined below, and total capital to risk-weighted assets (including certain off-balance sheet agreements such as letters of credit). For purposes of calculating the ratios, a banking organization’s assets and some of its specified off-balance sheet agreements are assigned to various risk categories. A depository institution’s or holding company’s capital, in turn, is classified in one of the following three tiers depending on type:
| | ● | Core Capital (Tier 1). Tier 1 capital includes common equity, retained earnings, qualifying noncumulative perpetual preferred stock, a limited amount of qualifying cumulative perpetual preferred stock at the holding company level, minority interests in equity accounts of consolidated subsidiaries, qualifying trust preferred securities less goodwill, nonqualifying deferred tax assets, most intangible assets and certain other assets. |
| | ● | Supplementary Capital (Tier 2). Tier 2 capital includes, among other things, perpetual preferred stock and trust preferred securities not meeting the Tier 1 definition, qualifying mandatory convertible debt securities, qualifying subordinated debt and allowances for loan losses, subject to limitations. |
| | ● | Market-Risk Capital (Tier 3). Tier 3 capital includes qualifying unsecured subordinated debt. |
The Company, like other bank holding companies, is currently required to maintain Tier 1 capital and total capital (the sum of Tier 1, Tier 2, and Tier 3 capital) equal to at least 4% and 8%, respectively, of its total risk-weighted assets (including various off-balance sheet agreements such as letters of credit). At least half of the total capital is required to be Tier 1 capital. In determining the amount of risk-weighted assets, all assets, including certain off-balance sheet agreements, are multiplied by a risk-weight based on the risk inherent in the type of asset. The Bank, like other depository institutions, is required to maintain similar capital levels under capital adequacy guidelines. For a depository institution to be considered well-capitalized under the regulatory framework for prompt corrective action, its Tier 1 and total capital ratios must be at least 6% and 10% on a risk-weighted basis, respectively.
Bank holding companies and banks subject to the market-risk capital guidelines are required to incorporate market and interest-rate risk components into their risk-based capital standards. The Company and the Bank are not subject to the market-risk capital guidelines.
In addition to the risk-based capital guidelines, bank holding companies and banks are also required to comply with minimum leverage ratio requirements. For bank holding companies that have the highest regulatory examination ratios and are not contemplating significant growth or expansion, the Federal Reserve has adopted a minimum Tier 1 (leverage) capital ratio under which a bank holding company must maintain a minimum level of Tier 1 capital to its total adjusted quarterly average assets (as defined for regulatory purposes) of at least 3%. All other bank holding companies are required to maintain a Tier 1 (leverage) capital ratio of at least 4% unless an appropriate regulatory authority specifies a different minimum. For a depository institution to be considered well-capitalized under the regulatory framework for prompt corrective action, its leverage ratio must be at least 5%. The Federal Reserve has not advised the Company of any specific minimum leverage ratio applicable to it. The FDIC also requires state-chartered, nonmember banks, such as the Bank, to maintain a minimum leverage ratio similar to that adopted by the Federal Reserve. Under the FDIC's leverage capital requirement, the Bank is generally required to maintain a minimum Tier 1 (leverage) capital ratioof not less than 4%.
As previously disclosed inBasel Capital Standards above, on July 7, 2013, the federal bank regulatory agencies issued a final rule that will revise their risk-based capital requirements and the method for calculating risk-weighted assets to make them consistent with agreements that were reached by Basel III and certain provisions of the Dodd-Frank Act.
The Federal Deposit Insurance Act (“FDIA”) requires, among other things, that federal banking agencies take prompt corrective action with respect to depository institutions that do not meet minimum capital requirements. The FDIA sets forth the following five capital tiers: well-capitalized, adequately-capitalized, undercapitalized, significantly-undercapitalized and critically-undercapitalized. A depository institution’s capital tier depends on how its capital levels compare with various relevant capital measures and certain other factors as established by regulation. The relevant capital measures are the total capital ratio, Tier 1 capital ratio, and Tier 1 (leverage) capital ratio.
Under the regulations adopted by the federal regulatory authorities, a bank will be categorized as:
| | ● | Well-capitalized if the institution has a total capital ratio of 10% or greater, a Tier 1 capital ratio of 6% or greater, a Tier 1 (leverage) capital ratio of 5% or greater and is not subject to any order or written directive by any such regulatory authority to meet and maintain a specific capital level for any capital measure, |
| | ● | Adequately-capitalized if the institution has a total capital ratio of 8% or greater, a Tier 1 capital ratio of 4% or greater, a Tier 1 (leverage) capital ratio of 4% or greater and is not categorized as well-capitalized, |
| | ● | Undercapitalized if the institution has a total capital ratio that is less than 8%, a Tier 1 capital ratio of less than 4% or a Tier 1 (leverage) capital ratio of less than 4%, |
| | ● | Significantly-undercapitalized if the institution has a total capital ratio of less than 6%, a Tier 1 capital ratio of less than 3% or a Tier 1 (leverage) capital ratio of less than 3% or |
| | ● | Critically-undercapitalized if the institution’s tangible equity is equal to or less than 2% of average quarterly tangible assets. |
However, beginning in January 2015, the minimum capital levels for each prompt corrective action category were increased pursuant to the new capital regulations adopted in July 2013, as previously disclosed inBasel Capital Standards above.
An institution may be downgraded to, or deemed to be in, a capital category that is lower than indicated by its capital ratios if it is determined to be in an unsafe or unsound condition or if it receives an unsatisfactory examination rating with respect to certain matters. A bank’s capital category is determined solely for the purpose of applying prompt corrective action regulations, and the capital category may not constitute an accurate representation of a bank’s overall financial condition for other purposes. If a bank is not well-capitalized, it is subject to certain requirements and restrictions, which get progressively more restrictive if the bank’s regulatory capital level further deteriorates.
At December 31, 2014, all of our capital ratios exceeded the well-capitalized regulatory minimum thresholds.
FDICIA
FDICIA and regulations implementing the FDICIA require, among other things, that management report on the institution's responsibility for preparing financial statements, establishing and maintaining an internal control structure and procedures for financial reporting and compliance with designated laws and regulations concerning safety and soundness. The regulations also require that independent registered public accounting firms attest to, and report separately on, assertions in management's reports regarding compliance with such laws and regulations using FDIC-approved audit procedures. These regulations apply to financial institutions with assets greater than $1 billion at the beginning of their fiscal year. Accordingly, the Bank is subject to these regulations.
Sarbanes-Oxley Act of 2002
The Sarbanes-Oxley Act of 2002 (the “Sarbanes-Oxley Act”) revised the laws affecting corporate governance, accounting obligations and corporate reporting for companies with equity or debt securities registered under the Securities Exchange Act of 1934. In particular, the Sarbanes-Oxley Act established new requirements for audit committees including independence, expertise and responsibilities and established new certification responsibilities for the Chief Executive Officer and Chief Financial Officer with respect to the Company’s financial statements. It also established new standards for auditors and regulation of audits, increased disclosure and reporting obligations for reporting companies and their directors and executive officers and established new and increased civil and criminal penalties for violation of the federal securities laws.
Deposit Insurance
The deposits of the Bank are insured up to applicable limits by the Deposit Insurance Fund (the “DIF”) of the FDIC. The Dodd-Frank Act increased the maximum amount of deposit insurance for banks, savings associations and credit unions to $250 thousand per account. As insurer, the FDIC imposes deposit insurance premiums and is authorized to conduct examinations of, and to require reporting by, FDIC-insured institutions. It also may prohibit any FDIC-insured institution from engaging in any activity that the FDIC determines by regulation or order to pose a serious risk to the DIF. FDIC-insured institutions are required to pay a Financing Corporation assessment to fund the interest on bonds issued to resolve thrift failures in the 1980s. These assessments, which may be revised based upon the level of deposits, will continue until the bonds mature in the years 2017 through 2019. The FDIC may terminate the deposit insurance of any insured depository institution, including the Bank, if it determines after a notice and hearing that the institution has engaged in unsafe or unsound practices, is in an unsafe or unsound condition to continue operations or has violated any applicable law, regulation, rule, order or condition imposed by the FDIC. It also may suspend deposit insurance temporarily during the hearing process for the permanent termination of insurance if the institution has no tangible capital. If insurance of accounts is terminated, the accounts at the institution at the time of the termination, less subsequent withdrawals, remain insured for a period of six months to two years, as determined by the FDIC. Management is not aware of any practice, condition or violation that might lead to termination of the Bank’s deposit insurance.
Anti-Tying Restrictions
Under amendments to the BHCA and Federal Reserve Board regulations, a bank is prohibited from engaging in certain tying or reciprocity arrangements with its customers. In general, a bank may not extend credit, lease, sell property or furnish any services or fix or vary the consideration for these on the condition that:
| | ● | the customer obtain or provide some additional credit, property or services from or to the bank, the bank holding company or its subsidiaries or |
| | ● | the customer not obtain some other credit, property or services from a competitor except to the extent reasonable conditions are imposed to assure the soundness of the credit extended. |
Certain arrangements are permissible, however. For example, a bank may offer combined-balance products and may otherwise offer more favorable terms if a customer obtains two or more traditional bank products. In addition, certain foreign transactions are exempt from the general rule. A bank holding company or any bank affiliate also is subject to anti-tying requirements in connection with electronic benefit transfer services.
Community Reinvestment Act of 1977
The Community Reinvestment Act of 1977 (“CRA”)requires depository institutions to assist in meeting the lending needs of their market areas consistent with safe and sound banking practices. Under the CRA, each depository institution is required to help meet the lending needs of its market areas by, among other things, providing loans to low- and moderate-income individuals and communities. In its most recent CRA examination, the Bank received a “satisfactory” rating.
Transactions with Affiliates and Insiders
Various legal limitations restrict the Bank from lending or otherwise supplying funds to the Company. The Company and the Bank are subject to Sections 23A and 23B of the Federal Reserve Act and Federal Reserve Regulation W.
Section 23A of the Federal Reserve Act places limits on the amount of loans or extensions of credit to, investments in or certain other transactions with, affiliates and on the amount of advances to third parties collateralized by the securities or obligations of affiliates. The aggregate of all covered transactions is limited in amount, as to any one affiliate, to 10% of the Bank’s capital and surplus and, as to all affiliates combined, to 20% of the Bank’s capital and surplus. Furthermore, within the foregoing limitations as to amount, each covered transaction must meet specified collateral requirements. The Bank is forbidden to purchase low-quality assets from an affiliate.
Section 23B of the Federal Reserve Act, among other things, prohibits an institution from engaging in certain transactions with certain affiliates unless the transactions are on terms and under circumstances, including credit standards, that are substantially the same, or at least as favorable to such institution or its subsidiaries, as those prevailing at the time for comparable transactions with nonaffiliated companies. If there are no comparable transactions, an institution’s (or one of its subsidiaries’) affiliate transaction must be on terms and under circumstances, including credit standards, that in good faith would be offered to, or would apply to, nonaffiliated companies.
Regulation W generally excludes all nonbank and nonsavings association subsidiaries of banks from treatment as affiliates except to the extent that the Federal Reserve decides to treat these subsidiaries as affiliates. The regulation also limits the amount of loans that can be purchased by a bank from an affiliate to not more than 100% of the bank’s capital and surplus.
The Bank is also subject to certain restrictions on extensions of credit to its executive officers, directors, certain principal shareholders and their related interests. Such extensions of credit must be made on substantially the same terms, including interest rates and collateral, as those prevailing at the time for comparable transactions with unrelated third parties and must not involve more than the normal risk of repayment or present other unfavorable features.
Effective July 2011, the Dodd-Frank Act expanded the definition of affiliate for purposes of quantitative and qualitative limitations of Section 23A of the Federal Reserve Act to include mutual funds advised by a depository institution or its affiliates. The Dodd-Frank Act will apply Section 23A and Section 22(h) of the Federal Reserve Act (governing transactions with insiders) to derivative transactions, repurchase agreements and securities lending and borrowing transactions that create credit exposure to an affiliate or insider. Any such transactions with affiliates must be fully secured. The current exemption from Section 23A for transactions with financial subsidiaries will be eliminated. The Dodd-Frank Act will additionally prohibit an insured depository institution from purchasing an asset from or selling an asset to an insider unless the transaction is on market terms and, if representing more than 10% of capital, is approved in advance by the disinterested directors.
Branching
Under South Carolina law, the Bank may open branch offices throughout South Carolina with the prior approval of the State Board. In addition, with prior regulatory approval, the Bank may acquire existing banking operations in South Carolina. Furthermore, federal legislation permits interstate branching, including out-of-state acquisitions by bank holding companies, interstate branching by banks and interstate merging by banks. The Dodd-Frank Act removes previous state law restrictions on de novo interstate branching in states such as South Carolina. This change permits out-of-state banks to open de novo branches in states where the laws of the state in which the de novo branch is to be opened would permit a bank chartered by that state to open a de novo branch.
Financial Privacy
In accordance with the Gramm-Leach-Bliley Act, the Company is limited in its ability to disclose nonpublic information about consumers to nonaffiliated third parties. These limitations require disclosure of privacy policies to consumers and, in some circumstances, allow consumers to prevent disclosure of certain personal information to a nonaffiliated third party.
In addition, pursuant to the Fair and Accurate Credit Transactions Act (the “FACT Act”) and the implementing regulations of the federal banking agencies and Federal Trade Commission, the Company is required to have in place an “identity theft red flags” program to detect, prevent and mitigate identity theft. The Company has implemented an identity theft red flags program designed to meet the requirements of the FACT Act and the joint final rules. Additionally, the FACT Act amends the Fair Credit Reporting Act of 1978, as amended by the FACT Act to generally prohibit a person from using information received from an affiliate to make a solicitation for marketing purposes to a consumer unless the consumer is given notice and a reasonable opportunity and a reasonable and simple method to opt-out of the making of such solicitations.
Consumer Protection Regulations
Activities of the Bank are subject to a variety of statutes and regulations designed to protect consumers. Interest and other charges collected or contracted for by the Bank are subject to state usury laws and federal laws concerning interest rates. The loan operations of the Bank are also subject to federal laws and regulations applicable to credit transactions including:
| | ● | The Dodd-Frank Act that created the CFPB within the Federal Reserve, which has broad rule-making authority over a wide range of consumer laws that apply to all insured depository institutions, |
| | ● | The federal Truth-In-Lending Act and Regulation Z governing disclosures of credit terms to consumer borrowers and including substantial new requirements for mortgage lending as mandated by the Dodd-Frank Act, |
| | ● | The Home Mortgage Disclosure Act of 1975 and Regulation C requiring financial institutions to provide information to enable the public and public officials to determine whether a financial institution is fulfilling its obligation to help meet the housing needs of the community it serves, |
| | ● | The Equal Credit Opportunity Act and Regulation B prohibiting discrimination on the basis of race, color, religion or other prohibited factors in extending credit, |
| | ● | The Fair Credit Reporting Act of 1978, as amended by the FACT Act and Regulation V, as well as the rules and regulations of the FDIC, governing the use and provision of information to credit reporting agencies, certain identity theft protections and certain credit and other disclosures, |
| | ● | The Fair Debt Collection Practices Act and Regulation F governing the manner in which consumer debts may be collected by collection agencies and |
| | ● | The Real Estate Settlement Procedures Act and Regulation X governing aspects of the settlement process for residential mortgage loans. |
The deposit operations of the Bank are also subject to federal laws including:
| | ● | The Right to Financial Privacy Act, which imposes a duty to maintain confidentiality of consumer financial records and prescribes procedures for complying with administrative subpoenas of financial records, |
| | ● | The Electronic Funds Transfer Act and Regulation E governing automatic deposits to and withdrawals from deposit accounts and customers’ rights and liabilities arising from the use of ATMs and other electronic banking services and |
| | ● | The Truth-in-Savings Act and Regulation DD requiring depository institutions to provide disclosures so that consumers can make meaningful comparisons about depository institutions. |
Anti-Money Laundering
Financial institutions must maintain anti-money laundering programs that include established internal policies, procedures and controls, a designated compliance officer, an ongoing teammate training program and testing of the program by an independent audit function. The Company and the Bank are also prohibited from entering into specified financial transactions and account relationships and must meet enhanced standards for due diligence and “knowing your customer” in dealings with foreign financial institutions and foreign customers. Financial institutions must take reasonable steps to conduct enhanced scrutiny of account relationships to guard against money laundering and to report any suspicious transactions. Recent laws provide law enforcement authorities with increased access to financial information maintained by banks. Anti-money laundering obligations have been substantially strengthened as a result of the USA PATRIOT Act. Bank regulators routinely examine institutions for compliance with these obligations and are required to consider compliance in connection with the regulatory review of applications. The regulatory authorities have been active in imposing cease and desist orders and monetary sanctions against institutions found to be in violation of these obligations.
USA PATRIOT Act
The USA PATRIOT Act provides, in part, for the facilitation of information sharing among governmental entities and financial institutions for the purpose of combating terrorism and money laundering by enhancing anti-money laundering and financial transparency laws as well as enhanced information collection tools and enforcement mechanics for the U.S. government, including: (i) requiring standards for verifying customer identification at account opening, (ii) rules to promote cooperation among financial institutions, regulators and law enforcement entities in identifying parties that may be involved in terrorism or money laundering, (iii) requiring reports be filed by nonfinancial trades and businesses with the U.S. Treasury’s Financial Crimes Enforcement Network for transactions exceeding $10,000, (iv) requiring the filing of suspicious activities reports by brokers and dealers if they believe a customer may be violating U.S. laws and regulations, and (v) requiring enhanced due diligence requirements for financial institutions that administer, maintain or manage private bank accounts or correspondent accounts for non-U.S. persons. Bank regulators routinely examine institutions for compliance with these obligations and are required to consider compliance in connection with the regulatory review of applications.
Privacy and Credit Reporting
Financial institutions are required to disclose their policies for collecting and protecting confidential information. Clients generally may prevent financial institutions from sharing nonpublic personal financial information with nonaffiliated third parties except under narrow circumstances such as the processing of transactions requested by the consumer or when the financial institution is jointly sponsoring a product or service with a nonaffiliated third party. Additionally, financial institutions generally may not disclose consumer account numbers to any nonaffiliated third party for use in telemarketing, direct mail marketing or other marketing to consumers. It is the Bank's policy not to disclose any personal information unless required by law.
Like other lending institutions, the Bank utilizes credit bureau data in its underwriting activities. Use of such data is regulated under the Federal Credit Reporting Act on a uniform, nationwide basis including credit reporting, prescreening, sharing of information between affiliates and the use of credit data. The FACT Act authorizes states to enact identity theft laws that are not inconsistent with the conduct required by the provisions of the FACT Act.
Federal Home Loan Bank System
The Bank is a member of the FHLB of Atlanta, which is one of the regional FHLBs that administer home financing credit for depository institutions. Each FHLB serves as a reserve or central bank for its members within its assigned region. It is funded primarily from proceeds derived from the sale of consolidated obligations of the FHLB System. It makes loans or advances to members in accordance with policies and procedures established by the Board of Directors of the FHLB, which are subject to the oversight of the Federal Housing Finance Board. All advances from the FHLB are required to be fully secured by collateral as determined by the FHLB.
Available Information
Under the Securities Exchange Act of 1934, we are required to electronically file annual, quarterly and current reports, proxy statements and other information with the SEC. Documents we file with the SEC may be accessed, read and copied at the SEC’s Public Reference Room at 100 E. St. N.E., Washington, D.C. 20549. The public may obtain information on the operation of the Public Reference Room by calling the SEC at 1-800-SEC-0330.
Our Annual Reports on Form 10-K, Quarterly Reports on Form 10-Q and Current Reports on Form 8-K, as well as select other documents filed with or furnished to the SEC pursuant to Section 13(a) or 15(d) of the Securities Exchange Act of 1934, are accessible at no cost on our website, www.palmettobank.com, through the Investor Relations link. Other documents filed with or furnished to the SEC pursuant to Section 13(a) or 15(d) of the Securities Exchange Act of 1934, in addition to the documents noted above, are accessible at no cost on the SEC’s website (www.sec.gov). In addition, through the Investor Relations link, we make available our Code of Ethics as well as other information pertinent to corporate governance. We will provide a printed copy of any of the aforementioned documents to any requesting shareholder. Such requests should be directed to 306 East North Street, Greenville, South Carolina 29601, Attention: Chief Financial Officer.
ITEM 1A.RISK FACTORS
The material risks and uncertainties that we believe impact the Company are described below. If any of the following risks actually occur, our business, financial condition, results of operations or cash flows could be materially and adversely impacted. If this were to happen, the value of our stock could decline, and investors could lose all or part of their investment. The risks described below are not the only risks we face. Additional risks and uncertainties not currently known or currently deemed to be immaterial also may materially and adversely impact our business, financial condition, results of operations or cash flows.
Our decisions regarding credit risk and allowance for loan losses may materially and adversely impact our business.
Making loans and other extensions of credit is an essential element of our business. Although we seek to mitigate risks inherent in lending by adhering to specific underwriting practices, our loans and other extensions of credit may not be repaid. The risk of nonpayment is impacted by a number of factors, including:
| | ● | The duration of the credit, |
| | ● | Credit risks of a particular client, |
| | ● | The quality of the underwriting, |
| | ● | Changes in economic and industry conditions and |
| | ● | In the case of a collateralized loan, risks resulting from uncertainties about the future value of the collateral. |
We attempt to maintain an appropriate allowance for loan losses to provide for inherent losses in our loan portfolio. We periodically determine the amount of the allowance based on consideration of several factors, including:
| | ● | Evaluations of the collectability of loans in our portfolio including consideration of factors such as the balance of impaired loans and the quality, mix and size of our overall loan portfolio, |
| | ● | Economic conditions that may impact the overall loan portfolio or an individual borrower’s ability to repay, |
| | ● | The amount and quality of collateral securing the loans, |
| | ● | Our historical loan loss experience and |
| | ● | Borrower and collateral specific considerations for loans individually evaluated for impairment. |
The determination of the appropriate level of the allowance for loan losses inherently involves a high degree of subjectivity and requires us to make significant estimates of current credit risks and future trends, all of which may undergo material changes subsequent to the determination of the allowance for loan losses. Therefore, we face the risk that charge-offs in future periods will exceed our allowance for loan losses, and that additional increases in the allowance for loan losses will be required. Additions to the allowance for loan losses would result in a decrease of our net income (or increase in our net loss) and possibly our capital.
Federal and state regulators periodically review our allowance for loan losses and may require us to increase our provision for loan losses or recognize further loan charge-offs based on judgments different than those of management. Any increase in the amount of our provision for loan losses or loans charged-off as required by these regulatory agencies could have a negative impact on our business, financial condition and results of operations.
We may have higher actual loan losses than our recorded allowance for loan losses.
We maintain an allowance for loan losses, which is a reserve established through a provision for loan losses charged to expense, that we believe is appropriate to provide for probable losses inherent in our loan portfolio. Our actual loan losses could exceed our allowance for loan losses, and, therefore, our historic allowance for loan losses may not be adequate. As of December 31, 2014, 53.4% of our gross loan portfolio was secured by commercial real estate. Repayment of such loans is generally considered more subject to market risk than residential mortgage loans. Industry experience shows that a portion of loans will become delinquent, and that a portion of loans will require partial or entire charge-off. Regardless of the underwriting criteria utilized, losses may be experienced as a result of various factors beyond our control including, among other things, changes in market conditions impacting the value of loan collateral and problems impacting borrowers’ credit.
If our allowance for loan losses is determined to be inadequate, we will be required to make additional provision for loan losses, which could further adversely impact our results of operations. No assurance can be given that we will not sustain credit losses requiring additions to the provision for loan losses in excess of present levels.
A significant portion of our loan portfolio is secured by real estate, and events that negatively impact the real estate market could hurt our business.
At December 31, 2014, 79.7% of our gross loan portfolio was secured by real estate. The real estate collateral provides an alternate source of repayment in the event of default by the borrower and may deteriorate in value during the time the credit is extended. The real estate market was substantially impacted by the Great Recession and its aftermath, which led to reduced real estate values for residential and commercial properties, increased levels of inventories of unsold homes and resulted in higher foreclosure rates. As a result, property values for this type of collateral declined substantially and, although stabilizing, some market appraisal assumptions remain depressed. These loans carry a higher degree of risk than long-term financing of existing real estate since repayment is dependent on the ultimate completion of the project or home and often on the sale of the property or permanent financing. Slower housing conditions have impacted some of these borrowers’ ability to sell the completed projects in a timely manner. In some cases, this downturn resulted in a significant impairment in the value of the real estate collateral and our ability to sell the collateral upon foreclosure. As a result, during 2009 through 2013, we incurred substantially higher charge-offs than we have historically experienced, and we maintained our allowance for loan losses during these periods at levels higher than historically maintained to address the probable credit losses inherent within our loan portfolio. Further deterioration in the South Carolina real estate market may cause us to adjust our opinion of the level of credit quality in our loan portfolio. Such a determination may lead to additional provisions for loan losses, which could also adversely impact our business, financial condition and results of operations.
We have a concentrationof credit exposure in commercial real estate and depressed commercial real estate conditions could adversely impact our business, financial condition and results of operations.
At December 31, 2014, 53.4% of our loan portfolio was secured by commercial real estate. Loans secured by commercial real estate are generally viewed as having more risk of default than loans secured by residential real estate or consumer loans because repayment of the loans often depends on the successful operation of the property, the income stream of the borrowers, the accuracy of the estimate of the property’s value at completion of construction and the estimated cost of construction. Loans secured by commercial real estate are also generally more risky than loans secured by residential real estate or consumer loans because the collateral securing commercial real estate loans typically cannot be sold as easily as residential real estate. An adverse development with respect to one lending relationship can expose us to a significantly greater risk of loss compared with a single-family residential mortgage loan because we typically have more than one loan with such borrowers. Additionally, these loans typically involve larger loan balances to single borrowers or groups of related borrowers compared with single-family residential mortgage loans. Therefore, the deterioration of one or a few of these loans could cause a significant decline in the related asset quality. Because of the severity of the Great Recession and lack of a more typical recovery, these loans represent higher risk, could result in an increase in loans charged-off and could require us to significantly increase our allowance for loan losses, which could have a material adverse impact on our business, financial condition and results of operations.
Our focus on lending to small to mid-sized community-based businesses may increase our credit risk.
Most of our commercial business and commercial real estate loans are made to small business or middle-market clients. These businesses generally have fewer financial resources in terms of capital or borrowing capacity than larger entities and have a heightened vulnerability to economic conditions. If general economic conditions in the markets in which we operate negatively impact this important client sector, our financial condition, results of operations and the value of our common stock may be adversely impacted. Moreover, a portion of these loans have been made by us in recent years, and the borrowers may not have experienced a complete business or economic cycle. Furthermore, the deterioration of our borrowers’ businesses may hinder their ability to repay their loans with us, which could have a material adverse impact on our business, financial condition, results of operations and cash flows.
Our underwriting decisions may materially and adversely impact our business.
While we generally underwrite the loans in our portfolio in accordance with our own internal underwriting guidelines and regulatory supervisory guidelines, in certain circumstances, we have made loans, including purchased loans, with loan-to-value ratios which exceed either our internal underwriting guidelines, supervisory guidelines or both. The number of loans in our portfolio with loan-to-value ratios in excess of supervisory guidelines, our internal guidelines or both could increase the risk of delinquencies and defaults in our portfolio as well as credit losses.
Strong competition within our market area could reduce our profits and slow growth.
As the economy continues to recover, we face more intense competition both in making loans and attracting deposits, particularly as a community bank. This competition may make it more difficult for us to make new loans and may force us to offer lower loan rates and higher deposit rates. Pricing competition for loans and deposits might result in our earning less on our loans and paying more on our deposits, which may reduce net interest income. Competition also makes it more difficult to grow loans and deposits. Many of the institutions with which we compete have substantially greater resources and lending limits than we have and may offer services that we do not provide. We expect competition to increase in the future as a result of legislative, regulatory and technological changes and the continuing trend of consolidation in the financial services industry. Our profitability depends upon our continued ability to compete successfully in our market area.
The severity of theGreat Recession and lack of a typical recovery could reduce our client base, level of deposits and demand for financial products such as loans.
Our success significantly depends upon the growth in population, income levels, deposits and housing starts in our markets. The Great Recession and its aftermath negatively impacted the markets in which we operate. If the communities in which we operate do not grow or if prevailing economic conditions locally or nationally do not continue to improve, our business may be negatively impacted. A period of depressed economic conditions or entering a prolonged recession would likely result in the deterioration of the quality of our loan portfolio, which in turn would hurt our business. Interest and fees on loans represented 89.5% and 90.1% of our interest income for the years ended December 31, 2014 and 2013, respectively. If economic conditions deteriorate or a prolonged economic recession occurs in the economy as a whole, borrowers will be less likely to repay their loans as scheduled. Moreover, the value of real estate or other collateral that secures our loans may be adversely impacted by negative economic conditions. Unlike many larger institutions, we are not able to spread the risks of unfavorable local economic conditions across a large number of diversified economies. Continued unfavorable economic conditions could, therefore, have a material adverse impact on our business, financial condition, results of operations and cash flows.
Liquidity risks could impact operations and jeopardize our financial condition.
The goal of liquidity management is to ensure that we can meet client loan requests, client deposit maturities and withdrawals and other cash commitments under both normal operating conditions and under unpredictable circumstances of industry or market stress. To achieve this goal, our Asset / Liability Committee (“ALCO”) establishes liquidity guidelines that require sufficient asset-based liquidity to cover potential funding requirements and to avoid overdependence on volatile, less reliable funding sources.
An inability to raise funds through deposits, retail repurchase agreements, borrowings, the sale of securities or loans, issuance of additional equity or debt securities and other sources could have a substantial negative impact on our liquidity. Our access to funding sources in amounts adequate to finance our activities and with terms acceptable to us could be impaired by factors that impact us specifically or the financial services industry in general. Factors that could detrimentally impact access to liquidity sources include a decrease in the level of our business activity as a result of a downturn in the markets in which our loans are concentrated or regulatory action against us. Our ability to borrow could also be impaired by factors that are not specific to us such as disruptions in the financial markets and negative views and expectations about the prospects for the financial services industry as a result of contracting net interest margins, increased regulatory restrictions and costs and the lack of a robust economic recovery.
Historically, we have relied on deposits, retail repurchase agreements, FHLB advances, funding from correspondent banks and other borrowings to fund our operations. Some of the Bank’s various sources of liquidity could be restricted in the event we experience negative financial performance.
We monitor the depository institutions that hold our federal funds sold and due from banks cash balances. We cannot provide assurances that access to our cash and cash equivalents and federal funds sold will not be impacted by adverse conditions in the financial markets. Our emphasis is primarily on safety of principal, and we diversify cash, due from banks and federal funds sold among counterparties to minimize exposure relating to any one of these entities. We routinely review the financial condition of our counterparties as part of our risk management process. Balances in our accounts with financial institutions in the U.S. may exceed the FDIC insurance limits. While we monitor and adjust the balances in our accounts as appropriate, these balances could be impacted if the correspondent financial institutions fail.
We currently do not utilize brokered deposits as a funding source. However, this funding source is available to us if we were to decide to pursue such funding. Brokered deposits generally represent deposit accounts placed with a bank from sources outside its local market. These funds are often raised at a cost in excess of the cost of funds generated through a bank’s organic channels and do not represent true client relationships. Our ability to access the brokered deposit market without prior approval from the FDIC is contingent on maintaining a well-capitalized status under regulatory capital rules. Our ability to access the brokered deposit market can also be impacted by an FDIC order or other regulatory restrictions as a result of the Bank’s ongoing examination process.
There can be no assurance that our sources of funds will be adequate for our liquidity needs, and we may be compelled to seek additional sources of financing in the future. Specifically, we may seek additional equity and/or debt in the future to achieve our business objectives. There can be no assurance that additional capital and/or borrowings, if sought, would be available to us or, if available, would be on favorable terms. Bank and holding company stock prices have been negatively impacted by the Great Recession and its aftermath as has the ability of banks and holding companies to raise capital or borrow in the debt markets. If additional financing sources are unavailable or are not available on reasonable terms, our business, financial condition, results of operations, cash flows and future prospects could be materially adversely impacted.
Customers could pursue alternatives to bank deposits causing us to lose a relatively inexpensive source of funding.
Checking and savings account balances and other forms of customer deposits could decrease if clientsperceive alternative investments, such as the stock market, provide superior expected returns. When customers move money out of bank deposits in favor of alternative investments, we can lose a relatively inexpensive source of funds, increasing our funding costs.
Negative developments in the financialservicesindustry, the domestic and international credit markets, and the economy in general pose significant challenges for our industry and us and could adversely impact our business, financial condition and results of operations.
The Great Recession and its aftermath resulted in unprecedented volatility and disruption in the financial markets and a general economic downturn, both nationally and in our primary market in the Upstate of South Carolina. As a result of this “credit crunch,” commercial as well as consumer loan portfolio performance deteriorated at many institutions, and the competition for deposits and quality loans increased significantly. In addition, the values of real estate collateral supporting many commercial loans and home mortgages have declined and may continue to decline. As a result, we face the following risks:
| | ● | Economic conditions that negatively impact housing prices and the job market may cause the credit quality of our loan portfolio to deteriorate, |
| | ● | Market developments that impact consumer confidence may cause adverse changes in payment patterns by our clients, causing increases in delinquencies and default rates on loans and other credit facilities, |
| | ● | The processes that we use to estimate our allowance for loan losses may no longer be reliable because they rely on judgments, such as forecasts of economic conditions, that may no longer be accurately estimated, |
| | ● | The value of our securities portfolio may decline and |
| | ● | Increased regulation of our industry, and the costs of compliance with such regulation may increase. |
These conditions or similar ones may continue to persist or worsen causing us to experience continuing or increased adverse impacts on our business, financial condition, results of operations and the price of our common stock.
Higher FDIC deposit insurance premiums and assessments could adversely impact our financial condition.
As previously disclosed in Item 1. Business, the Bank’s deposits are insured up to applicable limits by the DIF and are subject to deposit insurance assessments to maintain deposit insurance. As an FDIC-insured institution, we are required to pay quarterly deposit insurance premium assessments to the FDIC.
Although wecannot predict what the insurance assessment rates will be in the future, deterioration in our risk category could have a material adverse impact on our business, financial condition, results of operations and cash flows.
Changes in prevailing interest rates may reduce our profitability.
One of the key measures of our success is the amount of our net interest income. Net interest income is the difference between interest income earned on interest-earning assets and interest expense paid on interest-bearing liabilities. Interest rates are highly sensitive to many factors that are beyond our control including general economic conditions and policies of various governmental and regulatory agencies, particularly the Federal Reserve.
We are subject to interest rate risk because:
| | ● | Assets and liabilities may mature or reprice at different times (for example, if assets reprice faster than liabilities and interest rates are generally falling, net income will initially decline), |
| | ● | Assets and liabilities may reprice at the same time but by different amounts (for example, when the general level of interest rates is falling, we may reduce interest rates paid on deposit accounts by an amount that is less than the general decline in market interest rates), |
| | ● | Short-term and long-term market interest rates may change by different amounts (for example, the shape of the yield curve may impact new or repricing loan yields and funding costs differently) and/or |
| | ● | The remaining maturity of various assets or liabilities may shorten or lengthen as interest rates change (for example, if long-term mortgage interest rates decline sharply, mortgage-backed securities held in the investment securities available for sale portfolio may prepay significantly earlier than anticipated, which could reduce portfolio income). |
Interest rates may also have a direct or indirect impact on any of our financial instruments, including loan demand, credit losses, mortgage origination volumes, servicing rights, gain on the sale of mortgage and SBA loans, the value of our defined benefit pension plan (the “Pension Plan”) assets and liabilities, bank-owned life insurance (“BOLI”) income, trading account income and other financial instruments directly or indirectly impacting net income.
We may be unable to anticipate changes in market interest rates, which are impacted by many factors beyond our control including, but not limited to, inflation, recession, unemployment, money supply, monetary policy and other changes that impact financial markets both domestic and foreign. Our net interest income is impacted not only by the level and direction of interest rates but also by the shape of the yield curve and relationships between interest-sensitive instruments and key driver rates as well as balance sheet growth, client loan and deposit preferences and the timing of changes in these variables. In the event interest rates increase, our costs on interest-bearing liabilities may increase more rapidly than our income on interest-earning assets resulting in a deterioration of our net interest margin. As such, any substantial, unexpected, prolonged change in market interest rates could have a material adverse impact on our business, financial condition, results of operations and cash flows.
We may be adversely impacted by the soundness of other financial institutions.
Financial services institutions are interrelated as a result of credit, trading, clearing, counterparty or other relationships. We have exposure to many different industries and counterparties and routinely execute transactions with counterparties in the financial services industry including commercial banks, brokers and dealers, investment banks and other institutional clients. Many of these transactions expose us to credit risk in the event of a default by a counterparty or client. In addition, our credit risk may be exacerbated when the collateral held by the Bank cannot be realized upon or is liquidated at prices not sufficient to recover the full amount of the credit or derivative exposure due to the Bank. Any such losses could have a material adverse impact on our business, financial condition, results of operations and cash flows.
We are dependent on key management individuals and the loss of one or more of these key individuals could curtail our growth and adversely impact our prospects.
We depend on a limited number of key management personnel. The loss of key personnel could have a material adverse impact on our operations because other personnel may not have the experience and expertise to readily replace these individuals. As a result, our Board of Directors may have to search outside of the Bank for qualified replacements. This search may be prolonged, and we cannot provide assurance that we would be able to locate and hire qualified replacements.
We are subject to extensive regulation that could limit or restrict our activities, have an adverse impact on our operations and impose financial requirements or limitations on the conduct of our business.
We operate in a highly-regulated industry and are subject to examination, supervision and comprehensive regulation by various regulatory agencies. Our compliance with these regulations is costly and restricts certain of our activities including payment of dividends, corporate transactions, investments, loans and interest rates charged, interest rates paid on deposits and locations of branches. We are also subject to capitalization guidelines established by our regulators, which require us to maintain adequate capital to support our growth.
Further, changes in laws, regulations and regulatory practices impacting the financial services industry could subject us to additional costs, limit the types of financial services and products we may offer and/or may increase the ability of nonbanks to offer competing financial services and products, among other things. Failure to comply with laws, regulations or policies could also result in heightened regulatory scrutiny and in sanctions by regulatory agencies (such as a memorandum of understanding, a written supervisory agreement or a cease and desist order), civil money penalties and/or reputation damage. Any of these consequences could restrict our ability to expand our business or could require us to raise additional capital or sell assets on terms that are not advantageous to us or our shareholders and could have a material adverse impact on our business, financial condition and results of operations. While we have policies and procedures designed to prevent any such violations, such violations may occur despite our best efforts.
New capital rules that were recently issued generally require insured depository institutions and their holding companies to hold more capital. The impact of the new rules on our financial condition and operations is uncertain but could be materially adverse.
On July 9, 2013, the federal bank regulatory agencies issued a final rule that will revise their risk-based capital requirements and the method for calculating risk-weighted assets to make them consistent with agreements that were reached by Basel III and certain provisions of the Dodd-Frank Act. This rule substantially amended the regulatory risk-based capital rules applicable to us. The requirements in the rule began to phase in on January 1, 2015 for the Company and the Bank. The requirements in the rule will be fully phased in by January 1, 2019.
The final rules increase capital requirements and generally include two new capital measurements that will impact us, a risk-based Common Equity Tier 1 (“CET1”) ratio and a capital conservation buffer. CET1 capital is a subset of Tier 1 capital and is limited to common equity (plus related surplus), retained earnings, accumulated other comprehensive income and certain other items. Other instruments that have historically qualified for Tier 1 treatment, including noncumulative perpetual preferred stock, are consigned to a category known as Additional Tier 1 capital and must be phased out over a period of nine years beginning in 2014. The rules permit bank holding companies with less than $15 billion in assets (such as us) to continue to include trust preferred securities and noncumulative perpetual preferred stock issued before May 19, 2010 in Tier 1 capital but not CET1. Tier 2 capital consists of instruments that have historically been placed in Tier 2 as well as cumulative perpetual preferred stock.
The final rules adjust all three categories of capital by requiring new deductions from and adjustments to capital that will result in more stringent capital requirements and may require changes in the ways we do business. Among other things, the current rule on the deduction of mortgage-servicing assets from Tier 1 capital has been revised in ways that are likely to require a greater deduction than we currently make and that will require the deduction be made from CET1. This deduction phases in over a three-year period from 2015 through 2017. Additionally, any gains on sales of mortgage loans sold into securitizations must be deducted in full from CET1. This requirement phases in over three years from 2015 through 2017. Under the earlier rule and through 2014, no deduction is required.
Beginning in 2015, our minimum capital requirements will be:
| | ● | A Tier 1 capital (CET1 plus Additional Tier 1 capital) of 6% (up from 4%) and |
| | ● | A total capital ratio of 8% (the current requirement). |
Our leverage ratio requirement will remain at the 4% level now required. Beginning in 2016, a capital conservation buffer will phase in over three years ultimately requiring 2.5% on top of the CET1, Tier 1 and total capital requirements resulting in a required CET1 ratio of 7%, a Tier 1 ratio of 8.5% and a total capital ratio of 10.5%. Failure to satisfy any of these three capital requirements will result in limits on paying dividends, engaging in share repurchases and paying discretionary bonuses. These limitations will establish a maximum percentage of eligible retained income that could be utilized for such actions. While the final rules will result in higher regulatory capital standards, it is difficult at this time to predict when or how any new standards will ultimately be applied to us.
In addition to the higher required capital ratios and the new deductions and adjustments, the final rules increase the risk-weights for certain assets. As a result, we will have to hold more capital against these assets. For example, commercial real estate loans that do not meet certain new underwriting requirements must be risk-weighted at 150% rather than the current 100%. There are also new risk-weights for unsettled transactions and derivatives. We also will be required to hold capital against short-term commitments that are not unconditionally cancelable. Prior to January 1, 2015, there were no capital requirements for these off-balance sheet commitments. All changes to the risk-weights take effect fully in 2015.
In addition, in the current economic and regulatory environment, bank regulators may impose capital requirements that are more stringent than those required by applicable existing regulations. The application of more stringent capital requirements for us could, among other things, result in lower returns on equity, require the raising of additional capital and result in regulatory actions if we were to be unable to comply with such requirements. Implementation of changes to asset risk-weightings for risk-based capital calculations, items included or deducted in calculating regulatory capital or additional capital conservation buffers could result in management modifying our business strategy and could limit our ability to make distributions including paying dividends or buying back shares of our stock.
We face a risk of noncompliance and enforcement action with the Bank Secrecy Act and other anti-money laundering statutes and regulations.
The federal Bank Secrecy Act, the Uniting and Strengthening America by Providing Appropriate Tools Required to Intercept and Obstruct Terrorism Act of 2001 and other laws and regulations require financial institutions to, among other duties, institute and maintain effective anti-money laundering programs and file suspicious activity and currency transaction reports as appropriate. The federal Financial Crimes Enforcement Network, established by the U.S. Treasury to administer the Bank Secrecy Act, is authorized to impose significant civil money penalties for violations of those requirements and has recently engaged in coordinated enforcement efforts with the individual federal banking regulators as well as the U.S. Department of Justice, Drug Enforcement Administration and Internal Revenue Service. There is also increased scrutiny of compliance with the rules enforced by the Office of Foreign Assets Control. Federal and state bank regulators also have begun to focus on compliance with Bank Secrecy Act and anti-money laundering regulations. If our policies, procedures and systems are deemed deficient or the policies, procedures and systems of the financial institutions that we may acquire in the future are deficient, we would be subject to liability including fines and regulatory actions such as restrictions on our ability to pay dividends and the necessity to obtain regulatory approvals to proceed with certain aspects of our business plan, including our acquisition plans, which would negatively impact our business, financial condition and results of operations. Failure to maintain and implement adequate programs to combat money laundering and terrorist financing could also have serious reputational consequences for us.
Federal, state and local consumer lending laws may restrict our ability to originate certain mortgage loans or increase our risk of liability with respect to such loans and could increase our cost of doing business.
Federal, state and local laws have been adopted that are intended to eliminate certain lending practices considered “predatory.” These laws prohibit practices such as steering borrowers away from more affordable products, selling unnecessary insurance to borrowers, repeatedly refinancing loans and making loans without a reasonable expectation that the borrowers will be able to repay the loans irrespective of the value of the underlying property. During 2013 and 2014, the CFPB issued several rules on mortgage lending, notably a rule requiring all home mortgage lenders to determine a borrower's ability to repay the loan. Loans with certain terms and conditions and that otherwise meet the definition of a “qualified mortgage” may be protected from liability to a borrower for failing to make the necessary determinations. In either case, we may find it necessary to tighten our mortgage loan underwriting standards in response to the CFPB rules, which may constrain our ability to make loans consistent with our business strategies. It is our policy not to make predatory loans and to determine borrowers' ability to repay, but the law and related rules create the potential for increased liability with respect to our lending and loan investment activities. Additionally, they increase our cost of doing business and, ultimately, may prevent us from making certain loans and cause us to reduce the average interest rate charged or the points and fees charged on loans that we do originate.
We are subject to federal and state fair lending laws and failure to comply with these laws could lead to material penalties.
Federal and state fair lending laws and regulations, such as the Equal Credit Opportunity Act and the Fair Housing Act, impose nondiscriminatory lending requirements on financial institutions. The Department of Justice, CFPB and other federal and state agencies are responsible for enforcing these laws and regulations. Private parties may also have the ability to challenge an institution's performance under fair lending laws in private class action litigation. A successful challenge to our performance under the fair lending laws and regulations could adversely impact our rating under the CRA and result in a wide variety of sanctions including the required payment of damages and civil money penalties, injunctive relief, imposition of restrictions on merger and acquisition activity and restrictions on expansion activity, any of which could negatively impact our reputation, business, financial condition and/or results of operations.
The Federal Reserve may require us to commit capital resources to support the Bank.
The Federal Reserve requires a bank holding company to act as a source of financial and managerial strength to a subsidiary bank and to commit resources to support such subsidiary bank. Under the “source of strength” doctrine, the Federal Reserve may require a bank holding company to make capital injections into a troubled subsidiary bank and may charge the bank holding company with engaging in unsafe and unsound practices for failure to commit resources to such a subsidiary bank. In addition, the Dodd-Frank Act directs the federal bank regulators to require that all companies that directly or indirectly control an insured depository institution serve as a source of strength for the institution. Under these requirements, in the future, we could be required to provide financial assistance to our Bank if the Bank experiences financial distress.
A capital injection may be required at times when we do not have the resources to provide it, and, therefore, we may be required to borrow funds. In the event of a bank holding company's bankruptcy, the bankruptcy trustee will assume any commitment by the holding company to a federal bank regulatory agency to maintain the capital of a subsidiary bank. Moreover, bankruptcy law provides that claims based on any such commitment will be entitled to a priority of payment over the claims of the holding company's general unsecured creditors including the holders of its note obligations. Thus, any borrowing that must be done by the holding company in order to make the required capital injection becomes more difficult and expensive and would adversely impact the holding company's prospects, financial condition, results of operations and cash flows.
Deteriorating sovereign debt conditions, including in theU.S., could negatively impact our business, financial condition and results of operations.
Recent U.S. debt ceiling and budget deficit concerns, coupled with signs of deteriorating sovereign debt conditions in Europe, have increased the possibility of additional credit rating downgrades and economic slowdowns in the U.S. Although U.S. lawmakers passed legislation to raise the federal debt ceiling in 2011, Standard & Poor's Ratings Services lowered its long-term sovereign credit rating on the U.S. from AAA to AA+ in August 2011. The impact of any further downgrades to the U.S. government's sovereign credit rating or its perceived creditworthiness could adversely impact the U.S. and global financial markets and economic conditions. The U.S. government has adopted legislation to suspend the debt limit numerous times since January 2013. Currently, the debt ceiling is suspended without conditions through March 15, 2015. Moody's and Fitch have each warned that they may downgrade the U.S. government's rating if the federal debt is not stabilized. A downgrade of the U.S. government's credit rating or a default by the U.S. government to satisfy its debt obligations likely would create broader financial turmoil and uncertainty, which would weigh heavily on the global banking system. It is possible that any such impact could have a material adverse impact on our business, financial condition and results of operations.
If we grow in the future or incur additional credit losses, we may need to raise additional capital, but that capital may not be available when it is needed.
We are required by regulatory authorities to maintain adequate levels of capital to support our operations. If we grow in the future or incur additional credit losses, we may need to raise additional capital. Our ability to raise additional capital, if needed, will depend, in part, on conditions in the capital markets at that time, which are outside of our control. Accordingly, we cannot be assured of our ability to raise additional capital, if needed, on terms acceptable to us. If we cannot raise additional capital on acceptable terms when needed, our ability to expand our operations through internal growth and acquisitions could be materially impaired. In addition, if we decide to raise additional equity capital, existing shareholder interests could be diluted.
We may evaluate, and potentially consummate, strategic transactions, which could require significant management attention, disrupt our business, and adversely affect our financial results.
As part of our business strategy, we may, from time to time, seek out or be presented with opportunities to engage in a capital raising transaction or transactions, or to acquire or be acquired by, or merge with, another bank or other third party. Such strategic transactions may also create uncertainty for our teammates, clients and business partners. Any such uncertainty could make it more difficult for us to retain key teammates and hire new talent, and could cause our clients and business partners to not enter into new arrangements with us or to terminate existing arrangements which could be material to our financial condition and results of operations. Additionally, management and our board of directors could be subject to future lawsuits related to strategic transactions. Any such future lawsuits could become time consuming and expensive.
We rely on network and information systems and other technologies, and, as a result, we are subject to various cybersecurity risks.
Cybersecurity refers to the combination of technologies, processes and procedures established to protect information technology systems and data from unauthorized access, attack or damage. Our business involves the storage and transmission of clients’ personal information. While we have internal policies and procedures designed to prevent or limit the effect of a failure, interruption or security breach of our information systems, as well as contracts and service agreements with applicable outside vendors, we cannot be assured that any such failures, interruptions or security breaches will not occur or, if they do, that they will be addressed adequately. Unauthorized disclosure of sensitive or confidential client information, whether through a breach of our computer systems or otherwise, could severely harm our business. Although we have implemented measures to prevent security breaches, cyber incidents and other security threats, our facilities and systems, and those of third party service providers, may be vulnerable to security breaches, acts of vandalism, computer viruses, misplaced or lost data, programming and/or human error, or other similar events that could have a material adverse impact on our business. Furthermore, the storage and transmission of such data is regulated at the federal and state level. Privacy information security laws and regulation changes, and compliance therewith, may result in cost increases due to system changes and the development of new administrative processes. If we fail to comply with applicable laws and regulations or experience a data security breach involving the misappropriation, loss or other unauthorized disclosure of confidential information, whether by us or our vendors, our reputation could be damaged, possibly resulting in lost future business, and we could be subject to fines, penalties, administrative orders and other legal risks as a result of a breach or non-compliance.
Our controls and procedures may fail or be circumvented, which could have a material adverseimpact on our business, financial condition andresults of operations.
We regularly review and update our internal controls, disclosure controls and procedures and corporate governance policies and procedures. Any system of controls, however well designed and operated, is based in part on certain assumptions and can provide only reasonable, not absolute, assurances that the objectives of the system are met. Any failure or circumvention of our controls and procedures or failure to comply with regulations related to controls and procedures could have a material adverse impact on our business, financial condition and results of operations.
If our deferred tax asset is impaired in the future, our earnings and capital position may be adversely impacted.
Deferred income tax represents the tax impact of the differences between the book and tax bases of assets and liabilities. Deferred tax assets are assessed periodically by us to determine if they are realizable. Factors used in this assessment include our ability to carryback or carryforward net operating losses, the performance of the business including our ability to generate taxable income from a variety of sources and the impact of tax planning strategies. If, based on available information, it is more likely than not that the deferred income tax asset will not be realized, a valuation allowance against the deferred tax asset must be established with a corresponding charge to income tax expense.
The Private Placement was considered a change in control under the Internal Revenue Code and Regulations. Accordingly, the Company was required to evaluate potential limitation or deferral of our ability to carryforward pre-acquisition net operating losses and to determine the amount of net unrealized pre-acquisition built-in losses that also are subject to similar limitation or deferral. Under the Internal Revenue Code and Regulations, net unrealized pre-acquisition built-in losses realized within five years of the change in control on October 7, 2010 are subject to potential limitation. Through that date, we will continue to analyze our ability to utilize such losses to offset anticipated future taxable income as pre-acquisition built-in losses are ultimately realized.
Analysis of our ability to realize deferred tax assets requires us to apply significant judgment and is inherently subjective because the future occurrence of events and circumstances cannot be predicted with certainty. The net operating losses and realized built-in losses generated in 2010, 2011 and 2012 may be carried forward for income tax purposes up to 20 years. Thus, to the extent we generate sufficient taxable income in the future, we may be able to utilize the net operating losses and realized built-in losses for income tax purposes. The determination of how much of the net operating losses and realized built-in losses we expect to ultimately utilize, and the resulting recognition of these tax benefits in the Consolidated Balance Sheets, is based on sustained trends in our profitability and the projected utilization of deferred tax assets.
We are party to various lawsuits incidental to our business. Litigation is subject to many uncertainties such that the expenses and ultimate exposure with respect to many of these matters cannot be ascertained.
From time to time, clients and others make claims and take legal action pertaining to our performance of fiduciary responsibilities. Whether client claims and other legal actions are legitimate or unfounded, if such claims and legal actions are not resolved in our favor, they may result in significant financial liability and/or adversely impact the market perception of us and our products and services as well as impact customer demand for those products and services. Any financial liability or reputation damage could have a material adverse impact on our business, which, in turn, could have a material adverse impact on our financial condition and results of operations.
Our ability to pay dividends on our common stockcould berestricted.
The Federal Reserve has issued a policy statement regarding the payment of dividends by bank holding companies. In general, the Federal Reserve’s policies provide that dividends should be paid only out of current earnings and only if the prospective rate of earnings retention by the bank holding company appears consistent with the organization’s capital needs, asset quality and overall financial condition. The Federal Reserve’s policies also require that a bank holding company serve as a source of financial strength to its subsidiary banks by standing ready to use available resources to provide adequate capital funds to those banks during periods of financial stress or adversity and by maintaining the financial flexibility and capital-raising capacity to obtain additional resources for assisting its subsidiary banks when necessary. Under the prompt corrective action regulations, the ability of a bank holding company to pay dividends may be restricted if a subsidiary bank becomes undercapitalized. These regulatory policies could impact our ability to pay dividends or otherwise engage in capital distributions.
Since the Company is a legal entity separate and distinct from the Bank and does not conduct stand-alone operations, its ability to pay dividends depends on the ability of the Bank to pay dividends to it. As a South Carolina chartered bank, the Bank is subject to limitations on the amount of dividends that it is permitted to pay. Unless otherwise instructed by the State Board or the Commissioner of Banking, the Bank is generally permitted under South Carolina state banking regulations to pay cash dividends of up to 100% of net income in any calendar year without obtaining the prior approval of the State Board.
In addition, under Federal Reserve regulations, a dividend cannot be paid by the Bank if it would be less than well-capitalized after the dividend. The Federal Reserve may also prevent the payment of a dividend by the Bank if it determines that the payment would be an unsafe and unsound banking practice.
We may issue additional shares of common or preferred stock, which may dilute the interests of our shareholders and may adversely impact the marketprice of our common stock.
We are currently authorized to issue up to 75,000,000 shares of common stock, of which 12,814,574 shares were outstanding as of February 23, 2015, and up to 2,500,000 shares of preferred stock, none of which were outstanding as of February 23, 2015. In addition, in 2014, we filed a shelf registration statement on Form S-3 with the SEC to provide capacity and flexibility for the Company’s possible future funding needs. The registration statement allows the Company to issue a variety of registered debt and/or equity securities of up to $50 million; however there are currently no plans to access such funding. We may need to obtain additional debt or equity financing in the future to strengthen our capital position or to make strategic acquisitions or investments. If we determine, for any reason, that we need to raise capital, our Board of Directors generally has the authority, without action by or vote of the shareholders, to issue all or part of any authorized but unissued shares of stock for any corporate purpose including issuance of equity-based incentives under our equity compensation plans, subject to applicable NASDAQ Capital Market (“NASDAQ”) rules. Additionally, we are not restricted from issuing additional common stock or preferred stock including any securities that are convertible into or exchangeable for, or that represent the right to receive, common stock or preferred stock or any substantially similar securities. Any issuance of additional shares of common stock or preferred stock will dilute the percentage ownership interest of our shareholders and may dilute the book value per share of our common stock.
Our stock price may be volatile, which could result in losses to our investors and litigation against us.
Our stock price may be volatile and several factors could cause the price to fluctuate substantially in the future. These factors include, but are not limited to:
| | ● | Actual or anticipated variations in earnings, |
| | ● | Initiation of coverage by analysts and their resulting recommendations or projections, |
| | ● | Our announcement of developments related to our businesses, |
| | ● | Potential or consummated corporate transactions, including mergers and acquisitions and securities offerings, |
| | ● | Operations and stock performance of other financial institutions, |
| | ● | New technology used or services offered by traditional and nontraditional competitors, |
| | ● | News reports of trends, concerns or irrational exuberance on the part of investors, |
| | ● | Changes in economic conditions, |
| | ● | General equity market conditions, |
| | ● | Continued listing on the NASDAQ and inclusion in the Russell 2000(R) Index, and/or |
| | ● | Other issues related to the financial services industry. |
Our stock price may fluctuate significantly in the future, and these fluctuations may be unrelated to our performance. General market declines or market volatility in the future, especially in the financial institutions sector, could adversely impact the price of our common stock, and the current market price may not be indicative of future market prices.
Stock price volatility may make it more difficult for our investors to sell their common stock when they desire and at prices they find attractive. Moreover, in the past, securities class action lawsuits have been instituted against some companies following periods of volatility in the market price of their securities. We could, in the future, be the target of similar litigation. Securities litigation could result in substantial costs and divert management’s attention and resources from normal business.
The price of our common stock may fluctuate significantly, and this may make it difficult for shareholders to resell our common stock at times or at prices they find attractive.
Although our common stock is listed on the NASDAQ, our stock price constantly changes, and we expect our stock price to continue to fluctuate in the future. Our stock price is impacted by a variety of factors, some of which are beyond our control. These factors include:
| | ● | Variations in our operating results or the quality of our assets, |
| | ● | Operating results that vary from the expectations of management, securities analysts and investors, |
| | ● | Increase in loan losses, nonperforming loans and foreclosed real estate, |
| | ● | Changes in expectations as to our future financial performance, |
| | ● | Announcements of new products, strategic developments, acquisitions and other material events by us or our competitors, |
| | ● | The operating and securities price performance of other companies that investors believe are comparable to us, |
| | ● | Our common stock listed on the small-cap Russell 2000® Index and the possibility that our common stock is removed from the Index, |
| | ● | Actual or anticipated sales of our equity or equity-related securities, |
| | ● | Our past and future dividend practice, |
| | ● | The credit, mortgage and housing markets, the markets for securities relating to mortgages or housing, |
| | ● | Developments with respect to financial institutions generally and |
| | ● | Economic, financial, geopolitical, regulatory, congressional or judicial events that impact us or the financial markets. |
In addition, the stock market in general has recently experienced price and volume fluctuations. This volatility has had a significant impact on the market price of securities issued by many companies and particularly those in the financial services and banking sector including for reasons unrelated to their operating performance. These broad market fluctuations may adversely impact our stock price, notwithstanding our operating results.
Future sales of our stock by our shareholders, or the perception that those sales could occur, may cause our stock price to decline.
Although our common stock is listed for trading on the NASDAQ, the trading volume in our common stock is generally lower than that of other financial services companies of equal or greater size. A public trading market having the desired characteristics of depth, liquidity and orderliness depends on the presence in the marketplace of willing buyers and sellers at any given time. This presence depends on the individual decisions of investors and general economic and market conditions over which we have no control. The relatively low trading volume of our common stock, significant sales of our common stock in the public market or the perception that those sales may occur could cause the trading price of our common stock to fluctuate or decline or to be lower than it otherwise might be in the absence of those sales or perceptions.
Our common stock isownedby one or morelargershareholders whose interests may conflict with those of our other shareholders.
CapGen Financial Partners (“CapGen”) and its affiliates and Patriot Financial Partners (“Patriot”) and its affiliates own approximately 44.7% and 19.1%, respectively, of our outstanding shares of common stock as of February 23, 2015. As a result, CapGen and Patriot are able, individually and collectively, to exercise significant influence on our business as shareholders including influence over election of our Board of Directors and the authorization of other corporate actions requiring shareholder approval. In deciding on how to vote on certain proposals, our shareholders should be aware that CapGen and Patriot may have interests that are different from, or in addition to, the interests of our other shareholders.
A holder with as little as a 5% interest in our Company could, under certain circumstances, be subject to regulation as a “bank holding company” and possibly other restrictions.
Any entity (including a “group” composed of natural persons) owning 25% or more of our outstanding common stock, or 5% or more if such holder otherwise exercises a “controlling influence” over us, may be subject to regulation as a bank holding company in accordance with the BHCA. In addition any bank holding company or foreign bank with a U.S. presence may be required to obtain the approval of the Federal Reserve under the BHCA to acquire or retain 5% or more of our outstanding common stock and any person other than a bank holding company may be required to obtain regulatory approval under the Change in Bank Control Act of 1978 to acquire or retain 10% or more of our outstanding common stock.
Becoming a bank holding company imposes certain statutory and regulatory restrictions and burdens and might require the holder to divest all or a portion of the holder’s investment in our common stock. In addition, because a bank holding company is required to provide managerial and financial strength for its bank subsidiary, such a holder may be required to divest investments that may be deemed incompatible with bank holding company status such as a material investment in a company unrelated to banking. Further, subject to an FDIC policy statement published in August 2009, under certain circumstances, holders of 5% or more of our securities could be required to be subject to certain restrictions such as an inability to sell or trade their securities for a period of three years, among other restrictions, in order for us to participate in an FDIC-assisted transaction of a failed bank. Given their ownership percentage of our common stock, CapGen is deemed by the Federal Reserve to be the top-tier bank holding company for the Company.
ITEM 1B.UNRESOLVED STAFF COMMENTS
None.
ITEM 2.PROPERTIES
On an ongoing basis, we evaluate the suitability and adequacy of all of our properties and have active programs of remodeling, consolidating or closing properties, as necessary, to maintain efficient and attractive facilities. We believe that all of our properties are suitable and adequate for their intended purposes.
Our principal executive offices consist of approximately 37,465 square feet of leased space at 306 East North Street, Greenville, South Carolina. We own an approximately 50,000 square feet operations center in Laurens, South Carolina where a substantial portion of our back-office operations are conducted. The Bank is primarily engaged in the business of commercial and retail banking through our 25 branches in the Upstate, of which five are leased and 20 are owned.
ITEM 3. LEGAL PROCEEDINGS
We are a party to claims and lawsuits arising in the course of normal business activities. Management is not aware of any material pending legal proceedings against the Company which, if resolved adversely, would have a material adverse impact on the Company’s financial position, results of operations or cash flows.
ITEM 4.MINE SAFETY DISCLOSURES
Not applicable.
PART II
ITEM 5.MARKET FOR REGISTRANT’S COMMON EQUITY, RELATED SHAREHOLDER MATTERS ANDISSUER PURCHASES OF EQUITY SECURITIES
Common Stock Market Prices
The following table summarizes the traded prices of our common stock as reported by the NASDAQ and dividend information for the periods indicated.
| | | High | | | Low | | | Cash dividend declaredper common share | |
2014 | | | | | | | | | | | | |
First quarter | | $ | 14.52 | | | $ | 11.92 | | | $ | - | |
Second quarter | | | 14.78 | | | | 13.27 | | | | - | |
Third quarter | | | 14.70 | | | | 12.69 | | | | 0.05 | |
Fourth quarter | | | 18.77 | | | | 14.02 | | | | 0.05 | |
| | | | | | | | | | | | | |
2013 | | | | | | | | | | | | |
First quarter | | $ | 11.80 | | | $ | 8.10 | | | $ | - | |
Second quarter | | | 15.95 | | | | 11.74 | | | | - | |
Third quarter | | | 13.85 | | | | 11.43 | | | | - | |
Fourth quarter | | | 13.71 | | | | 11.63 | | | | - | |
As of February 23, 2015, there were 12,814,574 shares of our common stock outstanding held in approximately 1,356 registered accounts as reported to us by our transfer agent.
Dividends
During the year ended December 31, 2014, the Company declared cash dividends on its common stock as follows:
Declaration date | | Record date | | Payment date | | Cash dividend per common share | |
7/17/2014 | | 8/4/2014 | | 8/18/2014 | | $ | 0.05 | |
10/16/2014 | | 11/3/2014 | | 11/17/2014 | | | 0.05 | |
Subsequently, on January 15, 2015, the Company declared a dividend of $0.08 per common share payable on February 16, 2015 to shareholders of record on February 2, 2015.
The dividends payable to shareholders were funded by dividends paid to the Company by the Bank. Neither the Company nor the Bank declared or paid dividends in 2013.
Equity-Based Compensation Plan Information
The following table summarizes information regarding equity-based compensation awards outstanding and available for future grants at December 31, 2014.
| | | Number of securities to be issued upon exercise of outstanding options, warrants and rights | | | Weighted average exercise price of outstanding options, warrants and rights | | | Number of securities remaining available for future issuances under equity compensation plans (excluding securities reflected in column (a)) | |
| | | (a) | | | (b) | | | (c) | |
Equity-based compensation plans approved by shareholders | | | | | | | | | | | | |
1997 Stock Compensation Plan | | | 2,950 | | | $ | 109.80 | | | | - | |
2008 Restricted Stock Plan | | | - | | | | - | | | | 114 | |
2011 Stock Incentive Plan | | | 402,001 | | | | 10.90 | | | | 154,016 | |
Equity-based compensation plans not approved by shareholders | | | - | | | | - | | | | - | |
| | | | | | | | | | | | | |
Total equity-based compensation plans | | | 404,951 | | | $ | 11.62 | | | | 154,130 | |
For disclosure regarding matters related to our equity-based compensation, see Item 8. Financial Statements and Supplementary Data, Note 1, Summary of Significant Accounting Policies and Note 16, Equity-Based Compensation.
Total Shareholder Return
The following graph summarizes the performance of our common stock for the five-year period ended December 31, 2014 as compared to the Standard & Poor’s 500 Index (“S&P 500”) and the SNL U.S. $1B - $5B Bank Index. The graph assumes that $100 was originally invested on December 31, 2009 and that all subsequent dividends were reinvested in additional shares. The performance graph represents past performance and should not be considered to be an indication of future performance.
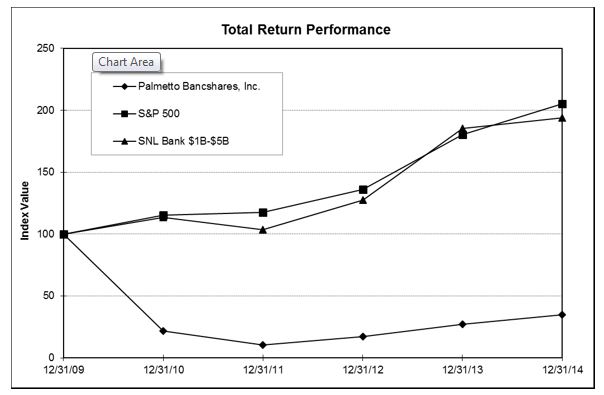
The following table summarizes the cumulative total return for the Company, the S&P 500and the SNL U.S. Bank $1B - $5B Index at the dates indicated.
| | | December 31, | |
Index | | 2009 | | | 2010 | | | 2011 | | | 2012 | | | 2013 | | | 2014 | |
Palmetto Bancshares, Inc. | | $ | 100.00 | | | $ | 21.67 | | | $ | 10.65 | | | $ | 17.35 | | | $ | 27.00 | | | $ | 35.03 | |
S&P 500 | | | 100.00 | | | | 115.06 | | | | 117.49 | | | | 136.30 | | | | 180.44 | | | | 205.14 | |
SNL U.S. Bank $1B-$5B | | | 100.00 | | | | 113.35 | | | | 103.38 | | | | 127.47 | | | | 185.36 | | | | 193.81 | |
ITEM 6.SELECTED FINANCIAL DATA
The following selected financial data should be read in conjunction with Item 7. Management’s Discussion and Analysis of Financial Condition and Results of Operations and Item 8. Financial Statements and Supplementary Data (dollars in thousands, except per share data).
| | | At and for the years ended December 31, | |
| | | 2014 | | | 2013 | | | 2012 | | | 2011 | | | 2010 | |
STATEMENTS OF INCOME | | | | | | | | | | | | | | | | | | | | |
Interest income | | $ | 39,650 | | | $ | 42,538 | | | $ | 45,390 | | | $ | 51,818 | | | $ | 55,567 | |
Interest expense | | | 523 | | | | 2,260 | | | | 5,138 | | | | 9,426 | | | | 15,366 | |
Net interest income | | | 39,127 | | | | 40,278 | | | | 40,252 | | | | 42,392 | | | | 40,201 | |
Provision for loan losses | | | (2,300 | ) | | | 3,465 | | | | 13,075 | | | | 20,500 | | | | 47,100 | |
Net interest income (loss) after provision for loan losses | | | 41,427 | | | | 36,813 | | | | 27,177 | | | | 21,892 | | | | (6,899 | ) |
Noninterest income | | | 13,538 | | | | 14,836 | | | | 27,030 | | | | 15,426 | | | | 16,867 | |
Noninterest expense | | | 40,141 | | | | 42,333 | | | | 53,350 | | | | 63,382 | | | | 71,512 | |
Net income (loss) before provision (benefit) for income taxes | | | 14,824 | | | | 9,316 | | | | 857 | | | | (26,064 | ) | | | (61,544 | ) |
Provision (benefit) for income taxes | | | 5,469 | | | | (18,415 | ) | | | 2,721 | | | | (2,664 | ) | | | (1,342 | ) |
Net income (loss) | | $ | 9,355 | | | $ | 27,731 | | | $ | (1,864 | ) | | $ | (23,400 | ) | | $ | (60,202 | ) |
| | | | | | | | | | | | | | | | | | | | | |
| | | | | | | | | | | | | | | | | | | | | |
COMMON AND PER SHARE DATA | | | | | | | | | | | | | | | | | | | | |
Net income (loss) per common share: | | | | | | | | | | | | | | | | | | | | |
Basic | | $ | 0.73 | | | $ | 2.17 | | | $ | (0.15 | ) | | $ | (1.86 | ) | | $ | (15.13 | ) |
Diluted | | | 0.73 | | | | 2.17 | | | | (0.15 | ) | | | (1.86 | ) | | | (15.13 | ) |
Cash dividends declared per common share | | | 0.10 | | | | - | | | | - | | | | - | | | | - | |
Book value per common share | | | 10.39 | | | | 9.68 | | | | 7.71 | | | | 8.13 | | | | 9.61 | |
Outstanding common shares | | | 12,810,388 | | | | 12,784,605 | | | | 12,754,045 | | | | 12,726,388 | | | | 11,852,599 | |
Weighted average basic common shares | | | 12,696,777 | | | | 12,658,752 | | | | 12,639,379 | | | | 12,555,247 | | | | 3,978,250 | |
Weighted average diluted common shares | | | 12,761,885 | | | | 12,658,752 | | | | 12,639,379 | | | | 12,555,247 | | | | 3,978,250 | |
Dividend payout ratio | | | 13.67 | % | | | n/a | % | | | n/a | % | | | n/a | % | | | n/a | % |
| | | | | | | | | | | | | | | | | | | | | |
| | | | | | | | | | | | | | | | | | | | | |
PERIOD-END BALANCES | | | | | | | | | | | | | | | | | | | | |
Total assets | | $ | 1,118,811 | | | $ | 1,090,229 | | | $ | 1,145,456 | | | $ | 1,203,152 | | | $ | 1,355,247 | |
Investment securities available for sale, at fair value | | | 211,511 | | | | 214,383 | | | | 264,502 | | | | 260,992 | | | | 218,755 | |
Total loans, including loans held for sale | | | 806,184 | | | | 769,235 | | | | 745,172 | | | | 791,384 | | | | 864,376 | |
Deposits and retail repurchase agreements | | | 944,241 | | | | 925,535 | | | | 1,038,599 | | | | 1,088,039 | | | | 1,194,082 | |
Federal Home Loan Bank advances | | | 35,000 | | | | 35,000 | | | | - | | | | - | | | | 35,000 | |
Shareholders' equity | | | 133,044 | | | | 123,817 | | | | 98,380 | | | | 103,482 | | | | 113,899 | |
| | | | | | | | | | | | | | | | | | | | | |
| | | | | | | | | | | | | | | | | | | | | |
AVERAGE BALANCES | | | | | | | | | | | | | | | | | | | | |
Total assets | | $ | 1,096,282 | | | $ | 1,095,363 | | | $ | 1,174,974 | | | $ | 1,286,148 | | | $ | 1,399,592 | |
Interest-earning assets | | | 1,028,853 | | | | 1,047,513 | | | | 1,122,935 | | | | 1,240,264 | | | | 1,325,651 | |
Investment securities available for sale, at fair value | | | 210,748 | | | | 248,698 | | | | 269,237 | | | | 265,451 | | | | 135,379 | |
Total loans, including loans held for sale | | | 761,515 | | | | 749,138 | | | | 758,207 | | | | 826,091 | | | | 967,882 | |
Deposits and retail repurchase agreements | | | 949,372 | | | | 979,911 | | | | 1,064,245 | | | | 1,160,197 | | | | 1,204,835 | |
Federal Home Loan Bank advances | | | 12,205 | | | | 425 | | | | 1 | | | | 2,027 | | | | 95,231 | |
Other borrowings | | | 16 | | | | 159 | | | | 30 | | | | 11 | | | | 1 | |
Shareholders' equity | | | 129,572 | | | | 106,408 | | | | 100,018 | | | | 113,147 | | | | 87,463 | |
| | | | | | | | | | | | | | | | | | | | | |
| | | | | | | | | | | | | | | | | | | | | |
SELECT PERFORMANCE RATIOS | | | | | | | | | | | | | | | | | | | | |
Return on average assets | | | 0.85 | % | | | 2.53 | % | | | (0.16 | )% | | | (1.82 | )% | | | (4.30 | )% |
Return on average shareholders' equity | | | 7.22 | | | | 26.06 | | | | (1.86 | ) | | | (20.68 | ) | | | (68.83 | ) |
Net interest margin | | | 3.80 | | | | 3.85 | | | | 3.58 | | | | 3.42 | | | | 3.03 | |
| | | | | | | | | | | | | | | | | | | | | |
| | | | | | | | | | | | | | | | | | | | | |
CAPITAL RATIOS | | | | | | | | | | | | | | | | | | | | |
Average shareholders' equity as a percentage of average assets | | | 11.82 | % | | | 9.71 | % | | | 8.51 | % | | | 8.80 | % | | | 6.25 | % |
Shareholders' equity as a percentage of assets | | | 11.89 | | | | 11.36 | | | | 8.59 | | | | 8.60 | | | | 8.40 | |
Tier 1 risk-based capital | | | 15.00 | | | | 14.24 | | | | 13.16 | | | | 12.22 | | | | 13.16 | |
Total risk-based capital | | | 16.26 | | | | 15.49 | | | | 14.42 | | | | 13.49 | | | | 14.43 | |
Tier 1 leverage | | | 12.15 | | | | 11.03 | | | | 9.18 | | | | 8.59 | | | | 8.22 | |
| | | | | | | | | | | | | | | | | | | | | |
| | | | | | | | | | | | | | | | | | | | | |
ASSET QUALITY INFORMATION | | | | | | | | | | | | | | | | | | | | |
Allowance for loan losses | | $ | 12,920 | | | $ | 16,485 | | | $ | 17,825 | | | $ | 25,596 | | | $ | 26,934 | |
Nonaccrual loans | | | 12,463 | | | | 15,108 | | | | 15,848 | | | | 53,028 | | | | 91,405 | |
Nonperforming assets | | | 18,447 | | | | 22,653 | | | | 26,840 | | | | 80,852 | | | | 111,492 | |
Loans 90 days past due and still accruing interest | | | 238 | | | | - | | | | - | | | | - | | | | 68 | |
Net loans charged-off | | | 1,265 | | | | 4,805 | | | | 20,846 | | | | 21,838 | | | | 41,435 | |
Allowance for loan losses as a percentage of gross loans | | | 1.60 | % | | | 2.15 | % | | | 2.41 | % | | | 3.31 | % | | | 3.39 | % |
Nonaccrual loans and loans 90 days past due and still accruing interest as a percentage of gross loans | | | 1.58 | | | | 1.97 | | | | 2.14 | | | | 6.73 | | | | 10.64 | |
Nonperforming assets and loans 90 days past due and still accruing interest as a percentage of total assets | | | 1.67 | | | | 2.08 | | | | 2.34 | | | | 6.72 | | | | 8.23 | |
Net loans charged-off as a percentage of average gross loans | | | 0.17 | | | | 0.64 | | | | 2.80 | | | | 2.82 | | | | 4.39 | |
| | | | | | | | | | | | | | | | | | | | | |
| | | | | | | | | | | | | | | | | | | | | |
OTHER DATA | | | | | | | | | | | | | | | | | | | | |
Number of full-service branches | | | 25 | | | | 25 | | | | 25 | | | | 29 | | | | 29 | |
Number of full-time equivalent teammates | | | 285.8 | | | | 301.5 | | | | 322.5 | | | | 351.5 | | | | 393.5 | |
ITEM 7. MANAGEMENT’S DISCUSSION AND ANALYSIS OF FINANCIAL CONDITION AND RESULTS OF OPERATIONS
The following discussion and analysis addresses important factors impacting the financial condition and results of operations of the Company for the periods indicated. This discussion should be read in conjunction with, and is intended to supplement, all of the other Items presented in this Annual Report on Form 10-K.
Palmetto Bancshares, Inc. is a South Carolina bank holding company organized in 1982 and headquartered in Greenville, South Carolina. The Company serves as the bank holding company for The Palmetto Bank, which began operations in 1906. Given our 108-year history, we have developed long-standing relationships with clients in the communities in which we operate and a recognizable name, which has resulted in a well-established deposit network and loyal client base.
Critical Accounting Policies and Estimates
General
The Company’s accounting and financial reporting policies are in conformity, in all material respects, with accounting principles generally accepted in the United States of America (“GAAP”) and with general practices within the financial services industry. The preparation of financial statements in conformity with such principles requires management to make complex judgments to estimate the values of assets and liabilities. We have procedures and processes in place to facilitate making these judgments.
The more judgmental estimates are summarized in the following discussion. We have identified and described the variables most important in the estimation processes that involve mathematical models to derive the estimates. In many cases, there are numerous alternative judgments that could be used in the process of determining the inputs to the models. Where alternatives exist, we have used the factors that we believe represent the most reasonable value in developing the inputs. Actual performance that differs from our estimates of the key variables could impact our results of operations. These fluctuations would not be indicative of deficiencies in our models or inputs.
Management, in conjunction with the Company’s independent registered public accounting firm, discusses the development and selection of the critical accounting policies and estimates with the Audit Committee of our Board of Directors on an annual basis. Of those significant accounting policies, we determined that accounting for our allowance for loan losses and the related reserve for unfunded commitments, servicing rights, foreclosed real estate, net deferred tax asset, defined benefit pension plan and fair value measurements are critical. The determination of the carrying amounts for all of these items involves considerable subjective judgment and estimation by management.
Allowance for Loan Losses
The allowance for loan losses is a reserve established through a provision for loan losses charged to expense. The allowance for loan losses represents our best estimate of probable inherent losses that have been incurred within the existing loan portfolio. Our allowance for loan losses methodology is based on historical loss experience by loan type, specific homogeneous risk pools and specific loss allocations. Our process for determining the appropriate level of the allowance for loan losses is designed to account for changes in loan quality as it occurs. The provision for loan losses reflects loan quality trends including the levels of and trends related to concentrations of credit risk, nonaccrual loans, potential problem loans, criticized loans, collateral values and loans charged-off or recovered, among other factors.
The level of the allowance for loan losses reflects our continuing evaluation of specific lending risks, loan loss experience, current loan portfolio quality, present economic, political, and regulatory conditions and unidentified losses inherent in the current loan portfolio. Portions of the allowance for loan losses may be allocated for specific loans. However, the entire allowance for loan losses is available for any loan that, in our judgment, should be charged-off. The determination of the appropriate level of the allowance for loan losses inherently involves a high degree of subjectivity and requires us to make significant estimates of current credit risks and future trends, all of which may undergo material changes. While we utilize our best judgment and information available, the ultimate adequacy of the allowance for loan losses is dependent upon a variety of factors, many of which are beyond our control, including the performance of our loan portfolio, the economy, changes in interest rates and the view of the regulatory authorities toward loan classifications and collateral valuation.
The starting point for the general component of the allowance is the historical loss experience of specific types of loans. We calculate historical loss ratios for pools of similar loans with similar characteristics based on the proportion of actual net loan charge-offs to the total population of loans in the pool. We use a five-year look-back period when computing historical loss rates. However, given the increase in loan charge-offs from 2009 to 2013, since then we have also utilized a three-year look-back period for computing historical loss rates as an additional point of reference in determining the allowance for loan losses.
We increase or decrease these historical loss percentages for qualitative environmental factors derived from macroeconomic indicators and other factors. Qualitative factors we considered in the determination of the allowance for loan losses include pervasive factors that generally impact clients across the loan portfolio (such as unemployment and the consumer price index) and factors that have specific implications to particular loan portfolios (such as residential home sales or commercial development). Factors evaluated may include, without limitation:
| | ● | Changes in delinquent, nonaccrual and troubled debt restructured loan trends, |
| | ● | Trends in risk ratings and net loans charged-off, |
| | ● | Concentrations of credit, |
| | ● | Legal and regulatory requirements, |
| | ● | Trends in the nature and volume of the loan portfolio, |
| | ● | National and local economic and business conditions, |
| | ● | The experience and depth of lending management, |
| | ● | Credit-related training, |
| | ● | Lending policies and procedures, |
| | ● | Underwriting standards and practices, |
| | ● | The quality of loan review systems and the degree of oversight by the Board of Directors, |
We record allowances for loan losses on specific loans when, based on current information and events, it is probable that we will be unable to collect all amounts due according to the contractual terms of the loan. Specific allowances for loans considered individually significant and that exhibit probable or observed weaknesses are determined by analyzing, among other things, the borrower’s ability to repay amounts owed, guarantor support, collateral deficiencies, the relative risk rating of the loan and economic conditions impacting the client’s industry.
Each impaired loan is individually reviewed to determine whether the impairment should be recorded as a charge-off or a specific allowance based on our assessment of the status of the borrower and the underlying collateral. In general, for collateral-dependent loans, the impairment is recorded as a charge-off unless the fair value of the collateral was based on an internal valuation pending receipt of a third-party appraisal or other extenuating circumstances. Consumer loan accounts are generally charged-off based on predefined past due time periods.
In addition to our loan portfolio review process, as part of their examination process, various regulatory agencies periodically review our allowance for loan losses methodology and calculation. Such agencies may require us to recognize additions to the allowance for loan losses based on their judgments and information available to them at the time of their examination. While we use available information to recognize inherent losses on loans, future adjustments to the allowance for loan losses may be necessary based on changes in economic and other factors and the impact that such factors have on our clients.
The general reserve portion of the allowance for loan losses is determined using the historical loss rates and qualitative factors, the total of which is combined with the specific allowance on loans individually evaluated for impairment to determine the total allowance for loan losses.
We believe that the allowance for loan losses is adequate to cover probable inherent losses in the loan portfolio. However, underlying assumptions may be impacted in future periods by changes in economic conditions, the impact of regulatory examinations and the discovery of information with respect to borrowers that was not known by management at the time of the issuance of our Consolidated Financial Statements. Therefore, our underlying assumptions may or may not prove valid, and there can be no assurance that loan losses in future periods will not exceed the current allowance for loan losses or that future increases in the allowance for loan losses will not be required. Additionally, no assurance can be given that our ongoing evaluation of the loan portfolio, in light of changing economic conditions and other relevant factors, will not require significant future additions to the allowance for loan losses thus adversely impacting the Company’s business, financial condition, results of operations and cash flows.
Servicing Rights
The value of our residential mortgage and SBA loan servicing rights (collectively referred to as “servicing rights”) is an accounting estimate that depends heavily on current economic conditions (specifically the interest-rate environment and management's judgments about servicing costs), loan loss experience and prepayment rates.
For servicing rights, we utilize the expertise of third-party specialists on a quarterly basis to determine, among other things, capitalization, impairment and amortization rates. Estimates of the amount and timing of prepayment rates, loan loss experience, costs to service loans and discount rates are evaluated by the third-party specialists, reviewed and approved by us and then used to estimate the fair value of our servicing rights portfolio. Amortization of the servicing rights portfolio is based on the ratio of net servicing income received in the current period to total net servicing income projected to be realized from the servicing rights portfolio. Projected net servicing income is determined based on the estimated future balance of the underlying loan portfolio, which declines over time from prepayments and scheduled loan amortization. Expected prepayment rates are estimated based on current interest-rate levels, other economic conditions, market forecasts and relevant characteristics of the servicing rights portfolio such as loan types, interest-rate stratification and recent prepayment experience. We believe that the modeling techniques and assumptions used are reasonable. However, such assumptions may or may not prove valid. Thus, there can be no assurance that servicing rights portfolio capitalization, amortization and impairment in future periods will not exceed the current capitalization, amortization and impairment amounts. Moreover, no assurance can be given that changing economic conditions and other relevant factors impacting our servicing rights portfolio will not cause actual results to differ from underlying assumptions thus adversely impacting our business, financial condition, results of operations and cash flows.
Foreclosed Real Estate
The value of our foreclosed real estate portfolio represents an accounting estimate that depends heavily on current economic conditions. Foreclosed real estate is initially recorded at fair value less estimated selling costs thereby establishing a new cost basis. Fair value of foreclosed real estate is subsequently reviewed regularly, and writedowns are recorded when it is determined that the carrying value of the real estate exceeds the fair value less estimated selling costs. Writedowns resulting from the periodic re-evaluation of holding costs and gains and losses on the sale of foreclosed properties are charged against income. Costs to develop and improve foreclosed properties are capitalized.
The fair value of properties in the foreclosed real estate portfolio is generally determined from independent appraisals. We review the appraisal assumptions for reasonableness and may make adjustments necessary to reflect current market conditions or for collateral specific factors. However, such assumptions may or may not prove valid. Moreover, no assurance can be given that changing economic conditions and other relevant factors impacting our foreclosed real estate portfolio will not cause actual occurrences to differ from underlying assumptions thus adversely impacting our business, financial condition, results of operations and cash flows.
NetDeferred Tax Asset
We use certain assumptions and estimates in determining income taxes currently payable or refundable and for recognizing deferred income tax assets and liabilities related to events for which recognition occurs in different accounting periods in our financial statements than the period during which they are recognized for income tax purposes. The assumptions and estimates include sources, amounts and timing of estimated future taxable income and deductions. Determining these amounts requires analysis of certain transactions and interpretation of tax laws and regulations. We exercise considerable judgment in evaluating the amount and timing of recognition of the resulting income tax assets and liabilities. These judgments and estimates are re-evaluated on a periodic basis as regulatory and business factors change.
We include the current and deferred tax impact of our tax positions in the Consolidated Financial Statements only when it is more likely than not (likelihood of greater than 50 percent) that such positions will be sustained by taxing authorities with full knowledge of relevant information based on the technical merits of the position. While we support our tax positions by the application of unambiguous tax law, prior experience with the taxing authorities and analysis that considers all relevant facts, circumstances and regulations, we rely on assumptions and estimates to determine the overall likelihood of success and proper quantification of each tax position.
As of December 31, 2014, net deferred tax assets, without regard to any valuation allowance, of $17.1 million were recorded in the Company’s Consolidated Balance Sheet. A portion of these net deferred tax assets includes the after-tax impact of net operating loss and realized built-in loss carryforwards. Based on available information as of this date, the Company determined that a valuation allowance against the deferred tax asset was not necessary.
The Private Placement was considered a change in control under the Internal Revenue Code and Regulations. Accordingly, the Company was required to evaluate potential limitation or deferral of its ability to carryforward pre-acquisition net operating losses and to determine the amount of net unrealized pre-acquisition built-in losses which are subject to similar limitation or deferral. Under the Internal Revenue Code and Regulations, net unrealized pre-acquisition built-in losses realized within five years of the change in control on October 7, 2010 are subject to potential limitation. Through that date, the Company will continue to analyze its ability to utilize such losses to offset anticipated future taxable income as pre-acquisition built-in losses are ultimately realized. As of December 31, 2014, the Company estimates that future utilization of built-in losses of $53 million generated prior to the Private Placement will be limited to $1.1 million per year. However, this estimate will not be conclusively confirmed until the five-year limitation period expires in October 2015. The Company’s deferred tax asset does not include any recognized built-in losses that exceed the amount expected to be utilized against future taxable income.
Analysis of our ability to realize deferred tax assets requires us to apply significant judgment and is inherently subjective because future occurrence of events and circumstances cannot be predicted with certainty. The net operating losses and realized built-in losses generated in 2010, 2011 and 2012 may be carried forward for income tax purposes up to 20 years. Thus, to the extent we generate sufficient taxable income in the future, we may be able to utilize the net operating losses and realized built-in losses for income tax purposes. The determination of how much of the net operating losses and realized built-in losses we expect to ultimately utilize and the resulting recognition of these tax benefits in the Consolidated Balance Sheets is based on sustained trends in our profitability and the projected utilization of deferred tax assets.
Defined Benefit Pension Plan
We account for our Pension Plan on an actuarial basis calculated by an independent actuary. Pension assumptions are significant inputs to the actuarial models that measure pension benefit obligations and the related impacts on financial condition, results of operations and cash flows. In particular, the assumed discount rate and expected return on plan assets are important elements of Pension Plan expense and asset/liability measurement with regard to the Pension Plan. We evaluate these critical assumptions annually. Lower discount rates increase present values and subsequent year Pension Plan expense while higher discount rates decrease present values and subsequent year Pension Plan expense. To determine the expected long-term rate of return on Pension Plan assets, we consider asset allocations and historical returns on various categories of Pension Plan assets. Both of these key assumptions are sensitive to changes. Additionally, we periodically evaluate other assumptions involving demographic factors such as retirement age, mortality and turnover and update such factors to reflect experience and expectations for the future.
Beginning in 2008, we ceased accruing pension benefits for teammates under our Pension Plan. Although no previously accrued benefits were lost, teammates no longer accrue benefits for service subsequent to 2007. Because of the considerable judgment necessary in the determination of assumptions underlying inputs to the actuarial models, such assumptions may or may not prove valid. In addition, we may decide to terminate the Pension Plan which, based on the valuation of the Pension Plan assets and actuarial valuation of the accrued benefits to the participants at that time, could result in an incremental expense for any resulting unfunded liability. While not computed on a termination basis, the unfunded liability was $3.0 million at December 31, 2014.
Fair Value Measurements
Fair value is defined as the price that would be received to sell the asset or paid to transfer the liability in an orderly transaction between market participants at the measurement date. Accounting standards establish a three-level hierarchy for disclosure of assets and liabilities recorded at fair value. The classification of assets and liabilities within the hierarchy is based on whether the inputs to the valuation methodology used for measurement are observable or unobservable. Observable inputs reflect market-derived or market-based information obtained from independent sources while unobservable inputs reflect our estimates of market data. The three-level hierarchy that is used to classify fair value measurements includes:
| | ● | Level 1 – Valuation is based on quoted prices for identical instruments traded in active markets. Level 1 instruments generally include securities traded on active exchange markets, such as the New York Stock Exchange or NASDAQ, as well as securities that are traded by dealers or brokers in active over-the-counter markets. Instruments the Company classifies as Level 1 are instruments that have been priced directly from dealer trading desks and represent actual prices at which such securities have traded within active markets. Level 1 instruments also include other loans held for sale and foreclosed real estate for which binding sales contracts have been entered into as of the balance sheet date. |
| | ● | Level 2 – Valuation is based on quoted prices for similar instruments in active markets, quoted prices for identical or similar instruments in markets that are not active and model-based valuation techniques, such as matrix pricing, for which all significant assumptions are observable in the market. Instruments the Company classifies as Level 2 include securities that are valued based on pricing models that use relevant observable information generated by transactions that have occurred in the market place involving similar securities. Level 2 instruments also include mortgage loans held for sale that are valued based on prices for other mortgage whole loans with similar characteristics and other loans held for sale as well as impaired loans and foreclosed real estate valued by independent collateral appraisals based on recent sales of comparable properties. |
| | ● | Level 3 – Valuation is generated from model-based techniques that use significant assumptions not observable in the market. These unobservable assumptions reflect our estimate of assumptions market participants would use in pricing the asset or liability. Valuation techniques include use of option-pricing models, discounted cash flow models and similar techniques. |
We attempt to maximize the use of observable inputs and minimize the use of unobservable inputs when developing fair value measurements. When available, we use quoted market prices to measure fair value. If market prices are not available, fair value measurement is based on models that use primarily market-based or independently-sourced market parameters. In certain cases when observable market inputs for model-based valuation techniques may not be readily available, we are required to make judgments about assumptions market participants would use in estimating the fair value of the financial instrument.
The degree of management judgment involved in determining the fair value of an instrument is dependent upon the availability of quoted market prices or observable market parameters. For instruments that trade actively and have quoted market prices or observable market parameters, there is minimal subjectivity involved in measuring fair value. When observable market prices and parameters are not fully available, management judgment is necessary to estimate fair value. In addition, changes in market conditions may reduce the availability of quoted prices or observable data. For example, reduced liquidity in the capital markets or changes in secondary-market activities could result in observable market inputs becoming unavailable. When significant adjustments to available observable inputs are required, it may be appropriate to utilize an estimate based primarily on unobservable inputs. When an active market for a security does not exist, the use of management estimates that incorporate current market participant expectations of future cash flows and appropriate risk premiums is acceptable.
Significant judgment may be required to determine whether certain instruments measured at fair value are included in Level 2 or Level 3. If fair value measurement is based on recent observable market activity of such instruments or comparable instruments (other than forced or distressed transactions) that occur in sufficient volume and do not require significant adjustment using unobservable inputs, those instruments are classified as Level 2. If not, they are classified as Level 3. Making this assessment requires significant management judgment.
Executive Summary
Company Overview
Our financial results were significantly impacted by the recession from December 2007 to June 2009 (commonly referred to as the “Great Recession”) and its aftermath. In 2009, the Board of Directors and Company leadership adopted and began executing a proactive and aggressive Strategic Project Plan to address the Company’s issues related to the Great Recession. The Strategic Project Plan and subsequent annual strategic plans included significant strategic changes to the Company’s operations. These strategic changes resulted in a reduction in problem assets, additional capital, a repositioned balance sheet, an improved and more efficient infrastructure and enhanced product and service offerings. In addition, we reconstituted our Senior Leadership Team, returned to annual profitability in 2013 and exited all formal regulatory directives in 2014.
Our net income for the year ended December 31, 2014 was $9.4 million ($0.73 per diluted common share), and we expect to remain profitable going forward. Our financial results in 2013 and 2014 reflect a growth strategy that includes controlled and managed growth concentrating first on organic loan and deposit growth, supplemented by tactical investments in other earning assets pending sustained loan growth that may be funded short-term by wholesale borrowing. We believe our growth strategy will continue to generate more stable and predictable earnings on a going-forward basis.
Our performance going forward is subject to numerous risks and uncertainties, many of which are beyond our control, and we can provide no assurance regarding the sustainability of, or improvement in, future earnings. In addition, the pace of future problem asset resolution activities may vary and, as a result, the level of credit-related expenses may fluctuate from period to period.
2014 Highlights
Since 2013 we have been focused on our forward-looking Value Creation Strategy with particular focus on the Client and Teammate Experiences under the mantra of “every experience counts”. The Client Experience is focused on execution of a comprehensive and intentional approach to engendering a “positive personal experience” for all interactions with The Palmetto Bank. The Teammate Experience is focused on a culture of high performance in which our team is inspired to do its best and win against the competition. Both involve innovative and creative thinking to meet evolving market and teammate expectations. Our ongoing strategic decisions and investments will be determined in the context of executing on the Client and Teammate Experiences, both of which, along with achieving high performing financial results, are expected to increase the value of The Palmetto Bank franchise.
For the year ended December 31, 2014, the Company reported net income of $9.4 million compared to $27.7 million for the year ended December 31, 2013. The results of operations for year ended December 31, 2014, as compared to year ended December 31, 2013, were primarily influenced by the following factors:
| | ● | Net interest income decreased $1.2 million, and net interest margin decreased five basis points to 3.80%. The decrease in net interest income was due to a reduction in interest income on loans resulting primarily from higher-yielding loans maturing and being replaced with new loan originations at lower rates in the current low interest rate environment and a decline in investment securities balances. Partially offsetting this decline was net growth in average loans, an increase in investment securities yields and a reduction in deposit costs as a result of a strategic reduction in higher-priced certificates of deposit. |
| | ● | To attempt to avoid a similar decline in interest income in 2015, in late 2014 we began the execution of an earning asset strategy to begin 2015 with a higher level of earning assets, both to replace loans resulting from unscheduled payoffs in the fourth quarter 2014 and to supplement temporarily our organic loan growth to start 2015. The strategy included retaining on our balance sheet residential mortgage and SBA loan production, and purchases of loan pools, loan participations and trading account assets. The earning asset purchases included a pool of residential mortgage loans for $14.0 million in the third quarter 2014, a pool of indirect auto loans for $22.1 million in the fourth quarter 2014, a commercial loan participation of $5.0 million in the fourth quarter 2014, a pool of residential mortgage loans for $12.3 million in the first quarter 2015 and an additional $4.5 million investment in our trading account in January 2015. The loans purchased were subjected to our normal internal due diligence and underwriting guidelines prior to purchase. The earning asset purchases were primarily funded by FHLB advances on a short-term basis which we expect to be replaced by deposits in 2015. |
| | ● | Total credit-related expenses, defined as provision for loan losses, foreclosed real estate writedowns and expenses, gain on sale of other loans held for sale and loan workout expenses declined from $7.6 million during the year ended December 31, 2013 to $32 thousand during the year ended December 31, 2014 primarily as a result of a reduction in the provision for loan losses and foreclosed real estate writedowns. These reductions were driven by a decline in net charge-offs and further improvement in credit quality and real estate values. |
| | | |
| | ● | Credit quality continued to improve as classified assets decreased $6.0 million from December 31, 2013 to December 31, 2014, and nonperforming assets declined $4.2 million during the same period. In addition, net charge-offs declined from $4.8 million for the year ended December 31, 2013 to $1.3 million for the year ended December 31, 2014, which was primarily the result of lower levels of problem assets and a recovery of a previously charged-off loan in the amount of $833 thousand. As a result of these factors, we reduced our allowance for loan losses in 2014 which resulted in a negative provision for loan losses of $2.3 million. |
| | ● | Fees for trust, investment management and brokerage services declined $1.4 million primarily as the result of the June 2013 transfer of our trust business to Thomasville National Bank (“TNB”). This transfer, as well as the conversion of our brokerage platform to Investment Professionals, Inc. (“IPI”) in August 2013, were part of our more integrated go-forward Wealth Management strategy to provide our clients seamless access to the comprehensive suite of products and services they need to achieve their financial goals. While gross fees declined, we no longer incur the personnel and other operating costs for these businesses and, therefore, experienced a decline in those expense categories as well. |
| | ● | Mortgage-banking income declined $499 thousand from the year ended December 31, 2013 to the year ended December 31, 2014 due to a decline in mortgage loan sales of $28.3 million. During the third quarter 2014, we made a strategic decision to retain, rather than sell, the majority of mortgage loans originated during the third and fourth quarters. Beginning in January 2015, we resumed selling most of our mortgage production in the secondary market. |
| | ● | As part of our strategy to diversify our revenues and effectively utilize our cash balances, in the third quarter 2013 we invested $5.0 million in an account managed by a third party to trade municipalsecurities.For the year ended December 31, 2014, net trading account income totaled $501 thousand, interest income totaled $180 thousand and related investment management expenses totaled $287 thousand. For the year ended December 31, 2013, net trading account income totaled $170 thousand, interest income totaled $38 thousand and related investment management expenses totaled $90 thousand. As noted above, as part of our strategy to begin 2015 with a higher level of earning assets we made an additional $4.5 million investment in the trading account in January 2015. |
| | ● | As an alternative source of income and to fund overall employee benefits costs, we purchased bank-owned life insurance (“BOLI”) involving two fully-funded general account life insurance policies for which all premiums were paid by us during the fourth quarter 2013. During the year ended December 31, 2014, earnings related to these policies totaled $307 thousand compared to $46 thousand during the year ended December 31, 2013. |
| | ● | Salaries and personnel expense declined $1.4 million as a result of decreased salaries resulting from fewer average full-time equivalent teammates (primarily related to the trust and brokerage transactions described above, reduction in branch hours to better match client usage patterns of our various delivery channels and refined branch roles resulting in reduced headcount), lower medical insurance premiums, lower pension plan expense and decreased incentives offset partially by a decline in loan origination cost deferrals and, to a lesser extent, increased employer 401(k) contributions. |
| | ● | We continued to implement client-facing and internal operational changes designed to enhance the Client Experience and improve operational efficiency resulting in an increase in Occupancy and Furniture and equipment expenses from 2013 to 2014. |
| | ● | Professional services expense increased $800 thousand from 2013 to 2014. Professional services expense during 2014 included expenses related to the revenue enhancement and process improvement projects, as well as trading asset account management fees. The incremental professional fees from the revenue enhancement and process improvement projects are expected to be more than offset by the combined effect of increased revenues and lower expenses in 2014 and 2015. |
| | ● | We recorded an income tax benefit of $18.4 million in 2013 related to the reversal of our valuation allowance on net deferred tax assets that existed at December 31, 2012. |
Other highlights for 2014 include:
| | ● | Through organic loan originations and purchased loans, we experienced an increase in net loans that outpaced normal and unscheduled pay-offs. The face amount of organic loan originations in 2014 were $255.9 million, compared to $274.8 million in 2013. As noted above, to replace unscheduled payoffs and supplement our organic loan growth during the year and to begin 2015 with a higher level of earning assets, we retained on our balance sheet a portion of residential mortgage and SBA production, purchased a participation interest in a commercial loan and purchased pools of residential mortgage loans and indirect auto loans. In January 2015, we also purchased another pool of residential mortgage loans. To the extent organic loan growth slows or unscheduled payoffs exceed our organic loan growth, we may consider additional loan pool purchases in the future. |
| | ● | Core deposits (defined as total deposits excluding time deposits in excess of $100 thousand) grew by $33.2 million, and we entered 2015 with an overall cost of deposits of 0.05%. |
| | ● | Based on a competitive market analysis, we implemented selected fee increases effective July 1, 2014 and September 1, 2014 which resulted in increased revenues beginning in the third quarter 2014. |
| | ● | We refined the features of selected deposit products and developed new products that were introduced September 1, 2014. |
| | ● | We completed a number of process improvements to reduce expenses with the reductions beginning primarily in the third quarter, including refinement of our staffing model in our Retail branches resulting in fewer FTE. |
| | ● | We declared a dividend of $0.05 per common share payable on August 18, 2014 and November 17, 2014. We also declared a dividend of $0.08 per common share payable on February 16, 2015. |
| | ● | We continued to implement technological enhancements to improve the Client Experience, risk management and operational efficiency. Examples in 2014 related to the Client Experience include online personal financial management and upgraded mobile banking app, as well as additional products in the first quarter 2015 including mobile deposits, online financial education and an upgraded website. |
| | ● | Our common stock continued to be included in the small-cap Russell 2000® Index, and our stock price appreciated 29% in 2014. |
Financial Condition
The following discussion and analysis of our financial condition is provided on a consolidated basis with commentary on business specific implications where more granular information is available.
PALMETTO BANCSHARES, INC. AND SUBSIDIARY
Consolidated Balance Sheets
(in thousands)
| | | December 31, | | | Dollar | | | Percent | |
| | | 2014 | | | 2013 | | | variance | | | variance | |
| | | | | | | | | | | | | | | | | |
Assets | | | | | | | | | | | | | | | | |
Cash and cash equivalents | | | | | | | | | | | | | | | | |
Cash and due from banks | | $ | 36,887 | | | $ | 38,178 | | | $ | (1,291 | ) | | | (3.4 | )% |
Total cash and cash equivalents | | | 36,887 | | | | 38,178 | | | | (1,291 | ) | | | (3.4 | ) |
| | | | | | | | | | | | | | | | | |
Federal Home Loan Bank stock, at cost | | | 2,556 | | | | 2,950 | | | | (394 | ) | | | (13.4 | ) |
Trading account assets, at fair value | | | 5,513 | | | | 5,118 | | | | 395 | | | | 7.7 | |
Investment securities available for sale, at fair value | | | 211,511 | | | | 214,383 | | | | (2,872 | ) | | | (1.3 | ) |
Mortgage loans held for sale | | | 1,125 | | | | 1,722 | | | | (597 | ) | | | (34.7 | ) |
| | | | | | | | | | | | | | | | | |
Loans, gross | | | 805,059 | | | | 767,513 | | | | 37,546 | | | | 4.9 | |
Less: allowance for loan losses | | | (12,920 | ) | | | (16,485 | ) | | | 3,565 | | | | (21.6 | ) |
Loans, net | | | 792,139 | | | | 751,028 | | | | 41,111 | | | | 5.5 | |
| | | | | | | | | | | | | | | | | |
Premises and equipment, net | | | 22,006 | | | | 23,367 | | | | (1,361 | ) | | | (5.8 | ) |
Accrued interest receivable | | | 3,387 | | | | 3,535 | | | | (148 | ) | | | (4.2 | ) |
Foreclosed real estate | | | 5,949 | | | | 7,502 | | | | (1,553 | ) | | | (20.7 | ) |
Deferred tax asset, net | | | 17,053 | | | | 22,087 | | | | (5,034 | ) | | | (22.8 | ) |
Bank-owned life insurance | | | 11,923 | | | | 11,617 | | | | 306 | | | | 2.6 | |
Other assets | | | 8,762 | | | | 8,742 | | | | 20 | | | | 0.2 | |
Total assets | | $ | 1,118,811 | | | $ | 1,090,229 | | | $ | 28,582 | | | | 2.6 | % |
| | | | | | | | | | | | | | | | | |
Liabilities and shareholders' equity | | | | | | | | | | | | | | | | |
Liabilities | | | | | | | | | | | | | | | | |
Deposits | | | | | | | | | | | | | | | | |
Noninterest-bearing | | $ | 196,219 | | | $ | 178,075 | | | $ | 18,144 | | | | 10.2 | % |
Interest-bearing | | | 732,101 | | | | 729,285 | | | | 2,816 | | | | 0.4 | |
Total deposits | | | 928,320 | | | | 907,360 | | | | 20,960 | | | | 2.3 | |
| | | | | | | | | | | | | | | | | |
Retail repurchase agreements | | | 15,921 | | | | 18,175 | | | | (2,254 | ) | | | (12.4 | ) |
Federal Home Loan Bank advances | | | 35,000 | | | | 35,000 | | | | - | | | | - | |
Other liabilities | | | 6,526 | | | | 5,877 | | | | 649 | | | | 11.0 | |
Total liabilities | | | 985,767 | | | | 966,412 | | | | 19,355 | | | | 2.0 | |
| | | | | | | | | | | | | | | | | |
Shareholders' equity | | | | | | | | | | | | | | | | |
Preferred stock | | | - | | | | - | | | | - | | | | - | |
Common stock | | | 128 | | | | 127 | | | | 1 | | | | 0.8 | |
Capital surplus | | | 145,384 | | | | 144,624 | | | | 760 | | | | 0.5 | |
Accumulated deficit | | | (2,565 | ) | | | (10,641 | ) | | | 8,076 | | | | (75.9 | ) |
Accumulated other comprehensive loss, net of tax | | | (9,903 | ) | | | (10,293 | ) | | | 390 | | | | (3.8 | ) |
Total shareholders' equity | | | 133,044 | | | | 123,817 | | | | 9,227 | | | | 7.5 | |
| | | | | | | | | | | | | | | | | |
Total liabilities and shareholders' equity | | $ | 1,118,811 | | | $ | 1,090,229 | | | $ | 28,582 | | | | 2.6 | % |
Cash and Cash Equivalents
Carrying excess cash has a negative impact on our interest income since we currently only earn 25 basis points on our deposits with the Federal Reserve. As a result, we have strategically managed our cash to avoid holding excess cash balances. From time-to-time we may allow cash balances to increase to fund projected loan growth. In such cases, to supplement our earnings on excess cash we may deposit a portion of our excess funds in money market accounts at third party institutions that are well-capitalized under the regulatory capital rules that earn a return in excess of that available at the Federal Reserve.
Concentrations and Restrictions. From time to time, we may sell federal funds to, or place deposits with, other financial institutions. Federal funds and any deposits in excess of FDIC insurance limits are essentially uncollateralized overnight loans. We regularly evaluate the risk associated with the potential counterparties to these transactions to ensure that we would not be exposed to any significant risks with regard to cash and cash equivalent balances if we were to sell federal funds or place deposits in amounts in excess of FDIC insurance limits. At December 31, 2014 and 2013, we did not have any material deposits in excess of FDIC insurance limits with other financial institutions.
FHLB Stock
As an FHLB member, we are required to purchase and maintain stock in the FHLB. At December 31, 2013, we owned FHLB stock with a carrying value of $3.0 million. During 2014, we purchased $1.8 million in FHLB stock, and the FHLB redeemed $2.2 million of our FHLB stock at book value thereby decreasing our balance to $2.6 million at December 31, 2014. No ready market exists for this stock, and it has no quoted market value. Purchases and redemptions are normally transacted each quarter to adjust our investment to an amount based on FHLB requirements. Requests for redemptions are met at the discretion of the FHLB. We have experienced no interruption in such redemptions. Dividends are paid on this stock at the discretion of the FHLB. The average dividend yield for the year ended December 31, 2014 and 2013 was 4.02% and 2.61%, respectively. There can be no guarantee of future dividends.
Trading Account Assets
As part of our strategy to diversify our revenues, effectively utilize our cash balances and increase our earning assets,in September 2013 we invested $5.0 million in an account managed by a third party to trade municipalsecurities. Under the account agreement, the third party has discretionary power to trade in the account subject to certain contractual restrictions. The investment strategy is to trade small and odd lot municipal securities which tend to trade at wider bid and offered spreads, allowing for higher trading profits than larger block sizes. By trading in small and odd lot municipal securities, the account takes advantage of trading opportunities by allocating funds across a wide variety of securities that are immediately available for resale to broker-dealers, financial planners and electronic trading companies. Cash in the account pending investment in municipal bonds is generally held in liquid, insured bank deposits. We may withdraw trading account assets related to our original investment from the account subject to 30-days’ written notice. To begin 2015 with a higher level of earning assets we invested an additional $4.5 million in the trading account in January 2015. This additional investment is restricted from withdrawal until January 2016.
At December 31, 2014, the trading account included municipal securities of $4.1 million and insured bank deposits of $1.4 million. At December 31, 2013, the trading account included municipal securities of $3.8 million and insured bank deposits of $1.3 million.
All of the municipal securities included in trading account assets at December 31, 2014 were investment grade. Fair value of our trading account assets is derived from a third-party pricing service. The fair values are subject to our internal price verification procedures, which include periodic comparisons to values received in subsequent sales and other third-party pricing services.
Investment Securities Available for Sale
Our primary objective in managing the investment portfolio is to maintain a portfolio of high-quality, highly-liquid investments yielding competitive returns. We are required under federal regulations to maintain adequate liquidity to ensure safe and sound operations. We maintain investment balances based on a continuing assessment of cash flows, the level of current and expected loan production, current interest-rate risk strategies and the assessment of the potential future direction of market interest-rate changes. Investment securities differ in terms of default, interest rate, liquidity and expected rate of return risk.
Composition. The fair value of the investment securities available for sale portfolio represented 18.9% and 19.7% of total assets at December 31, 2014 and 2013, respectively.
The following table summarizes the amortized cost and fair value composition of our investment securities available for sale portfolio at the dates indicated (dollars in thousands).
| | | December 31, 2014 | | | December 31, 2013 | | | December 31, 2012 | |
| | | Amortized | | | Fair | | | % of | | | Amortized | | | Fair | | | % of | | | Amortized | | | Fair | | | % of | |
| | | cost | | | value | | | total | | | cost | | | value | | | total | | | cost | | | value | | | total | |
U.S. agency | | $ | 3,930 | | | $ | 3,965 | | | | 1.9 | % | | $ | - | | | $ | - | | | | - | % | | $ | - | | | $ | - | | | | - | % |
State and municipal | | | 6,665 | | | | 6,732 | | | | 3.2 | | | | 7,393 | | | | 7,460 | | | | 3.5 | | | | 11,247 | | | | 11,530 | | | | 4.4 | |
Collateralized mortgage obligations (federal agencies) | | | 89,311 | | | | 87,774 | | | | 41.5 | | | | 97,303 | | | | 93,132 | | | | 43.4 | | | | 122,444 | | | | 123,508 | | | | 46.7 | |
Other mortgage-backed (federal agencies) | | | 78,532 | | | | 78,503 | | | | 37.1 | | | | 76,852 | | | | 76,020 | | | | 35.5 | | | | 62,581 | | | | 63,817 | | | | 24.1 | |
SBA loan-backed (federal agency) | | | 34,394 | | | | 34,537 | | | | 16.3 | | | | 37,655 | | | | 37,771 | | | | 17.6 | | | | 65,828 | | | | 65,647 | | | | 24.8 | |
Total investment securities available for sale | | $ | 212,832 | | | $ | 211,511 | | | | 100.0 | % | | $ | 219,203 | | | $ | 214,383 | | | | 100.0 | % | | $ | 262,100 | | | $ | 264,502 | | | | 100.0 | % |
The net unrealized loss on investment securities available for sale at December 31, 2014 reflects fluctuations in longer-term interest rates since the dates the securities were purchased. While the investment securities portfolio is currently in an unrealized loss position, absent any unexpected credit losses, we will recover the full principal amount of these securities if we hold them to maturity.
All of the investment securities available for sale at December 31, 2014 were investment grade.
We continue to evaluate the interest rate sensitivity of our investment securities portfolio in anticipation of rising interest rates. At December 31, 2014, the estimated decrease in fair value resulting from an instantaneous 100 basis point increase in interest rates was 3.95%.
U.S. agency securities represent debt obligations of U.S. government agencies that generate regular payments of interest income over the life of the instrument and a principal repayment at maturity. These debt obligations are guaranteed by the U.S. government and do not present credit risk to the Company.
State and municipal investment securities are debt securities issued by a state, municipality or county in order to finance its capital expenditures. The most substantial risk associated with buying state and municipal investment securities is the credit risk associated with the municipality from which the securities are purchased. Although municipal investment securities in smaller municipalities can sometimes be difficult to sell quickly, we do not currently anticipate that we will liquidate this portfolio in the near term. State and municipal investment securities provide income tax benefits to the Company in that interest income on these securities is generally exempt from federal income tax and, in some cases, state income tax.
Collateralized mortgage obligations are a mortgage-backed security subtype in which the mortgages are ordered into tranches by some criterion (such as repayment time) with each tranche sold as a separate security. These mortgage-backed securities separate the mortgage pools into short, medium and long-term tranches. Our collateralized mortgage obligations are all fixed-rate instruments and, absent nonpayment as a result of a credit event, monthly fluctuations in income occur only as there are changes in amortization or accretion due to changes in prepayment speeds. All of our collateralized mortgage obligations are issued and guaranteed by U.S. government agencies.
Other mortgage-backed investment securities include instruments representing ownership of an undivided interest in a group of fixed- and variable-rate mortgages. Principal and interest from the individual mortgages are used to pay principal and interest on the mortgage-backed investment security. Monthly income from other mortgage-backed investment securities may fluctuate as interest rates change due to the volume of mortgage prepayments. All of our mortgage-backed investment securities are issued and guaranteed by U.S. government agencies. Other mortgage-backed investment securities also include instruments representing undivided interests in a pools of reverse mortgages guaranteed under the U.S. government’s Home Equity Conversion Mortgage program. These investment securities do not have a payment schedule, but rather accrue interest on the securitized principal until such time that payoffs are received, which is generally through the sale of the underlying loan collateral.
SBA loan-backed investment securities are formed by pool assemblers through the combination of the purchased guaranteed portion of SBA fixed- and variable-rate loans. The pool assembler combines SBA loans of similar characteristics into a pool in a process similar to a mortgage-backed security formation. The resulting security maintains the same “Full Faith and Credit” guarantee of the U.S. government. Each month, the security holder receives the pro-rata share of the principal and interest payment from the guaranteed portion of the underlying loans.
We use prices from third-party pricing services and, to a lesser extent, nonbinding quotes from third-party brokers to estimate the fair value of our investment securities. While we obtain fair value information from multiple sources, we generally obtain one price/quote for each individual security. For securities priced by third-party pricing services, we determine the most appropriate and relevant pricing service for each security class and have that vendor provide the price for each security in the class. We record the value provided by the third-party pricing service/broker in our Consolidated Financial Statements subject to our internal price verification procedures, which include periodic comparisons to other brokers and third-party pricing services.
Maturities. The following table summarizes the amortized cost and book yield of investment securities available for sale at December 31, 2014 by contractual maturity and estimated principal repayment distribution (dollars in thousands). U.S. agency and state and municipal securities are organized based on contractual maturity. Principal amounts on collateralized mortgage obligations, other mortgage-backed securities and SBA loan-backed securities are not due at a single maturity date and are subject to early repayment based on prepayment activity of underlying loans. Therefore, collateralized mortgage obligations, other mortgage-backed securities and SBA loan-backed securities are organized based on estimated cash flows using current prepayment assumptions.
| | | Amortized cost | | | Book yield | |
Due in one year or less | | $ | - | | | | - | % |
Due after one year through five years | | | 2,015 | | | | 1.6 | |
Due after five years through ten years | | | 1,915 | | | | 2.5 | |
Due after ten years | | | - | | | | - | |
U.S. agency | | | 3,930 | | | | 2.0 | |
| | | | | | | | | |
Due in one year or less | | | 1,898 | | | | 3.8 | |
Due after one year through five years | | | 2,050 | | | | 2.6 | |
Due after five years through ten years | | | 2,717 | | | | 2.1 | |
Due after ten years | | | - | | | | - | |
State and municipal | | | 6,665 | | | | 2.7 | |
| | | | | | | | | |
Due in one year or less | | | 407 | | | | 2.0 | |
Due after one year through five years | | | 11,227 | | | | 1.7 | |
Due after five years through ten years | | | 77,677 | | | | 2.5 | |
Due after ten years | | | - | | | | - | |
Collateralized mortgage obligations (federal agencies) | | | 89,311 | | | | 2.4 | |
| | | | | | | | | |
Due in one year or less | | | - | | | | - | |
Due after one year through five years | | | 42,042 | | | | 1.9 | |
Due after five years through ten years | | | 19,191 | | | | 1.2 | |
Due after ten years | | | 17,299 | | | | 1.1 | |
Other mortgage-backed (federal agencies) | | | 78,532 | | | | 1.5 | |
| | | | | | | | | |
Due in one year or less | | | - | | | | - | |
Due after one year through five years | | | 15,116 | | | | 0.1 | |
Due after five years through ten years | | | 11,219 | | | | 1.9 | |
Due after ten years | | | 8,059 | | | | 2.6 | |
SBA loan-backed (federal agency) | | | 34,394 | | | | 1.3 | |
| | | | | | | | | |
Due in one year or less | | | 2,305 | | | | 3.5 | |
Due after one year through five years | | | 72,450 | | | | 1.5 | |
Due after five years through ten years | | | 112,719 | | | | 2.2 | |
Due after ten years | | | 25,358 | | | | 1.6 | |
Total investment securities available for sale | | $ | 212,832 | | | | 1.9 | % |
Concentrations. The following table summarizes issuer concentrations of collateralized mortgage obligations for which aggregate fair values exceed 10% of shareholders’ equity at December 31, 2014 (dollars in thousands).
| | | Aggregate | | | Aggregate | | | Fair value as a % of | |
Issuer | | amortized cost | | | fair value | | | shareholders' equity | |
Federal Home Loan Mortgage Corporation | | $ | 59,776 | | | $ | 59,086 | | | | 44.4 | % |
Government National Mortgage Association | | | 23,308 | | | | 22,574 | | | | 17.0 | |
The following table summarizes issuer concentrations of other mortgage-backed investment securities for which fair values exceed 10% of shareholders’ equity at December 31, 2013 (dollars in thousands).
| | | Aggregate | | | Aggregate | | | Fair value as a % of | |
Issuer | | amortized cost | | | fair value | | | shareholders' equity | |
Government National Mortgage Association | | $ | 63,805 | | | $ | 63,744 | | | | 47.9 | % |
Pledged. At December 31, 2014 and 2013, securities totaling $133.2 million and $119.6 million, respectively, were pledged to secure municipal and certain other deposits, retail repurchase agreements and Federal Reserve and certain correspondent bank lines of credit.
Lending Activities
Gross loans continue to be the largest component of our assets and primary generator of interest income. The following table summarizes activity within gross loans at the dates and for the periods indicated (in thousands).
| | | At and for the years ended December 31, | |
| | | 2014 | | | 2013 | |
Gross loans, beginning of period | | $ | 767,513 | | | $ | 738,282 | |
| | | | | | | | | |
Additions: | | | | | | | | |
Purchased mortgage loans | | | 13,974 | | | | - | |
Purchased commercial loan participation | | | 5,000 | | | | - | |
Purchased indirect automobile loans | | | 22,123 | | | | - | |
Loan originations, net of paydowns and other reductions | | | 1,192 | | | | 38,592 | |
Total additions | | | 42,289 | | | | 38,592 | |
| | | | | | | | | |
Reductions: | | | | | | | | |
Transfers to foreclosed real estate | | | 2,312 | | | | 2,541 | |
Transfers to other loans held for sale | | | 1,166 | | | | 2,015 | |
Net loans charged-off | | | 1,265 | | | | 4,805 | |
Total reductions | | | 4,743 | | | | 9,361 | |
| | | | | | | | | |
Gross loans, end of period | | $ | 805,059 | | | $ | 767,513 | |
We are aggressively pursuing organic loan growth to generate a higher level of interest-earning assets. Currently, demand for new loans from credit-worthy borrowers is not consistent or sustained and, therefore, very competitive with reduced rates. We have experienced uneven but generally improved loan origination volumes since 2012 in certain products and markets. The face amount of total organic loan production, excluding loan purchases, was $255.9 million and $274.8 million for the years ended December 31, 2014 and 2013, respectively.
To offset unscheduled commercial loan payoffs, supplement organic loan growth and begin 2015 with a higher level of earning assets, during the third and fourth quarters 2014 we purchased $14.0 million of performing jumbo hybrid adjustable-rate residential mortgages, along with the related servicing, $22.1 million of performing indirect auto loans, with servicing retained by the seller, a $5.0 commercial loan participation, and retained residential mortgage and SBA loan production that we normally would have sold. In January 2015, we purchased a pool of performing jumbo hybrid adjustable-rate residential mortgage loans and resumed selling our residential mortgage and SBA loan production in the secondary market.
Our organic loan originations and pipeline ended the year strong. However, to the extent organic loan production slows or unscheduled payoffs exceed our organic loan growth, we may once again retain residential mortgage and SBA loan production and consider additional loan pool purchases in the future.
Other Loans Held for Sale. For disclosure regarding activity within other loans held for sale and the related valuation allowance, if applicable, for the years ended December 31, 2014 and 2013, see Item 8. Financial Statements and Supplementary Data, Note 6, Other Loans Held for Sale and Valuation Allowance.
During the year ended December 31, 2014 and 2013, we sold SBA loans for proceeds totaling $1.2 million and $2.2 million, respectively, and recognized gains of $70 thousand and $207 thousand, respectively.
Composition. In the tables below, loan classes are based on the FDIC classification code, and portfolio segments are an aggregation of those classes based on the methodology used to develop and document the allowance for loan losses. FDIC classification codes are based on the underlying loan collateral.
Tabular disclosures include other loans held for sale for applicable periods, which are reported separately from our gross loan portfolio on the Consolidated Balance Sheets and are subject to different accounting and reporting standards. We believe inclusion of other loans held for sale in the related disclosures for gross loans provides a more accurate and relevant picture of our credit exposures at the dates indicated.
The following table summarizes gross loans and other loans held for sale, categorized by portfolio segment, at the dates indicated (dollars in thousands).
| | | December 31, | |
| | | 2014 | | | 2013 | | | 2012 | | | 2011 | | | 2010 | |
| | | Total | | | % of total | | | Total | | | % of total | | | Total | | | % of total | | | Total | | | % of total | | | Total | | | % of total | |
| | | | | | | | | | | | | | | | | | | | | | | | | | | | | | | | | | | | | | | | | |
Commercial real estate | | $ | 430,025 | | | | 53.4 | % | | $ | 455,452 | | | | 59.4 | % | | $ | 459,212 | | | | 62.1 | % | | $ | 492,754 | | | | 62.6 | % | | $ | 573,822 | | | | 66.8 | % |
Single-family residential | | | 204,439 | | | | 25.4 | | | | 178,125 | | | | 23.2 | | | | 168,180 | | | | 22.8 | | | | 185,504 | | | | 23.5 | | | | 178,980 | | | | 20.8 | |
Commercial and industrial | | | 80,927 | | | | 10.0 | | | | 73,078 | | | | 9.5 | | | | 51,661 | | | | 7.0 | | | | 49,381 | | | | 6.3 | | | | 47,812 | | | | 5.6 | |
Consumer | | | 76,984 | | | | 9.6 | | | | 50,099 | | | | 6.5 | | | | 50,574 | | | | 6.8 | | | | 52,771 | | | | 6.7 | | | | 52,652 | | | | 6.1 | |
Other | | | 12,684 | | | | 1.6 | | | | 10,759 | | | | 1.4 | | | | 9,431 | | | | 1.3 | | | | 7,326 | | | | 0.9 | | | | 6,317 | | | | 0.7 | |
Total loans | | $ | 805,059 | | | | 100.0 | % | | $ | 767,513 | | | | 100.0 | % | | $ | 739,058 | | | | 100.0 | % | | $ | 787,736 | | | | 100.0 | % | | $ | 859,583 | | | | 100.0 | % |
Less: other loans held for sale | | | - | | | | | | | | - | | | | | | | | 776 | | | | | | | | 14,178 | | | | | | | | 66,157 | | | | | |
Loans, gross | | $ | 805,059 | | | | | | | $ | 767,513 | | | | | | | $ | 738,282 | | | | | | | $ | 773,558 | | | | | | | $ | 793,426 | | | | | |
Mortgage loans serviced for the benefit of others totaled $375.1 million and $384.5 million at December 31, 2014 and 2013, respectively, and are not included in our Consolidated Balance Sheets since they are not owned by us.
Concentrations. We monitor borrower and industry sector concentrations and limit additional credit exposure to certain concentrations, in particular the segments of our loan portfolio secured by commercial real estate. As noted in the table above, from 2010 to 2014 we were proactive in repositioning the composition of our loan portfolio resulting in a reduction in commercial real estate and increase in commercial and industrial and consumer loans. Within commercial real estate, we significantly reduced our nonowner occupied and construction and development loans outstanding.
At December 31, 2014, commercial real estate loans comprised 53.4% of gross loans and 300.0% of the Bank’s total regulatory capital and are primarily concentrated within nonfarm nonresidential commercial real estate.
We currently provide our services primarily to clients within our market area. However, from 2006 to 2008 we originated out-of-market loans, purchased participation loans from other banks and/or obtained brokered loans brought to us by loan brokers, which were generally to nonclients with whom we had no pre-existing banking relationship and were not subjected to the enhanced underwriting procedures implemented in 2010. In connection with our loan portfolio and lending practices reviews since 2009, we determined that out-of-market loans were a significant contributing factor to our increased credit losses through 2013 and, as such, we generally no longer originate such loans. As noted above, to begin 2015 with a higher level of earning assets, in 2014 we purchased two pools of loans totaling $36.1 million and a commercial loan participation that contained loans to borrowers and/or collateral located outside of our markets. These loans were subjected to due diligence and our current underwriting procedures prior to purchase.
Although our geographic concentration limits us to the economic risks within our market area, our lack of geographic diversification may make us particularly sensitive to adverse impacts of negative economic conditions that impact our market area.
Pledged. The Bank must pledge collateral to borrow from the FHLB and cover the various Federal Reserve services that are available for use by the Bank. For disclosure regarding pledged loan collateral, see Item 8. Financial Statements and Supplementary Data, Note 5, Loans.
Maturities and Sensitivities of Loans to Changes in Interest Rates. At December 31, 2014, our total loan portfolio, excluding mortgage loans held for sale, was comprised of 65% fixed-rate loans and 35% variable rate loans.
The following table summarizes our total loan portfolio excluding mortgage loans held for sale, by portfolio segment, at December 31, 2014, that, based on remaining maturity for fixed-rate loans and repricing frequency for variable-rate loans, were due during the periods noted. For this purpose, a variable-rate loan that has reached its ceiling or floor limit is included in the fixed rate category. Nonaccrual loans are included in the due in one year or less category given that maturity cannot be reasonably estimated. The table also summarizes our loan portfolio at December 31, 2014 based on remaining maturity for fixed-rate loans due after one year (in thousands).
| | | Maturity or repricing term | | | Rate structure for loans with remaining maturities over one year | |
| | | | | | | | | | | | | | | | | | | |
| | | Due in one year or less | | | Due after one year through five years | | | Due after five years | | | Total | | | Variable-rate | | | Fixed-rate | |
| | | | | | | | | | | | | | | | | | | | | | | | | |
Commercial real estate | | $ | 24,680 | | | $ | 51,613 | | | $ | 4,634 | | | $ | 80,927 | | | $ | 268 | | | $ | 55,979 | |
Single-family residential | | | 43,109 | | | | 68,642 | | | | 92,688 | | | | 204,439 | | | | 13,550 | | | | 147,780 | |
Commercial and industrial | | | 113,480 | | | | 230,558 | | | | 85,987 | | | | 430,025 | | | | - | | | | 316,545 | |
Consumer | | | 2,719 | | | | 38,773 | | | | 35,492 | | | | 76,984 | | | | - | | | | 74,265 | |
Other | | | 8,236 | | | | 3,585 | | | | 863 | | | | 12,684 | | | | - | | | | 4,448 | |
Total loans | | $ | 192,224 | | | $ | 393,171 | | | $ | 219,664 | | | $ | 805,059 | | | $ | 13,818 | | | $ | 599,017 | |
Asset Quality. Our commercial real estate loan portfolio was negatively impacted by the challenging economic environment that began in 2008. Given the negative credit-quality trends that began in 2008 and accelerated during 2009 and 2010, we performed an extensive analysis of our commercial loan portfolio with particular focus on commercial real estate loans. The analysis included internal and external loan reviews that required detailed, written analyses for the loans reviewed and vetting of the risk rating, accrual status and collateral valuation of loans. Of particular significance is that these reviews identified 57 individual loans that resulted in $97.5 million (51%) of the $191.9 million of net loan charge-offs and writedowns on other loans held for sale and foreclosed real estate recorded from 2009 through 2012. In general, these loans had one or more of the following common characteristics:
| | ● | Individually larger commercial real estate loans originated between 2004 and 2008 that were larger and more complex loans than we historically originated, |
| | ● | Out-of-market loans, participated loans purchased from other banks or brokered loans brought to us by loan brokers which were generally to nonclients for whom we generally had no pre-existing banking relationship and/or |
| | ● | Concentrated originations in commercial real estate including acquisition, development and construction loans by loan officers who did not have the level of specialized expertise necessary to more effectively underwrite and manage these types of loans. |
This specific pool of loans was the primary contributor to our deteriorated asset quality, increased charge-offs and resulting net losses from 2009 to 2012. In addition, this pool of loans exhibited a loss rate much higher than the remainder of the loan portfolio that was comprised of loans in our market area to our in-market clients that were underwritten by loan officers using our credit underwriting standards. Accordingly, with regard to the credit quality of the remaining loan portfolio, we do not currently believe that the higher loss rate incurred on this particular pool of loans is indicative of the loss rate to be incurred on the remaining loan portfolio. By the end of 2012, we had substantially resolved this pool of problem loans and, as a result, our credit losses during 2013 and 2014 have been much less significant.
While asset-quality measures remain at historically subpar levels, such measures have improved significantly from their negative peak levels.
Delinquent Loans. We determine past due and delinquent status based on contractual terms. When a client fails to make a scheduled loan payment, we attempt to cure the default through several methods including, but not limited to, collection contact and assessment of late fees. If these methods do not result in the borrower remitting the past due payment, further action may be taken. Interest on loans deemed past due continues to accrue until the loan is placed in nonaccrual status.
Nonperforming Assets. The following table summarizes nonperforming assets, by class, at the dates indicated (dollars in thousands).
| | | December 31, | |
| | | 2014 | | | 2013 | | | 2012 | | | 2011 | | | 2010 | |
| | | | | | | | | | | | | | | | | | | | | |
Commercial real estate | | | | | | | | | | | | | | | | | | | | |
Construction, land development and other land loans | | $ | 441 | | | $ | 3,872 | | | $ | 5,467 | | | $ | 27,085 | | | $ | 52,528 | |
Multifamily residential | | | - | | | | 181 | | | | - | | | | - | | | | 7,943 | |
Nonfarm nonresidential | | | 8,174 | | | | 4,832 | | | | 3,732 | | | | 14,870 | | | | 18,781 | |
Total commercial real estate | | | 8,615 | | | | 8,885 | | | | 9,199 | | | | 41,955 | | | | 79,252 | |
| | | | | | | | | | | | | | | | | | | | | |
Single-family residential | | | | | | | | | | | | | | | | | | | | |
Single-family real estate, revolving, open-end loans | | | 977 | | | | 797 | | | | 816 | | | | 843 | | | | 998 | |
Single-family real estate, closed-end, first lien | | | 1,928 | | | | 3,176 | | | | 4,442 | | | | 7,957 | | | | 7,607 | |
Single-family real estate, closed-end, junior lien | | | 78 | | | | 129 | | | | 299 | | | | 471 | | | | 866 | |
Total single-family residential | | | 2,983 | | | | 4,102 | | | | 5,557 | | | | 9,271 | | | | 9,471 | |
| | | | | | | | | | | | | | | | | | | | | |
Commercial and industrial | | | 715 | | | | 1,885 | | | | 826 | | | | 1,313 | | | | 2,197 | |
| | | | | | | | | | | | | | | | | | | | | |
Indirect automobile | | | 116 | | | | 210 | | | | 195 | | | | 383 | | | | 404 | |
All other consumer | | | 34 | | | | 26 | | | | 69 | | | | 106 | | | | 81 | |
Total consumer | | | 150 | | | | 236 | | | | 264 | | | | 489 | | | | 485 | |
| | | | | | | | | | | | | | | | | | | | | |
Farmland and other | | | - | | | | - | | | | 2 | | | | - | | | | - | |
| | | | | | | | | | | | | | | | | | | | | |
Total nonaccrual loans | | | 12,463 | | | | 15,108 | | | | 15,848 | | | | 53,028 | | | | 91,405 | |
| | | | | | | | | | | | | | | | | | | | | |
Foreclosed real estate | | | 5,949 | | | | 7,502 | | | | 10,911 | | | | 27,663 | | | | 19,983 | |
Repossessed personal property | | | 35 | | | | 43 | | | | 81 | | | | 161 | | | | 104 | |
Total foreclosed real estate and repossessed personal property | | | 5,984 | | | | 7,545 | | | | 10,992 | | | | 27,824 | | | | 20,087 | |
| | | | | | | | | | | | | | | | | | | | | |
Total nonperforming assets | | $ | 18,447 | | | $ | 22,653 | | | $ | 26,840 | | | $ | 80,852 | | | $ | 111,492 | |
| | | | | | | | | | | | | | | | | | | | | |
Less: nonaccrual other loans held for sale | | | - | | | | - | | | | 776 | | | | 5,812 | | | | 27,940 | |
| | | | | | | | | | | | | | | | | | | | | |
Adjusted nonperforming assets | | $ | 18,447 | | | $ | 22,653 | | | $ | 26,064 | | | $ | 75,040 | | | $ | 83,552 | |
| | | | | | | | | | | | | | | | | | | | | |
Over 90 days past due and still accruing interest | | $ | 238 | | | $ | - | | | $ | - | | | $ | - | | | $ | 68 | |
Troubled debt restructurings included in nonaccrual loans above | | | 4,286 | | | | 2,184 | | | | 2,184 | | | | 2,184 | | | | 2,184 | |
Loans * | | | 805,059 | | | | 767,513 | | | | 739,058 | | | | 787,736 | | | | 859,583 | |
Total assets | | | 1,118,811 | | | | 1,090,229 | | | | 1,145,456 | | | | 1,203,152 | | | | 1,355,247 | |
| | | | | | | | | | | | | | | | | | | | | |
Total nonaccrual loans as a percentage of: | | | | | | | | | | | | | | | | | | | | |
loans* | | | 1.55 | % | | | 1.97 | % | | | 2.14 | % | | | 6.73 | % | | | 10.63 | % |
total assets | | | 1.11 | | | | 1.39 | | | | 1.38 | | | | 4.41 | | | | 6.74 | |
| | | | | | | | | | | | | | | | | | | | | |
Total nonperforming assets and loans over 90 days and still accruing interest as a percentage of: | | | | | | | | | | | | | | | | | | | | |
loans* and foreclosed real estate and personal property | | | 2.30 | % | | | 2.92 | % | | | 3.58 | % | | | 9.91 | % | | | 12.68 | % |
total assets | | | 1.67 | | | | 2.08 | | | | 2.34 | | | | 6.72 | | | | 8.23 | |
*includes gross loans and other loans held for sale, where applicable
Nonaccrual loans are those loans for which payment in full of principal or interest is not expected. In most cases, loans are automatically placed in nonaccrual status when the loan payment becomes 90 days delinquent and no acceptable repayment arrangement has been made with the client. Loans may also be placed in nonaccrual status if we determine that a factor other than delinquency (such as imminent foreclosure or bankruptcy proceedings) causes us to believe that more than a normal amount of risk exists with regard to collectability. When the loan is placed in nonaccrual status, accrued interest income is reversed. Thereafter, any cash payments received on the nonaccrual loan are applied as a principal reduction until the entire unamortized basis of the loan has been recovered. Any additional amounts received are reflected in interest income.
When the probability of future collectability on a nonaccrual loan declines, we may take additional collection measures including commencing foreclosure. Specific steps must be taken when commencing foreclosure action on loans secured by real estate, which take an extended period of time based on state-specific legal requirements.
Total loans migrating into nonaccrual status were $74.2 million, $34.7 million, $11.5 million, $16.4 million and $10.0 million for the years ended December 31, 2010, 2011, 2012, 2013 and 2014, respectively. We believe the overall trend in reduced loans migrating into nonaccrual status is an indication of improving credit quality in our overall loan portfolio and a leading indicator of reduced credit losses going forward.
The following table summarizes nonaccrual loans with balances greater than $1 million, by collateral type, at December 31, 2014. None of these loans were out-of-market or purchased participation loans (dollars in thousands).
| | | Carrying balance | | | Loan count | |
Residential lots/golf course development | | $ | 3,297 | | | | 2 | |
Commercial-use real estate | | | 1,723 | | | | 1 | |
Total | | $ | 5,020 | | | | 3 | |
Additional interest income of $478 thousand would have been reported during 2014 had loans classified as nonaccrual during the period performed in accordance with their current contractual terms. As a result, our earnings did not include this interest income.
The following table summarizes the foreclosed real estate portfolio, by class, at the date indicated (in thousands).
| | | December 31, 2014 | |
Construction, land development and other land | | $ | 5,250 | |
Single-family residential | | | 79 | |
Multifamily residential | | | 109 | |
Nonfarm nonresidential | | | 510 | |
Total foreclosed real estate | | $ | 5,948 | |
Included in foreclosed real estate at December 31, 2014 were 56 residential lots with an aggregate net book value of $4.7 million in three separate communities related to one real estate development. During 2014 and 2013, we recorded writedowns on these properties of $946 thousand and $1.7 million, respectively, to reflect declines in fair value.
In 2013, ownership of the development was consolidated and its development and marketing plan was refined. We continue to work directly with the primary owner to market and sell our remaining lots. Due to the number of lots owned, change in ownership of the development in 2013 and the generally depressed state of the residential housing market, absent additional bulk sales of the lots, we expect the resolution of these remaining lots to occur over several years. At December 31, 2014, two lots with a carrying value of $405 thousand were under contract for sale and closed during January 2015 at a gain. While we sold 23 lots in the fourth quarter 2014 and to date in 2015 at prices above carrying value, the ongoing resolution may result in additional writedowns based on receipt of annual appraisals.
Foreclosed real estate properties are being actively marketed with the primary objective of liquidating the collateral at a level that most accurately approximates fair value and allows recovery of as much of the unpaid principal balance as possible in a reasonable period of time. We generally obtain third-party, “as-is” appraisals on foreclosed real estate at the time it is classified as such if a recent appraisal has not been obtained within the most recent 12-month period. Loan charge-offs are recorded prior to or upon foreclosure to writedown the loans to fair value less estimated costs to sell. Until the time of disposition, we normally obtain updated appraisals annually. For some assets, additional writedowns have been taken based on receipt of updated third-party appraisals for which appraised values continue to decline. However, the rate of decline appears to be slowing and recent appraisals and sales generally indicate signs of stabilizing, or in some cases, increasing values. Based on currently available valuation information, the carrying value of these assets is believed to be representative of their fair value less estimated costs to sell although there can be no assurance that the ultimate proceeds from the sale of these assets will be equal to or greater than the carrying values.
For disclosure regarding balances of and changes in foreclosed real estate at and for the years ended December 31, 2014 and 2013, see Item 8. Financial Statements and Supplementary Data, Note 9, Foreclosed Real Estate and Repossessed Personal Property.
The following table summarizes the components of foreclosed real estate writedowns charged to expense for the periods indicated (in thousands).
| | | For the years ended December 31, | |
| | | 2014 | | | 2013 | |
Writedowns related to the receipt of updated appraisals | | $ | 684 | | | $ | 2,107 | |
Writedowns related to the execution of sales contracts | | | 997 | | | | 1,012 | |
Total foreclosed real estate writedowns charged to expense | | $ | 1,681 | | | $ | 3,119 | |
Troubled Debt Restructurings. Troubled debt restructurings are loans for which we made concessions to the borrowers when they were restructured from their original contractual terms due to financial difficulty of the borrower (for example, a reduction in the contractual interest rate below that at which the borrower could obtain new credit from another lender). As part of our proactive actions to resolve problem loans and the resulting individual loan workout plans, we may restructure loans to assist borrowers facing cash flow challenges to facilitate ultimate repayment of the loan and minimize our loss. Troubled debt restructurings totaled $19.9 million and $28.9 million at December 31, 2014 and 2013, respectively, of which $4.3 million (21.6%) and $2.2 million (7.5%) were in nonaccrual status.
At December 31, 2013, we had three loans that had been legally split into separate loans (commonly referred to as an A/B loan structure) for which cumulative net charge-offs of $2.6 million had been recorded. The aggregate balances of the A and B loans at December 31, 2013 were $4.7 million and $2.1 million, respectively. During 2014, the A note relative to one A/B loan structure was repaid for which the B note had been previously charged-off. The following table summarizes A/B loan structures at December 31, 2014 by performing and nonperforming status (dollars in thousands).
| | | A Note | | | B Note | | | Total | |
Carrying balance performing | | $ | 3,096 | | | $ | 2,051 | | | $ | 5,147 | |
Carrying balance performing count | | | 1 | | | | 1 | | | | 2 | |
| | | | | | | | | | | | | |
Carrying balance nonperforming | | $ | 1,245 | | | $ | - | | | $ | 1,245 | |
Carrying balance nonperforming count | | | 1 | | | | - | | | | 1 | |
| | | | | | | | | | | | | |
Carrying balance total | | $ | 4,341 | | | $ | 2,051 | | | $ | 6,392 | |
Carrying balance total count | | | 2 | | | | 1 | | | | 3 | |
Additionally, at December 31, 2014, both of the A/B loan structures were reported as troubled debt restructurings. Cumulative net charge-offs of $381 thousand have been recorded on these loans, none of which was charged-off during 2014.
Six individual loans greater than $1 million comprised $16.8 million (84.5%) of our troubled debt restructurings at December 31, 2014. Two of these loans experienced a term concession, one experienced rate and term concessions, one experienced rate and term concessions as well as principal reduction, one experienced a reduction in principal and one experienced a rate concession. At December 31, 2014, one of the six troubled debt restructurings individually greater than $1 million was in nonaccrual status.
Loans classified as troubled debt restructurings may be removed from this status if they are subsequently restructured if, at the time of the subsequent restructuring, the borrower is not experiencing financial difficulties and under terms of the subsequent agreement no concession has been granted to the borrower. To meet these conditions for removing the impairment designation, the subsequent modification agreement must specify market terms, including a contractual interest rate not less than a market interest rate for new debt with similar credit risk characteristics, and other terms no less favorable to the Company than those it would offer for such new debt. In addition to no longer being classified as troubled debt restructurings, the loans may be removed from impaired loan status. In addition, loans classified as troubled debt restructurings may be removed from this classification for disclosure purposes after a specified period of time if the restructured agreement specifies an interest rate equal to or greater than the rate that the lender was willing to accept at the time of the restructuring for a new loan with comparable risk, and the loan is performing in accordance with the terms specified by the restructured agreement. During the year ended December 31, 2014, loans totaling $8.6 million were removed from troubled debt restructuring classification of which $7.1 million were also removed from classification as impaired loans for purposes of determining the allowance for loan losses Loans removed from troubled debt restructuring classification continue to be classified as impaired loans unless they qualify for removal in accordance with our policy as described above.
For additional disclosure regarding troubled debt restructurings and impaired loans, see Allowance for Loan Losses beginning on the next page and Item 8. Financial Statements and Supplementary Data, Note 5, Loans.
Potential Problem Loans. Potential problem loans (loans risk rated 6 or 7 under our risk rating system and, therefore, classified as substandard and doubtful, respectively) consist of commercial loans and consumer loans within the commercial relationships that are not already classified as nonaccrual for which questions exist as to the current sound worth and paying capacity of the client or of the collateral pledged, if any, that have a well-defined weakness or weaknesses that jeopardize the liquidation of the loan and are characterized by the distinct possibility that we will sustain some loss if the deficiencies are not corrected. We monitor these loans closely and review performance on a regular basis. As of December 31, 2014, total potential problem loans totaled $26.5 million, of which $12.5 million were troubled debt restructurings. Total potential problem loans decreased $2.0 million (7.2%) from December 31, 2013.
Allowance for Loan Losses. The allowance for loan losses represents an amount that we believe will be adequate to absorb probable losses inherent in our loan portfolio as of the balance sheet date. Assessing the adequacy of the allowance for loan losses is a process that requires considerable judgment. Our judgment in determining the adequacy of the allowance is based on evaluations of the collectability of loans including consideration of factors such as the balance of impaired loans, the quality, mix and size of our overall loan portfolio, economic conditions that may impact the overall loan portfolio or an individual borrower’s ability to repay, the amount and quality of collateral securing the loans, our historical loan loss experience and borrower and collateral specific considerations for loans individually evaluated for impairment.
The allowance for loan losses decreased to $12.9 million, or 1.60% of gross loans, at December 31, 2014, compared to $16.5 million, or 2.15% of gross loans, at December 31, 2013. The reduced coverage percentage at December 31, 2014 as compared to December 31, 2013 was the result of the continued overall improvement in credit quality and reduced risk profile of the loan portfolio as discussed below.
In general, since 2012 we have experienced improved trends in certain credit-quality metrics related to our loan portfolio, and, as a result, nonaccrual loans of $12.5 million at December 31, 2014 represented an 89.0% reduction from the peak at March 31, 2010 and a 17.5% reduction from December 31, 2013. In addition, the loss severity on individual problem loans has decreased as we obtain annual appraisals. Overall loan loss rates have declined in each of the last five years and were $1.3 million (0.17% of average gross loans) in 2014 as compared to $4.8 million (0.64% of average gross loans) in 2013.
We continue to pursue collection of charged-off loans, which may result in recoveries in future periods. During 2014, we had recoveries totaling $1.8 million. Additional recoveries, some of which may be individually significant, may occur in the future. Recoveries and/or other reductions in the allowance for loan losses may also reduce the provision for loan losses recorded in future periods. Conversely, there can be no assurance that loan losses in future periods will not exceed the current allowance for loan losses or that future increases in the allowance for loan losses will not be required. Additionally, no assurance can be given that our ongoing evaluation of the loan portfolio, in light of changing economic conditions and other relevant factors, will not require significant future additions to the allowance for loan losses thus adversely impacting our business, financial condition, results of operations and cash flows.
We sold certain foreclosed real estate properties at gains in 2014 and to date in 2015. While it appears that appraised values on commercial real estate have stabilized, some appraisals continue to indicate reduced values with a few now showing increased values. Given our relatively heavy concentration in commercial real estate loans, including individually large loans, we continue to maintain an allowance for loan losses at an elevated amount compared to historical levels.
The allowance for loan losses at December 31, 2014, and indirectly the provision for loan losses for the year ended December 31, 2014, was determined based on the following specific factors, though this is not intended to be an all-inclusive list:
| | ● | The impact of the uncertain overall economic environment including inconsistent month to month business activity and loan production within our market, |
| | ● | The cumulative impact of the extended duration of the economic environment on our clients, in particular commercial real estate loans for which we have a concentration, |
| | ● | The level of real estate development loans in which the majority of our losses have occurred although such loans have decreased 82.0% since June 30, 2009 (peak quarter-end real estate development loans), |
| | ● | The asset-quality metrics of our loan portfolio included a higher than historical level of nonperforming assets at December 31, 2014 although, while still at an elevated level, nonperforming assets decreased 87.0% from the peak at March 31, 2010, |
| | ● | Our classified loans decreased 10.8% from December 31, 2013. |
| | ● | The trend and elevated level of the historical loan loss rates (and recoveries) within our loan portfolio, |
| | ● | The results of our internal and external loan reviews and |
| | ● | Our individual impaired loan analysis which identified: |
| | o | Improving but some stress on certain borrowers based on liquidity and |
| | o | Stabilizing but still generally depressed appraised values and market assumptions used to value real estate dependent loans. |
The following table summarizes allowance for loan losses activity, by portfolio segment, at the dates and for the periods indicated (dollars in thousands). Loans charged-off and recovered are charged or credited to the allowance for loan losses at the time realized.
| | | At and for the years ended December 31, | |
| | | 2014 | | | 2013 | | | 2012 | | | 2011 | | | 2010 | |
Allowance for loan losses, beginning of period | | $ | 16,485 | | | $ | 17,825 | | | $ | 25,596 | | | $ | 26,934 | | | $ | 24,079 | |
| | | | | | | | | | | | | | | | | | | | | |
Provision for loan losses | | | (2,300 | ) | | | 3,465 | | | | 13,075 | | | | 20,500 | | | | 47,100 | |
| | | | | | | | | | | | | | | | | | | | | |
Less: allowance for loan losses reclassified as other loans held for sale valuation allowance | | | - | | | | - | | | | - | | | | - | | | | 2,358 | |
| | | | | | | | | | | | | | | | | | | | | |
Less: allowance for loan losses reclassified in credit card portfolio sale | | | - | | | | - | | | | - | | | | - | | | | 452 | |
| | | | | | | | | | | | | | | | | | | | | |
Loans charged-off | | | | | | | | | | | | | | | | | | | | |
Commercial real estate | | | 1,082 | | | | 1,780 | | | | 17,548 | | | | 16,532 | | | | 33,481 | |
Single-family residential | | | 697 | | | | 731 | | | | 3,314 | | | | 3,070 | | | | 4,214 | |
Commercial and industrial | | | 530 | | | | 2,426 | | | | 376 | | | | 1,572 | | | | 3,135 | |
Consumer | | | 225 | | | | 285 | | | | 586 | | | | 810 | | | | 1,483 | |
Other | | | 555 | | | | 669 | | | | 696 | | | | 848 | | | | 647 | |
Total loans charged-off | | | 3,089 | | | | 5,891 | | | | 22,520 | | | | 22,832 | | | | 42,960 | |
| | | | | | | | | | | | | | | | | | | | | |
Recoveries | | | | | | | | | | | | | | | | | | | | |
Commercial real estate | | | 396 | | | | 291 | | | | 209 | | | | 101 | | | | 544 | |
Single-family residential | | | 982 | | | | 135 | | | | 648 | | | | 56 | | | | 98 | |
Commercial and industrial | | | 47 | | | | 147 | | | | 168 | | | | 115 | | | | 154 | |
Consumer | | | 83 | | | | 138 | | | | 193 | | | | 146 | | | | 729 | |
Other | | | 316 | | | | 375 | | | | 456 | | | | 576 | | | | - | |
Total loans recovered | | | 1,824 | | | | 1,086 | | | | 1,674 | | | | 994 | | | | 1,525 | |
| | | | | | | | | | | | | | | | | | | | | |
Net loans charged-off | | | 1,265 | | | | 4,805 | | | | 20,846 | | | | 21,838 | | | | 41,435 | |
| | | | | | | | | | | | | | | | | | | | | |
Allowance for loan losses, end of period | | $ | 12,920 | | | $ | 16,485 | | | $ | 17,825 | | | $ | 25,596 | | | $ | 26,934 | |
| | | | | | | | | | | | | | | | | | | | | |
Average gross loans | | $ | 760,338 | | | $ | 746,815 | | | $ | 745,473 | | | $ | 775,358 | | | $ | 943,101 | |
Loans, gross | | | 805,059 | | | | 767,513 | | | | 738,282 | | | | 773,558 | | | | 793,426 | |
Nonaccrual loans (1) | | | 12,463 | | | | 15,108 | | | | 15,848 | | | | 53,028 | | | | 91,405 | |
| | | | | | | | | | | | | | | | | | | | | |
Net loans charged-off as a percentage of average gross loans | | | 0.17 | % | | | 0.64 | % | | | 2.80 | % | | | 2.82 | % | | | 4.39 | % |
Allowance for loan losses as a percentage of gross loans | | | 1.60 | | | | 2.15 | | | | 2.41 | | | | 3.31 | | | | 3.39 | |
Allowance for loan losses as a percentage of nonaccrual loans | | | 103.67 | | | | 109.11 | | | | 112.47 | | | | 48.27 | | | | 29.47 | |
(1) Nonaccrual loans includes loans classified as other loans held for sale of: | | $ | - | | | $ | - | | | $ | 776 | | | $ | 5,812 | | | $ | 27,940 | |
In addition to loans charged-off in their entirety in the ordinary course of business, included within total loans charged-off were charge-offs on loans individually evaluated for impairment for the years ended December 31, 2014 and 2013 totaling $923 thousand and $3.3 million, respectively. Charge-offs were taken on certain collateral-dependent loans based on the status of the underlying real estate projects or our expectation that these loans would be foreclosed on, and we would take possession of the collateral. The loan charge-offs were recorded to reduce the carrying balance of the loans to the fair value of the underlying collateral less estimated costs to sell, which are generally based on third-party appraisals.
We analyze certain individual loans within the loan portfolio and make allocations to the allowance for loan losses based on the individual loan’s specific factors and other circumstances that impact the collectability of the loan. The population of loans evaluated for potential impairment includes all loans that are currently classified as troubled debt restructurings, certain loans that have previously been classified as troubled debt restructurings, all loans with Bank-funded interest reserves, significant individual loans classified as doubtful and loans on nonaccrual status. At December 31, 2014, we had four loan relationships totaling $3.1 million with a Bank-funded interest reserve. None of these loans were considered impaired at December 31, 2014.
In situations when a loan is determined to be impaired because it is probable that all principal and interest due according to the terms of the loan agreement will not be collected as scheduled, the loan is excluded from the general reserve calculation and is evaluated individually for impairment. The impairment analysis is based on the determination of the most probable source of repayment which is typically liquidation of the underlying collateral, but may also include the present value of estimated future cash flows or, in rare cases, the fair value of the loan itself.
At December 31, 2014 and 2013, impaired loans totaled $31.6 million and $44.7 million, respectively, of which $19.9 million and $28.9 million, respectively, were classified as troubled debt restructurings. At December 31, 2014, 64.6% of our loans evaluated individually for impairment, net of related allowance for loan losses, were valued based on the estimated fair value of collateral and 35.4%, net of related valuation allowance, were valued based on the present value of estimated future cash flows.
Generally for larger impaired loans valued based on the estimated fair value of collateral, current appraisals performed by approved third-party appraisers are the basis for estimating the fair value of the collateral. However, in situations where a current appraisal is not available, we use the best available information (including recent appraisals for similar properties, communications with qualified real estate professionals, information contained in reputable trade publications and other observable market data) to estimate fair value. The estimated costs to sell the property are then deducted from the appraised value to determine the loan’s net realizable value used to calculate the loan’s specific reserve.
For additional disclosure regarding changes in the allowance for loan losses and recorded investment in gross loans, see Item 8. Financial Statements and Supplementary Data, Note 5, Loans.
Portions of the allowance for loan losses may be allocated to specific loans or portfolio segments. However, the entire allowance for loan losses is available for any loan that, in our judgment, should be charged-off. While we utilize the best judgment and information available to us, the ultimate adequacy of the allowance for loan losses depends on a variety of factors beyond our control including the performance of our loan portfolio, the economy, changes in interest rates and the view of the regulatory authorities toward loan classifications. Absent the impact of unexpected negative trends in credit quality, we expect our allowance for loan losses coverage ratio to be reduced further in 2015 which could possibly result in a negative provision for loan losses.
Premises and Equipment, net
Premises and equipment, net decreased $1.4 million (5.8%) during 2014 due primarily to depreciation of $2.4 million, partially offset by investments in technology.
Net Deferred Tax Asset
As of December 31, 2014, net deferred tax assets of $17.1 million were recorded in our Consolidated Balance Sheet. A portion of the net deferred tax asset includes the after-tax impact of net operating losses and realized built-in loss carryforwards. Based on available information as of this date, we determined that a valuation allowance against the deferred tax asset was not necessary.
Analysis of our ability to realize deferred tax assets requires us to apply significant judgment and is inherently subjective because the future occurrence of events and circumstances cannot be predicted with certainty. The net operating losses and realized built-in losses generated in 2010, 2011 and 2012 may be carried forward for income tax purposes up to 20 years. Thus, to the extent we generate sufficient taxable income in the future, we may be able to utilize the net operating losses and realized built-in losses for income tax purposes. The determination of how much of the net operating losses and realized built-in losses we expect to ultimately utilize, and the resulting recognition of these tax benefits in the Consolidated Balance Sheets, is based on sustained trends in our profitability and the projected utilization of deferred tax assets.
For disclosure regarding the impact of the Private Placement on our net deferred tax asset, see Item 8. Financial Statements and Supplementary Data, Note 14, Income Taxes.
Bank-Owned Life Insurance
As an alternative source of income and to fund overall teammate benefits costs, we purchased two BOLI policies on certain members of our leadership team for which all premiums were paid by us during the fourth quarter 2013. Each policy was funded with a premium of $5.0 million paid to an AA+ rated insurance company, and we are the sole beneficiary of the policies. To encourage the covered teammates to consent to the coverage, the Bank provided a $50 thousand taxable death benefit payable to the named beneficiaries of the covered teammates in the event of the death of a covered teammate while employed by the Bank. The policies are reflected in the Consolidated Balance Sheets at the cash surrender value at December 31, 2014. Income from these policies and changes in the cash surrender value are recorded in other noninterest income. During the years ended December 31, 2014 and 2013, earnings on these policies totaled $307 thousand and $46 thousand, respectively, none of which was due to the death benefit.
Deposit Activities
Deposits have historically been our primary source of funds and a competitive strength resulting in a cost of funds of 0.05% for the year ended December 31, 2014 (0.05% for the fourth quarter 2014), which reflects our strong core deposit franchise. Deposits also provide a client base for the sale of additional financial products and services and the recognition of fee income through service charges and other ancillary banking services. We set annual targets for deposit balances in an effort to increase the number of products per banking relationship and households we service as well as to manage the composition of our deposit funding. Deposits are attractive sources of funding because of their stability and generally low cost as compared with other funding sources. Over our 108-year history, we have developed long-standing relationships with clients in the communities in which we operate and achieved considerable name recognition, resulting in a well-established branch network and loyal deposit base. On account of these factors, we believe that we have developed a higher core deposit mix and a historically lower cost of deposits relative to our peers. This competitive advantage is not as pronounced in the current low interest-rate environment.
The following table summarizes our composition of deposits at the dates indicated (dollars in thousands).
| | | December 31, | |
| | | 2014 | | | 2013 | |
| | | | | | | | | | | | | |
| | | Total | | | % of total | | | Total | | | % of total | |
Noninterest-bearing transaction deposits | | $ | 196,219 | | | | 21.2 | % | | $ | 178,075 | | | | 19.6 | % |
Interest-bearing transaction deposits | | | 332,414 | | | | 35.8 | | | | 316,214 | | | | 34.9 | |
Transaction deposits | | | 528,633 | | | | 57.0 | | | | 494,289 | | | | 54.5 | |
| | | | | | | | | | | | | | | | | |
Money market deposits | | | 138,449 | | | | 14.9 | | | | 136,476 | | | | 15.0 | |
Savings deposits | | | 90,318 | | | | 9.7 | | | | 79,760 | | | | 8.8 | |
Time deposits | | | 170,920 | | | | 18.4 | | | | 196,835 | | | | 21.7 | |
Total deposits | | $ | 928,320 | | | | 100.0 | % | | $ | 907,360 | | | | 100.0 | % |
The decline in time deposits has resulted in a significant improvement in our interest expense on deposits. Going forward, the opportunity for further improvement in our cost of funds paid on deposits from maturing time deposits is significantly reduced as time deposits that are scheduled to mature in 2015 are at a weighted-average rate of 0.16%. We may also pursue time deposits at higher interest rates to replace our FHLB advances borrowed in December 2014 and January 2015.
Noninterest-bearing deposits increased $18.1 million during 2014 while interest-bearing deposits increased $2.8 million during the same period. The increase in noninterest-bearing deposits was due to our continued execution of several specific strategies to continue growing core deposits through increasing balances in existing accounts as well as growth in the number of households. These strategies include proactively focusing on client retention, attracting new clients including in markets with local bank disruption, hiring teammates with specialized deposit product knowledge, providing a rewards program to clients for referrals and use of debit cards and enhancing existing deposit products. The increase in interest-bearing deposits was the result of growth in interest-bearing core deposits which were partially offset by a strategic reduction in time deposits to lower our overall cost of funds and focus our efforts on relationship banking to reduce the number of single-product households that only maintain time deposit accounts with the Bank. These increases were also impacted by current client trends to retain funds in deposit accounts rather than other investment options given the current interest rate environment.
Deposit accounts continue to be our primary source of funding. As part of our liquidity management, we proactively pursue core deposit retention initiatives with our deposit clients and strategies to increase our transaction deposit accounts in proportion to our total deposits. For example, in 2013 we began a client rewards program to encourage clients to use their debit cards in order to increase the likelihood that these accounts become the clients’ primary checking account, which typically carries higher balances and has higher account retention. Similarly, starting in 2013 we also began a referral rewards program which rewards clients for referring new clients to the Bank. In 2014 we hired a business deposit specialist whose primary role is to grow operating accounts from businesses and to provide employer banking packages for the employees of our business clients. We also introduced enhancements to existing deposit products and implemented new deposit products on September 1, 2014.
From a liquidity standpoint given the expectation of rising interest rates in the future, we are monitoring on a monthly basis changes in the deposit balances of our top 100 depositors and evaluating their deposit behavior to understand the likelihood of retaining those deposits in the future.
Time Deposits $100 Thousand or Greater. Time deposits $100 thousand or greater totaled $67.4 million and $79.7 million at December 31, 2014 and 2013, respectively. We believe our balance sheet management efforts to attract and retain lower-priced transaction deposit accounts and reduce our higher-priced deposit base contributed to this decrease in jumbo time deposit accounts.
Borrowing Activities
Borrowings as a percentage of total liabilities decreased from 5.5% at December 31, 2013 to 5.2% at December 31, 2014 resulting from a 12.4% decline in retail repurchase agreements during 2014 while total liabilities increased 2.0% over the period as a result of an increase in deposits.
For additional disclosure regarding our borrowings, see Item 8. Financial Statements and Supplementary Data, Note 12, Borrowings.
RetailRepurchase Agreements. We offer retail repurchase agreements as an alternative investment tool to conventional savings deposits. In connection with the agreements, the client buys an interest in a pool of U.S. government, U.S. agency or state and municipal investment securities. Funds are swept daily between the client and the Bank. Retail repurchase agreements are not insured deposits.
Wholesale Funding. Wholesale funding options for the Bank include lines of credit from correspondent banks, brokered time deposits, FHLB advances and the Federal Reserve Discount Window. In addition, during the second quarter 2014, we filed a shelf registration with the SEC to provide capacity and flexibility for the Company’s possible future funding needs. The registration allows the Company to issue a variety of registered debt and/or equity securities of up to $50 million; however there are currently no plans to access such funding. Wholesale funding generally provides us with the ability to access the type of funding needed, at the time and amount needed, at market rates. This provides us with the flexibility to tailor borrowings to our specific needs. Interest rates on such borrowings vary in response to general economic conditions and, in the case of FHLB advances, may be at fixed or floating rates. Our earning asset purchases in 2014 were primarily funded by FHLB advances of $35 million with a weighted-average rate of 0.24% at December 31, 2014 all of which matured in January 2015 and were replaced with new advances maturing between April and July 2015 with a weighted-average rate of 0.26%. We expect to replace all or a portion of these advances through deposit growth in 2015.
Correspondent Bank Lines of Credit. The following table summarizes the Bank’s correspondent bank lines of credit at the dates indicated (dollars in thousands).
| | | December 31, 2014 | | | December 31, 2013 | |
| | | Secured | | | Unsecured | | | Total | | | Secured | | | Unsecured | | | Total | |
Amount available | | $ | 15,000 | | | $ | 65,000 | | | $ | 80,000 | | | $ | 35,000 | | | $ | 25,000 | | | $ | 60,000 | |
Count | | | 2 | | | | 6 | | | | 8 | | | | 3 | | | | 2 | | | | 5 | |
The changes in the composition of our correspondent bank lines of credit during 2014 were the result of the additional of two unsecured lines totaling $20 million as well as the a previously secured correspondence line of credit being converted into one secured and one unsecured line of credit.
None of the lines of credit were utilized as of either date. These correspondent bank funding sources may be canceled at any time at the correspondent bank’s discretion.
Brokered Time Deposits. We have agreements in place that allow us to offer time deposit accounts on a national basis through brokers and on-line listing services. Brokered time deposits are a ready source of funds that are generally more expensive than time deposits obtained through our local markets. Brokered time deposits are generally only available to banks that are considered well-capitalized under the regulatory prompt corrective action regulations. Other than to periodically test access to such markets, we have not obtained brokered time deposits or time deposits from on-line listing services and had no such borrowings outstanding at December 31, 2014 or 2013.
FHLB Advances. We pledge investment securities and loans to collateralize FHLB advances. Additionally, the Bank may pledge cash and cash equivalents. The amount that can be borrowed is based on the balance of the type of asset pledged as collateral multiplied by lendable collateral value percentages as calculated by the FHLB. The Bank’s borrowing capacity with the FHLB is 25% of the Bank’s total assets, subject to available collateral.
The following table summarizes the collateral utilization and availability of borrowings from the FHLB at the dates indicated (in thousands).
| | | December 31, | |
| | | 2014 | | | 2013 | |
Available lendable loan collateral value pledged to serve against FHLB advances | | $ | 79,139 | | | $ | 90,225 | |
FHLB advances outstanding | | | 35,000 | | | | 35,000 | |
Excess lendable collateral value pledged to serve against FHLB advances | | $ | 44,139 | | | $ | 55,225 | |
Federal Reserve Discount Window. We have established a borrowing relationship with the Federal Reserve through its Discount Window. Our borrowings from the Discount Window are at the primary credit rate. Primary credit is available through the Discount Window to generally sound depository institutions on a very short-term basis, typically overnight, at a rate above the Federal Open Market Committee target rate for federal funds. The maximum maturity for potential borrowings is overnight. We have not drawn on this availability since its initial establishment in 2009 other than to periodically test our ability to access the line. The Federal Reserve has the discretion to deny approval of borrowing requests.
Capital
At December 31, 2014, all of our capital ratios exceeded the well-capitalized regulatory minimum thresholds.
The following table summarizes capital key performance indicators at the dates and for the periods indicated (dollars in thousands, except per share data).
| | | At and for the years ended December 31, | |
| | | 2014 | | | 2013 | | | 2012 | |
Total shareholders' equity | | $ | 133,044 | | | $ | 123,817 | | | $ | 98,380 | |
Average shareholders' equity | | | 129,572 | | | | 106,408 | | | | 100,018 | |
| | | | | | | | | | | | | |
Shareholders' equity as a percentage of total assets | | | 11.89 | % | | | 11.36 | % | | | 8.59 | % |
Average shareholders' equity as a percentage of average total assets | | | 11.82 | | | | 9.71 | | | | 8.51 | |
| | | | | | | | | | | | | |
Book value per common share | | $ | 10.39 | | | $ | 9.68 | | | $ | 7.71 | |
Cash dividends declared per common share | | | 0.10 | | | | - | | | | - | |
Dividend payout ratio | | | 13.67 | % | | n/a | | | n/a | |
Dividends. Dividends from the Bank are the Company’s primary source of funds for payment of dividends to its common shareholders. During the year ended December 31, 2014, the Company declared dividends on its common stock as follows:
Declaration date | | Record date | | Payment date | | Cash dividend per common share | |
7/17/2014 | | 8/4/2014 | | 8/18/2014 | | $ | 0.05 | |
10/16/2014 | | 11/3/2014 | | 11/17/2014 | | | 0.05 | |
In addition, on January 15, 2015, the Company declared a dividend of $0.08 per common share payable on February 16, 2015.
The dividends paid to shareholders were funded by dividends paid to the Company by the Bank. Our Board of Directors will continue to evaluate dividend payment opportunities on a quarterly basis. There can be no assurance as to when and if future dividends will be paid, and at what level, because the payment of dividends is dependent on our financial condition, results of operations and/or cash flows as well as capital and dividend regulations of the FDIC and our other regulatory authorities.
Private Placement. In October 2010, we consummated the Private Placement in which institutional investors purchased 9,993,995 shares of our common stock at $10.40 per share resulting in proceeds of $103.9 million. Under the terms of the Private Placement, we conducted a common stock follow-on offering following the closing of the Private Placement directed to our shareholders as of the close of business on October 6, 2010. With respect to the follow-on offering, in December 2010, we issued 194,031 shares of common stock resulting in proceeds of $2.0 million, and in January 2011, we issued an additional 767,508 shares of common stock resulting in proceeds of $8.0 million. Net proceeds from the offerings totaling $104 million were contributed to the Bank as an additional capital contribution.
Regulatory Capital and Other Requirements. The Company and the Bank are required to meet regulatory capital requirements that include several measures of capital. Under regulatory capital requirements as of December 31, 2014, accumulated other comprehensive income (loss) amounts do not increase or decrease regulatory capital and are not included in the calculation of risk-based capital and leverage ratios.
For regulatory capital purposes as of December 31, 2014, deferred tax assets that are dependent on future taxable income generally are limited to the lesser of (1) the amount of such deferred tax assets that we expect to realize within one year of the calendar quarter-end date based on our projected future taxable income for that year or (2) 10% of the amount of our Tier 1 capital. At December 31, 2014, $6.1 million of our net deferred tax asset was included in Tier 1 and total regulatory capital. Under the Basel III regulatory capital reforms that went into effect on January 1, 2015, deferred tax assets that arise from net operating loss and tax credit carryforwards (net of any related valuations allowances and net of deferred tax liabilities) are excluded from regulatory capital, in addition to certain overall limits on net deferred tax assets as a percentage of CET1 capital. We will continue to evaluate the realizability of our net deferred tax asset on a quarterly basis for both financial reporting and regulatory capital purposes. This evaluation may result in the inclusion of a deferred tax asset in regulatory capital in an amount that is different from the amount determined under GAAP.
Since December 31, 2014, we are not aware of the occurrence of any conditions or events that have resulted in a material change in the Bank's regulatory capital category other than as reported in this Annual Report on Form 10-K.
For additional disclosure regarding the Company’s and the Bank’s actual and required regulatory capital requirements and ratios, see Item 8. Financial Statements and Supplementary Data, Note 21, Regulatory Capital Requirements and Dividend Restrictions.
Equity. At December 31, 2014, we had authorized common stock and preferred stock of 75,000,000 shares and 2,500,000 shares, respectively. Authorized but unissued shares of common stock totaled 62,185,426 at February 23, 2015. To date, we have not issued any shares of preferred stock.
The Company’s common stock is traded on the NASDAQ Capital Market and has been included in the Russell 2000(R) Index since June 2013.
Derivative Activities
For disclosure regarding our derivative financial instruments and hedging activities, see Item 8. Financial Statements and Supplementary Data, Note 19, Derivative Financial Instruments and Hedging Activities. We are currently evaluating the potential use of additional interest-rate derivatives for balance sheet management purposes and to accommodate client requests.
Liquidity
General
Liquidity measures our ability to meet current and future cash flow needs as they become due. The liquidity of a financial institution reflects its ability to accommodate possible outflows from deposit accounts, meet loan requests and commitments, maintain reserve requirements, pay operating expenses, provide funds for dividends and debt service, manage operations on an ongoing basis, capitalize on new business opportunities and take advantage of interest-rate market opportunities. The ability of a financial institution to meet its current financial obligations is a function of its balance sheet structure, its ability to liquidate assets and its access to alternative sources of funds. We seek to ensure our funding needs are met by maintaining a level of liquid funds through proactive balance sheet management.
Asset liquidity is provided by maintaining assets that are readily convertible into cash, are pledgeable or that will mature in the near future. Our liquid assets may include cash, interest-bearing deposits in banks, investment securities available for sale, portions of our trading account asset and federal funds sold. Liability liquidity is provided by access to funding sources including deposits, borrowings and public capital markets. We may also issue equity securities on the NASDAQ. To date, no preferred stock has been issued, and there can be no guarantee that a market would exist for such common or preferred shares at terms acceptable to us.Each of our sources of liquidity is subject to various factors beyond our control such as willingness of counterparties to extend credit to the Company or the Bank and systematic disruptions.
Overall, we continuously focus on balance sheet management to manage our cash effectively and invest in earning assets. Based on loan origination activity, this includes purchasing loans, and investing in investment securities and trading account assets (as compared to maintaining cash on deposit at the Federal Reserve) as well as paying down higher-priced funding such as maturing time deposits. Future net loan growth is expected to be funded primarily from increases in deposits and paydowns and maturities of investment securities. Wholesale borrowings and sales of investment securities may also be used to supplement short-term funding needs.
Liquidity resources and balances at December 31, 2014, as disclosed herein, are an accurate depiction of our activity during the period and, except as noted, have not materially changed since that date.
Cash Flow Needs
In the normal course of business, we enter into various transactions some of which, in accordance with GAAP, are not recorded in our Consolidated Balance Sheets. These transactions may involve, to varying degrees, elements of credit risk and interest-rate risk in excess of the amounts recognized in the Consolidated Balance Sheets, if any.
Our nonmortgage lending commitments and letters of credit do not meet the criteria to be recorded on the Consolidated Balance Sheets at fair value since our commitment letters contain material adverse change clauses. Accordingly, we account for estimated probable losses on these instruments in a manner similar to our loans.
We use the same credit policies in making and monitoring commitments as used for loan underwriting. Therefore, in general, the methodology to determine the reserve for unfunded commitments is inherently similar to that used to determine the general reserve component of the allowance for loan losses. However, commitments have fixed expiration dates, and most of our commitments to extend credit have adverse change clauses that allow us to cancel the commitments based on various factors including deterioration in the creditworthiness of the borrower. Accordingly, many of our loan commitments are expected to expire without being drawn upon and, therefore, the total commitment amounts do not necessarily represent potential credit exposure. The reserve for unfunded commitments at December 31, 2014 and 2013 was $472 thousand and $259 thousand, respectively, and is recorded in Other liabilities in the Consolidated Balance Sheets.
For additional disclosure regarding our commitments, guarantees and other contingencies, see Item 8. Financial Statements and Supplementary Data, Note 18, Commitments, Guarantees and Other Contingencies.
Dividend Obligations. The holders of the Company’s common stock are entitled to receive dividends, when and if declared by the Company’s Board of Directors, out of funds legally available for such dividends. The Company is a legal entity separate and distinct from the Bank and depends on the payment of dividends from the Bank.
Earnings Review
The following discussion and analysis of our results of operations is provided on a consolidated basis with commentary on business specific implications where more granular information is available.
PALMETTO BANCSHARES, INC. AND SUBSIDIARY
Consolidated Statements of Income (Loss)
(dollars in thousands, except per share data)
| | | | | | | | | | | | | | | 2014 to 2013 comparison | |
| | | For the years ended December 31, | | | Dollar | | | Percent | |
| | | 2014 | | | 2013 | | | 2012 | | | variance | | | variance | |
| | | | | | | | | | | | | | | | | | | | | |
Interest income | | | | | | | | | | | | | | | | | | | | |
Interest earned on cash and cash equivalents | | $ | 93 | | | $ | 100 | | | $ | 209 | | | $ | (7 | ) | | | (7.0 | )% |
Dividends received on Federal Home Loan Bank stock | | | 65 | | | | 39 | | | | 47 | | | | 26 | | | | 66.7 | |
Interest earned on trading account assets | | | 180 | | | | 38 | | | | - | | | | 142 | | | | 373.7 | |
Interest earned on investment securities available for sale | | | 3,820 | | | | 4,017 | | | | 5,059 | | | | (197 | ) | | | (4.9 | ) |
Interest and fees earned on loans | | | 35,492 | | | | 38,344 | | | | 40,075 | | | | (2,852 | ) | | | (7.4 | ) |
Total interest income | | | 39,650 | | | | 42,538 | | | | 45,390 | | | | (2,888 | ) | | | (6.8 | ) |
| | | | | | | | | | | | | | | | | | | | | |
Interest expense | | | | | | | | | | | | | | | | | | | | |
Interest expense on deposits | | | 494 | | | | 2,257 | | | | 5,136 | | | | (1,763 | ) | | | (78.1 | ) |
Interest expense on retail repurchase agreements | | | 2 | | | | 2 | | | | 2 | | | | - | | | | - | |
Interest expense on Federal Home Loan Bank advances | | | 27 | | | | - | | | | - | | | | 27 | | | n/m | |
Interest expense on other borrowings | | | - | | | | 1 | | | | - | | | | (1 | ) | | | (100.0 | ) |
Total interest expense | | | 523 | | | | 2,260 | | | | 5,138 | | | | (1,737 | ) | | | (76.9 | ) |
| | | | | | | | | | | | | | | | | | | | | |
Net interest income | | | 39,127 | | | | 40,278 | | | | 40,252 | | | | (1,151 | ) | | | (2.9 | ) |
| | | | | | | | | | | | | | | | | | | | | |
Provision for loan losses | | | (2,300 | ) | | | 3,465 | | | | 13,075 | | | | (5,765 | ) | | | (166.4 | ) |
| | | | | | | | | | | | | | | | | | | | | |
Net interest income after provision for loan losses | | | 41,427 | | | | 36,813 | | | | 27,177 | | | | 4,614 | | | | 12.5 | |
| | | | | | | | | | | | | | | | | | | | | |
Noninterest income | | | | | | | | | | | | | | | | | | | | |
Service charges on deposit accounts, net | | | 7,027 | | | | 6,902 | | | | 6,691 | | | | 125 | | | | 1.8 | |
Fees for trust, investment management and brokerage services | | | 642 | | | | 2,039 | | | | 3,092 | | | | (1,397 | ) | | | (68.5 | ) |
Mortgage-banking | | | 1,509 | | | | 2,008 | | | | 3,139 | | | | (499 | ) | | | (24.9 | ) |
Debit card and automatic teller machine income, net | | | 2,437 | | | | 2,400 | | | | 2,171 | | | | 37 | | | | 1.5 | |
Investment securities gains, net | | | 125 | | | | 310 | | | | 10,494 | | | | (185 | ) | | | (59.7 | ) |
Trading account income, net | | | 501 | | | | 170 | | | | - | | | | 331 | | | | 194.7 | |
Gain on sale of branches | | | - | | | | - | | | | 568 | | | | - | | | n/m | |
Other | | | 1,297 | | | | 1,007 | | | | 875 | | | | 290 | | | | 28.8 | |
Total noninterest income | | | 13,538 | | | | 14,836 | | | | 27,030 | | | | (1,298 | ) | | | (8.7 | ) |
| | | | | | | | | | | | | | | | | | | | | |
Noninterest expense | | | | | | | | | | | | | | | | | | | | |
Salaries and other personnel | | | 18,750 | | | | 20,107 | | | | 21,088 | | | | (1,357 | ) | | | (6.7 | ) |
Occupancy | | | 4,319 | | | | 4,242 | | | | 4,455 | | | | 77 | | | | 1.8 | |
Furniture and equipment | | | 3,971 | | | | 3,731 | | | | 3,378 | | | | 240 | | | | 6.4 | |
Professional services | | | 2,883 | | | | 2,083 | | | | 1,715 | | | | 800 | | | | 38.4 | |
Federal Deposit Insurance Corporation deposit insurance assessment | | | 1,142 | | | | 1,439 | | | | 1,861 | | | | (297 | ) | | | (20.6 | ) |
Marketing | | | 1,058 | | | | 1,051 | | | | 1,384 | | | | 7 | | | | 0.7 | |
Foreclosed real estate writedowns and expenses | | | 1,827 | | | | 3,373 | | | | 9,285 | | | | (1,546 | ) | | | (45.8 | ) |
Loss (gain) on other loans held for sale | | | - | | | | (326 | ) | | | 3,660 | | | | 326 | | | | (100.0 | ) |
Loan workout | | | 505 | | | | 1,066 | | | | 1,273 | | | | (561 | ) | | | (52.6 | ) |
Other | | | 5,686 | | | | 5,567 | | | | 5,251 | | | | 119 | | | | 2.1 | |
Total noninterest expense | | | 40,141 | | | | 42,333 | | | | 53,350 | | | | (2,192 | ) | | | (5.2 | ) |
| | | | | | | | | | | | | | | | | | | | | |
Income before provision (benefit) for income taxes | | | 14,824 | | | | 9,316 | | | | 857 | | | | 5,508 | | | | 59.1 | |
| | | | | | | | | | | | | | | | | | | | | |
Provision (benefit) for income taxes | | | 5,469 | | | | (18,415 | ) | | | 2,721 | | | | 23,884 | | | | (129.7 | ) |
| | | | | | | | | | | | | | | | | | | | | |
Net income (loss) | | $ | 9,355 | | | $ | 27,731 | | | $ | (1,864 | ) | | $ | (18,376 | ) | | | (66.3 | )% |
| | | | | | | | | | | | | | | | | | | | | |
Common and per common share data | | | | | | | | | | | | | | | | | | | | |
Net income (loss) - basic | | $ | 0.73 | | | $ | 2.17 | | | $ | (0.15 | ) | | $ | (1.44 | ) | | | (66.4 | )% |
Net income (loss) - diluted | | | 0.73 | | | | 2.17 | | | | (0.15 | ) | | | (1.44 | ) | | | (66.4 | ) |
Cash dividends declared | | | 0.10 | | | | - | | | | - | | | | 0.10 | | | n/m | |
Book value | | | 10.39 | | | | 9.68 | | | | 7.71 | | | | 0.71 | | | | 7.3 | |
| | | | | | | | | | | | | | | | | | | | | |
Weighted average basic common shares | | | 12,696,777 | | | | 12,658,752 | | | | 12,639,379 | | | | | | | | | |
Weighted average diluted common shares | | | 12,761,885 | | | | 12,658,752 | | | | 12,639,379 | | | | | | | | | |
Net Interest Income
Net interest income is our primary source of earnings. Net interest income is the difference between interest income earned on interest-earning assets, primarily loans and investment securities, and interest expense incurred on interest-bearing deposits and other interest-bearing liabilities. The net interest margin measures the difference between the interest income earned on interest-earning assets and the interest expense incurred to fund those assets. Changes in interest rates earned on interest-earning assets and interest rates paid on interest-bearing liabilities, the rate of growth of the interest-earning assets and interest-bearing liabilities, the ratio of interest-earning assets to interest-bearing liabilities and the management of interest-rate sensitivity factor into fluctuations in net interest income.
Net interest income totaled $39.1 million and $40.3 million for the years ended December 31, 2014 and 2013, respectively.
Overall, net interest income for the year ended December 31, 2014 was impacted by the following:
| | ● | A continuation of the low interest-rate environment that generally began with the Federal Reserve’s actions to reduce short-term interest rates and subsequent quantitative easing measures which reduced longer-term rates. In response, taking into consideration the interest income earned on interest-earning assets and interest expense incurred on interest-bearing deposits and other interest-bearing liabilities, we refined the type of loan and deposit products we pursue and are exercising discipline in our loan and deposit pricing. We also utilize interest-rate floors on loans although current competitive pressures make the ability to obtain such floors more difficult. At December 31, 2014, loans aggregating $180.6 million had interest-rate floors, of which $90.8 million had floors greater than or equal to 4.50%. |
| | ● | The mix of our loan portfolio between fixed and variable rate loans. Based on the shape of the yield curve over the past few years, variable rate loans have been originated at a lower current rate than fixed rate loans. At December 31, 2014, loans aggregating $281.5 million (35% of our gross loan portfolio) are variable rate loans which will reprice upwards when interest rates rise. |
| | ● | Very competitive loan pricing for credit-worthy clients, which has resulted in lower interest rates on loan originations and a decline in the overall yield on our loan portfolio, although these rates are still in excess of those for alternative uses of funds such as investment securities of similar duration. |
| | ● | Foregone interest on nonaccrual loans for the year ended December 31, 2014 and 2013 totaling $478 thousand and $757 thousand, respectively. |
| | ● | An increase of $13.5 million (1.8%) in average gross loansduring 2014 as compared to 2013 as new loan originations and purchases outpaced loan repayments, sales, foreclosures and charge-offs. Because most of our 2014 loan originations and purchases were weighted toward the last months of the third quarter and during the fourth quarter, we only earned interest income on these loans during a portion of the year. We are actively pursuing new loan originations and are focused on generating additional loan growth to borrowers with acceptable credit and financial strength. |
| | ● | To attempt to avoid a similar decline in interest income in 2015, in late 2014 we began the execution of an earning asset strategy to begin 2015 with a higher level of earning assets, both to replace loans resulting from unscheduled payoffs in the fourth quarter 2014 and to supplement temporarily our organic loan growth to start 2015. The strategy included retaining on our balance sheet residential mortgage and SBA loan production (which we resumed selling in January 2015), and purchases of loan pools, a loan participation and trading account assets. The earning asset purchases included a pool of residential mortgage loans for $14.0 million in the third quarter 2014, a pool of indirect auto loans for $22.1 million in the fourth quarter 2014, a commercial loan participation of $5.0 million in the fourth quarter, a pool of residential mortgage loans for $12.3 million in the first quarter 2015 and an additional $4.5 million investment in our trading account in January 2015. The loans purchased were subjected to our normal internal due diligence and underwriting guidelines prior to purchase. The earning asset purchases were primarily funded by short-term FHLB advances that we expect to replace with deposits in 2015. |
| | ● | Reduction in time deposits to lower our overall cost of funds and focus our efforts on relationship banking to reduce the number of single-product households that only maintain time deposit accounts with the Bank. Our opportunity to further reduce time deposit costs is limited as the weighted-average rate of time deposits scheduled to mature during 2015 is 0.16%. In addition, we may pursue issuing higher priced CDs to replace our FHLB advances borrowed in December 2014 and January 2015. |
| | ● | A general flattening of the yield curve during 2014 as short-term rates increased to reflect heightened expectations that the Federal Reserve will begin to increase the federal funds rate in 2015 and lower long term rates reflecting continued global economic uncertainty. Based on the fixed versus variable composition of our loan portfolio, relatively short duration of our investment securities portfolio and expected lag in deposit re-pricing compared to loan re-pricing, over time an increase in interest rates to historical levels is expected to improve our net interest margin. |
| | ● | Increasing earning assets, including alternative investments. For example, in addition to the loan purchases as described above, in 2013 and 2014 we invested a total of $600 thousand in a small business investment fund (with a maximum potential investment of $2.0 million), $5.0 million in a municipal bond trading account and $10.0 million in BOLI policies. |
Average Balance Sheets and Net Interest Income / Margin Analysis. The following table summarizes our average balance sheets and changes in net interest income / margin for the periods indicated (dollars in thousands). Our yields earned on interest-earning assets and rates incurred on interest-bearing liabilities shown in the table are derived by dividing interest income and expense by the average balances of interest-earning assets or interest-bearing liabilities, respectively. The following table does not include a tax-equivalent adjustment to net interest income for interest-earning assets earning tax-exempt income to a comparable yield on a taxable basis.
| | | For the years ended December 31, | |
| | | 2014 | | | 2013 | | | 2012 | |
| | | Average | | | Income/ | | | Yield/ | | | Average | | | Income/ | | | Yield/ | | | Average | | | Income/ | | | Yield/ | |
| | | balance | | | expense | | | rate | | | balance | | | expense | | | rate | | | balance | | | expense | | | rate | |
Assets | | | | | | | | | | | | | | | | | | | | | | | | | | | | | | | | | | | | |
Interest-earning assets | | | | | | | | | | | | | | | | | | | | | | | | | | | | | | | | | | | | |
Cash and cash equivalents | | $ | 49,629 | | | $ | 93 | | | | 0.19 | % | | $ | 46,739 | | | $ | 100 | | | | 0.21 | % | | $ | 92,988 | | | $ | 209 | | | | 0.22 | % |
Federal Home Loan Bank stock | | | 1,616 | | | | 65 | | | | 4.02 | | | | 1,497 | | | | 39 | | | | 2.61 | | | | 2,503 | | | | 47 | | | | 1.88 | |
Trading account assets | | | 5,345 | | | | 180 | | | | 3.37 | | | | 1,441 | | | | 38 | | | | 2.64 | | | | - | | | | - | | | | - | |
| | | | | | | | | | | | | | | | | | | | | | | | | | | | | | | | | | | | | |
Investment securities available for sale, taxable (1) | | | 204,661 | | | | 3,633 | | | | 1.78 | | | | 239,564 | | | | 3,718 | | | | 1.55 | | | | 212,119 | | | | 3,272 | | | | 1.54 | |
Investment securities available for sale, nontaxable (1) | | | 6,087 | | | | 187 | | | | 3.07 | | | | 9,134 | | | | 299 | | | | 3.27 | | | | 57,118 | | | | 1,787 | | | | 3.13 | |
Total investment securities available for sale | | | 210,748 | | | | 3,820 | | | | 1.81 | | | | 248,698 | | | | 4,017 | | | | 1.62 | | | | 269,237 | | | | 5,059 | | | | 1.88 | |
| | | | | | | | | | | | | | | | | | | | | | | | | | | | | | | | | | | | | |
Loans (2) | | | 761,515 | | | | 35,492 | | | | 4.66 | | | | 749,138 | | | | 38,344 | | | | 5.12 | | | | 758,207 | | | | 40,075 | | | | 5.29 | |
Total interest-earning assets | | | 1,028,853 | | | | 39,650 | | | | 3.85 | | | | 1,047,513 | | | | 42,538 | | | | 4.06 | | | | 1,122,935 | | | | 45,390 | | | | 4.04 | |
| | | | | | | | | | | | | | | | | | | | | | | | | | | | | | | | | | | | | |
Noninterest-earning assets | | | | | | | | | | | | | | | | | | | | | | | | | | | | | | | | | | | | |
Cash and cash equivalents | | | 9,702 | | | | | | | | | | | | 9,629 | | | | | | | | | | | | 10,663 | | | | | | | | | |
Allowance for loan losses | | | (15,820 | ) | | | | | | | | | | | (17,230 | ) | | | | | | | | | | | (20,483 | ) | | | | | | | | |
Premises and equipment, net | | | 22,727 | | | | | | | | | | | | 24,172 | | | | | | | | | | | | 25,187 | | | | | | | | | |
Accrued interest receivable | | | 3,318 | | | | | | | | | | | | 3,513 | | | | | | | | | | | | 4,265 | | | | | | | | | |
Foreclosed real estate | | | 7,250 | | | | | | | | | | | | 9,339 | | | | | | | | | | | | 18,631 | | | | | | | | | |
Deferred tax asset, net | | | 19,305 | | | | | | | | | | | | 5,968 | | | | | | | | | | | | - | | | | | | | | | |
Other assets | | | 20,947 | | | | | | | | | | | | 12,459 | | | | | | | | | | | | 13,776 | | | | | | | | | |
Total noninterest-earning assets | | | 67,429 | | | | | | | | | | | | 47,850 | | | | | | | | | | | | 52,039 | | | | | | | | | |
Total assets | | $ | 1,096,282 | | | | | | | | | | | $ | 1,095,363 | | | | | | | | | | | $ | 1,174,974 | | | | | | | | | |
| | | | | | | | | | | | | | | | | | | | | | | | | | | | | | | | | | | | | |
Liabilities and shareholders' equity | | | | | | | | | | | | | | | | | | | | | | | | | | | | | | | | | | | | |
Liabilities | | | | | | | | | | | | | | | | | | | | | | | | | | | | | | | | | | | | |
Interest-bearing liabilities | | | | | | | | | | | | | | | | | | | | | | | | | | | | | | | | | | | | |
Transaction deposits | | $ | 323,169 | | | $ | 41 | | | | 0.01 | % | | $ | 309,214 | | | $ | 39 | | | | 0.01 | % | | $ | 300,189 | | | $ | 39 | | | | 0.01 | % |
Money market deposits | | | 137,115 | | | | 38 | | | | 0.03 | | | | 134,462 | | | | 32 | | | | 0.02 | | | | 134,093 | | | | 47 | | | | 0.04 | |
Savings deposits | | | 87,091 | | | | 9 | | | | 0.01 | | | | 77,147 | | | | 10 | | | | 0.01 | | | | 65,710 | | | | 9 | | | | 0.01 | |
Time deposits | | | 181,593 | | | | 406 | | | | 0.22 | | | | 255,070 | | | | 2,176 | | | | 0.85 | | | | 367,402 | | | | 5,041 | | | | 1.37 | |
Total interest-bearing deposits | | | 728,968 | | | | 494 | | | | 0.07 | | | | 775,893 | | | | 2,257 | | | | 0.29 | | | | 867,394 | | | | 5,136 | | | | 0.59 | |
| | | | | | | | | | | | | | | | | | | | | | | | | | | | | | | | | | | | | |
Retail repurchase agreements | | | 20,054 | | | | 2 | | | | 0.01 | | | | 18,916 | | | | 2 | | | | 0.01 | | | | 20,485 | | | | 2 | | | | 0.01 | |
Federal Home Loan Bank advances | | | 12,205 | | | | 27 | | | | 0.22 | | | | 425 | | | | - | | | | - | | | | 1 | | | | - | | | | - | |
Other borrowings | | | 16 | | | | - | | | | - | | | | 159 | | | | 1 | | | | 0.63 | | | | 30 | | | | - | | | | - | |
Total interest-bearing liabilities | | | 761,243 | | | | 523 | | | | 0.07 | | | | 795,393 | | | | 2,260 | | | | 0.28 | | | | 887,910 | | | | 5,138 | | | | 0.58 | |
| | | | | | | | | | | | | | | | | | | | | | | | | | | | | | | | | | | | | |
Noninterest-bearing liabilities | | | | | | | | | | | | | | | | | | | | | | | | | | | | | | | | | | | | |
Noninterest-bearing deposits | | | 200,350 | | | | | | | | | | | | 185,102 | | | | | | | | | | | | 176,366 | | | | | | | | | |
Other liabilities | | | 5,117 | | | | | | | | | | | | 8,460 | | | | | | | | | | | | 10,680 | | | | | | | | | |
Total noninterest-bearing liabilities | | | 205,467 | | | | | | | | | | | | 193,562 | | | | | | | | | | | | 187,046 | | | | | | | | | |
| | | | | | | | | | | | | | | | | | | | | | | | | | | | | | | | | | | | | |
Total liabilities | | | 966,710 | | | | | | | | | | | | 988,955 | | | | | | | | | | | | 1,074,956 | | | | | | | | | |
| | | | | | | | | | | | | | | | | | | | | | | | | | | | | | | | | | | | | |
Shareholders' equity | | | 129,572 | | | | | | | | | | | | 106,408 | | | | | | | | | | | | 100,018 | | | | | | | | | |
| | | | | | | | | | | | | | | | | | | | | | | | | | | | | | | | | | | | | |
Total liabilities and shareholders' equity | | $ | 1,096,282 | | | | | | | | | | | $ | 1,095,363 | | | | | | | | | �� | | $ | 1,174,974 | | | | | | | | | |
| | | | | | | | | | | | | | | | | | | | | | | | | | | | | | | | | | | | | |
| | | | | | | | | | | | | | | | | | | | | | | | | | | | | | | | | | | | | |
NET INTEREST INCOME / NET INTEREST MARGIN | | | | | | $ | 39,127 | | | | 3.80 | % | | | | | | $ | 40,278 | | | | 3.85 | % | | | | | | $ | 40,252 | | | | 3.58 | % |
(1) | The average balances for investment securities include the applicable net unrealized gain or loss recorded for available for sale securities. |
(2) | Calculated including mortgage and other loans held for sale excluding the allowance for loan losses. Nonaccrual loansare included in average balances for yield computations. The impact of foregone interest income as a result of loans on nonaccrual was notconsidered in the above analysis. All loans and deposits are domestic. |
Rate / Volume Analysis. The following rate / volume analyses summarize the dollar amount of changes in interest income and interest expense attributable to changes in volume and the amount attributable to changes in rate when comparing the periods indicated (in thousands). The impact of the combination of rate and volume change has been allocated between the rate change and volume change. The comparison includes a change factor that captures the impact of the difference in the number of days when comparing the periods, which has also been allocated between the rate change and volume change.
| | | For the year ended December 31, 2014 compared with the year ended December 31, 2013 | |
| | | Change in | | | Change in | | | Total | |
| | | volume | | | rate | | | change | |
Assets | | | | | | | | | | | | |
Interest-earning assets | | | | | | | | | | | | |
Cash and cash equivalents | | $ | 7 | | | $ | (14 | ) | | $ | (7 | ) |
Federal Home Loan Bank stock | | | 3 | | | | 23 | | | | 26 | |
Trading account assets | | | 128 | | | | 14 | | | | 142 | |
Investment securities available for sale | | | (990 | ) | | | 793 | | | | (197 | ) |
Loans (1) | | | 647 | | | | (3,499 | ) | | | (2,852 | ) |
Total interest income | | | (205 | ) | | | (2,683 | ) | | | (2,888 | ) |
| | | | | | | | | | | | | |
Liabilities and shareholders' equity | | | | | | | | | | | | |
Interest-bearing liabilities | | | | | | | | | | | | |
Transaction deposits | | | 2 | | | | - | | | | 2 | |
Money market deposits | | | 1 | | | | 5 | | | | 6 | |
Savings deposits | | | 1 | | | | (2 | ) | | | (1 | ) |
Time deposits | | | (497 | ) | | | (1,273 | ) | | | (1,770 | ) |
Total interest-bearing deposits | | | (493 | ) | | | (1,270 | ) | | | (1,763 | ) |
| | | | | | | | | | | | | |
Retail repurchase agreements | | | - | | | | - | | | | - | |
Federal Home Loan Bank advances | | | - | | | | 27 | | | | 27 | |
Other borrowings | | | - | | | | (1 | ) | | | (1 | ) |
Total interest expense | | | (493 | ) | | | (1,244 | ) | | | (1,737 | ) |
| | | | | | | | | | | | | |
Net interest income | | $ | 288 | | | $ | (1,439 | ) | | $ | (1,151 | ) |
| | | For the year ended December 31, 2013 compared with the year ended December 31, 2012 | |
| | | Change in | | | Change in | | | Total | |
| | | volume | | | rate | | | change | |
Assets | | | | | | | | | | | | |
Interest-earning assets | | | | | | | | | | | | |
Cash and cash equivalents | | $ | (99 | ) | | $ | (10 | ) | | $ | (109 | ) |
Federal Home Loan Bank stock | | | (152 | ) | | | 144 | | | | (8 | ) |
Trading account assets | | | 38 | | | | - | | | | 38 | |
Investment securities available for sale | | | (367 | ) | | | (675 | ) | | | (1,042 | ) |
Loans (1) | | | (475 | ) | | | (1,256 | ) | | | (1,731 | ) |
Total interest income | | | (1,055 | ) | | | (1,797 | ) | | | (2,852 | ) |
| | | | | | | | | | | | | |
Liabilities and shareholders' equity | | | | | | | | | | | | |
Interest-bearing liabilities | | | | | | | | | | | | |
Transaction deposits | | | 1 | | | | (1 | ) | | | - | |
Money market deposits | | | - | | | | (15 | ) | | | (15 | ) |
Savings deposits | | | 1 | | | | - | | | | 1 | |
Time deposits | | | (1,280 | ) | | | (1,585 | ) | | | (2,865 | ) |
Total interest-bearing deposits | | | (1,278 | ) | | | (1,601 | ) | | | (2,879 | ) |
| | | | | | | | | | | | | |
Retail repurchase agreements | | | - | | | | - | | | | - | |
Federal Home Loan Bank advances | | | - | | | | - | | | | - | |
Other borrowings | | | 1 | | | | - | | | | 1 | |
Total interest expense | | | (1,277 | ) | | | (1,601 | ) | | | (2,878 | ) |
| | | | | | | | | | | | | |
Net interest income | | $ | 222 | | | $ | (196 | ) | | $ | 26 | |
(1) | Calculated including mortgage and other loans held for sale, excluding the allowance for loan losses |
Provision for Loan Losses
A negative provision for loan losses of $2.3 million was recorded during 2014 compared to provisions for loan losses of $3.5 million and $13.1 million during 2013 and 2012, respectively. This reduction reflects our improved credit quality, an increasing proportion of commercial loans that have been more recently originated under our improved underwriting standards and generally improving economic conditions. The following table summarizes credit quality key performance indicators impacting the level of the provision for loan losses recorded in 2014, 2013 and 2012 (in thousands).
| | | | | | | | | | | | | | | 2014 to 2013 comparison | |
| | | At and for the years ended December 31, | | | Dollar | | | Percent | |
| | | 2014 | | | 2013 | | | 2012 | | | variance | | | variance | |
Net loans charged-off | | $ | 1,265 | | | $ | 4,805 | | | $ | 20,846 | | | $ | (3,540 | ) | | | (73.7 | )% |
Nonaccrual loans | | | 12,463 | | | | 15,108 | | | | 15,848 | | | | (2,645 | ) | | | (17.5 | ) |
Loans past due greater than 90 days and still accruing | | | 238 | | | | - | | | | - | | | | 238 | | | n/m | |
Loans past due 30-89 days and still accruing | | | 3,885 | | | | 3,202 | | | | 7,580 | | | | 683 | | | | 21.3 | |
Classified loans | | | 38,497 | | | | 43,162 | | | | 63,671 | | | | (4,665 | ) | | | (10.8 | ) |
Troubled debt restructurings | | | 19,871 | | | | 28,928 | | | | 33,278 | | | | (9,057 | ) | | | (31.3 | ) |
The lower level of problem assets, coupled with anticipated loan growth, is expected to result in a more stable provision for loan losses going forward. In addition, we continue to pursue the recovery of previously charged-off balances, the receipt of which may impact the level of future provisions for loan losses. Absent unexpected negative trends in credit quality, we expect our annual net charge-offs to normalize in 2015 at 25 to 35 basis points of average loans outstanding.
For disclosure regarding our accounting policies related to the factors impacting and methodology for analyzing the adequacy of our allowance for loan losses and, therefore, our provision for loan losses, see Item 8. Financial Statements and Supplementary Data, Note 1, Summary of Significant Accounting Policies.
Noninterest Income
The following table summarizes the components of noninterest income for the periods indicated (in thousands).
| | | For the years ended December 31, | |
| | | 2014 | | | 2013 | | | 2012 | |
Service charges on deposit accounts, net | | $ | 7,027 | | | $ | 6,902 | | | $ | 6,691 | |
Fees for trust, investment management and brokerage services | | | 642 | | | | 2,039 | | | | 3,092 | |
Mortgage-banking | | | 1,509 | | | | 2,008 | | | | 3,139 | |
Debit card and automatic teller machine income, net | | | 2,437 | | | | 2,400 | | | | 2,171 | |
Investment securities gains, net | | | 125 | | | | 310 | | | | 10,494 | |
Trading account income, net | | | 501 | | | | 170 | | | | - | |
Gain on sale of branches | | | - | | | | - | | | | 568 | |
Other | | | 1,297 | | | | 1,007 | | | | 875 | |
Total noninterest income | | $ | 13,538 | | | $ | 14,836 | | | $ | 27,030 | |
Service Charges on DepositAccounts, Net. Service charges on deposit accounts, net comprise a significant component of noninterest income and totaled 1.3% and 1.4% of average transaction deposit balances for the years ended December 31, 2014 and 2013, respectively. In general, we believe the slower increase in service charges between 2013 and 2014 is the result of industry and regulatory efforts to better inform consumers regarding NSF and overdraft programs, including the prohibition under Regulation E of assessing overdraft fees on point of sale transactions unless the depositor has opted into an overdraft program.
During 2013, we implemented tiered NSF pricing and a reduction in courtesy overdraft limits in connection with changes to our MyPalmetto checking account product. The revised NSF pricing structure resulted in a reduction in the amount of NSF fees for most of our clients who trigger an occasional NSF item while increasing our overall fees for those clients using this service on a recurring basis.
During the first half of 2014, we performed an analysis of service charges on deposit accounts including comparison of our pricing to our local market competitors. As a result, we implemented selected fee changes with most of the changes effective July 1, 2014 and September 1, 2014. Among the changes were changes related to the NSF tiered pricing structure, overdraft fees, including a decrease in the time period before a daily overdraft fee is assessed from eight business days to five business days, an increase in the overdraft protection transfer fee from $5 to $10 per transfer and an increase in the courtesy overdraft amount from $1 to $5 that will not result in an item return / item paid fee on accounts overdrawn at the end of the business day by $5 or less.
We also refined the features of selected deposit products and introduced new products effective September 1, 2014, including a new basic business checking account and the re-introduction of student checking. These changes, along with other selected loan related and other fee increases, are projected to increase noninterest income by approximately $750 thousand in 2015 as compared to 2014.
Fees for Trust, Investment Management and Brokerage Services. In June 2013, we transferred all of our trust-related accounts to TNB. Contemporaneously with the transfer, we also began an arrangement with TNB under which we provide office space and other support services in our existing facilities to the TNB employees who provide the trust services. In accordance with the agreements, TNB assumed ownership of the accounts, certain of our trust employees and all operational and fiduciary responsibility for administering the transferred accounts under the underlying client account agreements. In exchange, we earn a percentage of the ongoing revenues generated from the assets under management in the transferred accounts owned by TNB and any new accounts subsequently referred to TNB.
In August 2013, we entered into an agreement with IPI, which replaced a similar agreement with a different broker-dealer, which permits IPI to provide brokerage services to our clients including acting as clearing agent, executing purchases and sales of securities products on behalf of and for the account of clients and maintaining securities in client accounts as agent. Under the Agreement, we provide office space and other support services in our existing facilities to the IPI employees who provide the brokerage services. In exchange, we earn a percentage of the ongoing revenues generated from the brokerage assets managed by IPI under the agreement.
Other than an immaterial amount of contract termination costs, execution of the agreements did not result in any gain or loss upon the consummation of these transactions.
The decrease in trust, investment management and brokerage services revenue during 2014 as compared to 2013 was primarily the result of the transfer of our trust accounts to TNB since we no longer earn the gross trust revenues but only earn a percentage of the revenues under our revenue sharing arrangement and conversion of our brokerage platform to IPI. For both trust and brokerage, we also transferred the teammates to TNB and IPI so we no longer incur the personnel costs. Accordingly, while our gross trust, investment management and brokerage revenues declined period over period, we also had a similar decline in salaries, personnel and other operating costs. On a net basis, our earnings related to trust and brokerage declined slightly while the transitions occurred in 2013 but have since increased with the expectation that they will eventually exceed our historical levels going forward.
The trust and brokerage actions are part of our more integrated go-forward Wealth Management strategy to provide our clients seamless access to the comprehensive suite of products and services they need to achieve their financial goals. For trust and brokerage services, TNB and IPI, respectively, have invested and continue to invest in additional resources with relevant expertise and a focus on business development to obtain new clients and grow assets under management. In addition, in 2013 we hired a Private Banker who serves in a key relationship management role in our Wealth Management business.
Mortgage-Banking. We normally sell the residential mortgage loans we originate and retain the obligation to service these loans in order to maintain the client relationships. During the third quarter 2014, we made a strategic decision to retain, rather than sell, the majority of mortgage loans originated over the remainder of 2014 in order to supplement our organic loan growth.
The following table summarizes the components of mortgage-banking income for the periods indicated (dollars in thousands).
| | | For the years ended December 31, | |
| | | 2014 | | | 2013 | | | 2012 | |
Mortgage-servicing fees | | $ | 970 | | | $ | 1,000 | | | $ | 1,065 | |
Gain on sale of mortgage loans held for sale | | | 1,178 | | | | 1,803 | | | | 2,585 | |
Mortgage-servicing rights portfolio amortization and impairment | | | (573 | ) | | | (765 | ) | | | (866 | ) |
Derivative loan commitment expense | | | (88 | ) | | | (164 | ) | | | (28 | ) |
Forward sales commitment expense | | | (42 | ) | | | (4 | ) | | | (63 | ) |
Other | | | 64 | | | | 138 | | | | 446 | |
Total mortgage-banking income | | $ | 1,509 | | | $ | 2,008 | | | $ | 3,139 | |
| | | | | | | | | | | | | |
Mortgage-servicing fees as a percentage of average mortgage loans serviced for the benefit of others | | | 0.25 | % | | | 0.26 | % | | | 0.27 | % |
Mortgage loans originated during 2014 decreased to $43.0 million compared to $67.8 million during 2013. The gain on sale of mortgage loans decreased during 2014 as compared with 2013 due to a decline in proceeds from loans sold from $74.0 million during 2013 to $44.8 million during 2014 which was partially offset by improved pricing. As a result of our decision to retain our mortgage loan production during the third quarter 2014, $12.4 million of mortgage loan originations during the third and fourth quarters 2014 were retained on the balance sheet as opposed to being sold. In 2015, we returned to selling the residential mortgage loans we originate, but may subsequently decide to retain a portion in order to supplement our organic loan growth.
Mortgage-banking income during 2014 and 2013 was also impacted by fair market value adjustments on mortgage loan origination and sales commitments considered derivative financial instruments. The value of mortgage loan origination and sales commitments fluctuates based on the change in interest rates between the time we enter into the commitment to originate / sell the loans and the balance sheet date. Since we have historically sold the mortgage loans we originate each quarter, the notional amount of our commitments to originate mortgage loans held for sale have been accounted for as derivative financial instruments and reflected at fair market value in the Consolidated Balance Sheets.
Debit Card and AutomatedTeller Machine Income, Net. Debit card and automated teller machine income, net increased $37 thousand (1.5%) from 2013 to 2014 primarily as a result of our MyPalmetto checking account product design and rewards program to encourage client debit card use.
Investment Securities Gains, Net.During 2014 and 2013, we realized net gains on the sale of investment securities of $125 thousand and $310 thousand, respectively, as a result of balance sheet management efforts designed to reduce the investment securities portfolio’s exposure to rising interest rates and to manage liquidity.
Trading Account Income, Net. As part of our strategy to diversify our revenues, increase earning assets and effectively utilize our cash balances, during September 2013 we invested $5.0 million in an account managed by a third party to trade municipalsecurities.The following table summarizes trading account related income and expense included in earnings for the periods indicated (in thousands), which in the aggregate resulted in a net return of 7.72% and 8.28% in 2014 and 2013, respectively. Interest earned on trading assets is included in Interest income and investment management expenses are included in Professional services noninterest expense in the Consolidated Statements of Income.
| | | For the years ended December 31, | |
| | | 2014 | | | 2013 | |
Interest earned on trading account assets | | $ | 180 | | | $ | 38 | |
Trading account income, net | | | 501 | | | | 170 | |
Investment management expenses | | | 287 | | | | 90 | |
We invested an additional $4.5 million in January 2015 which we expect to increase our trading account income in 2015.
Other. Other noninterest income increased $290 thousand (28.8%) from 2013 to 2014. This increase was driven by an increase of $261 thousand of income on BOLI policies that were purchased during the fourth quarter 2013 and the benefits of our revenue enhancement initiatives implemented during 2014. Earnings on BOLI policies are intended to help cover the cost of providing benefits to the teammates covered by our various employee benefit programs. This increase was partially offset by lower income related to SBA lending activities of $144 thousand.
Noninterest Expense
In connection with the Strategic Project Plan and additional strategic and tactical actions to align our infrastructure and expense base with our current balance sheet size and the underlying revenue generating capacity of the franchise, we have been focused on identifying and implementing specific noninterest expense reductions and promoting a culture of strategic efficiency. Examples of actions that have resulted in reductions to our overall expense base include:
| | ● | A reduction in problem assets resulting in reduced writedowns and related carrying costs such as legal expenses, property taxes, property insurance and other costs incurred to resolve the problem assets and protect the collateral value, |
| | ● | Freezing most teammate salaries from May 2009 to February 2011 and from February 2012 through February 2013, |
| | ● | Eliminating the annual officer cash incentive plan awards under the corporate officer incentive plan beginning in 2009. In July 2014, we reinstated this plan with any potential payments under the plan tied directly to pre-established Company financial results related to pre-tax income, loan and deposit balances, and asset quality, as well as individual performance. |
| | ● | Suspending the Company’s ongoing regular match under the 401(k) Plan from January 2012 to June 2013, which was reinstated effective July 1, 2013 with the Company providing a match of $0.10 per dollar of participant contributions up to 6% of a teammate’s eligible compensation. The Company’s matching contribution was increased to $0.25 per dollar of participant contributions effective July 1, 2014, |
| | ● | Eliminating officer perquisites, |
| | ● | Reducing the business hours of our branches, |
| | ● | Implementing refined staffing models for our branches resulting in reduced teammate headcount, |
| | ● | Reducing courier runs from our branches, |
| | ● | Reducing marketing expenses and corporate contributions to community and not-for-profit organizations, |
| | ● | Outsourcing and co-sourcing of certain operational functions, |
| | ● | Renegotiating business partner contracts for price reductions and consolidating business partners for volume pricing, |
| | ● | Process improvements for efficiency, |
| | ● | Consolidating two branches and selling two branches in 2012, and |
| | ● | More fully leveraging existing technology, implementing more advanced technology, and automating manual processes. |
As noted in the table below, these expense reduction initiatives contributed to the reductions in total noninterest expense of $11.0 million and $2.2 million in 2013 and 2014, respectively. The initiatives are expected to result in an additional reduction in noninterest expense of at least $500 thousand in 2015 as compared to 2014.
The following table summarizes the components of noninterest expense for the periods indicated (in thousands).
| | | For the years ended December 31, | |
| | | 2014 | | | 2013 | | | 2012 | |
Salaries and other personnel | | $ | 18,750 | | | $ | 20,107 | | | $ | 21,088 | |
Occupancy | | | 4,319 | | | | 4,242 | | | | 4,455 | |
Furniture and equipment | | | 3,971 | | | | 3,731 | | | | 3,378 | |
Professional services | | | 2,883 | | | | 2,083 | | | | 1,715 | |
Federal Deposit Insurance Corporation deposit insurance assessment | | | 1,142 | | | | 1,439 | | | | 1,861 | |
Marketing | | | 1,058 | | | | 1,051 | | | | 1,384 | |
Foreclosed real estate writedowns and expenses | | | 1,827 | | | | 3,373 | | | | 9,285 | |
Loss (gain) on other loans held for sale | | | - | | | | (326 | ) | | | 3,660 | |
Loan workout | | | 505 | | | | 1,066 | | | | 1,273 | |
Other | | | 5,686 | | | | 5,567 | | | | 5,251 | |
Total noninterest expense | | $ | 40,141 | | | $ | 42,333 | | | $ | 53,350 | |
Salaries and Other Personnel. Salaries and other personnel expense declined $1.4 million as a result of fewer average full-time equivalent teammates (primarily related to the trust and brokerage transactions described above, reduction in branch hours to better match client usage patterns of our various delivery channels and refined branch roles resulting in reduced headcount), lower medical insurance premiums, lower pension plan expense and decreased incentives partially offset by a decline in loan origination cost deferrals and, to a lesser extent, increased employer 401(k) contributions. At December 31, 2014, full-time equivalent teammates were 286 compared to 302 at December 31, 2013.
Occupancy and Furniture and Equipment. Occupancy and furniture and equipment expenses increased $317 thousand (4.0%) from 2013 to 2014 due to continued investments in technology to enhance the Client Experience and operational efficiency.
Professional Services. Professional services expense increased $800 thousand from 2013 to 2014. Professional services expense during 2014 included expenses related to the revenue enhancement and process improvement projects, as well as trading asset account management fees. The incremental professional fees from the revenue enhancement and process improvement projects are expected to be more than offset by the combined effect of increased revenues and lower expenses in 2014 and 2015.
Federal Deposit Insurance Corporation Deposit Insurance Assessment. FDIC deposit insurance premiums decreased $297 thousand (20.6%) from 2013 to 2014 due toimprovement in the Bank’s risk tier for assessment purposes as well as a slight fluctuation in our assessment base. FDIC insurance premiums are expected to decline in 2015 as compared to 2014 as a result of a full-year impact of the Bank’s improved risk tier.
Marketing. Marketing expenses increased $7 thousand (0.7%) from 2013 to 2014 and are a function ofthe type, timing and duration of marketing campaigns and initiatives.
Foreclosed Real Estate Writedowns and Expenses. Foreclosed real estate writedowns and expensestotaled $1.8 million for 2014compared to $3.4 million for 2013.
The carrying value of foreclosed real estate is written down to fair value less estimated selling costs based on currently available valuation information primarily from third-party appraisals. The amount of foreclosed real estate writedowns and expenses is a function of the level of foreclosed real estate, the number of properties for which appraisals are received during the period and foreclosed real estate sales activity.
We own 56 residential lots with an aggregate net book value of $4.7 million in three separate communities related to one real estate development. In 2013, ownership of the development was consolidated and its development and marketing plan was refined. We continue to work directly with the primary owner to market and sell our remaining lots. During 2014 and 2013, we recorded writedowns on these properties of $946 thousand and $1.7 million, respectively, to reflect declines in fair value. However, during 2014 we sold all of our lots in one particular development, and sold five other individual lots (all of which were sold at prices above carrying value). At December 31, 2014, two lots with a carrying value of $405 thousand were under contract for sale and closed during January 2015 at prices above carrying value.
Loss(Gain) on Other Loans Heldfor Sale. Loss (gain) on other loans held for sale represents writedowns and gains and losses on sales of problem loans classified as other loans held for sale.
Loan Workout. Loan workout expenses include costs to resolve problem loans such as legal fees, property taxes and operating expenses associated with collateral securing these loans. Changes in loan workout expenses are generally driven by the level of problem assets and pace of problem asset resolution. The level of loan workout expenses reflects the reduction in problem assets since 2012 and we expect these expenses to be lower and less variable going forward.
Other. Other noninterest expense increased $119 thousand (2.1%) from2013 to 2014 primarily as a result of:
| | ● | An increase in the provision for unfunded commitments due to an increase in unfunded loan commitments, |
| | ● | Increased losses associated with fraudulent debit card and checking account activity, and |
| | ● | Writedowns of $253 thousand during 2014 on long-lived assets to reflect a reduction in their estimated fair values based on an updated appraisal and an evaluation of current market conditions. |
These increases were partially offset by:
| | ● | A reduction of $181 thousand in telecommunication expenses as a result of reconfiguring our branch telecommunications network and reducing the number of telecommunications business partners, and |
| | ● | Reduced operating costs in conjunction with the change in our trust, investment management and brokerage services platforms during 2013 as part of our integrated go-forward Wealth Management strategy. |
Provision(Benefit)for Income Taxes
The provision for income taxes for 2014 of $5.5 million included $4.7 million of deferred federal income tax expense, provision for state income tax of $503 thousand and $300 thousand for federal alternative minimum tax. South Carolina banking taxation law does not allow the use of net operating loss carryforwards as an offset to current period taxable income.
The benefit for income taxes for the year ended December 31, 2013 totaled $18.4 million and included a provision of $1.2 million for state income tax and $181 thousand for federal alternative minimum tax. In addition, $22.4 million of the 2013 benefit reflects the reversal of a significant portion of the valuation allowance on the net deferred tax assets that existed at December 31, 2012. That valuation allowance was originally established in 2010 as further described inFinancial Condition,Net Deferred Tax Asset.
For additional disclosure regarding the net deferred tax asset, the valuation allowance on the net deferred tax asset and the provision (benefit) for income taxes, see Critical Accounting Policies and Estimates, Net Deferred Tax Asset and Item 8. Financial Statements and Supplementary Data, Note 14, Income Taxes.
Impact of Inflation and Changing Prices
The Consolidated Financial Statements contained in Item 8 of this Annual Report on Form 10-K and related data have been prepared in accordance with GAAP which requires the measurement of financial condition and results of operations in terms of historical dollars without considering changes in the relative purchasing power of money over time because of inflation.
Unlike most industrial companies, virtually all of the assets and liabilities of a financial institution are monetary. As a result, interest rates have a more significant impact on the performance of a financial institution than the impact of general levels of inflation. Interest rates do not necessarily move in the same direction or in the same magnitude as the price of goods and services since such prices are impacted by inflation. We are committed to continuing to actively manage the gap between our interest-sensitive assets and interest-sensitive liabilities.
ITEM 7A.QUANTITATIVE AND QUALITATIVE DISCLOSURES ABOUT MARKET RISK
Market risk refers to the risk of loss arising from adverse changes in interest rates, foreign exchange rates, commodity prices and other relevant market rates and prices such as equity prices. Due to the nature of our operations, we are primarily exposed to interest-rate risk and liquidity risk. To a lesser degree we are also exposed to equity risk as variability in equity values impacts the amount of our trust and, to a lesser extent, brokerage income and the funded status of our Pension Plan, which was frozen in 2007.
Interest-rate risk within our Consolidated Balance Sheets consists of repricing, option and basis risks. Repricing risk results from differences in the maturity, or repricing, of asset and liability portfolios. Option risk arises from embedded options present in many financial instruments such as loan prepayment options, deposit early withdrawal options and interest-rate caps and floors. These options allow our clients opportunities to benefit when market interest rates change, which typically results in higher expense or lower income for us. Basis risk refers to the potential for changes in the underlying relationship between market rates and indices, which subsequently result in a narrowing of the profit spread on an interest-earning asset or interest-bearing liability. Basis risk is also present in administered-rate liabilities such as savings accounts, interest-bearing checking accounts and money market accounts with respect to which historical pricing relationships to market rates may change due to the level or directional change in market interest rates.
We seek to avoid fluctuations in our net interest margin and to maximize net interest income within acceptable levels of risk through periods of changing interest rates. Accordingly, our ALCO and the Board of Directors monitor our interest-rate sensitivity and liquidity on an ongoing basis. The Board of Directors and the ALCO oversee market-risk management and establish risk measures, limits and policy guidelines for managing the amount of interest-rate risk and its impact on net interest income and capital. The ALCO uses a variety of measures to gain a comprehensive view of the magnitude of interest-rate risk, the distribution of risk, the level of risk over time and the exposure to changes in certain interest-rate relationships.
We utilize a simulation model as the primary quantitative tool in measuring the amount of interest-rate risk associated with changing market rates. The model measures the impact on net interest income relative to a base case scenario of hypothetical fluctuations in interest rates over the coming 12-month and 24-month periods. These simulations incorporate assumptions regarding balance sheet growth and mix, pricing and the repricing and maturity characteristics of the existing and projected Consolidated Balance Sheets. Other interest-rate related risks, such as prepayment, basis and option risk, are also considered in the model.
The ALCO monitors and manages the volume of interest-sensitive assets and interest-sensitive liabilities. Interest-sensitive assets and liabilities are those that reprice or mature within a given timeframe. The objective is to manage the impact of fluctuating market rates on net interest income within acceptable levels. In order to meet this objective and mitigate potential market risk, management develops and implements investment, lending, funding and pricing strategies.
The following table summarizes as of December 31, 2014 the forecasted impact on net interest income over a 12-month horizon using a base case scenario given upward movements in interest rates of 100, 200, 300 and 400 basis points and downward movements in interest rates of 100, 200 and 300 basis points based on forecasted assumptions of prepayment speeds, nominal interest rates and loan and deposit repricing rates. Given the current low interest-rate environment, we have not prepared a parallel interest-rate scenario for downward movements in interest rates of 400 basis points. Estimates are based on current economic conditions, historical interest-rate cycles and other factors deemed to be relevant. However, underlying assumptions may be impacted in future periods which were not known to us at the time of the issuance of the Consolidated Financial Statements. Therefore, our assumptions may or may not prove valid. No assurance can be given that changing economic conditions and other relevant factors impacting our net interest income will not cause actual results to differ from underlying assumptions.
Interest rate scenario (1) | | Percentage change in net interest income from base | |
Up 400 basis points | | 2.57 | % | |
Up 300 basis points | | 1.69 | | |
Up 200 basis points | | 0.78 | | |
Up 100 basis points | | 0.93 | | |
Down 100 basis points | | (4.13 | ) | |
Down 200 basis points | | (5.79 | ) | |
Down 300 basis points | | (8.76 | ) | |
| Down 400 basis points | | n/a | | |
(1) The rising 100, 200, 300 and 400 basis point and falling 100, 200 and 300 basis point interest-rate scenarios assume an immediate and parallel change in interest rates along the entire yield curve.
There are material limitations with the model presented above, which include, but are not limited to:
| | ● | It presents the balance sheet in a static position. When assets and liabilities mature or reprice, they do not necessarily keep the same characteristics, |
| | ● | The computation of prospective impacts of hypothetical interest-rate changes are based on numerous assumptions and should not be relied upon as indicative of actual results, and |
| | ● | The computations do not contemplate any additional actions we could undertake in response to changes in interest rates. |
ITEM 8.FINANCIAL STATEMENTS AND SUPPLEMENTARY DATA
MANAGEMENT’S REPORT ON INTERNAL CONTROL OVER FINANCIAL REPORTING
Management of Palmetto Bancshares, Inc. is responsible for establishing and maintaining adequate internal control over financial reporting as defined in Rule 13a-15(f) of the Securities Exchange Act of 1934 as amended (the Exchange Act). The Company’s internal control over financial reporting is a process designed to provide reasonable assurance regarding the reliability of financial reporting and the preparation of financial statements for external purposes in accordance with accounting principles generally accepted in the United States of America. The Company’s internal control over financial reporting includes those policies and procedures that (1) pertain to the maintenance of records, that in reasonable detail, accurately and fairly reflect the transactions and disposition of the Company’s assets; (2) provide reasonable assurance that transactions are recorded as necessary to permit the preparation of the financial statements in accordance with generally accepted accounting principles and that receipts and expenditures of the Company are being made only in accordance with the authorizations of the Company’s management and directors; and (3) provide reasonable assurance regarding prevention or timely detection of unauthorized acquisition, use or disposition of the Company’s assets that could have a material impact on the financial statements.
Because of its inherent limitations, internal control over financial reporting may not prevent or detect misstatements. Also, projections of any evaluation of effectiveness to future periods are subject to the risk that controls may become inadequate due to changes in conditions, or that the degree of compliance with the policies and procedures may deteriorate.
Management conducted an evaluation of the effectiveness of the internal control over financial reporting based on the framework in Internal Control — Integrated Framework issued by the Committee of Sponsoring Organizations of the Treadway Commission (“COSO”) in 2013. Based on this evaluation under the COSO criteria, management concluded that the internal control over financial reporting was effective as of December 31, 2014.
The effectiveness of the internal control structure over financial reporting as of December 31, 2014 has been audited by Elliott Davis Decosimo, LLC, an independent registered public accounting firm, as stated in their report included in this Annual Report on Form 10-K, which expresses an unqualified opinion on the effectiveness of the Company’s internal control over financial reporting as of December 31, 2014.
/s/ Samuel L. Erwin | /s/ Roy D. Jones |
| |
Samuel L. Erwin, | Roy D. Jones, |
Chief Executive Officer | Chief Financial Officer |
Palmetto Bancshares, Inc. | Palmetto Bancshares, Inc. |
REPORT OF INDEPENDENT REGISTERED PUBLIC ACCOUNTING FIRM
To the Board of Directors and Shareholders
Palmetto Bancshares, Inc.
Greenville, South Carolina
We have audited Palmetto Bancshares Inc. and Subsidiary's (the “Company”) internal control over financial reporting as of December 31, 2014, based on criteria established inInternal Control — Integrated Framework issued by the Committee of Sponsoring Organizations of the Treadway Commission in 2013 (the “COSO criteria”). The Company’s management is responsible for maintaining effective internal control over financial reporting and for its assessment of the effectiveness of internal control over financial reporting included in the accompanying Management’s Report on Internal Control over Financial Reporting. Our responsibility is to express an opinion on the Company's internal control over financial reporting based on our audit.
We conducted our audit in accordance with the standards of the Public Company Accounting Oversight Board (United States). Those standards require that we plan and perform the audit to obtain reasonable assurance about whether effective internal control over financial reporting was maintained in all material respects. Our audit included obtaining an understanding of internal control over financial reporting, assessing the risk that a material weakness exists, and testing and evaluating the design and operating effectiveness of internal control based on the assessed risk. Our audit also included performing such other procedures as we considered necessary in the circumstances. We believe that our audit provides a reasonable basis for our opinion.
A company's internal control over financial reporting is a process designed to provide reasonable assurance regarding the reliability of financial reporting and the preparation of financial statements for external purposes in accordance with generally accepted accounting principles. A company's internal control over financial reporting includes those policies and procedures that(a) pertain to the maintenance of records that, in reasonable detail, accurately and fairly reflect the transactions and dispositions of the assets of the company;(b) provide reasonable assurance that transactions are recorded as necessary to permit preparation of financial statements in accordance with generally accepted accounting principles, and that receipts and expenditures of the company are being made only in accordance with authorizations of management and directors of the company; and(c) provide reasonable assurance regarding prevention or timely detection of unauthorized acquisition, use, or disposition of the company's assets that could have a material effect on the financial statements.
Because of its inherent limitations, internal control over financial reporting may not prevent or detect misstatements. Also, projections of any evaluation of effectiveness to future periods are subject to the risk that controls may become inadequate because of changes in conditions, or that the degree of compliance with the policies or procedures may deteriorate.
In our opinion, Palmetto Bancshares, Inc. and Subsidiary maintained, in all material respects, effective internal control over financial reporting as of December 31, 2014, based on criteria established inInternal Control — Integrated Framework issued by the Committee of Sponsoring Organizations of the Treadway Commission in 2013.
We have also audited, in accordance with the standards of the Public Company Accounting Oversight Board (United States), the consolidated balance sheets of the Company as of December 31, 2014 and 2013 and the related consolidated statements of income (loss), comprehensive income (loss), changes in shareholders’ equity and cash flows for each of the three years in the period ended December 31, 2014 and our report dated March 4, 2015 expressed an unqualified opinion thereon.
/s/ Elliott Davis Decosimo, LLC
Greenville, South Carolina
March 4, 2015
REPORT OF INDEPENDENT REGISTERED PUBLIC ACCOUNTING FIRM
To the Board of Directors and Shareholders
Palmetto Bancshares, Inc.
Greenville, South Carolina
We have audited the accompanying consolidated balance sheets of Palmetto Bancshares, Inc. and Subsidiary (the “Company”) as of December 31, 2014 and 2013, and the related consolidated statements of income (loss), comprehensive income (loss), changes in shareholders' equity and cash flows for each of the three years in the period ended December 31, 2014. These financial statements are the responsibility of the Company's management. Our responsibility is to express an opinion on these financial statements based on our audits.
We conducted our audits in accordance with the standards of the Public Company Accounting Oversight Board (United States). Those standards require that we plan and perform the audit to obtain reasonable assurance about whether the financial statements are free of material misstatement. An audit includes examining, on a test basis, evidence supporting the amounts and disclosures in the financial statements. An audit also includes assessing the accounting principles used and significant estimates made by management, as well as evaluating the overall financial statement presentation. We believe that our audits provide a reasonable basis for our opinion.
In our opinion, the consolidated financial statements referred to above present fairly, in all material respects, the financial position of Palmetto Bancshares, Inc. and Subsidiary as of December 31, 2014 and 2013, and the results of their operations and their cash flows for each of the three years in the period ended December 31, 2014, in conformity with U.S. generally accepted accounting principles.
We have also audited, in accordance with the standards of the Public Company Accounting Oversight Board (United States), the Company’s internal control over financial reporting as of December 31, 2014, based on criteria established inInternal Control — Integrated Framework issued by the Committee of Sponsoring Organizations of the Treadway Commission in 2013, and our report dated March 4, 2015 expressed an unqualified opinion on the effectiveness of Palmetto Bancshares Inc. and Subsidiary’s internal control over financial reporting.
/s/ Elliott Davis Decosimo, LLC
Greenville, South Carolina
March 4, 2015
PALMETTO BANCSHARES, INC. AND SUBSIDIARY
Consolidated Balance Sheets
(dollars in thousands, except per share data)
| | | December 31, | |
| | | 2014 | | | 2013 | |
| | | | | | | | | |
Assets | | | | | | | | |
Cash and cash equivalents | | | | | | | | |
Cash and due from banks | | $ | 36,887 | | | $ | 38,178 | |
Total cash and cash equivalents | | | 36,887 | | | | 38,178 | |
| | | | | | | | | |
Federal Home Loan Bank stock, at cost | | | 2,556 | | | | 2,950 | |
Trading account assets, at fair value | | | 5,513 | | | | 5,118 | |
Investment securities available for sale, at fair value | | | 211,511 | | | | 214,383 | |
Mortgage loans held for sale | | | 1,125 | | | | 1,722 | |
| | | | | | | | | |
Loans, gross | | | 805,059 | | | | 767,513 | |
Less: allowance for loan losses | | | (12,920 | ) | | | (16,485 | ) |
Loans, net | | | 792,139 | | | | 751,028 | |
| | | | | | | | | |
Premises and equipment, net | | | 22,006 | | | | 23,367 | |
Accrued interest receivable | | | 3,387 | | | | 3,535 | |
Foreclosed real estate | | | 5,949 | | | | 7,502 | |
Deferred tax asset, net | | | 17,053 | | | | 22,087 | |
Bank-owned life insurance | | | 11,923 | | | | 11,617 | |
Other assets | | | 8,762 | | | | 8,742 | |
Total assets | $ | 1,118,811 | | | $ | 1,090,229 | |
| | | | | | | | | |
Liabilities and shareholders' equity | | | | | | | | |
Liabilities | | | | | | | | |
Deposits | | | | | | | | |
Noninterest-bearing | | $ | 196,219 | | | $ | 178,075 | |
Interest-bearing | | | 732,101 | | | | 729,285 | |
Total deposits | | | 928,320 | | | | 907,360 | |
| | | | | | | | | |
Retail repurchase agreements | | | 15,921 | | | | 18,175 | |
Federal Home Loan Bank advances | | | 35,000 | | | | 35,000 | |
Other liabilities | | | 6,526 | | �� | | 5,877 | |
Total liabilities | | | 985,767 | | | | 966,412 | |
| | | | | | | | | |
Shareholders' equity | | | | | | | | |
Preferred stock - par value $0.01 per share; authorized 2,500,000shares; none issued and outstanding | | | - | | | | - | |
Common stock - par value $0.01 per share; authorized75,000,000 shares; 12,810,388 and 12,784,605 issued andoutstanding at December 31, 2014 and 2013, respectively | | | 128 | | | | 127 | |
Capital surplus | | | 145,384 | | | | 144,624 | |
Accumulated deficit | | | (2,565 | ) | | | (10,641 | ) |
Accumulated other comprehensive loss, net of tax | | | (9,903 | ) | | | (10,293 | ) |
Total shareholders' equity | | | 133,044 | | | | 123,817 | |
| | | | | | | | | |
Total liabilities and shareholders' equity | | $ | 1,118,811 | | | $ | 1,090,229 | |
See Notes to Consolidated Financial Statements
PALMETTO BANCSHARES, INC. AND SUBSIDIARY
Consolidated Statements of Income (Loss)
(dollars in thousands, except per share data)
| | | For the years ended December 31, | |
| | | 2014 | | | 2013 | | | 2012 | |
Interest income | | | | | | | | | | | | |
Interest earned on cash and cash equivalents | | $ | 93 | | | $ | 100 | | | $ | 209 | |
Dividends received on Federal Home Loan Bank stock | | | 65 | | | | 39 | | | | 47 | |
Interest earned on trading account assets | | | 180 | | | | 38 | | | | - | |
Interest earned on investment securities available for sale | | | 3,820 | | | | 4,017 | | | | 5,059 | |
Interest and fees earned on loans | | | 35,492 | | | | 38,344 | | | | 40,075 | |
Total interest income | | | 39,650 | | | | 42,538 | | | | 45,390 | |
| | | | | | | | | | | | | |
Interest expense | | | | | | | | | | | | |
Interest expense on deposits | | | 494 | | | | 2,257 | | | | 5,136 | |
Interest expense on retail repurchase agreements | | | 2 | | | | 2 | | | | 2 | |
Interest expense on Federal Home Loan Bank advances | | | 27 | | | | - | | | | - | |
Interest expense on other borrowings | | | - | | | | 1 | | | | - | |
Total interest expense | | | 523 | | | | 2,260 | | | | 5,138 | |
| | | | | | | | | | | | | |
Net interest income | | | 39,127 | | | | 40,278 | | | | 40,252 | |
| | | | | | | | | | | | | |
Provision for loan losses | | | (2,300 | ) | | | 3,465 | | | | 13,075 | |
| | | | | | | | | | | | | |
Net interest income after provision for loan losses | | | 41,427 | | | | 36,813 | | | | 27,177 | |
| | | | | | | | | | | | | |
Noninterest income | | | | | | | | | | | | |
Service charges on deposit accounts, net | | | 7,027 | | | | 6,902 | | | | 6,691 | |
Fees for trust, investment management and brokerage services | | | 642 | | | | 2,039 | | | | 3,092 | |
Mortgage-banking | | | 1,509 | | | | 2,008 | | | | 3,139 | |
Debit card and automatic teller machine income, net | | | 2,437 | | | | 2,400 | | | | 2,171 | |
Investment securities gains, net | | | 125 | | | | 310 | | | | 10,494 | |
Trading account income, net | | | 501 | | | | 170 | | | | - | |
Gain on sale of branches | | | - | | | | - | | | | 568 | |
Other | | | 1,297 | | | | 1,007 | | | | 875 | |
Total noninterest income | | | 13,538 | | | | 14,836 | | | | 27,030 | |
| | | | | | | | | | | | | |
Noninterest expense | | | | | | | | | | | | |
Salaries and other personnel | | | 18,750 | | | | 20,107 | | | | 21,088 | |
Occupancy | | | 4,319 | | | | 4,242 | | | | 4,455 | |
Furniture and equipment | | | 3,971 | | | | 3,731 | | | | 3,378 | |
Professional services | | | 2,883 | | | | 2,083 | | | | 1,715 | |
Federal Deposit Insurance Corporation deposit insurance assessment | | | 1,142 | | | | 1,439 | | | | 1,861 | |
Marketing | | | 1,058 | | | | 1,051 | | | | 1,384 | |
Foreclosed real estate writedowns and expenses | | | 1,827 | | | | 3,373 | | | | 9,285 | |
Loss (gain) on other loans held for sale | | | - | | | | (326 | ) | | | 3,660 | |
Loan workout | | | 505 | | | | 1,066 | | | | 1,273 | |
Other | | | 5,686 | | | | 5,567 | | | | 5,251 | |
Total noninterest expense | | | 40,141 | | | | 42,333 | | | | 53,350 | |
| | | | | | | | | | | | | |
Income before provision (benefit) for income taxes | | | 14,824 | | | | 9,316 | | | | 857 | |
| | | | | | | | | | | | | |
Provision (benefit) for income taxes | | | 5,469 | | | | (18,415 | ) | | | 2,721 | |
| | | | | | | | | | | | | |
Net income (loss) | | $ | 9,355 | | | $ | 27,731 | | | $ | (1,864 | ) |
| | | | | | | | | | | | | |
Common and per common share data | | | | | | | | | | | | |
Net income (loss) - basic | | $ | 0.73 | | | $ | 2.17 | | | $ | (0.15 | ) |
Net income (loss) - diluted | | | 0.73 | | | | 2.17 | | | | (0.15 | ) |
Cash dividends declared | | | 0.10 | | | | - | | | | - | |
Book value | | | 10.39 | | | | 9.68 | | | | 7.71 | |
| | | | | | | | | | | | | |
Weighted average basic common shares | | | 12,696,777 | | | | 12,658,752 | | | | 12,639,379 | |
Weighted average diluted common shares | | | 12,761,885 | | | | 12,658,752 | | | | 12,639,379 | |
See Notes to Consolidated Financial Statements
PALMETTO BANCSHARES, INC. AND SUBSIDIARY
Consolidated Statements of Comprehensive Income (Loss)
(in thousands)
| | | For the years ended December 31, | |
| | | 2014 | | | 2013 | | | 2012 | |
| | | | | | | | | | | | | |
Net income (loss) | | $ | 9,355 | | | $ | 27,731 | | | $ | (1,864 | ) |
| | | | | | | | | | | | | |
Other comprehensive income (loss), pretax | | | | | | | | | | | | |
Investment securities available for sale | | | | | | | | | | | | |
Increase (decrease) in net unrealized gains | | | 3,374 | | | | (7,532 | ) | | | (18,854 | ) |
Plus: reclassification adjustment of net gains included in net income | | | 125 | | | | 310 | | | | 10,494 | |
Increase (decrease) in net unrealized gains (losses) on investment securities available for sale | | | 3,499 | | | | (7,222 | ) | | | (8,360 | ) |
| | | | | | | | | | | | | |
Defined benefit pension plan | | | | | | | | | | | | |
Change in net actuarial loss | | | (2,740 | ) | | | 1,392 | | | | 1,292 | |
Change in net actuarial loss of defined benefit pension plan | | | (2,740 | ) | | | 1,392 | | | | 1,292 | |
| | | | | | | | | | | | | |
Other comprehensive income (loss), pretax | | | 759 | | | | (5,830 | ) | | | (7,068 | ) |
| | | | | | | | | | | | | |
Provision (benefit) for income taxes related to items of other comprehensive income (loss) | | | 369 | | | | (2,254 | ) | | | (2,721 | ) |
| | | | | | | | | | | | | |
Other comprehensive income (loss), net of tax | | | 390 | | | | (3,576 | ) | | | (4,347 | ) |
| | | | | | | | | | | | | |
Comprehensive income (loss) | | $ | 9,745 | | | $ | 24,155 | | | $ | (6,211 | ) |
See Notes to Consolidated Financial Statements
PALMETTO BANCSHARES, INC. AND SUBSIDIARY
Consolidated Statements of Changes in Shareholders' Equity
(dollars in thousands)
| | | | | | | | | | | | | | | | | | | Accumulated | | | | | |
| | | Shares of | | | | | | | | | | | | | | | other | | | | | |
| | | common | | | Common | | | Capital | | | Accumulated | | | comprehensive | | | | | |
| | | stock | | | stock | | | surplus | | | deficit | | | loss, net | | | Total | |
| | | | | | | | | | | | | | | | | | | | | | | | | |
Balance, December 31, 2011 | | | 12,726,388 | | | $ | 127 | | | $ | 142,233 | | | $ | (36,508 | ) | | $ | (2,370 | ) | | $ | 103,482 | |
| | | | | | | | | | | | | | | | | | | | | | | | | |
Net loss | | | | | | | | | | | | | | | (1,864 | ) | | | | | | | (1,864 | ) |
Other comprehensive loss, net of tax | | | | | | | | | | | | | | | | | | | (4,347 | ) | | | (4,347 | ) |
Compensation expense related to stock options and restricted stock granted under equity award plans | | | | | | | | | | | 1,109 | | | | | | | | | | | | 1,109 | |
Common stock issued related to restricted stock granted under equity award plans, net of forfeitures | | | 27,637 | | | | | | | | | | | | | | | | | | | | - | |
Other changes | | | 20 | | | | | | | | | | | | | | | | | | | | - | |
| | | | | | | | | | | | | | | | | | | | | | | | | |
Balance, December 31, 2012 | | | 12,754,045 | | | $ | 127 | | | $ | 143,342 | | | $ | (38,372 | ) | | $ | (6,717 | ) | | $ | 98,380 | |
| | | | | | | | | | | | | | | | | | | | | | | | | |
Net income | | | | | | | | | | | | | | | 27,731 | | | | | | | | 27,731 | |
Other comprehensive loss, net of tax | | | | | | | | | | | | | | | | | | | (3,576 | ) | | | (3,576 | ) |
Exercise of stock options | | | 11,250 | | | | | | | | 124 | | | | | | | | | | | | 124 | |
Compensation expense related to stock options and restricted stock granted under equity award plans | | | | | | | | | | | 1,158 | | | | | | | | | | | | 1,158 | |
Common stock issued related to restricted stock granted under equity award plans, net of forfeitures | | | 19,309 | | | | | | | | | | | | | | | | | | | | - | |
Other changes | | | 1 | | | | | | | | | | | | | | | | | | | | - | |
| | | | | | | | | | | | | | | | | | | | | | | | | |
Balance, December 31, 2013 | | | 12,784,605 | | | $ | 127 | | | $ | 144,624 | | | $ | (10,641 | ) | | $ | (10,293 | ) | | $ | 123,817 | |
| | | | | | | | | | | | | | | | | | | | | | | | | |
Net income | | | | | | | | | | | | | | | 9,355 | | | | | | | | 9,355 | |
Other comprehensive income, net of tax | | | | | | | | | | | | | | | | | | | 390 | | | | 390 | |
Compensation expense related to stock options and restricted stock granted under equity award plans | | | | | | | 1 | | | | 773 | | | | | | | | | | | | 774 | |
Common stock issued related to restricted stock granted under equity award plans, net of forfeitures and vested shares withheld for employee taxes | | | 25,783 | | | | | | | | (13 | ) | | | | | | | | | | | (13 | ) |
Cash dividends declared on common stock | | | | | | | | | | | | | | | (1,279 | ) | | | | | | | (1,279 | ) |
| | | | | | | | | | | | | | | | | | | | | | | | | |
Balance, December 31, 2014 | | | 12,810,388 | | | $ | 128 | | | $ | 145,384 | | | $ | (2,565 | ) | | $ | (9,903 | ) | | $ | 133,044 | |
See Notes to Consolidated Financial Statements
PALMETTO BANCSHARES, INC. AND SUBSIDIARY
Consolidated Statements of Cash Flows
(in thousands) (unaudited)
| | | For the years ended December 31, | |
| | 2014 | | | 2013 | | | 2012 | |
| Operating Activities | | | | | | | | | | | | |
Net income (loss) | | $ | 9,355 | | | $ | 27,731 | | | $ | (1,864 | ) |
Adjustments to reconcile net income to net cash provided by operating activities | | | | | | | | | | | | |
Investment securities gains, net | | | (125 | ) | | | (310 | ) | | | (10,494 | ) |
Amortization of unearned discounts / premiums on investment securities available for sale, net | | | 3,398 | | | | 4,992 | | | | 6,031 | |
Trading account income, net | | | (501 | ) | | | (170 | ) | | | - | |
Reduction in (purchases of) trading account assets, net | | | 106 | | | | (4,948 | ) | | | - | |
Gain on sales of mortgage loans held for sale, net | | | (1,178 | ) | | | (1,803 | ) | | | (2,585 | ) |
Originations of mortgage loans held for sale | | | (42,982 | ) | | | (67,811 | ) | | | (97,400 | ) |
Proceeds from sales of mortgage loans held for sale | | | 44,757 | | | | 74,006 | | | | 97,519 | |
Gain on sales of Small Business Administration loans | | | (70 | ) | | | (207 | ) | | | (162 | ) |
Proceeds from sales of Small Business Administration loans | | | 1,236 | | | | 2,222 | | | | 1,830 | |
Loss (gain) on other loans held for sale | | | - | | | | (326 | ) | | | 3,660 | |
Proceeds from sales of other loans held for sale | | | - | | | | 1,102 | | | | 13,922 | |
Provision for loan losses | | | (2,300 | ) | | | 3,465 | | | | 13,075 | |
Depreciation | | | 2,364 | | | | 2,581 | | | | 2,529 | |
Gain on sale of branches | | | - | | | | - | | | | (568 | ) |
Writedowns and losses on sales of foreclosed real estate, net | | | 1,344 | | | | 2,977 | | | | 8,617 | |
Deferred income tax expense (benefit) | | | 4,666 | | | | (19,834 | ) | | | 2,721 | |
Decrease (increase) in income tax refunds receivable | | | 138 | | | | - | | | | (510 | ) |
Increase in cash surrender value of bank-owned life insurance | | | (306 | ) | | | (46 | ) | | | - | |
Compensation expense on equity-based awards | | | 774 | | | | 1,158 | | | | 1,109 | |
Writedowns on long-lived assets | | | 253 | | | | - | | | | 70 | |
Net periodic pension expense | | | 545 | | | | 642 | | | | 736 | |
Contribution to defined benefit pension plan | | | (1,600 | ) | | | (1,893 | ) | | | (1,600 | ) |
Provision for unfunded commitments | | | 213 | | | | (108 | ) | | | (11 | ) |
Decrease (increase) in interest receivable and other assets, net | | | (14 | ) | | | 1,207 | | | | 1,502 | |
Increase (decrease) in interest payable and other liabilities, net | | | (1,249 | ) | | | 151 | | | | (1,031 | ) |
Net cash provided by operating activities | | | 18,824 | | | | 24,778 | | | | 37,096 | |
| | | | | | | | | | | | | |
Investing Activities | | | | | | | | | | | | |
Purchases of Federal Home Loan Bank stock | | | (1,800 | ) | | | (1,570 | ) | | | - | |
Proceeds from redemption of Federal Home Loan Bank stock | | | 2,194 | | | | 431 | | | | 1,691 | |
Proceeds from sales of investment securities available for sale | | | 21,504 | | | | 48,660 | | | | 181,014 | |
Proceeds from maturities and repayments of investment securities available for sale | | | 20,212 | | | | 52,696 | | | | 72,495 | |
Purchases of investment securities available for sale | | | (38,618 | ) | | | (63,141 | ) | | | (260,916 | ) |
Repayments on other loans held for sale | | | - | | | | - | | | | 70 | |
Purchase of mortgage loans held for investment | | | (13,974 | ) | | | - | | | | - | |
Purchase of commercial loan participation | | | (5,000 | ) | | | - | | | | - | |
Purchase of indirect automobile loans | | | (22,123 | ) | | | - | | | | - | |
Increase in gross loans, net | | | (1,192 | ) | | | (38,592 | ) | | | (4,385 | ) |
Purchase of bank-owned life insurance | | | - | | | | (10,000 | ) | | | - | |
Purchases of premises and equipment, net | | | (1,003 | ) | | | (1,152 | ) | | | (1,521 | ) |
Proceeds from sales of foreclosed real estate | | | 2,521 | | | | 2,973 | | | | 13,524 | |
Payment for sale of branches, net | | | - | | | | - | | | | (32,272 | ) |
Investment in SBIC limited partnership | | | (250 | ) | | | (350 | ) | | | - | |
Net cash used for investing activities | | | (37,529 | ) | | | (10,045 | ) | | | (30,300 | ) |
| | | | | | | | | | | | | |
Financing Activities | | | | | | | | | | | | |
Increase in transaction, money market and savings deposits, net | | | 46,875 | | | | 26,327 | | | | 36,980 | |
Decrease in time deposits, net | | | (25,915 | ) | | | (142,209 | ) | | | (36,842 | ) |
Increase (decrease) in retail repurchase agreements, net | | | (2,254 | ) | | | 2,818 | | | | (8,501 | ) |
Proceeds from Federal Home Loan Bank advances | | | 35,000 | | | | 35,000 | | | | - | |
Repayment of Federal Home Loan Bank advances | | | (35,000 | ) | | | - | | | | - | |
Proceeds from exercise of stock options | | | - | | | | 124 | | | | - | |
Dividends paid on common stock | | | (1,279 | ) | | | - | | | | - | |
Taxes paid related to net share settlement of equity awards | | | (13 | ) | | | - | | | | - | |
Net cash provided by (used for) financing activities | | | 17,414 | | | | (77,940 | ) | | | (8,363 | ) |
Net change in cash and due from banks | | | (1,291 | ) | | | (63,207 | ) | | | (1,567 | ) |
Cash and due from banks, beginning of period | | | 38,178 | | | | 101,385 | | | | 102,952 | |
Cash and due from banks, end of period | | $ | 36,887 | | | $ | 38,178 | | | $ | 101,385 | |
| | | | | | | | | | | | | |
Supplemental cash flow disclosures | | | | | | | | | | | | |
Cash paid during the period for: | | | | | | | | | | | | |
Interest expense | | $ | 530 | | | $ | 2,662 | | | $ | 5,242 | |
Income taxes | | | 1,363 | | | | - | | | | 510 | |
Significant noncash activities | | | | | | | | | | | | |
Increase (decrease) in net unrealized gains on investment securities available for sale, net of tax | | | 2,171 | | | | (4,481 | ) | | | (5,187 | ) |
Decrease (increase) in defined benefit pension plan net actuarial loss, net of tax | | | (1,781 | ) | | | 905 | | | | 840 | |
Loans transferred from gross loans to other loans held for sale | | | 1,166 | | | | 2,015 | | | | 21,383 | |
Loans transferred from gross loans to foreclosed real estate, at fair value | | | 2,312 | | | | 2,541 | | | | 3,575 | |
Loans transferred from other loans held for sale to gross loans, at fair value | | | - | | | | - | | | | 6,143 | |
Loans transferred from other loans held for sale to foreclosed real estate, at fair value | | | - | | | | - | | | | 1,814 | |
See Notes to Consolidated Financial Statements
PALMETTO BANCSHARES, INC. AND SUBSIDIARY
Notes To Consolidated Financial Statements
1. | Summary of Significant Accounting Policies |
Nature of Operations
Palmetto Bancshares, Inc. (the “Company’) is a South Carolina bank holding company organized in 1982 and headquartered in Greenville, South Carolina. The Company serves as the bank holding company for The Palmetto Bank(the “Bank”), which began operations in 1906.The Bank, also headquartered in Greenville, South Carolina, is the second largest banking institution headquartered in South Carolina. The Bank serves the Upstate of South Carolina through 25 branch locations in nine counties along the economically attractive I-85 corridor, as well as 24/7/365 service through online and mobile banking and automatic teller machines. Through its Retail, Commercial and Wealth Management lines of business, the Bank specializes in providing financial solutions to consumers and small to mid-size businesses with deposit and cash management products, loans (including consumer, mortgage, credit card, automobile, Small Business Administration (“SBA”), commercial and corporate), lines of credit, trust, brokerage, private banking, financial planning and insurance.
Principles of Consolidation / Basis of Presentation
The accompanying Consolidated Financial Statements include the accounts of the Company, the Bank and subsidiaries of the Bank (collectively referred to herein as the “Company,” “we,” “us” or “our”). In management’s opinion, all significant intercompany accounts and transactions have been eliminated in consolidation, and all adjustments necessary for a fair presentation of the financial condition and results of operations for the periods presented have been included. Any such adjustments are of a normal and recurring nature. Assets held by the Company in a fiduciary or agency capacity for clients are not included in the Company’s Consolidated Financial Statements because those items do not represent assets of the Company. The accounting and financial reporting policies of the Company conform, in all material respects, to accounting principles generally accepted in the United States of America (“GAAP”) and to general practices within the financial services industry.
Subsequent Events
Subsequent events are events or transactions that occur after the balance sheet date but before financial statements are issued. Recognized subsequent events are events or transactions that provide additional evidence about conditions that existed at the date of the balance sheet including the estimates inherent in the process of preparing financial statements. Unrecognized subsequent events are events that provide evidence about conditions that did not exist at the date of the balance sheet but arose after that date. The Company has reviewed events occurring through the issuance date of the Consolidated Financial Statements and no subsequent events have occurred requiring accrual or disclosure in these financial statements other than those included in this Annual Report on Form 10-K.
Business Segments
Operating segments are components of an enterprise about which separate financial information is available and evaluated regularly by the Company’s chief operating decision makers in deciding how to allocate resources and assess performance. Public enterprises are required to report a measure of segment profit or loss, certain specific revenue and expense items for each segment, segment assets and information about the way that the operating segments were determined, among other items.
The Company considers business segments by analyzing distinguishable components that are engaged in providing individual products, services or groups of related products or services and that are subject to risks and returns that are different from those of other business segments. When determining whether products and services are related, the Company considers the nature of the products or services, the nature of the production processes, the type or class of client for which the products or services are designed and the methods used to distribute the products or provide the services.
For the past several years, we have been realigning our organizational structure and more specifically delineating our businesses for improved accountability and go-to-market strategies. However, financial information for these businesses has been separated to a limited extent, and, therefore, we do not have disaggregated financial information that meets the criteria to be considered reportable segments. Accordingly, at December 31, 2014, the Company had one reportable business segment, which was banking.
Use of Estimates
In preparing the Consolidated Financial Statements, the Company’s management makes estimates and assumptions that impact the reported amounts of assets and liabilities and the disclosure of contingent assets and liabilities at the dates and for the periods indicated in the Consolidated Financial Statements. Actual results could differ from these estimates and assumptions. Therefore, the results of operations for the year ended December 31, 2014 are not necessarily indicative of the results of operations that may be expected in future periods.
Risk and Uncertainties
In the normal course of business, the Company encounters two significant types of overall risk: economic and regulatory. There are three main components of economic risk: credit risk, market risk and concentration of credit risk. Credit risk is the risk of default on the Company's loan portfolio resulting from borrowers' inability or unwillingness to make contractually required interest and principal payments, default on repayment of investment securities and trading account assets, and the risk of other counterparties such as insurance providers failing to make contractually required payments to the Company. Market risk primarily includes interest-rate risk. The Company is exposed to interest-rate risk to the degree that its interest-bearing liabilities mature or reprice at different speeds, or different bases, than its interest-earning assets. Market risk also reflects the risk of declines in the valuation of investment securities, trading account assets, loans held for sale, the value of the collateral underlying loans and the value of real estate held by the Company. Concentration of credit risk refers to the risk that, if the Company extends a significant portion of its total outstanding credit to borrowers in a specific geographical area or industry or on the security of a specific form of collateral, the Company may experience disproportionately high levels of defaults and losses if those borrowers, or the value of such type of collateral, are adversely impacted by economic or other factors that are particularly applicable to such borrowers or collateral. Concentration of credit risk is also similarly applicable to the investment securities portfolio, trading account assets and bank-owned life insurance (“BOLI”) policies.
The Company and the Bank are subject to the regulations of various government agencies. These regulations can and do change significantly from period to period. In addition, the Company and the Bank undergo periodic examinations by bank regulatory agencies which may subject us to changes with respect to asset and liability valuations, amount of required allowance for loan losses, capital levels or operating restrictions.
Cash and Cash Equivalents
Cash and cash equivalents may include cash, interest-bearing bank balances and federal funds sold. Generally, both cash and cash equivalents have maturities of three months or less, and accordingly, the carrying amount of these instruments is deemed to be a reasonable estimate of fair value.
Federal Home Loan Bank Stock
The Bank is a member of the Federal Home Loan Bank of Atlanta (the “FHLB”), which is one of the regional FHLBs that administer home financing credit for depository institutions. Each FHLB serves as a reserve or central bank for its members within its assigned region. It is funded primarily from proceeds derived from the sale of consolidated obligations of the FHLB System. It makes loans or advances to members in accordance with policies and procedures established by the Board of Directors of the FHLB, which are subject to the oversight of the Federal Housing Financing Board. All advances from the FHLB are required to be fully secured by collateral as determined by the FHLB.
As an FHLB member, the Company is required to purchase and maintain stock in the FHLB. No ready market exists for this stock, and it has no quoted market value. The stock is recorded at historical cost and redemptions are conducted at book value. Purchases and redemptions are normally transacted each quarter to adjust the Company’s investment to an amount based on the FHLB requirements, and requests for redemptions are met at the discretion of the FHLB. The Company has experienced no interruption in such redemptions. Dividends are paid on this stock at the discretion of the FHLB.
Trading Account Assets
The Company invests in an account that is managed by a third party and invests in municipal bond securities that are actively traded. Trading account assets are reported at estimated fair value as Trading account assets on the Consolidated Balance Sheet. Interest income on trading account assets is reported as interest income in the Consolidated Statement of Income (Loss). Unrealized gains and losses and realized gains and losses on the sales of trading account assets are included in Other noninterest income in the Consolidated Statement of Income (Loss). Account management fees and related expenses are included in Professional services expense.
Investment Securities Available for Sale
The Company’s investment securities are classified into three categories: held-to-maturity, trading and available for sale. Held-to-maturity investment securities include debt securities that the Company has the intent and ability to hold until maturity and are reported at amortized cost. Available for sale investment securities include debt and equity investment securities that the Company determines may be sold at a future date or that it does not have the intent or ability to hold to maturity. Available for sale investment securities are reported at fair value with unrealized gains and losses excluded from income and reported as a separate component of shareholders' equity, net of deferred income taxes. Any other-than-temporary impairment related to credit losses would be recognized through earnings while any other-than-temporary impairment related to other factors would be recognized in other comprehensive income (loss). Realized gains or losses on available for sale investment securities are computed on a specific identification basis.
An other-than-temporary impairment analysis is conducted on a quarterly basis or more often if a potential loss-triggering event occurs. Investment securities are considered to be impaired on an other-than-temporary basis if it is probable that the issuer will be unable to make its contractual payments or if the Company no longer believes the security will recover within the estimated recovery period. Other-than-temporary impairment is recognized by evaluating separately other-than-temporary impairment losses due to credit issues and losses related to all other factors. Other-than-temporary impairment exists when it is more likely than not that the security will mature or be sold before its amortized cost basis can be recovered. For debt securities, the Company also considers the cause of the price decline such as the general level of interest rates and industry and issuer-specific factors, the issuer’s financial condition, near-term prospects and current ability to make future payments in a timely manner, the issuer’s ability to service debt, any change in agency ratings at evaluation date from acquisition date and any likely imminent action, and for asset-backed securities, the credit performance of the underlying collateral including delinquency rates, cumulative losses to date and the remaining credit enhancement compared to expected credit losses. Additionally, in determining if there is evidence of credit deterioration, the Company evaluates the severity of decline in market value below cost, the period of time for which the decline in fair value has existed and the financial condition and near-term prospects of the issuer including any specific events which may influence the operations of the issuer.
Unamortized premiums and discounts are recognized in interest income over the contractual life of the security using the effective interest method. As principal repayments are received on securities a pro-rata portion of the unamortized premium or discount is recognized in interest income. Accretion of unamortized discounts is discontinued for investment securities that fall below investment grade.
Mortgageand OtherLoans Held for Sale
Mortgage and other loans originated with the intent to sell, or for which a decision to sell is made subsequent to origination, are reported at the lower of cost or estimated fair value. Net unrealized losses, if necessary, are provided for through a valuation allowance charged to income. Gain or loss on sale of mortgage and other loans held for sale are recognized at the time of sale and are based on proceeds received, the value of any servicing rights recognized, the carrying amount of the loans at the time of sale and any interests the Company continues to hold based on relative fair value at the date of sale.
Loans
Loans are reported at their outstanding principal balances net of any unearned income, charge-offs and unamortized deferred fees and direct loan origination costs. Purchased loans are reported at their outstanding principal balance plus any unamortized purchase premiums. Unearned income, deferred fees and costs, and discounts and premiums are amortized to interest income over the contractual life of the loan.
Past due and delinquent status is based on contractual terms. Interest income on loans deemed past due continues to accrue until the loan is placed in nonaccrual status.
The accrual of interest income is discontinued when it is determined there is a more than normal risk of future uncollectibility. In most cases, loans are automatically placed in nonaccrual status when the loan payment becomes 90 days delinquent and no acceptable arrangement has been made between the Company and the client. The accrual of interest on some loans, however, may continue even after the loan becomes 90 days delinquent in special circumstances deemed appropriate by the Company. Loans may be placed in nonaccrual status if it is determined that some factor other than delinquency (such as imminent foreclosure or bankruptcy proceedings) causes the Company to believe that more than a normal amount of risk exists with regard to collectability. When a loan is placed in nonaccrual status, accrued interest income receivable is reversed. Thereafter, any cash payments received on a nonaccrual loan are applied as a principal reduction until the entire amortized cost of the loan has been recovered. Any additional amounts received are reflected in interest income. Loans are returned to accrual status when the loan is brought current and ultimate collectability of principal and interest is no longer in doubt.
In situations where, for economic or legal reasons related to a client’s financial difficulties, a concession is granted to the client that the Company would not otherwise consider, the related loan is classified as a troubled debt restructuring. The restructuring of a loan may include the transfer, from the client to the Company, of real estate, receivables from third parties, other assets or an equity interest in the client in full or partial satisfaction of the loan, a modification of the loan terms or a combination of the above. The accrual of interest continues on a troubled debt restructuring as long as the loan is performing in accordance with the restructured terms. If the restructured loan is not performing in accordance with the restructured terms, the loan will be placed on nonaccrual status and will retain its status as a troubled debt restructuring. Loans classified as troubled debt restructurings may be removed from this classification if they are subsequently restructured if, at the time of the subsequent restructuring, the borrower is not experiencing financial difficulties and under terms of the subsequent agreement no concession has been granted to the borrower. To meet these conditions, the subsequent modification agreement must specify market terms, including a contractual interest rate not less than a market interest rate for new debt with similar credit risk characteristics, and other terms no less favorable to the Company than those it would offer for such new debt. In addition, loans may also be removed from troubled debt restructuring classification for disclosure purposes after a specified period of time if the restructured agreement specifies an interest rate equal to or greater than the rate that the lender was willing to accept at the time of the restructuring for a new loan with comparable risk, and the loan is performing in accordance with the terms specified by the restructured agreement.
Nonrefundable fees and certain direct costs associated with the origination of loans are deferred and recognized as a yield adjustment over the contractual life of the related loan, or if the related loan is held for sale, until the loan is sold. Premiums paid for purchased loans are recognized as a yield adjustment over the contractual or estimated life of the related loan pools depending on the size and homogeneity of the pool. Recognition of deferred fees and costs and purchase premiums is discontinued on nonaccrual loans until they return to accrual status or are charged-off. Deferral of direct loan origination costs are reported as a reduction of Salaries and other personnel expense.
Allowance for Loan Losses
The allowance for loan losses represents an amount that the Company believes will be adequate to absorb probable losses inherent in the loan portfolio as of the balance sheet date. Assessing the adequacy of the allowance for loan losses is a process that requires considerable judgment. Judgment in determining the adequacy of the allowance is based on evaluations of the collectability of loans including consideration of factors such as the balance of impaired loans, the quality, mix, and size of the overall loan portfolio, economic conditions that may impact the overall loan portfolio or an individual borrower’s ability to repay, the amount and quality of collateral securing the loans, the Company’s historical loan loss experience and borrower and collateral specific considerations for loans individually evaluated for impairment.
The allowance for loan losses is a reserve established through a provision for loan losses charged to expense. The allowance for loan losses represents the Company’s best estimate of probable inherent losses that have been incurred within the existing loan portfolio and is necessary to reserve for estimated probable loan losses inherent in the loan portfolio. The Company’s allowance for loan losses methodology is based on historical loss experience by loan type, specific homogeneous risk pools and specific loss allocations. The process for determining the appropriate level of the allowance for loan losses is designed to account for asset deterioration as it occurs. The provision for loan losses reflects loan quality trends including the levels of and trends related to nonaccrual loans, potential problem loans, criticized loans, collateral values and loans charged-off or recovered, among other factors.
The level of the allowance for loan losses reflects the Company’s continuing evaluation of specific lending risks, loan loss experience, current loan portfolio quality, present economic, political, and regulatory conditions and unidentified losses inherent in the current loan portfolio. Portions of the allowance for loan losses may be allocated for specific loans. However, the entire allowance for loan losses is available for any loan that, in the Company’s judgment, should be charged-off. The determination of the appropriate level of the allowance for loan losses inherently involves a high degree of subjectivity and requires significant estimates of current credit risks and future trends, all of which may undergo material changes. While the Company utilizes its best judgment and information available, the ultimate adequacy of the allowance for loan losses is dependent upon a variety of factors beyond the Company’s control including the performance of the loan portfolio, the economy, changes in interest rates and the view of the regulatory authorities toward loan classifications and collateral valuation.
The starting point for the general component of the allowance is the historical loss experience of specific types of loans. Historical loss ratios are calculated for pools of similar loans with similar characteristics based on the proportion of actual loan net charge-offs to the total population of loans in the pool. A five-year look-back period is used to compute historical loss rates. However, given the increase in loan charge-offs beginning in 2009, since then a three-year look-back period has also been used for computing historical loss rates as an additional reference point in determining the allowance for loan losses.
These historical loss percentages are increased or decreased for qualitative environmental factors derived from macroeconomic indicators and other factors. Qualitative factors considered in the determination of the allowance for loan losses include pervasive factors that generally impact clients across the loan portfolio (such as unemployment and the consumer price index) and factors that have specific implications to particular loan portfolios (such as residential home sales or commercial development). Factors evaluated may include, without limitation, changes in delinquent, nonaccrual and troubled debt restructured loan trends, trends in risk ratings and net loans charged-off, concentrations of credit, competition, legal and regulatory requirements, trends in the nature and volume of the loan portfolio, national and local economic and business conditions, collateral valuations, the experience and depth of lending management, lending policies and procedures, underwriting standards and practices, the quality of loan review systems and the degree of oversight by the Board of Directors, peer comparisons and other external factors.
Allowances for loan losses on specific loans are recorded when, based on current information and events, it is probable that the Company will be unable to collect all amounts due according to the contractual terms of the loan. Specific allowances for loans considered individually significant and that exhibit probable or observed weaknesses are determined by analyzing, among other things, the borrower’s ability to repay amounts owed, guarantor support, collateral deficiencies, the relative risk rating of the loan and economic conditions impacting the client’s industry. The population of loans evaluated for potential impairment includes all loans that are currently classified as troubled debt restructurings, certain loans that have previously been classified as troubled debt restructurings, all loans with Bank-funded interest reserves and significant individual loans in nonaccrual status. Loans classified as troubled debt restructuring that are performing in accordance with their restructured terms are evaluated for impairment based on discounted cash flows using the loan’s original contractual interest rate. Troubled debt restructuring loans that are no longer performing in accordance with their restructured terms, and for which ultimate collection is based on liquidation of the collateral, are evaluated for impairment based on the collateral value less estimated costs to sell.
Each impaired loan is individually reviewed to determine whether the impairment should be recorded as a charge-off or a reserve based on an assessment of the status of the borrower and the underlying collateral. In general, for collateral-dependent loans, the impairment is recorded as a charge-off unless the fair value of the collateral was based on an internal valuation pending receipt of a third-party appraisal or other extenuating circumstances. Consumer loan accounts are generally charged-off based on predefined past due time periods.
The general reserve portion of the allowance for loan losses determined using the historical loss rates and qualitative factors is then combined with the specific allowance on loans individually evaluated for impairment to determine the total allowance for loan losses.
Reserve for Unfunded Commitments
The Company estimates probable losses related to unfunded lending commitments. The same credit policies are used in making and monitoring lending commitments as are used for loan underwriting. Therefore, in general, the methodology to determine the reserve for unfunded commitments is inherently similar to that used to determine the general reserve component of the allowance for loan losses. However, commitments have fixed expiration dates, and most commitments to extend credit have adverse change clauses that allow the Company to cancel the commitments based on various factors including deterioration in the creditworthiness of the borrower. Accordingly, many of the loan commitments are expected to expire without being drawn upon and, therefore, the total commitment amounts do not necessarily represent potential credit exposure. The reserve for unfunded lending commitments is included in Other liabilities in the Consolidated Balance Sheets. Changes to the reserve for unfunded commitments are recorded through Other noninterest expense in the Consolidated Statements of Income (Loss).
Premises and Equipment, net
Land is reported at cost. Buildings and improvements, furniture and equipment and software are reported at cost less accumulated depreciation computed principally by the straight-line method based on the estimated useful lives of the related asset. Estimated lives range from 12 to 39 years for buildings and improvements and from five to 12 years for furniture and equipment. Estimated lives range from three to five years for computer software. Estimated lives of automobiles are typically five years. Leasehold improvements are generally depreciated over the lesser of the lease term or the estimated useful lives of the improvements.
Maintenance and repairs of such premises and equipment are expensed as incurred. Improvements that extend the useful lives of the respective assets are capitalized.
ForeclosedReal Estate and Repossessed Personal Property
Foreclosed real estate is initially recorded at fair value less estimated selling costs thereby establishing a new cost basis. Fair value of foreclosed real estate is subsequently reviewed regularly and writedowns are recorded when it is determined that the carrying value of the real estate exceeds the fair value less estimated selling costs. Subsequent increases in the fair value of foreclosed real estate are recognized through a reduction of the specific valuation allowance to the extent of previous writedowns. Writedowns resulting from the periodic re-evaluation of, costs related to holding, and gains and losses on the sale of foreclosed properties are charged against income. Costs to develop and improve foreclosed properties are capitalized.
Repossessed personal property is included in Other assets in the Consolidated Balance Sheets.
Servicing Rights
The Company recognizes residential mortgage-servicing rights assets and SBA loan servicing rights assets (collectively referred to as “servicing rights”) upon the sale of residential mortgage and SBA loans for which the Company retains the underlying servicing obligation. Servicing rights assets are initially measured at fair value and amortized to expense over the estimated life of the servicing obligation.
The fair value of servicing rights is determined at the date of sale of the underlying loan using the present value of estimated future net servicing income using assumptions that market participants use in their valuation estimates. The Company presents its servicing rights assets at the lower of cost or fair value in Other assets in the Consolidated Balance Sheets.
For servicing rights, we utilize the expertise of third-party specialists on a quarterly basis to determine, among other things, capitalization, impairment and amortization rates. Estimates of the amount and timing of prepayment rates, loan loss experience, costs to service loans and discount rates are evaluated by the third-party specialists, reviewed and approved by us and used to estimate the fair value of our servicing rights portfolio. Amortization of the servicing rights portfolio is based on the ratio of net servicing income received in the current period to total net servicing income projected to be realized from the servicing rights portfolio. Projected net servicing income is determined based on the estimated future balance of the underlying loan portfolio, which declines over time from prepayments and scheduled loan amortization. Expected prepayment rates are estimated based on current interest-rate levels, other economic conditions, market forecasts and relevant characteristics of the servicing rights portfolio such as loan types, interest-rate stratification and recent prepayment experience.
Impairment valuations are based on projections using a discounted cash flow method that includes assumptions regarding prepayments, interest rates, servicing costs and other factors. Impairment is measured on a disaggregated basis for each stratum of the servicing rights, which is segregated based on predominate risk characteristics including interest rate and loan type. Subsequent increases in value are recognized to the extent of previously recorded impairment for each stratum.
Bank-Owned Life Insurance
The Company has purchased life insurance policies on certain key employees (which we refer to as “teammate”). All premiums were paid by the Company and the Company is the sole beneficiary; however, the Company provides a $50 thousand death benefit to the beneficiaries of covered teammates. These policies are recorded in the Consolidated Balance Sheets at their cash surrender value as provided by the insurance carriers. Income from these policies is recorded in other noninterest income.
Accumulated Other Comprehensive Income (Loss)
The Company reports changes in other comprehensive income (loss) in the Consolidated Statements of Comprehensive Income (Loss). Comprehensive income (loss) includes all changes in shareholders’ equity during a period except those resulting from transactions with shareholders.
Changes in the market value of investment securities available for sale are recorded through accumulated other comprehensive income (loss). Additionally, accumulated other comprehensive income (loss) includes adjustments related to the defined benefit pension plan (the “Pension Plan”). These adjustments relate to the actuarial gains and losses and the amortization of prior service costs and credits and any remaining transition amounts that had not yet been recognized through net periodic benefit cost.
Income Taxes
The Company files consolidated federal and state income tax returns. Federal income tax expense or benefit is allocated to the Bank on a separate return basis. The Company accounts for income taxes based on two components of income tax expense: current and deferred. Current income tax expense approximates taxes to be paid or refunded for the current period and includes income tax expense related to uncertain tax positions, if any. Interest and penalties, if any, are recognized as a component of income tax expense.
Deferred income taxes are determined using the balance sheet method. Under this method, the net deferred tax asset or liability is based on the tax impacts of the differences between the book and tax bases of assets and liabilities and recognizes enacted changes in tax rates and laws in the period in which they occur. Deferred income tax expense results from changes in deferred tax assets and liabilities between periods. Deferred tax assets are recognized subject to the Company’s judgment that realization is more likely than not. A tax position that meets the more likely than not recognition threshold is measured to determine the amount of benefit to recognize. The tax position is measured at the largest amount of benefit that is greater than 50% likely of being realized upon settlement.
The Company reviews deferred tax assets for recoverability based on carryback ability, history of earnings, expectations for future earnings and the expected timing of reversals of temporary differences. Realization of a deferred tax asset ultimately depends on the existence of sufficient taxable income available under tax law including future reversals of existing temporary differences, future taxable income exclusive of reversing differences, taxable income in prior carryback years, projections of future operating results, cumulative tax losses over the past three years, tax loss deductibility limitations and available tax planning strategies. If, based on available information, it is more likely than not that the deferred income tax asset will not be realized, a valuation allowance against the deferred tax asset must be established with a corresponding charge to income tax expense.
Net Income (Loss) per Common Share
Basic net income (loss) per common share is computed by dividing net income (loss) available to common shareholders by the weighted-average number of common shares outstanding during the period. Net income (loss) available to common shareholders represents income (loss) applicable to common shareholders which is net income (loss) less income allocated to participating securities. For diluted net income (loss) per common share, the denominator is increased to include the number of additional common shares that would have been outstanding if dilutive potential common shares had been issued. If dilutive, common stock equivalents are calculated for stock options and restricted stock using the treasury stock method. Potential common shares are not included in the denominator of the diluted net income (loss) per common share computation when inclusion would be anti-dilutive.
Participating securities are unvested share-based payment awards that contain nonforfeitable rights to dividends and are included in computing net income per common share using the two-class method. The two-class method is an earnings allocation formula under which net income per share is calculated for participating securities according to dividends declared and undistributed earnings. Under this method, all earnings, distributed and undistributed, are allocated to participating securities and common shares based on their respective rights to receive dividends. For purposes of applying the two-class method, the Company’s unvested restricted stock awards are considered participating securities since those shares have a nonforfeitable right to any cash dividends declared and paid to common shareholders. For additional disclosure regarding the Company’s restricted stock awards, see Note 16, Equity-Based Compensation.
Pension Plan
The funded status of our Pension Plan is the difference between the plan assets and the projected benefit obligation at the balance sheet date. The underfunded status of our Pension Plan is recognized on the Consolidated Balance Sheets in Other liabilities.
Equity-Based Compensation
Compensation expense for restricted stock and stock option awards is measured at fair value and recognized as compensation expense in the Consolidated Statements of Income (Loss) over the service period for grants that have time / service-based vesting provisions. The fair value of restricted stock is determined based on the fair value of the common stock at the time of the grant. The fair value of stock options is estimated using an option-pricing model that takes into account fair value of the Company’s common stock, volatility measures, level of interest rates, term of the option and estimated prevesting forfeiture rates.
Forfeitures are accounted for by eliminating compensation expense for unvested shares as forfeitures occur. Stock option and restricted stock awards are subject to vesting restrictions as to continuous employment for a specified time period following the date of grant. In addition, certain stock option and restricted stock awards are also subject to specified performance objectives. During these restriction periods, the holder of restricted stock awards is entitled to full voting rights and any dividends declared.
Derivative Financial Instruments and Hedging Activities
All derivatives are recognized as either assets or liabilities in the Consolidated Balance Sheets and measured at fair value. Changes in the fair value of derivatives are reported in current earnings or other comprehensive income depending on the purpose for which the derivative is held and whether the Company elects and the derivative qualifies for hedge accounting. The Company did not apply hedge accounting to any of its derivative instruments for the years ended December 31, 2014, 2013 or 2012. As a result, all of the changes in fair value of derivatives are reported in current earnings.
The Company’s only derivative instruments are related to its mortgage-banking activities. The Company generally originates certain residential mortgage loans with the intention of selling these loans. Between the time the Company enters into an interest-rate lock commitment to originate a residential mortgage loan held for sale and the time the loan is closed and sold, the Company is subject to variability in market prices related to these commitments. The Company also enters into forward sale agreements of “to-be-issued” loans. The commitments to originate residential mortgage loans and forward sales commitments are freestanding derivative instruments. Fair value adjustments on these derivative instruments are recorded within Mortgage-banking income in the Consolidated Statements of Income (Loss). Interest-rate lock commitments to originate residential mortgage loans to be held for investment are not considered derivatives.
FairValue Measurements
The Company provides disclosures about the fair value of assets and liabilities recognized in the Consolidated Balance Sheets in periods subsequent to initial recognition including whether the measurements are made on a recurring basis (for example, trading account assets and investment securities available for sale) or on a nonrecurring basis (for example, mortgage and other loans held for sale).
Fair value is defined as the price that would be received to sell the asset or paid to transfer the liability in an orderly transaction between market participants at the measurement date. Accounting standards establish a three-level hierarchy for disclosure of assets and liabilities recorded at fair value. The classification of assets and liabilities within the hierarchy is based on whether the inputs to the valuation methodology used for measurement are observable or unobservable. Observable inputs reflect market-derived or market-based information obtained from independent sources while unobservable inputs reflect our estimates of market data. The three-level hierarchy that is used to classify fair value measurements includes:
| | ● | Level 1 – Valuation is based on quoted prices for identical instruments traded in active markets. Level 1 instruments generally include securities traded on active exchange markets, such as the New York Stock Exchange or NASDAQ, as well as securities that are traded by dealers or brokers in active over-the-counter markets. Instruments the Company classifies as Level 1 are instruments that have been priced directly from dealer trading desks and represent actual prices at which such securities have traded within active markets. Level 1 instruments also include other loans held for sale and foreclosed real estate for which binding sales contracts have been entered into as of the balance sheet date. |
| | ● | Level 2 – Valuation is based on quoted prices for similar instruments in active markets, quoted prices for identical or similar instruments in markets that are not active and model-based valuation techniques, such as matrix pricing, for which all significant assumptions are observable in the market. Instruments the Company classifies as Level 2 include securities that are valued based on pricing models that use relevant observable information generated by transactions that have occurred in the market place involving similar securities. Level 2 instruments also include mortgage loans held for sale that are valued based on prices for other mortgage whole loans with similar characteristics and other loans held for sale as well as impaired loans and foreclosed real estate valued by independent collateral appraisals based on recent sales of comparable properties. |
| | ● | Level 3 – Valuation is generated from model-based techniques that use significant assumptions not observable in the market. These unobservable assumptions reflect our estimate of assumptions market participants would use in pricing the asset or liability. Valuation techniques include use of option-pricing models, discounted cash flow models and similar techniques. |
The Company attempts to maximize the use of observable inputs and minimize the use of unobservable inputs when developing fair value measurements. When available, the Company uses quoted market prices to measure fair value. If market prices are not available, fair value measurement is based on models that use primarily market-based or independently-sourced market parameters. In certain cases when observable market inputs for model-based valuation techniques may not be readily available, the Company is required to make judgments about assumptions market participants would use in estimating the fair value of the financial instrument.
The degree of management judgment involved in determining the fair value of an instrument is dependent upon the availability of quoted market prices or observable market parameters. For instruments that trade actively and have quoted market prices or observable market parameters, there is minimal subjectivity involved in measuring fair value. When observable market prices and parameters are not fully available, management judgment is necessary to estimate fair value. In addition, changes in market conditions may reduce the availability of quoted prices or observable data. For example, reduced liquidity in the capital markets or changes in secondary-market activities could result in observable market inputs becoming unavailable. When significant adjustments to available observable inputs are required, it may be appropriate to utilize an estimate based primarily on unobservable inputs. When an active market for a security does not exist, the use of management estimates that incorporate current market participant expectations of future cash flows and appropriate risk premiums is acceptable.
Valuation of the Company’s Common Stock
The Company utilizes the market price of its common stock within various valuations and calculations relating to the Pension Plan assets, teammate retirement accounts, granting of equity awards, the calculation of diluted net income (loss) per common share and the valuation of stock serving as loan collateral. The Company uses the closing price of its common stock as reported on the NASDAQ Capital Market to obtain the value of its common stock as of each valuation date or award date.
RecentlyAdopted Authoritative Pronouncements
In May 2013, the Committee of Sponsoring Organizations (“COSO”) of the Treadway Commission issued its updatedInternal Control–Integrated Frameworkand related illustrative documents (the "2013 Framework"). The updated framework was written to reflect the changes in business since the first version was released in 1992. The Company transitioned from the 1992 framework to the 2013 framework during the first quarter 2014.
In July 2013, the Financial Accounting Standards Board (“FASB”) issued Accounting Standards Update (“ASU”) 2013-11 Income Taxes (Topic 740):Presentation of an Unrecognized Tax Benefit When a Net Operating Loss Carryforward, a Similar Tax Loss, or a Tax Credit Carryforward Exists (“ASU 2013-11”) to provide guidance on the financial statement presentation of an unrecognized tax benefit when a net operating loss carryforward, a similar tax loss, or a tax credit carryforward exists thereby reducing diversity in practice. The amendments in ASU 2013-11 became effective for the Company on January 1, 2014 and did not have a material impact on the Company’s financial position, results of operations or cash flows.
Recently Issued Authoritative Pronouncements
In January 2014, the FASB issued ASU 2014-04, Receivables – Troubled Debt Restructurings by Creditors (Topic 310): Reclassification of Residential Real Estate Collateralized Consumer Mortgage Loans Upon Foreclosure (“ASU 2014-04”) to clarify that an in substance repossession or foreclosure occurs, and a creditor is considered to have received physical possession of residential real estate property collateralizing a consumer mortgage loan, upon either the creditor obtaining legal title to the residential real estate property upon completion of a foreclosure or the borrower conveying all interest in the residential real estate property to the creditor to satisfy that loan through completion of a deed in lieu of foreclosure or through a similar legal agreement. Additionally, the amendments require interim and annual disclosure of both the amount of foreclosed residential real estate property held by the creditor and the recorded investment in consumer mortgage loans collateralized by residential real estate property that are in the process of foreclosure according to local requirements of the applicable jurisdiction. An entity can elect to adopt the amendments in this Update using either a modified retrospective transition method or a prospective transition method. The Company adopted the provisions of ASU 2014-04 effective January 1, 2015. The adoption of ASU 2014-04 did not have a material impact on the Company’s financial position, results of operations or cash flows.
In May 2014, the FASB issued ASU 2014-09, Revenue from Contracts with Customers (Topic 606):Revenue from Contracts with Customers(“ASU 2014-09”). The scope of the guidance applies to revenue arising from contracts with customers, except for the following: lease contracts, insurance contracts, contractual rights and obligations within the scope of other guidance and nonmonetary exchanges between entities in the same line of business to facilitate sales to customers. The core principle of the new guidance is that an entity should recognize revenue to reflect the transfer of goods and services to customers in an amount equal to the consideration that the entity receives or expects to receive. ASU 2014-09 is not expected to impact the timing or approach to revenue recognition for financial institutions. The likely impact for financial institutions will relate only to disclosures. The amendments are effective for public entities for annual reporting periods beginning after December 15, 2016, including interim periods within that reporting period. The Company does not expect the adoption of ASU 2014-09 to have a material impact on its financial position, results of operations or cash flows.
In August 2014, the FASB issued ASU 2014-14, Receivables – Troubled Debt Restructurings by Creditors (Topic 310):Classification of Certain Government-Guaranteed Mortgage Loans upon Foreclosure (“ASU 2014-14”). The amendments in ASU 2014-14 require that a mortgage loan be derecognized and that a separate other receivable be recognized upon foreclosure if the following conditions are met:
| | 1. | The loan has a government guarantee that is not separable from the loan before foreclosure. |
| | 2. | At the time of foreclosure, the creditor has the intent to convey the real estate property to the guarantor and make a claim on the guarantee, and the creditor has the ability to recover under that claim. |
| | 3. | At the time of foreclosure, any amount of the claim that is determined on the basis of the fair value of the real estate is fixed. |
Upon foreclosure, the separate other receivable is to be measured based on the amount of the loan balance (principal and interest) expected to be recovered from the guarantor. The amendments are effective for public business entities for annual periods, and interim periods within those annual periods, beginning after December 15, 2014. The Company adopted the provisions of ASU 2014-14 effective January 1, 2015. The adoption of ASU 2014-14 did not have a material impact on the Company’s financial position, results of operations or cash flows.
In August 2014, the FASB issued ASU 2014-15, Presentation of Financial Statements – Going Concern (Topic 205):Disclosure of Uncertainties about an Entity’s Ability to Continue as a Going Concern (“ASU 2014-15”). The amendments in ASU 2014-15 are intended to define management’s responsibility to evaluate whether there is substantial doubt about an organization’s ability to continue as a going concern and to provide related footnote disclosures. In connection with preparing financial statements, management is required to evaluate whether there are conditions or events, considered in the aggregate, that raise substantial doubt about the organization’s ability to continue as a going concern within one year after the date that the financial statements are issued. The amendments are effective for annual periods ending after December 15, 2016 and interim periods thereafter. Early application is permitted. The Company does not expect the adoption of ASU 2014-15 to have a material impact on its financial position, results of operations or cash flows.
Other accounting standards that have been recently issued by the FASB or other standards-setting bodies are not expected to have a material impact on the Company’s financial position, results of operations or cash flows.
2. | Cash and Cash Equivalents |
Required Reserve Balances
The Federal Reserve Act requires each depository institution to maintain cash reserves against certain liabilities. The Bank reports these liabilities to the Board of Governors of the Federal Reserve System (the “Federal Reserve”) on a weekly basis and maintains reserves on these liabilities with a 30-day lag. As of December 31, 2014, after taking into consideration the Bank’s levels of vault cash, reserves of $3.9 million were maintained with the Federal Reserve.
Concentrations and Restrictions
From time to time, the Company may sell federal funds to, or place deposits with, other financial institutions. Federal funds and any deposits in excess of Federal Deposit Insurance Corporation (“FDIC”) insurance limits are essentially uncollateralized overnight loans. The Company regularly evaluates the risk associated with the potential counterparties to these transactions to ensure that it would not be exposed to any significant risks with regard to cash and cash equivalent balances if it were to sell federal funds or place deposits in amounts in excess of FDIC insurance limits. At December 31, 2014 and 2013, the Company did not have any material deposits in excess of FDIC insurance limits with other financial institutions.
Restricted cash and cash equivalents pledged as collateral relative to public funds and other agreements totaled $250 thousand and $706 thousand at December 31, 2014 and 2013, respectively.
The following table summarizes the components of trading account assets at the dates indicated (in thousands).
| | | December 31, | |
| | | 2014 | | | 2013 | |
Municipal bonds | | $ | 4,116 | | | $ | 3,771 | |
Insured bank deposits | | | 1,397 | | | | 1,347 | |
Total trading account assets | | $ | 5,513 | | | $ | 5,118 | |
The following table summarizes net realized gains and the change in fair value relative to trading account assets included in the Consolidated Statements of Income for the periods indicated (in thousands).
| | | For the years ended December 31, | |
| | | 2014 | | | 2013 | |
Realized gains, net | | $ | 480 | | | $ | 139 | |
Unrealized gains, net due to changes in fair value relative to assets held at end of period | | | 21 | | | | 31 | |
Total trading account income, net | | $ | 501 | | | $ | 170 | |
The Company may withdraw from the trading account the assets related to its original $5.0 million investment subject to 30-days’ written notice. In January 2015, the Company invested an additional $4.5 million in the trading account, which is restricted from withdrawal until January 2016.
Ratings
The following tables summarize Moody’s and Standard and Poor’s ratings of municipal bond trading account assets, based on fair value, at December 31, 2014.
| | | Moody's Ratings | | |
Aaa | | | 21 | % | |
Aa1 - Aa3 | | | 60 | | |
A1 - A3 | | | 14 | | |
Not rated | | | 5 | | |
Total | | | 100 | % | |
| | | Standard and
Poor's Ratings | | |
AAA | | | 26 | % | |
AA+ - AA- | | | 52 | | |
A+ - A- | | | 14 | | |
Not Rated | | | 8 | | |
Total | | | 100 | % | |
All municipal bond trading account assets were rated by either Moody’s or Standard and Poor’s at December 31, 2014.
4. | Investment Securities Available for Sale |
The following tables summarize the amortized cost, gross unrealized gains and losses included in accumulated other comprehensive loss and fair value of investment securities available for sale at the dates indicated (in thousands).
| | | December 31, 2014 | |
| | | Amortized cost | | | Gross unrealized gains | | | Gross unrealized losses | | | Fair value | |
| | | | | | | | | | | | | | | | | |
U.S. agency | | $ | 3,930 | | | $ | 35 | | | $ | - | | | $ | 3,965 | |
State and municipal | | | 6,665 | | | | 84 | | | | (17 | ) | | | 6,732 | |
Collateralized mortgage obligations (federal agencies) | | | 89,311 | | | | 13 | | | | (1,550 | ) | | | 87,774 | |
Other mortgage-backed (federal agencies) | | | 78,532 | | | | 411 | | | | (440 | ) | | | 78,503 | |
SBA loan-backed (federal agency) | | | 34,394 | | | | 210 | | | | (67 | ) | | | 34,537 | |
Total investment securities available for sale | | $ | 212,832 | | | $ | 753 | | | $ | (2,074 | ) | | $ | 211,511 | |
| | | December 31, 2013 | |
| | | Amortized cost | | | Gross unrealized gains | | | Gross unrealized losses | | | Fair value | |
| | | | | | | | | | | | | | | | | |
State and municipal | | $ | 7,393 | | | $ | 138 | | | $ | (71 | ) | | $ | 7,460 | |
Collateralized mortgage obligations (federal agencies) | | | 97,303 | | | | 30 | | | | (4,201 | ) | | | 93,132 | |
Other mortgage-backed (federal agencies) | | | 76,852 | | | | 95 | | | | (927 | ) | | | 76,020 | |
SBA loan-backed (federal agency) | | | 37,655 | | | | 258 | | | | (142 | ) | | | 37,771 | |
Total investment securities available for sale | | $ | 219,203 | | | $ | 521 | | | $ | (5,341 | ) | | $ | 214,383 | |
The following tables summarize securities in each category of investment securities available for sale that were in an unrealized loss position at the dates indicated (dollars in thousands).
| | | December 31, 2014 | |
| | | Less than 12 months | | | 12 months or longer | | | Total | |
| | | # | | | Fair value | | | Gross unrealized losses | | | # | | | Fair value | | | Gross unrealized losses | | | # | | | Fair value | | | Gross unrealized losses | |
State and municipal | | | 3 | | | $ | 1,641 | | | $ | 7 | | | | 1 | | | $ | 1,062 | | | $ | 10 | | | | 4 | | | $ | 2,703 | | | $ | 17 | |
Collateralized mortgage obligations (federal agencies) | | | 11 | | | | 32,532 | | | | 192 | | | | 10 | | | | 52,924 | | | | 1,358 | | | | 21 | | | | 85,456 | | | | 1,550 | |
Other mortgage-backed (federal agencies) | | | 10 | | | | 14,889 | | | | 119 | | | | 10 | | | | 18,979 | | | | 321 | | | | 20 | | | | 33,868 | | | | 440 | |
SBA loan-backed (federal agency) | | | 3 | | | | 3,122 | | | | 10 | | | | 6 | | | | 14,850 | | | | 57 | | | | 9 | | | | 17,972 | | | | 67 | |
Total | | | 27 | | | $ | 52,184 | | | $ | 328 | | | | 27 | | | $ | 87,815 | | | $ | 1,746 | | | | 54 | | | $ | 139,999 | | | $ | 2,074 | |
| | | December 31, 2013 | |
| | | Less than 12 months | | | 12 months or longer | | | Total | |
| | | # | | | Fair value | | | Gross unrealized losses | | | # | | | Fair value | | | Gross unrealized losses | | | # | | | Fair value | | | Gross unrealized losses | |
State and municipal | | | 1 | | | $ | 1,010 | | | $ | 71 | | | | - | | | $ | - | | | $ | - | | | | 1 | | | $ | 1,010 | | | $ | 71 | |
Collateralized mortgage obligations (federal agencies) | | | 14 | | | | 62,251 | | | | 2,863 | | | | 9 | | | | 29,123 | | | | 1,338 | | | | 23 | | | | 91,374 | | | | 4,201 | |
Other mortgage-backed (federal agencies) | | | 20 | | | | 64,428 | | | | 774 | | | | 1 | | | | 1,517 | | | | 153 | | | | 21 | | | | 65,945 | | | | 927 | |
SBA loan-backed (federal agency) | | | 4 | | | | 14,468 | | | | 73 | | | | 3 | | | | 5,306 | | | | 69 | | | | 7 | | | | 19,774 | | | | 142 | |
Total | | | 39 | | | $ | 142,157 | | | $ | 3,781 | | | | 13 | | | $ | 35,946 | | | $ | 1,560 | | | | 52 | | | $ | 178,103 | | | $ | 5,341 | |
Other-Than-Temporary Impairment
Based on the Company’s other-than-temporary impairment analysis at December 31, 2014, the Company concluded that gross unrealized losses detailed in the preceding table were due to changes in market interest rates and were not other-than-temporarily impaired as of that date.
Ratings
Except for state and municipal securities, all of the Company’s available for sale securities are backed by United States (“U.S.”) agencies and are rated Aaa and AA+ by Moody’s and Standard and Poor’s rating services, respectively. The following table summarizes ratings of the Company’s state and municipal investment securities available for sale, based on fair value, at December 31, 2014.
| | | Moody's Ratings | | |
Aaa | | | 7 | % | |
Aa1 - Aa3 | | | 56 | | |
A1 - A2 | | | 4 | | |
Not rated | | | 33 | | |
Total | | | 100 | % | |
| | | Standard and
Poor's Ratings | | |
AAA | | | 17 | % | |
AA+ - AA- | | | 41 | | |
Not Rated | | | 42 | | |
Total | | | 100 | % | |
All state and municipal securities were rated by either Moody’s or Standard and Poor’s at December 31, 2014.
Maturities
The following table summarizes the amortized cost and fair value of investment securities available for sale at December 31, 2014 by contractual maturity and estimated principal repayment distribution (in thousands). U.S. agency and state and municipal securities are organized based on contractual maturity. Principal amounts on collateralized mortgage obligations, other mortgage-backed securities and SBA loan-backed securities are not due at a single maturity date and are subject to early repayment based on prepayment activity of underlying loans. Therefore, collateralized mortgage obligations, other mortgage-backed securities and SBA loan-backed securities are organized based on estimated cash flows using current prepayment assumptions.
| | | Amortized cost | | | Fair value | |
Due in one year or less | | $ | - | | | $ | - | |
Due after one year through five years | | | 2,015 | | | | 2,017 | |
Due after five years through ten years | | | 1,915 | | | | 1,948 | |
Due after ten years | | | - | | | | - | |
U.S. agency | | | 3,930 | | | | 3,965 | |
| | | | | | | | | |
Due in one year or less | | | 1,898 | | | | 1,917 | |
Due after one year through five years | | | 2,050 | | | | 2,115 | |
Due after five years through ten years | | | 2,717 | | | | 2,700 | |
Due after ten years | | | - | | | | - | |
State and municipal | | | 6,665 | | | | 6,732 | |
| | | | | | | | | |
Due in one year or less | | | 407 | | | | 407 | |
Due after one year through five years | | | 11,227 | | | | 11,041 | |
Due after five years through ten years | | | 77,677 | | | | 76,326 | |
Due after ten years | | | - | | | | - | |
Collateralized mortgage obligations (federal agencies) | | | 89,311 | | | | 87,774 | |
| | | | | | | | | |
Due in one year or less | | | - | | | | - | |
Due after one year through five years | | | 42,042 | | | | 42,112 | |
Due after five years through ten years | | | 19,191 | | | | 19,158 | |
Due after ten years | | | 17,299 | | | | 17,233 | |
Other mortgage-backed (federal agencies) | | | 78,532 | | | | 78,503 | |
| | | | | | | | | |
Due in one year or less | | | - | | | | - | |
Due after one year through five years | | | 15,116 | | | | 15,133 | |
Due after five years through ten years | | | 11,219 | | | | 11,216 | |
Due after ten years | | | 8,059 | | | | 8,188 | |
SBA loan-backed (federal agency) | | | 34,394 | | | | 34,537 | |
| | | | | | | | | |
Due in one year or less | | | 2,305 | | | | 2,324 | |
Due after one year through five years | | | 72,450 | | | | 72,418 | |
Due after five years through ten years | | | 112,719 | | | | 111,348 | |
Due after ten years | | | 25,358 | | | | 25,421 | |
Total investment securities available for sale | | $ | 212,832 | | | $ | 211,511 | |
Pledged
Investment securities were pledged as collateral for the following purposes at the dates indicated (in thousands).
| | | December 31, | |
| | | 2014 | | | 2013 | |
Municipal and other secured deposits | | $ | 84,255 | | | $ | 75,718 | |
Retail repurchase agreements | | | 36,629 | | | | 25,626 | |
Federal Reserve line of credit | | | 1,352 | | | | 1,459 | |
Correspondent bank lines of credit | | | 10,959 | | | | 16,788 | |
Total investment securities available for sale pledged | | $ | 133,195 | | | $ | 119,591 | |
Realized Gains and Losses
The following table summarizes the gross realized gains and losses from sales of investment securities available for sale for the periods indicated (in thousands).
| | | For the years ended December 31, | |
| | | 2014 | | | 2013 | | | 2012 | |
Realized gains | | $ | 165 | | | $ | 471 | | | $ | 10,499 | |
Realized losses | | | (40 | ) | | | (161 | ) | | | (5 | ) |
Total investment securities gains, net | | $ | 125 | | | $ | 310 | | | $ | 10,494 | |
In the tables below, loan classes are based on FDIC classification codes, and portfolio segments are an aggregation of those classes based on the methodology used to develop and document the allowance for loan losses. FDIC classification codes are based on the underlying loan collateral.
Composition
The following table summarizes gross loans, categorized by portfolio segment, at the dates indicated (dollars in thousands).
| | | December 31, 2014 | | | December 31, 2013 | |
| | | Total | | | % of total | | | Total | | | % of total | |
| | | | | | | | | | | | | | | | | |
Commercial real estate | | $ | 430,025 | | | | 53.4 | % | | $ | 455,452 | | | | 59.4 | % |
Single-family residential | | | 204,439 | | | | 25.4 | | | | 178,125 | | | | 23.2 | |
Commercial and industrial | | | 80,927 | | | | 10.0 | | | | 73,078 | | | | 9.5 | |
Consumer | | | 76,984 | | | | 9.6 | | | | 50,099 | | | | 6.5 | |
Other | | | 12,684 | | | | 1.6 | | | | 10,759 | | | | 1.4 | |
Loans, gross | | $ | 805,059 | | | | 100.0 | % | | $ | 767,513 | | | | 100.0 | % |
Net unearned income and deferred fees totaled $596 thousand and $643 thousand at December 31, 2014 and 2013, respectively. Unamortized purchase premiums totaled $1.3 million at December 31, 2014 and are included in the applicable portfolio segment in the table above.
Residential mortgage loans serviced for the benefit of others totaled $375.1 million and $384.5 million at December 31, 2014 and 2013, respectively, and are excluded from the Consolidated Balance Sheets since they are not owned by the Company.
Pledged
The Bank, as a member of the FHLB of Atlanta, must pledge collateral to borrow from the FHLB and cover the various Federal Reserve services that are available for use by the Bank. Acceptable collateral includes, among other types of collateral, a variety of loans including residential, multifamily, home equity lines and second mortgages as well as qualifying commercial loans. At December 31, 2014 and 2013, $170.6 million and $205.2 million of gross loans, respectively, were pledged to collateralize FHLB advances of which $79.1 million and $90.2 million, respectively, were available as lendable collateral.
At December 31, 2014 and 2013, loans totaling $38.2 million and $794 thousand, respectively, were pledged as collateral to cover the various Federal Reserve services that are available for use by the Bank of which $27.8 million and $651 thousand, respectively, were available as lendable collateral.
Concentrations
The following table summarizes loans secured by commercial real estate, categorized by class, at December 31, 2014 (dollars in thousands).
| | | Total commercial real estate loans | | | % of gross loans | | | % of Bank's total regulatory capital | |
Secured by commercial real estate | | | | | | | | | | | | |
Construction, land development and other land loans | | $ | 48,063 | | | | 6.0 | % | | | 33.5 | % |
Multifamily residential | | | 9,025 | | | | 1.1 | | | | 6.3 | |
Nonfarm nonresidential | | | 372,937 | | | | 46.3 | | | | 260.2 | |
Total loans secured by commercial real estate | | $ | 430,025 | | | | 53.4 | % | | | 300.0 | % |
The following table further categorizes loans secured by commercial real estate at December 31, 2014 (dollars in thousands).
| | | Total commercial real estate loans | | | % of gross loans | | | % of Bank's total regulatory capital | |
Development commercial real estate loans | | | | | | | | | | | | |
Secured by: | | | | | | | | | | | | |
Land - unimproved (commercial or residential) | | $ | 15,636 | | | | 1.9 | % | | | 10.9 | % |
Land development - commercial | | | 5,926 | | | | 0.7 | | | | 4.2 | |
Land development - residential | | | 5,338 | | | | 0.7 | | | | 3.7 | |
Commercial construction: | | | | | | | | | | | | |
Retail | | | 3,167 | | | | 0.4 | | | | 2.2 | |
Total development commercial real estate loans | | | 30,067 | | | | 3.7 | | | | 21.0 | |
| | | | | | | | | | | | | |
Existing and other commercial real estate loans | | | | | | | | | | | | |
Secured by: | | | | | | | | | | | | |
Hotel / motel | | | 40,384 | | | | 5.0 | | | | 28.2 | |
Retail | | | 32,703 | | | | 4.1 | | | | 22.8 | |
Office | | | 26,804 | | | | 3.3 | | | | 18.7 | |
Multifamily | | | 9,025 | | | | 1.1 | | | | 6.3 | |
Industrial and warehouse | | | 5,976 | | | | 0.8 | | | | 4.2 | |
Healthcare | | | 13,183 | | | | 1.6 | | | | 9.2 | |
Miscellaneous commercial | | | 102,115 | | | | 12.7 | | | | 71.2 | |
Residential construction - speculative | | | 299 | | | | - | | | | 0.2 | |
Total existing and other commercial real estate loans | | | 230,489 | | | | 28.6 | | | | 160.8 | |
| | | | | | | | | | | | | |
Commercial real estate owner-occupied and residential loans | | | | | | | | | | | | |
Secured by: | | | | | | | | | | | | |
Commercial - owner-occupied | | | 151,774 | | | | 18.9 | | | | 105.9 | |
Commercial construction - owner-occupied | | | 8,542 | | | | 1.1 | | | | 5.9 | |
Residential construction - contract | | | 9,153 | | | | 1.1 | | | | 6.4 | |
Total commercial real estate owner-occupied and residential loans | | | 169,469 | | | | 21.1 | | | | 118.2 | |
| | | | | | | | | | | | | |
Total loans secured by commercial real estate | | $ | 430,025 | | | | 53.4 | % | | | 300.0 | % |
Asset Quality
The composition of the Company’s loan portfolio is currently weighted toward commercial real estate. Commercial real estate loans have higher risks than other real estate loans because repayment is sensitive to interest-rate changes, governmental regulation of real property, general economic and market conditions and the availability of long-term financing particularly in the current economic environment. Commercial and industrial loans are generally secured by the assets being financed or other business assets, such as accounts receivable, inventory or property and equipment, and generally incorporate a personal guarantee. In the case of loans secured by accounts receivable or inventory, the availability of funds for repayment of these loans may depend substantially on the ability of the client to collect amounts due from its customers or to liquidate inventory at sufficient prices. Underwriting standards for single-family real estate purpose loans are heavily regulated by statutory requirements. However, these loans have risks associated with declines in collateral value. Many consumer loans are unsecured and depend solely on the client’s availability of funds for the repayment of the loans.
The Company regularly monitors the credit quality of its loan portfolio. Credit quality refers to the current and expected ability of clients to repay their obligations according to the contractual terms of their loans. Credit quality is evaluated through assignment of individual loan grades as well as past due and performing status analysis. Credit-quality indicators allow the Company to assess the inherent loss on certain individual loans and pools of loans.
The Company uses an internal risk rating system to classify and monitor the credit quality of all commercial loans. Loan risk ratings are based on a graduated scale representing increasing likelihood of loss. Responsibility for the assignment of risk ratings to commercial loans rests with the individual loan officer assigned to each loan subject to verification by the Credit Administration department, which is independent of the loan officers. Risk ratings are also reviewed periodically by an independent third-party loan review firm that reports directly to the Board of Directors. Individual loan officers are also responsible for ensuring risk ratings remain appropriate over the life of the loan. Commercial loan risk ratings are summarized as follows:
Risk rating | Description | Specific characteristics |
1 | Superior Quality | Fully secured by liquid collateral held at the Company |
2 | High Quality | Secured loans to public companies with satisfactory credit ratings and financial strength or secured by properly margined public securities |
3 | Satisfactory | Loans with reasonable credit risk to borrowers with satisfactory credit and financial strength (may include unsecured loans with defined primary and secondary repayment sources) |
4 | Pass | Loans with an elevated credit risk to clients with an adequate credit history and financial strength (includes loans with inherent industry risk with support from principals and/or guarantors) |
W | Watch | A subset of “Pass”, watch loans have somewhat elevated credit risk trends (e.g., financial, economic or industry specific) to clients with an adequate credit history and financial strength |
5 | Special Mention | Loans with potential credit weakness that deserve management attention that, if left uncorrected, may result in deterioration of repayment prospects for the loan |
6 | Substandard | Loans inadequately protected by the current sound worth and paying capacity of the client or of the collateral pledged that have well-defined weaknesses that jeopardize the liquidation of the loan combined with a distinct possibility that the Company will sustain some loss if the deficiencies are not corrected |
7 | Doubtful | Loans with all the weaknesses of “Substandard” with additional factors that make collection or liquidation in full highly questionable and improbable (generally these loans are placed on nonaccrual status) |
8 | Loss | Loans considered uncollectible that are immediately charged-off for which some recovery may exist, but the probability of such recovery does not warrant reflecting the loan as an asset |
NR | Not Rated | Primarily consists of individual consumer loans not assigned a risk rating. Also, commercial loans in process for which an assigned risk rating has not yet been determined as underwriting steps are currently being taken to determine the appropriate risk rating to be assigned. |
Credit quality of the consumer loan portfolio is monitored through review of delinquency measures and nonaccrual levels on a portfolio-level basis. In general, higher levels of amounts past due and loans in nonaccrual status are indicative of increased credit risk and higher potential inherent losses within these loan portfolios.
The following table summarizes various internal credit-quality indicators of gross loans, by class, at December 31, 2014 (in thousands).
| | | Construction, land development and other land loans | | | Multifamily residential | | | Nonfarm nonresidential | | | Total commercial real estate | |
Grade 1 | | $ | - | | | $ | - | | | $ | - | | | $ | - | |
Grade 2 | | | - | | | | - | | | | - | | | | - | |
Grade 3 | | | 3,337 | | | | 144 | | | | 74,966 | | | | 78,447 | |
Grade 4 | | | 17,826 | | | | 1,191 | | | | 183,829 | | | | 202,846 | |
Grade W | | | 9,595 | | | | 7,690 | | | | 62,429 | | | | 79,714 | |
Grade 5 | | | 138 | | | | - | | | | 25,502 | | | | 25,640 | |
Grade 6 | | | 1,724 | | | | - | | | | 25,131 | | | | 26,855 | |
Grade 7 | | | - | | | | - | | | | 1,051 | | | | 1,051 | |
Not risk rated* | | | 15,443 | | | | - | | | | 29 | | | | 15,472 | |
Total | | $ | 48,063 | | | $ | 9,025 | | | $ | 372,937 | | | $ | 430,025 | |
*Consumer real estate loans, included within construction, land development and other land loans, are not risk rated in accordance with the Company's policy.
| | | Commercial and industrial | |
Grade 1 | | $ | 753 | |
Grade 2 | | | 1,534 | |
Grade 3 | | | 12,864 | |
Grade 4 | | | 53,171 | |
Grade W | | | 3,953 | |
Grade 5 | | | 5,786 | |
Grade 6 | | | 2,476 | |
Grade 7 | | | 339 | |
Not risk rated | | | 51 | |
Total | | $ | 80,927 | |
| | | Single-family residential revolving, open-end loans | | | Single-family residential closed-end, first lien | | | Single-family residential closed-end, junior lien | | | Total single-family residential loans | |
Performing | | $ | 79,667 | | | $ | 119,079 | | | $ | 2,710 | | | $ | 201,456 | |
Nonperforming | | | 977 | | | | 1,928 | | | | 78 | | | | 2,983 | |
Total | | $ | 80,644 | | | $ | 121,007 | | | $ | 2,788 | | | $ | 204,439 | |
| | | Indirect automobile | | | All other consumer | | | Total consumer | |
Performing | | $ | 66,161 | | | $ | 10,673 | | | $ | 76,834 | |
Nonperforming | | | 116 | | | | 34 | | | | 150 | |
Total | | $ | 66,277 | | | $ | 10,707 | | | $ | 76,984 | |
| | | Other | |
Performing | | $ | 12,684 | |
Nonperforming | | | - | |
Total | | $ | 12,684 | |
The following table summarizes various internal credit-quality indicators of gross loans, by class, at December 31, 2013 (in thousands).
| | | Construction, land development and other land loans | | | Multifamily residential | | | Nonfarm nonresidential | | | Total commercial real estate | |
Grade 1 | | $ | - | | | $ | - | | | $ | - | | | $ | - | |
Grade 2 | | | - | | | | - | | | | - | | | | - | |
Grade 3 | | | 10,025 | | | | 259 | | | | 69,954 | | | | 80,238 | |
Grade 4 | | | 34,654 | | | | 887 | | | | 171,585 | | | | 207,126 | |
Grade W | | | 8,679 | | | | 9,079 | | | | 83,843 | | | | 101,601 | |
Grade 5 | | | 2,202 | | | | - | | | | 16,727 | | | | 18,929 | |
Grade 6 | | | 4,400 | | | | 181 | | | | 24,352 | | | | 28,933 | |
Grade 7 | | | 803 | | | | - | | | | 1,604 | | | | 2,407 | |
Not risk rated* | | | 15,795 | | | | 11 | | | | 412 | | | | 16,218 | |
Total | | $ | 76,558 | | | $ | 10,417 | | | $ | 368,477 | | | $ | 455,452 | |
| | | | | | |
*Consumer real estate loans, included within construction, land development and other land loans, are not risk ratedin accordance with the Company's policy. |
| | | Commercial and industrial | |
Grade 1 | | $ | 879 | |
Grade 2 | | | 1,186 | |
Grade 3 | | | 8,830 | |
Grade 4 | | | 51,167 | |
Grade W | | | 5,151 | |
Grade 5 | | | 2,361 | |
Grade 6 | | | 2,923 | |
Grade 7 | | | 494 | |
Not risk rated | | | 87 | |
Total | | $ | 73,078 | |
| | | Single-family residential revolving, open-end loans | | | Single-family residential closed-end, first lien | | | Single-family residential closed-end, junior lien | | | Total single-family residential loans | |
Performing | | $ | 69,121 | | | $ | 101,100 | | | $ | 3,802 | | | $ | 174,023 | |
Nonperforming | | | 797 | | | | 3,176 | | | | 129 | | | | 4,102 | |
Total | | $ | 69,918 | | | $ | 104,276 | | | $ | 3,931 | | | $ | 178,125 | |
| | | Indirect automobile | | | All other consumer | | | Total consumer | |
Performing | | $ | 38,514 | | | $ | 11,349 | | | $ | 49,863 | |
Nonperforming | | | 210 | | | | 26 | | | | 236 | |
Total | | $ | 38,724 | | | $ | 11,375 | | | $ | 50,099 | |
| | | Other | |
Performing | | $ | 10,759 | |
Nonperforming | | | - | |
Total | | $ | 10,759 | |
The following table summarizes delinquencies, by class, at December 31, 2014 (in thousands).
| | | 30-89 days past due and still accruing interest | | | Greater than 90 days past due and still accruing interest | | | Greater than 90 days past due and not accruing interest (nonaccrual) | | | Total past due | | | Current | | | Loans, gross | |
Construction, land development and other land loans | | $ | 112 | | | $ | - | | | $ | 441 | | | $ | 553 | | | $ | 47,510 | | | $ | 48,063 | |
Multifamily residential | | | - | | | | - | | | | - | | | | - | | | | 9,025 | | | | 9,025 | |
Nonfarm nonresidential | | | 2,102 | | | | - | | | | 8,174 | | | | 10,276 | | | | 362,661 | | | | 372,937 | |
Total commercial real estate | | | 2,214 | | | | - | | | | 8,615 | | | | 10,829 | | | | 419,196 | | | | 430,025 | |
| | | | | | | | | | | | | | | | | | | | | | | | | |
Single-family real estate, revolving, open-end loans | | | 151 | | | | - | | | | 977 | | | | 1,128 | | | | 79,516 | | | | 80,644 | |
Single-family real estate, closed-end, first lien | | | 827 | | | | 238 | | | | 1,928 | | | | 2,993 | | | | 118,014 | | | | 121,007 | |
Single-family real estate, closed-end, junior lien | | | 16 | | | | - | | | | 78 | | | | 94 | | | | 2,694 | | | | 2,788 | |
Total single-family residential | | | 994 | | | | 238 | | | | 2,983 | | | | 4,215 | | | | 200,224 | | | | 204,439 | |
| | | | | | | | | | | | | | | | | | | | | | | | | |
Commercial and industrial | | | 361 | | | | - | | | | 715 | | | | 1,076 | | | | 79,851 | | | | 80,927 | |
| | | | | | | | | | | | | | | | | | | | | | | | | |
Indirect automobile | | | 283 | | | | - | | | | 116 | | | | 399 | | | | 65,878 | | | | 66,277 | |
All other consumer | | | 33 | | | | - | | | | 34 | | | | 67 | | | | 10,640 | | | | 10,707 | |
Total consumer | | | 316 | | | | - | | | | 150 | | | | 466 | | | | 76,518 | | | | 76,984 | |
| | | | | | | | | | | | | | | | | | | | | | | | | |
Farmland | | | - | | | | - | | | | - | | | | - | | | | 6,032 | | | | 6,032 | |
Obligations of states and political subdivisions of the U.S. | | | - | | | | - | | | | - | | | | - | | | | 416 | | | | 416 | |
Other | | | - | | | | - | | | | - | | | | - | | | | 6,236 | | | | 6,236 | |
Total other | | | - | | | | - | | | | - | | | | - | | | | 12,684 | | | | 12,684 | |
| | | | | | | | | | | | | | | | | | | | | | | | | |
Loans, gross | | $ | 3,885 | | | $ | 238 | | | $ | 12,463 | | | $ | 16,586 | | | $ | 788,473 | | | $ | 805,059 | |
Additional interest income of $478 thousand would have been reported during the year ended December 31, 2014 had loans classified as nonaccrual during the period performed in accordance with their current contractual terms. This interest income was not recorded in the Company’s Consolidated Statements of Income.
The following table summarizes delinquencies, by class, at December 31, 2013 (in thousands).
| | | 30-89 days past due and still accruing interest | | | Greater than 90 days past due and not accruing interest (nonaccrual) | | | Total past due | | | Current | | | Loans, gross | |
Construction, land development and other land loans | | $ | 82 | | | $ | 3,872 | | | $ | 3,954 | | | $ | 72,604 | | | $ | 76,558 | |
Multifamily residential | | | - | | | | 181 | | | | 181 | | | | 10,236 | | | | 10,417 | |
Nonfarm nonresidential | | | 1,199 | | | | 4,832 | | | | 6,031 | | | | 362,446 | | | | 368,477 | |
Total commercial real estate | | | 1,281 | | | | 8,885 | | | | 10,166 | | | | 445,286 | | | | 455,452 | |
| | | | | | | | | | | | | | | | | | | | | |
Single-family real estate, revolving, open-end loans | | | 148 | | | | 797 | | | | 945 | | | | 68,973 | | | | 69,918 | |
Single-family real estate, closed-end, first lien | | | 1,091 | | | | 3,176 | | | | 4,267 | | | | 100,009 | | | | 104,276 | |
Single-family real estate, closed-end, junior lien | | | 41 | | | | 129 | | | | 170 | | | | 3,761 | | | | 3,931 | |
Total single-family residential | | | 1,280 | | | | 4,102 | | | | 5,382 | | | | 172,743 | | | | 178,125 | |
| | | | | | | | | | | | | | | | | | | | | |
Commercial and industrial | | | 306 | | | | 1,885 | | | | 2,191 | | | | 70,887 | | | | 73,078 | |
| | | | | | | | | | | | | | | | | | | | | |
Indirect automobile | | | 294 | | | | 210 | | | | 504 | | | | 38,220 | | | | 38,724 | |
All other consumer | | | 41 | | | | 26 | | | | 67 | | | | 11,308 | | | | 11,375 | |
Total consumer | | | 335 | | | | 236 | | | | 571 | | | | 49,528 | | | | 50,099 | |
| | | | | | | | | | | | | | | | | | | | | |
Farmland | | | - | | | | - | | | | - | | | | 3,394 | | | | 3,394 | |
Obligations of states and political subdivisions of the U.S. | | | - | | | | - | | | | - | | | | 497 | | | | 497 | |
Other | | | - | | | | - | | | | - | | | | 6,868 | | | | 6,868 | |
Total other | | | - | | | | - | | | | - | | | | 10,759 | | | | 10,759 | |
| | | | | | | | | | | | | | | | | | | | | |
Loans, gross | | $ | 3,202 | | | $ | 15,108 | | | $ | 18,310 | | | $ | 749,203 | | | $ | 767,513 | |
Additional interest income of $757 thousand would have been reported during the year ended December 31, 2013 had loans classified as nonaccrual during the period performed in accordance with their current contractual terms. This interest income was not recorded in the Company’s Consolidated Statements of Income.
Troubled Debt Restructurings. The following table summarizes the carrying balance of troubled debt restructurings at the dates indicated (in thousands).
| | | December 31, | |
| | | 2014 | | | 2013 | |
Accrual | | $ | 15,585 | | | $ | 26,744 | |
Nonaccrual | | | 4,286 | | | | 2,184 | |
Total troubled debt restructurings | | $ | 19,871 | | | $ | 28,928 | |
The following table summarizes troubled debt restructurings removed from this classification during the periods indicated (dollars in thousands).
| | | For the years ended December 31, | |
| | | 2014 | | | 2013 | | | 2012 | |
Carrying balance | | $ | 8,615 | | | $ | 7,077 | | | $ | 6,018 | |
Count | | | 7 | | | | 14 | | | | 19 | |
Of the $8.6 million of loans removed from troubled debt restructuring classification during 2014, three loans totaling $7.1 million were also removed from classification as impaired loans for purposes of determining the allowance for loan losses.
The following table summarizes, by class, loans that were modified resulting in troubled debt restructurings during the periods indicated (dollars in thousands).
| | | For the years ended December 31, | |
| | | 2014 | | | 2013 | | | 2012 | |
| | | Number of loans | | | Pre-modification outstanding recorded investment | | | Post-modification outstanding recorded investment | | | Number of loans | | | Pre-modification outstanding recorded investment | | | Post-modification outstanding recorded investment | | | Number of loans | | | Pre-modification outstanding recorded investment | | | Post-modification outstanding recorded investment | |
| | | | | | | | | | | | | | | | | | | | | | | | | | | | | | | | | | | | | |
Construction, land development and other land loans | | | - | | | $ | - | | | $ | - | | | | 1 | | | $ | 60 | | | $ | 60 | | | | 1 | | | $ | 4,089 | | | $ | 4,089 | |
Nonfarm nonresidential | | | 1 | | | | 883 | | | | 883 | | | | 4 | | | | 4,364 | | | | 4,364 | | | | 8 | | | | 2,305 | | | | 2,305 | |
Total commercial real estate | | | 1 | | | | 883 | | | | 883 | | | | 5 | | | | 4,424 | | | | 4,424 | | | | 9 | | | | 6,394 | | | | 6,394 | |
| | | | | | | | | | | | | | | | | | | | | | | | | | | | | | | | | | | | | |
Single-family real estate | | | - | | | | - | | | | - | | | | - | | | | - | | | | - | | | | 4 | | | | 715 | | | | 715 | |
| | | | | | | | | | | | | | | | | | | | | | | | | | | | | | | | | | | | | |
Commercial and industrial | | | 3 | | | | 2,665 | | | | 1,365 | | | | 1 | | | | 242 | | | | 242 | | | | 3 | | | | 506 | | | | 501 | |
Loans, gross | | | 4 | | | $ | 3,548 | | | $ | 2,248 | | | | 6 | | | $ | 4,666 | | | $ | 4,666 | | | | 16 | | | $ | 7,615 | | | $ | 7,610 | |
The following table summarizes, by type of concession, loans that were modified resulting in troubled debt restructurings during the periods indicated (dollars in thousands).
| | | For the years ended December 31, | |
| | | 2014 | | | 2013 | | | 2012 | |
| | | Number of loans | | | Pre-modification outstanding recorded investment | | | Post-modification outstanding recorded investment | | | Number of loans | | | Pre-modification outstanding recorded investment | | | Post-modification outstanding recorded investment | | | Number of loans | | | Pre-modification outstanding recorded investment | | | Post-modification outstanding recorded investment | |
| | | | | | | | | | | | | | | | | | | | | | | | | | | | | | | | | | | | | |
Rate concession | | | - | | | $ | - | | | $ | - | | | | 1 | | | $ | 60 | | | $ | 60 | | | | - | | | $ | - | | | $ | - | |
Term concession | | | 1 | | | | 883 | | | | 883 | | | | 5 | | | | 4,606 | | | | 4,606 | | | | 6 | | | | 5,047 | | | | 5,047 | |
Term and principal concessions | | | 3 | | | | 2,665 | | | | 1,365 | | | | - | | | | - | | | | - | | | | - | | | | - | | | | - | |
Rate and term concessions | | | - | | | | - | | | | - | | | | - | | | | - | | | | - | | | | 10 | | | | 2,568 | | | | 2,563 | |
Loans, gross | | | 4 | | | $ | 3,548 | | | $ | 2,248 | | | | 6 | | | $ | 4,666 | | | $ | 4,666 | | | | 16 | | | $ | 7,615 | | | $ | 7,610 | |
The following table summarizes, by class, loans that were modified resulting in troubled debt restructurings within the previous 12-month period for which there was a payment default during the periods indicated (dollars in thousands).
| | | For the years ended December 31, | |
| | | 2014 | | | 2013 | | | 2012 | |
| | | Number of loans | | | Recorded investment | | | Number of loans | | | Recorded investment | | | Number of loans | | | Recorded investment | |
Construction, land development and other land loans | | | - | | | $ | - | | | | 1 | | | $ | 56 | | | | - | | | $ | - | |
Nonfarm nonresidential | | | 2 | | | | 2,597 | | | | - | | | | - | | | | 2 | | | | 2,122 | |
Total commercial real estate | | | 2 | | | | 2,597 | | | | 1 | | | | 56 | | | | 2 | | | | 2,122 | |
| | | | | | | | | | | | | | | | | | | | | | | | | |
Single-family real estate | | | - | | | | - | | | | 1 | | | | 404 | | | | 2 | | | | 293 | |
| | | | | | | | | | | | | | | | | | | | | | | | | |
Commercial and industrial | | | 2 | | | | 486 | | | | 1 | | | | 127 | | | | - | | | | - | |
| | | | | | | | | | | | | | | | | | | | | | | | | |
Consumer | | | - | | | | - | | | | - | | | | - | | | | - | | | | - | |
Loans, gross | | | 4 | | | $ | 3,083 | | | | 3 | | | $ | 587 | | | | 4 | | | $ | 2,415 | |
Impaired Loans. The following tables summarize the composition of impaired loans at the dates indicated (in thousands).
| | | December 31, | |
| | | 2014 | | | 2013 | |
Accrual troubled debt restructured loans | | $ | 15,585 | | | $ | 26,744 | |
Nonaccrual troubled debt restructured loans | | | 4,286 | | | | 2,184 | |
Accrual other loans | | | 7,955 | | | | 9,187 | |
Nonaccrual other loans | | | 3,736 | | | | 6,580 | |
Total impaired loans | | $ | 31,562 | | | $ | 44,695 | |
The following table summarizes the composition of and information relative to impaired loans, by class, at December 31, 2014 (in thousands).
| | | Loans, gross | |
| | | Recorded investment | | | Unpaid principal balance | | | Related allowance | |
With no related allowance recorded: | | | | | | | | | | | | |
Construction, land development and other land loans | | $ | 283 | | | $ | 805 | | | | | |
Multifamily residential | | | - | | | | - | | | | | |
Nonfarm nonresidential | | | 18,534 | | | | 23,055 | | | | | |
Total commercial real estate | | | 18,817 | | | | 23,860 | | | | | |
| | | | | | | | | | | | | |
Single-family real estate, revolving, open-end loans | | | 333 | | | | 333 | | | | | |
Single-family real estate, closed-end, first lien | | | 645 | | | | 750 | | | | | |
Single-family real estate, closed-end, junior lien | | | 24 | | | | 24 | | | | | |
Total single-family residential | | | 1,002 | | | | 1,107 | | | | | |
| | | | | | | | | | | | | |
Commercial and industrial | | | 607 | | | | 2,208 | | | | | |
| | | | | | | | | | | | | |
Consumer | | | - | | | | - | | | | | |
| | | | | | | | | | | | | |
Total impaired loans with no related allowance recorded | | $ | 20,426 | | | $ | 27,175 | | | | | |
| | | | | | | | | | | | | |
With an allowance recorded: | | | | | | | | | | | | |
Construction, land development and other land loans | | $ | 6 | | | $ | 6 | | | $ | - | |
Multifamily residential | | | - | | | | - | | | | - | |
Nonfarm nonresidential | | | 10,186 | | | | 12,021 | | | | 1,555 | |
Total commercial real estate | | | 10,192 | | | | 12,027 | | | | 1,555 | |
| | | | | | | | | | | | | |
Single-family real estate, revolving, open-end loans | | | - | | | | - | | | | - | |
Single-family real estate, closed-end, first lien | | | 208 | | | | 208 | | | | 24 | |
Single-family real estate, closed-end, junior lien | | | 106 | | | | 106 | | | | 41 | |
Total single-family residential | | | 314 | | | | 314 | | | | 65 | |
| | | | | | | | | | | | | |
Commercial and industrial | | | 616 | | | | 616 | | | | 115 | |
| | | | | | | | | | | | | |
Consumer | | | 14 | | | | 14 | | | | 2 | |
| | | | | | | | | | | | | |
Total impaired loans with an allowance recorded | | $ | 11,136 | | | $ | 12,971 | | | $ | 1,737 | |
| | | | | | | | | | | | | |
Total: | | | | | | | | | | | | |
Construction, land development and other land loans | | $ | 289 | | | $ | 811 | | | $ | - | |
Multifamily residential | | | - | | | | - | | | | - | |
Nonfarm nonresidential | | | 28,720 | | | | 35,076 | | | | 1,555 | |
Total commercial real estate | | | 29,009 | | | | 35,887 | | | | 1,555 | |
| | | | | | | | | | | | | |
Single-family real estate, revolving, open-end loans | | | 333 | | | | 333 | | | | - | |
Single-family real estate, closed-end, first lien | | | 853 | | | | 958 | | | | 24 | |
Single-family real estate, closed-end, junior lien | | | 130 | | | | 130 | | | | 41 | |
Total single-family residential | | | 1,316 | | | | 1,421 | | | | 65 | |
| | | | | | | | | | | | | |
Commercial and industrial | | | 1,223 | | | | 2,824 | | | | 115 | |
| | | | | | | | | | | | | |
Consumer | | | 14 | | | | 14 | | | | 2 | |
| | | | | | | | | | | | | |
Total impaired loans | | $ | 31,562 | | | $ | 40,146 | | | $ | 1,737 | |
Interest income recognized on impaired loans during the year ended December 31, 2014 was $1.5 million. The average balance of total impaired loans was $41.6 million for the same period.
The following table summarizes the composition of and information relative to impaired loans, by class, at December 31, 2013 (in thousands).
| | | Loans, gross | |
| | | Recorded investment | | | Unpaid principal balance | | | Related allowance | |
With no related allowance recorded: | | | | | | | | | | | | |
Construction, land development and other land loans | | $ | 3,244 | | | $ | 6,503 | | | | | |
Multifamily residential | | | 181 | | | | 239 | | | | | |
Nonfarm nonresidential | | | 17,414 | | | | 24,422 | | | | | |
Total commercial real estate | | | 20,839 | | | | 31,164 | | | | | |
| | | | | | | | | | | | | |
Single-family real estate, revolving, open-end loans | | | - | | | | - | | | | | |
Single-family real estate, closed-end, first lien | | | 1,369 | | | | 5,811 | | | | | |
Single-family real estate, closed-end, junior lien | | | - | | | | - | | | | | |
Total single-family residential | | | 1,369 | | | | 5,811 | | | | | |
| | | | | | | | | | | | | |
Commercial and industrial | | | 753 | | | | 1,150 | | | | | |
| | | | | | | | | | | | | |
Consumer | | | 7 | | | | 7 | | | | | |
| | | | | | | | | | | | | |
Total impaired loans with no related allowance recorded | | $ | 22,968 | | | $ | 38,132 | | | | | |
| | | | | | | | | | | | | |
With an allowance recorded: | | | | | | | | | | | | |
Construction, land development and other land loans | | $ | 260 | | | $ | 260 | | | $ | 68 | |
Multifamily residential | | | - | | | | - | | | | - | |
Nonfarm nonresidential | | | 18,839 | | | | 18,839 | | | | 1,668 | |
Total commercial real estate | | | 19,099 | | | | 19,099 | | | | 1,736 | |
| | | | | | | | | | | | | |
Single-family real estate, revolving, open-end loans | | | 404 | | | | 404 | | | | 83 | |
Single-family real estate, closed-end, first lien | | | 323 | | | | 323 | | | | 18 | |
Single-family real estate, closed-end, junior lien | | | 195 | | | | 195 | | | | 62 | |
Total single-family residential | | | 922 | | | | 922 | | | | 163 | |
| | | | | | | | | | | | | |
Commercial and industrial | | | 1,680 | | | | 2,980 | | | | 644 | |
| | | | | | | | | | | | | |
Consumer | | | 26 | | | | 26 | | | | 12 | |
| | | | | | | | | | | | | |
Total impaired loans with an allowance recorded | | $ | 21,727 | | | $ | 23,027 | | | $ | 2,555 | |
| | | | | | | | | | | | | |
Total: | | | | | | | | | | | | |
Construction, land development and other land loans | | $ | 3,504 | | | $ | 6,763 | | | $ | 68 | |
Multifamily residential | | | 181 | | | | 239 | | | | - | |
Nonfarm nonresidential | | | 36,253 | | | | 43,261 | | | | 1,668 | |
Total commercial real estate | | | 39,938 | | | | 50,263 | | | | 1,736 | |
| | | | | | | | | | | | | |
Single-family real estate, revolving, open-end loans | | | 404 | | | | 404 | | | | 83 | |
Single-family real estate, closed-end, first lien | | | 1,692 | | | | 6,134 | | | | 18 | |
Single-family real estate, closed-end, junior lien | | | 195 | | | | 195 | | | | 62 | |
Total single-family residential | | | 2,291 | | | | 6,733 | | | | 163 | |
| | | | | | | | | | | | | |
Commercial and industrial | | | 2,433 | | | | 4,130 | | | | 644 | |
| | | | | | | | | | | | | |
Consumer | | | 33 | | | | 33 | | | | 12 | |
| | | | | | | | | | | | | |
Total impaired loans | | $ | 44,695 | | | $ | 61,159 | | | $ | 2,555 | |
Interest income recognized on impaired loans during the year ended December 31, 2013 was $1.6 million. The average balance of total impaired loans was $44.7 million for the same period.
Allowance for Loan Losses
The following tables summarize the allowance for loan losses and recorded investment in gross loans, by portfolio segment, at the dates and for the periods indicated (in thousands).
| | | For the year ended December 31, 2014 | |
| | | Commercial | | | Single-family | | | Commercial and | | | | | | | | | | | | | |
| | | real estate | | | residential | | | industrial | | | Consumer | | | Other | | | Total | |
Allowance for loan losses, beginning of period | | $ | 10,565 | | | $ | 3,124 | | | $ | 1,682 | | | $ | 1,118 | | | $ | (4 | ) | | $ | 16,485 | |
Provision for loan losses | | | (2,506 | ) | | | (553 | ) | | | (152 | ) | | | 362 | | | | 549 | | | | (2,300 | ) |
| | | | | | | | | | | | | | | | | | | | | | | | | |
Loan charge-offs | | | 1,082 | | | | 697 | | | | 530 | | | | 225 | | | | 555 | | | | 3,089 | |
Loan recoveries | | | (396 | ) | | | (982 | ) | | | (47 | ) | | | (83 | ) | | | (316 | ) | | | (1,824 | ) |
Net loans charged-off (recovered) | | | 686 | | | | (285 | ) | | | 483 | | | | 142 | | | | 239 | | | | 1,265 | |
| | | | | | | | | | | | | | | | | | | | | | | | | |
Allowance for loan losses, end of period | | $ | 7,373 | | | $ | 2,856 | | | $ | 1,047 | | | $ | 1,338 | | | $ | 306 | | | $ | 12,920 | |
| | | December 31, 2014 | |
| | | Commercial | | | Single-family | | | Commercial and | | | | | | | | | | | | | |
| | | real estate | | | residential | | | industrial | | | Consumer | | | Other | | | Total | |
Individually evaluated for impairment | | $ | 1,555 | | | $ | 65 | | | $ | 115 | | | $ | 2 | | | $ | - | | | $ | 1,737 | |
Collectively evaluated for impairment | | | 5,818 | | | | 2,791 | | | | 932 | | | | 1,336 | | | | 306 | | | | 11,183 | |
Allowance for loan losses, end of period | | $ | 7,373 | | | $ | 2,856 | | | $ | 1,047 | | | $ | 1,338 | | | $ | 306 | | | $ | 12,920 | |
| | | | | | | | | | | | | | | | | | | | | | | | | |
Individually evaluated for impairment | | $ | 29,009 | | | $ | 1,316 | | | $ | 1,223 | | | $ | 14 | | | $ | - | | | $ | 31,562 | |
Collectively evaluated for impairment | | | 401,016 | | | | 203,123 | | | | 79,704 | | | | 76,970 | | | | 12,684 | | | | 773,497 | |
Loans, gross | | $ | 430,025 | | | $ | 204,439 | | | $ | 80,927 | | | $ | 76,984 | | | $ | 12,684 | | | $ | 805,059 | |
| | | For the year ended December 31, 2013 | |
| | | Commercial | | | Single-family | | | Commercial and | | | | | | | | | | | | | |
| | | real estate | | | residential | | | industrial | | | Consumer | | | Other | | | Total | |
Allowance for loan losses, beginning of period | | $ | 12,317 | | | $ | 3,140 | | | $ | 1,264 | | | $ | 1,093 | | | $ | 11 | | | $ | 17,825 | |
Provision for loan losses | | | (263 | ) | | | 580 | | | | 2,697 | | | | 172 | | | | 279 | | | | 3,465 | |
| | | | | | | | | | | | | | | | | | | | | | | | | |
Loan charge-offs | | | 1,780 | | | | 731 | | | | 2,426 | | | | 285 | | | | 669 | | | | 5,891 | |
Loan recoveries | | | (291 | ) | | | (135 | ) | | | (147 | ) | | | (138 | ) | | | (375 | ) | | | (1,086 | ) |
Net loans charged-off | | | 1,489 | | | | 596 | | | | 2,279 | | | | 147 | | | | 294 | | | | 4,805 | |
| | | | | | | | | | | | | | | | | | | | | | | | | |
Allowance for loan losses, end of period | | $ | 10,565 | | | $ | 3,124 | | | $ | 1,682 | | | $ | 1,118 | | | $ | (4 | ) | | $ | 16,485 | |
| | | December 31, 2013 | |
| | | Commercial | | | Single-family | | | Commercial and | | | | | | | | | | | | | |
| | | real estate | | | residential | | | industrial | | | Consumer | | | Other | | | Total | |
Individually evaluated for impairment | | $ | 1,736 | | | $ | 163 | | | $ | 644 | | | $ | 12 | | | $ | - | | | $ | 2,555 | |
Collectively evaluated for impairment | | | 8,829 | | | | 2,961 | | | | 1,038 | | | | 1,106 | | | | (4 | ) | | | 13,930 | |
Allowance for loan losses, end of period | | $ | 10,565 | | | $ | 3,124 | | | $ | 1,682 | | | $ | 1,118 | | | $ | (4 | ) | | $ | 16,485 | |
| | | | | | | | | | | | | | | | | | | | | | | | | |
Individually evaluated for impairment | | $ | 39,938 | | | $ | 2,291 | | | $ | 2,433 | | | $ | 33 | | | $ | - | | | $ | 44,695 | |
Collectively evaluated for impairment | | | 415,514 | | | | 175,834 | | | | 70,645 | | | | 50,066 | | | | 10,759 | | | | 722,818 | |
Loans, gross | | $ | 455,452 | | | $ | 178,125 | | | $ | 73,078 | | | $ | 50,099 | | | $ | 10,759 | | | $ | 767,513 | �� |
6. | Other Loans Held for Sale and Valuation Allowance |
The following table summarizes the changes in netother loans held for saleat the dates and for the periods indicated (in thousands).
| | | At and for the years ended December 31, | |
| | | 2014 | | | 2013 | |
Other loans held for sale, net of valuation allowance, beginning of period | | $ | - | | | $ | 776 | |
| | | | | | | | | |
SBA loans transferred to other loans held for sale | | | 1,166 | | | | 2,015 | |
Proceeds from sales of SBA loans | | | (1,236 | ) | | | (2,222 | ) |
Gain on sale of SBA loans | | | 70 | | | | 207 | |
SBA loan activity, net | | | - | | | | - | |
| | | | | | | | | |
Proceeds from sales of other loans held for sale | | | - | | | | (1,102 | ) |
Gain on sale of other loans held for sale | | | - | | | | 326 | |
Other loans held for sale activity, net | | | - | | | | (776 | ) |
| | | | | | | | | |
Other loans held for sale, net of valuation allowance, end of period | | $ | - | | | $ | - | |
The following table summarizes the activity in the valuation allowance on other loans held for sale at the dates and for the periods indicated (in thousands).
| | | At and for the years ended December 31, | |
| | | 2014 | | | 2013 | |
Valuation allowance, beginning of period | | $ | - | | | $ | 1,512 | |
Reduction resulting from sales of other loans held for sale | | | - | | | | (1,512 | ) |
Valuation allowance, end of period | | $ | - | | | $ | - | |
7. | Premises and Equipment, net |
The following table summarizes premises and equipment balances, net at the dates indicated (in thousands).
| | | December 31, | | |
| | | 2014 | | | 2013 | | |
Land | | $ | 5,521 | | | $ | 5,521 | | |
Buildings | | | 19,539 | | | | 19,395 | | |
Furniture and equipment | | | 13,395 | | | | 13,259 | | |
Software | | | 5,556 | | | | 5,344 | | |
Leasehold improvements | | | 3,782 | | | | 3,746 | | |
Capital lease asset | | | 557 | | | | 1,396 | | |
Bank automobiles | | | 94 | | | | 95 | | |
Premises and equipment, gross | | $ | 48,444 | | | $ | 48,756 | | |
| | | | | | | | | | |
Accumulated depreciation | | | (26,438 | ) | | | (25,389 | ) | |
Premises and equipment, net | | $ | 22,006 | | | $ | 23,367 | | |
At December 31, 2014, the Bank provided banking products and services through 25 branches of which five were leased and 20 were owned.
Depreciation expense for the years ended December 31, 2014, 2013 and 2012 was $2.4 million, $2.6 million and $2.5 million, respectively.
Residential Mortgage-Servicing Rights
The following table summarizes the changes in residential mortgage-servicing rights at the dates and for the periods indicated (in thousands).
| | | At and for the years ended December 31, | |
| | | 2014 | | | 2013 | | | 2012 | |
Mortgage-servicing rights portfolio, net of valuation allowance, beginning of period | | $ | 2,431 | | | $ | 2,584 | | | $ | 2,586 | |
Capitalized mortgage-servicing rights | | | 390 | | | | 612 | | | | 864 | |
Mortgage-servicing rights portfolio amortization and impairment | | | (573 | ) | | | (765 | ) | | | (866 | ) |
Mortgage-servicing rights portfolio, net of valuation allowance, end of period | | $ | 2,248 | | | $ | 2,431 | | | $ | 2,584 | |
The estimated fair value of residential mortgage-servicing rights was $3.4 million and $3.8 million at December 31, 2014 and 2013, respectively.
The following table summarizes the activity in the valuation allowance for impairment of the residential mortgage-servicing rights portfolio at the dates and for the periods indicated (in thousands).
| | | At and for the years ended December 31, | |
| | | 2014 | | | 2013 | | | 2012 | |
Valuation allowance, beginning of period | | $ | 31 | | | $ | 41 | | | $ | 39 | |
Additions charged (reductions credited) to operations, net | | | (10 | ) | | | (10 | ) | | | 2 | |
Valuation allowance, end of period | | $ | 21 | | | $ | 31 | | | $ | 41 | |
The following table summarizes the estimated future amortization expense of residential mortgage-servicing rights, net of the valuation allowance for impairment, at December 31, 2014 during the periods indicated (in thousands).
For the years ended December 31, | | | | |
2015 | | $ | 661 | |
2016 | | | 531 | |
2017 | | | 423 | |
2018 | | | 333 | |
2019 | | | 260 | |
Thereafter | | | 61 | |
| | | $ | 2,269 | |
SBAServicing Rights
The following table summarizes the changes in SBA servicing rights at the dates and for the periods indicated (in thousands).
| | | At and for the years ended December 31, | |
| | | 2014 | | | 2013 | | | 2012 | |
SBA servicing rights portfolio, net of valuation allowance, beginning of period | | $ | 64 | | | $ | 39 | | | $ | - | |
Capitalized SBA servicing rights | | | 31 | | | | 47 | | | | 40 | |
SBA servicing rights portfolio amortization and impairment | | | (18 | ) | | | (22 | ) | | | (1 | ) |
SBA servicing rights portfolio, net of valuation allowance, end of period | | $ | 77 | | | $ | 64 | | | $ | 39 | |
The estimated fair value of SBA servicing rights was $84 thousand and $69 thousand at December 31, 2014 and 2013, respectively.
The following table summarizes the activity in the valuation allowance for impairment of the SBA servicing rights portfolio at the dates and for the periods indicated (in thousands).
| | | At and for the year ended | |
| | | December 31, | |
| | | 2014 | | | 2013 | |
Valuation allowance, beginning of period | | $ | 8 | | | $ | - | |
Additions charged to operations, net | | | 4 | | | | 8 | |
Valuation allowance, end of period | | $ | 12 | | | $ | 8 | |
The following table summarizes the estimated future amortization expense of SBA servicing rights (without regard to the valuation allowance for impairment) at December 31, 2014 during the periods indicated (in thousands).
For the years ended December 31, | | | | |
2015 | | $ | 14 | |
2016 | | | 12 | |
2017 | | | 11 | |
2018 | | | 10 | |
2019 | | | 8 | |
Thereafter | | | 34 | |
| | | $ | 89 | |
9. | Foreclosed Real Estate and Repossessed Personal Property |
Composition
The following table summarizes foreclosed real estate and repossessed personal property at the dates indicated (in thousands).
| | | December 31, | |
| | | 2014 | | | 2013 | |
Foreclosed real estate | | $ | 5,949 | | | $ | 7,502 | |
Repossessed personal property | | | 35 | | | | 43 | |
Total foreclosed real estate and repossessed personal property | | $ | 5,984 | | | $ | 7,545 | |
Included in foreclosed real estate at December 31, 2014 were 56 residential lots with an aggregate net book value of $4.7 million, in three separate communities related to one real estate development. At December 31, 2014, two lots with a carrying value of $405 thousand were under contract for sale and closed during January 2015 at prices above carrying value.
Foreclosed Real EstateActivity
The following table summarizes changes in foreclosed real estate at the dates and for the periods indicated (in thousands).
| | | At and for the years ended December 31, | |
| | | 2014 | | | 2013 | | | 2012 | |
Foreclosed real estate, beginning of period | | $ | 7,502 | | | $ | 10,911 | | | $ | 27,663 | |
Plus: new foreclosed real estate | | | 2,312 | | | | 2,541 | | | | 5,389 | |
Less: proceeds from sale of foreclosed real estate | | | (2,521 | ) | | | (2,973 | ) | | | (13,524 | ) |
Plus: gain on sale of foreclosed real estate | | | 386 | | | | 142 | | | | 729 | |
Less: writedowns and losses charged to expense | | | (1,730 | ) | | | (3,119 | ) | | | (9,346 | ) |
Foreclosed real estate, end of period | | $ | 5,949 | | | $ | 7,502 | | | $ | 10,911 | |
10. | Bank-Owned Life Insurance |
The Company owns two fully-funded general account life insurance policies on certain members of its leadership team. The Company paid all premiums on these policies during 2013 and is the sole beneficiary; however, the Company provides a $50 thousand death benefit to the beneficiaries of the covered teammates. Each policy was funded with a premium of $5.0 million paid to AA+ rated insurance companies. The policies are reflected in the Consolidated Balance Sheets at the cash surrender value of $10.4 million and $10.0 million at December 31, 2014 and 2013, respectively.
In addition, the Company has fully-funded life insurance policies on two former members of executive management who are retired from the Company. At both December 31, 2014 and 2013, the cash surrender value of these policies attributable to the Company totaled $1.6 million.
Composition
The following table summarizes the composition of deposits at the dates indicated (in thousands).
| | | December 31, | | | | | |
| | | 2014 | | | 2013 | | | | | |
Transaction deposits | | $ | 528,633 | | | $ | 494,289 | | | | | |
Money market deposits | | | 138,449 | | | | 136,476 | | | | | |
Savings deposits | | | 90,318 | | | | 79,760 | | | | | |
Time deposits $100,000 and greater | | | 67,419 | | | | 79,654 | | | | | |
Time deposits less than $100,000 | | | 103,501 | | | | 117,181 | | | | | |
Total deposits | | $ | 928,320 | | | $ | 907,360 | | | | | |
At December 31, 2014 and 2013, $531 thousand and $564 thousand, respectively, of overdrawn transaction deposit accounts were reclassified to loans.
At December 31, 2014 and 2013, $17.6 million and $22.2 million, respectively, of time deposits meet or exceed the FDIC insurance limit of $250,000.
Time Deposit Maturities
The following table summarizes the maturity distribution of time deposit accounts at December 31, 2014 during the periods indicated (in thousands).
For the years ended December 31, | | | | | |
2015 | | $ | 124,154 | | |
2016 | | | 24,321 | | |
2017 | | | 12,809 | | |
2018 | | | 7,262 | | |
2019 | | | 2,343 | | |
Thereafter | | | 31 | | |
| | | $ | 170,920 | | |
Time Deposits $100 Thousand and Greater
The following table summarizes time deposit accounts of $100 thousand and greater by maturity as of December 31, 2014 (in thousands).
| | | As of December 31, 2014 | |
Three months or less | | $ | 19,401 | |
Over three months through six months | | | 12,174 | |
Over six months through twelve months | | | 14,187 | |
Twelve months or less | | | 45,762 | |
| | | | | |
Over twelve months | | | 21,657 | |
Total time deposits $100 thousand and greater | | $ | 67,419 | |
Interest Expense on Deposit Accounts
The following table summarizes interest expense on deposits for the periods indicated (in thousands).
| | | For the years ended December 31, | |
| | | 2014 | | | 2013 | | | 2012 | |
Transaction deposits | | $ | 41 | | | $ | 39 | | | $ | 39 | |
Money market deposits | | | 38 | | | | 32 | | | | 47 | |
Savings deposits | | | 9 | | | | 10 | | | | 9 | |
Time deposits | | | 406 | | | | 2,176 | | | | 5,041 | |
Total interest expense on deposits | | $ | 494 | | | $ | 2,257 | | | $ | 5,136 | |
The following table provides detail with respect to borrowings at the dates and for the periods indicated (dollars in thousands).
| | | At and for the years ended December 31, | |
| | | 2014 | | | 2013 | | | 2012 | |
Retail repurchase agreements | | | | | | | | | | | | |
Amount outstanding at year-end | | $ | 15,921 | | | $ | 18,175 | | | $ | 15,357 | |
Average amount outstanding during year | | | 20,054 | | | | 18,916 | | | | 20,485 | |
Maximum amount outstanding at any month-end | | | 31,418 | | | | 24,640 | | | | 27,985 | |
Rate paid at year-end | | | 0.01 | % | | | 0.01 | % | | | 0.01 | % |
Weighted average rate paid during the year | | | 0.01 | | | | 0.01 | | | | 0.01 | |
| | | | | | | | | | | | | |
FHLB advances | | | | | | | | | | | | |
Amount outstanding at year-end | | $ | 35,000 | | | $ | 35,000 | | | $ | - | |
Average amount outstanding during year | | | 12,205 | | | | 425 | | | | 1 | |
Maximum amount outstanding at any month-end | | | 40,000 | | | | 35,000 | | | | - | |
Rate paid at year-end | | | 0.24 | % | | | 0.17 | % | | | - | % |
Weighted average rate paid during the year | | | 0.22 | | | | 0.24 | | | | - | |
| | | | | | | | | | | | | |
Other borrowings | | | | | | | | | | | | |
Amount outstanding at year-end | | $ | - | | | $ | - | | | $ | - | |
Average amount outstanding during year | | | 16 | | | | 159 | | | | 30 | |
Maximum amount outstanding at any month-end | | | - | | | | - | | | | - | |
Rate paid at year-end | | | - | % | | | - | % | | | - | % |
Weighted average rate paid during the year | | | - | | | | - | | | | - | |
Retail Repurchase Agreements
Retail repurchase agreements represent overnight secured borrowing arrangements between the Bank and certain clients. Retail repurchase agreements are not insured deposits and were secured by $36.6 million of the Company’s investment securities available for sale at December 31, 2014.
FHLB Advances
As disclosed in Note 4, Investment Securities Available for Sale, and Note 5, Loans, the Bank may pledge investment securities and loans to collateralize FHLB advances. Additionally, the Bank may pledge cash and cash equivalents. The amount that can be borrowed is based on the balance of the type of asset pledged as collateral multiplied by lendable collateral value percentages as calculated by the FHLB. The FHLB allows the Bank to borrow up to 25% of total assets, subject to available collateral.
The following table summarizes the collateral utilization and availability of borrowings from the FHLB at the dates indicated (in thousands).
| | | December 31, | |
| | | 2014 | | | 2013 | |
Available lendable loan collateral value pledged to serve against FHLB advances | | $ | 79,139 | | | $ | 90,225 | |
FHLB advances outstanding | | | 35,000 | | | | 35,000 | |
Excess lendable collateral value pledged to serve against FHLB advances | | $ | 44,139 | | | $ | 55,225 | |
All FHLB advances at December 31, 2014 matured during January 2015 and were replaced with new advances maturing between April and July 2015 with a weighted-average rate of 0.26%.
Federal Reserve Discount Window
At December 31, 2014 and 2013, $39.5 million and $2.2 million, respectively, of loans and investment securities were pledged as collateral to cover the various Federal Reserve services that are available for use by the Bank. Of these amounts, $29.1 million and $2.1 million were available as lendable collateral at December 31, 2014 and 2013, respectively. The Bank’s borrowings from the Federal Reserve Discount Window (the “Discount Window”) are at the primary credit rate. Primary credit is available through the Discount Window to generally sound depository institutions on a very short-term basis, typically overnight, at a rate above the Federal Open Market Committee target rate for federal funds. The Bank’s maximum maturity for potential borrowings is overnight. The Bank has not drawn on this availability since its initial establishment in 2009 other than to periodically test its ability to access the line. The Federal Reserve has the discretion to deny approval of borrowing requests.
Other Borrowings
Other borrowings generally consist of outstanding borrowings on correspondent bank lines of credit.
Correspondent Bank Lines of Credit. The following table summarizes the Bank’s correspondent bank lines of credit at the dates indicated (dollars in thousands).
| | | December 31, 2014 | | | December 31, 2013 | |
| | | Secured | | | Unsecured | | | Total | | | Secured | | | Unsecured | | | Total | |
Amount available | | $ | 15,000 | | | $ | 65,000 | | | $ | 80,000 | | | $ | 35,000 | | | $ | 25,000 | | | $ | 60,000 | |
Count | | | 2 | | | | 6 | | | | 8 | | | | 3 | | | | 2 | | | | 5 | |
The changes in the composition of our correspondent bank lines of credit during 2014 were the result of the additional of two unsecured lines totaling $20 million as well as the a previously secured correspondence line of credit being converted into one secured and one unsecured line of credit..
None of the lines of credit were utilized as of either date. These correspondent bank funding sources may be canceled at any time at the correspondent bank’s discretion.
Common Shares
At December 31, 2014, the Company had 75,000,000 authorized shares of common stock of which 12,810,388 were issued and outstanding. As of February 23, 2015, the Company has reserved a total of 554,645 shares for future issuance under various equity incentive plans.
For disclosure regarding actual and potential share issuances under the Company’s equity award plans, see Note 16, Equity-Based Compensation.
Accumulated Other Comprehensive Loss
The following table summarizes the components of accumulated other comprehensive loss, net of tax at the dates indicated (in thousands).
| | | December 31, | |
| | | 2014 | | | 2013 | | | 2012 | |
Net unrealized loss on investment securities available for sale | | $ | (819 | ) | | $ | (2,990 | ) | | $ | 1,491 | |
Net unrealized defined benefit pension plan actuarial loss | | | (9,084 | ) | | | (7,303 | ) | | | (8,208 | ) |
Total accumulated other comprehensive loss, net of tax | | $ | (9,903 | ) | | $ | (10,293 | ) | | $ | (6,717 | ) |
Authorized Preferred Shares
The Company has authorized for issuance 2,500,000 shares of preferred stock with such preferences, limitations and relative rights within legal limits of the class, or one or more series within the class, as are set by the Board of Directors. To date, the Company has not issued any preferred shares.
Cash Dividends
Dividends from the Bank are the Company’s primary source of funds for payment of dividends to its common shareholders. During the year ended December 31, 2014, the Company declared and paid cash dividends on its common stock as follows:
Declaration date | | Record date | | Payment date | | Cash dividend per common share | |
7/17/2014 | | 8/4/2014 | | 8/18/2014 | | $ | 0.05 | |
10/16/2014 | | 11/3/2014 | | 11/17/2014 | | | 0.05 | |
Subsequently, the Company paid dividends of $0.08 per common share on February 16, 2015.
The dividends payable to shareholders were funded by dividends paid to the Company by the Bank.
The following table summarizes income tax expense (benefit) attributable to continuing operations for the periods indicated (in thousands).
| | | For the years ended December 31, | |
| | | 2014 | | | 2013 | | | 2012 | |
Current income tax expense | | | | | | | | | | | | |
Federal | | $ | 300 | | | $ | 181 | | | $ | - | |
State | | | 503 | | | | 1,238 | | | | - | |
Total current expense | | | 803 | | | | 1,419 | | | | - | |
| | | | | | | | | | | | | |
Deferred income tax expense (benefit) | | | | | | | | | | | | |
Federal | | | 4,666 | | | | (19,798 | ) | | | 2,721 | |
State | | | - | | | | (36 | ) | | | - | |
Total deferred expense (benefit) | | | 4,666 | | | | (19,834 | ) | | | 2,721 | |
| | | | | | | | | | | | | |
Total current and deferred expense (benefit) | | $ | 5,469 | | | $ | (18,415 | ) | | $ | 2,721 | |
For the year ended December 31, 2014, the deferred income tax expense of $4.7 million consisted primarily of a $1.2 million reduction of the net deferred tax asset attributable to allowance for loan losses and a $2.8 million reduction in the net deferred tax asset attributable to prior year federal net operating loss carryforwards resulting from the usage of such carryforwards to offset taxable income.
For the year ended December 31, 2013, the deferred income tax benefit of $19.8 million consisted primarily of a $22.4 million decrease in the valuation allowance previously required against the net deferred tax asset as of December 31, 2012. The deferred income tax benefit was partially offset by a decrease in net deferred tax assets arising during 2013.
As of December 31, 2014 and 2013, we determined that no valuation allowance was necessary due to sustained trends in profitability, projected reversals of existing taxable temporary differences and projections of future taxable income.
No excess tax benefit from equity-based awards were recorded in shareholders’ equity during the years ended December 31, 2014, 2013 and 2012.
The following table reconciles the Company’s statutory federal income tax rate to the effective income tax rate for the periods indicated.
| | | For the years ended December 31, | |
| | | 2014 | | | 2013 | | | 2012 | |
U.S. statutory federal income tax rate | | | 35.0 | % | | | 35.0 | % | | | 35.0 | % |
Changes from statutory rates resulting from: | | | | | | | | | | | | |
State income tax, net of federal benefit | | | 2.2 | | | | 8.6 | | | | - | |
Tax-exempt income | | | (1.6 | ) | | | (1.5 | ) | | | (74.1 | ) |
Expenses not deductible for tax purposes | | | 0.1 | | | | 0.3 | | | | 2.6 | |
(Decrease) increase in deferred tax asset valuation allowance | | | - | | | | (240.0 | ) | | | 352.2 | |
Other | | | 1.2 | | | | 0.1 | | | | 1.9 | |
Effective income tax rate | | | 36.9 | % | | | (197.5 | )% | | | 317.6 | % |
The following table summarizes the Company’s gross deferred tax assets, related valuation allowance and gross deferred tax liabilities at the dates indicated (in thousands).
| | | December 31, | |
| | | 2014 | | | 2013 | |
Deferred tax assets | | | | | | | | |
Recognized built-in loss carryforward | | $ | 7,609 | | | $ | 7,689 | |
Allowance for loan losses | | | 4,522 | | | | 5,770 | |
Federal net operating loss carryforward | | | 3,275 | | | | 6,072 | |
Writedowns of foreclosed real estate | | | 1,912 | | | | 2,369 | |
Equity-based compensation | | | 1,054 | | | | 1,047 | |
Pension Plan contributions and accrued liability | | | 1,053 | | | | 463 | |
Alternative minimum tax credit carryforward | | | 750 | | | | 493 | |
Unrealized losses on investment securities available for sale | | | 501 | | | | 1,829 | |
Other | | | 375 | | | | 365 | |
Nonaccrual loan interest | | | - | | | | 202 | |
Deferred tax assets, gross | | | 21,051 | | | | 26,299 | |
Valuation allowance | | | - | | | | - | |
Deferred tax assets, net of valuation allowance | | | 21,051 | | | | 26,299 | |
Deferred tax liabilities | | | | | | | | |
Deferred loan fees and costs, net | | | (1,703 | ) | | | (1,592 | ) |
Premises, equipment and capital leases | | | (1,148 | ) | | | (1,380 | ) |
Servicing rights | | | (814 | ) | | | (874 | ) |
Other | | | (333 | ) | | | (366 | ) |
Deferred tax liabilities, gross | | | (3,998 | ) | | | (4,212 | ) |
Deferred tax asset, net | | $ | 17,053 | | | $ | 22,087 | |
As of December 31, 2014, the Company had federal net operating loss carryforwards of $9.4 million, which, if not utilized to offset future taxable income, will expire as follows: $200 thousand in 2031, $8.9 million in 2032 and $279 thousand in 2034. During 2014, the Company utilized $9.2 million of federal net operating loss carryforwards to offset federal taxable income. This amount was comprised of $7.3 million of federal net operating loss carryforwards that would have expired in 2031 and $1.9 million that would have expired in 2032.
As of December 31, 2014, net deferred tax assets of $17.1 million were recorded in the Company’s Consolidated Balance Sheet, a portion of which includes the after-tax impact of net operating loss carryforwards. Based on available information as of this date, the Company determined that a valuation allowance against the deferred tax asset was not necessary.
In 2010, the Company consummated a private offering pursuant to which the Company issued 9,993,995 shares of its common stock at $10.40 per share (the “Private Placement”). The Private Placement was considered a change in control under the Internal Revenue Code and Regulations. Accordingly, the Company was required to evaluate potential limitation or deferral of its ability to carryforward pre-acquisition net operating losses and to determine the amount of net unrealized pre-acquisition built-in losses which are subject to similar limitation or deferral. Under the Internal Revenue Code and Regulations, net unrealized pre-acquisition built-in losses realized within five years of the change in control on October 7, 2010 are subject to potential limitation. Through that date, the Company will continue to analyze its ability to utilize such losses to offset anticipated future taxable income as pre-acquisition built-in losses are ultimately realized. As of December 31, 2014, the Company estimates that future utilization of built-in losses of $53 million generated prior to the Private Placement will be limited to $1.1 million per year. However, this estimate will not be conclusively confirmed until the five-year limitation period expires in October 2015. The Company’s deferred tax asset does not include any recognized built-in losses that exceed the amount expected to be utilized against future taxable income.
The Company is subject to U.S. federal and South Carolina state income tax. Tax authorities in various jurisdictions may examine the Company. The Company is not currently undergoing a U.S. federal or South Carolina state examination; however, tax years dating back to 2010 are generally considered subject to examination based on federal and state regulations.
401(k) Plan
Teammates are given the opportunity to participate in The Palmetto Bank 401(k) Retirement Plan (the “401(k) Plan”) which is designed to supplement a teammate’s retirement income. Teammates are eligible to participate in the 401(k) Plan immediately when hired and participants are able to defer a portion of their compensation into the 401(k) Plan. Matching contributions, if any, are contributed to the 401(k) Plan prior to the end of each plan year.
From January 1, 2012 through June 30, 2013, the Company suspended its regular ongoing matching of teammate contributions to the 401(k) Plan. The Company reinstated its match of teammate contributions effective July 1, 2013. From July 1, 2013 through June 30, 2014, teammate contributions were matched at a rate of $0.10 per dollar up to 6% of a teammate’s eligible compensation. Effective July 1, 2014, the match of teammate contributions was increased to a rate of $0.25 per dollar up to 6% of a teammate’s eligible compensation. The Company’s matching contributions totaled $86 thousand and $28 thousand for the years ended December 31, 2014 and 2013, respectively.
Under the Internal Revenue Service (“IRS”) rules related to 401(k) plans, the IRS imposes certain annual limitations on the amount of allowable contributions to the 401(k) Plan by highly compensated participants (as determined annually by applying the required IRS tests). To the extent teammates receive contribution refunds of prior deferrals as a result of the annual limitations, the Bank has in place a benefit equalization plan into which such teammates may contribute refunds received. The benefit equalization plan operates similar to the 401(k) Plan except that this plan is a nonqualified plan under the IRS rules, and the assets of the benefit equalization plan are subject to the general creditors of the Bank. At December 31, 2014, assets in the benefit equalization plan were $40 thousand and are included in Other assets in the Consolidated Balance Sheet. An offsetting liability of $40 thousand is reflected in Other liabilities and represents the Bank’s obligation to benefit equalization plan participants. There were no assets or liabilities associated with the benefit equalization plan at December 31, 2013.
Defined Benefit Pension Plan
Prior to 2008, the Company offered a noncontributory, defined benefit pension plan that covered all full-time teammates having at least 12 months of continuous service and having attained age 21. Effective December 31, 2007, the Company ceased accruing pension benefits for participants in the Pension Plan. Although no previously accrued benefits were lost, teammates no longer accrue benefits for service subsequent to 2007.
The Company accounts for the Pension Plan using an actuarial model. This model allocates pension costs over the service period of teammates in the Pension Plan. The underlying principle is that teammates render services ratably over this period; therefore, the income statement impacts of pension benefits should follow a similar pattern.
Defined Benefit Pension PlanFunded Status. The Company recognizes the funded status of the Pension Plan in the Consolidated Balance Sheets. The funded status is the difference between the Pension Plan assets and the projected benefit obligation at the balance sheet date. The following table summarizes the combined change in benefit obligation, Pension Plan assets, and funded status of the Pension Plan at the dates and for the periods indicated (in thousands).
| | | At and for the years ended December 31, | |
| | | 2014 | | | 2013 | | | 2012 | |
Change in benefit obligation | | | | | | | | | | | | |
Benefit obligation, beginning of period | | $ | 18,122 | | | $ | 18,507 | | | $ | 19,786 | |
Interest cost | | | 892 | | | | 848 | | | | 958 | |
Net actuarial loss | | | 4,110 | | | | 80 | | | | 668 | |
Benefits paid | | | (2,686 | ) | | | (1,313 | ) | | | (2,905 | ) |
Benefit obligation, end of period | | | 20,438 | | | | 18,122 | | | | 18,507 | |
| | | | | | | | | | | | | |
Change in Pension Plan assets | | | | | | | | | | | | |
Fair value of Pension Plan assets, beginning of period | | | 16,798 | | | | 14,540 | | | | 13,663 | |
Return on Pension Plan assets | | | 1,717 | | | | 1,678 | | | | 2,182 | |
Employer contribution | | | 1,600 | | | | 1,893 | | | | 1,600 | |
Benefits paid | | | (2,686 | ) | | | (1,313 | ) | | | (2,905 | ) |
Fair value of Pension Plan assets, end of period | | | 17,429 | | | | 16,798 | | | | 14,540 | |
| | | | | | | | | | | | | |
Underfunded status | | $ | (3,009 | ) | | $ | (1,324 | ) | | $ | (3,967 | ) |
| | | | | | | | | | | | | |
Net actuarial loss | | $ | (13,975 | ) | | $ | (11,235 | ) | | $ | (12,627 | ) |
Income tax benefit | | | (4,891 | ) | | | (3,932 | ) | | | (4,419 | ) |
Accumulated other comprehensive loss impact | | $ | (9,084 | ) | | $ | (7,303 | ) | | $ | (8,208 | ) |
Cost ofthe Pension Plan. The following table summarizes the components of net periodic pension expense, which is included in Salaries and other personnel expense in the Consolidated Statements of Income (Loss), for the periods indicated (in thousands).
| | | For the years ended December 31, | |
| | | 2014 | | | 2013 | | | 2012 | |
Interest cost | | $ | 892 | | | $ | 848 | | | $ | 958 | |
Expected return on plan assets | | | (1,076 | ) | | | (1,186 | ) | | | (1,133 | ) |
Amortization of net actuarial loss | | | 729 | | | | 980 | | | | 911 | |
Net periodic pension expense | | $ | 545 | | | $ | 642 | | | $ | 736 | |
As a result of the decision to cease accruing benefits under the Pension Plan effective December 31, 2007, no costs relative to service have been necessary since that date as teammates no longer accrue benefits for services rendered.
Actuarial gains and losses also result from changes in the discount rate used to measure plan obligations and other variances in demographic experience such as retirements and mortality. Actuarial gains and losses, prior service costs and credits and any remaining transition amounts that had not yet been recognized through net periodic pension expense since the Pension Plan was frozen are amortized as a component of net periodic pension expense.
Defined Benefit Pension Plan Assumptions. One of the principal components of the net periodic pension expense calculation is the expected long-term rate of return on plan assets. The use of an expected long-term rate of return on plan assets may cause the recognition of income returns that are greater or less than the actual returns of plan assets in any given year. The expected long-term rate of return is designed to approximate the actual long-term rate of return over time. Therefore, the pattern of income / expense recognition should match the stable pattern of services provided by teammates over the life of the pension obligation. Expected returns on Pension Plan assets are developed in conjunction with input from external advisors and take into account the investment policy, actual investment allocation, long-term expected rates of return on the relevant asset classes and considers any material forward-looking return expectations for these major asset classes. Differences between expected and actual returns in each year, if any, are included in the net actuarial gain or loss amount, which is recognized in other comprehensive income.
A discount rate is used to determine the present value of future benefit obligations. The discount rate is determined in consultation with the third-party actuary and is set by matching the projected benefit cash flow to a yield curve consisting of the 50% highest yielding issuances within each defined maturity tranche of a AA-only universe of bonds monitored by the third-party actuary. The yield curve provides transparency with respect to the underlying bonds and provides matching of future benefit obligations to the payment of benefits. This yield curve was also used during 2012 and 2013 and reflects the Pension Plan specific duration.
The following table summarizes the assumptions used in computing the benefit obligation and theadjusted net periodic expensefor the periods indicated.
| | | For the years ended December 31, | |
| | | 2014 | | 2013 | | 2012 |
Weighted-average assumptions used in computing balance sheet liabilty: | | | | | | | | | | | | |
Discount rate | | | 4.16 | % | | | 5.04 | % | | | 4.19 | % |
Expected long-term rate of return on Pension Plan assets | | | 6.30 | | | | 8.00 | | | | 8.00 | |
| Rate of increase in compensation levels | | | n/a | | | | n/a | | | | n/a | |
| | | | | | | | | | | | | |
Weighted-average assumptions used in computing net periodic benefit expense: | | | | | | | | | | | | |
Discount rate | | | 5.04 | % | | | 4.19 | % | | | 5.02 | % |
Expected long-term rate of return on Pension Plan assets | | | 6.30 | | | | 8.00 | | | | 8.00 | |
| Rate of increase in compensation levels | | | n/a | | | | n/a | | | | n/a | |
In addition, the 2014 actuarial valuation utilized the Society of Actuary’s updated 2014 mortality table while 2013 and 2012 utilized the 2000 mortality table.
Pension PlanAssets. The following table summarizes the fair value of Pension Plan assets by major category at the dates indicated (in thousands).
| | | December 31, | |
| | | 2014 | | | 2013 | |
Cash and cash equivalents | | $ | 902 | | | $ | 4,440 | |
U.S. government and agency securities | | | - | | | | 549 | |
Municipal securities | | | - | | | | 470 | |
Corporate bonds | | | - | | | | 3,398 | |
Mutual funds | | | 902 | | | | 3,596 | |
Corporate stocks | | | 1,085 | | | | 3,329 | |
Exchange traded funds | | | 14,351 | | | | 287 | |
Foreign equities | | | 182 | | | | 694 | |
Accrued interest receivable | | | - | | | | 30 | |
Other | | | 7 | | | | 5 | |
Total Pension Plan assets | | $ | 17,429 | | | $ | 16,798 | |
The investment objectives of the Pension Plan assets are designed to fund the projected benefit obligation and to maximize returns in order to minimize contributions within reasonable and prudent levels of risk. The precise amount for which these obligations will be settled depends on future events, including the life expectancy of the Pension Plan participants. The Pension Plan’s investment strategy balances the requirement to generate return, using higher returning assets, with the need to control risk using less volatile assets. Risks include, but are not limited to, inflation, volatility in equity values and changes in interest rates that could cause the Pension Plan to become underfunded, thereby increasing the Pension Plan’s dependence on contributions from the Company.
Pension Plan assets are managed by a third-party firm as approved by the Board of Directors. The Compensation Committee of the Board of Directors is responsible for maintaining the investment policy of the Pension Plan, approving the appointment of the investment manager and reviewing the performance of the Pension Plan assets at least annually.
Investments within the Pension Plan are diversified with the intent to minimize the risk of large losses to the Pension Plan. The total portfolio is constructed and maintained to provide prudent diversification within each investment category, and the Company assumes that the volatility of the portfolio will be similar to the market as a whole. The asset allocation ranges represent a long-term perspective. Therefore, rapid unanticipated market shifts may cause the asset mix to fall outside the policy range. Such divergences are expected to be short-term in nature.
Fair Value Measurements.Following is a description of the valuation methodology used in determining fair value measurements of Pension Plan assets:
| | ● | Cash and cash equivalents: Valued at the net asset value of units held by the Pension Plan. |
| | ● | U.S. government and agency securities: Valued at the closing price reported in the active market in which the individual securities are traded. |
| | ● | Municipal securities: Valued at the closing price reported in the active market in which the individual securities are traded. |
| | ● | Corporate bonds: Valued at the closing price reported in the active market in which the bond is traded. |
| | ● | Mutual funds: Valued at the closing price reported in the active market in which the instrument is traded. |
| | ● | Corporate stocks: Valued at the closing price reported in the active market in which the individual securities are traded. |
| | ● | Exchange traded funds: Valued at the closing price reported in the active market in which the instrument is traded. |
| | ● | Foreign equities: Valued at the closing price reported in the active market in which the instrument is traded. |
The preceding methods described may produce a fair value calculation that may not be indicative of net realizable value or reflective of future fair values. Furthermore, although the Company believes the valuation methods are appropriate and consistent with other market participants, the use of different methodologies or assumptions to determine the fair value of certain financial instruments could result in a different fair value measurement at the reporting date.
The following tables summarize Pension Plan assets measured at fair value at the dates indicated aggregated by the level in the fair value hierarchy within which those measurements fall (in thousands).
| | | December 31, | |
| | | 2014 | | | 2013 | |
Level 1 | | $ | 1,994 | | | $ | 7,804 | |
Level 2 | | | 15,435 | | | | 8,994 | |
Level 3 | | | - | | | | - | |
Total Pension Plan assets | | $ | 17,429 | | | $ | 16,798 | |
There were nochanges in the Pension Plan’s Level 3 assets during 2013 or 2014.
FutureExpected Contributions. The Company’s expects to make contributions of $1.6 million to the Pension Plan during 2015.
Expected Future Defined Benefit Pension Plan Payments. The following table summarizes the estimated future benefit payments expected to be paid from the Pension Plan at December 31, 2014 for the periods indicated (in thousands).
For the years ended December 31, | | | | |
2015 | | $ | 1,002 | |
2016 | | | 1,017 | |
2017 | | | 1,030 | |
2018 | | | 1,069 | |
2019 | | | 1,092 | |
| 2020-2024 | | | 5,711 | |
The expected benefits to be paid are based on the same assumptions used to measure the Company’s benefit obligation at December 31, 2014.
16. | Equity-Based Compensation |
1997 Stock Compensation Plan
Stock option awards have been granted under the Palmetto Bancshares, Inc. 1997 Stock Compensation Plan (the “1997 Plan”). The 1997 Plan terminated in 2007 and no options have been granted under the 1997 Plan since then. However, the termination did not impact options previously granted under the 1997 Plan. All outstanding options expire at various dates through January 16, 2017 and all stock option awards granted have a five-year vesting term and an exercise period of 10 years. The Board of Directors determined the terms of the options on the grant date, and the option exercise price was at least 100% of the fair value of the Company’s common stock as of the grant date. Options granted to teammates were “incentive stock options” within the meaning of Section 422 of the Internal Revenue Code, while options granted to individuals other than teammates were “nonqualified stock options” (i.e., options that are not “incentive stock options”).
The following table summarizes stock option activity for the 1997 Plan at the dates and for the periods indicated.
| | | Stock options outstanding | | | Weighted- average exercise price | |
Outstanding, December 31, 2011 | | | 18,703 | | | $ | 93.65 | |
Forfeited | | | (6,750 | ) | | | 94.98 | |
Outstanding, December 31, 2012 | | | 11,953 | | | | 92.89 | |
Expired | | | (5,503 | ) | | | 80.00 | |
Outstanding, December 31, 2013 | | | 6,450 | | | | 103.89 | |
Forfeited | | | (1,250 | ) | | | 109.20 | |
Expired | | | (2,250 | ) | | | 93.20 | |
Outstanding, December 31, 2014 | | | 2,950 | | | | 109.80 | |
The following table summarizes information regarding stock options under the 1997 Plan that were outstanding and exercisable at December 31, 2014.
| | Weighted-average exercise price | | | Number of stock options outstanding and exercisable | | | Weighted-average remaining contractual life (years) | |
| | $ | 106.40 | | | | 250 | | | | 0.05 | |
| | | 109.20 | | | | 2,500 | | | | 1.42 | |
| | | 121.60 | | | | 200 | | | | 2.05 | |
| | Total | | | | 2,950 | | | | 1.35 | |
At December 31, 2014 and 2013, the fair value of the Company’s common stock did not exceed the exercise price of any options outstanding and exercisable under the 1997 Plan and, therefore, the stock options had no intrinsic value.
2008 Restricted Stock Plan
Under the 2008 Restricted Stock Plan (the “2008 Plan”), 62,500 shares of common stock were reserved for issuance subject to its anti-dilution provisions. Forfeitures are returned to the available pool of common stock for future issuance. Generally, the recipient will have the right to receive dividends, if any, with respect to such shares of restricted stock, to vote such shares and to enjoy all other shareholder rights except that the Company will retain custody of the stock certificate, and the recipient may not sell, transfer, pledge or otherwise dispose of the restricted stock until the forfeiture restrictions have expired.
Prior to 2011, restricted stock granted to directors under the 2008 Plan generally had a five-year vesting period. Beginning in 2011, with the exception of annual retainer grants that vest immediately, restricted stock granted to directors under the 2008 Plan generally had a three-year vesting period designed to coincide with director service terms. Beginning in 2012, restricted stock awarded to directors upon initial appointment and reelection to the Board of Directors continued to be granted with vesting periods to coincide with director service terms but were changed to require a director to purchase shares of the Company’s common stock on the open market to be eligible to receive a matching grant of restricted stock awards. The matching grants at initial appointment and reelection are capped at an economic value of $10 thousand.
Shares of restricted stock granted to teammates and directors under the 2008 Plan are subject to vesting provisions based on continuous employment and service for a specified time period following the date of grant as follows:
| | Vesting Period |
Issued to directors in connection with annual retainer | Immediate |
Issued to directors in connection with initial appointment or re-election to the Board of Directors | Length of Board of Directors term (currently 3 years) |
Issued to teammates | 5 years |
The following table summarizes restricted stock activity at the dates and for the periods indicated.
| | | Shares of restricted stock | | | Weighted- average grant date fair value per share | |
Granted, net of forfeitures, December 31, 2011 | | | 31,696 | | | $ | 49.38 | |
Grants | | | 19,967 | | | | 5.51 | |
Forfeited | | | (350 | ) | | | 168.00 | |
Granted, net of forfeitures, December 31, 2012 | | | 51,313 | | | | 31.50 | |
Grants | | | 11,073 | | | | 9.68 | |
Granted, net of forfeitures, December 31, 2013 | | | 62,386 | | | | 27.63 | |
Grants | | | - | | | | - | |
Granted, net of forfeitures, December 31, 2014 | | | 62,386 | | | | 27.63 | |
| | | | | | | | | |
Remaining shares available for grant, December 31, 2013 and 2014 | | | 114 | | | | | |
There were no grants or forfeitures of restricted stock under the Company’s 2008 Plan during the year ended December 31, 2014.
Of the 62,386 net restricted stock awards granted under the 2008 Plan, the following table summarizes vesting status and activity at the dates and for the period indicated.
| | | Unvested | | | Vested | | | Total granted, net of forfeitures | |
Balance, December 31, 2013 | | | 11,247 | | | | 51,139 | | | | 62,386 | |
Vested | | | (5,180 | ) | | | 5,180 | | | | - | |
Balance, December 31, 2014 | | | 6,067 | | | | 56,319 | | | | 62,386 | |
The weighted-average grant date fair value of restricted stock awards that vested during the year ended December 31, 2014 was $23.95 per share. The fair value of shares vested during the year ended December 31, 2014 based on vesting date fair value totaled $74 thousand.
2011 Stock Incentive Plan
Under the 2011 Stock Incentive Plan, as amended (the “2011 Plan”), the Board of Directors may grant a total of 700,000 of various types of equity awards (including stock options and/or restricted stock awards) to teammates and directors. The 2011 Plan requires that stock options be issued with an exercise price at or above the fair market value per share of the Company’s common stock on the date of grant.
Under the 2011 Plan, the Board of Directors, at its discretion, determines the amount of equity awards to be granted, vesting conditions, type of award and any other terms and conditions. No options are exercisable more than 10 years after the date of grant. Generally, the recipient will have the right to receive dividends, if any, with respect to any shares of restricted stock granted, to vote such shares and to enjoy all other shareholder rights, except that the Company will retain custody of the stock certificate, and the recipient may not sell, transfer, pledge or otherwise dispose of the restricted stock until the forfeiture restrictions have expired. Forfeitures of restricted stock are returned to the available pool of common stock for future issuance.
The following table summarizes stock option and restricted stock information for the 2011 Plan at the dates and for the periods indicated.
| | | Total shares | | | Stock options outstanding | | | Weighted- average exercise price per share | | | Shares of restricted stock | | | Weighted- average grant date fair value per share | |
2011 Grants | | | 473,002 | | | | 383,251 | | | $ | 10.51 | | | | 89,751 | | | $ | 10.48 | |
| | | | | | | | | | | | | | | | | | | | | |
2012 Grants | | | 8,020 | | | | - | | | | - | | | | 8,020 | | | | 6.50 | |
| | | | | | | | | | | | | | | | | | | | | |
2013 Grants | | | 8,811 | | | | - | | | | - | | | | 8,811 | | | | 13.70 | |
2013 Forfeitures | | | (575 | ) | | | - | | | | - | | | | (575 | ) | | | 13.95 | |
2013 Exercises | | | - | | | | (11,250 | ) | | | 11.00 | | | | - | | | | - | |
| | | | | | | | | | | | | | | | | | | | | |
2014 Grants | | | 57,351 | | | | 30,000 | | | | 15.97 | | | | 27,351 | | | | 15.15 | |
2014 Forfeitures | | | (625 | ) | | | - | | | | - | | | | (625 | ) | | | 6.50 | |
Granted, net of forfeitures, December 31, 2014 | | | 545,984 | | | | | | | | | | | | 132,733 | | | | | |
Outstanding, December 31, 2014 | | | | | | | 402,001 | | | | 10.90 | | | | | | | | | |
| | | | | | | | | | | | | | | | | | | | | |
Total shares available for grant under the 2011 Plan | | | 700,000 | | | | | | | | | | | | | | | | | |
Remaining shares available for grant, December 31, 2014 | | | 154,016 | | | | | | | | | | | | | | | | | |
The 2011 grants were made subject to time vesting restrictions that began in 2014 and performance requirements including termination of the Bank’s Consent Order with the Supervisory Authorities and two consecutive quarters of net income. At December 31, 2012, the quarterly net income vesting condition was met, and the Consent Order was terminated on January 30, 2013. Therefore, the performance requirements are fully satisfied. Except for 11,250 stock options and 2,500 shares of restricted stock that vested in 2013 based on the time vesting restrictions, the awards vest from 2014 to 2016.
During 2012, 8,020 shares of restricted stock were awarded to certain teammates in recognition of performance. These awards are subject to the same time and performance conditions described above and, assuming the time vesting conditions are met, will vest from 2015 to 2017.
During 2013, 8,811 shares of restricted stock were awarded to certain teammates in recognition of performance and upon initial employment. These awards are subject to time vesting conditions and, assuming the time vesting conditions are met, vest from 2014 to 2016.
During 2014, 5,404 shares of restricted stock with a total grant date fair value of $70 thousand were granted to the non-management members of the Board of Directors as compensation for their annual Board retainers and 2,547 shares of restricted stock were granted to certain directors re-elected to the Board in 2014. The 2,547 shares of restricted stock are subject to time vesting conditions and, assuming the time vesting conditions are met, will vest from 2015 to 2017. In addition, during 2014, 19,400 shares of restricted stock and 30,000 stock options were awarded to certain teammates in recognition of performance and/or upon initial employment. These grants are subject to time vesting conditions. Assuming the time vesting conditions are met, 2,500 shares of the restricted stock awarded will vest from 2014 to 2017, and 16,900 shares of the restricted stock awarded will vest from 2015 to 2019. In addition, assuming the time vesting conditions are met, 4,000 stock options awarded will vest from 2015 to 2017, and 26,000 stock options awarded will vest from 2015 to 2019.
The following table summarizes the activity of restricted stock under the 2011 Plan at the dates and for the period indicated.
| | | Unvested | | | Vested | | | Total granted, net of forfeitures | |
Balance, December 31, 2013 | | | 103,507 | | | | 2,500 | | | | 106,007 | |
Granted | | | 27,351 | | | | - | | | | 27,351 | |
Forfeited | | | (625 | ) | | | - | | | | (625 | ) |
Vested | | | (37,399 | ) | | | 37,399 | | | | - | |
Balance, December 31, 2014 | | | 92,834 | | | | 39,899 | | | | 132,733 | |
The weighted-average grant date fair value of restricted stock awards that vested during the year ended December 31, 2014 was $11.07 per share. The value of shares vested during the year ended December 31, 2014 based on vesting date fair value totaled $508 thousand.
For both the 2008 Plan and the 2011 Plan, a portion of the restricted shares thatvested during 2014 were net-settled to cover the required withholding taxes, and the grantee received the common stock equal to the vested shares less the net-settled shares. Withholding taxes for the remaining shares thatvested during 2014 were paid in cash by the grantee. The net-share settlements reduced the number of common shares outstanding.
The following table summarizes information regarding stock options under the 2011 Plan that were outstanding and exercisable at December 31, 2014.
| | | | | | Options outstanding | | | Options exercisable | |
| | Weighted- average exercise price | | | Number of stock options | | | Weighted- average remaining contractual life (years) | | | Value of outstanding in-the- money stock options | | | Number of stock options | | | Weighted- average remaining contractual life (years) | | | Value of exercisable in-the- money stock options | |
| | $ | 10.40 | | | | 312,501 | | | | 6.38 | | | $ | 1,968,756 | | | | 104,167 | | | | 6.38 | | | $ | 656,252 | |
| | | 11.00 | | | | 59,500 | | | | 6.54 | | | | 339,150 | | | | 19,833 | | | | 6.54 | | | | 113,048 | |
| | | 12.96 | | | | 4,000 | | | | 9.14 | | | | 14,960 | | | | - | | | | - | | | | - | |
| | | 16.43 | | | | 26,000 | | | | 9.96 | | | | 7,020 | | | | - | | | | - | | | | - | |
| | Total | | | | 402,001 | | | | 6.66 | | | $ | 2,329,886 | | | | 124,000 | | | | 6.40 | | | $ | 769,300 | |
Determining Fair Value. The following table summarizes the weighted-average fair value of stock option awards granted under the 2011 Plan during 2014 as estimated on the date of grant using the Black-Scholes option-pricing model and the weighted-average assumptions used to determine the fair value of such grants.
Option exercise price, per share | | $ | 15.97 | | |
| | | | | | |
Fair value of stock option awards granted, per share | | $ | 5.73 | | |
| | | | | | |
Expected dividend yield | | | 1.1 | % | |
Expected volatility | | | 36 | | |
Risk-free interest rate | | | 2.00 | | |
Expected term (years) | | | 7 | | |
Vesting period (years) | | | 5 | | |
Compensation Expense Relating to Equity-Based Compensation
The following table summarizes compensation expense for the 1997 Plan, 2008 Plan and the 2011 Plan charged against pretax income for the periods indicated (in thousands).
| | | For the years ended December 31, | |
| | | 2014 | | | 2013 | | | 2012 | |
Compensation expense | | | | | | | | | | | | |
1997 Plan | | $ | - | | | $ | - | | | $ | - | |
2008 Plan | | | 83 | | | | 336 | | | | 343 | |
2011 Plan | | | 690 | | | | 822 | | | | 766 | |
Total equity-based compensation expense | | $ | 773 | | | $ | 1,158 | | | $ | 1,109 | |
| | | | | | | | | | | | | |
Income tax benefit | | $ | 271 | | | $ | - | | | $ | - | |
At December 31, 2014, the total unrecognized pretax compensation expense related to unvested equity awards granted under the 2008 Plan and the 2011 Plan was $49 thousand and $909 thousand, respectively. This expense is expected to be recognized through 2016 under the 2008 Plan and 2019 under the 2011 Plan.
17. | Average Share Information |
The following table reconciles the denominators of the basic and diluted net income per common share computations for the periods indicated (dollars in thousands, except per share data).
| | | For the years ended December 31, | |
| | | 2014 | | | 2013 | | | 2012 | |
Basic net income (loss) per common share | | | | | | | | | | | | |
Net income (loss) applicable to common shareholders | | $ | 9,355 | | | $ | 27,731 | | | $ | (1,864 | ) |
Undistributed earnings allocated to participating securities | | | (61 | ) | | | (248 | ) | | | - | |
Net income (loss) allocated to common shareholders | | $ | 9,294 | | | $ | 27,483 | | | $ | (1,864 | ) |
Weighted average basic common shares | | | 12,696,777 | | | | 12,658,752 | | | | 12,639,379 | |
Basic net income (loss) per common share | | $ | 0.73 | | | $ | 2.17 | | | $ | (0.15 | ) |
| | | | | | | | | | | | | |
Diluted net income (loss) per common share | | | | | | | | | | | | |
Net income (loss) applicable to common shareholders | | $ | 9,355 | | | $ | 27,731 | | | $ | (1,864 | ) |
Undistributed earnings allocated to participating securities | | | (61 | ) | | | (248 | ) | | | - | |
Net income (loss) allocated to common shareholders | | $ | 9,294 | | | $ | 27,483 | | | $ | (1,864 | ) |
Weighted average basic common shares | | | 12,696,777 | | | | 12,658,752 | | | | 12,639,379 | |
Dilutive potential common shares (1) | | | 65,108 | | | | - | | | | - | |
Weighted average diluted common shares | | | 12,761,885 | | | | 12,658,752 | | | | 12,639,379 | |
Diluted net income (loss) per common share | | $ | 0.73 | | | $ | 2.17 | | | $ | (0.15 | ) |
(1) Includes dilutive impact of restricted stock and stock options, as applicable
No potential common shares were included in the computation of the diluted earnings per common share amount for the year ended December 31, 2013 since application of the two-class method of computing earnings per common share resulted in greater dilution as compared to applying the treasury stock method for restricted stock. No potential common shares were included in the computation of the diluted loss per common share amount for the year ended December 31, 2012 as inclusion would be anti-dilutive given the Company’s net loss during the period.
18. | Commitments, Guarantees and Other Contingencies |
Unused lending commitments to clients are not recorded in the Consolidated Balance Sheets until funds are advanced. For commercial clients, lending commitments generally take the form of unused revolving credit arrangements to finance clients’ working capital requirements as well as unused credit arrangements to fund commercial construction. For retail clients, lending commitments are generally unused lines of credit secured by residential property as well as unused credit arrangements to fund residential construction. The Company routinely extends lending commitments for both floating and fixed-rate loans.
The following table summarizes the contractual amounts of the Company’s unused lending commitments relating to extensions of credit with off-balance sheet risk at December 31, 2014 (in thousands).
Commitments to extend credit: | | | | |
Revolving, open-end loans secured by single-family residential properties | | $ | 66,706 | |
Commercial real estate, construction and land development loans secured by real estate | | | | |
Single-family residential construction loans | | | 9,477 | |
Commercial real estate, other construction loans, and land development loans | | | 41,259 | |
Commercial and industrial loans | | | 36,464 | |
Overdraft protection loans | | | 30,414 | |
Other | | | 16,799 | |
Total commitments to extend credit | | $ | 201,119 | |
Standby letters of credit are issued for clients in connection with contracts between clients and third parties. Letters of credit are conditional commitments issued by the Company to guarantee the performance of a client to a third party. The maximum potential amount of undiscounted future advances related to letters of credit was $2.7 million and $3.7 million at December 31, 2014 and 2013, respectively.
The reserve for estimated credit losses on unfunded lending commitments at December 31, 2014 and 2013 was $472 thousand and $259 thousand, respectively.
For disclosure regarding our derivative financial instruments and hedging activities, see Note 19, Derivative Financial Instruments and Hedging Activities.
Loan Participations
The Company periodically sells portions of loans extended to clients in order to manage overall credit concentrations under loan participation agreements. With regard to loan participations, the Company serves as the lead bank and is, therefore, responsible for certain administrative and other management functions as agent to the participating banks. The participation agreements include certain standard representations and warranties related to the Company’s duties to the participating banks.
Contractual Obligations
In addition to other contractual commitments and arrangements disclosed herein, the Company enters into other contractual obligations in the ordinary course of business. The following table summarizes these contractual obligations at December 31, 2014 (in thousands) except obligations for teammate benefit plans for which obligations are paid from separately identified assets. For disclosure regarding obligations of teammate benefit plans, see Note 15, Benefit Plans.
| | | Less than one year | | | Over one through three years | | | Over three through five years | | | Over five years | | | Total | |
Real property operating lease obligations | | $ | 1,733 | | | $ | 3,329 | | | $ | 3,347 | | | $ | 7,115 | | | $ | 15,524 | |
Time deposit accounts | | | 124,154 | | | | 37,130 | | | | 9,605 | | | | 31 | | | | 170,920 | |
Contractually required interest payments on time deposits | | | 266 | | | | 256 | | | | 43 | | | | - | | | | 565 | |
Total | | $ | 126,153 | | | $ | 40,715 | | | $ | 12,995 | | | $ | 7,146 | | | $ | 187,009 | |
Obligations under noncancelable real property operating lease agreements noted above are payable over several years with the longest obligation expiring in 2029. Option periods that the Company has not yet exercised are not included in the preceding table.
In 2012, the Company sold a branch for which the lease was assigned to the purchaser of the branch, although the Bank remains as a named party to the lease in the event the purchaser fails to satisfy its obligations. Future lease payments related to this facility to be made by the purchaser total $33 thousand through September 2015. These payments are the primary responsibility of the purchaser, and, therefore, have been excluded from the preceding table.
Though not included in the preceding table, the Company is contractually obligated to make minimum required contributions to the Pension Plan, however, these contributions are determined annually and, therefore, future obligations beyond 2015 cannot be reasonably estimated at this time. For disclosure regarding contributions that the Company expects to contribute to the Pension Plan during 2015, see Note 15, Benefit Plans.
In March 2013, the Bank signed a subscription agreement for a limited partnership investment in Plexus Fund III, L.P. (the “Fund”). The Fund closed on May 1, 2013, raising commitments of $150 million of private limited partnership interests (of which the Bank committed to invest up to $2.0 million) and $150 million of funding commitments from the Small Business Administration in the form of 10-year debentures. The fund is licensed as a Small Business Investment Company under the Small Business Investment Act of 1958. The principal objective of the Fund is the realization of current yield and long-term capital appreciation through mezzanine and equity investments in a diversified portfolio of companies located throughout the United States. The Fund focuses primarily on investments in “lower middle-market companies.” Earnings from the fund will come from returns generated from the underlying investments, less management and other fees payable to the Fund. Capital calls on limited partners may occur through the fifth anniversary of the Fund’s closing (May 1, 2018) at the sole general partner’s discretion on an as-needed basis. The Bank’s commitment represents approximately 1.3% of the Fund’s total capital commitments. During 2013 and 2014, the Bank invested $350 thousand and $250 thousand, respectively, into the Fund in connection with its capital call obligation. As of December 31, 2014, $1.4 million remains subject to additional capital calls by the Fund. Capital calls are at the discretion of the Fund and are expected to be fully invested by 2018. Because the timing and amount of capital calls is not definitive at this point, they have been excluded from the preceding table and not accrued in the Consolidated Balance Sheets.
The Company enters into agreements with third parties with respect to the leasing, servicing, and maintenance of equipment. However, because we believe that these agreements are immaterial when considered individually, or in the aggregate, with regard to our Consolidated Financial Statements, we have not included such agreements in the preceding contractual obligations table. Therefore, we believe that noncompliance with terms of such agreements would not have a material impact on our business, financial condition, results of operations or cash flows. Furthermore, as most such commitments are entered into for a 12-month period with option extensions, long-term obligations beyond 2015 cannot be reasonably estimated at this time.
Legal Proceedings
The Company is a party to claims and lawsuits arising in the course of normal business activities. Management is not aware of any material pending legal proceedings against the Company which, if resolved adversely, would have a material adverse impact on the Company’s financial position, results of operations or cash flows.
19. | Derivative Financial Instruments and Hedging Activities |
At December 31, 2014 and 2013, the Company’s only derivative instruments related to residential mortgage-banking activities.
At December 31, 2014, the notional amount of commitments to originate conforming mortgage loans held for sale totaled $2.4 million. These derivative loan commitments had positive fair values, included in Other assets in the Consolidated Balance Sheets, totaling $85 thousand. At December 31, 2013, the notional amount of commitments to originate conforming mortgage loans held for sale totaled $7.3 million and were considered derivative financial instruments. These derivative loan commitments had positive fair values, included in Other assets in the Consolidated Balance Sheet, totaling $176 thousand and negative fair values, included in Other liabilities in the Consolidated Balance Sheet, totaling $3 thousand. The net change in derivative loan commitment fair values during the years ended December 31, 2014, 2013 and 2012 resulted in expense of $88 thousand, $164 thousand and $28 thousand, respectively.
The notional amount of forward sales commitments totaled $2.3 million at December 31, 2014. These forward sales commitments had negative fair values, included in Other liabilities in the Consolidated Balance Sheets, totaling $18 thousand. The notional amount of forward sales commitments totaled $6.8 million at December 31, 2013. These forward sales commitments had positive fair values, included in Other assets in the Consolidated Balance Sheets, totaling $28 thousand and negative fair values, included in Other liabilities in the Consolidated Balance Sheets, totaling $4 thousand. The net change in forward sales commitment fair values during the years ended December 31, 2014, 2013 and 2012 resulted in expense of $42 thousand, $4 thousand and $63 thousand, respectively.
20. | Fair Value Measurements |
Valuation Methodologies
The valuation methodologies used for fair value measurement for certain of the Company’s assets and liabilities are disclosed in Note 1, Summary of Significant Accounting Policies. Following is a description of the valuation methodologies used for fair value measurements of assets and liabilities not included in Note 1.
Trading accountassets. The fair values of trading account assets are primarily based on actively traded markets where prices are based on either direct market quotes or observed transactions. Liquidity is a significant factor in the determination of the fair values of trading account assets. Market prices may not be readily available for some positions or positions within a market sector where trading activity has slowed significantly or ceased.
Investmentsecuritiesavailable forsale. The fair value of investment securities available for sale is based upon quoted prices, if available. If quoted prices are not available, fair values are measured using independent pricing models or other model-based valuation techniques such as the present value of future cash flows, adjusted for the security’s credit rating, prepayment assumptions and other factors such as credit loss assumptions. Level 1 securities include those traded on an active exchange, such as the New York Stock Exchange or NASDAQ, as well as securities that are traded by dealers or brokers in active over-the-counter markets. Instruments classified as Level 1 are instruments that have been priced directly from dealer trading desks and represent actual prices at which such securities have traded within active markets. Level 2 securities are valued based on pricing models that use relevant observable information generated by transactions that have occurred in the market place that involve similar securities.
Mortgageloansheld forsale. The fair value of mortgage loans held for sale is based on what secondary markets are currently offering for portfolios with similar characteristics. As such, the Company classifies these loans subjected to nonrecurring fair value adjustments as Level 2.
Other loans held for sale.Other loans held for sale for which binding sales contracts have been entered into as of the balance sheet date are classified as Level 1 instruments.
Impaired loans.The fair value of an impaired loan is estimated using one of three methods: fair value of the underlying collateral, present value of expected cash flows and, in rare cases, the market value of the impaired loan itself. Impaired loans, where an allowance for loan losses or charge-off is recorded based on the fair value of collateral, require classification in the fair value hierarchy. When the fair value of the collateral is based on an executed sales contract with an independent third party, the Company classifies the impaired loan as nonrecurring Level 1. If the collateral is based on another observable market price or a current appraised value, the Company classifies the impaired loan as nonrecurring Level 2. When an appraised value is not available or the Company determines the fair value of the collateral is further impaired below the appraised value and there is no observable market price, the Company classifies the impaired loan as nonrecurring Level 3.
Foreclosed real estate and repossessed personal property. Fair value of foreclosed real estate and repossessed property is generally based upon binding sales contracts, current appraisals, comparable sales and other estimates of value obtained principally from independent sources. When the fair value of the collateral is based on an observable market price or a current appraised value, the Company classifies the asset as nonrecurring Level 2. However, the Company also considers other factors or recent developments which could result in adjustments to the collateral value estimates indicated in the appraisals such as changes in absorption rates or market conditions from the time of valuation. In situations where management adjustments are significant to the fair value measurement in its entirety, such measurements are classified as Level 3 within the valuation hierarchy.
Derivative financial instruments. Currently, the Company enters into residential mortgage loan commitments and forward sales commitments. The valuation of these instruments is computed using internal valuation models utilizing observable market-based inputs such as current mortgage rates and forward loan sale “pair-off” prices. As such, derivative financial instruments subjected to recurring fair value adjustments are classified as Level 2.
Assets and Liabilities Measured at Fair Value on a Recurring Basis
The following tables summarize assets and liabilities measured at fair value on a recurring basis at the dates indicated aggregated by the level in the fair value hierarchy within which those measurements fall (in thousands).
| | | December 31, 2014 | |
| | | Level 1 | | | Level 2 | | | Level 3 | | | Total | |
Assets | | | | | | | | | | | | | | | | |
Trading account assets | | $ | 1,397 | | | $ | 4,116 | | | $ | - | | | $ | 5,513 | |
Investment securities available for sale | | | | | | | | | | | | | | | | |
U.S. agency | | | - | | | | 3,965 | | | | - | | | | 3,965 | |
State and municipal | | | 572 | | | | 6,160 | | | | - | | | | 6,732 | |
Collateralized mortgage obligations (federal agencies) | | | - | | | | 87,774 | | | | - | | | | 87,774 | |
Other mortgage-backed (federal agencies) | | | - | | | | 78,503 | | | | - | | | | 78,503 | |
SBA loan-backed (federal agency) | | | 19,675 | | | | 14,862 | | | | - | | | | 34,537 | |
Derivative financial instruments | | | - | | | | 85 | | | | - | | | | 85 | |
Total assets measured at fair value on a recurring basis | | $ | 21,644 | | | $ | 195,465 | | | $ | - | | | $ | 217,109 | |
| | | | | | | | | | | | | | | | | |
Liabilities | | | | | | | | | | | | | | | | |
Derivative financial instruments | | $ | - | | | $ | 18 | | | $ | - | | | $ | 18 | |
| | | December 31, 2013 | |
| | | Level 1 | | | Level 2 | | | Level 3 | | | Total | |
Assets | | | | | | | | | | | | | | | | |
Trading account assets | | $ | 1,347 | | | $ | 3,771 | | | $ | - | | | $ | 5,118 | |
Investment securities available for sale | | | | | | | | | | | | | | | | |
State and municipal | | | - | | | | 7,460 | | | | - | | | | 7,460 | |
Collateralized mortgage obligations (federal agencies) | | | - | | | | 93,132 | | | | - | | | | 93,132 | |
Other mortgage-backed (federal agencies) | | | 1,188 | | | | 74,832 | | | | - | | | | 76,020 | |
SBA loan-backed (federal agency) | | | 20,457 | | | | 17,314 | | | | - | | | | 37,771 | |
Derivative financial instruments | | | - | | | | 204 | | | | - | | | | 204 | |
Total assets measured at fair value on a recurring basis | | $ | 22,992 | | | $ | 196,713 | | | $ | - | | | $ | 219,705 | |
| | | | | | | | | | | | | | | | | |
Liabilities | | | | | | | | | | | | | | | | |
Derivative financial instruments | | $ | - | | | $ | 7 | | | $ | - | | | $ | 7 | |
For disclosure regarding the fair value of Pension Plan assets, see Note 15, Benefit Plans.
Assets and Liabilities Measured at Fair Value on a Nonrecurring Basis
For financial assets measured at fair value on a nonrecurring basis that are recorded in the Consolidated Balance Sheets, the following tables summarize the level of valuation assumptions used to determine fair value of the related individual assets at the dates indicated (in thousands). There were no liabilities measured at fair value on a nonrecurring basis at December 31, 2014 or 2013.
| | | December 31, 2014 | |
| | | Level 1 | | | Level 2 | | | Level 3 | | | Total | |
Assets | | | | | | | | | | | | | | | | |
Mortgage loans held for sale | | $ | - | | | $ | 1,125 | | | $ | - | | | $ | 1,125 | |
Impaired loans | | | - | | | | 5,709 | | | | - | | | | 5,709 | |
Foreclosed real estate | | | 82 | | | | - | | | | 4,717 | | | | 4,799 | |
Total assets measured at fair value on a nonrecurring basis | | $ | 82 | | | $ | 6,834 | | | $ | 4,717 | | | $ | 11,633 | |
| | | December 31, 2013 | |
| | | Level 1 | | | Level 2 | | | Level 3 | | | Total | |
Assets | | | | | | | | | | | | | | | | |
Mortgage loans held for sale | | $ | - | | | $ | 1,722 | | | $ | - | | | $ | 1,722 | |
Impaired loans | | | - | | | | 5,588 | | | | 25 | | | | 5,613 | |
Foreclosed real estate | | | 34 | | | | 31 | | | | 6,595 | | | | 6,660 | |
Total assets measured at fair value on a nonrecurring basis | | $ | 34 | | | $ | 7,341 | | | $ | 6,620 | | | $ | 13,995 | |
Level 3 Valuation Methodologies. The following table summarizes the significant unobservable inputs used in the fair value measurements for Level 3 assets measured at fair value on a nonrecurring basis at December 31, 2014 (in thousands).
| | | Fair value | | | Valuation technique | | | Significant unobservable inputs |
Assets | | | | | | | | | |
Foreclosed real estate | | $ | 4,717 | | | Appraisals of
collateral value | | | Adjustments to appraisal for age of comparable sales |
Carrying Amounts and Estimated Fair Value of Financial Assets and Liabilities Not Measured at Fair Value
For assets and liabilities that are not measured on the Consolidated Balance Sheets at fair value, the Company uses several different valuation methodologies as outlined below.
For financial instruments that have quoted market prices, those quotes are used to determine fair value. Financial instruments that have no defined maturity, have a remaining maturity of 180 days or less, or reprice frequently to a market rate, are assumed to have a fair value that approximates reported book value. If no market quotes are available, financial instruments are valued by discounting the expected cash flows using an estimated current market interest rate for the financial instrument.
Certain of the Company’s assets and liabilities are financial instruments whose fair value equals or closely approximates carrying value. Such financial instruments are reported in the following Consolidated Balance Sheet captions: cash and cash equivalents, retail repurchase agreements, FHLB advances and other borrowings.
Fair value estimates are made at a specific point in time based on relevant market information and information about the financial instrument. These estimates do not reflect the premium or discount on any particular financial instrument that could result from the sale of the Company’s entire holdings. Because no ready market exists for a significant portion of the Company’s financial instruments, fair value estimates are based on many judgments. These estimates are subjective in nature and involve uncertainties and matters of significant judgment and therefore cannot be determined with precision. Changes in assumptions could significantly impact the estimates.
Fair value estimates are based on existing on and off-balance sheet financial instruments without attempting to estimate the value of anticipated future business and the value of assets and liabilities that are not financial instruments. Significant assets and liabilities that are not financial instruments include those resulting from the Company’s mortgage-banking operations, the value of the long-term relationships with the Company’s deposit clients, deferred income taxes, and premises and equipment. In addition, the tax ramifications related to the realization of the unrealized gains and losses can have a significant impact on fair value estimates and have not been considered in the estimates.
Commitments to extend credit are primarily short-term and are generally at variable market interest rates. Commitments to extend credit may be terminated by the Company based on material adverse change clauses. Standby letters of credit are generally short-term and have no associated rate unless funding occurs. As such, commitments to extend credit and standby letters of credit are deemed to have no material fair value.
The following table summarizes the carrying amount and fair value of other financial instruments included in the Consolidated Balance Sheets at the dates indicated (in thousands) all of which are considered Level 3 fair value estimates. These fair value estimates are subject to fluctuation based on the amount and timing of expected cash flows as well as the choice of discount rate used in the present value calculation. The Company used management's best estimate of fair value. Thus, the fair values presented may not be the amounts that could be realized in an immediate sale or settlement of the instrument. In addition, any income taxes or other expenses that would be incurred in an actual sale or settlement are not taken into consideration in the fair values presented.
| | | Carrying amount | | | Fair value | | |
December 31, 2014 | | | | | | | | | |
Financial instruments - assets | | | | | | | | | |
Loans (1) | | $ | 788,228 | | | $ | 788,334 | | |
| | | | | | | | | | |
Financial instruments - liabilities | | | | | | | | | |
Deposits | | | 928,320 | | | | 885,100 | | |
| | | | | | | | | | |
December 31, 2013 | | | | | | | | | |
Financial instruments - assets | | | | | | | | | |
Loans (1) | | $ | 748,243 | | | $ | 748,330 | | |
| | | | | | | | | | |
Financial instruments - liabilities | | | | | | | | | |
Deposits | | | 907,360 | | | | 896,858 | | |
(1) Includes gross loans less impaired loans for which fair value exceeds carrying value and allowance for loan lossesrelative to loans collectively evaluated for impairment
21. | Regulatory Capital Requirements |
The following table summarizes the Company’s and the Bank’s actual and required capital ratios at the dates indicated (dollars in thousands). The Bank was classified in the well-capitalized category at both December 31, 2014 and 2013. Since December 31, 2014, no conditions or events have occurred, of which the Company is aware, that have resulted in a material change in the Bank's regulatory risk category other than as reported in this Annual Report on Form 10-K.
| | | Actual | | | For capital adequacy purposes | | | To be well capitalized under prompt corrective action provisions | |
| | | amount | | | ratio | | | amount | | | ratio | | | amount | | | ratio | |
At December 31, 2014 | | | | | | | | | | | | | | | | | | | | | | | | |
Total capital to risk-weighted assets | | | | | | | | | | | | | | | | | | | | | | | | |
Company | | $ | 143,519 | | | | 16.26 | % | | $ | 70,625 | | | | 8.00 | % | | n/a | | | n/a | |
Bank | | | 143,363 | | | | 16.24 | | | | 70,622 | | | | 8.00 | | | $ | 88,278 | | | | 10.00 | % |
| | | | | | | | | | | | | | | | | | | | | | | | | |
Tier 1 capital to risk-weighted assets | | | | | | | | | | | | | | | | | | | | | | | | |
Company | | | 132,455 | | | | 15.00 | | | | 35,312 | | | | 4.00 | | | n/a | | | n/a | |
Bank | | | 132,299 | | | | 14.99 | | | | 35,311 | | | | 4.00 | | | | 52,967 | | | | 6.00 | |
| | | | | | | | | | | | | | | | | | | | | | | | | |
Tier 1 leverage ratio | | | | | | | | | | | | | | | | | | | | | | | | |
Company | | | 132,455 | | | | 12.15 | | | | 43,613 | | | | 4.00 | | | n/a | | | n/a | |
Bank | | | 132,299 | | | | 12.13 | | | | 43,611 | | | | 4.00 | | | | 54,514 | | | | 5.00 | |
| | | | | | | | | | | | | | | | | | | | | | | | | |
| | | | | | | | | | | | | | | | | | | | | | | | | |
At December 31, 2013 | | | | | | | | | | | | | | | | | | | | | | | | |
Total capital to risk-weighted assets | | | | | | | | | | | | | | | | | | | | | | | | |
Company | | $ | 130,043 | | | | 15.49 | % | | $ | 67,142 | | | | 8.00 | % | | n/a | | | n/a | |
Bank | | | 129,956 | | | | 15.48 | | | | 67,142 | | | | 8.00 | | | $ | 83,928 | | | | 10.00 | % |
| | | | | | | | | | | | | | | | | | | | | | | | | |
Tier 1 capital to risk-weighted assets | | | | | | | | | | | | | | | | | | | | | | | | |
Company | | | 119,475 | | | | 14.24 | | | | 33,571 | | | | 4.00 | | | n/a | | | n/a | |
Bank | | | 119,388 | | | | 14.23 | | | | 33,571 | | | | 4.00 | | | | 50,357 | | | | 6.00 | |
| | | | | | | | | | | | | | | | | | | | | | | | | |
Tier 1 leverage ratio | | | | | | | | | | | | | | | | | | | | | | | | |
Company | | | 119,475 | | | | 11.03 | | | | 43,309 | | | | 4.00 | | | n/a | | | n/a | |
Bank | | | 119,388 | | | | 11.03 | | | | 43,311 | | | | 4.00 | | | | 54,138 | | | | 5.00 | |
22. | Holding Company Condensed Financial Information |
Since the Company is a holding company and does not conduct operations, its primary sources of liquidity are equity issuances, dividends received from the Bank and funds received through stock option exercises.
The following tables summarize the holding company’s financial condition, results of operations and cash flows at the dates and for the periods indicated (in thousands).
Condensed Balance Sheets
| | | December 31, | |
| | | 2014 | | | 2013 | |
| | | | | | | | | |
Assets | | | | | | | | |
Cash and cash equivalents | | $ | 127 | | | $ | 87 | |
Deferred tax asset, net | | | 150 | | | | 364 | |
Investment in subsidiary | | | 132,738 | | | | 123,366 | |
Other assets | | | 29 | | | | - | |
Total assets | | $ | 133,044 | | | $ | 123,817 | |
| | | | | | | | | |
| | | | | | | | | |
Liabilities and shareholders' equity | | | | | | | | |
Shareholders' equity | | $ | 133,044 | | | $ | 123,817 | |
Total liabilities and shareholders' equity | | $ | 133,044 | | | $ | 123,817 | |
Condensed Statements of Income (Loss)
| | | For the years ended December 31, | |
| | | 2014 | | | 2013 | | | 2012 | |
| | | | | | | | | | | | | |
Equity in undistributed income (loss) of subsidiary | | $ | 9,848 | | | $ | 27,509 | | | $ | (1,738 | ) |
Other operating expense | | | 279 | | | | 142 | | | | 126 | |
Net income (loss) before provision (benefit) for income taxes | | | 9,569 | | | | 27,367 | | | | (1,864 | ) |
| | | | | | | | | | | | | |
Provision (benefit) for income taxes | | | 214 | | | | (364 | ) | | | - | |
Net income (loss) | | $ | 9,355 | | | $ | 27,731 | | | $ | (1,864 | ) |
Condensed Statements of Cash Flows
| | | For the years ended December 31, | |
| | | 2014 | | | 2013 | | | 2012 | |
Operating Activities | | | | | | | | | | | | |
Net income (loss) | | $ | 9,355 | | | $ | 27,731 | | | $ | (1,864 | ) |
Adjustments to reconcile net income (loss) to net cash provided by(used for) operating activities | | | | | | | | | | | | |
Increase in equity in undistributed (income) loss of subsidiary | | | (8,208 | ) | | | (27,509 | ) | | | 1,738 | |
Deferred income tax expense (benefit) | | | 214 | | | | (364 | ) | | | - | |
Increase in other assets | | | (29 | ) | | | - | | | | - | |
Decrease in other liabilities | | | - | | | | (23 | ) | | | (55 | ) |
Net cash provided by (used for) operating activities | | | 1,332 | | | | (165 | ) | | | (181 | ) |
| | | | | | | | | | | | | |
Investing Activities | | | | | | | | | | | | |
Capital contribution in subsidiary | | | - | | | | - | | | | (650 | ) |
Net cash used for investing activities | | | - | | | | - | | | | (650 | ) |
| | | | | | | | | | | | | |
Financing Activities | | | | | | | | | | | | |
Dividends paid on common stock | | | (1,279 | ) | | | - | | | | - | |
Taxes paid related to net share settlement of equity awards | | | (13 | ) | | | | | | | | |
Proceeds from exercise of stock options | | | - | | | | 124 | | | | - | |
Net cash provided by (used for) financing activities | | | (1,292 | ) | | | 124 | | | | - | |
| | | | | | | | | | | | | |
Net change in cash and due from banks | | | 40 | | | | (41 | ) | | | (831 | ) |
Cash and due from banks, beginning of period | | | 87 | | | | 128 | | | | 959 | |
Cash and due from banks, end of period | | $ | 127 | | | $ | 87 | | | $ | 128 | |
23. | Related Party Transactions |
Intercompany Transactions
Intercompany transactions include activities between the Company and the Bank. Prior to June 2013, the Pension Plan assets were administered by the Bank’s Trust department and were managed by professional investment firms as well as by investment professionals that were teammates of the Bank. Administration and management of the Pension Plan assets were transferred to a third party in June 2013.
Related Party Transactions
Certain Directors, Executive Officers, and their related interests are loan clients of the Bank. All such loans are made on substantially the same terms, including interest rates and collateral, as those prevailing at the same time for comparable transactions. The following table summarizes activity of all such loans at the dates and for the periods indicated (in thousands).
| | | At and for the years ended December 31, | |
| | | 2014 | | | 2013 | |
Related party loans, beginning of period | | $ | 1,758 | | | $ | 1,772 | |
| | | | | | | | | |
Additions: | | | | | | | | |
Loan originations | | | 30 | | | | - | |
Total additions | | | 30 | | | | - | |
| | | | | | | | | |
Reductions: | | | | | | | | |
Paydowns and payoffs | | | 66 | | | | 14 | |
Total reductions | | | 66 | | | | 14 | |
| | | | | | | | | |
Related party loans, end of period | | $ | 1,722 | | | $ | 1,758 | |
All such loans outstanding at December 31, 2014 were performing based on contractual terms.
24. | Quarterly Financial Data (Unaudited) |
The following tables summarize selected quarterly financial data for the periods indicated (in thousands, except per share data).
| | | For the year ended December 31, 2014 | |
| | | First quarter | | | Second quarter | | | Third quarter | | | Fourth quarter | | | Total | |
Interest income | | $ | 10,076 | | | $ | 9,920 | | | $ | 9,871 | | | $ | 9,783 | �� | | $ | 39,650 | |
Interest expense | | | 143 | | | | 131 | | | | 126 | | | | 123 | | | | 523 | |
Net interest income | | | 9,933 | | | | 9,789 | | | | 9,745 | | | | 9,660 | | | | 39,127 | |
| | | | | | | | | | | | | | | | | | | | | |
Provision for loan losses | | | - | | | | - | | | | (500 | ) | | | (1,800 | ) | | | (2,300 | ) |
Net interest income after provision for loan losses | | | 9,933 | | | | 9,789 | | | | 10,245 | | | | 11,460 | | | | 41,427 | |
| | | | | | | | | | | | | | | | | | | | | |
Investment securities gains, net | | | 85 | | | | - | | | | - | | | | 40 | | | | 125 | |
Other noninterest income | | | 3,281 | | | | 3,490 | | | | 3,408 | | | | 3,234 | | | | 13,413 | |
Noninterest expense | | | 10,089 | | | | 10,084 | | | | 10,482 | | | | 9,486 | | | | 40,141 | |
Net income before provision for income taxes | | | 3,210 | | | | 3,195 | | | | 3,171 | | | | 5,248 | | | | 14,824 | |
| | | | | | | | | | | | | | | | | | | | | |
Provision for income taxes | | | 1,182 | | | | 1,168 | | | | 1,189 | | | | 1,930 | | | | 5,469 | |
| | | | | | | | | | | | | | | | | | | | | |
Net income | | $ | 2,028 | | | $ | 2,027 | | | $ | 1,982 | | | $ | 3,318 | | | $ | 9,355 | |
| | | | | | | | | | | | | | | | | | | | | |
Common and per share data | | | | | | | | | | | | | | | | | | | | |
Net income - basic | | $ | 0.16 | | | $ | 0.16 | | | $ | 0.15 | | | $ | 0.26 | | | $ | 0.73 | |
Net income - diluted | | | 0.16 | | | | 0.16 | | | | 0.15 | | | | 0.26 | | | | 0.73 | |
| | | | | | | | | | | | | | | | | | | | | |
| | | For the year ended December 31, 2013 | |
| | | First quarter | | | Second quarter | | | Third quarter | | | Fourth quarter | | | Total | |
Interest income | | $ | 10,864 | | | $ | 10,728 | | | $ | 10,523 | | | $ | 10,423 | | | $ | 42,538 | |
Interest expense | | | 895 | | | | 503 | | | | 475 | | | | 387 | | | | 2,260 | |
Net interest income | | | 9,969 | | | | 10,225 | | | | 10,048 | | | | 10,036 | | | | 40,278 | |
| | | | | | | | | | | | | | | | | | | | | |
Provision for loan losses | | | 350 | | | | 670 | | | | 645 | | | | 1,800 | | | | 3,465 | |
Net interest income after provision for loan losses | | | 9,619 | | | | 9,555 | | | | 9,403 | | | | 8,236 | | | | 36,813 | |
| | | | | | | | | | | | | | | | | | | | | |
Investment securities gains (losses), net | | | - | | | | 331 | | | | (44 | ) | | | 23 | | | | 310 | |
Other noninterest income | | | 3,745 | | | | 3,906 | | | | 3,323 | | | | 3,552 | | | | 14,526 | |
Noninterest expense | | | 10,375 | | | | 11,911 | | | | 9,835 | | | | 10,212 | | | | 42,333 | |
Net income before provision (benefit) for income taxes | | | 2,989 | | | | 1,881 | | | | 2,847 | | | | 1,599 | | | | 9,316 | |
| | | | | | | | | | | | | | | | | | | | | |
Provision (benefit) for income taxes | | | 813 | | | | 382 | | | | (19,386 | ) | | | (224 | ) | | | (18,415 | ) |
| | | | | | | | | | | | | | | | | | | | | |
Net income | | $ | 2,176 | | | $ | 1,499 | | | $ | 22,233 | | | $ | 1,823 | | | $ | 27,731 | |
| | | | | | | | | | | | | | | | | | | | | |
Common and per share data | | | | | | | | | | | | | | | | | | | | |
Net income - basic | | $ | 0.17 | | | $ | 0.12 | | | $ | 1.74 | | | $ | 0.14 | | | $ | 2.17 | |
Net income - diluted | | | 0.17 | | | | 0.12 | | | | 1.74 | | | | 0.14 | | | | 2.17 | |
ITEM 9.CHANGES IN AND DISAGREEMENTS WITH ACCOUNTANTS ON ACCOUNTING AND FINANCIAL DISCLOSURE
None.
ITEM 9A.CONTROLS AND PROCEDURES
Evaluation of Disclosure Controls and Procedures
Management, including our Chief Executive Officer and Chief Financial Officer, has evaluated the effectiveness of our disclosure controls and procedures (as defined in Exchange Act Rules 13a-15(e) and 15d-15(e)) as of the end of the period covered by this report. Based upon that evaluation, our Chief Executive Officer and Chief Financial Officer concluded that our disclosure controls and procedures were effective, in all material respects, to ensure that information required to be disclosed in the reports we file and submit under the Exchange Act is (i) recorded, processed, summarized and reported as and when required and (ii) accumulated and communicated to our management, including our Chief Executive Officer and our Chief Financial Officer, as appropriate to allow timely decisions regarding required disclosure.
For management’s report on internal control over financial reporting and the attestation report thereon issued by our independent registered public accounting firm, see Item 8. Financial Statements and Supplementary Data.
Changes in Internal Control over Financial Reporting
There has been no change in the Company’s internal control over financial reporting during the three months ended December 31, 2014 that has materially impacted, or is reasonably likely to materially impact, the Company’s internal control over financial reporting.
In May 2013, the COSO of the Treadway Commission issued its updatedInternal Control–Integrated Frameworkand related illustrative documents (the "2013 Framework"). The 2013 Framework was written to reflect the changes in business since the first version was released in 1992. The Company transitioned to the 2013 Framework during the first quarter 2014.
ITEM 9B.OTHER INFORMATION
None.
PART III
ITEM 10.DIRECTORS, EXECUTIVE OFFICERS AND CORPORATE GOVERNANCE
The information required by this item is set forth in the definitive Proxy Statement of the Company filed in connection with its 2015 Annual Meeting of Shareholders, which is incorporated herein by reference.
ITEM 11.EXECUTIVE COMPENSATION
The information required by this item is set forth in the definitive Proxy Statement of the Company filed in connection with its 2015 Annual Meeting of Shareholders, which is incorporated herein by reference.
ITEM 12.SECURITY OWNERSHIP OF CERTAIN BENEFICIAL OWNERS AND MANAGEMENT AND RELATED SHAREHOLDER MATTERS
A portion of the information required by this item is set forth in Item 5 of this Annual Report on Form 10-K. Additional information required by this item is set forth in the definitive Proxy Statement of the Company filed in connection with its 2015 Annual Meeting of Shareholders, which is incorporated herein by reference.
ITEM 13.CERTAIN RELATIONSHIPS AND RELATED TRANSACTIONS, AND DIRECTOR INDEPENDENCE
The information required by this item is set forth in the definitive Proxy Statement of the Company filed in connection with its 2015 Annual Meeting of Shareholders, which is incorporated herein by reference.
ITEM 14.PRINCIPAL ACCOUNTING FEES AND SERVICES
The information required by this item is set forth in the definitive Proxy Statement of the Company filed in connection with its 2015 Annual Meeting of Shareholders, which is incorporated herein by reference.
PART IV
ITEM 15.EXHIBITS, FINANCIAL STATEMENT SCHEDULES
(a) | | (1) | | All Financial Statements |
| | | | | |
| | | | | See Item 8. Financial Statements and Supplementary Data |
| | | | | |
| | | (2) | | Financial Statement Schedules |
| | | | | |
| | | | | All schedules to the Consolidated Financial Statements required by Article 9 of Regulation S-X and all other schedules to the financial statements of the Company required by Article 5 of Regulation S-X are not required under the related instructions or are inapplicable and, therefore, have been omitted, or the required information is contained in the Consolidated Financial Statements or the notes thereto, which are included in Item 8 hereof. |
| | | | | |
| | | (3) | | Exhibits |
| | | | | |
| | | | | See the Exhibit Index immediately following the signature page of this report |
SIGNATURES
Pursuant to the requirements of Section 13 or 15(d) of the Securities Exchange Act of 1934, the registrant has duly caused this report to be signed on its behalf by the undersigned, thereunto duly authorized.
PALMETTO BANCSHARES, INC.
By:
/s/ Samuel L. Erwin
Samuel L. Erwin,
Chief Executive Officer
Palmetto Bancshares, Inc.
(Principal Executive Officer)
/s/ Roy D. Jones
Roy D. Jones,
Chief Financial Officer
Palmetto Bancshares, Inc.
(Principal Financial Officer and Principal Accounting Officer)
Date: March 4, 2015
KNOW ALL MEN BY THESE PRESENTS, that each person whose signature appears below constitutes and appoints Samuel L. Erwin, his true and lawful attorney-in-fact and agent, with full power of substitution and resubstitution, for him and in his name, place and stead, in any and all capacities, to sign any and all amendments to this Annual Report on Form 10-K, and to file the same, with all exhibits thereto, and other documents in connection therewith, with the Securities and Exchange Commission, granting unto attorney-in-fact and agent full power and authority to do and perform each and every act and thing requisite or necessary to be done in and about the premises, as fully to all intents and purposes as he might or could do in person, hereby ratifying and confirming all that attorney-in-fact and agent, or his substitute or substitutes, may lawfully do or cause to be done by virtue hereof.
Pursuant to the requirements of the Securities Exchange Act of 1934, this report has been signed below by the following persons on behalf of the registrant and in the capacities and on the dates indicated.
Signature | Title | Date |
| | | |
| | | |
| | | |
/s/ Lee S. Dixon | | |
Lee S. Dixon | Director | March 4, 2015 |
| Chief Operating Officer | |
| Chief Risk Officer | |
| | | |
/s/ Samuel L. Erwin | | |
Samuel L. Erwin | Chairman of the Board of | March 4, 2015 |
| Directors | |
| Chief Executive Officer | |
| (Principal Executive Officer) | |
| | | |
/s/ Michael D. Glenn | | |
Michael D. Glenn | Director | March 4, 2015 |
| | | |
| | | |
| | | |
/s/ Robert B. Goldstein | | |
Robert B. Goldstein | Lead Independent Director | March 4, 2015 |
| | | |
| | | |
| | | |
/s/ John D. Hopkins, Jr. | | |
John D. Hopkins, Jr. | Director | March 4, 2015 |
| | | |
| | | |
| | | |
/s/ Roy D. Jones | | |
Roy D. Jones | Chief Financial Officer | March 4, 2015 |
| (Principal Financial Officer | |
| and Principal Accounting Officer) | |
| | | |
/s/ James J. Lynch | | |
James J. Lynch | Director | March 4, 2015 |
| | | |
| | | |
| | | |
/s/ Jane S. Sosebee | | |
Jane S. Sosebee | Director | March 4, 2015 |
| | | |
| | | |
| | | |
/s/ John P. Sullivan | | |
John P. Sullivan | Director | March 4, 2015 |
| | | |
| | | |
| | | |
/s/ J. David Wasson, Jr. | | |
J. David Wasson, Jr. | Director | March 4, 2015 |
| | | |
| | | |
EXHIBIT INDEX
| | Exhibit No. | Description |
| | | |
| | 3.1 | Amended and Restated Articles of Incorporation filed on December 21, 2009 (incorporated by reference to Exhibit 3.1 of the Company’s Form 8-K filed December 21, 2009) |
| | 3.1.2 | Articles of Amendmentto the Amended and Restated Articles of Incorporation filed on August 11, 2010 (incorporated by reference to Exhibit 3.1 of the Company’s Form 8-K filed October 7, 2010) |
| | 3.1.3 | Articles of Amendment to the Amended and Restated Articles of Incorporation filed on June 27, 2011 (incorporated by reference to Exhibit 3.1 to the Company’s Form 8-K filed June 27, 2011) |
| | 3.1.4 | Articles of Amendment to the Amended and Restated Articles of Incorporation filed on May 22, 2012 (incorporated by reference to Exhibit 3.1 to the Company’s Form 10-Q filed August 2, 2012) |
| | 3.2 | Amended and Restated Bylaws dated December 15, 2009 (incorporated by reference to Exhibit 3.2 of the Company’s Form 8-K filed December 21, 2009) |
| | 4.1 | Specimen Certificate for Common Stock (incorporated by reference to Exhibit 4.3 to the Company's Form S-8 filed August 20, 1992) |
| | 10.1* | The Palmetto Bank Pension Plan and Trust Agreement (incorporated by reference to Exhibit 10(c) to the Company’s Form S-4 filed May 2, 1988) |
| | 10.2* | The Palmetto Bank Corporate Officer Incentive Compensation Plan (incorporated by reference to Exhibit 10.1 to the Company’s Form 8-K filed July 14, 2014) |
| | 10.3* | Palmetto Bancshares, Inc. Amended and Restated 1997 Stock Compensation Plan (incorporated by reference to Exhibit 10.1 to the Company’s Form 10-K filed March 15, 2004) |
| | 10.4* | Palmetto Bancshares, Inc. 2008 Restricted Stock Plan (incorporated by reference to Appendix A to Company’s Schedule 14A filed March 17, 2008) |
| | 10.5 | Lease Agreement dated as of May 2, 2007 between The Palmetto Bank and Charles E. Howard and Doris H. Howard (incorporated by reference to Exhibit 10.1 to the Company’s Form 8-K filed June 26, 2007) |
| | 10.6 | Stock Purchase Agreement by and among Palmetto Bancshares, Inc. and the investors named therein dated as of May 25, 2010 (incorporated by reference to Exhibit 10.1 of the Company’s Form 8-K filed June 1, 2010) |
| | 10.7 | Registration Rights Agreement by and among Palmetto Bancshares, Inc. and the investors named therein dated as of May 25, 2010 (incorporated by reference to Exhibit 10.2 of the Company’s Form 8-K filed June 1, 2010) |
| | 10.8 | Amendment No. 1 dated June 8, 2010 to Stock Purchase Agreement and Registration Rights Agreement by and among Palmetto Bancshares, Inc. and each of the other investors named therein, each dated as of May 25, 2010 (incorporated by reference to Exhibit 10.1 of the Company’s Form 8-K filed June 11, 2010) |
| | 10.9 | Amendment No. 2 dated September 22, 2010 to Stock Purchase Agreement by and among Palmetto Bancshares, Inc. and each of the other investors named therein (incorporated by reference to Exhibit 10.1 of the Company’s Form 8-K filed September 24, 2010) |
| | 10.10 | Form of Subscription Agreement by and among Palmetto Bancshares, Inc. and each Institutional Investor participating in the Institutional Shareholders Offering dated as of January 28, 2011 (incorporated by reference to Exhibit 10.1 of the Company’s Form 8-K filed February 3, 2011) |
| | 10.11* | Amended and Restated Employment Agreement by and between Palmetto Bancshares, Inc. and Samuel L. Erwin, dated March 17, 2011 (incorporated by reference to Exhibit 10.1 of the Company’s Form 8-K filed April 1, 2011) |
| | 10.12* | Amended and Restated Employment Agreement by and between Palmetto Bancshares, Inc. and Lee S. Dixon, dated March 17, 2011 (incorporated by reference to Exhibit 10.1 of the Company’s Form 8-K filed April 1, 2011) |
| | 10.13* | Palmetto Bancshares, Inc. 2011 Stock Incentive Plan (incorporated by reference to Exhibit B of the Company’s Schedule 14A filed April 14, 2011) |
| | 21.1 | List of Subsidiaries of the Registrant |
| | 23.1 | Consent of Elliott Davis Decosimo, LLC |
| | 31.1 | Certification Pursuant to Section 302 of the Sarbanes-Oxley Act of 2002 |
| | 31.2 | Certification Pursuant to Section 302 of the Sarbanes-Oxley Act of 2002 |
| | 32 | Certifications Pursuant to Section 906 of the Sarbanes-Oxley Act of 2002 |
| | 101 | The following materials from Palmetto Bancshares, Inc.’s Annual Report on Form 10-K for the year ended December 31, 2014, formatted in XBRL; (i) Consolidated Balance Sheets at December 31, 2014 and 2013, (ii) Consolidated Statements of Income (Loss) for the years ended December 31, 2014, 2013 and 2012, (iii) Consolidated Statements of Comprehensive Income (Loss) for the years ended December 31, 2014, 2013 and 2012, (iv) Consolidated Statements of Changes in Shareholders’ Equity for the years ended December 31, 2014, 2013 and 2012, (v) Consolidated Statements of Cash Flows for the years ended December 31, 2014, 2013 and 2012, and (vi) Notes to Consolidated Financial Statements |
* Management contract or compensatory plan or arrangement
Copies of exhibits are available upon written request to Corporate Secretary, Palmetto Bancshares, Inc., 306 East North Street, Greenville, South Carolina 29601.
131