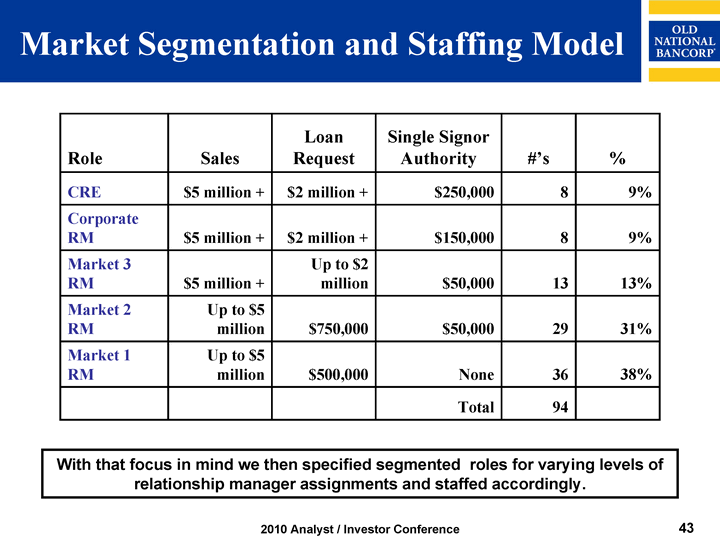
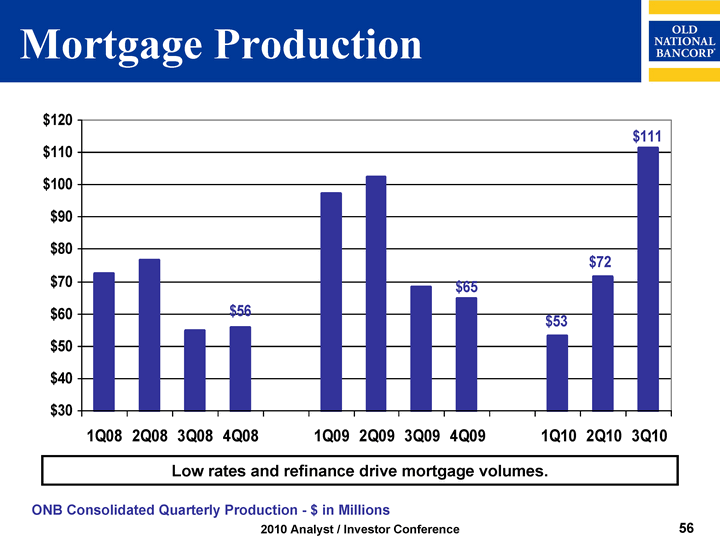
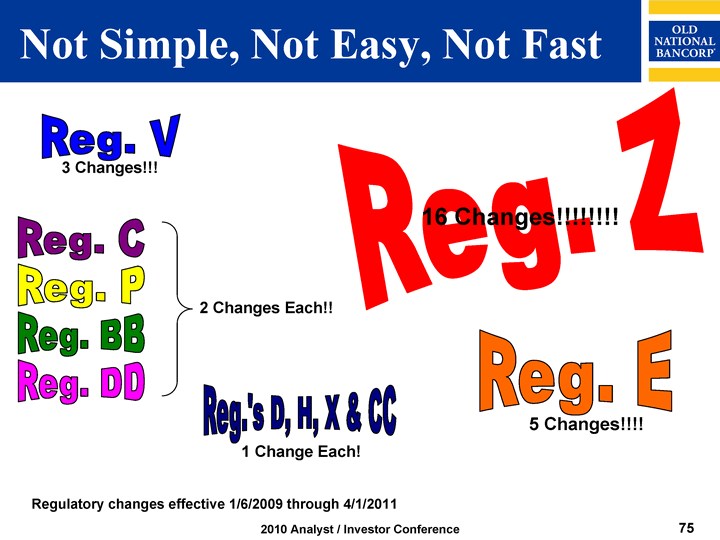
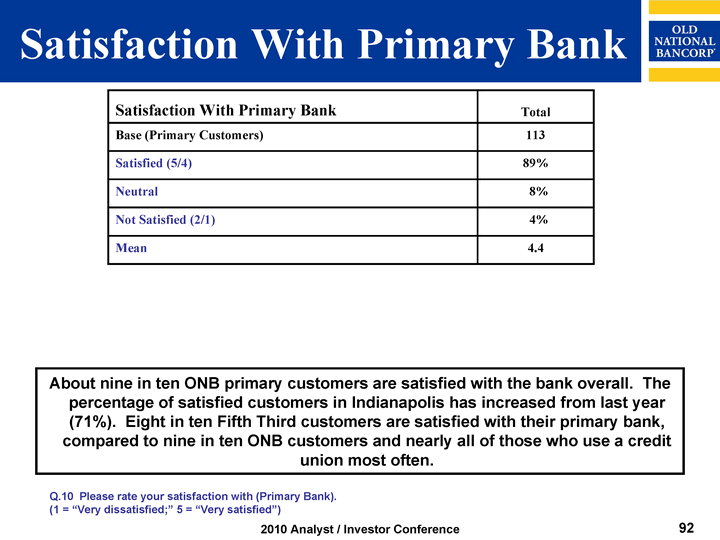
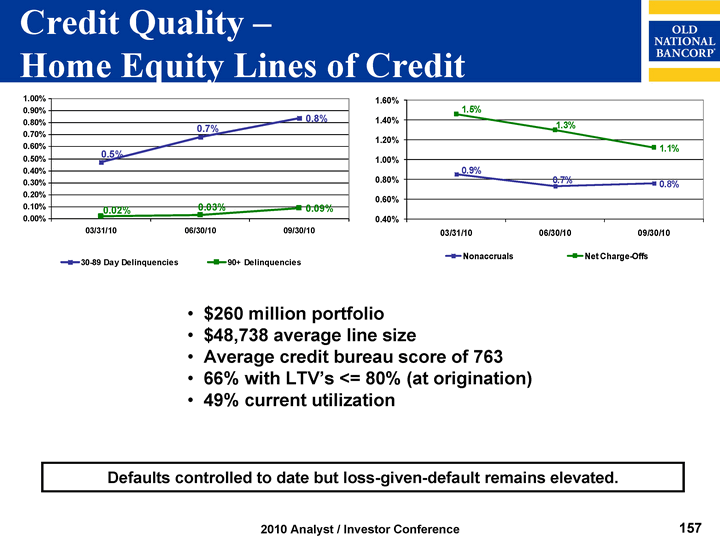
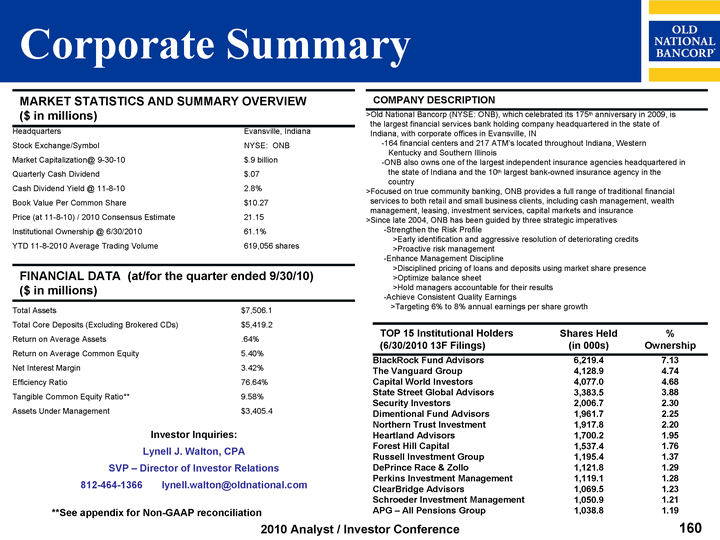
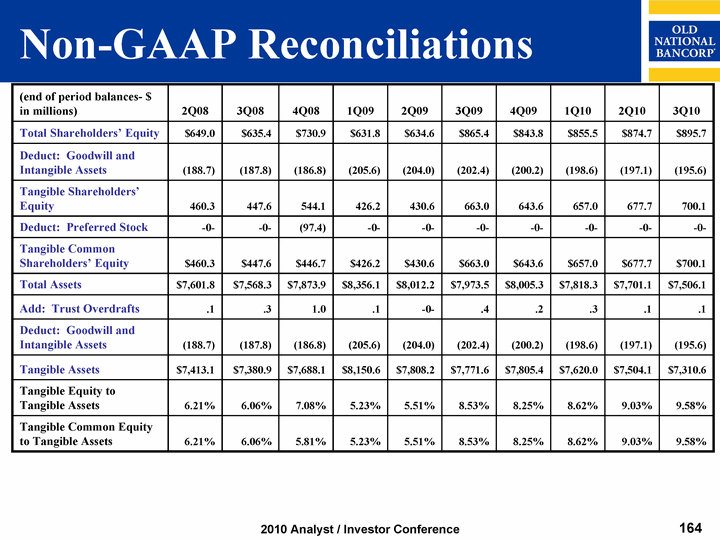
| Corporate Summary MARKET STATISTICS AND SUMMARY OVERVIEW ($ in millions) MARKET STATISTICS AND SUMMARY OVERVIEW ($ in millions) MARKET STATISTICS AND SUMMARY OVERVIEW ($ in millions) MARKET STATISTICS AND SUMMARY OVERVIEW ($ in millions) MARKET STATISTICS AND SUMMARY OVERVIEW ($ in millions) MARKET STATISTICS AND SUMMARY OVERVIEW ($ in millions) MARKET STATISTICS AND SUMMARY OVERVIEW ($ in millions) Headquarters Headquarters Headquarters Evansville, Indiana Evansville, Indiana Evansville, Indiana Stock Exchange/Symbol Stock Exchange/Symbol Stock Exchange/Symbol NYSE: ONB NYSE: ONB Market Capitalization@ 9-30-10 Market Capitalization@ 9-30-10 Market Capitalization@ 9-30-10 $.9 billion $.9 billion Quarterly Cash Dividend Quarterly Cash Dividend Quarterly Cash Dividend $.07 $.07 Cash Dividend Yield @ 11-8-10 Cash Dividend Yield @ 11-8-10 Cash Dividend Yield @ 11-8-10 2.8% 2.8% Book Value Per Common Share Book Value Per Common Share Book Value Per Common Share $10.27 $10.27 Price (at 11-8-10) / 2010 Consensus Estimate Price (at 11-8-10) / 2010 Consensus Estimate Price (at 11-8-10) / 2010 Consensus Estimate 21.15 21.15 Institutional Ownership @ 6/30/2010 Institutional Ownership @ 6/30/2010 Institutional Ownership @ 6/30/2010 61.1% 61.1% YTD 11-8-2010 Average Trading Volume YTD 11-8-2010 Average Trading Volume YTD 11-8-2010 Average Trading Volume 619,056 shares 619,056 shares FINANCIAL DATA (at/for the quarter ended 9/30/10) ($ in millions) FINANCIAL DATA (at/for the quarter ended 9/30/10) ($ in millions) FINANCIAL DATA (at/for the quarter ended 9/30/10) ($ in millions) FINANCIAL DATA (at/for the quarter ended 9/30/10) ($ in millions) FINANCIAL DATA (at/for the quarter ended 9/30/10) ($ in millions) FINANCIAL DATA (at/for the quarter ended 9/30/10) ($ in millions) FINANCIAL DATA (at/for the quarter ended 9/30/10) ($ in millions) FINANCIAL DATA (at/for the quarter ended 9/30/10) ($ in millions) Total Assets $7,506.1 $7,506.1 $7,506.1 Total Core Deposits (Excluding Brokered CDs) $5,419.2 $5,419.2 $5,419.2 Return on Average Assets .64% .64% .64% Return on Average Common Equity 5.40% 5.40% 5.40% Net Interest Margin 3.42% 3.42% 3.42% Efficiency Ratio 76.64% 76.64% 76.64% Tangible Common Equity Ratio** 9.58% 9.58% 9.58% Assets Under Management $3,405.4 $3,405.4 $3,405.4 COMPANY DESCRIPTION >Old National Bancorp (NYSE: ONB), which celebrated its 175th anniversary in 2009, is the largest financial services bank holding company headquartered in the state of Indiana, with corporate offices in Evansville, IN -164 financial centers and 217 ATM's located throughout Indiana, Western Kentucky and Southern Illinois -ONB also owns one of the largest independent insurance agencies headquartered in the state of Indiana and the 10th largest bank-owned insurance agency in the country >Focused on true community banking, ONB provides a full range of traditional financial services to both retail and small business clients, including cash management, wealth management, leasing, investment services, capital markets and insurance >Since late 2004, ONB has been guided by three strategic imperatives -Strengthen the Risk Profile >Early identification and aggressive resolution of deteriorating credits >Proactive risk management -Enhance Management Discipline >Disciplined pricing of loans and deposits using market share presence >Optimize balance sheet >Hold managers accountable for their results -Achieve Consistent Quality Earnings >Targeting 6% to 8% annual earnings per share growth **See appendix for Non-GAAP reconciliation Investor Inquiries: Lynell J. Walton, CPA SVP - Director of Investor Relations 812-464-1366 lynell.walton@oldnational.com TOP 15 Institutional Holders (6/30/2010 13F Filings) Shares Held (in 000s) % Ownership BlackRock Fund Advisors 6,219.4 7.13 The Vanguard Group 4,128.9 4.74 Capital World Investors 4,077.0 4.68 State Street Global Advisors 3,383.5 3.88 Security Investors 2,006.7 2.30 Dimentional Fund Advisors 1,961.7 2.25 Northern Trust Investment 1,917.8 2.20 Heartland Advisors 1,700.2 1.95 Forest Hill Capital 1,537.4 1.76 Russell Investment Group 1,195.4 1.37 DePrince Race & Zollo 1,121.8 1.29 Perkins Investment Management 1,119.1 1.28 ClearBridge Advisors 1,069.5 1.23 Schroeder Investment Management 1,050.9 1.21 APG - All Pensions Group 1,038.8 1.19 |