Exhibit 99.2

To Partner With November 25, 2024

Disclaimer and Caution About Forward - Looking Statements 2 Certain statements in this presentation constitute “forward - looking statements” within the meaning of the Private Securities Lit igation Reform Act of 1995, Section 27A of the Securities Act of 1933, as amended, and Rule 175 promulgated thereunder, and S ect ion 21E of the Securities Exchange Act of 1934, as amended, and Rule 3b - 6 promulgated thereunder, which statements involve inherent risks and uncertainties. Examples of forward - looking statements include, but are not limited to, statements regarding the outlo ok and expectations of Old National Bancorp (the “Company”, “Old National”, “ONB”, “we” or “us”) and Bremer Financial Corporation (“Bremer”), respectively, with respect to the proposed transaction, the strategic benefits and financial benefits of the proposed transaction, including the expected impact of the proposed transactions on the combined company’s future financial performanc e ( including anticipated accretion to earnings per share, the tangible book value earn - back period and other operating and return metrics), the timing of the closing of the proposed transaction, the ability to successfully integrate the combined businesse s, and statements on the slides entitled “Transaction Highlights”, “Key Transaction Terms”, “Key Financial Assumptions,” “Financ ial ly Attractive Transaction Accelerating Top Quartile Returns,” “Rapid Capital Accretion,” “Creating Value For All Stakeholders,” “Pr o Forma Deposit Composition,” “Pro Forma Loan Composition,” and “Pro Forma Earnings Per Share Reconciliation.” Such statemen ts are often characterized by the use of qualified words (and their derivatives) such as “may,” “will,” “anticipate,” “could,” “ sho uld,” “would”, “believe,” “contemplate”, “expect,” “estimate”, “continue”, “plan”, “project” and “intend”, as well as words o f s imilar meaning or other statements concerning opinions or judgment of Old National or Bremer or their respective management about future events . F orward - looking statements are based on assumptions as of the time they are made and are subject to risks, uncertainties and othe r factors that are difficult to predict with regard to timing, extent, likelihood and degree of occurrence which could cause ac tua l results to differ materially from anticipated results, expressed or implied by such forward - looking statements. Such risks, u ncertainties and assumptions, include, among others, the following: the occurrence of any event, change or other circumstances that could give rise to the right of one or both of the parties to te rminate the merger agreement; the failure to obtain necessary regulatory approvals (and the risk that such approvals may result in the imposition of condit ion s that could adversely affect the combined company or the expected benefits of the proposed transaction) and the possibility that the proposed transaction does not close when expected or at all because required regulatory approvals, the approval by B rem er’s shareholders, or other approvals and the other conditions to closing are not received or satisfied on a timely basis or at all; the outcome of any legal proceedings that may be instituted against Old National or Bremer; the possibility that the anticipated benefits of the proposed transaction, including anticipated cost savings and strategic g ain s, are not realized when expected or at all, including as a result of changes in, or problems arising from, general economic and market conditions, interest and exchange rates, monetary policy, laws and regulations and their enforcement, and the degree o f c ompetition in the geographic and business areas in which Old National and Bremer operate; the possibility that the integration of the two companies may be more difficult, time - consuming or costly than expected; the impact of purchase accounting with respect to the proposed transaction, or any change in the assumptions used regarding t he assets acquired and liabilities assumed to determine their fair value and credit marks; the possibility that the proposed transaction may be more expensive or take longer to complete than anticipated, including as a result of unexpected factors or events; the diversion of management’s attention from ongoing business operations and opportunities; potential adverse reactions of Old National’s or Bremer’s customers or changes to business or employee relationships, includi ng those resulting from the announcement or completion of the proposed transaction; a material adverse change in the financial condition of Old National or Bremer; changes in Old National’s share price before closing; risks relating to the potential dilutive effect of shares of Old National’s common stock to be issued in the proposed transac tio n; general competitive, economic, political and market conditions; major catastrophes such as earthquakes, floods or other natural or human disasters, including infectious disease outbreaks; a nd other factors that may affect future results of Old National or Bremer, including, among others, changes in asset quality and cr edit risk; the inability to sustain revenue and earnings growth; changes in interest rates; deposit flows; inflation; custome r borrowing, repayment, investment and deposit practices; the impact, extent and timing of technological changes; capital manag eme nt activities; and other actions of the Federal Reserve Board, the Office of the Comptroller of the Currency and legislative and regulatory actions and reforms. These factors are not necessarily all of the factors that could cause Old National, Bremer, or the combined company’s actual res ults, performance or achievements to differ materially from those expressed in or implied by any of the forward - looking statemen ts. Other factors, including unknown or unpredictable factors, also could harm Old National’s, Bremer’s, or the combined company’ s r esults. Although each of Old National and Bremer believes that its expectations with respect to forward looking statements are based upo n reasonable assumptions within the bounds of its existing knowledge of its business and operations, there can be no assuranc e t hat actual results of Old National or Bremer will not differ materially from any projected future results expressed or implied by su ch forward - looking statements. Additional factors that could cause results to differ materially from those described above can be found in Old National’s most recent annual report on Form 10 - K for the fiscal year ended December 31, 2023 and quarterly reports on Form 10 - Q, and other documents subsequently filed by Old National with the Securities and Exchange Commission (the “SEC”). The actual results anticipated may not be realized or, even if substantially realized, they may not have the expected consequence s t o or effects on Old National, Bremer or their respective businesses or operations. Investors are cautioned not to rely too h eav ily on any such forward - looking statements. Old National and Bremer urge you to consider all of these risks, uncertainties and other facto rs carefully in evaluating all such forward - looking statements made by Old National and Bremer. Forward looking statements speak only as of the date they are made and Old National and Bremer undertake no obligation to update or clarify these forward - looking stat ements, whether as a result of new information, future events or otherwise, except to the extent required by applicable law. No Offer or Solicitation This communication does not constitute an offer to sell or the solicitation of an offer to buy any securities or the solicita tio n of any vote or approval with respect to the proposed transaction between Old National and Bremer. No offer of securities s hal l be made except by means of a prospectus meeting the requirements of the Securities Act of 1933, as amended, and no offer to sell or s oli citation of an offer to buy shall be made in any jurisdiction in which such offer, solicitation or sale would be unlawful pri or to registration or qualification under the securities laws of such jurisdiction.
Additional Information 3 Important Additional Information and Where to Find It In connection with the proposed transaction, Old National intends to file with the SEC a Registration Statement on Form S - 4 (the “Registration Statement”) to register the shares of Old National capital stock to be issued in connection with the proposed t ra nsaction. The Registration Statement will include a proxy statement of Bremer and a prospectus of Old National (the “Proxy Statement/Pr osp ectus”), and Old National may file with the SEC other relevant documents concerning the proposed transaction. BEFORE MAKING ANY VOTING OR INVESTMENT DECISION, INVESTORS AND SHAREHOLDERS ARE URGED TO READ THE REGISTRATION STATEMENT AND PROXY STATEMENT/P ROSPECTUS REGARDING THE PROPOSED TRANSACTION WHEN THEY BECOME AVAILABLE AND ANY OTHER RELEVANT DOCUMENTS FILED WITH THE SEC, AS WELL AS ANY AMENDMENTS OR SUPPLEMENTS TO THOSE DOCUM ENT S, BECAUSE THEY WILL CONTAIN IMPORTANT INFORMATION ABOUT OLD NATIONAL, BREMER AND THE PROPOSED TRANSACTION AND RELATED MATTERS. A copy of the Registration Statement, Proxy Statement/Prospectus, as well as other filings containing information about Old N ati onal and Bremer, may be obtained, free of charge, at the SEC’s website (http://www.sec.gov) when they are filed. You will al so be able to obtain these documents, when they are filed, free of charge, from Old National by accessing Old National’s website at ht tps://ir.oldnational.com. Copies of the Registration Statement, Proxy Statement/Prospectus and the filings with the SEC that wi ll be incorporated by reference therein can also be obtained, without charge, by directing a request to Old National’s Investor Rel ati ons, Old National Bancorp, One Main Street, Evansville, Indiana, 47708, or by calling (812) 464 - 1366. The information on Old Na tional’s website is not, and shall not be deemed to be, a part of this communication or incorporated into other filings either company ma kes with the SEC. Bremer Data Unless otherwise indicated, data about Bremer provided in this presentation, including financial information, has been obtain ed from Bremer management. Pro Forma Forward - Looking Data Neither Old National’s nor Bremer’s independent registered public accounting firms have studied, reviewed or performed any pr oce dures with respect to the pro forma forward - looking financial data for the purpose of inclusion in this presentation, and, accor dingly, neither have expressed an opinion or provided any form of assurance with respect thereto for the purpose of this presentation . These pro forma forward - looking financial data are for illustrative purposes only and should not be relied on as necessarily bei ng indicative of future results. The assumptions and estimates underlying the pro forma forward - looking financial data are inheren tly uncertain and are subject to a wide variety of significant business, economic and competitive risks and uncertainties tha t c ould cause actual results to differ materially from those contained in the prospective financial information, including those in the “Ca uti on about Forward - Looking Statements” disclaimer on slide 2 of this presentation. Pro forma forward - looking financial data is in herently uncertain due to a number of factors outside of Old National’s and Bremer’s control. Accordingly, there can be no assurance tha t the prospective results are indicative of future performance of the combined company after the proposed acquisition or that ac tual results will not differ materially from those presented in the pro forma forward - looking financial data. Inclusion of pro forma financial data in this presentation should not be regarded as a representation by any person that the results contained in th e prospective financial information will be achieved. Non - GAAP Financial Measures This presentation includes certain financial measures derived from consolidated financial data but not presented in accordanc e w ith U.S. generally accepted accounting principles (“GAAP”). The Company believes that these non - GAAP measures, when taken together with its financial results presented in accordance with GAAP, provide meaningful supplemental information regarding its operating performance and facilitate internal comparisons of its historical operating performance on a mere consistent basis. These non - GAAP financial measures, however, are subject to inherent limitations, may not be comparable to similarly titled measures us ed by other companies and should not be considered in isolation or as an alternative to GAAP measures. Please refer to the appendix for more information about the non - GAAP financial measures, and reconciliations of the non - GAAP financial measures to t heir most directly comparable GAAP financial measures. Market and Industry Data Unless otherwise indicated, market data and certain industry forecast data used in this presentation were obtained from inter nal reports, where appropriate, as well as third party sources and other publicly available information. Data regarding the indu st ries in which the Company competes, its market position and market share within these industries are inherently imprecise and are sub jec t to significant business, economic and competitive uncertainties beyond the Company’s control. In addition, assumptions and estimates of the Company and its industries’ future performance are necessarily subject to a high degree of uncertainty and r isk due to a variety of factors. These and other factors could cause future performance to differ materially from assumptions an d estimates.

A Combination Creating the Premier Midwest Regional Bank Source: S&P Capital IQ, FactSet, ONB filings and management and Bremer filings . Financial data as of the quarter ended September 30, 2024 . 1. Reflects pro forma balances as of September 30, 2024 for illustrative purposes. 2. Pro forma impact is presented for illus tra tive purposes only. Inclusive of all purchase accounting adjustments, merger costs, CECL provision expense, sale of CRE loans and common equity offering. See disclaimer "Pro Forma Forward - Looking Da ta" and slides 8 and 17 for key financial assumptions. There can be no assurance that we will be able to find a prospective purchaser for the CRE loan sale concurrent with the merger or to sell the loans at a price or other terms acceptable to us. See appendix for Pro Forma EPS reconciliation. 3 . Reflects bank - level data. 4. Branch data as of June 30, 2024. 4 Compelling Partnership 1 Complementary Pro Forma Footprint 4 ~22% 2026E EPS Accretion 2.0 yrs TBVPS Earnback ~20% Internal Rate Of Return < 250% Pro Forma CRE / Total RBC At Close 3 ~1.3% Pro Forma 2026E ROAA 18.4% Pro Forma 2026E ROATCE 10.2% Pro Forma CET1 At Close ~84% Pro Forma Loans / Deposits At Close Gross Loans $46B Deposits $54B Wealth AUM $39B Total Assets $70B ND MN SD IA MO IL TN KY OH IN MI WI ONB Disciplined Approach Focused on Maximizing Shareholder Value 2 (289) (70) Pro Forma Scale
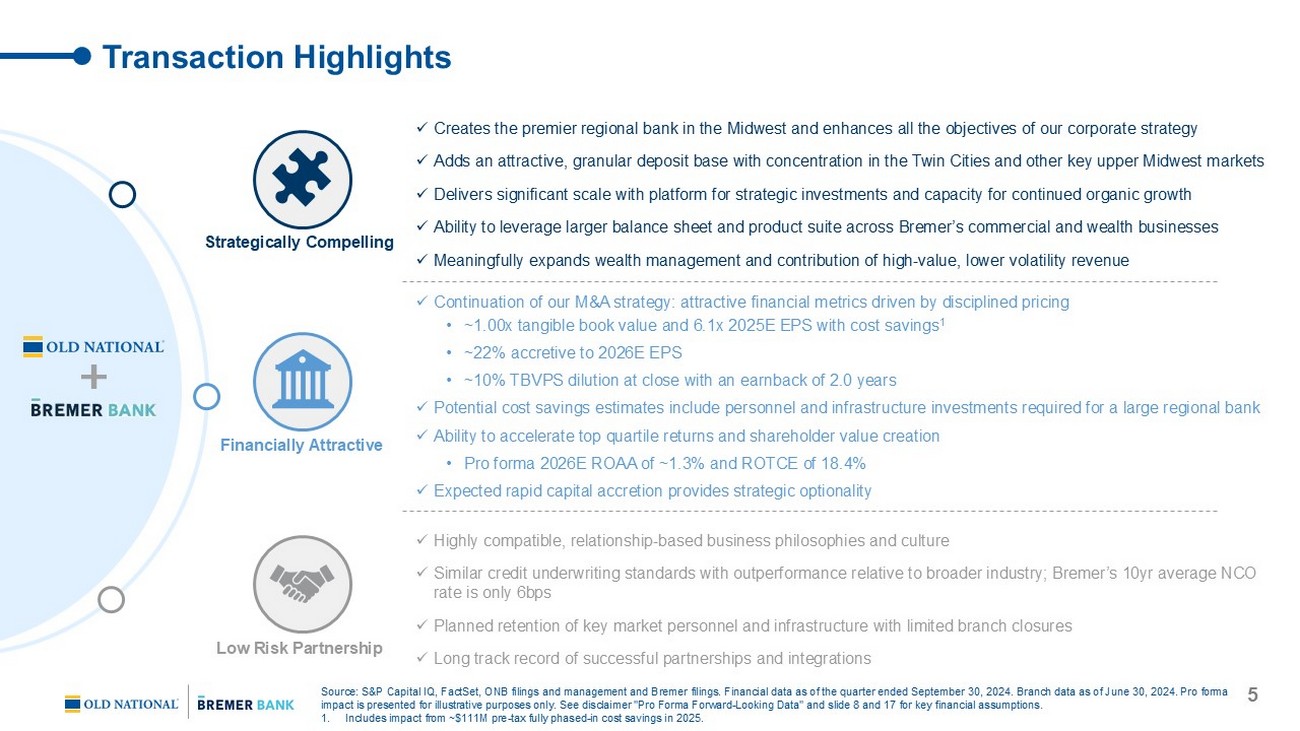
x Creates the premier regional bank in the Midwest and enhances all the objectives of our corporate strategy x Adds an attractive, granular deposit base with concentration in the Twin Cities and other key upper Midwest markets x Delivers significant scale with platform for strategic investments and capacity for continued organic growth x Ability to leverage larger balance sheet and product suite across Bremer’s commercial and wealth businesses x Meaningfully expands wealth management and contribution of high - value, lower volatility revenue x Continuation of our M&A strategy: attractive financial metrics driven by disciplined pricing • ~1.00x tangible book value and 6.1x 2025E EPS with cost savings 1 • ~22% accretive to 2026E EPS • ~10% TBVPS dilution at close with an earnback of 2.0 years x Potential cost savings estimates include personnel and infrastructure investments required for a large regional bank x Ability to accelerate top quartile returns and shareholder value creation • Pro forma 2026E ROAA of ~1.3% and ROTCE of 18.4% x Expected rapid capital accretion provides strategic optionality x Highly compatible, relationship - based business philosophies and culture x Similar credit underwriting standards with outperformance relative to broader industry; Bremer’s 10yr average NCO rate is only 6bps x Planned retention of key market personnel and infrastructure with limited branch closures x Long track record of successful partnerships and integrations Transaction Highlights Strategically Compelling 5 Financially Attractive Low Risk Partnership Source: S&P Capital IQ, FactSet, ONB filings and management and Bremer filings . Financial data as of the quarter ended September 30, 2024 . Branch data as of June 30, 2024. Pro forma impact is presented for illustrative purposes only. See disclaimer "Pro Forma Forward - Looking Data" and slide 8 and 17 for key f inancial assumptions. 1. Includes impact from ~$111M pre - tax fully phased - in cost savings in 2025.

28% 15% 44% 9% 3% 6% 18% 10% 13% 17% 16% 10% 9% Loan & Deposit Composition O O CRE Investor CRE $11.5B Loans $13.2B Deposits CLD Multifamily C&I 1 - 4 Family Cons. & Other 2 Agriculture Retail Time Jumbo Time Non - Int Demand Now & Other Trans. MMDA & Savings • Established in 1943 and headquartered in St. Paul, MN – 2 nd largest traditional bank headquartered in Minnesota • Private institution, ~86% owned by the Otto Bremer Trust (a charitable organization) • Operates 70 branches across Minnesota, Wisconsin and North Dakota • Primarily concentrated in Minneapolis - St. Paul with the 6 th ranked market share 1 • Community - focused banking model with commercially - oriented loan portfolio • High - quality, low - cost deposit base with competitive positioning in key markets Overview of Bremer Financial Corporation 6 Source: S&P Capital IQ, ONB filings and management and Bremer management and filings . Financial data as of the quarter ended September 30, 2024. Total may not sum to 100 due to rounding. Branch data as of June 30, 2024. 1. Rank based on traditional commercial banks. 2. Primarily state, politica l a nd municipal loans. 3. Based on the nine months ended September 30, 2024. Key Ratios Balance Sheet ($B) Profitability Company Overview Key Financial Metrics 3 3

Proj . Pop. CAGR (’24 - ’29E) Minneapolis-St. Paul Market Dynamics % of Deposits Franchise 1U.S. Bancorp $111,326 21.1% 2Wells Fargo 41,922 3.0 Old National + Bremer Old National + Bremer 8,992 18.0 3Huntington 6,604 4.2 4Bank of Montreal 6,097 3.0 5Bank of America 5,957 0.3 6 Bremer Financial 5,452 42.6 7State Bankshares 4,161 34.7 8Bridgewater 4,034 100.0 9 Old National 3,540 8.8 10Choice Financial 2,997 68.6 % of Market Market MSA Branches Deposits Franchise Rank Share Rank Share 1 Chicago, IL 89 $16.4 32.7% 9 2.8% 4 7.7% 2 Twin Cities, MN 47 9.0 18.0 3 4.0 2 5.2 3 Evansville, IN 15 4.2 8.4 1 35.5 1 35.5 4 Indianapolis, IN 21 2.1 4.2 12 2.4 9 3.2 5 Milwaukee, WI 6 1.4 2.8 9 1.9 6 2.7 6 Nashville, TN 7 1.0 1.9 16 1.0 12 1.3 7 Madison, WI 11 1.0 1.9 9 3.8 7 4.9 8 St. Cloud, MN 3 0.9 1.8 2 11.8 2 13.1 9 Bloomington, IN 5 0.8 1.7 2 22.4 1 30.4 10 Grand Forks, ND 3 0.6 1.3 2 16.2 2 17.1 Top 10 Markets 207 $37.4 74.7% 7 7.6% 4 10.3% All Markets 359 51.7 100.0 6 10.1 Pro Forma Combined Footprint Enhances Regional Scale & Density in Key Markets 7 Source: S&P Capital IQ, ONB filings and management and Bremer filings. Financial data as of September 30, 2024 unless otherwi se specified. Branch data as of June 30, 2024. Pro forma impact is presented for illustrative purposes only. See disclaimer "Pro Forma Forward - Looking Data" and slides 8 and 17 for key financial assumptions. 1. Rank based on traditional commercial banks. 2. Excludes money center banks, trust banks and foreign - owned bank subsidiaries. Expands Our Midwest Footprint… …With Density in The Twin Cities… 1 7 MSAs with Bremer Contribution All Banks Regional Banks 2 …And Stronger Demographics Pro Forma National Average: 2.4% Median Household Income National Average: $75.9k 1 ($B) ($M)

Key Transaction Terms 8 8 Transaction Structure Bremer shareholders will receive 4.182 ONB shares (fixed exchange ratio) and $26.22 per share in cash for each Bremer share – Aggregate consideration to Bremer shareholders equates to approximately 50 million shares of ONB and $315 million in cash Approximately 78% stock and 22% cash consideration Pro forma ownership: ~81.6% ONB, ~12.8% Bremer and ~5.6% new shareholders 1 Approvals & Timing Approval of Bremer shareholders required – Otto Bremer Trust will enter into a voting agreement at signing to approve the transaction (86% voting control of Bremer shar es) Customary regulatory approvals Anticipated closing in the middle of 2025 Board Representation Otto Bremer Trust to appoint one Trustee to Old National Bancorp Board of Directors Transaction Value 2 Deal value of ~$1.401 billion Price / TBV: 1.00x Price / 2025E EPS: 9.7x Price / 2025E EPS with cost savings: 6.1x 3 Source: S &P Capital IQ, ONB filings and management and Bremer filings . Financial data as of the quarter ended September 30, 2024 . Pro forma impact is presented for illustrative purposes only. See disclaimer “Pro Forma Forward - Looking Data” and slides 8 and 17 for key financial assumptions. 1. Pro forma ownership assumes common equity raise base offering of $400M at $21.00, full exercise of 15% greenshoe and full ph ysical settlement for illustrative purposes. 2. Based on ONB’s closing stock price on November 22, 2024 of $21.65. 3. Includes impac t f rom ~$111M pre - tax fully phased - in cost savings in 2025. Common Equity Raise $400 million common equity offering Forward settlement mechanism to provide flexibility around settlement amount and date

49% 52% 53% 56% 1.34% 1.30% 1.19% 1.12% 18.4% 14.5% 14.1% 12.5% 9 Pro Forma Top Quartile Profitability 1,4 2026E ROAA 2026E ROATCE 2026E Efficiency Ratio Standalone Standalone Standalone Financially Attractive Transaction Accelerating Top Quartile Returns Pro Forma Pro Forma Pro Forma Top Quartile Top Quartile Top Quartile Disciplined M&A Strategy 1 Strong Pro Forma Capital Position 1 ~20% Median Median Median 2.0yrs ~22% 2026E EPS Accretion TBVPS Earnback Period 2 Internal Rate Of Return Announced Deal Metrics Source: S&P Capital IQ, FactSet, ONB filings and management and Bremer filings. Financial data as of the quarter ended Septem ber 30, 2024. 1. Pro forma impact is presented for illustrative purposes only. Inclusive of all purchase accounting adjustments, merger costs, CECL provision expense, sale of CRE loans and common equity offering. See disclaimer "Pro Forma Forward - Looking Data" and slides 8 and 17 for key financial assumptions . There can be no assurance that we will be able to find a prospective purchaser for the CRE loan sale concurrent with the merger or to sell the loans at a price or other terms accepta ble to us. See appendix for Pro Forma EPS reconciliation. 2. Earnback period calculation is based on the crossover method. 3. Reflects bank - level data. 4. Analysis based on public U.S. banks $20bn - $100bn in total assets. 10.2% CET1 12.2% TRBC 244% CRE / TRBC 3 Capital At Close

10.2% 11.8% 1.9% 0.7% 0.5% 12.9% (0.6%) (0.8%) CET1 (at Close) ONB Standalone Earnings Bremer Synergized Earnings Dividends RWAs & Other Accretion of FV Marks CET1 (2026E) Rapid Capital Accretion 10 Enhanced Earnings & Accretion of Fair Value Marks 1 6 Quarters of Projected Core Retained Earnings Benefit From Remaining FV Marks Accretion After 2026 Pro Forma CET1 Ratio 1 4 2 3 Leverage Ratio 8.2% CET1 Ratio 10.2% Total RBC Ratio 12.2% Key Takeaways 1 Snapshot of Projected Pro Forma Capital Ratios at Close 1 Source: S&P Capital IQ, FactSet, ONB filings and management and Bremer filings. Financial data as of the quarter ended Septem ber 30, 2024 . 1. Pro forma impact is presented for illustrative purposes only. Inclusive of all purchase accounting adjustments, merger costs, CE CL provision expense and sale of CRE loans and common equity offering. See disclaimer "Pro Forma Forward - Looking Data" and slides 8 and 17 for key financial assumptions. There can be no assurance that we will be able to find a prospective purchaser for the CRE loan sale concurrent with the merger or to sell the loans at a price or other terms acceptable to us. See appendix for Pro Forma EPS reconciliation. 2. Reflects impact from Bremer standalone projected earnings and cost savings. 3. Includes ~$14M net impact to CET1 from sale of CRE loans, amortization of intangibles and other adjustments. 4. Reflects impact from remaining after - tax fair value marks through earnings post - 2026 , prior to any additional risk - weighted asset growth. Meaningful capital generation from expected $1.3B+ of combined core earnings over 18 months post - closing ~160bps in expected CET1 growth by year - end 2026 2026E CET1 expected to end at a strong 11.8%

Comprehensive Due Diligence Old National Diligence Summary 1 ~3,400 Files posted to virtual data room and reviewed by ONB due diligence team 20+ External participants, including consultants and advisors 75+ ONB internal Participants By The Numbers 100% Bremer consumer loans reviewed or modeled ~1,200 Individual Bremer commercial loans were reviewed (70% of commercial exposure) • Management and employees have significant acquisition and integration experience ○ Old National management team has successfully completed and integrated 9 bank M&A transactions over the last 10 years ○ Integration process will evaluate and reflect best practices and people at each bank Disciplined & Experienced With M&A • Comprehensive process led by Old National senior leadership team ○ Significant alignment in credit philosophy, approach and risk appetite ○ Strong risk and compliance culture throughout each organization • Detailed review of both companies’ cost structure and expected synergies • Extensive credit due diligence performed, including thorough loan file review to assess risk appetite, underwriting practices, loan administration and risk rating accuracy Thorough Due Diligence Process 11 Operations Facilities Diligence Focus Credit Commercial & Treasury Management Community Banking Wealth Human Resources Information Technology Balance Sheet, Liquidity and Capital Vendor Management Legal, Audit, Risk and Compliance Finance, Tax & Accounting Source: ONB management. 1. Amounts and percentages are approximated.
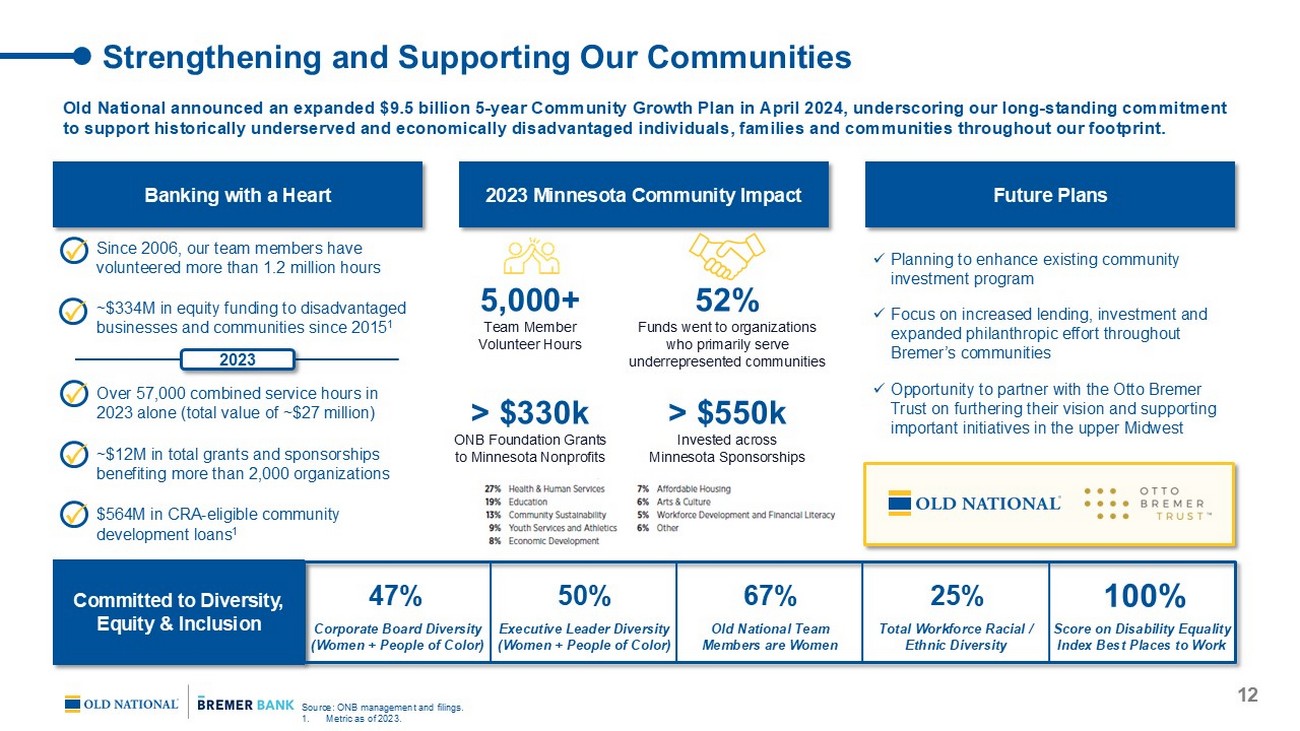
12 Strengthening and Supporting Our Communities Old National announced an expanded $9.5 billion 5 - year Community Growth Plan in April 2024, underscoring our long - standing commi tment to support historically underserved and economically disadvantaged individuals, families and communities throughout our footp rin t. Committed to Diversity, Equity & Inclusion 47% 50% 67% 25% 100% Corporate Board Diversity (Women + People of Color) Executive Leader Diversity (Women + People of Color) Old National Team Members are Women Total Workforce Racial / Ethnic Diversity Score on Disability Equality Index Best Places to Work 2023 Minnesota Community Impact Future Plans x Planning to enhance existing community investment program x Focus on increased lending, investment and expanded philanthropic effort throughout Bremer’s communities x Opportunity to partner with the Otto Bremer Trust on furthering their vision and supporting important initiatives in the upper Midwest Banking with a Heart > $330k ONB Foundation Grants to Minnesota Nonprofits > $550k Invested across Minnesota Sponsorships 5,000+ Team Member Volunteer Hours 52% Funds went to organizations who primarily serve underrepresented communities Since 2006, our team members have volunteered more than 1.2 million hours ~$334M in equity funding to disadvantaged businesses and communities since 2015 1 Over 57,000 combined service hours in 2023 alone (total value of ~$27 million) ~$12M in total grants and sponsorships benefiting more than 2,000 organizations $564M in CRA - eligible community development loans 1 Source: ONB management and filings. 1. Metric as of 2023. 2023

Creating Value For All Stakeholders 1 Attractive Pro Forma Scale and Profitability & Well - Positioned for Continued Outperformance ~22% 2026E EPS Accretion 2.0yrs Crossover TBVPS Earnback 18.4% ROATCE Top Quartile Profitability ~10.2% CET1 Robust Capital ~160bps Expected CET1 Growth in 18 Months Branches 359 Gross Loans $46B Deposits $54B 13 Source: S&P Capital IQ, ONB filings and management and Bremer fillings . Financial data as of the quarter ended September 30, 2024 unless otherwise specified . Branch data as of June 30, 2024. 1. Pro forma impact is presented for illustrative purposes only. Inclusive of all purchase accounting adjustments, merger cos ts, CECL provision expense, sale of CRE loans and common equity offering. See disclaimer "Pro Forma Forward - Looking Data" and slide 8 and 17 for key financial assumptions. See appendix for Pro Forma EPS reconciliation. 2. Based on September 30, 2024 balances for illustrative purposes. 3. Includes impact from CRE loan sale. There can be no assurance that we will be able to find a prospective purchaser for the CRE loan sale concurrent with the merg er or to sell the loans at a price or other terms acceptable to us. 4. Earnback period calculation is based on crossover method. 4 Total Assets $70B AUM $39B 3 Pro Forma Scale 2
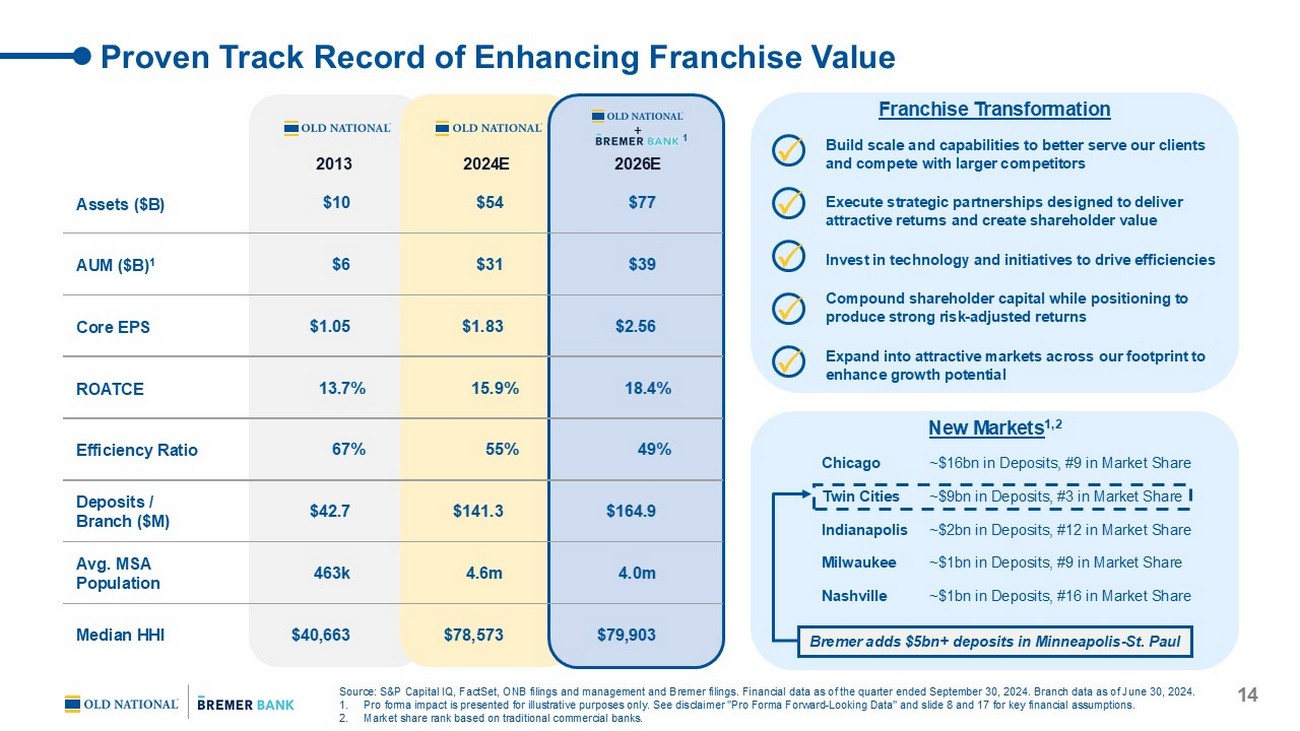
Assets ($B) AUM ($B) 1 Core EPS Efficiency Ratio Deposits / Branch ($M) Avg. MSA Population Median HHI Proven Track Record of Enhancing Franchise Value 2013 2024E 2026E + Source: S&P Capital IQ, FactSet, ONB filings and management and Bremer filings. Financial data as of the quarter ended Septem ber 30, 2024. Branch data as of June 30, 2024. 1. Pro forma impact is presented for illustrative purposes only. See disclaimer "Pro Forma Forward - Looking Data" and slide 8 and 17 for key financial assumptions. 2. Market share rank based on traditional commercial banks. 14 Build scale and capabilities to better serve our clients and compete with larger competitors Execute strategic partnerships designed to deliver attractive returns and create shareholder value Invest in technology and initiatives to drive efficiencies Compound shareholder capital while positioning to produce strong risk - adjusted returns Expand into attractive markets across our footprint to enhance growth potential New Markets 1,2 Twin Cities Indianapolis Milwaukee Nashville Chicago ~$16bn in Deposits, #9 in Market Share ~$9bn in Deposits, #3 in Market Share ~$2bn in Deposits, #12 in Market Share ~$1bn in Deposits, #9 in Market Share ~$1bn in Deposits, #16 in Market Share Franchise Transformation ROATCE $10 $54 $77 $6 $31 $39 $1.05 $1.83 $2.56 13.7% 15.9% 18.4% 67% 55% 49% $42.7 $141.3 $164.9 463k 4.6m 4.0m $40,663 $78,573 $79,903 1 Bremer adds $5bn+ deposits in Minneapolis - St. Paul

Appendix

$57 $71 $73 $82 $105 2019 2020 2021 2022 2023 The Otto Bremer Trust will own ~11% 1 of Old National and appoint one Trustee to its Board A Long - Term Shareholder & Partnership for Good 16 • The Otto Bremer Trust is a private charitable trust based in St. Paul, Minnesota • 501(C)(3) tax - exempt organization that has owned 86% or more of Bremer for 80+ years • Chartable Focus Areas: Basic Needs, Community Asset Building, Health & Well Being, Restorative & Emergency Services Over $1 Billion of Community Investments 2023 Investment Highlights Minnesota ~$61mm 638 Grants & PRIs 2 Montana ~$12mm 124 Grants & PRIs 2 North Dakota ~$8mm 85 Grants Wisconsin ~$24mm 290 Grants & PRIs 2 ($M) Source: Otto Bremer Trust press releases . 1. Pro forma ownership assumes common equity raise base offering of $400M at $21.00, full exercise of 15% greenshoe and full phy sic al settlement for illustrative purposes. 2. Program related investments (PRIs).

Key Financial Assumptions 17 17 Earnings ONB projections based on Wall Street consensus estimates Bremer projections based on ONB management’s estimates following extensive due diligence (~0.85% run - rate ROAA) Source: S&P Capital IQ, FactSet, ONB filings and management and Bremer fillings . Financial data as of the quarter ended September 30, 2024 . Note: Fair value marks reflect pre - tax figures. 1. All balance sheet marks are preliminary subject to change. 2. There can be no assurance that we will be able to find a prospective purchaser for the CRE loan sale concurrent with the merg er or to sell the loans at a price or other terms acceptable to us. Synergies & Merger Costs Cost savings of ~30% of Bremer’s 2025E noninterest expense (~$111 million pre - tax) – 25% realized in 2025 and 100% in 2026 and thereafter Revenue synergies expected but not included ~$194 million pre - tax one - time merger expenses (fully - reflected in pro forma tangible book value estimate at closing) Intangibles Core deposit intangible of $479 million, or 4.0% of non - time deposits; amortized sum - of - years digits over 10 years Customer relationship intangible of $20 million; amortized sum - of - years digits over 13 years Loan Fair Value Marks 1 Gross credit mark of $190 million or ~1.6% of Bremer’s gross loans (equivalent to 1.8x existing reserves) Credit mark allocated ~60% PCD and ~40% non - PCD Non - PCD credit mark accreted into earnings over 7 years using sum - of - the - years digits Reserve for non - PCD loans and unfunded commitments established on Day 2 (reflected in pro forma TBV at closing) $585 million interest rate mark; accreted over 7 years using sum - of - the - years digits Other Fair Value Marks Securities mark of $384 million (in addition to AOCI losses); accreted over 5 years using straight line method Write - up of $18 million on interest - bearing liabilities; accreted over 2.5 years using straight line method CRE Loan Sale 2 Up to ~$2.4 billion CRE loans expected to be sold post - close Maintains CRE / TRBC ratio below 250%

28% 15% 44% 9% 3% 23% 20% 39% 12% 5% Pro Forma Deposit Composition $ 40.8B $13.2B $54.1B Source: S&P Capital IQ, ONB filings and management and Bremer filings . Financial data as of the quarter ended September 30, 2024 . Total may not sum to 100 due to rounding. Pro forma impact is presented for illustrative purposes only. See disclaimer "Pro Forma Forward - Looking Data" and slide 8 and 17 for key financial assumptions. Q3‘24 Cost of Deposits: 2.25% Q3‘24 Cost of Deposits: 2.33% Q3‘24 Cost of Deposits: 2.26% Pro Forma Non - Int. Demand NOW & Other Trans. MMDAs & Savings Retail Time Jumbo Time Non - Int. Demand NOW & Other Trans. MMDAs & Savings Retail Time Jumbo Time Non - Int. Demand NOW & Other Trans. MMDAs & Savings Retail Time Jumbo Time 18

6% 18% 10% 13% 17% 16% 10% 8% 7% 24% 11% 13% 15% 23% 4% Pro Forma Loan Composition $36.4B $11.5B $45.6B Pro Forma Q3‘24 Yield: 6.36% Q3‘24 Yield: 5.84% Q3‘24 Yield: 6.23% C LD Multifamily OO CRE C&I 1 - 4 Family Other Consumer Agriculture C LD Multifamily OO CRE C&I Other Consumer Agriculture C LD Multifamily OO CRE C&I Other Consumer Agriculture Investor CRE 2 Source: S&P Capital IQ, ONB filings and management and Bremer fillings. Financial data as of the quarter ended September 30, 202 4. Total may not sum to 100 due to rounding. Pro forma impact is presented for illustrative purposes only. Does not include purchase accounting adjustments. See disclaime r " Pro Forma Forward - Looking Data" and slides 8 and 17 for key financial assumptions. 1. Loan total and composition include impact from CRE loan sale. There can be no assurance that we will be able to find a prospective purchaser for the CRE loan sale concurrent with the merger or to sell the loans at a price or other terms acceptable to us. 2. Includes state, political and municipal loans. 1 - 4 Family 1 - 4 Family Investor CRE Investor CRE 19 1

0.07% 0.06% 0.11% ONB Barley Regional Banks 0.11% 0.16% 0.16% ONB Barley Regional Banks History of Strong Credit Quality Both franchises have a history of strong credit performance driven by a conservative approach to risk 15yr Cumulative NCOs Regional Banks 2 5yr Average Regional Banks 2 YTD 2024 Source: S&P Capital IQ, ONB filings and management and Bremer filings. Financial data as of the quarter ended September 30, 2 024 . 1. Excludes PCD loans with allowance at acquisition. 2. Based on public U.S. banks $20bn - $100bn in total assets. 1 Regional Banks 2 NCOs / Average Loans 20

2026E EPS reconciliation $ millions ONB net income (consensus estimate) $669.0 Bremer net income (ONB management's estimate) 151.6 After-tax transaction adjustments Cost savings $87.7 Rate marks accretion 177.2 Non-PCD credit mark accretion 11.0 Intangible amortization (64.1) Earnings impact from CRE loan sale (34.6) Other adjustments 5.6 ONB pro forma net income $1,003.5 Pro forma average diluted shares outstanding 392.1 Pro forma 2026E EPS $2.56 ONB standalone EPS $2.09 EPS accretion to ONB ($) $0.47 EPS accretion to ONB (%) 22.4% Pro Forma Earnings Per Share Reconciliation Source: S&P Capital IQ, FactSet, ONB filings and management and Bremer filings. Financial data as of the quarter ended Septem ber 30, 2024 . Pro forma impact is presented for illustrative purposes only. See disclaimer "Pro Forma Forward - Looking Data" and slide 8 and 17 for key financial assumptions. 1. Based on 2026E median consensus estimates. 2. There can be no assurance that we will be able to find a prospective purchaser for the CRE loan sale concurrent with the merg er or to sell the loans at a price or other terms acceptable to us. 21 1 2

Basic shares Tangible book value per share build to close $ millions (millions) $ Per share ONB tangible book value as of 9/30/24 $3,818 319 $11.97 (+) Three quarters of consensus earnings prior to close 453 ( – ) Three quarters of dividends prior to close (134) (+) Amortization of existing intangibles 22 ONB standalone tangible book value per share at close $4,160 319 $13.04 Pro forma merger adjustments ONB standalone tangible book value at close $4,160 319 $13.04 (+) Common equity issued as consideration 1,086 50 (+) Third-party equity issuance 442 22 (–) Goodwill & intangibles created (885) (–) Restructuring charges (153) (–) Day 2 CECL provision for non-PCD loans (60) (–) Day 2 provision for unfunded comittments (4) ONB pro forma tangible book value per share at close $4,587 391 $11.73 TBVPS dilution to ONB ($) ($1.31) TBVPS dilution to ONB (%) (10.1%) Goodwill & other intangible asset recognition $ millions Merger consideration $1,401 Bremer tangible book value at close 1,443 (–) Fair value adjustments (pre-tax) (1,064) (+) Net DTA / (DTL) from fair value adjustments 263 Adjusted tangible book value at closing $641 Excess over adjusted tangible book value $760 (–) Core deposit intangibles created (479) (–) Client relationship intangibles created (20) (+) DTL on intangibles created 125 Goodwill created $385 Purchase Accounting Summary Source: S&P Capital IQ, FactSet, ONB filings and management and Bremer filings . Financial data as of the quarter ended September 30, 2024 . Note: Based on assumptions as of announcement date; subject to change at transaction closing. Pro forma impact is presented f or illustrative purposes only. See disclaimer "Pro Forma Forward - Looking Data" and slide 8 and 17 for key financial assumptions. See disclaimer "Non - GAAP Financial Measures." 1. Old National tangible book value equal to common shareholders equity less goodwill and other intangible assets. 2. Assumes common equity raise base offering of $400 M at $21.00, net of underwriting spread, full exercise of 15% greenshoe and full physical settlement for illustrative purposes. 1 22 2

Non - GAAP Reconciliation Source: S&P Capital IQ, FactSet, ONB filings and management and Bremer management. Financial data as of the quarter ended Sep tem ber 30, 2024 . 23 $M September 30, 2024 Shareholders' equity $6,367 Less: Preferred equity (244) Shareholders' common equity 6,124 Less: Goodwill and other intangible assets (2,305) Tangible shareholders' common equity $3,818 Common shares outstanding (millions) 319 Tangible common book value per share $11.97 Old National Bremer ONB share price at November 22, 2024 $21.65 Price / tangible book value per share 1.81x $M September 30, 2024 Shareholders' equity $1,516 Less: Goodwill and other intangible assets (113) Tangible shareholders' common equity $1,403 Common shares outstanding (millions) 12 Tangible common book value per share $116.88 Transaction price $1,401 Transaction price / tangible book value 1.00x
