Exhibit 99.1
| Old National Bancorp Investment ThesisFinancial Data as of 12-31-11 Dated: February 17, 2012 |
| Additional Information for Shareholders In connection with the proposed merger, Old National Bancorp will file with the Securities and Exchange Commission a Registration Statement on Form S-4 that will include a Proxy Statement of Indiana Community Bancorp and a Prospectus of Old National Bancorp, as well as other relevant documents concerning the proposed transaction. Shareholders are urged to read the Registration Statement and the Proxy Statement/Prospectus regarding the merger when it becomes available and any other relevant documents filed with the SEC, as well as any amendments or supplements to those documents, because they will contain important information. A free copy of the Proxy Statement/Prospectus, as well as other filings containing information about Old National Bancorp and Indiana Community Bancorp, may be obtained at the SEC's Internet site (http://www.sec.gov). You will also be able to obtain these documents, free of charge, from Old National Bancorp at www.oldnational.com under the tab"Investor Relations" and then under the heading "Financial Information" or from Indiana Community Bancorp by accessing Indiana Community Bancorp's website at www.myindianabank.com under the tab "Shareholder Relations" and then under the heading "Documents."Old National Bancorp and Indiana Community Bancorp and certain of their directors and executive officers may be deemed to be participants in the solicitation of proxies from the shareholders of Indiana Community Bancorp in connection with the proposed merger. Information about the directors and executive officers of Old National Bancorp is set forth in the proxy statement for Old National's 2011 annual meeting of shareholders, as filed with the SEC on a Schedule 14A on March 25, 2011. Information about the directors and executive officers of Indiana Community Bancorp is set forth in the proxy statement for Indiana Community Bancorp's 2011 annual meeting of shareholders, as filed with the SEC on a Schedule 14A on March 22, 2011. Additional information regarding the interests of those participants and other persons who may be deemed participants in the transaction may be obtained by reading the Proxy Statement/Prospectus regarding the proposed merger when it becomes available. Free copies of this document may be obtained as described in the preceding paragraph. |

| Forward-Looking Statement This presentation contains certain forward-looking statements within the meaning of the Private Securities Litigation Reform Act of 1995. These statements include, but are not limited to, descriptions of Old National's financial condition, results of operations, asset and credit quality trends and profitability, and statements about the expected timing, completion, financial benefits and other effects of the proposed merger. Forward-looking statements can be identified by the use of the words "anticipate," "believe," "expect," "intend," "could" and "should," and other words of similar meaning. These forward-looking statements express management's current expectations or forecasts of future events and, by their nature, are subject to risks and uncertainties and there are a number of factors that could cause actual results to differ materially from those in such statements. Factors that might cause such a difference include, but are not limited to; market, economic, operational, liquidity, credit and interest rate risks associated with Old National's business, competition, government legislation and policies (including the impact of the Dodd-Frank Wall Street Reform and Consumer Protection Act and its related regulations), ability of Old National to execute its business plan (including the proposed acquisition of Indiana Community Bancorp), changes in the economy which could materially impact credit quality trends and the ability to generate loans and gather deposits, failure or circumvention of Old National's internal controls, failure or disruption of our information systems, significant changes in accounting, tax or regulatory practices or requirements, new legal obligations or liabilities or unfavorable resolutions of litigations, other matters discussed in this presentation and other factors identified in the Company's Annual Report on Form 10-K and other periodic filings with the Securities and Exchange Commission. These forward-looking statements are made only as of the date of this presentation, and Old National undertakes no obligation to release revisions to these forward-looking statements to reflect events or conditions after the date of this presentation. |
| Non-GAAP Financial Measures These slides contain non-GAAP financial measures. For purposes of Regulation G, a non-GAAP financial measure is a numerical measure of the registrant's historical or future financial performance, financial position or cash flows that excludes amounts, or is subject to adjustments that have the effect of excluding amounts, that are included in the most directly comparable measure calculated and presented in accordance with GAAP in the statement of income, balance sheet or statement of cash flows (or equivalent statements) of the issuer; or includes amounts, or is subject to adjustments that have the effect of including amounts, that are excluded from the most directly comparable measure so calculated and presented. In this regard, GAAP refers to generally accepted accounting principles in the United States. Pursuant to the requirements of Regulation G, Old National Bancorp has provided reconciliations within the slides, as necessary, of the non-GAAP financial measure to the most directly comparable GAAP financial measure. |

| The Old National Distinction Through execution of a sound strategy, ONB is well positioned for the futureStrengthen the risk profileConsistent application of conservative underwriting standards has led to strong loan quality relative to peers (excluding covered loans)4Q11 net charge-offs of .79% vs. 4Q11 peer average of .93%4Q11 loans 90+ days of .03% vs. 3Q11 peer average of .56%Enhance management disciplineDisciplined approach to managing expenses and improving efficiencies company wide has yielded positive resultsStrongly capitalized, liquid balance sheet with the flexibility to take advantage of opportunities in the market place4Q11 tangible common equity of 8.97%Tier 1 capital of 13.5% and total risk-based capital of 15.0%Loan to deposit ratio at 4Q11 of 72.2% vs. 3Q11 peer average of 78.4%Achieve consistent, quality earningsRecent acquisitions along with improving balance sheet mix has lead to expanding net interest margin4Q11 of 4.20% vs. 3Q11 of 3.96% CONSISTENCY |
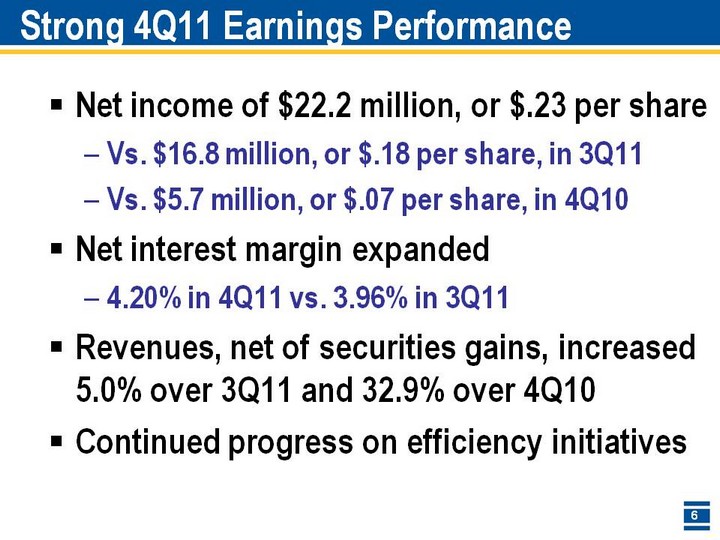
| Strong 4Q11 Earnings Performance Net income of $22.2 million, or $.23 per shareVs. $16.8 million, or $.18 per share, in 3Q11Vs. $5.7 million, or $.07 per share, in 4Q10Net interest margin expanded4.20% in 4Q11 vs. 3.96% in 3Q11Revenues, net of securities gains, increased 5.0% over 3Q11 and 32.9% over 4Q10Continued progress on efficiency initiatives |
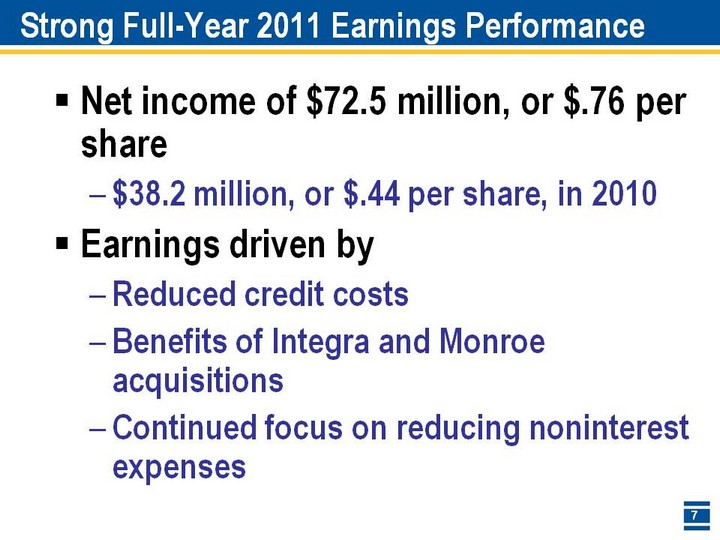
| Strong Full-Year 2011 Earnings Performance Net income of $72.5 million, or $.76 per share$38.2 million, or $.44 per share, in 2010Earnings driven byReduced credit costsBenefits of Integra and Monroe acquisitionsContinued focus on reducing noninterest expenses |
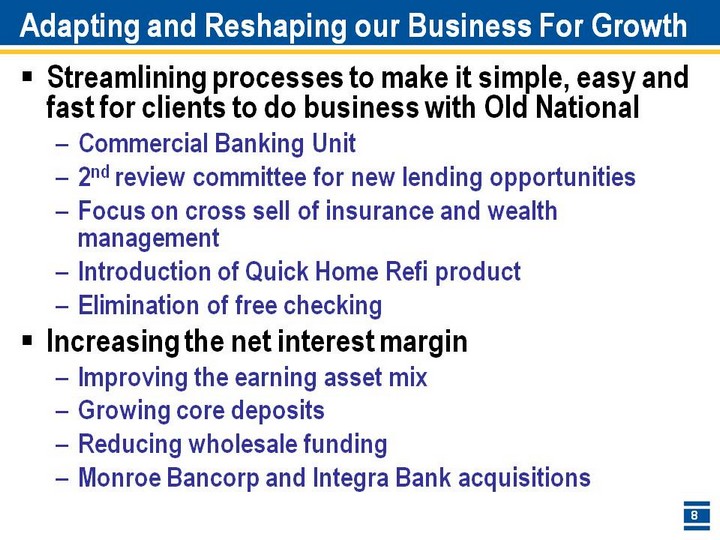
| Adapting and Reshaping our Business For Growth Streamlining processes to make it simple, easy and fast for clients to do business with Old NationalCommercial Banking Unit 2nd review committee for new lending opportunitiesFocus on cross sell of insurance and wealth managementIntroduction of Quick Home Refi productElimination of free checking Increasing the net interest margin Improving the earning asset mixGrowing core depositsReducing wholesale fundingMonroe Bancorp and Integra Bank acquisitions |
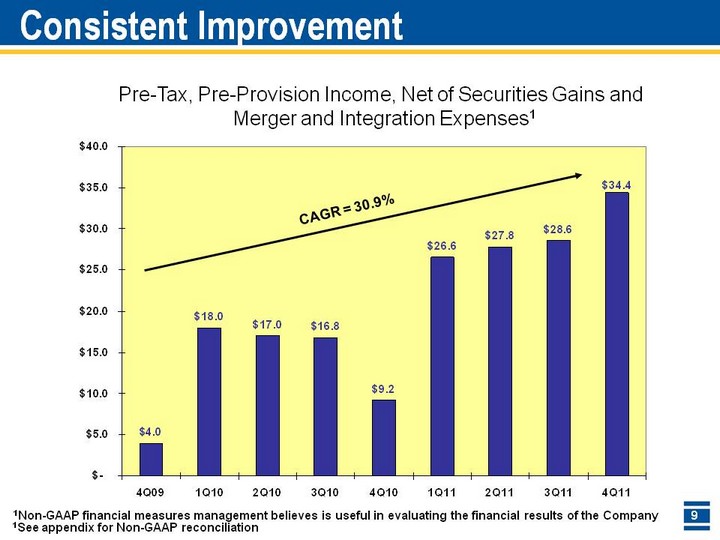
| Consistent Improvement 4Q09 1Q10 2Q10 3Q10 4Q10 1Q11 2Q11 3Q11 4Q11 Pre-Tax, Pre-Provision Income, Net of Securities Gains and Merger and Integration Expenses 4 18 17 16.8 9.2 26.6 27.8 28.6 34.4 1Non-GAAP financial measures management believes is useful in evaluating the financial results of the Company 1 CAGR = 30.9% Pre-Tax, Pre-Provision Income, Net of Securities Gains and Merger and Integration Expenses 1See appendix for Non-GAAP reconciliation |
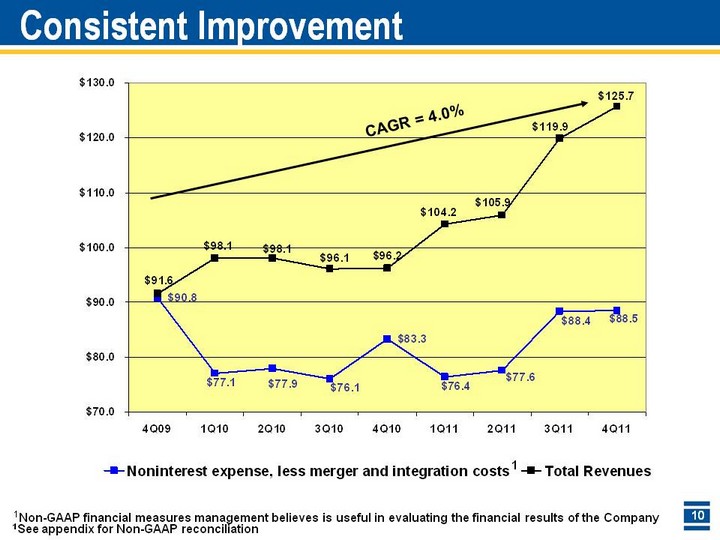
| Consistent Improvement 4Q09 1Q10 2Q10 3Q10 4Q10 1Q11 2Q11 3Q11 4Q11 Noninterest expense, less merger and integration costs 90.8 77.1 77.9 76.1 83.3 76.4 77.6 88.4 88.5 Total Revenues 91.6 98.1 98.1 96.1 96.2 104.2 105.9 119.9 125.7 1Non-GAAP financial measures management believes is useful in evaluating the financial results of the Company 1 CAGR = 4.0% 1See appendix for Non-GAAP reconciliation |
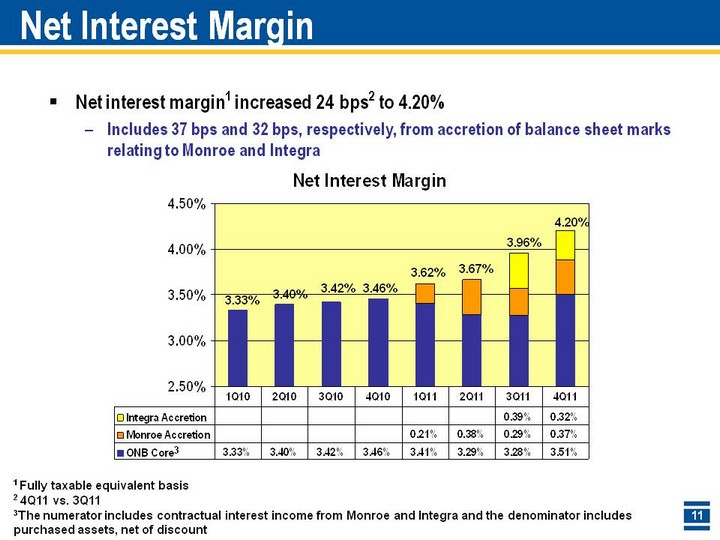
| Net Interest Margin 1Q10 2Q10 3Q10 4Q10 1Q11 2Q11 3Q11 4Q11 ONB Core 0.0333 0.034 0.0342 0.0346 0.0341 0.0329 0.0328 0.0351 Monroe Accretion 0.0021 0.0038 0.0029 0.0037 Integra Accretion 0.0039 0.0032 Net interest margin1 increased 24 bps2 to 4.20%Includes 37 bps and 32 bps, respectively, from accretion of balance sheet marks relating to Monroe and Integra 1 Fully taxable equivalent basis 2 4Q11 vs. 3Q11 3.33% 3.40% 3.42% 3.46% 3.62% 3.67% 3.96% 4.20% 3The numerator includes contractual interest income from Monroe and Integra and the denominator includes purchased assets, net of discount 3 |
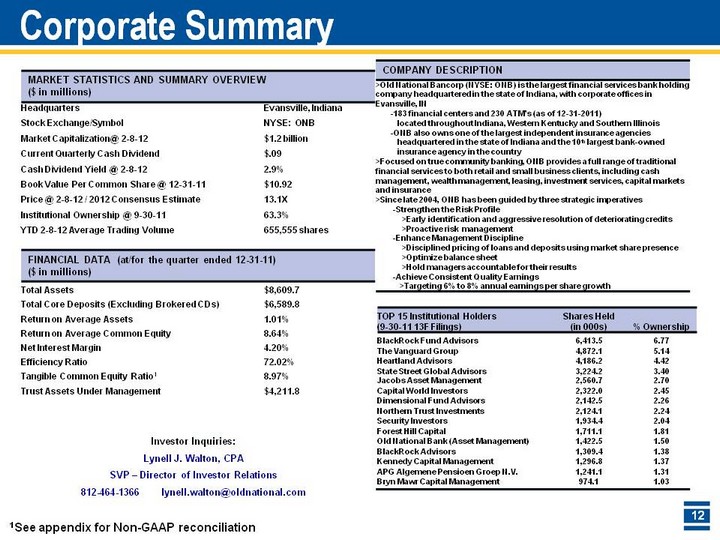
| Corporate Summary Corporate Summary Corporate Summary 1See appendix for Non-GAAP reconciliation Investor Inquiries:Lynell J. Walton, CPASVP - Director of Investor Relations812-464-1366 lynell.walton@oldnational.com 812-464-1366 lynell.walton@oldnational.com 812-464-1366 lynell.walton@oldnational.com 812-464-1366 lynell.walton@oldnational.com 812-464-1366 lynell.walton@oldnational.com |
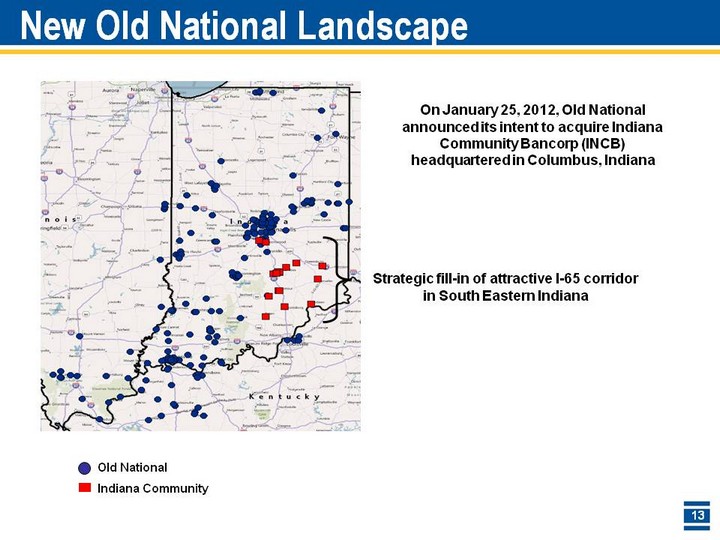
| New Old National Landscape Old NationalIndiana Community Strategic fill-in of attractive I-65 corridor in South Eastern Indiana On January 25, 2012, Old National announced its intent to acquire Indiana Community Bancorp (INCB) headquartered in Columbus, Indiana |
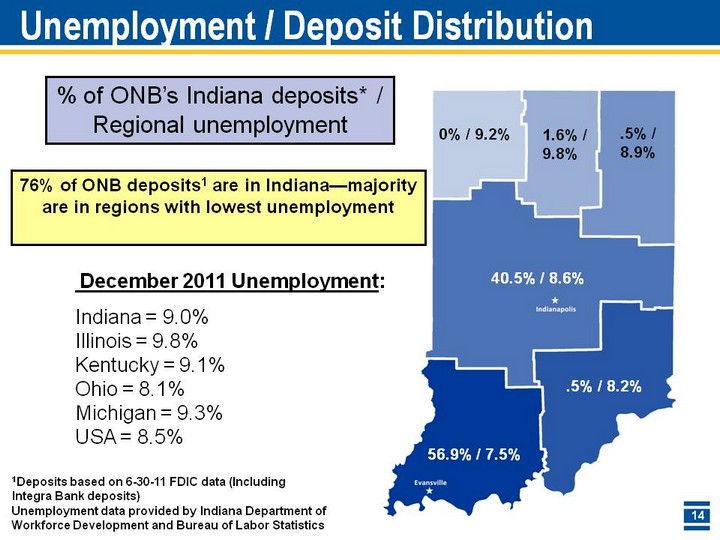
| Unemployment / Deposit Distribution Unemployment / Deposit Distribution 56.9% / 7.5% .5% / 8.9% 1.6% / 9.8% 0% / 9.2% 40.5% / 8.6% .5% / 8.2% % of ONB's Indiana deposits* / Regional unemployment Unemployment data provided by Indiana Department of Workforce Development and Bureau of Labor Statistics December 2011 Unemployment:Indiana = 9.0% Illinois = 9.8% Kentucky = 9.1% Ohio = 8.1% Michigan = 9.3% USA = 8.5% 1Deposits based on 6-30-11 FDIC data (Including Integra Bank deposits) 76% of ONB deposits1 are in Indiana-majority are in regions with lowest unemployment |
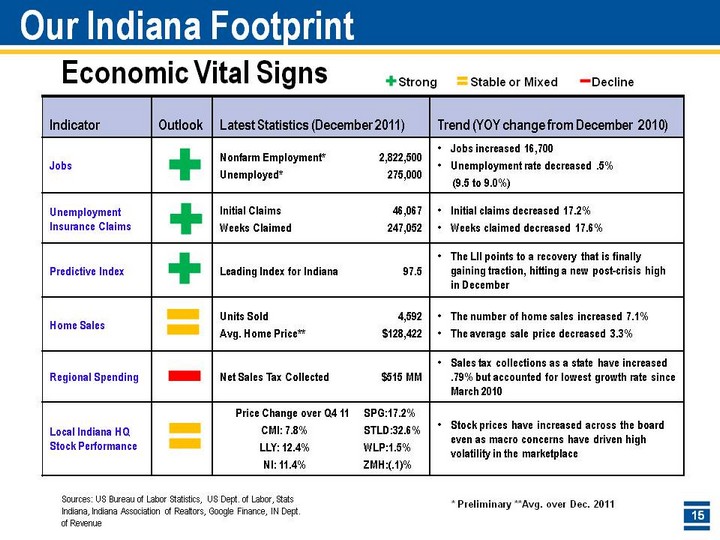
| Our Indiana Footprint Economic Vital Signs Economic Vital Signs * Preliminary **Avg. over Dec. 2011 Strong Stable or Mixed Decline Sources: US Bureau of Labor Statistics, US Dept. of Labor, Stats Indiana, Indiana Association of Realtors, Google Finance, IN Dept. of Revenue |
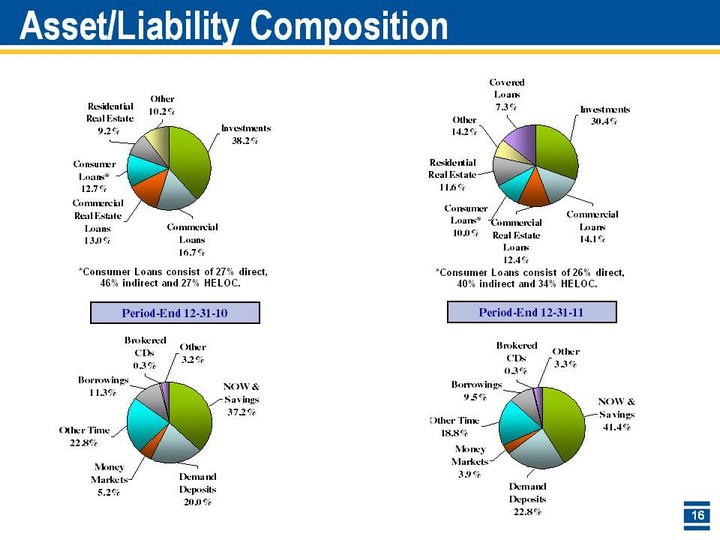
| Asset/Liability Composition Investments Commercial Loans Commercial Real Estate Loans Consumer Loans* Residential Real Estate Other Asset 0.38197 0.16677 0.12974 0.12733 0.09203 0.10216 NOW & Savings Demand Deposits Money Markets Other Time Borrowings Brokered CDs Other Liability 0.4144 0.2282 0.039 0.1882 0.0946 0.0029 0.0329 Investments Commercial Loans Commercial Real Estate Loans Consumer Loans* Residential Real Estate Covered Loans Other Asset 0.3044 0.1413 0.124 0.1001 0.1161 0.0728 0.1414 *Consumer Loans consist of 27% direct, 46% indirect and 27% HELOC. Period-End 12-31-10 *Consumer Loans consist of 26% direct, 40% indirect and 34% HELOC. Period-End 12-31-11 NOW & Savings Demand Deposits Money Markets Other Time Borrowings Brokered CDs Other Liability 0.37224 0.19984 0.05243 0.22787 0.11278 0.00316 0.03167 |
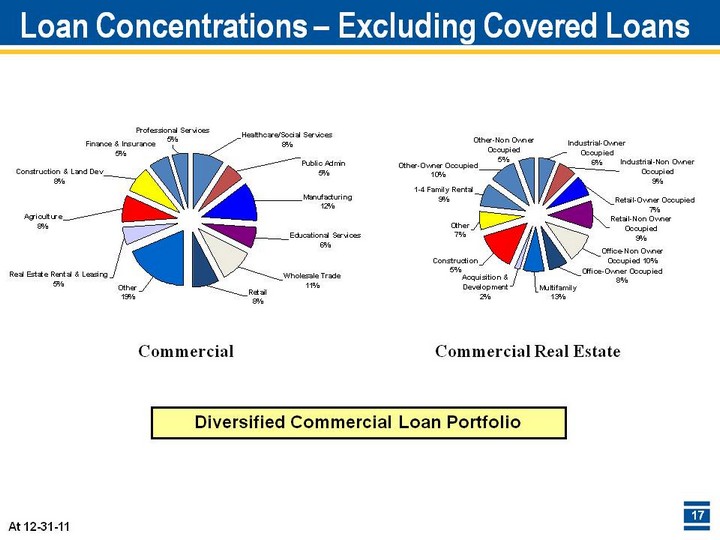
| Loan Concentrations - Excluding Covered Loans At 12-31-11 Commercial Commercial Real Estate Diversified Commercial Loan Portfolio |
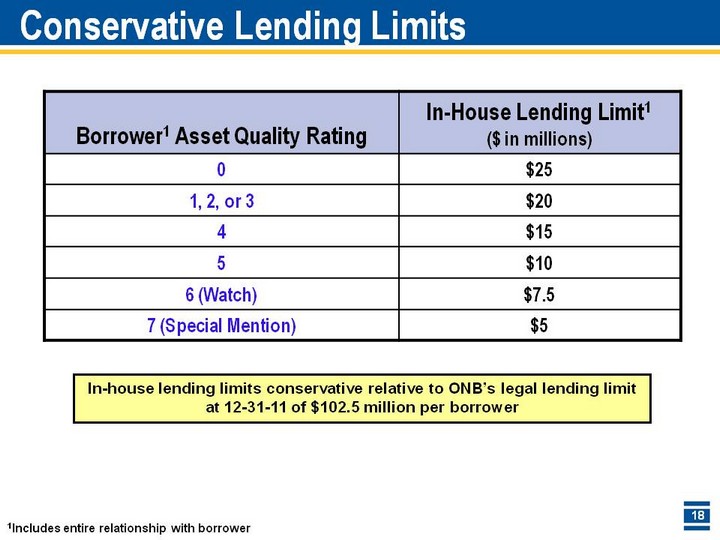
| Conservative Lending Limits Conservative Lending Limits In-house lending limits conservative relative to ONB's legal lending limit at 12-31-11 of $102.5 million per borrower 1Includes entire relationship with borrower |
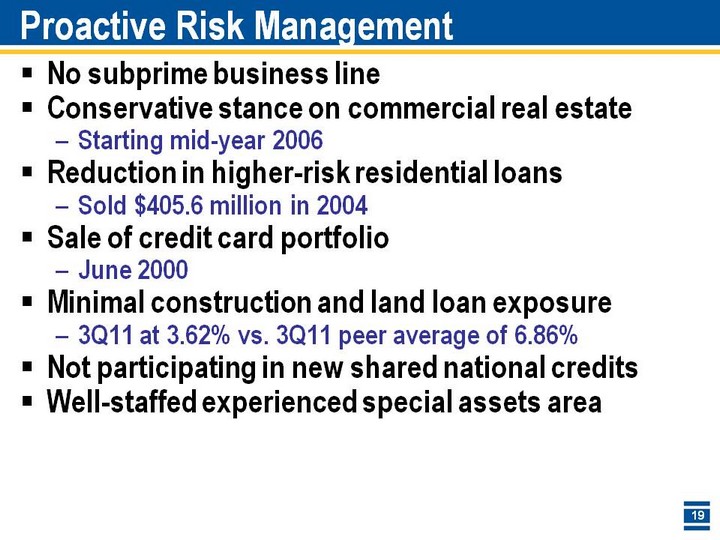
| Proactive Risk Management No subprime business lineConservative stance on commercial real estateStarting mid-year 2006Reduction in higher-risk residential loansSold $405.6 million in 2004Sale of credit card portfolioJune 2000Minimal construction and land loan exposure3Q11 at 3.62% vs. 3Q11 peer average of 6.86%Not participating in new shared national creditsWell-staffed experienced special assets area |
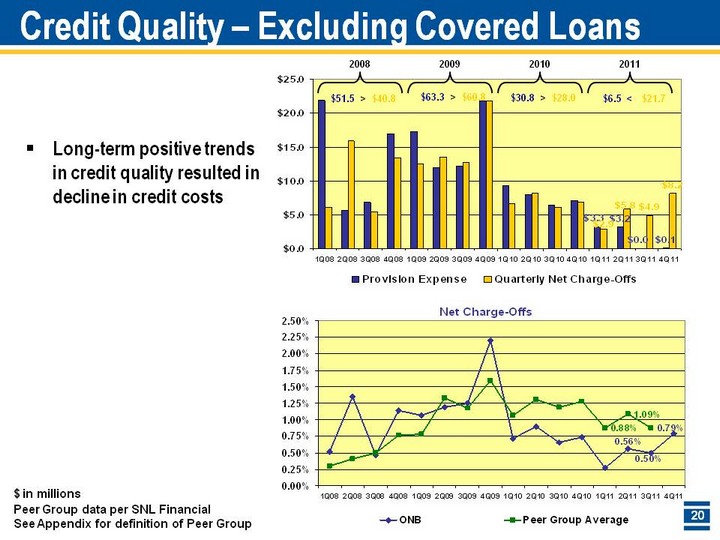
| 1Q08 2Q08 3Q08 4Q08 1Q09 2Q09 3Q09 4Q09 1Q10 2Q10 3Q10 4Q10 1Q11 2Q11 3Q11 4Q11 Provision Expense 21.9 5.7 6.8 17 17.3 12 12.2 21.8 9.3 8 6.4 7.1 3.3 3.2 0 0.1 Quarterly Net Charge-Offs 6.1 15.9 5.5 13.4 12.6 13.6 12.7 21.8 6.7 8.2 6.1 6.9 2.9 5.8 4.9 8.2 2008 2009 2010 $40.8 $60.8 $28.0 $51.5 > $63.3 > $30.8 > $ in millions Long-term positive trends in credit quality resulted in decline in credit costs 1Q08 2Q08 3Q08 4Q08 1Q09 2Q09 3Q09 4Q09 1Q10 2Q10 3Q10 4Q10 1Q11 2Q11 3Q11 4Q11 ONB 0.0052 0.0135 0.0047 0.0114 0.0107 0.0119 0.0125 0.022 0.0072 0.009 0.0066 0.0074 0.0027 0.0056 0.005 0.0079 Peer Group Average 0.003 0.0041 0.005 0.0077 0.0078 0.0133 0.0118 0.0159 0.0107 0.0131 0.0119 0.0128 0.0088 0.0109 0.0088 Peer Group data per SNL Financial See Appendix for definition of Peer Group Credit Quality - Excluding Covered Loans 2011 $21.7 $6.5 < |
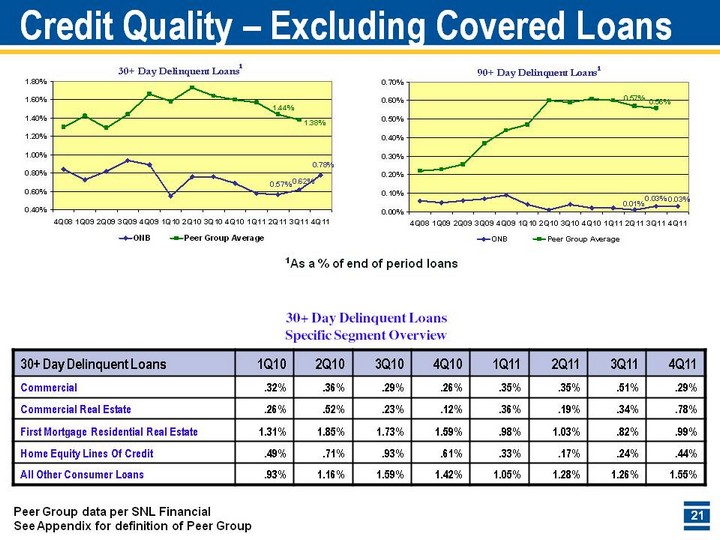
| Credit Quality - Excluding Covered Loans 30+ Day Delinquent Loans Specific Segment Overview Specific Segment Overview Specific Segment Overview 1As a % of end of period loans Peer Group data per SNL Financial See Appendix for definition of Peer Group 4Q08 1Q09 2Q09 3Q09 4Q09 1Q10 2Q10 3Q10 4Q10 1Q11 2Q11 3Q11 4Q11 ONB 0.0084 0.0073 0.0082 0.0094 0.0089 0.0055 0.0076 0.0076 0.0069 0.0058 0.0057 0.0062 0.0078 Peer Group Average 0.013 0.0142 0.0129 0.0144 0.0166 0.0158 0.0173 0.0164 0.016 0.0157 0.0144 0.0138 4Q08 1Q09 2Q09 3Q09 4Q09 1Q10 2Q10 3Q10 4Q10 1Q11 2Q11 3Q11 4Q11 ONB 0.0006 0.0005 0.0006 0.0007 0.0009 0.0004 0.0001 0.0004 0.0002 0.0002 0.0001 0.0003 0.0003 Peer Group Average 0.0022 0.0023 0.00256 0.0037 0.0044 0.0047 0.006 0.0059 0.0061 0.006 0.0057 0.0056 |
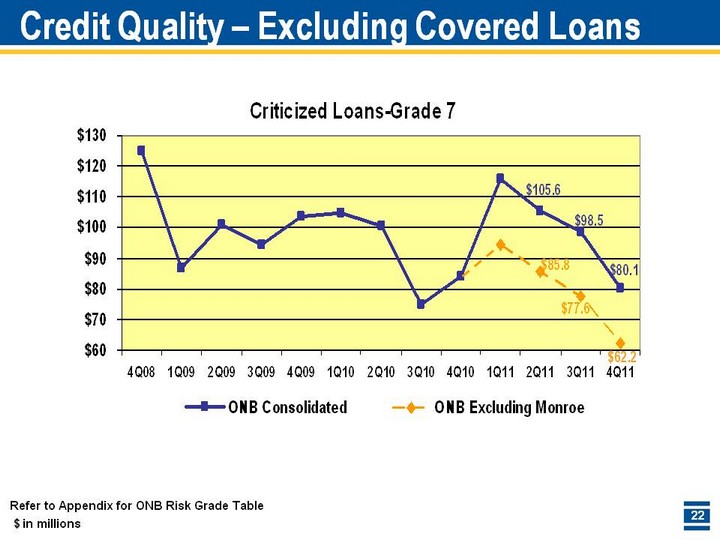
| 4Q08 1Q09 2Q09 3Q09 4Q09 1Q10 2Q10 3Q10 4Q10 1Q11 2Q11 3Q11 4Q11 ONB Consolidated 124.855 86.587 101.019 94.607 103.5 104.861 100.652 75 84 115.8 105.6 98.5 80.1 ONB Excluding Monroe 94.6 85.8 77.6 62.2 $ in millions Refer to Appendix for ONB Risk Grade Table Credit Quality - Excluding Covered Loans |

| 4Q08 1Q09 2Q09 3Q09 4Q09 1Q10 2Q10 3Q10 4Q10 1Q11 2Q11 3Q11 4Q11 ONB Consolidated 116.1 122.4 113.6 101 90.1 92.4 88.8 101 103.4 102 110.9 101.6 88.8 ONB Excluding Monroe 83 98.7 90.6 79.3 $ in millions Refer to Appendix for ONB Risk Grade Table Credit Quality - Excluding Covered Loans |
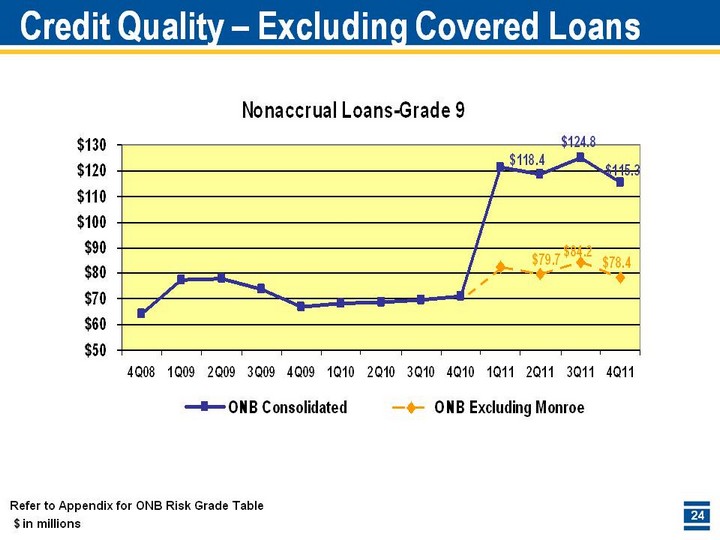
| 4Q08 1Q09 2Q09 3Q09 4Q09 1Q10 2Q10 3Q10 4Q10 1Q11 2Q11 3Q11 4Q11 ONB Consolidated 64 77.4 77.7 73.7 67 68.1 68.86 69.8 70.9 121.4 118.4 124.8 115.3 ONB Excluding Monroe 82.4 79.7 84.2 78.4 $ in millions Refer to Appendix for ONB Risk Grade Table Credit Quality - Excluding Covered Loans |
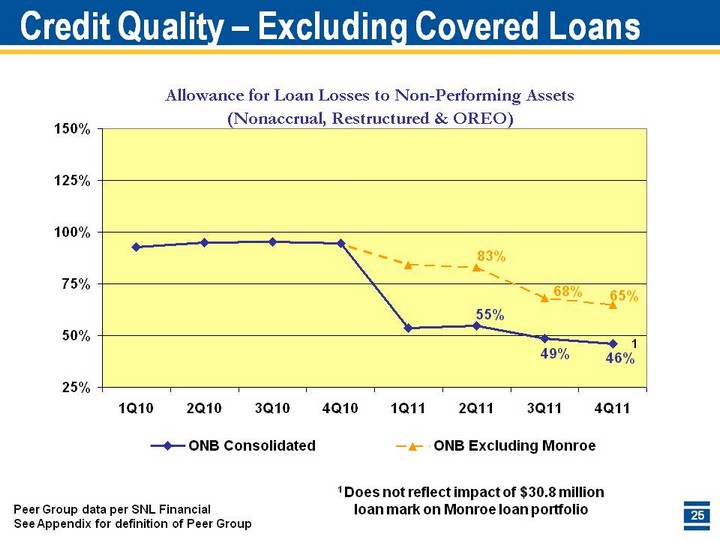
| 1Q10 2Q10 3Q10 4Q10 1Q11 2Q11 3Q11 4Q11 ONB Consolidated 0.9273 0.9477 0.9527 0.9448 0.5366 0.547 0.486 0.4615 ONB Excluding Monroe 0.84 0.83 0.68 0.65 Peer Group data per SNL Financial See Appendix for definition of Peer Group Credit Quality - Excluding Covered Loans 1 Does not reflect impact of $30.8 million loan mark on Monroe loan portfolio 1 |
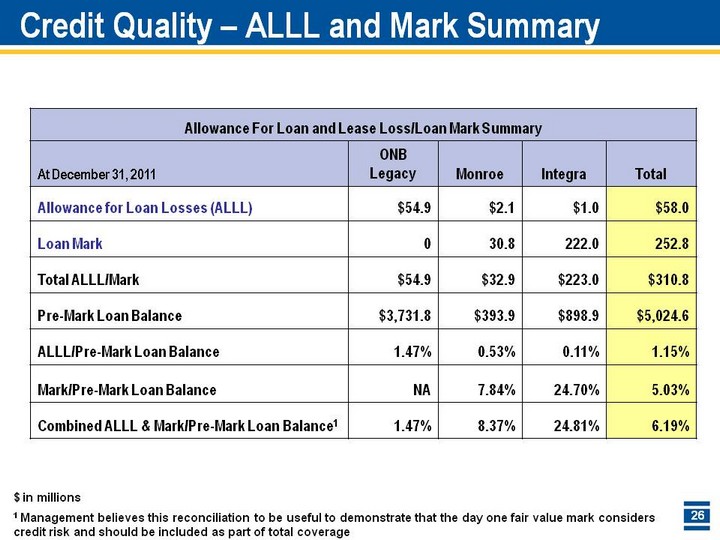
| Credit Quality - ALLL and Mark Summary Credit Quality - ALLL and Mark Summary $ in millions 1 Management believes this reconciliation to be useful to demonstrate that the day one fair value mark considers credit risk and should be included as part of total coverage |
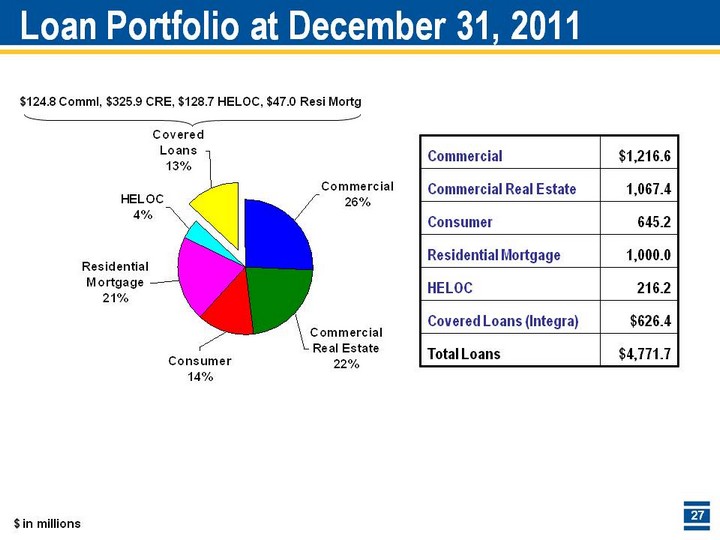
| Loan Portfolio at December 31, 2011 Commercial Commercial Real Estate Consumer Residential Mortgage HELOC Covered Loans 3Q11 1245.5 1072.3 645.2 1000.4 225.1 626.4 MSGraph.Chart.8 $124.8 Comml, $325.9 CRE, $128.7 HELOC, $47.0 Resi Mortg $ in millions |
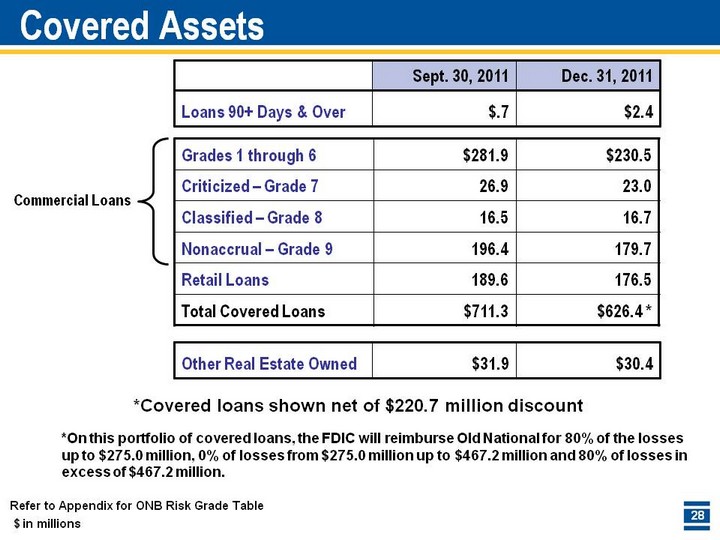
| Covered Assets Covered Assets Covered Assets $ in millions Refer to Appendix for ONB Risk Grade Table Refer to Appendix for ONB Risk Grade Table *Covered loans shown net of $220.7 million discount Commercial Loans *On this portfolio of covered loans, the FDIC will reimburse Old National for 80% of the losses up to $275.0 million, 0% of losses from $275.0 million up to $467.2 million and 80% of losses in excess of $467.2 million. |
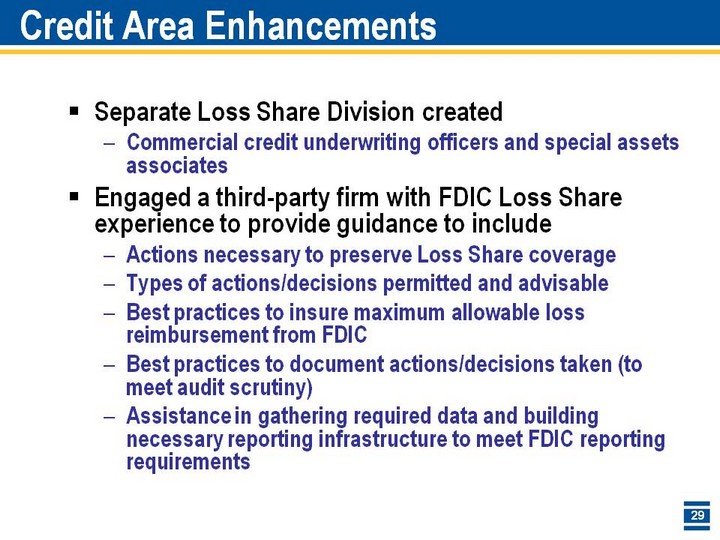
| Credit Area Enhancements Separate Loss Share Division createdCommercial credit underwriting officers and special assets associatesEngaged a third-party firm with FDIC Loss Share experience to provide guidance to includeActions necessary to preserve Loss Share coverageTypes of actions/decisions permitted and advisableBest practices to insure maximum allowable loss reimbursement from FDICBest practices to document actions/decisions taken (to meet audit scrutiny)Assistance in gathering required data and building necessary reporting infrastructure to meet FDIC reporting requirements |
| Credit Area Enhancements Separate staff allowsFocus on FDIC requirements in workout (and currently performing) to maximize Loss Share benefitsSeparation of Loss Share bank efforts from legacy portfolio credit administration to insure we don't diminish strong underwriting practices and management of risk in existing portfolio |
| Capital Management - Recent Actions Approved share repurchase program 1-26-12Up to 2.0 million shares of ONB common stockEnds 1-31-13Approved 28.6% increase in cash dividend to $.09 from $.07 per common shareRetirement of $150 million of 6.75% subordinated bank notes on 10-17-11Strong capital position allows ONB to prudently take advantage of opportunities as a result of market disruption and the difficult economic climate |

| Strong Capital Position 4Q09 1Q10 2Q10 3Q10 4Q10 1Q11 2Q11 3Q11 4Q11 ONB 0.1244 0.1304 0.1398 0.1458 0.145 0.1408 0.1482 0.1342 0.1446 Peer Group Average 0.0989 0.11 0.1133 0.1158 0.1144 0.1169 0.1179 0.1194 ONB Guideline 0.09 0.09 0.09 0.09 0.09 0.09 0.09 0.09 0.09 Capital levels remain strong following the acquisition of Integra BankAmong the best capitalized in our peer groupStrong capital supports future growth 4Q09 1Q10 2Q10 3Q10 4Q10 1Q11 2Q11 3Q11 4Q11 ONB 0.0825 0.0862 0.0903 0.0958 0.0968 0.0912 0.0952 0.084 0.0897 Peer Group Average 0.071 0.0775 0.0783 0.0795 0.0789 0.0802 0.0811 0.0819 ONB Guideline 0.06 0.06 0.06 0.06 0.06 0.06 0.06 0.06 0.06 Peer Group data per SNL Financial See Appendix for definition of Peer Group and Non-GAAP reconciliation |

| Investment Portfolio Investment Portfolio *Includes market value for both available for sale and held to maturity securities |
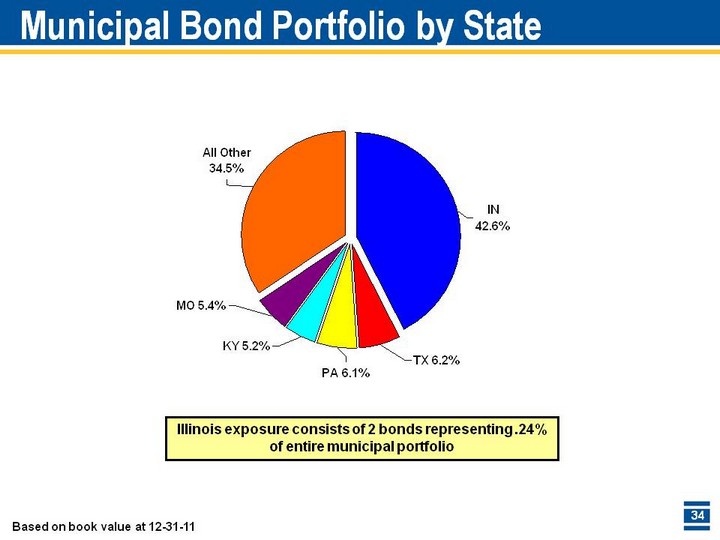
| Municipal Bond Portfolio by State IN TX PA KY MO All Other 0.426 0.062 0.061 0.052 0.054 0.345 Based on book value at 12-31-11 Illinois exposure consists of 2 bonds representing .24% of entire municipal portfolio |

| M&A Strategy Branch acquisition FDIC assisted transaction Whole bank purchase Must enhance Old National's mission of being a true "community bank" Must align both strategically and culturally Must meet/exceed financial targets Must pass rigorous due diligence process |
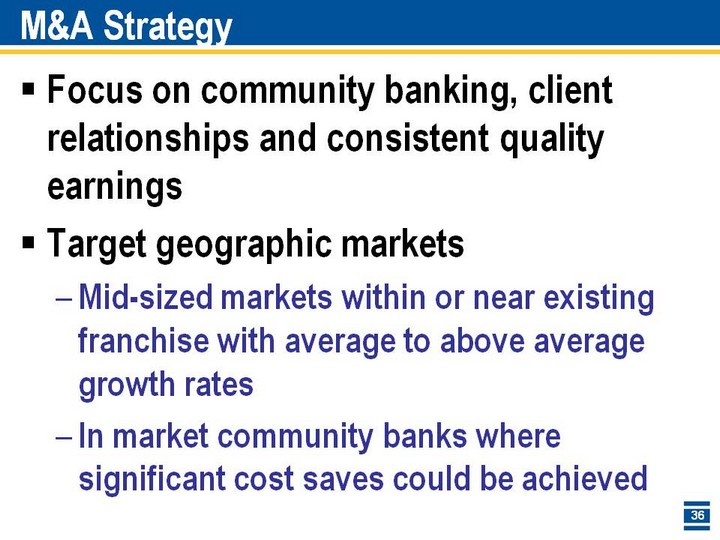
| M&A Strategy Focus on community banking, client relationships and consistent quality earningsTarget geographic marketsMid-sized markets within or near existing franchise with average to above average growth ratesIn market community banks where significant cost saves could be achieved |

| ONB Acquired Monroe Bancorp Transaction closed 1-1-11Provides #1 market share in Monroe County (Bloomington, Indiana)Home to Indiana UniversityMarket has above-average growth rates and lower unemployment vs. state of IndianaSystems conversion occurred 5-14-11Balance sheet acquired1$419.4 million in total loans$574.0 million in total deposits15 branch locationsConsolidated 6 locations at conversion date203 associates 1Balances at 3-31-11 |
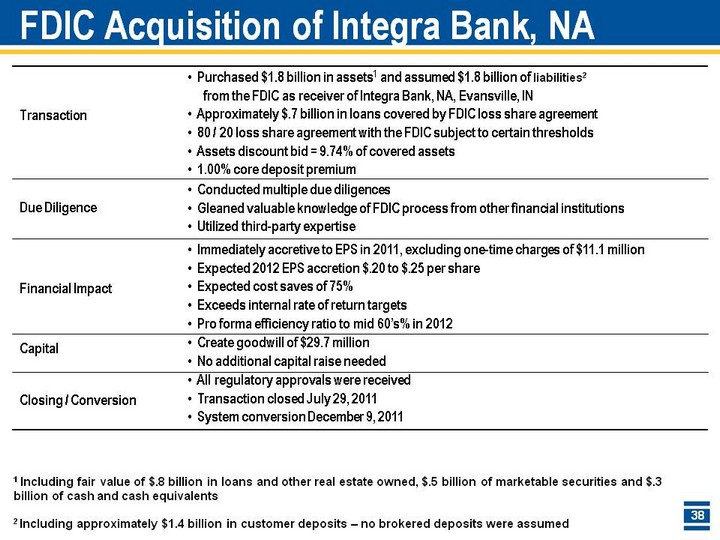
| FDIC Acquisition of Integra Bank, NA Transaction Due DiligenceFinancial ImpactCapitalClosing / Conversion Purchased $1.8 billion in assets1 and assumed $1.8 billion of liabilities2 from the FDIC as receiver of Integra Bank, NA, Evansville, IN Approximately $.7 billion in loans covered by FDIC loss share agreement 80 / 20 loss share agreement with the FDIC subject to certain thresholds Assets discount bid = 9.74% of covered assets 1.00% core deposit premium Conducted multiple due diligences Gleaned valuable knowledge of FDIC process from other financial institutions Utilized third-party expertise Immediately accretive to EPS in 2011, excluding one-time charges of $11.1 million Expected 2012 EPS accretion $.20 to $.25 per share Expected cost saves of 75% Exceeds internal rate of return targets Pro forma efficiency ratio to mid 60's% in 2012 Create goodwill of $29.7 million No additional capital raise needed All regulatory approvals were received Transaction closed July 29, 2011 System conversion December 9, 2011 1 Including fair value of $.8 billion in loans and other real estate owned, $.5 billion of marketable securities and $.3 billion of cash and cash equivalents 2 Including approximately $1.4 billion in customer deposits - no brokered deposits were assumed |
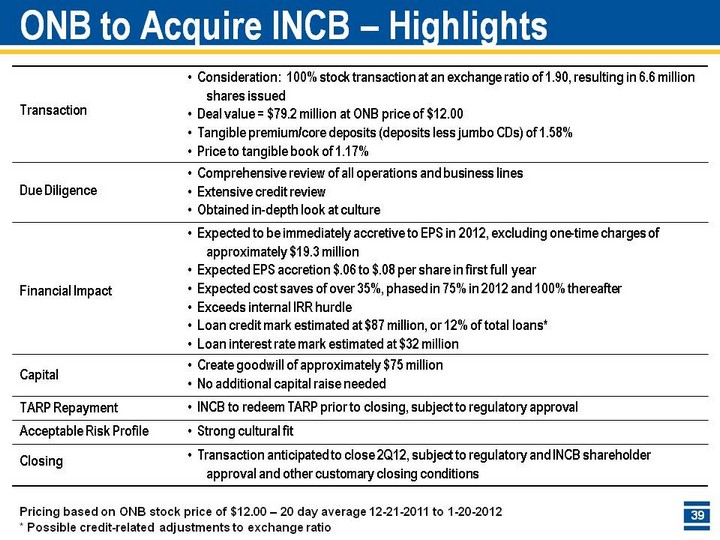
| ONB to Acquire INCB - Highlights Transaction Due DiligenceFinancial ImpactCapitalTARP RepaymentAcceptable Risk ProfileClosing Consideration: 100% stock transaction at an exchange ratio of 1.90, resulting in 6.6 million shares issued Deal value = $79.2 million at ONB price of $12.00 Tangible premium/core deposits (deposits less jumbo CDs) of 1.58% Price to tangible book of 1.17% Comprehensive review of all operations and business lines Extensive credit review Obtained in-depth look at culture Expected to be immediately accretive to EPS in 2012, excluding one-time charges of approximately $19.3 million Expected EPS accretion $.06 to $.08 per share in first full year Expected cost saves of over 35%, phased in 75% in 2012 and 100% thereafter Exceeds internal IRR hurdle Loan credit mark estimated at $87 million, or 12% of total loans* Loan interest rate mark estimated at $32 million Create goodwill of approximately $75 million No additional capital raise needed INCB to redeem TARP prior to closing, subject to regulatory approval Strong cultural fit Transaction anticipated to close 2Q12, subject to regulatory and INCB shareholder approval and other customary closing conditions * Possible credit-related adjustments to exchange ratio Pricing based on ONB stock price of $12.00 - 20 day average 12-21-2011 to 1-20-2012 |
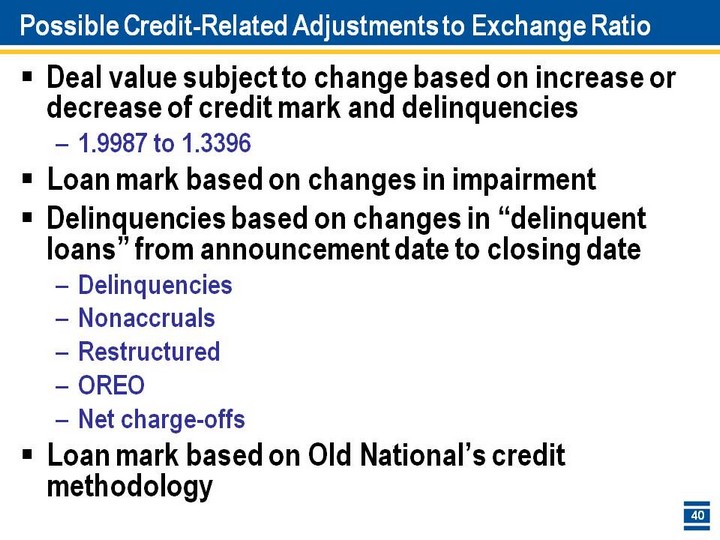
| Possible Credit-Related Adjustments to Exchange Ratio Deal value subject to change based on increase or decrease of credit mark and delinquencies1.9987 to 1.3396Loan mark based on changes in impairmentDelinquencies based on changes in "delinquent loans" from announcement date to closing dateDelinquenciesNonaccrualsRestructuredOREONet charge-offsLoan mark based on Old National's credit methodology |
| Appendix Old National Bancorp |
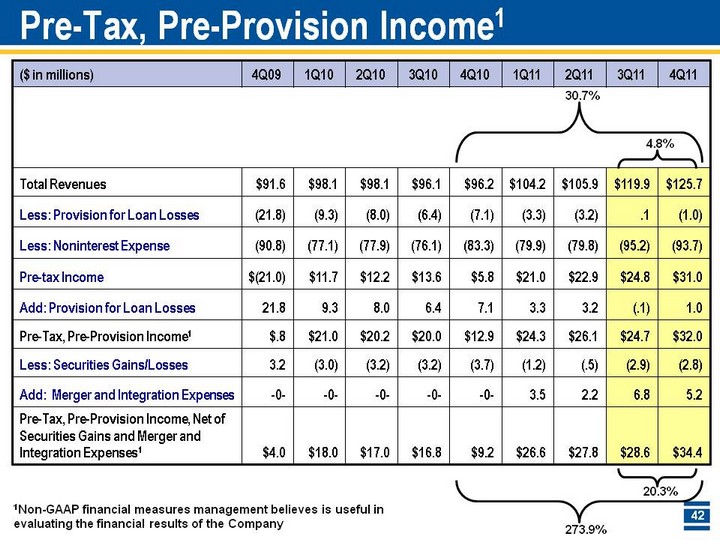
| Pre-Tax, Pre-Provision Income1 Pre-Tax, Pre-Provision Income1 1Non-GAAP financial measures management believes is useful in evaluating the financial results of the Company 20.3% 273.9% 30.7% 4.8% |
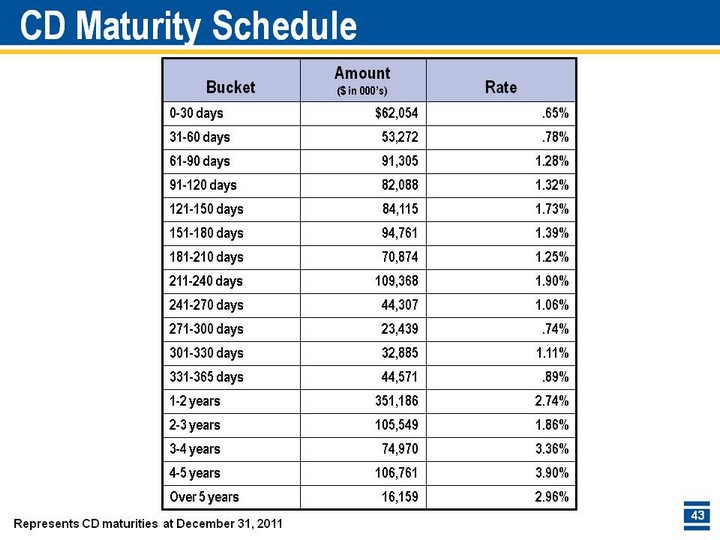
| CD Maturity Schedule CD Maturity Schedule Represents CD maturities at December 31, 2011 |
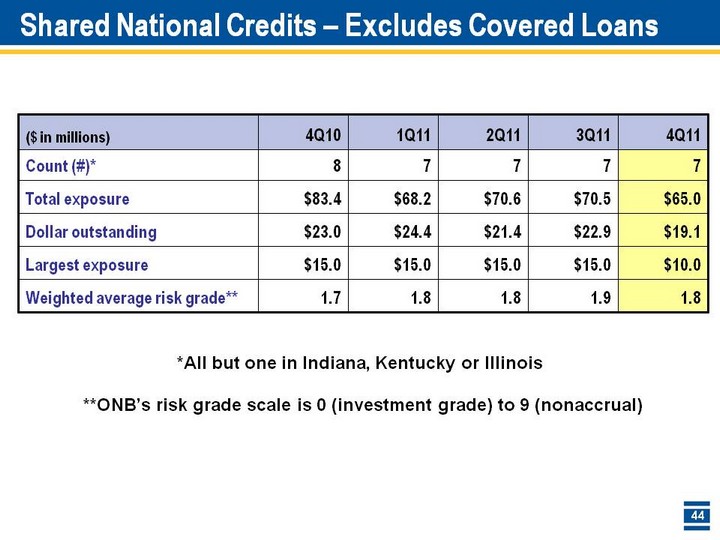
| Shared National Credits - Excludes Covered Loans Shared National Credits - Excludes Covered Loans *All but one in Indiana, Kentucky or Illinois **ONB's risk grade scale is 0 (investment grade) to 9 (nonaccrual) |
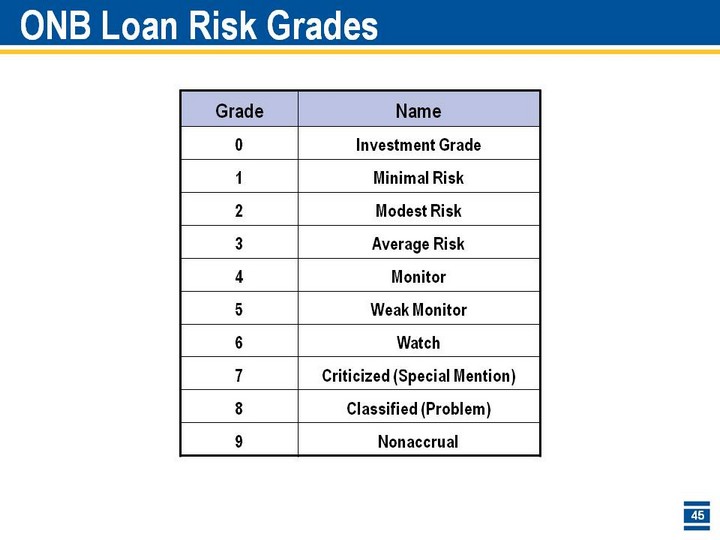
| ONB Loan Risk Grades ONB Loan Risk Grades |
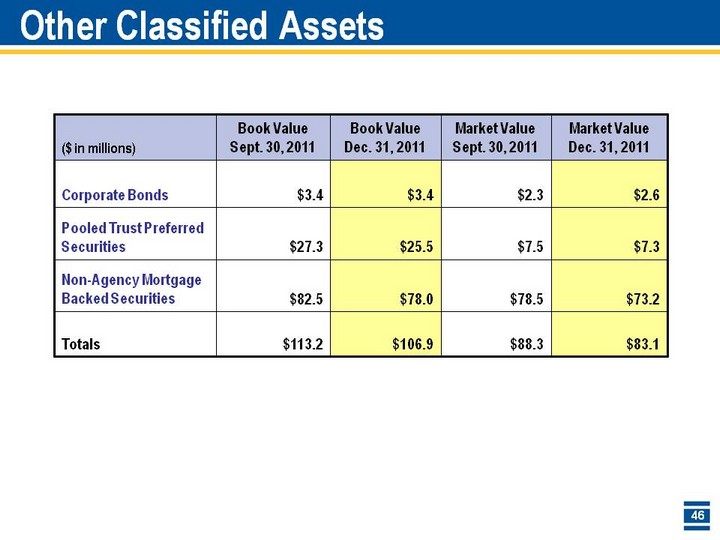
| Other Classified Assets Other Classified Assets |
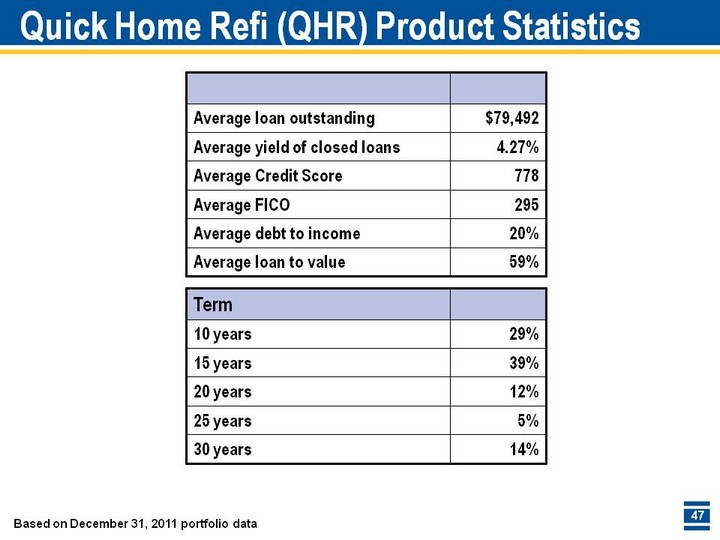
| Quick Home Refi (QHR) Product Statistics Quick Home Refi (QHR) Product Statistics Based on December 31, 2011 portfolio data Based on December 31, 2011 portfolio data |
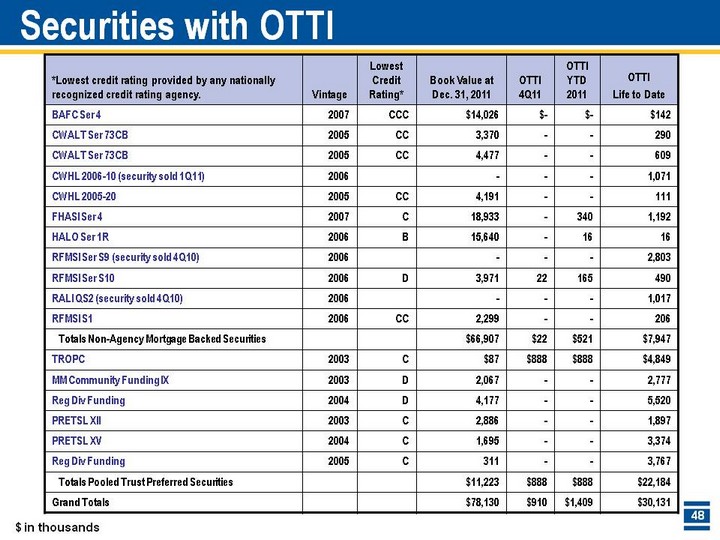
| Securities with OTTI Securities with OTTI $ in thousands |
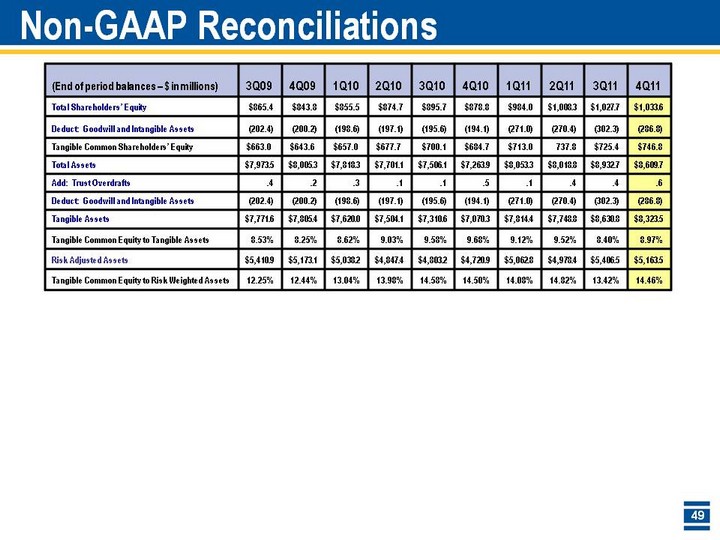
| Non-GAAP Reconciliations Non-GAAP Reconciliations End of period balances - $ in millions |
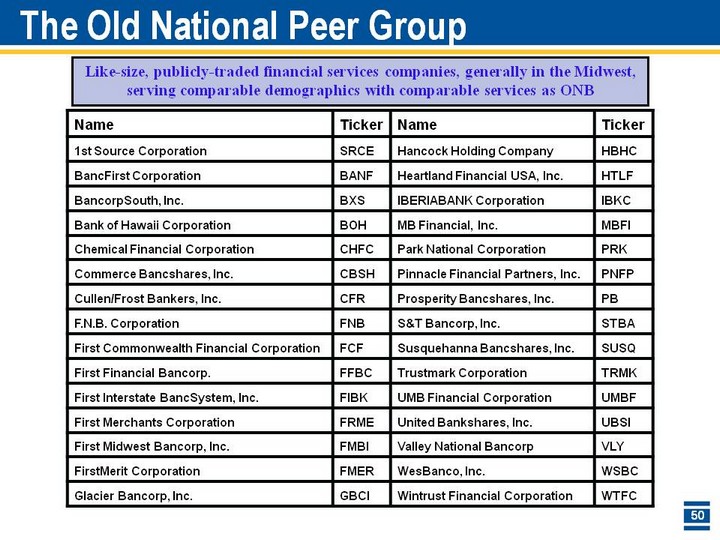
| The Old National Peer Group The Old National Peer Group Like-size, publicly-traded financial services companies, generally in the Midwest, serving comparable demographics with comparable services as ONB |

| Investor Contact Additional information can be found on theInvestor Relations web pages atwww.oldnational.comInvestor Inquiries:Lynell J. Walton, CPASVP - Director of Investor Relations812-464-1366lynell.walton@oldnational.com |