
Investment Thesis Financial Data as of June 30, 2017 Dated: August 28, 2017 Exhibit 99.1

Investment Thesis Executive Summary Slides 2 to 23 Financial Data as of June 30, 2017 Dated: August 28, 2017
Additional Information for Shareholders of Anchor Bancorp, Inc. Communications in this document do not constitute an offer to sell or the solicitation of an offer to buy any securities or a solicitation of any vote or approval. In connection with the proposed merger, Old National Bancorp (“ONB”) will file with the Securities and Exchange Commission (“SEC”) a Registration Statement on Form S-4 that will include a Proxy Statement of Anchor Bancorp, Inc. (“Anchor”) and a Prospectus of ONB, as well as other relevant documents concerning the proposed transaction. Shareholders are urged to read the Registration Statement and the Proxy Statement/Prospectus regarding the merger when it becomes available and any other relevant documents filed with the SEC, as well as any amendments or supplements to those documents, because they will contain important information. A free copy of the Proxy Statement/Prospectus, as well as other filings containing information about ONB and Anchor, may be obtained at the SEC’s Internet site (http://www.sec.gov). You will also be able to obtain these documents, free of charge, from ONB at www.oldnational.com under the tab “Investor Relations” and then under the heading “Financial Information” or from Anchor by accessing Anchor’s website at www.anchorlink.com under the tab “About Us.” ONB and Anchor and certain of their directors and executive officers may be deemed to be participants in the solicitation of proxies from the shareholders of Anchor in connection with the proposed merger. Information about the directors and executive officers of ONB is set forth in the proxy statement for ONB’s 2016 annual meeting of shareholders, as filed with the SEC on a Schedule 14A on March 6, 2017. Additional information regarding the interests of those participants and other persons who may be deemed participants in the transaction may be obtained by reading the Proxy Statement/Prospectus regarding the proposed merger when it becomes available. Free copies of this document may be obtained as described in the preceding paragraph.
Forward-Looking Statements This presentation contains certain forward-looking statements within the meaning of the Private Securities Litigation Reform Act of 1995. These statements include, but are not limited to, statements about the expected timing, completion, financial benefits and other effects of the proposed merger between ONB and Anchor. Forward-looking statements can be identified by the use of the words “anticipate,” “believe,” “expect,” “intend,” “could” and “should,” and other words of similar meaning. These forward-looking statements express management’s current expectations or forecasts of future events and, by their nature, are subject to risks and uncertainties and there are a number of factors that could cause actual results to differ materially from those in such statements. Factors that might cause such a difference include, but are not limited to: expected cost savings, synergies and other financial benefits from the proposed merger might not be realized within the expected time frames and costs or difficulties relating to integration matters might be greater than expected; the requisite shareholder and regulatory approvals for the proposed merger might not be obtained; satisfaction of other closing conditions; delay in closing the proposed merger; the reaction to the transaction of the companies’ customers and employees; market, economic, operational, liquidity, credit and interest rate risks associated with ONB’s and Anchor’s businesses; competition; government legislation and policies (including the impact of the Dodd-Frank Wall Street Reform and Consumer Protection Act and its related regulations); ability of ONB and Anchor to execute their respective business plans (including integrating the ONB and Anchor businesses); changes in the economy which could materially impact credit quality trends and the ability to generate loans and gather deposits; failure or circumvention of our internal controls; failure or disruption of our information systems; significant changes in accounting, tax or regulatory practices or requirements; new legal obligations or liabilities or unfavorable resolutions of litigations; other factors identified in ONB’s Annual Report on Form 10-K and other periodic filings with the SEC and other factors identified in this presentation. These forward-looking statements are made only as of the date of this presentation, and ONB undertakes no obligation to release revisions to these forward-looking statements to reflect events or conditions after the date of this presentation.
Non-GAAP Financial Measures These slides contain non-GAAP financial measures. For purposes of Regulation G, a non-GAAP financial measure is a numerical measure of the registrant's historical or future financial performance, financial position or cash flows that excludes amounts, or is subject to adjustments that have the effect of excluding amounts, that are included in the most directly comparable measure calculated and presented in accordance with GAAP in the statement of income, balance sheet or statement of cash flows (or equivalent statements) of the registrant; or includes amounts, or is subject to adjustments that have the effect of including amounts, that are excluded from the most directly comparable measure so calculated and presented. In this regard, GAAP refers to generally accepted accounting principles in the United States. Pursuant to the requirements of Regulation G, Old National Bancorp has provided reconciliations within the slides, as necessary, of the non-GAAP financial measure to the most directly comparable GAAP financial measure.
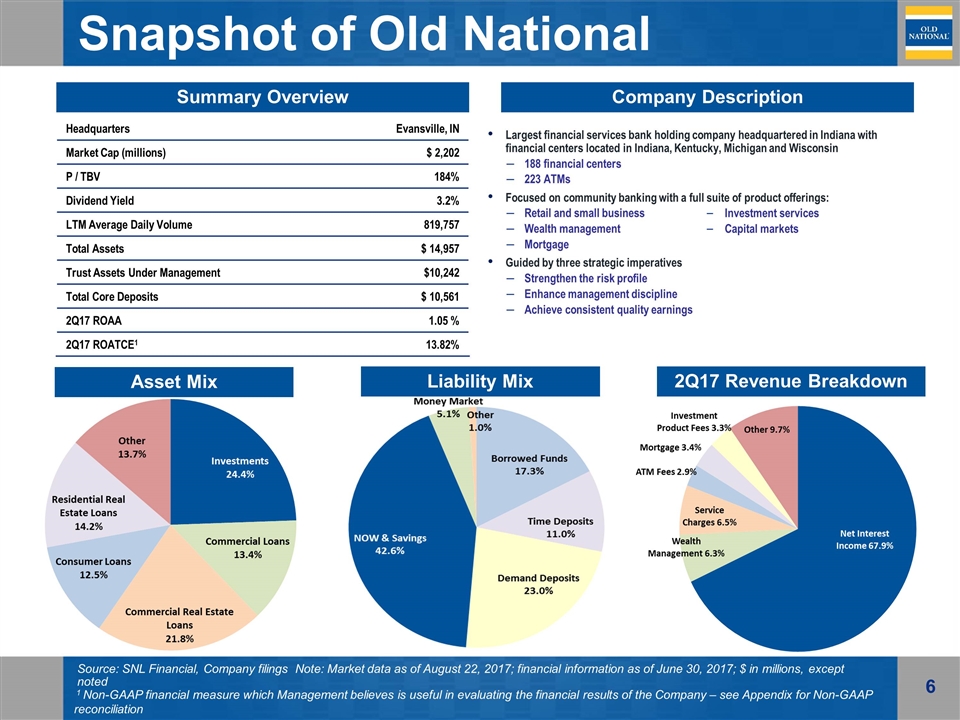
Snapshot of Old National Largest financial services bank holding company headquartered in Indiana with financial centers located in Indiana, Kentucky, Michigan and Wisconsin 188 financial centers 223 ATMs Focused on community banking with a full suite of product offerings: Retail and small business Wealth management Mortgage Guided by three strategic imperatives Strengthen the risk profile Enhance management discipline Achieve consistent quality earnings Summary Overview Company Description Headquarters Evansville, IN Market Cap (millions) $ 2,202 P / TBV 184% Dividend Yield 3.2% LTM Average Daily Volume 819,757 Total Assets $ 14,957 Trust Assets Under Management $10,242 Total Core Deposits $ 10,561 2Q17 ROAA 1.05 % 2Q17 ROATCE1 13.82% Investment services Capital markets Asset Mix Liability Mix 2Q17 Revenue Breakdown Source: SNL Financial, Company filings Note: Market data as of August 22, 2017; financial information as of June 30, 2017; $ in millions, except noted 1 Non-GAAP financial measure which Management believes is useful in evaluating the financial results of the Company – see Appendix for Non-GAAP reconciliation
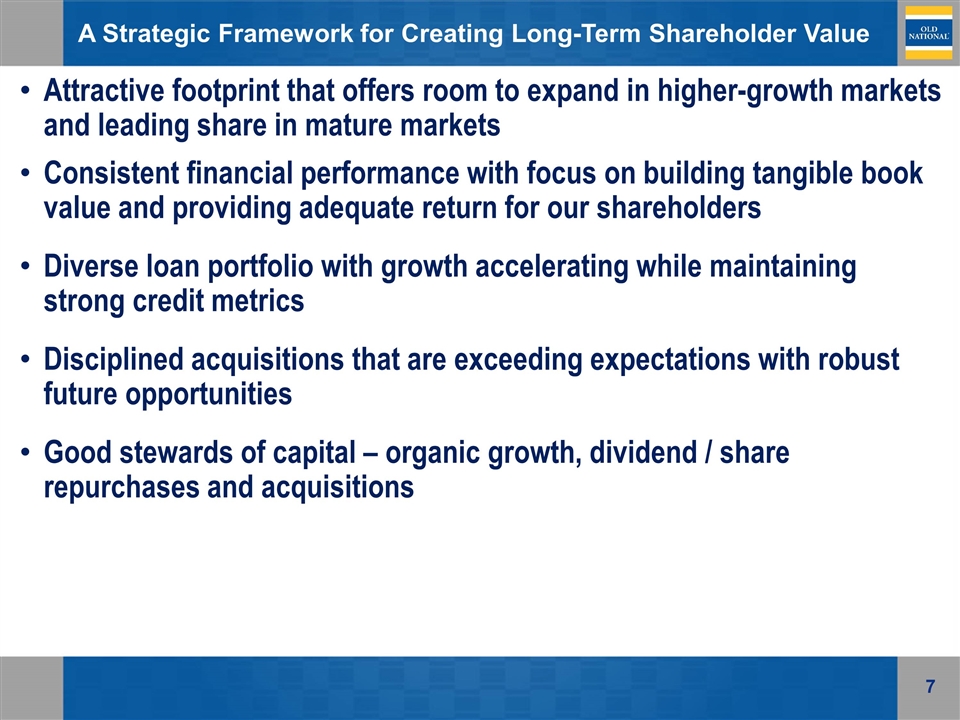
A Strategic Framework for Creating Long-Term Shareholder Value Attractive footprint that offers room to expand in higher-growth markets and leading share in mature markets Consistent financial performance with focus on building tangible book value and providing adequate return for our shareholders Diverse loan portfolio with growth accelerating while maintaining strong credit metrics Disciplined acquisitions that are exceeding expectations with robust future opportunities Good stewards of capital – organic growth, dividend / share repurchases and acquisitions

Commitment to Excellence
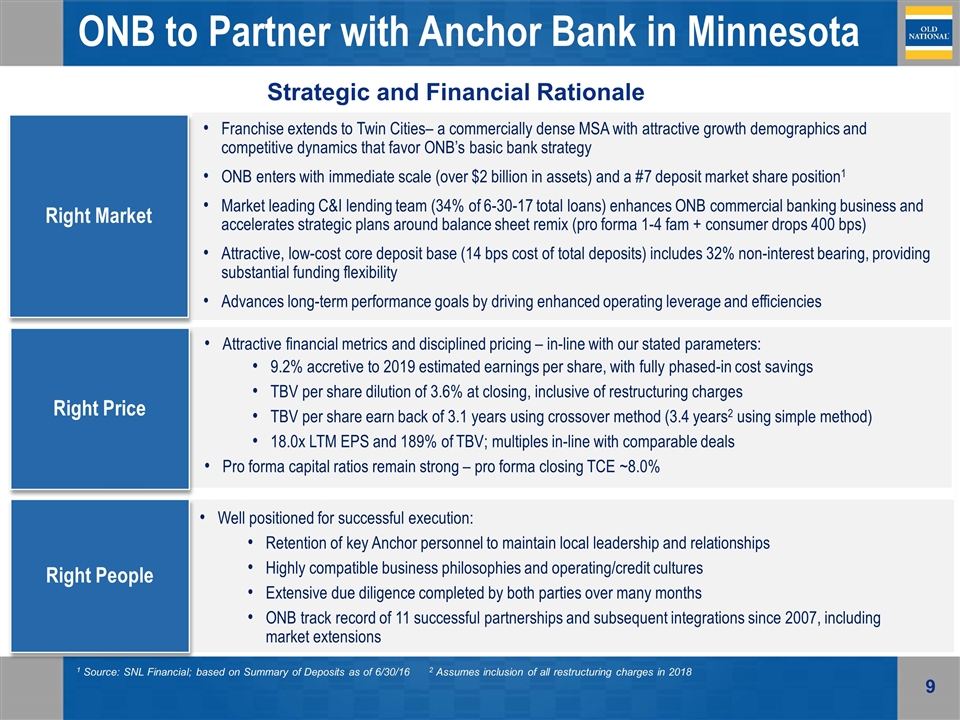
Franchise extends to Twin Cities– a commercially dense MSA with attractive growth demographics and competitive dynamics that favor ONB’s basic bank strategy ONB enters with immediate scale (over $2 billion in assets) and a #7 deposit market share position1 Market leading C&I lending team (34% of 6-30-17 total loans) enhances ONB commercial banking business and accelerates strategic plans around balance sheet remix (pro forma 1-4 fam + consumer drops 400 bps) Attractive, low-cost core deposit base (14 bps cost of total deposits) includes 32% non-interest bearing, providing substantial funding flexibility Advances long-term performance goals by driving enhanced operating leverage and efficiencies ONB to Partner with Anchor Bank in Minnesota Right Market Right Price Right People Attractive financial metrics and disciplined pricing – in-line with our stated parameters: 9.2% accretive to 2019 estimated earnings per share, with fully phased-in cost savings TBV per share dilution of 3.6% at closing, inclusive of restructuring charges TBV per share earn back of 3.1 years using crossover method (3.4 years2 using simple method) 18.0x LTM EPS and 189% of TBV; multiples in-line with comparable deals Pro forma capital ratios remain strong – pro forma closing TCE ~8.0% Well positioned for successful execution: Retention of key Anchor personnel to maintain local leadership and relationships Highly compatible business philosophies and operating/credit cultures Extensive due diligence completed by both parties over many months ONB track record of 11 successful partnerships and subsequent integrations since 2007, including market extensions 1 Source: SNL Financial; based on Summary of Deposits as of 6/30/16 2 Assumes inclusion of all restructuring charges in 2018 Strategic and Financial Rationale
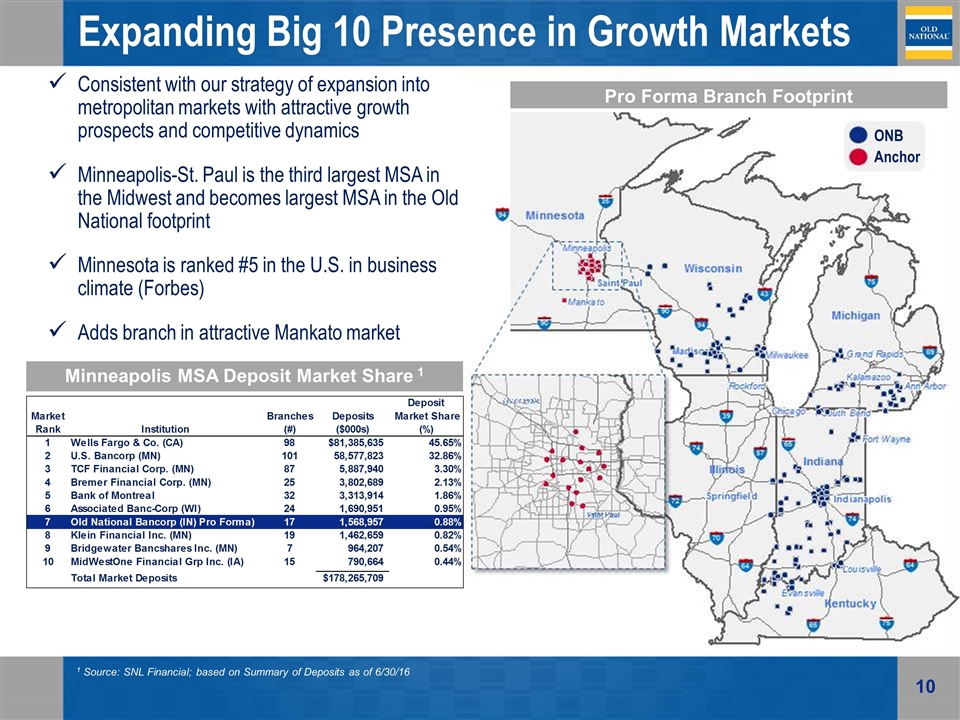
Expanding Big 10 Presence in Growth Markets Pro Forma Branch Footprint Minneapolis MSA Deposit Market Share 1 1 Source: SNL Financial; based on Summary of Deposits as of 6/30/16 Consistent with our strategy of expansion into metropolitan markets with attractive growth prospects and competitive dynamics Minneapolis-St. Paul is the third largest MSA in the Midwest and becomes largest MSA in the Old National footprint Minnesota is ranked #5 in the U.S. in business climate (Forbes) Adds branch in attractive Mankato market ONB Anchor
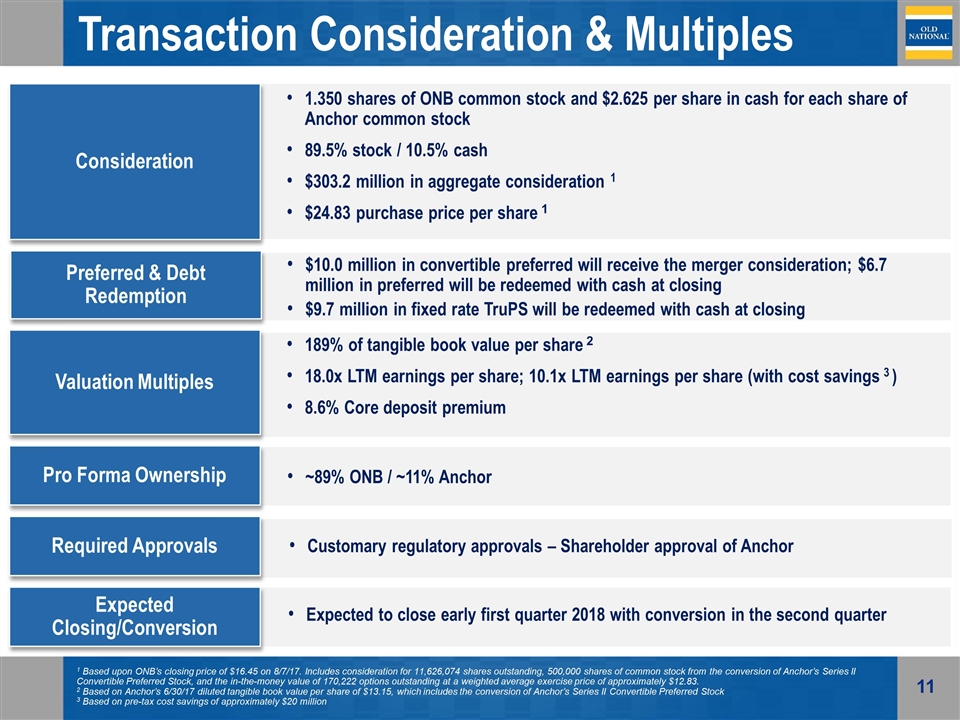
~89% ONB / ~11% Anchor Customary regulatory approvals – Shareholder approval of Anchor Expected to close early first quarter 2018 with conversion in the second quarter Transaction Consideration & Multiples Consideration Valuation Multiples Pro Forma Ownership Required Approvals Expected Closing/Conversion 1.350 shares of ONB common stock and $2.625 per share in cash for each share of Anchor common stock 89.5% stock / 10.5% cash $303.2 million in aggregate consideration 1 $24.83 purchase price per share 1 189% of tangible book value per share 2 18.0x LTM earnings per share; 10.1x LTM earnings per share (with cost savings 3 ) 8.6% Core deposit premium Preferred & Debt Redemption $10.0 million in convertible preferred will receive the merger consideration; $6.7 million in preferred will be redeemed with cash at closing $9.7 million in fixed rate TruPS will be redeemed with cash at closing 1 Based upon ONB’s closing price of $16.45 on 8/7/17. Includes consideration for 11,626,074 shares outstanding, 500,000 shares of common stock from the conversion of Anchor’s Series II Convertible Preferred Stock, and the in-the-money value of 170,222 options outstanding at a weighted average exercise price of approximately $12.83. 2 Based on Anchor’s 6/30/17 diluted tangible book value per share of $13.15, which includes the conversion of Anchor’s Series II Convertible Preferred Stock 3 Based on pre-tax cost savings of approximately $20 million
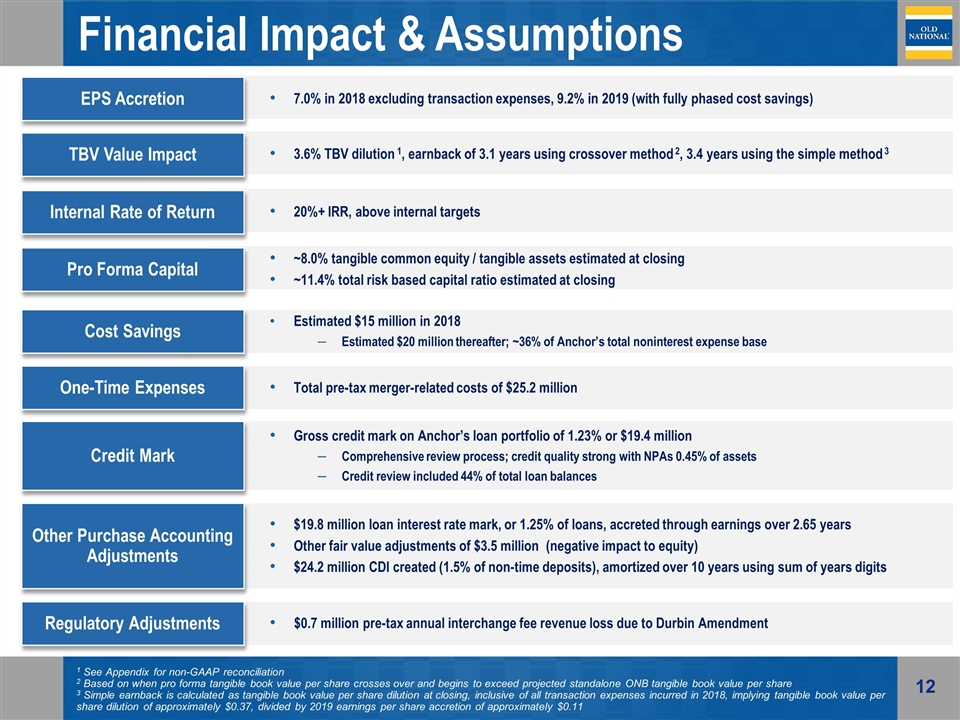
Financial Impact & Assumptions Estimated $15 million in 2018 Estimated $20 million thereafter; ~36% of Anchor’s total noninterest expense base Gross credit mark on Anchor’s loan portfolio of 1.23% or $19.4 million Comprehensive review process; credit quality strong with NPAs 0.45% of assets Credit review included 44% of total loan balances 7.0% in 2018 excluding transaction expenses, 9.2% in 2019 (with fully phased cost savings) 3.6% TBV dilution 1, earnback of 3.1 years using crossover method 2, 3.4 years using the simple method 3 20%+ IRR, above internal targets Total pre-tax merger-related costs of $25.2 million $0.7 million pre-tax annual interchange fee revenue loss due to Durbin Amendment $19.8 million loan interest rate mark, or 1.25% of loans, accreted through earnings over 2.65 years Other fair value adjustments of $3.5 million (negative impact to equity) $24.2 million CDI created (1.5% of non-time deposits), amortized over 10 years using sum of years digits EPS Accretion TBV Value Impact Internal Rate of Return Cost Savings One-Time Expenses Credit Mark Other Purchase Accounting Adjustments Regulatory Adjustments ~8.0% tangible common equity / tangible assets estimated at closing ~11.4% total risk based capital ratio estimated at closing Pro Forma Capital 1 See Appendix for non-GAAP reconciliation 2 Based on when pro forma tangible book value per share crosses over and begins to exceed projected standalone ONB tangible book value per share 3 Simple earnback is calculated as tangible book value per share dilution at closing, inclusive of all transaction expenses incurred in 2018, implying tangible book value per share dilution of approximately $0.37, divided by 2019 earnings per share accretion of approximately $0.11
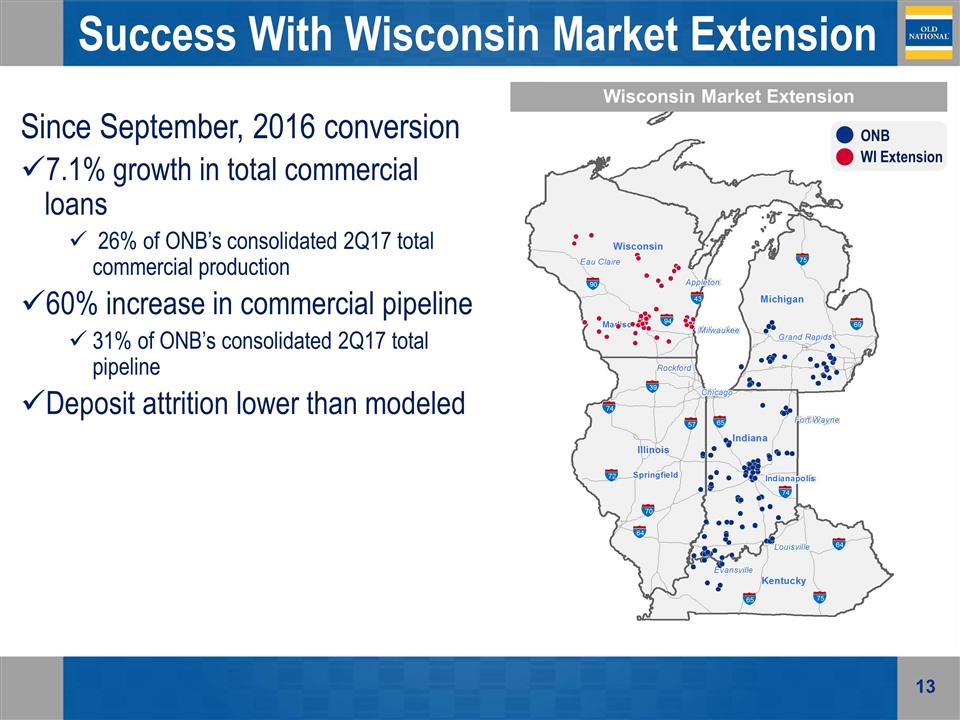
90 94 43 75 69 75 64 65 72 74 70 64 57 39 65 74 Success With Wisconsin Market Extension Since September, 2016 conversion 7.1% growth in total commercial loans 26% of ONB’s consolidated 2Q17 total commercial production 60% increase in commercial pipeline 31% of ONB’s consolidated 2Q17 total pipeline Deposit attrition lower than modeled ONB WI Extension Wisconsin Market Extension
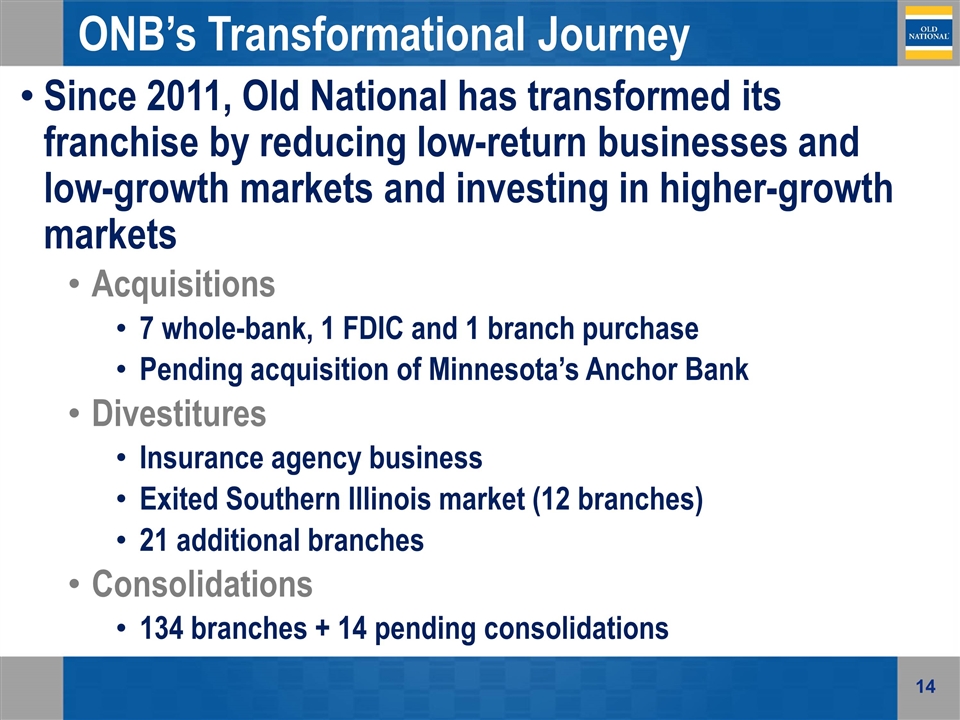
ONB’s Transformational Journey Since 2011, Old National has transformed its franchise by reducing low-return businesses and low-growth markets and investing in higher-growth markets Acquisitions 7 whole-bank, 1 FDIC and 1 branch purchase Pending acquisition of Minnesota’s Anchor Bank Divestitures Insurance agency business Exited Southern Illinois market (12 branches) 21 additional branches Consolidations 134 branches + 14 pending consolidations
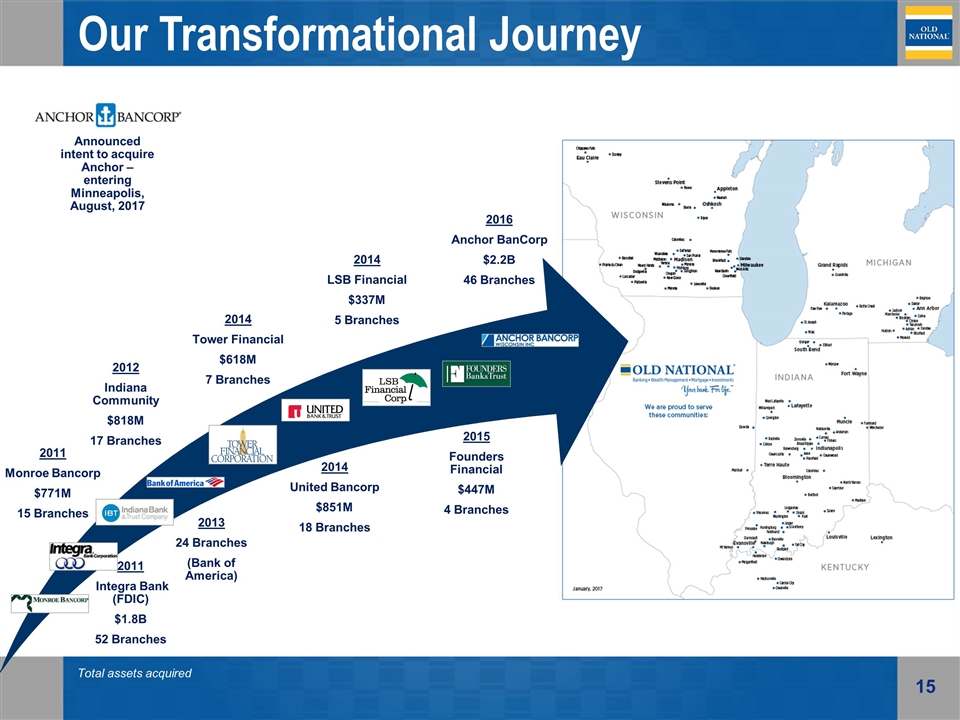
Our Transformational Journey 2011 Monroe Bancorp $771M 15 Branches 2012 Indiana Community $818M 17 Branches 2014 Tower Financial $618M 7 Branches 2014 United Bancorp $851M 18 Branches 2013 24 Branches (Bank of America) 2011 Integra Bank (FDIC) $1.8B 52 Branches 2014 LSB Financial $337M 5 Branches 2015 Founders Financial $447M 4 Branches 2016 Anchor BanCorp $2.2B 46 Branches Total assets acquired Announced intent to acquire Anchor – entering Minneapolis, August, 2017
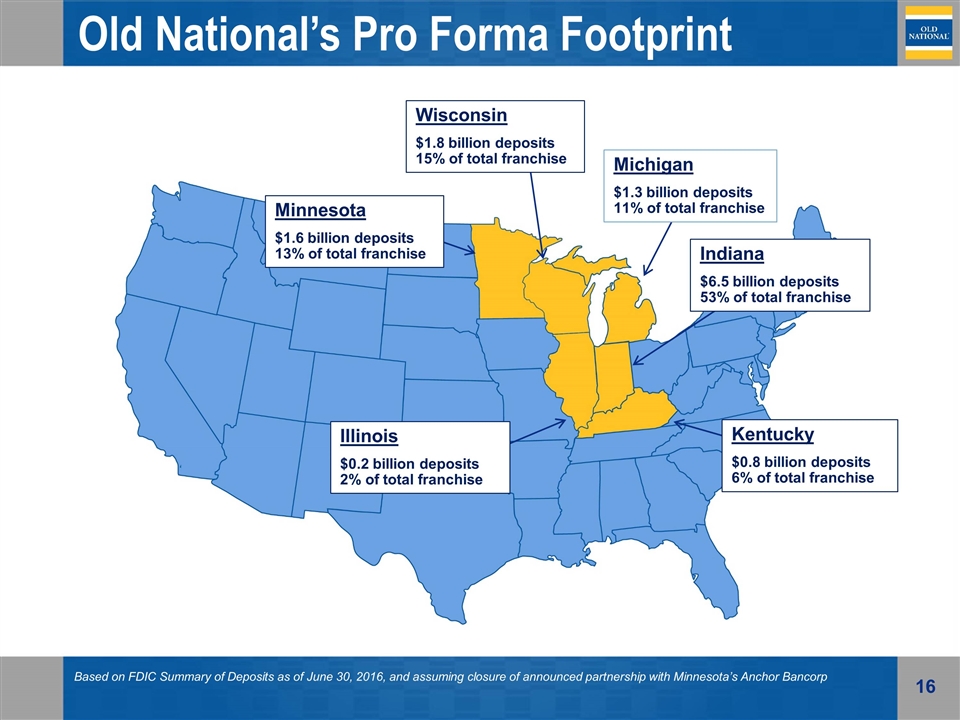
Old National’s Pro Forma Footprint Kentucky $0.8 billion deposits 6% of total franchise Michigan $1.3 billion deposits 11% of total franchise Wisconsin $1.8 billion deposits 15% of total franchise Indiana $6.5 billion deposits 53% of total franchise Based on FDIC Summary of Deposits as of June 30, 2016, and assuming closure of announced partnership with Minnesota’s Anchor Bancorp Illinois $0.2 billion deposits 2% of total franchise Minnesota $1.6 billion deposits 13% of total franchise
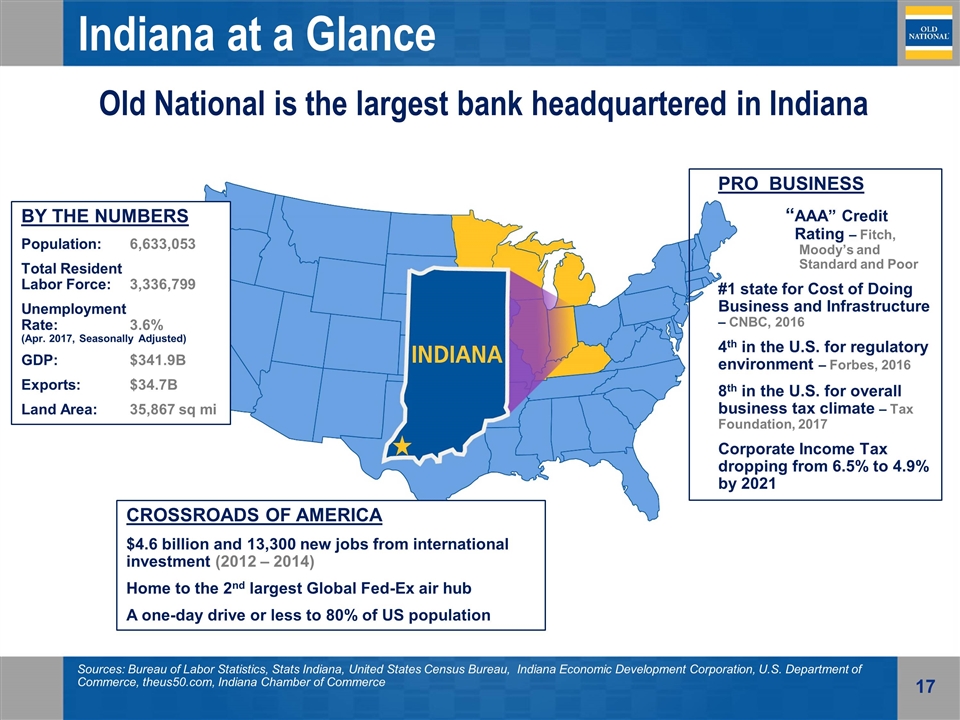
by the numbers Population: 6,633,053 Total Resident Labor Force:3,336,799 Unemployment Rate:3.6% (Apr. 2017, Seasonally Adjusted) GDP: $341.9B Exports:$34.7B Land Area:35,867 sq mi crossroads of America $4.6 billion and 13,300 new jobs from international investment (2012 – 2014) Home to the 2nd largest Global Fed-Ex air hub A one-day drive or less to 80% of US population Indiana at a Glance Old National is the largest bank headquartered in Indiana Sources: Bureau of Labor Statistics, Stats Indiana, United States Census Bureau, Indiana Economic Development Corporation, U.S. Department of Commerce, theus50.com, Indiana Chamber of Commerce pro business “AAA” Credit Rating – Fitch, Moody’s and Standard and Poor #1 state for Cost of Doing Business and Infrastructure – CNBC, 2016 4th in the U.S. for regulatory environment – Forbes, 2016 8th in the U.S. for overall business tax climate – Tax Foundation, 2017 Corporate Income Tax dropping from 6.5% to 4.9% by 2021
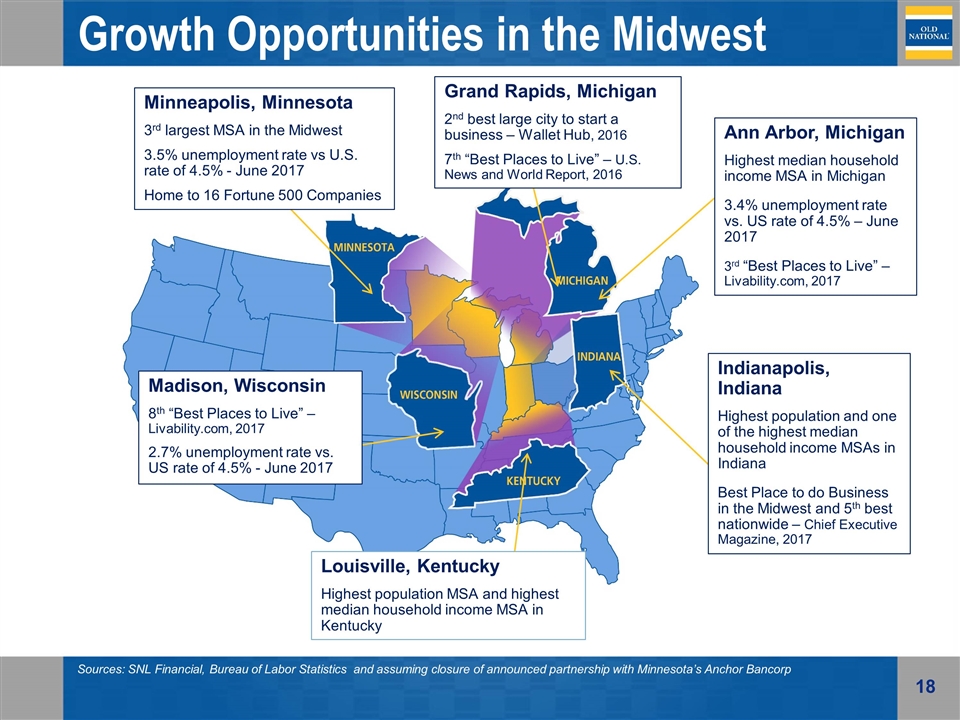
Growth Opportunities in the Midwest Louisville, Kentucky Highest population MSA and highest median household income MSA in Kentucky Grand Rapids, Michigan 2nd best large city to start a business – Wallet Hub, 2016 7th “Best Places to Live” – U.S. News and World Report, 2016 Ann Arbor, Michigan Highest median household income MSA in Michigan 3.4% unemployment rate vs. US rate of 4.5% – June 2017 3rd “Best Places to Live” – Livability.com, 2017 Indianapolis, Indiana Highest population and one of the highest median household income MSAs in Indiana Best Place to do Business in the Midwest and 5th best nationwide – Chief Executive Magazine, 2017 Madison, Wisconsin 8th “Best Places to Live” – Livability.com, 2017 2.7% unemployment rate vs. US rate of 4.5% - June 2017 Sources: SNL Financial, Bureau of Labor Statistics and assuming closure of announced partnership with Minnesota’s Anchor Bancorp Minneapolis, Minnesota 3rd largest MSA in the Midwest 3.5% unemployment rate vs U.S. rate of 4.5% - June 2017 Home to 16 Fortune 500 Companies
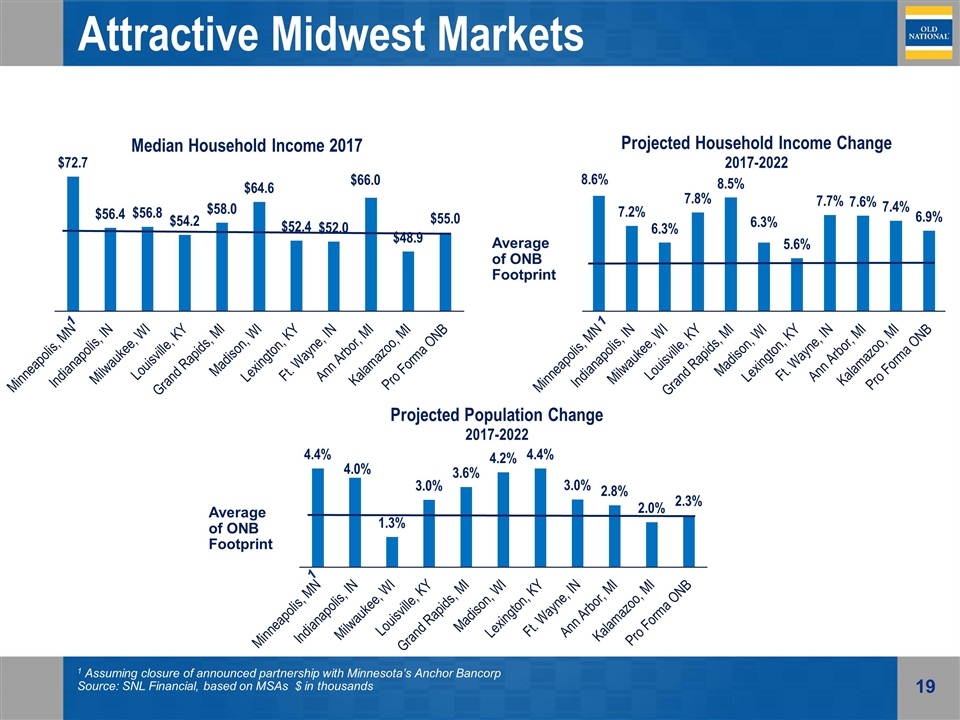
Attractive Midwest Markets 1 Assuming closure of announced partnership with Minnesota’s Anchor Bancorp Source: SNL Financial, based on MSAs $ in thousands Average of ONB Footprint Average of ONB Footprint 1 1
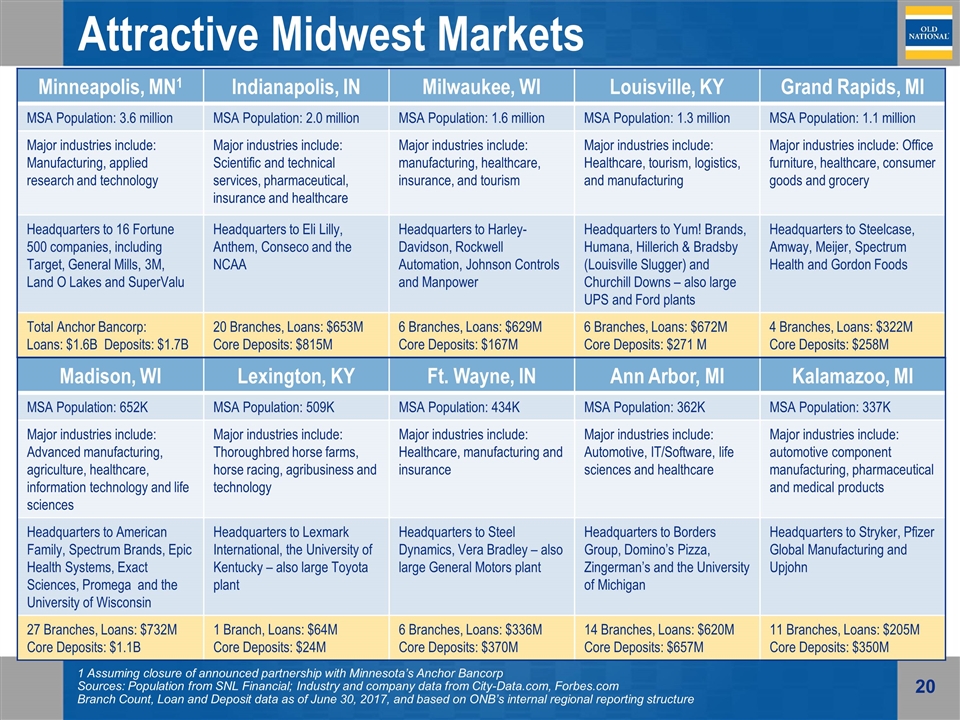
Attractive Midwest Markets Minneapolis, MN1 Indianapolis, IN Milwaukee, WI Louisville, KY Grand Rapids, MI MSA Population: 3.6 million MSA Population: 2.0 million MSA Population: 1.6 million MSA Population: 1.3 million MSA Population: 1.1 million Major industries include: Manufacturing, applied research and technology Major industries include: Scientific and technical services, pharmaceutical, insurance and healthcare Major industries include: manufacturing, healthcare, insurance, and tourism Major industries include: Healthcare, tourism, logistics, and manufacturing Major industries include: Office furniture, healthcare, consumer goods and grocery Headquarters to 16 Fortune 500 companies, including Target, General Mills, 3M, Land O Lakes and SuperValu Headquarters to Eli Lilly, Anthem, Conseco and the NCAA Headquarters to Harley-Davidson, Rockwell Automation, Johnson Controls and Manpower Headquarters to Yum! Brands, Humana, Hillerich & Bradsby (Louisville Slugger) and Churchill Downs – also large UPS and Ford plants Headquarters to Steelcase, Amway, Meijer, Spectrum Health and Gordon Foods Total Anchor Bancorp: Loans: $1.6B Deposits: $1.7B 20 Branches, Loans: $653M Core Deposits: $815M 6 Branches, Loans: $629M Core Deposits: $167M 6 Branches, Loans: $672M Core Deposits: $271 M 4 Branches, Loans: $322M Core Deposits: $258M 1 Assuming closure of announced partnership with Minnesota’s Anchor Bancorp Sources: Population from SNL Financial; Industry and company data from City-Data.com, Forbes.com Branch Count, Loan and Deposit data as of June 30, 2017, and based on ONB’s internal regional reporting structure Madison, WI Lexington, KY Ft. Wayne, IN Ann Arbor, MI Kalamazoo, MI MSA Population: 652K MSA Population: 509K MSA Population: 434K MSA Population: 362K MSA Population: 337K Major industries include: Advanced manufacturing, agriculture, healthcare, information technology and life sciences Major industries include: Thoroughbred horse farms, horse racing, agribusiness and technology Major industries include: Healthcare, manufacturing and insurance Major industries include: Automotive, IT/Software, life sciences and healthcare Major industries include: automotive component manufacturing, pharmaceutical and medical products Headquarters to American Family, Spectrum Brands, Epic Health Systems, Exact Sciences, Promega and the University of Wisconsin Headquarters to Lexmark International, the University of Kentucky – also large Toyota plant Headquarters to Steel Dynamics, Vera Bradley – also large General Motors plant Headquarters to Borders Group, Domino’s Pizza, Zingerman’s and the University of Michigan Headquarters to Stryker, Pfizer Global Manufacturing and Upjohn 27 Branches, Loans: $732M Core Deposits: $1.1B 1 Branch, Loans: $64M Core Deposits: $24M 6 Branches, Loans: $336M Core Deposits: $370M 14 Branches, Loans: $620M Core Deposits: $657M 11 Branches, Loans: $205M Core Deposits: $350M
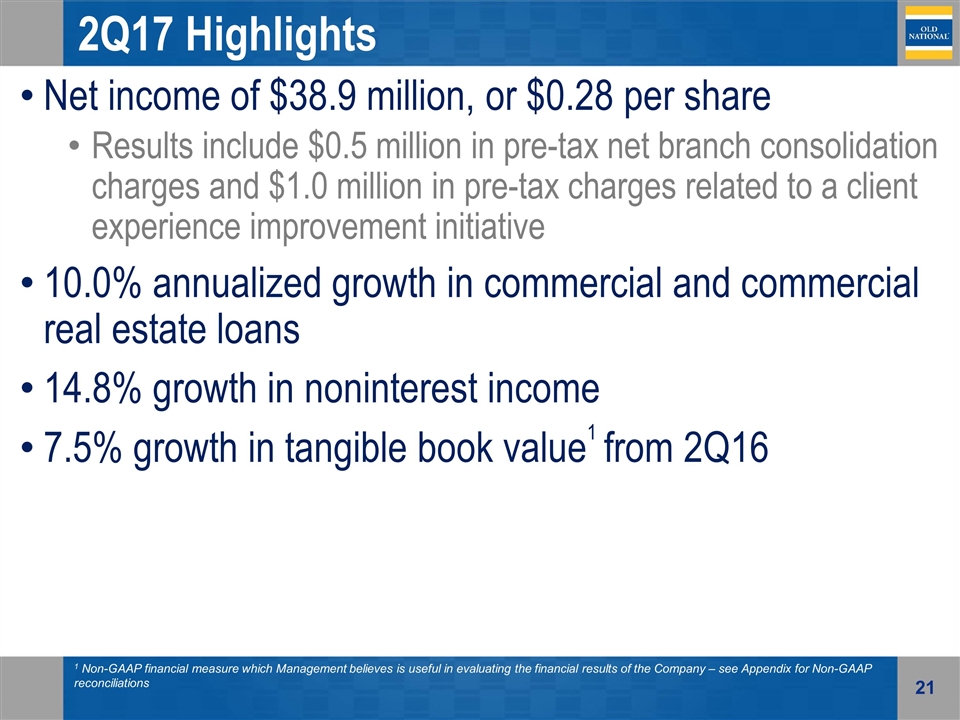
2Q17 Highlights Net income of $38.9 million, or $0.28 per share Results include $0.5 million in pre-tax net branch consolidation charges and $1.0 million in pre-tax charges related to a client experience improvement initiative 10.0% annualized growth in commercial and commercial real estate loans 14.8% growth in noninterest income 7.5% growth in tangible book value1 from 2Q16 1 Non-GAAP financial measure which Management believes is useful in evaluating the financial results of the Company – see Appendix for Non-GAAP reconciliations
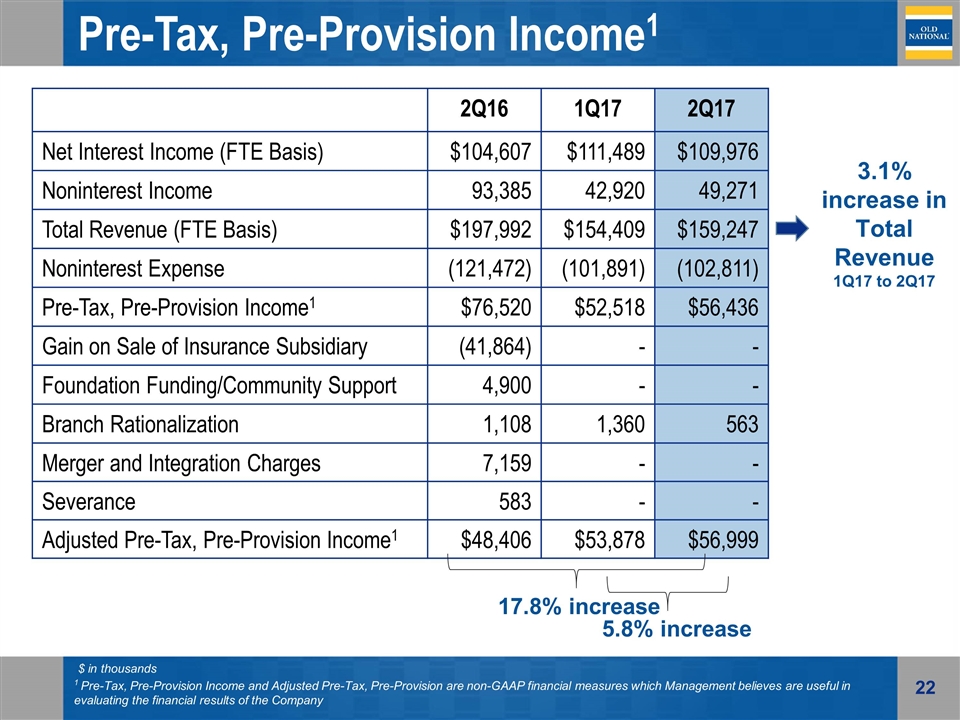
Pre-Tax, Pre-Provision Income1 2Q16 1Q17 2Q17 Net Interest Income (FTE Basis) $104,607 $111,489 $109,976 Noninterest Income 93,385 42,920 49,271 Total Revenue (FTE Basis) $197,992 $154,409 $159,247 Noninterest Expense (121,472) (101,891) (102,811) Pre-Tax, Pre-Provision Income1 $76,520 $52,518 $56,436 Gain on Sale of Insurance Subsidiary (41,864) - - Foundation Funding/Community Support 4,900 - - Branch Rationalization 1,108 1,360 563 Merger and Integration Charges 7,159 - - Severance 583 - - Adjusted Pre-Tax, Pre-Provision Income1 $48,406 $53,878 $56,999 $ in thousands 1 Pre-Tax, Pre-Provision Income and Adjusted Pre-Tax, Pre-Provision are non-GAAP financial measures which Management believes are useful in evaluating the financial results of the Company 5.8% increase 3.1% increase in Total Revenue 1Q17 to 2Q17 17.8% increase
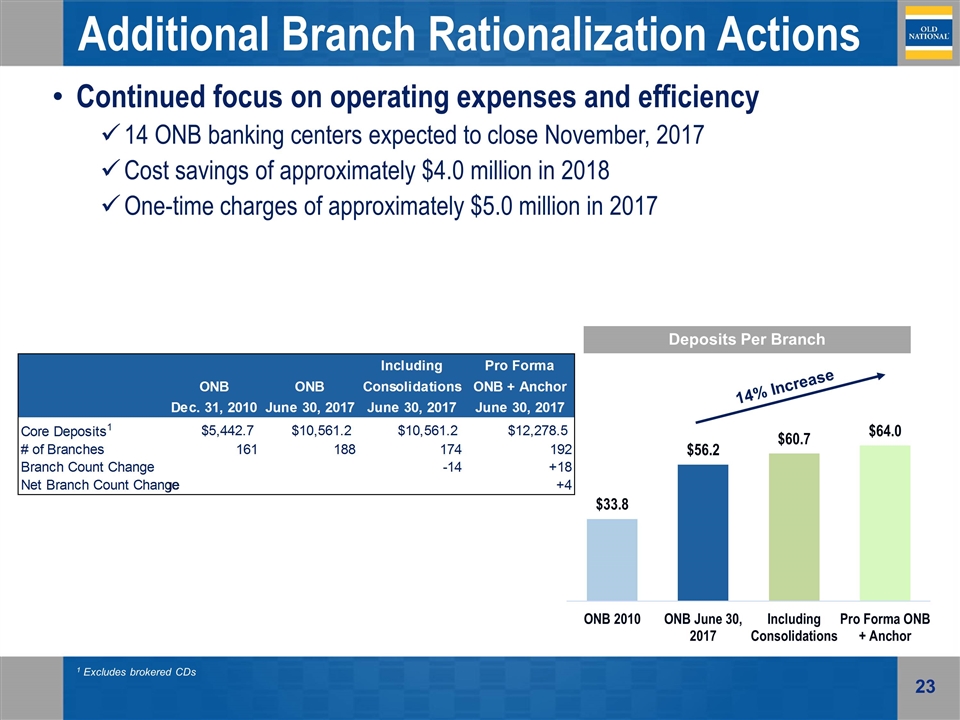
Additional Branch Rationalization Actions Continued focus on operating expenses and efficiency 14 ONB banking centers expected to close November, 2017 Cost savings of approximately $4.0 million in 2018 One-time charges of approximately $5.0 million in 2017 14% Increase Deposits Per Branch 1 Excludes brokered CDs

Investment Thesis Financial Data as of June 30, 2017 Dated: August 28, 2017
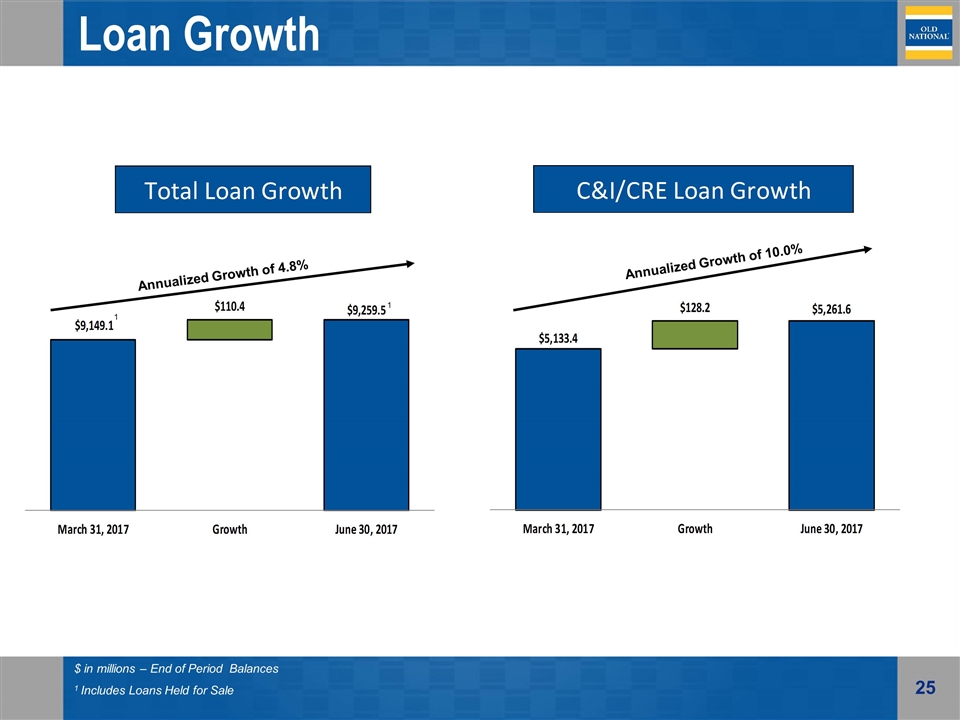
Loan Growth $ in millions – End of Period Balances 1 Includes Loans Held for Sale 1 1 Annualized Growth of 4.8% Annualized Growth of 10.0%
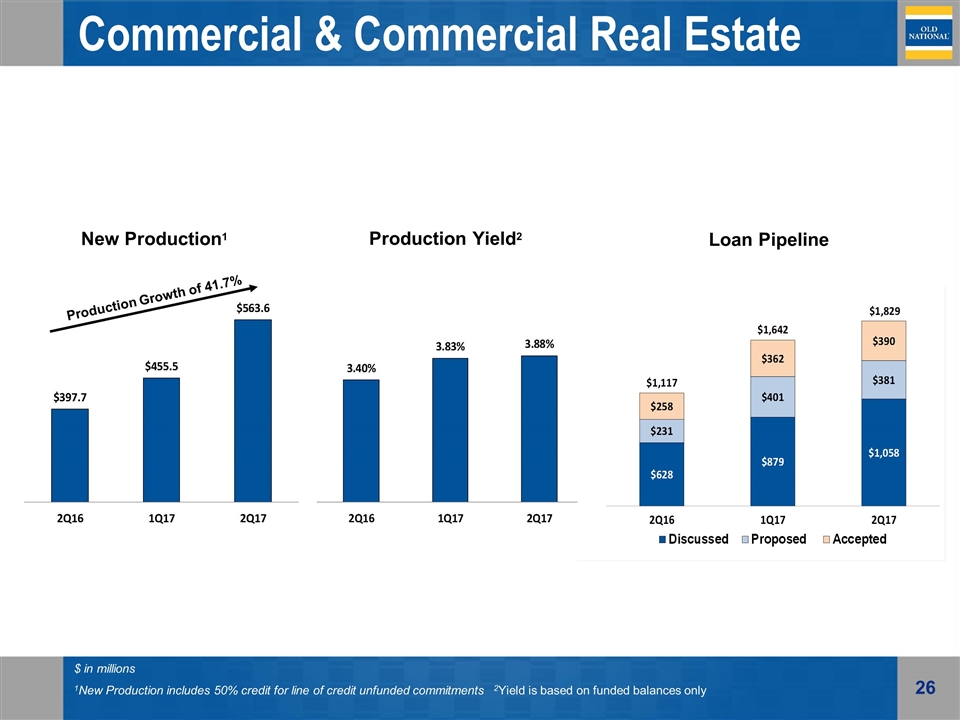
Commercial & Commercial Real Estate Loans $ in millions 1New Production includes 50% credit for line of credit unfunded commitments 2Yield is based on funded balances only New Production1 Production Yield2 Loan Pipeline Production Growth of 41.7%

Loan Production & Yield Trends $ in millions New quarterly production includes unfunded commitments – Yield is based on funded balances only Quick Home Refinance (residential mortgage product) is included in the Residential Mortgage graph Direct Consumer includes Home Equity Lines of Credit Consumer Direct Consumer Indirect Residential Mortgage
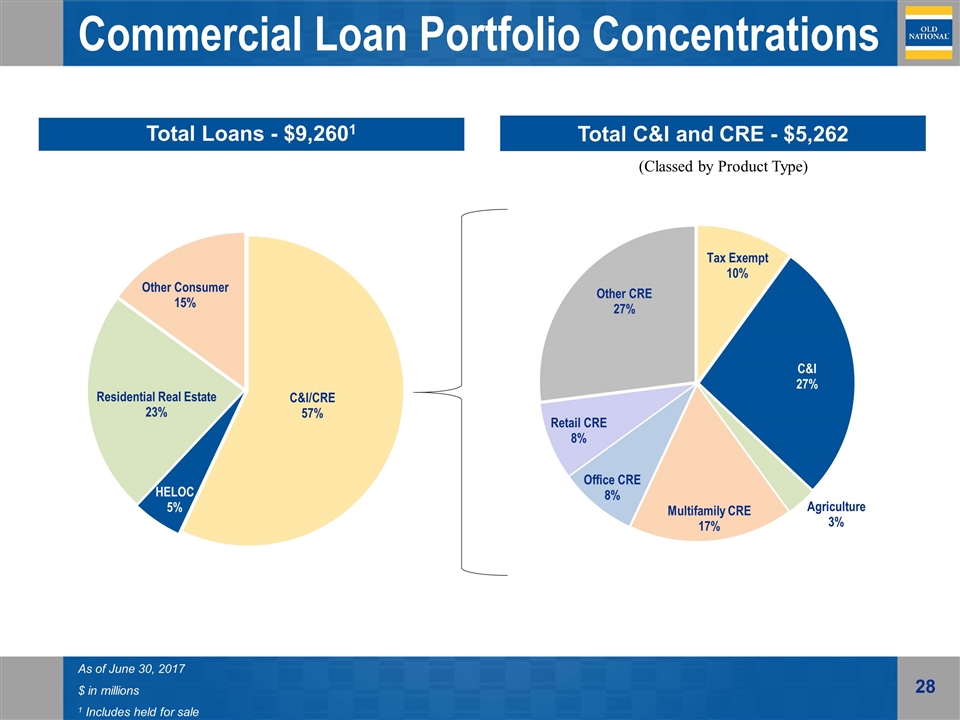
Commercial Loan Portfolio Concentrations As of June 30, 2017 $ in millions 1 Includes held for sale Total C&I and CRE - $5,262 (Classed by Product Type)
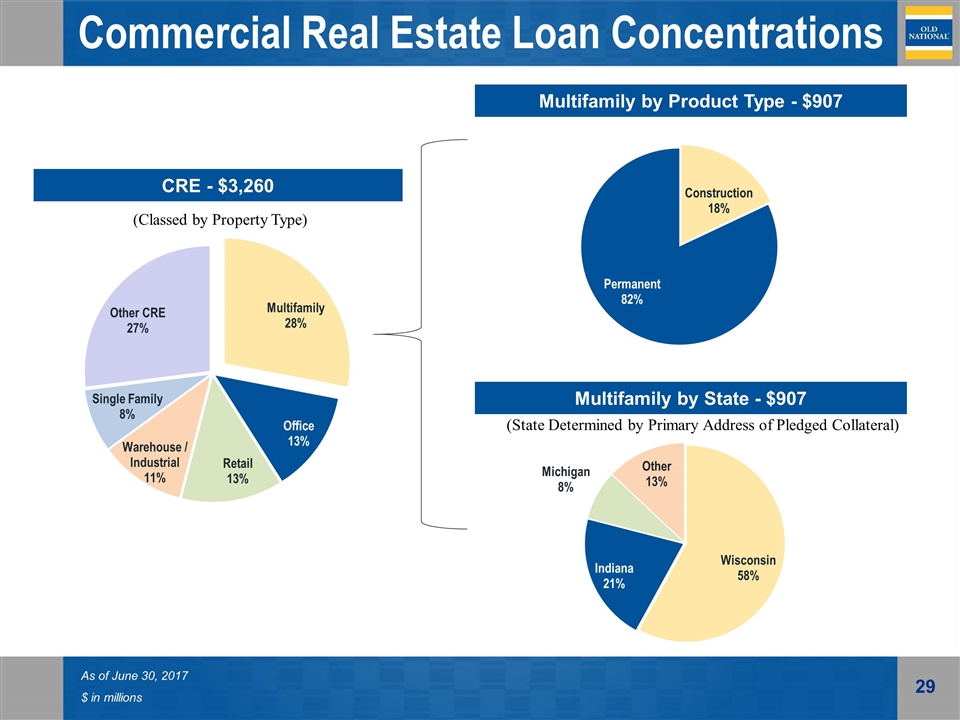
Commercial Real Estate Loan Concentrations As of June 30, 2017 $ in millions CRE - $3,260 (Classed by Property Type) Multifamily by Product Type - $907 Multifamily by State - $907 (State Determined by Primary Address of Pledged Collateral)
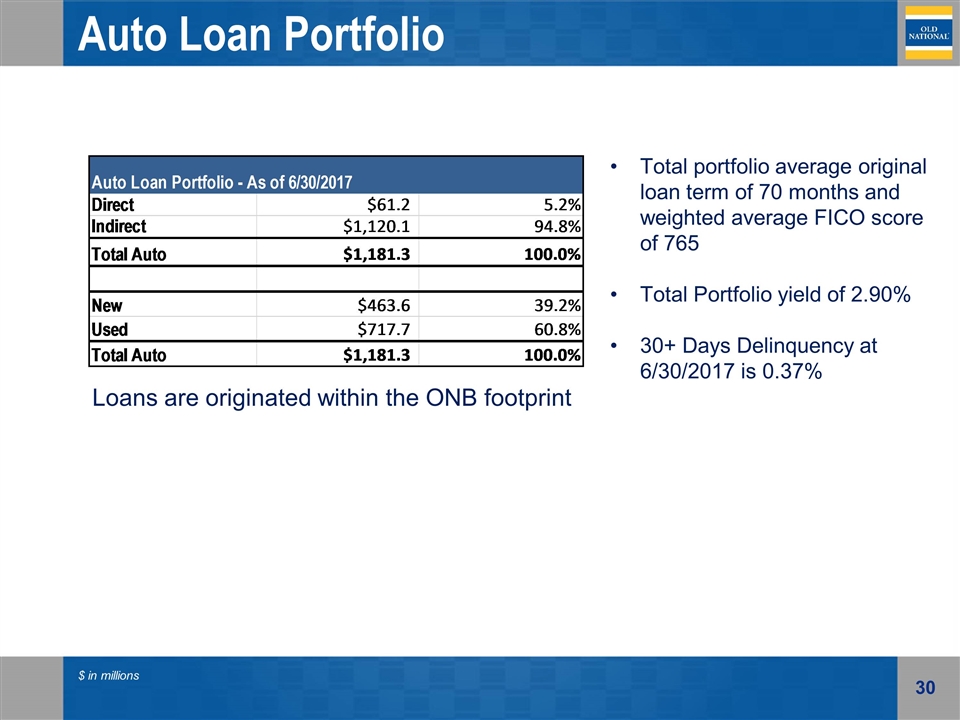
Auto Loan Portfolio $ in millions Total portfolio average original loan term of 70 months and weighted average FICO score of 765 Total Portfolio yield of 2.90% 30+ Days Delinquency at 6/30/2017 is 0.37% Loans are originated within the ONB footprint

$ in millions Credit Quality Trends
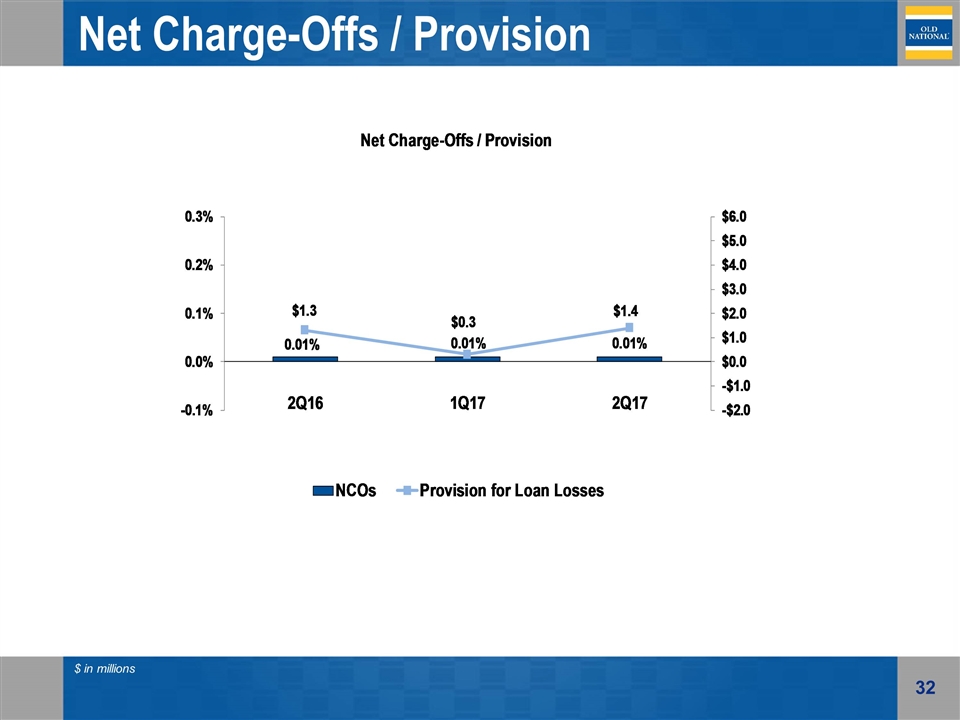
Net Charge-Offs / Provision $ in millions
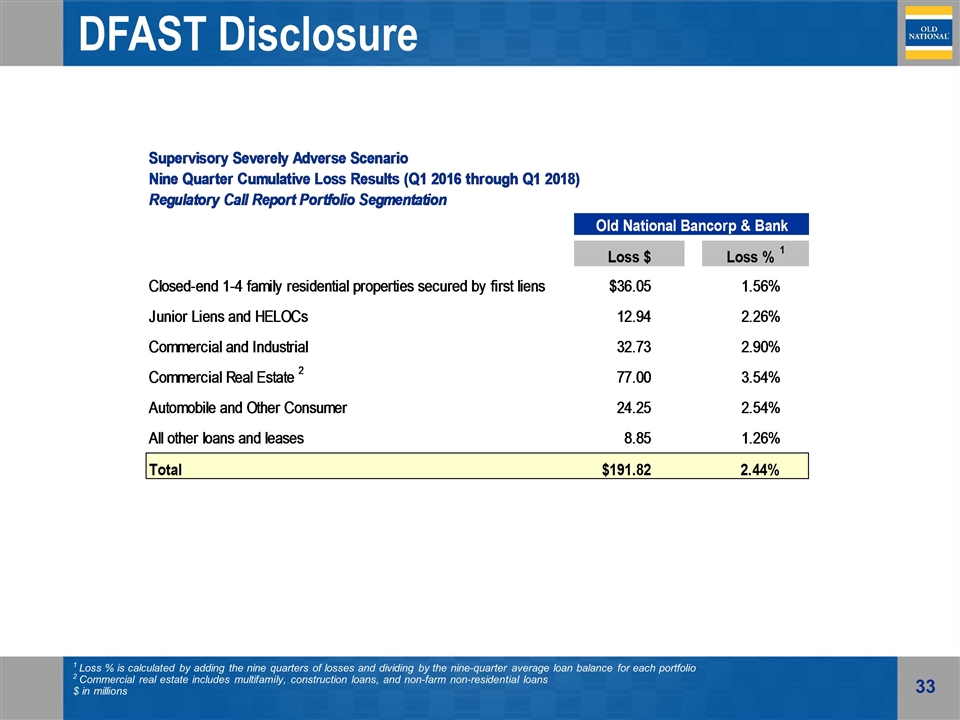
DFAST Disclosure 1 Loss % is calculated by adding the nine quarters of losses and dividing by the nine-quarter average loan balance for each portfolio 2 Commercial real estate includes multifamily, construction loans, and non-farm non-residential loans $ in millions
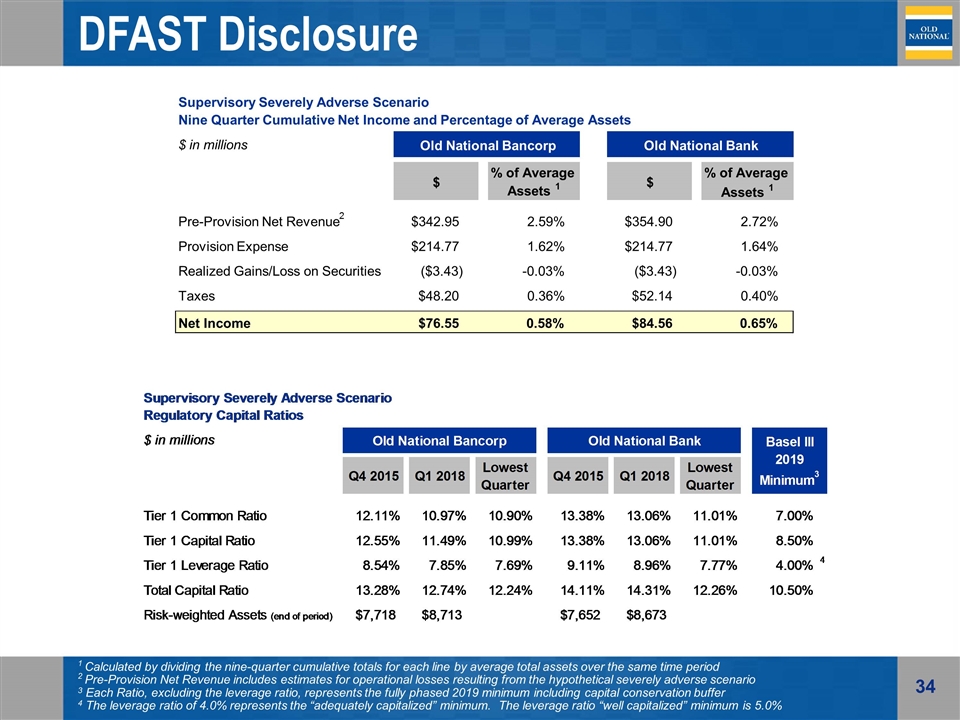
DFAST Disclosure 1 Calculated by dividing the nine-quarter cumulative totals for each line by average total assets over the same time period 2 Pre-Provision Net Revenue includes estimates for operational losses resulting from the hypothetical severely adverse scenario 3 Each Ratio, excluding the leverage ratio, represents the fully phased 2019 minimum including capital conservation buffer 4 The leverage ratio of 4.0% represents the “adequately capitalized” minimum. The leverage ratio “well capitalized” minimum is 5.0% Supervisory Severely Adverse Scenario Nine Quarter Cumulative Net Income and Percentage of Average Assets $ in millions $ % of Average Assets 1 $ % of Average Assets 1 Pre-Provision Net Revenue 2 $342.95 2.59% $354.90 2.72% Provision Expense $214.77 1.62% $214.77 1.64% Realized Gains/Loss on Securities ($3.43) -0.03% ($3.43) -0.03% Taxes $48.20 0.36% $52.14 0.40% Net Income $76.55 0.58% $84.56 0.65% Old National Bancorp Old National Bank
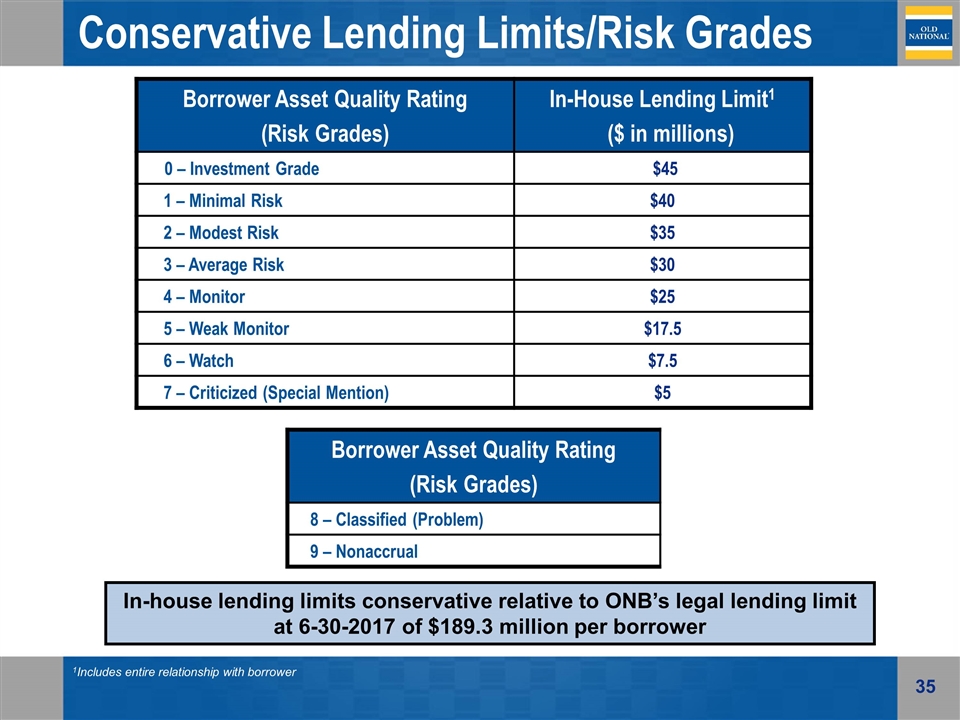
Conservative Lending Limits/Risk Grades Borrower Asset Quality Rating (Risk Grades) In-House Lending Limit1 ($ in millions) 0 – Investment Grade $45 1 – Minimal Risk $40 2 – Modest Risk $35 3 – Average Risk $30 4 – Monitor $25 5 – Weak Monitor $17.5 6 – Watch $7.5 7 – Criticized (Special Mention) $5 In-house lending limits conservative relative to ONB’s legal lending limit at 6-30-2017 of $189.3 million per borrower 1Includes entire relationship with borrower Borrower Asset Quality Rating (Risk Grades) 8 – Classified (Problem) 9 – Nonaccrual
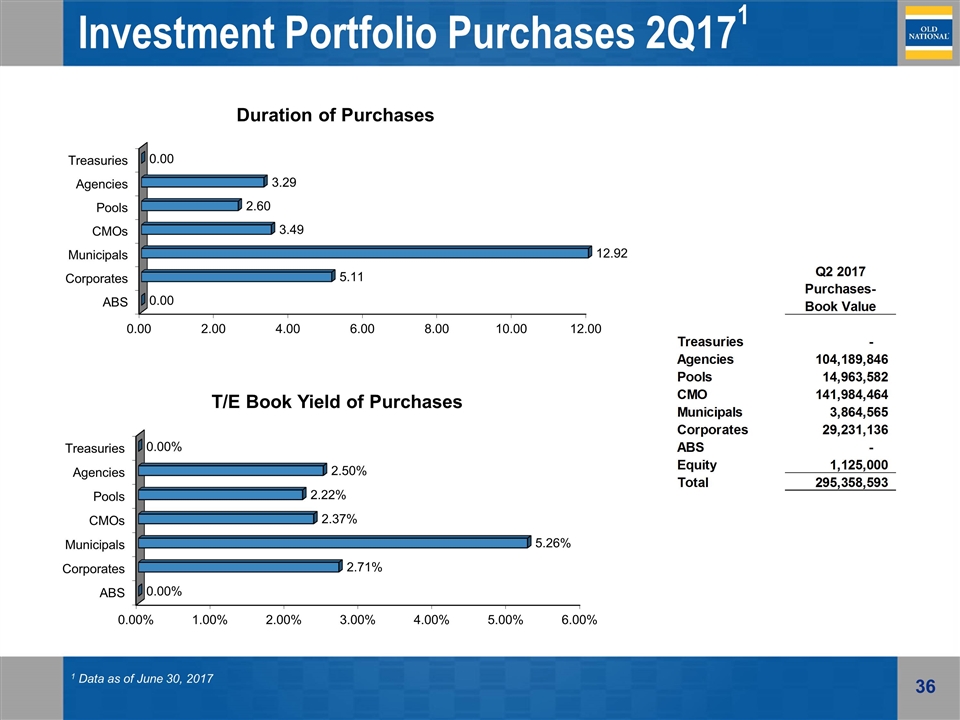
Investment Portfolio Purchases 2Q171 1 Data as of June 30, 2017
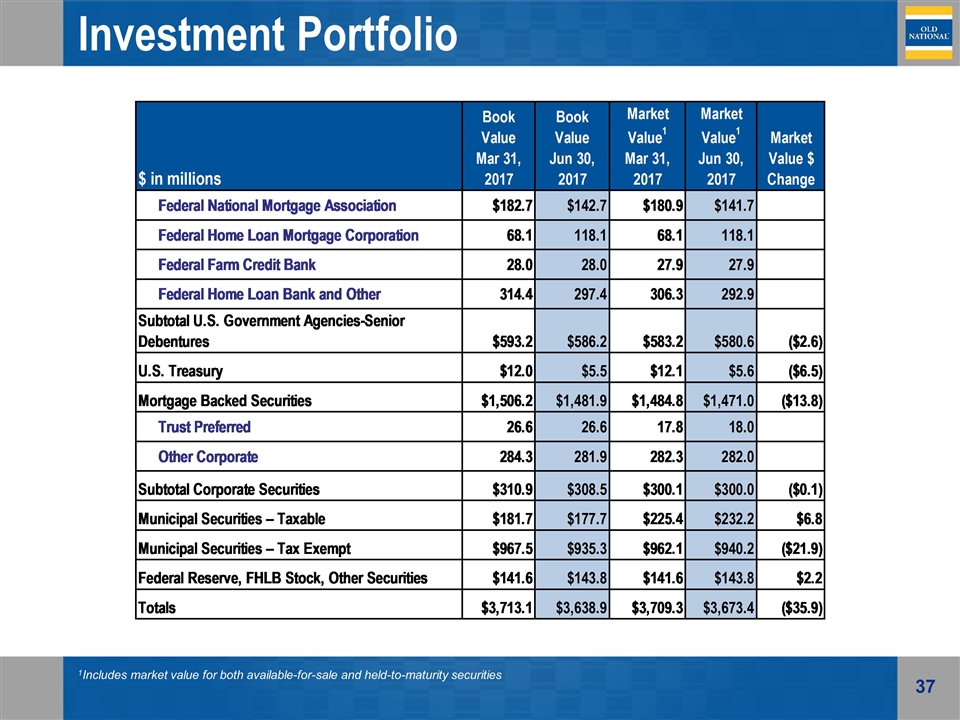
Investment Portfolio 1Includes market value for both available-for-sale and held-to-maturity securities
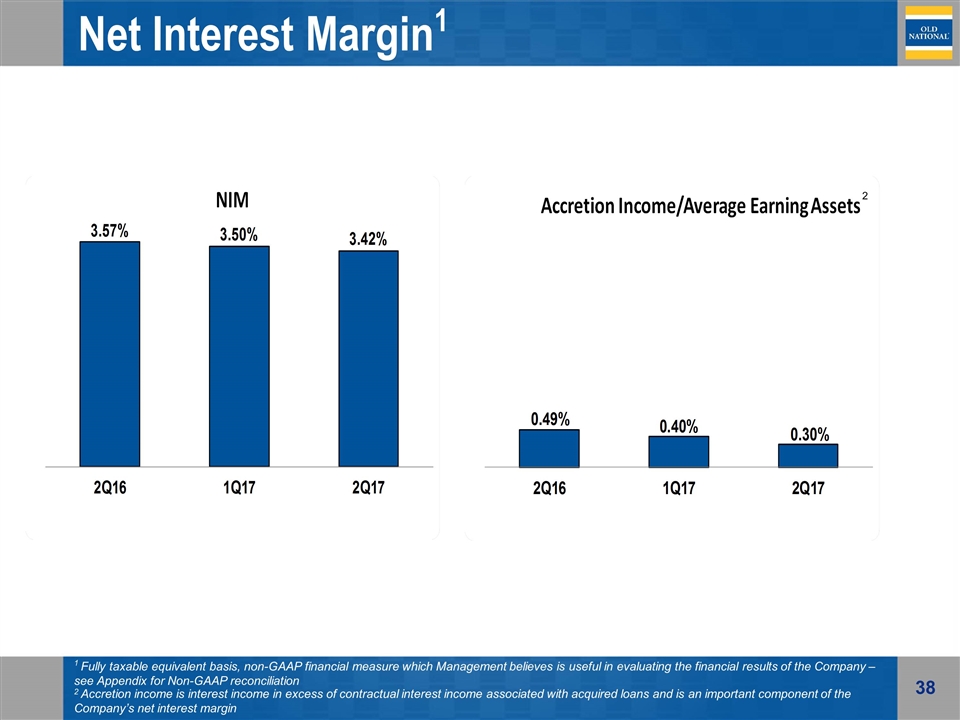
Net Interest Margin1 1 Fully taxable equivalent basis, non-GAAP financial measure which Management believes is useful in evaluating the financial results of the Company – see Appendix for Non-GAAP reconciliation 2 Accretion income is interest income in excess of contractual interest income associated with acquired loans and is an important component of the Company’s net interest margin 2
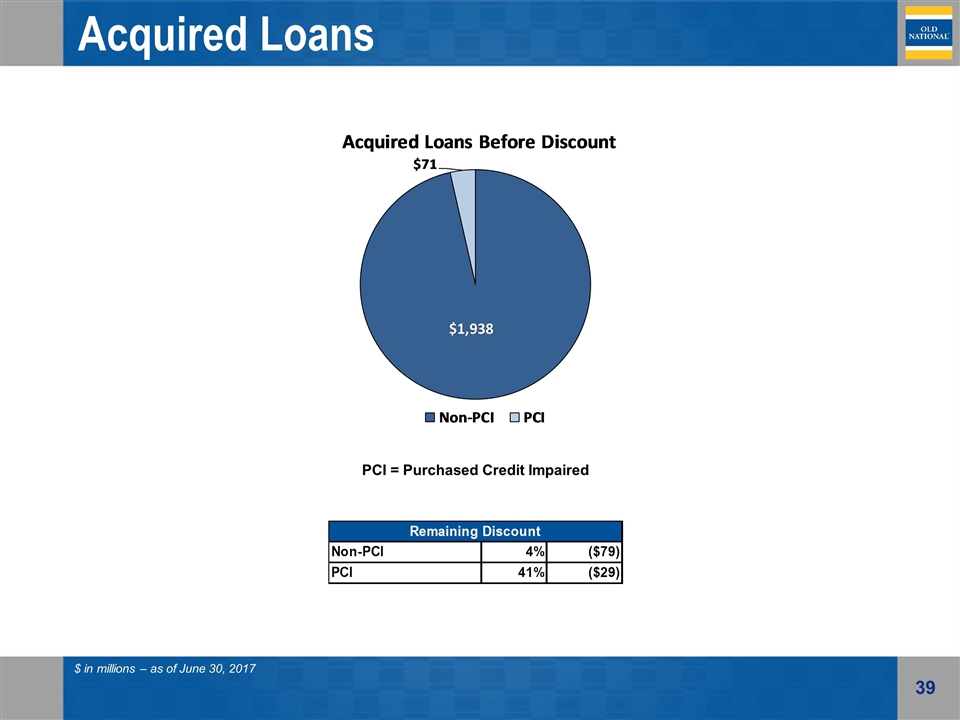
Acquired Loans $ in millions – as of June 30, 2017 PCI = Purchased Credit Impaired
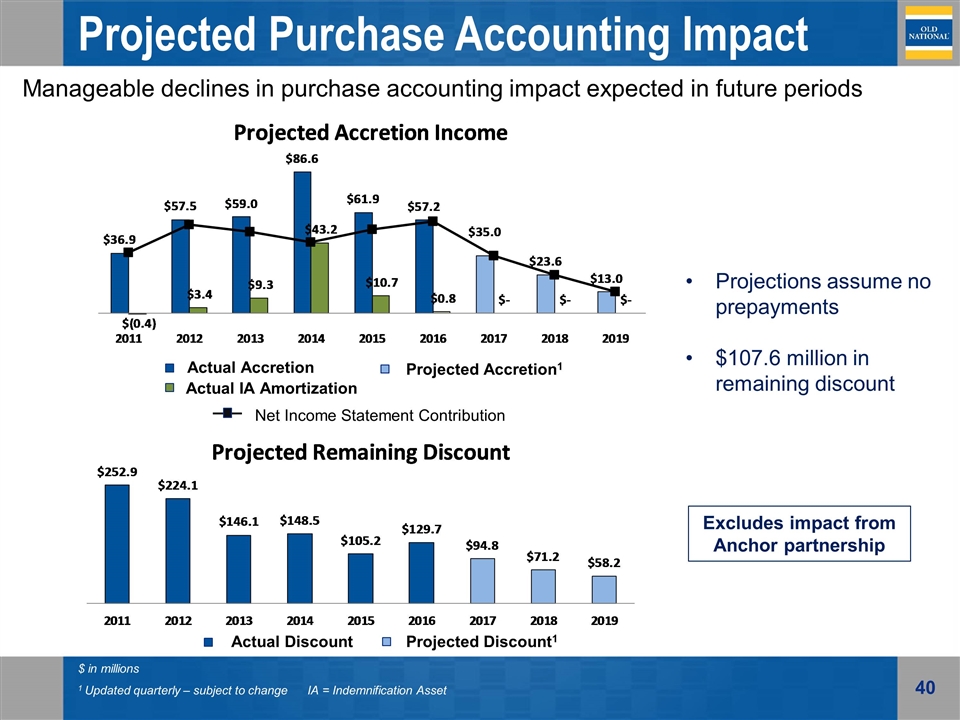
Projected Purchase Accounting Impact Actual Accretion Projected Accretion1 Actual Discount Projected Discount1 $ in millions 1 Updated quarterly – subject to change IA = Indemnification Asset Manageable declines in purchase accounting impact expected in future periods Actual IA Amortization Net Income Statement Contribution Projections assume no prepayments $107.6 million in remaining discount Excludes impact from Anchor partnership
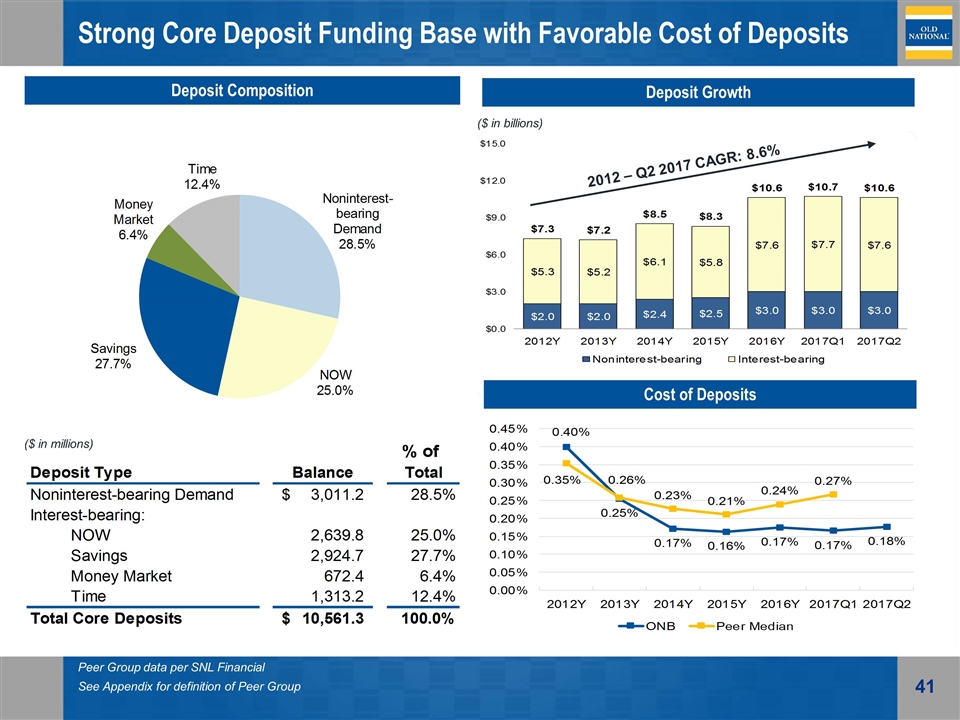
Strong Core Deposit Funding Base with Favorable Cost of Deposits Deposit Composition Deposit Growth ($ in millions) ($ in billions) 2012 – Q2 2017 CAGR: 8.6% Cost of Deposits Peer Group data per SNL Financial See Appendix for definition of Peer Group
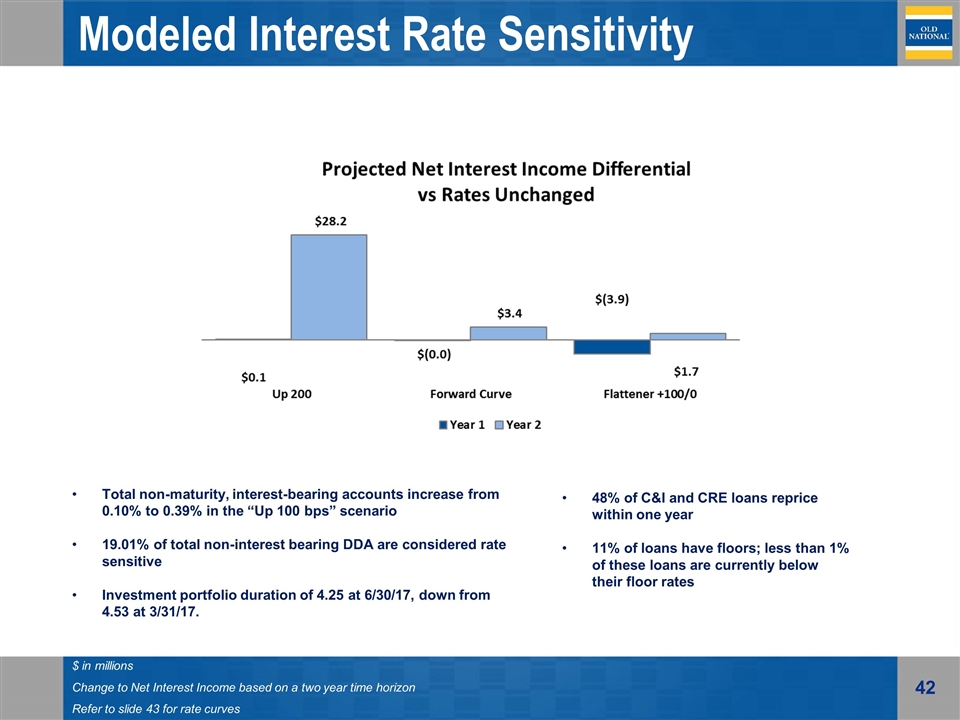
$ in millions Change to Net Interest Income based on a two year time horizon Refer to slide 43 for rate curves Total non-maturity, interest-bearing accounts increase from 0.10% to 0.39% in the “Up 100 bps” scenario 19.01% of total non-interest bearing DDA are considered rate sensitive Investment portfolio duration of 4.25 at 6/30/17, down from 4.53 at 3/31/17. Modeled Interest Rate Sensitivity 48% of C&I and CRE loans reprice within one year 11% of loans have floors; less than 1% of these loans are currently below their floor rates
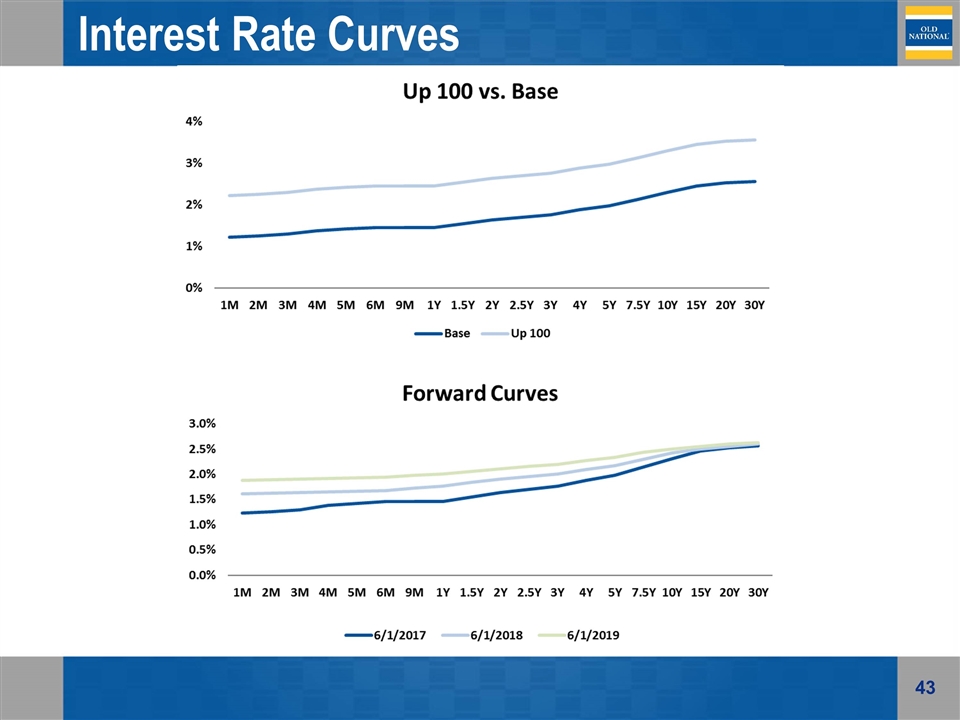
Interest Rate Curves
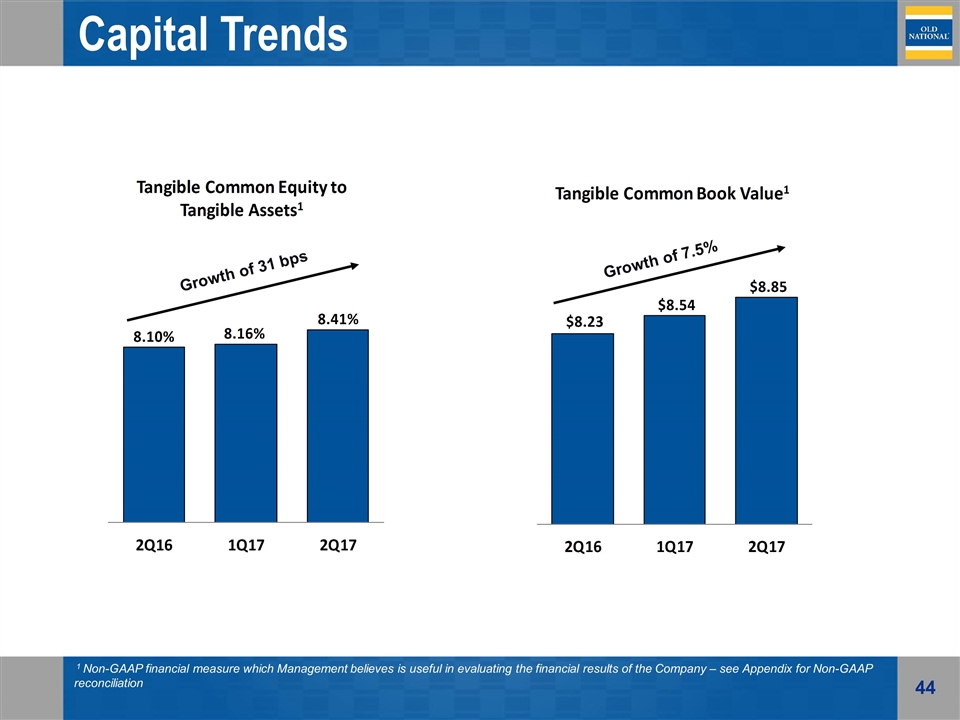
Capital Trends 1 Non-GAAP financial measure which Management believes is useful in evaluating the financial results of the Company – see Appendix for Non-GAAP reconciliation Growth of 7.5% Growth of 31 bps

Fee-Based Business Revenue $ in millions
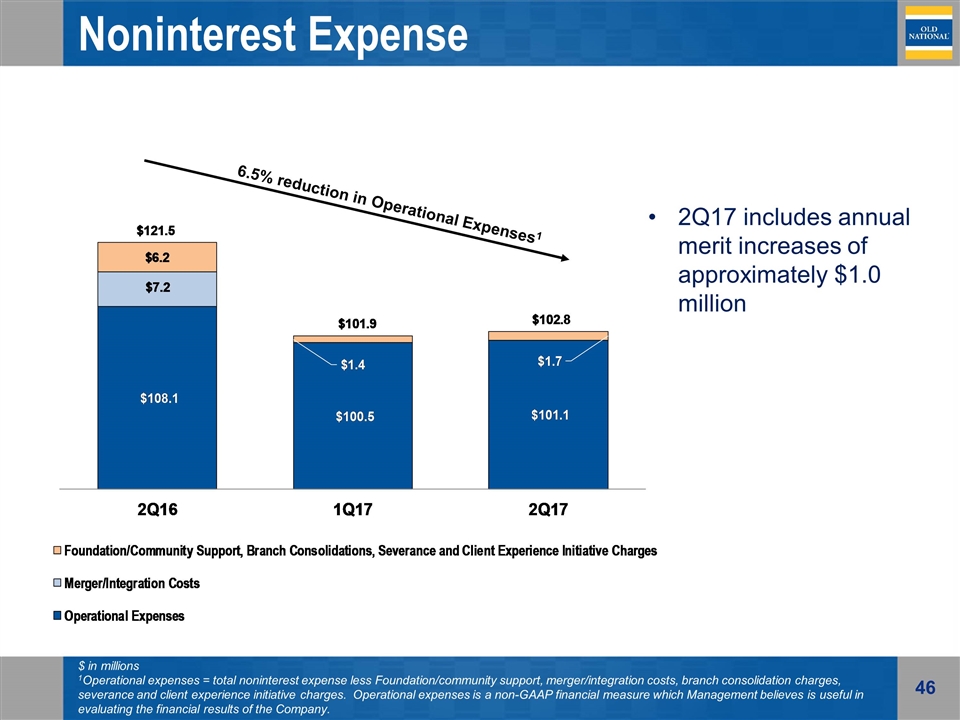
$ in millions 1Operational expenses = total noninterest expense less Foundation/community support, merger/integration costs, branch consolidation charges, severance and client experience initiative charges. Operational expenses is a non-GAAP financial measure which Management believes is useful in evaluating the financial results of the Company. Noninterest Expense 2Q17 includes annual merit increases of approximately $1.0 million 6.5% reduction in Operational Expenses1
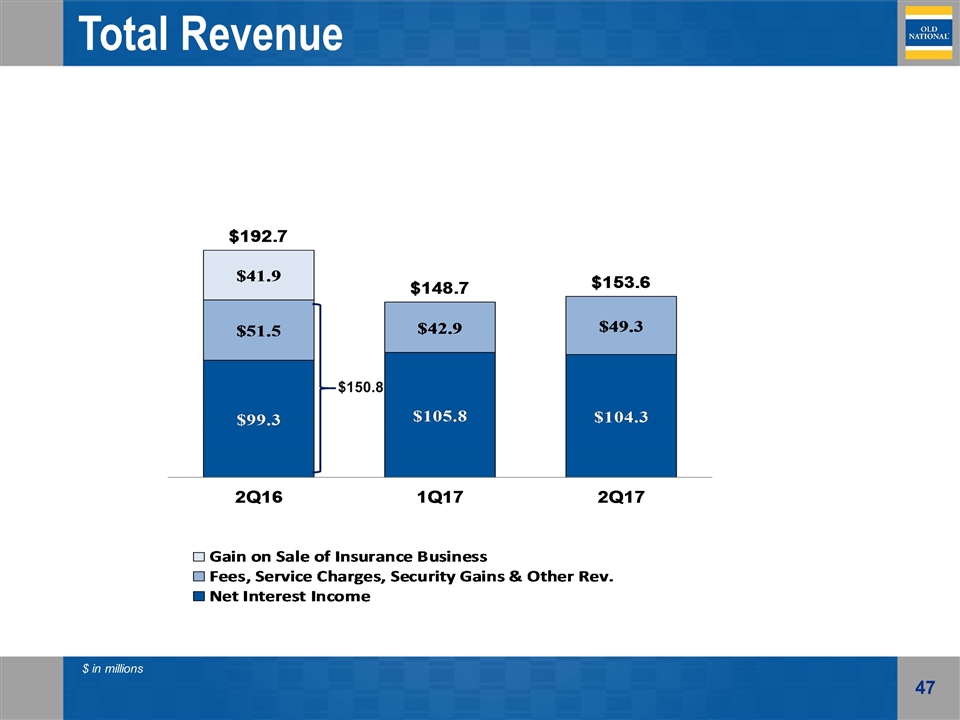
$ in millions Total Revenue $150.8
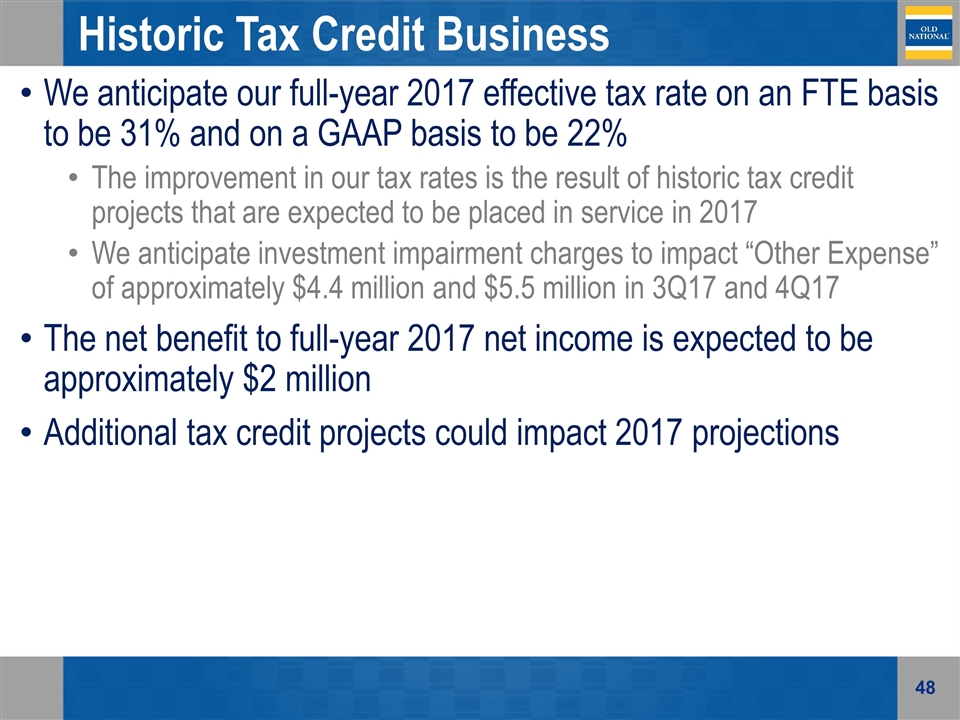
Historic Tax Credit Business We anticipate our full-year 2017 effective tax rate on an FTE basis to be 31% and on a GAAP basis to be 22% The improvement in our tax rates is the result of historic tax credit projects that are expected to be placed in service in 2017 We anticipate investment impairment charges to impact “Other Expense” of approximately $4.4 million and $5.5 million in 3Q17 and 4Q17 The net benefit to full-year 2017 net income is expected to be approximately $2 million Additional tax credit projects could impact 2017 projections
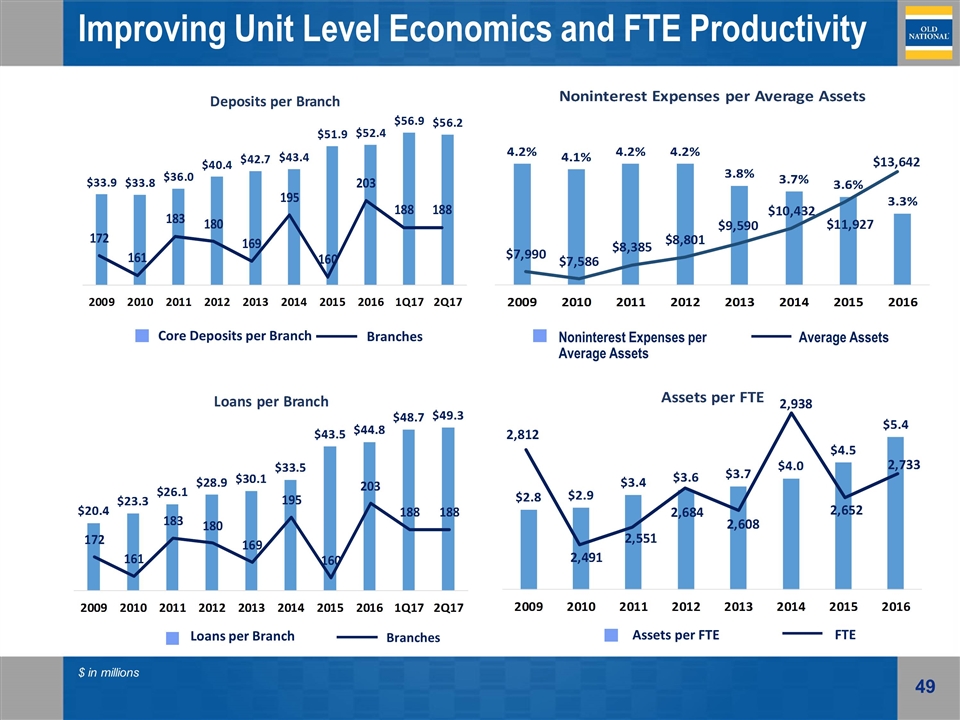
Improving Unit Level Economics and FTE Productivity Core Deposits per Branch Branches $ in millions Noninterest Expenses per Average Assets Average Assets
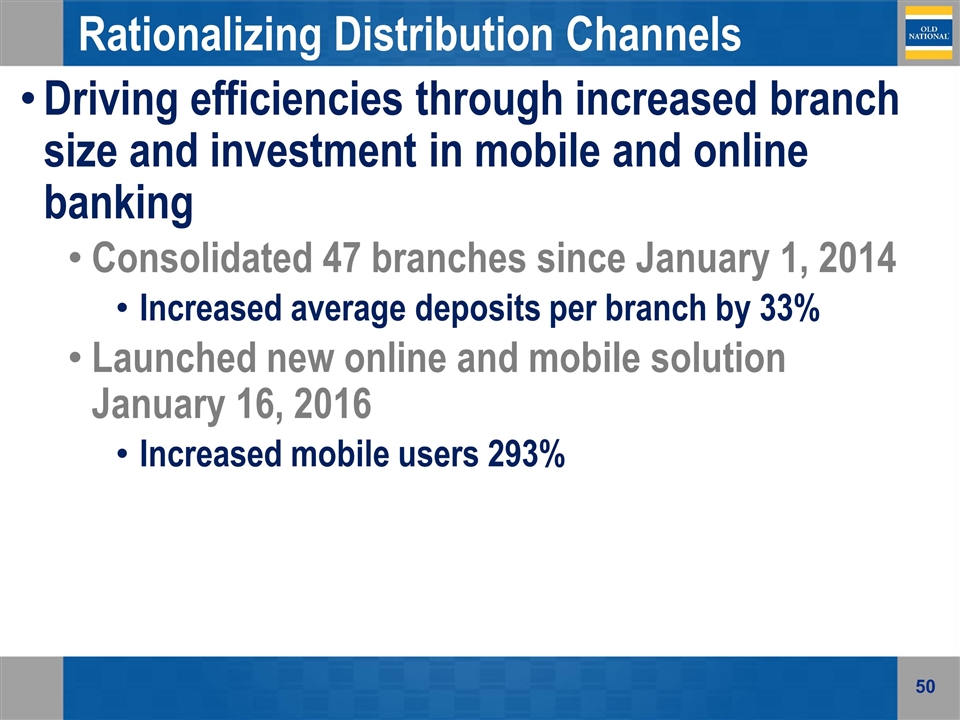
Rationalizing Distribution Channels Driving efficiencies through increased branch size and investment in mobile and online banking Consolidated 47 branches since January 1, 2014 Increased average deposits per branch by 33% Launched new online and mobile solution January 16, 2016 Increased mobile users 293%
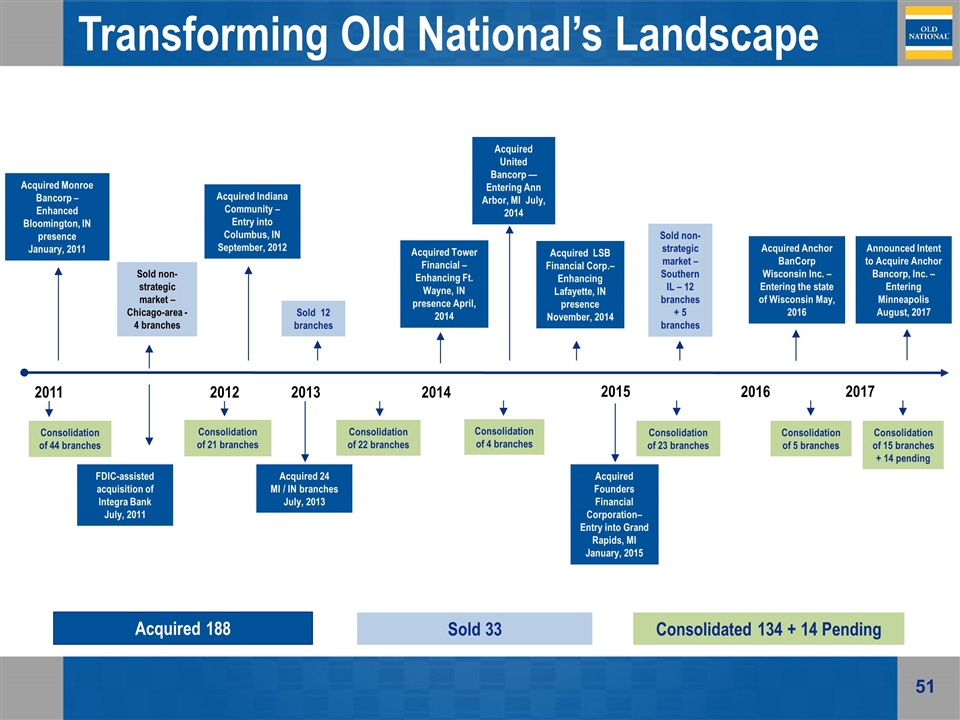
2011 2012 2013 Acquired Monroe Bancorp – Enhanced Bloomington, IN presence January, 2011 Acquired Indiana Community – Entry into Columbus, IN September, 2012 FDIC-assisted acquisition of Integra Bank July, 2011 Sold non-strategic market – Chicago-area - 4 branches Consolidation of 21 branches Acquired 24 MI / IN branches July, 2013 Consolidation of 44 branches Sold 12 branches Consolidation of 22 branches Acquired 188 Sold 33 Consolidated 134 + 14 Pending Acquired Tower Financial – Enhancing Ft. Wayne, IN presence April, 2014 Acquired United Bancorp — Entering Ann Arbor, MI July, 2014 2014 Consolidation of 4 branches Acquired LSB Financial Corp.– Enhancing Lafayette, IN presence November, 2014 Acquired Founders Financial Corporation– Entry into Grand Rapids, MI January, 2015 2015 Consolidation of 23 branches Transforming Old National’s Landscape Sold non-strategic market – Southern IL – 12 branches + 5 branches 2016 Acquired Anchor BanCorp Wisconsin Inc. – Entering the state of Wisconsin May, 2016 Consolidation of 5 branches 2017 Consolidation of 15 branches + 14 pending Announced Intent to Acquire Anchor Bancorp, Inc. – Entering Minneapolis August, 2017
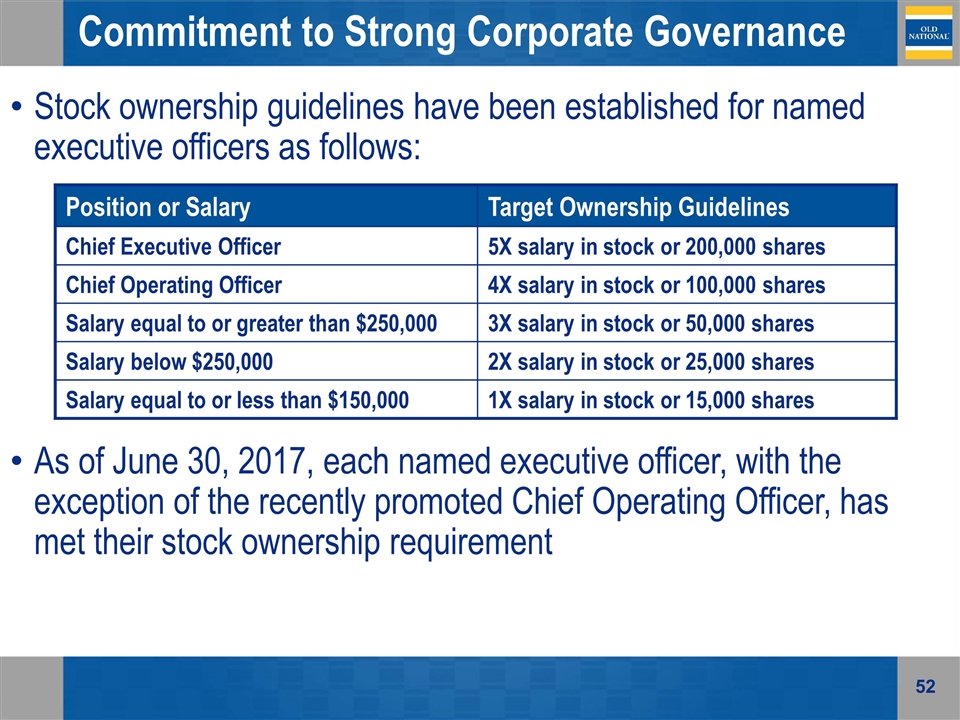
Position or Salary Target Ownership Guidelines Chief Executive Officer 5X salary in stock or 200,000 shares Chief Operating Officer 4X salary in stock or 100,000 shares Salary equal to or greater than $250,000 3X salary in stock or 50,000 shares Salary below $250,000 2X salary in stock or 25,000 shares Salary equal to or less than $150,000 1X salary in stock or 15,000 shares Stock ownership guidelines have been established for named executive officers as follows: As of June 30, 2017, each named executive officer, with the exception of the recently promoted Chief Operating Officer, has met their stock ownership requirement Commitment to Strong Corporate Governance
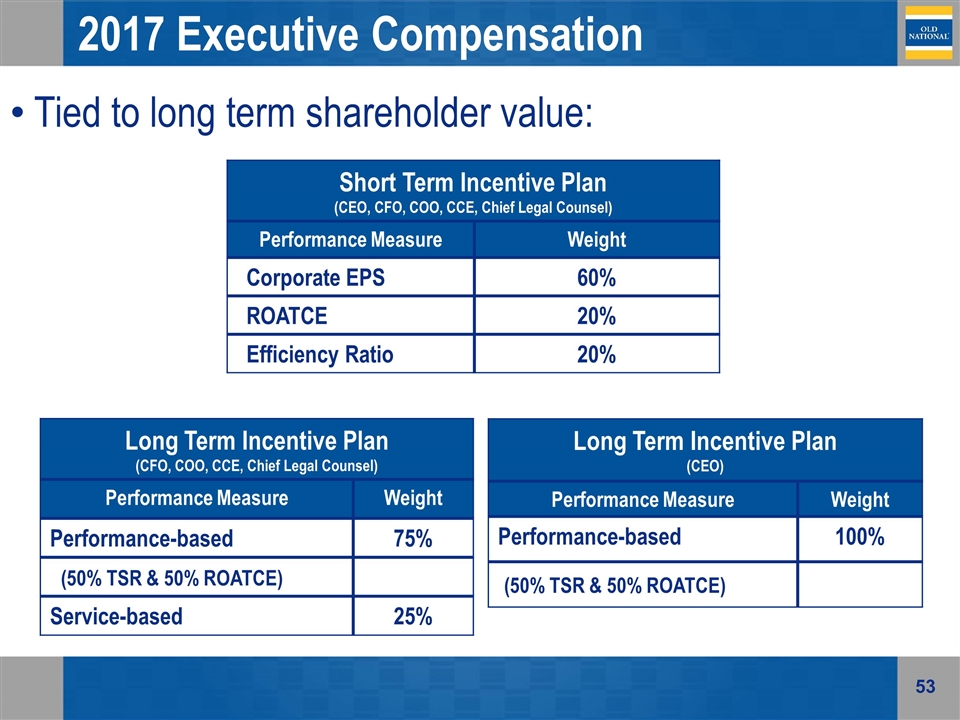
2017 Executive Compensation Short Term Incentive Plan (CEO, CFO, COO, CCE, Chief Legal Counsel) Performance Measure Weight Corporate EPS 60% ROATCE 20% Efficiency Ratio 20% Tied to long term shareholder value: Long Term Incentive Plan (CFO, COO, CCE, Chief Legal Counsel) Performance Measure Weight Performance-based 75% (50% TSR & 50% ROATCE) Service-based 25% Long Term Incentive Plan (CEO) Performance Measure Weight Performance-based 100% (50% TSR & 50% ROATCE)
Appendix
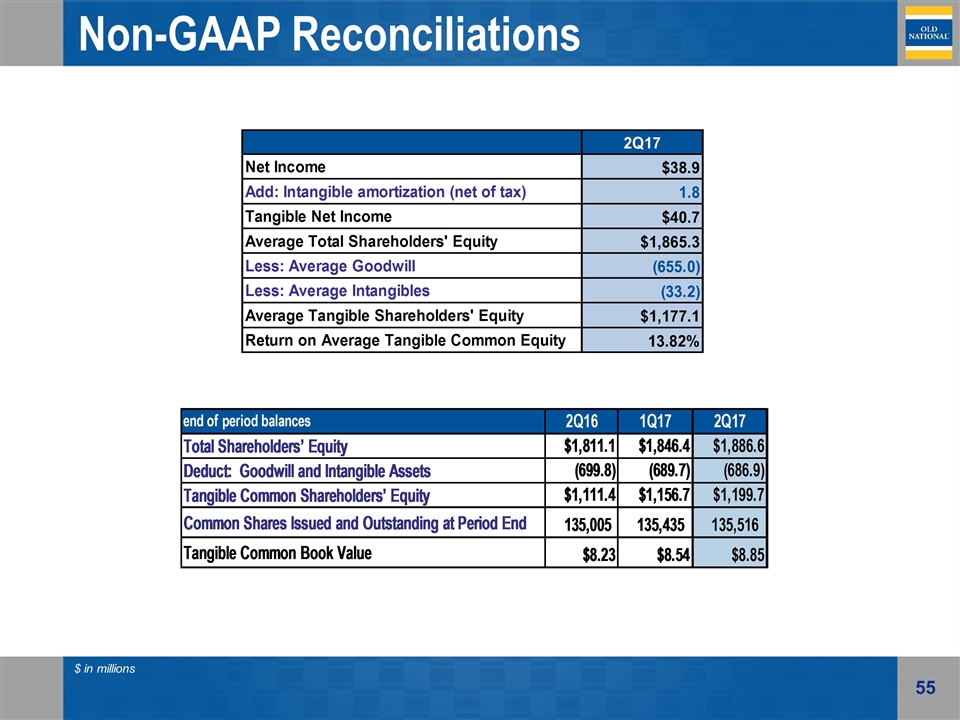
Non-GAAP Reconciliations $ in millions
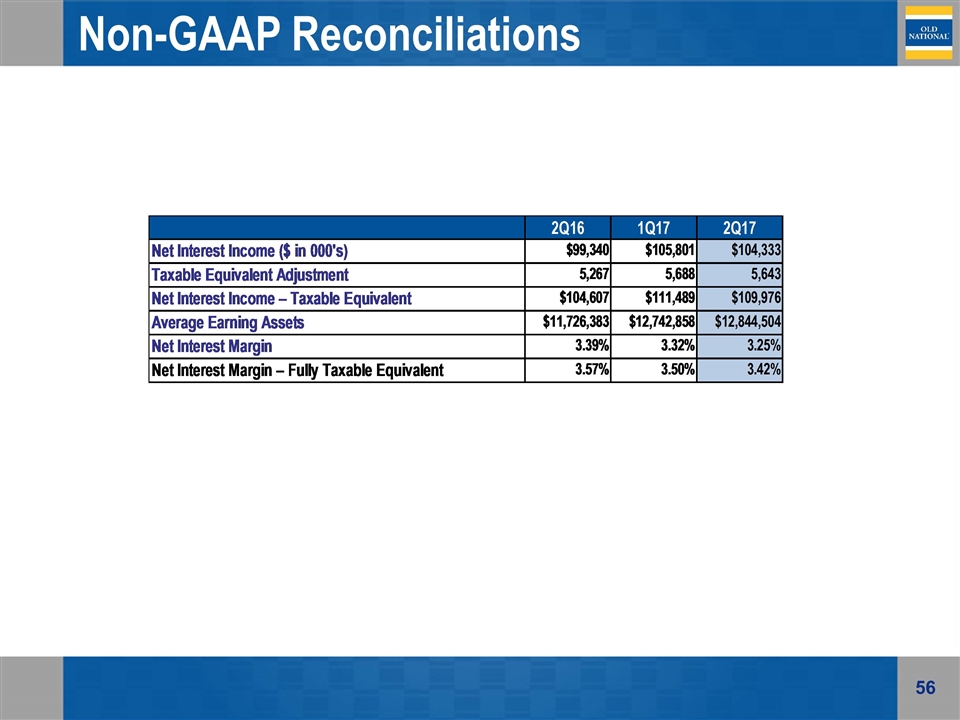
Non-GAAP Reconciliations
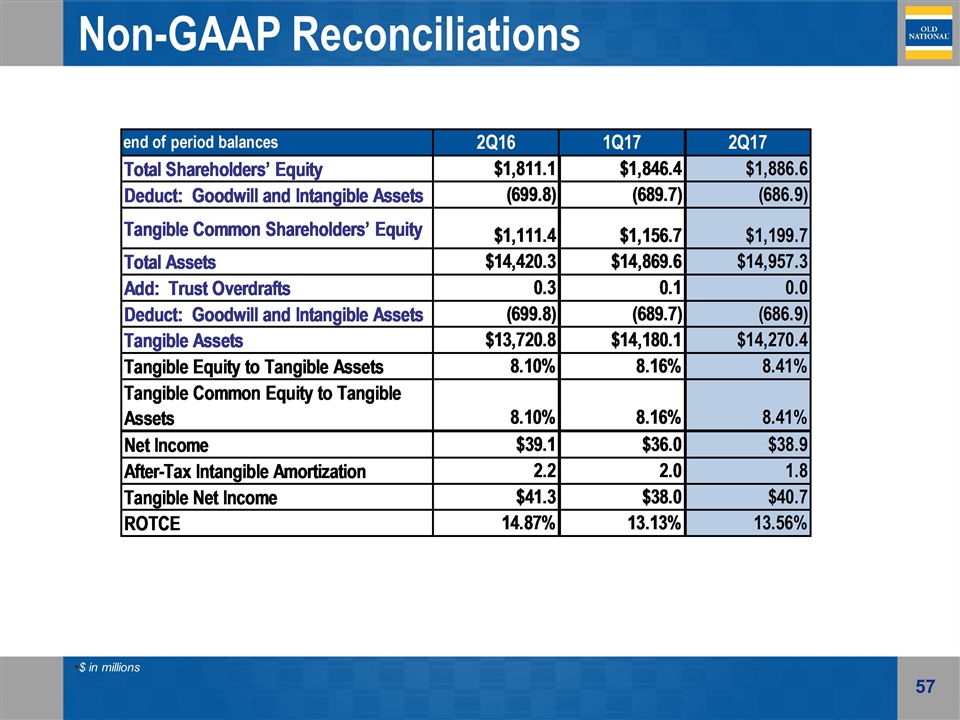
Non-GAAP Reconciliations $ in millions
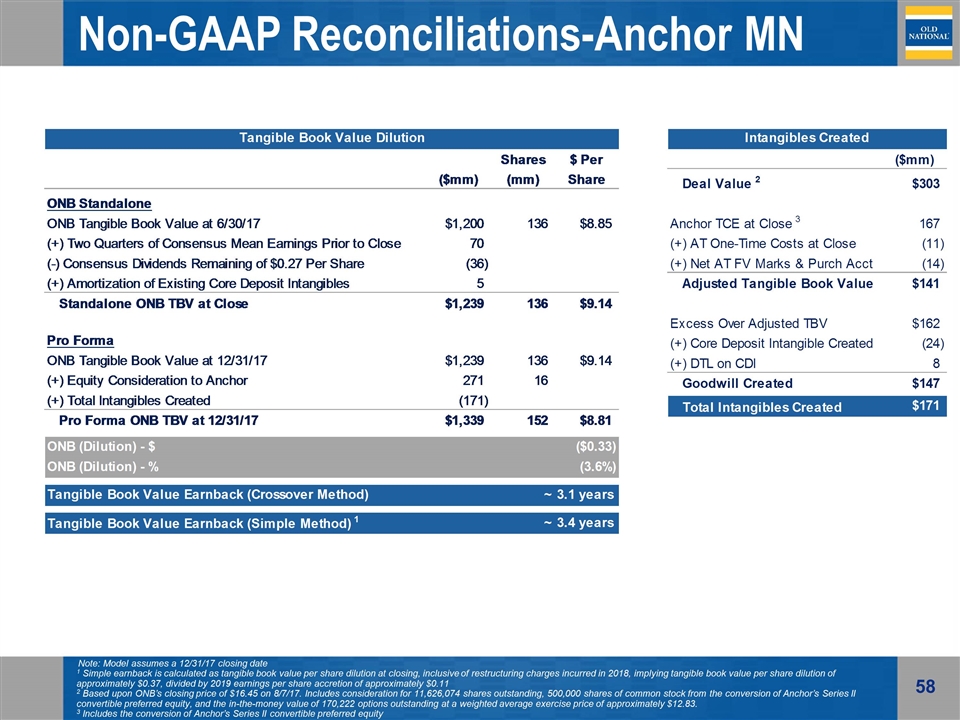
Non-GAAP Reconciliations-Anchor MN Note: Model assumes a 12/31/17 closing date 1 Simple earnback is calculated as tangible book value per share dilution at closing, inclusive of restructuring charges incurred in 2018, implying tangible book value per share dilution of approximately $0.37, divided by 2019 earnings per share accretion of approximately $0.11 2 Based upon ONB’s closing price of $16.45 on 8/7/17. Includes consideration for 11,626,074 shares outstanding, 500,000 shares of common stock from the conversion of Anchor’s Series II convertible preferred equity, and the in-the-money value of 170,222 options outstanding at a weighted average exercise price of approximately $12.83. 3 Includes the conversion of Anchor’s Series II convertible preferred equity
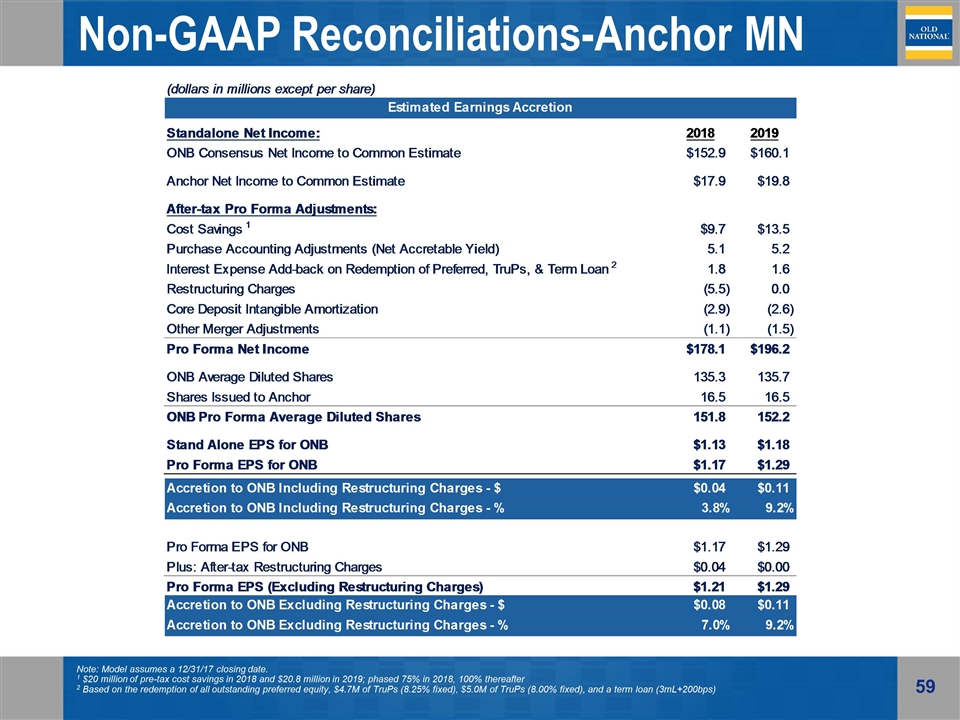
Non-GAAP Reconciliations-Anchor MN Note: Model assumes a 12/31/17 closing date. 1 $20 million of pre-tax cost savings in 2018 and $20.8 million in 2019; phased 75% in 2018, 100% thereafter 2 Based on the redemption of all outstanding preferred equity, $4.7M of TruPs (8.25% fixed), $5.0M of TruPs (8.00% fixed), and a term loan (3mL+200bps)
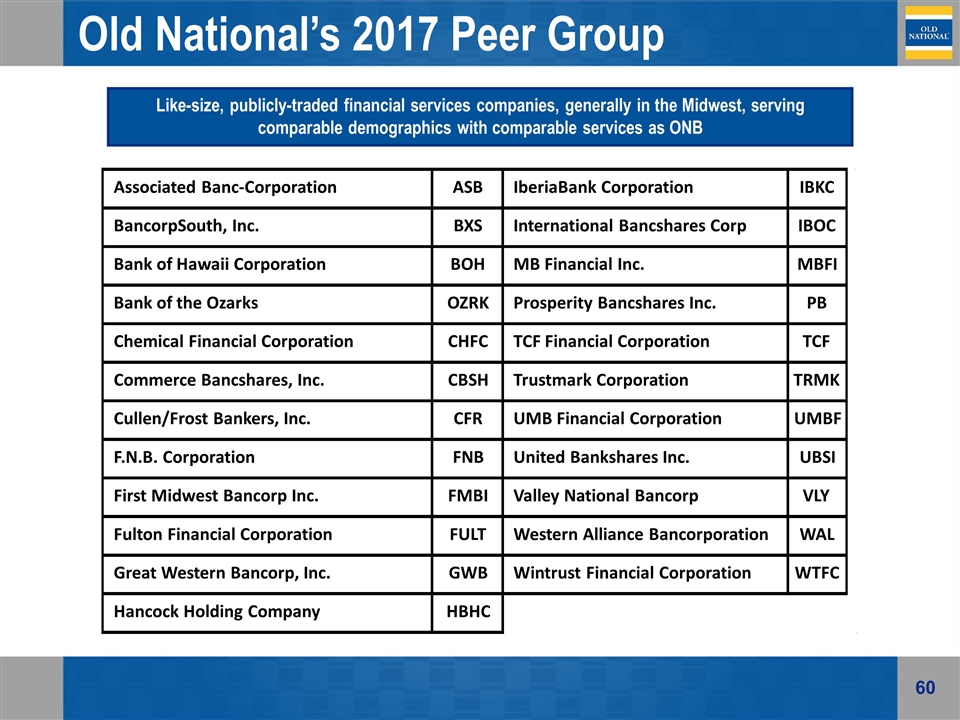
Old National’s 2017 Peer Group Like-size, publicly-traded financial services companies, generally in the Midwest, serving comparable demographics with comparable services as ONB Associated Banc-Corporation ASB IberiaBank Corporation IBKC BancorpSouth, Inc. BXS International Bancshares Corp IBOC Bank of Hawaii Corporation BOH MB Financial Inc. MBFI Bank of the Ozarks OZRK Prosperity Bancshares Inc. PB Chemical Financial Corporation CHFC TCF Financial Corporation TCF Commerce Bancshares, Inc. CBSH Trustmark Corporation TRMK Cullen/Frost Bankers, Inc. CFR UMB Financial Corporation UMBF F.N.B. Corporation FNB United Bankshares Inc. UBSI First Midwest Bancorp Inc. FMBI Valley National Bancorp VLY Fulton Financial Corporation FULT Western Alliance Bancorporation WAL Great Western Bancorp, Inc. GWB Wintrust Financial Corporation WTFC Hancock Holding Company HBHC

Old National Investor Relations Contact Additional information can be found on the Investor Relations web pages at www.oldnational.com Investor Inquiries: Lynell J. Walton, CPA SVP – Director of Investor Relations 812-464-1366 lynell.walton@oldnational.com


