Investment Thesis FINANCIAL DATA AS OF June 30, 2022 DATED: August 2022 Exhibit 99.1
2 Executive Summary Slides 5 — 14

3 Forward-Looking Statements These materials contain certain "forward-looking statements" within the meaning of the Private Securities Litigation Reform Act of 1995. These statements include, but are not limited to, descriptions of Old National’s financial condition, results of operations, assets, credit quality and cost save trends, profitability and business plans or opportunities. Forward-looking statements can be identified by the use of the words "anticipate," "believe," "contemplate," "could," "estimate," "expect," "intend," "may," "outlook," "plan," "should," and "will," and other words of similar meaning. These forward-looking statements express management’s current expectations or forecasts of future events and, by their nature, are subject to risks and uncertainties. There are a number of factors that could cause actual results or outcomes to differ materially from those in such statements. Factors that might cause such a difference include, but are not limited to: the continued impact of the COVID-19 pandemic on our business and team members as well as the business of our customers; competition; government legislation, regulations and policies; ability of Old National to execute its business plan, including the completion of the integration related to the merger between Old National and First Midwest and the achievement of the synergies and other benefits from the merger; changes in economic conditions which could materially impact credit quality and the ability to generate loans and gather deposits; failure or circumvention of our internal controls; unanticipated changes in our liquidity position; sufficiency of our allowance for credit losses; operational or risk management failure by critical vendors or third parties; business interruptions or fraud risks; significant changes in accounting, tax or regulatory practices or requirements; new legal obligations; disruptive technologies in payment systems and other services traditionally provided by banks; failure or disruption of our information systems; computer hacking and other cybersecurity threats; other matters discussed in these materials; and other factors identified in our Annual Report on Form 10-K for the year ended December 31, 2021 and other filings with the Securities and Exchange Commission. These forward-looking statements are made only as of the date of these materials and are not guarantees of future results or performance, and Old National does not undertake an obligation to update these forward-looking statements to reflect events or conditions after the date of these materials.

4 Non-GAAP Financial Measures The Company's accounting and reporting policies conform to U.S. generally accepted accounting principles ("GAAP") and general practices within the banking industry. As a supplement to GAAP, the Company provides non-GAAP performance results, which the Company believes are useful because they assist investors in assessing the Company's operating performance. Where non-GAAP financial measures are used, the comparable GAAP financial measure, as well as the reconciliation to the comparable GAAP financial measure, can be found in the tables of this release. The Company presents EPS, the efficiency ratio, return on average common equity, and return on average tangible common equity, all adjusted for certain notable items. These items include the CECL Day 1 non-PCD provision expense, merger related charges associated with completed acquisitions, ONB Way charges, and net securities gains. Management believes excluding these items from EPS, the efficiency ratio, return on average common equity, and return on average tangible common equity may be useful in assessing the Company's underlying operational performance since these transactions do not pertain to its core business operations and their exclusion may facilitate better comparability between periods. Management believes that excluding merger related charges and the CECL Day 1 non-PCD provision expense from these metrics may be useful to the Company, as well as analysts and investors, since these expenses can vary significantly based on the size, type, and structure of each acquisition. Additionally, management believes excluding these items from these metrics may enhance comparability for peer comparison purposes. The Company presents loans excluding PPP loans, as well as deposits, both on a historical combined basis. Management believes that comparisons of balance sheet balances to legacy periods are not meaningful due to the merger with First Midwest. The Company presents loans excluding PPP loans as management believes that excluding PPP loans is useful to facilitate better comparability between periods. PPP loans are fully guaranteed by the Small Business Administration and are expected to be forgiven if the applicable criteria are met. Additionally, management believes excluding PPP loans from this item may enhance comparability for peer comparison. Income tax expense, provision for credit losses, and the certain notable items listed above are excluded from the calculation of pre-provision net revenues, adjusted due to the fluctuation in income before income tax and the level of provision for credit losses required. Management believes pre-provision net revenues, adjusted may be useful in assessing the Company's underlying operating performance and their exclusion may facilitate better comparability between periods and for peer comparison purposes. The Company presents adjusted noninterest expense, which excludes merger related charges, ONB Way charges and amortization of tax credit investments. Management believes that excluding these items from noninterest expense may be useful in assessing the Company’s underlying operational performance as these items either do not pertain to its core business operations or their exclusion may facilitate better comparability between periods and for peer comparison purposes. The tax-equivalent adjustment to net interest income and net interest margin recognizes the income tax savings when comparing taxable and tax-exempt assets. Interest income and yields on tax-exempt securities and loans are presented using the current federal income tax rate of 21%. Management believes that it is standard practice in the banking industry to present net interest income and net interest margin on a fully tax-equivalent basis and that it may enhance comparability for peer comparison purposes. In management's view, tangible common equity measures are capital adequacy metrics that may be meaningful to the Company, as well as analysts and investors, in assessing the Company's use of equity and in facilitating comparisons with peers. These non-GAAP measures are valuable indicators of a financial institution's capital strength since they eliminate intangible assets from shareholders' equity and retain the effect of accumulated other comprehensive loss in shareholders' equity. Although intended to enhance investors' understanding of the Company's business and performance, these non-GAAP financial measures should not be considered an alternative to GAAP. In addition, these non-GAAP financial measures may differ from those used by other financial institutions to assess their business and performance. See the previously provided tables and the following reconciliations in the "Non-GAAP Reconciliations" section for details on the calculation of these measures to the extent presented herein.

5 Commitment to Excellence
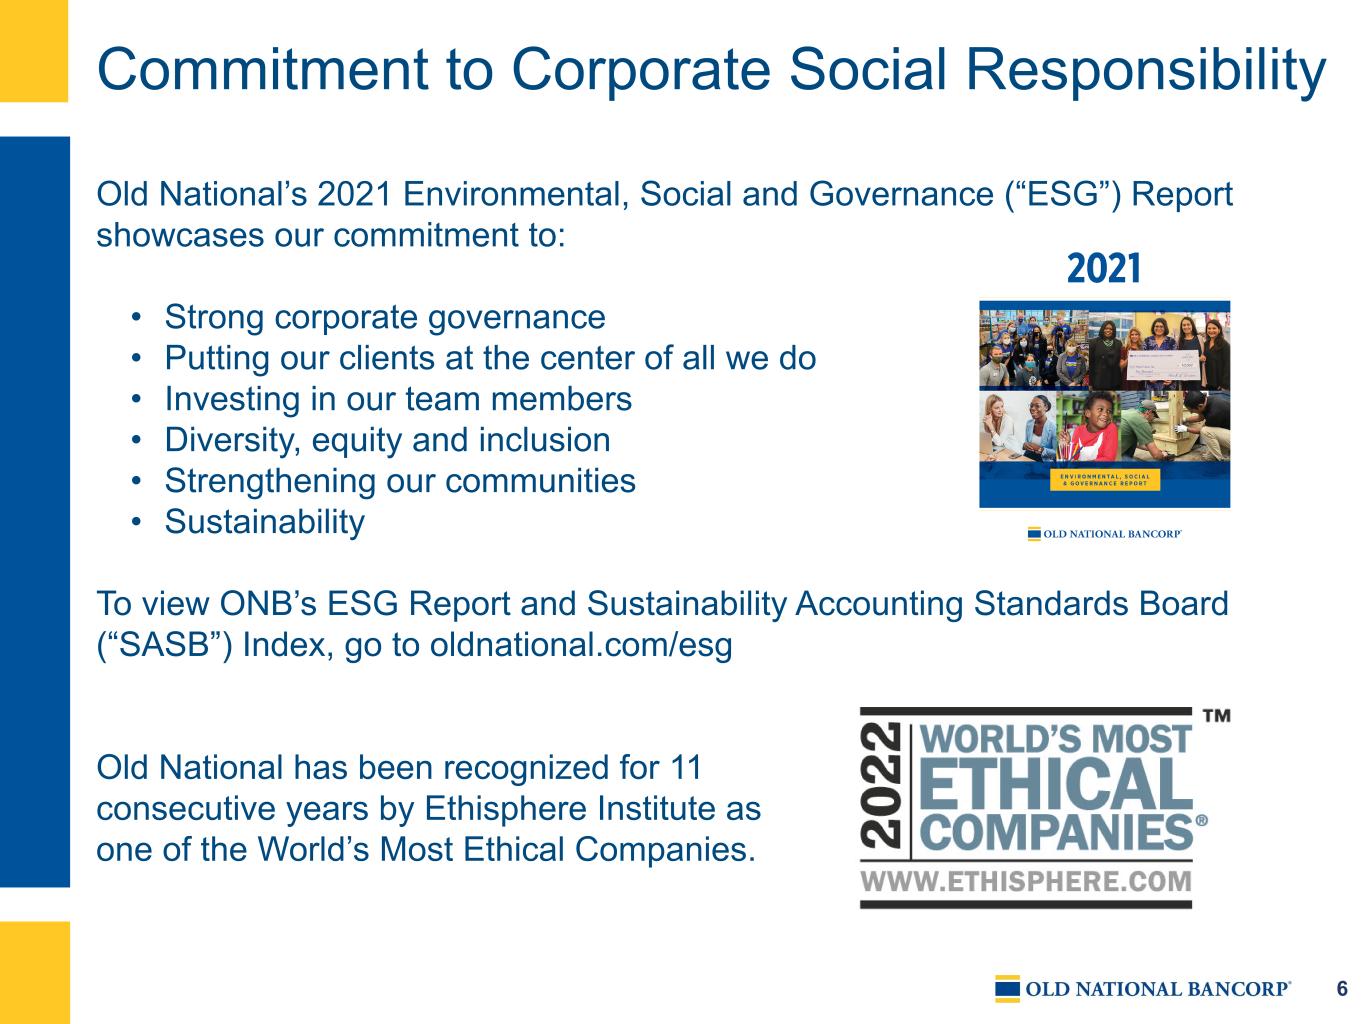
6 Commitment to Corporate Social Responsibility Old National’s 2021 Environmental, Social and Governance (“ESG”) Report showcases our commitment to: • Strong corporate governance • Putting our clients at the center of all we do • Investing in our team members • Diversity, equity and inclusion • Strengthening our communities • Sustainability To view ONB’s ESG Report and Sustainability Accounting Standards Board (“SASB”) Index, go to oldnational.com/esg Old National has been recognized for 11 consecutive years by Ethisphere Institute as one of the World’s Most Ethical Companies.
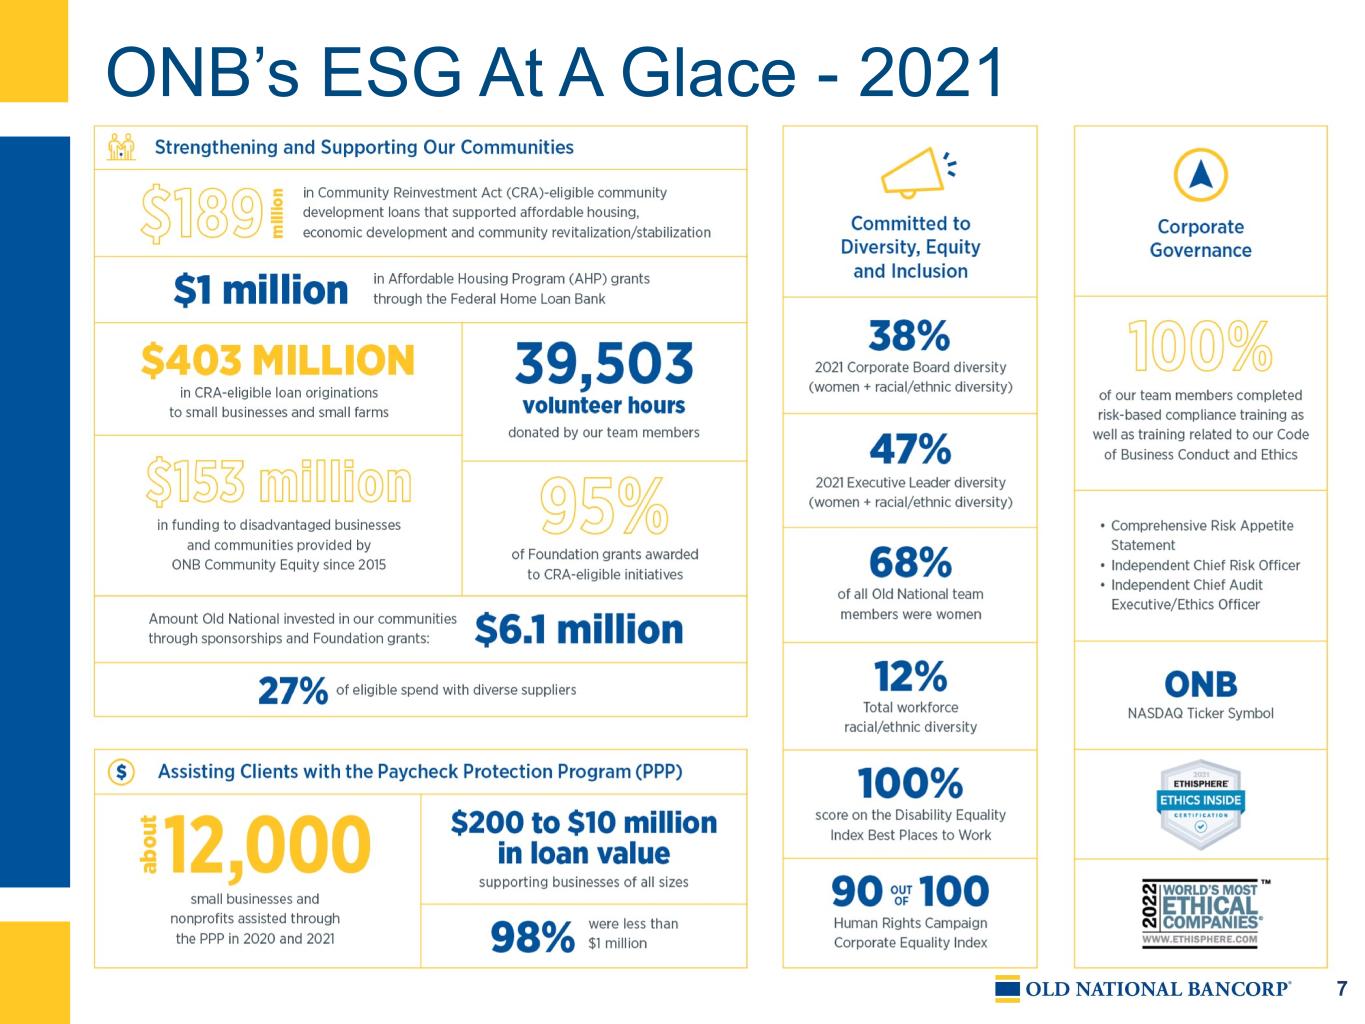
7 ONB’s ESG At A Glace - 2021
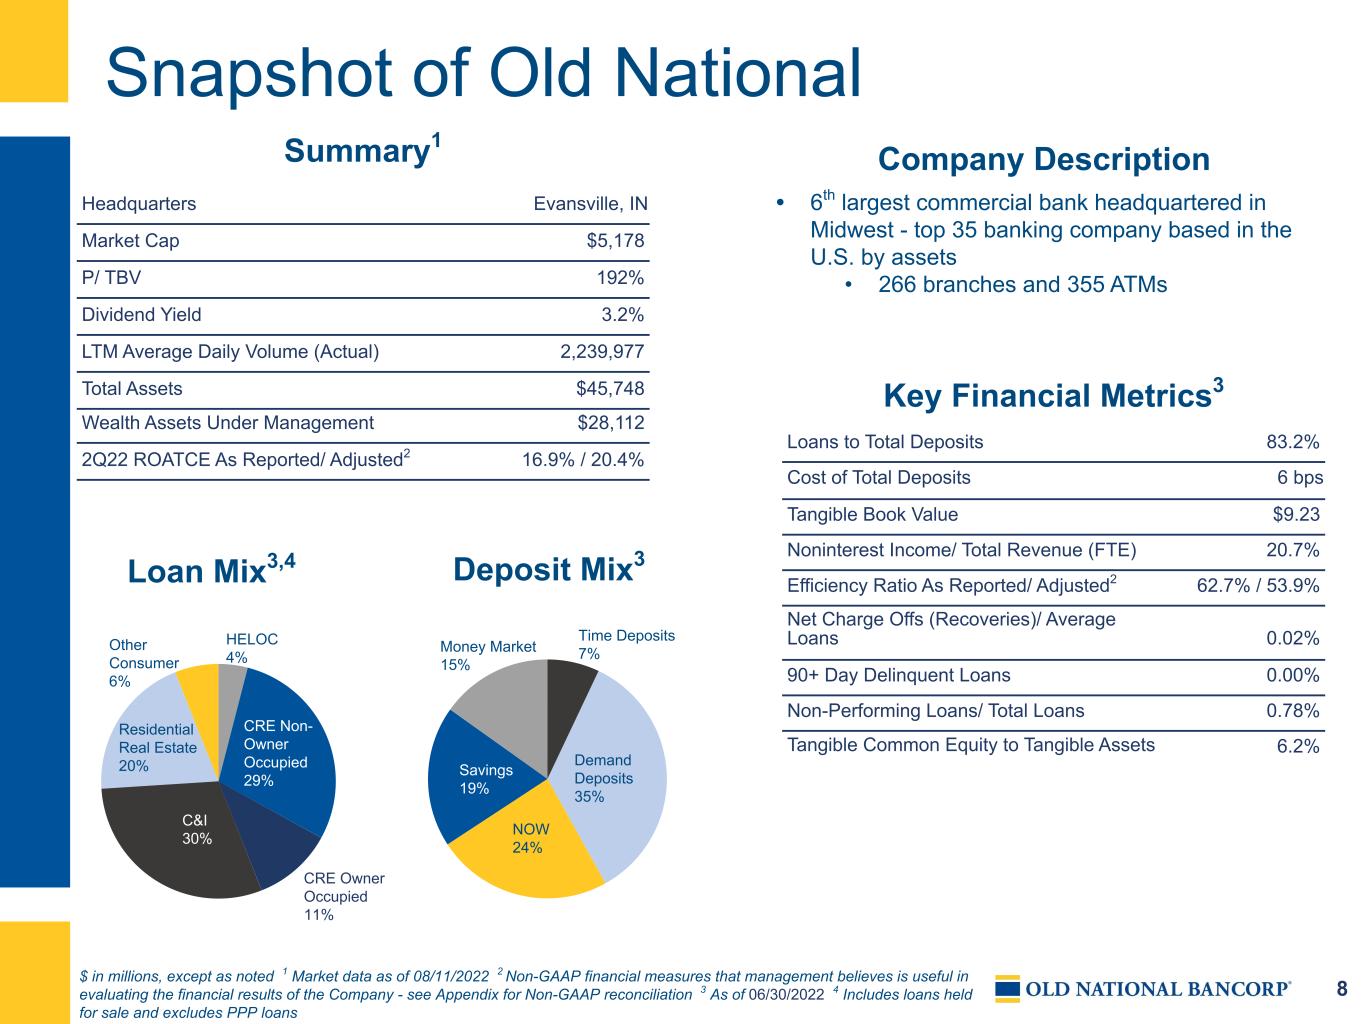
8 HELOC 4% CRE Non- Owner Occupied 29% CRE Owner Occupied 11% C&I 30% Residential Real Estate 20% Other Consumer 6% Snapshot of Old National $ in millions, except as noted 1 Market data as of 08/11/2022 2 Non-GAAP financial measures that management believes is useful in evaluating the financial results of the Company - see Appendix for Non-GAAP reconciliation 3 As of 06/30/2022 4 Includes loans held for sale and excludes PPP loans Summary1 Headquarters Evansville, IN Market Cap $5,178 P/ TBV 192% Dividend Yield 3.2% LTM Average Daily Volume (Actual) 2,239,977 Total Assets $45,748 Wealth Assets Under Management $28,112 2Q22 ROATCE As Reported/ Adjusted2 16.9% / 20.4% Key Financial Metrics3 Loans to Total Deposits 83.2% Cost of Total Deposits 6 bps Tangible Book Value $9.23 Noninterest Income/ Total Revenue (FTE) 20.7% Efficiency Ratio As Reported/ Adjusted2 62.7% / 53.9% Net Charge Offs (Recoveries)/ Average Loans 0.02% 90+ Day Delinquent Loans 0.00% Non-Performing Loans/ Total Loans 0.78% Tangible Common Equity to Tangible Assets 6.2% • 6th largest commercial bank headquartered in Midwest - top 35 banking company based in the U.S. by assets • 266 branches and 355 ATMs Company Description Time Deposits 7% Demand Deposits 35% NOW 24% Savings 19% Money Market 15% Loan Mix3,4 Deposit Mix3
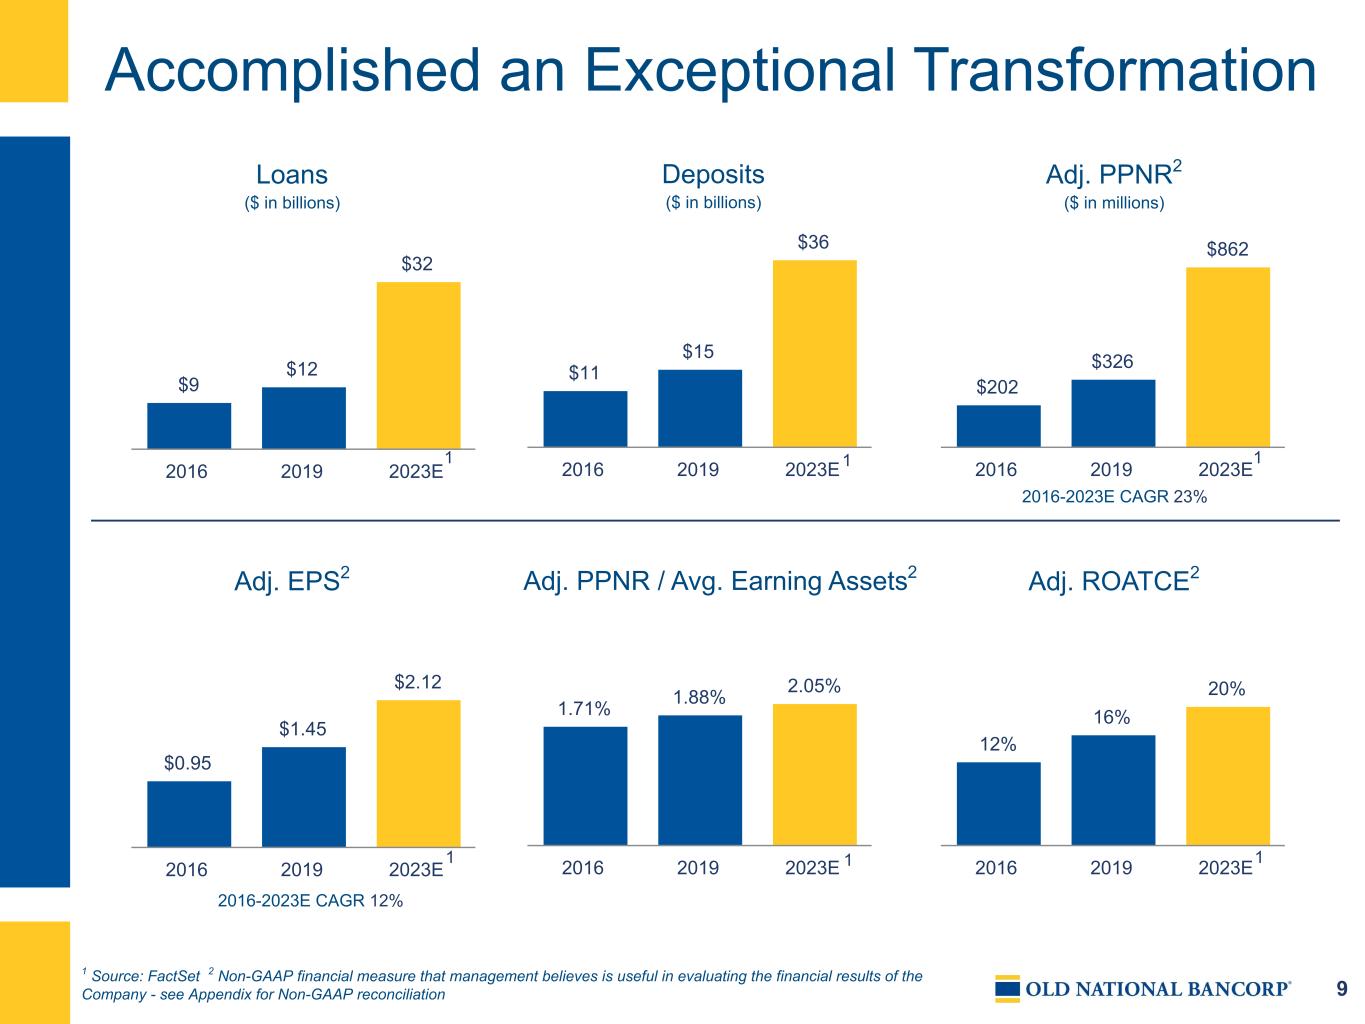
9 Accomplished an Exceptional Transformation $9 $12 $32 2016 2019 2023E $11 $15 $36 2016 2019 2023E $202 $326 $862 2016 2019 2023E $0.95 $1.45 $2.12 2016 2019 2023E 1.71% 1.88% 2.05% 2016 2019 2023E 12% 16% 20% 2016 2019 2023E Loans ($ in billions) Deposits ($ in billions) Adj. PPNR2 ($ in millions) Adj. EPS2 Adj. PPNR / Avg. Earning Assets2 Adj. ROATCE2 111 111 2016-2023E CAGR 23% 2016-2023E CAGR 12% 1 Source: FactSet 2 Non-GAAP financial measure that management believes is useful in evaluating the financial results of the Company - see Appendix for Non-GAAP reconciliation
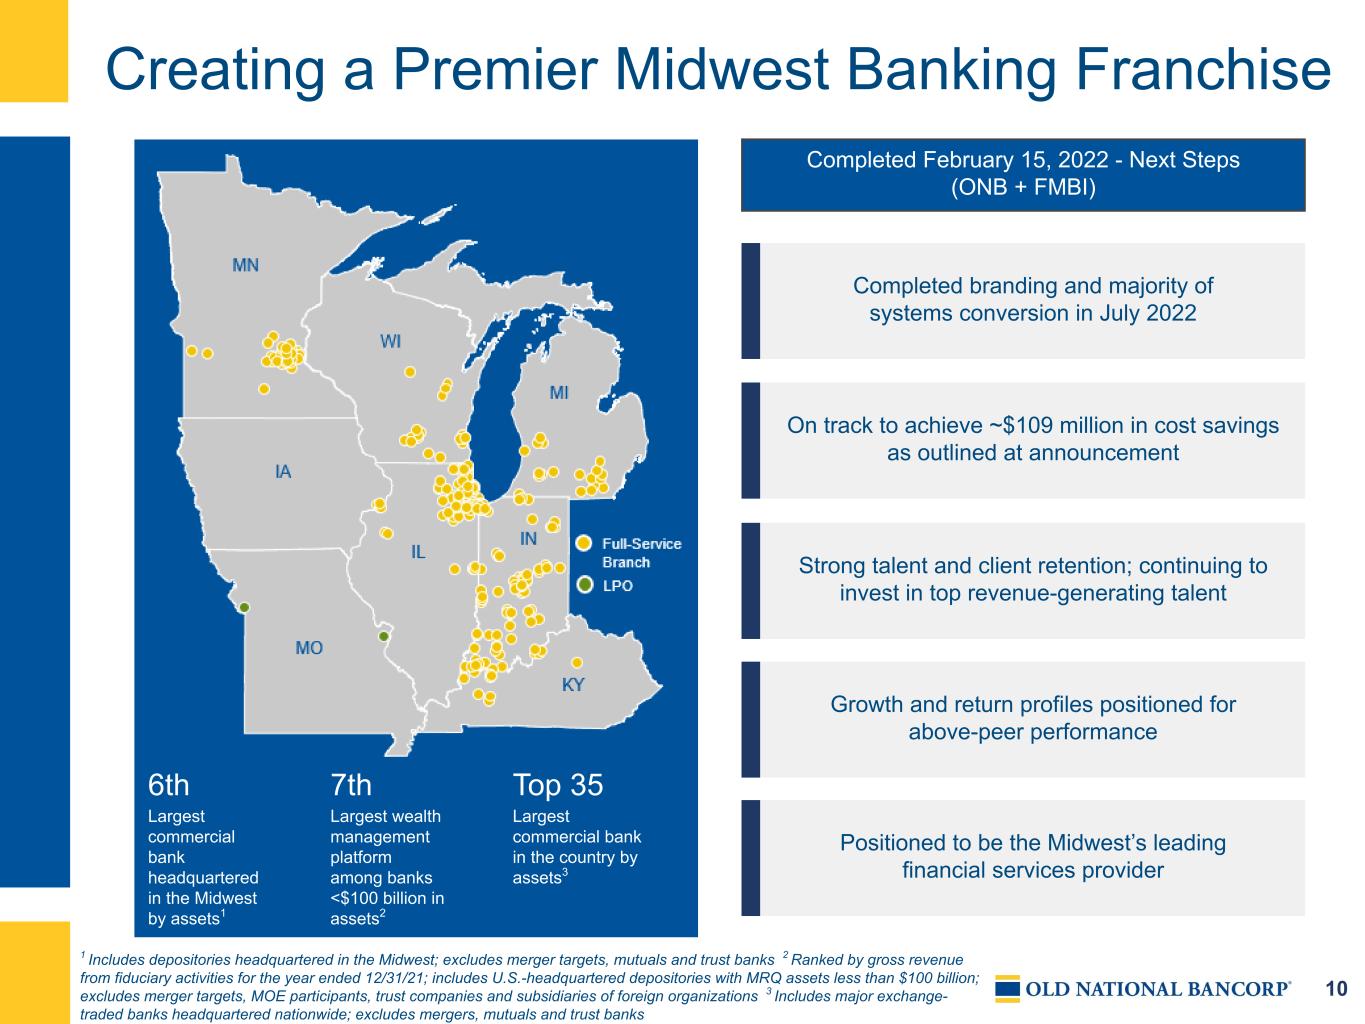
10 7th Largest wealth management platform among banks <$100 billion in assets2 6th Largest commercial bank headquartered in the Midwest by assets1 Top 35 Largest commercial bank in the country by assets3 Creating a Premier Midwest Banking Franchise Completed February 15, 2022 - Next Steps (ONB + FMBI) Completed branding and majority of systems conversion in July 2022 On track to achieve ~$109 million in cost savings as outlined at announcement Strong talent and client retention; continuing to invest in top revenue-generating talent Growth and return profiles positioned for above-peer performance Positioned to be the Midwest’s leading financial services provider 12% of total franchise 0.3% of total franchise 8% of total franchise 42% of total franchise 3% of total franchise 30% of total franchise 5% of total franchise 1 Includes depositories headquartered in the Midwest; excludes merger targets, mutuals and trust banks 2 Ranked by gross revenue from fiduciary activities for the year ended 12/31/21; includes U.S.-headquartered depositories with MRQ assets less than $100 billion; excludes merger targets, MOE participants, trust companies and subsidiaries of foreign organizations 3 Includes major exchange- traded banks headquartered nationwide; excludes mergers, mutuals and trust banks

11 Meaningful Upside Key Performance Catalysts1 • Record commercial pipeline of $5.9 billion • Asset sensitivity better than peers • Deposit betas better than peers (22% last cycle) • ~$109 million of merger cost saves • Timely branding and systems conversion • Consistent track record of delivering on M&A synergies • Strong credit metrics and well reserved • Continue to hire top revenue-generating talent Price / TBV 1.4x 1.8x ONB ^KRX Price / 2023 Earnings 8.6x 11.5x ONB ^KRX As of 3/31/2022 As of 03/31/2022 ^KRX represents the Keefe, Bruyette & Woods (KBW) Regional Banking Index 1 As of 06/30/2022

12 0.19% 0.32% 0.48% 0.18% 0.06% 0.06% 0.30% 0.54% 0.80% 0.29% 0.10% 0.08% ONB Peer Median 2017Y 2018Y 2019Y 2020Y 2021Y 1Q22 2Q22 Quality Low-Cost Deposit Franchise Cost of Deposits $12.4 $14.2 $14.5 $16.9 $18.6 $35.6 $35.5 $3.7 $4.0 $4.1 $5.6 $6.3 $12.5 $12.4$8.7 $10.2 $10.4 $11.3 $12.3 $23.1 $23.2 Noninterest-bearing Interest-bearing 2017Y 2018Y 2019Y 2020Y 2021Y 1Q22 2Q22 Deposit Growth 2017-2Q22 CAGR: 23% Time Deposits 7% Demand Deposits 35% NOW 24% Savings 19% Money Market 15% Deposit Mix $ in billions Peer Group data per S&P Global Market Intelligence as of 03/31/2022 - See Appendix for definition of Peer Group 0.05%

13 Granular & Diversified Loan Portfolio1,2 $ in billions As of 06/30/2022 1 Includes loans held for sale 2 Excludes PPP loans $11.1 $12.3 $12.2 $12.9 $13.5 $28.2 $29.6 $2.7 $3.2 $2.9 $3.0 $3.2 $8.4 $9.0$4.4 $5.0 $5.2 $5.9 $6.4 $11.3 $11.8 $4.0 $4.1 $4.1 $4.0 $3.9 $8.5 $8.8 C&I CRE Consumer 2017Y 2018Y 2019Y 2020Y 2021Y 1Q22 2Q22 2017-2Q22 CAGR: 22% CRE Non- Owner Occupied 29% CRE Owner Occupied 11% C&I 30% Residential Real Estate 20% Retail 13% Warehouse/ Industrial 10% Single Family Use 4% Mixed Use 3% Senior Housing 6% Self Storage 1% Other 9% Multifamily 39% Office 15% HELOC 4% Other Consumer 6%
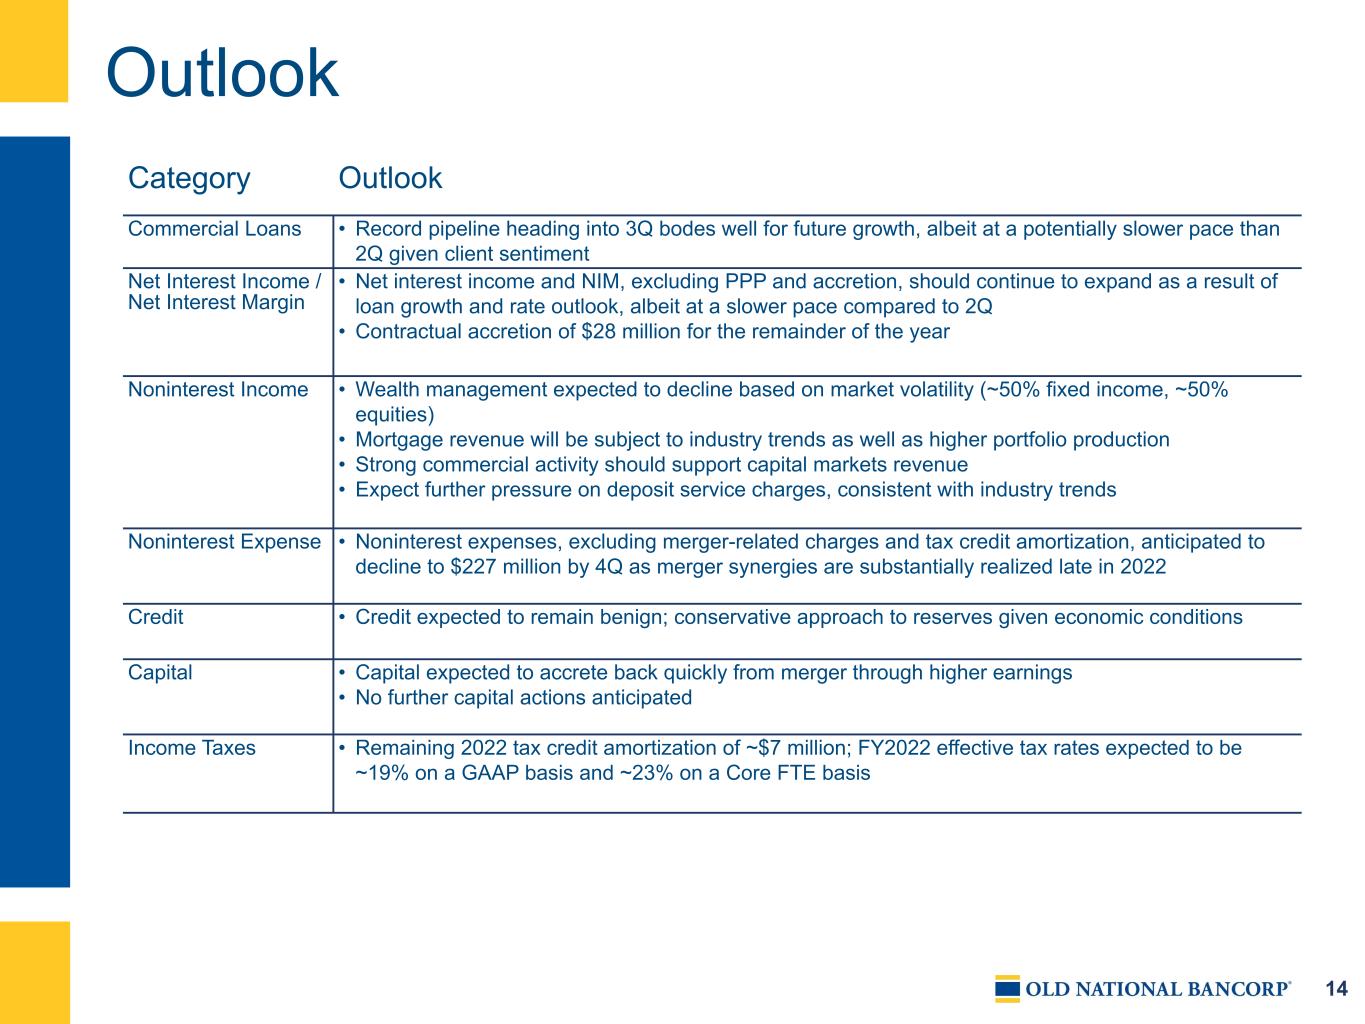
14 Outlook Category Outlook Commercial Loans • Record pipeline heading into 3Q bodes well for future growth, albeit at a potentially slower pace than 2Q given client sentiment Net Interest Income / Net Interest Margin • Net interest income and NIM, excluding PPP and accretion, should continue to expand as a result of loan growth and rate outlook, albeit at a slower pace compared to 2Q • Contractual accretion of $28 million for the remainder of the year Noninterest Income • Wealth management expected to decline based on market volatility (~50% fixed income, ~50% equities) • Mortgage revenue will be subject to industry trends as well as higher portfolio production • Strong commercial activity should support capital markets revenue • Expect further pressure on deposit service charges, consistent with industry trends Noninterest Expense • Noninterest expenses, excluding merger-related charges and tax credit amortization, anticipated to decline to $227 million by 4Q as merger synergies are substantially realized late in 2022 Credit • Credit expected to remain benign; conservative approach to reserves given economic conditions Capital • Capital expected to accrete back quickly from merger through higher earnings • No further capital actions anticipated Income Taxes • Remaining 2022 tax credit amortization of ~$7 million; FY2022 effective tax rates expected to be ~19% on a GAAP basis and ~23% on a Core FTE basis

Financial Details FINANCIAL DATA AS OF June 30, 2022 DATED: August 2022
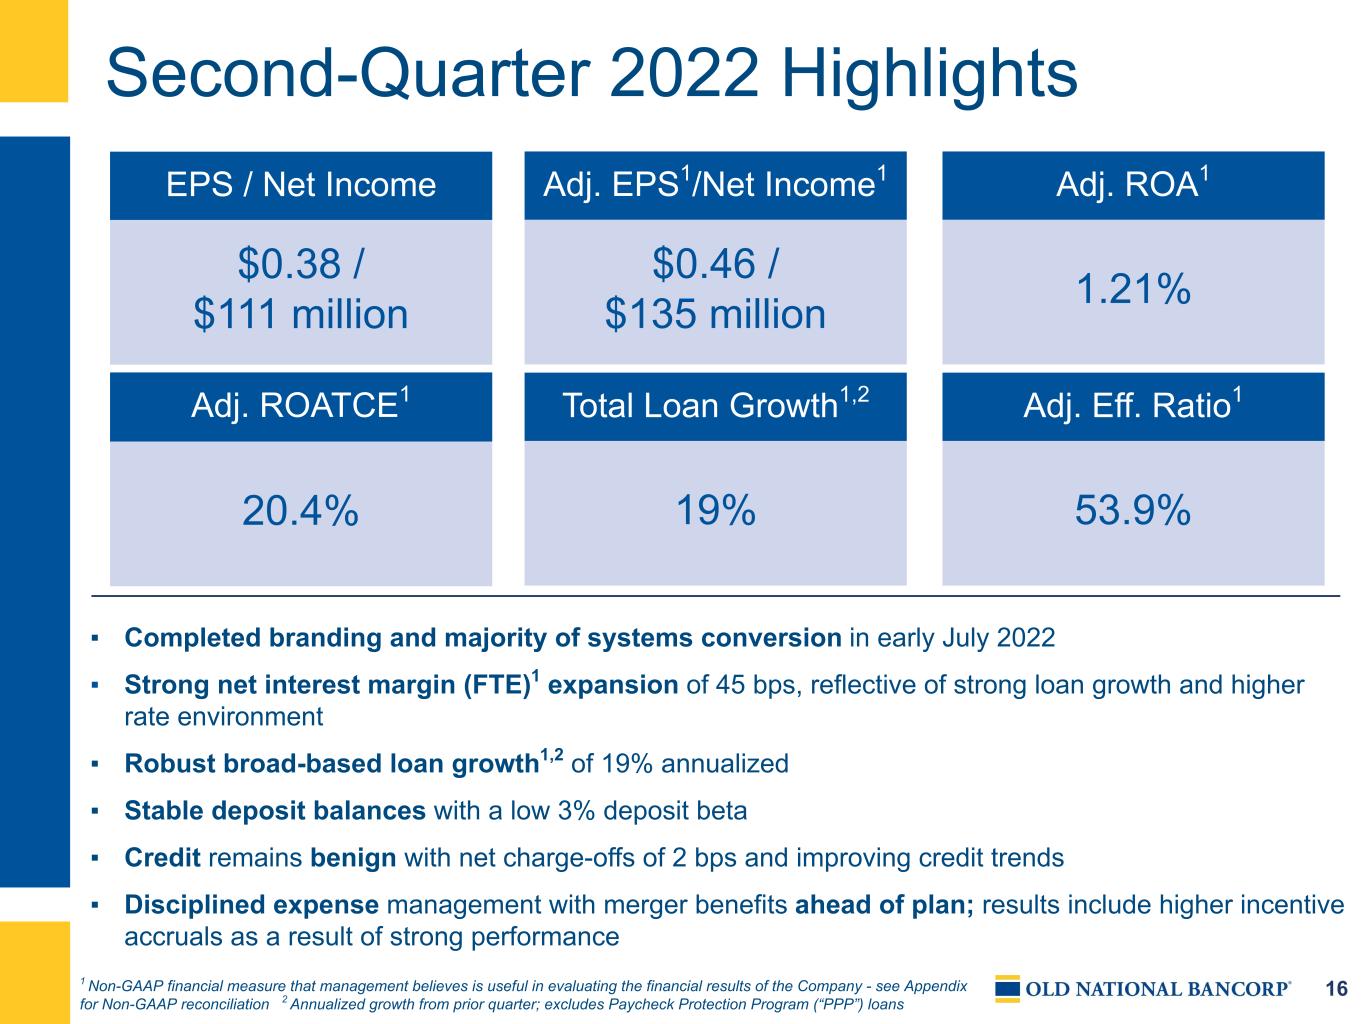
16 Second-Quarter 2022 Highlights EPS / Net Income Adj. ROATCE1 Adj. EPS1/Net Income1 Total Loan Growth1,2 Adj. Eff. Ratio1 $0.38 / $111 million 20.4% $0.46 / $135 million 19% 53.9% Adj. ROA1 1.21% ▪ Completed branding and majority of systems conversion in early July 2022 ▪ Strong net interest margin (FTE)1 expansion of 45 bps, reflective of strong loan growth and higher rate environment ▪ Robust broad-based loan growth1,2 of 19% annualized ▪ Stable deposit balances with a low 3% deposit beta ▪ Credit remains benign with net charge-offs of 2 bps and improving credit trends ▪ Disciplined expense management with merger benefits ahead of plan; results include higher incentive accruals as a result of strong performance 1 Non-GAAP financial measure that management believes is useful in evaluating the financial results of the Company - see Appendix for Non-GAAP reconciliation 2 Annualized growth from prior quarter; excludes Paycheck Protection Program (“PPP”) loans

17 Second-Quarter 2022 Results $ in millions, except per-share data 1 Excludes PPP loans 2 Non-GAAP financial measures that management believes is useful in evaluating the financial results of the Company - see Appendix for Non-GAAP reconciliation Performance Drivers - Impacted by Merger Completed Mid 1Q222Q22 1Q22 2Q21 End of period total loans1 $29,472 $28,131 $13,064 • Strong total loan growth1 of 19%, annualized; commercial up 18% and consumer up 22% End of period deposits 35,539 35,607 17,869 • Consistent balance Net Interest Income (FTE)2 $342 $227 $153 • Reflects higher rate environment, robust loan growth, higher accretion, and more days in the quarter Provision for credit losses - Current Expected Credit Losses (“CECL”) Day 1 non-PCD provision expense — 96 — • Allowance for credit losses established on acquired non-PCD loans Provision for credit losses - excluding CECL Day 1 non-PCD provision expense 9 1 (5) • Reflects loan growth, economic factors and portfolio mix changes Provision for credit losses 9 97 (5) Noninterest income 89 65 52 • Mortgage banking continues to be impacted by the rate environment and a higher mix of portfolio production Noninterest expense ex. tax credit amort., • Disciplined expense management, includes year-to- date incentive accrual true-up as a result of strong performancemerger-related charges, and ONB Way 239 173 121 Amortization of tax credit investments 2 2 2 Merger-related charges, and ONB Way 37 52 7 • Merger expenses associated with closing & integration Income taxes (FTE)2 29 (5) 17 • Current FTE tax rate of 20.3% Net income (loss) $115 $(27) $63 Preferred Dividends 4 2 — Net income (loss) applicable to common shares $111 $(29) $63 Net income applicable to common shares, adjusted2 $135 $92 $67 Earnings per diluted share $0.38 $(0.13) $0.38 Adjusted earnings per diluted share2 $0.46 $0.40 $0.41 Net charge-offs (recoveries)/avg loans 2 bps 5 bps -1 bps

18 Total Loans and Earning Assets $27,392 $27,634 $27,792 $28,131 $29,472 $13,064 $13,230 $13,432 $26,355 $27,754 $12,425 $12,477 $12,391 ONB FMBI FMBI Transactional Loans 2Q21 3Q21 4Q21 1Q22 2Q22 Total loans1 • Growth of $1.3 billion, +19% annualized • Commercial growth of $882 million, +18% annualized • Total consumer3 growth of $459 million, +22%; driven by strong residential real estate production, partially offset by acquired transactional portfolio run-off of ~$58 million Securities • Transferred ~$1 billion of securities to held to maturity in light of the rate environment • Duration4 of 4.4 consistent with 1Q22 • 2Q22 yield was 2.37% • 2Q22 new money yield was 3.68% Earning Asset Mix Consumer 7% Residential 14% Commercial 49% Cash / Securities 30% Total Loans1 Up 8% YoY $ in millions 1 Excludes PPP loans for legacy First Midwest and combined Old National. This is a non-GAAP financial measure that management believes is useful in evaluating the financial results of the Company 2 For illustration only; represents historical combined balances as reported by Old National and First Midwest; certain reclassifications were made 3 Includes consumer and residential real estate loans 4 Available for sale effective duration including securities hedges Historical Combined 2
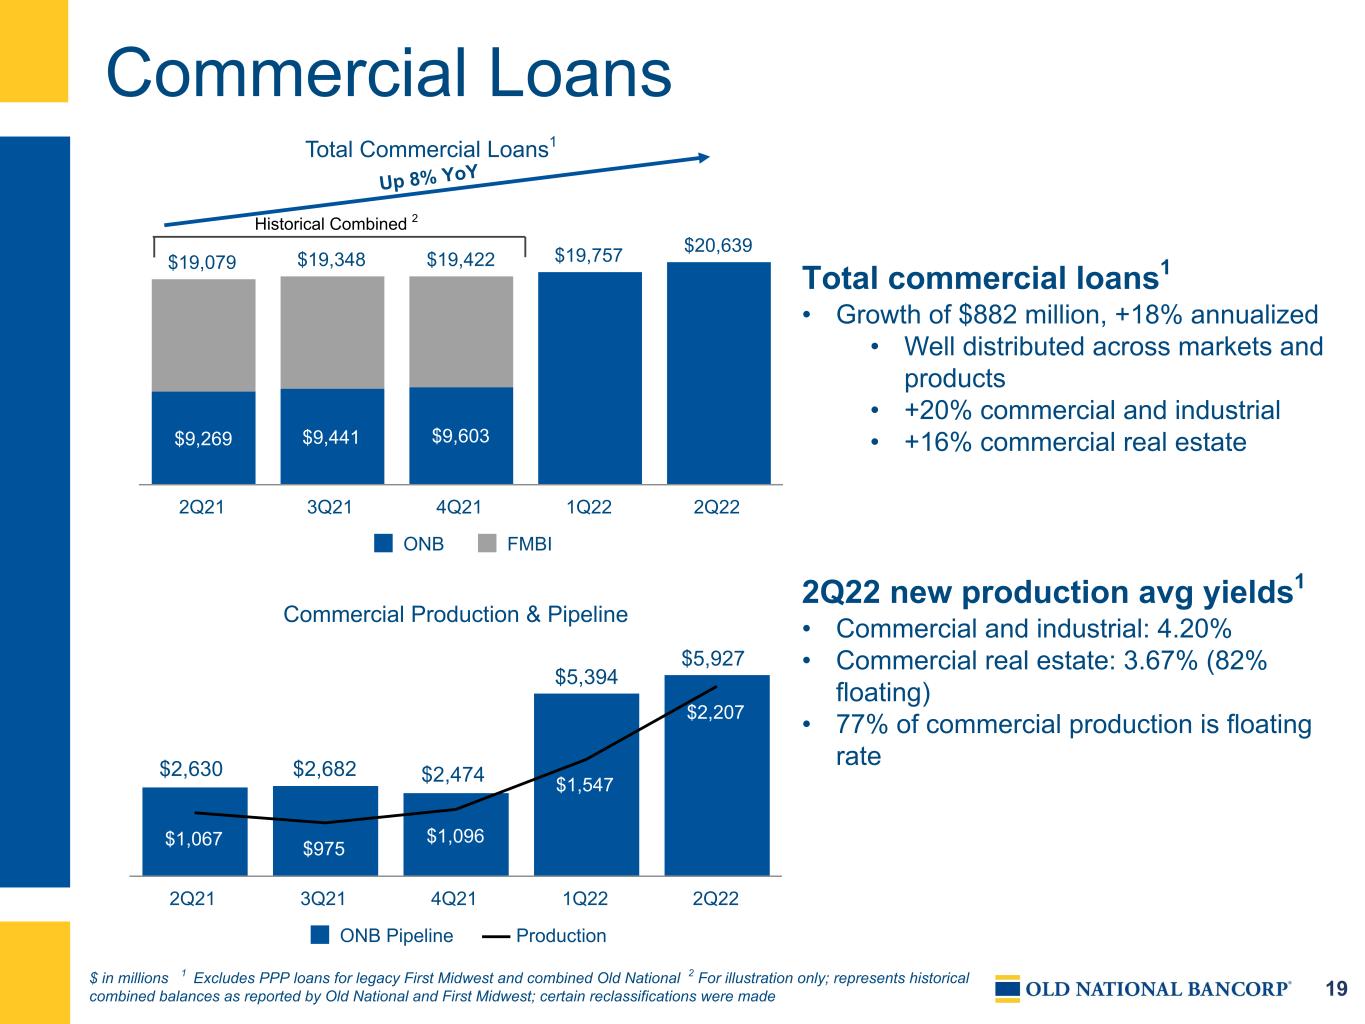
19 Commercial Loans $19,757 $20,639 $19,079 $19,348 $19,422 $9,269 $9,441 $9,603 ONB FMBI 2Q21 3Q21 4Q21 1Q22 2Q22 Commercial Production & Pipeline $1,067 $975 $1,096 $1,547 $2,207 ONB Pipeline Production 2Q21 3Q21 4Q21 1Q22 2Q22 Total commercial loans1 • Growth of $882 million, +18% annualized • Well distributed across markets and products • +20% commercial and industrial • +16% commercial real estate 2Q22 new production avg yields1 • Commercial and industrial: 4.20% • Commercial real estate: 3.67% (82% floating) • 77% of commercial production is floating rate Total Commercial Loans1 $ in millions 1 Excludes PPP loans for legacy First Midwest and combined Old National 2 For illustration only; represents historical combined balances as reported by Old National and First Midwest; certain reclassifications were made Historical Combined 2 $2,630 $2,474$2,682 $5,394 $5,927 Up 8% YoY

20 Commercial Loan Production Production by Product Line $1,137 $513 $529 $28 CRE Business Banking Corporate Small Business Production by RM Location $967 $283 $315 $161 $147 $174 $73 $87 Illinois Indiana Minnesota Wisconsin Michigan Kentucky New LPO Markets Healthcare Vertical Strong $2.2 billion of production throughout the entire commercial loan portfolio and across the combined expanded market footprint $ in millions
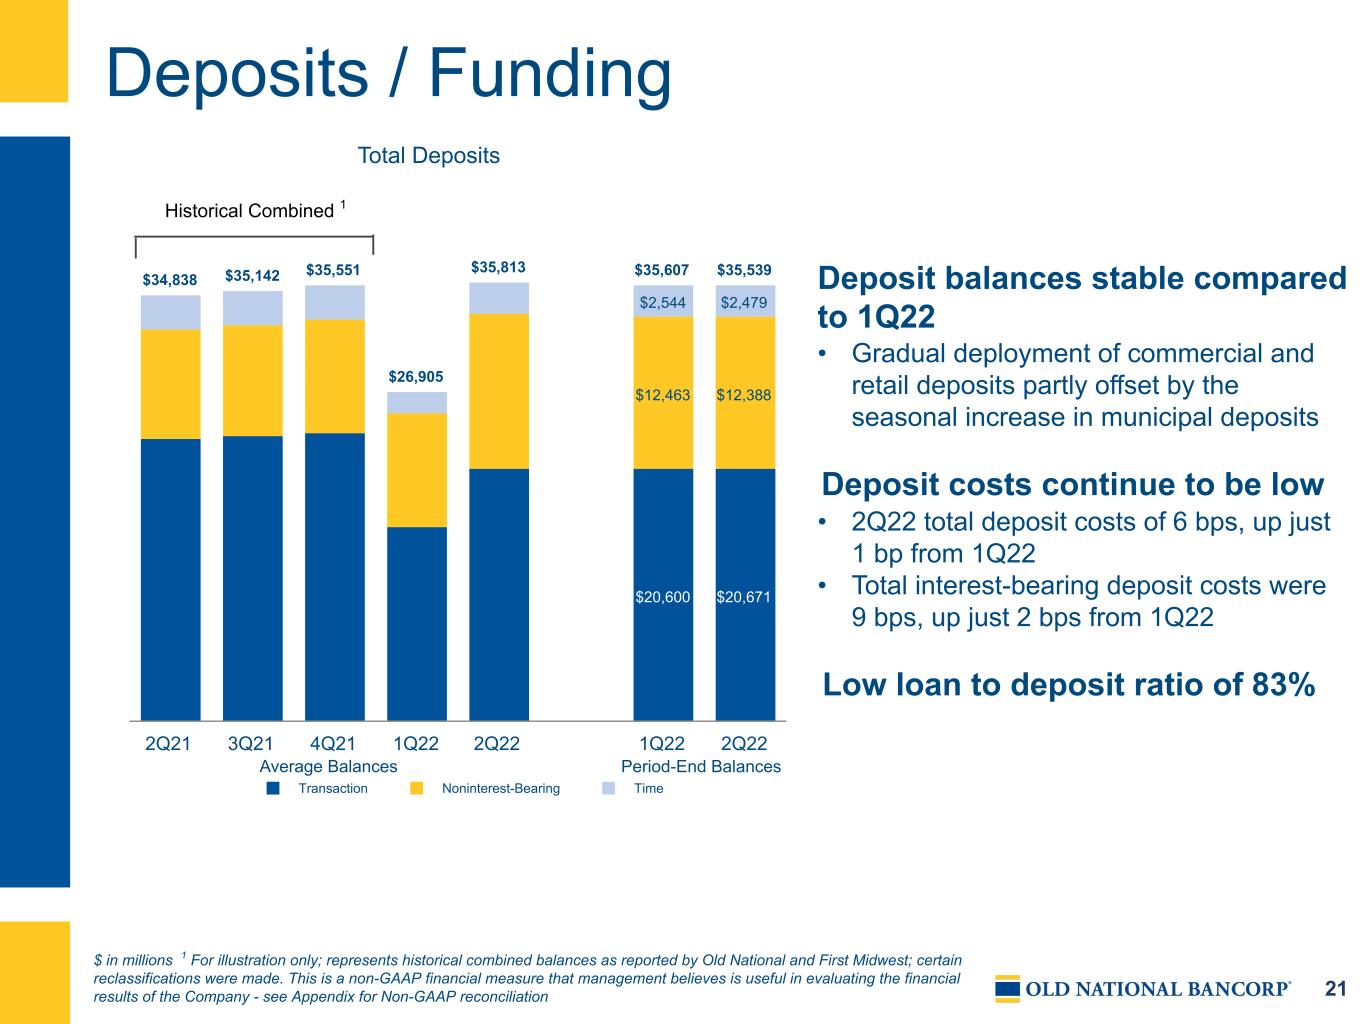
21 Deposits / Funding $34,838 $35,142 $35,551 $26,905 $35,813 $35,607 $35,539 $20,600 $20,671 $12,463 $12,388 $2,544 $2,479 Transaction Noninterest-Bearing Time 2Q21 3Q21 4Q21 1Q22 2Q22 1Q22 2Q22 $ in millions 1 For illustration only; represents historical combined balances as reported by Old National and First Midwest; certain reclassifications were made. This is a non-GAAP financial measure that management believes is useful in evaluating the financial results of the Company - see Appendix for Non-GAAP reconciliation Deposit balances stable compared to 1Q22 • Gradual deployment of commercial and retail deposits partly offset by the seasonal increase in municipal deposits Deposit costs continue to be low • 2Q22 total deposit costs of 6 bps, up just 1 bp from 1Q22 • Total interest-bearing deposit costs were 9 bps, up just 2 bps from 1Q22 Low loan to deposit ratio of 83% Average Balances Period-End Balances Historical Combined 1 Total Deposits
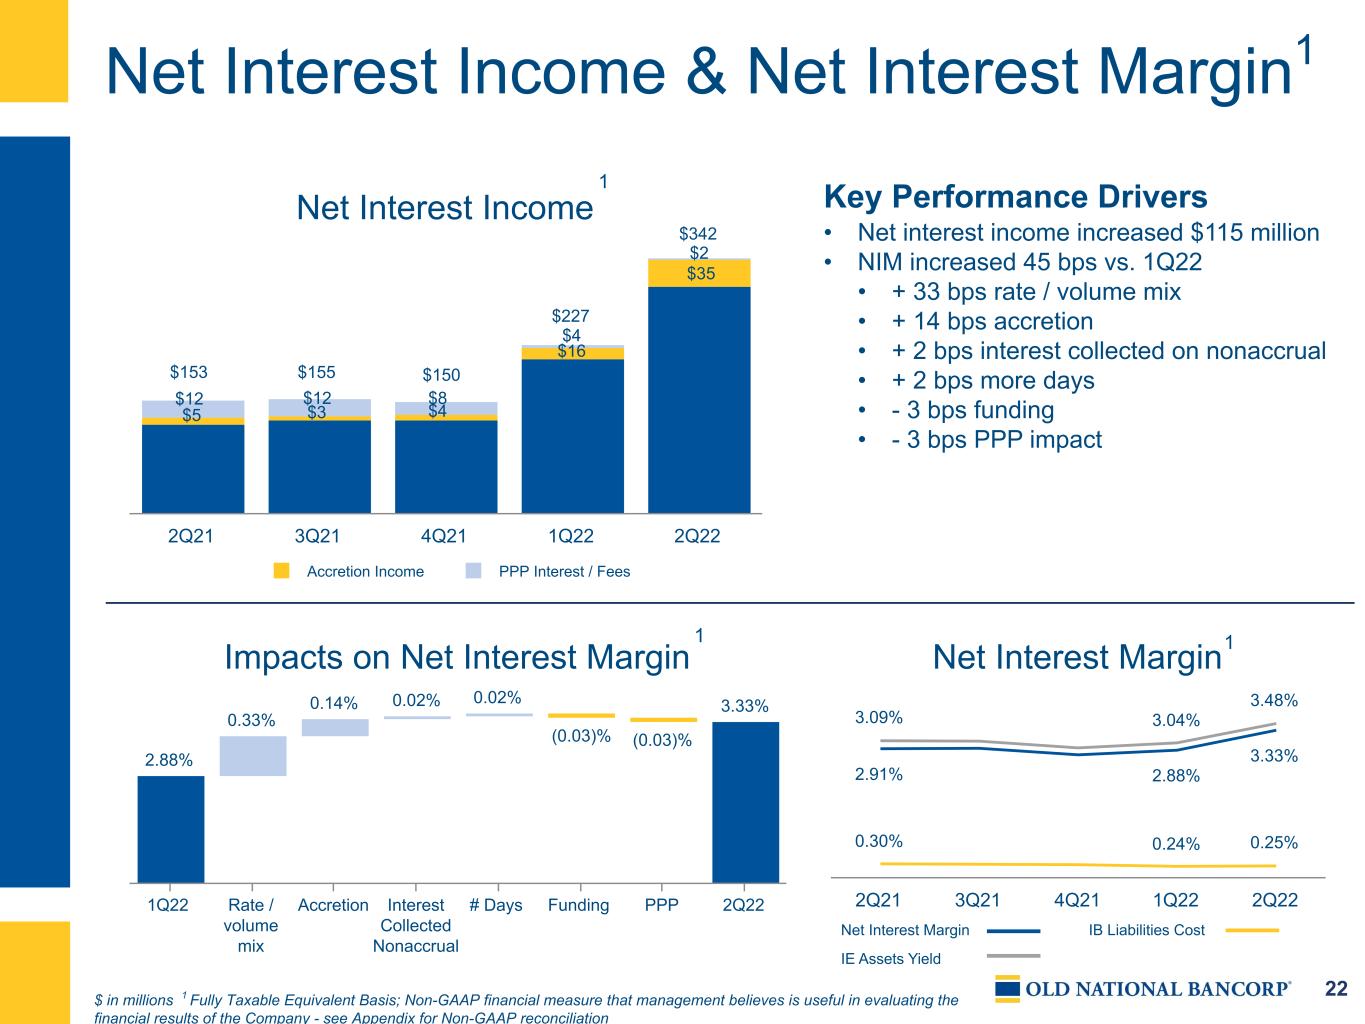
22 Net Interest Income & Net Interest Margin1 1Net Interest Income Accretion Income PPP Interest / Fees 2Q21 3Q21 4Q21 1Q22 2Q22 Key Performance Drivers • Net interest income increased $115 million • NIM increased 45 bps vs. 1Q22 • + 33 bps rate / volume mix • + 14 bps accretion • + 2 bps interest collected on nonaccrual • + 2 bps more days • - 3 bps funding • - 3 bps PPP impact Net Interest Margin 3.09% 3.04% 3.48% 2.91% 2.88% 3.33% 0.30% 0.24% 0.25% 2Q21 3Q21 4Q21 1Q22 2Q22 $ in millions 1 Fully Taxable Equivalent Basis; Non-GAAP financial measure that management believes is useful in evaluating the financial results of the Company - see Appendix for Non-GAAP reconciliation 1 $5 $3 $4 $16 $35 $2 $4 $8$12$12 $153 $155 $150 $227 $342 Impacts on Net Interest Margin 2.88% 0.33% 0.14% 0.02% 0.02% (0.03)% (0.03)% 3.33% 1Q22 Rate / volume mix Accretion Interest Collected Nonaccrual # Days Funding PPP 2Q22 1 1 Net Interest Margin IE Assets Yield IB Liabilities Cost
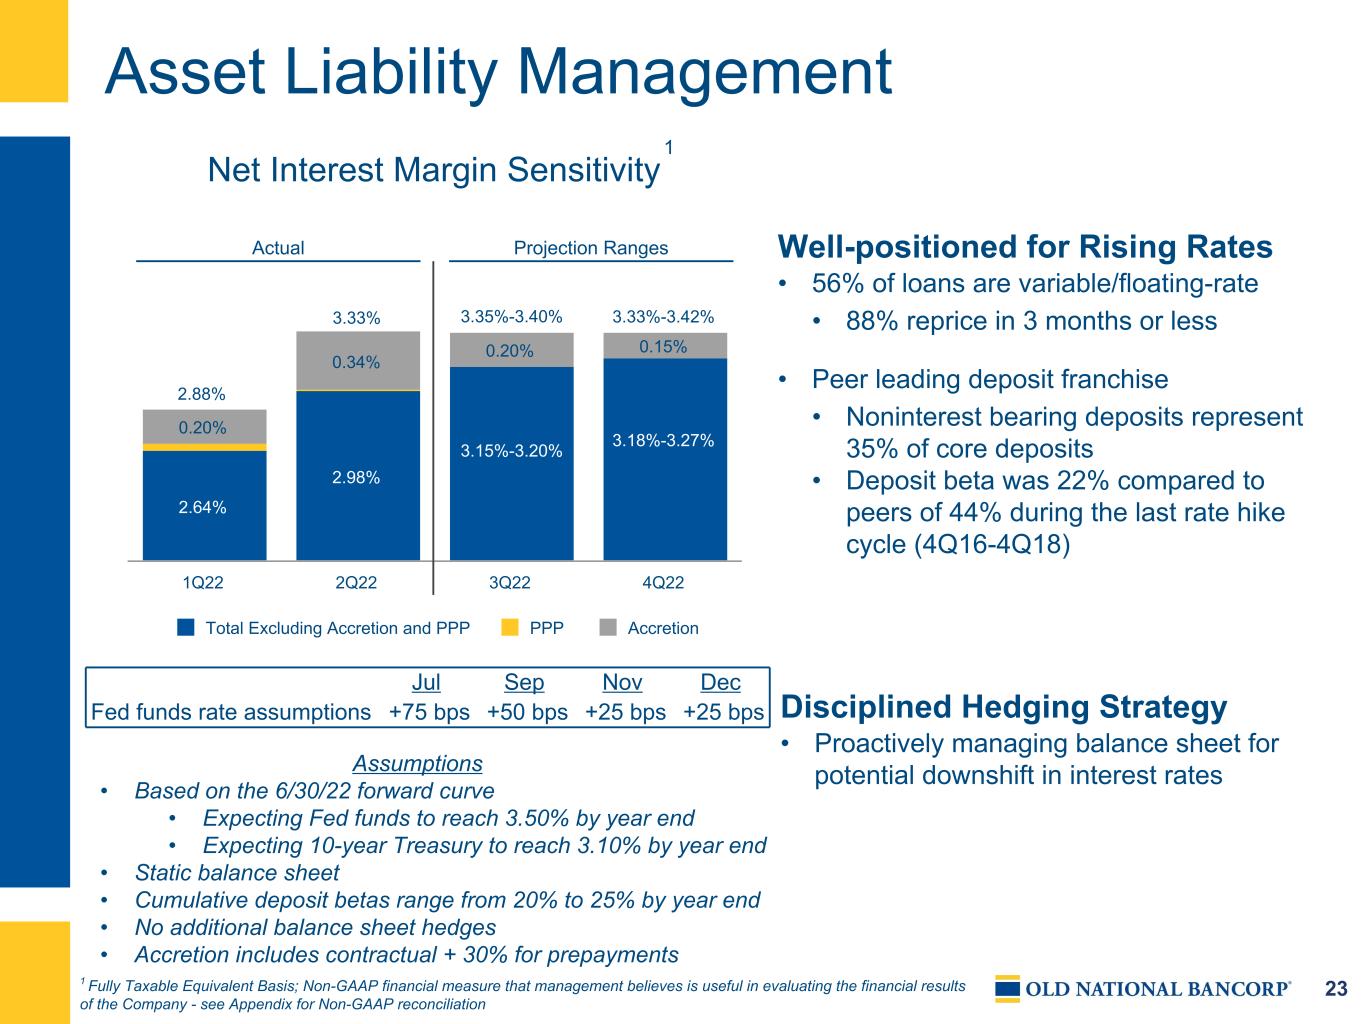
23 Asset Liability Management Net Interest Margin Sensitivity 2.64% 2.98% 0.20% 0.34% 0.20% 0.15% Total Excluding Accretion and PPP PPP Accretion 1Q22 2Q22 3Q22 4Q22 Well-positioned for Rising Rates • 56% of loans are variable/floating-rate • 88% reprice in 3 months or less • Peer leading deposit franchise • Noninterest bearing deposits represent 35% of core deposits • Deposit beta was 22% compared to peers of 44% during the last rate hike cycle (4Q16-4Q18) Assumptions • Based on the 6/30/22 forward curve • Expecting Fed funds to reach 3.50% by year end • Expecting 10-year Treasury to reach 3.10% by year end • Static balance sheet • Cumulative deposit betas range from 20% to 25% by year end • No additional balance sheet hedges • Accretion includes contractual + 30% for prepayments Disciplined Hedging Strategy • Proactively managing balance sheet for potential downshift in interest rates Actual Projection Ranges 3.15%-3.20% 3.18%-3.27% 2.88% 3.33% 3.35%-3.40% 3.33%-3.42% 1 Fully Taxable Equivalent Basis; Non-GAAP financial measure that management believes is useful in evaluating the financial results of the Company - see Appendix for Non-GAAP reconciliation 1 Jul Sep Nov Dec Fed funds rate assumptions +75 bps +50 bps +25 bps +25 bps
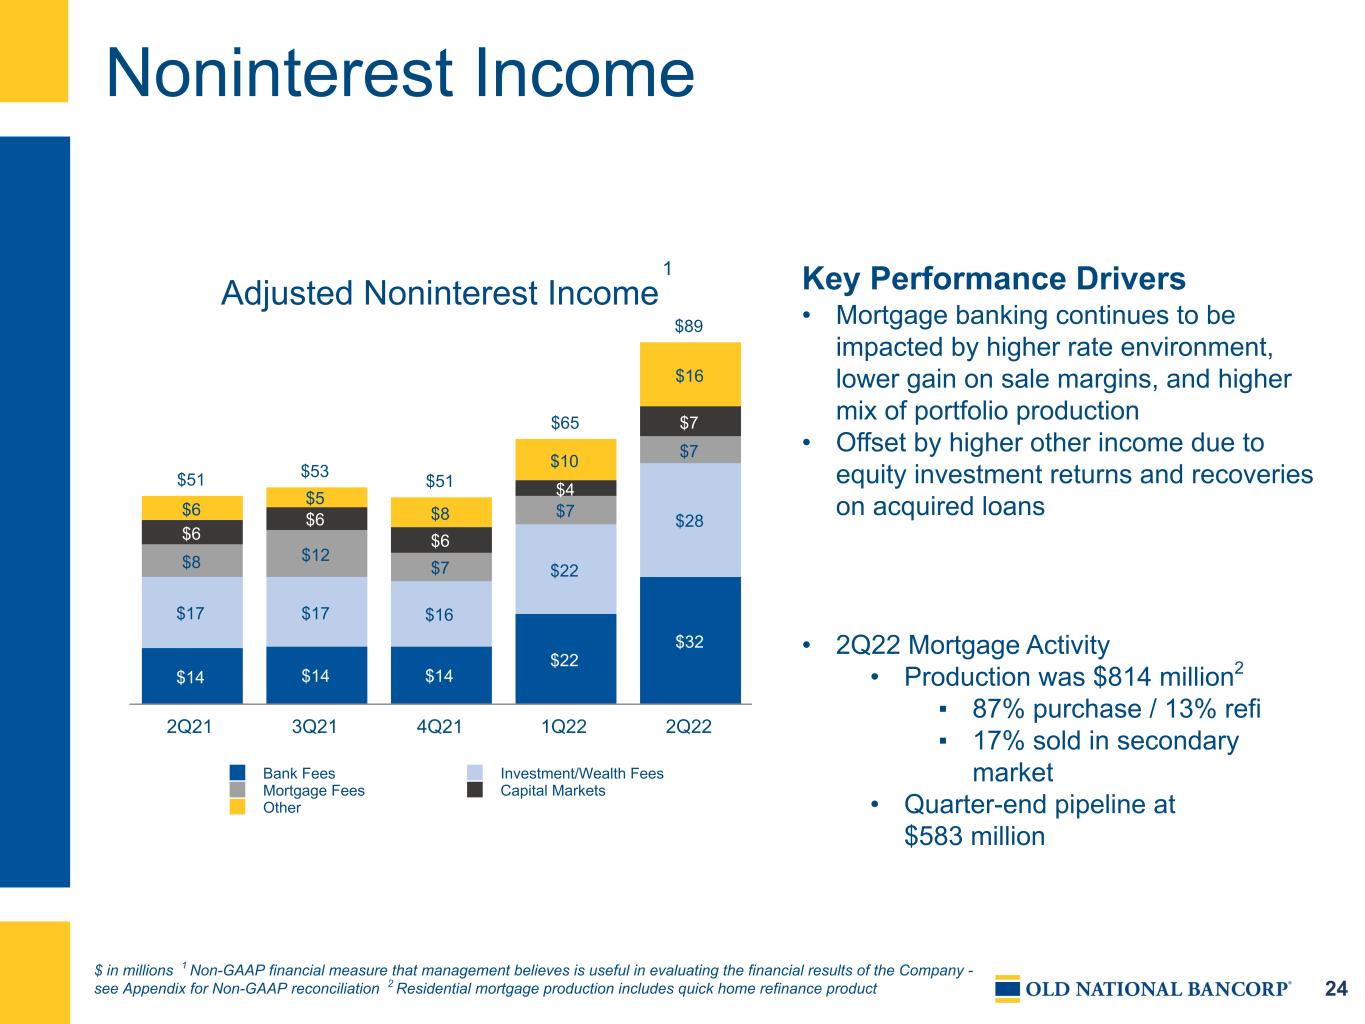
24 Noninterest Income $ in millions 1 Non-GAAP financial measure that management believes is useful in evaluating the financial results of the Company - see Appendix for Non-GAAP reconciliation 2 Residential mortgage production includes quick home refinance product Adjusted Noninterest Income $51 $53 $51 $65 $89 $14 $14 $14 $22 $32 $17 $17 $16 $22 $28 $8 $12 $7 $7 $7 $6 $6 $6 $4 $7 $6 $5 $8 $10 $16 Bank Fees Investment/Wealth Fees Mortgage Fees Capital Markets Other 2Q21 3Q21 4Q21 1Q22 2Q22 Key Performance Drivers • Mortgage banking continues to be impacted by higher rate environment, lower gain on sale margins, and higher mix of portfolio production • Offset by higher other income due to equity investment returns and recoveries on acquired loans • 2Q22 Mortgage Activity • Production was $814 million2 ▪ 87% purchase / 13% refi ▪ 17% sold in secondary market • Quarter-end pipeline at $583 million 1
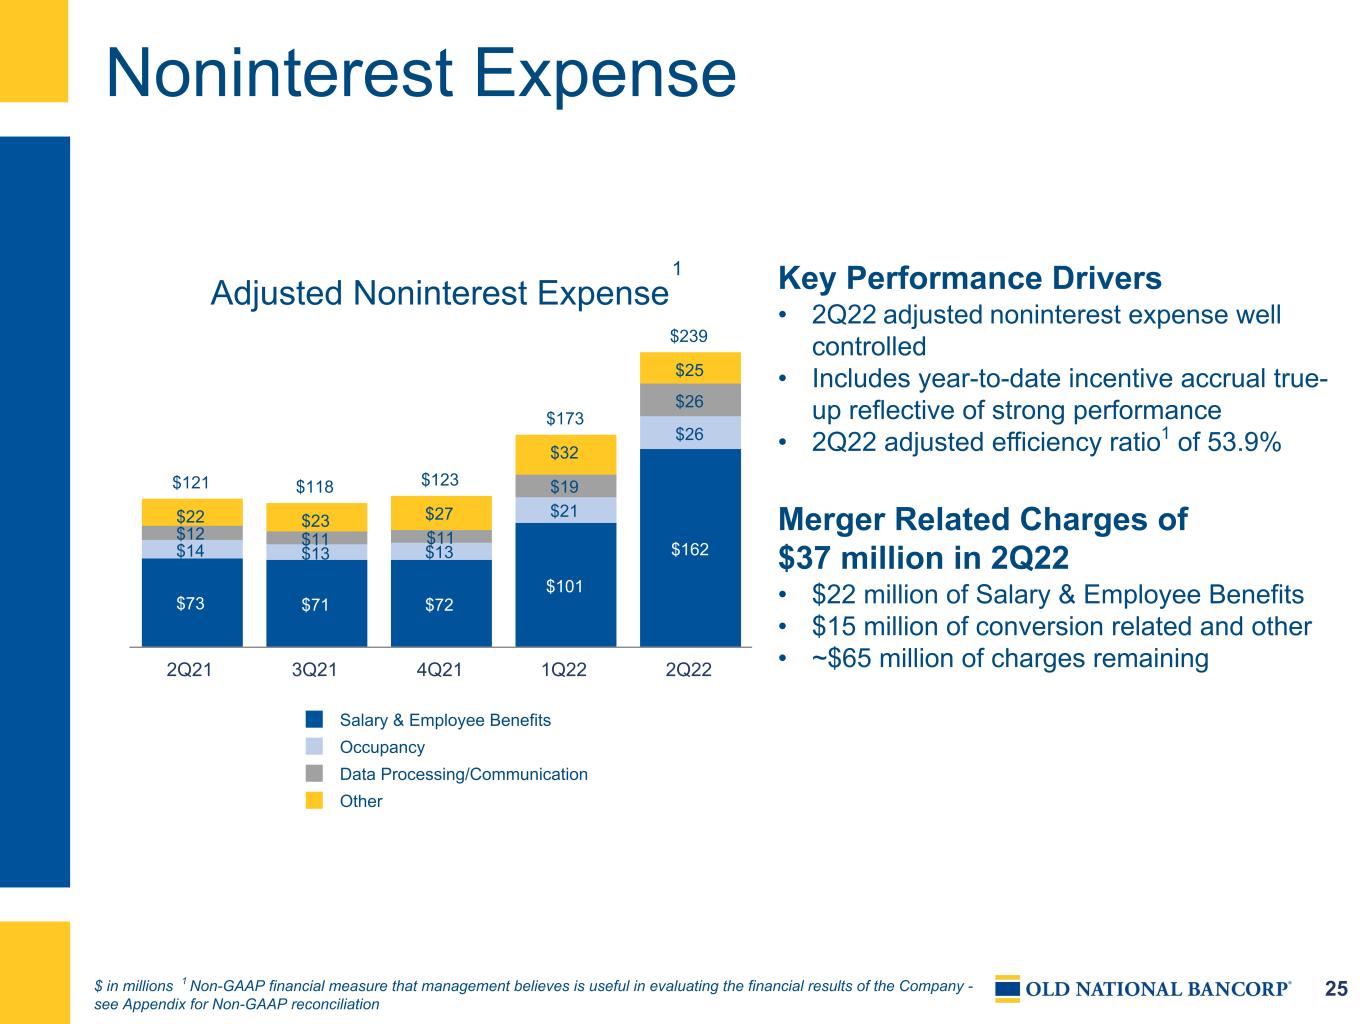
25 Noninterest Expense Adjusted Noninterest Expense $121 $118 $123 $173 $239 $73 $71 $72 $101 $162$14 $13 $13 $21 $26 $12 $11 $11 $19 $26 $22 $23 $27 $32 $25 Salary & Employee Benefits Occupancy Data Processing/Communication Other 2Q21 3Q21 4Q21 1Q22 2Q22 Key Performance Drivers • 2Q22 adjusted noninterest expense well controlled • Includes year-to-date incentive accrual true- up reflective of strong performance • 2Q22 adjusted efficiency ratio1 of 53.9% Merger Related Charges of $37 million in 2Q22 • $22 million of Salary & Employee Benefits • $15 million of conversion related and other • ~$65 million of charges remaining $ in millions 1 Non-GAAP financial measure that management believes is useful in evaluating the financial results of the Company - see Appendix for Non-GAAP reconciliation 1

26 $235 $227 $212 $2 $7 $6 Combined Expense Incremental Intangibles Merit & Strategic Investments Performance-driven Incentives 2Q21 4Q22 Expected Path to Cost Saves1 $23 million (~$92 million annualized) 2 Key Performance Drivers • ~85% of cost saves target (~$109 million annualized) realized by 4Q22 • Full run rate expected by early 2023 $ in millions 1 Excludes tax credit amortization as well as merger related charges 2 Adjusted expense, combined Company view; excludes $14 of merger related charges and $2 of tax credit amortization
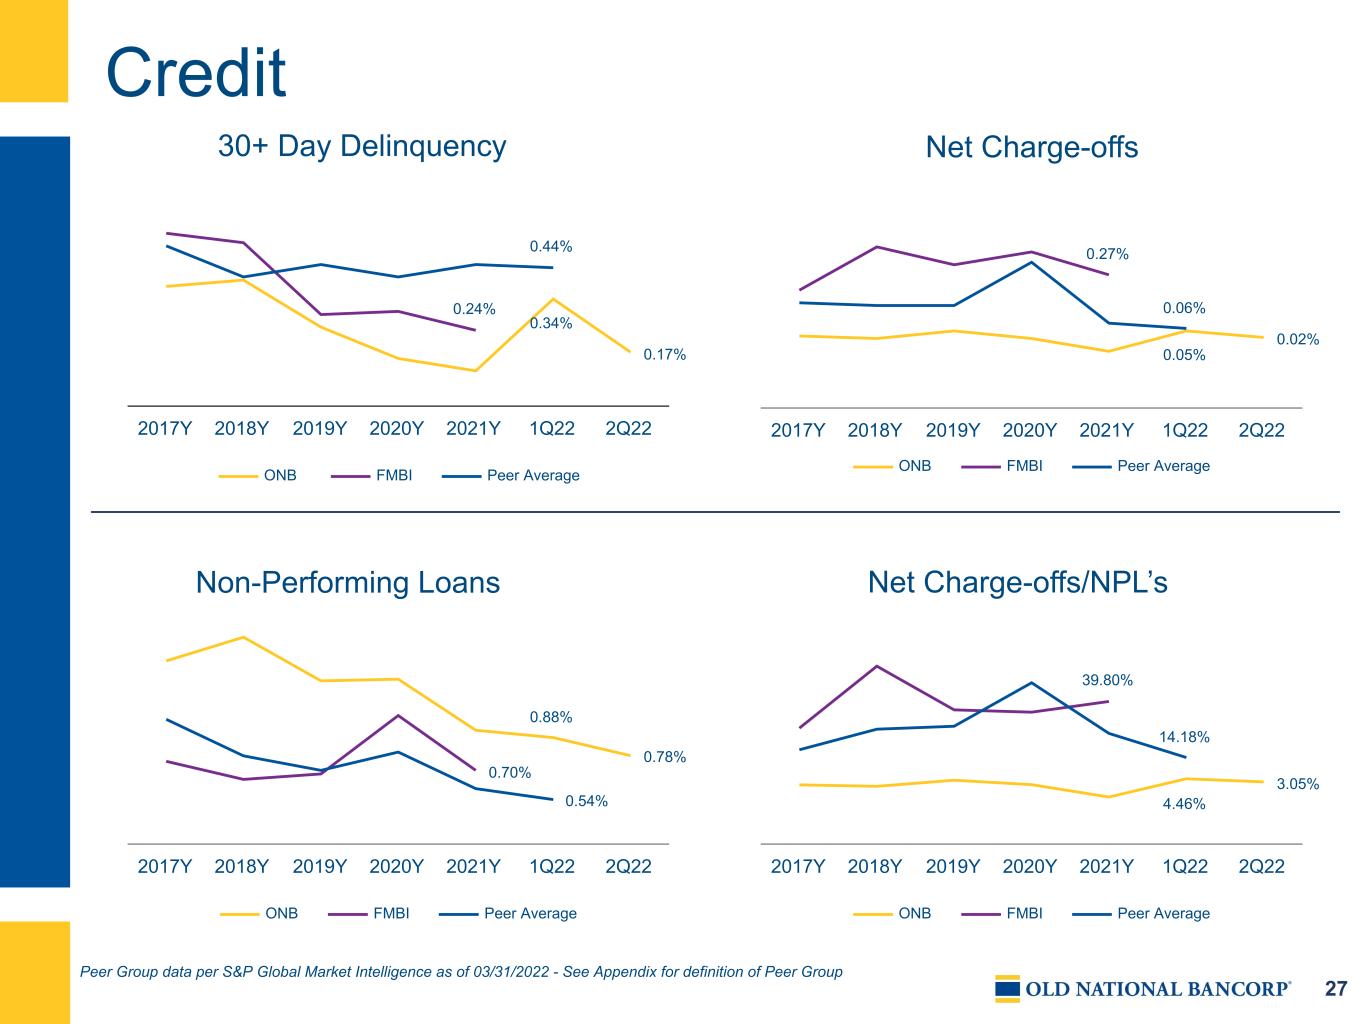
27 0.05% 0.02% 0.27% 0.06% ONB FMBI Peer Average 2017Y 2018Y 2019Y 2020Y 2021Y 1Q22 2Q22 Credit Peer Group data per S&P Global Market Intelligence as of 03/31/2022 - See Appendix for definition of Peer Group Non-Performing Loans Net Charge-offs/NPL’s 30+ Day Delinquency Net Charge-offs 1 4.46% 3.05% 39.80% 14.18% ONB FMBI Peer Average 2017Y 2018Y 2019Y 2020Y 2021Y 1Q22 2Q22 0.88% 0.78% 0.70% 0.54% ONB FMBI Peer Average 2017Y 2018Y 2019Y 2020Y 2021Y 1Q22 2Q22 0.34% 0.17% 0.24% 0.44% ONB FMBI Peer Average 2017Y 2018Y 2019Y 2020Y 2021Y 1Q22 2Q22
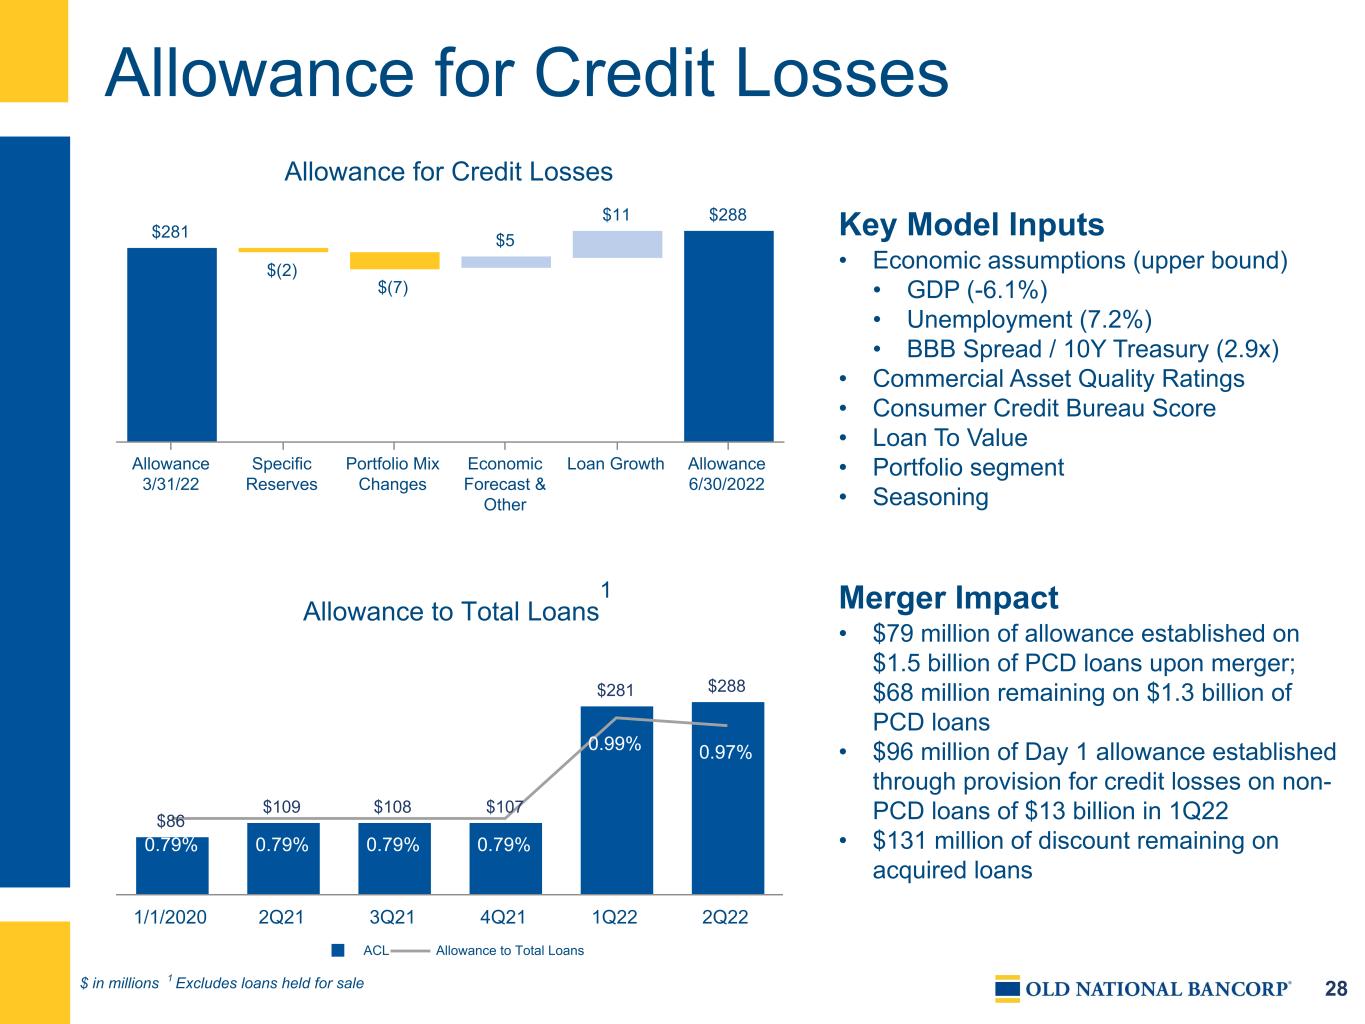
28 Allowance to Total Loans $86 $109 $108 $107 $281 $288 0.79% 0.79% 0.79% 0.79% 0.99% 0.97% ACL Allowance to Total Loans 1/1/2020 2Q21 3Q21 4Q21 1Q22 2Q22 Allowance for Credit Losses $ in millions 1 Excludes loans held for sale 1 Key Model Inputs • Economic assumptions (upper bound) • GDP (-6.1%) • Unemployment (7.2%) • BBB Spread / 10Y Treasury (2.9x) • Commercial Asset Quality Ratings • Consumer Credit Bureau Score • Loan To Value • Portfolio segment • Seasoning Merger Impact • $79 million of allowance established on $1.5 billion of PCD loans upon merger; $68 million remaining on $1.3 billion of PCD loans • $96 million of Day 1 allowance established through provision for credit losses on non- PCD loans of $13 billion in 1Q22 • $131 million of discount remaining on acquired loans Allowance for Credit Losses $281 $(2) $(7) $5 $11 $288 Allowance 3/31/22 Specific Reserves Portfolio Mix Changes Economic Forecast & Other Loan Growth Allowance 6/30/2022
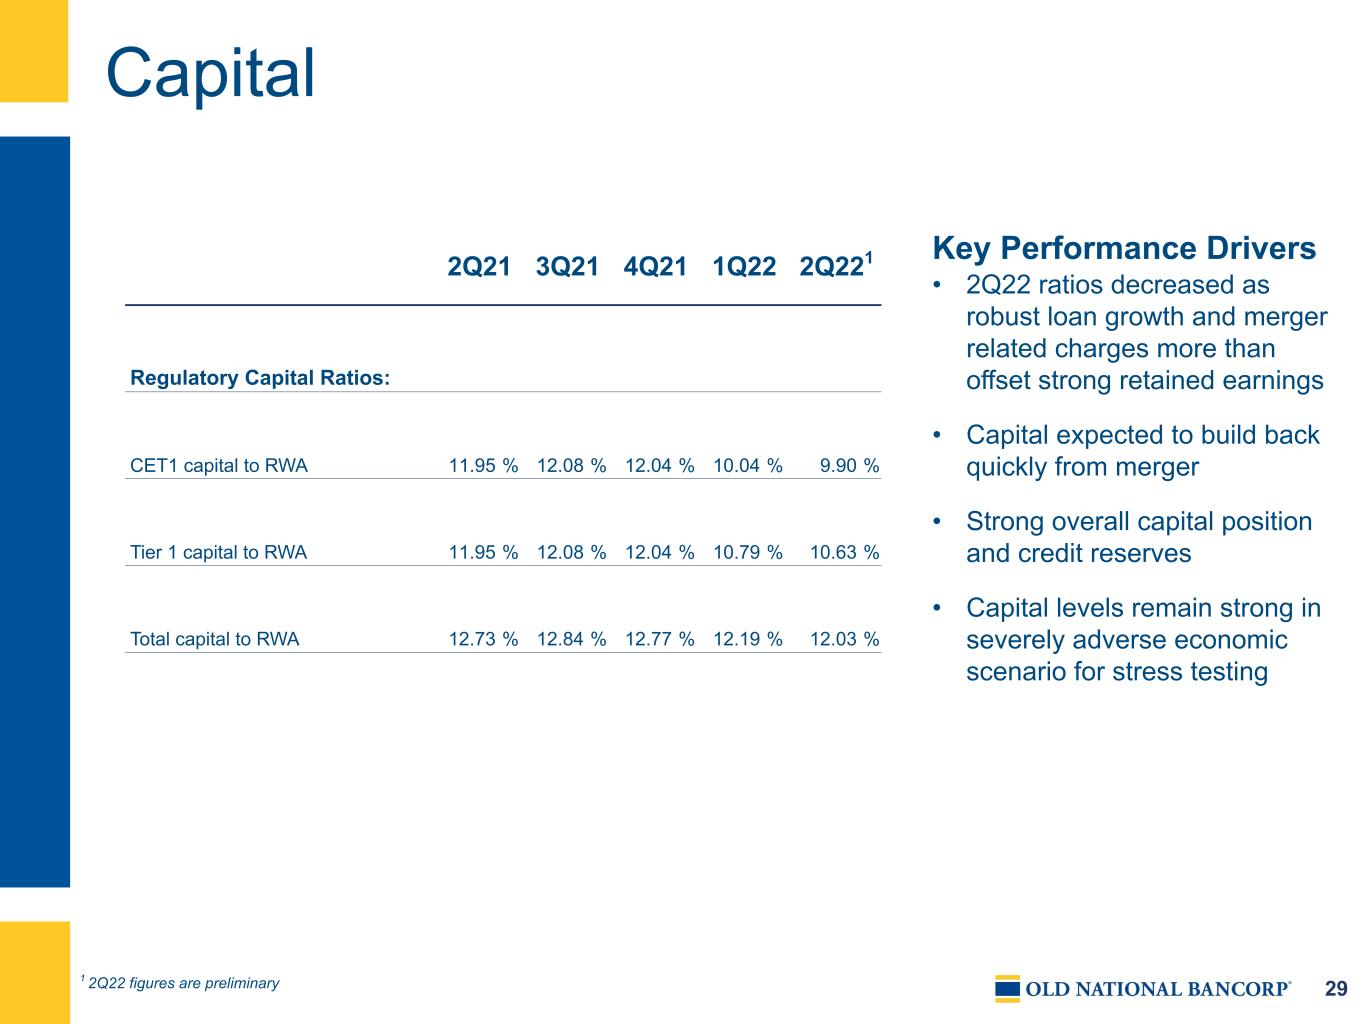
29 Capital 2Q21 3Q21 4Q21 1Q22 2Q221 Regulatory Capital Ratios: CET1 capital to RWA 11.95 % 12.08 % 12.04 % 10.04 % 9.90 % Tier 1 capital to RWA 11.95 % 12.08 % 12.04 % 10.79 % 10.63 % Total capital to RWA 12.73 % 12.84 % 12.77 % 12.19 % 12.03 % Key Performance Drivers • 2Q22 ratios decreased as robust loan growth and merger related charges more than offset strong retained earnings • Capital expected to build back quickly from merger • Strong overall capital position and credit reserves • Capital levels remain strong in severely adverse economic scenario for stress testing 1 2Q22 figures are preliminary

Appendix
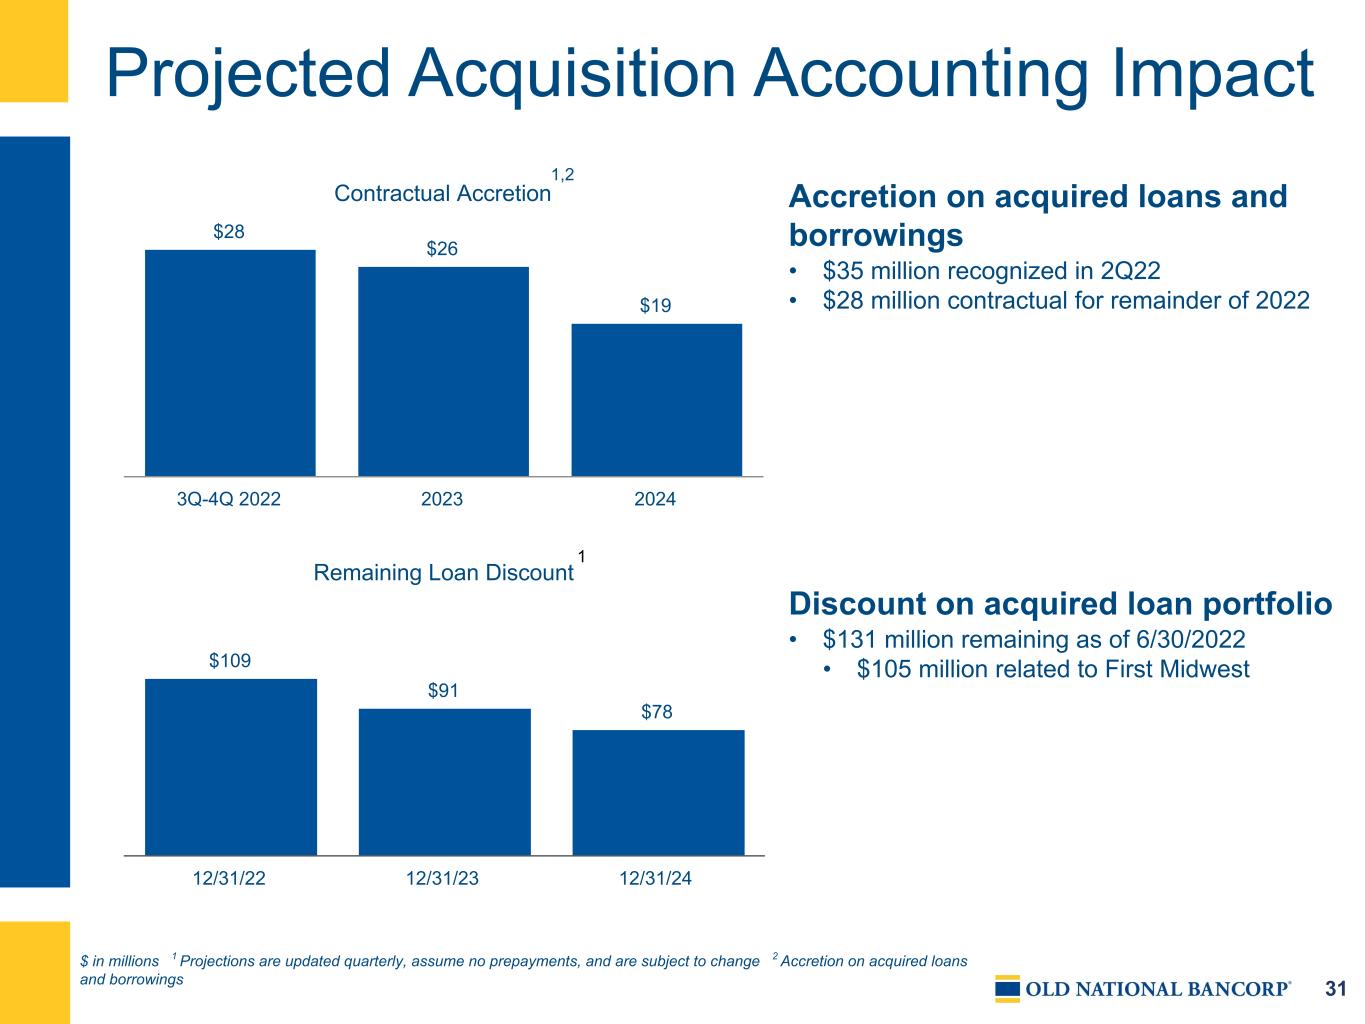
31 Contractual Accretion $28 $26 $19 3Q-4Q 2022 2023 2024 Remaining Loan Discount $109 $91 $78 12/31/22 12/31/23 12/31/24 Accretion on acquired loans and borrowings • $35 million recognized in 2Q22 • $28 million contractual for remainder of 2022 Discount on acquired loan portfolio • $131 million remaining as of 6/30/2022 • $105 million related to First Midwest Projected Acquisition Accounting Impact $ in millions 1 Projections are updated quarterly, assume no prepayments, and are subject to change 2 Accretion on acquired loans and borrowings 1,2 1

32 Commitment to Strong Corporate Governance Position or Salary Target Ownership Guidelines Chief Executive Officer 5X salary in stock or 200,000 shares Chief Operating Officer 4X salary in stock or 100,000 shares Salary equal to or greater than $250,000 3X salary in stock or 50,000 shares Salary below $250,000 2X salary in stock or 25,000 shares • Stock ownership guidelines have been established for executive officers as follows: • As indicated in Old National’s Proxy Statement filed April 8, 2022, each named executive officer has met their stock ownership requirement
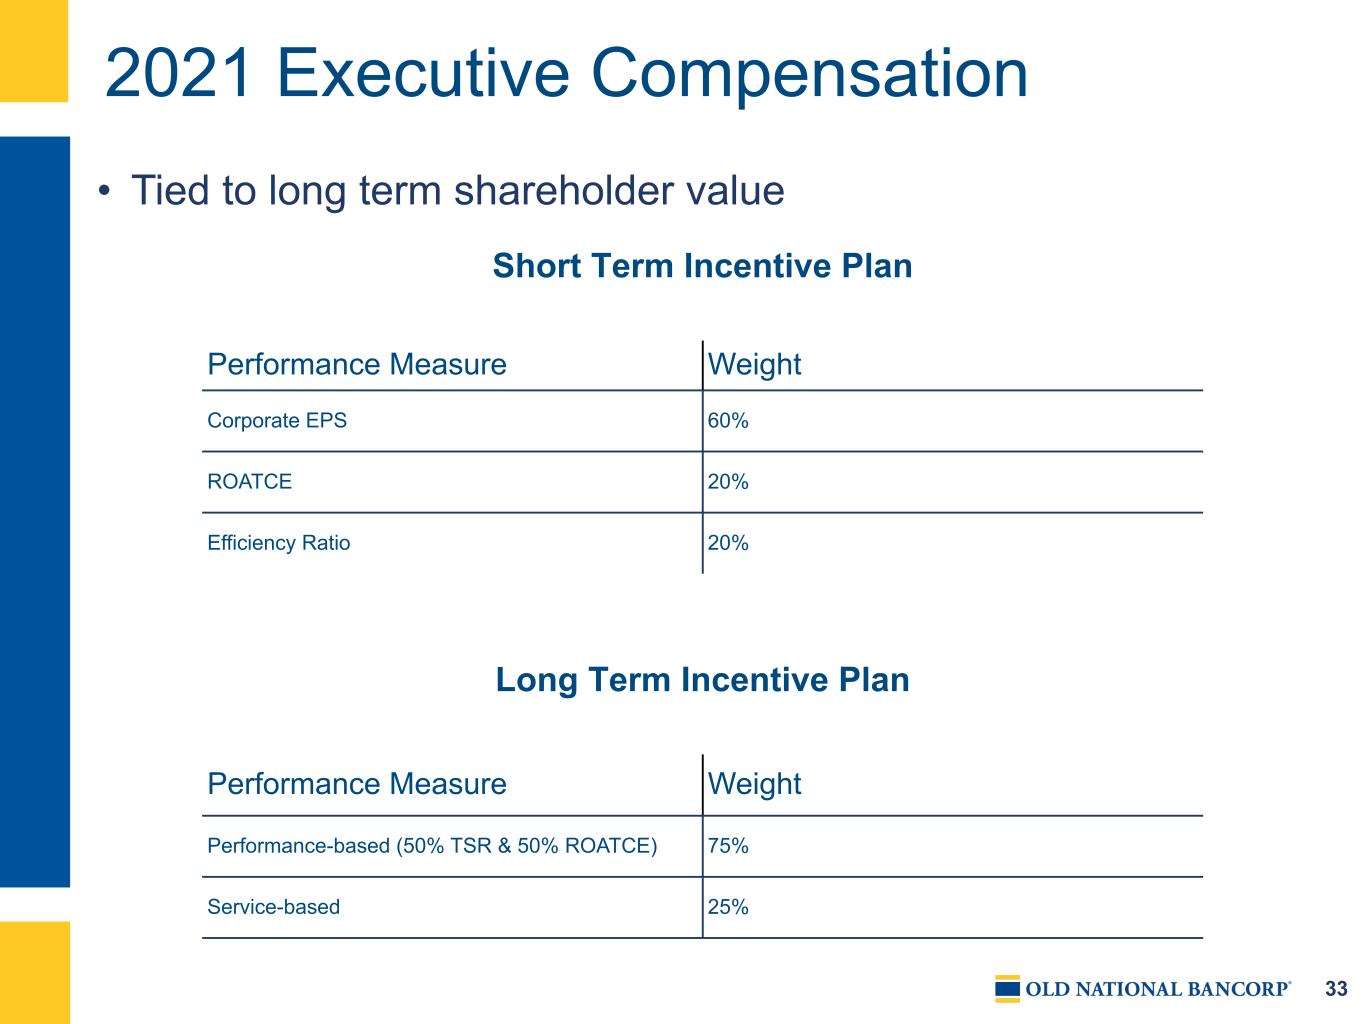
33 2021 Executive Compensation Short Term Incentive Plan Performance Measure Weight Corporate EPS 60% ROATCE 20% Efficiency Ratio 20% Long Term Incentive Plan Performance Measure Weight Performance-based (50% TSR & 50% ROATCE) 75% Service-based 25% • Tied to long term shareholder value

34 Board of Directors Director Market Background Barbara A. Boigegrain Chicago, IL Former CEO and General Secretary of Wespath Benefits and Investments Thomas L. Brown Chicago, IL Former Senior Vice President and CFO of RLI Corp., a specialty insurer serving diverse niche property, casualty and surety markets; former partner, PricewaterhouseCoopers LLP Kathryn J. Hayley Chicago, IL CEO of Rosewood Advisory Services, LLC, a business advisory services firm; former Executive Vice President, United Healthcare Peter J. Henseler Chicago, IL Chairman of TOMY International, a wholly owned subsidiary of TOMY Company, Ltd., a global designer and marketer of toys and infant products Daniel S. Hermann Evansville, IN Founder of AmeriQual Group, LLC, where he served as CEO; Founding partner of Lechwe Holdings LLC; over 20 years of management experience with Black Beauty Coal Company Ryan C. Kitchell Indianapolis, IN Former Executive Vice President and Chief Administrative Officer at Indiana University Health; former IU Health’s Chief Financial Officer; previously worked for Indiana Governor Mitch Daniels Austin M. Ramirez Waukesha, WI President and CEO of Husco International, a global engineering and manufacturing company Ellen A. Rudnick Chicago, IL Senior Advisor and Adjunct Professor of Entrepreneurship and former Executive Director of the Polsky Center for Entrepreneurship and Innovation at the University of Chicago Booth School of Business James C. Ryan, III Evansville, IN CEO of Old National Bancorp; previously CFO of Old National Bancorp Thomas E. Salmon Evansville, IN Chairman and CEO of Berry Global, a Fortune 500 and NYSE company; former Berry Global’s President and Chief Operating Officer Michael L. Scudder, Executive Chairman Chicago, IL Executive Chairman of the Board of Directors of the Company; former CEO of First Midwest Rebecca S. Skillman, Lead Independent Director Bloomington, IN Chairman of Radius Indiana, an economic development regional partnership; former Lieutenant Governor of the State of Indiana as well as Indiana Senator Michael J. Small Chicago, IL Chairman and Co-Founder of K4 Mobility LLC, a technology developer and provider of satellite communications services; former CEO, Gogo, Inc. (NASDAQ) Derrick J. Stewart Indianapolis, IN Senior Vice President, Education and Communication of the YMCA Retirement Fund; former President & CEO of the YMCA of Greater Indianapolis; former CEO of the YMCA of Southwestern Indiana Stephen C. Van Arsdell Chicago, IL Former senior partner of Deloitte & Touche LLP, where he served as Chairman and CEO Katherine E. White Ann Arbor, MI Brigadier General in the U.S. Army; currently serving in the Michigan Army National Guard as the Deputy Commanding General of the 46th Military Police Command; Professor of Law at Wayne State University Law School; Regent with the University of Michigan Board of Regents
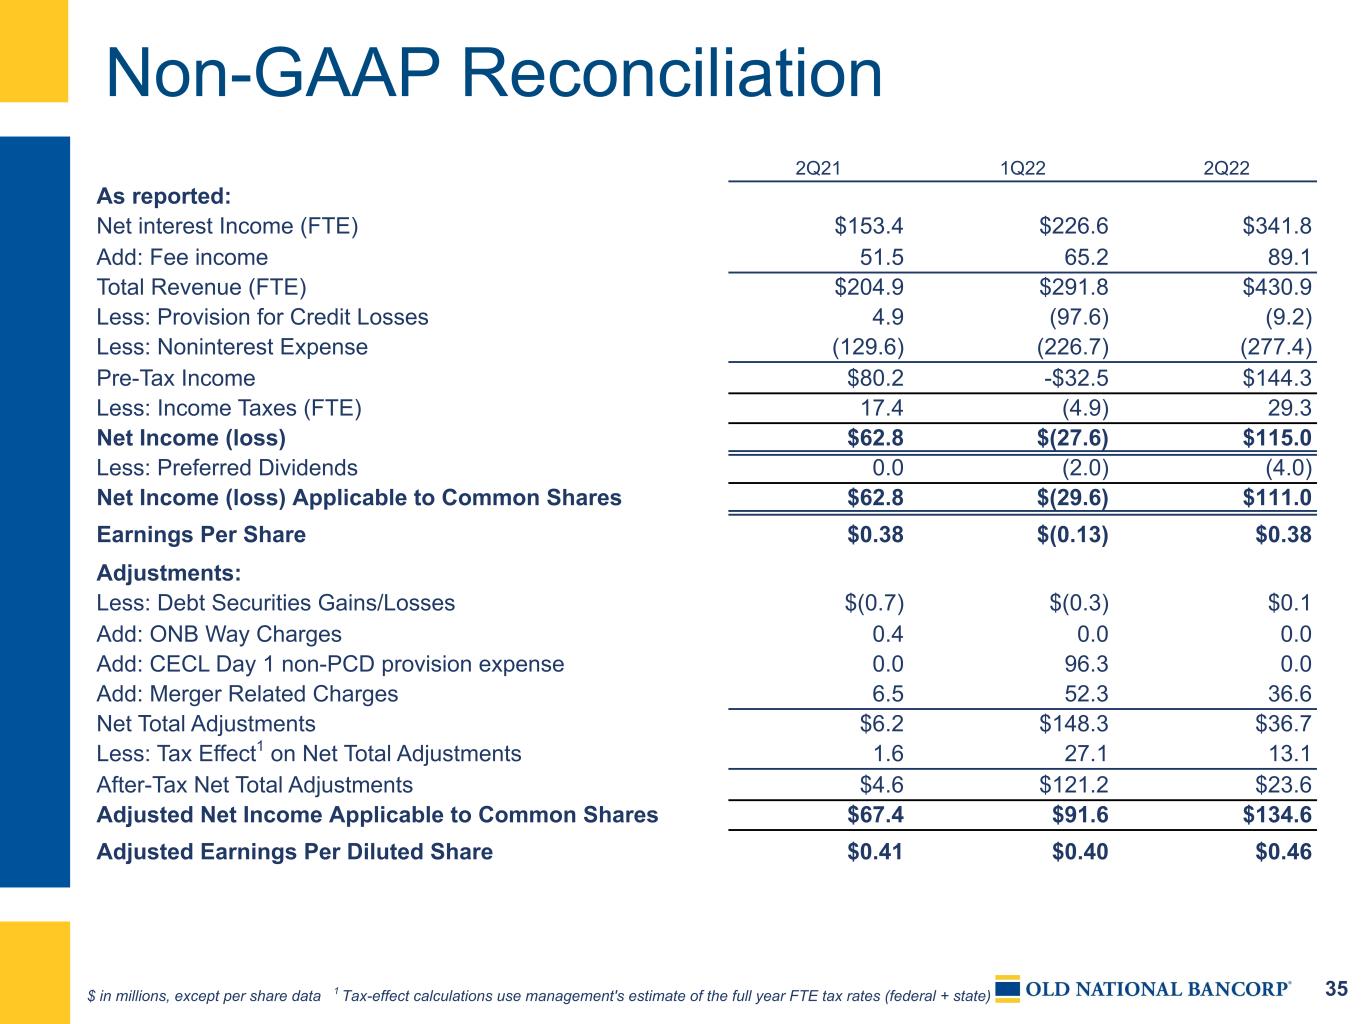
35 Non-GAAP Reconciliation $ in millions, except per share data 1 Tax-effect calculations use management's estimate of the full year FTE tax rates (federal + state) 2Q21 1Q22 2Q22 As reported: Net interest Income (FTE) $153.4 $226.6 $341.8 Add: Fee income 51.5 65.2 89.1 Total Revenue (FTE) $204.9 $291.8 $430.9 Less: Provision for Credit Losses 4.9 (97.6) (9.2) Less: Noninterest Expense (129.6) (226.7) (277.4) Pre-Tax Income $80.2 -$32.5 $144.3 Less: Income Taxes (FTE) 17.4 (4.9) 29.3 Net Income (loss) $62.8 $(27.6) $115.0 Less: Preferred Dividends 0.0 (2.0) (4.0) Net Income (loss) Applicable to Common Shares $62.8 $(29.6) $111.0 Earnings Per Share $0.38 $(0.13) $0.38 Adjustments: Less: Debt Securities Gains/Losses $(0.7) $(0.3) $0.1 Add: ONB Way Charges 0.4 0.0 0.0 Add: CECL Day 1 non-PCD provision expense 0.0 96.3 0.0 Add: Merger Related Charges 6.5 52.3 36.6 Net Total Adjustments $6.2 $148.3 $36.7 Less: Tax Effect1 on Net Total Adjustments 1.6 27.1 13.1 After-Tax Net Total Adjustments $4.6 $121.2 $23.6 Adjusted Net Income Applicable to Common Shares $67.4 $91.6 $134.6 Adjusted Earnings Per Diluted Share $0.41 $0.40 $0.46

36 Non-GAAP Reconciliation $ in millions 2Q21 3Q21 4Q21 1Q22 2Q22 As reported: Net interest Income (FTE) $153.4 $155.1 $150.2 $226.6 $341.8 Add: Fee income 51.5 54.5 51.5 65.2 89.1 Total Revenue (FTE) $204.9 $209.6 $201.7 $291.8 $430.9 Less: Noninterest Expense 129.6 121.3 131.9 226.7 277.4 Pre-Provision Net Revenue (PPRN) $75.3 $88.3 $69.8 $65.1 $153.5 Revenue Adjustments: Less: Debt Securities Gains/Losses $(0.7) $(1.2) $(0.4) $(0.3) $0.1 Adjusted Total Revenue $204.2 $208.4 $201.3 $291.5 $431.0 Expense Adjustments: Less: ONB Way Charges $(0.4) $0.0 $0.0 $0.0 $0.0 Less: Merger-Related Charges (6.5) (1.4) (6.7) (52.3) (36.6) Less: Amortization of Tax Credit Investments (1.8) (1.7) (2.0) (1.5) (1.5) Adjusted Total Expense $120.9 $118.2 $123.2 $172.9 $239.3 Adjusted Pre-Provision Net Revenue (PPRN) $83.3 $90.2 $78.1 $118.6 $191.7

37 Non-GAAP Reconciliation $ in millions 2Q21 3Q21 4Q21 1Q22 2Q22 Noninterest Expense As Reported $129.6 $121.3 $131.9 $226.7 $277.4 Less: ONB Way Charges (0.4) 0.0 0.0 0.0 0.0 Less: Merger-Related Charges (6.5) (1.4) (6.7) (52.3) (36.6) Noninterest Expense Less Charges $122.7 $119.9 $125.2 $174.4 $240.8 Less: Amortization of Tax Credits Investments $(1.8) $(1.7) $(2.0) $(1.5) $(1.5) Adjusted Noninterest Expense $120.9 $118.2 $123.2 $172.9 $239.3 Net Interest Income As Reported $149.9 $151.6 $146.8 $222.8 $337.5 Add: FTE Adjustment 3.5 3.5 3.4 3.8 4.3 Net Interest Income (FTE) $153.4 $155.1 $150.2 $226.6 $341.8 Noninterest Income As Reported 51.5 54.5 51.5 65.2 89.1 Total Revenue (FTE) $204.9 $209.6 $201.7 $291.8 $430.9 Less: Debt Securities Gains/Losses (0.7) (1.2) (0.4) (0.3) 0.1 Adjusted Total Revenue (FTE) $204.2 $208.4 $201.3 $291.5 $431.0 Reported Efficiency Ratio 62.05 % 56.86 % 64.27 % 76.15 % 62.70 % Adjusted Efficiency Ratio 57.74 % 55.38 % 59.95 % 57.67 % 53.85 % Noninterest Income As Reported $51.5 $54.5 $51.5 $65.2 $89.1 Less: Debt Securities Gains/Losses (0.7) (1.2) (0.4) (0.3) 0.1 Adjusted Noninterest Income $50.8 $53.3 $51.1 $64.9 $89.2
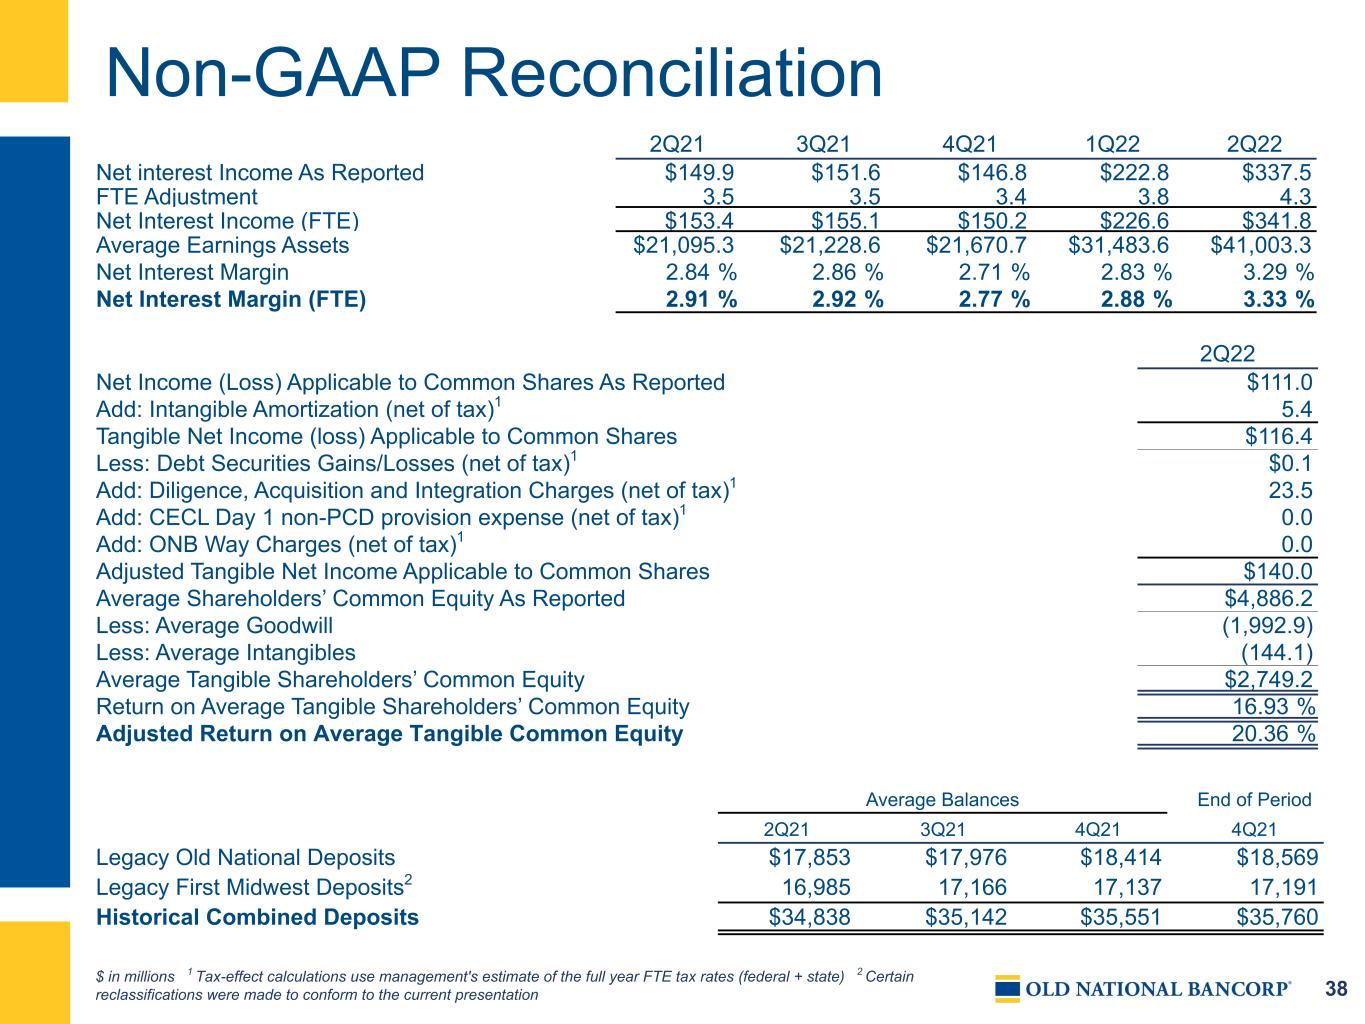
38 Non-GAAP Reconciliation $ in millions 1 Tax-effect calculations use management's estimate of the full year FTE tax rates (federal + state) 2 Certain reclassifications were made to conform to the current presentation 2Q21 3Q21 4Q21 1Q22 2Q22 Net interest Income As Reported $149.9 $151.6 $146.8 $222.8 $337.5 FTE Adjustment 3.5 3.5 3.4 3.8 4.3 Net Interest Income (FTE) $153.4 $155.1 $150.2 $226.6 $341.8 Average Earnings Assets $21,095.3 $21,228.6 $21,670.7 $31,483.6 $41,003.3 Net Interest Margin 2.84 % 2.86 % 2.71 % 2.83 % 3.29 % Net Interest Margin (FTE) 2.91 % 2.92 % 2.77 % 2.88 % 3.33 % 2Q22 Net Income (Loss) Applicable to Common Shares As Reported $111.0 Add: Intangible Amortization (net of tax)1 5.4 Tangible Net Income (loss) Applicable to Common Shares $116.4 Less: Debt Securities Gains/Losses (net of tax)1 $0.1 Add: Diligence, Acquisition and Integration Charges (net of tax)1 23.5 Add: CECL Day 1 non-PCD provision expense (net of tax)1 0.0 Add: ONB Way Charges (net of tax)1 0.0 Adjusted Tangible Net Income Applicable to Common Shares $140.0 Average Shareholders’ Common Equity As Reported $4,886.2 Less: Average Goodwill (1,992.9) Less: Average Intangibles (144.1) Average Tangible Shareholders’ Common Equity $2,749.2 Return on Average Tangible Shareholders’ Common Equity 16.93 % Adjusted Return on Average Tangible Common Equity 20.36 % Average Balances End of Period 2Q21 3Q21 4Q21 4Q21 Legacy Old National Deposits $17,853 $17,976 $18,414 $18,569 Legacy First Midwest Deposits2 16,985 17,166 17,137 17,191 Historical Combined Deposits $34,838 $35,142 $35,551 $35,760
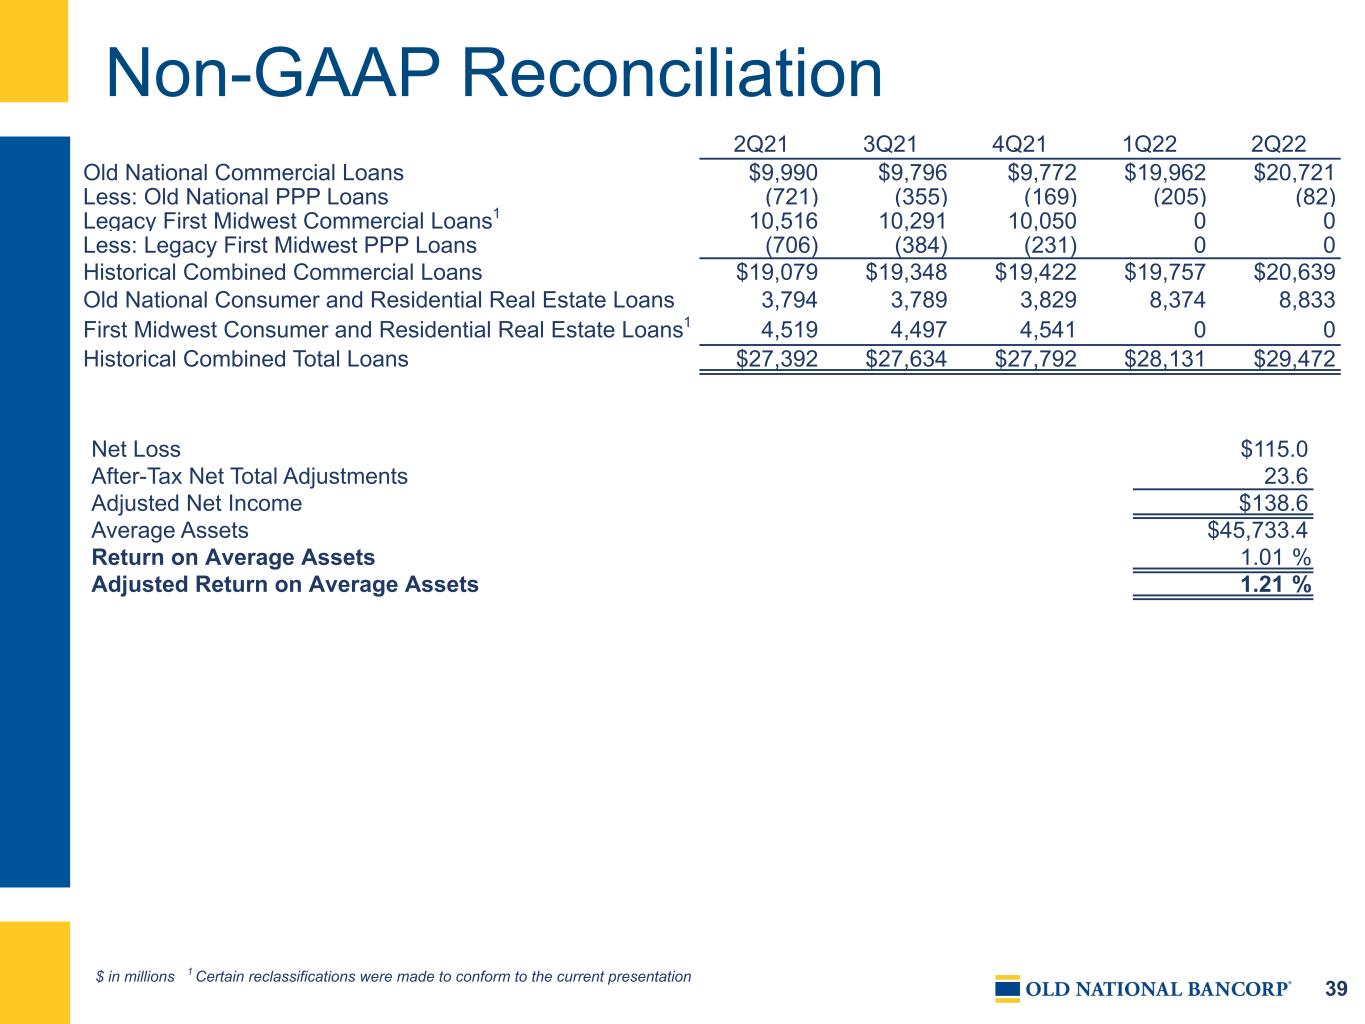
39 Non-GAAP Reconciliation $ in millions 1 Certain reclassifications were made to conform to the current presentation 2Q21 3Q21 4Q21 1Q22 2Q22 Old National Commercial Loans $9,990 $9,796 $9,772 $19,962 $20,721 Less: Old National PPP Loans (721) (355) (169) (205) (82) Legacy First Midwest Commercial Loans1 10,516 10,291 10,050 0 0 Less: Legacy First Midwest PPP Loans (706) (384) (231) 0 0 Historical Combined Commercial Loans $19,079 $19,348 $19,422 $19,757 $20,639 Old National Consumer and Residential Real Estate Loans 3,794 3,789 3,829 8,374 8,833 First Midwest Consumer and Residential Real Estate Loans1 4,519 4,497 4,541 0 0 Historical Combined Total Loans $27,392 $27,634 $27,792 $28,131 $29,472 Net Loss $115.0 After-Tax Net Total Adjustments 23.6 Adjusted Net Income $138.6 Average Assets $45,733.4 Return on Average Assets 1.01 % Adjusted Return on Average Assets 1.21 %
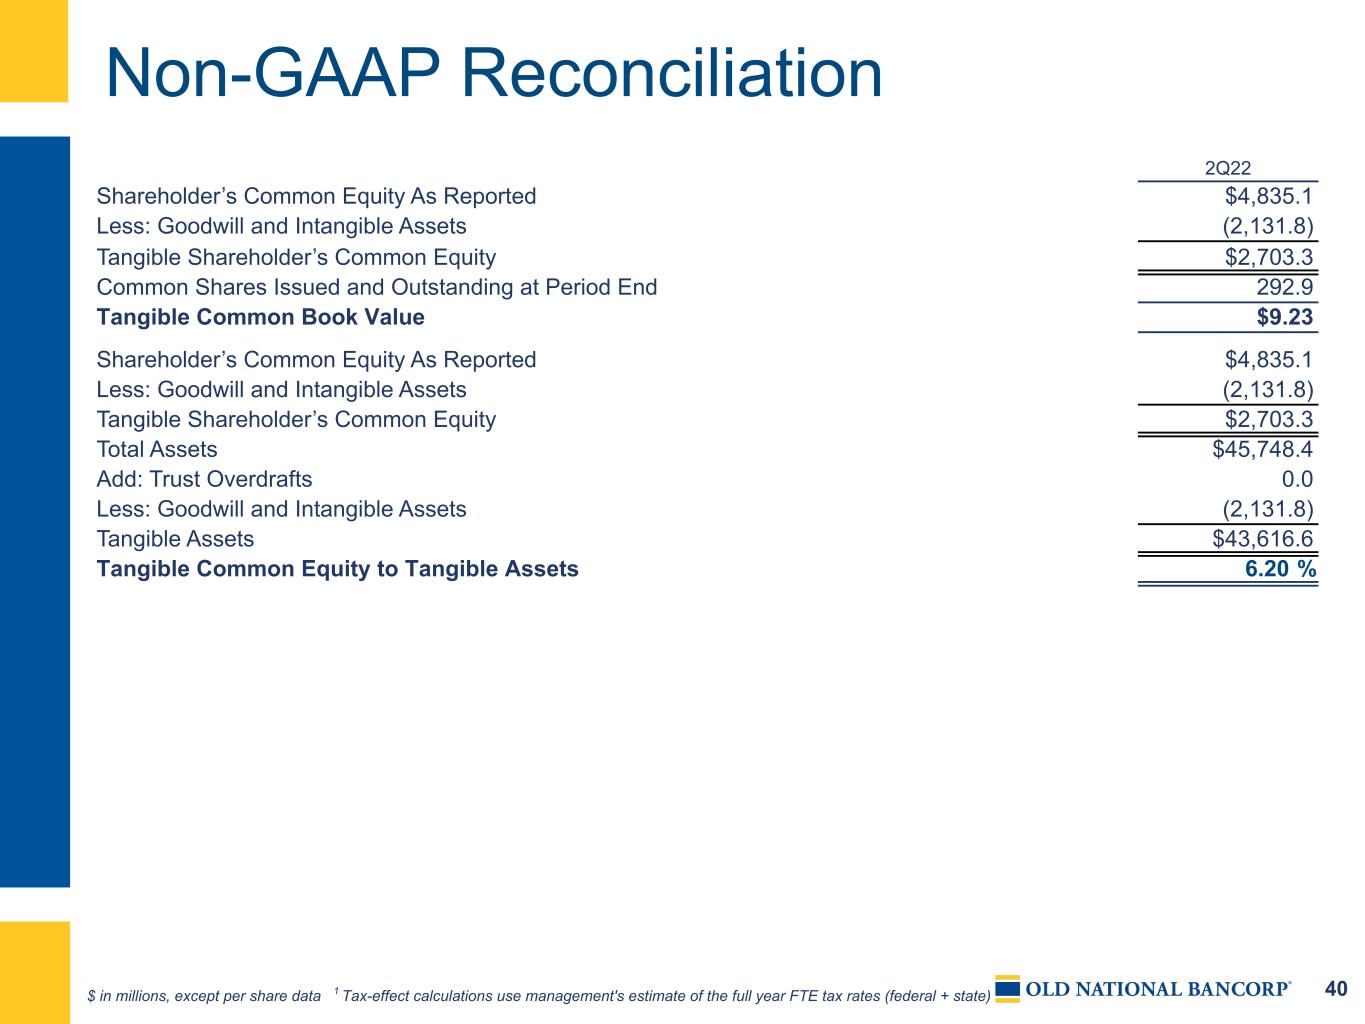
40 Non-GAAP Reconciliation $ in millions, except per share data 1 Tax-effect calculations use management's estimate of the full year FTE tax rates (federal + state) 2Q22 Shareholder’s Common Equity As Reported $4,835.1 Less: Goodwill and Intangible Assets (2,131.8) Tangible Shareholder’s Common Equity $2,703.3 Common Shares Issued and Outstanding at Period End 292.9 Tangible Common Book Value $9.23 Shareholder’s Common Equity As Reported $4,835.1 Less: Goodwill and Intangible Assets (2,131.8) Tangible Shareholder’s Common Equity $2,703.3 Total Assets $45,748.4 Add: Trust Overdrafts 0.0 Less: Goodwill and Intangible Assets (2,131.8) Tangible Assets $43,616.6 Tangible Common Equity to Tangible Assets 6.20 %
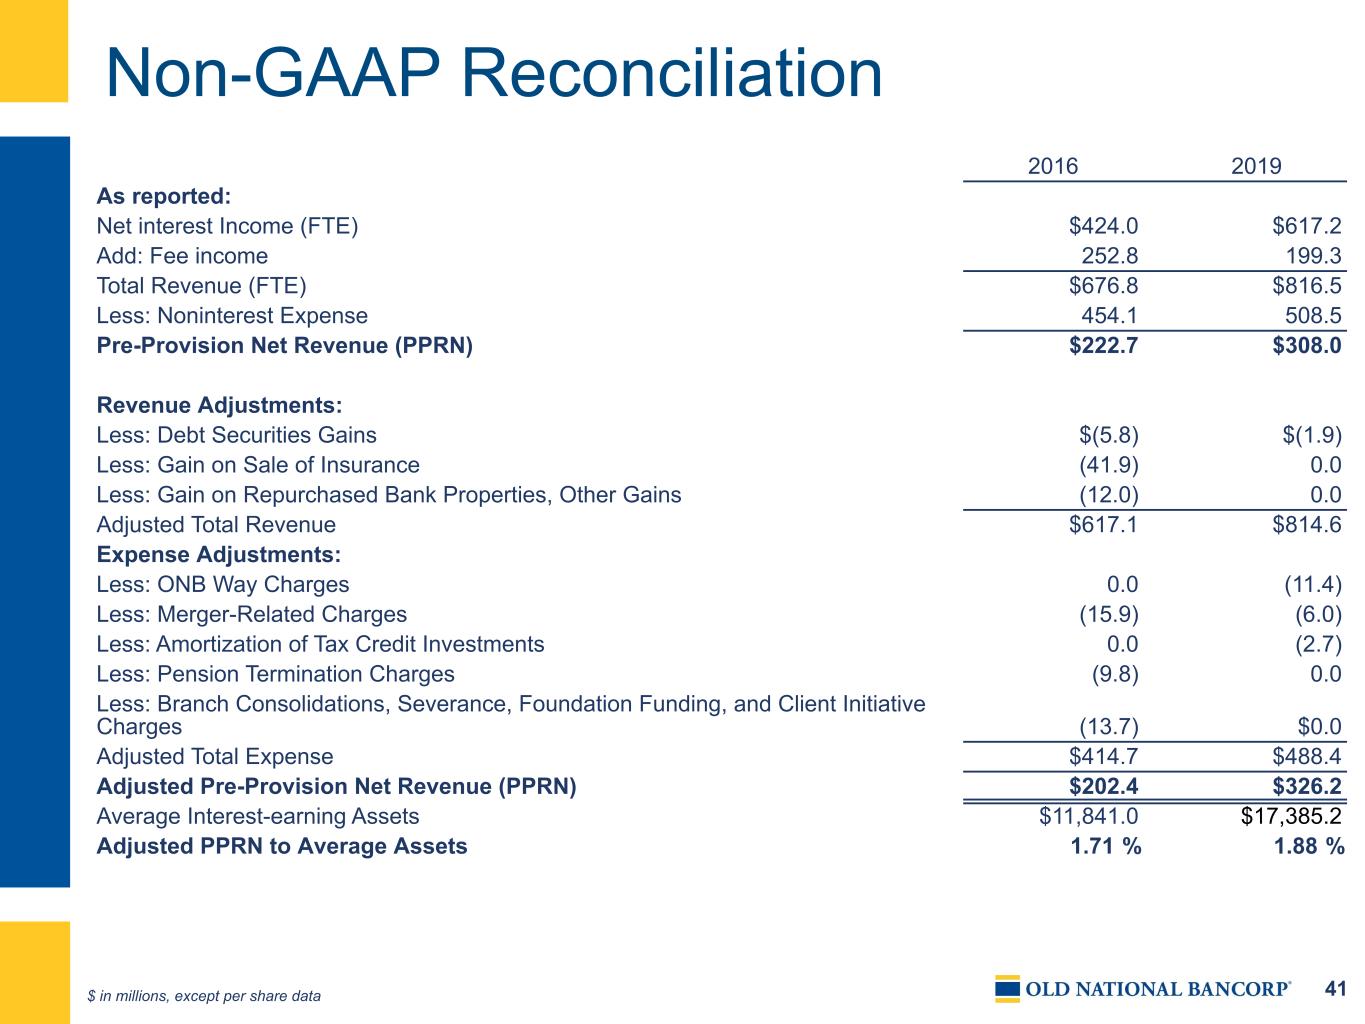
41 Non-GAAP Reconciliation $ in millions, except per share data 2016 2019 As reported: Net interest Income (FTE) $424.0 $617.2 Add: Fee income 252.8 199.3 Total Revenue (FTE) $676.8 $816.5 Less: Noninterest Expense 454.1 508.5 Pre-Provision Net Revenue (PPRN) $222.7 $308.0 Revenue Adjustments: Less: Debt Securities Gains $(5.8) $(1.9) Less: Gain on Sale of Insurance (41.9) 0.0 Less: Gain on Repurchased Bank Properties, Other Gains (12.0) 0.0 Adjusted Total Revenue $617.1 $814.6 Expense Adjustments: Less: ONB Way Charges 0.0 (11.4) Less: Merger-Related Charges (15.9) (6.0) Less: Amortization of Tax Credit Investments 0.0 (2.7) Less: Pension Termination Charges (9.8) 0.0 Less: Branch Consolidations, Severance, Foundation Funding, and Client Initiative Charges (13.7) $0.0 Adjusted Total Expense $414.7 $488.4 Adjusted Pre-Provision Net Revenue (PPRN) $202.4 $326.2 Average Interest-earning Assets $11,841.0 $17,385.2 Adjusted PPRN to Average Assets 1.71 % 1.88 %
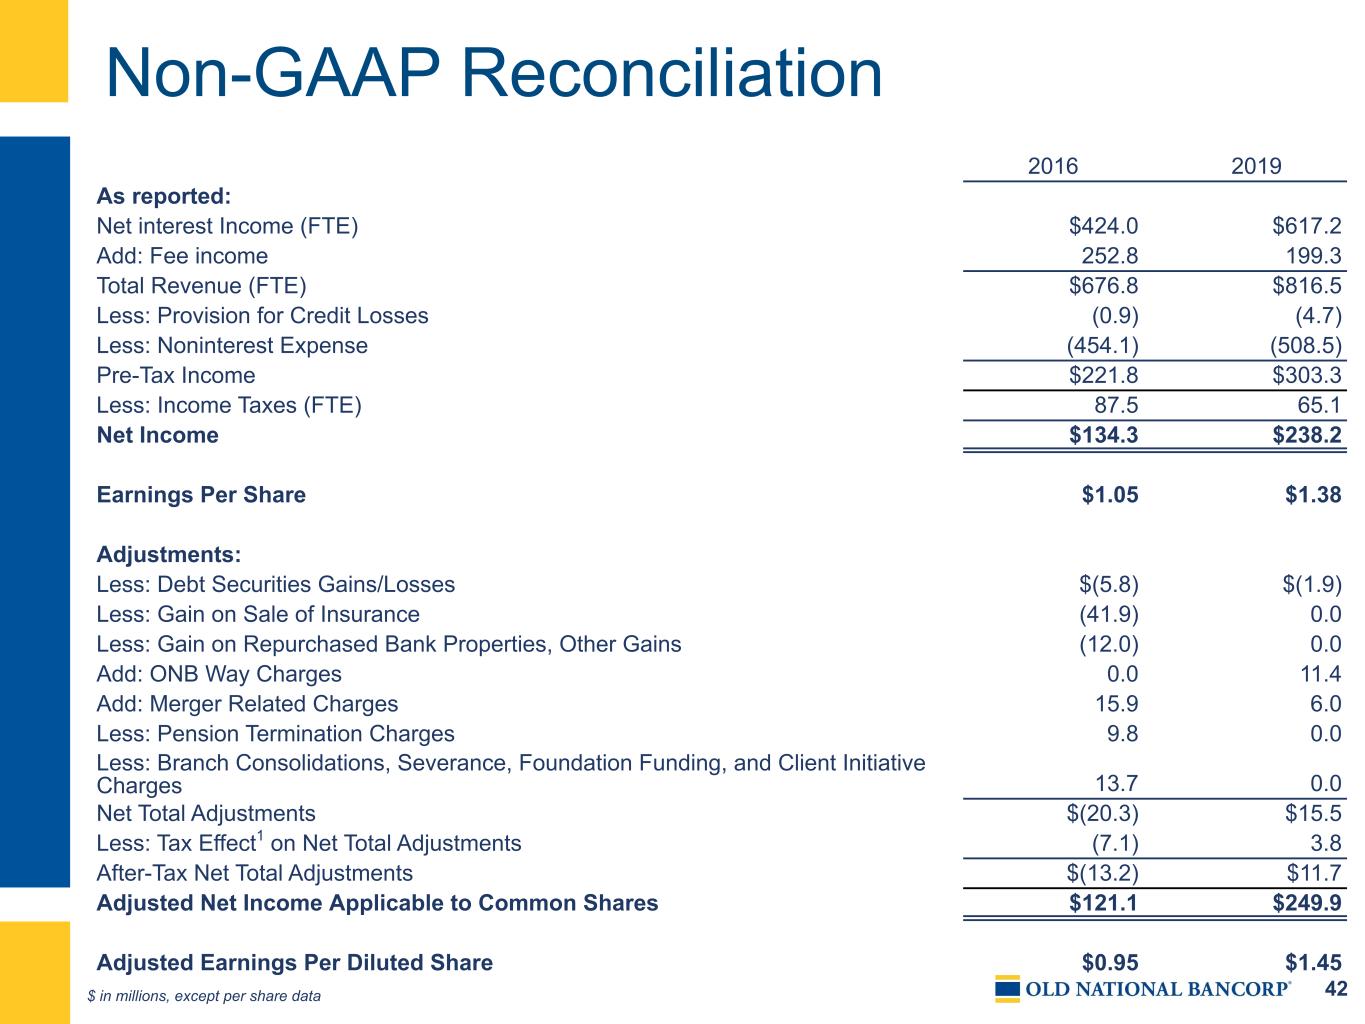
42 Non-GAAP Reconciliation $ in millions, except per share data 2016 2019 As reported: Net interest Income (FTE) $424.0 $617.2 Add: Fee income 252.8 199.3 Total Revenue (FTE) $676.8 $816.5 Less: Provision for Credit Losses (0.9) (4.7) Less: Noninterest Expense (454.1) (508.5) Pre-Tax Income $221.8 $303.3 Less: Income Taxes (FTE) 87.5 65.1 Net Income $134.3 $238.2 Earnings Per Share $1.05 $1.38 Adjustments: Less: Debt Securities Gains/Losses $(5.8) $(1.9) Less: Gain on Sale of Insurance (41.9) 0.0 Less: Gain on Repurchased Bank Properties, Other Gains (12.0) 0.0 Add: ONB Way Charges 0.0 11.4 Add: Merger Related Charges 15.9 6.0 Less: Pension Termination Charges 9.8 0.0 Less: Branch Consolidations, Severance, Foundation Funding, and Client Initiative Charges 13.7 0.0 Net Total Adjustments $(20.3) $15.5 Less: Tax Effect1 on Net Total Adjustments (7.1) 3.8 After-Tax Net Total Adjustments $(13.2) $11.7 Adjusted Net Income Applicable to Common Shares $121.1 $249.9 Adjusted Earnings Per Diluted Share $0.95 $1.45
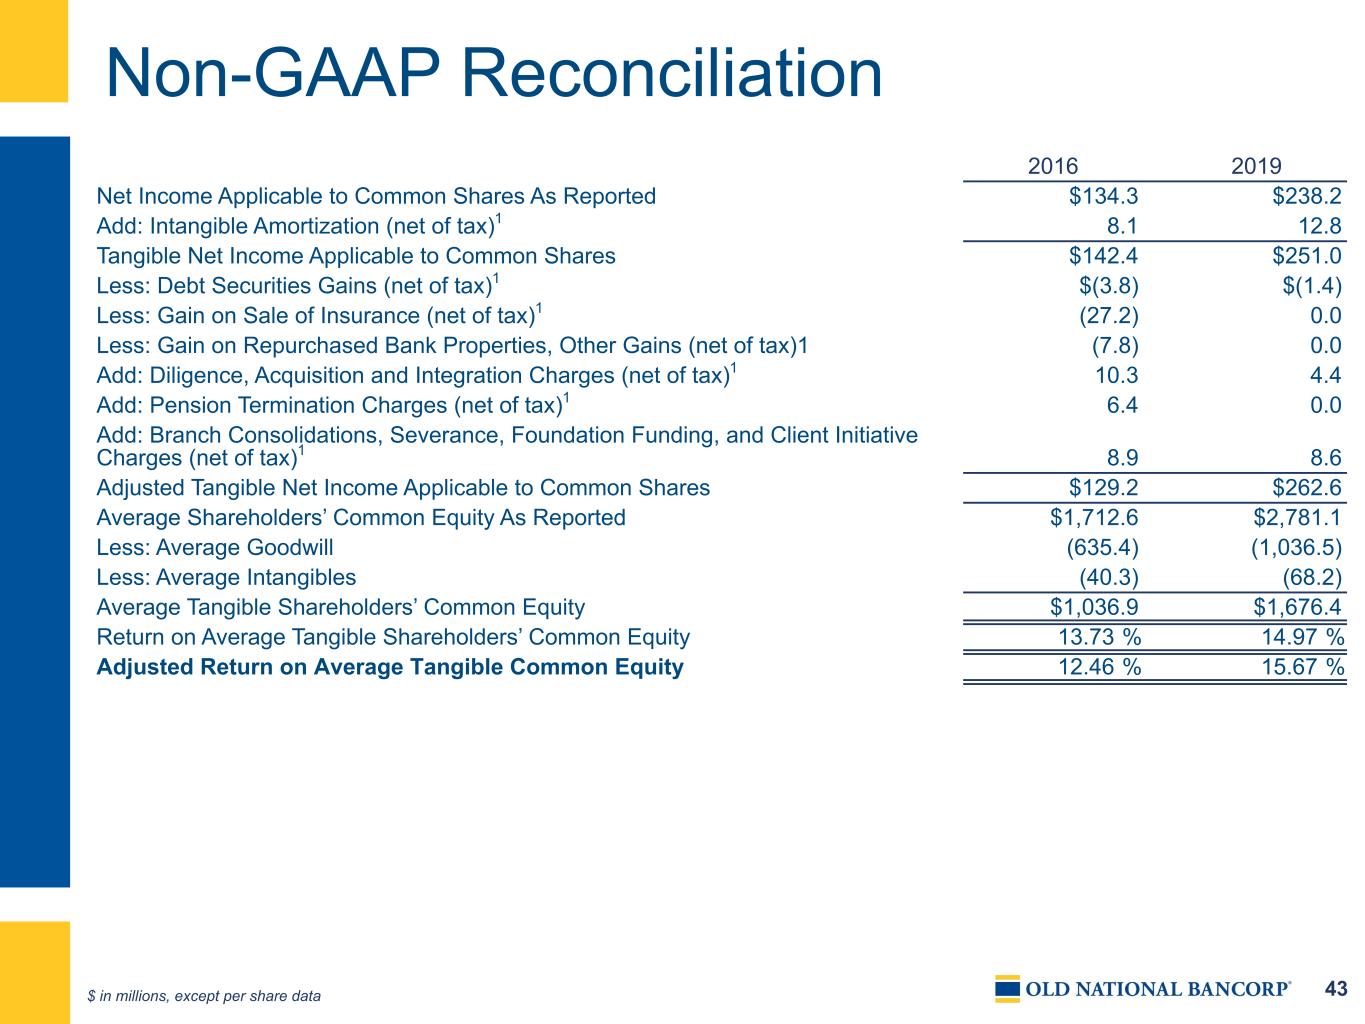
43 Non-GAAP Reconciliation $ in millions, except per share data 2016 2019 Net Income Applicable to Common Shares As Reported $134.3 $238.2 Add: Intangible Amortization (net of tax)1 8.1 12.8 Tangible Net Income Applicable to Common Shares $142.4 $251.0 Less: Debt Securities Gains (net of tax)1 $(3.8) $(1.4) Less: Gain on Sale of Insurance (net of tax)1 (27.2) 0.0 Less: Gain on Repurchased Bank Properties, Other Gains (net of tax)1 (7.8) 0.0 Add: Diligence, Acquisition and Integration Charges (net of tax)1 10.3 4.4 Add: Pension Termination Charges (net of tax)1 6.4 0.0 Add: Branch Consolidations, Severance, Foundation Funding, and Client Initiative Charges (net of tax)1 8.9 8.6 Adjusted Tangible Net Income Applicable to Common Shares $129.2 $262.6 Average Shareholders’ Common Equity As Reported $1,712.6 $2,781.1 Less: Average Goodwill (635.4) (1,036.5) Less: Average Intangibles (40.3) (68.2) Average Tangible Shareholders’ Common Equity $1,036.9 $1,676.4 Return on Average Tangible Shareholders’ Common Equity 13.73 % 14.97 % Adjusted Return on Average Tangible Common Equity 12.46 % 15.67 %

44 Peer Group Like-size, publicly-traded financial services companies, serving comparable demographics with comparable services as Old National Bancorp Associated Banc-Corp ASB BOK Financial Corporation BOKF Cadence Bank CADE Comerica Incorporated CMA F.N.B. Corporation FNB First Horizon Corporation FHN Hancock Whitney Corporation HWC Synovus Financial Corp. SNV UMB Financial Corporation UMBF Umpqua Holdings Corporation UMPQ Valley National Bancorp VLY Webster Financial Corporation WBS Western Alliance Bancorporation WAL Wintrust Financial Corporation WTFC Zions Bancorporation ZION

45 Old National Investor Relations Contact Additional information can be found on the Investor Relations web pages at www.oldnational.com Investor Inquiries: Lynell J. Walton, CPA SVP - Director of Investor Relations 812-464-1366 lynell.walton@oldnational.com


