Digirad Corporation
Nasdaq: DRAD
CapStone Investments
Small-Cap Investor Conference
June 17, 2008

Forward-Looking Statements
Certain statements in this presentation that are not a description of historical facts are
forward-looking statements as determined by the Private Securities Litigation Reform Act of
1995. Forward-looking statements do not relate strictly to historical or current facts and include
words such as "anticipate," "estimate," "expect," "project," "intend," "plan," "believe" and other
terms that discuss future operating or financial performance and/or events. Examples of such
forward-looking statements include, but are not limited to, statements about the Company’s
revenues, expenses, margins, operations, mobile imaging services, centers of influence
strategy and benefits, market conditions and trends, demand for imaging services and
products, imaging modality trends, strategic growth, acquisition strategies, competitive
advantages, utilization, cost control, financial results. These forward-looking statements are
based upon current assumptions and expectations that involve risks and uncertainties that
could cause actual events and financial performance to differ materially. Risks and
uncertainties include but are not limited to, technological change, industry trends, changes in
the company’s markets, and competition. More information about risks and uncertainties is
available in the Company’s filings with the U.S. Securities & Exchange Commission, including
Annual Reports on Form 10-K, Quarterly Reports on Form 10-Q, and Current Reports on Form
8-K. The information discussed in and during this presentation should be used in conjunction
with the consolidated financial statements and notes included in those Reports and speak only
as of the date hereof. The Company undertakes no obligation to update these forward-looking
statements. All such statements are qualified in their entirety by this cautionary statement, and
Digirad undertakes no obligation to revise or update this presentation to reflect events or
circumstances after the date hereof.
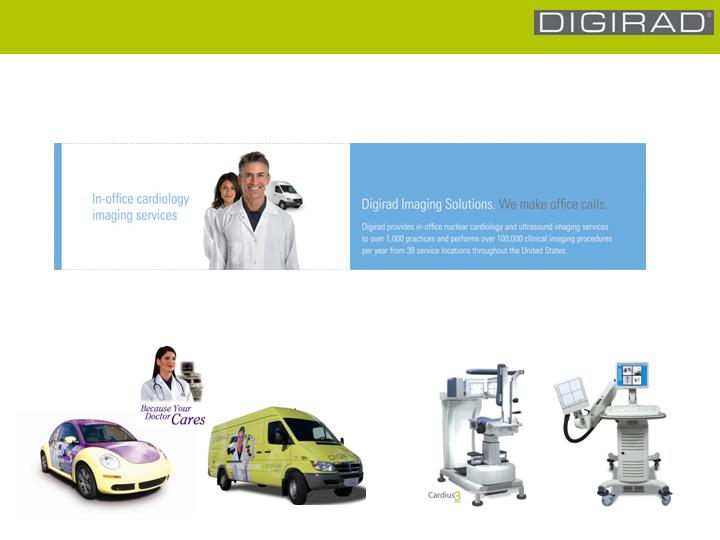
Digirad Corporation provides medical diagnostic imaging products
and services to physicians’ offices, hospitals and imaging centers.
Business Summary
Product Sales
Diagnostic Imaging Services
Diagnostic Imaging Services
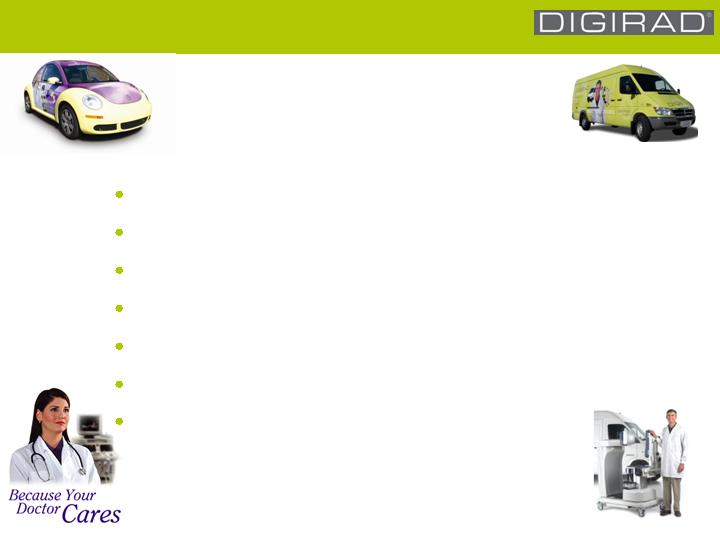
Mobile Imaging For
Today’s Patient, Physician Needs
Diagnostic requirements for aging population
Trend to decentralized (non-hospital) services
Facilitates outreach programs for academia and cardiology groups
Patients prefer own primary-care physicians
Flexible, scalable response to patient loads
Solves cost issues: fixed equipment, space, upkeep
New revenue stream for primary-care practices
“We Make Office Calls”
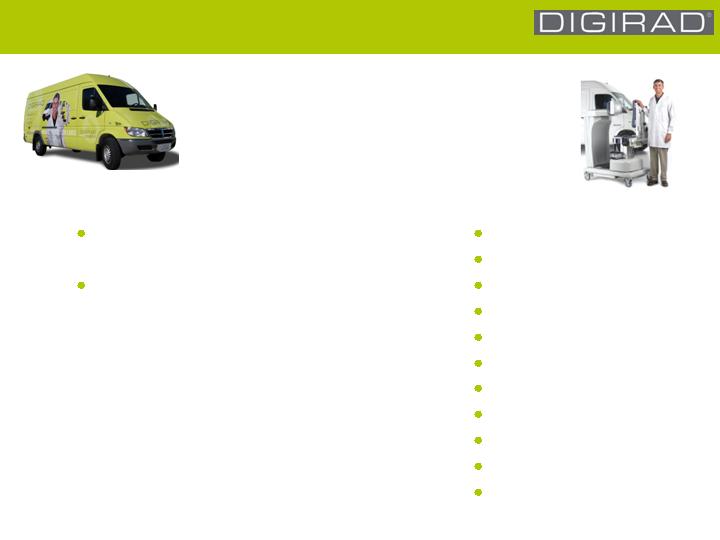
Digirad Imaging Solutions
Mobile Nuclear Imaging
Cardiac
Cardiac SPECT Perfusion Imaging
-Stress & Rest Gated/Non-Gated Studies
Results
-Cardiac Perfusion
-End Diastolic / End Systolic Volumes
-Ejection Fraction (EF)
-Myocardial Mass
-Cardiac Output Volumes (CO)
-Summed Stress Scores
-Myocardial Surface Maps
-Transient Ischemic Dilatation (TID)
General
HIDA
Gastric Emptying
GI Bleed
Thyroid Imaging
Renography
Brain Flow
Lung Imaging
Liver Imaging
Bone Spots
Pediatrics
MUGA (hearts)
Diagnostic Imaging Services
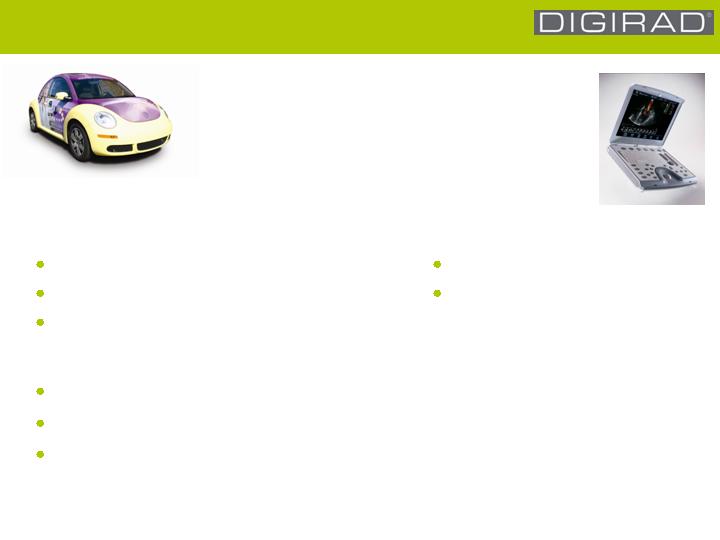
Digirad Ultrascan Solutions
Mobile Ultrasound Imaging
Cardiac
2D and 3D Echo (Adult and Pediatric)
Stress Echo
TEE
Vascular
Complete Carotid Imaging
Upper and lower Venous and Arterial Imaging
Segmental Pressures
General
Complete Abdominal Imaging
Complete Obstetrical and
Gynecological Imaging
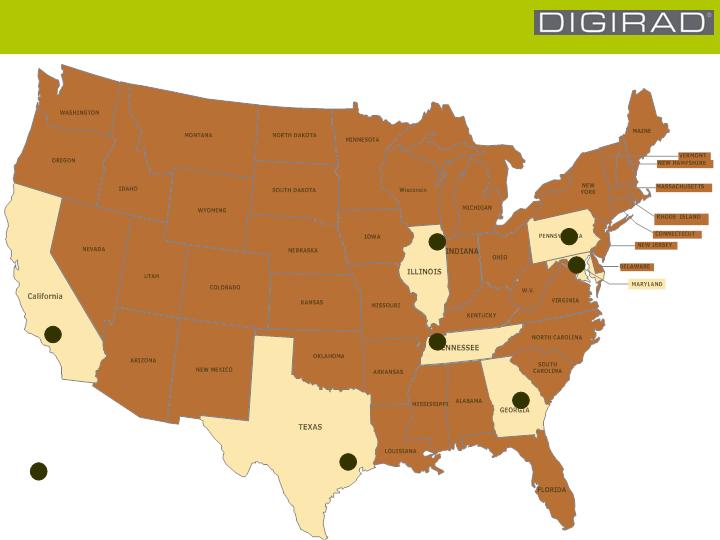
Diagnostic Imaging Services
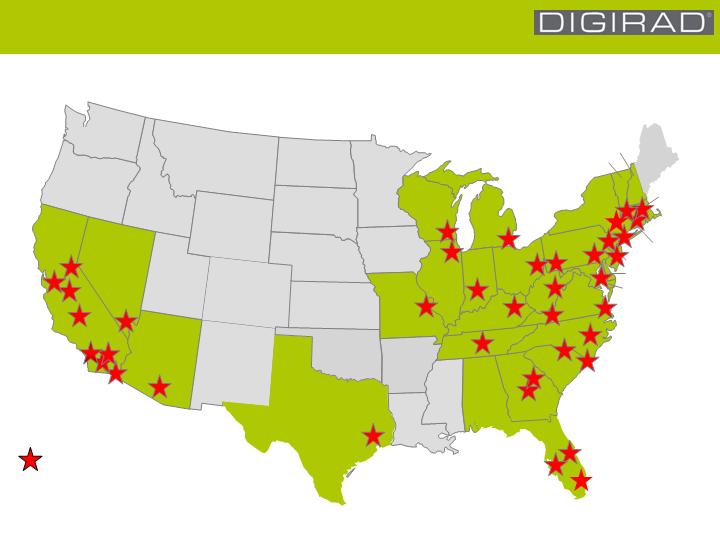
U.S. Regional Presence
California
Oregon
Washington
Montana
Idaho
Nevada
Utah
Colorado
Arizona
New Mexico
Texas
Oklahoma
Wyoming
Tennessee
Kentucky
Kansas
Nebraska
South Dakota
North Dakota
Minnesota
Iowa
Missouri
Arkansas
Ohio
Indiana
Illinois
Wisconsin
Michigan
Florida
Louisiana
Georgia
S. Carolina
N. Carolina
Mississippi
Alabama
Maine
Virginia
Pennsylvania
New
York
Vermont
New Hampshire
Delaware
Maryland
W. Virginia
Massachusetts
Connecticut
Rhode Island
New Jersey
Existing Services Hubs
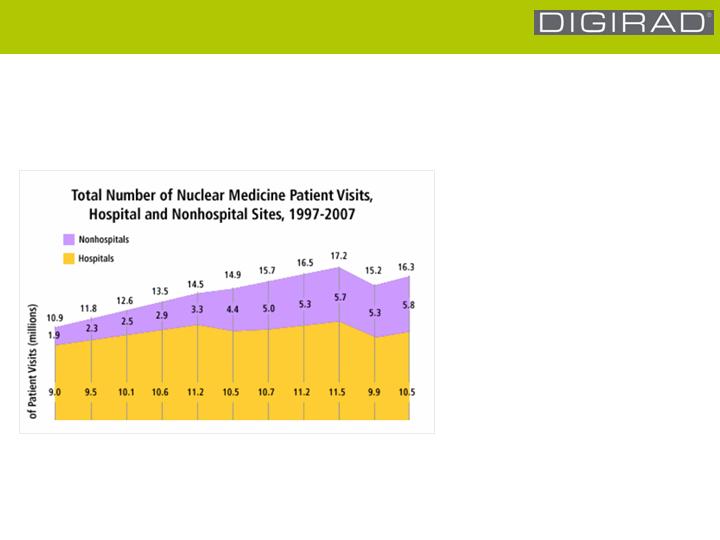
Source: IMV Nuclear Survey, Oct 2007
Market decline in 2006:
- Greater pre-certification burdens
- PET impacting oncology NM
Resuming Yearly Uptrend in Nuclear Imaging Patient Visits
Continuing Trend To Non-Hospital Providers
Market recovery in 2007:
- Secular uptrend resuming
- Trend away from hospitals
- IM/GPs becoming service providers
- Higher use of imaging by IM/GPs
Nuclear Imaging Market Trend
1997 1998 1999 2000 2001 2002 2003 2004 2005 2006 2007

2007*
2006
2005
16.3M 100%
15.2M 100%
17.2M 100%
Total
6.5M 40%
6.1M 41%
7.9M 46%
Non-Cardiac
9.8M 60%
9.1M 59%
9.3M 54%
Cardiac
Nuclear Imaging Patient Visits
*Estimated from 1H2007 data
Source: IMV Nuclear Survey, Oct 2007
Cardiac Studies:
Largest Segment of Nuclear Imaging Market,
Growing as Percent of Annual Market
Nuclear Imaging Market: Cardiac
Ultrasound Imaging Market Trend
Ultrasound Procedures (USA): 2003 – 2009
82.2M
2006
90.6M
2007
101.8M
2008
2009
2005
2004
2003
115.1M
74.8M
68.1M
62.8M
Source: Medical Imaging Markets – Volume III Oct. 2006 Kalorama

Primary-Care Physicians
Affiliation with luminary institution
Expert readings by cardiologists on staff at institution
Higher retention of patients
Ancillary revenue
Centers of Influence
New revenues from reading fees improve staff retention
New revenue from intervention via readings
Coordination with primary-care physicians improves relationships,
increases referrals
Digirad
Fuller utilization of mobile imaging services assets, personnel
Aligned with high-profile academic medical institutions
Greater penetration of local base of primary-care physicians
Potential for significant long-term revenue growth
A win-win-win strategy
Centers of Influence Strategy
UCLA
2
Vanderbilt Univ.
3
Penn State
Johns Hopkins
Univ. of
Chicago
Emory
University
1
Methodist
Hosp.
7
4
6
5
= Existing: seven as
of June 17, 2008
Centers of Influence Locations
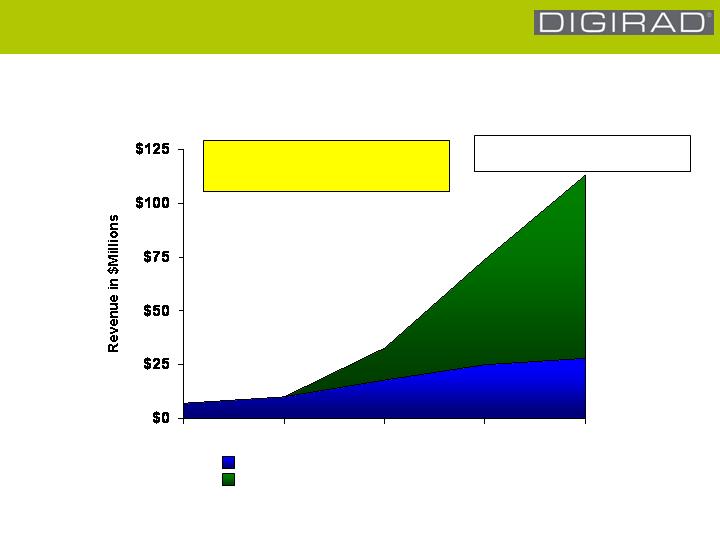
Est. COI Revenue Growth - Cumulative
Hypothetical Example Based on COI Expansion 2008-2011
2008
2009
2010
2011
Potential Cumulative Revenue From Existing 5 COIs
Potential Incremental Revenue From Addition of 15 COIs
At 36 months from signing, a COI adds $3
million to $8 million per year in revenue
based on size/population of region
20 COIs = $110 Million in cumulative
annual revenue by end of 2011

Multiple Imaging Services Strategy
Add new diagnostic procedures
Leverage current mobile-service infrastructure
Broaden demand for Company’s imaging services
Enhance physicians’ practices
New capabilities to diagnose patients in-office
Multiple procedures during single patient visit
Better overall care
New revenue sources for practice
Sustainable
Economics
Mobility of imaging procedures
Patient needs
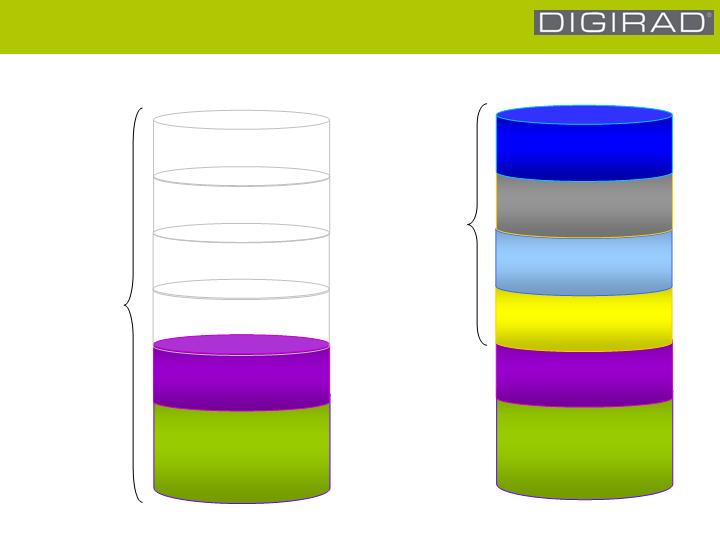
Today
$3,500
Nuclear
$950
Ultrasound
$3,500
Nuclear
$950
Ultrasound
$250
New Service 1
$450
New Service 2
$350
New Service 3
$200
New Service 4
Service
Expansion
Potential
“Tomorrow”
Multiple Imaging Services
Digirad
typically
performs one
modality per
service day
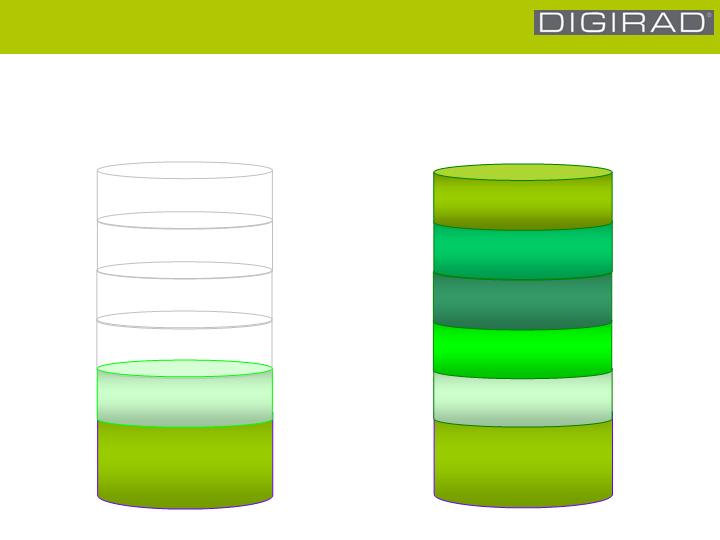
Today
$65K incremental annual revenue,
or 30% increase
$40K
Nuclear
$25K
Ultrasound
$35K
Nuclear
$20K
Ultrasound
$10K
New Service 1
$20K
New Service 2
$15K
New Service 3
$10K
New Service 4
Economics for Physicians
“Tomorrow”
$110K incremental annual revenue,
or 40% increase

Added Value for Patients-Example
Artery Age Screening
Standard, non-invasive ultrasound procedure
Measures CIMT (carotid intima-media thickness): thickness of the first
two layers of the carotid artery located in the neck
To monitor atherosclerosis (underlying cause of heart attack and stroke)
even in individuals with no symptoms of heart disease
Wall-thickening is the earliest anatomical manifestation of
atherosclerosis and heart disease
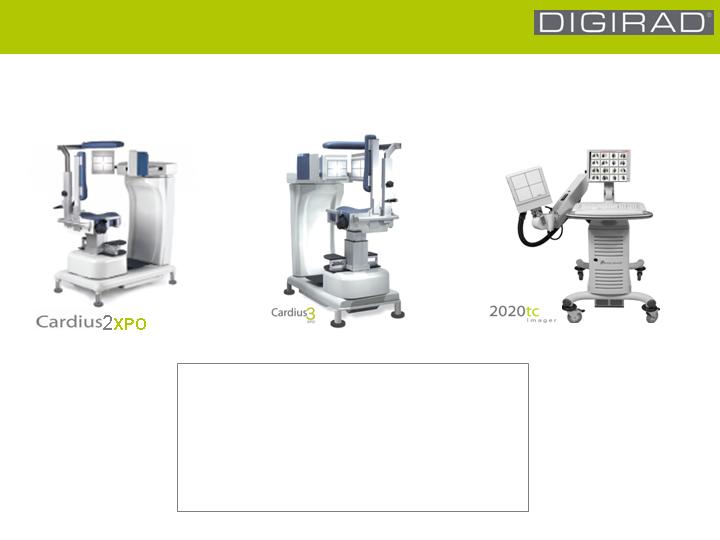
The Digirad Advantage
Solid-State Technology
Compact designs
500 lb. patient-weight capacity
Portable Systems
Scaleable platforms (1-2-3)
Product Line
®
High-Quality, High-Performance Mobile Equipment
®
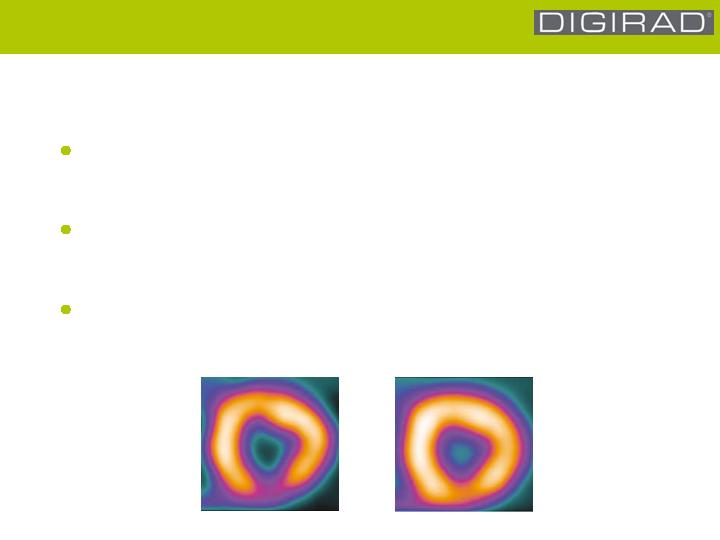
Product Development Roadmap
Innovation, Leadership, Clinical Superiority
nSPEED (1/2 time acquisition): Released
- Faster imaging, higher image quality or reduced radiation dose.
STASYS (automated motion correction): Released 6/08
- Improved image quality and reduced costs (eliminates license fees)
X-ACT (attenuation correction): June 2009
- Improved clinical accuracy & quality
Abnormal
Normal
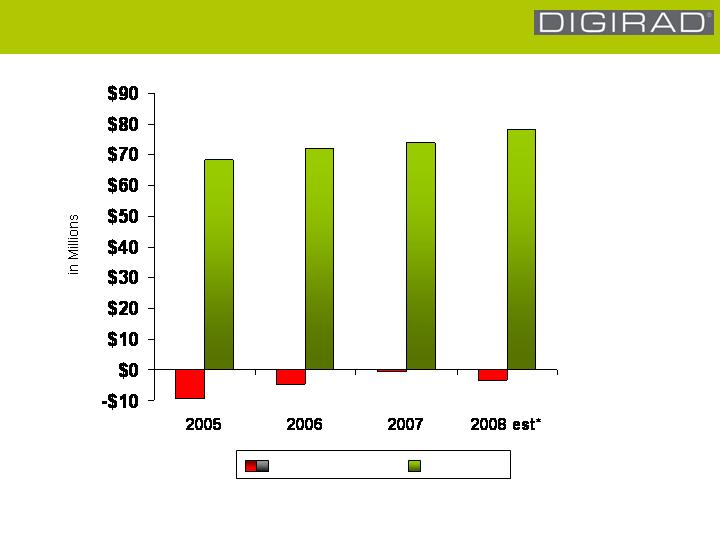
Consolidated Results: Trend, Outlook
*Midpoints of guidance as of April 24, 2008
Note: Net excludes estimated stock-based compensation expense
Revenue Growth in 2008
Net Loss/Income Revenue

Comparative Operating Results
(In millions, except per share) Q1 2008 2007 2006 2005
Revenues $18.3 $73.9 $71.9 $68.2
Gross Profit 4.4 20.5 19.1 15.2
Operating Expenses 6.1 23.4 27.3 26.2
Operating Income (Loss) (1.7) (2.8) (8.2) (11.0)
EBITDA 0.4 4.7 (1.9) (5.2)
Net Income (Loss) $(1.4) $(1.4) $(6.3) $(9.6)
Earnings (Loss) Per Share $(0.07) $(0.07) $(0.34) $(0.52)
Shares Outstanding 18.9 18.8 18.8 18.5
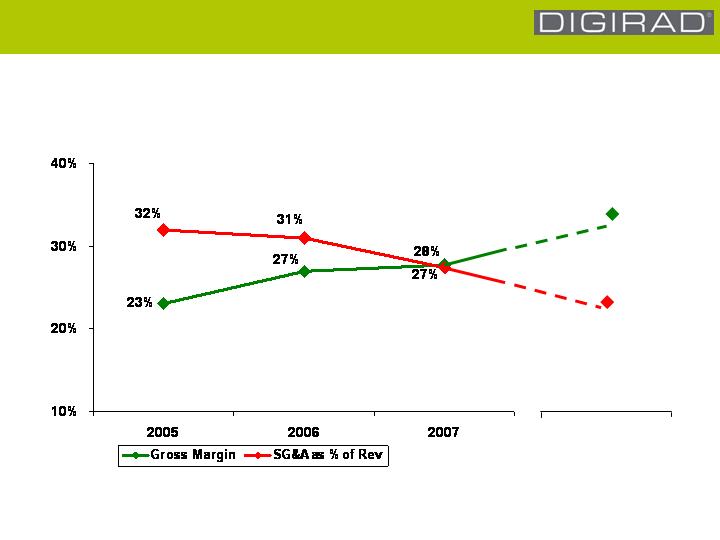
Margins: Trend, Targets
Gross Margin Rising, SG&A Declining as % of Revenue
33%
22%
Future Targets

Balance Sheet
(In millions, except per share data)
Liquid, Strong Ratios, No Long-Term Debt
Mar 31, 2008 Dec 31, 2007
Cash/equivalents and securities $26.4 $31.7
Total current assets 41.6 47.4
Total current liabilities 12.4 13.5
Long-term debt 0.0 0.0
Shareholders’ equity 54.1 55.2
Current ratio 3.4:1 3.5:1
Quick ratio 1.9:1 2.3:1
Working capital $29.2 $33.9
Shareholders’ equity per share $2.86 $2.93

2008 Guidance (April 24, 2008)
2008 Guidance
Revenue
DIS
$ 56M - $ 60M
Product
$ 19M - $ 21M
Total Revenue
$ 75M - $ 81M
Net Loss
($ 2.0 M - $ 4.5M)
Note: Net Loss includes stock-based comp. of $1M

Investment Merits
Demographics driving demand for diagnostic imaging services
Trend to decentralized (non-hospital) facilities
Expecting revenue growth in 2008:
Centers of Influence
New imaging services
Imaging market trend
Continuing control of costs/expenses
Strong balance sheet (March 31, 2008)
$26.4 million cash/securities available-for-sale
No long-term debt
$2.86 shareholders’ equity per share
Attractive valuation
Market-cap to 2008 estimated sales: 0.60 versus 1.20 to 2.30 for peers

Stock Data
Nasdaq symbol DRAD
Three-year trading range $2.05 to $6.30
Close 6/9/2008 $2.36
Average daily trading volume 27,700 shares
Shares outstanding 18.9 million
Float (shares) 15.3 million
Institutional holdings (shares) 10.5 million
Market capitalization $44.6 million
Digirad Corporation
13950 Stowe Drive
Poway, CA 92064
858-726-1600
www.digirad.com