 Digirad Corporation Digirad Corporation Nasdaq: DRAD January 2008 Exhibit 99.1 |
 ® Forward-Looking Statements Certain statements in this presentation that are not a description of historical facts are forward-looking statements as determined by the Private Securities Litigation Reform Act of 1995. Forward-looking statements do not relate strictly to historical or current facts and include words such as "anticipate," "estimate," "expect," "project," "intend," "plan," "believe" and other terms that discuss future operating or financial performance and/or events. Examples of such forward-looking statements include, but are not limited to, statements about the Company’s revenues, expenses, margins, operations, mobile imaging services, centers of influence strategy and benefits, market conditions and trends, demand for imaging services and products, imaging modality trends, strategic growth, acquisition strategies, competitive advantages, utilization, cost control, financial results. These forward-looking statements are based upon current assumptions and expectations that involve risks and uncertainties that could cause actual events and financial performance to differ materially. Risks and uncertainties include but are not limited to, technological change, industry trends, changes in the company’s markets, and competition. More information about risks and uncertainties is available in the Company’s filings with the U.S. Securities & Exchange Commission, including Annual Reports on Form 10-K, Quarterly Reports on Form 10-Q, and Current Reports on Form 8-K. The information discussed in and during this presentation should be used in conjunction with the consolidated financial statements and notes included in those Reports and speak only as of the date hereof. The Company undertakes no obligation to update these forward-looking statements. All such statements are qualified in their entirety by this cautionary statement, and Digirad undertakes no obligation to revise or update this presentation to reflect events or circumstances after the date hereof. |
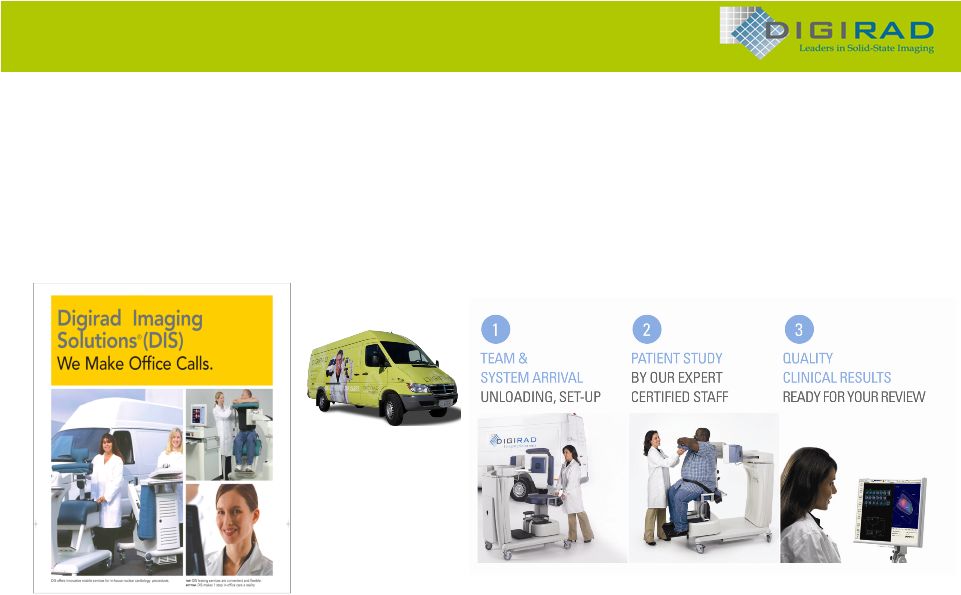 ® Digirad Corporation provides medical diagnostic imaging products and services to physicians’ offices, hospitals and imaging centers. Business Summary Digirad Mobile Imaging Services |
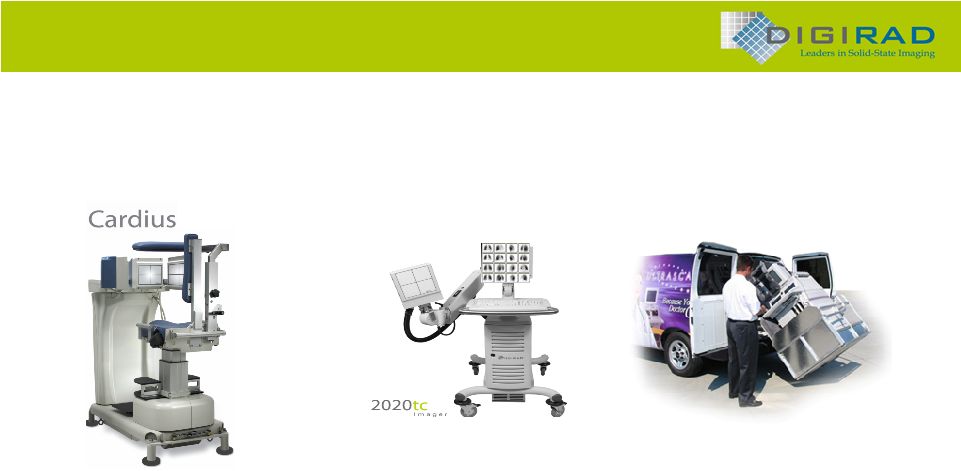 ® Unique solid-state technology Compact designs 500 lb. patient-weight capacity Portable Multi-head (1-2-3) platform XPO Innovation Makes it Happen ® Hospital Operating Room Departmental Bedside Satellite Facilities Cardiology Groups General Practice High-Quality, High-Performance Mobile Equipment ® In-Office Primary Care Internal Medicine Satellite Facilities Cardiology Groups General Practice |
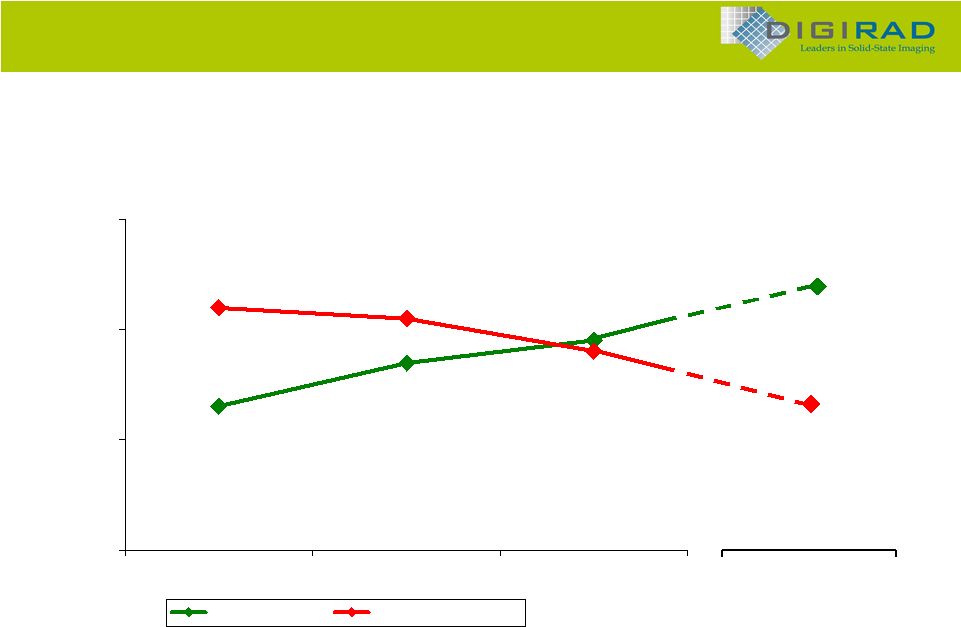
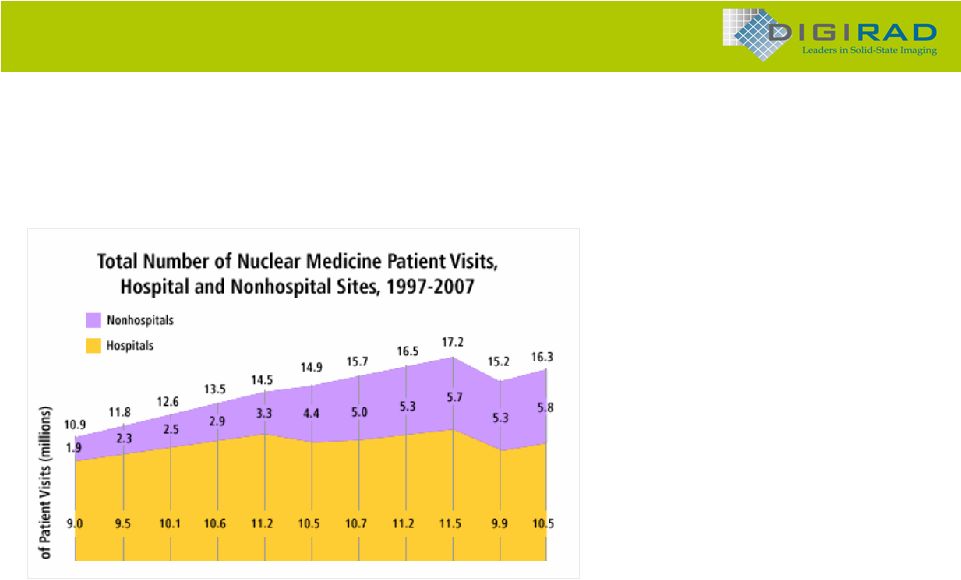 ® Source: IMV Nuclear Survey, Oct 2007 Market decline in 2006: - Greater pre-certification burdens - PET impacting oncology NM Resuming Yearly Uptrend in Nuclear Imaging Patient Visits Continuing Trend To Non-Hospital Providers Market recovery in 2007: - Secular uptrend resuming - Trend away from hospitals - IM/GPs becoming service providers - Higher use of imaging by IM/GPs Nuclear Imaging Market Trend 1997 1998 1999 2000 2001 2002 2003 2004 2005 2006 2007 |
 ® 2007* 2006 2005 16.3M 100% 15.2M 100% 17.2M 100% Total 6.5M 40% 6.1M 41% 7.9M 46% Non-Cardiac 9.8M 60% 9.1M 59% 9.3M 54% Cardiac Nuclear Imaging Patient Visits *Estimated from 1H2007 data Source: IMV Nuclear Survey, Oct 2007 Cardiac Studies: Largest Segment of Nuclear Imaging Market, Growing as Percent of Annual Market Nuclear Imaging Market: Cardiac Segment |
 ® Growth Strategy Core imaging services • Increase utilization rate of existing fleet, personnel • Open mobile imaging services hubs in target regions • Expand client base: add new primary-care physicians Centers of Influence (COI) • Grow revenues from existing Centers of Influence • Add new Centers of Influence Strategic acquisitions • Complement growth platform • Diversify imaging services, modalities • Expand geographic coverage • Add revenues, earnings |
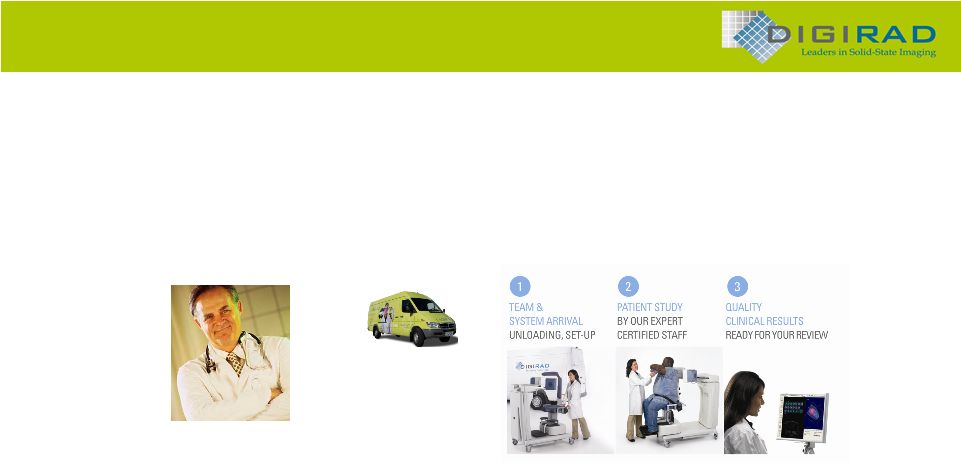
 ® Core Imaging Services – meeting current physician needs Mobile Imaging For Today’s Patient, Physician Needs Diagnostic requirements for aging population Trend to decentralized (non-hospital) services Facilitates outreach programs for academia and cardiology groups Patients prefer own primary-care physicians Flexible, scalable response to patient loads Solves cost issues: fixed equipment, space, upkeep New revenue stream for primary-care practices “We Make Office Calls” |
 ® Economic Benefits for Physicians’ Practices Digirad Imaging Services Trend: Costs rising faster than revenues for traditional practices Solution: Add imaging for 29% to 60% growth of revenues $175K Avg. Annual Revenue $20K–$50K New Annual Revenue $30K–$60K New Annual Revenue Traditional Services + Nuclear Imaging + Ultrasound Imaging + |
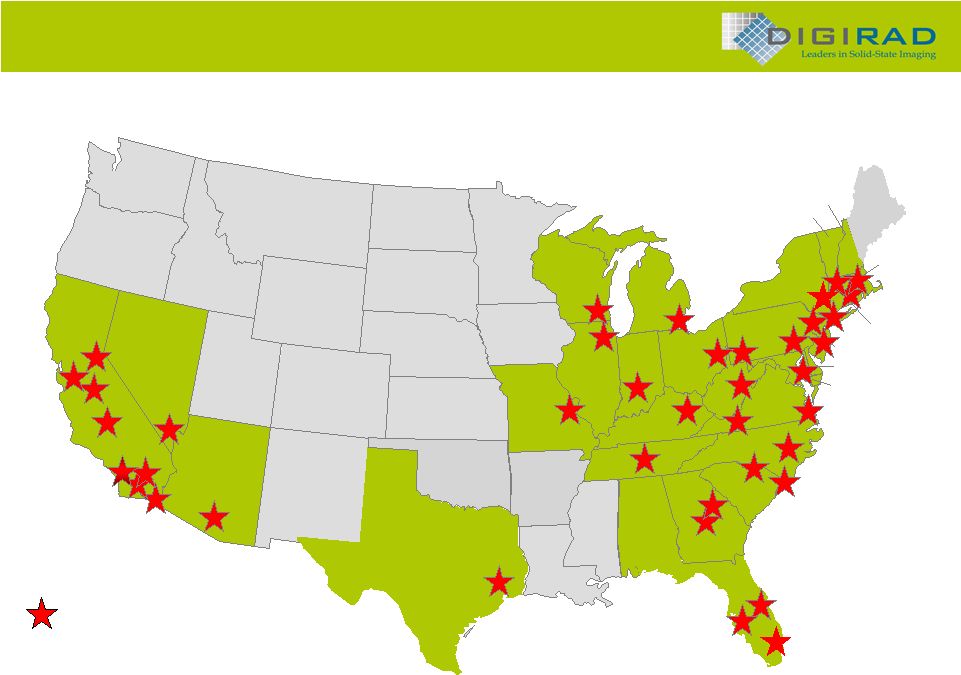 ® Core Imaging Services California Oregon Washington Montana Idaho Nevada Utah Colorado Arizona New Mexico Texas Oklahoma Tennessee Wyoming Kentucky Kansas Nebraska South Dakota North Dakota Minnesota Iowa Missouri Arkansas Ohio Indiana Illinois Wisconsin Michigan Florida Georgia Louisiana S. Carolina N. Carolina Alabama Mississippi Maine Virginia Pennsylvania New York Vermont New Hampshire W. Virginia Delaware Maryland Massachusetts Connecticut Rhode Island New Jersey EXISTING Hubs |
 ® Primary-Care Physicians – Affiliation with luminary institution – Expert readings by cardiologists on staff at institution – Higher retention of patients – Ancillary revenue Centers of Influence – New revenues from reading fees improve staff retention – New revenue from intervention via readings – Coordination with primary-care physicians improves relationships, increases referrals Digirad – Fuller utilization of mobile imaging services assets, personnel – Aligned with high-profile academic medical institutions – Greater penetration of local base of primary-care physicians – Potential for significant long-term revenue growth A win-win-win strategy Centers of Influence Strategy |
 ® = Existing COI (5) 4 UCLA 5 The Methodist Hospital 2 Vanderbilt University. Emory University 1 3 Penn State University Centers of Influence |
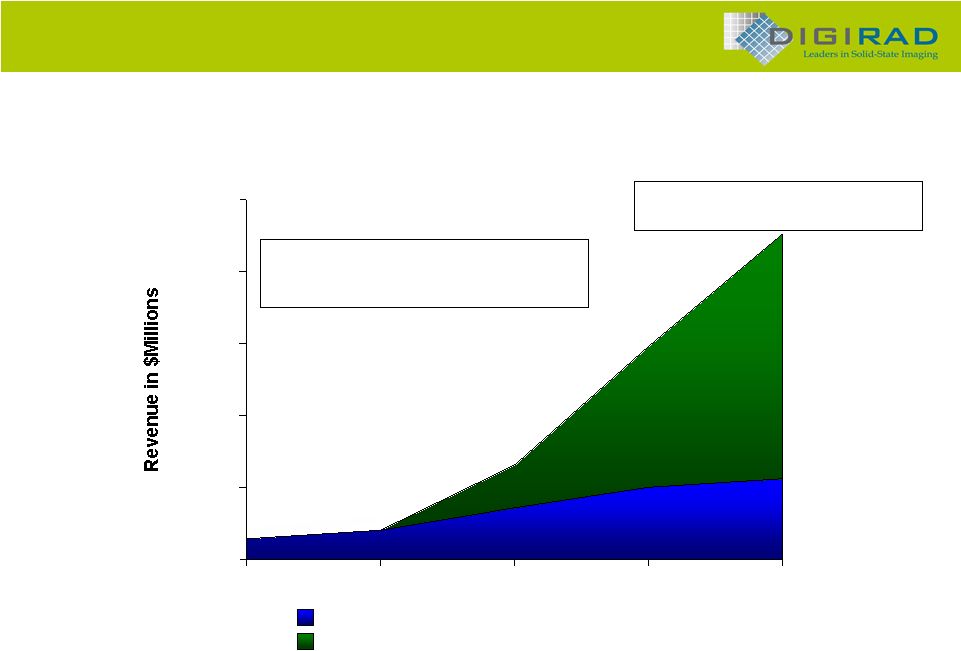 ® Estimated COI Revenue Growth - Cumulative Hypothetical Example Based on COI Expansion 2008-2011 $0 $25 $50 $75 $100 $125 2008 2009 2010 2011 Potential Cumulative Revenue From Existing 5 COIs Potential Incremental Revenue From Addition of 15 COIs At 36 months COI adds $3 million to $8 million per year in revenue based on size/population of region 20 COIs = $110 Million in Cumulative Annual Revenue by End 2011 |
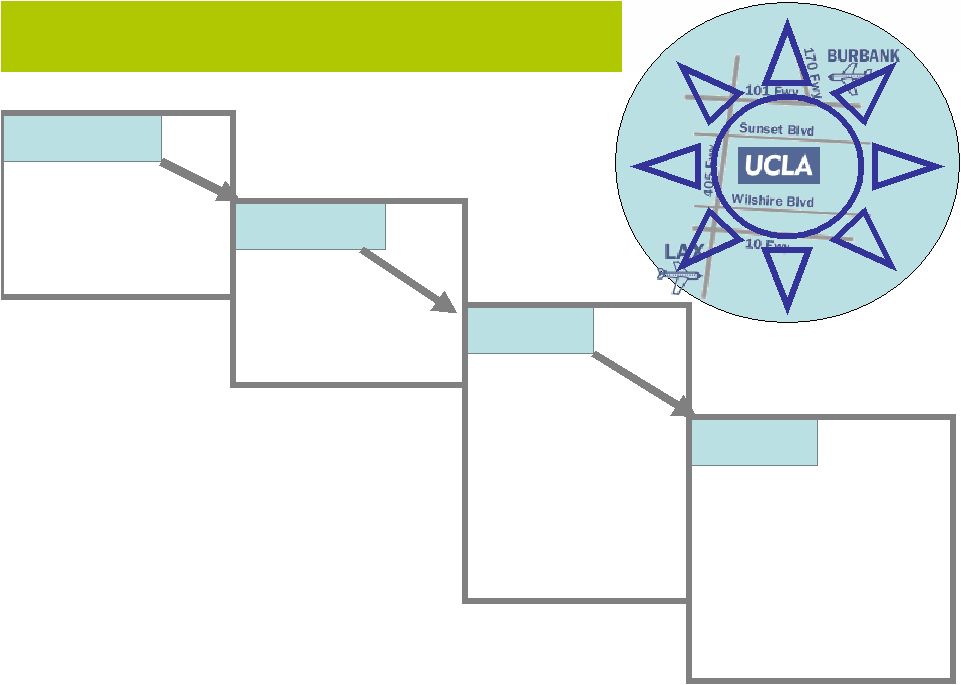 Center of Influence Process COI Partnership Execution Perform Planning Meeting • Finalize Blitz Timeline • Target Market • Top 10 customers (COI) • Additional targeted accounts (DIS) • General Database search within 60 miles • Sign LOU • Finalize PSA • Review billing / collection requirements • Identify Online viewing solution • Finalize Lunch & Learn Strategy Blitz Planning Handoff to Operations • Operations Planning Meeting • Hub Location to target customers • Identify resources and logistics • Equipments • Training • COI Protocols • Implement Online Solution • Initiate routs and service • Confirm timeline • Identify resources • Identify collaterals needed • Finalize databases …. A list – called by corporate …. B List – Residing TM blitz territory …. C List – General list by all TM’s • Inside Sales Strategy and script …. Generate COI Script …. Confirm appointments • Sales conference call • Blitz schedule and training • Execute Blitz |
 ® Strategic Acquisition(s) Complements to growth platform • Mobile imaging services • Centers of Influence Diversify imaging services, modalities • Pre-imaging services • Potential addition of complimentary services to nuclear and ultrasound Expand geographic coverage • Meet demand in existing regional markets • Add regions with unmet/underserved/rising demand for imaging services • Incremental revenues • Incremental net income |
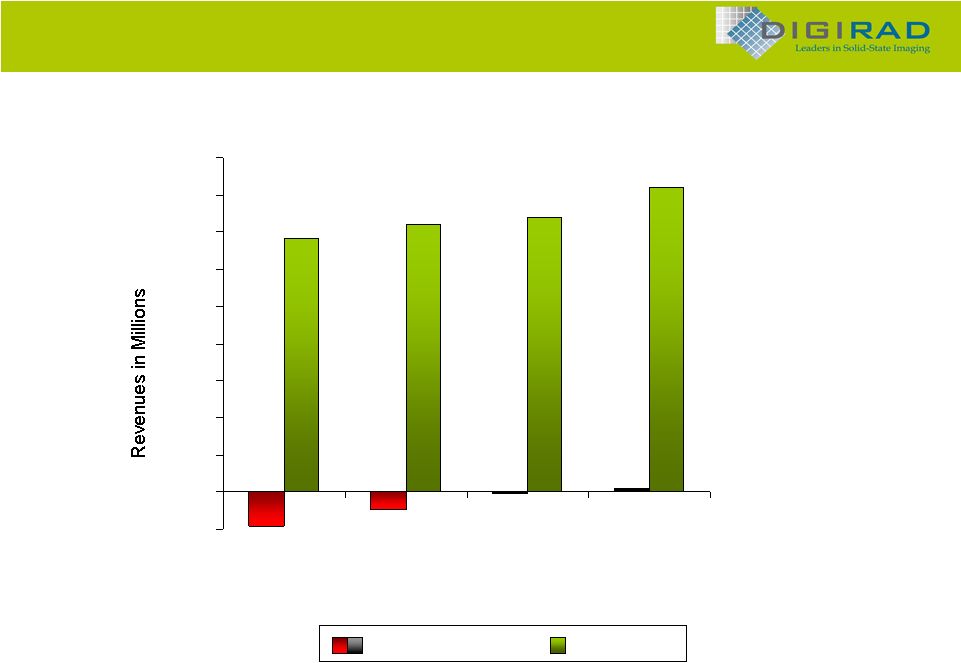 ® -$10 $0 $10 $20 $30 $40 $50 $60 $70 $80 $90 2005 2006 2007est* 2008 est* Consolidated Results: Trend, Outlook *Midpoints of guidance as of January 8, 2008; net excludes estimated stock-based compensation expense. Revenue Growth, Potential for Profitability in 2008 Net Loss/Income Revenue |
 ® Comparative Operating Results (In millions, except per share) 9-Mos 2007 Full-Year 2006 Full-Year 2005 Revenues $55.1 $71.9 $68.2 Gross Profit 16.0 19.1 15.2 Operating Expenses 17.6 27.3 Operating Income (Loss) (1.5) (8.2) (11.0) EBITDA 4.1 (1.9) Net Income (Loss) $(0.3) $(6.3) $(9.6) Earnings (Loss) Per Share $(0.01) $(0.34) $(0.52) Shares Outstanding 18.8 18.8 26.2 (5.2) 18.5 |
 ® Margins: Trend, Targets 29% 23% 27% 28% 32% 31% 10% 20% 30% 40% 2005 2006 2007est* Gross Margin SG&A as % of Rev Gross Margin Rising, SG&A Declining as % of Revenue 33% 22% Future Targets |
 ® Balance Sheet (In millions, except per share data) Liquid, Strong Ratios, No Long-Term Debt Sep 30, 2007 Dec 31, 2006 Cash/equivalents and securities $30.8 $44.3 Total current assets 47.9 59.2 Total current liabilities 13.1 13.4 Long-term debt 0.0 0.1 Shareholders’ equity 56.2 55.4 Current ratio 3.7:1 4.4:1 Quick ratio 2.4:1 3.3:1 Working capital $34.8 $45.8 Shareholders’ equity per share $2.99 $2.95 |
 ® 2008 Guidance (January 8, 2008) 2008 Guidance Revenue DIS $ 59.0M - $ 61.0M Product $ 21.0M - $ 23.0M Total Revenue $ 80.0M - $ 84.0M Net Income/(Loss) $ (1.0M) - $ 0.5M Note: Net income/(loss) includes stock-based comp. expense of $1M |
 ® Investment Merits Growing demand for imaging services, decentralization Expecting revenue growth in 2008: Centers Of Influence, core services Continuing control of costs/expenses Potential net income for 2008 Strong balance sheet (September 30, 2007) – $30+ million cash/equivalents – No long-term debt – $2.99 shareholders’ equity per share Valuation lagging peer averages Market-cap to 2008 estimated sales: 0.8 vs. 1.6 to 1.7 for peers Evaluating acquisition(s) – Complement growth platform – Incremental revenues, net income (not in 2008 guidance) |
 ® Stock Data Nasdaq symbol DRAD Three-year trading range $2.94 to $9.05 Close 12/31/07 $3.64 Average daily trading volume 29,600 shares Shares outstanding 18.8 million Float (shares) 12.3 million Institutional holdings (shares) 7.7 million Market capitalization $68.4 million |
 ® Digirad Corporation 13950 Stowe Drive Poway, CA 92064 858-726-1600 www.digirad.com |