UNITED STATES |
SECURITIES AND EXCHANGE COMMISSION |
Washington, D.C. 20549 |
FORM 10-K |
| |
| [X] ANNUAL REPORT PURSUANT TO SECTION 13 OR 15(d) OF THE SECURITIES EXCHANGE ACT OF 1934 |
| |
| For the fiscal year ended December 31, 2006 |
| |
| [ ] TRANSITION REPORT PURSUANT TO SECTION 13 OR 15(D) OF THE SECURITIES EXCHANGE ACT OF 1934 |
| |
| Commission File Number: 0-22606 |
|
Britton & Koontz Capital Corporation |
| (Exact name of registrant as specified in its charter) |
| |
| | |
| Mississippi | 64-0665423 |
| (State or other jurisdiction of incorporation or organization) | I.R.S. Employer Identification No. |
| | |
| |
| 500 Main Street |
| Natchez, Mississippi 39120 |
| (Address of principal executive offices) (Zip Code) |
| |
| (601) 445-5576 |
| (Registrant’s Telephone Number, Including Area Code) |
| Securities registered pursuant to Section 12(b) of the Exchange Act: |
| Title of each class | Common Stock, $2.50 Par Value |
| Name of each exchange on which registered | The NASDAQ Capital Market |
| | |
| |
| Securities registered pursuant to Section 12(g) of the Exchange Act: |
None |
Indicate by check mark if the registrant is a well-known seasoned issuer, as defined in Rule 405 of the Securities Act. [ ] Yes [X] No
Indicate by check mark if the registrant is not required to file reports pursuant to Section 13 or Section 15(d) of the Exchange Act. [ ] Yes [X] No
Indicate by check mark whether the registrant: (1) has filed all reports required to be filed by Section 13 or 15(d) of the Securities Exchange Act of 1934 during the preceding 12 months (or for such shorter period that the registrant was required to file such reports), and (2) has been subject to such filing requirements for the past 90 days. [X] Yes [ ] No
Indicate by check mark if disclosure of delinquent filers pursuant to Item 405 of Regulation S-K is not contained herein, and will not be contained, to the best of the registrant’s knowledge, in definitive proxy or information statements incorporated by reference in Part III of this Form10-K or any amendment to this Form 10-K. [X]
Indicate by check mark whether the registrant is a large accelerated filer, an accelerated filer, or a non-accelerated filer. See definition of “accelerated filer and large accelerated filer” in Rule 12b-2 of the Exchange Act. (Check One)
Large accelerated filer [ ] Accelerated filer [ ] Non-accelerated filer [X]
Indicate by check mark whether the registrant is a shell company (as defined in Rule 12b-2 of the Exchange Act). [ ] Yes [X] No
The aggregate market value of the registrant’s voting stock held by non-affiliates at February 26, 2007, computed by reference to the price of $19.38 per share, the price at which the registrant’s voting stock was last sold as of June 30, 2006, is $36,181,045.
The registrant had 2,117,966 shares of common stock outstanding as of March 15, 2007.
DOCUMENTS INCORPORATED BY REFERENCE
Portions of the Definitive Proxy Statement of Britton & Koontz Capital Corporation with respect to its 2007 Annual Meeting of Shareholders are incorporated by reference into Part III of this Annual Report on Form 10-K.
| | PART I | |
| BUSINESS | * |
| RISK FACTORS | * |
| UNRESOLVED STAFF COMMENTS | * |
| PROPERTIES | * |
| LEGAL PROCEEDINGS | * |
| SUBMISSION OF MATTERS TO A VOTE OF SECURITY HOLDERS | * |
| | | |
| | PART II | |
| MARKET FOR REGISTRANT’S COMMON EQUITY, RELATED | |
| | STOCKHOLDER MATTERS AND ISSUER PURCHASES OF EQUITY | |
| | SECURITIES | * |
| SELECTED FINANCIAL DATA | * |
| MANAGEMENT’S DISCUSSION AND ANALYSIS OF FINANCIAL CONDITION AND RESULTS OF OPERATIONS | * |
| QUANTITATIVE AND QUALITATIVE DISCLOSURES ABOUT MARKET RISK | * |
| FINANCIAL STATEMENTS AND SUPPLEMENTARY DATA | * |
| CHANGES IN AND DISAGREEMENTS WITH ACCOUNTANTS ON ACCOUNTING AND FINANCIAL DISCLOSURE | * |
| CONTROLS AND PROCEDURES. | * |
| OTHER INFORMATION | * |
| | | |
| | PART III | |
| DIRECTORS, EXECUTIVE OFFICERS AND CORPORATE GOVERNANCE | ** |
| EXECUTIVE COMPENSATION | ** |
| SECURITY OWNERSHIP OF CERTAIN BENEFICIAL OWNERS AND MANAGEMENT AND RELATED STOCKHOLDER MATTERS | ** |
| CERTAIN RELATIONSHIPS AND RELATED TRANSACTIONS, AND DIRECTOR INDEPENDENCE | ** |
| PRINCIPAL ACCOUNTING FEES AND SERVICES | ** |
| | | |
| | PART IV | |
| EXHIBITS, FINANCIAL STATEMENT SCHEDULES | * |
* Included herein.
| ** | Incorporated by reference from Britton & Koontz Capital Corporation’s Definitive Proxy Statement for its 2007 Annual Meeting of Shareholders in accordance with Instruction G(3) of Form 10-K. |
PART I
This Annual Report on Form 10-K includes “forward-looking statements” within the meaning of Section 27A of the Securities Act of 1933, as amended, and Section 21E of the Securities Exchange Act of 1934, as amended. Although Britton & Koontz Capital Corporation (the “Company”) believes that the expectations reflected in such forward-looking statements are reasonable, such forward-looking statements are based on numerous assumptions (some of which may prove to be incorrect) and are subject to risks and uncertainties which could cause the actual results to differ materially from the Company’s expectations. Such statements are based on management’s beliefs as well as assumptions made by and information currently available to management. When used in the Company’s documents or oral presentations, the words “anticipate”, “estimate”, “expect”, “objective”, “projection”, “forecast”, “goal” and similar expressions are intended to identify forward-looking statements. In addition to any assumptions and other factors referred to specifically in connection with such forward-looking statements, factors that could cause the Company’s actual results to differ materially from those contemplated in any forward-looking statements include, among others, increased competition, regulatory factors, economic conditions, changing market conditions, availability or cost of capital, employee workforce factors, costs and other effects of legal and administrative proceedings, and changes in federal, state or local legislative requirements. The Company undertakes no obligation to update or revise any forward-looking statements, whether as a result of changes in actual results or changes in assumptions or on account of other factors affecting such statements.
The information set forth in this Annual Report on Form 10-K is as of March 14, 2007, unless otherwise indicated herein.
General
The Company
Britton & Koontz Capital Corporation was organized as a Mississippi business corporation in July 1982. Later that year, the Company became a one-bank holding company registered under the Bank Holding Company Act of 1956, as amended (the “BHCA”), when it acquired all of the issued and outstanding shares of Britton & Koontz Bank, National Association, a national banking association headquartered in Natchez, Mississippi (the “Bank”). The Bank is a wholly-owned subsidiary of the Company, and stock of the Bank is the Company’s most significant asset. On April 17, 2001, B&K Title Insurance Agency, Inc. was organized as a Mississippi corporation (“B&K Insurance”); in May 2001, the Company acquired all of the outstanding common stock of B&K Insurance, making it the Company’s second wholly-owned subsidiary.
The Company’s major source of income in 2006 was dividends from the Bank in the amount of $2.5 million. The Company expects that dividends from the Bank will continue to be the Company’s major source of income in 2007. As of December 31, 2006, the Company had total assets of approximately $369 million and total consolidated shareholders’ equity of approximately $34 million. Financial information about the Company, including information with respect to revenues from external customers, profit and loss and total assets for 2006, 2005 and 2004, is contained in Item 8, “Financial Statements and Supplementary Data.”
The Company has entered into a Trust Services Agreement with National Independent Trust Company, a national banking association, d/b/a Argent Trust Company, headquartered in Ruston, Louisiana. Effective January 1, 2007, Argent Trust Company assumed all responsibilities associated with the Bank’s trust services, having been duly appointed successor trustee for all Bank trust accounts. Argent Trust Company performs certain fiduciary services for customers transferred from and referred by the Bank to Argent Trust Company. In return, the Bank receives a specified percentage of the fee income generated by Argent Trust Company.
As of December 31, 2006, the Company discontinued issuing title insurance policies through B&K Insurance. See “The Insurance Agency” below for more information.
The Bank
The Bank provides commercial and consumer banking and trust services to customers in Adams and Warren Counties, Mississippi, and East Baton Rouge Parish, Louisiana, and the adjoining counties and parishes in Mississippi and Louisiana. A loan production office was opened in Madison, Mississippi, on February 1, 2003, which was converted into a full service branch in 2004. Management decided to leave the Madison market in November, 2004 in order to allocate its resources to its remaining markets. In 2004, the Bank completed the construction of a new branch in Vicksburg, Mississippi, and closed three branches in Baton Rouge, Louisiana, moving into a larger, more visible facility on Bluebonnet Boulevard in Baton Rouge. The Bank also sold its Shields Lane branch in Natchez, Mississippi, in 2004, while completing the renovation of its existing Tracetown branch in Natchez, which houses its mortgage banking operations. As a result of these actions, the Bank now conducts its full-service banking business from its main office and two branch offices in Natchez, Mississippi, two branches in Vicksburg, Mississippi, and one branch office in Baton Rouge, Louisiana. The geographical area serviced by the Bank is economically diverse and includes public and private sector industries, including government service, manufacturing, tourism, agriculture and oil and gas exploration. The Bank is not dependent on any one customer or group of customers in any of its activities, and it has no foreign operations.
The products and services offered by the Bank include personal and commercial checking accounts, money market deposit accounts, savings accounts, automated clearinghouse services, safe deposit box facilities, and brokerage services. The Bank also offers access to automated teller machines and cash management services including money transfer, direct deposit payroll and sweep accounts. The Bank is a full-service residential and commercial mortgage lender and engages in other commercial and consumer lending activities, including, among other things, the issuance of VISA credit cards and letters of credit.
In 1995, the Bank became an Internet service provider (ISP) for the Natchez area and eventually extended its service to the Vicksburg, Mississippi market. In 1996, the Bank began offering Internet-based online banking using SumxNet, a software product developed by Sumx Inc. (“Sumx”), See “Investment in Sumx” below. In the second quarter of 2004, the Bank completed the sale of its ISP to Canufly.net, a company providing Internet services in Mississippi and Louisiana.
Income from the Bank’s lending activities, including loan interest and fees, represent the largest component of the Bank’s total operating revenues. This source accounted for 70%, 66% and 62% of the Bank’s total operating revenue during 2006, 2005 and 2004, respectively, and the Company expects that income from lending activities will continue to be the leading source of income related to the Bank’s activities. In addition to business and consumer lending, the bank invests a portion of its total assets in the securities market in order to earn a higher return compared to overnight positions. Investment security purchases are monitored closely and managed on a monthly basis by an asset liability committee comprised of four outside directors along with the bank’s Chief Executive Officer and Chief Financial Officer. Investment income represents the second largest source of revenue for the Bank. For the 2006, 2005 and 2004 fiscal years, revenue in this segment amounted to 20%, 24% and 26% of the Bank’s total operating revenue, respectively.
The Insurance Agency
B&K Insurance has entered into an agreement, as agent, to issue policies of title insurance upon properties in all counties of the State of Mississippi in the name of Mississippi Guaranty Title Insurance Company, a Mississippi corporation. B&K Insurance is not a separately-reportable segment for financial reporting purposes. B&K Insurance discontinued its operations as of December 31, 2006, due to limited demand for business and continuing fixed costs associated with maintaining B&K Insurance services. B&K Insurance will not be dissolved but will continue to be included as a 100% owned subsidiary of the Company. The Company does not expect any material adverse impact on earnings in 2007 on account of the discontinuation of B&K Insurance’s operations.
Investment in Sumx
In December 1998, the Company invested $1 million in Sumx, a Mississippi corporation established to develop and market internet-based electronic banking solutions for the financial industry. On September 15, 2001, the Company acquired 240,000 shares of Series B Preferred Stock of Sumx for $250,000. In exchange for such investments, the Company received approximately 37% preferred interest in the voting stock of Sumx. During the second quarter of 2002, the Company wrote off its $1,250,000 investment in Sumx, as well as approximately $711,000 of advances to Sumx, due to the uncertainty regarding Sumx’s future prospects and valuation.
On December 31, 2004, the Company sold its entire preferred interest in Sumx back to Sumx for $20,000. As further consideration, the Company received a non-exclusive license to use Sumx’s Internet banking software at no charge. The license has an initial term of five years, with automatic one year renewal terms thereafter unless a party gives the other party notice of non-renewal at least six months prior to the expiration of the then-current term. During 2006, the Company decided to discontinue using this software and began using the internet banking software provided by Harland Financial, its core account processing company. Finally, the Company agreed to cancel and forgive all indebtedness, obligations and encumbrances of any kind owed by Sumx to the Company.
Competition
There is significant competition among banks and bank holding companies in the Bank’s market areas and throughout Mississippi and Louisiana. The Bank competes with both national and state banks, savings and loan associations and credit unions for loans and deposits. The Bank also competes with large national banks from the principal cities in Louisiana and Mississippi for certain commercial loans. All of these numerous institutions, including the Bank, compete in the delivery of products and services on the basis of availability, quality and pricing. Most institutions track total deposits as an appropriate measure of penetration in each market. The Bank's market share, in relation to total deposits, is 37% and 4% for Adams and Warren Counties in Mississippi, respectively and .53% in East Baton Rouge Parish in Louisiana.
The deregulation of depository institutions as well as the increased ability of non-banking financial institutions, such as finance companies, investment companies, insurance companies, brokerage companies and several governmental agencies, to provide services previously reserved to commercial banks has further intensified competition. Accordingly, the Bank now competes with these non-banking financial institutions, all of which are engaged in marketing various types of loans, commercial paper, short-term obligations, investments and other services. Because non-banking financial institutions are not subject to the same regulatory restrictions as banks and bank holding companies, in many instances they may operate with greater flexibility. The continued deregulation of the financial services industry may have a detrimental effect on the Bank’s long-term growth and profitability.
In addition to the deregulation of the financial services industry, the increasing liberalization of the laws and regulations affecting the conduct of interstate banking activities makes it possible that competition in the Bank’s geographical market area will increase. If large, regional bank holding companies acquire branches in the Bank’s market area, they may offer a wider range of services than are currently offered by the Bank. Some of these regional competitors may take full advantage of the powers of “financial holding companies,” as defined in the Gramm-Leach-Bliley Financial Services Modernization Act of 1999, which allows such competitors to offer products and services not offered by the Bank. In addition, these competitors are likely to be better capitalized than the Bank and the Company.
Employees
As of December 31, 2006, the Company had three full-time employees, who are also employees of the Bank and compensated by the Bank. The Bank’s employees decreased from 102 full-time and 10 part-time employees at December 31, 2005, to 97 full-time and 11 part-time at December 31, 2006. The employees are not represented by a collective bargaining agreement. The Company believes that its relationship with its employees is good.
Supervision and Regulation
General
The banking industry is extensively regulated under federal and state law. As a bank holding company, the Company is subject to regulation under the BHCA and to supervision by the Board of Governors of the Federal Reserve System (the “Federal Reserve”). Pursuant to the BHCA, the Company may not directly or indirectly acquire the ownership or control of more than 5% of any class of voting shares or substantially all of the assets of any other company, including a bank, without the prior approval of the Federal Reserve. The BHCA further limits the activities of both the Company and the Bank to the business of banking and activities closely related or incidental to banking.
As a national bank, the Bank is subject to supervision and regular examination by the Office of the Comptroller of the Currency (the “Comptroller”). The examinations are undertaken to ensure the protection of the Bank Insurance Fund (“BIF”). Pursuant to the terms of the Federal Deposit Insurance Act (the “FDIA”), the deposits of the Bank are insured through the BIF and the Savings Association Insurance Fund of the Federal Deposit Insurance Corporation (the “FDIC”). Accordingly, the Bank is subject to regulation by the FDIC and is also subject to the Federal Reserve’s requirements to maintain reserves against deposits, restrictions on the types and amounts of loans that may be granted and the interest that may be charged thereon, and limitations on the types of investments that may be made and the types of services that may be offered.
In 1991, Congress enacted the Federal Deposit Insurance Corporation Improvement Act (“FDICIA”), which, among other things, substantially revised the depository institution regulatory and funding provisions of the FDIA. FDICIA also expanded the regulatory and enforcement powers of bank regulatory agencies. Most significantly, FDICIA mandates annual examinations of banks by their primary regulators and requires the federal banking agencies to take prompt “corrective action” whenever financial institutions do not meet minimum capital requirements. FDICIA establishes five capital tiers: “well capitalized,” “adequately capitalized,” “undercapitalized,” “significantly undercapitalized” and “critically undercapitalized.” A depository institution’s capitalization status will depend on how well its capital levels compare to various relevant capital measures and certain other factors, as established by regulation. As of December 31, 2006, the Bank maintained a capital level which qualified it as being “well capitalized” under such regulations.
FDICIA also prohibits a depository institution from making any capital distribution (including payment of a dividend) or paying any management fee to its holding company if the depository institution would thereafter be “undercapitalized.”
The banking industry is affected by the policies of the Federal Reserve. An important function of the Federal Reserve is to regulate the national supply of bank credit to moderate recessions and to curb inflation. Among the instruments of monetary policy used by the Federal Reserve to implement its objectives are: open-market operations in U.S. Government securities, changes in the discount rate on bank borrowings and changes in reserve requirements on bank deposits. Changes in any of these policies can affect how the Bank operates and generates revenues.
Interstate Banking and Branching Legislation
Federal Law. In 1994, Congress passed the Riegle-Neal Interstate Banking and Branching Efficiency Act (“Riegle-Neal”), which affected the interstate banking and branching abilities of bank holding companies and banks. Riegle-Neal authorizes a national bank domiciled in one state to establish branches in any other state as long as neither state has opted out of interstate branching between the date of enactment of Riegle-Neal and May 31, 1997. Riegle-Neal, however, does allow states to preserve certain restrictions on the entry of out-of-state banks, such as the fashion in which entry can be made, an age requirement for a bank being merged or acquired, and a deposit cap. Under Riegle-Neal, once a bank has established a branch in another state, it may exercise the same rights in that state as national and state banks enjoy in that state, including the ability to branch intra-state.
Riegle-Neal also permits states to allow banks to enter the state by establishing a de novo branch in that state. In order to allow de novo entry into a particular state, that state’s banking laws must expressly provide for de novo branching. Once a bank has established a branch in a host state through de novo branching, it may exercise the same rights in that state as national and state banks enjoy, including the ability to branch intra-state. If a state opts out of interstate branching, no bank domiciled in that state may establish branches in other states, and no bank domiciled in another state may establish branches in that state.
Mississippi Law. On March 29, 1996, the Governor of Mississippi signed into law a bill in which Mississippi elected to opt in to interstate branching, effective May 1, 1997. As enacted, the bill (1) allows all Mississippi banks to establish branches in any other state pursuant to the entry rules in the potential host state, and (2) allows out-of-state banks to establish branches in Mississippi pursuant to Mississippi’s entry rules. The bill does not authorize de novo branching into Mississippi. An out-of-state bank can establish branches in Mississippi only by (1) merging with a Mississippi-domiciled bank, (2) buying all of the assets of a Mississippi-domiciled bank, or (3) buying all of the assets in Mississippi of an out-of-state bank which has branches in Mississippi. All interstate branching transactions require appropriate regulatory approval.
On December 1, 2000, the Bank acquired its first interstate branch offices in Baton Rouge, Louisiana. Under applicable law, the Bank, with the approval of the Comptroller, can establish additional de novo branch offices within the States of Mississippi and Louisiana. The Company from time to time evaluates merger and acquisition opportunities, as well as opportunities to establish additional branch offices, and it anticipates that it will continue to evaluate such opportunities.
Financial Modernization
The Gramm-Leach-Bliley Financial Services Modernization Act of 1999 (the “GLB Act”) was enacted into law on November 12, 1999. The GLB Act potentially affects every facet of a depository institution’s operations. The GLB Act does three fundamental things affecting the banking industry: (a) repeals key provisions of the Glass-Steagall Act to permit commercial banks to affiliate with securities firms, insurance companies and other financial service providers; (b) establishes a statutory framework pursuant to which full affiliations can occur between these entities; and (c) provides financial services organizations with flexibility in structuring these new financial affiliations through a new entity called a “financial holding company” or through a financial subsidiary.
As a result of the GLB Act, banks will be able to offer customers a wide range of financial products and services without the restraints of previous legislation. In addition, bank holding companies and other financial services providers will be able to commence new activities or new affiliations much more readily. To take advantage of the new provisions of the GLB Act, a bank holding company must elect to become a financial holding company. The Company has elected to become a financial holding company.
Anti-Money Laundering
On October 26, 2001, the President signed the USA PATRIOT Act of 2001 into law. This act contains the International Money Laundering Abatement and Financial Anti-Terrorism Act of 2001 (the “IMLAFA”). The IMLAFA substantially broadens existing anti-money laundering legislation and the extraterritorial jurisdiction of the United States, imposes new compliance and due diligence obligations, creates new crimes and penalties, compels the production of documents located both inside and outside the United States, including those of foreign institutions that have a correspondent relationship in the United States, and clarifies the safe harbor from civil liability to customers. The U.S. Treasury Department has issued a number of regulations implementing the USA PATRIOT Act that apply certain of its requirements to financial institutions such as the Bank. The regulations impose new obligations on financial institutions to maintain appropriate policies, procedures and controls to detect, prevent and report money laundering and terrorist financing. The IMLAFA requires all “financial institutions,” as defined, to establish anti-money laundering compliance and due diligence programs no later than April 2002. Such programs must include, among other things, adequate policies, the designation of a compliance officer, employee training programs, and an independent audit function to review and test the program. The Company believes that it has complied with the IMLAFA requirements as currently in effect.
Further Changes in Regulatory Requirements
The United States Congress and the Mississippi legislature have periodically considered and adopted legislation that has adversely affected the profitability of the banking industry. See “Competition” above. Future legislation could further modify or eliminate geographic and other business restrictions on banks and bank holding companies and current prohibitions affecting other financial institutions, including mutual funds, securities brokerage firms, insurance companies, banks from other states and investment banking firms. The effect of any such legislation on the business of the Company or the Bank cannot be accurately predicted. The Company also cannot predict what legislation might be enacted or what other implementing regulations might be adopted, and if enacted or adopted, the effect thereof.
Restrictions on Dividends
The Company is a legal entity separate and distinct from the Bank, and substantially all of the Company’s revenues result from amounts paid by the Bank, as dividends, to the Company. The payment of dividends by the Bank is, of course, dependent upon its earnings and financial condition. The Bank, however, as a national bank, is also subject to legal limitations on the amount of its earnings that it may pay as dividends. Under federal law, the directors of a national bank, after making proper deduction for all expenses and other deductions required by the Comptroller, may credit net profits to the Bank’s undivided profits account and may declare a dividend from that account of so much of the net profits as they judge expedient. The Comptroller and the Federal Reserve have each indicated that banking organizations should generally pay dividends only out of current operating earnings.
Further, in connection with the Company’s acquisition of Natchez First Federal in 1993, the Bank assumed a liquidation account of approximately $2.8 million which has the effect of prohibiting the payment of dividends if the Bank’s net worth would thereby be reduced below $2.8 million.
Corporate Governance
The Sarbanes-Oxley Act of 2002 (the “Sarbanes Act”) requires publicly traded companies to adhere to several directives designed to prevent corporate misconduct. Additional duties have been placed on officers, directors, auditors and attorneys of public companies. The Sarbanes Act requires certifications regarding financial statement accuracy and internal control adequacy by the chief executive officer and chief financial officer of the Company in periodic and annual reports filed with the Securities and Exchange Commission (the “SEC”). The Sarbanes Act also accelerates insider reporting obligations under Section 16 of the Securities Exchange Act of 1934, as amended, restricts certain executive officer and director transactions, imposes new obligations on corporate audit committees and provides for enhanced review by the SEC. The SEC has delayed the compliance date for non-accelerated filers to include a management report on internal control of financial reporting (and make a related certification) until the filer's first fiscal year ending after December 15, 2007.
In addition to the other information contained in or incorporated by reference into this Annual Report on Form 10-K and the exhibits hereto, the following risk factors should be considered carefully in evaluating our business. The risks disclosed below, either alone or in combination, could materially adversely affect the business, financial condition or results of operations of the Company. Additional risks not presently known to us, or that we currently deem immaterial, may also adversely affect our business, financial condition or results of operations.
Risks Related To Our Business and Industry
We are subject to interest rate risk.
Our earnings and cash flows are largely dependent upon the net interest income of the Bank. Net interest income is the difference between interest earned on assets, such as loans and securities, and the cost of interest-bearing liabilities, such as deposits and borrowed funds. Interest rates are highly sensitive to many factors that are beyond our control, including general economic conditions and policies of various governmental and regulatory agencies and, in particular, the FRB. Changes in monetary policy, including changes in interest rates, could influence not only the interest we receive on loans and securities and the amount of interest we pay on deposits and borrowings, but such changes could also affect (i) our ability to originate loans and obtain deposits, which could reduce the amount of fee income generated, (ii) the fair value of our financial assets and liabilities, and (iii) the average duration of our mortgage-backed securities portfolio. If the interest rates paid on deposits and other borrowings increase at a faster rate than the interest rates received on loans and other investments, our net interest income could be adversely affected, which in turn could negatively affect our earnings. Earnings could also be adversely affected if the interest rates received on loans and other investments fall more quickly than the interest rates paid on deposits and other borrowings.
Although management believes it has implemented effective asset and liability management strategies to reduce the potential effects of changes in interest rates on the results of operations of the Company, any substantial, unexpected, prolonged change in market interest rates could have a material adverse effect on our financial condition and results of operations. Volatility in interest rates may also result in disintermediation, which is the flow of funds away from financial institutions into direct investments, such as U.S. Government and Agency securities and other investment vehicles, including mutual funds, which generally pay higher rates of return than financial institutions because of the absence of federal insurance premiums and reserve requirements. Disintermediation could also result in material adverse effects on our financial condition and results of operations.
A discussion of the policies and procedures used to identify, assess and manage certain interest rate risk is set forth in Item 7A, “Qualitative and Quantitative Disclosures about Market Risk.”
We are subject to lending risk.
There are inherent risks associated with our lending activities. These risks include, among other things, the impact of changes in interest rates and changes in the economic conditions in the markets where we operate as well as those across the United States. Increases in interest rates and/or weakening economic conditions could adversely impact the ability of borrowers to repay outstanding loans or the value of the collateral securing these loans.
As of December 31, 2006, approximately 61% of the bank’s loan portfolio consisted of commercial, construction and commercial real estate loans compared to 55% at December 31, 2005. These types of loans are generally viewed as having more risk of default than residential real estate loans or consumer loans due primarily to the large amounts loaned to individual borrowers. Because the loan portfolio contains a significant number of commercial, construction and commercial real estate loans with relatively large balances, the deterioration of one or a few of these loans could cause a significant increase in non-performing loans. An increase in non-performing loans could result in a net loss of earnings from these loans, an increase in the provision for possible loan losses and an increase in loan charge-offs, all of which could have a material adverse effect on our financial condition and results of operations.
The allowance for possible loan losses may be insufficient.
Although we try to maintain diversification within our loan portfolio in order to minimize the effect of economic conditions within a particular industry, management also maintains an allowance for loan losses, which is a reserve established through a provision for loan losses charged to expense, to absorb probable credit losses inherent in the entire loan portfolio. The appropriate level of the allowance is based on management’s quarterly analysis of the loan portfolio and represents an amount that management deems adequate to provide for inherent losses, including collective impairment. Among other considerations in establishing the allowance for loan losses, management considers economic conditions reflected within industry segments, the unemployment rate in our markets, loan segmentation, and historical losses that are inherent in the loan portfolio. The determination of the appropriate level of the allowance for loan losses inherently involves a high degree of subjectivity and requires management to make significant estimates of current credit risks and future trends, all of which may undergo material changes. Changes in economic conditions affecting borrowers, new information regarding existing loans, identification of additional problem loans and other factors, both within and outside of our control, may require an increase in the allowance for loan losses.
In addition, bank regulatory agencies periodically review the allowance for loan losses and may require an increase in the provision for loan losses or the recognition of further loan charge-offs, based on judgments different than those of management. In addition, if charge-offs in future periods exceed the allowance for loan losses we will need additional provisions to increase the allowance for loan losses. Any increases in the allowance for loan losses will result in a decrease in net income and, possibly, capital, and may have a material adverse effect on our financial condition and results of operations. A discussion of the policies and procedures related to management’s process for determining the appropriate level of the allowance for loan losses is set forth in Item 7, “Management’s Discussion and Analysis of Financial Condition and Results of Operations.”
Bank holding companies depend on the accuracy and completeness of information about customers and counterparties.
In deciding whether to extend credit or enter into other transactions, we often rely on information furnished by or on behalf of customers and counterparties, including financial statements, credit reports and other financial information. We may also rely on representations of those customers, counterparties or other third parties, such as independent auditors, as to the accuracy and completeness of that information. Reliance on inaccurate or misleading financial statements, credit reports or other financial information could have a material adverse impact on our business and, in turn, our financial condition and results of operations.
We are subject to environmental liability risk associated with lending activities.
A significant portion of the loan portfolio is secured by real property. During the ordinary course of business, we may foreclose on and take title to properties securing certain loans. In doing so, there is a risk that hazardous or toxic substances could be found on these properties. If hazardous or toxic substances are found, we may be liable for remediation costs, as well as for personal injury and property damage. Environmental laws may require us to incur substantial expenses and may materially reduce the affected property’s value or limit the ability of the Company to use or sell the affected property. In addition, future laws or more stringent interpretations or enforcement policies with respect to existing laws may increase our exposure to environmental liability. Although management has policies and procedures to perform an environmental review during the loan application process and also before initiating any foreclosure action on real property, these reviews may not be sufficient to detect all potential environmental hazards. The remediation costs and any other financial liabilities associated with an environmental hazard could have a material adverse effect on our financial condition and results of operations.
The profitability of the Company depends significantly on economic conditions in the States of Mississippi and Louisiana.
Our success depends primarily on the general economic conditions of the State of Mississippi and the State of Louisiana and the specific local markets in which we operate.
Unlike larger national or other regional banks that are more geographically diversified, we provide banking and financial services to customers primarily in Natchez and Vicksburg, Mississippi, and Baton Rouge, Louisiana. The local economic conditions in these areas have a significant impact on the demand for our products and services as well as the ability of our customers to repay loans, the value of the collateral securing loans and the stability of our deposit funding sources.
The earnings of bank holding companies are significantly affected by general business and economic conditions.
In addition to the risks associated with the general economic conditions in the markets in which we operate, our operations and profitability are also impacted by general business and economic conditions in the United States and abroad. These conditions include short-term and long-term interest rates, inflation, money supply, political issues, legislative and regulatory changes, fluctuations in both debt and equity capital markets, broad trends in industry and finance, and the strength of the U.S. economy and the local economies in which we operate, all of which are beyond our control. Deterioration in economic conditions could result in an increase in loan delinquencies and non-performing assets, decreases in loan collateral values and a decrease in demand for our products and services, among other things, any of which could have a material adverse impact on our financial condition and results of operations.
We operate in a highly competitive industry and market area.
We face substantial competition in all areas of our operations from a variety of different competitors, many of which are larger and have greater financial resources. Such competitors primarily include national, regional and community banks within the various markets in which we operate. We also face competition from many other types of financial institutions, including savings and loan associations, credit unions, finance companies, brokerage firms, insurance companies, factoring companies and other financial intermediaries. The information under the heading “Competition” in Item 1, “Business,” provides more information regarding the competitive conditions in our markets.
Our industry could become even more competitive as a result of legislative, regulatory and technological changes and continued consolidation. Banks, securities firms and insurance companies can merge under the umbrella of a financial holding company, which can offer virtually any type of financial service, including banking, securities underwriting, insurance (both agency and underwriting) and merchant banking. Also, technology has lowered barriers to entry and made it possible for non-banks to offer products and services traditionally provided by banks, such as automatic transfer and automatic payment systems. Many of our competitors have fewer regulatory constraints and may have lower cost structures. Additionally, many of our competitors have substantially greater resources than us, including higher total assets and capitalization, greater access to capital markets and a broader offering of financial services.
Our ability to compete successfully depends on a number of factors, including, among other things:
| · | The ability to develop, maintain and build upon long-term customer relationships based on top quality service, high ethical standards and safe, sound assets. |
| · | The ability to expand the Company’s market position. |
| · | The scope, relevance and pricing of products and services offered to meet customer needs and demands. |
| · | The rate at which we introduce new products and services relative to our competitors. |
| · | Customer satisfaction with our level of service. |
| · | Industry and general economic trends. |
Failure to perform in any of these areas could significantly weaken our competitive position, which could adversely affect our growth and profitability, which, in turn, could have a material adverse effect on our financial condition and results of operations.
We are subject to extensive government regulation and supervision.
The Company and the Bank are subject to extensive federal and state regulation and supervision. Banking regulations are primarily intended to protect depositors’ funds, federal deposit insurance funds and the banking system as a whole, not the economic or other interests of shareholders. These regulations affect our lending practices, capital structure, investment practices, dividend policy and growth, among other things. Changes to statutes, regulations or regulatory policies, including changes in interpretation or implementation of the foregoing, could affect the Company and/or the Bank in substantial and unpredictable ways. Such changes could subject us to additional costs, limit the types of financial services and products we may offer and/or increase the ability of non-banks to offer competing financial services and products, among other things.
Under regulatory capital adequacy guidelines and other regulatory requirements, the Company and the Bank must meet guidelines that include quantitative measures of assets, liabilities and certain off-balance sheet items, subject to qualitative judgments by regulators about components, risk weightings and other factors. If we fail to meet these minimum capital guidelines and other regulatory requirements, our financial condition would be materially and adversely affected. Our failure to maintain the status of “well capitalized” under our regulatory framework could affect the confidence of our customers in us, thus compromising our competitive position. In addition, failure to maintain the status of “well capitalized” under our regulatory framework or “well managed” under regulatory examination procedures could compromise our status as a bank holding company and related eligibility for a streamlined review process for acquisition proposals.
We are also subject to laws, regulations and standards relating to corporate governance and public disclosure, including the Sarbanes Act and new SEC regulations. These laws, regulations and standards are subject to varying interpretations in many cases, and as a result, their application in practice may evolve over time as new guidance is provided by regulatory and governing bodies, which could result in continuing uncertainty regarding compliance matters and higher costs necessitated by ongoing revisions to disclosure and governance practices. We are committed to maintaining high standards of corporate governance and public disclosure. As a result, our efforts to comply with evolving laws, regulations and standards have resulted in, and are likely to continue to result in, increased expenses and a diversion of management time and attention.
Failure to comply with laws, regulations or policies could also result in sanctions by regulatory agencies and/or civil money penalties, which could have a material adverse effect on our business, financial condition and results of operations. While we have policies and procedures designed to prevent any such violations, there can be no assurance that such violations will not occur. The information under the heading “Supervision and Regulation” in Item 1, “Business,” and Note N, “Regulatory Matters” to the Consolidated Financial Statements of the Company in Item 8, “Financial Statements and Supplementary Data,” provides more information regarding the regulatory environment in which we and the Bank operate.
Slower than anticipated growth in new branches and new product and service offerings could result in reduced income.
We have placed a strategic emphasis on expanding our branch network and product offerings. Executing this strategy carries risks of slower than anticipated growth both in new branches and new products. New branches and products require a significant investment of both financial and personnel resources. Lower than expected loan and deposit growth in new investments can decrease anticipated revenues and net income generated by those investments, and opening new branches and introducing new products could result in more additional expenses than anticipated and divert resources from current core operations.
We are substantially dependent on dividends from the Bank for our revenues.
The Company is a separate and distinct legal entity from the Bank, and it receives substantially all of its revenue from dividends from the Bank. These dividends are the principal source of funds to pay dividends on our common stock and interest and principal on debt. Various federal and/or state laws and regulations limit the amount of dividends that the Bank may pay to the Company. In the event the Bank is unable to pay dividends to us, we may not be able to service debt, pay obligations or pay dividends on our common stock. The inability to receive dividends from the Bank could have a material adverse effect on our business, financial condition and results of operations. The information under the heading “Supervision and Regulation” in Item 1, “Business,” provides a discussion about the restrictions governing the Bank’s ability to transfer funds to us.
We may not be able to attract and retain skilled people.
Our success depends in part on our ability to retain key executives and to attract and retain additional qualified personnel who have experience both in sophisticated banking matters and in operating a bank of our size. Competition for such personnel is strong in the banking industry, and we may not be successful in attracting or retaining the personnel we require. The unexpected loss of one or more of our key personnel could have a material adverse impact on our business because of their skills, knowledge of our markets, years of industry experience and the difficulty of promptly finding qualified replacements. We expect to effectively compete in this area by offering financial packages that are competitive within the industry.
Consumers may decide not to use banks to complete their financial transactions.
While we continually attempt to use technology to offer new products and services, at the same time, technology and other changes are allowing parties to complete financial transactions that historically have involved banks through alternative methods. For example, consumers can now maintain funds in brokerage accounts or mutual funds that would have historically been held as bank deposits. Consumers can also complete transactions such as paying bills and/or transferring funds directly without the assistance of banks. The process of eliminating banks as intermediaries, known as disintermediation, could result in the loss of fee income, as well as the loss of customer deposits and the related income generated from those deposits. The loss of these revenue streams and the lower cost deposits as a source of funds could have a material adverse effect on our financial condition and results of operations.
Severe weather, natural disasters, acts of war or terrorism and other external events could significantly impact our business.
Severe weather, natural disasters, acts of war or terrorism and other adverse external events could have a significant impact on the ability of the Company to conduct business. Such events could affect the stability of our deposit base, impair the ability of borrowers to repay outstanding loans, impair the value of collateral securing loans, cause significant property damage, result in loss of revenue and/or cause us to incur additional expenses. For example, during 2005, Hurricanes Katrina and Rita made landfall and subsequently caused extensive flooding and destruction along the coastal areas of the Gulf of Mexico. Although our operations were not disrupted by these hurricanes or their aftermath, other severe weather or natural disasters, acts of war or terrorism or other adverse external events may occur in the future. Although management has established disaster recovery policies and procedures, the occurrence of any such event could have a material adverse effect on our business, which, in turn, could have a material adverse effect on our financial condition and results of operations.
Risks Associated With Our Common Stock
Our stock price can be volatile.
Stock price volatility may make it more difficult for you to resell your common stock when you want and at prices you find attractive. Our stock price can fluctuate significantly in response to a variety of factors including, among other things:
| · | Actual or anticipated variations in quarterly results of operations. |
| · | Recommendations by securities analysts. |
| · | Operating and stock price performance of other companies that investors deem comparable to the Company. |
| · | News reports relating to trends, concerns and other issues in the banking and financial services industry. |
| · | Perceptions in the marketplace regarding us and/or our competitors. |
| · | New technology used, or services offered, by competitors. |
| · | Significant acquisitions or business combinations, strategic partnerships, joint ventures or capital commitments by or involving us or our competitors. |
| · | Failure to integrate acquisitions or realize anticipated benefits from acquisitions. |
| · | Changes in government regulations. |
| · | Geopolitical conditions such as acts or threats of terrorism or military conflicts. |
General market fluctuations, industry factors and general economic and political conditions and events, such as economic slowdowns or recessions, interest rate changes or credit loss trends, could also cause our stock price to decrease regardless of operating results.
The trading volume in our common stock is less than that of other larger bank holding companies.
Our common stock is listed for trading on The NASDAQ Capital Market; the average daily trading volume in our common stock is low, generally less than that of many of our competitors and other larger bank holding companies. A public trading market having the desired characteristics of depth, liquidity and orderliness depends on the presence in the marketplace of willing buyers and sellers of our common stock at any given time. This presence depends on the individual decisions of investors and general economic and market conditions over which we have no control. Given the lower trading volume of our common stock, significant sales of our common stock, or the expectation of these sales, could cause volatility in the price of our common stock.
An investment in our common stock is not an insured deposit.
Our common stock is not a bank deposit and, therefore, is not insured against loss by the FDIC, any deposit insurance fund or by any other public or private entity. Investment in our common stock is inherently risky for the reasons described in this “Risk Factors” section and elsewhere in this report and is subject to the same market forces that affect the price of common stock in any company. As a result, if you acquire our common stock, you may lose some or all of your investment.
Our Restated Articles of Association and By-laws, our Shareholder Rights Plan, as well as certain banking laws, may have an anti-takeover effect.
Provisions of our Restated Articles of Association and By-laws as well as our Shareholder Rights Plan, which are exhibits to this Annual Report on Form 10-K, and federal banking laws, including regulatory approval requirements, could make it more difficult for a third party to acquire the Company, even if doing so would be perceived to be beneficial to our shareholders. The combination of these provisions impedes a non-negotiated merger or other business combination, which, in turn, could adversely affect the market price of our common stock.
None.
The Company has its principal offices in its headquarters building at 500 Main Street, Natchez, Adams County, Mississippi 39120, which is owned and occupied by the Bank. The Bank owns the property on four additional branches and leases the property for one of its branches. In the judgment of management, the facilities of the Company and the Bank are generally suitable, adequately insured and provide for the continuing needs of the Company and the Bank. All branches operated are full service and the list below describes the locations and general character of the properties owned and leased by the Company and the Bank:
Location | Own/Lease | Use | Approximate Office Space (square feet) |
Natchez | | | |
500 Main Street Natchez, Mississippi | Owned | Main Office | 33,790 |
411 Highway 61 N. Natchez, Mississippi | Owned | Branch Office | 1,671 |
55A Sgt. Prentiss Drive Natchez, Mississippi | Owned | Branch Office | 10,720 |
| | | | |
Vicksburg | | | |
2059 Highway 61 N. Vicksburg, Mississippi | Owned | Branch Office | 3,050 |
2150 S. Frontage Road Vicksburg, Mississippi | Owned | Branch Office | 4,570 |
| | | | |
Baton Rouge | | | |
8810 Bluebonnet Suites A & B Baton Rouge, Louisiana | Lease | Branch Office | 5,112 |
The lease for the Company’s branch located at 8810 Bluebonnet Boulevard, in Baton Rouge, Louisiana is for a ten year period beginning October 1, 2003.
The Company and the Bank are currently not involved in any material pending legal proceedings.
There were no matters submitted to the Company’s shareholders during the fourth quarter of 2006.
PART II
Information Regarding our Common Stock
The Company’s common stock is listed on The NASDAQ Capital Market, and trades under the symbol “BKBK.” The table below sets forth dividends per share and the high and low sales prices ranges for the common stock, as reported by NASDAQ, for the last two fiscal years.
| | | | | | | | |
| | | Dividends Per Share | | High | | Low | |
2006 | | | | | | | |
| 4th Quarter | | $ | .18 | | $ | 20.95 | | $ | 19.16 | |
| 3rd Quarter | | | .18 | | | 21.50 | | | 18.85 | |
| 2nd Quarter | | | .18 | | | 23.04 | | | 18.25 | |
| 1st Quarter | | | .18 | | | 24.00 | | | 19.89 | |
| | | | | | | | | | | |
2005 | | | | | | | | | | |
| 4th Quarter | | $ | .18 | | $ | 21.48 | | $ | 20.07 | |
| 3rd Quarter | | | .18 | | | 21.68 | | | 19.56 | |
| 2nd Quarter | | | .33 | | | 22.80 | | | 17.01 | |
| 1st Quarter | | | | | | 19.50 | | | 17.70 | |
On March 1, 2007, there were 558 shareholders of record of the Company’s common stock.
The Company did not repurchase any equity securities during the 4th quarter of 2006.
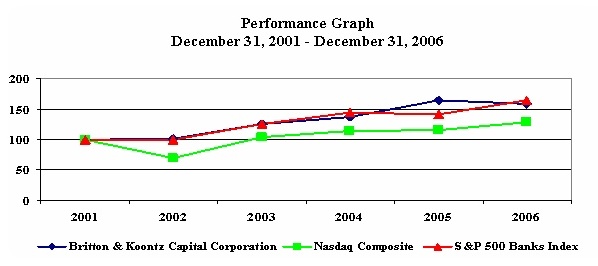
Stock Performance Graph
The following performance graph compares the performance of our common stock to the Nasdaq Composite Index and to the S&P 500 Banks Index for our reporting period. The performance graph assumes that the value of the investment in our common stock, the Nasdaq Composite Index and to the S&P 500 Banks Index was $100 at December 31, 2001, and that all dividends were reinvested.
| | 12/31/2001 | 12/31/2002 | 12/31/2003 | 12/31/2004 | 12/31/2005 | 12/31/2006 |
Britton & Koontz Capital Corporation | 100.00 | 101.41 | 124.58 | 136.48 | 163.40 | 158.74 |
Nasdaq Composite | 100.00 | 68.76 | 103.68 | 113.16 | 115.57 | 127.58 |
S&P 500 Banks Index (1) | 100.00 | 98.97 | 125.34 | 143.42 | 141.38 | 164.17 |
(1) | The companies in the S&P 500 Banks Index are: BB&T Corporation, Comerica Incorporated, Commerce Banc, New Jersey, Compass Bancshares, Inc., Countrywide Financial Corporation, Federal National Mortgage Association, Fifth Third Bancorp, First Horizon National Corporation, Federal Home Loan Mortgage Corporation, Huntington Bancshares Incorporated, Keycorp, M&T Bank Corporation, Marshall & Ilsley Corporation, MGIC Investment Corporation, National City Corporation, The PNC Financial Services Group, Inc., Regions Financial Corporation, Sovereign Bancorp, Inc., Suntrust Banks, Inc., Synovus Financial Corporation, U.S. Bancorp, Wachovia Corporation, Washington Mutual, Inc., Wells Fargo & Company and Zions Bancorporation. |
There can be no assurance that our common stock performance will continue in the future with the same or similar trends depicted in the performance graph above. We do not and will not make or endorse any predictions as to future stock performance.
| ($ IN THOUSANDS, EXCEPT PER SHARE DATA) | |
| | | | | | | | | | | | |
| | | | | | | | | | | | |
YEAR END ACTUAL BALANCES | | 2006 | | 2005 | | 2004 | | 2003 | | 2002 | |
| | | | | | | | | | | | |
| | | | | | | | | | | | |
| Total Assets | | $ | 369,318 | | $ | 389,260 | | $ | 377,351 | | $ | 373,032 | | $ | 308,879 | |
| Investment Securities | | | 107,370 | | | 121,783 | | | 137,303 | | | 141,135 | | | 97,059 | |
| Gross Loans (net of unearned income) | | | 243,534 | | | 244,912 | | | 219,311 | | | 206,591 | | | 180,398 | |
| Loans held for sale | | | 55 | | | 171 | | | 1,688 | | | 3,102 | | | 4,393 | |
| Allowance for Loan Losses | | | 2,344 | | | 2,378 | | | 2,237 | | | 2,070 | | | 2,129 | |
| Total Deposits | | | 253,757 | | | 257,377 | | | 226,288 | | | 232,934 | | | 233,012 | |
| Total Long-Term Debt | | | 39,579 | | | 53,041 | | | 60,078 | | | 65,711 | | | 30,315 | |
| Stockholders’ Equity | | | 33,597 | | | 31,260 | | | 31,152 | | | 30,197 | | | 29,329 | |
| | | | | | | | | | | | | | | | | |
| | | | | | | | | | | | | | | | | |
YEAR END AVERAGE BALANCES | | | | | | | | | | | | | | | | |
| | | | | | | | | | | | | | | | | |
| Total Assets | | | 376,626 | | | 390,317 | | | 375,496 | | | 340,566 | | | 299,600 | |
| Earning Assets | | | 357,407 | | | 370,609 | | | 354,004 | | | 320,337 | | | 280,233 | |
| Investment Securities | | | 112,458 | | | 132,843 | | | 134,993 | | | 116,520 | | | 92,502 | |
| Gross Loans (net of unearned income)* | | | 242,910 | | | 236,796 | | | 218,301 | | | 201,595 | | | 182,744 | |
| Allowance for Loan Losses | | | 2,444 | | | 2,379 | | | 2,224 | | | 2,209 | | | 2,008 | |
| Total Deposits | | | 255,713 | | | 236,440 | | | 230,437 | | | 237,019 | | | 220,095 | |
| Total Long-Term Debt | | | 46,241 | | | 70,760 | | | 67,665 | | | 44,359 | | | 34,088 | |
| Stockholders’ Equity | | | 32,248 | | | 31,347 | | | 30,853 | | | 30,181 | | | 29,323 | |
| | | | | | | | | | | | | | | | | |
| *Includes loans held for sale | | | | | | | | | | | | | | | | |
| | | | | | | | | | | | | | | | | |
| | | | | | | | | | | | | | | | | |
SUMMARY OF EARNINGS | | | | | | | | | | | | | | | | |
| | | | | | | | | | | | | | | | | |
| Total Interest Income | | | 23,708 | | | 22,000 | | | 19,774 | | | 19,565 | | | 19,854 | |
| Total Interest Expense | | | 10,206 | | | 8,445 | | | 6,465 | | | 6,329 | | | 7,205 | |
| Net Interest Income | | | 13,502 | | | 13,555 | | | 13,309 | | | 13,236 | | | 12,649 | |
| Provision for Loan Losses | | | 475 | | | 300 | | | 390 | | | 670 | | | 1,025 | |
| Non-interest Income | | | 2,462 | | | 2,418 | | | 2,678 | | | 2,767 | | | 870 | |
| Non-interest Expense | | | 10,716 | | | 11,630 | | | 11,973 | | | 11,844 | | | 10,266 | |
| Income Tax Expense | | | 1,194 | | | 815 | | | 780 | | | 750 | | | 988 | |
| Net Income | | | 3,579 | | | 3,228 | | | 2,844 | | | 2,739 | | | 1,240 | |
| | | | | | | | | | | | | | | | | |
| | | | | | | | | | | | | | | | | |
PER SHARE DATA | | | | | | | | | | | | | | | | |
| | | | | | | | | | | | | | | | | |
| Earnings Per Share-Basic | | | 1.69 | | | 1.53 | | | 1.35 | | | 1.30 | | | 0.59 | |
| Earnings Per Share - Diluted | | | 1.69 | | | 1.52 | | | 1.34 | | | 1.29 | | | 0.59 | |
| Cash Dividends | | | 0.72 | | | 0.69 | | | 0.64 | | | 0.64 | | | 0.62 | |
| Book Value | | | 15.86 | | | 14.77 | | | 14.72 | | | 14.29 | | | 13.88 | |
| Year End Stock Price | | | 19.76 | | | 21.10 | | | 18.25 | | | 17.27 | | | 14.60 | |
| | | | | | | | | | | | | | | | | |
| | | | | | | | | | | | | | | | | |
OTHER KEY INFORMATION | | | | | | | | | | | | | | | | |
| | | | | | | | | | | | | | | | | |
| Return on Average Assets | | | 0.95 | % | | 0.83 | % | | 0.76 | % | | .080 | % | | 0.41 | % |
| Return on Average Equity | | | 11.10 | % | | 10.30 | % | | 9.22 | % | | 9.07 | % | | 4.23 | % |
| Dividend Payout | | | 42.60 | % | | 45.10 | % | | 47.41 | % | | 49.23 | % | | 105.08 | % |
| Efficiency Ratio | | | 63.11 | % | | 68.52 | % | | 70.51 | % | | 69.80 | % | | 70.79 | % |
| Net Interest Income/Average Earning Assets | | | 3.78 | % | | 3.66 | % | | 3.76 | % | | 4.13 | % | | 4.51 | % |
| Allowance for Loan Losses/Loans | | | 0.96 | % | | 0.97 | % | | 1.02 | % | | 1.00 | % | | 1.18 | % |
| Non Performing Loans/Loans | | | 0.59 | % | | 0.51 | % | | 0.41 | % | | 0.74 | % | | 1.29 | % |
| Loans/Deposits | | | 95.97 | % | | 95.16 | % | | 96.92 | % | | 88.69 | % | | 77.42 | % |
| Total Stockholders’ Equity/Assets | | | 9.10 | % | | 8.03 | % | | 8.26 | % | | 8.10 | % | | 9.50 | % |
| Total Risk-Based Ratio | | | 15.27 | % | | 14.44 | % | | 15.43 | % | | 15.39 | % | | 14.71 | % |
| Tier 1 Risk-Based Ratio | | | 14.40 | % | | 13.55 | % | | 14.49 | % | | 14.48 | % | | 13.61 | % |
| Tier 1 Leverage Ratio | | | 10.45 | % | | 9.31 | % | | 9.23 | % | | 9.23 | % | | 8.71 | % |
| | | | | | | | | | | | | | | | | |
| Weighted Average Share Outstanding: | | | | | | | | | | | | | | | | |
| | | | | | | | | | | | | | | | | |
| Basic | | | 2,117,529 | | | 2,116,316 | | | 2,114,649 | | | 2,113,087 | | | 2,109,809 | |
| Diluted | | | 2,121,846 | | | 2,120.951 | | | 2,118,181 | | | 2,116,163 | | | 2,112,405 | |
This discussion presents a review of the major factors that have affected the financial condition, changes in financial condition and results of operations of Britton & Koontz Capital Corporation (the “Company”) and its subsidiaries, principally Britton & Koontz Bank, N.A. (the “Bank”), as of and for the three years ended December 31, 2006.
SUMMARY
During the past three years, the Company has emphasized loan and deposit growth and reduction of personnel expenses while also devoting considerable efforts to consolidate and realign branches and Bank premises. The Company ended 2004 with six locations and 131 employees, down from ten locations and 149 employees the year before. During 2005, the Company continued its efforts to streamline operations and ended the year with 107 employees. The Company also experienced excellent growth in its loan and deposits in 2005, as loans increased $24 million to $245 million and total deposits increased $31 million to $257 million. The Company’s loan growth in 2005 came primarily from growth in business and industrial commercial real estate loans, including residential land development and construction loans and 1-4 family residential mortgage loans. Throughout 2005, the Company operated in an environment where short-term rates continued to move upward while long-term rates remained the same or decreased, thus creating a flatter yield curve. This scenario contributed to the decline in net interest margin to 3.66% at December 31, 2005, from 3.76% at December 31, 2004. While declining margins were prevalent throughout the industry, management believes that the Company’s growth in loans during 2005 helped offset the negative effects associated with a flat yield curve and actually slowed margin compression. Another major factor that aided in preventing additional declines in net interest margin and stabilizing net interest margin in 2005 was the 29% increase in the Company’s non-interest bearing deposits since December 31, 2004.
The Federal Reserve began raising short-term rates in 2004 and had raised the benchmark rate 13 times through December 31, 2005, to 4.25%. As 2006 began, it became clear that the Company would face significant pressure on its interest margins as the Fed Funds rate was increased an additional 4 times, ending 2006 at 5.25%. Not only was the short-term rate increase elevating funding costs, but at the same time intermediate and longer-term rates on earning assets remained the same, or even decreased, effectively capping asset yields. This flattening and inversion of the yield curve contributed heavily to the lower levels of the Company’s net interest income in 2006. In light of the changes in the yield curve, management determined in 2006 that, while it would continue to aggressively seek out new opportunities to grow the Bank’s loans, investments and deposits, such growth should come only from assets whose margins justified the risk associated with the asset and that otherwise satisfied the Company’s credit standards. Management also determined that, if such growth opportunities were not available for one type of asset, funds would be directed to those assets where such growth opportunities were present and otherwise would be used to pay down long-term debt, which itself would improve the Company’s net interest income and interest margins. Accordingly, in 2006 cash flows from the investment portfolio and the residential mortgage portfolio were redirected into higher-yielding commercial loans and to the reduction in borrowings from the Federal Home Loan Bank of Dallas (“FHLB”). These commercial loans increased $19 million while borrowing declined by a similar amount. The effect of this redirection of cash flows was to lower the level of total assets and the level of total liabilities by approximately $20 million each. The new commercial loans and the reduction of FHLB borrowings also increased the Company’s net interest income during 2006. This increase, however, was offset by the negative effects of the interest rate environment during 2006. More information about the volume and rate variances can be seen under the heading “Average Balances and Yield Analysis” and “Net Interest Income.”
The Company currently leases a branch on Bluebonnet Boulevard and intends to acquire a second site in Baton Rouge during the year. Management also plans to add a third branch in Baton Rouge by 2010. Capital expenditures for equipment and software in 2007 are projected to be approximately $400 thousand. Management expects that new purchases in 2007 will be offset by an estimated $785 thousand in depreciation expense.
In 2006, the Company reported net income of $3.6 million, or $1.69 per basic and diluted share, representing an 11% increase over the $3.2 million, or $1.53 and $1.52 per basic and diluted share, of net income reported at December 31, 2005, and a 26% increase compared to net income of $2.8 million, or $1.35 and $1.34 per basic and diluted share, reported at December 31, 2004. Return on average equity for the years 2006, 2005 and 2004 was 11.10%, 10.30% and 9.22%, respectively. Net interest margins increased to 3.78% at December 31, 2006, from 3.66% at December 31, 2005 and 3.76% at December 31, 2004.
FINANCIAL CONDITION
Assets
Total assets decreased 5%, or $19.9 million, during 2006 to $369.3 million from $389.3 million at December 31, 2005. The decline in assets is primarily due to the redirection of cash flows from both the investment portfolio and the residential mortgage portfolio into new commercial loans and the reduction in FHLB borrowings. The strategy had the effect of lowering the Bank’s total assets but also improving both interest margins and net interest income.
Total assets increased 3%, or $11.9 million, during 2005 to $389.3 million from $377.4 million at December 31, 2004. Growth in assets was primarily due to increases in loans held for investment of $25.5 million, net of unearned interest and allowance for loan losses, offset by reductions of $15.5 million in investment securities.
Average Earning Assets. Interest income from earning assets represents the Company’s main source of revenue. Average earning assets for the year ended December 31, 2006, totaled $357.4 million, a $13.2 million, or 3.6%, decrease compared to December 31, 2005. The decrease was made up of a $20.4 million, or 15.3%, decrease in average investment securities primarily offset by a $6.1 million, or 2.6%, increase in average loans. Average earning assets for the period ended December 31, 2004, totaled $354 million.
Investment Securities. Investment securities primarily consist of mortgage-backed, municipal, corporate and agency securities. Securities that are deemed to be held-to-maturity (“HTM”) are accounted for by the amortized cost method and represent approximately 36% of total securities at December 31, 2006. Those securities designated available-for-sale (“AFS”) are accounted for at fair value and represent approximately 60% of the total at December 31, 2006. Equity securities account for the remaining 4%. Management determines the classification of its securities at acquisition. Total HTM and AFS investment securities fell by $13.3 million, or 11%, to $103.0 million at December 31, 2006, from $116.3 million at December 31, 2005. From 2004 to 2005, total HTM and AFS investment securities fell by $15.5 million, or 12%, to $116.3 million at December 31, 2005, from $131.8 million at December 31, 2004. In both 2005 and 2006, the flat yield curve discouraged reinvestment of proceeds from investments back into the market; consequently, cash flows from investments were used to fund new loan growth and reduce borrowings.
Equity securities at December 31, 2006 are comprised primarily of Federal Reserve Bank stock of $522 thousand, FHLB stock of $3.5 million, the Company’s $155 thousand interest in its B&K Bank Statutory Trust and ECD Investments, LLC membership interests of $100 thousand. These securities fell $1.2 million to $4.3 million in 2006 from $5.5 million in 2005, due to mandatory redemption recalculations of $1.4 million of FHLB stock.
The amortized cost of the Bank’s investment securities at December 31, 2006, 2005 and 2004, are summarized as follows:
| | | | | | | | |
| | | | | Amortized Cost | | | |
| | | | | | | | |
| | | 12/31/06 | | 12/31/05 | | 12/31/04 | |
| | | | | | | | |
| Obligations of other U.S. Government | | | | | | | | | | |
| Agencies and Corporations | | $ | 68,015,850 | | $ | 82,864,118 | | $ | 94,369,933 | |
| Obligations of State and | | | | | | | | | | |
| Political Subdivisions | | | 36,175,580 | | | 34,904,765 | | | 35,321,401 | |
| Privately Issued Collateralized | | | | | | | | | | |
| Mortgage Obligations | | | - | | | 127,770 | | | 173,419 | |
| Corporate Securities | | | - | | | - | | | 1,007,752 | |
| | | | | | | | | | | |
| | | $ | 104,191,430 | | $ | 117,896,653 | | $ | 130,872,505 | |
The amortized cost of investment securities at December 31, 2006, by contractual maturity (including mortgage backed securities) is shown below. Expected maturities may differ from contractual maturities because borrowers may have the right to call or prepay obligations with or without call or prepayment penalties. Yields on tax-exempt municipal securities have been computed on a book equivalent basis which takes into account the coupon rate paid by the issuer adjusted by any premium paid or discount received on the security at settlement date.
| | | Amortized | | Weighted | |
| | | Cost | | Average Yield | |
| | | | | | |
| Due in one year or less | | $ | 5,993,800 | | | 4.116 | % |
| Due after one year through five years | | | 5,848,745 | | | 5.235 | % |
| Due after five years through ten years | | | 56,029,464 | | | 5.175 | % |
| Due after ten years | | | 36,319,421 | | | 5.723 | % |
| Total | | $ | 104,191,430 | | | 5.308 | % |
| | | | | | | | |
Loans. Loans represent the Company’s largest source of revenue. Total loans at December 31, 2006, were $243.6 million, a decrease of $1.5 million compared to December 31, 2005. Total loans at December 31, 2005 were $245.1 million, an increase of $24.1 million compared to December 31, 2004. The Company experienced loan growth in its Baton Rouge, Louisiana market of $25.1 million in 2006. Loan demand in the small business and commercial real estate sector in this market has been brisk, and the Company’s lending staff has been especially successful in attracting new business. Total loans in Baton Rouge amounted to $84.0 million, representing approximately 34% of the Company’s loan portfolio. The Vicksburg market ended December 31, 2006, with $42 million in loans, representing 17% of the portfolio, a drop since the previous year of 4%. The Natchez, Mississippi market ended 2006 virtually the same as the previous year. The Company’s 1-4 family mortgage loans that are held in the its treasury management branch decreased $18.6 million. The decrease in the mortgage portfolio resulted from the Company’s decision to table fund and sell predominately all of its 1-4 family residential loans in the secondary market. Loan growth in the Baton Rouge market was funded by operating activities and excess cash flows from investment securities and residential mortgage loans. Table 1 presents the Bank’s loan portfolio, including loans held for sale, at the end of the last five years. The Company has no foreign loan activities.
TABLE 1: COMPOSITION OF LOAN PORTFOLIO
| | | 12/31/06 | | 12/31/05 | | 12/31/04 | | 12/31/03 | | 12/31/02 | |
| Commercial, financial and agricultural | | $ | 28,385,000 | | $ | 32,868,000 | | $ | 31,589,000 | | $ | 31,853,000 | | $ | 34,264,000 | |
| Real estate-construction | | | 44,592,000 | | | 30,069,000 | | | 18,360,000 | | | 14,690,000 | | | 7,207,000 | |
| Real estate-residential | | | 83,256,000 | | | 98,488,000 | | | 92,889,000 | | | 91,031,000 | | | 73,590,000 | |
| Real Estate-other | | | 76,473,000 | | | 70,875,000 | | | 63,685,000 | | | 57,826,000 | | | 53,694,000 | |
| Installment | | | 10,680,000 | | | 12,478,000 | | | 14,229,000 | | | 14,195,000 | | | 15,881,000 | |
| Other | | | 203,000 | | | 306,000 | | | 249,000 | | | 102,000 | | | 170,000 | |
| | | | | | | | | | | | | | | | | |
| Total loans | | $ | 243,589,000 | | $ | 245,084,000 | | $ | 221,001,000 | | $ | 209,697,000 | | $ | 184,806,000 | |
The following table sets forth as of December 31, 2006, the periods in which the Bank’s commercial, financial and agricultural loans and its real estate-construction loans mature or reprice and the total amount of all such loans due after one year having (a) predetermined interest rates and (b) floating or adjustable rates. Loan maturities are based upon contract terms and specific maturity dates. Loans with balloon payments and longer amortizations are often repriced and extended beyond the initial maturity when credit conditions remain satisfactory.
| | | | | Due after | | | | | |
| | | Due in | | one year | | | | | |
| | | one year | | through | | Due after | | | |
| | | or less | | five years | | five years | | Total | |
| | | | | | | | | | |
| Commercial, financial and agricultural | | $ | 13,993,000 | | $ | 14,004,000 | | $ | 388,000 | | $ | 28,385,000 | |
| Real estate-construction | | | 28,033,000 | | | 12,927,000 | | | 3,632,000 | | | 44,592,000 | |
| | | | | | | | | | | | | | |
| Total | | $ | 42,026,000 | | $ | 26,931,000 | | $ | 4,020,000 | | $ | 72,977,000 | |
| | | | | | | | | | | | | | |
| | | | | | | | | | | | | | |
| Predetermined interest rates | | | | | $ | 20,784,000 | | $ | 1,331,000 | | | | |
| | | | | | | | | | | | | | |
| Floating or adjustable interest rates | | | | | $ | 6,147,000 | | $ | 2,689,000 | | | | |
| | | | | | | | | | | | | | |
Asset Quality
Management periodically analyzes the diversification of the loan portfolio and the repayment ability of borrowers. When it appears to management that the Company will have trouble recapturing all outstanding principal and/or interest on a loan or loan relationship, the debt is placed on non-accrual. By placing loans on non-accrual the Company recognizes a problem credit, foregoes interest that is likely uncollectible, and adjusts the carried loan balance to reflect the collection amount expected. When problem credits are transferred to non-accrual status, the accrual of interest income is discontinued and all previously accrued and uncollected interest for the year is reversed against interest income. A non-accrual loan may be restored to accrual status when it is no longer delinquent and management no longer doubts the collectibility of interest and principal.
Several key measures are used to evaluate and monitor the Company’s asset quality. These measures include the levels and percentages of total nonperforming assets, loan delinquencies, non-accrual loans, foreclosed assets and charge-offs. Nonperforming assets, consisting of non-accrual loans, loans past due 90 days or more and other real estate owned, decreased $49 thousand to $2.7 million at December 31, 2006 compared to the balance at December 31, 2005. From December 31, 2004 to December 31, 2005, nonperforming assets increased $500 thousand compared to the balance at December 31, 2005. Non-performing assets as a percent of average assets increased to .71% in 2006 compared to .70% in 2005 and .59% in 2004. Nonperforming loans as a percent of total loans, net of unearned income and loans held for sale, increased to .59% at December 31, 2006, from .51% the year at December 31, 2005 and .41% at December 31, 2004. After a three year decline, net charge-offs as a percent of average loans increased from .07% at December 31, 2005, to .21% at December 31, 2006, which occurred primarily in the fourth quarter of 2006. Net charge-offs as a percent of average loans decreased from .10% at December 31, 2004, to .07% at December 31, 2005.
At December 31, 2006, overall credit quality remained stable. The increase in the fourth quarter of 2006 in the net charge-off percentages was due primarily to one commercial credit. In the opinion of management, this credit will not materially affect the Company’s asset quality. Specific reserves have been set aside for the unsecured portion of the credit as well as any unforeseen shortfalls. The Company added a $175 thousand provision for loan losses in the fourth quarter of 2006 to maintain the overall adequacy of the Allowance for Loan Losses, which ended 2004, 2005 and 2006 at 1.03%, .97% and .96% of loans, respectively. A breakdown of nonperforming loans at the end of each of the last five years is shown in Table 2
TABLE 2: BREAKDOWN OF NONPERFORMING LOANS
| | | 12/31/06 | | 12/31/05 | | 12/31/04 | | 12/31/03 | | 12/31/02 | |
| | | | | (dollars in thousands) | | | |
| Non-accrual loans by type | | | | | | | | | | | | | | | | |
| Real estate | | $ | 829 | | $ | 413 | | $ | 532 | | $ | 584 | | $ | 1,513 | |
| Installment | | | 13 | | | 72 | | | 26 | | | 20 | | | 16 | |
| Commercial and all other loans | | | 351 | | | 574 | | | 214 | | | 580 | | | 537 | |
| Total non-accrual loans | | | 1,193 | | | 1,059 | | | 772 | | | 1,184 | | | 2,066 | |
| Loans past due 90 days or more | | | 232 | | | 201 | | | 129 | | | 337 | | | 253 | |
| | | | | | | | | | | | | | | | | |
| Total nonperforming loans | | | 1,425 | | | 1,260 | | | 901 | | | 1,521 | | | 2,319 | |
| Other real estate owned (net) | | | 1,257 | | | 1,471 | | | 1,320 | | | 1,741 | | | 1,554 | |
| Total nonperforming assets | | $ | 2,682 | | $ | 2,731 | | $ | 2,221 | | $ | 3,262 | | $ | 3,873 | |
Nonperforming loans as a percent | | | | | | | | | | | | | | | | |
| of loans, net of unearned interest and loans held for sale | | | .59 | % | | .51 | % | | .41 | % | | .74 | % | | 1.29 | % |
Additional interest income foregone on non-accrual loans | | $ | 31 | | $ | 24 | | $ | 38 | | $ | 28 | | $ | 141 | |
| | | | | | | | | | | | | | | | | |
There were no loans in any of the reported periods above classified as “troubled debt restructurings” as defined in Statement of Financial Accounting Standards No. 15, “Accounting by Debtors and Creditors for Troubled Debt Restructuring.” Management does not believe that there are any other loans, or any other interest-bearing asset, not already specifically reserved for, that the Company has serious doubts as to the ability of the borrower to comply with the present repayment terms.
As of December 31, 2006, no other interest-bearing assets held by the Company are classified as non-accrual or past due 90 days or more. The Company continues to monitor securities issued by municipalities on the Mississippi Gulf Coast, as reported in the Company’s 10-Q dated September 30, 2005 under Item 3, Quantitative and Qualitative Disclosures About Market Risk.
Allowance for Loan Losses
The allowance for loan losses is established as losses are estimated through a provision for loan losses charged against operations and is maintained at a level that management considers adequate to absorb losses in the loan portfolio. The allowance is subject to change as management re-evaluates the adequacy of the allowance on a quarterly basis. Management’s judgment in determining the adequacy of the allowance is inherently subjective and is based on the evaluation of individual loans, the known and inherent risk characteristics and size of the loan portfolios, the assessment of current economic and real estate market conditions, estimates of the current value of underlying collateral, past loan loss experience, review of regulatory authority examination reports and evaluations of specific loans and other relevant factors. The Bank risk rates each loan at the initiation of the transaction and risk ratings are reviewed and changed, when necessary, during the life of the loan.
The allowance consists of specific, general and unallocated components. The specific component relates to loans that are considered impaired. Loan loss reserve factors are multiplied against the balances in each risk rating category to arrive at the appropriate level for the allowance for loan losses. Loans assigned higher risk ratings are monitored more closely by management. The general component of the allowance for loan losses groups loans with similar characteristics and allocates a percentage based upon historical losses and the inherent risks within each category. The unallocated portion of the allowance reflects management’s estimate of probable but undetected losses inherent in the portfolio; such estimates are influenced by uncertainties in economic conditions, delays in obtaining information, including unfavorable information about a borrower’s financial condition, difficulty in identifying triggering events that correlate to subsequent loss rates, and risk factors that have not yet manifested themselves in loss allocation factors. The methodology for determining the adequacy of the allowance for loan losses is consistently applied; however, revisions may be made to the methodology and assumptions based on historical information related to charge-off and recovery experience and management’s evaluation of the current loan portfolio.
Based upon this evaluation, management believes the allowance for loan losses of $2.3 million at December 31, 2006, which represents .96% of gross loans held to maturity, is more than adequate, under prevailing economic conditions, to absorb probable losses on existing loans. At December 31, 2006, total reserves included specific reserves of $603 thousand, general reserves of $1.3 million and unallocated reserves of $489 thousand. At December 31, 2005, the allowance for loan losses was $2.4 million, or .97%, of gross loans held to maturity, which was composed of specific reserves of $825 thousand, general reserves of $1.1 million and unallocated reserves of $494 thousand. At December 31, 2004, the allowance for loan losses was $2.2 million, or 1.02%, of gross loans held to maturity, which was composed of specific reserves of $913 thousand, general reserves of $836 thousand and unallocated reserves of $451 thousand.
Table 3 presents the activity in the allowance for loan losses for the last five years. In establishing the amounts of provision for each year charged to operating expense, management uses the basic methodologies described above. Table 4 presents the allocation of the allowance for loan losses applicable to each loan category for the previous five years.
TABLE 3: ACTIVITY OF ALLOWANCE FOR LOAN LOSSES
| | | 12/31/06 | | 12/31/05 | | 12/31/04 | | 12/31/03 | | 12/31/02 | |
| | | | | (dollars in thousands) | | | |
| Balance at beginning of year | | $ | 2,378 | | $ | 2,237 | | $ | 2,070 | | $ | 2,129 | | $ | 2,108 | |
| | | | | | | | | | | | | | | | | |
| Charge-offs: | | | | | | | | | | | | | | | | |
| Commercial, financial & agricultural | | | (571 | ) | | (54 | ) | | (108 | ) | | (285 | ) | | (434 | ) |
| Real Estate-construction | | | (5 | ) | | (0 | ) | | (22 | ) | | (0 | ) | | (11 | ) |
| Real Estate-residential | | | (3 | ) | | (40 | ) | | (29 | ) | | (37 | ) | | (150 | ) |
| Real Estate-other | | | (64 | ) | | (109 | ) | | (62 | ) | | (419 | ) | | (266 | ) |
| Installment and other | | | (107 | ) | | (48 | ) | | (47 | ) | | (91 | ) | | (282 | ) |
| Recoveries: | | | | | | | | | | | | | | | | |
| Commercial, financial & agricultural | | | 26 | | | 22 | | | 23 | | | 60 | | | 64 | |
| Real Estate-residential | | | 26 | | | 22 | | | 0 | | | 0 | | | 36 | |
| Real Estate-other | | | 51 | | | 14 | | | 5 | | | 25 | | | 0 | |
| Installment and other | | | 31 | | | 34 | | | 17 | | | 18 | | | 39 | |
| Net (charge-offs) / recoveries | | | (509 | ) | | (159 | ) | | (223 | ) | | (729 | ) | | (1,004 | ) |
| Provision charged to operations | | | 475 | | | 300 | | | 390 | | | 670 | | | 1,025 | |
| | | | | | | | | | | | | | | | | |
| Balance at end of year | | $ | 2,344 | | $ | 2,378 | | $ | 2,237 | | $ | 2,070 | | $ | 2,129 | |
| | | | | | | | | | | | | | | | | |
| Allowance for loan losses as a percent of loans, net of unearned | | | | | | | | | | | | | | | | |
| interest and loans held for sale | | | .96 | % | | .97 | % | | 1.02 | % | | 1.00 | % | | 1.18 | % |
| | | | | | | | | | | | | | | | | |
| Net charge-offs as a percent of average loans | | | .21 | % | | .07 | % | | .10 | % | | .36 | % | | .55 | % |
TABLE 4: ALLOCATION OF ALLOWANCE FOR LOAN LOSSES
| | | Amounts as of December 31, | |
| | | | | | | | | | | | |
| | | 2006 | | 2005 | | 2004 | | 2003 | | 2002 | |
| | | | | | | | | | | | |
| Commercial, financial and | | | | | | | | | | | | | | | | |
| agricultural | | $ | 426 | | $ | 502 | | $ | 452 | | $ | 350 | | $ | 568 | |
| Real estate-construction | | | 187 | | | 77 | | | 60 | | | 36 | | | 140 | |
| Real estate-residential | | | 248 | | | 162 | | | 149 | | | 136 | | | 112 | |
| Real Estate-other | | | 663 | | | 787 | | | 764 | | | 811 | | | 673 | |
| Installment | | | 331 | | | 354 | | | 361 | | | 151 | | | 95 | |
| Other | | | 489 | | | 496 | | | 451 | | | 586 | | | 541 | |
| | | | | | | | | | | | | | | | | |
| Total loans | | $ | 2,344 | | $ | 2,378 | | $ | 2,237 | | $ | 2,070 | | $ | 2,129 | |
| | | | | | | | | | | | | | | | | |
| | | Percent of loans in each category to total loans | |
| | | 2006 | | 2005 | | 2004 | | 2003 | | 2002 | |
| | | | | | | | | | | | |
| Commercial, financial and | | | | | | | | | | | | | | | | |
| agricultural | | | 11.65 | % | | 13.41 | % | | 14.29 | % | | 15.19 | % | | 18.54 | % |
| Real estate-construction | | | 18.31 | | | 12.27 | | | 8.31 | | | 7.01 | | | 3.90 | |
| Real estate-residential | | | 34.18 | | | 40.18 | | | 42.03 | | | 43.41 | | | 39.82 | |
| Real Estate-other | | | 31.40 | | | 28.92 | | | 28.82 | | | 27.58 | | | 29.05 | |
| Installment | | | 4.38 | | | 5.09 | | | 6.44 | | | 6.77 | | | 8.59 | |
| Other | | | .08 | | | .13 | | | .11 | | | .04 | | | .10 | |
| | | | | | | | | | | | | | | | | |
| Total loans | | | 100.00 | % | | 100.00 | % | | 100.00 | % | | 100.00 | % | | 100.00 | % |
Other Real Estate
The balance of other real estate (ORE) decreased $214 thousand to $1.3 million in 2006 from $1.5 million in 2005. The ORE balance was $1.3 million at December 31, 2004. Activity during 2006, set forth in Table 5, includes foreclosures of $210 thousand, proceeds from sales of $324 thousand, transfers of $78 thousand from ORE due to the satisfaction of a covered transaction and write-downs in the amount of $22 thousand. Subsequent to year end, the Company entered into a purchase agreement in the amount of $375 thousand on one commercial property held in ORE with a book value of $499 thousand. The after tax loss of $78 thousand will be taken in the first quarter of 2007.
TABLE 5: OTHER REAL ESTATE ACTIVITY
| Balance at December 31, 2005 | | | | | $ | 1,471 | |
| Write-downs | | | (22 | ) | | | |
| Proceeds from sales, net of gains and losses | | | (324 | ) | | | |
| Transfers to loan portfolio | | | (78 | ) | | | |
| Foreclosures | | | 210 | | | (214 | ) |
| Balance at December 31, 2006 | | | | | $ | 1,257 | |
Funding
Deposits. Deposits are the Company’s primary source of funding for earning assets. Total deposits ended 2006 at $253.8 million compared to $257.4 million at December 31, 2005 and $226.3 million at December 31, 2004. Average deposits increased 8.2% from $236 million at December 31, 2005, to $256 million at December 31, 2006. Average deposits increased 2.6% from $230 million at December 31, 2004, to $236 million at December 31, 2005. Non-interest bearing deposits ended 2006 at $50.3 million, compared to $51.5 million in 2005 and $39.9 million in 2004.
The decrease in deposits in 2006 is related to the Bank’s national deposit portfolio. The Bank belongs to a network that allows access to national deposits and gathers these deposits as needed. During 2006, cash flows from the investment and mortgage portfolios were sufficient to satisfy the Bank’s liquidity needs, allowing the Bank to forego gathering these national deposits until the yields required to be paid on such deposits decreased to a level where net interest income and interest margin would not be negatively impacted. Although the higher cost national deposits declined, the Bank’s core deposits actually grew by approximately $2 million compared to 2005. Included in the Bank’s liquidity plan is the use of brokered deposits as a means to fund and manage loan and deposit levels. The Bank purchased $10 million in brokered funds in 2005 as a part of its liquidity and funding plan and to contain deposit costs as interest rates were rising. These deposits remain in the portfolio at December 31, 2006, at rates considerably lower than market rates. The original terms and rates of these deposits range from 1 year to four years with an average cost of 4.74%. Fees associated with the deposits are amortized over the life of the deposits. To protect and grow the deposit portfolio, the Bank intends to utilize certificate of deposit specials throughout 2007. These accounts in the past have been successful and have contributed toward the growth in interest-bearing deposits.
During 2004, the Company joined the Certificate of Deposit Account Registry Service (“CDARS”), an innovative new deposit placement service that helps banks attract and retain larger local deposits. Deposits in the CDARS program are federally insured and are considered brokered. These deposits have increased over the past three years to $8.3 million at December 31, 2006, from $6.6 million at December 31, 2005, and $2.1 million at December 31, 2004.
Maturities of certificates of deposits of $100,000 or more at December 31, 2006, and 2005, are summarized below.
| | | 12/31/06 | | 12/31/05 | |
| | | | | | |
| Time remaining until maturity: | | | | | |
| Three months or less | | $ | 11,261,017 | | $ | 10,061,668 | |
| Over three through six months | | | 15,290,171 | | | 11,198,948 | |
| Over six through twelve months | | | 26,185,733 | | | 21,735,701 | |
| Over twelve months | | | 9,647,050 | | | 15,523,648 | |
| | | | | | | | |
| | | $ | 62,383,971 | | $ | 58,519,965 | |
| | | | | | | | |
Deposits at December 31, 2006, and December 31, 2005, consist of the following:
| | | 12/31/06 | | 12/31/05 | |
| | | | | | |
| Non-interest bearing demand deposits | | $ | 50,345,279 | | $ | 51,466,230 | |
| Now accounts | | | 24,555,009 | | | 23,016,487 | |
| Money market deposit accounts | | | 37,101,457 | | | 36,516,395 | |
| Savings accounts | | | 18,082,839 | | | 23,032,910 | |
| Certificates of deposit | | | 123,672,691 | | | 123,344,888 | |
| | | | | | | | |
| | | $ | 253,757,275 | | $ | 257,376,910 | |
| | | | | | | | |
Borrowings. Aside from the deposit base described above, the Company utilizes short and long-term borrowings as another funding source. Short-term borrowings include overnight funding through established lines of credit with correspondent banks and the FHLB. Also included are short-term advances maturing in one year or less from the FHLB, along with customer repurchase agreements. The Company’s short-term funding base decreased $4.9 million to $39.4 million at December 31, 2006, from $44.3 million at December 31, 2005, due primarily to the use of cash flows from the Bank’s investment securities portfolio to pay down borrowings. Long-term borrowings consist of advances from the FHLB with a maturity date greater than one year from the reporting period and junior subordinated debentures (See Note I, “Borrowings” in the Notes to the Consolidated Financial Statements of the Company.) These longer-term funding sources also declined during 2006 to $39.6 million at December 31, 2006, from $53.0 million at December 31, 2005.
Because of increases in the Company’s deposits from 2004 to 2005, the Company utilized its short-term funding sources less. Accordingly, the balance of short-term borrowings decreased $12.2 million to $44.3 million at December 31, 2005, from $56.5 million at December 31, 2004. Long-term borrowings also declined during 2005 to $53.0 million at December 31, 2005, from $60.1 million at December 31, 2004.
Short-term borrowings at December 31, 2006, 2005 and 2004 are outlined in Table 6 below:
TABLE 6: SHORT-TERM BORROWINGS
| | | 2006 | | 2005 | | 2004 | |
| | | | | | | | |
| Year-end balance | | $ | 39,393,000 | | $ | 44,343,000 | | $ | 56,538,000 | |
| Weighted average rate | | | 4.73 | % | | 3.07 | % | | 2.74 | % |
| Maximum month-end balance | | $ | 49,510,000 | | $ | 59,455,000 | | $ | 52,816,000 | |
| | | | | | | | | | | |
| Year to date average balance | | $ | 38,091,000 | | $ | 47,696,000 | | $ | 42,371,000 | |
| Weighted average rate | | | 4.26 | % | | 3.24 | % | | 2.11 | % |
The Company collateralizes short-term funding from the FHLB with a portion of the Bank’s one-to-four family residential mortgage portfolio and certain secured commercial loans. The Company expects that short-term borrowings from the FHLB will continue to be a source of liquidity to fund short-term needs.
Average Balances and Yield Analysis
The following table presents the Bank’s average balance sheets during 2006, 2005 and 2004. Dividing income or expense by the average balance of assets and liabilities, respectively, derives yields and costs. Non-accrual loans are included in loans for yield computations. Loan fees and late charges in the amount of approximately $1.1 million for both 2006 and 2005 and in the amount of $835 thousand for 2004 are included in both income and yield computations in loans. Income and expense resulting from interest rate caps and swaps used to manage interest rate risk are included appropriately in loans and certificates of deposit. (No tax-equivalent adjustments have been made. All averages are derived from monthly average balances.)
Average Balances and Yield Analysis
(dollars in thousands)
| | | | | Twelve Months Ended December 31, | |
| | | | | | | 2006 | | | | | | 2005 | | | | | | 2004 | | | |
| | | | | | | Interest | | | | | | Interest | | | | | | Interest | | | |
| | | | | Average | | Income/ | | Average % | | Average | | Income/ | | Average % | | Average | | Income/ | | Average % | |
| | | | | Balance | | Expense | | Yield/Rate | | Balance | | Expense | | Yield/Rate | | Balance | | Expense | | Yield/Rate | |
ASSETS | | | | | | | | | | | |
| | | | | | | | | | | | | | | | | | | | | | | | | | | | | | | | |
| Loans | | | | | $ | 242,910 | | $ | 18,443 | | | 7.59 | % | $ | 236,796 | | $ | 16,101 | | | 6.80 | % | $ | 218,301 | | $ | 14,031 | | | 6.43 | % |
| Investment securities: | | | | | | | | | | | | | | | | | | | | | | | | | | | | | | | |
| U.S. Government | | | | | | - | | | - | | | 0.00 | % | | - | | | - | | | 0.00 | % | | 339 | | | 12 | | | 3.63 | % |
| Mortgage Backed Securities | | | | | | 66,425 | | | 3,045 | | | 4.58 | % | | 86,062 | | | 3,776 | | | 4.39 | % | | 91,870 | | | 3,820 | | | 4.16 | % |
| State & municipal | | | | | | 35,146 | | | 1,641 | | | 4.67 | % | | 34,914 | | | 1,634 | | | 4.68 | % | | 35,036 | | | 1,634 | | | 4.66 | % |
| Other | | | | | | 10,887 | | | 479 | | | 4.40 | % | | 11,867 | | | 459 | | | 3.86 | % | | 7,748 | | | 267 | | | 3.44 | % |
| | | | | | | | | | | | | | | | | | | | | | | | | | | | | | | | |
| Total investment securities | | | | | | 112,458 | | | 5,166 | | | 4.59 | % | | 132,843 | | | 5,869 | | | 4.42 | % | | 134,993 | | | 5,733 | | | 4.25 | % |
| | | | | | | | | | | | | | | | | | | | | | | | | | | | | | | | |
| Interest bearing bank balances | | | | | | 1,435 | | | 69 | | | 4.83 | % | | 735 | | | 22 | | | 2.95 | % | | 543 | | | 8 | | | 1.50 | % |
| Federal funds sold | | | | | | 604 | | | 30 | | | 4.91 | % | | 235 | | | 8 | | | 3.35 | % | | 167 | | | 2 | | | 1.56 | % |
| | | | | | | | | | | | | | | | | | | | | | | | | | | | | | | | |
| Total earning assets | | | | | | 357,407 | | | 23,708 | | | 6.63 | % | | 370,609 | | | 22,000 | | | 5.94 | % | | 354,004 | | | 19,774 | | | 5.59 | % |
| | | | | | | | | | | | | | | | | | | | | | | | | | | | | | | | |
| Allowance for loan losses | | | | | | (2,444 | ) | | | | | | | | (2,379 | ) | | | | | | | | (2,224 | ) | | | | | | |
| Cash & due from banks, non-interest bearing | | | | | | 7,419 | | | | | | | | | 7,548 | | | | | | | | | 8,610 | | | | | | | |
| Bank premises & equipment | | | | | | 7,901 | | | | | | | | | 8,221 | | | | | | | | | 8,547 | | | | | | | |
| Cash Value Life Insurance and other | | | | | | 957 | | | | | | | | | 929 | | | | | | | | | 929 | | | | | | | |
| Other assets | | | | | | 5,386 | | | | | | | | | 5,389 | | | | | | | | | 5,630 | | | | | | | |
| | | | | | | | | | | | | | | | | | | | | | | | | | | | | | | | |
| TOTAL ASSETS | | | | | $ | 376,626 | | | | | | | | $ | 390,317 | | | | | | | | $ | 375,496 | | | | | | | |
| | | | | | | | | | | | | | | | | | | | | | | | | | | | | | | | |
LIABILITIES AND STOCKHOLDERS' EQUITY | | | | | | | | | | | | | | | | | | | | | | | | | | | | | | | |
| | | | | | | | | | | | | | | | | | | | | | | | | | | | | | | | |
| Interest bearing deposits: | | | | | | | | | | | | | | | | | | | | | | | | | | | | | | | |
| Savings | | | | | $ | 20,623 | | $ | 249 | | | 1.21 | % | $ | 20,289 | | $ | 215 | | | 1.06 | % | $ | 16,859 | | $ | 122 | | | 0.72 | % |
| Interest bearing checking | | | | | | 23,711 | | | 334 | | | 1.41 | % | | 27,961 | | | 216 | | | 0.77 | % | | 34,150 | | | 186 | | | 0.54 | % |
| Money rate savings | | | | | | 38,709 | | | 968 | | | 2.50 | % | | 27,318 | | | 392 | | | 1.44 | % | | 25,631 | | | 250 | | | 0.97 | % |
| Certificates of deposit and other time deposits | | | | | | 123,198 | | | 4,918 | | | 3.99 | % | | 118,297 | | | 3,463 | | | 2.93 | % | | 117,039 | | | 2,780 | | | 2.38 | % |
| | | | | | | | | | | | | | | | | | | | | | | | | | | | | | | | |
| | | | | | 206,241 | | | 6,469 | | | 3.14 | % | | 193,865 | | | 4,286 | | | 2.21 | % | | 193,679 | | | 3,338 | | | 1.72 | % |
| | | | | | | | | | | | | | | | | | | | | | | | | | | | | | | | |
| Short term borrowed funds | | | | | | 38,091 | | | 1,623 | | | 4.26 | % | | 47,696 | | | 1,546 | | | 3.24 | % | | 42,371 | | | 893 | | | 2.11 | % |
| Long term debt | | | | | | 46,241 | | | 2,114 | | | 4.57 | % | | 70,760 | | | 2,613 | | | 3.69 | % | | 67,665 | | | 2,234 | | | 3.30 | % |
| | | | | | | | | | | | | | | | | | | | | | | | | | | | | | | | |
| Total interest bearing liabilities | | | | | | 290,542 | | | 10,206 | | | 3.51 | % | | 312,321 | | | 8,445 | | | 2.70 | % | | 303,715 | | | 6,465 | | | 2.13 | % |
| | | | | | | | | | | | | | | | | | | | | | | | | | | | | | | | |
| Non-interest bearing deposits | | | | | | 49,472 | | | | | | | | | 42,575 | | | | | | | | | 36,759 | | | | | | | |
| Other liabilities | | | | | | 4,364 | | | | | | | | | 4,074 | | | | | | | | | 4,169 | | | | | | | |
| Shareholders' equity | | | | | | 32,248 | | | | | | | | | 31,347 | | | | | | | | | 30,853 | | | | | | | |
| | | | | | | | | | | | | | | | | | | | | | | | | | | | | | | | �� |
| TOTAL LIABILITIES & STOCKHOLDERS' EQUITY | | | | | $ | 376,626 | | $ | 10,206 | | | | | $ | 390,317 | | $ | 8,445 | | | | | $ | 375,496 | | $ | 6,465 | | | | |
| | | | | | | | | | | | | | | | | | | | | | | | | | | | | | | | |
| Interest income and rate earned | | | | | | | | $ | 23,708 | | | 6.63 | % | | | | $ | 22,000 | | | 5.94 | % | | | | $ | 19,774 | | | 5.59 | % |
| Interest expense and rate paid | | | | | | | | | 10,206 | | | 3.51 | % | | | | | 8,445 | | | 2.70 | % | | | | | 6,465 | | | 2.13 | % |
| Interest rate spread | | | | | | | | | | | | 3.12 | % | | | | | | | | 3.23 | % | | | | | | | | 3.46 | % |
| NET INTEREST INCOME & NET YIELD ON | | | | | | | | | | | | | | | | | | | | | | | | | | | | | | | |
| AVERAGE EARNING ASSETS | | | | | | | | $ | 13,502 | | | 3.78 | % | | | | $ | 13,555 | | | 3.66 | % | | | | $ | 13,309 | | | 3.76 | % |
Capital
Stockholders' equity ended 2006 at $33.6 million compared to $31.3 million at December 31, 2005 and $31.2 million at December 31, 2004. The change in stockholders equity from 2005 to 2006 is due to net income of $3.6 million in 2006 offset by dividend payments totaling $1.5 million and a $238 thousand increase in accumulated other comprehensive income. The change in stockholders equity from 2004 to 2005 is due to net income of $3.2 million in 2005 offset by dividend payments totaling $1.5 million and a $1.6 million decrease in accumulated other comprehensive income. Other comprehensive income is the result of unrealized gains or losses on available-for-sale securities and the recognition of the fair value of certain derivative instruments. The Company’s AFS portfolio, representing approximately 60% of total investment securities, is marked to market each month, and the result of these unrealized gains or losses, net of deferred taxes, is reported as a component of comprehensive income in stockholders’ equity. Stockholders’ equity to assets ratio at December 31, 2006, increased to 9.1% from 8.0% at December 31, 2005 and 8.3% at December 31, 2004.
Capital is well above regulatory minimums. Management intends to use excess capital to fund necessary expansion in the Baton Rouge market in 2007 and to make a target dividend payout of up to 40% of earnings. The Company currently leases a branch on Bluebonnet Boulevard and expects to acquire a second site during the year. Management also plans to add a third branch in Baton Rouge by 2010. Capital expenditures for equipment and software in 2007 are projected to be approximately $400 thousand. Management expects that new purchases in 2007 will be offset by an estimated $785 thousand in depreciation expense. Capital levels for the Company and the Bank substantially exceed the minimum requirements of the regulatory agencies for well-capitalized institutions in all three categories in both 2006 and 2005. Both the Company and the Bank maintain levels in total capital to risk-weighted assets, Tier 1 capital to risk-weighted assets and a leverage ratio (Tier 1 capital to average assets) in excess of the minimum requirements of 10.00%, 6.00% and 5.00%, respectively.
| | | December 31, 2006 | | December 31, 2005 | |
| | | | | | | | | | | | |
| | | Company | | Bank | | | | Company | | Bank | |
| | | | | | | | | | | | |
| Risk-based capital: | | | | | | | | | | | |
| Total | | $ | 40,943 | | $ | 37,961 | | | | | $ | 38,770 | | $ | 36,423 | |
| Tier 1 | | | 38,599 | | | 35,617 | | | | | | 36,392 | | | 34,045 | |
| Leverage | | | 38,599 | | | 35,617 | | | | | | 36,392 | | | 34,045 | |
| Assets: | | | | | | | | | | | | | | | | |
Quarterly average assets (1) | | | 369,411 | | | 372,266 | | | | | | 390,734 | | | 394,351 | |
| Risk-weighted assets | | | 268,095 | | | 267,944 | | | | | | 268,481 | | | 268,118 | |
| Ratios: | | | | | | | | | | | | | | | | |
| Total risk-based capital | | | 15.27 | % | | 14.17 | % | | | | | 14.44 | % | | 13.58 | % |
| Tier 1 risk-based capital | | | 14.40 | % | | 13.29 | % | | | | | 13.55 | % | | 12.70 | % |
| Leverage | | | 10.45 | % | | 9.57 | % | | | | | 9.31 | % | | 8.63 | % |
| | | | | | | | | | | | | | | | | |
| (1) | Excludes disallowed assets |
RESULTS OF OPERATIONS
The following are measurements of the Company’s earnings in relation to assets, equity and earnings per share for the past three years.
| | | 2006 | | 2005 | | 2004 | |
| | | | | | | | |
| Return on average assets | | | .95 | % | | .83 | % | | .76 | % |
| Return on average equity | | | 11.09 | % | | 10.30 | % | | 9.22 | % |
| Dividend payout ratio | | | 42.60 | % | | 45.10 | % | | 47.41 | % |
| Average equity to average assets | | | 8.56 | % | | 8.03 | % | | 8.22 | % |
| Net interest margin | | | 3.78 | % | | 3.66 | % | | 3.76 | % |
| Basic income per share | | $ | 1.69 | | $ | 1.53 | | $ | 1.35 | |
| Diluted income per share | | $ | 1.69 | | $ | 1.52 | | $ | 1.34 | |
Non-Interest Income/Non-Interest Expense
Non-interest income primarily includes service charge on deposit accounts, gains on sales of mortgage loans originated and sold in the secondary market, revenues from the Company’s investment department and other non-interest fee generating services. The Company has sought to increase income in the category by establishing new financial services, such as internet banking and commercial cash management services, including remote deposit, which allows Bank customers to make deposits electronically from their offices.
Non-interest income for the year ended December 31, 2006, was $2.5 million compared to $2.4 million in 2005 and $2.7 million in 2004. The increase for the year ended December 31, 2006 is primarily related to higher service charges on deposit accounts and gains on sales of mortgage originations sold in the secondary market in 2006, offset by lower revenues from sales in the Bank’s investment department. The majority of the decrease in non-interest income from 2004 to 2005 was a result of the sale of a Bank branch office in 2004 and the loss of non-interest income generated by that branch office.
Non-interest expenses primarily include personnel, occupancy and equipment costs along with other operating expenses related to transacting the Company’s business. Total non-interest expenses for the year ended December 31, 2006, amounted to $10.7 million, a decrease of $914 thousand compared to the corresponding period in 2005. Non-interest expense decreased $345 thousand for the year ended December 31, 2005, compared to the same period in 2004. The reductions in non-interest expense from 2004 to 2005 and from 2005 to 2006 was due primarily due to lower personnel costs and expenses related to the Company’s 2005 offer of a voluntary separation package to employees with certain years of service.
Net Interest Income/Margins
Net interest income, the amount by which interest income on loans, investments and other interest earning assets exceed interest expense on deposits and other borrowed funds, is the largest component of the Company’s earnings and is affected by several factors, including the volume of earning assets and costing liabilities, the mix of these assets and liabilities and interest rates. Net Interest Margin represents net interest income expressed as a percentage of average earning assets. Tax-equivalent margins (“TEY”) are in parenthesis.
Net interest income for 2006, 2005 and 2004 was $13.5, $13.6 and $13.3 million, respectively. The increase of $245 thousand from 2004 to 2005 resulted from growth in loan volumes and other earning assets offset by the rising interest rate environment. The small decline of $53 thousand from 2005 to 2006 reflects compression due to the interest rate environment. In 2006, cash flows from both the investment portfolio and the residential mortgage portfolio were directed into new commercial loans in the amount of $19 million; FHLB borrowings were also reduced by a similar amount. The flat to inverted yield curve experienced throughout 2006 afforded limited opportunity to reinvest cash flows from securities into additional securities. Cash flows that funded increases in commercial loans were mostly used in the Baton Rouge market. The commercial loan growth and the pay downs in the residential loan portfolio combined to keep the aggregate dollar amount of the entire loan portfolio relatively unchanged for the year with additional cash flows used to reduce wholesale borrowings. This strategy also had the effect of lowering the Bank’s total assets while simultaneously improving net interest margins. Net interest margins for 2006, 2005 and 2004 were 3.78% (4.01% TEY), 3.66% (3.89% TEY) and 3.76% (4.00% TEY), respectively.
The following table presents the dollar amount of changes in interest income and interest expense for the major components of the Company’s interest earning assets and interest bearing liabilities. It distinguishes between the changes related to outstanding balances and those due to changes in interest rates. For each category of interest earning assets and interest bearing liabilities, information is provided on changes attributable to (a) changes in volume (i.e., changes in volume multiplied by the old rate) and (b) changes in rates (i.e., changes in rates multiplied by the old volume.) For purposes of this table, changes attributable to both rate and volume have been allocated proportionately to the change due to volume and the change due to rates.
| | Volume/Rate Analysis |
| | | 2006 change from 2005 | 2005 change from 2004 |
| | | Total | | | Volume | | | Rate | | | Total | | | Volume | | | Rate | |
| Interest earning assets: | | (dollars in thousands) | (dollars in thousands) |
| Loans | | $ | 2,343 | | $ | 426 | | $ | 1,917 | | $ | 2,070 | | $ | 1,230 | | $ | 840 | |
| Investment securities: | | | | | | | | | | | | | | | | | | | |
| U.S. Government | | | - | | | - | | | - | | | (12 | ) | | (6 | ) | | (6 | ) |
| Mortgage Backed Securities | | | (731 | ) | | (894 | ) | | 163 | | | (44 | ) | | (250 | ) | | 206 | |
| State & municipal | | | 7 | | | 11 | | | (4 | ) | | - | | | (6 | ) | | 6 | |
| Other | | | 20 | | | (41 | ) | | 61 | | | 192 | | | 156 | | | 36 | |
| | | | | | | | | | | | | | | | | | | | |
| Total investment securities | | | (704 | ) | | (924 | ) | | 220 | | | 136 | | | (106 | ) | | 242 | |
| | | | | | | | | | | | | | | | | | | | |
| Interest bearing bank balances | | | 47 | | | 29 | | | 18 | | | 14 | | | 4 | | | 10 | |
| Federal funds sold | | | 22 | | | 17 | | | 5 | | | 6 | | | 2 | | | 4 | |
| | | | | | | | | | | | | | | | | | | | |
| Total earning assets | | $ | 1,708 | | $ | (452 | ) | $ | 2,160 | | $ | 2,226 | | $ | 1,130 | | $ | 1,096 | |
| | | | | | | | | | | | | | | | | | | | |
| Interest bearing deposits: | | | | | | | | | | | | | | | | | | | |
| Savings | | | 34 | | | 3 | | | 31 | | | 93 | | | 28 | | | 65 | |
| Interest bearing checking | | | 118 | | | (36 | ) | | 154 | | | 30 | | | (38 | ) | | 68 | |
| Money rate savings | | | 576 | | | 207 | | | 369 | | | 142 | | | 17 | | | 125 | |
| Certificates of deposit and other time deposits | | | 1,456 | | | 150 | | | 1,306 | | | 683 | | | 30 | | | 653 | |
| | | | | | | | | | | | | | | | | | | | |
| Total interest bearing deposits | | | 2,184 | | | 324 | | | 1,860 | | | 948 | | | 37 | | | 911 | |
| | | | | | | | | | | | | | | | | | | | |
| Short term borrowed funds | | | 77 | | | (350 | ) | | 427 | | | 653 | | | 124 | | | 529 | |
| Long term debt | | | (500 | ) | | (1,034 | ) | | 534 | | | 379 | | | 106 | | | 273 | |
| | | | | | | | | | | | | | | | | | | | |
| Total interest bearing liabilities | | $ | 1,761 | | $ | (1,060 | ) | $ | 2,821 | | $ | 1,980 | | $ | 267 | | $ | 1,713 | |
| | | | | | | | | | | | | | | | | | | | |
| Change in Interest Earning Assets | | | 1,708 | | | (452 | ) | | 2,160 | | | 2,226 | | | 1,130 | | | 1,096 | |
| Change in Interest Bearing Liabilities | | | 1,761 | | | (1,060 | ) | | 2,821 | | | 1,980 | | | 267 | | | 1,713 | |
| Change in Net Interest Income | | $ | (53 | ) | $ | 608 | | $ | (661 | ) | $ | 246 | | $ | 863 | | $ | (617 | ) |
| | | | | | | | | | | | | | | | | | | | |
Provision for Loan Losses
The provision for loan losses is a charge to earnings to maintain the reserve for loan losses at a level consistent with management’s assessment of the risk of loss in the loan portfolio in light of current risk management strategies, economic conditions and market trends. Net charge-offs had declined for three years but increased in 2006 to $509 thousand, an increase of $350 thousand from the previous year. The information under the heading “Asset Quality” above provides a discussion of the increase. The Company recorded a provision for the twelve months ended December 31, 2006, of $475 thousand, compared to $300 thousand in 2005 and $390 thousand in 2004.
Liquidity
Liquidity is a measure of the Company’s ability to fund loan commitments and meet deposit maturities and withdrawals in a timely and cost-effective manner. These needs can be met by generating profits, attracting new deposits, converting assets (including short-term investments, mortgage loans held for sale and securities available for sale) to cash through sales or securitizations, and increasing borrowings. To minimize funding risks, management monitors liquidity monthly through reviews of basic surplus which includes investment securities available for pledging or borrowing offset by short-term liabilities, along with projections of loan and deposits for the next 90 days.
Principal sources of liquidity, both short and long-term, for the Company are asset cash flows, customer deposits and the ability to borrow against investment securities and loans. The Company’s cash and cash equivalents decreased from $9.8 million at December 31, 2005, to $6.6 million at December 31, 2006. Cash provided by operating and investing activities during 2006 was $4.4 and $15.9 million, respectively, while $23.5 million was devoted to financing activities in 2006. The Company’s cash and cash equivalents were $6.6 million at December 31, 2004.
In 2006, the Company experienced a 1.4% decline in deposits. Nevertheless, in 2006 the Company was able use cash flows from its investment securities to reduce the amount of short and long-term borrowings from the FHLB and other short-term federal funds lines with correspondent banks. In addition to the Company’s deposit base, management believes that the current level of short-term investments and the projected cash flows from earning assets and securities available for sale are more than adequate to meet the Company’s current liquidity needs. Additional sources of liquidity available to the Company include the ability to issue additional retail brokered certificates of deposit and the ability to sell or securitize a portion of the Company’s residential first mortgage portfolio. The Company also has available federal funds lines and its membership in the FHLB to further augment liquidity by providing a readily accessible source of funds at competitive rates.
The Company accepts funds from various local and state governments. Total public deposits at December 31, 2006, were $31.1 million compared to $29.0 million at December 31, 2005, and $38.8 million at December 31, 2004. These deposits, considered non-core, generally are accepted on a bid basis and tend to fluctuate from year to year. Management does not believe the reductions in public deposits since December 31, 2004 will affect the Company’s ability to fund loans, engage in investment activities or handle normal deposit fluctuations.
In the ordinary course of business, the Company enters into commitments to extend credit to its customers. See Note O, “Commitments and Contingencies,” to the Consolidated Financial Statements for a discussion of the Company’s commitments to extend credit as of December 31, 2006.
The Company’s liquidity and capital resources are substantially dependent on the ability of the Bank to transfer funds to the Company in the form of dividends, loans and advances. Under federal law, the directors of a national bank, after making proper deduction for all expenses and other deductions required by the Comptroller of the Currency, may credit net profits to the bank’s undivided profits account, and may declare a dividend from that account of so much of the net profits as they judge expedient. The Comptroller and the Federal Reserve Board have each indicated that banking organizations should generally pay dividends only out of current operating earnings. The Bank’s ability to pay dividends is also limited by prudence, statutory and regulatory guidelines, and a variety of other factors.
Further, in connection with the acquisition of Natchez First Federal in 1993, the Bank assumed a liquidation account of approximately $2.8 million which has the effect of prohibiting the payment of dividends if the Bank’s net worth would thereby be reduced below the amount required for the liquidation account. Management does not anticipate that this restriction will have a material adverse effect on the Bank’s ability to pay dividends to the Company.
Certain restrictions exist on the ability of the Bank to transfer such funds to the Company in the form of loans. Federal Reserve regulations limit the amount the Bank may loan to the Company unless such loans are collateralized by specific obligations. At December 31, 2006, the maximum amount available for transfer from the Bank to the Company in the form of loans on a secured basis was $2.8 million. There were no loans outstanding from the Bank to the Company at December 31, 2006.
The Company’s asset/liability committee (“ALCO”) determines an appropriate level of capital and liquidity adequate to respond to the needs of depositors and borrowers. At December 31, 2006, the ALCO, in its report to the Board of Directors, indicated that it believes that the Company’s current level of liquidity is adequate to fund foreseeable asset growth or to meet unanticipated deposit fluctuations.
OFF-BALANCE SHEET ARRANGEMENTS
The Bank enters into off-balance-sheet arrangements in the normal course of its business. For a discussion of such arrangements, see Note A, “Summary of Significant Accounting Policies − Off-Balance-Sheet Financial Instruments,” “− Interest-Rate Cap Agreements,” and “− Interest-Rate Swap Agreements,” Note O, “Commitments and Contingencies,” and Note R, “Interest Rate Risk Management,” in the Notes to the Consolidated Financial Statements of the Company. Such discussion is incorporated by reference into this item.
The Company’s long-term contractual obligations, comprised of operating lease agreements and long-term borrowings, including junior subordinated debt, can be found in Note I, “Borrowings,” and Note K, “Leases,” in the Notes to the Consolidated Financial Statements of the Company.
Pursuant to Mississippi law, the Company’s Board of Directors may authorize the Company to pay cash dividends to its shareholders. The only limitation on such a dividend is that no distribution may be made if, after giving effect to the distribution (a) the Company would not be able to pay its debts as they come due in the usual course of business, or (b) the Company's total assets would be less than the sum of its total liabilities plus the amount that would be needed, if the Company were to be dissolved at the time of the distribution, to satisfy the preferential rights upon dissolution of any shareholders whose preferential rights are superior to those receiving the distribution.
The principal source of the Company’s cash revenues are dividends from the Bank. There are certain limitations on the Bank’s ability to pay dividends to the Company. See the disclosures under the heading “Liquidity” in Management’s Discussion and Analysis of Financial Condition and Results of Operations.
The Company declared semiannual cash dividends in 2004 and prior years. Beginning in the second quarter of 2005, the Company began paying dividends on a quarterly basis. Dividends, for the last three fiscal years total, on an annual basis, $.64 per share for 2004 and $.69 per share for 2005 and $.72 in 2006. Historical dividend payout ratios, expressed as a percentage of net income, for 2004, 2005 and 2006 were 47.41%, 45.10% and 42.60%, respectively.
The declaration of future dividends is at the discretion of the Company and generally will be dependent upon the earnings of the Bank, the assessment of capital requirements, considerations of safety and soundness, applicable law and regulation and other factors. Subject to the limitations referenced above, it is the present policy of the Board of Directors of the Company to continue the declaration of cash dividends on the Company’s common stock on a quarterly basis, to the extent practicable.
Retained earnings of the Bank available for payment of cash dividends under applicable dividend regulations was $5.3 million, $4.6 million and $2.8 million as of December 31, 2006, December 31, 2005, and December 31, 2004, respectively. The Bank intends to retain most of these funds for capital and not pay them out as dividends.
Quarterly Financial Trends
| 2006 | | | | | | | | | | | | | | |
| | | First | | | Second | | | Third | | | Fourth | | | Year |
| | Quarter | | | Quarter | | | Quarter | | | Quarter | | | to Date |
| Interest Income | $ | 5,717 | | $ | 5,844 | | $ | 6,074 | | $ | 6,073 | | $ | 23,708 |
| Interest Expense | | 2,337 | | | 2,444 | | | 2,686 | | | 2,739 | | | 10,206 |
| Net Interest Income | | 3,380 | | | 3,400 | | | 3,388 | | | 3,334 | | | 13,502 |
| Provision for Loan Losses | | 60 | | | 60 | | | 90 | | | 265 | | | 475 |
| Non-interest Income | | 611 | | | 593 | | | 618 | | | 639 | | | 2,462 |
| Non-interest Expense | | 2,689 | | | 2,776 | | | 2,670 | | | 2,581 | | | 10,716 |
| Income Taxes | | 317 | | | 282 | | | 321 | | | 274 | | | 1,194 |
| Net Income | $ | 925 | | $ | 875 | | $ | 925 | | $ | 854 | | $ | 3,579 |
| Per common share: | | | | | | | | | | | | | | |
| Basic | $ | 0.44 | | $ | 0.41 | | $ | 0.44 | | $ | 0.40 | | $ | 1.69 |
| Diluted | | 0.44 | | | 0.41 | | | 0.44 | | | 0.40 | | | 1.69 |
| Cash Dividends | $ | 0.18 | | $ | 0.18 | | $ | 0.18 | | $ | 0.18 | | $ | 0.72 |
| | | | | | | | | | | | | | | |
| | | | | | | | | | | | | | |
| | | | | Second | | | Third | | | Fourth | | | Year |
| | | | | Quarter | | | Quarter | | | Quarter | | | to Date |
| Interest Income | $ | 5,153 | | $ | 5,413 | | $ | 5,659 | | $ | 5,775 | | $ | 22,000 |
| Interest Expense | | 1,835 | | | 2,003 | | | 2,270 | | | 2,337 | | | 8,445 |
| Net Interest Income | | 3,318 | | | 3,410 | | | 3,389 | | | 3,438 | | | 13,555 |
| Provision for Loan Losses | | 90 | | | 90 | | | 60 | | | 60 | | | 300 |
| Non-interest Income | | 606 | | | 589 | | | 642 | | | 578 | | | 2,415 |
| Non-interest Expense | | 2,843 | | | 2,781 | | | 2,876 | | | 3,127 | | | 11,627 |
| Income Taxes | | 100 | | | 279 | | | 267 | | | 169 | | | 815 |
| Net Income | $ | 891 | | $ | 849 | | $ | 828 | | $ | 660 | | $ | 3,228 |
| Per common share: | | | | | | | | | | | | | | |
| Basic | $ | 0.42 | | $ | 0.40 | | $ | 0.39 | | $ | 0.32 | | $ | 1.53 |
| Diluted | | 0.42 | | | 0.40 | | | 0.39 | | | 0.31 | | | 1.52 |
| Cash Dividends | $ | - | | $ | 0.33 | | $ | 0.18 | | $ | 0.18 | | $ | 0.69 |
Market risk reflects the potential risk of economic loss that would result from adverse changes in interest rates and market prices. The risk is usually seen in either reduced market value of financial assets or reduced net interest income in future periods.
The Company utilizes an asset/liability committee (“ALCO”) comprised of four outside directors, the Bank’s Chief Executive Officer and its Chief Financial Officer, who acts as chairman of the committee. The committee meets monthly or more often as needed, and its primary responsibility is the management of the assets and liabilities of the Bank to produce a stable and evenly rising flow of net interest income, an appropriate level of capital and a level of liquidity adequate to respond to the needs of depositors and borrowers and to take advantage of earnings' enhancement opportunities. The committee manages the interest rate risk inherent in the loan, investment, deposit and borrowed funds portfolios. Further, the committee manages the risk profile of the Company and determines strategies to maintain interest rate sensitivity at a low level.
The Company utilizes an electronically-based financial modeling system that measures earnings at risk. After supplying the system with an interest rate scenario and a set of projections, the ALCO and Board of Directors receive a standard reporting package showing the current and future impact of changes in interest rates, strategies and tactics and tracking information against budgets, other forecasts and actual performance. The latest analysis at December 31, 2006, showed the impact on earnings in both a falling and rising rate scenario compared to current earnings. A rising rate scenario of 200 basis points was determined to be the worst case scenario, as the analysis indicated that Bank earnings would fall 1.7% in the first year and 6.9% in the second year in such a scenario. The impact on earnings is within the Company’s internal policy of 10%, but has increased since the previous review. This prompted management to increase the risk level to moderate. The ALCO will continue to monitor this change on a quarterly basis and report to the Board the impact that a volatile interest rate environment and changes in rate have on income. If rates decreased 200 basis points, Bank earnings would decline in the first year by .3% and improve in the second year by 1.4% compared to current levels of income.
The Company also models Economic Value of Equity (EVE) as an asset/liability management tool to measure market risk. At least annually, an EVE analysis is performed to determine the effect of the Bank’s franchise value under different rate scenarios. This value is calculated by subtracting the net present value of the Bank’s liabilities from the net present value of its assets. The difference is referred to as “net portfolio value,” with the value calculated under each rate scenario measured as a percentage change to the base portfolio value. The latest analysis at December 31, 2006, showed that in a rising rate scenario, as rates moved up by 200 basis points, the Bank’s net portfolio value would decline by 5.37% and as rates fell by 200 basis points, net portfolio value would decline by 7.22%. The committee as reported to the Board of Directors agreed that this was well within acceptable limits and places the Company in a minimal risk position according to the Office of Thrift Supervision designation.
BRITTON & KOONTZ CAPITAL CORPORATION
AND SUBSIDIARIES
CONSOLIDATED FINANCIAL STATEMENTS
DECEMBER 31, 2006, 2005 AND 2004
CONTENTS
| | |
| | |
| | |
| | |
| Audited Financial Statements: | |
| | |
| F-1 |
| | |
| F-2 |
| | |
| F-4 |
| |
| F-6 |
| | |
| F-7 |
| |
| F-9 |
| | |
| | |
| | |
| | |
To the Board of Directors and Stockholders
Britton & Koontz Capital Corporation and Subsidiaries
We have audited the accompanying Consolidated Balance Sheets of Britton & Koontz Capital Corporation and Subsidiaries as of December 31, 2006 and 2005, and the related Consolidated Statements of Income, Changes in Stockholders' Equity, and Cash Flows for each of the years in the three-year period ended December 31, 2006. These financial statements are the responsibility of the Company's management. Our responsibility is to express an opinion on these financial statements based on our audits.
We conducted our audits in accordance with the standards of the Public Company Accounting Oversight Board (United States). Those standards require that we plan and perform the audit to obtain reasonable assurance about whether the financial statements are free of material misstatement. The Company is not required to have, nor were we engaged to perform, an audit of its internal control over financial reporting. Our audit included consideration of internal control over financial reporting as a basis for designing audit procedures that are appropriate in the circumstances, but not for the purpose of expressing an opinion on the effectiveness of the Company’s internal control over financial reporting. Accordingly, we express no such opinion. An audit also includes examining, on a test basis, evidence supporting the amounts and disclosures in the financial statements, assessing the accounting principles used and significant estimates made by management, as well as evaluating the overall financial statement presentation. We believe that our audits provide a reasonable basis for our opinion.
In our opinion, the financial statements referred to above present fairly, in all material respects, the consolidated financial position of Britton & Koontz Capital Corporation and Subsidiaries as of Decem- ber 31, 2006 and 2005, and the consolidated results of their operations and their cash flows for each of the years in the three-year period ended December 31, 2006, in conformity with accounting principles generally accepted in the United States of America.
/s/ Hannis T. Bourgeois, LLP
Baton Rouge, Louisiana
February 23, 2007
BRITTON& KOONTZ CAPITAL CORPORATION AND SUBSIDIARIES CONSOLIDATED BALANCE SHEETS
DECEMBER 31, 2006 AND 2005
ASSETS
| | | 2006 | | 2005 | |
| | | | | | |
ASSETS: | | | | | |
| Cash and Due from Banks: | | | | | | | |
| Non-interest bearing | | $ | 6,254,364 | | $ | 8,553,139 | |
| Interest bearing | | | 317,799 | | | 1,272,320 | |
| | | | | | | | |
| Total Cash and Due from Banks | | | 6,572,163 | | | 9,825,459 | |
| | | | | | | | |
| Federal funds sold | | | 304,569 | | | 401,138 | |
| Investment Securities: | | | | | | | |
| Held-to-maturity (market value, in 2006 and 2005, of $39,525,495 and $39,015,853, respectively) | | | 38,610,920 | | | 37,994,043 | |
| Available-for-sale (amortized cost, in 2006 and 2005, of $65,580,510 and $79,902,610, respectively) | | | 64,419,428 | | | 78,287,012 | |
| Equity securities | | | 4,339,700 | | | 5,501,700 | |
| Loans, less unearned income of $122 in 2006 and $794 in 2005, and allowance for loan losses of $2,344,434 in 2006 and $2,377,840 in 2005 | | | 241,190,049 | | | 242,534,011 | |
| Loans held-for-sale | | | 54,810 | | | 171,200 | |
| Bank premises and equipment, net | | | 7,719,278 | | | 8,046,668 | |
| Other real estate, net | | | 1,256,611 | | | 1,470,584 | |
| Accrued interest receivable | | | 2,437,387 | | | 2,258,225 | |
| Cash surrender value of life insurance | | | 973,212 | | | 936,378 | |
| Core deposits, net | | | 773,275 | | | 880,890 | |
| Other assets | | | 666,839 | | | 952,721 | |
| | | | | | | | |
TOTAL ASSETS | | $ | 369,318,241 | | $ | 389,260,029 | |
| | | | | | | | |
The accompanying notes are an integral part of these financial statements.
LIABILITIES AND STOCKHOLDERS' EQUITY
| | | 2006 | | 2005 | |
| | | | | | |
LIABILITIES: | | | | | |
| Deposits: | | | | | | | |
| Non-interest bearing | | $ | 50,345,279 | | $ | 51,466,230 | |
| Interest bearing | | | 203,411,996 | | | 205,910,680 | |
| Total Deposits | | | 253,757,275 | | | 257,376,910 | |
| | | | | | | | |
| Securities sold under repurchase agreements | | | 8,149,016 | | | 8,032,721 | |
| Federal Home Loan Bank advances | | | 65,667,972 | | | 84,196,067 | |
| Junior subordinated debentures | | | 5,155,000 | | | 5,155,000 | |
| Accrued interest payable | | | 1,786,288 | | | 1,438,836 | |
| Advances from borrowers for taxes and insurance | | | 401,678 | | | 437,222 | |
| Accrued taxes and other liabilities | | | 804,124 | | | 1,363,115 | |
| Total Liabilities | | | 335,721,353 | | | 357,999,871 | |
| | | | | | | | |
| | | | | | | | |
STOCKHOLDERS' EQUITY: | | | | | | | |
| Common stock, $2.50 par value per share; 12,000,000 shares authorized; 2,132,466 and 2,130,816 issued and 2,117,966 and 2,116,316 outstanding, for December 31, 2006 and December 31, 2005, respectively. | | | 5,331,165 | | | 5,327,040 | |
| Additional paid-in capital | | | 7,295,235 | | | 7,254,113 | |
| Retained earnings | | | 22,003,063 | | | 19,949,100 | |
| Accumulated other comprehensive income | | | (775,200 | ) | | (1,012,720 | ) |
| | | | 33,854,263 | | | 31,517,533 | |
| Less: Treasury stock, 14,500 shares, at cost | | | (257,375 | ) | | (257,375 | ) |
| Total Stockholders' Equity | | | 33,596,888 | | | 31,260,158 | |
| | | | | | | | |
TOTAL LIABILITIES AND STOCKHOLDERS' EQUITY | | $ | 369,318,241 | | $ | 389,260,029 | |
BRITTON& KOONTZ CAPITAL CORPORATION AND SUBSIDIARIES CONSOLIDATED STATEMENTS OF INCOME
FOR THE YEARS ENDED DECEMBER 31, 2006, 2005 AND 2004
| | | 2006 | | 2005 | | 2004 | |
| | | | | | | | |
INTEREST INCOME: | | | | | | | |
| Interest and fees on loans | | $ | 18,443,069 | | $ | 16,101,335 | | $ | 14,030,704 | |
| Interest on investment securities: | | | | | | | | | | |
| Taxable interest income | | | 3,593,781 | | | 4,256,926 | | | 4,107,372 | |
| Exempt from federal income taxes | | | 1,641,361 | | | 1,634,084 | | | 1,633,638 | |
| Other interest income | | | 29,672 | | | 7,876 | | | 2,598 | |
| | | | | | | | | | | |
| Total Interest Income | | | 23,707,883 | | | 22,000,221 | | | 19,774,312 | |
| | | | | | | | | | | |
INTEREST EXPENSE: | | | | | | | | | | |
| Interest on deposits | | | 6,468,890 | | | 4,285,526 | | | 3,337,903 | |
| Interest on Federal Home Loan Bank advances | | | 2,915,388 | | | 3,422,399 | | | 2,667,895 | |
| Interest on federal funds purchased | | | - | | | 190,594 | | | 77,662 | |
| Interest on trust preferred securities | | | 417,930 | | | 327,120 | | | 235,195 | |
| Interest on securities sold under repurchase agreements | | | 403,863 | | | 219,422 | | | 146,633 | |
| | | | | | | | | | | |
| Total Interest Expense | | | 10,206,071 | | | 8,445,061 | | | 6,465,288 | |
| | | | | | | | | | | |
NET INTEREST INCOME | | | 13,501,812 | | | 13,555,160 | | | 13,309,024 | |
| | | | | | | | | | | |
PROVISION FOR LOAN LOSSES | | | 475,000 | | | 300,000 | | | 390,000 | |
| | | | | | | | | | | |
NET INTEREST INCOME AFTER PROVISION FOR LOAN LOSSES | | | 13,026,812 | | | 13,255,160 | | | 12,919,024 | |
| | | | | | | | | | | |
OTHER INCOME: | | | | | | | | | | |
| Service charges on deposit accounts | | | 1,430,164 | | | 1,388,327 | | | 1,350,548 | |
| Income from fiduciary activities | | | 38,202 | | | 41,038 | | | 43,547 | |
| Income from investment activities | | | 179,457 | | | 201,890 | | | 210,523 | |
| Net gain on sales of loans | | | 313,327 | | | 359,821 | | | 331,593 | |
| Net gain (loss) on sale of securities | | | (30,481 | ) | | - | | | - | |
| Net gain (loss) on sales of premises and equipment | | | - | | | (36,612 | ) | | 175,091 | |
| Other | | | 531,124 | | | 463,151 | | | 566,484 | |
| | | | | | | | | | | |
| Total Other Income | | | 2,461,793 | | | 2,417,615 | | | 2,677,786 | |
| Income before Other Expenses | | | 15,488,605 | | | 15,672,775 | | | 15,596,810 | |
| | | | | | | | | | | |
| | | 2006 | | 2005 | | 2004 | |
| | | | | | | | |
OTHER EXPENSES: | | | | | | | |
| Salaries | | | 5,003,831 | | | 5,863,029 | | | 6,060,543 | |
| Employee benefits | | | 747,685 | | | 872,998 | | | 870,638 | |
| Director fees | | | 198,012 | | | 208,087 | | | 203,348 | |
| Net occupancy expense | | | 977,511 | | | 912,357 | | | 927,430 | |
| Equipment expense | | | 1,102,240 | | | 1,109,984 | | | 979,139 | |
| Other real estate, net | | | 76,365 | | | 71,895 | | | 218,510 | |
| FDIC assessment | | | 32,526 | | | 31,160 | | | 34,358 | |
| Advertising | | | 207,834 | | | 198,233 | | | 259,284 | |
| Stationery and supplies | | | 188,057 | | | 182,497 | | | 233,379 | |
| Amortization | | | 107,616 | | | 107,616 | | | 107,616 | |
| Audit expense | | | 186,485 | | | 192,996 | | | 165,074 | |
| Other | | | 1,887,878 | | | 1,879,189 | | | 1,913,037 | |
| | | | | | | | | | | |
| Total Other Expenses | | | 10,716,040 | | | 11,630,041 | | | 11,972,356 | |
| | | | | | | | | | | |
INCOME BEFORE INCOME TAX EXPENSE | | | 4,772,565 | | | 4,042,734 | | | 3,624,454 | |
| | | | | | | | | | | |
INCOME TAX EXPENSE | | | 1,193,982 | | | 815,094 | | | 780,245 | |
| | | | | | | | | | | |
NET INCOME | | $ | 3,578,583 | | $ | 3,227,640 | | $ | 2,844,209 | |
| | | | | | | | | | | |
PER SHARE DATA: | | | | | | | | | | |
| Basic earnings per share | | $ | 1.69 | | $ | 1.53 | | $ | 1.35 | |
| | | | | | | | | | | |
| Basic weighted shares outstanding | | | 2,117,529 | | | 2,116,316 | | | 2,114,649 | |
| | | | | | | | | | | |
| Diluted earnings per share | | $ | 1.69 | | $ | 1.52 | | $ | 1.34 | |
| | | | | | | | | | | |
| Diluted weighted shares outstanding | | | 2,121,846 | | | 2,120,951 | | | 2,118,181 | |
| | | | | | | | | | | |
| Cash dividends per share | | $ | 0.72 | | $ | 0.69 | | $ | 0.64 | |
| | | | | | | | | | | |
The accompanying notes are an integral part of these financial statements.
BRITTON & KOONTZ CAPITAL CORPORATION AND SUBSIDIARIES CONSOLIDATED STATEMENTS OF CHANGES IN STOCKHOLDERS' EQUITY
FOR THE YEARS ENDED DECEMBER 31, 2006, 2005 AND 2004
| | | | | | | | | | | Accumulated | | | | | |
| | | | | | | Additional | | | | Other | | | | | |
| | | Common Stock | | Paid-In | | Retained | | Comprehensive | | Treasury | | | |
| | | Shares | | Amount | | Capital | | Earnings | | Income | | Stock | | Total | |
| BALANCE, December 31,2003 | | | 2,113,087 | | $ | 5,318,968 | | $ | 7,225,408 | | $ | 16,690,918 | | $ | 1,218,680 | | $ | (257,375 | ) | $ | 30,196,599 | |
| Comprehensive Income: | | | | | | | | | | | | | | | | | | | | | | |
| Net Income | | | - | | | - | | | - | | | 2,844,209 | | | - | | | - | | | 2,844,209 | |
| Other Comprehensive Income: | | | | | | | | | | | | | | | | | | | | | | |
| Change in fair value of | | | | | | | | | | | | | | | | | | | | | | |
| available for sale securities, | | | | | | | | | | | | | | | | | | | | | | |
| net of taxes of $128,353 | | | - | | | - | | | - | | | - | | | (469,749 | ) | | - | | | (469,749 | ) |
| Change in fair value of | | | | | | | | | | | | | | | | | | | | | | |
| derivatives, net of taxes of | | | | | | | | | | | | | | | | | | | | | | |
| $61,073 | | | - | | | - | | | - | | | - | | | (102,659 | ) | | - | | | (102,659 | ) |
| Total Comprehensive Income | | | - | | | - | | | - | | | - | | | - | | | - | | | 2,271,801 | |
| Cash dividends ($0.64 per share) | | | - | | | - | | | - | | | (1,353,409 | ) | | - | | | - | | | (1,353,409 | ) |
| Issuance of common stock | | | 3,229 | | | 8,072 | | | 28,705 | | | - | | | - | | | - | | | 36,777 | |
| BALANCE, December 31, 2004 | | | 2,116,316 | | | 5,327,040 | | | 7,254,113 | | | 18,181,718 | | | 646,272 | | | (257,375 | ) | | 31,151,768 | |
| Comprehensive Income: | | | | | | | | | | | | | | | | | | | | | | |
| Net Income | | | - | | | - | | | - | | | 3,227,640 | | | - | | | - | | | 3,227,640 | |
| Other Comprehensive Income | | | | | | | | | | | | | | | | | | | | | | |
| Change in fair value of | | | | | | | | | | | | | | | | | | | | | | |
| available for sale securities, | | | | | | | | | | | | | | | | | | | | | | |
| net of taxes of $ 930,312 | | | - | | | - | | | - | | | - | | | (1,563,823 | ) | | - | | | (1,563,823 | ) |
| Change in fair value of | | | | | | | | | | | | | | | | | | | | | | |
| derivatives, net of taxes of | | | | | | | | | | | | | | | | | | | | | | |
| $56,615 | | | - | | | - | | | - | | | - | | | (95,169 | ) | | - | | | (95,169 | ) |
| Total Comprehensive Income | | | - | | | - | | | - | | | - | | | - | | | - | | | 1,568,648 | |
| Cash dividends ($0.69 per share) | | | - | | | - | | | - | | | (1,460,258 | ) | | - | | | - | | | (1,460,258 | ) |
| BALANCE, December 31, 2005 | | | 2,116,316 | | | 5,327,040 | | | 7,254,113 | | | 19,949,100 | | | (1,012,720 | ) | | (257,375 | ) | | 31,260,158 | |
| Comprehensive Income: | | | | | | | | | | | | | | | | | | | | | | |
| Net Income | | | - | | | - | | | - | | | 3,578,583 | | | - | | | - | | | 3,578,583 | |
| Other Comprehensive Income: | | | | | | | | | | | | | | | | | | | | | | |
| Change in fair value of | | | | | | | | | | | | | | | | | | | | | | |
| available for sale securities, | | | | | | | | | | | | | | | | | | | | | | |
| net of taxes of $169,535, | | | | | | | | | | | | | | | | | | | | | | |
| net of reclassification | | | | | | | | | | | | | | | | | | | | | | |
| adjustment of $1,875 | | | - | | | - | | | - | | | - | | | 284,982 | | | - | | | 284,982 | |
| Change in fair value of | | | | | | | | | | | | | | | | | | | | | | |
| derivatives, net of taxes of | | | | | | | | | | | | | | | | | | | | | | |
| $28,235, net of reclassification | | | | | | | | | | | | | | | | | | | | | | |
| adjustment of $28,605 | | | - | | | - | | | - | | | - | | | (47,462 | ) | | - | | | (47,462 | ) |
| Total Comprehensive Income | | | - | | | - | | | - | | | - | | | - | | | - | | | 3,816,103 | |
| Cash dividends ($0.72 per share) | | | - | | | - | | | - | | | (1,524,619 | ) | | - | | | - | | | (1,524,619 | ) |
| Issuance of common stock | | | 1,650 | | | 4,125 | | | 41,122 | | | - | | | - | | | - | | | 45,247 | |
| BALANCE, December 31, 2006 | | | 2,117,966 | | $ | 5,331,165 | | $ | 7,295,235 | | $ | 22,003,063 | | $ | (775,200 | ) | $ | (257,375 | ) | $ | 33,596,888 | |
| | | | | | | | | | | | | | | | | | | | | | | |
The accompanying notes are an integral part of these financial statements.
BRITTON & KOONTZ CAPITAL CORPORATION AND SUBSIDIARIES CONSOLIDATED STATEMENTS OF CASH FLOWS
FOR THE YEARS ENDED DECEMBER 31, 2006, 2005 AND 2004
| | | 2006 | | 2005 | | 2004 | |
| | | | | | | | |
CASH FLOWS FROM OPERATING ACTIVITIES: | | | | | | | |
| Net income | | $ | 3,578,583 | | $ | 3,227,640 | | $ | 2,844,209 | |
| Adjustments to reconcile net income to | | | | | | | | | | |
| net cash provided by operating activities: | | | | | | | | | | |
| Deferred taxes | | | (114,945 | ) | | (264,520 | ) | | 104,018 | |
| Provision for loan losses | | | 475,000 | | | 300,000 | | | 390,000 | |
| Provision for depreciation | | | 798,221 | | | 824,447 | | | 727,564 | |
| Write-down of other real estate | | | 22,178 | | | 34,255 | | | 126,000 | |
| (Gain) on sale of loans | | | (313,327 | ) | | (359,821 | ) | | (331,593 | ) |
| (Gain) Loss on sale of other repossessed assets | | | - | | | 1,500 | | | (193 | ) |
| (Gain) Loss on sale of premises and equipment | | | - | | | 36,612 | | | (175,091 | ) |
| (Gain) Loss on sale of securities | | | 30,480 | | | - | | | - | |
| (Gain) Loss on sale of other real estate | | | (11,032 | ) | | (3,161 | ) | | 42,970 | |
| Stock dividends received | | | (192,200 | ) | | (181,600 | ) | | (85,100 | ) |
| Net amortization (accretion) of securities | | | 139,519 | | | 307,126 | | | 590,506 | |
| Amortization of acquisition premium | | | 107,616 | | | 107,616 | | | 107,616 | |
| Net change in: | | | | | | | | | | |
| Loans held for sale | | | 116,390 | | | 1,517,138 | | | 1,413,668 | |
| Accrued interest receivable | | | (179,162 | ) | | (131,146 | ) | | (31,417 | ) |
| Cash surrender value of life insurance | | | (36,834 | ) | | 7,103 | | | (38,391 | ) |
| Other assets | | | 198,704 | | | (169 | ) | | 320,689 | |
| Accrued interest payable | | | 347,452 | | | 453,977 | | | 154,361 | |
| Accrued taxes and other liabilities | | | (558,993 | ) | | 559,562 | | | 352,977 | |
| | | | | | | | | | | |
| Net Cash Provided by Operating Activities | | | 4,407,650 | | | 6,436,559 | | | 6,512,793 | |
| | | | | | | | | | | |
CASH FLOWS FROM INVESTING ACTIVITIES: | | | | | | | | | | |
| (Increase) decrease in federal funds sold | | | 96,570 | | | (292,107 | ) | | (67,670 | ) |
| Proceeds from principal paydowns and maturities | | | | | | | | | | |
| of investment securities held-to-maturity | | | 1,149,236 | | | 1,759,528 | | | 2,813,609 | |
| Proceeds from principal paydowns and maturities of | | | | | | | | | | |
| investment securities available-for-sale | | | 19,446,947 | | | 24,938,759 | | | 25,139,010 | |
| Proceeds from redemption of Federal Home Loan | | | | | | | | | | |
| Bank stock | | | 1,354,200 | | | 603,000 | | | - | |
| Purchases of investment securities held-to-maturity | | | (1,774,002 | ) | | - | | | (473,892 | ) |
| Purchases of investment securities available-for-sale | | | (5,286,957 | ) | | (14,029,560 | ) | | (24,465,532 | ) |
| Purchase of other equity securities | | | - | | | (371,500 | ) | | (129,700 | ) |
| Net (increase)/decrease in loans | | | 1,013,155 | | | (26,509,385 | ) | | (13,171,667 | ) |
| Proceeds from sales of other repossessed assets | | | 22,626 | | | 30,565 | | | - | |
| Proceeds from sale of other real estate | | | 334,461 | | | 890,709 | | | 1,260,075 | |
| Purchases of premises and equipment | | | (470,831 | ) | | (641,972 | ) | | (1,444,730 | ) |
| Proceeds from sales of premises and equipment | | | - | | | - | | | 775,000 | |
| | | | | | | | | | | |
| Net Cash Provided by/ (Used in) Investing Activities | | | 15,885,405 | | | (13,621,963 | ) | | (9,765,497 | ) |
BRITTON & KOONTZ CAPITAL CORPORATION AND SUBSIDIARIES
CONSOLIDATED STATEMENTS OF CASH FLOWS (Continued)
FOR THE YEARS ENDED DECEMBER 31, 2006, 2005 AND 2004
| | | 2006 | | 2005 | | 2004 | |
CASH FLOWS FROM FINANCING ACTIVITIES: | | | | | | | |
| Net increase (decrease) in customer deposits | | | (4,961,586 | ) | | 33,069,981 | | | (9,220,853 | ) |
| Net increase (decrease) in brokered deposits | | | 1,341,951 | | | (1,981,000 | ) | | 2,575,000 | |
| Net increase (decrease) in federal funds purchased | | | - | | | (6,435,000 | ) | | 1,885,000 | |
| Net increase (decrease) in Federal Home Loan Bank | | | | | | | | | | |
| advances | | | (18,528,095 | ) | | (12,726,804 | ) | | 9,347,110 | |
| Net increase (decrease) in securities sold under | | | | | | | | | | |
| repurchase agreements | | | 116,295 | | | (70,660 | ) | | (1,831,919 | ) |
| Increase (decrease) in advances from borrowers | | | | | | | | | | |
| for taxes and insurance | | | (35,544 | ) | | 37,779 | | | 32,068 | |
| Cash dividends paid | | | (1,524,619 | ) | | (1,460,258 | ) | | (1,353,409 | ) |
| Cash received from stock options exercised | | | 45,247 | | | - | | | 36,777 | |
| | | | | | | | | | | |
| Net Cash Provided by/(Used in) Financing Activities | | | (23,546,351 | ) | | 10,434,038 | | | 1,469,774 | |
| | | | | | | | | | | |
NET INCREASE/(DECREASE) IN CASH AND DUE | | | | | | | | | | |
FROM BANKS | | | (3,253,296 | ) | | 3,248,634 | | | (1,782,930 | ) |
| | | | | | | | | | | |
CASH AND DUE FROM BANKS AT BEGINNING OF YEAR | | | 9,825,459 | | | 6,576,825 | | | 8,359,755 | |
| | | | | | | | | | | |
CASH AND DUE FROM BANKS AT END OF YEAR | | $ | 6,572,163 | | $ | 9,825,459 | | $ | 6,576,825 | |
| | | | | | | | | | | |
| | | | | | | | | | | |
SUPPLEMENTAL DISCLOSURES OF CASH FLOW | | | | | | | | | | |
INFORMATION: | | | | | | | | | | |
| Cash payments for: | | | | | | | | | | |
| Income taxes | | $ | 1,623,914 | | $ | 579,504 | | $ | 644,624 | |
| | | | | | | | | | | |
| Interest on deposits and borrowings | | $ | 9,858,619 | | $ | 7,991,084 | | $ | 6,310,927 | |
| | | | | | | | | | | |
SCHEDULE OF NONCASH INVESTING AND | | | | | | | | | | |
FINANCING ACTIVITIES: | | | | | | | | | | |
| Transfers to other real estate/other repossessed assets | | $ | 169,134 | | $ | 1,072,050 | | $ | 1,008,255 | |
| | | | | | | | | | | |
| Change in unrealized (gains) losses on | | | | | | | | | | |
| securities available-for-sale | | $ | 454,517 | | $ | (2,494,135 | ) | $ | (598,102 | ) |
| | | | | | | | | | | |
| Change in the deferred tax effect in unrealized | | | | | | | | | | |
| gains (losses) on securities available-for-sale | | $ | 169,535 | | $ | (930,312 | ) | $ | (128,353 | ) |
| | | | | | | | | | | |
| Change in unrealized gains on derivatives | | $ | (75,697 | ) | $ | (151,784 | ) | $ | (163,732 | ) |
| | | | | | | | | | | |
| Change in the deferred tax effect in | | | | | | | | | | |
| unrealized gains on derivatives | | $ | (28,235 | ) | $ | (56,615 | ) | $ | (61,073 | ) |
The accompanying notes are an integral part of these financial statements.
NOTE A. SUMMARY OF SIGNIFICANT ACCOUNTING POLICIES
Principles of Consolidation
The consolidated financial statements include the accounts of Britton & Koontz Capital Corporation (the Company) and its wholly owned subsidiaries, Britton & Koontz Bank, National Association (the Bank) and B & K Title Insurance Agency, Inc. (the Agency). All material inter-company profits, balances and transactions have been eliminated.
Nature of Operations
The Bank operates under a national bank charter and provides full banking services, including trust services. The primary area served by the Bank is the southwest region of Mississippi and East Baton Rouge Parish in Louisiana. Services are provided at three locations in Natchez, Mississippi, two locations in Vicksburg, Mississippi, and one location in Baton Rouge, Louisiana. The Agency operations were discontinued during 2006.
Use of Estimates
The preparation of consolidated financial statements in conformity with generally accepted accounting principles requires management to make estimates and assumptions that affect the reported amounts of assets and liabilities and the disclosure of contingent assets and liabilities at the date of the financial statements as well as the reported amounts of revenues and expenses during the reporting period. Actual results could differ from those estimates.
Material estimates that are particularly susceptible to significant change relate to the determination of the allowance for loan losses. In connection with the determination of the allowance for loan losses, management obtains independent appraisals for significant properties.
While management uses available information to recognize losses on loans, future additions to the allowance may be necessary based on changes in local economic conditions. In addition, regulatory agencies, as an integral part of their examination process, periodically review the Bank's allowance for loan losses. Such agencies may require the Bank to recognize additions to the allowance based on their judgments about information available to them at the time of their examination. Because of these factors, it is reasonably possible that the allowance for loan losses may change materially in the near term. However, the amount of the change that is reasonably possible cannot be estimated.
NOTE A. SUMMARY OF SIGNIFICANT ACCOUNTING POLICIES (Continued)
Investment Securities
Management determines the appropriate classification of securities at the time of purchase. If management has the positive intent and the Bank has the ability at the time of purchase to hold debt securities until maturity, they are classified as held-to-maturity and carried at cost, adjusted for amortization of premiums and accretion of discounts using methods approximating the interest method. Available-for-sale securities include securities that management intends to use as part of its asset and liability management strategy and that may be sold in response to changes in interest rates, resultant prepayment risk and other factors related to interest rates and resultant prepayment risk changes. These securities are carried at fair value. Equity securities primarily include stock in the Federal Reserve Bank and the Federal Home Loan Bank, which are restricted and are carried at cost.
Realized gains and losses on dispositions of investment securities are based on the net proceeds and the adjusted book value of the securities sold, using the specific identification method. Unrealized gains and losses on investment securities available-for-sale are based on the difference between book value and fair value of each security. These unrealized gains and losses are reported as a component of comprehensive income in stockholders' equity, net of the related deferred tax effect. The Bank does not engage in trading account activities.
Loans
Loans are stated at the amount of principal outstanding, reduced by unearned income and an allowance for loan losses. Unearned income on certain installment loans is recognized as income over the terms of the loans by a method which approximates the interest method. Interest on other loans is calculated by using the simple interest method on daily balances of the principal amount outstanding. Loans are ordinarily placed on non-accrual when a loan is specifically determined to be impaired or when principal or interest is delinquent for 90 days or more; however, management may elect to continue the accrual when the estimated net realizable value of collateral is sufficient to cover the principal balance and the accrued interest. Any unpaid interest previously accrued on non-accrual loans is reversed from income. Interest income, generally, is not recognized on specific impaired loans unless the likelihood of further loss is remote. Interest payments received on such loans are applied as a reduction of the loan principal balance. Interest income on other non-accrual loans is recognized only to the extent of interest payments received.
Securitized loans are transferred to a long-term investment category at the lower of cost or market value on the transfer date. Any material difference between the carrying amount of the loans and their outstanding principal balance is recognized as an adjustment to the yield by the interest method.
Loans Held-for-Sale
Loans held-for-sale primarily range from ten, fifteen and thirty-year fixed-rate, one-to-four family real estate loans which are valued at the lower of cost or market, as determined by outstanding commitments from investors or current investor yield requirements, calculated on an individual basis. These loans are originated with the intent of selling them on the secondary market.
NOTE A. SUMMARY OF SIGNIFICANT ACCOUNTING POLICIES (Continued)
Unrealized losses on loans held-for-sale are charged against income in the period of decline. Such declines are recorded in a valuation allowance account and deducted from the cost basis of the loans. Gains on loans held-for-sale are recognized when realized.
Allowance for Loan Losses
The allowance is an amount that management believes will be adequate to absorb probable losses inherent in the loan portfolio as of the balance sheet date based on evaluations of the collectibility of loans and prior loan loss experience. The evaluations take into consideration such factors as changes in the nature and volume of the loan portfolio, overall portfolio quality, review of specific problem loans, and current economic conditions that may affect the borrower's ability to pay. A loan is considered impaired when, based on current information and events, it is probable that the Bank will be unable to collect the scheduled payments of principal or interest when due according to the contractual terms of the loan agreement. Allowances for impaired loans are generally determined based on collateral values or the present value of estimated cash flows. Credits deemed uncollectible are charged to the allowance. Provisions for loan losses and recoveries on loans previously charged off are adjusted to the allowance. Past due status is determined based on contractual terms.
Bank Premises and Equipment
Bank premises and equipment are stated at cost, less accumulated depreciation. Depreciation expense is computed by the straight-line method and is charged to expense over the estimated useful lives of the assets, which range from 3 to 40 years.
Other Real Estate
Properties acquired through foreclosure or in settlement of loans and in lieu of loan foreclosures are classified as foreclosed properties and are valued at the lower of the loan value or estimated fair value of the property acquired less estimated selling costs. At the time of foreclosure, the excess, if any, of the loan value over the estimated fair value of the property acquired less estimated selling costs, is charged to the allowance for loan losses. Additional decreases in the carrying values of foreclosed properties or changes in estimated selling costs, subsequent to the time of foreclosure, are recognized through provisions charged to operations. Revenues and expenses from operations and gains and losses on dispositions of such assets are recorded in earnings in the period incurred.
The fair value of foreclosed properties is determined based upon appraised value, utilizing either the estimated replacement cost, the selling price of properties utilized for similar purposes, or discounted cash flow analyses of the properties' operations.
Compensated Absences
Employees of the Bank are entitled to paid vacation, emergency and sick days off, depending on length of service in the banking industry. Vacation, emergency and sick days are granted on an annual basis to eligible employees. Unused vacation and emergency days expire on December 31 of each year. Unused sick days expire on each employee's employment anniversary date each year.
NOTE A. SUMMARY OF SIGNIFICANT ACCOUNTING POLICIES (Continued)
The estimated amount of compensation for future absences is deemed immaterial to the consolidated financial statements; accordingly, no liability has been recorded in the accompanying financial statements. The Bank's policy is to recognize the cost of compensated absences when actually paid to employees.
Income Taxes
The provision for income taxes is based on amounts reported in the statements of income after exclusion of nontaxable income such as interest on state and municipal securities. Also, certain items of income and expenses are recognized in different time periods for financial statement purposes than for income tax purposes. Thus, provisions for deferred taxes are recorded in recognition of such temporary differences.
Deferred taxes are determined utilizing a liability method whereby deferred tax assets are recognized for deductible temporary differences and deferred tax liabilities are recognized for taxable temporary differences. Temporary differences are the differences between the reported amounts of assets and liabilities and their tax bases. Deferred tax assets are reduced by a valuation allowance when, in the opinion of management, it is more likely than not that some portion or all of the deferred tax assets will not be realized. Deferred tax assets and liabilities are adjusted for the effects of changes in tax laws and rates on the date of enactment.
The Company and its subsidiaries file a consolidated federal income tax return. Consolidated income tax expense is allocated on the basis of each company's income adjusted for permanent differences.
Earnings Per Share
Basic earnings per share represents income available to common stockholders divided by the weighted-average number of shares of common stock outstanding during the period. Diluted earnings per share reflects additional common shares that would have been outstanding if dilutive potential common shares had been issued, as well as any adjustment to income that would result from the assumed issuance. All shares held by the Employee Stock Ownership Plan (ESOP) are treated as outstanding in computing the earnings per share. Stock options are used in the calculation of diluted earnings per share if they are dilutive. Earnings per common share have been computed as follows:
| | | 2006 | | 2005 | | 2004 | |
| Basic weighted average shares outstanding | | | 2,117,529 | | | 2,116,316 | | | 2,114,649 | |
| Dilutive effect of stock options | | | 4,317 | | | 4,635 | | | 3,532 | |
| | | | | | | | | | | |
| Dilutive weighted average shares outstanding | | | 2,121,846 | | | 2,120,951 | | | 2,118,181 | |
| Net income | | $ | 3,578,583 | | $ | 3,227,640 | | $ | 2,844,209 | |
| Net income per share-basic | | $ | 1.69 | | $ | 1.53 | | $ | 1.35 | |
| Net income per share-dilutive | | $ | 1.69 | | $ | 1.52 | | $ | 1.34 | |
NOTE A. SUMMARY OF SIGNIFICANT ACCOUNTING POLICIES (Continued)
The Company has granted options to purchase various amounts of the Company’s common stock at various prices ranging from $14.50 to $19.94 per share. Those options whose exercise price exceeded the average market price of the common shares are not included in the options adjustment for diluted earnings per share.
Off-Balance-Sheet Financial Instruments
In the ordinary course of business, the Bank has entered into off-balance-sheet financial instruments consisting of interest-rate swap and cap agreements, commitments to extend credit and standby letters of credit. Financial instruments related to loans are recorded in the financial statements when they become payable.
Statement of Cash Flows
For purposes of the statements of cash flows, the Company considers only cash and due from banks to be cash equivalents.
Advertising Costs
Advertising and marketing costs are recorded as expenses in the year in which they are incurred. Advertising and marketing costs charged to operations during 2006, 2005 and 2004 were $207,834, $198,233 and $259,284, respectively.
Interest-Rate Cap Agreements
The cost of interest-rate cap agreements is amortized to interest expense over the terms of the caps. The unamortized cost is included in other assets in the consolidated balance sheet. Amounts receivable under cap agreements are accrued as a reduction of interest expense. The Bank does not engage in trading of derivatives. All such financial instruments are used to manage interest rate risk.
Interest-Rate Swap Agreements
The Bank enters into interest-rate swap agreements to modify the interest rate characteristics of its assets and liabilities. These agreements may involve the receipt or payment of fixed rate amounts in exchange for floating rate interest receipts or payments over the life of the agreement without an exchange of the underlying principal amount. The differential to be paid or received is accrued as interest rates change and recognized as an adjustment to interest income or expense. The related amount payable to or receivable from counter-parties is included in other liabilities or assets.
Core Deposits
During 1999, the Company acquired certain assets and liabilities of three Union Planters, N.A. branches in Natchez and Vicksburg, Mississippi, which were accounted for as a purchase. The Bank paid a premium for the depositor relationship of $1,614,210. This premium is included in other assets and is being amortized over 15 years, which is the estimated life of the customer base.
NOTE A. SUMMARY OF SIGNIFICANT ACCOUNTING POLICIES (Continued)
Stock Compensation Plans
Financial Accounting Standards Board (FASB) Statement No. 123, “Accounting for Stock-Based Compensation”, encourages all entities to adopt a fair value based method of accounting for employee stock compensation plans, whereby com-pensation cost is measured at the grant date based on the value of the award and is recognized over the service period, which is usually the vesting period. However, it also permitted an entity to continue to measure compensation cost for those plans using the intrinsic value based method of accounting prescribed by Accounting Principles Board Opinion No. 25, “Accounting for Stock Issued to Employees,” whereby compensation cost is the excess, if any, of the quoted market price of the stock at the grant date (or other measurement date) over the amount an employee must pay to acquire the stock. Prior to 2006, the Company applied the accounting methodology in Opinion No. 25 with respect to outstanding stock options. Note J below provides pro forma disclosures of net income and earnings per share and other disclosures as if the fair value based method of accounting had been applied prior to 2006.
In December 2004, the FASB issued SFAS No. 123 (revised 2004), “Share-Based Payment” (SFAS No. 123(R)). This statement is a revision to SFAS No. 123 and supersedes APB Opinion No. 25. This statement eliminated the alternative to use APB Opinion No. 25’s intrinsic value method of accounting that was allowed under SFAS No. 123 as originally issued. As a result, a public entity is required to measure the cost of employee services received in exchange for an award of equity based instruments based on the grant-date fair value of the award and to recognize the cost over the period during which an employee is required to provide service in exchange for the award. In March 2005, the Securities and Exchange Commission (SEC) issued Staff Accounting Bulletin No. 107 (SAB 107) which expressed the views of the staff regarding the interaction between SFAS 123(R) and certain SEC rules and regulations and the valuation of share based payment arrangements for public companies. SAB 107 provided that the effective date for implementation of SFAS 123(R) was the first fiscal year beginning on or after June 15, 2005. The Company applied the principals set forth in SFAS 123(R) for the 2006 fiscal year. Note J below sets forth information regarding the Company’s application of SFAS 123(R) with respect to stock options outstanding in 2006.
Comprehensive Income
Accounting principles generally require that recognized revenue, expenses, gains and losses be included in net income. Although certain changes in assets and liabilities, such as unrealized gains and losses on available-for-sale securities, are reported as a separate component of the equity section of the balance sheet, such items, along with net income, are components of comprehensive income.
Recent Accounting Pronouncements
In November of 2005, the FASB issued combined FASB Staff Positions (FSP) Nos. FAS 115-1 and FAS 124-1, “The Meaning of Other-Than-Temporary Impairment and Its Application to Certain Investments.” The FSP addresses the determination as to when an investment is considered impaired, whether that impairment is other than temporary, and the measurement of an impairment loss. This FSP includes accounting considerations subsequent to the recognition of an other-than-temporary impairment and addresses disclosure requirements about unrealized losses that have not been recognized as other-than-temporary impairments. This pronouncement is effective for reporting periods beginning after December 15, 2005. The disclosure requirements of this pronouncement are included in these financial statements as of December 31, 2006.
In December 2004, the FASB issued SFAS No. 123 (revised 2004), “Share-Based Payment.” This statement replaced SFAS No. 123, “Accounting for Stock-Based Compensation.” Information about the more significant provisions of SFAS No. 123R, including effective dates, is presented in the earlier section on “Stock Compensation Plans.”
NOTE A. SUMMARY OF SIGNIFICANT ACCOUNTING POLICIES (Continued)
Reclassifications
Certain reclassifications have been made to the 2005 and 2004 consolidated financial statements in order to conform to the classifications adopted for reporting in 2006.
NOTE B. INVESTMENT SECURITIES
The amortized cost and approximate market value of investment securities classified as held-to-maturity at December 31, 2006, are summarized as follows:
| | | | | Gross | | Gross | | | |
| | | Amortized | | Unrealized | | Unrealized | | Fair | |
| | | Cost | | Gains | | Losses | | Value | |
| Obligations of State and | | | | | | | | | | | | | |
| Political Subdivisions | | $ | 36,175,580 | | $ | 1,008,011 | | $ | (76,999 | ) | $ | 37,106,592 | |
| | | | | | | | | | | | | | |
| Mortgage-Backed Securities | | | 2,435,340 | | | 2,005 | | | (18,442 | ) | | 2,418,903 | |
| | | $ | 38,610,920 | | $ | 1,010,016 | | $ | (95,441 | ) | $ | 39,525,495 | |
The amortized cost and approximate market value of investment securities classified as available-for-sale at December 31, 2006, are summarized as follows:
| | | | | Gross | | Gross | | | |
| | | Amortized | | Unrealized | | Unrealized | | Fair | |
| | | Cost | | Gains | | Losses | | Value | |
| | | | | | | | | | |
| Mortgage-Backed Securities | | $ | 59,083,551 | | $ | 35,224 | | $ | (1,138,712 | ) | $ | 57,980,063 | |
| Agency Obligations | | | 6,496,959 | | | - | | | (57,594 | ) | | 6,439,365 | |
| | | $ | 65,580,510 | | $ | 35,224 | | $ | (1,196,306 | ) | $ | 64,419,428 | |
The amortized cost and approximate market value of investment securities classified as held-to-maturity at December 31, 2005, are summarized as follows:
| | | | | Gross | | Gross | | | |
| | | Amortized | | Unrealized | | Unrealized | | Fair | |
| | | Cost | | Gains | | Losses | | Value | |
| | | | | | | | | | |
| Obligations of State and | | | | | | | | | | | | | |
| Political Subdivisions | | $ | 34,904,765 | | $ | 1,125,045 | | $ | (81,676 | ) | $ | 35,948,134 | |
| Mortgage-Backed Securities | | | 3,089,278 | | | 8,139 | | | (29,698) (29,698 | ) | | 3,067,719 | |
| | | $ | 37,994,043 | | $ | 1,133,184 | | $ | (111,374 | ) | $ | 39,015,853 | |
NOTE B. INVESTMENT SECURITIES (Continued)
The amortized cost and approximate market value of investment securities classified as available-for-sale at December 31, 2005, are summarized as follows:
| | | | | Gross | | Gross | | | |
| | | Amortized | | Unrealized | | Unrealized | | Fair | |
| | | Cost | | Gains | | Losses | | Value | |
| | | | | | | | | | | | | | |
| Mortgage-Backed Securities | | $ | 73,407,065 | | $ | 170,203 | | $ | (1,692,906 | ) | $ | 71,884,362 | |
| Agency Obligations | | | 6,495,545 | | | - | | | (92,895 | ) | | 6,402,650 | |
| | | $ | 79,902,610 | | $ | 170,203 | | $ | (1,785,801 | ) | $ | 78,287,012 | |
The aggregate fair values and aggregate unrealized losses on securities whose fair values were below book values as of December 31, 2006, are summarized below. Due to the nature of the investment and current market prices, these unrealized losses are considered a temporary impairment of the securities. As of December 31, 2006, there were six securities included in held-to-maturity and twenty nine securities included in available-for-sale.
| | | Less than 12 Months | | 12 Months or More | | Total | |
| | | Fair | | Unrealized | | Fair | | Unrealized | | Fair | | Unrealized | |
| | | Value | | Loss | | Value | | Loss | | Value | | Loss | |
Held-to-Maturity: | | | | | | | | | | | | | | | | | | | |
| Obligations of | | | | | | | | | | | | | | | | | | | |
| State and Political | | | | | | | | | | | | | | | | | | | |
| Subdivisions (5) | | $ | 1,433,200 | | $ | (30,881 | ) | $ | 955,936 | | $ | (46,118 | ) | $ | 2,389,136 | | $ | (76,999 | ) |
| Mortgaged-backed | | | | | | | | | | | | | | | | | | | |
| Securities (1) | | | - | | | - | | | 1,744,972 | | | (18,442 | ) | | 1,744,972 | | | (18,442 | ) |
| | | $ | 1,433,200 | | $ | (30,881 | ) | $ | 2,700,908 | | $ | (64,560 | ) | $ | 4,134,108 | | $ | (95,441 | ) |
| | | | | | | | | | | | | | | | | | | | |
Available for Sale: | | | | | | | | | | | | | | | | | | | |
| Mortgaged-backed | | | | | | | | | | | | | | | | | | | |
| Securities (26) | | $ | 1,756,255 | | $ | (18,286 | ) | $ | 50,035,263 | | $ | (1,120,425 | ) | $ | 51,791,518 | | $ | (1,138,711 | ) |
| Agency Obligations (3) | | | - | | | - | | | 6,439,365 | | | (57,594 | ) | | 6,439,365 | | | (57,594 | ) |
| | | $ | 1,756,255 | | $ | (18,286 | ) | $ | 56,474,628 | | $ | (1,178,019 | ) | $ | 58,230,883 | | $ | (1,196,305 | ) |
NOTE B. INVESTMENT SECURITIES (Continued)
The aggregate fair values and aggregate unrealized losses on securities whose fair values were below book values as of December 31, 2005, are summarized below. Due to the nature of the investment and current market prices, these unrealized losses are considered a temporary impairment of the securities. As of December 31, 2005, there were eight securities included in held-to-maturity and thirty six securities included in available-for-sale.
| | | Less than 12 Months | | 12 Months or More | | Total | |
| | | Fair | | Unrealized | | Fair | | Unrealized | | Fair | | Unrealized | |
| | | Value | | Loss | | Value | | Loss | | Value | | Loss | |
Held-to-Maturity: | | | | | | | | | | | | | | | | | | | |
| Obligations of | | | | | | | | | | | | | | | | | | | |
| State and Political | | | | | | | | | | | | | | | | | | | |
| Subdivisions (7) | | $ | 802,424 | | $ | (15,240 | ) | $ | 935,988 | | $ | (66,435 | ) | $ | 1,738,412 | | $ | (81,675 | ) |
| Mortgaged-backed | | | | | | | | | | | | | | | | | | | |
| Securities (1) | | | 2,180,195 | | | (29,698 | ) | | - | | | - | | | 2,180,195 | | | (29,698 | ) |
| | | $ | 2,982,619 | | $ | (44,938 | ) | $ | 935,988 | | $ | (66,435 | ) | $ | 3,918,607 | | $ | (111,373 | ) |
| | | | | | | | | | | | | | | | | | | | |
Available for Sale: | | | | | | | | | | | | | | | | | | | |
| Agency Obligations (3) | | $ | 6,402,650 | | $ | (92,895 | ) | $ | - | | $ | - | | $ | 6,402,650 | | $ | (92,895 | ) |
| Mortgaged-backed | | | | | | | | | | | | | | | | | | | |
| Securities (33) | | | 46,386,361 | | | (982,002 | ) | | 18,643,555 | | | (710,904 | ) | | 65,029,916 | | | (1,692,906 | ) |
| | | $ | 52,789,011 | | $ | (1,074,897 | ) | $ | 18,643,555 | | $ | (710,904 | ) | $ | 71,432,566 | | $ | (1,785,801 | ) |
The unrealized losses in the Company's investment portfolio, caused by interest rate increases, are not credit issues and are deemed to be tempoary. Cash flows from the mortgage-backed securities are guaranteed by the full faith and credit of the United States or by an agency of the United States government. The Company also has the ability and intent to hold these securities until maturity and thus is not required to record any loss on the securities.
Equity securities at December 31, 2006 and 2005, include the following: Federal Home Loan Bank stock of $3,515,200 and $4,677,200 for 2006 and 2005, respectively; Federal Reserve Bank stock of $521,700 for 2006 and 2005; First National Bankers Bank stock in the amount of $47,800 for 2006 and 2005; a $100,000 investment in ECD Investments, LLC for both years; and a $155,000 investment in B&K Statutory Trust for both years. Redemptions of stock in the Federal Home Loan Bank during 2006 and 2005 were $1,354,200 and $603,000, respectively. The Federal Home Loan Bank, Federal Reserve Bank and First National Bankers Bank stocks are considered restricted stock as only banks, which are members of these organizations, may acquire or redeem them. The stock is redeemable at its face value; therefore, there are no gross unrealized gains or losses associated with these investments.
NOTE B. INVESTMENT SECURITIES (Continued)
The Company invested $1 million during 1998 and $250,000 during 2001 in Sumx, Inc. (“Sumx”), a Mississippi corporation established to provide electronic banking solutions for the financial industry. During the second quarter of 2002, the Company’s $1,250,000 investment in, and advances in the amount of approximately $711 thousand to Sumx were written off and reflected in other expense/income due to the uncertainty regarding Sumx’s future prospects. On December 31, 2004, the Company divested itself of its equity interest in Sumx by selling its shares in Sumx to Sumx for $20,000. In connection with this sale, the Company and Sumx entered into a 5 year non-exclusive license to use the Sumx Internet banking software at no charge. The Company agreed to cancel and forgive all indebtedness, obligations and encumbrances of any kind to Sumx. During 2006, the Company decided to discontinue using this software and began using the Phoenix internet banking software provided by Harland Financial, its core accounting processor.
Investment securities carried at approximately $56,217,000 (approximate market value $56,600,000) at December 31, 2006, and approximately $52,781,000 (approximate market value $53,404,000) at December 31, 2005, were pledged to collateralize public deposits and for other purposes as required or permitted by law or agreement.
The amortized cost and approximate market value of investment debt securities at December 31, 2006, by contractual maturity (including mortgage-backed securities), are shown below. Actual maturities will differ from contractual maturities because borrowers may have the right to call or prepay obligations with or without call or prepayment penalties.
| | | Securities held-to-maturity | |
| | | Weighted | | | | | |
| | | Average | | Amortized | | Market | |
| | | Yield | | Cost | | Value | |
| | | | | | | | |
| Due in One Year or Less | | | 5.694 | % | $ | 502,693 | | $ | 505,643 | |
| Due After One Year through Five Years | | | 6.683 | % | | 2,669,288 | | | 2,730,952 | |
| Due After Five Years through Ten Years | | | 6.709 | % | | 20,195,912 | | | 20,697,533 | |
| Due After Ten Years | | | 6.802 | % | | 15,243,027 | | | 15,591,367 | |
| | | | | | | | | | | |
| | | | 6.734 | % | $ | 38,610,920 | | $ | 39,525,495 | |
| | | | | | | | | | | |
| | | | | | | | | | | |
| | Securities available-for-sale |
| | | Weighted | | | | | | | |
| | | Average | | | Amortized | | | Market | |
| | | Yield | | | Cost | | | Value | |
| | | | | | | | | | | |
| Due in One Year or Less | | | 3.972 | % | $ | 5,491,106 | | $ | 5,449,400 | |
| Due After One Year through Five Years | | | 4.020 | % | | 3,179,457 | | | 3,133,185 | |
| Due After Five Years through Ten Years | | | 4.310 | % | | 35,833,552 | | | 35,002,585 | |
| Due After Ten Years | | | 4.943 | % | | 21,076,395 | | | 20,834,258 | |
| | | | | | | | | | | |
| | | | 4.472 | % | $ | 65,580,510 | | $ | 64,419,428 | |
| | | | | | | | | | | |
NOTE C. LOANS
The Bank’s loan portfolio (rounded to the nearest thousand) at December 31, 2006 and 2005, consists of the following:
| | | 2006 | | 2005 | |
| | | | | | |
| Commercial, Financial and Agricultural | | $ | 28,385,000 | | $ | 32,868,000 | |
| Real Estate-Construction | | | 44,592,000 | | | 30,069,000 | |
| Real Estate-Mortgage | | | 159,729,000 | | | 169,363,000 | |
| Installment | | | 10,680,000 | | | 12,478,000 | |
| Overdrafts | | | 203,000 | | | 306,000 | |
| | | | | | | | |
| Total loans | | $ | 243,589,000 | | $ | 245,084,000 | |
| | | | | | | | |
Loans on which accrual of interest has been discontinued or reduced were approximately $1,193,000 and $1,059,000 at December 31, 2006, and 2005, respectively. If interest on such loans had been accrued, the income would have approximated $31,000 in 2006, $24,000 in 2005, and $38,000 in 2004. At December 31, 2006 and 2005, the recorded investment in loans that were considered to be impaired was approximately $1,192,901 and $1,058,750, respectively, substantially all of which were on a non-accrual basis. The related allowance amount on impaired loans at December 31, 2006, was approximately $388 thousand compared to $247 thousand at December 31, 2005. Loans which are contractually 90 days or more past due as of December 31, 2006 and 2005, were approximately $232,292 and $201,301, respectively.
In the ordinary course of business, the Bank makes loans to its executive officers, principal stockholders, directors and to companies in which these borrowers are principal owners. Loans outstanding to such borrowers (including companies in which they are principal owners) amounted to $3,255,659 and $2,807,745 at December 31, 2006 and 2005, respectively. These loans were made on substantially the same terms, including interest rate and collateral, as those prevailing at the time for comparable transactions with other persons and did not involve more than normal risk of collectibility or present other unfavorable features.
The aggregate amount of loans to such related parties for 2006 and 2005 is as follows:
| | | 2006 | | 2005 | |
| Balance at January 1 | | $ | 2,807,745 | | $ | 2,391,668 | |
| New Loans | | | 1,732,202 | | | 1,812,367 | |
| Repayments | | | (1,284,288 | ) | | (1,396,290 | ) |
| Balance at December 31 | | $ | 3,255,659 | | $ | 2,807,745 | |
NOTE D. ALLOWANCE FOR LOAN LOSSES
An analysis of the allowance for loan losses is as follows:
| | | 2006 | | 2005 | | 2004 | |
Balance at January 1 | | $ | 2,377,840 | | $ | 2,236,778 | | $ | 2,070,162 | |
| Credits charged off: | | | | | | | | | | |
| Real Estate - Mortgage | | | (7,501 | ) | | (149,502 | ) | | (113,888 | ) |
| Commercial, Financial and Agricultural | | | (570,717 | ) | | (53,960 | ) | | (107,208 | ) |
| Installment Loans | | | (64,488 | ) | | (47,187 | ) | | (46,738 | ) |
| Total Charge-Offs | | | (642,706 | ) | | (250,649 | ) | | (267,834 | ) |
| Recoveries: | | | | | | | | | | |
| Real Estate - Mortgage | | | 77,198 | | | 35,225 | | | 4,256 | |
| Commercial, Financial and Agricultural | | | 25,991 | | | 22,520 | | | 23,032 | |
| Installment Loans | | | 31,111 | | | 33,966 | | | 17,162 | |
| Total Recoveries | | | 134,300 | | | 91,711 | | | 44,450 | |
| Net Credits Charged Off | | | (508,406 | ) | | (158,938 | ) | | (223,384 | ) |
| Provision for Loan Losses | | | 475,000 | | | 300,000 | | | 390,000 | |
Balance at December 31 | | $ | 2,344,434 | | $ | 2,377,840 | | $ | 2,236,778 | |
NOTE E. LOAN SERVICING
Loans serviced for others are not included in the accompanying consolidated balance sheets. The unpaid principal balances of these loans were approximately $12,830,831, $11,274,712 and $9,740,772 in 2006, 2005 and 2004, respectively.
NOTE F. BANK PREMISES AND EQUIPMENT
A summary of Bank premises and equipment is as follows:
| | | 2006 | | 2005 | |
| Buildings and Improvements | | $ | 7,327,873 | | $ | 7,292,935 | |
| Furniture and Equipment | | | 5,227,504 | | | 4,783,170 | |
| | | | 12,555,377 | | | 12,076,105 | |
| Less: Accumulated Depreciation | | | (5,950,652 | ) | | (5,152,431 | ) |
| Land | | | 1,114,553 | | | 1,122,994 | |
| Bank Premises and Equipment, Net | | $ | 7,719,278 | | $ | 8,046,668 | |
The provision for depreciation charged to operating expenses was $798,221, $824,447 and $727,564 for the years ended December 31, 2006, 2005 and 2004, respectively.
NOTE G. TRUST DEPARTMENT ASSETS
Property (other than cash deposits) held by the Bank in fiduciary or agency capacities for its customers is not included in the accompanying consolidated balance sheets as such items are not assets of the Bank. Trust fees are reported on the cash basis. The difference between cash basis and the accrual basis is immaterial.
The Company has entered into a Trust Services Agreement with National Independent Trust Company, a national banking association, d/b/a Argent Trust Company, headquartered in Ruston, Louisiana. Effective January 1, 2007, Argent Trust Company assumed all responsibilities associated with trust services, having been duly appointed successor trustee for all trust accounts. Argent Trust Company shall perform certain fiduciary services for customers transferred from and referred by Britton & Koontz Bank, N.A. to Argent Trust Company. In return Britton & Koontz Bank, N.A. shall receive a specified percentage of fee income paid to Argent Trust Company by those customers
NOTE H. DEPOSITS
Deposits at December 31, 2006 and 2005, consisted of the following:
| | | 2006 | | 2005 | |
| Non-Interest Bearing Demand Deposits | | $ | 50,345,279 | | $ | 51,466,230 | |
| NOW Accounts | | | 24,555,009 | | | 23,016,487 | |
| Money Market Deposit Accounts | | | 37,101,457 | | | 36,516,395 | |
| Savings Accounts | | | 18,082,839 | | | 23,032,910 | |
| Certificates of Deposit | | | 123,672,691 | | | 123,344,888 | |
| | | $ | 253,757,275 | | $ | 257,376,910 | |
Maturities of certificates of deposit of $100,000 or more outstanding at December 31, 2006 and 2005, are summarized as follows:
| | | 2006 | | 2005 | |
| Time Remaining Until Maturity: | | | | | | | |
| Three Months or Less | | $ | 11,261,017 | | $ | 10,061,668 | |
| Over Three Through Six Months | | | 15,290,171 | | | 11,198,948 | |
| Over Six Through Twelve Months | | | 26,185,733 | | | 21,735,701 | |
| Over Twelve Months | | | 9,647,050 | | | 15,523,648 | |
| | | $ | 62,383,971 | | $ | 58,519,965 | |
NOTE H. DEPOSITS (Continued)
The approximate scheduled maturities of certificates of deposits for each of the next five years are:
| 2007 | | $ | 106,230,771 | |
| 2008 | | | 11,242,316 | |
| 2009 | | | 4,877,830 | |
| 2010 | | | 921,634 | |
| 2011 | | | 400,140 | |
| | | $ | 123,672,691 | |
Interest expense on certificates of deposit greater than $100,000 was approximately $2,486,000, $1,647,000 and $1,211,000 for the years ended December 31, 2006, 2005 and 2004, respectively.
The public fund deposits were $31,160,342 and $29,041,518 at December 31, 2006 and 2005, respectively.
NOTE I. BORROWINGS
Federal Home Loan Bank Advances:
During 2006 and 2005, the Bank received advances from and remitted payments to the Federal Home Loan Bank. These advances are collateralized by a portion of the Bank's one-to-four family residential mortgage portfolio, certain secured commercial loans and certain investment securities in accordance with the Advance Security and Collateral Agreement with the Federal Home Loan Bank. The following provides information regarding outstanding Federal Home Loan Bank advances:
Advances outstanding at December 31, 2006, consist of:
Two fixed-rate term loans totaling $6,000,000 with interest rates of 3.619% and 3.762%, respectively. The maturities on these loans are May 30, 2007 and November 30, 2007, respectively.
Five amortizable fixed-rate loans totaling $9,607,972 with interest rates ranging from 2.377% to 4.177%. The maturities on these loans range from January 2, 2007, to June 1, 2009.
Three variable-rate loans, tied to 3 month Libor, totaling $30,000,000 with interest rates, including margins and adjusting quarterly, ranging from 4.37% to 5.564% and caps established at the strike price of 4.00%, 4.50% and 5.50%. The maturities on these loans range from October 18, 2007, to August 15, 2008.
One overnight advance in the amount of $20,060,000 with an interest rate of 5.44%.
Advances outstanding at December 31, 2005, consist of:
Ten fixed-rate term loans ranging from $2,000,000 to $6,000,000, totaling $31,000,000 with interest rates ranging from 2.060% to 5.157%. The maturities on these loans range from May 12, 2006 to November 30, 2007.
NOTE I. BORROWINGS (Continued)
Five amortizable fixed-rate loans totaling $16,886,067 with interest rates ranging from 2.377% to 4.177%. The maturities on these loans range from January 2, 2007, to June 1, 2009.
Two variable-rate loans, tied to 3 month Libor, totaling $25,000,000 with interest rates, adjusting quarterly, of 4.37% and 4.524%, respectively, and caps established at the strike price of 4.00% and 4.50%, respectively. The maturities on these loans are October 18, 2007 and February 4, 2008, respectively.
One overnight advance in the amount of $11,310,000 with an interest rate of 4.35%.
Annual maturities for the next three years as of December 31, 2006 are as follows:
| 2007 | | $ | 31,243,868 | |
| 2008 | | | 30,487,211 | |
| 2009 | | | 3,936,893 | |
| | | $ | 65,667,972 | |
Junior Subordinated Debentures:
In 2003, the Company issued $5,000,000 of junior subordinated debentures. The $5,000,000 of trust preferred securities qualifies as Tier 1 capital for regulatory capital purposes but is classified as a liability under accounting principles generally accepted in the United States of America. These securities carry an interest rate of LIBOR + 3.15%, adjusted quarterly, with interest paid quarterly in arrears and mature in March, 2033. Under certain circumstances, these securities are subject to repayment on March 26, 2008, or thereafter.
NOTE J. EMPLOYEE BENEFIT PLANS
The Bank has an employee stock ownership plan which is designed to invest primarily in employer stock. Essentially, all employees of the Bank with one year of service and who are at least 21 years old are covered under this plan, and are fully vested in their benefits after seven years of service. Employer contributions are determined by the Board of Directors each year and are allocated among participants on the basis of their total annual compensation. Dividends on the Company stock owned by the plan are recorded as a reduction of retained earnings. Operating expenses include contributions to the plan of $0, $0 and $96,960 in 2006, 2005 and 2004, respectively. This plan owned 89,733 and 158,630 allocated shares of Britton & Koontz Capital Corporation stock, as of December 31, 2006 and 2005.
The overall cost to the plan for the years ended December 31, 2006, 2005 and 2004, was $8.00, $7.73 and $6.58 per share, respectively.
Employees age 21 and older are eligible to participate in a 401(k) plan established by the Bank. Under this plan, employees may contribute a percentage of their salaries subject to certain limits based on federal tax laws. These contributions are immediately vested. Employer matching contributions are 100% vested after six years. Employer profit sharing contributions are 100% vested after seven years.
NOTE J. EMPLOYEE BENEFIT PLANS (Continued)
Employer contributions to the plan are made at the discretion of the Board of Directors and aggregated $123,816, $114,077 and $73,040 for the years ended December 31, 2006, 2005 and 2004, respectively.
The Company maintains a long-term incentive plan in which all employees of the Company and its subsidiaries are eligible to participate. Under the terms of the plan, however, no grants or awards can be made after May 16, 2006. Thus, no grants or awards have been made since that date. The plan will remain in effect until all grants and awards under the plan have been satisfied by the issuance of common stock or forfeited or have expired and all restrictions imposed on shares of common stock issued under the plan have lapsed. The plan is administered by a Committee of at least two non-employee directors appointed by the full Board of Directors. From the adoption of the plan until May 16, 2006, the Company granted options to purchase a total of 102,124 shares. Unless earlier forfeited, options expire ten years from the date of grant. Options to acquire 19,604 shares were exercisable as of December 31, 2006. The summary of stock option activity is shown below:
| | | | | Weighted | |
| | | Options | | Average | |
| | | Outstanding | | Exercise Price | |
December 31, 2003 Options granted Options exercised Options forfeited | | | 53,229 - (3,229 (15,000 | ) ) | | 17.38 - 11.39 19.94 | |
December 31, 2004 | | | 35,000 | | $ | 16.83 | |
| Options granted | | | 5,000 | | | 18.00 | |
| Options exercised | | | - | | | - | |
| Options forfeited | | | (4,480 | ) | | 14.50 | |
December 31, 2005 | | | 35,520 | | $ | 17.29 | |
| Options granted | | | - | | | - | |
| Options exercised | | | (1,650 | ) | | 14.50 | |
| Options forfeited | | | (5,500 | ) | | 16.97 | |
December 31, 2006 | | | 28,370 | | $ | 17.51 | |
The following table summarizes information about stock options outstanding at December 31, 2006:
| Exercise Price | | Options Outstanding | | Remaining Contractual Life | |
| $ 19.94 | | | 12,500 | | | 0.9 years | |
| $ 14.50 | | | 10,870 | | | 4.9 years | |
| $ 18.00 | | | 5,000 | | | 4.0 years | |
NOTE J. EMPLOYEE BENEFIT PLANS (Continued)
The Company applied APB Opinion 25 and related Interpretations in accounting for the stock options prior to 2006. Accordingly, no compensation cost was recognized. Had compensation cost for the Company’s stock options been determined based on the fair value at the grant dates consistent with the method prescribed by SFAS 123, the Company’s net income and earnings per share for 2005 and 2004 would have been adjusted to the pro forma amounts indicated below:
| | | 2005 | | 2004 | |
| | | | | | |
| Net Income, as Reported | | $ | 3,227,640 | | $ | 2,844,209 | |
| Pro Forma Net Income | | $ | 3,215,915 | | $ | 2,837,413 | |
| Basic Earnings Per Share, as Reported | | $ | 1.53 | | $ | 1.35 | |
| Pro Forma Basic Earnings Per Share | | $ | 1.52 | | $ | 1.34 | |
| Diluted Earnings Per Share, as Reported | | $ | 1.52 | | $ | 1.34 | |
| Pro Forma Diluted Earnings Per Share | | $ | 1.52 | | $ | 1.34 | |
The fair value of each option is estimated on the grant date using the Black-Scholes option pricing model. The following assumptions were made in estimating fair values in 2005. No options were granted in either 2006 or 2004.
| Assumption | | 2005 | |
| | | | |
| Dividend yield | | | 3.59 | % |
| Risk free rate | | | 4.42 | % |
| Expected life | | | 5 years | |
| Expected volatility | | | 27.59 | % |
SFAS 123R requires measurement for share-based transactions at the fair value of the equity instrument issued. The Company adopted this pronouncement effective as of January 1, 2006. Net income for the year was reduced by $10 thousand after tax due to valuing stock options for the year ended December 31, 2006. The Company has addressed the future application of this pronouncement and does not consider its potential impact to be significant.
The Bank maintains a salary continuation agreement with its chief executive officer. The agreement is intended to provide equal annual benefits for a period of 15 years following the chief executive’s retirement on or after his attainment of age 65. The amount of the benefits is fixed and is based, in part, upon the anticipated cash value of the company’s individual life insurance policy purchased to fund the agreement. One-half of the chief executive’s retirement benefit vested upon his attainment of age 55; the remaining benefit will fully vest upon his attainment of age 62. In addition to normal retirement benefits, the agreement provides for death, disability and early retirement benefits. The agreement also includes a change of control benefit, which is payable if the chief executive’s employment is terminated, other than for death or disability, during the 36-month period following a sale or acquisition of the Bank. The amount of the benefit is equal to the greater of a fixed dollar amount or the amount accrued under the agreement’s benefit schedule; the benefit is payable in the form of a single sum within 90 days of the chief executive’s termination date. The Bank is also currently paying benefits to a retired executive officer pursuant to a salary continuation agreement the Bank had entered into with such executive officer prior to his retirement. The terms of this salary continuation agreement are substantially the same as described above. The financial statements for the years ended December 31, 2006, 2005 and 2004, respectively; include $33,478 and $42,982 and $24,883 of expense, consisting of monthly accruals determined by the salary continuation vesting schedule and the payment of benefits to the retired executive officer.
NOTE K. LEASES
The Bank leases one branch office as well as parking space under operating leases which expire in various years through 2014. Rent expense was $103,277, $124,577 and $148,402 in 2006, 2005 and 2004, respectively.
The future minimum rental commitments for these leases at December 31, 2006, are as follows:
| 2007 | | $ | 105,792 | |
| 2008 | | | 105,792 | |
| 2009 | | | 105,792 | |
| 2010 | | | 105,792 | |
| 2011 | | | 105,792 | |
| Thereafter | | | 203,136 | |
| | | $ | 732,096 | |
NOTE L. INCOME TAXES
The provision/(benefit) for income taxes included in the consolidated statements of income is as follows for the years ended December 31, 2006, 2005 and 2004:
| | | 2006 | | 2005 | | 2004 | |
| | | | | | | | |
| Current | | $ | 1,308,927 | | $ | 1,079,614 | | $ | 676,227 | |
| Deferred | | | (114,945 | ) | | (264,520 | ) | | 104,018 | |
| | | | | | | | | | | |
| | | $ | 1,193,982 | | $ | 815,094 | | $ | 780,245 | |
The provision for federal income taxes differs from that computed by applying the federal statutory rate of 34% in 2006, 2005 and 2004 as indicated in the following analysis:
| | | 2006 | | 2005 | | 2004 | |
| | | | | | | | |
| Tax Based on Statutory Rate | | $ | 1,622,672 | | $ | 1,374,530 | | $ | 1,232,314 | |
| State Taxes | | | 108,971 | | | 98,051 | | | 108,211 | |
| Effect of Tax-Exempt Income | | | (565,412 | ) | | (565,456 | ) | | (569,345 | ) |
| Other | | | 27,751 | | | (92,031 | ) | | 9,065 | |
| | | | | | | | | | | |
| | | $ | 1,193,982 | | $ | 815,094 | | $ | 780,245 | |
NOTE L. INCOME TAXES (Continued)
The net deferred tax assets of $9,620 in 2006 and $35,974 in 2005 are included in other assets and net deferred liabilities of $1,024,406 in 2004 is included in accrued taxes and other liabilities. The net deferred tax asset and liabilities consist of the following components at December 31, 2006, 2005 and 2004:
| | | 2006 | | 2005 | | 2004 | |
| Deferred Tax Liabilities: | | | | | | | |
| Unrealized gain on available-for-sale securities | | $ | - | | $ | - | | $ | (327,694 | ) |
| Unrealized gain on derivatives | | | - | | | (155 | ) | | (56,770 | ) |
| Depreciation | | | (978,128 | ) | | (992,514 | ) | | (1,019,448 | ) |
| Federal Home Loan Bank dividends | | | (271,687 | ) | | (335,975 | ) | | (309,575 | ) |
| Other | | | (6,869 | ) | | (191,067 | ) | | (122,031 | ) |
| | | | (1,256,685 | ) | | (1,519,711 | ) | | (1,835,518 | ) |
| Deferred Tax Assets: | | | | | | | | | | |
| Unrealized Loss on available-for-sale securities | | | 433,083 | | | 602,618 | | | - | |
| Unrealized gain on derivatives | | | 28,080 | | | - | | | - | |
| Provision for loan losses | | | 584,673 | | | 597,133 | | | 544,517 | |
| Other real estate | | | 19,463 | | | 11,190 | | | 44,760 | |
| Voluntary severance | | | 35,293 | | | 171,770 | | | - | |
| Other | | | 165,713 | | | 172,974 | | | 221,835 | |
| | | | 1,266,305 | | | 1,555,685 | | | 811,112 | |
| Net Deferred Tax Asset/(Liability) | | $ | 9,620 | | $ | 35,974 | | $ | (1,024,406 | ) |
A summary of the changes in the net deferred tax asset (liability) for the years ended December 31, 2006, 2005 and 2004, is as follows:
| | | 2006 | | 2005 | | 2004 | |
| Balance at beginning of year | | $ | 35,974 | | $ | (1,024,406 | ) | $ | (1,204,554 | ) |
| Deferred tax expense, charged to operations | | | 114,945 | | | 264,520 | | | (104,018 | ) |
| Other comprehensive income, charged to | | | | | | | | | | |
| equity | | | (141,299 | ) | | 795,860 | | | 284,166 | |
| Balance at end of year | | $ | 9,620 | | $ | 35,974 | | $ | (1,024,406 | ) |
NOTE M. SECURITIES SOLD UNDER REPURCHASE AGREEMENTS
At December 31, 2006 and 2005, the Bank had sold various investment securities with an agreement to repurchase these securities at various times within one year. The underlying securities are U.S. Government obligations and obligations of other U.S. Government agencies and corporations. These securities generally remain under the Bank's control and are included in investment securities. These securities have coupon rates ranging from 3.287% to 6.00% and maturity dates ranging from 2012 to 2034. The related liability to repurchase these securities, included in securities sold under repurchase agreements, was $8,149,016 and $8,032,721 at December 31, 2006 and 2005, respectively. The maximum amount of outstanding agreements at any month-end was $15,017,677 and $8,932,200 during 2006 and 2005, respectively. The monthly average amount of outstanding agreements was $9,222,316 and $7,527,541 during 2006 and 2005, respectively. At December 31, 2006, the securities underlying the repurchase agreements had as approximate amortized cost of $15,408,000 and an approximate market value of $15,058,000.
NOTE N. REGULATORY MATTERS
The primary source of revenue of Britton & Koontz Capital Corporation is dividends from its subsidiary, Britton & Koontz Bank, N.A. Federal banking regulations place certain restrictions on dividends paid and loans or advances made by the Bank to the Company. Any such distribution is subject to the requirements described in the following paragraphs.
In accordance with Office of Thrift Supervision regulations, a special "Liquidation Account" has been established for the benefit of certain Qualifying Depositors of Natchez First Federal Savings Bank (acquired by the Bank in 1993) in an initial amount of approximately $2.8 million. The Liquidation Account serves as a restriction on the distribution of stockholders' equity in the Bank and no cash dividend may be paid on its capital stock if the effect thereof would be to cause the regulatory capital of the Bank to be reduced below an amount equal to the adjusted Liquidation Account balance.
In the event of a complete liquidation of the Bank, each Qualifying Depositor would be entitled to his or her pro rata interest in the Liquidation Account. Such claims would be paid before payment to Britton & Koontz Capital Corporation as the Bank’s sole shareholder. A merger, consolidation, purchase of assets and assumption of deposits and/or other liabilities or similar transaction, with an FDIC-insured institution, would not be a complete liquidation for the purpose of paying the Liquidation Account. In such a transaction, the Liquidation Account would be required to be assumed by the surviving institution.
The Company and the Bank are subject to various regulatory capital requirements administered by federal banking agencies. Failure to meet minimum capital requirements can initiate certain mandatory and possibly additional discretionary actions by regulators that, if undertaken, could have a direct material effect on the Company’s and Bank’s financial statements. Under capital adequacy guidelines and the regulatory framework for prompt corrective action, the Company and the Bank must meet specific capital guidelines that involve quantitative measures of their assets, liabilities, and certain off-balance-sheet items as calculated under regulatory accounting practices. The capital amounts and classification are also subject to qualitative judgments by the regulators about components, risk weightings, and other factors. Prompt corrective action provisions are not applicable to bank holding companies.
Quantitative measures established by regulation to ensure capital adequacy require the Company and the Bank to maintain minimum amounts and ratios (set forth in the table below) of total capital and Tier I capital to risk-weighted assets and of Tier I capital to average assets. Management believes, as of December 31, 2006 and 2005, that the Company and the Bank meet all capital adequacy requirements to which they are subject.
The most recent regulatory notification categorized the Bank as well capitalized under the regulatory capital framework for prompt corrective action. There are no conditions or events since that notification that management believes have changed the Bank's category.
The Company’s (consolidated) and the Bank's actual capital amounts and ratios as of December 31, 2006 and 2005, are presented in the following table.
NOTE N. REGULATORY MATTERS (Continued)
| | | Actual | | Minimum Capital Requirement | | Minimum To Be Well Capitalized Under Prompt Corrective Action Provisions | |
| | | Amount | | Ratio | | Amount | | Ratio | | Amount | | Ratio | |
| | | (dollars in thousands) | |
As of December 31, 2006 | | | | | | | | | | | | | |
| Total Capital (to Risk- | | | | | | | | | | | | | | | | | | | |
| Weighted Assets) | | | | | | | | | | | | | | | | | | | |
| Consolidated | | $ | 40,943 | | | 15.27 | % | $ | 21,448 | | | 8.00 | % | | N/A | | | N/A | |
| The Bank | | $ | 37,961 | | | 14.17 | % | $ | 21,435 | | | 8.00 | % | $ | 26,794 | | | 10.00 | % |
| Tier I Capital (to Risk- | | | | | | | | | | | | | | | | | | | |
| Weighted Assets) | | | | | | | | | | | | | | | | | | | |
| Consolidated | | $ | 38,599 | | | 14.40 | % | $ | 10,724 | | | 4.00 | % | | N/A | | | N/A | |
| The Bank | | $ | 35,617 | | | 13.29 | % | $ | 10,718 | | | 4.00 | % | $ | 16,075 | | | 6.00 | % |
| Tier I Capital (to Average | | | | | | | | | | | | | | | | | | | |
| Assets) | | | | | | | | | | | | | | | | | | | |
| Consolidated | | $ | 38,599 | | | 10.45 | % | $ | 14,776 | | | 4.00 | % | | N/A | | | N/A | |
| The Bank | | $ | 35,617 | | | 9.57 | % | $ | 14,891 | | | 4.00 | % | $ | 18,613 | | | 5.00 | % |
| | | Actual | | Minimum Capital Requirement | | Minimum To Be Well Capitalized Under Prompt Corrective Action Provisions | |
| | | Amount | | Ratio | | Amount | | Ratio | | Amount | | Ratio | |
| | | (dollars in thousands) | |
As of December 31, 2005 | | | | | | | | | | | | | |
| Total Capital (to Risk- | | | | | | | | | | | | | | | | | | | |
| Weighted Assets) | | | | | | | | | | | | | | | | | | | |
| Consolidated | | $ | 38,770 | | | 14.44 | % | $ | 21,476 | | | 8.00 | % | | N/A | | | N/A | |
| The Bank | | $ | 36,423 | | | 13.58 | % | $ | 21,457 | | | 8.00 | % | $ | 26,821 | | | 10.00 | % |
| Tier I Capital (to Risk- | | | | | | | | | | | | | | | | | | | |
| Weighted Assets) | | | | | | | | | | | | | | | | | | | |
| Consolidated | | $ | 36,392 | | | 13.55 | % | $ | 10,741 | | | 4.00 | % | | N/A | | | N/A | |
| The Bank | | $ | 34,045 | | | 12.70 | % | $ | 10,723 | | | 4.00 | % | $ | 16,084 | | | 6.00 | % |
| Tier I Capital (to Average | | | | | | | | | | | | | | | | | | | |
| Assets) | | | | | | | | | | | | | | | | | | | |
| Consolidated | | $ | 36,392 | | | 9.31 | % | $ | 15,635 | | | 4.00 | % | | N/A | | | N/A | |
| The Bank | | $ | 34,045 | | | 8.63 | % | $ | 15,780 | | | 4.00 | % | $ | 19,725 | | | 5.00 | % |
NOTE O. COMMITMENTS AND CONTINGENCIES
The Bank is a party to financial instruments with off-balance-sheet risk entered into in the normal course of business to meet the financing needs of its customers. These financial instruments include commitments to extend credit and standby letters of credit, which are not included in the accompanying consolidated financial statements.
Commitments to extend credit are agreements to lend money with fixed expiration dates or termination clauses. The Bank applies the same credit standards used in the lending process when extending these commitments, and periodically reassesses the customer's creditworthiness through ongoing credit reviews. Since many of the commitments are expected to expire without being drawn upon, the total commitment amounts do not necessarily represent future cash requirements. Collateral is obtained based on the Bank's assessment of the transaction. At December 31, 2006 and 2005, the Bank’s commitments to extend credit totaled $67,515,609 and $82,642,254, respectively.
Standby letters of credit are conditional commitments issued by the Bank to guarantee the performance of a customer to a third party. The credit risk and collateralization policy involved in issuing letters of credit is essentially the same as that involved in extending loans to customers. The Bank had total unfunded letters of credit of $2,092,014 and $2,389,797 as of December 31, 2006 and 2005, respectively.
The Bank is required to maintain average reserves at the Federal Reserve Bank. This requirement approximated $275,000 at December 31, 2006. The Bank is in compliance with this requirement.
At December 31, 2006, the Bank had committed to sell approximately $55,000 of loans originated near year-end. These loans are classified as loans held-for-sale and are carried at the lower of cost or market. Due to the short period from origination, the cost and market value of these loans are approximately the same.
The Bank has outstanding lines of credit with several of its correspondent banks available to assist in the management of short-term liquidity. At December 31, 2006, the total available lines of credit were $41,700,000 with an outstanding balance of $ -0- as reflected on the consolidated balance sheet.
Britton & Koontz Capital Corporation and its wholly owned subsidiaries, the Bank and the Agency, are involved in certain litigation incurred in the normal course of business. In the opinion of management and legal counsel, liabilities arising from such claims, if any, would not have a material effect upon the Company's consolidated financial statements.
NOTE P. CONCENTRATIONS OF CREDIT
Substantially all of the Bank's loans, commitments, and standby letters of credit have been granted to customers in the Bank's market area. The majority of investments in state and municipal securities involve governmental entities in and around the Bank's market area. The concentrations of credit by type of loan are set forth in Note C. The distribution of commitments to extend credit approximates the distribution of loans outstanding. Standby letters of credit are granted primarily to commercial borrowers.
The Bank maintains deposit accounts and federal funds sold with correspondent banks which may, periodically, exceed the federally insured amount.
NOTE Q. DIVIDENDS
The Bank paid dividends to the Company amounting to $2,500,000 and $2,100,000 for the years 2006 and 2005, respectively.
NOTE R. INTEREST RATE RISK MANAGEMENT
During 2006, the Bank entered into an off-balance sheet interest rate swap agreement to reduce its interest-rate risk and protect its prime based loans if interest rates were to fall. Under the terms of this agreement, the Bank receives a fixed rate and is obligated to pay a floating rate based on Prime calculated on a contractual notional amount of $10 million at December 31, 2006. The original term is for three years expiring in October 2009. The fixed payment rate was 7.769% during 2006. The average variable-payment rate was 8.25% at December 31, 2006. The collateral at December 31, 2006, is a Federal National Mortgage Corporation investment. The carrying amount of the swap has been adjusted to its fair value at year-end approximating $(75) thousand and is included in other assets. The terms of the swap are assumed to be completely effective, and accordingly, is reported as other comprehensive income.
NOTE S. FAIR VALUE OF FINANCIAL INSTRUMENTS
The fair value of a financial instrument is the current amount that would be exchanged between willing parties, other than in a forced liquidation. Fair value is best determined based upon quoted market prices. However, in many instances, there are no quoted market prices for the Company's various financial instruments. In cases where quoted market prices are not available, fair values are based on esti-mates using present value or other valuation techniques. Those tech-niques are significantly affected by the assumptions used, including the discount rate and estimates of future cash flows. Accordingly, the fair value estimates may not be realized in an immediate settlement of the instrument. FASB Statement No. 107 excludes certain financial instru-ments and all non-financial instruments from its disclosure require-ments. Accordingly, the aggregate fair value amounts presented may not necessarily represent the underlying fair value of the Company.
The following methods and assumptions were used by the Company in estimating fair value disclosures for financial instruments:
Cash and Due From Banks - Fair value equals the carrying value of such assets.
Federal Funds Sold - Due to the short-term nature of this asset, the carrying value of this item approximates its fair value.
Investment Securities - Fair values for investment securities are based on quoted market prices, where available. If quoted market prices are not available, fair values are based on quoted market prices of comparable instruments.
Cash Surrender Value of Life Insurance - The fair value of this item approximates its carrying value.
Loans, Net - For variable-rate loans which are repricing immediately, fair values are based on carrying values. Other variable-rate loans, fixed-rate commercial loans, installment loans, and mortgage loans are valued using discounted cash flows. The discount rates used to determine the present value of these loans are based on interest rates currently being charged by the Bank on loans with comparable credit risk and terms.
NOTE S. FAIR VALUE OF FINANCIAL INSTRUMENTS (Continued)
Deposits - The fair values of demand deposits are equal to the carrying value of such deposits. Demand deposits include non-interest bearing demand deposits, savings accounts, NOW accounts, and money market demand accounts. Discounted cash flows have been used to value fixed rate term deposits. The discount rate used is based on interest rates currently being offered by the Bank on deposits with comparable amounts and terms.
Long-Term Borrowings - The fair values of the Company’s long-term borrowings are estimated using discounted cash flow analysis based on the Company’s current incremental borrowing ratio for similar types of borrowing arrangements.
Federal Funds Purchased and Securities Sold Under Repurchase Agreements - The fair value of these items approximates their carrying values.
Off-Balance Sheet Instruments - Loan commitments are negotiated at current market rates and are relatively short-term in nature. Therefore, the estimated value of loan commitments approximates the face amount. Fair values for interest rate swaps and caps are based on quoted market prices where available. If quoted market prices are not available, fair values are based on quoted market prices of comparable instruments.
NOTE S. FAIR VALUE OF FINANCIAL INSTRUMENTS (Continued)
The estimated fair values of the Company's financial instruments, rounded to the nearest thousand, are as follows:
| | | 2006 | | 2005 | |
| | | Carrying | | Fair | | Carrying | | Fair | |
| | | Amount | | Value | | Amount | | Value | |
| | | | | (dollars in Thousands) | | | |
| Financial Assets: | | | | | | | | | |
| Cash and due from banks | | $ | 6,572 | | $ | 6,572 | | $ | 9,825 | | $ | 9,825 | |
| Federal funds sold | | | 305 | | | 305 | | | 401 | | | 401 | |
| Investment securities: | | | | | | | | | | | | | |
| Held-to-maturity | | | 38,611 | | | 39,525 | | | 37,994 | | | 39,016 | |
| Available-for-sale | | | 64,419 | | | 64,419 | | | 78,287 | | | 78,287 | |
| Equity securities | | | 4,340 | | | 4,340 | | | 5,502 | | | 5,502 | |
| Cash surrender value of life insurance | | | 973 | | | 973 | | | 936 | | | 936 | |
| Loans, net | | | 241,245 | | | 239,567 | | | 242,705 | | | 240,119 | |
| | | | | | | | | | | | | | |
| Financial Liabilities: | | | | | | | | | | | | | |
| Deposits | | | 253,757 | | | 253,135 | | | 257,377 | | | 256,493 | |
| Short-term borrowings | | | 31,244 | | | 31,146 | | | 36,310 | | | 35,955 | |
| Long-term borrowings | | | 34,424 | | | 34,044 | | | 47,886 | | | 47,263 | |
| Securities sold under | | | | | | | | | | | | | |
| repurchase agreements | | | 8,149 | | | 8,131 | | | 8,033 | | | 8,033 | |
| Junior subordinated debentures | | | 5,155 | | | 5,155 | | | 5,155 | | | 5,155 | |
| | | | | | | | | | | | | | |
| | | Face Amount | | | Fair Value | | | Face Amount | | | Fair Value | |
| | | | | | | | | | | | | | |
| Other: | | | | | | | | | | | | | |
| Commitments to extend credit | | $ | 67,516 | | $ | 67,516 | | $ | 82,642 | | $ | 82,642 | |
| Standby letters of credit | | | 2,092 | | | 2,092 | | | 2,390 | | | 2,390 | |
| Interest rate swap | | | (75 | ) | | (75 | ) | | - | | | - | |
| | | | | | | | | | | | | | |
NOTE T. CONDENSED FINANCIAL INFORMATION OF
BRITTON & KOONTZ CAPITAL CORPORATION
The financial information of Britton & Koontz Capital Corporation, parent company only, is as follows:
BALANCE SHEETS
| | | December 31 | |
| | | 2006 | | 2005 | |
| ASSETS: | | | | | | | |
| Cash | | $ | 2,778,862 | | $ | 1,942,459 | |
| Investment in subsidiaries | | | 35,914,120 | | | 34,199,317 | |
| Other assets | | | 95,557 | | | 279,971 | |
| TOTAL ASSETS | | $ | 38,788,539 | | $ | 36,421,747 | |
| LIABILITIES: | | | | | | | |
| Junior subordinated debentures | | $ | 5,155,000 | | $ | 5,155,000 | |
| Other liabilities | | | 36,651 | | | 6,589 | |
| TOTAL LIABILITIES | | | 5,191,651 | | | 5,161,589 | |
| STOCKHOLDERS’ EQUITY | | | 33,596,888 | | | 31,260,158 | |
| TOTAL LIABILITIES AND STOCKHOLDERS’ | | | | | | | |
| EQUITY | | $ | 38,788,539 | | $ | 36,421,747 | |
STATEMENTS OF INCOME
| | | Years Ended December 31, | |
| | | 2006 | | 2005 | | 2004 | |
| REVENUE: | | | | | | | | | | |
| Dividends Received: | | | | | | | | | | |
| Britton & Koontz Bank, N.A. | | $ | 2,500,000 | | $ | 2,100,000 | | $ | 1,700,000 | |
| Other income | | | 3,308 | | | 18,592 | | | 4,671 | |
| | | | 2,503,308 | | | 2,118,592 | | | 1,704,671 | |
| EXPENSES | | | 675,339 | | | 414,355 | | | 310,563 | |
| | | | 1,827,969 | | | 1,704,237 | | | 1,394,108 | |
| INCOME TAX EXPENSE (BENEFIT) | | | (273,332 | ) | | (162,090 | ) | | (123,354 | ) |
| | | | 2,101,301 | | | 1,866,327 | | | 1,517,462 | |
| EQUITY IN UNDISTRIBUTED | | | | | | | | | | |
| EARNINGS: | | | | | | | | | | |
| Britton & Koontz Bank, N.A. | | | 1,464,176 | | | 1,337,909 | | | 1,308,982 | |
| B & K Title Insurance Agency, Inc. | | | 13,106 | | | 23,404 | | | 17,765 | |
| NET INCOME | | $ | 3,578,583 | | $ | 3,227,640 | | $ | 2,844,209 | |
| | | | | | | | | | | |
NOTE T. CONDENSED FINANCIAL INFORMATION OF
BRITTON & KOONTZ CAPITAL CORPORATION (Continued)
STATEMENTS OF CASH FLOWS
| | | Years Ended December 31, | |
| | | 2006 | | 2005 | | 2004 | |
| | | | | | | | |
| CASH FLOWS FROM OPERATING ACTIVITIES: | | | | | | | | | | |
| Net Income | | $ | 3,578,583 | | $ | 3,227,640 | | $ | 2,844,209 | |
| Adjustments to reconcile net income to net | | | | | | | | | | |
| cash provided by operating activities: | | | | | | | | | | |
| Equity on undistributed earnings | | | | | | | | | | |
| and losses of affiliates | | | (1,477,282 | ) | | (1,361,313 | ) | | (1,326,747 | ) |
| (Increase) decrease in other assets | | | 184,413 | | | 26,006 | | | (53,741 | ) |
| Increase in other liabilities | | | 30,061 | | | 1,693 | | | 1,184 | |
| Net Cash Provided by Operating Activities | | | 2,315,775 | | | 1,894,026 | | | 1,464,905 | |
| CASH FLOWS FROM INVESTING ACTIVITIES: | | | | | | | | | | |
| Transfer of bank premises to subsidiary | | | - | | | - | | | 188,038 | |
| | | | | | | | | | | |
| Net Cash Provided by (Used in) Investing | | | | | | | | | | |
| Activities | | | - | | | - | | | 188,038 | |
| | | | | | | | | | | |
| CASH FLOWS FROM FINANCING ACTIVITIES: | | | | | | | | | | |
| Cash dividends paid | | | (1,524,619 | ) | | (1,460,258 | ) | | (1,353,409 | ) |
| Cash received from stock options exercised | | | 45,247 | | | - | | | 36,778 | |
| Net Cash Provided by (Used in) | | | | | | | | | | |
| Financing Activities | | | (1,479,372 | ) | | (1,460,258 | ) | | (1,316,631 | ) |
| | | | | | | | | | | |
| NET INCREASE (DECREASE) IN CASH | | | 836,403 | | | 433,768 | | | 336,312 | |
| CASH AT BEGINNING OF YEAR | | | 1,942,459 | | | 1,508,691 | | | 1,172,379 | |
| CASH AT END OF YEAR | | $ | 2,778,862 | | $ | 1,942,459 | | $ | 1,508,691 | |
None.
The Company carried out an evaluation, under the supervision and with the participation of the Chief Executive Officer of the Company (“CEO”) and the Chief Financial Officer of the Company (“CFO”) of the effectiveness of the design and operation of the Company’s disclosure controls and procedures (as defined in Rule 13a-15(e) and Rule 15d-15(e) under the Securities Exchange Act of 1934, as amended) as of December 31, 2006. Based on this evaluation, the CEO and CFO concluded that the Company’s disclosure controls and procedures are effective in timely alerting them to material information required to be included in the Company’s SEC reports.
During the fourth quarter of 2006, there were no changes to the Company’s internal control over financial reporting that materially affected, or was reasonably likely to materially affect, the Company’s internal control over financial reporting.
None.
PART III
The following table sets forth the names and principal occupations of each director and executive officer of the Company.
DIRECTORS | | EXECUTIVE OFFICERS |
| | | |
| Robert R. Punches | | W. Page Ogden |
Partner, Gwin, Lewis & Punches, LLP | | President & Chief Executive Officer |
Chairman, Britton & Koontz Capital Corporation | | Britton & Koontz Capital Corporation Britton & Koontz Bank, National Association |
| | | |
| R. Andrew Patty II | | William M. Salters |
Member, Sieberth & Patty, LLC Vice Chairman, Britton & Koontz Capital Corporation | | Treasurer, Chief Financial & Accounting Officer Britton & Koontz Capital Corporation |
| | | Britton & Koontz Bank, National Association |
| W. W. Allen, Jr. | | |
President, Allen Petroleum Services, Inc. | | Jarrett E. Nicholson |
| | | Credit Policy Officer |
| Craig A. Bradford, D.M.D | | Chief Operations Officer |
Pediatric Dentist | | Britton & Koontz Capital Corporation |
| | | Britton & Koontz Bank, National Association |
| A. J. Ferguson | | |
Petroleum Geologist | | |
| | | |
| George R. Kurz | | |
Principal, Kurz & Hebert | | |
| | | |
| Bethany L. Overton | | |
President, Lambdin-Bisland Realty Co. | | |
| | | |
| Vinod K. Thukral, Ph.D. | | |
Retired University Professor | | |
The additional information required in response to this item is incorporated into this report by reference to the material under the headings “Stock Ownership”, “Board of Directors”, “Committees of the Board of Directors”, “Executive Officers” and “Executive Compensation” in the Company’s Definitive Proxy Statement for its 2007 Annual Meeting of Shareholders (the “2007 Proxy Statement”).
Code of Ethics
The Board of Directors adopted a code of business conduct and ethics in compliance with Item 406 of Regulation S-K that applies to the principal executive officer, principal financial officer, principal accounting officer and controller of the Company and the Bank. Access to the Company’s Code of Ethics is available to shareholders of the Company and customers of the Bank through the Bank’s website at www4.bkbank.com under “investor relations.” Amendments to or waivers from provisions of the Company’s Code of Ethics will be disclosed on the Company’s website.
The information required in response to this item is incorporated into this report by reference to the material under the headings “Board of Directors” and “Executive Compensation” in the 2007 Proxy Statement.
The information required in response to this item is incorporated into this report by reference to the material under the headings “Stock Ownership” and “Executive Compensation” in the 2007 Proxy Statement.
The information required in response to this item is incorporated into this report by reference to the material under the heading “Board of Directors” in the 2007 Proxy Statement.
The information required in response to this item is incorporated into this report by reference to the material under the heading “Independent Registered Public Accountants” in the 2007 Proxy Statement.
PART IV
(a)
| 1. | Consolidated Financial Statements and Supplementary Information for Years Ended December 31, 2006, 2005 and 2004, which include the following: |
| (a) | Selected Financial Data |
| (b) | Report of Independent Registered Public Accounting Firm |
| (c) | Consolidated Balance Sheets |
| (d) | Consolidated Statements of Income |
| (e) | Consolidated Statements of Changes in Shareholders’ Equity |
| (f) | Consolidated Statement of Cash Flows |
| (g) | Notes to the Consolidated Financial Statements |
| 2. | Financial Statement Schedules |
None
3. Exhibits required by Item 601 of Regulation S-K
| Exhibit | | Description of Exhibit |
| | | |
| 3.1 | * | Restated Articles of Incorporation of Britton & Koontz Capital Corporation, incorporated by reference to Exhibit 3.1 to Registrant’s Quarterly Report on Form 10-Q, filed with the Securities and Exchange Commission (the “Commission”) on August 4, 2006. |
| | | |
| 3.2 | * | By-Laws of Britton & Koontz Capital Corporation, as amended, incorporated by reference to Exhibit 3.2 to Registrant’s Quarterly Report on Form 10-Q filed with the Commission on November 14, 2006. |
| | | |
| 4.1 | * | Shareholder Rights Agreement dated June 1, 1996 between Britton & Koontz Capital Corporation and Britton & Koontz First National Bank, as Rights Agent, incorporated by reference to Exhibit 4.3 to Registrant’s Registration Statement on Form S-8, Registration No. 333-20631, filed with the Commission on January 29, 1997, as amended by Amendment No. 1 to Rights Agreement dated as of August 15, 2006, incorporated by reference to Exhibit 4.2 to Registrants Current Report on Form 8-K filed with the Commission on August 17, 2006. |
| | | |
| 10.01 | *† | Employment Agreement dated December 31, 2002, between Britton & Koontz Capital Corporation and W. Page Ogden, incorporated by reference to Exhibit 10.01 to Registrant’s Annual Report on Form 10-KSB filed with the Commission on March 27, 2003. |
| | | |
| 10.02 | *† | Salary Continuation Plan Agreement dated September 26, 1994, between Britton & Koontz Capital Corporation and W. Page Ogden, incorporated by reference to Exhibit 10 to Registrant’s Quarterly Report on Form 10-QSB filed with the Commission on November 14, 1994, (Commission File Number 33-56204). |
| | | |
| 10.03 | *† | Britton & Koontz Capital Corporation Long-Term Incentive Compensation Plan and Amendment, incorporated by reference to Exhibit 4.4 to Registrant’s Registration Statement on Form S-8, Registration No. 333-20631, filed with the Commission on January 29, 1997. |
| | | |
| 21 | | Subsidiaries of the Company |
| | | |
| 23 | | Consent of Independent Registered Public Accountants |
| | | |
| 31.1 | | Certification of Chief Executive Officer as required pursuant to Section 302 of the Sarbanes-Oxley Act of 2002 |
| | | |
| 31.2 | | Certification of Chief Financial Officer as required pursuant to Section 302 of the Sarbanes-Oxley Act of 2002 |
| | | |
| 32.1 | | Certification of Chief Executive Officer as required pursuant to Section 906 of the Sarbanes-Oxley Act of 2002 |
| | | |
| 32.2 | | Certification of Chief Financial Officer as required pursuant to Section 906 of the Sarbanes-Oxley Act of 2002 |
| * | As indicated in the column entitled “Description of Exhibit,” this exhibit is incorporated by reference to another filing or document. |
| † | Management contract or compensatory plan or arrangement required to be filed as an exhibit to this Annual Report on Form 10-K pursuant to Item 15 of Form 10-K. |
The Company does not have any un-registered long-term debt exceeding ten percent of the total assets of the Company and its subsidiaries on a consolidated basis. The Company will file with the SEC, upon request, a copy of all long-term debt instruments.
Pursuant to the requirements of Section 13 or 15(d) of the Securities Exchange Act of 1934, the registrant has duly caused this report to be signed on its behalf by the undersigned, thereunto duly authorized.
BRITTON & KOONTZ CAPITAL CORPORATION
Date: March 14, 2007 By: /s/ Robert R. Punches
Robert R. Punches
Chairman of the Board
Pursuant to the requirements of the Securities Exchange Act of 1934, this report has been signed below by the following persons on behalf of the registrant and in the capacities and on the dates indicated.
Signature | | Title | | Date |
| /s/ Robert R. Punches | | | | |
| Robert R. Punches | | Chairman and Director | | March 14, 2007 |
| | | | | |
| /s/ R. Andrew Patty II | | | | |
| R. Andrew Patty II | | Vice Chairman and Director | | March 14, 2007 |
| | | | | |
| /s/ W.W. Allen, Jr. | | | | |
| W. W. Allen, Jr. | | Director | | March 14, 2007 |
| | | | | |
| /s/ Craig A. Bradford, DMD | | | | |
| Craig A. Bradford, DMD | | Director | | March 14, 2007 |
| | | | | |
| /s/ A.J. Ferguson | | | | |
| A. J. Ferguson | | Director | | March 14, 2007 |
| | | | | |
| /s/ Bethany L. Overton | | | | |
| Bethany L. Overton | | Director | | March 14, 2007 |
| | | | | |
| /s/ George R. Kurz | | | | |
| George R. Kurz | | Director | | March 14, 2007 |
| | | | | |
| /s/ Vinod K. Thukral, Ph.D. | | | | |
| Vinod K. Thukral, Ph.D. | | Director | | March 14, 2007 |
| | | | | |
Signature | | Title | | Date |
| /s/ W. Page Ogden | | | | |
| W. Page Ogden | | President, Chief Executive Officer | | March 14, 2007 |
| | | | | |
| /s/ William M. Salters | | | | |
| William M. Salters | | Treasurer, Chief Financial Officer, Principal Accounting Officer, Controller | | March 14, 2007 |
EXHIBIT INDEX
| Exhibit | | Description of Exhibit |
| | | |
| | | |
| 21 | | Subsidiaries of Britton & Koontz Capital Corporation, as amended |
| | | |
| 23 | | Consent of Independent Registered Public Accountants |
| | | |
| 31.1 | | Certification of Chief Executive Officer as required pursuant to Section 302 of the Sarbanes-Oxley Act of 2002. |
| | | |
| 31.2 | | Certification of Chief Financial Officer as required pursuant to Section 302 of the Sarbanes-Oxley Act of 2002. |
| | | |
| 32.1 | | Certification of Chief Executive Officer as required pursuant to Section 906 of the Sarbanes-Oxley Act of 2002 |
| | | |
| 32.2 | | Certification of Chief Financial Officer as required pursuant to Section 906 of the Sarbanes-Oxley Act of 2002 |