Exhibit 99.1


2020 Annual Shareholders' Meeting 2
Allan R. Dennison Chairman AmeriServ Financial, Inc. 3

4 This meeting is being transmitted in its entirety via webcast to all interested shareholders and prospective investors.

Welcome to our Annual Shareholder Meeting. We appreciate your ongoing loyalty and support. Welcome! 5
Agenda • Proxy Items • Chief Financial Officer Presentation • President & CEO Comments • Final Report on Proxy Items • Question & Answer Period 6

Voting Procedures VOTE BY EMAIL - bgilchrist@wesselcpa.com You have the option to vote or change your vote during the meeting. Use the email address shown here to transmit your voting instructions and for electronic delivery of information. Have your proxy card in hand when you access the email address and provide voting instructions for each of the numbered items that appear on the proxy card. If you have previously returned a proxy card or voted by one of the other methods described in the proxy statement and you do not wish to change your vote, you do not need to take any further action at this time. 7
Election of Class I Directors Allan R. Dennison Sara A. Sargent 8
Ratification of Appointment of S.R. Snodgrass - Audit financial records for fiscal year ending 12 - 31 - 20 9
Advisory (Non - Binding) Vote – Compensation of Named Executive Officers of AmeriServ Financial, Inc. 10


Michael D. Lynch Senior Vice President Chief Financial Officer Chief Investment Officer Chief Risk Officer 12
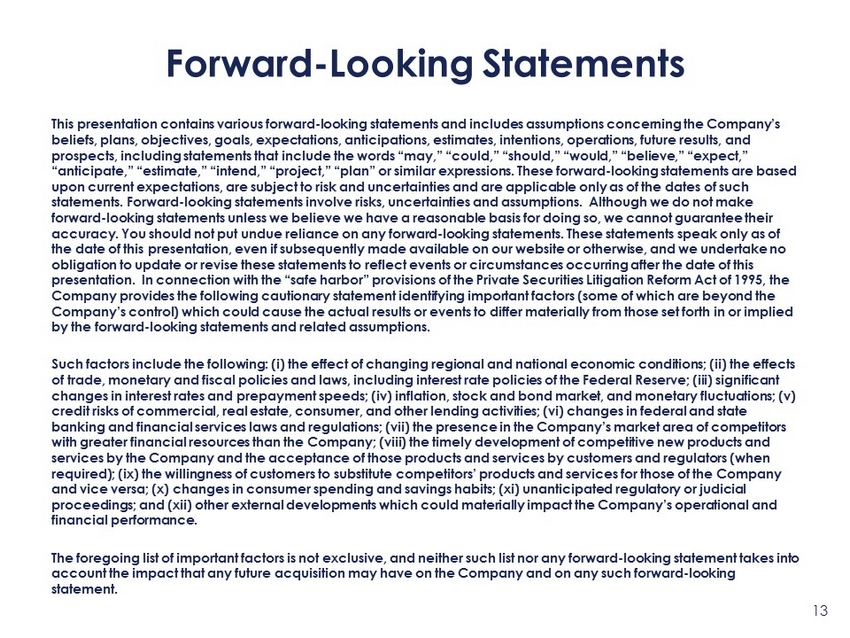
Forward - Looking Statements 13 This presentation contains various forward - looking statements and includes assumptions concerning the Company’s beliefs, plans, objectives, goals, expectations, anticipations, estimates, intentions, operations, future results, and prospects, including statements that include the words “may,” “could,” “should,” “would,” “believe,” “expect,” “anticipate,” “estimate,” “intend,” “project,” “plan” or similar expressions. These forward - looking statements are based upon current expectations, are subject to risk and uncertainties and are applicable only as of the dates of such statements. Forward - looking statements involve risks, uncertainties and assumptions. Although we do not make forward - looking statements unless we believe we have a reasonable basis for doing so, we cannot guarantee their accuracy. You should not put undue reliance on any forward - looking statements. These statements speak only as of the date of this presentation, even if subsequently made available on our website or otherwise, and we undertake no obligation to update or revise these statements to reflect events or circumstances occurring after the date of this presentation. In connection with the “safe harbor” provisions of the Private Securities Litigation Reform Act of 1995, the Company provides the following cautionary statement identifying important factors (some of which are beyond the Company’s control) which could cause the actual results or events to differ materially from those set forth in or implied by the forward - looking statements and related assumptions. Such factors include the following: (i) the effect of changing regional and national economic conditions; (ii) the effects of trade, monetary and fiscal policies and laws, including interest rate policies of the Federal Reserve; (iii) significant changes in interest rates and prepayment speeds; (iv) inflation, stock and bond market, and monetary fluctuations; (v) credit risks of commercial, real estate, consumer, and other lending activities; (vi) changes in federal and state banking and financial services laws and regulations; (vii) the presence in the Company’s market area of competitors with greater financial resources than the Company; (viii) the timely development of competitive new products and services by the Company and the acceptance of those products and services by customers and regulators (when required); (ix) the willingness of customers to substitute competitors’ products and services for those of the Company and vice versa; (x) changes in consumer spending and savings habits; (xi) unanticipated regulatory or judicial proceedings; and (xii) other external developments which could materially impact the Company’s operational and financial performance. The foregoing list of important factors is not exclusive, and neither such list nor any forward - looking statement takes into account the impact that any future acquisition may have on the Company and on any such forward - looking statement.
Annual Financial Results Through 2019 14
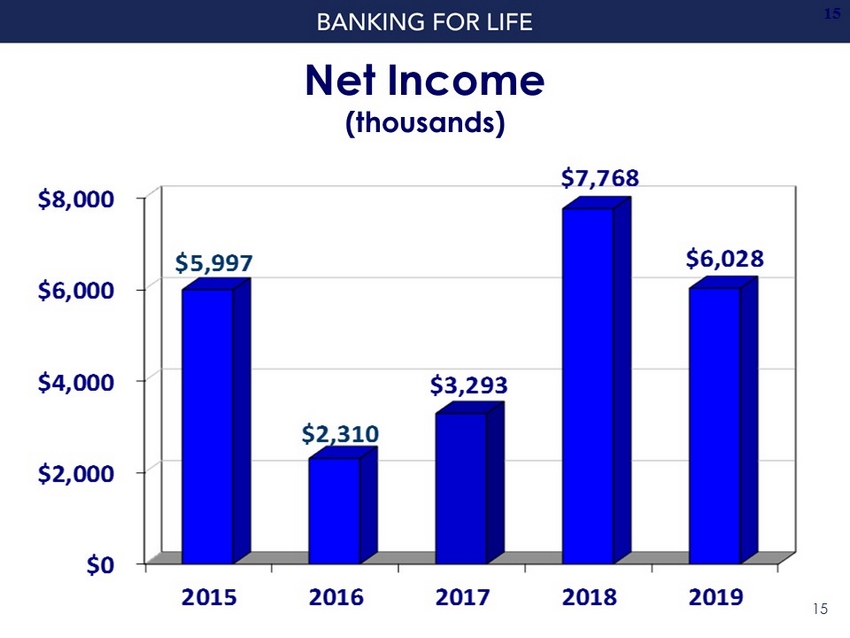
Net Income (thousands) $0 $2,000 $4,000 $6,000 $8,000 2015 2016 2017 2018 2019 $5,997 $2,310 $3,293 $7,768 $6,028 15 15
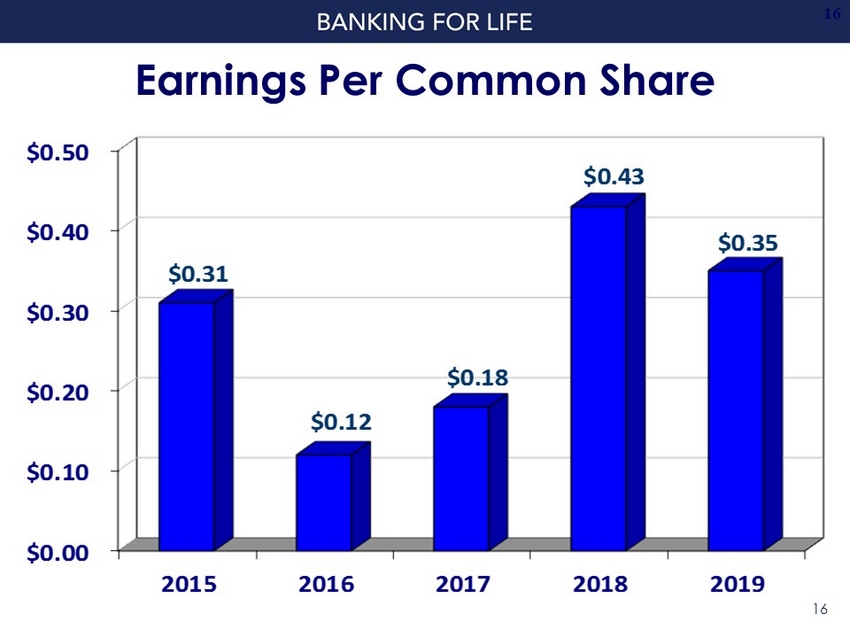
$0.00 $0.10 $0.20 $0.30 $0.40 $0.50 2015 2016 2017 2018 2019 $0.31 $0.12 $0.18 $0.43 $0.35 Earnings Per Common Share 16 16

Tangible Book Value $3.50 $4.00 $4.50 $5.00 $5.50 2015 2016 2017 2018 2019 $4.56 $4.41 $4.59 $4.88 $5.08 17 17
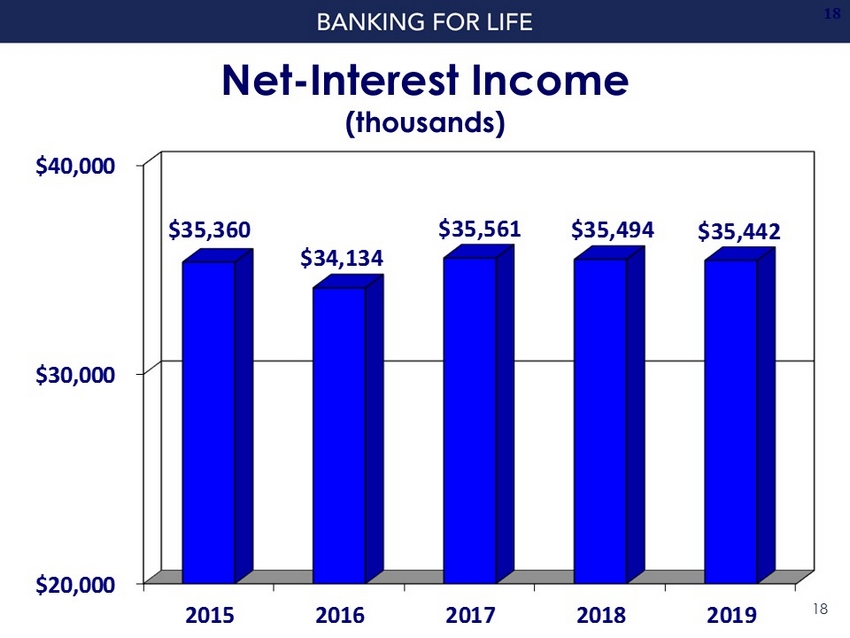
Net - Interest Income (thousands) $20,000 $30,000 $40,000 2015 2016 2017 2018 2019 $35,360 $34,134 $35,561 $35,494 $35,442 18 18
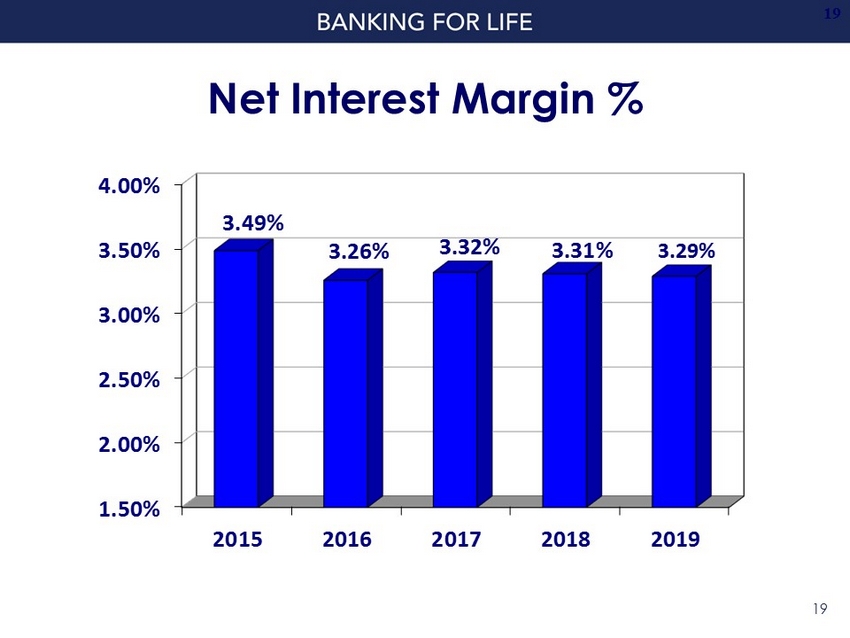
Net Interest Margin % 1.50% 2.00% 2.50% 3.00% 3.50% 4.00% 2015 2016 2017 2018 2019 3.49% 3.26% 3.32% 3.31% 3.29% 19 19
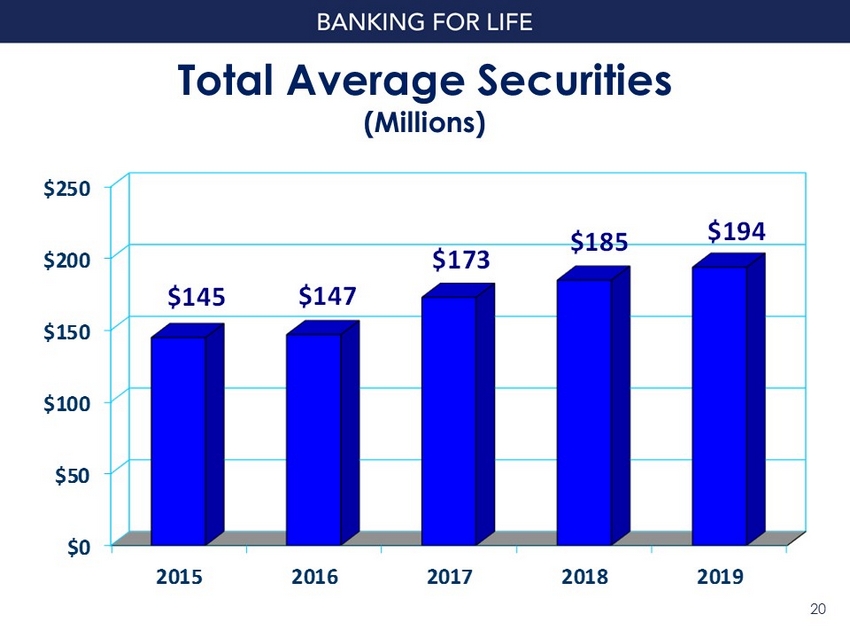
Total Average Securities (Millions) $0 $50 $100 $150 $200 $250 2015 2016 2017 2018 2019 $145 $147 $173 $185 $194 20 20
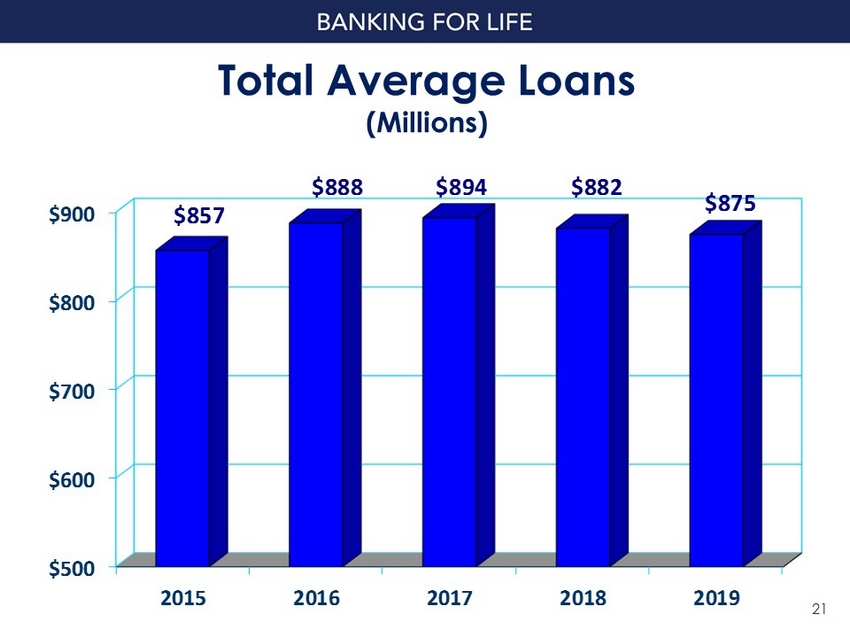
Total Average Loans (Millions) $500 $600 $700 $800 $900 2015 2016 2017 2018 2019 $857 $888 $894 $882 $875 21 21

Total Average Deposits (Millions) $500 $600 $700 $800 $900 $1,000 2015 2016 2017 2018 2019 $893 $956 $976 $960 $980 22 22
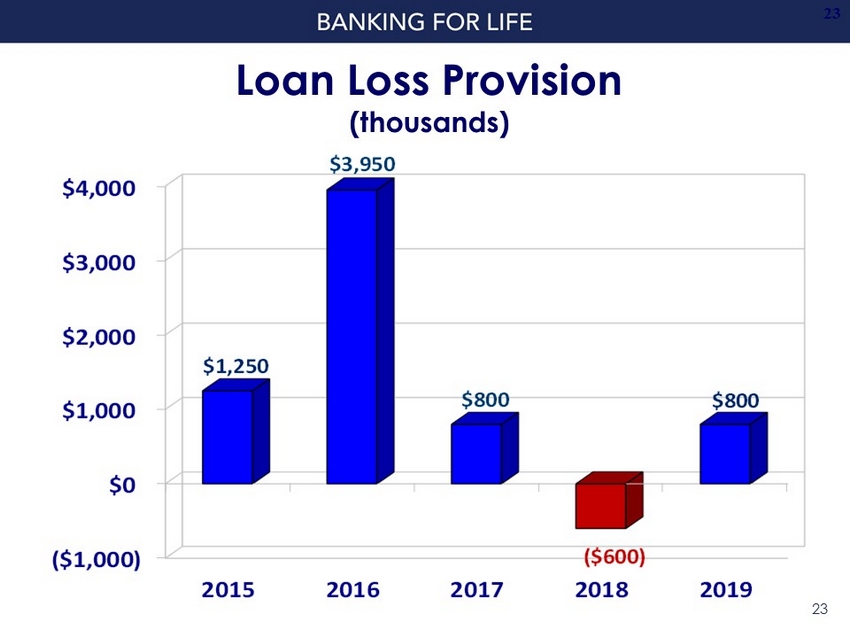
Loan Loss Provision (thousands) ($1,000) $0 $1,000 $2,000 $3,000 $4,000 2015 2016 2017 2018 2019 $1,250 $3,950 $800 ($600) $800 23 23
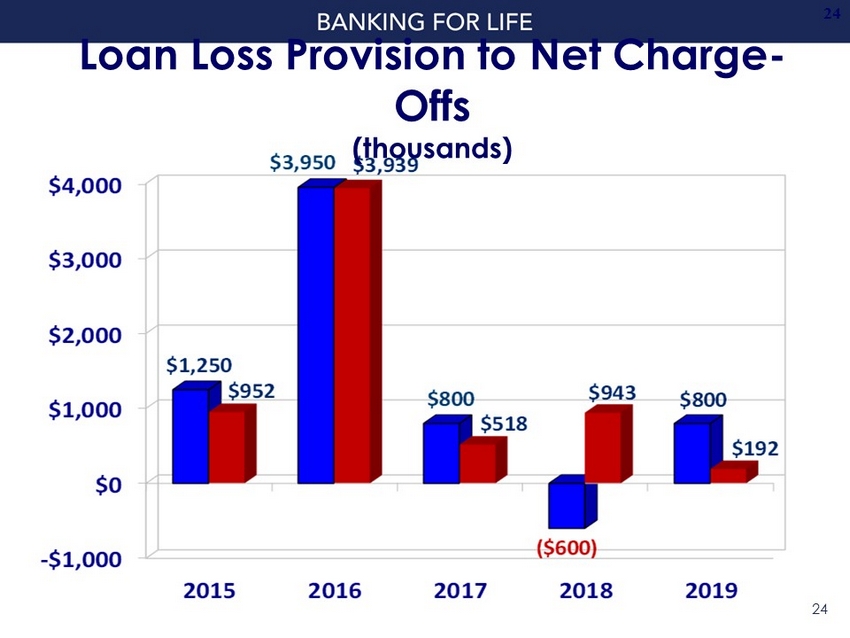
-$1,000 $0 $1,000 $2,000 $3,000 $4,000 2015 2016 2017 2018 2019 $1,250 $3,950 $800 ($600) $800 $952 $3,939 $518 $943 $192 Loan Loss Provision to Net Charge - Offs (thousands) 24 24
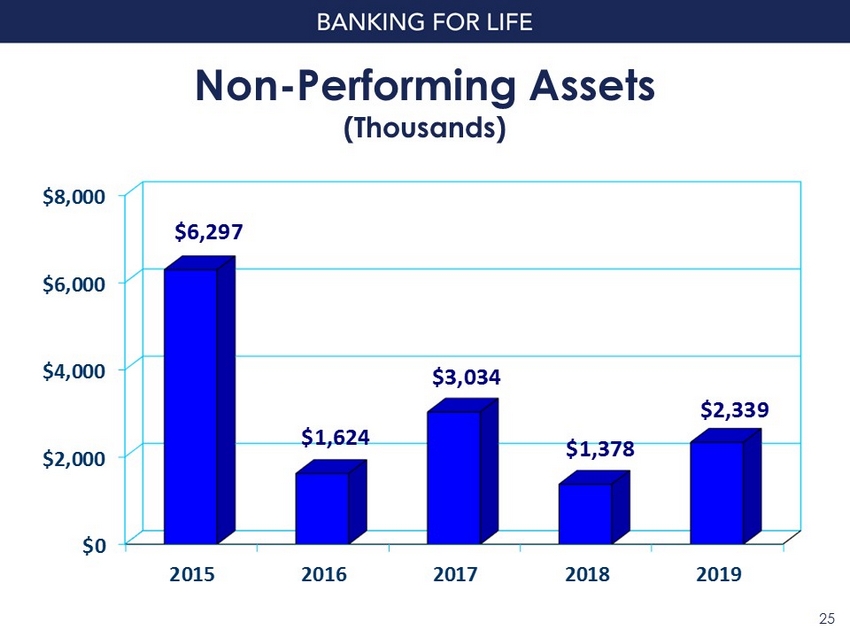
Non - Performing Assets (Thousands) 25 $0 $2,000 $4,000 $6,000 $8,000 2015 2016 2017 2018 2019 $6,297 $1,624 $3,034 $1,378 $2,339 25

$10,000 $12,000 $14,000 $16,000 2015 2016 2017 2018 2019 $15,196 $14,461 $14,531 $14,507 $15,155 Non - Interest Revenue (excluding security sale gains/losses) (thousands) 26 26

0 2,500 5,000 7,500 10,000 2015 2016 2017 2018 2019 8,682 8,747 9,170 9,660 9,730 Wealth Management Revenue (Thousands) 27 27
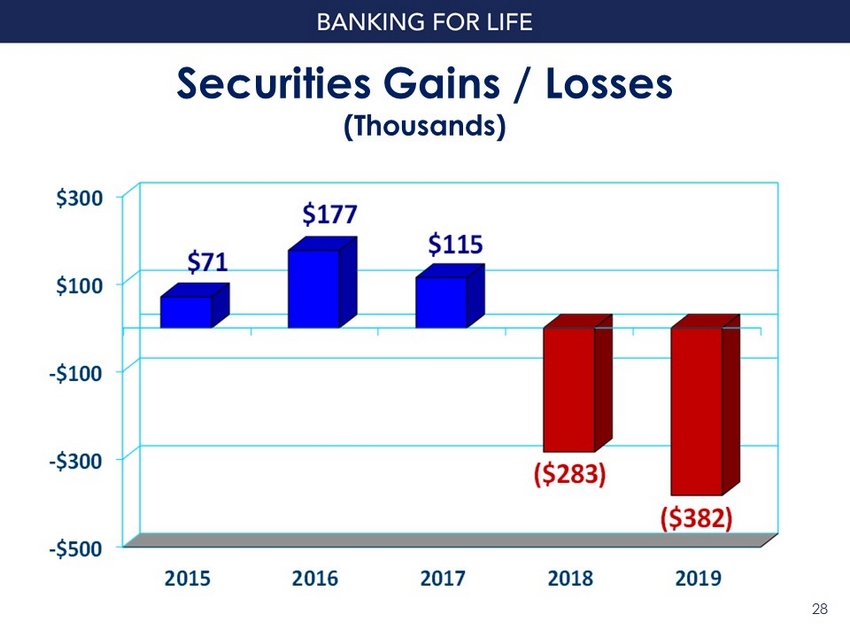
Securities Gains / Losses (Thousands) -$500 -$300 -$100 $100 $300 2015 2016 2017 2018 2019 $71 $177 $115 ($283) ($382) 28 28
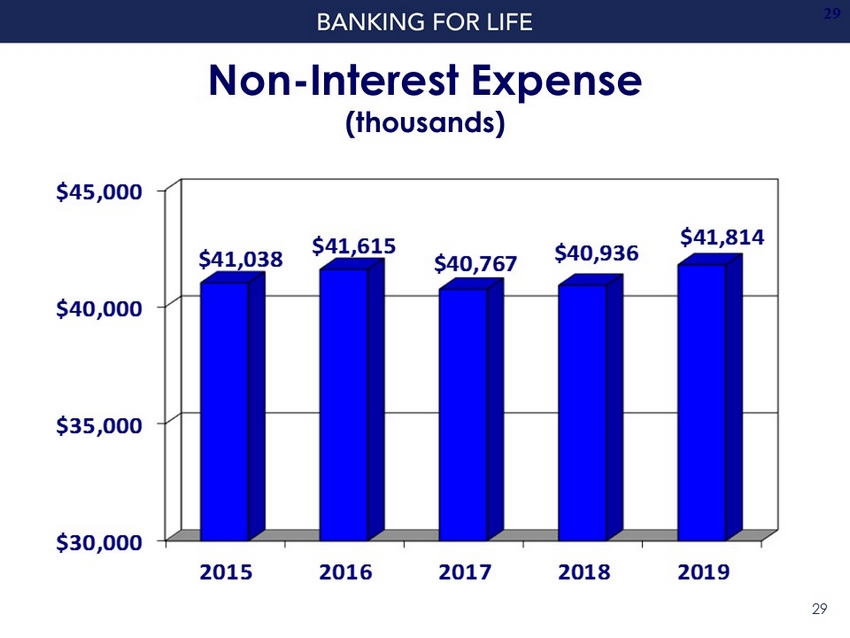
Non - Interest Expense (thousands) $30,000 $35,000 $40,000 $45,000 2015 2016 2017 2018 2019 $41,038 $41,615 $40,767 $40,936 $41,814 29 29

10.47% 11.68% 13.49% 9.87% 11.17% 11.17% 12.23% 9.50% 0.00% 3.00% 6.00% 9.00% 12.00% 15.00% Common Equity Tier 1 Capital Ratio Tier 1 Capital Ratio Total Capital Ratio Tier 1 Leverage Ratio Consolidated Bank Regulatory Well Capitalized Requirement Regulatory Capital Ratios As of December 31, 2019 30

31 2019 Summary • Our earnings decline in 2019 was primarily the result of to two significant unfavorable events. • However, we continue to be encouraged by the success of our business model as demonstrated by strong loan production and total average deposits reaching a historical level. • Our net interest margin performance remained relatively stable even though the economy became more volatile and asset quality continued to be excellent.
32 2019 Summary • The improv em ent in non - interest revenue offset a significant portion of the increase to non - interest expense which was necessary to make prudent investments in the franchise that positions us well in the rapidly changing financial services industry.


Jeffrey A. Stopko President & Chief Executive Officer AmeriServ Financial, Inc. 34

ASRV Branches Loan Production Offices Overview of AmeriServ Financial Inc. Branch Map Overview • $1.2 Billion Community Bank Headquartered in Johnstown, PA • 16 Retail Branches • 2 Loan Production Offices • Sizable Wealth Management Company with $2 Billion Assets Under Administration • Stable deposit base in core markets with 22% deposit market share in Cambria County • Commercial Loan Portfolio well diversified in nearby faster growing markets Financial Highlights as of 03/31/2020 ($ Millions except per share data) Total Assets $1168.6 Total Loans $ 877.4 Total Deposits $ 957.6 Shareholders Equity $ 100.8 2019 Net Income $ 6.0 2019 Earnings Per Share $ 0.35 Tangible Book Value/Share $ 5.22 NASDAQ Ticker Symbol ASRV Market Cap $ 44.7 35
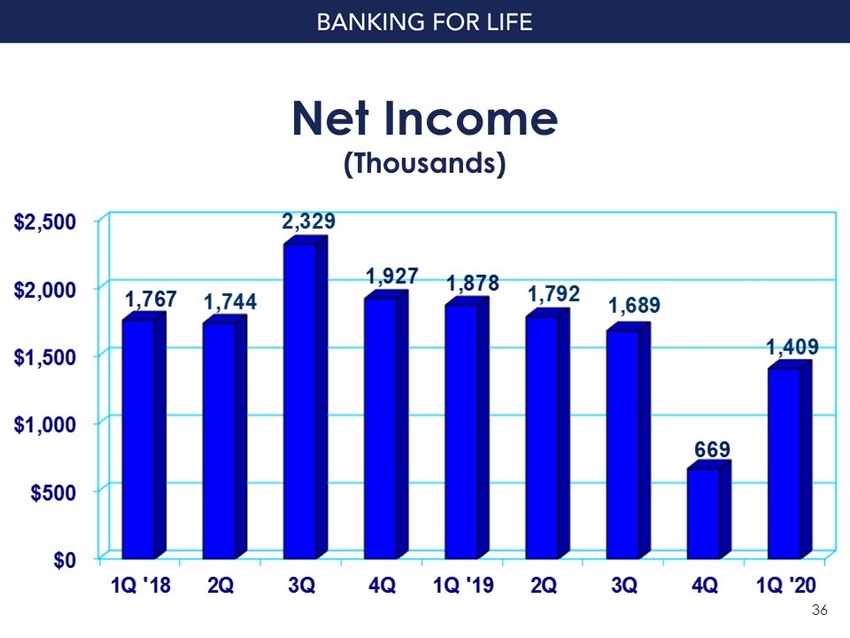
36 Net Income (Thousands) $0 $500 $1,000 $1,500 $2,000 $2,500 1Q '18 2Q 3Q 4Q 1Q '19 2Q 3Q 4Q 1Q '20 1,767 1,744 2,329 1,927 1,878 1,792 1,689 669 1,409
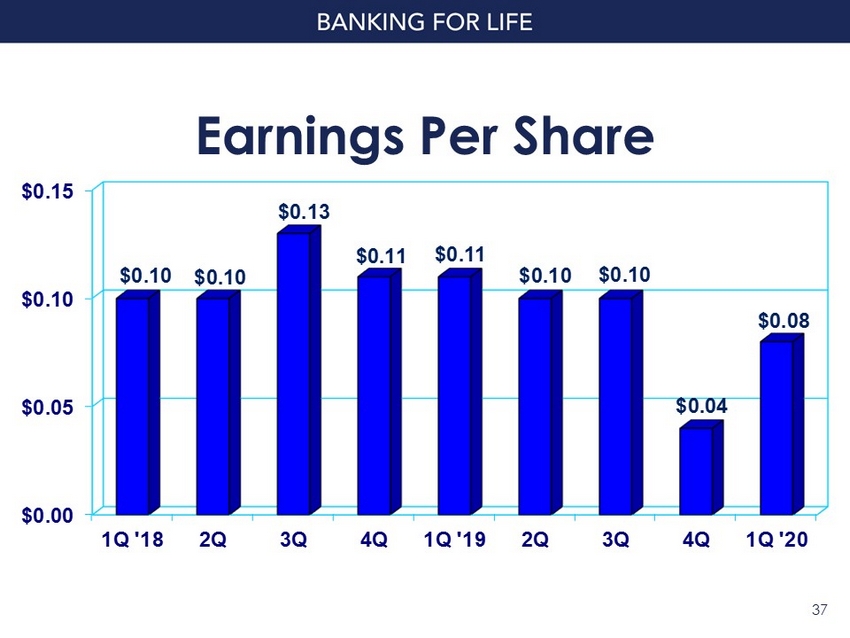
37 Earnings Per Share $0.00 $0.05 $0.10 $0.15 1Q '18 2Q 3Q 4Q 1Q '19 2Q 3Q 4Q 1Q '20 $0.10 $0.10 $0.13 $0.11 $0.11 $0.10 $0.10 $0.04 $0.08

AmeriServ Strategic Plan 38 Create long - term value for our shareholders by: – Maintaining financially strong balance sheet – Appropriately managing risk – Consistently improving shareholder returns

39 Financially Strong Balance Sheet Deposit Composition ($mm) As of March 31, 2020 Demand Deposits $145.6 Savings, NOW & Money Market , $500.5 Certificates of Deposit $272.8 Jumbo Certificates of Deposit $38.7 $957.6 Million 15% 4% 28% 52%
Financially Strong Balance Sheet COVID - 19 Update Liquidity Position • As demonstrated on the previous chart, our loyal and stable core deposit base is a strong source of liquidity for AmeriServ. • AmeriServ deposits are currently at record levels as our customers have deposited funds received from the various government stimulus programs in our bank. • As a result of our strong liquidity, we are well positioned to fund increased customer loan demand expected over the next several quarters. 40
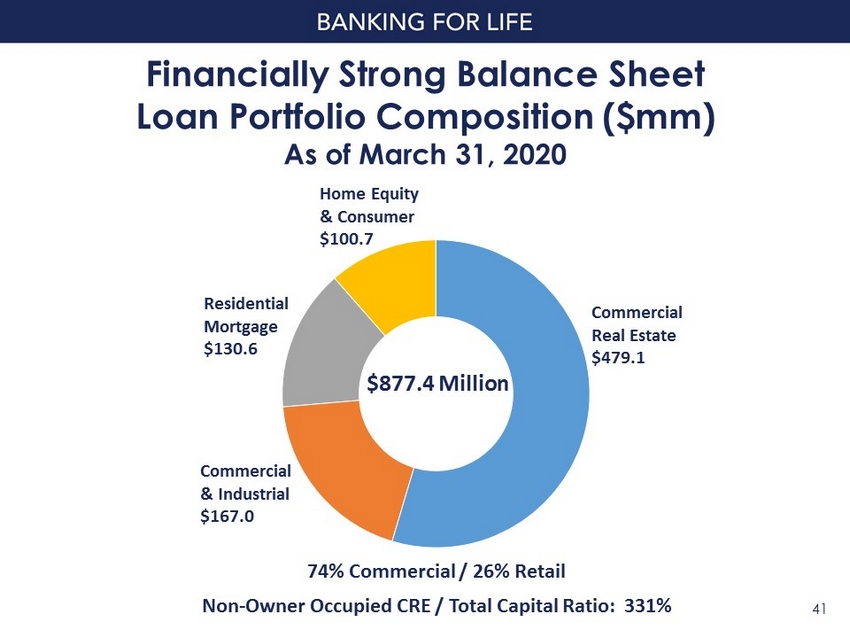
41 Financially Strong Balance Sheet Loan Portfolio Composition ($mm) As of March 31, 2020 Residential Mortgage $130.6 Home Equity & Consumer $100.7 Commercial & Industrial $167.0 Commercial Real Estate $479.1 $877.4 Million 74% Commercial / 26% Retail Non - Owner Occupied CRE / Total Capital Ratio: 331%
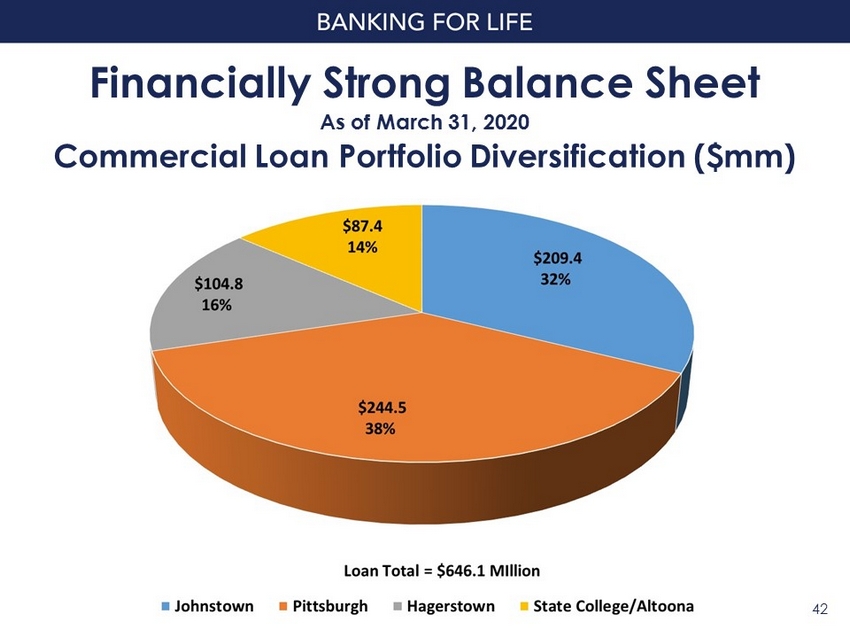
Financially Strong Balance Sheet 42 Commercial Loan Portfolio Diversification ($mm) As of March 31, 2020
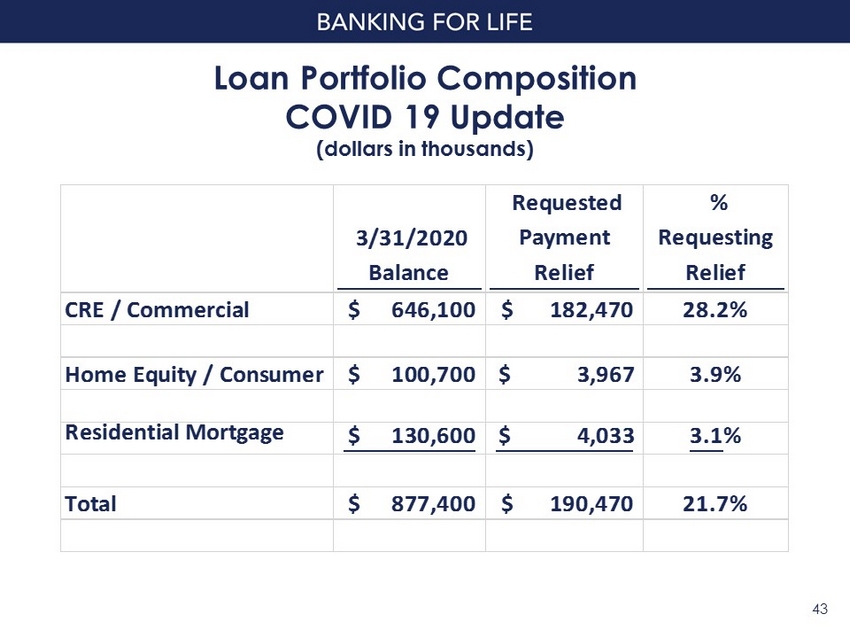
Loan Portfolio Composition COVID 19 Update (dollars in thousands) 43 3/31/2020 Balance Requested Payment Relief % Requesting Relief CRE / Commercial $ 646,100 $ 182,470 28.2% Home Equity / Consumer $ 100,700 $ 3,967 3.9% Residential Mortgage $ 130,600 $ 4,033 3.1% Total $ 877,400 $ 190,470 21.7%

Loan Portfolio Composition COVID 19 Update Type of Payment Relief (dollars in thousands) 44 Number of Loans Dollar Value of Loans Interest Only Payments 3 to 6 Months 80 $ 92,778 Complete Payment Deferrals 3 to 6 Months 244 $ 97,692 Total 324 $ 190,470

Loan Portfolio Composition COVID 19 Update CRE/Comm. Loans in Higher Risk Industries (dollars in thousands) 45 Total Exposure Exposure as a % of Total Loans Customers Requesting Payment Relief Loan Value % of Total Exposure Requesting Relief Hotels $ 45,885 5.2% $ 40,326 88.0% Restaurants $ 6,453 0.7% $ 5,307 82.0% Retail $ 129,034 14.7% $ 29,385 23.0% Total $ 181,372 20.6% $ 75,018 41.4%
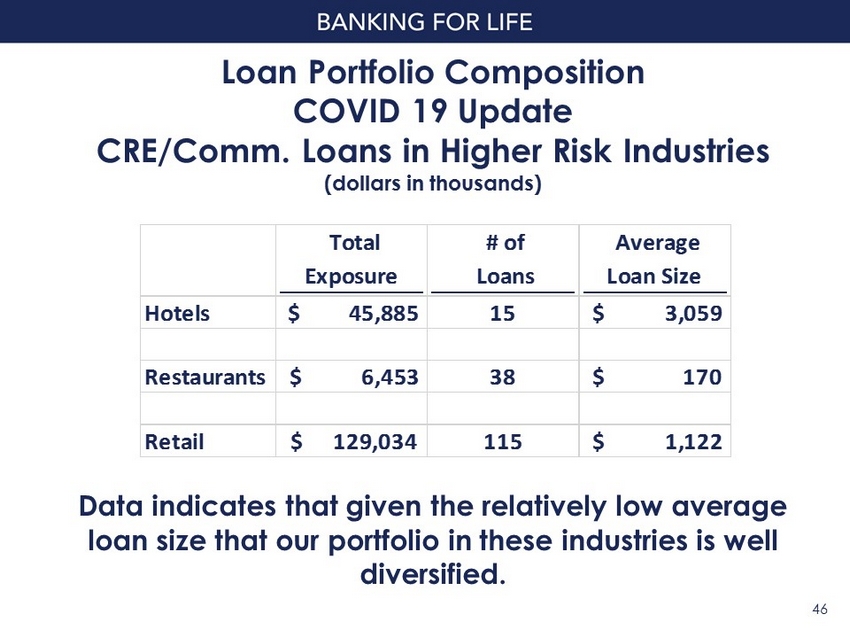
Loan Portfolio Composition COVID 19 Update CRE/Comm. Loans in Higher Risk Industries (dollars in thousands) 46 Total Exposure # of Loans Average Loan Size Hotels $ 45,885 15 $ 3,059 Restaurants $ 6,453 38 $ 170 Retail $ 129,034 115 $ 1,122 Data indicates that given the relatively low average loan size that our portfolio in these industries is well diversified.
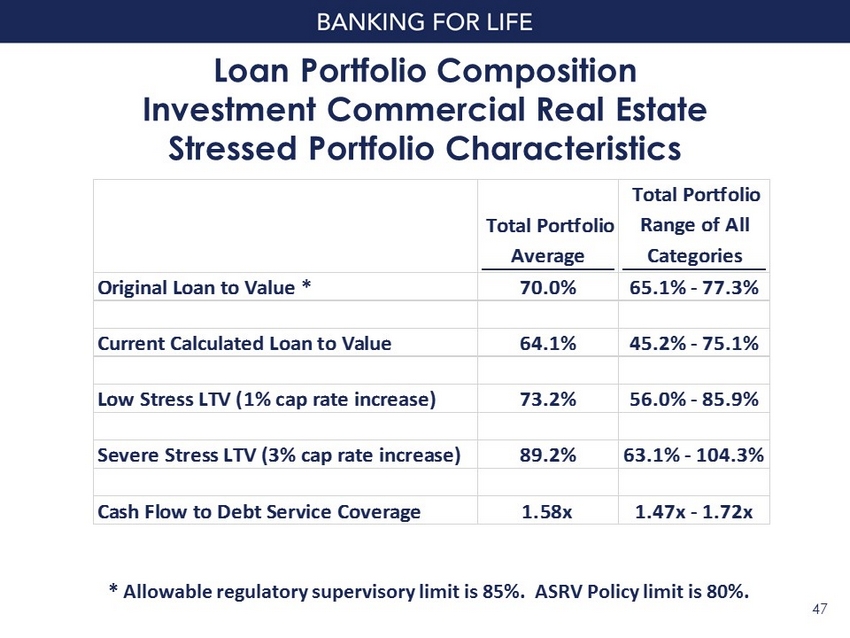
Loan Portfolio Composition Investment Commercial Real Estate Stressed Portfolio Characteristics 47 Total Portfolio Average Total Portfolio Range of All Categories Original Loan to Value * 70.0% 65.1% - 77.3% Current Calculated Loan to Value 64.1% 45.2% - 75.1% Low Stress LTV (1% cap rate increase) 73.2% 56.0% - 85.9% Severe Stress LTV (3% cap rate increase) 89.2% 63.1% - 104.3% Cash Flow to Debt Service Coverage 1.58x 1.47x - 1.72x * Allowable regulatory supervisory limit is 85%. ASRV Policy limit is 80%.

Loan Portfolio Composition Higher Risk Commercial Real Estate Stressed Portfolio Characteristics 48 Hotels Retail Original Loan to Value 70.3% 67.2% Current Calculated Loan to Value 68.8% 56.5% Low Stress LTV (1% cap rate increase) 79.7% 64.3% Severe Stress LTV (3% cap rate increase) 99.4% 78.2% Cash Flow to Debt Service Coverage 1.72x 1.56x
COVID - 19 Paycheck Protection Program (PPP) • Provides small businesses with funds to pay up to eight weeks of payroll costs and certain other expenses. • Targets small businesses with 500 or fewer employees. • PPP loans are eligible for full forgiveness. 49

COVID - 19 Paycheck Protection Program (PPP) • PPP loans have a 1% interest rate and are fully guaranteed by the SBA so there is no credit risk. • Banks earn an attractive processing fee for issuing loans. • As a community bank focusing on small business, the PPP loan program has been very successful for AmeriServ Financial. 50

Paycheck Protection Program Expected Fee Income 51 Loan Amount # of Loans Approvals Fee % Fee Income Loans < $350,000 237 $17,097,000 5.0% $ 855,000 Loans > $350,000 and < $2 Million 31 $21,799,000 3.0% $ 654,000 Loans > $2 Million 2 $ 4,325,000 1.0% $ 43,000 Total 270 $43,221,000 3.6% $ 1,552,000
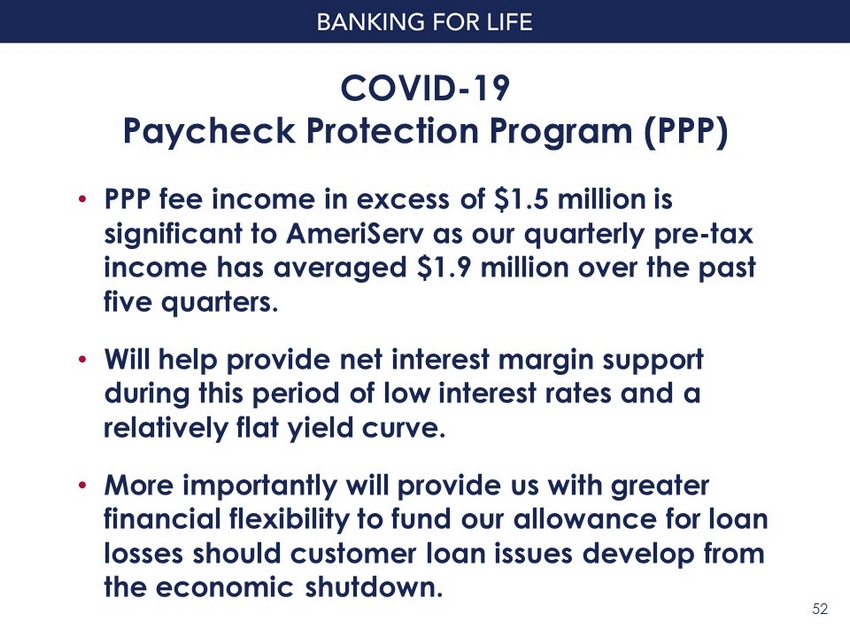
COVID - 19 Paycheck Protection Program (PPP) • PPP fee income in excess of $1.5 million is significant to AmeriServ as our quarterly pre - tax income has averaged $1.9 million over the past five quarters. • Will help provide net interest margin support during this period of low interest rates and a relatively flat yield curve. • More importantly will provide us with greater financial flexibility to fund our allowance for loan losses should customer loan issues develop from the economic shutdown. 52
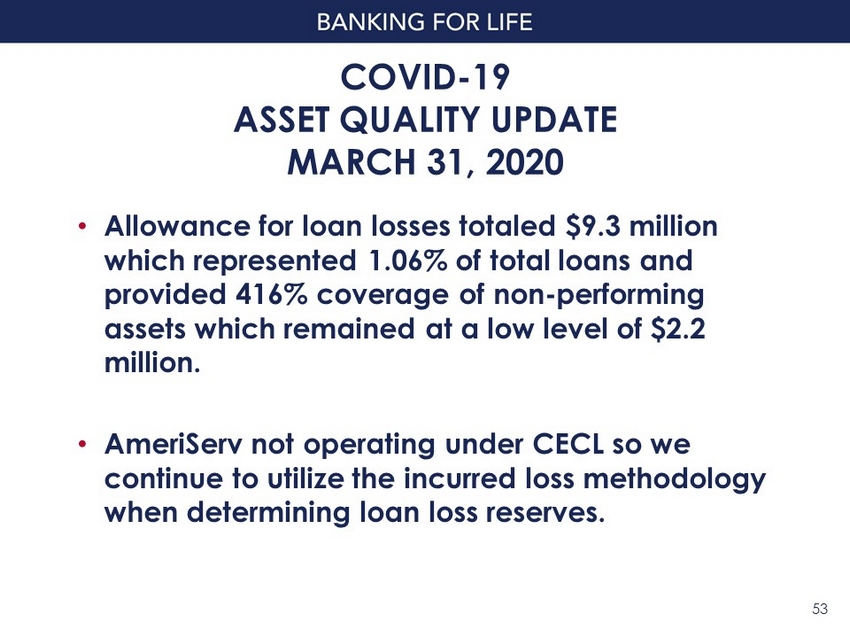
COVID - 19 ASSET QUALITY UPDATE MARCH 31, 2020 • Allowance for loan losses totaled $9.3 million which represented 1.06% of total loans and provided 416% coverage of non - performing assets which remained at a low level of $2.2 million. • AmeriServ not operating under CECL so we continue to utilize the incurred loss methodology when determining loan loss reserves. 53

COVID - 19 ASSET QUALITY UPDATE MARCH 31, 2020 • Strengthened economic risk qualitative factors within the allowance calculation during the first quarter 2020. • Within the allowance for loan losses, $925,000 or almost 10% is considered unallocated or available for general loan portfolio risk. 54

AmeriServ Strategic Plan Strong Capital Returns to Shareholders – Strategic plan goal – Return 75% of earnings to shareholders through a combination of dividends and share repurchases – Focus on growing book value and tangible book value per share – Subject to maintaining sufficient capital to support balance sheet growth 55
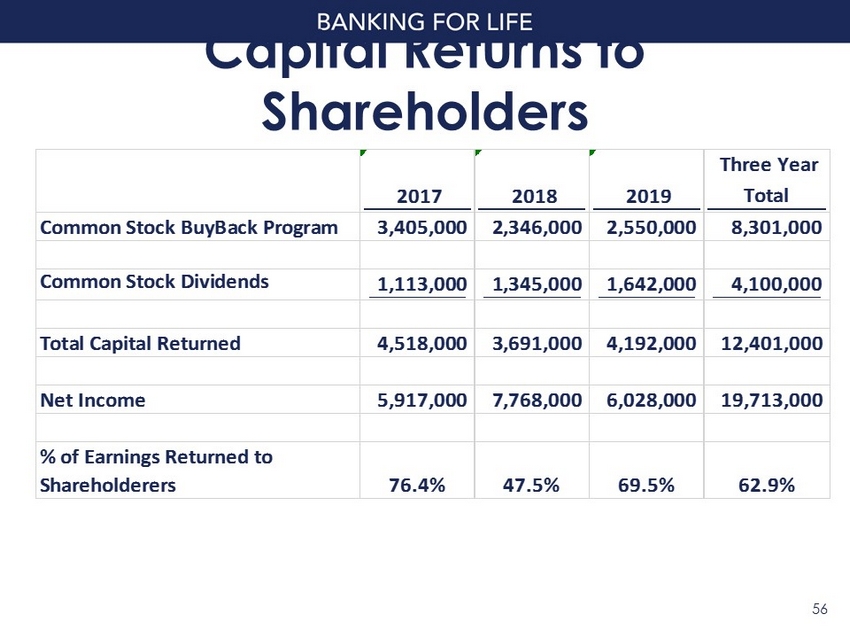
Capital Returns to Shareholders 56 2017 2018 2019 Three Year Total Common Stock BuyBack Program 3,405,000 2,346,000 2,550,000 8,301,000 Common Stock Dividends 1,113,000 1,345,000 1,642,000 4,100,000 Total Capital Returned 4,518,000 3,691,000 4,192,000 12,401,000 Net Income 5,917,000 7,768,000 6,028,000 19,713,000 % of Earnings Returned to Shareholderers 76.4% 47.5% 69.5% 62.9%
Capital Return 3 - Year Summary Common Stock Buybacks • Repurchased 1,975,000 shares at a total cost of $8.3 million or an average price of $4.20 per share. • This represented a 10.5% reduction in outstanding shares since January 1, 2017. • Since all shares were repurchased at a price below tangible book value (TBV), these buybacks were accretive to all shareholders because they favorably impacted both TBV and EPS. 57
Capital Return 3 - Year Summary Common Stock Dividend • Quarterly common stock dividend increased in each of the past three years. • Common dividend payout ratio remained reasonable as it typically averaged less than 30% of net income. • Provides shareholders with ongoing cash return and a competitive dividend yield given the continued low interest rate environment. 58

CAPITAL ALLOCATION COVID - 19 UPDATE • While we work through the COVID - 19 pandemic, our focus is on preserving capital to support customer lending and managing heightened credit risk due to the downturn in the economy. • We fully completed our previously authorized common stock buyback program early in the first quarter of 2020 before the pandemic exploded. Evaluation of a new common stock buyback program is on hold. • We currently believe that we have sufficient capital and earnings power to continue to pay our common stock cash dividend at its current rate of $0.025 per quarter. 59
CAPITAL ALLOCATION COVID - 19 UPDATE • As a result of regulatory changes last year, the regulatory focus on banks with an asset size below $3 billion is now on bank capital levels rather than holding company capital levels. • This change may provide AmeriServ with an opportunity to reduce the cost of debt housed at our parent company (TRUPS – Tier 1 Capital 8.45% rate and Sub Debt – Tier 2 Capital 6.50% rate) once the COVID - 19 pandemic is resolved and markets normalize. 60

Report On Election 62

Question & Answer Period 63

Stay well and stay safe! Thank you for joining us! 64