UNITED STATES
SECURITIES AND EXCHANGE COMMISSION
Washington, D.C. 20549
FORM N-CSR
CERTIFIED SHAREHOLDER REPORT OF REGISTERED
MANAGEMENT INVESTMENT COMPANIES
Investment Company Act file number 811-3583
Fidelity Mt. Vernon Street Trust
(Exact name of registrant as specified in charter)
245 Summer St., Boston, Massachusetts 02210
(Address of principal executive offices) (Zip code)
Marc Bryant, Secretary
245 Summer St.
Boston, Massachusetts 02210
(Name and address of agent for service)
Registrant's telephone number, including area code:
617-563-7000
| |
Date of fiscal year end: | November 30 |
| |
Date of reporting period: | November 30, 2016 |
Item 1.
Reports to Stockholders
Fidelity® Growth Company Fund Class K
Annual Report November 30, 2016 |
 |
Contents
To view a fund's proxy voting guidelines and proxy voting record for the 12-month period ended June 30, visit http://www.fidelity.com/proxyvotingresults or visit the Securities and Exchange Commission's (SEC) web site at http://www.sec.gov.
You may also call 1-800-835-5092 to request a free copy of the proxy voting guidelines.
Standard & Poor's, S&P and S&P 500 are registered service marks of The McGraw-Hill Companies, Inc. and have been licensed for use by Fidelity Distributors Corporation.
Other third-party marks appearing herein are the property of their respective owners.
All other marks appearing herein are registered or unregistered trademarks or service marks of FMR LLC or an affiliated company. © 2017 FMR LLC. All rights reserved.
This report and the financial statements contained herein are submitted for the general information of the shareholders of the Fund. This report is not authorized for distribution to prospective investors in the Fund unless preceded or accompanied by an effective prospectus.
A fund files its complete schedule of portfolio holdings with the SEC for the first and third quarters of each fiscal year on Form N-Q. Forms N-Q are available on the SEC’s web site at http://www.sec.gov. A fund's Forms N-Q may be reviewed and copied at the SEC’s Public Reference Room in Washington, DC. Information regarding the operation of the SEC's Public Reference Room may be obtained by calling 1-800-SEC-0330.
For a complete list of a fund's portfolio holdings, view the most recent holdings listing, semiannual report, or annual report on Fidelity's web site at http://www.fidelity.com, http://www.institutional.fidelity.com, or http://www.401k.com, as applicable.
NOT FDIC INSURED •MAY LOSE VALUE •NO BANK GUARANTEE
Neither the Fund nor Fidelity Distributors Corporation is a bank.
Performance: The Bottom Line
Average annual total return reflects the change in the value of an investment, assuming reinvestment of distributions from dividend income and capital gains (the profits earned upon the sale of securities that have grown in value, if any) and assuming a constant rate of performance each year. The hypothetical investment and the average annual total returns do not reflect the deduction of taxes that a shareholder would pay on fund distributions or the redemption of fund shares. During periods of reimbursement by Fidelity, a fund’s total return will be greater than it would be had the reimbursement not occurred. How a fund did yesterday is no guarantee of how it will do tomorrow.
Average Annual Total Returns
| For the periods ended November 30, 2016 | Past 1 year | Past 5 years | Past 10 years |
| Class K | 3.59% | 15.74% | 9.97% |
The initial offering of Class K shares took place on May 9, 2008. Returns prior to May 9, 2008 are those of Fidelity® Growth Company Fund, the original class of the fund.
$10,000 Over 10 Years
Let's say hypothetically that $10,000 was invested in Fidelity® Growth Company Fund - Class K on November 30, 2006. The chart shows how the value of your investment would have changed, and also shows how the Russell 3000® Growth Index performed over the same period. See above for additional information regarding the performance of Class K.
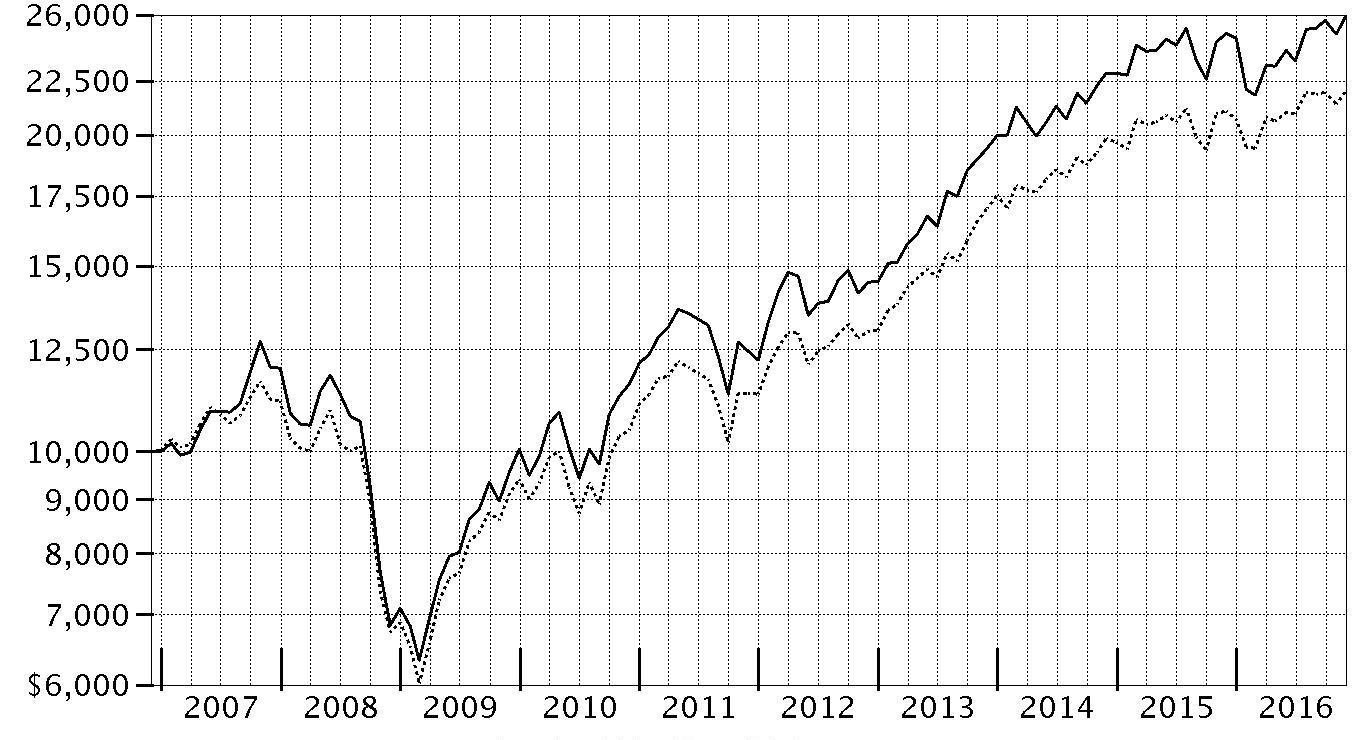
| Period Ending Values |
| $25,866 | Fidelity® Growth Company Fund - Class K |
| $21,953 | Russell 3000® Growth Index |
Management's Discussion of Fund Performance
Market Recap: The S&P 500
® index returned 8.06% for the 12 months ending November 30, 2016, rising sharply in the final month on post-election optimism for economic growth. The period began during a fairly volatile stretch, with stocks hampered by persistent oil-price weakness and U.S.-dollar strength. Markets regained positive momentum in February amid U.S. job gains, a rally in energy and other stimuli that helped keep the roughly seven-year uptrend intact. Markets tumbled briefly following the U.K.'s June 23 vote to exit the European Union – dubbed "Brexit" – then recovered quickly and settled into a flattish stretch until the November 8 U.S. presidential election. For the year, 10 of the 11 sectors in the S&P 500
® advanced, with six posting double-digit gains. Telecommunication services (+16%) led the way, its strength attributable to demand for dividend-paying equities early in the period, as well as to company-specific news. Cyclical sectors including industrials (+15%), financials (+14%), energy (+13%) and materials (+12%) posted strong gains, the latter two driven by a rebound in commodity prices. Conversely, real estate (+1%) lagged the index due to a late-period slump related to expectations for rising interest rates. Consumer discretionary (+3%) also underperformed, as competitive pressure continued to weigh on brick-and-mortar retailers.
Comments from Portfolio Manager Steven Wymer: For the year, the fund’s share classes returned about 4%, modestly underperforming the 4.25% gain of the benchmark Russell 3000 Growth Index. Versus the benchmark, positioning in the pharmaceuticals, biotechnology & life sciences industry weighed most on performance, attributed to stock-specific events and industrywide drug-pricing pressures. Positioning in industrials also hurt. Drugmaker Alnylam Pharmaceuticals was the fund’s biggest relative detractor. Alnylam's shares were cut roughly in half in October when a late-stage trial revealed potential safety issues with one of its drug candidates that sought to treat rare hereditary diseases. The fund's second-largest detractor this period was Regeneron Pharmaceuticals, one of our largest holdings. The firm faced a number of setbacks, including patent infringement woes and concerns about slowing sales growth for its key drug Eylea
®, used to treat macular (retinal) degeneration. Turning to the positive, graphics chipmaker Nvidia was the largest relative contributor to fund performance by far. The company's share price more than doubled this period, boosted by consecutive quarters of better-than-expected financial results.
The views expressed above reflect those of the portfolio manager(s) only through the end of the period as stated on the cover of this report and do not necessarily represent the views of Fidelity or any other person in the Fidelity organization. Any such views are subject to change at any time based upon market or other conditions and Fidelity disclaims any responsibility to update such views. These views may not be relied on as investment advice and, because investment decisions for a Fidelity fund are based on numerous factors, may not be relied on as an indication of trading intent on behalf of any Fidelity fund.
Investment Summary (Unaudited)
Top Ten Stocks as of November 30, 2016
| | % of fund's net assets | % of fund's net assets 6 months ago |
| NVIDIA Corp. | 7.7 | 4.6 |
| Apple, Inc. | 4.8 | 4.3 |
| Amazon.com, Inc. | 4.5 | 4.4 |
| Alphabet, Inc. Class A | 3.9 | 4.0 |
| Facebook, Inc. Class A | 3.0 | 3.3 |
| Salesforce.com, Inc. | 3.0 | 4.7 |
| adidas AG | 2.2 | 1.2 |
| Microsoft Corp. | 2.2 | 1.3 |
| Alphabet, Inc. Class C | 2.0 | 2.0 |
| Alkermes PLC | 1.6 | 1.3 |
| | 34.9 | |
Top Five Market Sectors as of November 30, 2016
| | % of fund's net assets | % of fund's net assets 6 months ago |
| Information Technology | 40.5 | 37.9 |
| Consumer Discretionary | 19.9 | 20.8 |
| Health Care | 19.0 | 18.7 |
| Industrials | 6.9 | 7.5 |
| Consumer Staples | 6.1 | 8.7 |
Prior period industry classifications reflect the categories in place as of the date indicated and have not been adjusted to reflect current industry classifications.
Asset Allocation (% of fund's net assets)
| As of November 30, 2016* |
| | Stocks | 97.3% |
| | Convertible Securities | 2.4% |
| | Short-Term Investments and Net Other Assets (Liabilities) | 0.3% |

* Foreign investments - 8.9%
| As of May 31, 2016* |
| | Stocks | 97.4% |
| | Convertible Securities | 2.3% |
| | Short-Term Investments and Net Other Assets (Liabilities) | 0.3% |

* Foreign investments - 7.9%
Investments November 30, 2016
Showing Percentage of Net Assets
| Common Stocks - 97.3% | | | |
| | | Shares | Value (000s) |
| CONSUMER DISCRETIONARY - 19.8% | | | |
| Auto Components - 0.0% | | | |
| Adient PLC (a) | | 49,986 | $2,677 |
| Automobiles - 0.7% | | | |
| Tesla Motors, Inc. (a)(b) | | 1,401,100 | 265,368 |
| Hotels, Restaurants & Leisure - 3.2% | | | |
| Buffalo Wild Wings, Inc. (a) | | 598,800 | 100,958 |
| China Lodging Group Ltd. ADR | | 367,600 | 19,255 |
| Chipotle Mexican Grill, Inc. (a) | | 145,000 | 57,468 |
| Dave & Buster's Entertainment, Inc. (a) | | 362,342 | 16,976 |
| Del Taco Restaurants, Inc. (a) | | 1,329,800 | 19,309 |
| Domino's Pizza, Inc. | | 278,700 | 46,833 |
| Dunkin' Brands Group, Inc. | | 434,540 | 23,591 |
| Hyatt Hotels Corp. Class A (a) | | 186,940 | 9,597 |
| Las Vegas Sands Corp. | | 907,100 | 56,848 |
| McDonald's Corp. | | 1,399,300 | 166,895 |
| Panera Bread Co. Class A (a)(b) | | 305,400 | 64,778 |
| Papa John's International, Inc. | | 1,020,300 | 90,154 |
| Shake Shack, Inc. Class A (a)(b) | | 177,400 | 6,543 |
| Starbucks Corp. | | 4,985,300 | 288,998 |
| Wingstop, Inc. | | 334,388 | 10,262 |
| Yum China Holdings, Inc. | | 2,587,400 | 72,758 |
| Yum! Brands, Inc. | | 1,281,600 | 81,241 |
| | | | 1,132,464 |
| Household Durables - 0.1% | | | |
| Newell Brands, Inc. | | 231,654 | 10,890 |
| Sony Corp. sponsored ADR | | 1,275,200 | 37,070 |
| | | | 47,960 |
| Internet & Direct Marketing Retail - 6.9% | | | |
| Amazon.com, Inc. (a) | | 2,178,101 | 1,634,817 |
| Ctrip.com International Ltd. ADR (a) | | 1,361,700 | 61,590 |
| Etsy, Inc. (a) | | 222,100 | 2,754 |
| Expedia, Inc. | | 1,099,000 | 136,331 |
| Groupon, Inc. Class A (a) | | 9,796,400 | 38,892 |
| JD.com, Inc. sponsored ADR (a) | | 305,500 | 8,209 |
| Netflix, Inc. (a) | | 2,028,500 | 237,335 |
| Priceline Group, Inc. (a) | | 137,768 | 207,159 |
| The Honest Co., Inc. (a)(c) | | 39,835 | 1,242 |
| TripAdvisor, Inc. (a) | | 126,600 | 6,112 |
| Vipshop Holdings Ltd. ADR (a) | | 4,699,000 | 52,723 |
| Wayfair LLC Class A (a)(b) | | 2,753,967 | 100,382 |
| | | | 2,487,546 |
| Leisure Products - 0.1% | | | |
| Callaway Golf Co. | | 2,565,900 | 31,176 |
| NJOY, Inc. (a)(c) | | 17,666,069 | 0 |
| | | | 31,176 |
| Media - 1.6% | | | |
| Comcast Corp. Class A | | 5,375,700 | 373,665 |
| Lions Gate Entertainment Corp. (b) | | 231,492 | 5,417 |
| The Walt Disney Co. | | 1,850,700 | 183,441 |
| Twenty-First Century Fox, Inc. Class A | | 404,800 | 11,379 |
| | | | 573,902 |
| Multiline Retail - 0.3% | | | |
| Dollar General Corp. | | 244,700 | 18,920 |
| Dollar Tree, Inc. (a) | | 595,400 | 52,490 |
| Target Corp. | | 284,689 | 21,989 |
| | | | 93,399 |
| Specialty Retail - 1.5% | | | |
| AutoNation, Inc. (a) | | 317,600 | 14,184 |
| CarMax, Inc. (a)(b) | | 319,721 | 18,477 |
| DavidsTea, Inc. (a) | | 982,600 | 9,384 |
| Home Depot, Inc. | | 2,574,700 | 333,166 |
| L Brands, Inc. | | 695,400 | 48,831 |
| Restoration Hardware Holdings, Inc. (a)(b)(d) | | 2,151,049 | 77,545 |
| TJX Companies, Inc. | | 386,000 | 30,239 |
| | | | 531,826 |
| Textiles, Apparel & Luxury Goods - 5.4% | | | |
| adidas AG | | 5,275,500 | 777,258 |
| Aritzia LP (a) | | 1,620,800 | 21,236 |
| Columbia Sportswear Co. | | 171,000 | 9,725 |
| Kate Spade & Co. (a) | | 3,704,715 | 55,015 |
| lululemon athletica, Inc. (a)(d) | | 8,984,923 | 512,051 |
| NIKE, Inc. Class B | | 3,772,700 | 188,899 |
| Skechers U.S.A., Inc. Class A (sub. vtg.) (a) | | 9,868,940 | 224,814 |
| Tory Burch LLC: | | | |
| Class A unit (a)(c)(e) | | 950,844 | 52,810 |
| Class B(a)(c)(e) | | 324,840 | 19,241 |
| Under Armour, Inc.: | | | |
| Class A (sub. vtg.) (a)(b) | | 430,500 | 13,259 |
| Class C (non-vtg.) | | 417,804 | 10,771 |
| VF Corp. | | 582,800 | 31,768 |
| | | | 1,916,847 |
|
| TOTAL CONSUMER DISCRETIONARY | | | 7,083,165 |
|
| CONSUMER STAPLES - 6.1% | | | |
| Beverages - 2.4% | | | |
| Constellation Brands, Inc. Class A (sub. vtg.) | | 360,600 | 54,501 |
| Dr. Pepper Snapple Group, Inc. | | 200,400 | 17,383 |
| Monster Beverage Corp. (a) | | 9,123,318 | 408,268 |
| PepsiCo, Inc. | | 1,161,640 | 116,280 |
| The Coca-Cola Co. | | 6,155,300 | 248,366 |
| | | | 844,798 |
| Food & Staples Retailing - 1.2% | | | |
| Costco Wholesale Corp. | | 1,404,300 | 210,799 |
| CVS Health Corp. | | 1,057,100 | 81,280 |
| Drogasil SA | | 2,947,473 | 56,203 |
| Kroger Co. | | 381,950 | 12,337 |
| Sprouts Farmers Market LLC (a) | | 66,200 | 1,325 |
| Walgreens Boots Alliance, Inc. | | 669,900 | 56,761 |
| Whole Foods Market, Inc. | | 699,600 | 21,261 |
| | | | 439,966 |
| Food Products - 0.7% | | | |
| Campbell Soup Co. | | 148,100 | 8,425 |
| General Mills, Inc. | | 173,800 | 10,591 |
| Mead Johnson Nutrition Co. Class A | | 1,095,000 | 78,939 |
| Mondelez International, Inc. | | 681,400 | 28,101 |
| The Hain Celestial Group, Inc. (a) | | 349,300 | 13,689 |
| The Hershey Co. | | 296,800 | 28,683 |
| The Kraft Heinz Co. | | 513,900 | 41,960 |
| Tyson Foods, Inc. Class A | | 380,100 | 21,593 |
| | | | 231,981 |
| Household Products - 0.3% | | | |
| Church & Dwight Co., Inc. | | 923,500 | 40,440 |
| Colgate-Palmolive Co. | | 481,700 | 31,421 |
| Kimberly-Clark Corp. | | 284,300 | 32,868 |
| Procter & Gamble Co. | | 148,100 | 12,212 |
| | | | 116,941 |
| Personal Products - 0.7% | | | |
| Coty, Inc. Class A | | 8,797,900 | 164,609 |
| Herbalife Ltd. (a) | | 1,637,110 | 80,268 |
| | | | 244,877 |
| Tobacco - 0.8% | | | |
| Altria Group, Inc. | | 2,884,580 | 184,411 |
| Japan Tobacco, Inc. | | 412,600 | 14,304 |
| Philip Morris International, Inc. | | 527,680 | 46,584 |
| Reynolds American, Inc. | | 1,008,726 | 54,572 |
| | | | 299,871 |
|
| TOTAL CONSUMER STAPLES | | | 2,178,434 |
|
| ENERGY - 2.6% | | | |
| Energy Equipment & Services - 0.8% | | | |
| Baker Hughes, Inc. | | 2,258,800 | 145,309 |
| Halliburton Co. | | 546,200 | 28,998 |
| Schlumberger Ltd. | | 204,000 | 17,146 |
| U.S. Silica Holdings, Inc. | | 1,655,100 | 83,765 |
| | | | 275,218 |
| Oil, Gas & Consumable Fuels - 1.8% | | | |
| Anadarko Petroleum Corp. | | 505,500 | 34,955 |
| Cabot Oil & Gas Corp. | | 1,458,400 | 32,260 |
| Concho Resources, Inc. (a) | | 653,500 | 93,464 |
| Continental Resources, Inc. (a) | | 715,200 | 41,489 |
| EOG Resources, Inc. | | 1,534,600 | 157,327 |
| Hess Corp. | | 268,600 | 15,031 |
| Noble Energy, Inc. | | 1,161,711 | 44,331 |
| PDC Energy, Inc. (a) | | 531,200 | 39,548 |
| Pioneer Natural Resources Co. | | 647,207 | 123,642 |
| Range Resources Corp. | | 1,606,900 | 56,531 |
| Valero Energy Corp. | | 243,700 | 15,002 |
| | | | 653,580 |
|
| TOTAL ENERGY | | | 928,798 |
|
| FINANCIALS - 2.4% | | | |
| Banks - 1.0% | | | |
| Citigroup, Inc. | | 577,780 | 32,581 |
| HDFC Bank Ltd. sponsored ADR | | 1,601,474 | 103,327 |
| JPMorgan Chase & Co. | | 2,005,300 | 160,765 |
| Signature Bank (a) | | 64,385 | 9,652 |
| Wells Fargo & Co. | | 866,900 | 45,876 |
| | | | 352,201 |
| Capital Markets - 1.3% | | | |
| BlackRock, Inc. Class A | | 448,800 | 166,411 |
| BM&F BOVESPA SA | | 5,757,397 | 28,276 |
| Charles Schwab Corp. | | 6,684,675 | 258,430 |
| RPI International Holdings LP (c) | | 130,847 | 17,149 |
| | | | 470,266 |
| Consumer Finance - 0.1% | | | |
| American Express Co. | | 255,548 | 18,410 |
| Discover Financial Services | | 112,644 | 7,634 |
| | | | 26,044 |
|
| TOTAL FINANCIALS | | | 848,511 |
|
| HEALTH CARE - 18.1% | | | |
| Biotechnology - 13.8% | | | |
| AbbVie, Inc. | | 1,068,200 | 64,947 |
| AbbVie, Inc. (f) | | 642,091 | 38,649 |
| ACADIA Pharmaceuticals, Inc. (a)(d) | | 2,929,105 | 79,057 |
| ACADIA Pharmaceuticals, Inc. (a)(b)(d) | | 4,036,694 | 108,950 |
| Adaptimmune Therapeutics PLC sponsored ADR (a) | | 685,400 | 2,858 |
| Adverum Biotechnologies, Inc. (a) | | 986,400 | 2,811 |
| Agios Pharmaceuticals, Inc. (a)(b) | | 1,529,287 | 89,020 |
| Aimmune Therapeutics, Inc. (a) | | 211,900 | 4,810 |
| Alder Biopharmaceuticals, Inc. (a)(b) | | 450,600 | 10,612 |
| Alexion Pharmaceuticals, Inc. (a) | | 1,864,860 | 228,613 |
| Alkermes PLC (a)(d) | | 9,933,061 | 564,496 |
| Alnylam Pharmaceuticals, Inc. (a)(d) | | 4,824,103 | 211,633 |
| Amgen, Inc. | | 1,895,000 | 273,013 |
| Array BioPharma, Inc. (a) | | 6,163,770 | 49,896 |
| aTyr Pharma, Inc. (a)(b)(d) | | 562,107 | 1,743 |
| aTyr Pharma, Inc. (a)(d)(f) | | 1,469,144 | 4,554 |
| BeiGene Ltd. ADR (b) | | 1,884,861 | 59,750 |
| Biogen, Inc. (a) | | 354,500 | 104,248 |
| bluebird bio, Inc. (a)(b)(d) | | 2,434,481 | 146,921 |
| Celgene Corp. (a) | | 1,263,088 | 149,689 |
| Celldex Therapeutics, Inc. (a)(b) | | 5,853,416 | 22,302 |
| Cellectis SA sponsored ADR (a) | | 701,962 | 11,835 |
| Chimerix, Inc. (a)(d) | | 2,915,257 | 14,256 |
| Coherus BioSciences, Inc. (a)(b) | | 2,029,917 | 54,605 |
| Corvus Pharmaceuticals, Inc. | | 330,300 | 5,097 |
| CytomX Therapeutics, Inc. (a) | | 678,978 | 7,564 |
| CytomX Therapeutics, Inc. (f) | | 794,033 | 8,846 |
| Dicerna Pharmaceuticals, Inc. (a) | | 875,550 | 2,609 |
| Editas Medicine, Inc. | | 1,264,682 | 18,047 |
| Exelixis, Inc. (a)(d) | | 18,229,867 | 308,449 |
| Fate Therapeutics, Inc. (a)(b) | | 1,676,206 | 4,928 |
| Five Prime Therapeutics, Inc. (a) | | 1,119,055 | 64,368 |
| Galapagos Genomics NV sponsored ADR (a) | | 1,120,098 | 66,220 |
| Genocea Biosciences, Inc. (a)(b) | | 518,900 | 2,086 |
| Gilead Sciences, Inc. | | 2,919,795 | 215,189 |
| Global Blood Therapeutics, Inc. (a) | | 668,417 | 12,800 |
| Heron Therapeutics, Inc. (a)(b) | | 918,591 | 14,100 |
| Intellia Therapeutics, Inc. (a)(b) | | 1,382,500 | 21,774 |
| Intercept Pharmaceuticals, Inc. (a)(b) | | 158,654 | 16,043 |
| Intrexon Corp. (a)(b) | | 551,275 | 16,086 |
| Ionis Pharmaceuticals, Inc. (a)(b)(d) | | 8,098,427 | 354,387 |
| Ironwood Pharmaceuticals, Inc. Class A (a) | | 6,028,193 | 94,070 |
| Lexicon Pharmaceuticals, Inc. (a)(b)(d) | | 6,811,148 | 103,734 |
| Macrogenics, Inc. (a) | | 157,921 | 4,095 |
| Merrimack Pharmaceuticals, Inc. (a)(b)(d) | | 7,509,421 | 41,377 |
| Momenta Pharmaceuticals, Inc. (a)(d) | | 5,402,265 | 76,442 |
| Opko Health, Inc. (a) | | 422,498 | 4,390 |
| PhaseRx, Inc. (b) | | 298,252 | 626 |
| Protagonist Therapeutics, Inc. | | 270,458 | 6,748 |
| Prothena Corp. PLC (a)(d) | | 2,145,423 | 126,623 |
| Regeneron Pharmaceuticals, Inc. (a) | | 1,271,218 | 482,097 |
| Regulus Therapeutics, Inc. (a)(d) | | 3,115,245 | 7,632 |
| Rigel Pharmaceuticals, Inc. (a)(d) | | 8,211,095 | 21,349 |
| Sage Therapeutics, Inc. (a)(b)(d) | | 1,997,456 | 100,093 |
| Seattle Genetics, Inc.(a) | | 3,503,836 | 227,084 |
| Seres Therapeutics, Inc. (a) | | 1,321,311 | 13,200 |
| Seres Therapeutics, Inc. (f) | | 572,827 | 5,723 |
| Shire PLC sponsored ADR | | 101,316 | 17,690 |
| Spark Therapeutics, Inc. (a)(b) | | 352,788 | 19,407 |
| Syros Pharmaceuticals, Inc. (b)(d) | | 816,234 | 11,084 |
| Syros Pharmaceuticals, Inc. (d) | | 938,008 | 12,101 |
| TESARO, Inc. (a) | | 122,793 | 16,662 |
| Ultragenyx Pharmaceutical, Inc. (a)(b) | | 838,000 | 65,607 |
| Versartis, Inc. (a) | | 590,494 | 7,352 |
| Vertex Pharmaceuticals, Inc. (a) | | 335,967 | 27,418 |
| | | | 4,930,465 |
| Health Care Equipment & Supplies - 1.4% | | | |
| Abbott Laboratories | | 529,900 | 20,173 |
| Align Technology, Inc. (a) | | 151,256 | 14,074 |
| Baxter International, Inc. | | 508,100 | 22,544 |
| Danaher Corp. | | 1,518,200 | 118,678 |
| DexCom, Inc. (a) | | 537,900 | 35,119 |
| Entellus Medical, Inc. (a)(b) | | 407,300 | 7,507 |
| Genmark Diagnostics, Inc. (a) | | 1,340,553 | 15,577 |
| Insulet Corp. (a) | | 1,980,482 | 66,643 |
| Intuitive Surgical, Inc. (a) | | 98,293 | 63,275 |
| Novocure Ltd. (a)(b) | | 1,262,000 | 9,781 |
| Novocure Ltd. (f) | | 571,461 | 4,429 |
| Penumbra, Inc. (a)(b) | | 1,267,087 | 78,433 |
| Presbia PLC (a)(d) | | 1,183,529 | 5,184 |
| St. Jude Medical, Inc. | | 402,400 | 31,870 |
| Zeltiq Aesthetics, Inc. (a)(b) | | 427,300 | 18,805 |
| | | | 512,092 |
| Health Care Providers & Services - 0.9% | | | |
| Apollo Hospitals Enterprise Ltd. | | 720,000 | 12,549 |
| Cardinal Health, Inc. | | 767,700 | 54,514 |
| Express Scripts Holding Co. (a) | | 352,003 | 26,710 |
| Laboratory Corp. of America Holdings (a) | | 178,000 | 22,401 |
| McKesson Corp. | | 478,900 | 68,871 |
| UnitedHealth Group, Inc. | | 897,300 | 142,061 |
| | | | 327,106 |
| Health Care Technology - 0.3% | | | |
| athenahealth, Inc. (a)(b) | | 757,700 | 71,678 |
| Castlight Health, Inc. Class B (a)(b) | | 2,420,594 | 11,256 |
| Cerner Corp. (a) | | 206,100 | 10,260 |
| | | | 93,194 |
| Life Sciences Tools & Services - 0.1% | | | |
| Divi's Laboratories Ltd. | | 124,668 | 2,132 |
| Illumina, Inc. (a) | | 180,838 | 24,077 |
| | | | 26,209 |
| Pharmaceuticals - 1.6% | | | |
| Adimab LLC unit (a)(c)(e) | | 3,162,765 | 76,033 |
| Allergan PLC | | 318,038 | 61,795 |
| Avexis, Inc. (b) | | 934,341 | 55,238 |
| Bristol-Myers Squibb Co. | | 2,952,500 | 166,639 |
| Castle Creek Pharmaceuticals, LLC Class A-2 unit (c)(e) | | 46,864 | 15,465 |
| Cempra, Inc. (a)(b) | | 401,900 | 2,612 |
| Endocyte, Inc. (a)(b) | | 1,837,415 | 4,888 |
| Intra-Cellular Therapies, Inc. (a)(b)(d) | | 3,416,199 | 47,622 |
| Jazz Pharmaceuticals PLC (a) | | 451,900 | 46,830 |
| Kolltan Pharmaceuticals, Inc. rights (a) | | 7,940,644 | 1,334 |
| Mylan N.V. (a) | | 117,800 | 4,313 |
| Stemcentrx, Inc. rights 12/31/21 (a) | | 2,065,715 | 5,701 |
| Teva Pharmaceutical Industries Ltd. sponsored ADR | | 631,800 | 23,819 |
| The Medicines Company (a) | | 1,961,778 | 68,858 |
| Theravance Biopharma, Inc. (a)(b) | | 312,600 | 8,703 |
| | | | 589,850 |
|
| TOTAL HEALTH CARE | | | 6,478,916 |
|
| INDUSTRIALS - 6.6% | | | |
| Aerospace & Defense - 0.8% | | | |
| Lockheed Martin Corp. | | 562,400 | 149,177 |
| Northrop Grumman Corp. | | 74,221 | 18,529 |
| Space Exploration Technologies Corp. Class A (a)(c) | | 356,922 | 37,116 |
| The Boeing Co. | | 653,400 | 98,376 |
| | | | 303,198 |
| Air Freight & Logistics - 0.4% | | | |
| FedEx Corp. | | 106,300 | 20,375 |
| United Parcel Service, Inc. Class B | | 1,148,600 | 133,146 |
| | | | 153,521 |
| Airlines - 2.6% | | | |
| Allegiant Travel Co. | | 387,800 | 63,367 |
| Delta Air Lines, Inc. | | 1,400,600 | 67,481 |
| InterGlobe Aviation Ltd. (a) | | 632,349 | 7,923 |
| JetBlue Airways Corp. (a) | | 10,018,423 | 201,270 |
| Ryanair Holdings PLC sponsored ADR | | 551,152 | 44,004 |
| Southwest Airlines Co. | | 3,188,315 | 148,607 |
| Spirit Airlines, Inc. (a) | | 2,294,460 | 127,572 |
| United Continental Holdings, Inc. (a) | | 2,607,500 | 179,787 |
| Wheels Up Partners Holdings LLC Series B unit (a)(c)(e) | | 6,703,518 | 18,032 |
| Wizz Air Holdings PLC (a)(d) | | 3,073,536 | 64,452 |
| | | | 922,495 |
| Building Products - 0.1% | | | |
| Tyco International Ltd. | | 500,066 | 22,493 |
| Electrical Equipment - 0.3% | | | |
| AMETEK, Inc. | | 76,300 | 3,613 |
| Eaton Corp. PLC | | 506,800 | 33,707 |
| Emerson Electric Co. | | 440,700 | 24,873 |
| Fortive Corp. | | 759,300 | 41,754 |
| | | | 103,947 |
| Industrial Conglomerates - 0.9% | | | |
| 3M Co. | | 1,014,400 | 174,213 |
| Honeywell International, Inc. | | 1,325,500 | 151,027 |
| | | | 325,240 |
| Machinery - 1.2% | | | |
| Caterpillar, Inc. | | 2,962,400 | 283,087 |
| Cummins, Inc. | | 137,400 | 19,481 |
| Deere & Co. | | 383,500 | 38,427 |
| Illinois Tool Works, Inc. | | 342,700 | 42,899 |
| Wabtec Corp. | | 242,600 | 20,541 |
| Xylem, Inc. | | 761,700 | 39,288 |
| | | | 443,723 |
| Road & Rail - 0.3% | | | |
| Union Pacific Corp. | | 905,000 | 91,704 |
|
| TOTAL INDUSTRIALS | | | 2,366,321 |
|
| INFORMATION TECHNOLOGY - 39.4% | | | |
| Communications Equipment - 0.4% | | | |
| Arista Networks, Inc. (a) | | 68,400 | 6,485 |
| Cisco Systems, Inc. | | 666,200 | 19,866 |
| Infinera Corp. (a)(d) | | 12,561,828 | 106,776 |
| Palo Alto Networks, Inc. (a) | | 86,300 | 11,596 |
| | | | 144,723 |
| Electronic Equipment & Components - 0.2% | | | |
| TE Connectivity Ltd. | | 129,900 | 8,786 |
| Trimble, Inc. (a) | | 1,648,200 | 46,463 |
| | | | 55,249 |
| Internet Software & Services - 10.7% | | | |
| Actua Corp. (a)(d) | | 3,188,221 | 43,200 |
| Akamai Technologies, Inc. (a) | | 260,800 | 17,395 |
| Alibaba Group Holding Ltd. sponsored ADR (a) | | 1,411,700 | 132,728 |
| Alphabet, Inc.: | | | |
| Class A (a) | | 1,786,778 | 1,386,325 |
| Class C (a) | | 925,883 | 701,856 |
| Apptio, Inc. (d) | | 881,266 | 15,712 |
| Apptio, Inc. Class A (d) | | 414,600 | 8,213 |
| Baidu.com, Inc. sponsored ADR (a) | | 22,698 | 3,789 |
| Criteo SA sponsored ADR (a)(b) | | 307,783 | 12,702 |
| Dropbox, Inc. (a)(c) | | 1,105,082 | 14,057 |
| eBay, Inc. (a) | | 3,167,700 | 88,094 |
| Facebook, Inc. Class A (a) | | 9,149,291 | 1,083,459 |
| GoDaddy, Inc. (a) | | 447,800 | 15,825 |
| Hortonworks, Inc. (a)(b) | | 272,500 | 2,477 |
| NAVER Corp. | | 9,827 | 6,659 |
| New Relic, Inc. (a)(b) | | 519,279 | 16,466 |
| Nutanix, Inc.: | | | |
| Class A (a)(b)(d) | | 964,600 | 30,867 |
| Class B (d) | | 1,151,309 | 33,158 |
| Shopify, Inc. Class A (a) | | 3,912,942 | 163,052 |
| Tencent Holdings Ltd. | | 791,500 | 19,709 |
| Twitter, Inc. (a)(b) | | 42,590 | 787 |
| Wix.com Ltd. (a) | | 1,019,000 | 50,441 |
| | | | 3,846,971 |
| IT Services - 2.7% | | | |
| Cognizant Technology Solutions Corp. Class A (a) | | 1,055,032 | 58,111 |
| IBM Corp. | | 169,700 | 27,529 |
| MasterCard, Inc. Class A | | 2,877,800 | 294,111 |
| PayPal Holdings, Inc. (a) | | 3,626,600 | 142,453 |
| Visa, Inc. Class A | | 5,528,405 | 427,456 |
| | | | 949,660 |
| Semiconductors & Semiconductor Equipment - 11.2% | | | |
| Advanced Micro Devices, Inc. (a) | | 4,636,400 | 41,310 |
| Applied Materials, Inc. | | 224,300 | 7,222 |
| Applied Micro Circuits Corp. (a)(d) | | 6,066,489 | 53,082 |
| ASML Holding NV | | 230,693 | 23,791 |
| Broadcom Ltd. | | 707,402 | 120,605 |
| Cavium, Inc. (a) | | 2,477,460 | 141,290 |
| Cirrus Logic, Inc. (a) | | 3,013,367 | 165,735 |
| Cree, Inc. (a) | | 3,479,371 | 88,098 |
| Intel Corp. | | 392,200 | 13,609 |
| KLA-Tencor Corp. | | 288,300 | 23,018 |
| M/A-COM Technology Solutions Holdings, Inc. (a) | | 292,414 | 14,568 |
| Mellanox Technologies Ltd. (a) | | 809,889 | 33,570 |
| Micron Technology, Inc. (a) | | 327,300 | 6,392 |
| NVIDIA Corp. (d) | | 30,031,051 | 2,768,858 |
| NXP Semiconductors NV (a) | | 285,000 | 28,258 |
| Qorvo, Inc. (a) | | 269,400 | 14,389 |
| Rambus, Inc. (a) | | 2,837,000 | 37,307 |
| Silicon Laboratories, Inc. (a)(d) | | 3,247,273 | 215,457 |
| Skyworks Solutions, Inc. | | 146,031 | 11,222 |
| Taiwan Semiconductor Manufacturing Co. Ltd. sponsored ADR | | 1,451,700 | 43,101 |
| Texas Instruments, Inc. | | 2,278,900 | 168,479 |
| | | | 4,019,361 |
| Software - 9.2% | | | |
| Activision Blizzard, Inc. | | 7,699,808 | 281,890 |
| Adobe Systems, Inc. (a) | | 1,478,736 | 152,029 |
| Appirio, Inc. Escrow(c) | | 389,363 | 94 |
| Atlassian Corp. PLC | | 233,800 | 6,345 |
| Autodesk, Inc. (a) | | 716,800 | 52,047 |
| CyberArk Software Ltd. (a) | | 1,429,900 | 72,939 |
| Electronic Arts, Inc. (a) | | 2,409,152 | 190,901 |
| HubSpot, Inc. (a)(d) | | 1,782,554 | 100,001 |
| Intuit, Inc. | | 545,200 | 61,978 |
| Microsoft Corp. | | 12,868,617 | 775,463 |
| Oracle Corp. | | 1,156,100 | 46,464 |
| Paylocity Holding Corp. (a) | | 203,700 | 6,745 |
| Proofpoint, Inc. (a) | | 475,000 | 36,580 |
| Red Hat, Inc. (a) | | 4,684,986 | 370,629 |
| Salesforce.com, Inc. (a) | | 14,997,612 | 1,079,828 |
| ServiceNow, Inc. (a) | | 535,600 | 44,535 |
| Zendesk, Inc. (a) | | 1,649,500 | 35,118 |
| | | | 3,313,586 |
| Technology Hardware, Storage & Peripherals - 5.0% | | | |
| Apple, Inc. | | 15,573,548 | 1,721,189 |
| Pure Storage, Inc. Class A (a) | | 4,463,819 | 62,270 |
| Samsung Electronics Co. Ltd. | | 12,683 | 18,805 |
| Western Digital Corp. | | 109,213 | 6,952 |
| | | | 1,809,216 |
|
| TOTAL INFORMATION TECHNOLOGY | | | 14,138,766 |
|
| MATERIALS - 1.4% | | | |
| Chemicals - 1.4% | | | |
| AdvanSix, Inc. (a) | | 77,124 | 1,442 |
| CF Industries Holdings, Inc. | | 1,226,525 | 35,496 |
| E.I. du Pont de Nemours & Co. | | 1,422,800 | 104,732 |
| Monsanto Co. | | 926,271 | 95,137 |
| Praxair, Inc. | | 213,300 | 25,660 |
| The Dow Chemical Co. | | 1,403,800 | 78,220 |
| The Mosaic Co. | | 307,200 | 8,724 |
| The Scotts Miracle-Gro Co. Class A | | 1,595,000 | 145,576 |
| | | | 494,987 |
| REAL ESTATE - 0.3% | | | |
| Equity Real Estate Investment Trusts (REITs) - 0.3% | | | |
| American Tower Corp. | | 1,131,500 | 115,719 |
| TELECOMMUNICATION SERVICES - 0.6% | | | |
| Diversified Telecommunication Services - 0.1% | | | |
| Verizon Communications, Inc. | | 1,223,000 | 61,028 |
| Wireless Telecommunication Services - 0.5% | | | |
| T-Mobile U.S., Inc. (a) | | 3,147,500 | 170,626 |
|
| TOTAL TELECOMMUNICATION SERVICES | | | 231,654 |
|
| TOTAL COMMON STOCKS | | | |
| (Cost $19,399,252) | | | 34,865,271 |
|
| Preferred Stocks - 2.4% | | | |
| Convertible Preferred Stocks - 2.4% | | | |
| CONSUMER DISCRETIONARY - 0.1% | | | |
| Hotels, Restaurants & Leisure - 0.0% | | | |
| MOD Super Fast Pizza Holdings LLC Series 3 Preferred unit (c)(e) | | 56,343 | 7,719 |
| Household Durables - 0.1% | | | |
| Roku, Inc.: | | | |
| Series F, 8.00% (a)(c) | | 17,901,305 | 31,327 |
| Series G, 8.00% (a)(c) | | 2,750,007 | 4,813 |
| Series H (c) | | 823,979 | 1,442 |
| | | | 37,582 |
| Internet & Direct Marketing Retail - 0.0% | | | |
| The Honest Co., Inc.: | | | |
| Series C (a)(c) | | 92,950 | 3,061 |
| Series D (a)(c) | | 69,363 | 2,530 |
| | | | 5,591 |
| Media - 0.0% | | | |
| Turn, Inc. Series E (a)(c) | | 984,774 | 3,121 |
| TOTAL CONSUMER DISCRETIONARY | | | 54,013 |
| CONSUMER STAPLES - 0.0% | | | |
| Food & Staples Retailing - 0.0% | | | |
| Blue Apron, Inc. Series D (a)(c) | | 750,363 | 10,858 |
| FINANCIALS - 0.0% | | | |
| Diversified Financial Services - 0.0% | | | |
| UNITY Biotechnology, Inc. Series B (c) | | 2,214,616 | 8,194 |
| HEALTH CARE - 0.9% | | | |
| Biotechnology - 0.8% | | | |
| 10X Genomics, Inc. Series C (c) | | 2,105,333 | 10,085 |
| Immunocore Ltd. Series A (a)(c) | | 67,323 | 14,865 |
| Intarcia Therapeutics, Inc.: | | | |
| Series CC (a)(c) | | 1,051,411 | 63,085 |
| Series DD (a)(c) | | 1,543,687 | 92,621 |
| Moderna Therapeutics, Inc.: | | | |
| Series D (c) | | 4,688,230 | 41,163 |
| Series E (c) | | 5,651,170 | 49,617 |
| Series F (c) | | 140,212 | 1,231 |
| RaNA Therapeutics LLC Series B (a)(c) | | 4,408,601 | 3,042 |
| | | | 275,709 |
| Health Care Providers & Services - 0.1% | | | |
| Mulberry Health, Inc. Series A8 (c) | | 2,790,742 | 18,224 |
| Health Care Technology - 0.0% | | | |
| Codiak Biosciences, Inc.: | | | |
| Series A (c) | | 589,863 | 1,557 |
| Series B (c) | | 1,917,058 | 5,061 |
| | | | 6,618 |
| TOTAL HEALTH CARE | | | 300,551 |
| INDUSTRIALS - 0.3% | | | |
| Aerospace & Defense - 0.1% | | | |
| Space Exploration Technologies Corp. Series G (a)(c) | | 216,276 | 22,491 |
| Commercial Services & Supplies - 0.1% | | | |
| Domo, Inc. Series D (a)(c) | | 2,990,903 | 20,317 |
| Professional Services - 0.1% | | | |
| YourPeople, Inc. Series C (c) | | 5,833,137 | 55,590 |
| TOTAL INDUSTRIALS | | | 98,398 |
| INFORMATION TECHNOLOGY - 1.1% | | | |
| Internet Software & Services - 0.7% | | | |
| Jet.Com, Inc. Series B1 Escrow(c) | | 7,578,338 | 2,489 |
| Uber Technologies, Inc.: | | | |
| Series D, 8.00% (a)(c) | | 4,770,180 | 232,652 |
| Series E, 8.00% (a)(c) | | 209,216 | 10,204 |
| | | | 245,345 |
| IT Services - 0.1% | | | |
| AppNexus, Inc. Series E (a)(c) | | 923,523 | 24,012 |
| Software - 0.3% | | | |
| Appirio, Inc. Series E Escrow(c) | | 2,725,544 | 730 |
| Cloudera, Inc. Series F (a)(c) | | 529,285 | 15,901 |
| Cloudflare, Inc. Series D 0.08% (a)(c) | | 1,429,726 | 8,564 |
| Dataminr, Inc. Series D (a)(c) | | 1,773,901 | 12,291 |
| MongoDB, Inc. Series F, 8.00% (a)(c) | | 1,913,404 | 16,194 |
| Snapchat, Inc. Series F (a)(c) | | 1,985,264 | 60,987 |
| Taboola.Com Ltd. Series E (a)(c) | | 1,337,420 | 17,530 |
| | | | 132,197 |
| TOTAL INFORMATION TECHNOLOGY | | | 401,554 |
| TELECOMMUNICATION SERVICES - 0.0% | | | |
| Wireless Telecommunication Services - 0.0% | | | |
| Altiostar Networks, Inc. Series E (c) | | 835,497 | 3,860 |
|
| TOTAL CONVERTIBLE PREFERRED STOCKS | | | 877,428 |
|
| Nonconvertible Preferred Stocks - 0.0% | | | |
| CONSUMER DISCRETIONARY - 0.0% | | | |
| Textiles, Apparel & Luxury Goods - 0.0% | | | |
| C. Wonder LLC Class A-1 (a)(c)(e) | | 619,048 | 0 |
| HEALTH CARE - 0.0% | | | |
| Biotechnology - 0.0% | | | |
| Yumanity Holdings LLC Class A (c) | | 464,607 | 3,587 |
|
| TOTAL NONCONVERTIBLE PREFERRED STOCKS | | | 3,587 |
|
| TOTAL PREFERRED STOCKS | | | |
| (Cost $615,570) | | | 881,015 |
| | | Principal Amount (000s) | Value (000s) |
|
| Convertible Bonds - 0.0% | | | |
| CONSUMER DISCRETIONARY - 0.0% | | | |
| Media - 0.0% | | | |
| Turn, Inc. 1.48% 3/2/23(c) | | | |
| (Cost $306) | | 306 | 306 |
| | | Shares | Value (000s) |
|
| Money Market Funds - 1.3% | | | |
| Fidelity Cash Central Fund, 0.39% (g) | | 62,860,972 | 62,874 |
| Fidelity Securities Lending Cash Central Fund 0.48% (g)(h) | | 401,706,108 | 401,786 |
| TOTAL MONEY MARKET FUNDS | | | |
| (Cost $464,586) | | | 464,660 |
| TOTAL INVESTMENT PORTFOLIO - 101.0% | | | |
| (Cost $20,479,714) | | | 36,211,252 |
| NET OTHER ASSETS (LIABILITIES) - (1.0)% | | | (358,266) |
| NET ASSETS - 100% | | | $35,852,986 |
Values shown as $0 may reflect amounts less than $500.
Legend
(a) Non-income producing
(b) Security or a portion of the security is on loan at period end.
(c) Restricted securities - Investment in securities not registered under the Securities Act of 1933 (excluding 144A issues). At the end of the period, the value of restricted securities (excluding 144A issues) amounted to $1,132,560,000 or 3.2% of net assets.
(d) Affiliated company
(e) Investment is owned by a wholly-owned subsidiary (Subsidiary) that is treated as a corporation for U.S. tax purposes.
(f) Security exempt from registration under Rule 144A of the Securities Act of 1933. These securities may be resold in transactions exempt from registration, normally to qualified institutional buyers. At the end of the period, the value of these securities amounted to $62,201,000 or 0.2% of net assets.
(g) Affiliated fund that is generally available only to investment companies and other accounts managed by Fidelity Investments. The rate quoted is the annualized seven-day yield of the fund at period end. A complete unaudited listing of the fund's holdings as of its most recent quarter end is available upon request. In addition, each Fidelity Central Fund's financial statements, which are not covered by the Fund's Report of Independent Registered Public Accounting Firm, are available on the SEC's website or upon request.
(h) Investment made with cash collateral received from securities on loan.
Additional information on each restricted holding is as follows:
| Security | Acquisition Date | Acquisition Cost (000s) |
| 10X Genomics, Inc. Series C | 2/23/16 | $9,428 |
| Adimab LLC unit | 9/17/14 - 6/5/15 | $47,869 |
| Altiostar Networks, Inc. Series E | 9/26/16 | $3,860 |
| Appirio, Inc. Escrow | 11/24/16 | $94 |
| Appirio, Inc. Series E Escrow | 11/24/16 | $730 |
| AppNexus, Inc. Series E | 8/1/14 | $18,500 |
| Blue Apron, Inc. Series D | 5/18/15 | $10,000 |
| C. Wonder LLC Class A-1 | 12/27/12 - 6/25/13 | $19,500 |
| Castle Creek Pharmaceuticals, LLC Class A-2 unit | 9/29/16 | $15,465 |
| Cloudera, Inc. Series F | 2/5/14 | $7,706 |
| Cloudflare, Inc. Series D 0.08% | 11/5/14 | $8,758 |
| Codiak Biosciences, Inc. Series A | 11/12/15 | $590 |
| Codiak Biosciences, Inc. Series B | 11/12/15 | $5,751 |
| Dataminr, Inc. Series D | 2/18/15 - 3/6/15 | $22,617 |
| Domo, Inc. Series D | 1/24/14 | $12,362 |
| Dropbox, Inc. | 5/2/12 | $10,000 |
| Immunocore Ltd. Series A | 7/27/15 | $12,669 |
| Intarcia Therapeutics, Inc. Series CC | 11/14/12 | $14,331 |
| Intarcia Therapeutics, Inc. Series DD | 3/17/14 | $50,000 |
| Jet.Com, Inc. Series B1 Escrow | 9/19/16 | $2,489 |
| MOD Super Fast Pizza Holdings LLC Series 3 Preferred unit | 11/3/16 | $7,719 |
| Moderna Therapeutics, Inc. Series D | 11/6/13 | $20,615 |
| Moderna Therapeutics, Inc. Series E | 12/18/14 | $24,850 |
| Moderna Therapeutics, Inc. Series F | 8/10/16 | $617 |
| MongoDB, Inc. Series F, 8.00% | 10/2/13 | $32,000 |
| Mulberry Health, Inc. Series A8 | 1/20/16 | $18,851 |
| NJOY, Inc. | 6/7/13 - 2/14/14 | $19,365 |
| RaNA Therapeutics LLC Series B | 7/17/15 | $4,761 |
| Roku, Inc. Series F, 8.00% | 5/7/13 - 5/28/13 | $16,212 |
| Roku, Inc. Series G, 8.00% | 10/1/14 | $3,574 |
| Roku, Inc. Series H | 11/9/15 | $1,260 |
| RPI International Holdings LP | 5/21/15 - 3/23/16 | $16,269 |
| Snapchat, Inc. Series F | 3/25/15 - 2/12/16 | $60,987 |
| Space Exploration Technologies Corp. Class A | 10/16/15 | $31,766 |
| Space Exploration Technologies Corp. Series G | 1/20/15 | $16,753 |
| Taboola.Com Ltd. Series E | 12/22/14 | $13,943 |
| The Honest Co., Inc. | 8/21/14 | $1,078 |
| The Honest Co., Inc. Series C | 8/21/14 | $2,515 |
| The Honest Co., Inc. Series D | 8/3/15 | $3,174 |
| Tory Burch LLC Class A unit | 5/14/15 | $67,653 |
| Tory Burch LLC Class B | 12/31/12 | $17,505 |
| Turn, Inc. Series E | 12/30/13 | $8,213 |
| Turn, Inc. 1.48% 3/2/23 | 3/2/16 | $306 |
| Uber Technologies, Inc. Series D, 8.00% | 6/6/14 | $74,000 |
| Uber Technologies, Inc. Series E, 8.00% | 12/5/14 | $6,971 |
| UNITY Biotechnology, Inc. Series B | 10/14/16 | $9,102 |
| Wheels Up Partners Holdings LLC Series B unit | 9/18/15 | $19,040 |
| YourPeople, Inc. Series C | 5/1/15 | $86,920 |
| Yumanity Holdings LLC Class A | 2/8/16 | $3,140 |
Affiliated Central Funds
Information regarding fiscal year to date income earned by the Fund from investments in Fidelity Central Funds is as follows:
| Fund | Income earned |
| | (Amounts in thousands) |
| Fidelity Cash Central Fund | $387 |
| Fidelity Securities Lending Cash Central Fund | 8,248 |
| Total | $8,635 |
Other Affiliated Issuers
An affiliated company is a company in which the Fund has ownership of at least 5% of the voting securities. Fiscal year to date transactions with companies which are or were affiliates are as follows:
| Affiliate (Amounts in thousands) | Value, beginning of period | Purchases | Sales Proceeds* | Dividend Income | Value, end of period |
| ACADIA Pharmaceuticals, Inc. | $107,666 | $45,035 | $9,227 | $-- | $108,950 |
| ACADIA Pharmaceuticals, Inc. | 111,160 | -- | -- | -- | 79,057 |
| Actua Corp. | 41,096 | 316 | 4,200 | -- | 43,200 |
| Alkermes PLC | 745,876 | 30,702 | 40,718 | -- | 564,496 |
| Alnylam Pharmaceuticals, Inc. | 512,375 | 20,379 | 24,688 | -- | 211,633 |
| Applied Micro Circuits Corp. | 46,056 | 2,819 | 5,030 | -- | 53,082 |
| Apptio, Inc. | -- | -- | -- | -- | 15,712 |
| Apptio, Inc. Class A | -- | 9,342 | 358 | -- | 8,213 |
| aTyr Pharma, Inc. | 5,110 | 28 | 182 | -- | 1,743 |
| aTyr Pharma, Inc. | 12,502 | -- | -- | -- | 4,554 |
| bluebird bio, Inc. | 205,014 | 17,452 | 11,087 | -- | 146,921 |
| Castlight Health, Inc. Class B | 10,480 | -- | 834 | -- | -- |
| Cavium, Inc. | 191,120 | 11,391 | 29,770 | -- | -- |
| Chimerix, Inc. | 105,837 | 2,702 | 1,369 | -- | 14,256 |
| Chuy's Holdings, Inc. | 45,305 | -- | 40,835 | -- | -- |
| Cree, Inc. | 184,985 | 13,676 | 92,905 | -- | -- |
| Dicerna Pharmaceuticals, Inc. | 14,490 | -- | 880 | -- | -- |
| Eleven Biotherapeutics, Inc. | 3,828 | -- | 432 | -- | -- |
| Exelixis, Inc. | 83,646 | 61,927 | 13,126 | -- | 308,449 |
| Fate Therapeutics, Inc. | 7,602 | -- | 368 | -- | -- |
| Homeinns Hotel Group ADR | 78,489 | -- | 1,627 | -- | -- |
| HubSpot, Inc. | 67,790 | 29,259 | 7,091 | -- | 100,001 |
| Infinera Corp. | 290,889 | 7,900 | 14,292 | -- | 106,776 |
| Intra-Cellular Therapies, Inc. | 128,584 | 50,651 | 5,589 | -- | 47,622 |
| Ionis Pharmaceuticals, Inc. | 509,728 | 15,932 | 26,521 | -- | 354,387 |
| Kate Spade & Co. | 155,897 | 725 | 73,788 | -- | -- |
| Lexicon Pharmaceuticals, Inc. | 81,561 | 21,165 | 7,969 | -- | 103,734 |
| lululemon athletica, Inc. | 453,130 | 30,692 | 58,783 | -- | 512,051 |
| Marketo, Inc. | 67,012 | -- | 77,045 | -- | -- |
| Merrimack Pharmaceuticals, Inc. | 75,878 | 401 | 4,211 | -- | 41,377 |
| Momenta Pharmaceuticals, Inc. | 101,247 | 1,762 | 5,424 | -- | 76,442 |
| Nutanix, Inc. Class A | -- | 29,557 | 645 | -- | 30,867 |
| Nutanix, Inc. Class B | -- | -- | -- | -- | 33,158 |
| NVIDIA Corp. | 1,195,282 | 17,321 | 538,182 | 16,902 | 2,768,858 |
| PhaseRx, Inc. | -- | 3,096 | 618 | -- | -- |
| Presbia PLC | 5,504 | 1,483 | 419 | -- | 5,184 |
| Prothena Corp. PLC | 145,362 | 11,961 | 9,600 | -- | 126,623 |
| Regulus Therapeutics, Inc. | 33,318 | 350 | 1,186 | -- | 7,632 |
| Restoration Hardware Holdings, Inc. | 185,808 | 9,247 | 6,720 | -- | 77,545 |
| Rigel Pharmaceuticals, Inc. | 16,099 | 9,760 | 1,836 | -- | 21,349 |
| Sage Therapeutics, Inc. | 78,768 | 22,178 | 6,834 | -- | 100,093 |
| Silicon Laboratories, Inc. | 184,882 | 5,791 | 15,410 | -- | 215,457 |
| Syros Pharmaceuticals, Inc. | -- | 11,698 | 573 | -- | 11,084 |
| Syros Pharmaceuticals, Inc. | -- | 2,451 | -- | -- | 12,101 |
| Transition Therapeutics, Inc. | 5,321 | -- | 131 | -- | -- |
| Wizz Air Holdings PLC | 77,780 | 10,502 | 5,993 | -- | 64,452 |
| Total | $6,372,477 | $509,651 | $1,146,496 | $16,902 | $6,377,059 |
* Includes the value of securities delivered through in-kind transactions, if applicable.
Investment Valuation
The following is a summary of the inputs used, as of November 30, 2016, involving the Fund's assets and liabilities carried at fair value. The inputs or methodology used for valuing securities may not be an indication of the risk associated with investing in those securities. For more information on valuation inputs, and their aggregation into the levels used below, please refer to the Investment Valuation section in the accompanying Notes to Financial Statements.
| | Valuation Inputs at Reporting Date: |
| Description | Total | Level 1 | Level 2 | Level 3 |
| (Amounts in thousands) | | | | |
| Investments in Securities: | | | | |
| Equities: | | | | |
| Consumer Discretionary | $7,137,178 | $6,232,614 | $777,258 | $127,306 |
| Consumer Staples | 2,189,292 | 2,164,130 | 14,304 | 10,858 |
| Energy | 928,798 | 928,798 | -- | -- |
| Financials | 856,705 | 831,362 | -- | 25,343 |
| Health Care | 6,783,054 | 6,314,952 | 65,431 | 402,671 |
| Industrials | 2,464,719 | 2,303,250 | 7,923 | 153,546 |
| Information Technology | 14,540,320 | 14,056,036 | 68,579 | 415,705 |
| Materials | 494,987 | 494,987 | -- | -- |
| Real Estate | 115,719 | 115,719 | -- | -- |
| Telecommunication Services | 235,514 | 231,654 | --�� | 3,860 |
| Corporate Bonds | 306 | -- | -- | 306 |
| Money Market Funds | 464,660 | 464,660 | -- | -- |
| Total Investments in Securities: | $36,211,252 | $34,138,162 | $933,495 | $1,139,595 |
The following are reconciliations of Investments in Securities for which Level 3 inputs were used in determining value:
| (Amounts in thousands) | | | | |
| Investments in Securities: | |
| Equities - Health Care | |
| Beginning Balance | $313,457 |
| Net Realized Gain (Loss) on Investment Securities | 10,928 |
| Net Unrealized Gain (Loss) on Investment Securities | 120,425 |
| Cost of Purchases | 103,181 |
| Proceeds of Sales | (145,320) |
| Amortization/Accretion | -- |
| Transfers into Level 3 | -- |
| Transfers out of Level 3 | -- |
| Ending Balance | $402,671 |
| The change in unrealized gain (loss) for the period attributable to Level 3 securities held at November 30, 2016 | $120,426 |
| Equities - Information Technology | |
| Beginning Balance | $397,096 |
| Net Realized Gain (Loss) on Investment Securities | 28,619 |
| Net Unrealized Gain (Loss) on Investment Securities | 63,675 |
| Cost of Purchases | 50,400 |
| Proceeds of Sales | (124,085) |
| Amortization/Accretion | -- |
| Transfers into Level 3 | -- |
| Transfers out of Level 3 | -- |
| Ending Balance | $415,705 |
| The change in unrealized gain (loss) for the period attributable to Level 3 securities held at November 30, 2016 | $55,414 |
| Other Investments in Securities | |
| Beginning Balance | $312,135 |
| Net Realized Gain (Loss) on Investment Securities | 5,790 |
| Net Unrealized Gain (Loss) on Investment Securities | 24,973 |
| Cost of Purchases | 133,549 |
| Proceeds of Sales | (155,228) |
| Amortization/Accretion | -- |
| Transfers into Level 3 | -- |
| Transfers out of Level 3 | -- |
| Ending Balance | $321,219 |
| The change in unrealized gain (loss) for the period attributable to Level 3 securities held at November 30, 2016 | $13,376 |
The information used in the above reconciliations represents fiscal year to date activity for any Investments in Securities identified as using Level 3 inputs at either the beginning or the end of the current fiscal period, and proceeds of sales includes securities delivered through in-kind transactions. See Note (4) of the Notes to Financial Statements. Transfers in or out of Level 3 represent the beginning value of any Security or Instrument where a change in the pricing level occurred from the beginning to the end of the period. The cost of purchases and the proceeds of sales may include securities received or delivered through corporate actions or exchanges. Realized and unrealized gains (losses) disclosed in the reconciliations are included in Net Gain (Loss) on the Fund's Statement of Operations.
See accompanying notes which are an integral part of the financial statements.
Financial Statements
Statement of Assets and Liabilities
| Amounts in thousands (except per-share amounts) | | November 30, 2016 |
| Assets | | |
Investment in securities, at value (including securities loaned of $383,378) — See accompanying schedule:
Unaffiliated issuers (cost $16,914,451) | $29,670,418 | |
| Fidelity Central Funds (cost $464,586) | 464,660 | |
| Other affiliated issuers (cost $3,100,677) | 6,076,174 | |
| Total Investments (cost $20,479,714) | | $36,211,252 |
| Restricted cash | | 250 |
| Receivable for investments sold | | 96,501 |
| Receivable for fund shares sold | | 22,572 |
| Dividends receivable | | 31,578 |
| Interest receivable | | 3 |
| Distributions receivable from Fidelity Central Funds | | 484 |
| Prepaid expenses | | 86 |
| Other receivables | | 1,754 |
| Total assets | | 36,364,480 |
| Liabilities | | |
| Payable to custodian bank | $286 | |
| Payable for investments purchased | 43,258 | |
| Payable for fund shares redeemed | 41,698 | |
| Accrued management fee | 19,029 | |
| Other affiliated payables | 3,493 | |
| Other payables and accrued expenses | 2,023 | |
| Collateral on securities loaned, at value | 401,707 | |
| Total liabilities | | 511,494 |
| Net Assets | | $35,852,986 |
| Net Assets consist of: | | |
| Paid in capital | | $18,116,189 |
| Undistributed net investment income | | 35,263 |
| Accumulated undistributed net realized gain (loss) on investments and foreign currency transactions | | 1,970,037 |
| Net unrealized appreciation (depreciation) on investments and assets and liabilities in foreign currencies | | 15,731,497 |
| Net Assets | | $35,852,986 |
| Growth Company: | | |
| Net Asset Value, offering price and redemption price per share ($21,113,864 ÷ 147,893 shares) | | $142.76 |
| Class K: | | |
| Net Asset Value, offering price and redemption price per share ($14,739,122 ÷ 103,258 shares) | | $142.74 |
See accompanying notes which are an integral part of the financial statements.
Statement of Operations
| Amounts in thousands | | Year ended November 30, 2016 |
| Investment Income | | |
| Dividends (including $16,902 earned from other affiliated issuers) | | $302,739 |
| Interest | | 3 |
| Income from Fidelity Central Funds | | 8,635 |
| Total income | | 311,377 |
| Expenses | | |
| Management fee | | |
| Basic fee | $204,424 | |
| Performance adjustment | 21,329 | |
| Transfer agent fees | 40,712 | |
| Accounting and security lending fees | 2,305 | |
| Custodian fees and expenses | 639 | |
| Independent trustees' fees and expenses | 164 | |
| Registration fees | 221 | |
| Audit | 260 | |
| Legal | 75 | |
| Interest | 1 | |
| Miscellaneous | 317 | |
| Total expenses before reductions | 270,447 | |
| Expense reductions | (667) | 269,780 |
| Net investment income (loss) | | 41,597 |
| Realized and Unrealized Gain (Loss) | | |
| Net realized gain (loss) on: | | |
| Investment securities: | | |
| Unaffiliated issuers | 3,976,805 | |
| Fidelity Central Funds | 21 | |
| Other affiliated issuers | 434,753 | |
| Foreign currency transactions | (56) | |
| Total net realized gain (loss) | | 4,411,523 |
Change in net unrealized appreciation (depreciation) on:
Investment securities | (3,344,116) | |
| Assets and liabilities in foreign currencies | 14 | |
| Total change in net unrealized appreciation (depreciation) | | (3,344,102) |
| Net gain (loss) | | 1,067,421 |
| Net increase (decrease) in net assets resulting from operations | | $1,109,018 |
See accompanying notes which are an integral part of the financial statements.
Statement of Changes in Net Assets
| Amounts in thousands | Year ended November 30, 2016 | Year ended November 30, 2015 |
| Increase (Decrease) in Net Assets | | |
| Operations | | |
| Net investment income (loss) | $41,597 | $13,855 |
| Net realized gain (loss) | 4,411,523 | 4,437,105 |
| Change in net unrealized appreciation (depreciation) | (3,344,102) | (841,705) |
| Net increase (decrease) in net assets resulting from operations | 1,109,018 | 3,609,255 |
| Distributions to shareholders from net investment income | (13,792) | (57,135) |
| Distributions to shareholders from net realized gain | (1,582,394) | (1,421,834) |
| Total distributions | (1,596,186) | (1,478,969) |
| Share transactions - net increase (decrease) | (4,759,956) | (3,437,067) |
| Total increase (decrease) in net assets | (5,247,124) | (1,306,781) |
| Net Assets | | |
| Beginning of period | 41,100,110 | 42,406,891 |
| End of period | $35,852,986 | $41,100,110 |
| Other Information | | |
| Undistributed net investment income end of period | $35,263 | $12,121 |
See accompanying notes which are an integral part of the financial statements.
Financial Highlights — Fidelity Growth Company Fund
| Years ended November 30, | 2016 | 2015 | 2014 | 2013 | 2012 |
| Selected Per–Share Data | | | | | |
| Net asset value, beginning of period | $143.47 | $136.46 | $124.69 | $95.80 | $85.29 |
| Income from Investment Operations | | | | | |
| Net investment income (loss)A | .09 | (.01) | .15 | .29 | .15 |
| Net realized and unrealized gain (loss) | 4.71 | 11.72 | 20.49 | 31.23 | 13.12 |
| Total from investment operations | 4.80 | 11.71 | 20.64 | 31.52 | 13.27 |
| Distributions from net investment income | – | (.13) | (.21) | (.19) | (.05) |
| Distributions from net realized gain | (5.51) | (4.57) | (8.67) | (2.44) | (2.71) |
| Total distributions | (5.51) | (4.70) | (8.87)B | (2.63) | (2.76) |
| Net asset value, end of period | $142.76 | $143.47 | $136.46 | $124.69 | $95.80 |
| Total ReturnC | 3.48% | 8.90% | 17.80% | 33.85% | 16.24% |
| Ratios to Average Net AssetsD,E | | | | | |
| Expenses before reductions | .77% | .88% | .82% | .83% | .90% |
| Expenses net of fee waivers, if any | .77% | .87% | .82% | .83% | .90% |
| Expenses net of all reductions | .77% | .87% | .82% | .83% | .90% |
| Net investment income (loss) | .07% | (.01)% | .12% | .27% | .16% |
| Supplemental Data | | | | | |
| Net assets, end of period (in millions) | $21,114 | $23,513 | $24,165 | $22,936 | $22,952 |
| Portfolio turnover rateF | 19%G | 18%G | 12%G | 26% | 33% |
A Calculated based on average shares outstanding during the period.
B Total distributions of $8.87 per share is comprised of distributions from net investment income of $.207 and distributions from net realized gain of $8.666 per share.
C Total returns would have been lower if certain expenses had not been reduced during the applicable periods shown.
D Fees and expenses of any underlying Fidelity Central Funds are not included in the Fund's expense ratio. The Fund indirectly bears its proportionate share of the expenses of any underlying Fidelity Central Funds.
E Expense ratios reflect operating expenses of the class. Expenses before reductions do not reflect amounts reimbursed by the investment adviser or reductions from brokerage service arrangements or reductions from other expense offset arrangements and do not represent the amount paid by the class during periods when reimbursements or reductions occur. Expenses net of fee waivers reflect expenses after reimbursement by the investment adviser but prior to reductions from brokerage service arrangements or other expense offset arrangements. Expenses net of all reductions represent the net expenses paid by the class.
F Amount does not include the portfolio activity of any underlying Fidelity Central Funds.
G Portfolio turnover rate excludes securities received or delivered in-kind.
See accompanying notes which are an integral part of the financial statements.
Financial Highlights — Fidelity Growth Company Fund Class K
| Years ended November 30, | 2016 | 2015 | 2014 | 2013 | 2012 |
| Selected Per–Share Data | | | | | |
| Net asset value, beginning of period | $143.42 | $136.41 | $124.68 | $95.82 | $85.35 |
| Income from Investment Operations | | | | | |
| Net investment income (loss)A | .23 | .12 | .29 | .42 | .27 |
| Net realized and unrealized gain (loss) | 4.71 | 11.72 | 20.48 | 31.21 | 13.10 |
| Total from investment operations | 4.94 | 11.84 | 20.77 | 31.63 | 13.37 |
| Distributions from net investment income | (.11) | (.26) | (.37) | (.34) | (.19) |
| Distributions from net realized gain | (5.51) | (4.57) | (8.67) | (2.44) | (2.71) |
| Total distributions | (5.62) | (4.83) | (9.04) | (2.77)B | (2.90) |
| Net asset value, end of period | $142.74 | $143.42 | $136.41 | $124.68 | $95.82 |
| Total ReturnC | 3.59% | 9.01% | 17.93% | 34.02% | 16.38% |
| Ratios to Average Net AssetsD,E | | | | | |
| Expenses before reductions | .66% | .77% | .71% | .71% | .77% |
| Expenses net of fee waivers, if any | .66% | .77% | .71% | .71% | .77% |
| Expenses net of all reductions | .66% | .77% | .71% | .71% | .77% |
| Net investment income (loss) | .17% | .09% | .24% | .39% | .29% |
| Supplemental Data | | | | | |
| Net assets, end of period (in millions) | $14,739 | $17,587 | $18,242 | $21,951 | $15,454 |
| Portfolio turnover rateF | 19%G | 18%G | 12%G | 26% | 33% |
A Calculated based on average shares outstanding during the period.
B Total distributions of $2.77 per share is comprised of distributions from net investment income of $.336 and distributions from net realized gain of $2.438 per share.
C Total returns would have been lower if certain expenses had not been reduced during the applicable periods shown.
D Fees and expenses of any underlying Fidelity Central Funds are not included in the Fund's expense ratio. The Fund indirectly bears its proportionate share of the expenses of any underlying Fidelity Central Funds.
E Expense ratios reflect operating expenses of the class. Expenses before reductions do not reflect amounts reimbursed by the investment adviser or reductions from brokerage service arrangements or reductions from other expense offset arrangements and do not represent the amount paid by the class during periods when reimbursements or reductions occur. Expenses net of fee waivers reflect expenses after reimbursement by the investment adviser but prior to reductions from brokerage service arrangements or other expense offset arrangements. Expenses net of all reductions represent the net expenses paid by the class.
F Amount does not include the portfolio activity of any underlying Fidelity Central Funds.
G Portfolio turnover rate excludes securities received or delivered in-kind.
See accompanying notes which are an integral part of the financial statements.
Notes to Financial Statements
For the period ended November 30, 2016
(Amounts in thousands except percentages)
1. Organization.
Fidelity Growth Company Fund (the Fund) is a fund of Fidelity Mt. Vernon Street Trust (the Trust) and is authorized to issue an unlimited number of shares. The Trust is registered under the Investment Company Act of 1940, as amended (the 1940 Act), as an open-end management investment company organized as a Massachusetts business trust. The Fund offers Growth Company and Class K shares, each of which has equal rights as to assets and voting privileges. Each class has exclusive voting rights with respect to matters that affect that class.
2. Investments in Fidelity Central Funds.
The Fund invests in Fidelity Central Funds, which are open-end investment companies generally available only to other investment companies and accounts managed by the investment adviser and its affiliates. The Fund's Schedule of Investments lists each of the Fidelity Central Funds held as of period end, if any, as an investment of the Fund, but does not include the underlying holdings of each Fidelity Central Fund. As an Investing Fund, the Fund indirectly bears its proportionate share of the expenses of the underlying Fidelity Central Funds.
The Money Market Central Funds seek preservation of capital and current income and are managed by Fidelity Investments Money Management, Inc. (FIMM), an affiliate of the investment adviser. Annualized expenses of the Money Market Central Funds as of their most recent shareholder report date are less than .005%.
A complete unaudited list of holdings for each Fidelity Central Fund is available upon request or at the Securities and Exchange Commission (the SEC) website at www.sec.gov. In addition, the financial statements of the Fidelity Central Funds, which are not covered by the Fund's Report of Independent Registered Public Accounting Firm, are available on the SEC website or upon request.
3. Significant Accounting Policies.
The financial statements have been prepared in conformity with accounting principles generally accepted in the United States of America (GAAP), which require management to make certain estimates and assumptions at the date of the financial statements. Actual results could differ from those estimates. Subsequent events, if any, through the date that the financial statements were issued have been evaluated in the preparation of the financial statements. The following summarizes the significant accounting policies of the Fund:
Investment Valuation. Investments are valued as of 4:00 p.m. Eastern time on the last calendar day of the period. The Board of Trustees (the Board) has delegated the day to day responsibility for the valuation of the Fund's investments to the Fair Value Committee (the Committee) established by the Fund's investment adviser. In accordance with valuation policies and procedures approved by the Board, the Fund attempts to obtain prices from one or more third party pricing vendors or brokers to value its investments. When current market prices, quotations or currency exchange rates are not readily available or reliable, investments will be fair valued in good faith by the Committee, in accordance with procedures adopted by the Board. Factors used in determining fair value vary by investment type and may include market or investment specific events, changes in interest rates and credit quality. The frequency with which these procedures are used cannot be predicted and they may be utilized to a significant extent. The Committee oversees the Fund's valuation policies and procedures and reports to the Board on the Committee's activities and fair value determinations. The Board monitors the appropriateness of the procedures used in valuing the Fund's investments and ratifies the fair value determinations of the Committee.
The Fund categorizes the inputs to valuation techniques used to value its investments into a disclosure hierarchy consisting of three levels as shown below:
- Level 1 – quoted prices in active markets for identical investments
- Level 2 – other significant observable inputs (including quoted prices for similar investments, interest rates, prepayment speeds, etc.)
- Level 3 – unobservable inputs (including the Fund's own assumptions based on the best information available)
Valuation techniques used to value the Fund's investments by major category are as follows:
Equity securities, including restricted securities, for which market quotations are readily available, are valued at the last reported sale price or official closing price as reported by a third party pricing vendor on the primary market or exchange on which they are traded and are categorized as Level 1 in the hierarchy. In the event there were no sales during the day or closing prices are not available, securities are valued at the last quoted bid price or may be valued using the last available price and are generally categorized as Level 2 in the hierarchy. For foreign equity securities, when market or security specific events arise, comparisons to the valuation of American Depositary Receipts (ADRs), futures contracts, Exchange-Traded Funds (ETFs) and certain indexes as well as quoted prices for similar securities may be used and would be categorized as Level 2 in the hierarchy. Utilizing these techniques may result in transfers between Level 1 and Level 2. For equity securities, including restricted securities, where observable inputs are limited, assumptions about market activity and risk are used and these securities may be categorized as Level 3 in the hierarchy. Equity securities, including restricted securities, for which observable inputs are not available are valued using alternate valuation approaches, including the market approach and the income approach and are categorized as Level 3 in the hierarchy. The market approach generally consists of using comparable market transactions while the income approach generally consists of using the net present value of estimated future cash flows, adjusted as appropriate for liquidity, credit, market and/or other risk factors.
Debt securities, including restricted securities, are valued based on evaluated prices received from third party pricing vendors or from brokers who make markets in such securities. Corporate bonds are valued by pricing vendors who utilize matrix pricing which considers yield or price of bonds of comparable quality, coupon, maturity and type or by broker-supplied prices. When independent prices are unavailable or unreliable, debt securities may be valued utilizing pricing methodologies which consider similar factors that would be used by third party pricing vendors. Debt securities are generally categorized as Level 2 in the hierarchy but may be Level 3 depending on the circumstances.
Investments in open-end mutual funds, including the Fidelity Central Funds, are valued at their closing net asset value (NAV) each business day and are categorized as Level 1 in the hierarchy.
The following provides information on Level 3 securities held by the Fund that were valued at period end based on unobservable inputs. These amounts exclude valuations provided by a broker.
| Asset Type | Fair Value at 11/30/16 | Valuation Technique(s) | Unobservable Input | Amount or Range/Weighted Average | Impact to Valuation from an Increase in Input(a) |
| Corporate Bonds | $ 306 | Market approach | Transaction Price | $100.00
| Increase
|
| Equities | 1,139,289 | Discounted cash flow | Discount rate | 8.0% - 22.1% / 18.1
| Decrease |
| | | | Weighted average cost of capital (WACC) | 11.5% | Decrease |
| | | | Discount for lack of marketability | 10.0% - 25.0% / 23.7% | Decrease |
| | | | Growth rate | 2.0% - 2.5% / 2.1% | Increase |
| | | Market approach | Discount rate | 3.0% - 50.0% / 13.7% | Decrease
|
| | | | Transaction price | $1.08 - $330.00 / $51.61 | Increase
|
| | | | Tender price | $24.04 | Increase
|
| | | | Discount for lack of marketability | 10.0% - 20.0% / 15.5% | Decrease |
| | | | Liquidity preference
| $6.75 - $68.25 / $59.82 | Increase
|
| | | | Premium rate
| 6.0% - 169.0% / 46.1% | Increase
|
| | | | Proxy discount
| 12.0% - 36.1% / 19.6% | Decrease
|
| | | | Proxy premium | 21.5% | Increase |
| | | Market comparable | Price/Earnings multiple (P/E)
| 10.5 | Increase |
| | | | Enterprise value/EBITDA multiple
| 9.3
| Increase
|
| | | | Enterprise value/Sales multiple (EV/S) | 0.6 - 15.3 / 4.9 | Increase
|
| | | | Enterprise value/Gross profit multiple (EV/GP) | 5.1 | Increase
|
| | | Recovery value | Recovery value | 0.0% - 0.3% / 0.3% | Increase |
(a) Represents the expected directional change in the fair value of the Level 3 investments that would result from an increase in the corresponding input. A decrease to the unobservable input would have the opposite effect. Significant changes in these inputs could result in significantly higher or lower fair value measurements.
Changes in valuation techniques may result in transfers in or out of an assigned level within the disclosure hierarchy. The aggregate value of investments by input level as of November 30, 2016, as well as a roll forward of Level 3 investments, is included at the end of the Fund's Schedule of Investments.
Foreign Currency. The Fund may use foreign currency contracts to facilitate transactions in foreign-denominated securities. Gains and losses from these transactions may arise from changes in the value of the foreign currency or if the counterparties do not perform under the contracts' terms.
Foreign-denominated assets, including investment securities, and liabilities are translated into U.S. dollars at the exchange rates at period end. Purchases and sales of investment securities, income and dividends received and expenses denominated in foreign currencies are translated into U.S. dollars at the exchange rate in effect on the transaction date.
The effects of exchange rate fluctuations on investments are included with the net realized and unrealized gain (loss) on investment securities. Other foreign currency transactions resulting in realized and unrealized gain (loss) are disclosed separately.
Investment Transactions and Income. For financial reporting purposes, the Fund's investment holdings and NAV include trades executed through the end of the last business day of the period. The NAV per share for processing shareholder transactions is calculated as of the close of business of the New York Stock Exchange (NYSE), normally 4:00 p.m. Eastern time and includes trades executed through the end of the prior business day. Gains and losses on securities sold are determined on the basis of identified cost and may include proceeds received from litigation. Dividend income is recorded on the ex-dividend date, except for certain dividends from foreign securities where the ex-dividend date may have passed, which are recorded as soon as the Fund is informed of the ex-dividend date. Non-cash dividends included in dividend income, if any, are recorded at the fair market value of the securities received. Income and capital gain distributions from Fidelity Central Funds, if any, are recorded on the ex-dividend date. Certain distributions received by the Fund represent a return of capital or capital gain. The Fund determines the components of these distributions subsequent to the ex-dividend date, based upon receipt of tax filings or other correspondence relating to the underlying investment. These distributions are recorded as a reduction of cost of investments and/or as a realized gain. Interest income is accrued as earned and includes coupon interest and amortization of premium and accretion of discount on debt securities as applicable. Investment income is recorded net of foreign taxes withheld where recovery of such taxes is uncertain.
Class Allocations and Expenses. Investment income, realized and unrealized capital gains and losses, common expenses of the Fund, and certain fund-level expense reductions, if any, are allocated daily on a pro-rata basis to each class based on the relative net assets of each class to the total net assets of the Fund. Each class differs with respect to transfer agent fees incurred. Certain expense reductions may also differ by class. For the reporting period, the allocated portion of income and expenses to each class as a percent of its average net assets may vary due to the timing of recording these transactions in relation to fluctuating net assets of the classes. Expenses directly attributable to a fund are charged to that fund. Expenses attributable to more than one fund are allocated among the respective funds on the basis of relative net assets or other appropriate methods. Expense estimates are accrued in the period to which they relate and adjustments are made when actual amounts are known.
Deferred Trustee Compensation. Under a Deferred Compensation Plan (the Plan), independent Trustees may elect to defer receipt of a portion of their annual compensation. Deferred amounts are invested in a cross-section of Fidelity funds, are marked-to-market and remain in the Fund until distributed in accordance with the Plan. The investment of deferred amounts and the offsetting payable to the Trustees are included in the accompanying Statement of Assets and Liabilities.
Income Tax Information and Distributions to Shareholders. Each year, the Fund intends to qualify as a regulated investment company under Subchapter M of the Internal Revenue Code, including distributing substantially all of its taxable income and realized gains. As a result, no provision for U.S. Federal income taxes is required. As of November 30, 2016, the Fund did not have any unrecognized tax benefits in the financial statements; nor is the Fund aware of any tax positions for which it is reasonably possible that the total amounts of unrecognized tax benefits will significantly change in the next twelve months. The Fund files a U.S. federal tax return, in addition to state and local tax returns as required. The Fund's federal income tax returns are subject to examination by the Internal Revenue Service (IRS) for a period of three fiscal years after they are filed. State and local tax returns may be subject to examination for an additional fiscal year depending on the jurisdiction. Foreign taxes are provided for based on the Fund's understanding of the tax rules and rates that exist in the foreign markets in which it invests.
Distributions are declared and recorded on the ex-dividend date. Income dividends and capital gain distributions are declared separately for each class. Income and capital gain distributions are determined in accordance with income tax regulations, which may differ from GAAP. In addition, the Fund claimed a portion of the payment made to redeeming shareholders as a distribution for income tax purposes.
Capital accounts within the financial statements are adjusted for permanent book-tax differences. These adjustments have no impact on net assets or the results of operations. Capital accounts are not adjusted for temporary book-tax differences which will reverse in a subsequent period.
Book-tax differences are primarily due to foreign currency transactions, passive foreign investment companies (PFIC), redemptions in kind, partnerships, deferred trustees compensation and losses deferred due to wash sales.
The federal tax cost of investment securities and unrealized appreciation (depreciation) as of period end were as follows:
| Gross unrealized appreciation | $17,351,013 |
| Gross unrealized depreciation | (1,661,098) |
| Net unrealized appreciation (depreciation) on securities | $15,689,915 |
| Tax Cost | $20,521,337 |
The tax-based components of distributable earnings as of period end were as follows:
| Undistributed ordinary income | $36,945 |
| Undistributed long-term capital gain | $2,011,660 |
| Net unrealized appreciation (depreciation) on securities and other investments | $15,689,874 |
The tax character of distributions paid was as follows:
| | November 30, 2016 | November 30, 2015 |
| Ordinary Income | $13,792 | $ 57,135 |
| Long-term Capital Gains | 1,582,394 | 1,421,834 |
| Total | $1,596,186 | $ 1,478,969 |
Restricted Securities. The Fund may invest in securities that are subject to legal or contractual restrictions on resale. These securities generally may be resold in transactions exempt from registration or to the public if the securities are registered. Disposal of these securities may involve time-consuming negotiations and expense, and prompt sale at an acceptable price may be difficult. Information regarding restricted securities is included at the end of the Fund's Schedule of Investments.
Consolidated Subsidiary. The Fund invests in certain investments through a wholly-owned subsidiary ("Subsidiary"), which may be subject to federal and state taxes upon disposition.
As of period end, the Fund held an investment of $189,550 in these Subsidiaries, representing .53% of the Fund's net assets. The financial statements have been consolidated and include accounts of the Fund and each Subsidiary. Accordingly, all inter-company transactions and balances have been eliminated.
Any cash held by the Subsidiaries is restricted as to its use and is presented as Restricted cash in the Statement of Assets and Liabilities.
4. Purchases and Sales of Investments.
Purchases and sales of securities, other than short-term securities and in-kind transactions, aggregated $7,024,112 and $9,140,669, respectively.
Redemptions In-Kind. During the period, 26,809 shares of the Fund held by unaffiliated entities were redeemed in-kind for cash and investments with a value of $3,667,395. The net realized gain of $2,216,038 on investments delivered through the in-kind redemption is included in the accompanying Statement of Operations. The amount of in-kind redemptions is included in share transactions in the accompanying Statement of Changes in Net Assets as well as Note 10: Share Transactions. The Fund recognized no gain or loss for federal income tax purposes.
Prior Fiscal Year Redemptions In-Kind. During the prior period, 31,588 shares of the Fund held by unaffiliated entities were redeemed in-kind for investments and cash with a value of $4,379,418. They had a net realized gain of $2,610,732 on investments delivered through the in-kind redemptions. The amount of in-kind redemptions is included in share transactions in the share transactions in the accompanying Statement of Changes in Net Assets as well as Note 10: Share Transactions. The Fund recognized no gain or loss for federal income tax purposes.
5. Fees and Other Transactions with Affiliates.
Management Fee. Fidelity Management & Research Company (the investment adviser) and its affiliates provide the Fund with investment management related services for which the Fund pays a monthly management fee. The management fee is the sum of an individual fund fee rate that is based on an annual rate of .30% of the Fund's average net assets and an annualized group fee rate that averaged .25% during the period. The group fee rate is based upon the average net assets of all the mutual funds advised by the investment adviser, including any mutual funds previously advised by the investment adviser that are currently advised by Fidelity SelectCo, LLC, an affiliate of the investment adviser. The group fee rate decreases as assets under management increase and increases as assets under management decrease. In addition, the management fee is subject to a performance adjustment (up to a maximum of +/- .20% of the Fund's average net assets over a 36 month performance period). The upward or downward adjustment to the management fee is based on the relative investment performance of Growth Company as compared to its benchmark index, the Russell 3000 Growth Index, over the same 36 month performance period. For the reporting period, the total annual management fee rate, including the performance adjustment, was .61% of the Fund's average net assets. The performance adjustment included in the management fee rate may be higher or lower than the maximum performance adjustment rate due to the difference between the average net assets for the reporting and performance periods.
Transfer Agent Fees. Fidelity Investments Institutional Operations Company, Inc., (FIIOC), an affiliate of the investment adviser, is the transfer, dividend disbursing and shareholder servicing agent for each class of the Fund. FIIOC receives account fees and asset-based fees that vary according to the account size and type of account of the shareholders of Growth Company. FIIOC receives an asset-based fee of Class K's average net assets. FIIOC pays for typesetting, printing and mailing of shareholder reports, except proxy statements.
For the period, transfer agent fees for each class were as follows:
| | Amount | % of
Class-Level Average
Net Assets |
| Growth Company | $33,401 | .15 |
| Class K | 7,311 | .05 |
| | $40,712 | |
Accounting and Security Lending Fees. Fidelity Service Company, Inc. (FSC), an affiliate of the investment adviser, maintains the Fund's accounting records. The accounting fee is based on the level of average net assets for each month. Under a separate contract, FSC administers the security lending program. The security lending fee is based on the number and duration of lending transactions.
Brokerage Commissions. The Fund placed a portion of its portfolio transactions with brokerage firms which are affiliates of the investment adviser. Brokerage commissions are included in net realized gain (loss) and change in net unrealized appreciation (depreciation) in the Statement of Operations. The commissions paid to these affiliated firms were $236 for the period.
Interfund Lending Program. Pursuant to an Exemptive Order issued by the SEC, the Fund, along with other registered investment companies having management contracts with Fidelity Management & Research Company (FMR) or other affiliated entities of FMR, may participate in an interfund lending program. This program provides an alternative credit facility allowing the funds to borrow from, or lend money to, other participating affiliated funds. At period end, there were no interfund loans outstanding. The Fund's activity in this program during the period for which loans were outstanding was as follows:
| Borrower or Lender | Average Loan Balance | Weighted Average Interest Rate | Interest Expense |
| Borrower | $19,086 | .59% | $1 |
Interfund Trades. The Fund may purchase from or sell securities to other Fidelity Funds under procedures adopted by the Board. The procedures have been designed to ensure these interfund trades are executed in accordance with Rule 17a-7 of the 1940 Act. Interfund trades are included within the respective purchases and sales amounts shown in the Purchases and Sales of Investments note.
Other. During the period, the investment adviser reimbursed the Fund for certain losses in the amount of $500.
6. Committed Line of Credit.
The Fund participates with other funds managed by the investment adviser or an affiliate in a $4.25 billion credit facility (the "line of credit") to be utilized for temporary or emergency purposes to fund shareholder redemptions or for other short-term liquidity purposes. The Fund has agreed to pay commitment fees on its pro-rata portion of the line of credit, which amounted to $96 and is reflected in Miscellaneous expenses on the Statement of Operations. During the period, the Fund did not borrow on this line of credit.
7. Security Lending.
The Fund lends portfolio securities through a lending agent from time to time in order to earn additional income. For equity securities, a lending agent is used and may loan securities to certain qualified borrowers, including Fidelity Capital Markets (FCM), a broker-dealer affiliated with the Fund. On the settlement date of the loan, the Fund receives collateral (in the form of U.S. Treasury obligations, letters of credit and/or cash) against the loaned securities and maintains collateral in an amount not less than 100% of the market value of the loaned securities during the period of the loan. The market value of the loaned securities is determined at the close of business of the Fund and any additional required collateral is delivered to the Fund on the next business day. The Fund or borrower may terminate the loan at any time, and if the borrower defaults on its obligation to return the securities loaned because of insolvency or other reasons, the Fund may apply collateral received from the borrower against the obligation. The Fund may experience delays and costs in recovering the securities loaned. Any cash collateral received is invested in the Fidelity Securities Lending Cash Central Fund. The value of loaned securities and cash collateral at period end are disclosed on the Fund's Statement of Assets and Liabilities. The value of securities loaned to FCM at period end was $23,623. Security lending income represents the income earned on investing cash collateral, less rebates paid to borrowers and any lending agent fees associated with the loan, plus any premium payments received for lending certain types of securities. Security lending income is presented in the Statement of Operations as a component of income from Fidelity Central Funds. Total security lending income during the period amounted to $8,248, including $571 from securities loaned to FCM.
8. Expense Reductions.
Commissions paid to certain brokers with whom the investment adviser, or its affiliates, places trades on behalf of the Fund include an amount in addition to trade execution, which may be rebated back to the Fund to offset certain expenses. This amount totaled $370 for the period. In addition, through arrangements with the Fund's custodian, credits realized as a result of certain uninvested cash balances were used to reduce the Fund's expenses. During the period, these credits reduced the Fund's custody expenses by $4.
In addition, during the period the investment adviser reimbursed and/or waived a portion of fund-level operating expenses in the amount of $293.
9. Distributions to Shareholders.
Distributions to shareholders of each class were as follows:
| | Year ended
November 30, 2016 | Year ended November 30, 2015 |
| From net investment income | | |
| Growth Company | $– | $22,481 |
| Class K | 13,792 | 34,654 |
| Total | $13,792 | $57,135 |
| From net realized gain | | |
| Growth Company | $904,788 | $808,358 |
| Class K | 677,606 | 613,476 |
| Total | $1,582,394 | $1,421,834 |
10. Share Transactions.
Share transactions for each class were as follows and may contain automatic conversions between classes or exchanges between affiliated funds:
| | Shares | Shares | Dollars | Dollars |
| | Year ended
November 30, 2016 | Year ended November 30, 2015 | Year ended
November 30, 2016 | Year ended November 30, 2015 |
| Growth Company | | | | |
| Shares sold | 17,124 | 20,925 | $2,254,562 | $2,877,874 |
| Reinvestment of distributions | 6,196 | 6,056 | 857,904 | 796,034 |
| Shares redeemed | (39,316)(a) | (40,175)(b) | (5,283,210)(a) | (5,503,138)(b) |
| Net increase (decrease) | (15,996) | (13,194) | $(2,170,744) | $(1,829,230) |
| Class K | | | | |
| Shares sold | 18,989 | 41,669 | $2,493,477 | $5,709,393 |
| Reinvestment of distributions | 5,003 | 4,938 | 691,398 | 648,130 |
| Shares redeemed | (43,361)(a) | (57,706)(b) | (5,774,087)(a) | (7,965,360)(b) |
| Net increase (decrease) | (19,369) | (11,099) | $(2,589,212) | $(1,607,837) |
(a) Amount includes in-kind redemptions (see Note 4: Redemptions In-Kind)
(b) Amount includes in-kind redemptions.(see Note 4: Prior Fiscal Year Redemptions In-Kind)
11. Other.
The Fund's organizational documents provide former and current trustees and officers with a limited indemnification against liabilities arising in connection with the performance of their duties to the Fund. In the normal course of business, the Fund may also enter into contracts that provide general indemnifications. The Fund's maximum exposure under these arrangements is unknown as this would be dependent on future claims that may be made against the Fund. The risk of material loss from such claims is considered remote.
Report of Independent Registered Public Accounting Firm
To the Trustees of Fidelity Mt. Vernon Street Trust and Shareholders of Fidelity Growth Company Fund:
We have audited the accompanying statement of assets and liabilities of Fidelity Growth Company Fund (the Fund), a fund of Fidelity Mt. Vernon Street Trust, including the schedule of investments, as of November 30, 2016, and the related statement of operations for the year then ended, the statement of changes in net assets for each of the two years in the period then ended, and the financial highlights for each of the five years in the period then ended. These financial statements and financial highlights are the responsibility of the Fund's management. Our responsibility is to express an opinion on these financial statements and financial highlights based on our audits.
We conducted our audits in accordance with the standards of the Public Company Accounting Oversight Board (United States). Those standards require that we plan and perform the audit to obtain reasonable assurance about whether the financial statements and financial highlights are free of material misstatement. The Fund is not required to have, nor were we engaged to perform, an audit of its internal control over financial reporting. Our audits included consideration of internal control over financial reporting as a basis for designing audit procedures that are appropriate in the circumstances, but not for the purpose of expressing an opinion on the effectiveness of the Fund's internal control over financial reporting. Accordingly, we express no such opinion. An audit also includes examining, on a test basis, evidence supporting the amounts and disclosures in the financial statements, assessing the accounting principles used and significant estimates made by management, as well as evaluating the overall financial statement presentation. Our procedures included confirmation of securities owned as of November 30, 2016, by correspondence with the custodians and brokers; when replies were not received from brokers, we performed other auditing procedures. We believe that our audits provide a reasonable basis for our opinion.
In our opinion, such financial statements and financial highlights referred to above present fairly, in all material respects, the financial position of Fidelity Growth Company Fund as of November 30, 2016, the results of its operations for the year then ended, the changes in its net assets for each of the two years in the period then ended, and the financial highlights for each of the five years in the period then ended, in conformity with accounting principles generally accepted in the United States of America.
DELOITTE & TOUCHE LLP
Boston, Massachusetts
January 23, 2017
Trustees and Officers
The Trustees, Members of the Advisory Board (if any), and officers of the trust and fund, as applicable, are listed below. The Board of Trustees governs the fund and is responsible for protecting the interests of shareholders. The Trustees are experienced executives who meet periodically throughout the year to oversee the fund's activities, review contractual arrangements with companies that provide services to the fund, oversee management of the risks associated with such activities and contractual arrangements, and review the fund's performance. Each of the Trustees oversees 170 funds.
The Trustees hold office without limit in time except that (a) any Trustee may resign; (b) any Trustee may be removed by written instrument, signed by at least two-thirds of the number of Trustees prior to such removal; (c) any Trustee who requests to be retired or who has become incapacitated by illness or injury may be retired by written instrument signed by a majority of the other Trustees; and (d) any Trustee may be removed at any special meeting of shareholders by a two-thirds vote of the outstanding voting securities of the trust. Each Trustee who is not an interested person (as defined in the 1940 Act) of the trust and the fund is referred to herein as an Independent Trustee. Each Independent Trustee shall retire not later than the last day of the calendar year in which his or her 75th birthday occurs. The Independent Trustees may waive this mandatory retirement age policy with respect to individual Trustees. Officers and Advisory Board Members hold office without limit in time, except that any officer or Advisory Board Member may resign or may be removed by a vote of a majority of the Trustees at any regular meeting or any special meeting of the Trustees. Except as indicated, each individual has held the office shown or other offices in the same company for the past five years.
The fund’s Statement of Additional Information (SAI) includes more information about the Trustees. To request a free copy, call Fidelity at 1-800-835-5092.
Experience, Skills, Attributes, and Qualifications of the Trustees. The Governance and Nominating Committee has adopted a statement of policy that describes the experience, qualifications, attributes, and skills that are necessary and desirable for potential Independent Trustee candidates (Statement of Policy). The Board believes that each Trustee satisfied at the time he or she was initially elected or appointed a Trustee, and continues to satisfy, the standards contemplated by the Statement of Policy. The Governance and Nominating Committee also engages professional search firms to help identify potential Independent Trustee candidates who have the experience, qualifications, attributes, and skills consistent with the Statement of Policy. From time to time, additional criteria based on the composition and skills of the current Independent Trustees, as well as experience or skills that may be appropriate in light of future changes to board composition, business conditions, and regulatory or other developments, have also been considered by the professional search firms and the Governance and Nominating Committee. In addition, the Board takes into account the Trustees' commitment and participation in Board and committee meetings, as well as their leadership of standing and ad hoc committees throughout their tenure.
In determining that a particular Trustee was and continues to be qualified to serve as a Trustee, the Board has considered a variety of criteria, none of which, in isolation, was controlling. The Board believes that, collectively, the Trustees have balanced and diverse experience, qualifications, attributes, and skills, which allow the Board to operate effectively in governing the fund and protecting the interests of shareholders. Information about the specific experience, skills, attributes, and qualifications of each Trustee, which in each case led to the Board's conclusion that the Trustee should serve (or continue to serve) as a trustee of the fund, is provided below.
Board Structure and Oversight Function. James C. Curvey is an interested person and currently serves as Chairman. The Trustees have determined that an interested Chairman is appropriate and benefits shareholders because an interested Chairman has a personal and professional stake in the quality and continuity of services provided to the fund. Independent Trustees exercise their informed business judgment to appoint an individual of their choosing to serve as Chairman, regardless of whether the Trustee happens to be independent or a member of management. The Independent Trustees have determined that they can act independently and effectively without having an Independent Trustee serve as Chairman and that a key structural component for assuring that they are in a position to do so is for the Independent Trustees to constitute a substantial majority for the Board. The Independent Trustees also regularly meet in executive session. Ned C. Lautenbach serves as Chairman of the Independent Trustees and as such (i) acts as a liaison between the Independent Trustees and management with respect to matters important to the Independent Trustees and (ii) with management prepares agendas for Board meetings.
Fidelity® funds are overseen by different Boards of Trustees. The fund's Board oversees Fidelity's high income and certain equity funds, and other Boards oversee Fidelity's investment-grade bond, money market, asset allocation, and sector funds. The asset allocation funds may invest in Fidelity® funds overseen by the fund's Board. The use of separate Boards, each with its own committee structure, allows the Trustees of each group of Fidelity® funds to focus on the unique issues of the funds they oversee, including common research, investment, and operational issues. On occasion, the separate Boards establish joint committees to address issues of overlapping consequences for the Fidelity® funds overseen by each Board.
The Trustees operate using a system of committees to facilitate the timely and efficient consideration of all matters of importance to the Trustees, the fund, and fund shareholders and to facilitate compliance with legal and regulatory requirements and oversight of the fund's activities and associated risks. The Board, acting through its committees, has charged FMR and its affiliates with (i) identifying events or circumstances the occurrence of which could have demonstrably adverse effects on the fund's business and/or reputation; (ii) implementing processes and controls to lessen the possibility that such events or circumstances occur or to mitigate the effects of such events or circumstances if they do occur; and (iii) creating and maintaining a system designed to evaluate continuously business and market conditions in order to facilitate the identification and implementation processes described in (i) and (ii) above. Because the day-to-day operations and activities of the fund are carried out by or through FMR, its affiliates, and other service providers, the fund's exposure to risks is mitigated but not eliminated by the processes overseen by the Trustees. While each of the Board's committees has responsibility for overseeing different aspects of the fund's activities, oversight is exercised primarily through the Operations, Audit, and Compliance Committees. In addition, the Independent Trustees have worked with FMR to enhance the Board's oversight of investment and financial risks, legal and regulatory risks, technology risks, and operational risks, including the development of additional risk reporting to the Board. For example, a working group comprised of Independent Trustees and FMR has worked and continues to work to review the Fidelity® funds' valuation-related activities, reporting and risk management. Appropriate personnel, including but not limited to the fund's Chief Compliance Officer (CCO), FMR's internal auditor, the independent accountants, the fund's Treasurer and portfolio management personnel, make periodic reports to the Board's committees, as appropriate, including an annual review of Fidelity's risk management program for the Fidelity® funds. The responsibilities of each standing committee, including their oversight responsibilities, are described further under "Standing Committees of the Trustees."
Interested Trustees*:
Correspondence intended for a Trustee who is an interested person may be sent to Fidelity Investments, 245 Summer Street, Boston, Massachusetts 02210.
Name, Year of Birth; Principal Occupations and Other Relevant Experience+
James C. Curvey (1935)
Year of Election or Appointment: 2007
Trustee
Chairman of the Board of Trustees
Mr. Curvey also serves as Trustee of other Fidelity® funds. Mr. Curvey is a Director of Fidelity Research & Analysis Co. (investment adviser firm, 2009-present), and Vice Chairman (2007-present) and Director of FMR LLC (diversified financial services company). In addition, Mr. Curvey serves as an Overseer for the Boston Symphony Orchestra and a member of the board of Artis-Naples, Naples, Florida, and as a Trustee for Brewster Academy, Wolfeboro, New Hampshire. Previously, Mr. Curvey served as a Director of Fidelity Investments Money Management, Inc. (investment adviser firm, 2009-2014) and a Director of FMR and FMR Co., Inc. (investment adviser firms, 2007-2014).
Charles S. Morrison (1960)
Year of Election or Appointment: 2014
Trustee
Mr. Morrison also serves as Trustee of other funds. He serves as President of Fidelity Management & Research Company (FMR) (investment adviser firm, 2016-present), a Director of Fidelity Investments Money Management, Inc. (FIMM) (investment adviser firm, 2014-present), Director of Fidelity SelectCo, LLC (investment adviser firm, 2014-present), President, Asset Management (2014-present), and is an employee of Fidelity Investments. Previously, Mr. Morrison served as Vice President of Fidelity's Fixed Income and Asset Allocation Funds (2012-2014), President, Fixed Income (2011-2014), Vice President of Fidelity's Money Market Funds (2005-2009), President, Money Market Group Leader of FMR (investment adviser firm, 2009), and Senior Vice President, Money Market Group of FMR (2004-2009). Mr. Morrison also served as Vice President of Fidelity's Bond Funds (2002-2005), certain Balanced Funds (2002-2005), and certain Asset Allocation Funds (2002-2007), and as Senior Vice President (2002-2005) of Fidelity's Bond Division.
* Determined to be an “Interested Trustee” by virtue of, among other things, his or her affiliation with the trust or various entities under common control with FMR.
+ The information includes the Trustee's principal occupation during the last five years and other information relating to the experience, attributes, and skills relevant to the Trustee's qualifications to serve as a Trustee, which led to the conclusion that the Trustee should serve as a Trustee for the fund.
Independent Trustees:
Correspondence intended for an Independent Trustee may be sent to Fidelity Investments, P.O. Box 55235, Boston, Massachusetts 02205-5235.
Name, Year of Birth; Principal Occupations and Other Relevant Experience+
Dennis J. Dirks (1948)
Year of Election or Appointment: 2005
Trustee
Mr. Dirks also serves as Trustee of other Fidelity® funds. Prior to his retirement in May 2003, Mr. Dirks was Chief Operating Officer and a member of the Board of The Depository Trust & Clearing Corporation (DTCC). He also served as President, Chief Operating Officer, and Board member of The Depository Trust Company (DTC) and President and Board member of the National Securities Clearing Corporation (NSCC). In addition, Mr. Dirks served as Chief Executive Officer and Board member of the Government Securities Clearing Corporation, Chief Executive Officer and Board member of the Mortgage-Backed Securities Clearing Corporation, as a Trustee and a member of the Finance Committee of Manhattan College (2005-2008), as a Trustee and a member of the Finance Committee of AHRC of Nassau County (2006-2008), and as a member of the Independent Directors Council (IDC) Governing Council (2010-2015). Mr. Dirks is a member of the Board of Directors for The Brookville Center for Children's Services, Inc. (2009-present) and the Finance Committee of the Asolo Repertory Theatre (2016-present).
Alan J. Lacy (1953)
Year of Election or Appointment: 2008
Trustee
Mr. Lacy also serves as Trustee of other Fidelity® funds. Mr. Lacy serves as Chairman (2014-present) and a member (2010-present) of the Board of Directors of Dave & Buster's Entertainment, Inc. (restaurant and entertainment complexes) and a Director of Bristol-Myers Squibb Company (global pharmaceuticals, 2008-present). He is a Trustee of the California Chapter of The Nature Conservancy (2015-present) and a Director of the Center for Advanced Study in the Behavioral Sciences at Stanford University (2015-present). In addition, Mr. Lacy served as Senior Adviser (2007-2014) of Oak Hill Capital Partners, L.P. (private equity) and also served as Chief Executive Officer (2005) and Vice Chairman (2005-2006) of Sears Holdings Corporation (retail) and Chief Executive Officer and Chairman of the Board of Sears, Roebuck and Co. (retail, 2000-2005). Previously, Mr. Lacy served as Chairman (2008-2011) and a member (2006-2015) of the Board of Trustees of the National Parks Conservation Association and as a member of the Board of Directors for The Western Union Company (global money transfer, 2006-2011), The Hillman Companies, Inc. (hardware wholesalers, 2010-2014), and Earth Fare, Inc. (retail grocery, 2010-2014).
Ned C. Lautenbach (1944)
Year of Election or Appointment: 2000
Trustee
Chairman of the Independent Trustees
Mr. Lautenbach also serves as Trustee of other Fidelity® funds. Mr. Lautenbach currently serves as the Lead Director of the Eaton Corporation Board of Directors (diversified industrial, 1997-present). Mr. Lautenbach is Chairman of the Board of Directors of Artis-Naples in Naples, Florida (2012-present), a member of the Council on Foreign Relations (1994-present), and currently Vice Chair of the Board of Governors, State University System of Florida (2013-present). Previously, Mr. Lautenbach was a Partner and Advisory Partner at Clayton, Dubilier & Rice, LLC (private equity investment, 1998-2010), as well as a Director of Sony Corporation (2006-2007). Mr. Lautenbach also had a 30-year career with IBM (technology company) during which time he served as Senior Vice President and a member of the Corporate Executive Committee (1968-1998).
Joseph Mauriello (1944)
Year of Election or Appointment: 2008
Trustee
Mr. Mauriello also serves as Trustee of other Fidelity® funds. Prior to his retirement in January 2006, Mr. Mauriello served in numerous senior management positions including Deputy Chairman and Chief Operating Officer (2004-2005), and Vice Chairman of Financial Services (2002-2004) of KPMG LLP US (professional services, 1965-2005). Mr. Mauriello currently serves as a member of the Board of Directors of XL Group plc. (global insurance and re-insurance, 2006-present) and the Independent Directors Council (IDC) Governing Council (2015-present). Previously, Mr. Mauriello served as a Director of the Hamilton Funds of the Bank of New York (2006-2007) and of Arcadia Resources Inc. (health care services and products, 2007-2012).
Robert W. Selander (1950)
Year of Election or Appointment: 2011
Trustee
Mr. Selander also serves as Trustee of other Fidelity® funds. Mr. Selander serves as a Director of The Western Union Company (global money transfer, 2014-present) and a non-executive Chairman of Health Equity, Inc. (health savings custodian, 2015-present). Previously, Mr. Selander served as a Member of the Advisory Board of certain Fidelity® funds (2011), and Executive Vice Chairman (2010), Chief Executive Officer (2009-2010), and President and Chief Executive Officer (1997-2009) of Mastercard, Inc.
Cornelia M. Small (1944)
Year of Election or Appointment: 2005
Trustee
Ms. Small also serves as Trustee of other Fidelity® funds. Ms. Small is a member of the Board of Directors (2009-present) and Chair of the Investment Committee (2010-present) of the Teagle Foundation. Ms. Small also serves on the Investment Committee of the Berkshire Taconic Community Foundation (2008-present). Previously, Ms. Small served as Chairperson (2002-2008) and a member of the Investment Committee and Chairperson (2008-2012) and a member of the Board of Trustees of Smith College. In addition, Ms. Small served as Chief Investment Officer, Director of Global Equity Investments, and a member of the Board of Directors of Scudder, Stevens & Clark and Scudder Kemper Investments.
William S. Stavropoulos (1939)
Year of Election or Appointment: 2002
Trustee
Vice Chairman of the Independent Trustees
Mr. Stavropoulos also serves as Trustee of other Fidelity® funds. Mr. Stavropoulos serves as President and Founder of the Michigan Baseball Foundation, the Great Lakes Loons (2007-present). Mr. Stavropoulos is Chairman Emeritus of the Board of Directors of The Dow Chemical Company, where he previously served in numerous senior management positions, including President, CEO (1995-2000; 2002-2004), Chairman of the Executive Committee (2000-2006), and as a member of the Board of Directors (1990-2006). Currently, Mr. Stavropoulos is Chairman of the Board of Directors of Univar Inc. (global distributor of commodity and specialty chemicals), a Director of Teradata Corporation (data warehousing and technology solutions), and a member of the Advisory Board for Metalmark Capital LLC (private equity investment, 2005-present). Mr. Stavropoulos is an operating advisor to Clayton, Dubilier & Rice, LLC (private equity investment). In addition, Mr. Stavropoulos is a member of the University of Notre Dame Advisory Council for the College of Science, a Trustee of the Rollin L. Gerstacker Foundation, and a Director of Artis-Naples in Naples, Florida. Previously, Mr. Stavropoulos served as a Director of Chemical Financial Corporation (bank holding company, 1993-2012) and Tyco International, Ltd. (multinational manufacturing and services, 2007-2012).
David M. Thomas (1949)
Year of Election or Appointment: 2008
Trustee
Mr. Thomas also serves as Trustee of other Fidelity® funds. Mr. Thomas serves as Non-Executive Chairman of the Board of Directors of Fortune Brands Home and Security (home and security products, 2011-present), as a member of the Board of Directors (2004-present) and Presiding Director (2013-present) of Interpublic Group of Companies, Inc. (marketing communication), and as a member of the Board of Trustees of the University of Florida (2013-present). Previously, Mr. Thomas served as Executive Chairman (2005-2006) and Chairman and Chief Executive Officer (2000-2005) of IMS Health, Inc. (pharmaceutical and healthcare information solutions), and a Director of Fortune Brands, Inc. (consumer products, 2000-2011).
+ The information includes the Trustee's principal occupation during the last five years and other information relating to the experience, attributes, and skills relevant to the Trustee's qualifications to serve as a Trustee, which led to the conclusion that the Trustee should serve as a Trustee for the fund.
Advisory Board Members and Officers:
Correspondence intended for an officer or Peter S. Lynch may be sent to Fidelity Investments, 245 Summer Street, Boston, Massachusetts 02210. Officers appear below in alphabetical order.
Name, Year of Birth; Principal Occupation
Peter S. Lynch (1944)
Year of Election or Appointment: 2003
Member of the Advisory Board
Mr. Lynch also serves as Member of the Advisory Board of other Fidelity® funds. Mr. Lynch is Vice Chairman and a Director of FMR (investment adviser firm) and FMR Co., Inc. (investment adviser firm). In addition, Mr. Lynch serves as a Trustee of Boston College and as the Chairman of the Inner-City Scholarship Fund. Previously, Mr. Lynch served on the Special Olympics International Board of Directors (1997-2006).
Marc R. Bryant (1966)
Year of Election or Appointment: 2015
Secretary and Chief Legal Officer (CLO)
Mr. Bryant also serves as Secretary and CLO of other funds. Mr. Bryant serves as CLO, Secretary, and Senior Vice President of Fidelity Management & Research Company (investment adviser firm, 2015-present) and FMR Co., Inc. (investment adviser firm, 2015-present); Secretary of Fidelity SelectCo, LLC (investment adviser firm, 2015-present) and Fidelity Investments Money Management, Inc. (investment adviser firm, 2015-present); and CLO of Fidelity Management & Research (Hong Kong) Limited and FMR Investment Management (UK) Limited (investment adviser firms, 2015-present) and Fidelity Management & Research (Japan) Limited (investment adviser firm, 2016-present). He is Senior Vice President and Deputy General Counsel of FMR LLC (diversified financial services company). Previously, Mr. Bryant served as Secretary and CLO of Fidelity Rutland Square Trust II (2010-2014) and Assistant Secretary of Fidelity's Fixed Income and Asset Allocation Funds (2013-2015). Prior to joining Fidelity Investments, Mr. Bryant served as a Senior Vice President and the Head of Global Retail Legal for AllianceBernstein L.P. (2006-2010), and as the General Counsel for ProFund Advisors LLC (2001-2006).
Jeffrey S. Christian (1961)
Year of Election or Appointment: 2016
Assistant Treasurer
Mr. Christian also serves as Assistant Treasurer of other funds. Mr. Christian is an employee of Fidelity Investments (2003-present).
William C. Coffey (1969)
Year of Election or Appointment: 2009
Assistant Secretary
Mr. Coffey also serves as Assistant Secretary of other funds. He is Senior Vice President and Deputy General Counsel of FMR LLC (diversified financial services company, 2010-present), and is an employee of Fidelity Investments. Previously, Mr. Coffey served as Vice President and Associate General Counsel of FMR LLC (2005-2009).
Jonathan Davis (1968)
Year of Election or Appointment: 2010
Assistant Treasurer
Mr. Davis also serves as Assistant Treasurer of other funds, and is an employee of Fidelity Investments. Previously, Mr. Davis served as Vice President and Associate General Counsel of FMR LLC (diversified financial services company, 2003-2010).
Adrien E. Deberghes (1967)
Year of Election or Appointment: 2016
Assistant Treasurer
Mr. Deberghes also serves as an officer of other funds. He serves as Executive Vice President of Fidelity Investments Money Management, Inc. (FIMM) (investment adviser firm, 2016-present) and is an employee of Fidelity Investments (2008-present). Prior to joining Fidelity Investments, Mr. Deberghes was Senior Vice President of Mutual Fund Administration at State Street Corporation (2007-2008), Senior Director of Mutual Fund Administration at Investors Bank & Trust (2005-2007), and Director of Finance for Dunkin' Brands (2000-2005). Previously, Mr. Deberghes served in other fund officer roles.
Stephanie J. Dorsey (1969)
Year of Election or Appointment: 2010
Assistant Treasurer
Ms. Dorsey also serves as an officer of other funds. She is an employee of Fidelity Investments (2008-present) and has served in other fund officer roles. Prior to joining Fidelity Investments, Ms. Dorsey served as Treasurer (2004-2008) of the JPMorgan Mutual Funds and Vice President (2004-2008) of JPMorgan Chase Bank.
Howard J. Galligan III (1966)
Year of Election or Appointment: 2014
Chief Financial Officer
Mr. Galligan also serves as Chief Financial Officer of other funds. Mr. Galligan serves as President of Fidelity Pricing and Cash Management Services (FPCMS) (2014-present) and as a Director of Strategic Advisers, Inc. (investment adviser firm, 2008-present). Previously, Mr. Galligan served as Chief Administrative Officer of Asset Management (2011-2014) and Chief Operating Officer and Senior Vice President of Investment Support for Strategic Advisers, Inc. (2003-2011).
Scott C. Goebel (1968)
Year of Election or Appointment: 2015
Vice President
Mr. Goebel serves as Vice President of other funds and is an employee of Fidelity Investments (2001-present). Previously, Mr. Goebel served as Senior Vice President of Fidelity Management & Research Company (FMR) (investment adviser firm, 2016), Secretary of Fidelity SelectCo, LLC (investment adviser firm, 2013-2015), Fidelity Investments Money Management, Inc. (FIMM) (investment adviser firm, 2010-2015), and Fidelity Research and Analysis Company (FRAC) (investment adviser firm, 2010-2015); General Counsel, Secretary, and Senior Vice President of FMR (investment adviser firm, 2008-2015) and FMR Co., Inc. (investment adviser firm, 2008-2015); Assistant Secretary of Fidelity Management & Research (Japan) Limited (investment adviser firm, 2008-2015) and Fidelity Management & Research (U.K.) Inc. (investment adviser firm, 2008-2015); Chief Legal Officer (CLO) of Fidelity Management & Research (Hong Kong) Limited (investment adviser firm, 2008-2015); Secretary and CLO of certain Fidelity® funds (2008-2015); Assistant Secretary of FIMM (2008-2010), FRAC (2008-2010), and certain funds (2007-2008); and as Vice President and Secretary of Fidelity Distributors Corporation (FDC) (2005-2007).
Brian B. Hogan (1964)
Year of Election or Appointment: 2009
Vice President
Mr. Hogan also serves as Trustee or Vice President of other funds. Mr. Hogan serves as a Director of FMR Investment Management (UK) Limited (investment adviser firm, 2015-present) and Fidelity SelectCo, LLC (investment adviser firm, 2014-present) and President of the Equity Division of FMR (investment adviser firm, 2009-present). Previously, Mr. Hogan served as Senior Vice President, Equity Research of FMR (2006-2009) and as a portfolio manager. Mr. Brian B. Hogan is not related to Mr. Colm A. Hogan.
Colm A. Hogan (1973)
Year of Election or Appointment: 2016
Deputy Treasurer
Mr. Hogan also serves as an officer of other funds. Mr. Hogan is an employee of Fidelity Investments (2005-present). Mr. Colm A. Hogan is not related to Mr. Brian B. Hogan.
Chris Maher (1972)
Year of Election or Appointment: 2013
Assistant Treasurer
Mr. Maher serves as Assistant Treasurer of other funds. Mr. Maher is Vice President of Valuation Oversight and is an employee of Fidelity Investments. Previously, Mr. Maher served as Vice President of Asset Management Compliance (2013), Vice President of the Program Management Group of FMR (investment adviser firm, 2010-2013), and Vice President of Valuation Oversight (2008-2010).
John F. Papandrea (1972)
Year of Election or Appointment: 2016
Anti-Money Laundering (AML) Officer
Mr. Papandrea also serves as AML Officer of other funds. Mr. Papandrea is Vice President of FMR LLC (diversified financial services company, 2008-present) and is an employee of Fidelity Investments (2005-present).
Melissa M. Reilly (1971)
Year of Election or Appointment: 2014
Vice President of certain Equity Funds
Ms. Reilly also serves as Vice President of other funds. Ms. Reilly is an employee of Fidelity Investments (2004-present).
Kenneth B. Robins (1969)
Year of Election or Appointment: 2016
Chief Compliance Officer
Mr. Robins also serves as an officer of other funds. Mr. Robins serves as Compliance Officer of Fidelity Management & Research Company and FMR Co., Inc. (investment adviser firms, 2016-present) and is an employee of Fidelity Investments (2004-present). Previously, Mr. Robins served as Executive Vice President of Fidelity Investments Money Management, Inc. (investment adviser firm, 2013-2016) and served in other fund officer roles.
Stacie M. Smith (1974)
Year of Election or Appointment: 2016
President and Treasurer
Ms. Smith also serves as an officer of other funds. She is an employee of Fidelity Investments (2009-present) and has served in other fund officer roles. Prior to joining Fidelity Investments, Ms. Smith served as Senior Audit Manager of Ernst & Young LLP (accounting firm, 1996-2009). Previously, Ms. Smith served as Deputy Treasurer of certain Fidelity® funds (2013-2016).
Marc L. Spector (1972)
Year of Election or Appointment: 2016
Assistant Treasurer
Mr. Spector also serves as an officer of other funds. Mr. Spector is an employee of Fidelity Investments (2016-present). Prior to joining Fidelity Investments, Mr. Spector served as Director at the Siegfried Group (accounting firm, 2013-2016), and prior to Siegfried Group as audit senior manager at Deloitte & Touche (accounting firm, 2005-2013).
Renee Stagnone (1975)
Year of Election or Appointment: 2016
Assistant Treasurer
Ms. Stagnone also serves as an officer of other funds. Ms. Stagnone is an employee of Fidelity Investments (1997-present). Previously, Ms. Stagnone served as Deputy Treasurer of certain Fidelity® funds (2013-2016).
Shareholder Expense Example
As a shareholder of the Fund, you incur two types of costs: (1) transaction costs and (2) ongoing costs, including management fees and other Fund expenses. This Example is intended to help you understand your ongoing costs (in dollars) of investing in the Fund and to compare these costs with the ongoing costs of investing in other mutual funds.
The Example is based on an investment of $1,000 invested at the beginning of the period and held for the entire period (June 1, 2016 to November 30, 2016).
Actual Expenses
The first line of the accompanying table for each class of the Fund provides information about actual account values and actual expenses. You may use the information in this line, together with the amount you invested, to estimate the expenses that you paid over the period. Simply divide your account value by $1,000.00 (for example, an $8,600 account value divided by $1,000.00 = 8.6), then multiply the result by the number in the first line for a class of the Fund under the heading entitled "Expenses Paid During Period" to estimate the expenses you paid on your account during this period. A small balance maintenance fee of $12.00 that is charged once a year may apply for certain accounts with a value of less than $2,000. This fee is not included in the table below. If it was, the estimate of expenses you paid during the period would be higher, and your ending account value lower, by this amount. In addition, the Fund, as a shareholder in the underlying Fidelity Central Funds, will indirectly bear its pro-rata share of the fees and expenses incurred by the underlying Fidelity Central Funds. These fees and expenses are not included in the Fund's annualized expense ratio used to calculate the expense estimate in the table below.
Hypothetical Example for Comparison Purposes
The second line of the accompanying table for each class of the Fund provides information about hypothetical account values and hypothetical expenses based on a Class' actual expense ratio and an assumed rate of return of 5% per year before expenses, which is not the Class' actual return. The hypothetical account values and expenses may not be used to estimate the actual ending account balance or expenses you paid for the period. You may use this information to compare the ongoing costs of investing in the Fund and other funds. To do so, compare this 5% hypothetical example with the 5% hypothetical examples that appear in the shareholder reports of the other funds. A small balance maintenance fee of $12.00 that is charged once a year may apply for certain accounts with a value of less than $2,000. This fee is not included in the table below. If it was, the estimate of expenses you paid during the period would be higher, and your ending account value lower, by this amount. In addition, the Fund, as a shareholder in the underlying Fidelity Central Funds, will indirectly bear its pro-rata share of the fees and expenses incurred by the underlying Fidelity Central Funds. These fees and expenses are not included in the Fund's annualized expense ratio used to calculate the expense estimate in the table below.
Please note that the expenses shown in the table are meant to highlight your ongoing costs only and do not reflect any transaction costs. Therefore, the second line of the table is useful in comparing ongoing costs only, and will not help you determine the relative total costs of owning different funds.
| | Annualized Expense Ratio-A | Beginning
Account Value
June 1, 2016 | Ending
Account Value
November 30, 2016 | Expenses Paid
During Period-B
June 1, 2016
to November 30, 2016 |
| Growth Company | .74% | | | |
| Actual | | $1,000.00 | $1,074.40 | $3.84 |
| Hypothetical-C | | $1,000.00 | $1,021.30 | $3.74 |
| Class K | .63% | | | |
| Actual | | $1,000.00 | $1,074.90 | $3.27 |
| Hypothetical-C | | $1,000.00 | $1,021.85 | $3.18 |
A Annualized expense ratio reflects expenses net of applicable fee waivers.
B Expenses are equal to each Class' annualized expense ratio, multiplied by the average account value over the period, multiplied by 183/366 (to reflect the one-half year period).
C 5% return per year before expenses
Distributions (Unaudited)
The Board of Trustees of Fidelity Growth Company Fund voted to pay to shareholders of record at the opening of business on record date, the following distributions per share derived from capital gains realized from sales of portfolio securities, and dividends derived from net investment income:
| | Pay Date | Record Date | Dividends | Capital Gains |
| Fidelity Growth Company Fund | | | | |
| Growth Company | 12/28/16 | 12/27/16 | $0.093 | $8.069 |
| Class K | 12/28/16 | 12/27/16 | $0.231 | $8.069 |
|
The fund hereby designates as a capital gain dividend with respect to the taxable year ended November 30, 2016, $2,189,213,127, or, if subsequently determined to be different, the net capital gain of such year.
Class K designates 100% of the dividends distributed during the fiscal year as qualifying for the dividends–received deduction for corporate shareholders.
Class K designates 100% of dividends distributed during the fiscal year as amounts which may be taken into account as a dividend for purposes of the maximum rate under section 1(h)(11) of the Internal Revenue Code.
The fund will notify shareholders in January 2017 of amounts for use in preparing 2016 income tax returns.
Board Approval of Investment Advisory Contracts and Management Fees
Fidelity Growth Company Fund
Each year, the Board of Trustees, including the Independent Trustees (together, the Board), votes on the renewal of the management contract with Fidelity Management & Research Company (FMR) and the sub-advisory agreements (together, the Advisory Contracts) for the fund. The Board, assisted by the advice of fund counsel and Independent Trustees' counsel, requests and considers a broad range of information relevant to the renewal of the Advisory Contracts throughout the year.
The Board meets regularly and, at each of its meetings, covers an extensive agenda of topics and materials and considers factors that are relevant to its annual consideration of the renewal of the fund's Advisory Contracts, including the services and support provided to the fund and its shareholders. The Board has established various standing committees (Committees), each composed of and chaired by Independent Trustees with varying backgrounds, to which the Board has assigned specific subject matter responsibilities in order to enhance effective decision-making by the Board. The Board, acting directly and through its Committees, requests and receives information concerning the annual consideration of the renewal of the fund's Advisory Contracts. The Board also meets as needed to consider matters specifically related to the Board's annual consideration of the renewal of the Advisory Contracts. Members of the Board may also meet with trustees of other Fidelity funds through ad hoc joint committees to discuss certain matters relevant to all of the Fidelity funds.
At its July 2016 meeting, the Board unanimously determined to renew the fund's Advisory Contracts. In reaching its determination, the Board considered all factors it believed relevant, including (i) the nature, extent, and quality of the services to be provided to the fund and its shareholders (including the investment performance of the fund); (ii) the competitiveness of the fund's management fee and total expense ratio relative to peer funds; (iii) the total costs of the services to be provided by and the profits to be realized by Fidelity from its relationships with the fund; and (iv) the extent to which, if any, economies of scale exist and would be realized as the fund grows, and whether any economies of scale are appropriately shared with fund shareholders.
In considering whether to renew the Advisory Contracts for the fund, the Board reached a determination, with the assistance of fund counsel and Independent Trustees' counsel and through the exercise of its business judgment, that the renewal of the Advisory Contracts was in the best interests of the fund and its shareholders and that the compensation payable under the Advisory Contracts was fair and reasonable. The Board's decision to renew the Advisory Contracts was not based on any single factor, but rather was based on a comprehensive consideration of all the information provided to the Board at its meetings throughout the year. The Board, in reaching its determination to renew the Advisory Contracts, was aware that shareholders of the fund have a broad range of investment choices available to them, including a wide choice among funds offered by Fidelity's competitors, and that the fund's shareholders, who have the opportunity to review and weigh the disclosure provided by the fund in its prospectus and other public disclosures, have chosen to invest in this fund, which is part of the Fidelity family of funds.
Nature, Extent, and Quality of Services Provided. The Board considered Fidelity's staffing as it relates to the fund, including the backgrounds of investment personnel of Fidelity, and also considered the fund's investment objective, strategies, and related investment philosophy. The Independent Trustees also had discussions with senior management of Fidelity's investment operations and investment groups. The Board considered the structure of the investment personnel compensation program and whether this structure provides appropriate incentives to act in the best interests of the fund. Additionally, the Board considered the portfolio managers' investments, if any, in the funds that they manage.
Resources Dedicated to Investment Management and Support Services. The Board and the Fund Oversight and Research Committees reviewed the general qualifications and capabilities of Fidelity's investment staff, including its size, education, experience, and resources, as well as Fidelity's approach to recruiting, training, managing, and compensating investment personnel. The Board noted that Fidelity has continued to increase the resources devoted to non-U.S. offices, including expansion of Fidelity's global investment organization. The Board also noted that Fidelity's analysts have extensive resources, tools and capabilities that allow them to conduct sophisticated quantitative and fundamental analysis, as well as credit analysis of issuers, counterparties and guarantors. Further, the Board considered that Fidelity's investment professionals have sufficient access to global information and data so as to provide competitive investment results over time, and that those professionals also have access to sophisticated tools that permit them to assess portfolio construction and risk and performance attribution characteristics continuously, as well as to transmit new information and research conclusions rapidly around the world. Additionally, in its deliberations, the Board considered Fidelity's trading, risk management, compliance, and technology and operations capabilities and resources, which are integral parts of the investment management process.
Shareholder and Administrative Services. The Board considered (i) the nature, extent, quality, and cost of advisory, administrative, and shareholder services performed by FMR, the sub-advisers (together with FMR, the Investment Advisers), and their affiliates under the Advisory Contracts and under separate agreements covering transfer agency, pricing and bookkeeping, and securities lending services for the fund; (ii) the nature and extent of the supervision of third party service providers, principally custodians, subcustodians, and pricing vendors; and (iii) the resources devoted to, and the record of compliance with, the fund's compliance policies and procedures. The Board also reviewed the allocation of fund brokerage, including allocations to brokers affiliated with the Investment Advisers, the use of brokerage commissions to pay fund expenses, and the use of "soft" commission dollars to pay for research services.
The Board noted that the growth of fund assets over time across the complex allows Fidelity to reinvest in the development of services designed to enhance the value or convenience of the Fidelity funds as investment vehicles. These services include 24-hour access to account information and market information through telephone representatives and over the Internet, investor education materials and asset allocation tools, and the expanded availability of Fidelity Investor Centers.
In 2014, the Board formed an ad hoc Committee on Transfer Agency Fees to review the variety of transfer agency fee structures throughout the industry and Fidelity's competitive positioning with respect to industry participants.
Investment in a Large Fund Family. The Board considered the benefits to shareholders of investing in a Fidelity fund, including the benefits of investing in a fund that is part of a large family of funds offering a variety of investment disciplines and providing a large variety of mutual fund investor services. The Board noted that Fidelity had taken, or had made recommendations that resulted in the Fidelity funds taking, a number of actions over the previous year that benefited particular funds, including: (i) continuing to dedicate additional resources to investment research and to the support of the senior management team that oversees asset management; (ii) continuing efforts to enhance Fidelity's global research capabilities; (iii) launching new funds and making other enhancements to meet client needs; (iv) broadening eligibility requirements for certain lower-priced share classes of, and streamlining the fee structure for, certain existing equity index funds; (v) lowering expense caps for certain existing funds and classes to reduce expenses paid by shareholders; (vi) eliminating redemption fees for certain variable insurance product funds and classes; (vii) continuing to launch dedicated lower cost underlying funds to meet portfolio construction needs related to expanding underlying fund options for Fidelity funds of funds, specifically for the Freedom Fund product lines; (viii) launching a lower cost share class for use by the Freedom Index Fund product line; (ix) rationalizing product lines and gaining increased efficiencies through fund mergers and share class consolidations; (x) continuing to develop, acquire and implement systems and technology to improve services to the funds and shareholders, strengthen information security, and increase efficiency; (xi) implementing investment enhancements to further strengthen Fidelity's target date product line to increase investors' probability of success in achieving their goals; (xii) accelerating the conversion of all remaining Class B shares to Class A shares, which have a lower expense structure; and (xiii) implementing changes to Fidelity's money market fund product line in response to recent regulatory reforms.
Investment Performance. The Board considered whether the fund has operated in accordance with its investment objective, as well as its record of compliance with its investment restrictions and its performance history.
The Board took into account discussions with representatives of the Investment Advisers about fund investment performance that occur at Board meetings throughout the year. In this regard the Board noted that as part of regularly scheduled fund reviews and other reports to the Board on fund performance, the Board considers annualized return information for the fund, for different time periods, measured against a securities market index ("benchmark index") and a peer group of funds with similar objectives ("peer group"), if any. In its evaluation of fund investment performance, the Board gave particular attention to information indicating changes in performance of certain Fidelity funds for specific time periods and discussed with the Investment Advisers the reasons for any overperformance or underperformance.
In addition to reviewing absolute and relative fund performance, the Independent Trustees periodically consider the appropriateness of fund performance metrics in evaluating the results achieved. In general, the Independent Trustees believe that fund performance should be evaluated based on net performance (after fees and expenses) of both the highest performing and lowest performing fund share classes, where applicable, compared to appropriate benchmark indices, over appropriate time periods that may include full market cycles, and compared to peer groups, as applicable, over the same periods, taking into account relevant factors including the following: general market conditions; issuer-specific information; and fund cash flows and other factors.
The Independent Trustees recognize that shareholders evaluate performance on a net basis over their own holding periods, for which one-, three-, and five-year periods are often used as a proxy. For this reason, the performance information reviewed by the Board also included net cumulative calendar year total return information for the fund and an appropriate benchmark index and peer group for the most recent one-, three-, and five-year periods, as shown below. Returns are shown compared to the 25th percentile (top of box, 75% beaten) and 75th percentile (bottom of box, 25% beaten) of the peer universe.
Fidelity Growth Company Fund

The Board also considered that the fund's management fee is subject to upward or downward adjustment depending upon whether, and to what extent, the fund's investment performance for the performance period exceeds, or is exceeded by, a securities index, thus leading to a performance adjustment for the same period. The Board noted that the performance adjustment provides FMR with a strong economic incentive to seek to achieve superior performance for the fund's shareholders and helps to more closely align the interests of FMR and the shareholders of the fund.
Based on its review, the Board concluded that the nature, extent, and quality of services provided to the fund under the Advisory Contracts should continue to benefit the shareholders of the fund.
Competitiveness of Management Fee and Total Expense Ratio. The Board considered the fund's management fee and total expense ratio compared to "mapped groups" of competitive funds and classes created for the purpose of facilitating the Trustees' competitive analysis of management fees and total expenses. Fidelity creates "mapped groups" by combining similar Broadridge investment objective categories that have comparable investment mandates. Combining Broadridge investment objective categories aids the Board's management fee and total expense ratio comparisons by broadening the competitive group used for comparison.
Management Fee. The Board considered two proprietary management fee comparisons for the 12-month periods shown in basis points (BP) in the chart below. The group of Broadridge funds used by the Board for management fee comparisons is referred to below as the "Total Mapped Group." The Total Mapped Group comparison focuses on a fund's standing in terms of gross management fees before expense reimbursements or caps, and without giving effect to the fund's performance adjustment, relative to the total universe of funds with comparable investment mandates, regardless of whether their management fee structures also are comparable. Funds with comparable investment mandates offer exposure to similar types of securities. Funds with comparable management fee structures have similar management fee contractual arrangements (
e.g., flat rate charged for advisory services, all-inclusive fee rate,
etc.). "TMG %" represents the percentage of funds in the Total Mapped Group that had management fees that were lower than the fund's. For example, a hypothetical TMG % of 20% would mean that 80% of the funds in the Total Mapped Group had higher, and 20% had lower, management fees than the fund. The fund's actual TMG %s and the number of funds in the Total Mapped Group are in the chart below. The "Asset-Size Peer Group" (ASPG) comparison focuses on a fund's standing relative to a subset of non-Fidelity funds within the Total Mapped Group that are similar in size and management fee structure without taking into account performance adjustments, if any. For example, if a fund is in the first quartile of the ASPG, the fund's management fee ranks in the least expensive or lowest 25% of funds in the ASPG. The ASPG represents at least 15% of the funds in the Total Mapped Group with comparable asset size and management fee structures, subject to a minimum of 50 funds (or all funds in the Total Mapped Group if fewer than 50). Additional information, such as the ASPG quartile in which the fund's management fee rate ranked and the impact of the fund's performance adjustment, is also included in the chart and considered by the Board.
Fidelity Growth Company Fund
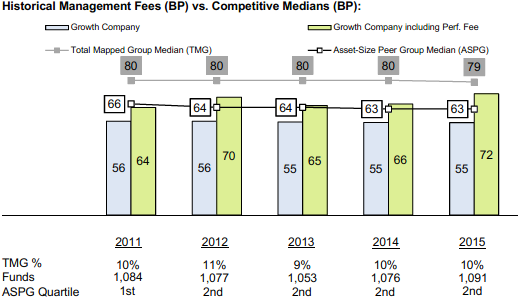
The Board noted that the fund's management fee rate ranked below the median of its Total Mapped Group and below the median of its ASPG for 2015. The Board also noted the effect of the fund's performance adjustment, if any, on the fund's management fee ranking.
The Board noted that, in 2014, the ad hoc Committee on Group Fee was formed by it and the boards of other Fidelity funds to conduct an in-depth review of the "group fee" component of the management fee of funds with such management fee structures. The Committee's focus included the mechanics of the group fee, the competitive landscape of group fee structures, Fidelity funds with no group fee component and investment products not included in group fee assets. The Board also considered that, for funds subject to the group fee, FMR agreed to voluntarily waive fees over a specified period of time in amounts designed to account for assets converted from certain funds to certain collective investment trusts.
The Board also noted that, in 2013, the ad hoc Committee on Management Fees was formed to conduct an in-depth review of the management fee rates of Fidelity's active equity mutual funds. The Committee focused on the following areas: (i) standard fee structures; (ii) research consumption and trading evolution; (iii) management fee competitiveness/profitability by category; and (iv) factors that drive institutional pricing.
Based on its review, the Board concluded that the fund's management fee is fair and reasonable in light of the services that the fund receives and the other factors considered.
Total Expense Ratio. In its review of each class's total expense ratio, the Board considered the fund's management fee rate as well as other fund or class expenses, as applicable, such as transfer agent fees, pricing and bookkeeping fees, and custodial, legal, and audit fees. The Board noted the impact of the fund's performance adjustment. The Board also noted that Fidelity may agree to waive fees and expenses from time to time, and the extent to which, if any, it has done so for the fund. As part of its review, the Board also considered the current and historical total expense ratios of each class of the fund compared to competitive fund median expenses. Each class of the fund is compared to those funds and classes in the Total Mapped Group (used by the Board for management fee comparisons) that have a similar sales load structure.
The Board noted that the total expense ratio of each class ranked below the competitive median for 2015.
Fees Charged to Other Fidelity Clients. The Board also considered Fidelity fee structures and other information with respect to clients of Fidelity, such as other funds advised or subadvised by Fidelity, pension plan clients, and other institutional clients with similar mandates. The Board noted the findings of the 2013 ad hoc joint committee (created with the board of other Fidelity funds), which reviewed and compared Fidelity's institutional investment advisory business with its business of providing services to the Fidelity funds, including the differences in services provided, fees charged, and costs incurred, as well as competition in their respective marketplaces.
Based on its review of total expense ratios and fees charged to other Fidelity clients, the Board concluded that the total expense ratio of each class of the fund was reasonable in light of the services that the fund and its shareholders receive and the other factors considered.
Costs of the Services and Profitability. The Board considered the revenues earned and the expenses incurred by Fidelity in conducting the business of developing, marketing, distributing, managing, administering and servicing the fund and servicing the fund's shareholders. The Board also considered the level of Fidelity's profits in respect of all the Fidelity funds.
On an annual basis, Fidelity presents to the Board information about the profitability of its relationship with the fund. Fidelity calculates profitability information for each fund, as well as aggregate profitability information for groups of Fidelity funds and all Fidelity funds, using a series of detailed revenue and cost allocation methodologies which originate with the books and records of Fidelity on which Fidelity's audited financial statements are based. The Audit Committee of the Board reviews any significant changes from the prior year's methodologies.
PricewaterhouseCoopers LLP (PwC), independent registered public accounting firm and auditor to Fidelity and certain Fidelity funds, has been engaged annually by the Board as part of the Board's assessment of Fidelity's profitability analysis. PwC's engagement includes the review and assessment of the methodologies used by Fidelity in determining the revenues and expenses attributable to Fidelity's mutual fund business, and completion of agreed-upon procedures in respect of the mathematical accuracy of the fund profitability information and its conformity to established allocation methodologies. After considering PwC's reports issued under the engagement and information provided by Fidelity, the Board concluded that while other allocation methods may also be reasonable, Fidelity's profitability methodologies are reasonable in all material respects.
The Board also reviewed Fidelity's non-fund businesses and fall-out benefits related to the mutual fund business as well as cases where Fidelity's affiliates may benefit from or be related to the fund's business.
The Board considered the costs of the services provided by and the profits realized by Fidelity in connection with the operation of the fund and was satisfied that the profitability was not excessive.
Economies of Scale. The Board considered whether there have been economies of scale in respect of the management of the Fidelity funds, whether the Fidelity funds (including the fund) have appropriately benefited from any such economies of scale, and whether there is potential for realization of any further economies of scale. The Board considered the extent to which the fund will benefit from economies of scale as assets grow through increased services to the fund, through waivers or reimbursements, or through fee or expense ratio reductions. The Board also noted that in 2013, it and the boards of other Fidelity funds created an ad hoc committee (the Economies of Scale Committee) to analyze whether Fidelity attains economies of scale in respect of the management and servicing of the Fidelity funds, whether the Fidelity funds have appropriately benefited from such economies of scale, and whether there is potential for realization of any further economies of scale.
The Board recognized that the fund's management contract incorporates a "group fee" structure, which provides for lower group fee rates as total group assets increase, and for higher group fee rates as total group assets decrease (with "group assets" defined to include fund assets under FMR's management plus the assets of sector funds previously under FMR's management). FMR calculates the group fee rates based on a tiered asset "breakpoint" schedule that varies based on asset class. The Board considered that the group fee is designed to deliver the benefits of economies of scale to fund shareholders when total Fidelity fund assets increase, even if assets of any particular fund are unchanged or have declined, because some portion of Fidelity's costs are attributable to services provided to all Fidelity funds, and all funds benefit if those costs can be allocated among more assets. The Board also considered that although the fund is partially closed to new investors, it continues to incur investment management expenses, and marketing and distribution expenses related to the retention of existing shareholders and assets. The Board further noted that the fund may continue to realize benefits from the group fee structure, even though assets may not be expected to grow significantly at the fund level. The Board concluded that, given the group fee structure, fund shareholders will benefit from lower management fees as group assets increase at the fund complex level, regardless of whether Fidelity achieves any such economies of scale.
The Board concluded, taking into account the analysis of the Economies of Scale Committee, that economies of scale, if any, are being appropriately shared between fund shareholders and Fidelity.
Additional Information Requested by the Board. In order to develop fully the factual basis for consideration of the Fidelity funds' Advisory Contracts, the Board requested and received additional information on certain topics, including: (i) fund performance trends and Fidelity's long-term strategies for certain funds; (ii) the various share classes employed by Fidelity and the attributes of each class, together with similar information on the distribution and servicing payments made by Fidelity or the funds to third-party participants in the distribution channels; (iii) fund profitability, and fund performance in relation to fund profitability; (iv) the methodology with respect to evaluating competitive fund data and peer group classifications and fee comparisons; (v) annual fund profitability margins; (vi) the realization of fall-out benefits in and attribution of fall-out benefits to certain Fidelity business units; (vii) the appropriateness of certain funds' benchmarks; (viii) the rationalization for certain share classes and expenses; (ix) sub-advisory fee rates for comparable investment mandates; (x) product strategy for certain underperforming funds; and (xi) Fidelity's resources and strategy for cybersecurity.
Based on its evaluation of all of the conclusions noted above, and after considering all factors it believed relevant, the Board concluded that the advisory fee structures are fair and reasonable, and that the fund's Advisory Contracts should be renewed.

Corporate Headquarters
245 Summer St.
Boston, MA 02210
www.fidelity.com
GCF-K-ANN-0117
1.863213.108
Fidelity® Growth Company Fund
Annual Report November 30, 2016 |
|
Contents
To view a fund's proxy voting guidelines and proxy voting record for the 12-month period ended June 30, visit http://www.fidelity.com/proxyvotingresults or visit the Securities and Exchange Commission's (SEC) web site at http://www.sec.gov.
You may also call 1-800-544-8544 to request a free copy of the proxy voting guidelines.
Standard & Poor's, S&P and S&P 500 are registered service marks of The McGraw-Hill Companies, Inc. and have been licensed for use by Fidelity Distributors Corporation.
Other third-party marks appearing herein are the property of their respective owners.
All other marks appearing herein are registered or unregistered trademarks or service marks of FMR LLC or an affiliated company. © 2017 FMR LLC. All rights reserved.
This report and the financial statements contained herein are submitted for the general information of the shareholders of the Fund. This report is not authorized for distribution to prospective investors in the Fund unless preceded or accompanied by an effective prospectus.
A fund files its complete schedule of portfolio holdings with the SEC for the first and third quarters of each fiscal year on Form N-Q. Forms N-Q are available on the SEC’s web site at http://www.sec.gov. A fund's Forms N-Q may be reviewed and copied at the SEC’s Public Reference Room in Washington, DC. Information regarding the operation of the SEC's Public Reference Room may be obtained by calling 1-800-SEC-0330.
For a complete list of a fund's portfolio holdings, view the most recent holdings listing, semiannual report, or annual report on Fidelity's web site at http://www.fidelity.com, http://www.institutional.fidelity.com, or http://www.401k.com, as applicable.
NOT FDIC INSURED •MAY LOSE VALUE •NO BANK GUARANTEE
Neither the Fund nor Fidelity Distributors Corporation is a bank.
Performance: The Bottom Line
Average annual total return reflects the change in the value of an investment, assuming reinvestment of distributions from dividend income and capital gains (the profits earned upon the sale of securities that have grown in value, if any) and assuming a constant rate of performance each year. The hypothetical investment and the average annual total returns do not reflect the deduction of taxes that a shareholder would pay on fund distributions or the redemption of fund shares. During periods of reimbursement by Fidelity, a fund’s total return will be greater than it would be had the reimbursement not occurred. How a fund did yesterday is no guarantee of how it will do tomorrow.
Average Annual Total Returns
| For the periods ended November 30, 2016 | Past 1 year | Past 5 years | Past 10 years |
| Fidelity® Growth Company Fund | 3.48% | 15.61% | 9.84% |
$10,000 Over 10 Years
Let's say hypothetically that $10,000 was invested in Fidelity® Growth Company Fund, a class of the fund, on November 30, 2006.
The chart shows how the value of your investment would have changed, and also shows how the Russell 3000® Growth Index performed over the same period.
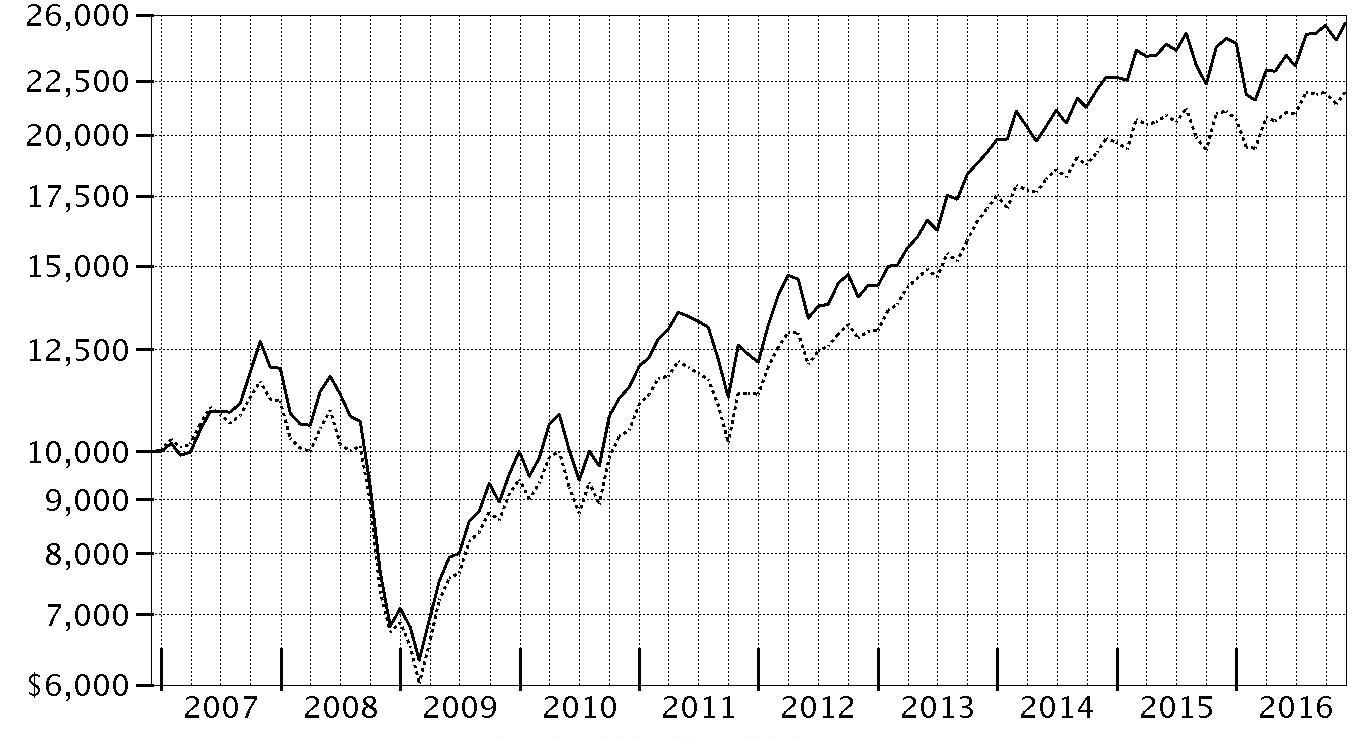
| Period Ending Values |
| $25,558 | Fidelity® Growth Company Fund |
| $21,953 | Russell 3000® Growth Index |
Management's Discussion of Fund Performance
Market Recap: The S&P 500
® index returned 8.06% for the 12 months ending November 30, 2016, rising sharply in the final month on post-election optimism for economic growth. The period began during a fairly volatile stretch, with stocks hampered by persistent oil-price weakness and U.S.-dollar strength. Markets regained positive momentum in February amid U.S. job gains, a rally in energy and other stimuli that helped keep the roughly seven-year uptrend intact. Markets tumbled briefly following the U.K.'s June 23 vote to exit the European Union – dubbed "Brexit" – then recovered quickly and settled into a flattish stretch until the November 8 U.S. presidential election. For the year, 10 of the 11 sectors in the S&P 500
® advanced, with six posting double-digit gains. Telecommunication services (+16%) led the way, its strength attributable to demand for dividend-paying equities early in the period, as well as to company-specific news. Cyclical sectors including industrials (+15%), financials (+14%), energy (+13%) and materials (+12%) posted strong gains, the latter two driven by a rebound in commodity prices. Conversely, real estate (+1%) lagged the index due to a late-period slump related to expectations for rising interest rates. Consumer discretionary (+3%) also underperformed, as competitive pressure continued to weigh on brick-and-mortar retailers.
Comments from Portfolio Manager Steven Wymer: For the year, the fund’s share classes returned about 4%, modestly underperforming the 4.25% gain of the benchmark Russell 3000 Growth Index. Versus the benchmark, positioning in the pharmaceuticals, biotechnology & life sciences industry weighed most on performance, attributed to stock-specific events and industrywide drug-pricing pressures. Positioning in industrials also hurt. Drugmaker Alnylam Pharmaceuticals was the fund’s biggest relative detractor. Alnylam's shares were cut roughly in half in October when a late-stage trial revealed potential safety issues with one of its drug candidates that sought to treat rare hereditary diseases. The fund's second-largest detractor this period was Regeneron Pharmaceuticals, one of our largest holdings. The firm faced a number of setbacks, including patent infringement woes and concerns about slowing sales growth for its key drug Eylea
®, used to treat macular (retinal) degeneration. Turning to the positive, graphics chipmaker Nvidia was the largest relative contributor to fund performance by far. The company's share price more than doubled this period, boosted by consecutive quarters of better-than-expected financial results.
The views expressed above reflect those of the portfolio manager(s) only through the end of the period as stated on the cover of this report and do not necessarily represent the views of Fidelity or any other person in the Fidelity organization. Any such views are subject to change at any time based upon market or other conditions and Fidelity disclaims any responsibility to update such views. These views may not be relied on as investment advice and, because investment decisions for a Fidelity fund are based on numerous factors, may not be relied on as an indication of trading intent on behalf of any Fidelity fund.
Investment Summary (Unaudited)
Top Ten Stocks as of November 30, 2016
| | % of fund's net assets | % of fund's net assets 6 months ago |
| NVIDIA Corp. | 7.7 | 4.6 |
| Apple, Inc. | 4.8 | 4.3 |
| Amazon.com, Inc. | 4.5 | 4.4 |
| Alphabet, Inc. Class A | 3.9 | 4.0 |
| Facebook, Inc. Class A | 3.0 | 3.3 |
| Salesforce.com, Inc. | 3.0 | 4.7 |
| adidas AG | 2.2 | 1.2 |
| Microsoft Corp. | 2.2 | 1.3 |
| Alphabet, Inc. Class C | 2.0 | 2.0 |
| Alkermes PLC | 1.6 | 1.3 |
| | 34.9 | |
Top Five Market Sectors as of November 30, 2016
| | % of fund's net assets | % of fund's net assets 6 months ago |
| Information Technology | 40.5 | 37.9 |
| Consumer Discretionary | 19.9 | 20.8 |
| Health Care | 19.0 | 18.7 |
| Industrials | 6.9 | 7.5 |
| Consumer Staples | 6.1 | 8.7 |
Prior period industry classifications reflect the categories in place as of the date indicated and have not been adjusted to reflect current industry classifications.
Asset Allocation (% of fund's net assets)
| As of November 30, 2016* |
| | Stocks | 97.3% |
| | Convertible Securities | 2.4% |
| | Short-Term Investments and Net Other Assets (Liabilities) | 0.3% |

* Foreign investments - 8.9%
| As of May 31, 2016* |
| | Stocks | 97.4% |
| | Convertible Securities | 2.3% |
| | Short-Term Investments and Net Other Assets (Liabilities) | 0.3% |

* Foreign investments - 7.9%
Investments November 30, 2016
Showing Percentage of Net Assets
| Common Stocks - 97.3% | | | |
| | | Shares | Value (000s) |
| CONSUMER DISCRETIONARY - 19.8% | | | |
| Auto Components - 0.0% | | | |
| Adient PLC (a) | | 49,986 | $2,677 |
| Automobiles - 0.7% | | | |
| Tesla Motors, Inc. (a)(b) | | 1,401,100 | 265,368 |
| Hotels, Restaurants & Leisure - 3.2% | | | |
| Buffalo Wild Wings, Inc. (a) | | 598,800 | 100,958 |
| China Lodging Group Ltd. ADR | | 367,600 | 19,255 |
| Chipotle Mexican Grill, Inc. (a) | | 145,000 | 57,468 |
| Dave & Buster's Entertainment, Inc. (a) | | 362,342 | 16,976 |
| Del Taco Restaurants, Inc. (a) | | 1,329,800 | 19,309 |
| Domino's Pizza, Inc. | | 278,700 | 46,833 |
| Dunkin' Brands Group, Inc. | | 434,540 | 23,591 |
| Hyatt Hotels Corp. Class A (a) | | 186,940 | 9,597 |
| Las Vegas Sands Corp. | | 907,100 | 56,848 |
| McDonald's Corp. | | 1,399,300 | 166,895 |
| Panera Bread Co. Class A (a)(b) | | 305,400 | 64,778 |
| Papa John's International, Inc. | | 1,020,300 | 90,154 |
| Shake Shack, Inc. Class A (a)(b) | | 177,400 | 6,543 |
| Starbucks Corp. | | 4,985,300 | 288,998 |
| Wingstop, Inc. | | 334,388 | 10,262 |
| Yum China Holdings, Inc. | | 2,587,400 | 72,758 |
| Yum! Brands, Inc. | | 1,281,600 | 81,241 |
| | | | 1,132,464 |
| Household Durables - 0.1% | | | |
| Newell Brands, Inc. | | 231,654 | 10,890 |
| Sony Corp. sponsored ADR | | 1,275,200 | 37,070 |
| | | | 47,960 |
| Internet & Direct Marketing Retail - 6.9% | | | |
| Amazon.com, Inc. (a) | | 2,178,101 | 1,634,817 |
| Ctrip.com International Ltd. ADR (a) | | 1,361,700 | 61,590 |
| Etsy, Inc. (a) | | 222,100 | 2,754 |
| Expedia, Inc. | | 1,099,000 | 136,331 |
| Groupon, Inc. Class A (a) | | 9,796,400 | 38,892 |
| JD.com, Inc. sponsored ADR (a) | | 305,500 | 8,209 |
| Netflix, Inc. (a) | | 2,028,500 | 237,335 |
| Priceline Group, Inc. (a) | | 137,768 | 207,159 |
| The Honest Co., Inc. (a)(c) | | 39,835 | 1,242 |
| TripAdvisor, Inc. (a) | | 126,600 | 6,112 |
| Vipshop Holdings Ltd. ADR (a) | | 4,699,000 | 52,723 |
| Wayfair LLC Class A (a)(b) | | 2,753,967 | 100,382 |
| | | | 2,487,546 |
| Leisure Products - 0.1% | | | |
| Callaway Golf Co. | | 2,565,900 | 31,176 |
| NJOY, Inc. (a)(c) | | 17,666,069 | 0 |
| | | | 31,176 |
| Media - 1.6% | | | |
| Comcast Corp. Class A | | 5,375,700 | 373,665 |
| Lions Gate Entertainment Corp. (b) | | 231,492 | 5,417 |
| The Walt Disney Co. | | 1,850,700 | 183,441 |
| Twenty-First Century Fox, Inc. Class A | | 404,800 | 11,379 |
| | | | 573,902 |
| Multiline Retail - 0.3% | | | |
| Dollar General Corp. | | 244,700 | 18,920 |
| Dollar Tree, Inc. (a) | | 595,400 | 52,490 |
| Target Corp. | | 284,689 | 21,989 |
| | | | 93,399 |
| Specialty Retail - 1.5% | | | |
| AutoNation, Inc. (a) | | 317,600 | 14,184 |
| CarMax, Inc. (a)(b) | | 319,721 | 18,477 |
| DavidsTea, Inc. (a) | | 982,600 | 9,384 |
| Home Depot, Inc. | | 2,574,700 | 333,166 |
| L Brands, Inc. | | 695,400 | 48,831 |
| Restoration Hardware Holdings, Inc. (a)(b)(d) | | 2,151,049 | 77,545 |
| TJX Companies, Inc. | | 386,000 | 30,239 |
| | | | 531,826 |
| Textiles, Apparel & Luxury Goods - 5.4% | | | |
| adidas AG | | 5,275,500 | 777,258 |
| Aritzia LP (a) | | 1,620,800 | 21,236 |
| Columbia Sportswear Co. | | 171,000 | 9,725 |
| Kate Spade & Co. (a) | | 3,704,715 | 55,015 |
| lululemon athletica, Inc. (a)(d) | | 8,984,923 | 512,051 |
| NIKE, Inc. Class B | | 3,772,700 | 188,899 |
| Skechers U.S.A., Inc. Class A (sub. vtg.) (a) | | 9,868,940 | 224,814 |
| Tory Burch LLC: | | | |
| Class A unit (a)(c)(e) | | 950,844 | 52,810 |
| Class B(a)(c)(e) | | 324,840 | 19,241 |
| Under Armour, Inc.: | | | |
| Class A (sub. vtg.) (a)(b) | | 430,500 | 13,259 |
| Class C (non-vtg.) | | 417,804 | 10,771 |
| VF Corp. | | 582,800 | 31,768 |
| | | | 1,916,847 |
|
| TOTAL CONSUMER DISCRETIONARY | | | 7,083,165 |
|
| CONSUMER STAPLES - 6.1% | | | |
| Beverages - 2.4% | | | |
| Constellation Brands, Inc. Class A (sub. vtg.) | | 360,600 | 54,501 |
| Dr. Pepper Snapple Group, Inc. | | 200,400 | 17,383 |
| Monster Beverage Corp. (a) | | 9,123,318 | 408,268 |
| PepsiCo, Inc. | | 1,161,640 | 116,280 |
| The Coca-Cola Co. | | 6,155,300 | 248,366 |
| | | | 844,798 |
| Food & Staples Retailing - 1.2% | | | |
| Costco Wholesale Corp. | | 1,404,300 | 210,799 |
| CVS Health Corp. | | 1,057,100 | 81,280 |
| Drogasil SA | | 2,947,473 | 56,203 |
| Kroger Co. | | 381,950 | 12,337 |
| Sprouts Farmers Market LLC (a) | | 66,200 | 1,325 |
| Walgreens Boots Alliance, Inc. | | 669,900 | 56,761 |
| Whole Foods Market, Inc. | | 699,600 | 21,261 |
| | | | 439,966 |
| Food Products - 0.7% | | | |
| Campbell Soup Co. | | 148,100 | 8,425 |
| General Mills, Inc. | | 173,800 | 10,591 |
| Mead Johnson Nutrition Co. Class A | | 1,095,000 | 78,939 |
| Mondelez International, Inc. | | 681,400 | 28,101 |
| The Hain Celestial Group, Inc. (a) | | 349,300 | 13,689 |
| The Hershey Co. | | 296,800 | 28,683 |
| The Kraft Heinz Co. | | 513,900 | 41,960 |
| Tyson Foods, Inc. Class A | | 380,100 | 21,593 |
| | | | 231,981 |
| Household Products - 0.3% | | | |
| Church & Dwight Co., Inc. | | 923,500 | 40,440 |
| Colgate-Palmolive Co. | | 481,700 | 31,421 |
| Kimberly-Clark Corp. | | 284,300 | 32,868 |
| Procter & Gamble Co. | | 148,100 | 12,212 |
| | | | 116,941 |
| Personal Products - 0.7% | | | |
| Coty, Inc. Class A | | 8,797,900 | 164,609 |
| Herbalife Ltd. (a) | | 1,637,110 | 80,268 |
| | | | 244,877 |
| Tobacco - 0.8% | | | |
| Altria Group, Inc. | | 2,884,580 | 184,411 |
| Japan Tobacco, Inc. | | 412,600 | 14,304 |
| Philip Morris International, Inc. | | 527,680 | 46,584 |
| Reynolds American, Inc. | | 1,008,726 | 54,572 |
| | | | 299,871 |
|
| TOTAL CONSUMER STAPLES | | | 2,178,434 |
|
| ENERGY - 2.6% | | | |
| Energy Equipment & Services - 0.8% | | | |
| Baker Hughes, Inc. | | 2,258,800 | 145,309 |
| Halliburton Co. | | 546,200 | 28,998 |
| Schlumberger Ltd. | | 204,000 | 17,146 |
| U.S. Silica Holdings, Inc. | | 1,655,100 | 83,765 |
| | | | 275,218 |
| Oil, Gas & Consumable Fuels - 1.8% | | | |
| Anadarko Petroleum Corp. | | 505,500 | 34,955 |
| Cabot Oil & Gas Corp. | | 1,458,400 | 32,260 |
| Concho Resources, Inc. (a) | | 653,500 | 93,464 |
| Continental Resources, Inc. (a) | | 715,200 | 41,489 |
| EOG Resources, Inc. | | 1,534,600 | 157,327 |
| Hess Corp. | | 268,600 | 15,031 |
| Noble Energy, Inc. | | 1,161,711 | 44,331 |
| PDC Energy, Inc. (a) | | 531,200 | 39,548 |
| Pioneer Natural Resources Co. | | 647,207 | 123,642 |
| Range Resources Corp. | | 1,606,900 | 56,531 |
| Valero Energy Corp. | | 243,700 | 15,002 |
| | | | 653,580 |
|
| TOTAL ENERGY | | | 928,798 |
|
| FINANCIALS - 2.4% | | | |
| Banks - 1.0% | | | |
| Citigroup, Inc. | | 577,780 | 32,581 |
| HDFC Bank Ltd. sponsored ADR | | 1,601,474 | 103,327 |
| JPMorgan Chase & Co. | | 2,005,300 | 160,765 |
| Signature Bank (a) | | 64,385 | 9,652 |
| Wells Fargo & Co. | | 866,900 | 45,876 |
| | | | 352,201 |
| Capital Markets - 1.3% | | | |
| BlackRock, Inc. Class A | | 448,800 | 166,411 |
| BM&F BOVESPA SA | | 5,757,397 | 28,276 |
| Charles Schwab Corp. | | 6,684,675 | 258,430 |
| RPI International Holdings LP (c) | | 130,847 | 17,149 |
| | | | 470,266 |
| Consumer Finance - 0.1% | | | |
| American Express Co. | | 255,548 | 18,410 |
| Discover Financial Services | | 112,644 | 7,634 |
| | | | 26,044 |
|
| TOTAL FINANCIALS | | | 848,511 |
|
| HEALTH CARE - 18.1% | | | |
| Biotechnology - 13.8% | | | |
| AbbVie, Inc. | | 1,068,200 | 64,947 |
| AbbVie, Inc. (f) | | 642,091 | 38,649 |
| ACADIA Pharmaceuticals, Inc. (a)(d) | | 2,929,105 | 79,057 |
| ACADIA Pharmaceuticals, Inc. (a)(b)(d) | | 4,036,694 | 108,950 |
| Adaptimmune Therapeutics PLC sponsored ADR (a) | | 685,400 | 2,858 |
| Adverum Biotechnologies, Inc. (a) | | 986,400 | 2,811 |
| Agios Pharmaceuticals, Inc. (a)(b) | | 1,529,287 | 89,020 |
| Aimmune Therapeutics, Inc. (a) | | 211,900 | 4,810 |
| Alder Biopharmaceuticals, Inc. (a)(b) | | 450,600 | 10,612 |
| Alexion Pharmaceuticals, Inc. (a) | | 1,864,860 | 228,613 |
| Alkermes PLC (a)(d) | | 9,933,061 | 564,496 |
| Alnylam Pharmaceuticals, Inc. (a)(d) | | 4,824,103 | 211,633 |
| Amgen, Inc. | | 1,895,000 | 273,013 |
| Array BioPharma, Inc. (a) | | 6,163,770 | 49,896 |
| aTyr Pharma, Inc. (a)(b)(d) | | 562,107 | 1,743 |
| aTyr Pharma, Inc. (a)(d)(f) | | 1,469,144 | 4,554 |
| BeiGene Ltd. ADR (b) | | 1,884,861 | 59,750 |
| Biogen, Inc. (a) | | 354,500 | 104,248 |
| bluebird bio, Inc. (a)(b)(d) | | 2,434,481 | 146,921 |
| Celgene Corp. (a) | | 1,263,088 | 149,689 |
| Celldex Therapeutics, Inc. (a)(b) | | 5,853,416 | 22,302 |
| Cellectis SA sponsored ADR (a) | | 701,962 | 11,835 |
| Chimerix, Inc. (a)(d) | | 2,915,257 | 14,256 |
| Coherus BioSciences, Inc. (a)(b) | | 2,029,917 | 54,605 |
| Corvus Pharmaceuticals, Inc. | | 330,300 | 5,097 |
| CytomX Therapeutics, Inc. (a) | | 678,978 | 7,564 |
| CytomX Therapeutics, Inc. (f) | | 794,033 | 8,846 |
| Dicerna Pharmaceuticals, Inc. (a) | | 875,550 | 2,609 |
| Editas Medicine, Inc. | | 1,264,682 | 18,047 |
| Exelixis, Inc. (a)(d) | | 18,229,867 | 308,449 |
| Fate Therapeutics, Inc. (a)(b) | | 1,676,206 | 4,928 |
| Five Prime Therapeutics, Inc. (a) | | 1,119,055 | 64,368 |
| Galapagos Genomics NV sponsored ADR (a) | | 1,120,098 | 66,220 |
| Genocea Biosciences, Inc. (a)(b) | | 518,900 | 2,086 |
| Gilead Sciences, Inc. | | 2,919,795 | 215,189 |
| Global Blood Therapeutics, Inc. (a) | | 668,417 | 12,800 |
| Heron Therapeutics, Inc. (a)(b) | | 918,591 | 14,100 |
| Intellia Therapeutics, Inc. (a)(b) | | 1,382,500 | 21,774 |
| Intercept Pharmaceuticals, Inc. (a)(b) | | 158,654 | 16,043 |
| Intrexon Corp. (a)(b) | | 551,275 | 16,086 |
| Ionis Pharmaceuticals, Inc. (a)(b)(d) | | 8,098,427 | 354,387 |
| Ironwood Pharmaceuticals, Inc. Class A (a) | | 6,028,193 | 94,070 |
| Lexicon Pharmaceuticals, Inc. (a)(b)(d) | | 6,811,148 | 103,734 |
| Macrogenics, Inc. (a) | | 157,921 | 4,095 |
| Merrimack Pharmaceuticals, Inc. (a)(b)(d) | | 7,509,421 | 41,377 |
| Momenta Pharmaceuticals, Inc. (a)(d) | | 5,402,265 | 76,442 |
| Opko Health, Inc. (a) | | 422,498 | 4,390 |
| PhaseRx, Inc. (b) | | 298,252 | 626 |
| Protagonist Therapeutics, Inc. | | 270,458 | 6,748 |
| Prothena Corp. PLC (a)(d) | | 2,145,423 | 126,623 |
| Regeneron Pharmaceuticals, Inc. (a) | | 1,271,218 | 482,097 |
| Regulus Therapeutics, Inc. (a)(d) | | 3,115,245 | 7,632 |
| Rigel Pharmaceuticals, Inc. (a)(d) | | 8,211,095 | 21,349 |
| Sage Therapeutics, Inc. (a)(b)(d) | | 1,997,456 | 100,093 |
| Seattle Genetics, Inc.(a) | | 3,503,836 | 227,084 |
| Seres Therapeutics, Inc. (a) | | 1,321,311 | 13,200 |
| Seres Therapeutics, Inc. (f) | | 572,827 | 5,723 |
| Shire PLC sponsored ADR | | 101,316 | 17,690 |
| Spark Therapeutics, Inc. (a)(b) | | 352,788 | 19,407 |
| Syros Pharmaceuticals, Inc. (b)(d) | | 816,234 | 11,084 |
| Syros Pharmaceuticals, Inc. (d) | | 938,008 | 12,101 |
| TESARO, Inc. (a) | | 122,793 | 16,662 |
| Ultragenyx Pharmaceutical, Inc. (a)(b) | | 838,000 | 65,607 |
| Versartis, Inc. (a) | | 590,494 | 7,352 |
| Vertex Pharmaceuticals, Inc. (a) | | 335,967 | 27,418 |
| | | | 4,930,465 |
| Health Care Equipment & Supplies - 1.4% | | | |
| Abbott Laboratories | | 529,900 | 20,173 |
| Align Technology, Inc. (a) | | 151,256 | 14,074 |
| Baxter International, Inc. | | 508,100 | 22,544 |
| Danaher Corp. | | 1,518,200 | 118,678 |
| DexCom, Inc. (a) | | 537,900 | 35,119 |
| Entellus Medical, Inc. (a)(b) | | 407,300 | 7,507 |
| Genmark Diagnostics, Inc. (a) | | 1,340,553 | 15,577 |
| Insulet Corp. (a) | | 1,980,482 | 66,643 |
| Intuitive Surgical, Inc. (a) | | 98,293 | 63,275 |
| Novocure Ltd. (a)(b) | | 1,262,000 | 9,781 |
| Novocure Ltd. (f) | | 571,461 | 4,429 |
| Penumbra, Inc. (a)(b) | | 1,267,087 | 78,433 |
| Presbia PLC (a)(d) | | 1,183,529 | 5,184 |
| St. Jude Medical, Inc. | | 402,400 | 31,870 |
| Zeltiq Aesthetics, Inc. (a)(b) | | 427,300 | 18,805 |
| | | | 512,092 |
| Health Care Providers & Services - 0.9% | | | |
| Apollo Hospitals Enterprise Ltd. | | 720,000 | 12,549 |
| Cardinal Health, Inc. | | 767,700 | 54,514 |
| Express Scripts Holding Co. (a) | | 352,003 | 26,710 |
| Laboratory Corp. of America Holdings (a) | | 178,000 | 22,401 |
| McKesson Corp. | | 478,900 | 68,871 |
| UnitedHealth Group, Inc. | | 897,300 | 142,061 |
| | | | 327,106 |
| Health Care Technology - 0.3% | | | |
| athenahealth, Inc. (a)(b) | | 757,700 | 71,678 |
| Castlight Health, Inc. Class B (a)(b) | | 2,420,594 | 11,256 |
| Cerner Corp. (a) | | 206,100 | 10,260 |
| | | | 93,194 |
| Life Sciences Tools & Services - 0.1% | | | |
| Divi's Laboratories Ltd. | | 124,668 | 2,132 |
| Illumina, Inc. (a) | | 180,838 | 24,077 |
| | | | 26,209 |
| Pharmaceuticals - 1.6% | | | |
| Adimab LLC unit (a)(c)(e) | | 3,162,765 | 76,033 |
| Allergan PLC | | 318,038 | 61,795 |
| Avexis, Inc. (b) | | 934,341 | 55,238 |
| Bristol-Myers Squibb Co. | | 2,952,500 | 166,639 |
| Castle Creek Pharmaceuticals, LLC Class A-2 unit (c)(e) | | 46,864 | 15,465 |
| Cempra, Inc. (a)(b) | | 401,900 | 2,612 |
| Endocyte, Inc. (a)(b) | | 1,837,415 | 4,888 |
| Intra-Cellular Therapies, Inc. (a)(b)(d) | | 3,416,199 | 47,622 |
| Jazz Pharmaceuticals PLC (a) | | 451,900 | 46,830 |
| Kolltan Pharmaceuticals, Inc. rights (a) | | 7,940,644 | 1,334 |
| Mylan N.V. (a) | | 117,800 | 4,313 |
| Stemcentrx, Inc. rights 12/31/21 (a) | | 2,065,715 | 5,701 |
| Teva Pharmaceutical Industries Ltd. sponsored ADR | | 631,800 | 23,819 |
| The Medicines Company (a) | | 1,961,778 | 68,858 |
| Theravance Biopharma, Inc. (a)(b) | | 312,600 | 8,703 |
| | | | 589,850 |
|
| TOTAL HEALTH CARE | | | 6,478,916 |
|
| INDUSTRIALS - 6.6% | | | |
| Aerospace & Defense - 0.8% | | | |
| Lockheed Martin Corp. | | 562,400 | 149,177 |
| Northrop Grumman Corp. | | 74,221 | 18,529 |
| Space Exploration Technologies Corp. Class A (a)(c) | | 356,922 | 37,116 |
| The Boeing Co. | | 653,400 | 98,376 |
| | | | 303,198 |
| Air Freight & Logistics - 0.4% | | | |
| FedEx Corp. | | 106,300 | 20,375 |
| United Parcel Service, Inc. Class B | | 1,148,600 | 133,146 |
| | | | 153,521 |
| Airlines - 2.6% | | | |
| Allegiant Travel Co. | | 387,800 | 63,367 |
| Delta Air Lines, Inc. | | 1,400,600 | 67,481 |
| InterGlobe Aviation Ltd. (a) | | 632,349 | 7,923 |
| JetBlue Airways Corp. (a) | | 10,018,423 | 201,270 |
| Ryanair Holdings PLC sponsored ADR | | 551,152 | 44,004 |
| Southwest Airlines Co. | | 3,188,315 | 148,607 |
| Spirit Airlines, Inc. (a) | | 2,294,460 | 127,572 |
| United Continental Holdings, Inc. (a) | | 2,607,500 | 179,787 |
| Wheels Up Partners Holdings LLC Series B unit (a)(c)(e) | | 6,703,518 | 18,032 |
| Wizz Air Holdings PLC (a)(d) | | 3,073,536 | 64,452 |
| | | | 922,495 |
| Building Products - 0.1% | | | |
| Tyco International Ltd. | | 500,066 | 22,493 |
| Electrical Equipment - 0.3% | | | |
| AMETEK, Inc. | | 76,300 | 3,613 |
| Eaton Corp. PLC | | 506,800 | 33,707 |
| Emerson Electric Co. | | 440,700 | 24,873 |
| Fortive Corp. | | 759,300 | 41,754 |
| | | | 103,947 |
| Industrial Conglomerates - 0.9% | | | |
| 3M Co. | | 1,014,400 | 174,213 |
| Honeywell International, Inc. | | 1,325,500 | 151,027 |
| | | | 325,240 |
| Machinery - 1.2% | | | |
| Caterpillar, Inc. | | 2,962,400 | 283,087 |
| Cummins, Inc. | | 137,400 | 19,481 |
| Deere & Co. | | 383,500 | 38,427 |
| Illinois Tool Works, Inc. | | 342,700 | 42,899 |
| Wabtec Corp. | | 242,600 | 20,541 |
| Xylem, Inc. | | 761,700 | 39,288 |
| | | | 443,723 |
| Road & Rail - 0.3% | | | |
| Union Pacific Corp. | | 905,000 | 91,704 |
|
| TOTAL INDUSTRIALS | | | 2,366,321 |
|
| INFORMATION TECHNOLOGY - 39.4% | | | |
| Communications Equipment - 0.4% | | | |
| Arista Networks, Inc. (a) | | 68,400 | 6,485 |
| Cisco Systems, Inc. | | 666,200 | 19,866 |
| Infinera Corp. (a)(d) | | 12,561,828 | 106,776 |
| Palo Alto Networks, Inc. (a) | | 86,300 | 11,596 |
| | | | 144,723 |
| Electronic Equipment & Components - 0.2% | | | |
| TE Connectivity Ltd. | | 129,900 | 8,786 |
| Trimble, Inc. (a) | | 1,648,200 | 46,463 |
| | | | 55,249 |
| Internet Software & Services - 10.7% | | | |
| Actua Corp. (a)(d) | | 3,188,221 | 43,200 |
| Akamai Technologies, Inc. (a) | | 260,800 | 17,395 |
| Alibaba Group Holding Ltd. sponsored ADR (a) | | 1,411,700 | 132,728 |
| Alphabet, Inc.: | | | |
| Class A (a) | | 1,786,778 | 1,386,325 |
| Class C (a) | | 925,883 | 701,856 |
| Apptio, Inc. (d) | | 881,266 | 15,712 |
| Apptio, Inc. Class A (d) | | 414,600 | 8,213 |
| Baidu.com, Inc. sponsored ADR (a) | | 22,698 | 3,789 |
| Criteo SA sponsored ADR (a)(b) | | 307,783 | 12,702 |
| Dropbox, Inc. (a)(c) | | 1,105,082 | 14,057 |
| eBay, Inc. (a) | | 3,167,700 | 88,094 |
| Facebook, Inc. Class A (a) | | 9,149,291 | 1,083,459 |
| GoDaddy, Inc. (a) | | 447,800 | 15,825 |
| Hortonworks, Inc. (a)(b) | | 272,500 | 2,477 |
| NAVER Corp. | | 9,827 | 6,659 |
| New Relic, Inc. (a)(b) | | 519,279 | 16,466 |
| Nutanix, Inc.: | | | |
| Class A (a)(b)(d) | | 964,600 | 30,867 |
| Class B (d) | | 1,151,309 | 33,158 |
| Shopify, Inc. Class A (a) | | 3,912,942 | 163,052 |
| Tencent Holdings Ltd. | | 791,500 | 19,709 |
| Twitter, Inc. (a)(b) | | 42,590 | 787 |
| Wix.com Ltd. (a) | | 1,019,000 | 50,441 |
| | | | 3,846,971 |
| IT Services - 2.7% | | | |
| Cognizant Technology Solutions Corp. Class A (a) | | 1,055,032 | 58,111 |
| IBM Corp. | | 169,700 | 27,529 |
| MasterCard, Inc. Class A | | 2,877,800 | 294,111 |
| PayPal Holdings, Inc. (a) | | 3,626,600 | 142,453 |
| Visa, Inc. Class A | | 5,528,405 | 427,456 |
| | | | 949,660 |
| Semiconductors & Semiconductor Equipment - 11.2% | | | |
| Advanced Micro Devices, Inc. (a) | | 4,636,400 | 41,310 |
| Applied Materials, Inc. | | 224,300 | 7,222 |
| Applied Micro Circuits Corp. (a)(d) | | 6,066,489 | 53,082 |
| ASML Holding NV | | 230,693 | 23,791 |
| Broadcom Ltd. | | 707,402 | 120,605 |
| Cavium, Inc. (a) | | 2,477,460 | 141,290 |
| Cirrus Logic, Inc. (a) | | 3,013,367 | 165,735 |
| Cree, Inc. (a) | | 3,479,371 | 88,098 |
| Intel Corp. | | 392,200 | 13,609 |
| KLA-Tencor Corp. | | 288,300 | 23,018 |
| M/A-COM Technology Solutions Holdings, Inc. (a) | | 292,414 | 14,568 |
| Mellanox Technologies Ltd. (a) | | 809,889 | 33,570 |
| Micron Technology, Inc. (a) | | 327,300 | 6,392 |
| NVIDIA Corp. (d) | | 30,031,051 | 2,768,858 |
| NXP Semiconductors NV (a) | | 285,000 | 28,258 |
| Qorvo, Inc. (a) | | 269,400 | 14,389 |
| Rambus, Inc. (a) | | 2,837,000 | 37,307 |
| Silicon Laboratories, Inc. (a)(d) | | 3,247,273 | 215,457 |
| Skyworks Solutions, Inc. | | 146,031 | 11,222 |
| Taiwan Semiconductor Manufacturing Co. Ltd. sponsored ADR | | 1,451,700 | 43,101 |
| Texas Instruments, Inc. | | 2,278,900 | 168,479 |
| | | | 4,019,361 |
| Software - 9.2% | | | |
| Activision Blizzard, Inc. | | 7,699,808 | 281,890 |
| Adobe Systems, Inc. (a) | | 1,478,736 | 152,029 |
| Appirio, Inc. Escrow(c) | | 389,363 | 94 |
| Atlassian Corp. PLC | | 233,800 | 6,345 |
| Autodesk, Inc. (a) | | 716,800 | 52,047 |
| CyberArk Software Ltd. (a) | | 1,429,900 | 72,939 |
| Electronic Arts, Inc. (a) | | 2,409,152 | 190,901 |
| HubSpot, Inc. (a)(d) | | 1,782,554 | 100,001 |
| Intuit, Inc. | | 545,200 | 61,978 |
| Microsoft Corp. | | 12,868,617 | 775,463 |
| Oracle Corp. | | 1,156,100 | 46,464 |
| Paylocity Holding Corp. (a) | | 203,700 | 6,745 |
| Proofpoint, Inc. (a) | | 475,000 | 36,580 |
| Red Hat, Inc. (a) | | 4,684,986 | 370,629 |
| Salesforce.com, Inc. (a) | | 14,997,612 | 1,079,828 |
| ServiceNow, Inc. (a) | | 535,600 | 44,535 |
| Zendesk, Inc. (a) | | 1,649,500 | 35,118 |
| | | | 3,313,586 |
| Technology Hardware, Storage & Peripherals - 5.0% | | | |
| Apple, Inc. | | 15,573,548 | 1,721,189 |
| Pure Storage, Inc. Class A (a) | | 4,463,819 | 62,270 |
| Samsung Electronics Co. Ltd. | | 12,683 | 18,805 |
| Western Digital Corp. | | 109,213 | 6,952 |
| | | | 1,809,216 |
|
| TOTAL INFORMATION TECHNOLOGY | | | 14,138,766 |
|
| MATERIALS - 1.4% | | | |
| Chemicals - 1.4% | | | |
| AdvanSix, Inc. (a) | | 77,124 | 1,442 |
| CF Industries Holdings, Inc. | | 1,226,525 | 35,496 |
| E.I. du Pont de Nemours & Co. | | 1,422,800 | 104,732 |
| Monsanto Co. | | 926,271 | 95,137 |
| Praxair, Inc. | | 213,300 | 25,660 |
| The Dow Chemical Co. | | 1,403,800 | 78,220 |
| The Mosaic Co. | | 307,200 | 8,724 |
| The Scotts Miracle-Gro Co. Class A | | 1,595,000 | 145,576 |
| | | | 494,987 |
| REAL ESTATE - 0.3% | | | |
| Equity Real Estate Investment Trusts (REITs) - 0.3% | | | |
| American Tower Corp. | | 1,131,500 | 115,719 |
| TELECOMMUNICATION SERVICES - 0.6% | | | |
| Diversified Telecommunication Services - 0.1% | | | |
| Verizon Communications, Inc. | | 1,223,000 | 61,028 |
| Wireless Telecommunication Services - 0.5% | | | |
| T-Mobile U.S., Inc. (a) | | 3,147,500 | 170,626 |
|
| TOTAL TELECOMMUNICATION SERVICES | | | 231,654 |
|
| TOTAL COMMON STOCKS | | | |
| (Cost $19,399,252) | | | 34,865,271 |
|
| Preferred Stocks - 2.4% | | | |
| Convertible Preferred Stocks - 2.4% | | | |
| CONSUMER DISCRETIONARY - 0.1% | | | |
| Hotels, Restaurants & Leisure - 0.0% | | | |
| MOD Super Fast Pizza Holdings LLC Series 3 Preferred unit (c)(e) | | 56,343 | 7,719 |
| Household Durables - 0.1% | | | |
| Roku, Inc.: | | | |
| Series F, 8.00% (a)(c) | | 17,901,305 | 31,327 |
| Series G, 8.00% (a)(c) | | 2,750,007 | 4,813 |
| Series H (c) | | 823,979 | 1,442 |
| | | | 37,582 |
| Internet & Direct Marketing Retail - 0.0% | | | |
| The Honest Co., Inc.: | | | |
| Series C (a)(c) | | 92,950 | 3,061 |
| Series D (a)(c) | | 69,363 | 2,530 |
| | | | 5,591 |
| Media - 0.0% | | | |
| Turn, Inc. Series E (a)(c) | | 984,774 | 3,121 |
| TOTAL CONSUMER DISCRETIONARY | | | 54,013 |
| CONSUMER STAPLES - 0.0% | | | |
| Food & Staples Retailing - 0.0% | | | |
| Blue Apron, Inc. Series D (a)(c) | | 750,363 | 10,858 |
| FINANCIALS - 0.0% | | | |
| Diversified Financial Services - 0.0% | | | |
| UNITY Biotechnology, Inc. Series B (c) | | 2,214,616 | 8,194 |
| HEALTH CARE - 0.9% | | | |
| Biotechnology - 0.8% | | | |
| 10X Genomics, Inc. Series C (c) | | 2,105,333 | 10,085 |
| Immunocore Ltd. Series A (a)(c) | | 67,323 | 14,865 |
| Intarcia Therapeutics, Inc.: | | | |
| Series CC (a)(c) | | 1,051,411 | 63,085 |
| Series DD (a)(c) | | 1,543,687 | 92,621 |
| Moderna Therapeutics, Inc.: | | | |
| Series D (c) | | 4,688,230 | 41,163 |
| Series E (c) | | 5,651,170 | 49,617 |
| Series F (c) | | 140,212 | 1,231 |
| RaNA Therapeutics LLC Series B (a)(c) | | 4,408,601 | 3,042 |
| | | | 275,709 |
| Health Care Providers & Services - 0.1% | | | |
| Mulberry Health, Inc. Series A8 (c) | | 2,790,742 | 18,224 |
| Health Care Technology - 0.0% | | | |
| Codiak Biosciences, Inc.: | | | |
| Series A (c) | | 589,863 | 1,557 |
| Series B (c) | | 1,917,058 | 5,061 |
| | | | 6,618 |
| TOTAL HEALTH CARE | | | 300,551 |
| INDUSTRIALS - 0.3% | | | |
| Aerospace & Defense - 0.1% | | | |
| Space Exploration Technologies Corp. Series G (a)(c) | | 216,276 | 22,491 |
| Commercial Services & Supplies - 0.1% | | | |
| Domo, Inc. Series D (a)(c) | | 2,990,903 | 20,317 |
| Professional Services - 0.1% | | | |
| YourPeople, Inc. Series C (c) | | 5,833,137 | 55,590 |
| TOTAL INDUSTRIALS | | | 98,398 |
| INFORMATION TECHNOLOGY - 1.1% | | | |
| Internet Software & Services - 0.7% | | | |
| Jet.Com, Inc. Series B1 Escrow(c) | | 7,578,338 | 2,489 |
| Uber Technologies, Inc.: | | | |
| Series D, 8.00% (a)(c) | | 4,770,180 | 232,652 |
| Series E, 8.00% (a)(c) | | 209,216 | 10,204 |
| | | | 245,345 |
| IT Services - 0.1% | | | |
| AppNexus, Inc. Series E (a)(c) | | 923,523 | 24,012 |
| Software - 0.3% | | | |
| Appirio, Inc. Series E Escrow(c) | | 2,725,544 | 730 |
| Cloudera, Inc. Series F (a)(c) | | 529,285 | 15,901 |
| Cloudflare, Inc. Series D 0.08% (a)(c) | | 1,429,726 | 8,564 |
| Dataminr, Inc. Series D (a)(c) | | 1,773,901 | 12,291 |
| MongoDB, Inc. Series F, 8.00% (a)(c) | | 1,913,404 | 16,194 |
| Snapchat, Inc. Series F (a)(c) | | 1,985,264 | 60,987 |
| Taboola.Com Ltd. Series E (a)(c) | | 1,337,420 | 17,530 |
| | | | 132,197 |
| TOTAL INFORMATION TECHNOLOGY | | | 401,554 |
| TELECOMMUNICATION SERVICES - 0.0% | | | |
| Wireless Telecommunication Services - 0.0% | | | |
| Altiostar Networks, Inc. Series E (c) | | 835,497 | 3,860 |
|
| TOTAL CONVERTIBLE PREFERRED STOCKS | | | 877,428 |
|
| Nonconvertible Preferred Stocks - 0.0% | | | |
| CONSUMER DISCRETIONARY - 0.0% | | | |
| Textiles, Apparel & Luxury Goods - 0.0% | | | |
| C. Wonder LLC Class A-1 (a)(c)(e) | | 619,048 | 0 |
| HEALTH CARE - 0.0% | | | |
| Biotechnology - 0.0% | | | |
| Yumanity Holdings LLC Class A (c) | | 464,607 | 3,587 |
|
| TOTAL NONCONVERTIBLE PREFERRED STOCKS | | | 3,587 |
|
| TOTAL PREFERRED STOCKS | | | |
| (Cost $615,570) | | | 881,015 |
| | | Principal Amount (000s) | Value (000s) |
|
| Convertible Bonds - 0.0% | | | |
| CONSUMER DISCRETIONARY - 0.0% | | | |
| Media - 0.0% | | | |
| Turn, Inc. 1.48% 3/2/23(c) | | | |
| (Cost $306) | | 306 | 306 |
| | | Shares | Value (000s) |
|
| Money Market Funds - 1.3% | | | |
| Fidelity Cash Central Fund, 0.39% (g) | | 62,860,972 | 62,874 |
| Fidelity Securities Lending Cash Central Fund 0.48% (g)(h) | | 401,706,108 | 401,786 |
| TOTAL MONEY MARKET FUNDS | | | |
| (Cost $464,586) | | | 464,660 |
| TOTAL INVESTMENT PORTFOLIO - 101.0% | | | |
| (Cost $20,479,714) | | | 36,211,252 |
| NET OTHER ASSETS (LIABILITIES) - (1.0)% | | | (358,266) |
| NET ASSETS - 100% | | | $35,852,986 |
Values shown as $0 may reflect amounts less than $500.
Legend
(a) Non-income producing
(b) Security or a portion of the security is on loan at period end.
(c) Restricted securities - Investment in securities not registered under the Securities Act of 1933 (excluding 144A issues). At the end of the period, the value of restricted securities (excluding 144A issues) amounted to $1,132,560,000 or 3.2% of net assets.
(d) Affiliated company
(e) Investment is owned by a wholly-owned subsidiary (Subsidiary) that is treated as a corporation for U.S. tax purposes.
(f) Security exempt from registration under Rule 144A of the Securities Act of 1933. These securities may be resold in transactions exempt from registration, normally to qualified institutional buyers. At the end of the period, the value of these securities amounted to $62,201,000 or 0.2% of net assets.
(g) Affiliated fund that is generally available only to investment companies and other accounts managed by Fidelity Investments. The rate quoted is the annualized seven-day yield of the fund at period end. A complete unaudited listing of the fund's holdings as of its most recent quarter end is available upon request. In addition, each Fidelity Central Fund's financial statements, which are not covered by the Fund's Report of Independent Registered Public Accounting Firm, are available on the SEC's website or upon request.
(h) Investment made with cash collateral received from securities on loan.
Additional information on each restricted holding is as follows:
| Security | Acquisition Date | Acquisition Cost (000s) |
| 10X Genomics, Inc. Series C | 2/23/16 | $9,428 |
| Adimab LLC unit | 9/17/14 - 6/5/15 | $47,869 |
| Altiostar Networks, Inc. Series E | 9/26/16 | $3,860 |
| Appirio, Inc. Escrow | 11/24/16 | $94 |
| Appirio, Inc. Series E Escrow | 11/24/16 | $730 |
| AppNexus, Inc. Series E | 8/1/14 | $18,500 |
| Blue Apron, Inc. Series D | 5/18/15 | $10,000 |
| C. Wonder LLC Class A-1 | 12/27/12 - 6/25/13 | $19,500 |
| Castle Creek Pharmaceuticals, LLC Class A-2 unit | 9/29/16 | $15,465 |
| Cloudera, Inc. Series F | 2/5/14 | $7,706 |
| Cloudflare, Inc. Series D 0.08% | 11/5/14 | $8,758 |
| Codiak Biosciences, Inc. Series A | 11/12/15 | $590 |
| Codiak Biosciences, Inc. Series B | 11/12/15 | $5,751 |
| Dataminr, Inc. Series D | 2/18/15 - 3/6/15 | $22,617 |
| Domo, Inc. Series D | 1/24/14 | $12,362 |
| Dropbox, Inc. | 5/2/12 | $10,000 |
| Immunocore Ltd. Series A | 7/27/15 | $12,669 |
| Intarcia Therapeutics, Inc. Series CC | 11/14/12 | $14,331 |
| Intarcia Therapeutics, Inc. Series DD | 3/17/14 | $50,000 |
| Jet.Com, Inc. Series B1 Escrow | 9/19/16 | $2,489 |
| MOD Super Fast Pizza Holdings LLC Series 3 Preferred unit | 11/3/16 | $7,719 |
| Moderna Therapeutics, Inc. Series D | 11/6/13 | $20,615 |
| Moderna Therapeutics, Inc. Series E | 12/18/14 | $24,850 |
| Moderna Therapeutics, Inc. Series F | 8/10/16 | $617 |
| MongoDB, Inc. Series F, 8.00% | 10/2/13 | $32,000 |
| Mulberry Health, Inc. Series A8 | 1/20/16 | $18,851 |
| NJOY, Inc. | 6/7/13 - 2/14/14 | $19,365 |
| RaNA Therapeutics LLC Series B | 7/17/15 | $4,761 |
| Roku, Inc. Series F, 8.00% | 5/7/13 - 5/28/13 | $16,212 |
| Roku, Inc. Series G, 8.00% | 10/1/14 | $3,574 |
| Roku, Inc. Series H | 11/9/15 | $1,260 |
| RPI International Holdings LP | 5/21/15 - 3/23/16 | $16,269 |
| Snapchat, Inc. Series F | 3/25/15 - 2/12/16 | $60,987 |
| Space Exploration Technologies Corp. Class A | 10/16/15 | $31,766 |
| Space Exploration Technologies Corp. Series G | 1/20/15 | $16,753 |
| Taboola.Com Ltd. Series E | 12/22/14 | $13,943 |
| The Honest Co., Inc. | 8/21/14 | $1,078 |
| The Honest Co., Inc. Series C | 8/21/14 | $2,515 |
| The Honest Co., Inc. Series D | 8/3/15 | $3,174 |
| Tory Burch LLC Class A unit | 5/14/15 | $67,653 |
| Tory Burch LLC Class B | 12/31/12 | $17,505 |
| Turn, Inc. Series E | 12/30/13 | $8,213 |
| Turn, Inc. 1.48% 3/2/23 | 3/2/16 | $306 |
| Uber Technologies, Inc. Series D, 8.00% | 6/6/14 | $74,000 |
| Uber Technologies, Inc. Series E, 8.00% | 12/5/14 | $6,971 |
| UNITY Biotechnology, Inc. Series B | 10/14/16 | $9,102 |
| Wheels Up Partners Holdings LLC Series B unit | 9/18/15 | $19,040 |
| YourPeople, Inc. Series C | 5/1/15 | $86,920 |
| Yumanity Holdings LLC Class A | 2/8/16 | $3,140 |
Affiliated Central Funds
Information regarding fiscal year to date income earned by the Fund from investments in Fidelity Central Funds is as follows:
| Fund | Income earned |
| | (Amounts in thousands) |
| Fidelity Cash Central Fund | $387 |
| Fidelity Securities Lending Cash Central Fund | 8,248 |
| Total | $8,635 |
Other Affiliated Issuers
An affiliated company is a company in which the Fund has ownership of at least 5% of the voting securities. Fiscal year to date transactions with companies which are or were affiliates are as follows:
| Affiliate (Amounts in thousands) | Value, beginning of period | Purchases | Sales Proceeds* | Dividend Income | Value, end of period |
| ACADIA Pharmaceuticals, Inc. | $107,666 | $45,035 | $9,227 | $-- | $108,950 |
| ACADIA Pharmaceuticals, Inc. | 111,160 | -- | -- | -- | 79,057 |
| Actua Corp. | 41,096 | 316 | 4,200 | -- | 43,200 |
| Alkermes PLC | 745,876 | 30,702 | 40,718 | -- | 564,496 |
| Alnylam Pharmaceuticals, Inc. | 512,375 | 20,379 | 24,688 | -- | 211,633 |
| Applied Micro Circuits Corp. | 46,056 | 2,819 | 5,030 | -- | 53,082 |
| Apptio, Inc. | -- | -- | -- | -- | 15,712 |
| Apptio, Inc. Class A | -- | 9,342 | 358 | -- | 8,213 |
| aTyr Pharma, Inc. | 5,110 | 28 | 182 | -- | 1,743 |
| aTyr Pharma, Inc. | 12,502 | -- | -- | -- | 4,554 |
| bluebird bio, Inc. | 205,014 | 17,452 | 11,087 | -- | 146,921 |
| Castlight Health, Inc. Class B | 10,480 | -- | 834 | -- | -- |
| Cavium, Inc. | 191,120 | 11,391 | 29,770 | -- | -- |
| Chimerix, Inc. | 105,837 | 2,702 | 1,369 | -- | 14,256 |
| Chuy's Holdings, Inc. | 45,305 | -- | 40,835 | -- | -- |
| Cree, Inc. | 184,985 | 13,676 | 92,905 | -- | -- |
| Dicerna Pharmaceuticals, Inc. | 14,490 | -- | 880 | -- | -- |
| Eleven Biotherapeutics, Inc. | 3,828 | -- | 432 | -- | -- |
| Exelixis, Inc. | 83,646 | 61,927 | 13,126 | -- | 308,449 |
| Fate Therapeutics, Inc. | 7,602 | -- | 368 | -- | -- |
| Homeinns Hotel Group ADR | 78,489 | -- | 1,627 | -- | -- |
| HubSpot, Inc. | 67,790 | 29,259 | 7,091 | -- | 100,001 |
| Infinera Corp. | 290,889 | 7,900 | 14,292 | -- | 106,776 |
| Intra-Cellular Therapies, Inc. | 128,584 | 50,651 | 5,589 | -- | 47,622 |
| Ionis Pharmaceuticals, Inc. | 509,728 | 15,932 | 26,521 | -- | 354,387 |
| Kate Spade & Co. | 155,897 | 725 | 73,788 | -- | -- |
| Lexicon Pharmaceuticals, Inc. | 81,561 | 21,165 | 7,969 | -- | 103,734 |
| lululemon athletica, Inc. | 453,130 | 30,692 | 58,783 | -- | 512,051 |
| Marketo, Inc. | 67,012 | -- | 77,045 | -- | -- |
| Merrimack Pharmaceuticals, Inc. | 75,878 | 401 | 4,211 | -- | 41,377 |
| Momenta Pharmaceuticals, Inc. | 101,247 | 1,762 | 5,424 | -- | 76,442 |
| Nutanix, Inc. Class A | -- | 29,557 | 645 | -- | 30,867 |
| Nutanix, Inc. Class B | -- | -- | -- | -- | 33,158 |
| NVIDIA Corp. | 1,195,282 | 17,321 | 538,182 | 16,902 | 2,768,858 |
| PhaseRx, Inc. | -- | 3,096 | 618 | -- | -- |
| Presbia PLC | 5,504 | 1,483 | 419 | -- | 5,184 |
| Prothena Corp. PLC | 145,362 | 11,961 | 9,600 | -- | 126,623 |
| Regulus Therapeutics, Inc. | 33,318 | 350 | 1,186 | -- | 7,632 |
| Restoration Hardware Holdings, Inc. | 185,808 | 9,247 | 6,720 | -- | 77,545 |
| Rigel Pharmaceuticals, Inc. | 16,099 | 9,760 | 1,836 | -- | 21,349 |
| Sage Therapeutics, Inc. | 78,768 | 22,178 | 6,834 | -- | 100,093 |
| Silicon Laboratories, Inc. | 184,882 | 5,791 | 15,410 | -- | 215,457 |
| Syros Pharmaceuticals, Inc. | -- | 11,698 | 573 | -- | 11,084 |
| Syros Pharmaceuticals, Inc. | -- | 2,451 | -- | -- | 12,101 |
| Transition Therapeutics, Inc. | 5,321 | -- | 131 | -- | -- |
| Wizz Air Holdings PLC | 77,780 | 10,502 | 5,993 | -- | 64,452 |
| Total | $6,372,477 | $509,651 | $1,146,496 | $16,902 | $6,377,059 |
* Includes the value of securities delivered through in-kind transactions, if applicable.
Investment Valuation
The following is a summary of the inputs used, as of November 30, 2016, involving the Fund's assets and liabilities carried at fair value. The inputs or methodology used for valuing securities may not be an indication of the risk associated with investing in those securities. For more information on valuation inputs, and their aggregation into the levels used below, please refer to the Investment Valuation section in the accompanying Notes to Financial Statements.
| | Valuation Inputs at Reporting Date: |
| Description | Total | Level 1 | Level 2 | Level 3 |
| (Amounts in thousands) | | | | |
| Investments in Securities: | | | | |
| Equities: | | | | |
| Consumer Discretionary | $7,137,178 | $6,232,614 | $777,258 | $127,306 |
| Consumer Staples | 2,189,292 | 2,164,130 | 14,304 | 10,858 |
| Energy | 928,798 | 928,798 | -- | -- |
| Financials | 856,705 | 831,362 | -- | 25,343 |
| Health Care | 6,783,054 | 6,314,952 | 65,431 | 402,671 |
| Industrials | 2,464,719 | 2,303,250 | 7,923 | 153,546 |
| Information Technology | 14,540,320 | 14,056,036 | 68,579 | 415,705 |
| Materials | 494,987 | 494,987 | -- | -- |
| Real Estate | 115,719 | 115,719 | -- | -- |
| Telecommunication Services | 235,514 | 231,654 | -- | 3,860 |
| Corporate Bonds | 306 | -- | -- | 306 |
| Money Market Funds | 464,660 | 464,660 | -- | -- |
| Total Investments in Securities: | $36,211,252 | $34,138,162 | $933,495 | $1,139,595 |
The following are reconciliations of Investments in Securities for which Level 3 inputs were used in determining value:
| (Amounts in thousands) | | | | |
| Investments in Securities: | |
| Equities - Health Care | |
| Beginning Balance | $313,457 |
| Net Realized Gain (Loss) on Investment Securities | 10,928 |
| Net Unrealized Gain (Loss) on Investment Securities | 120,425 |
| Cost of Purchases | 103,181 |
| Proceeds of Sales | (145,320) |
| Amortization/Accretion | -- |
| Transfers into Level 3 | -- |
| Transfers out of Level 3 | -- |
| Ending Balance | $402,671 |
| The change in unrealized gain (loss) for the period attributable to Level 3 securities held at November 30, 2016 | $120,426 |
| Equities - Information Technology | |
| Beginning Balance | $397,096 |
| Net Realized Gain (Loss) on Investment Securities | 28,619 |
| Net Unrealized Gain (Loss) on Investment Securities | 63,675 |
| Cost of Purchases | 50,400 |
| Proceeds of Sales | (124,085) |
| Amortization/Accretion | -- |
| Transfers into Level 3 | -- |
| Transfers out of Level 3 | -- |
| Ending Balance | $415,705 |
| The change in unrealized gain (loss) for the period attributable to Level 3 securities held at November 30, 2016 | $55,414 |
| Other Investments in Securities | |
| Beginning Balance | $312,135 |
| Net Realized Gain (Loss) on Investment Securities | 5,790 |
| Net Unrealized Gain (Loss) on Investment Securities | 24,973 |
| Cost of Purchases | 133,549 |
| Proceeds of Sales | (155,228) |
| Amortization/Accretion | -- |
| Transfers into Level 3 | -- |
| Transfers out of Level 3 | -- |
| Ending Balance | $321,219 |
| The change in unrealized gain (loss) for the period attributable to Level 3 securities held at November 30, 2016 | $13,376 |
The information used in the above reconciliations represents fiscal year to date activity for any Investments in Securities identified as using Level 3 inputs at either the beginning or the end of the current fiscal period, and proceeds of sales includes securities delivered through in-kind transactions. See Note (4) of the Notes to Financial Statements. Transfers in or out of Level 3 represent the beginning value of any Security or Instrument where a change in the pricing level occurred from the beginning to the end of the period. The cost of purchases and the proceeds of sales may include securities received or delivered through corporate actions or exchanges. Realized and unrealized gains (losses) disclosed in the reconciliations are included in Net Gain (Loss) on the Fund's Statement of Operations.
See accompanying notes which are an integral part of the financial statements.
Financial Statements
Statement of Assets and Liabilities
| Amounts in thousands (except per-share amounts) | | November 30, 2016 |
| Assets | | |
Investment in securities, at value (including securities loaned of $383,378) — See accompanying schedule:
Unaffiliated issuers (cost $16,914,451) | $29,670,418 | |
| Fidelity Central Funds (cost $464,586) | 464,660 | |
| Other affiliated issuers (cost $3,100,677) | 6,076,174 | |
| Total Investments (cost $20,479,714) | | $36,211,252 |
| Restricted cash | | 250 |
| Receivable for investments sold | | 96,501 |
| Receivable for fund shares sold | | 22,572 |
| Dividends receivable | | 31,578 |
| Interest receivable | | 3 |
| Distributions receivable from Fidelity Central Funds | | 484 |
| Prepaid expenses | | 86 |
| Other receivables | | 1,754 |
| Total assets | | 36,364,480 |
| Liabilities | | |
| Payable to custodian bank | $286 | |
| Payable for investments purchased | 43,258 | |
| Payable for fund shares redeemed | 41,698 | |
| Accrued management fee | 19,029 | |
| Other affiliated payables | 3,493 | |
| Other payables and accrued expenses | 2,023 | |
| Collateral on securities loaned, at value | 401,707 | |
| Total liabilities | | 511,494 |
| Net Assets | | $35,852,986 |
| Net Assets consist of: | | |
| Paid in capital | | $18,116,189 |
| Undistributed net investment income | | 35,263 |
| Accumulated undistributed net realized gain (loss) on investments and foreign currency transactions | | 1,970,037 |
| Net unrealized appreciation (depreciation) on investments and assets and liabilities in foreign currencies | | 15,731,497 |
| Net Assets | | $35,852,986 |
| Growth Company: | | |
| Net Asset Value, offering price and redemption price per share ($21,113,864 ÷ 147,893 shares) | | $142.76 |
| Class K: | | |
| Net Asset Value, offering price and redemption price per share ($14,739,122 ÷ 103,258 shares) | | $142.74 |
See accompanying notes which are an integral part of the financial statements.
Statement of Operations
| Amounts in thousands | | Year ended November 30, 2016 |
| Investment Income | | |
| Dividends (including $16,902 earned from other affiliated issuers) | | $302,739 |
| Interest | | 3 |
| Income from Fidelity Central Funds | | 8,635 |
| Total income | | 311,377 |
| Expenses | | |
| Management fee | | |
| Basic fee | $204,424 | |
| Performance adjustment | 21,329 | |
| Transfer agent fees | 40,712 | |
| Accounting and security lending fees | 2,305 | |
| Custodian fees and expenses | 639 | |
| Independent trustees' fees and expenses | 164 | |
| Registration fees | 221 | |
| Audit | 260 | |
| Legal | 75 | |
| Interest | 1 | |
| Miscellaneous | 317 | |
| Total expenses before reductions | 270,447 | |
| Expense reductions | (667) | 269,780 |
| Net investment income (loss) | | 41,597 |
| Realized and Unrealized Gain (Loss) | | |
| Net realized gain (loss) on: | | |
| Investment securities: | | |
| Unaffiliated issuers | 3,976,805 | |
| Fidelity Central Funds | 21 | |
| Other affiliated issuers | 434,753 | |
| Foreign currency transactions | (56) | |
| Total net realized gain (loss) | | 4,411,523 |
Change in net unrealized appreciation (depreciation) on:
Investment securities | (3,344,116) | |
| Assets and liabilities in foreign currencies | 14 | |
| Total change in net unrealized appreciation (depreciation) | | (3,344,102) |
| Net gain (loss) | | 1,067,421 |
| Net increase (decrease) in net assets resulting from operations | | $1,109,018 |
See accompanying notes which are an integral part of the financial statements.
Statement of Changes in Net Assets
| Amounts in thousands | Year ended November 30, 2016 | Year ended November 30, 2015 |
| Increase (Decrease) in Net Assets | | |
| Operations | | |
| Net investment income (loss) | $41,597 | $13,855 |
| Net realized gain (loss) | 4,411,523 | 4,437,105 |
| Change in net unrealized appreciation (depreciation) | (3,344,102) | (841,705) |
| Net increase (decrease) in net assets resulting from operations | 1,109,018 | 3,609,255 |
| Distributions to shareholders from net investment income | (13,792) | (57,135) |
| Distributions to shareholders from net realized gain | (1,582,394) | (1,421,834) |
| Total distributions | (1,596,186) | (1,478,969) |
| Share transactions - net increase (decrease) | (4,759,956) | (3,437,067) |
| Total increase (decrease) in net assets | (5,247,124) | (1,306,781) |
| Net Assets | | |
| Beginning of period | 41,100,110 | 42,406,891 |
| End of period | $35,852,986 | $41,100,110 |
| Other Information | | |
| Undistributed net investment income end of period | $35,263 | $12,121 |
See accompanying notes which are an integral part of the financial statements.
Financial Highlights — Fidelity Growth Company Fund
| Years ended November 30, | 2016 | 2015 | 2014 | 2013 | 2012 |
| Selected Per–Share Data | | | | | |
| Net asset value, beginning of period | $143.47 | $136.46 | $124.69 | $95.80 | $85.29 |
| Income from Investment Operations | | | | | |
| Net investment income (loss)A | .09 | (.01) | .15 | .29 | .15 |
| Net realized and unrealized gain (loss) | 4.71 | 11.72 | 20.49 | 31.23 | 13.12 |
| Total from investment operations | 4.80 | 11.71 | 20.64 | 31.52 | 13.27 |
| Distributions from net investment income | – | (.13) | (.21) | (.19) | (.05) |
| Distributions from net realized gain | (5.51) | (4.57) | (8.67) | (2.44) | (2.71) |
| Total distributions | (5.51) | (4.70) | (8.87)B | (2.63) | (2.76) |
| Net asset value, end of period | $142.76 | $143.47 | $136.46 | $124.69 | $95.80 |
| Total ReturnC | 3.48% | 8.90% | 17.80% | 33.85% | 16.24% |
| Ratios to Average Net AssetsD,E | | | | | |
| Expenses before reductions | .77% | .88% | .82% | .83% | .90% |
| Expenses net of fee waivers, if any | .77% | .87% | .82% | .83% | .90% |
| Expenses net of all reductions | .77% | .87% | .82% | .83% | .90% |
| Net investment income (loss) | .07% | (.01)% | .12% | .27% | .16% |
| Supplemental Data | | | | | |
| Net assets, end of period (in millions) | $21,114 | $23,513 | $24,165 | $22,936 | $22,952 |
| Portfolio turnover rateF | 19%G | 18%G | 12%G | 26% | 33% |
A Calculated based on average shares outstanding during the period.
B Total distributions of $8.87 per share is comprised of distributions from net investment income of $.207 and distributions from net realized gain of $8.666 per share.
C Total returns would have been lower if certain expenses had not been reduced during the applicable periods shown.
D Fees and expenses of any underlying Fidelity Central Funds are not included in the Fund's expense ratio. The Fund indirectly bears its proportionate share of the expenses of any underlying Fidelity Central Funds.
E Expense ratios reflect operating expenses of the class. Expenses before reductions do not reflect amounts reimbursed by the investment adviser or reductions from brokerage service arrangements or reductions from other expense offset arrangements and do not represent the amount paid by the class during periods when reimbursements or reductions occur. Expenses net of fee waivers reflect expenses after reimbursement by the investment adviser but prior to reductions from brokerage service arrangements or other expense offset arrangements. Expenses net of all reductions represent the net expenses paid by the class.
F Amount does not include the portfolio activity of any underlying Fidelity Central Funds.
G Portfolio turnover rate excludes securities received or delivered in-kind.
See accompanying notes which are an integral part of the financial statements.
Financial Highlights — Fidelity Growth Company Fund Class K
| Years ended November 30, | 2016 | 2015 | 2014 | 2013 | 2012 |
| Selected Per–Share Data | | | | | |
| Net asset value, beginning of period | $143.42 | $136.41 | $124.68 | $95.82 | $85.35 |
| Income from Investment Operations | | | | | |
| Net investment income (loss)A | .23 | .12 | .29 | .42 | .27 |
| Net realized and unrealized gain (loss) | 4.71 | 11.72 | 20.48 | 31.21 | 13.10 |
| Total from investment operations | 4.94 | 11.84 | 20.77 | 31.63 | 13.37 |
| Distributions from net investment income | (.11) | (.26) | (.37) | (.34) | (.19) |
| Distributions from net realized gain | (5.51) | (4.57) | (8.67) | (2.44) | (2.71) |
| Total distributions | (5.62) | (4.83) | (9.04) | (2.77)B | (2.90) |
| Net asset value, end of period | $142.74 | $143.42 | $136.41 | $124.68 | $95.82 |
| Total ReturnC | 3.59% | 9.01% | 17.93% | 34.02% | 16.38% |
| Ratios to Average Net AssetsD,E | | | | | |
| Expenses before reductions | .66% | .77% | .71% | .71% | .77% |
| Expenses net of fee waivers, if any | .66% | .77% | .71% | .71% | .77% |
| Expenses net of all reductions | .66% | .77% | .71% | .71% | .77% |
| Net investment income (loss) | .17% | .09% | .24% | .39% | .29% |
| Supplemental Data | | | | | |
| Net assets, end of period (in millions) | $14,739 | $17,587 | $18,242 | $21,951 | $15,454 |
| Portfolio turnover rateF | 19%G | 18%G | 12%G | 26% | 33% |
A Calculated based on average shares outstanding during the period.
B Total distributions of $2.77 per share is comprised of distributions from net investment income of $.336 and distributions from net realized gain of $2.438 per share.
C Total returns would have been lower if certain expenses had not been reduced during the applicable periods shown.
D Fees and expenses of any underlying Fidelity Central Funds are not included in the Fund's expense ratio. The Fund indirectly bears its proportionate share of the expenses of any underlying Fidelity Central Funds.
E Expense ratios reflect operating expenses of the class. Expenses before reductions do not reflect amounts reimbursed by the investment adviser or reductions from brokerage service arrangements or reductions from other expense offset arrangements and do not represent the amount paid by the class during periods when reimbursements or reductions occur. Expenses net of fee waivers reflect expenses after reimbursement by the investment adviser but prior to reductions from brokerage service arrangements or other expense offset arrangements. Expenses net of all reductions represent the net expenses paid by the class.
F Amount does not include the portfolio activity of any underlying Fidelity Central Funds.
G Portfolio turnover rate excludes securities received or delivered in-kind.
See accompanying notes which are an integral part of the financial statements.
Notes to Financial Statements
For the period ended November 30, 2016
(Amounts in thousands except percentages)
1. Organization.
Fidelity Growth Company Fund (the Fund) is a fund of Fidelity Mt. Vernon Street Trust (the Trust) and is authorized to issue an unlimited number of shares. The Trust is registered under the Investment Company Act of 1940, as amended (the 1940 Act), as an open-end management investment company organized as a Massachusetts business trust. The Fund offers Growth Company and Class K shares, each of which has equal rights as to assets and voting privileges. Each class has exclusive voting rights with respect to matters that affect that class.
2. Investments in Fidelity Central Funds.
The Fund invests in Fidelity Central Funds, which are open-end investment companies generally available only to other investment companies and accounts managed by the investment adviser and its affiliates. The Fund's Schedule of Investments lists each of the Fidelity Central Funds held as of period end, if any, as an investment of the Fund, but does not include the underlying holdings of each Fidelity Central Fund. As an Investing Fund, the Fund indirectly bears its proportionate share of the expenses of the underlying Fidelity Central Funds.
The Money Market Central Funds seek preservation of capital and current income and are managed by Fidelity Investments Money Management, Inc. (FIMM), an affiliate of the investment adviser. Annualized expenses of the Money Market Central Funds as of their most recent shareholder report date are less than .005%.
A complete unaudited list of holdings for each Fidelity Central Fund is available upon request or at the Securities and Exchange Commission (the SEC) website at www.sec.gov. In addition, the financial statements of the Fidelity Central Funds, which are not covered by the Fund's Report of Independent Registered Public Accounting Firm, are available on the SEC website or upon request.
3. Significant Accounting Policies.
The financial statements have been prepared in conformity with accounting principles generally accepted in the United States of America (GAAP), which require management to make certain estimates and assumptions at the date of the financial statements. Actual results could differ from those estimates. Subsequent events, if any, through the date that the financial statements were issued have been evaluated in the preparation of the financial statements. The following summarizes the significant accounting policies of the Fund:
Investment Valuation. Investments are valued as of 4:00 p.m. Eastern time on the last calendar day of the period. The Board of Trustees (the Board) has delegated the day to day responsibility for the valuation of the Fund's investments to the Fair Value Committee (the Committee) established by the Fund's investment adviser. In accordance with valuation policies and procedures approved by the Board, the Fund attempts to obtain prices from one or more third party pricing vendors or brokers to value its investments. When current market prices, quotations or currency exchange rates are not readily available or reliable, investments will be fair valued in good faith by the Committee, in accordance with procedures adopted by the Board. Factors used in determining fair value vary by investment type and may include market or investment specific events, changes in interest rates and credit quality. The frequency with which these procedures are used cannot be predicted and they may be utilized to a significant extent. The Committee oversees the Fund's valuation policies and procedures and reports to the Board on the Committee's activities and fair value determinations. The Board monitors the appropriateness of the procedures used in valuing the Fund's investments and ratifies the fair value determinations of the Committee.
The Fund categorizes the inputs to valuation techniques used to value its investments into a disclosure hierarchy consisting of three levels as shown below:
- Level 1 – quoted prices in active markets for identical investments
- Level 2 – other significant observable inputs (including quoted prices for similar investments, interest rates, prepayment speeds, etc.)
- Level 3 – unobservable inputs (including the Fund's own assumptions based on the best information available)
Valuation techniques used to value the Fund's investments by major category are as follows:
Equity securities, including restricted securities, for which market quotations are readily available, are valued at the last reported sale price or official closing price as reported by a third party pricing vendor on the primary market or exchange on which they are traded and are categorized as Level 1 in the hierarchy. In the event there were no sales during the day or closing prices are not available, securities are valued at the last quoted bid price or may be valued using the last available price and are generally categorized as Level 2 in the hierarchy. For foreign equity securities, when market or security specific events arise, comparisons to the valuation of American Depositary Receipts (ADRs), futures contracts, Exchange-Traded Funds (ETFs) and certain indexes as well as quoted prices for similar securities may be used and would be categorized as Level 2 in the hierarchy. Utilizing these techniques may result in transfers between Level 1 and Level 2. For equity securities, including restricted securities, where observable inputs are limited, assumptions about market activity and risk are used and these securities may be categorized as Level 3 in the hierarchy. Equity securities, including restricted securities, for which observable inputs are not available are valued using alternate valuation approaches, including the market approach and the income approach and are categorized as Level 3 in the hierarchy. The market approach generally consists of using comparable market transactions while the income approach generally consists of using the net present value of estimated future cash flows, adjusted as appropriate for liquidity, credit, market and/or other risk factors.
Debt securities, including restricted securities, are valued based on evaluated prices received from third party pricing vendors or from brokers who make markets in such securities. Corporate bonds are valued by pricing vendors who utilize matrix pricing which considers yield or price of bonds of comparable quality, coupon, maturity and type or by broker-supplied prices. When independent prices are unavailable or unreliable, debt securities may be valued utilizing pricing methodologies which consider similar factors that would be used by third party pricing vendors. Debt securities are generally categorized as Level 2 in the hierarchy but may be Level 3 depending on the circumstances.
Investments in open-end mutual funds, including the Fidelity Central Funds, are valued at their closing net asset value (NAV) each business day and are categorized as Level 1 in the hierarchy.
The following provides information on Level 3 securities held by the Fund that were valued at period end based on unobservable inputs. These amounts exclude valuations provided by a broker.
| Asset Type | Fair Value at 11/30/16 | Valuation Technique(s) | Unobservable Input | Amount or Range/Weighted Average | Impact to Valuation from an Increase in Input(a) |
| Corporate Bonds | $ 306 | Market approach | Transaction Price | $100.00
| Increase
|
| Equities | 1,139,289 | Discounted cash flow | Discount rate | 8.0% - 22.1% / 18.1
| Decrease |
| | | | Weighted average cost of capital (WACC) | 11.5% | Decrease |
| | | | Discount for lack of marketability | 10.0% - 25.0% / 23.7% | Decrease |
| | | | Growth rate | 2.0% - 2.5% / 2.1% | Increase |
| | | Market approach | Discount rate | 3.0% - 50.0% / 13.7% | Decrease
|
| | | | Transaction price | $1.08 - $330.00 / $51.61 | Increase
|
| | | | Tender price | $24.04 | Increase
|
| | | | Discount for lack of marketability | 10.0% - 20.0% / 15.5% | Decrease |
| | | | Liquidity preference
| $6.75 - $68.25 / $59.82 | Increase
|
| | | | Premium rate
| 6.0% - 169.0% / 46.1% | Increase
|
| | | | Proxy discount
| 12.0% - 36.1% / 19.6% | Decrease
|
| | | | Proxy premium | 21.5% | Increase |
| | | Market comparable | Price/Earnings multiple (P/E)
| 10.5 | Increase |
| | | | Enterprise value/EBITDA multiple
| 9.3
| Increase
|
| | | | Enterprise value/Sales multiple (EV/S) | 0.6 - 15.3 / 4.9 | Increase
|
| | | | Enterprise value/Gross profit multiple (EV/GP) | 5.1 | Increase
|
| | | Recovery value | Recovery value | 0.0% - 0.3% / 0.3% | Increase |
(a) Represents the expected directional change in the fair value of the Level 3 investments that would result from an increase in the corresponding input. A decrease to the unobservable input would have the opposite effect. Significant changes in these inputs could result in significantly higher or lower fair value measurements.
Changes in valuation techniques may result in transfers in or out of an assigned level within the disclosure hierarchy. The aggregate value of investments by input level as of November 30, 2016, as well as a roll forward of Level 3 investments, is included at the end of the Fund's Schedule of Investments.
Foreign Currency. The Fund may use foreign currency contracts to facilitate transactions in foreign-denominated securities. Gains and losses from these transactions may arise from changes in the value of the foreign currency or if the counterparties do not perform under the contracts' terms.
Foreign-denominated assets, including investment securities, and liabilities are translated into U.S. dollars at the exchange rates at period end. Purchases and sales of investment securities, income and dividends received and expenses denominated in foreign currencies are translated into U.S. dollars at the exchange rate in effect on the transaction date.
The effects of exchange rate fluctuations on investments are included with the net realized and unrealized gain (loss) on investment securities. Other foreign currency transactions resulting in realized and unrealized gain (loss) are disclosed separately.
Investment Transactions and Income. For financial reporting purposes, the Fund's investment holdings and NAV include trades executed through the end of the last business day of the period. The NAV per share for processing shareholder transactions is calculated as of the close of business of the New York Stock Exchange (NYSE), normally 4:00 p.m. Eastern time and includes trades executed through the end of the prior business day. Gains and losses on securities sold are determined on the basis of identified cost and may include proceeds received from litigation. Dividend income is recorded on the ex-dividend date, except for certain dividends from foreign securities where the ex-dividend date may have passed, which are recorded as soon as the Fund is informed of the ex-dividend date. Non-cash dividends included in dividend income, if any, are recorded at the fair market value of the securities received. Income and capital gain distributions from Fidelity Central Funds, if any, are recorded on the ex-dividend date. Certain distributions received by the Fund represent a return of capital or capital gain. The Fund determines the components of these distributions subsequent to the ex-dividend date, based upon receipt of tax filings or other correspondence relating to the underlying investment. These distributions are recorded as a reduction of cost of investments and/or as a realized gain. Interest income is accrued as earned and includes coupon interest and amortization of premium and accretion of discount on debt securities as applicable. Investment income is recorded net of foreign taxes withheld where recovery of such taxes is uncertain.
Class Allocations and Expenses. Investment income, realized and unrealized capital gains and losses, common expenses of the Fund, and certain fund-level expense reductions, if any, are allocated daily on a pro-rata basis to each class based on the relative net assets of each class to the total net assets of the Fund. Each class differs with respect to transfer agent fees incurred. Certain expense reductions may also differ by class. For the reporting period, the allocated portion of income and expenses to each class as a percent of its average net assets may vary due to the timing of recording these transactions in relation to fluctuating net assets of the classes. Expenses directly attributable to a fund are charged to that fund. Expenses attributable to more than one fund are allocated among the respective funds on the basis of relative net assets or other appropriate methods. Expense estimates are accrued in the period to which they relate and adjustments are made when actual amounts are known.
Deferred Trustee Compensation. Under a Deferred Compensation Plan (the Plan), independent Trustees may elect to defer receipt of a portion of their annual compensation. Deferred amounts are invested in a cross-section of Fidelity funds, are marked-to-market and remain in the Fund until distributed in accordance with the Plan. The investment of deferred amounts and the offsetting payable to the Trustees are included in the accompanying Statement of Assets and Liabilities.
Income Tax Information and Distributions to Shareholders. Each year, the Fund intends to qualify as a regulated investment company under Subchapter M of the Internal Revenue Code, including distributing substantially all of its taxable income and realized gains. As a result, no provision for U.S. Federal income taxes is required. As of November 30, 2016, the Fund did not have any unrecognized tax benefits in the financial statements; nor is the Fund aware of any tax positions for which it is reasonably possible that the total amounts of unrecognized tax benefits will significantly change in the next twelve months. The Fund files a U.S. federal tax return, in addition to state and local tax returns as required. The Fund's federal income tax returns are subject to examination by the Internal Revenue Service (IRS) for a period of three fiscal years after they are filed. State and local tax returns may be subject to examination for an additional fiscal year depending on the jurisdiction. Foreign taxes are provided for based on the Fund's understanding of the tax rules and rates that exist in the foreign markets in which it invests.
Distributions are declared and recorded on the ex-dividend date. Income dividends and capital gain distributions are declared separately for each class. Income and capital gain distributions are determined in accordance with income tax regulations, which may differ from GAAP. In addition, the Fund claimed a portion of the payment made to redeeming shareholders as a distribution for income tax purposes.
Capital accounts within the financial statements are adjusted for permanent book-tax differences. These adjustments have no impact on net assets or the results of operations. Capital accounts are not adjusted for temporary book-tax differences which will reverse in a subsequent period.
Book-tax differences are primarily due to foreign currency transactions, passive foreign investment companies (PFIC), redemptions in kind, partnerships, deferred trustees compensation and losses deferred due to wash sales.
The federal tax cost of investment securities and unrealized appreciation (depreciation) as of period end were as follows:
| Gross unrealized appreciation | $17,351,013 |
| Gross unrealized depreciation | (1,661,098) |
| Net unrealized appreciation (depreciation) on securities | $15,689,915 |
| Tax Cost | $20,521,337 |
The tax-based components of distributable earnings as of period end were as follows:
| Undistributed ordinary income | $36,945 |
| Undistributed long-term capital gain | $2,011,660 |
| Net unrealized appreciation (depreciation) on securities and other investments | $15,689,874 |
The tax character of distributions paid was as follows:
| | November 30, 2016 | November 30, 2015 |
| Ordinary Income | $13,792 | $ 57,135 |
| Long-term Capital Gains | 1,582,394 | 1,421,834 |
| Total | $1,596,186 | $ 1,478,969 |
Restricted Securities. The Fund may invest in securities that are subject to legal or contractual restrictions on resale. These securities generally may be resold in transactions exempt from registration or to the public if the securities are registered. Disposal of these securities may involve time-consuming negotiations and expense, and prompt sale at an acceptable price may be difficult. Information regarding restricted securities is included at the end of the Fund's Schedule of Investments.
Consolidated Subsidiary. The Fund invests in certain investments through a wholly-owned subsidiary ("Subsidiary"), which may be subject to federal and state taxes upon disposition.
As of period end, the Fund held an investment of $189,550 in these Subsidiaries, representing .53% of the Fund's net assets. The financial statements have been consolidated and include accounts of the Fund and each Subsidiary. Accordingly, all inter-company transactions and balances have been eliminated.
Any cash held by the Subsidiaries is restricted as to its use and is presented as Restricted cash in the Statement of Assets and Liabilities.
4. Purchases and Sales of Investments.
Purchases and sales of securities, other than short-term securities and in-kind transactions, aggregated $7,024,112 and $9,140,669, respectively.
Redemptions In-Kind. During the period, 26,809 shares of the Fund held by unaffiliated entities were redeemed in-kind for cash and investments with a value of $3,667,395. The net realized gain of $2,216,038 on investments delivered through the in-kind redemption is included in the accompanying Statement of Operations. The amount of in-kind redemptions is included in share transactions in the accompanying Statement of Changes in Net Assets as well as Note 10: Share Transactions. The Fund recognized no gain or loss for federal income tax purposes.
Prior Fiscal Year Redemptions In-Kind. During the prior period, 31,588 shares of the Fund held by unaffiliated entities were redeemed in-kind for investments and cash with a value of $4,379,418. They had a net realized gain of $2,610,732 on investments delivered through the in-kind redemptions. The amount of in-kind redemptions is included in share transactions in the share transactions in the accompanying Statement of Changes in Net Assets as well as Note 10: Share Transactions. The Fund recognized no gain or loss for federal income tax purposes.
5. Fees and Other Transactions with Affiliates.
Management Fee. Fidelity Management & Research Company (the investment adviser) and its affiliates provide the Fund with investment management related services for which the Fund pays a monthly management fee. The management fee is the sum of an individual fund fee rate that is based on an annual rate of .30% of the Fund's average net assets and an annualized group fee rate that averaged .25% during the period. The group fee rate is based upon the average net assets of all the mutual funds advised by the investment adviser, including any mutual funds previously advised by the investment adviser that are currently advised by Fidelity SelectCo, LLC, an affiliate of the investment adviser. The group fee rate decreases as assets under management increase and increases as assets under management decrease. In addition, the management fee is subject to a performance adjustment (up to a maximum of +/- .20% of the Fund's average net assets over a 36 month performance period). The upward or downward adjustment to the management fee is based on the relative investment performance of Growth Company as compared to its benchmark index, the Russell 3000 Growth Index, over the same 36 month performance period. For the reporting period, the total annual management fee rate, including the performance adjustment, was .61% of the Fund's average net assets. The performance adjustment included in the management fee rate may be higher or lower than the maximum performance adjustment rate due to the difference between the average net assets for the reporting and performance periods.
Transfer Agent Fees. Fidelity Investments Institutional Operations Company, Inc., (FIIOC), an affiliate of the investment adviser, is the transfer, dividend disbursing and shareholder servicing agent for each class of the Fund. FIIOC receives account fees and asset-based fees that vary according to the account size and type of account of the shareholders of Growth Company. FIIOC receives an asset-based fee of Class K's average net assets. FIIOC pays for typesetting, printing and mailing of shareholder reports, except proxy statements.
For the period, transfer agent fees for each class were as follows:
| | Amount | % of
Class-Level Average
Net Assets |
| Growth Company | $33,401 | .15 |
| Class K | 7,311 | .05 |
| | $40,712 | |
Accounting and Security Lending Fees. Fidelity Service Company, Inc. (FSC), an affiliate of the investment adviser, maintains the Fund's accounting records. The accounting fee is based on the level of average net assets for each month. Under a separate contract, FSC administers the security lending program. The security lending fee is based on the number and duration of lending transactions.
Brokerage Commissions. The Fund placed a portion of its portfolio transactions with brokerage firms which are affiliates of the investment adviser. Brokerage commissions are included in net realized gain (loss) and change in net unrealized appreciation (depreciation) in the Statement of Operations. The commissions paid to these affiliated firms were $236 for the period.
Interfund Lending Program. Pursuant to an Exemptive Order issued by the SEC, the Fund, along with other registered investment companies having management contracts with Fidelity Management & Research Company (FMR) or other affiliated entities of FMR, may participate in an interfund lending program. This program provides an alternative credit facility allowing the funds to borrow from, or lend money to, other participating affiliated funds. At period end, there were no interfund loans outstanding. The Fund's activity in this program during the period for which loans were outstanding was as follows:
| Borrower or Lender | Average Loan Balance | Weighted Average Interest Rate | Interest Expense |
| Borrower | $19,086 | .59% | $1 |
Interfund Trades. The Fund may purchase from or sell securities to other Fidelity Funds under procedures adopted by the Board. The procedures have been designed to ensure these interfund trades are executed in accordance with Rule 17a-7 of the 1940 Act. Interfund trades are included within the respective purchases and sales amounts shown in the Purchases and Sales of Investments note.
Other. During the period, the investment adviser reimbursed the Fund for certain losses in the amount of $500.
6. Committed Line of Credit.
The Fund participates with other funds managed by the investment adviser or an affiliate in a $4.25 billion credit facility (the "line of credit") to be utilized for temporary or emergency purposes to fund shareholder redemptions or for other short-term liquidity purposes. The Fund has agreed to pay commitment fees on its pro-rata portion of the line of credit, which amounted to $96 and is reflected in Miscellaneous expenses on the Statement of Operations. During the period, the Fund did not borrow on this line of credit.
7. Security Lending.
The Fund lends portfolio securities through a lending agent from time to time in order to earn additional income. For equity securities, a lending agent is used and may loan securities to certain qualified borrowers, including Fidelity Capital Markets (FCM), a broker-dealer affiliated with the Fund. On the settlement date of the loan, the Fund receives collateral (in the form of U.S. Treasury obligations, letters of credit and/or cash) against the loaned securities and maintains collateral in an amount not less than 100% of the market value of the loaned securities during the period of the loan. The market value of the loaned securities is determined at the close of business of the Fund and any additional required collateral is delivered to the Fund on the next business day. The Fund or borrower may terminate the loan at any time, and if the borrower defaults on its obligation to return the securities loaned because of insolvency or other reasons, the Fund may apply collateral received from the borrower against the obligation. The Fund may experience delays and costs in recovering the securities loaned. Any cash collateral received is invested in the Fidelity Securities Lending Cash Central Fund. The value of loaned securities and cash collateral at period end are disclosed on the Fund's Statement of Assets and Liabilities. The value of securities loaned to FCM at period end was $23,623. Security lending income represents the income earned on investing cash collateral, less rebates paid to borrowers and any lending agent fees associated with the loan, plus any premium payments received for lending certain types of securities. Security lending income is presented in the Statement of Operations as a component of income from Fidelity Central Funds. Total security lending income during the period amounted to $8,248, including $571 from securities loaned to FCM.
8. Expense Reductions.
Commissions paid to certain brokers with whom the investment adviser, or its affiliates, places trades on behalf of the Fund include an amount in addition to trade execution, which may be rebated back to the Fund to offset certain expenses. This amount totaled $370 for the period. In addition, through arrangements with the Fund's custodian, credits realized as a result of certain uninvested cash balances were used to reduce the Fund's expenses. During the period, these credits reduced the Fund's custody expenses by $4.
In addition, during the period the investment adviser reimbursed and/or waived a portion of fund-level operating expenses in the amount of $293.
9. Distributions to Shareholders.
Distributions to shareholders of each class were as follows:
| | Year ended
November 30, 2016 | Year ended November 30, 2015 |
| From net investment income | | |
| Growth Company | $– | $22,481 |
| Class K | 13,792 | 34,654 |
| Total | $13,792 | $57,135 |
| From net realized gain | | |
| Growth Company | $904,788 | $808,358 |
| Class K | 677,606 | 613,476 |
| Total | $1,582,394 | $1,421,834 |
10. Share Transactions.
Share transactions for each class were as follows and may contain automatic conversions between classes or exchanges between affiliated funds:
| | Shares | Shares | Dollars | Dollars |
| | Year
ended
November 30,
2016 | Year
ended
November 30,
2015 | Year
ended
November 30,
2016 | Year
ended
November 30,
2015 |
| Growth Company | | | | |
| Shares sold | 17,124 | 20,925 | $2,254,562 | $2,877,874 |
Reinvestment of
distributions | 6,196 | 6,056 | 857,904 | 796,034 |
| Shares redeemed | (39,316)(a) | (40,175)(b) | (5,283,210)(a) | (5,503,138)(b) |
| Net increase (decrease) | (15,996) | (13,194) | $(2,170,744) | $(1,829,230) |
| Class K | | | | |
| Shares sold | 18,989 | 41,669 | $2,493,477 | $5,709,393 |
Reinvestment of
distributions | 5,003 | 4,938 | 691,398 | 648,130 |
| Shares redeemed | (43,361)(a) | (57,706)(b) | (5,774,087)(a) | (7,965,360)(b) |
| Net increase (decrease) | (19,369) | (11,099) | $(2,589,212) | $(1,607,837) |
(a) Amount includes in-kind redemptions (see Note 4: Redemptions In-Kind)
(b) Amount includes in-kind redemptions.(see Note 4: Prior Fiscal Year Redemptions In-Kind)
11. Other.
The Fund's organizational documents provide former and current trustees and officers with a limited indemnification against liabilities arising in connection with the performance of their duties to the Fund. In the normal course of business, the Fund may also enter into contracts that provide general indemnifications. The Fund's maximum exposure under these arrangements is unknown as this would be dependent on future claims that may be made against the Fund. The risk of material loss from such claims is considered remote.
Report of Independent Registered Public Accounting Firm
To the Trustees of Fidelity Mt. Vernon Street Trust and Shareholders of Fidelity Growth Company Fund:
We have audited the accompanying statement of assets and liabilities of Fidelity Growth Company Fund (the Fund), a fund of Fidelity Mt. Vernon Street Trust, including the schedule of investments, as of November 30, 2016, and the related statement of operations for the year then ended, the statement of changes in net assets for each of the two years in the period then ended, and the financial highlights for each of the five years in the period then ended. These financial statements and financial highlights are the responsibility of the Fund's management. Our responsibility is to express an opinion on these financial statements and financial highlights based on our audits.
We conducted our audits in accordance with the standards of the Public Company Accounting Oversight Board (United States). Those standards require that we plan and perform the audit to obtain reasonable assurance about whether the financial statements and financial highlights are free of material misstatement. The Fund is not required to have, nor were we engaged to perform, an audit of its internal control over financial reporting. Our audits included consideration of internal control over financial reporting as a basis for designing audit procedures that are appropriate in the circumstances, but not for the purpose of expressing an opinion on the effectiveness of the Fund's internal control over financial reporting. Accordingly, we express no such opinion. An audit also includes examining, on a test basis, evidence supporting the amounts and disclosures in the financial statements, assessing the accounting principles used and significant estimates made by management, as well as evaluating the overall financial statement presentation. Our procedures included confirmation of securities owned as of November 30, 2016, by correspondence with the custodians and brokers; when replies were not received from brokers, we performed other auditing procedures. We believe that our audits provide a reasonable basis for our opinion.
In our opinion, such financial statements and financial highlights referred to above present fairly, in all material respects, the financial position of Fidelity Growth Company Fund as of November 30, 2016, the results of its operations for the year then ended, the changes in its net assets for each of the two years in the period then ended, and the financial highlights for each of the five years in the period then ended, in conformity with accounting principles generally accepted in the United States of America.
DELOITTE & TOUCHE LLP
Boston, Massachusetts
January 23, 2017
Trustees and Officers
The Trustees, Members of the Advisory Board (if any), and officers of the trust and fund, as applicable, are listed below. The Board of Trustees governs the fund and is responsible for protecting the interests of shareholders. The Trustees are experienced executives who meet periodically throughout the year to oversee the fund's activities, review contractual arrangements with companies that provide services to the fund, oversee management of the risks associated with such activities and contractual arrangements, and review the fund's performance. Each of the Trustees oversees 170 funds.
The Trustees hold office without limit in time except that (a) any Trustee may resign; (b) any Trustee may be removed by written instrument, signed by at least two-thirds of the number of Trustees prior to such removal; (c) any Trustee who requests to be retired or who has become incapacitated by illness or injury may be retired by written instrument signed by a majority of the other Trustees; and (d) any Trustee may be removed at any special meeting of shareholders by a two-thirds vote of the outstanding voting securities of the trust. Each Trustee who is not an interested person (as defined in the 1940 Act) of the trust and the fund is referred to herein as an Independent Trustee. Each Independent Trustee shall retire not later than the last day of the calendar year in which his or her 75th birthday occurs. The Independent Trustees may waive this mandatory retirement age policy with respect to individual Trustees. Officers and Advisory Board Members hold office without limit in time, except that any officer or Advisory Board Member may resign or may be removed by a vote of a majority of the Trustees at any regular meeting or any special meeting of the Trustees. Except as indicated, each individual has held the office shown or other offices in the same company for the past five years.
The fund’s Statement of Additional Information (SAI) includes more information about the Trustees. To request a free copy, call Fidelity at 1-800-544-8544.
Experience, Skills, Attributes, and Qualifications of the Trustees. The Governance and Nominating Committee has adopted a statement of policy that describes the experience, qualifications, attributes, and skills that are necessary and desirable for potential Independent Trustee candidates (Statement of Policy). The Board believes that each Trustee satisfied at the time he or she was initially elected or appointed a Trustee, and continues to satisfy, the standards contemplated by the Statement of Policy. The Governance and Nominating Committee also engages professional search firms to help identify potential Independent Trustee candidates who have the experience, qualifications, attributes, and skills consistent with the Statement of Policy. From time to time, additional criteria based on the composition and skills of the current Independent Trustees, as well as experience or skills that may be appropriate in light of future changes to board composition, business conditions, and regulatory or other developments, have also been considered by the professional search firms and the Governance and Nominating Committee. In addition, the Board takes into account the Trustees' commitment and participation in Board and committee meetings, as well as their leadership of standing and ad hoc committees throughout their tenure.
In determining that a particular Trustee was and continues to be qualified to serve as a Trustee, the Board has considered a variety of criteria, none of which, in isolation, was controlling. The Board believes that, collectively, the Trustees have balanced and diverse experience, qualifications, attributes, and skills, which allow the Board to operate effectively in governing the fund and protecting the interests of shareholders. Information about the specific experience, skills, attributes, and qualifications of each Trustee, which in each case led to the Board's conclusion that the Trustee should serve (or continue to serve) as a trustee of the fund, is provided below.
Board Structure and Oversight Function. James C. Curvey is an interested person and currently serves as Chairman. The Trustees have determined that an interested Chairman is appropriate and benefits shareholders because an interested Chairman has a personal and professional stake in the quality and continuity of services provided to the fund. Independent Trustees exercise their informed business judgment to appoint an individual of their choosing to serve as Chairman, regardless of whether the Trustee happens to be independent or a member of management. The Independent Trustees have determined that they can act independently and effectively without having an Independent Trustee serve as Chairman and that a key structural component for assuring that they are in a position to do so is for the Independent Trustees to constitute a substantial majority for the Board. The Independent Trustees also regularly meet in executive session. Ned C. Lautenbach serves as Chairman of the Independent Trustees and as such (i) acts as a liaison between the Independent Trustees and management with respect to matters important to the Independent Trustees and (ii) with management prepares agendas for Board meetings.
Fidelity® funds are overseen by different Boards of Trustees. The fund's Board oversees Fidelity's high income and certain equity funds, and other Boards oversee Fidelity's investment-grade bond, money market, asset allocation, and sector funds. The asset allocation funds may invest in Fidelity® funds overseen by the fund's Board. The use of separate Boards, each with its own committee structure, allows the Trustees of each group of Fidelity® funds to focus on the unique issues of the funds they oversee, including common research, investment, and operational issues. On occasion, the separate Boards establish joint committees to address issues of overlapping consequences for the Fidelity® funds overseen by each Board.
The Trustees operate using a system of committees to facilitate the timely and efficient consideration of all matters of importance to the Trustees, the fund, and fund shareholders and to facilitate compliance with legal and regulatory requirements and oversight of the fund's activities and associated risks. The Board, acting through its committees, has charged FMR and its affiliates with (i) identifying events or circumstances the occurrence of which could have demonstrably adverse effects on the fund's business and/or reputation; (ii) implementing processes and controls to lessen the possibility that such events or circumstances occur or to mitigate the effects of such events or circumstances if they do occur; and (iii) creating and maintaining a system designed to evaluate continuously business and market conditions in order to facilitate the identification and implementation processes described in (i) and (ii) above. Because the day-to-day operations and activities of the fund are carried out by or through FMR, its affiliates, and other service providers, the fund's exposure to risks is mitigated but not eliminated by the processes overseen by the Trustees. While each of the Board's committees has responsibility for overseeing different aspects of the fund's activities, oversight is exercised primarily through the Operations, Audit, and Compliance Committees. In addition, the Independent Trustees have worked with FMR to enhance the Board's oversight of investment and financial risks, legal and regulatory risks, technology risks, and operational risks, including the development of additional risk reporting to the Board. For example, a working group comprised of Independent Trustees and FMR has worked and continues to work to review the Fidelity® funds' valuation-related activities, reporting and risk management. Appropriate personnel, including but not limited to the fund's Chief Compliance Officer (CCO), FMR's internal auditor, the independent accountants, the fund's Treasurer and portfolio management personnel, make periodic reports to the Board's committees, as appropriate, including an annual review of Fidelity's risk management program for the Fidelity® funds. The responsibilities of each standing committee, including their oversight responsibilities, are described further under "Standing Committees of the Trustees."
Interested Trustees*:
Correspondence intended for a Trustee who is an interested person may be sent to Fidelity Investments, 245 Summer Street, Boston, Massachusetts 02210.
Name, Year of Birth; Principal Occupations and Other Relevant Experience+
James C. Curvey (1935)
Year of Election or Appointment: 2007
Trustee
Chairman of the Board of Trustees
Mr. Curvey also serves as Trustee of other Fidelity® funds. Mr. Curvey is a Director of Fidelity Research & Analysis Co. (investment adviser firm, 2009-present), and Vice Chairman (2007-present) and Director of FMR LLC (diversified financial services company). In addition, Mr. Curvey serves as an Overseer for the Boston Symphony Orchestra and a member of the board of Artis-Naples, Naples, Florida, and as a Trustee for Brewster Academy, Wolfeboro, New Hampshire. Previously, Mr. Curvey served as a Director of Fidelity Investments Money Management, Inc. (investment adviser firm, 2009-2014) and a Director of FMR and FMR Co., Inc. (investment adviser firms, 2007-2014).
Charles S. Morrison (1960)
Year of Election or Appointment: 2014
Trustee
Mr. Morrison also serves as Trustee of other funds. He serves as President of Fidelity Management & Research Company (FMR) (investment adviser firm, 2016-present), a Director of Fidelity Investments Money Management, Inc. (FIMM) (investment adviser firm, 2014-present), Director of Fidelity SelectCo, LLC (investment adviser firm, 2014-present), President, Asset Management (2014-present), and is an employee of Fidelity Investments. Previously, Mr. Morrison served as Vice President of Fidelity's Fixed Income and Asset Allocation Funds (2012-2014), President, Fixed Income (2011-2014), Vice President of Fidelity's Money Market Funds (2005-2009), President, Money Market Group Leader of FMR (investment adviser firm, 2009), and Senior Vice President, Money Market Group of FMR (2004-2009). Mr. Morrison also served as Vice President of Fidelity's Bond Funds (2002-2005), certain Balanced Funds (2002-2005), and certain Asset Allocation Funds (2002-2007), and as Senior Vice President (2002-2005) of Fidelity's Bond Division.
* Determined to be an “Interested Trustee” by virtue of, among other things, his or her affiliation with the trust or various entities under common control with FMR.
+ The information includes the Trustee's principal occupation during the last five years and other information relating to the experience, attributes, and skills relevant to the Trustee's qualifications to serve as a Trustee, which led to the conclusion that the Trustee should serve as a Trustee for the fund.
Independent Trustees:
Correspondence intended for an Independent Trustee may be sent to Fidelity Investments, P.O. Box 55235, Boston, Massachusetts 02205-5235.
Name, Year of Birth; Principal Occupations and Other Relevant Experience+
Dennis J. Dirks (1948)
Year of Election or Appointment: 2005
Trustee
Mr. Dirks also serves as Trustee of other Fidelity® funds. Prior to his retirement in May 2003, Mr. Dirks was Chief Operating Officer and a member of the Board of The Depository Trust & Clearing Corporation (DTCC). He also served as President, Chief Operating Officer, and Board member of The Depository Trust Company (DTC) and President and Board member of the National Securities Clearing Corporation (NSCC). In addition, Mr. Dirks served as Chief Executive Officer and Board member of the Government Securities Clearing Corporation, Chief Executive Officer and Board member of the Mortgage-Backed Securities Clearing Corporation, as a Trustee and a member of the Finance Committee of Manhattan College (2005-2008), as a Trustee and a member of the Finance Committee of AHRC of Nassau County (2006-2008), and as a member of the Independent Directors Council (IDC) Governing Council (2010-2015). Mr. Dirks is a member of the Board of Directors for The Brookville Center for Children's Services, Inc. (2009-present) and the Finance Committee of the Asolo Repertory Theatre (2016-present).
Alan J. Lacy (1953)
Year of Election or Appointment: 2008
Trustee
Mr. Lacy also serves as Trustee of other Fidelity® funds. Mr. Lacy serves as Chairman (2014-present) and a member (2010-present) of the Board of Directors of Dave & Buster's Entertainment, Inc. (restaurant and entertainment complexes) and a Director of Bristol-Myers Squibb Company (global pharmaceuticals, 2008-present). He is a Trustee of the California Chapter of The Nature Conservancy (2015-present) and a Director of the Center for Advanced Study in the Behavioral Sciences at Stanford University (2015-present). In addition, Mr. Lacy served as Senior Adviser (2007-2014) of Oak Hill Capital Partners, L.P. (private equity) and also served as Chief Executive Officer (2005) and Vice Chairman (2005-2006) of Sears Holdings Corporation (retail) and Chief Executive Officer and Chairman of the Board of Sears, Roebuck and Co. (retail, 2000-2005). Previously, Mr. Lacy served as Chairman (2008-2011) and a member (2006-2015) of the Board of Trustees of the National Parks Conservation Association and as a member of the Board of Directors for The Western Union Company (global money transfer, 2006-2011), The Hillman Companies, Inc. (hardware wholesalers, 2010-2014), and Earth Fare, Inc. (retail grocery, 2010-2014).
Ned C. Lautenbach (1944)
Year of Election or Appointment: 2000
Trustee
Chairman of the Independent Trustees
Mr. Lautenbach also serves as Trustee of other Fidelity® funds. Mr. Lautenbach currently serves as the Lead Director of the Eaton Corporation Board of Directors (diversified industrial, 1997-present). Mr. Lautenbach is Chairman of the Board of Directors of Artis-Naples in Naples, Florida (2012-present), a member of the Council on Foreign Relations (1994-present), and currently Vice Chair of the Board of Governors, State University System of Florida (2013-present). Previously, Mr. Lautenbach was a Partner and Advisory Partner at Clayton, Dubilier & Rice, LLC (private equity investment, 1998-2010), as well as a Director of Sony Corporation (2006-2007). Mr. Lautenbach also had a 30-year career with IBM (technology company) during which time he served as Senior Vice President and a member of the Corporate Executive Committee (1968-1998).
Joseph Mauriello (1944)
Year of Election or Appointment: 2008
Trustee
Mr. Mauriello also serves as Trustee of other Fidelity® funds. Prior to his retirement in January 2006, Mr. Mauriello served in numerous senior management positions including Deputy Chairman and Chief Operating Officer (2004-2005), and Vice Chairman of Financial Services (2002-2004) of KPMG LLP US (professional services, 1965-2005). Mr. Mauriello currently serves as a member of the Board of Directors of XL Group plc. (global insurance and re-insurance, 2006-present) and the Independent Directors Council (IDC) Governing Council (2015-present). Previously, Mr. Mauriello served as a Director of the Hamilton Funds of the Bank of New York (2006-2007) and of Arcadia Resources Inc. (health care services and products, 2007-2012).
Robert W. Selander (1950)
Year of Election or Appointment: 2011
Trustee
Mr. Selander also serves as Trustee of other Fidelity® funds. Mr. Selander serves as a Director of The Western Union Company (global money transfer, 2014-present) and a non-executive Chairman of Health Equity, Inc. (health savings custodian, 2015-present). Previously, Mr. Selander served as a Member of the Advisory Board of certain Fidelity® funds (2011), and Executive Vice Chairman (2010), Chief Executive Officer (2009-2010), and President and Chief Executive Officer (1997-2009) of Mastercard, Inc.
Cornelia M. Small (1944)
Year of Election or Appointment: 2005
Trustee
Ms. Small also serves as Trustee of other Fidelity® funds. Ms. Small is a member of the Board of Directors (2009-present) and Chair of the Investment Committee (2010-present) of the Teagle Foundation. Ms. Small also serves on the Investment Committee of the Berkshire Taconic Community Foundation (2008-present). Previously, Ms. Small served as Chairperson (2002-2008) and a member of the Investment Committee and Chairperson (2008-2012) and a member of the Board of Trustees of Smith College. In addition, Ms. Small served as Chief Investment Officer, Director of Global Equity Investments, and a member of the Board of Directors of Scudder, Stevens & Clark and Scudder Kemper Investments.
William S. Stavropoulos (1939)
Year of Election or Appointment: 2002
Trustee
Vice Chairman of the Independent Trustees
Mr. Stavropoulos also serves as Trustee of other Fidelity® funds. Mr. Stavropoulos serves as President and Founder of the Michigan Baseball Foundation, the Great Lakes Loons (2007-present). Mr. Stavropoulos is Chairman Emeritus of the Board of Directors of The Dow Chemical Company, where he previously served in numerous senior management positions, including President, CEO (1995-2000; 2002-2004), Chairman of the Executive Committee (2000-2006), and as a member of the Board of Directors (1990-2006). Currently, Mr. Stavropoulos is Chairman of the Board of Directors of Univar Inc. (global distributor of commodity and specialty chemicals), a Director of Teradata Corporation (data warehousing and technology solutions), and a member of the Advisory Board for Metalmark Capital LLC (private equity investment, 2005-present). Mr. Stavropoulos is an operating advisor to Clayton, Dubilier & Rice, LLC (private equity investment). In addition, Mr. Stavropoulos is a member of the University of Notre Dame Advisory Council for the College of Science, a Trustee of the Rollin L. Gerstacker Foundation, and a Director of Artis-Naples in Naples, Florida. Previously, Mr. Stavropoulos served as a Director of Chemical Financial Corporation (bank holding company, 1993-2012) and Tyco International, Ltd. (multinational manufacturing and services, 2007-2012).
David M. Thomas (1949)
Year of Election or Appointment: 2008
Trustee
Mr. Thomas also serves as Trustee of other Fidelity® funds. Mr. Thomas serves as Non-Executive Chairman of the Board of Directors of Fortune Brands Home and Security (home and security products, 2011-present), as a member of the Board of Directors (2004-present) and Presiding Director (2013-present) of Interpublic Group of Companies, Inc. (marketing communication), and as a member of the Board of Trustees of the University of Florida (2013-present). Previously, Mr. Thomas served as Executive Chairman (2005-2006) and Chairman and Chief Executive Officer (2000-2005) of IMS Health, Inc. (pharmaceutical and healthcare information solutions), and a Director of Fortune Brands, Inc. (consumer products, 2000-2011).
+ The information includes the Trustee's principal occupation during the last five years and other information relating to the experience, attributes, and skills relevant to the Trustee's qualifications to serve as a Trustee, which led to the conclusion that the Trustee should serve as a Trustee for the fund.
Advisory Board Members and Officers:
Correspondence intended for an officer or Peter S. Lynch may be sent to Fidelity Investments, 245 Summer Street, Boston, Massachusetts 02210. Officers appear below in alphabetical order.
Name, Year of Birth; Principal Occupation
Peter S. Lynch (1944)
Year of Election or Appointment: 2003
Member of the Advisory Board
Mr. Lynch also serves as Member of the Advisory Board of other Fidelity® funds. Mr. Lynch is Vice Chairman and a Director of FMR (investment adviser firm) and FMR Co., Inc. (investment adviser firm). In addition, Mr. Lynch serves as a Trustee of Boston College and as the Chairman of the Inner-City Scholarship Fund. Previously, Mr. Lynch served on the Special Olympics International Board of Directors (1997-2006).
Marc R. Bryant (1966)
Year of Election or Appointment: 2015
Secretary and Chief Legal Officer (CLO)
Mr. Bryant also serves as Secretary and CLO of other funds. Mr. Bryant serves as CLO, Secretary, and Senior Vice President of Fidelity Management & Research Company (investment adviser firm, 2015-present) and FMR Co., Inc. (investment adviser firm, 2015-present); Secretary of Fidelity SelectCo, LLC (investment adviser firm, 2015-present) and Fidelity Investments Money Management, Inc. (investment adviser firm, 2015-present); and CLO of Fidelity Management & Research (Hong Kong) Limited and FMR Investment Management (UK) Limited (investment adviser firms, 2015-present) and Fidelity Management & Research (Japan) Limited (investment adviser firm, 2016-present). He is Senior Vice President and Deputy General Counsel of FMR LLC (diversified financial services company). Previously, Mr. Bryant served as Secretary and CLO of Fidelity Rutland Square Trust II (2010-2014) and Assistant Secretary of Fidelity's Fixed Income and Asset Allocation Funds (2013-2015). Prior to joining Fidelity Investments, Mr. Bryant served as a Senior Vice President and the Head of Global Retail Legal for AllianceBernstein L.P. (2006-2010), and as the General Counsel for ProFund Advisors LLC (2001-2006).
Jeffrey S. Christian (1961)
Year of Election or Appointment: 2016
Assistant Treasurer
Mr. Christian also serves as Assistant Treasurer of other funds. Mr. Christian is an employee of Fidelity Investments (2003-present).
William C. Coffey (1969)
Year of Election or Appointment: 2009
Assistant Secretary
Mr. Coffey also serves as Assistant Secretary of other funds. He is Senior Vice President and Deputy General Counsel of FMR LLC (diversified financial services company, 2010-present), and is an employee of Fidelity Investments. Previously, Mr. Coffey served as Vice President and Associate General Counsel of FMR LLC (2005-2009).
Jonathan Davis (1968)
Year of Election or Appointment: 2010
Assistant Treasurer
Mr. Davis also serves as Assistant Treasurer of other funds, and is an employee of Fidelity Investments. Previously, Mr. Davis served as Vice President and Associate General Counsel of FMR LLC (diversified financial services company, 2003-2010).
Adrien E. Deberghes (1967)
Year of Election or Appointment: 2016
Assistant Treasurer
Mr. Deberghes also serves as an officer of other funds. He serves as Executive Vice President of Fidelity Investments Money Management, Inc. (FIMM) (investment adviser firm, 2016-present) and is an employee of Fidelity Investments (2008-present). Prior to joining Fidelity Investments, Mr. Deberghes was Senior Vice President of Mutual Fund Administration at State Street Corporation (2007-2008), Senior Director of Mutual Fund Administration at Investors Bank & Trust (2005-2007), and Director of Finance for Dunkin' Brands (2000-2005). Previously, Mr. Deberghes served in other fund officer roles.
Stephanie J. Dorsey (1969)
Year of Election or Appointment: 2010
Assistant Treasurer
Ms. Dorsey also serves as an officer of other funds. She is an employee of Fidelity Investments (2008-present) and has served in other fund officer roles. Prior to joining Fidelity Investments, Ms. Dorsey served as Treasurer (2004-2008) of the JPMorgan Mutual Funds and Vice President (2004-2008) of JPMorgan Chase Bank.
Howard J. Galligan III (1966)
Year of Election or Appointment: 2014
Chief Financial Officer
Mr. Galligan also serves as Chief Financial Officer of other funds. Mr. Galligan serves as President of Fidelity Pricing and Cash Management Services (FPCMS) (2014-present) and as a Director of Strategic Advisers, Inc. (investment adviser firm, 2008-present). Previously, Mr. Galligan served as Chief Administrative Officer of Asset Management (2011-2014) and Chief Operating Officer and Senior Vice President of Investment Support for Strategic Advisers, Inc. (2003-2011).
Scott C. Goebel (1968)
Year of Election or Appointment: 2015
Vice President
Mr. Goebel serves as Vice President of other funds and is an employee of Fidelity Investments (2001-present). Previously, Mr. Goebel served as Senior Vice President of Fidelity Management & Research Company (FMR) (investment adviser firm, 2016), Secretary of Fidelity SelectCo, LLC (investment adviser firm, 2013-2015), Fidelity Investments Money Management, Inc. (FIMM) (investment adviser firm, 2010-2015), and Fidelity Research and Analysis Company (FRAC) (investment adviser firm, 2010-2015); General Counsel, Secretary, and Senior Vice President of FMR (investment adviser firm, 2008-2015) and FMR Co., Inc. (investment adviser firm, 2008-2015); Assistant Secretary of Fidelity Management & Research (Japan) Limited (investment adviser firm, 2008-2015) and Fidelity Management & Research (U.K.) Inc. (investment adviser firm, 2008-2015); Chief Legal Officer (CLO) of Fidelity Management & Research (Hong Kong) Limited (investment adviser firm, 2008-2015); Secretary and CLO of certain Fidelity® funds (2008-2015); Assistant Secretary of FIMM (2008-2010), FRAC (2008-2010), and certain funds (2007-2008); and as Vice President and Secretary of Fidelity Distributors Corporation (FDC) (2005-2007).
Brian B. Hogan (1964)
Year of Election or Appointment: 2009
Vice President
Mr. Hogan also serves as Trustee or Vice President of other funds. Mr. Hogan serves as a Director of FMR Investment Management (UK) Limited (investment adviser firm, 2015-present) and Fidelity SelectCo, LLC (investment adviser firm, 2014-present) and President of the Equity Division of FMR (investment adviser firm, 2009-present). Previously, Mr. Hogan served as Senior Vice President, Equity Research of FMR (2006-2009) and as a portfolio manager. Mr. Brian B. Hogan is not related to Mr. Colm A. Hogan.
Colm A. Hogan (1973)
Year of Election or Appointment: 2016
Deputy Treasurer
Mr. Hogan also serves as an officer of other funds. Mr. Hogan is an employee of Fidelity Investments (2005-present). Mr. Colm A. Hogan is not related to Mr. Brian B. Hogan.
Chris Maher (1972)
Year of Election or Appointment: 2013
Assistant Treasurer
Mr. Maher serves as Assistant Treasurer of other funds. Mr. Maher is Vice President of Valuation Oversight and is an employee of Fidelity Investments. Previously, Mr. Maher served as Vice President of Asset Management Compliance (2013), Vice President of the Program Management Group of FMR (investment adviser firm, 2010-2013), and Vice President of Valuation Oversight (2008-2010).
John F. Papandrea (1972)
Year of Election or Appointment: 2016
Anti-Money Laundering (AML) Officer
Mr. Papandrea also serves as AML Officer of other funds. Mr. Papandrea is Vice President of FMR LLC (diversified financial services company, 2008-present) and is an employee of Fidelity Investments (2005-present).
Melissa M. Reilly (1971)
Year of Election or Appointment: 2014
Vice President of certain Equity Funds
Ms. Reilly also serves as Vice President of other funds. Ms. Reilly is an employee of Fidelity Investments (2004-present).
Kenneth B. Robins (1969)
Year of Election or Appointment: 2016
Chief Compliance Officer
Mr. Robins also serves as an officer of other funds. Mr. Robins serves as Compliance Officer of Fidelity Management & Research Company and FMR Co., Inc. (investment adviser firms, 2016-present) and is an employee of Fidelity Investments (2004-present). Previously, Mr. Robins served as Executive Vice President of Fidelity Investments Money Management, Inc. (investment adviser firm, 2013-2016) and served in other fund officer roles.
Stacie M. Smith (1974)
Year of Election or Appointment: 2016
President and Treasurer
Ms. Smith also serves as an officer of other funds. She is an employee of Fidelity Investments (2009-present) and has served in other fund officer roles. Prior to joining Fidelity Investments, Ms. Smith served as Senior Audit Manager of Ernst & Young LLP (accounting firm, 1996-2009). Previously, Ms. Smith served as Deputy Treasurer of certain Fidelity® funds (2013-2016).
Marc L. Spector (1972)
Year of Election or Appointment: 2016
Assistant Treasurer
Mr. Spector also serves as an officer of other funds. Mr. Spector is an employee of Fidelity Investments (2016-present). Prior to joining Fidelity Investments, Mr. Spector served as Director at the Siegfried Group (accounting firm, 2013-2016), and prior to Siegfried Group as audit senior manager at Deloitte & Touche (accounting firm, 2005-2013).
Renee Stagnone (1975)
Year of Election or Appointment: 2016
Assistant Treasurer
Ms. Stagnone also serves as an officer of other funds. Ms. Stagnone is an employee of Fidelity Investments (1997-present). Previously, Ms. Stagnone served as Deputy Treasurer of certain Fidelity® funds (2013-2016).
Shareholder Expense Example
As a shareholder of the Fund, you incur two types of costs: (1) transaction costs and (2) ongoing costs, including management fees and other Fund expenses. This Example is intended to help you understand your ongoing costs (in dollars) of investing in the Fund and to compare these costs with the ongoing costs of investing in other mutual funds.
The Example is based on an investment of $1,000 invested at the beginning of the period and held for the entire period (June 1, 2016 to November 30, 2016).
Actual Expenses
The first line of the accompanying table for each class of the Fund provides information about actual account values and actual expenses. You may use the information in this line, together with the amount you invested, to estimate the expenses that you paid over the period. Simply divide your account value by $1,000.00 (for example, an $8,600 account value divided by $1,000.00 = 8.6), then multiply the result by the number in the first line for a class of the Fund under the heading entitled "Expenses Paid During Period" to estimate the expenses you paid on your account during this period. A small balance maintenance fee of $12.00 that is charged once a year may apply for certain accounts with a value of less than $2,000. This fee is not included in the table below. If it was, the estimate of expenses you paid during the period would be higher, and your ending account value lower, by this amount. In addition, the Fund, as a shareholder in the underlying Fidelity Central Funds, will indirectly bear its pro-rata share of the fees and expenses incurred by the underlying Fidelity Central Funds. These fees and expenses are not included in the Fund's annualized expense ratio used to calculate the expense estimate in the table below.
Hypothetical Example for Comparison Purposes
The second line of the accompanying table for each class of the Fund provides information about hypothetical account values and hypothetical expenses based on a Class' actual expense ratio and an assumed rate of return of 5% per year before expenses, which is not the Class' actual return. The hypothetical account values and expenses may not be used to estimate the actual ending account balance or expenses you paid for the period. You may use this information to compare the ongoing costs of investing in the Fund and other funds. To do so, compare this 5% hypothetical example with the 5% hypothetical examples that appear in the shareholder reports of the other funds. A small balance maintenance fee of $12.00 that is charged once a year may apply for certain accounts with a value of less than $2,000. This fee is not included in the table below. If it was, the estimate of expenses you paid during the period would be higher, and your ending account value lower, by this amount. In addition, the Fund, as a shareholder in the underlying Fidelity Central Funds, will indirectly bear its pro-rata share of the fees and expenses incurred by the underlying Fidelity Central Funds. These fees and expenses are not included in the Fund's annualized expense ratio used to calculate the expense estimate in the table below.
Please note that the expenses shown in the table are meant to highlight your ongoing costs only and do not reflect any transaction costs. Therefore, the second line of the table is useful in comparing ongoing costs only, and will not help you determine the relative total costs of owning different funds.
| | Annualized Expense Ratio-A | Beginning
Account Value
June 1, 2016 | Ending
Account Value
November 30, 2016 | Expenses Paid
During Period-B
June 1, 2016
to November 30, 2016 |
| Growth Company | .74% | | | |
| Actual | | $1,000.00 | $1,074.40 | $3.84 |
| Hypothetical-C | | $1,000.00 | $1,021.30 | $3.74 |
| Class K | .63% | | | |
| Actual | | $1,000.00 | $1,074.90 | $3.27 |
| Hypothetical-C | | $1,000.00 | $1,021.85 | $3.18 |
A Annualized expense ratio reflects expenses net of applicable fee waivers.
B Expenses are equal to each Class' annualized expense ratio, multiplied by the average account value over the period, multiplied by 183/366 (to reflect the one-half year period).
C 5% return per year before expenses
Distributions (Unaudited)
The Board of Trustees of Fidelity Growth Company Fund voted to pay to shareholders of record at the opening of business on record date, the following distributions per share derived from capital gains realized from sales of portfolio securities, and dividends derived from net investment income:
| | Pay Date | Record Date | Dividends | Capital Gains |
| Fidelity Growth Company Fund | | | | |
| Growth Company | 12/28/16 | 12/27/16 | $0.093 | $8.069 |
| Class K | 12/28/16 | 12/27/16 | $0.231 | $8.069 |
|
The fund hereby designates as a capital gain dividend with respect to the taxable year ended November 30, 2016, $2,189,213,127, or, if subsequently determined to be different, the net capital gain of such year.
Class K designates 100% of the dividends distributed during the fiscal year as qualifying for the dividends–received deduction for corporate shareholders.
Class K designates 100% of dividends distributed during the fiscal year as amounts which may be taken into account as a dividend for purposes of the maximum rate under section 1(h)(11) of the Internal Revenue Code.
The fund will notify shareholders in January 2017 of amounts for use in preparing 2016 income tax returns.
Board Approval of Investment Advisory Contracts and Management Fees
Fidelity Growth Company Fund
Each year, the Board of Trustees, including the Independent Trustees (together, the Board), votes on the renewal of the management contract with Fidelity Management & Research Company (FMR) and the sub-advisory agreements (together, the Advisory Contracts) for the fund. The Board, assisted by the advice of fund counsel and Independent Trustees' counsel, requests and considers a broad range of information relevant to the renewal of the Advisory Contracts throughout the year.
The Board meets regularly and, at each of its meetings, covers an extensive agenda of topics and materials and considers factors that are relevant to its annual consideration of the renewal of the fund's Advisory Contracts, including the services and support provided to the fund and its shareholders. The Board has established various standing committees (Committees), each composed of and chaired by Independent Trustees with varying backgrounds, to which the Board has assigned specific subject matter responsibilities in order to enhance effective decision-making by the Board. The Board, acting directly and through its Committees, requests and receives information concerning the annual consideration of the renewal of the fund's Advisory Contracts. The Board also meets as needed to consider matters specifically related to the Board's annual consideration of the renewal of the Advisory Contracts. Members of the Board may also meet with trustees of other Fidelity funds through ad hoc joint committees to discuss certain matters relevant to all of the Fidelity funds.
At its July 2016 meeting, the Board unanimously determined to renew the fund's Advisory Contracts. In reaching its determination, the Board considered all factors it believed relevant, including (i) the nature, extent, and quality of the services to be provided to the fund and its shareholders (including the investment performance of the fund); (ii) the competitiveness of the fund's management fee and total expense ratio relative to peer funds; (iii) the total costs of the services to be provided by and the profits to be realized by Fidelity from its relationships with the fund; and (iv) the extent to which, if any, economies of scale exist and would be realized as the fund grows, and whether any economies of scale are appropriately shared with fund shareholders.
In considering whether to renew the Advisory Contracts for the fund, the Board reached a determination, with the assistance of fund counsel and Independent Trustees' counsel and through the exercise of its business judgment, that the renewal of the Advisory Contracts was in the best interests of the fund and its shareholders and that the compensation payable under the Advisory Contracts was fair and reasonable. The Board's decision to renew the Advisory Contracts was not based on any single factor, but rather was based on a comprehensive consideration of all the information provided to the Board at its meetings throughout the year. The Board, in reaching its determination to renew the Advisory Contracts, was aware that shareholders of the fund have a broad range of investment choices available to them, including a wide choice among funds offered by Fidelity's competitors, and that the fund's shareholders, who have the opportunity to review and weigh the disclosure provided by the fund in its prospectus and other public disclosures, have chosen to invest in this fund, which is part of the Fidelity family of funds.
Nature, Extent, and Quality of Services Provided. The Board considered Fidelity's staffing as it relates to the fund, including the backgrounds of investment personnel of Fidelity, and also considered the fund's investment objective, strategies, and related investment philosophy. The Independent Trustees also had discussions with senior management of Fidelity's investment operations and investment groups. The Board considered the structure of the investment personnel compensation program and whether this structure provides appropriate incentives to act in the best interests of the fund. Additionally, the Board considered the portfolio managers' investments, if any, in the funds that they manage.
Resources Dedicated to Investment Management and Support Services. The Board and the Fund Oversight and Research Committees reviewed the general qualifications and capabilities of Fidelity's investment staff, including its size, education, experience, and resources, as well as Fidelity's approach to recruiting, training, managing, and compensating investment personnel. The Board noted that Fidelity has continued to increase the resources devoted to non-U.S. offices, including expansion of Fidelity's global investment organization. The Board also noted that Fidelity's analysts have extensive resources, tools and capabilities that allow them to conduct sophisticated quantitative and fundamental analysis, as well as credit analysis of issuers, counterparties and guarantors. Further, the Board considered that Fidelity's investment professionals have sufficient access to global information and data so as to provide competitive investment results over time, and that those professionals also have access to sophisticated tools that permit them to assess portfolio construction and risk and performance attribution characteristics continuously, as well as to transmit new information and research conclusions rapidly around the world. Additionally, in its deliberations, the Board considered Fidelity's trading, risk management, compliance, and technology and operations capabilities and resources, which are integral parts of the investment management process.
Shareholder and Administrative Services. The Board considered (i) the nature, extent, quality, and cost of advisory, administrative, and shareholder services performed by FMR, the sub-advisers (together with FMR, the Investment Advisers), and their affiliates under the Advisory Contracts and under separate agreements covering transfer agency, pricing and bookkeeping, and securities lending services for the fund; (ii) the nature and extent of the supervision of third party service providers, principally custodians, subcustodians, and pricing vendors; and (iii) the resources devoted to, and the record of compliance with, the fund's compliance policies and procedures. The Board also reviewed the allocation of fund brokerage, including allocations to brokers affiliated with the Investment Advisers, the use of brokerage commissions to pay fund expenses, and the use of "soft" commission dollars to pay for research services.
The Board noted that the growth of fund assets over time across the complex allows Fidelity to reinvest in the development of services designed to enhance the value or convenience of the Fidelity funds as investment vehicles. These services include 24-hour access to account information and market information through telephone representatives and over the Internet, investor education materials and asset allocation tools, and the expanded availability of Fidelity Investor Centers.
In 2014, the Board formed an ad hoc Committee on Transfer Agency Fees to review the variety of transfer agency fee structures throughout the industry and Fidelity's competitive positioning with respect to industry participants.
Investment in a Large Fund Family. The Board considered the benefits to shareholders of investing in a Fidelity fund, including the benefits of investing in a fund that is part of a large family of funds offering a variety of investment disciplines and providing a large variety of mutual fund investor services. The Board noted that Fidelity had taken, or had made recommendations that resulted in the Fidelity funds taking, a number of actions over the previous year that benefited particular funds, including: (i) continuing to dedicate additional resources to investment research and to the support of the senior management team that oversees asset management; (ii) continuing efforts to enhance Fidelity's global research capabilities; (iii) launching new funds and making other enhancements to meet client needs; (iv) broadening eligibility requirements for certain lower-priced share classes of, and streamlining the fee structure for, certain existing equity index funds; (v) lowering expense caps for certain existing funds and classes to reduce expenses paid by shareholders; (vi) eliminating redemption fees for certain variable insurance product funds and classes; (vii) continuing to launch dedicated lower cost underlying funds to meet portfolio construction needs related to expanding underlying fund options for Fidelity funds of funds, specifically for the Freedom Fund product lines; (viii) launching a lower cost share class for use by the Freedom Index Fund product line; (ix) rationalizing product lines and gaining increased efficiencies through fund mergers and share class consolidations; (x) continuing to develop, acquire and implement systems and technology to improve services to the funds and shareholders, strengthen information security, and increase efficiency; (xi) implementing investment enhancements to further strengthen Fidelity's target date product line to increase investors' probability of success in achieving their goals; (xii) accelerating the conversion of all remaining Class B shares to Class A shares, which have a lower expense structure; and (xiii) implementing changes to Fidelity's money market fund product line in response to recent regulatory reforms.
Investment Performance. The Board considered whether the fund has operated in accordance with its investment objective, as well as its record of compliance with its investment restrictions and its performance history.
The Board took into account discussions with representatives of the Investment Advisers about fund investment performance that occur at Board meetings throughout the year. In this regard the Board noted that as part of regularly scheduled fund reviews and other reports to the Board on fund performance, the Board considers annualized return information for the fund, for different time periods, measured against a securities market index ("benchmark index") and a peer group of funds with similar objectives ("peer group"), if any. In its evaluation of fund investment performance, the Board gave particular attention to information indicating changes in performance of certain Fidelity funds for specific time periods and discussed with the Investment Advisers the reasons for any overperformance or underperformance.
In addition to reviewing absolute and relative fund performance, the Independent Trustees periodically consider the appropriateness of fund performance metrics in evaluating the results achieved. In general, the Independent Trustees believe that fund performance should be evaluated based on net performance (after fees and expenses) of both the highest performing and lowest performing fund share classes, where applicable, compared to appropriate benchmark indices, over appropriate time periods that may include full market cycles, and compared to peer groups, as applicable, over the same periods, taking into account relevant factors including the following: general market conditions; issuer-specific information; and fund cash flows and other factors.
The Independent Trustees recognize that shareholders evaluate performance on a net basis over their own holding periods, for which one-, three-, and five-year periods are often used as a proxy. For this reason, the performance information reviewed by the Board also included net cumulative calendar year total return information for the fund and an appropriate benchmark index and peer group for the most recent one-, three-, and five-year periods, as shown below. Returns are shown compared to the 25th percentile (top of box, 75% beaten) and 75th percentile (bottom of box, 25% beaten) of the peer universe.
Fidelity Growth Company Fund
The Board also considered that the fund's management fee is subject to upward or downward adjustment depending upon whether, and to what extent, the fund's investment performance for the performance period exceeds, or is exceeded by, a securities index, thus leading to a performance adjustment for the same period. The Board noted that the performance adjustment provides FMR with a strong economic incentive to seek to achieve superior performance for the fund's shareholders and helps to more closely align the interests of FMR and the shareholders of the fund.
Based on its review, the Board concluded that the nature, extent, and quality of services provided to the fund under the Advisory Contracts should continue to benefit the shareholders of the fund.
Competitiveness of Management Fee and Total Expense Ratio. The Board considered the fund's management fee and total expense ratio compared to "mapped groups" of competitive funds and classes created for the purpose of facilitating the Trustees' competitive analysis of management fees and total expenses. Fidelity creates "mapped groups" by combining similar Broadridge investment objective categories that have comparable investment mandates. Combining Broadridge investment objective categories aids the Board's management fee and total expense ratio comparisons by broadening the competitive group used for comparison.
Management Fee. The Board considered two proprietary management fee comparisons for the 12-month periods shown in basis points (BP) in the chart below. The group of Broadridge funds used by the Board for management fee comparisons is referred to below as the "Total Mapped Group." The Total Mapped Group comparison focuses on a fund's standing in terms of gross management fees before expense reimbursements or caps, and without giving effect to the fund's performance adjustment, relative to the total universe of funds with comparable investment mandates, regardless of whether their management fee structures also are comparable. Funds with comparable investment mandates offer exposure to similar types of securities. Funds with comparable management fee structures have similar management fee contractual arrangements (
e.g., flat rate charged for advisory services, all-inclusive fee rate,
etc.). "TMG %" represents the percentage of funds in the Total Mapped Group that had management fees that were lower than the fund's. For example, a hypothetical TMG % of 20% would mean that 80% of the funds in the Total Mapped Group had higher, and 20% had lower, management fees than the fund. The fund's actual TMG %s and the number of funds in the Total Mapped Group are in the chart below. The "Asset-Size Peer Group" (ASPG) comparison focuses on a fund's standing relative to a subset of non-Fidelity funds within the Total Mapped Group that are similar in size and management fee structure without taking into account performance adjustments, if any. For example, if a fund is in the first quartile of the ASPG, the fund's management fee ranks in the least expensive or lowest 25% of funds in the ASPG. The ASPG represents at least 15% of the funds in the Total Mapped Group with comparable asset size and management fee structures, subject to a minimum of 50 funds (or all funds in the Total Mapped Group if fewer than 50). Additional information, such as the ASPG quartile in which the fund's management fee rate ranked and the impact of the fund's performance adjustment, is also included in the chart and considered by the Board.
Fidelity Growth Company Fund
The Board noted that the fund's management fee rate ranked below the median of its Total Mapped Group and below the median of its ASPG for 2015. The Board also noted the effect of the fund's performance adjustment, if any, on the fund's management fee ranking.
The Board noted that, in 2014, the ad hoc Committee on Group Fee was formed by it and the boards of other Fidelity funds to conduct an in-depth review of the "group fee" component of the management fee of funds with such management fee structures. The Committee's focus included the mechanics of the group fee, the competitive landscape of group fee structures, Fidelity funds with no group fee component and investment products not included in group fee assets. The Board also considered that, for funds subject to the group fee, FMR agreed to voluntarily waive fees over a specified period of time in amounts designed to account for assets converted from certain funds to certain collective investment trusts.
The Board also noted that, in 2013, the ad hoc Committee on Management Fees was formed to conduct an in-depth review of the management fee rates of Fidelity's active equity mutual funds. The Committee focused on the following areas: (i) standard fee structures; (ii) research consumption and trading evolution; (iii) management fee competitiveness/profitability by category; and (iv) factors that drive institutional pricing.
Based on its review, the Board concluded that the fund's management fee is fair and reasonable in light of the services that the fund receives and the other factors considered.
Total Expense Ratio. In its review of each class's total expense ratio, the Board considered the fund's management fee rate as well as other fund or class expenses, as applicable, such as transfer agent fees, pricing and bookkeeping fees, and custodial, legal, and audit fees. The Board noted the impact of the fund's performance adjustment. The Board also noted that Fidelity may agree to waive fees and expenses from time to time, and the extent to which, if any, it has done so for the fund. As part of its review, the Board also considered the current and historical total expense ratios of each class of the fund compared to competitive fund median expenses. Each class of the fund is compared to those funds and classes in the Total Mapped Group (used by the Board for management fee comparisons) that have a similar sales load structure.
The Board noted that the total expense ratio of each class ranked below the competitive median for 2015.
Fees Charged to Other Fidelity Clients. The Board also considered Fidelity fee structures and other information with respect to clients of Fidelity, such as other funds advised or subadvised by Fidelity, pension plan clients, and other institutional clients with similar mandates. The Board noted the findings of the 2013 ad hoc joint committee (created with the board of other Fidelity funds), which reviewed and compared Fidelity's institutional investment advisory business with its business of providing services to the Fidelity funds, including the differences in services provided, fees charged, and costs incurred, as well as competition in their respective marketplaces.
Based on its review of total expense ratios and fees charged to other Fidelity clients, the Board concluded that the total expense ratio of each class of the fund was reasonable in light of the services that the fund and its shareholders receive and the other factors considered.
Costs of the Services and Profitability. The Board considered the revenues earned and the expenses incurred by Fidelity in conducting the business of developing, marketing, distributing, managing, administering and servicing the fund and servicing the fund's shareholders. The Board also considered the level of Fidelity's profits in respect of all the Fidelity funds.
On an annual basis, Fidelity presents to the Board information about the profitability of its relationship with the fund. Fidelity calculates profitability information for each fund, as well as aggregate profitability information for groups of Fidelity funds and all Fidelity funds, using a series of detailed revenue and cost allocation methodologies which originate with the books and records of Fidelity on which Fidelity's audited financial statements are based. The Audit Committee of the Board reviews any significant changes from the prior year's methodologies.
PricewaterhouseCoopers LLP (PwC), independent registered public accounting firm and auditor to Fidelity and certain Fidelity funds, has been engaged annually by the Board as part of the Board's assessment of Fidelity's profitability analysis. PwC's engagement includes the review and assessment of the methodologies used by Fidelity in determining the revenues and expenses attributable to Fidelity's mutual fund business, and completion of agreed-upon procedures in respect of the mathematical accuracy of the fund profitability information and its conformity to established allocation methodologies. After considering PwC's reports issued under the engagement and information provided by Fidelity, the Board concluded that while other allocation methods may also be reasonable, Fidelity's profitability methodologies are reasonable in all material respects.
The Board also reviewed Fidelity's non-fund businesses and fall-out benefits related to the mutual fund business as well as cases where Fidelity's affiliates may benefit from or be related to the fund's business.
The Board considered the costs of the services provided by and the profits realized by Fidelity in connection with the operation of the fund and was satisfied that the profitability was not excessive.
Economies of Scale. The Board considered whether there have been economies of scale in respect of the management of the Fidelity funds, whether the Fidelity funds (including the fund) have appropriately benefited from any such economies of scale, and whether there is potential for realization of any further economies of scale. The Board considered the extent to which the fund will benefit from economies of scale as assets grow through increased services to the fund, through waivers or reimbursements, or through fee or expense ratio reductions. The Board also noted that in 2013, it and the boards of other Fidelity funds created an ad hoc committee (the Economies of Scale Committee) to analyze whether Fidelity attains economies of scale in respect of the management and servicing of the Fidelity funds, whether the Fidelity funds have appropriately benefited from such economies of scale, and whether there is potential for realization of any further economies of scale.
The Board recognized that the fund's management contract incorporates a "group fee" structure, which provides for lower group fee rates as total group assets increase, and for higher group fee rates as total group assets decrease (with "group assets" defined to include fund assets under FMR's management plus the assets of sector funds previously under FMR's management). FMR calculates the group fee rates based on a tiered asset "breakpoint" schedule that varies based on asset class. The Board considered that the group fee is designed to deliver the benefits of economies of scale to fund shareholders when total Fidelity fund assets increase, even if assets of any particular fund are unchanged or have declined, because some portion of Fidelity's costs are attributable to services provided to all Fidelity funds, and all funds benefit if those costs can be allocated among more assets. The Board also considered that although the fund is partially closed to new investors, it continues to incur investment management expenses, and marketing and distribution expenses related to the retention of existing shareholders and assets. The Board further noted that the fund may continue to realize benefits from the group fee structure, even though assets may not be expected to grow significantly at the fund level. The Board concluded that, given the group fee structure, fund shareholders will benefit from lower management fees as group assets increase at the fund complex level, regardless of whether Fidelity achieves any such economies of scale.
The Board concluded, taking into account the analysis of the Economies of Scale Committee, that economies of scale, if any, are being appropriately shared between fund shareholders and Fidelity.
Additional Information Requested by the Board. In order to develop fully the factual basis for consideration of the Fidelity funds' Advisory Contracts, the Board requested and received additional information on certain topics, including: (i) fund performance trends and Fidelity's long-term strategies for certain funds; (ii) the various share classes employed by Fidelity and the attributes of each class, together with similar information on the distribution and servicing payments made by Fidelity or the funds to third-party participants in the distribution channels; (iii) fund profitability, and fund performance in relation to fund profitability; (iv) the methodology with respect to evaluating competitive fund data and peer group classifications and fee comparisons; (v) annual fund profitability margins; (vi) the realization of fall-out benefits in and attribution of fall-out benefits to certain Fidelity business units; (vii) the appropriateness of certain funds' benchmarks; (viii) the rationalization for certain share classes and expenses; (ix) sub-advisory fee rates for comparable investment mandates; (x) product strategy for certain underperforming funds; and (xi) Fidelity's resources and strategy for cybersecurity.
Based on its evaluation of all of the conclusions noted above, and after considering all factors it believed relevant, the Board concluded that the advisory fee structures are fair and reasonable, and that the fund's Advisory Contracts should be renewed.
Corporate Headquarters
245 Summer St.
Boston, MA 02210
www.fidelity.com
GCF-ANN-0117
1.539089.119
Fidelity® Growth Strategies Fund Class K
Annual Report November 30, 2016 |
|
Contents
To view a fund's proxy voting guidelines and proxy voting record for the 12-month period ended June 30, visit http://www.fidelity.com/proxyvotingresults or visit the Securities and Exchange Commission's (SEC) web site at http://www.sec.gov.
You may also call 1-800-835-5092 to request a free copy of the proxy voting guidelines.
Standard & Poor's, S&P and S&P 500 are registered service marks of The McGraw-Hill Companies, Inc. and have been licensed for use by Fidelity Distributors Corporation.
Other third-party marks appearing herein are the property of their respective owners.
All other marks appearing herein are registered or unregistered trademarks or service marks of FMR LLC or an affiliated company. © 2017 FMR LLC. All rights reserved.
This report and the financial statements contained herein are submitted for the general information of the shareholders of the Fund. This report is not authorized for distribution to prospective investors in the Fund unless preceded or accompanied by an effective prospectus.
A fund files its complete schedule of portfolio holdings with the SEC for the first and third quarters of each fiscal year on Form N-Q. Forms N-Q are available on the SEC’s web site at http://www.sec.gov. A fund's Forms N-Q may be reviewed and copied at the SEC’s Public Reference Room in Washington, DC. Information regarding the operation of the SEC's Public Reference Room may be obtained by calling 1-800-SEC-0330.
For a complete list of a fund's portfolio holdings, view the most recent holdings listing, semiannual report, or annual report on Fidelity's web site at http://www.fidelity.com, http://www.institutional.fidelity.com, or http://www.401k.com, as applicable.
NOT FDIC INSURED •MAY LOSE VALUE •NO BANK GUARANTEE
Neither the Fund nor Fidelity Distributors Corporation is a bank.
Performance: The Bottom Line
Average annual total return reflects the change in the value of an investment, assuming reinvestment of distributions from dividend income and capital gains (the profits earned upon the sale of securities that have grown in value, if any) and assuming a constant rate of performance each year. The hypothetical investment and the average annual total returns do not reflect the deduction of taxes that a shareholder would pay on fund distributions or the redemption of fund shares. During periods of reimbursement by Fidelity, a fund’s total return will be greater than it would be had the reimbursement not occurred. How a fund did yesterday is no guarantee of how it will do tomorrow.
Average Annual Total Returns
| For the periods ended November 30, 2016 | Past 1 year | Past 5 years | Past 10 years |
| Class K | 0.20% | 12.66% | 5.93% |
The initial offering of Class K shares took place on May 9, 2008. Returns prior to May 9, 2008 are those of Fidelity® Growth Strategies Fund, the original class of the fund.
$10,000 Over 10 Years
Let's say hypothetically that $10,000 was invested in Fidelity® Growth Strategies Fund - Class K on November 30, 2006. The chart shows how the value of your investment would have changed, and also shows how the Russell Midcap® Growth Index performed over the same period. See above for additional information regarding the performance of Class K.

| Period Ending Values |
| $17,783 | Fidelity® Growth Strategies Fund - Class K |
| $20,992 | Russell Midcap® Growth Index |
Management's Discussion of Fund Performance
Market Recap: The S&P 500 index returned 8.06% for the 12 months ending November 30, 2016, rising sharply in the final month on post-election optimism for economic growth. The period began during a fairly volatile stretch, with stocks hampered by persistent oil-price weakness and U.S.-dollar strength. Markets regained positive momentum in February amid U.S. job gains, a rally in energy and other stimuli that helped keep the roughly seven-year uptrend intact. Markets tumbled briefly following the U.K.’s June 23 vote to exit the European Union – dubbed “Brexit” – then recovered quickly and settled into a flattish stretch until the November 8 U.S. presidential election. For the year, 10 of the 11 sectors in the S&P 500
® advanced, with six posting double-digit gains. Telecommunication services (+16%) led the way, its strength attributable to demand for dividend-paying equities early in the period, as well as to company-specific news. Cyclical sectors including industrials (+15%), financials (+14%), energy (+13%) and materials (+12%) posted strong gains, the latter two driven by a rebound in commodity prices. Conversely, real estate (+1%) lagged the index due to a late-period slump related to expectations for rising interest rates. Consumer discretionary (+3%) also underperformed, as competitive pressure continued to weigh on brick-and-mortar retailers.
Comments from Portfolio Manager Jean Park: For the year, the fund’s share classes delivered essentially flat results, lagging the 4.54% return of the Russell Midcap Growth Index. The fund’s investments in what I considered higher-quality stocks with strong free cash flow yields at reasonable valuations did not keep pace with the rest of the mid-cap market, which was buoyed by strong returns of lower-quality stocks. Stock selection hurt relative performance most, especially in the health care and consumer staples sectors. The fund’s biggest relative detractor came from avoiding strong-performing semiconductor maker Nvidia, which was added to the benchmark in July but which I thought was too expensive. An overweighting in Ireland-based generic-drugmaker Endo International, which suffered amid negative publicity and government scrutiny of drug-pricing policies, also hurt performance. I eliminated the position in August. Conversely, positioning in information technology and consumer discretionary was modestly beneficial. An out-of-benchmark stake in casino operator Las Vegas Sands proved the fund’s top individual contributor; I pared back the fund’s position on share-price strength, harvesting some long-term gains for tax efficiency. Restaurant chain Domino’s Pizza was another win and another position I trimmed to take profits.
The views expressed above reflect those of the portfolio manager(s) only through the end of the period as stated on the cover of this report and do not necessarily represent the views of Fidelity or any other person in the Fidelity organization. Any such views are subject to change at any time based upon market or other conditions and Fidelity disclaims any responsibility to update such views. These views may not be relied on as investment advice and, because investment decisions for a Fidelity fund are based on numerous factors, may not be relied on as an indication of trading intent on behalf of any Fidelity fund.
Investment Summary (Unaudited)
Top Ten Stocks as of November 30, 2016
| | % of fund's net assets | % of fund's net assets 6 months ago |
| O'Reilly Automotive, Inc. | 2.6 | 2.5 |
| Equifax, Inc. | 2.5 | 2.3 |
| AutoZone, Inc. | 2.5 | 2.4 |
| Electronic Arts, Inc. | 2.3 | 2.2 |
| VeriSign, Inc. | 2.2 | 1.4 |
| TransDigm Group, Inc. | 2.1 | 2.0 |
| Total System Services, Inc. | 2.1 | 2.1 |
| Fiserv, Inc. | 1.9 | 1.7 |
| Global Payments, Inc. | 1.7 | 2.4 |
| Ross Stores, Inc. | 1.7 | 1.2 |
| | 21.6 | |
Top Five Market Sectors as of November 30, 2016
| | % of fund's net assets | % of fund's net assets 6 months ago |
| Information Technology | 24.6 | 20.9 |
| Consumer Discretionary | 21.6 | 22.7 |
| Industrials | 15.3 | 16.3 |
| Health Care | 14.6 | 13.4 |
| Financials | 8.1 | 12.2 |
Prior period industry classifications reflect the categories in place as of the date indicated and have not been adjusted to reflect current industry classifications.
Asset Allocation (% of fund's net assets)
| As of November 30, 2016* |
| | Stocks | 98.9% |
| | Short-Term Investments and Net Other Assets (Liabilities) | 1.1% |

* Foreign investments - 6.5%
| As of May 31, 2016* |
| | Stocks | 98.3% |
| | Short-Term Investments and Net Other Assets (Liabilities) | 1.7% |

* Foreign investments - 9.4%
Investments November 30, 2016
Showing Percentage of Net Assets
| Common Stocks - 98.9% | | | |
| | | Shares | Value (000s) |
| CONSUMER DISCRETIONARY - 21.6% | | | |
| Auto Components - 1.6% | | | |
| Delphi Automotive PLC | | 110,243 | $7,056 |
| Tenneco, Inc. (a) | | 115,544 | 6,811 |
| Visteon Corp. | | 350,600 | 27,582 |
| | | | 41,449 |
| Diversified Consumer Services - 1.0% | | | |
| H&R Block, Inc. | | 566,547 | 12,555 |
| Service Corp. International | | 461,880 | 12,466 |
| | | | 25,021 |
| Hotels, Restaurants & Leisure - 3.9% | | | |
| Domino's Pizza, Inc. | | 154,000 | 25,878 |
| Jack in the Box, Inc. | | 174,000 | 18,099 |
| Las Vegas Sands Corp. | | 196,500 | 12,315 |
| Wyndham Worldwide Corp. | | 589,000 | 42,402 |
| | | | 98,694 |
| Household Durables - 1.9% | | | |
| Leggett & Platt, Inc. | | 247,000 | 11,871 |
| Newell Brands, Inc. | | 810,000 | 38,078 |
| | | | 49,949 |
| Internet & Direct Marketing Retail - 0.6% | | | |
| Liberty Interactive Corp. QVC Group Series A (a) | | 110,000 | 2,278 |
| TripAdvisor, Inc. (a) | | 277,000 | 13,374 |
| | | | 15,652 |
| Media - 2.9% | | | |
| Interpublic Group of Companies, Inc. | | 1,379,234 | 33,198 |
| Starz Series A (a) | | 792,000 | 26,817 |
| Viacom, Inc. Class B (non-vtg.) | | 412,900 | 15,475 |
| | | | 75,490 |
| Multiline Retail - 0.9% | | | |
| Dollar Tree, Inc. (a) | | 254,000 | 22,393 |
| Specialty Retail - 7.7% | | | |
| AutoZone, Inc. (a) | | 79,600 | 62,341 |
| L Brands, Inc. | | 335,000 | 23,524 |
| O'Reilly Automotive, Inc. (a) | | 242,000 | 66,419 |
| Ross Stores, Inc. | | 644,325 | 43,550 |
| | | | 195,834 |
| Textiles, Apparel & Luxury Goods - 1.1% | | | |
| Hanesbrands, Inc. | | 750,000 | 17,423 |
| VF Corp. | | 197,300 | 10,755 |
| | | | 28,178 |
|
| TOTAL CONSUMER DISCRETIONARY | | | 552,660 |
|
| CONSUMER STAPLES - 6.4% | | | |
| Beverages - 1.6% | | | |
| Dr. Pepper Snapple Group, Inc. | | 310,200 | 26,907 |
| Monster Beverage Corp. (a) | | 285,000 | 12,754 |
| | | | 39,661 |
| Food & Staples Retailing - 0.3% | | | |
| Kroger Co. | | 190,000 | 6,137 |
| Rite Aid Corp. (a) | | 175,000 | 1,393 |
| | | | 7,530 |
| Food Products - 2.6% | | | |
| Campbell Soup Co. | | 268,000 | 15,247 |
| Mead Johnson Nutrition Co. Class A | | 253,000 | 18,239 |
| The Hershey Co. | | 345,206 | 33,361 |
| | | | 66,847 |
| Personal Products - 1.2% | | | |
| Coty, Inc. Class A | | 802,000 | 15,005 |
| Estee Lauder Companies, Inc. Class A | | 207,000 | 16,084 |
| | | | 31,089 |
| Tobacco - 0.7% | | | |
| Reynolds American, Inc. | | 317,000 | 17,150 |
|
| TOTAL CONSUMER STAPLES | | | 162,277 |
|
| ENERGY - 0.5% | | | |
| Oil, Gas & Consumable Fuels - 0.5% | | | |
| Tesoro Corp. (b) | | 165,900 | 13,496 |
| FINANCIALS - 8.1% | | | |
| Banks - 2.3% | | | |
| Citizens Financial Group, Inc. | | 1,213,000 | 40,648 |
| Huntington Bancshares, Inc. | | 318,100 | 3,964 |
| Investors Bancorp, Inc. | | 940,000 | 12,728 |
| | | | 57,340 |
| Capital Markets - 2.4% | | | |
| MarketAxess Holdings, Inc. | | 30,500 | 5,056 |
| Moody's Corp. | | 365,734 | 36,756 |
| S&P Global, Inc. | | 168,000 | 19,990 |
| | | | 61,802 |
| Consumer Finance - 0.0% | | | |
| Credit Acceptance Corp. (a)(b) | | 300 | 58 |
| Diversified Financial Services - 0.6% | | | |
| Valvoline, Inc. (b) | | 713,000 | 14,966 |
| Insurance - 2.8% | | | |
| AmTrust Financial Services, Inc. | | 834,000 | 21,234 |
| Aon PLC | | 113,500 | 12,950 |
| Arch Capital Group Ltd. (a) | | 290,000 | 23,989 |
| Progressive Corp. | | 417,000 | 13,886 |
| | | | 72,059 |
|
| TOTAL FINANCIALS | | | 206,225 |
|
| HEALTH CARE - 14.6% | | | |
| Health Care Equipment & Supplies - 4.1% | | | |
| Edwards Lifesciences Corp. (a) | | 467,000 | 38,691 |
| Intuitive Surgical, Inc. (a) | | 56,400 | 36,307 |
| ResMed, Inc. (b) | | 499,700 | 30,722 |
| | | | 105,720 |
| Health Care Providers & Services - 7.5% | | | |
| Aetna, Inc. | | 46,000 | 6,019 |
| AmerisourceBergen Corp. | | 500,087 | 39,002 |
| Cardinal Health, Inc. | | 278,000 | 19,741 |
| Cigna Corp. | | 95,000 | 12,800 |
| DaVita HealthCare Partners, Inc. (a) | | 330,000 | 20,906 |
| HCA Holdings, Inc. (a) | | 280,000 | 19,849 |
| Henry Schein, Inc. (a) | | 119,166 | 17,751 |
| Laboratory Corp. of America Holdings (a) | | 128,000 | 16,109 |
| MEDNAX, Inc. (a) | | 288,940 | 18,917 |
| Universal Health Services, Inc. Class B | | 164,500 | 20,237 |
| | | | 191,331 |
| Life Sciences Tools & Services - 2.1% | | | |
| Charles River Laboratories International, Inc. (a) | | 339,300 | 24,124 |
| Mettler-Toledo International, Inc. (a) | | 72,800 | 29,995 |
| | | | 54,119 |
| Pharmaceuticals - 0.9% | | | |
| Jazz Pharmaceuticals PLC (a) | | 215,088 | 22,290 |
|
| TOTAL HEALTH CARE | | | 373,460 |
|
| INDUSTRIALS - 15.3% | | | |
| Aerospace & Defense - 3.5% | | | |
| Huntington Ingalls Industries, Inc. | | 201,000 | 35,931 |
| TransDigm Group, Inc. | | 213,425 | 53,661 |
| | | | 89,592 |
| Airlines - 1.3% | | | |
| Alaska Air Group, Inc. | | 170,000 | 13,986 |
| JetBlue Airways Corp. (a) | | 1,001,000 | 20,110 |
| | | | 34,096 |
| Commercial Services & Supplies - 1.2% | | | |
| Deluxe Corp. | | 217,000 | 14,691 |
| KAR Auction Services, Inc. | | 385,000 | 16,232 |
| | | | 30,923 |
| Electrical Equipment - 0.9% | | | |
| AMETEK, Inc. | | 480,000 | 22,728 |
| Industrial Conglomerates - 1.4% | | | |
| Roper Technologies, Inc. | | 195,597 | 35,425 |
| Machinery - 2.9% | | | |
| IDEX Corp. | | 230,000 | 21,530 |
| Toro Co. | | 365,024 | 19,321 |
| Wabtec Corp. (b) | | 379,400 | 32,124 |
| | | | 72,975 |
| Professional Services - 3.5% | | | |
| Equifax, Inc. | | 570,000 | 65,237 |
| Verisk Analytics, Inc. (a) | | 298,700 | 24,816 |
| | | | 90,053 |
| Trading Companies & Distributors - 0.6% | | | |
| W.W. Grainger, Inc. (b) | | 63,900 | 14,733 |
|
| TOTAL INDUSTRIALS | | | 390,525 |
|
| INFORMATION TECHNOLOGY - 24.6% | | | |
| Communications Equipment - 0.9% | | | |
| F5 Networks, Inc. (a) | | 154,217 | 21,706 |
| Electronic Equipment & Components - 1.4% | | | |
| Amphenol Corp. Class A | | 507,662 | 34,653 |
| Internet Software & Services - 2.2% | | | |
| VeriSign, Inc. (a)(b) | | 708,200 | 55,842 |
| IT Services - 9.8% | | | |
| Amdocs Ltd. | | 360,600 | 21,265 |
| Broadridge Financial Solutions, Inc. | | 477,014 | 30,882 |
| CoreLogic, Inc. (a) | | 104,000 | 3,924 |
| Fiserv, Inc. (a) | | 457,853 | 47,901 |
| FleetCor Technologies, Inc. (a) | | 152,100 | 22,715 |
| Genpact Ltd. (a) | | 314,373 | 7,523 |
| Global Payments, Inc. | | 650,000 | 44,558 |
| Paychex, Inc. | | 332,983 | 19,629 |
| Total System Services, Inc. | | 1,081,000 | 53,207 |
| | | | 251,604 |
| Semiconductors & Semiconductor Equipment - 5.1% | | | |
| Broadcom Ltd. | | 114,100 | 19,453 |
| KLA-Tencor Corp. | | 124,695 | 9,956 |
| Lam Research Corp. | | 407,500 | 43,203 |
| NXP Semiconductors NV (a) | | 296,285 | 29,377 |
| Skyworks Solutions, Inc. | | 378,700 | 29,103 |
| | | | 131,092 |
| Software - 5.2% | | | |
| Adobe Systems, Inc. (a) | | 102,000 | 10,487 |
| Check Point Software Technologies Ltd. (a) | | 300,264 | 24,721 |
| Electronic Arts, Inc. (a) | | 732,900 | 58,075 |
| Intuit, Inc. | | 180,000 | 20,462 |
| Manhattan Associates, Inc. (a) | | 384,000 | 20,122 |
| | | | 133,867 |
|
| TOTAL INFORMATION TECHNOLOGY | | | 628,764 |
|
| MATERIALS - 4.2% | | | |
| Chemicals - 3.2% | | | |
| Eastman Chemical Co. | | 211,000 | 15,850 |
| Sherwin-Williams Co. | | 126,084 | 33,875 |
| The Scotts Miracle-Gro Co. Class A | | 186,097 | 16,985 |
| Valspar Corp. | | 136,990 | 13,985 |
| | | | 80,695 |
| Containers & Packaging - 1.0% | | | |
| Ball Corp. | | 350,000 | 26,271 |
|
| TOTAL MATERIALS | | | 106,966 |
|
| REAL ESTATE - 3.6% | | | |
| Equity Real Estate Investment Trusts (REITs) - 3.4% | | | |
| Coresite Realty Corp. | | 226,000 | 15,940 |
| Digital Realty Trust, Inc. | | 226,000 | 20,867 |
| Equinix, Inc. | | 49,500 | 16,769 |
| Equity Lifestyle Properties, Inc. | | 85,457 | 5,933 |
| Extra Space Storage, Inc. | | 391,626 | 27,476 |
| | | | 86,985 |
| Real Estate Management & Development - 0.2% | | | |
| CBRE Group, Inc. (a) | | 214,900 | 6,241 |
|
| TOTAL REAL ESTATE | | | 93,226 |
|
| TOTAL COMMON STOCKS | | | |
| (Cost $2,483,871) | | | 2,527,599 |
|
| Money Market Funds - 6.1% | | | |
| Fidelity Cash Central Fund, 0.39% (c) | | 50,897,877 | 50,908 |
| Fidelity Securities Lending Cash Central Fund 0.48% (c)(d) | | 104,126,158 | 104,147 |
| TOTAL MONEY MARKET FUNDS | | | |
| (Cost $155,056) | | | 155,055 |
| TOTAL INVESTMENT PORTFOLIO - 105.0% | | | |
| (Cost $2,638,927) | | | 2,682,654 |
| NET OTHER ASSETS (LIABILITIES) - (5.0)% | | | (127,578) |
| NET ASSETS - 100% | | | $2,555,076 |
Legend
(a) Non-income producing
(b) Security or a portion of the security is on loan at period end.
(c) Affiliated fund that is generally available only to investment companies and other accounts managed by Fidelity Investments. The rate quoted is the annualized seven-day yield of the fund at period end. A complete unaudited listing of the fund's holdings as of its most recent quarter end is available upon request. In addition, each Fidelity Central Fund's financial statements, which are not covered by the Fund's Report of Independent Registered Public Accounting Firm, are available on the SEC's website or upon request.
(d) Investment made with cash collateral received from securities on loan.
Affiliated Central Funds
Information regarding fiscal year to date income earned by the Fund from investments in Fidelity Central Funds is as follows:
| Fund | Income earned |
| | (Amounts in thousands) |
| Fidelity Cash Central Fund | $138 |
| Fidelity Securities Lending Cash Central Fund | 1,840 |
| Total | $1,978 |
Investment Valuation
All investments are categorized as Level 1 under the Fair Value Hierarchy. The inputs or methodology used for valuing securities may not be an indication of the risk associated with investing in those securities. For more information on valuation inputs please refer to the Investment Valuation section in the accompanying Notes to Financial Statements.
See accompanying notes which are an integral part of the financial statements.
Financial Statements
Statement of Assets and Liabilities
| Amounts in thousands (except per-share amounts) | | November 30, 2016 |
| Assets | | |
Investment in securities, at value (including securities loaned of $101,582) — See accompanying schedule:
Unaffiliated issuers (cost $2,483,871) | $2,527,599 | |
| Fidelity Central Funds (cost $155,056) | 155,055 | |
| Total Investments (cost $2,638,927) | | $2,682,654 |
| Receivable for investments sold | | 45,725 |
| Receivable for fund shares sold | | 1,091 |
| Dividends receivable | | 2,933 |
| Distributions receivable from Fidelity Central Funds | | 79 |
| Prepaid expenses | | 7 |
| Other receivables | | 71 |
| Total assets | | 2,732,560 |
| Liabilities | | |
| Payable to custodian bank | $1,370 | |
| Payable for investments purchased | 67,194 | |
| Payable for fund shares redeemed | 2,917 | |
| Accrued management fee | 1,283 | |
| Other affiliated payables | 449 | |
| Other payables and accrued expenses | 143 | |
| Collateral on securities loaned, at value | 104,128 | |
| Total liabilities | | 177,484 |
| Net Assets | | $2,555,076 |
| Net Assets consist of: | | |
| Paid in capital | | $2,613,601 |
| Undistributed net investment income | | 11,987 |
| Accumulated undistributed net realized gain (loss) on investments | | (114,239) |
| Net unrealized appreciation (depreciation) on investments | | 43,727 |
| Net Assets | | $2,555,076 |
| Growth Strategies: | | |
| Net Asset Value, offering price and redemption price per share ($2,080,302 ÷ 61,422 shares) | | $33.87 |
| Class K: | | |
| Net Asset Value, offering price and redemption price per share ($474,774 ÷ 13,907 shares) | | $34.14 |
See accompanying notes which are an integral part of the financial statements.
Statement of Operations
| Amounts in thousands | | Year ended November 30, 2016 |
| Investment Income | | |
| Dividends | | $34,352 |
| Special dividends | | 4,212 |
| Income from Fidelity Central Funds | | 1,978 |
| Total income | | 40,542 |
| Expenses | | |
| Management fee | | |
| Basic fee | $16,992 | |
| Performance adjustment | 2,825 | |
| Transfer agent fees | 4,892 | |
| Accounting and security lending fees | 853 | |
| Custodian fees and expenses | 89 | |
| Independent trustees' fees and expenses | 13 | |
| Registration fees | 68 | |
| Audit | 61 | |
| Legal | 13 | |
| Miscellaneous | 24 | |
| Total expenses before reductions | 25,830 | |
| Expense reductions | (37) | 25,793 |
| Net investment income (loss) | | 14,749 |
| Realized and Unrealized Gain (Loss) | | |
| Net realized gain (loss) on: | | |
| Investment securities: | | |
| Unaffiliated issuers | 446,630 | |
| Fidelity Central Funds | 24 | |
| Total net realized gain (loss) | | 446,654 |
| Change in net unrealized appreciation (depreciation) on investment securities | | (468,799) |
| Net gain (loss) | | (22,145) |
| Net increase (decrease) in net assets resulting from operations | | $(7,396) |
See accompanying notes which are an integral part of the financial statements.
Statement of Changes in Net Assets
| Amounts in thousands | Year ended November 30, 2016 | Year ended November 30, 2015 |
| Increase (Decrease) in Net Assets | | |
| Operations | | |
| Net investment income (loss) | $14,749 | $4,820 |
| Net realized gain (loss) | 446,654 | 118,840 |
| Change in net unrealized appreciation (depreciation) | (468,799) | 15,704 |
| Net increase (decrease) in net assets resulting from operations | (7,396) | 139,364 |
| Distributions to shareholders from net investment income | (5,195) | (7,023) |
| Distributions to shareholders from net realized gain | – | (561) |
| Total distributions | (5,195) | (7,584) |
| Share transactions - net increase (decrease) | (665,611) | 880,713 |
| Redemption fees | 199 | 404 |
| Total increase (decrease) in net assets | (678,003) | 1,012,897 |
| Net Assets | | |
| Beginning of period | 3,233,079 | 2,220,182 |
| End of period | $2,555,076 | $3,233,079 |
| Other Information | | |
| Undistributed net investment income end of period | $11,987 | $3,212 |
See accompanying notes which are an integral part of the financial statements.
Financial Highlights — Fidelity Growth Strategies Fund
| Years ended November 30, | 2016 | 2015 | 2014 | 2013 | 2012 |
| Selected Per–Share Data | | | | | |
| Net asset value, beginning of period | $33.91 | $32.44 | $27.66 | $20.56 | $19.05 |
| Income from Investment Operations | | | | | |
| Net investment income (loss)A | .16B | .04 | .11 | .09 | .02C |
| Net realized and unrealized gain (loss) | (.16) | 1.53 | 4.72 | 7.10 | 1.49 |
| Total from investment operations | – | 1.57 | 4.83 | 7.19 | 1.51 |
| Distributions from net investment income | (.04) | (.09) | (.05) | (.07)D | – |
| Distributions from net realized gain | – | (.01) | – | (.02)D | – |
| Total distributions | (.04) | (.10) | (.05) | (.09) | – |
| Redemption fees added to paid in capitalA,E | – | – | – | – | – |
| Net asset value, end of period | $33.87 | $33.91 | $32.44 | $27.66 | $20.56 |
| Total ReturnF | .02% | 4.86% | 17.50% | 35.13% | 7.93% |
| Ratios to Average Net AssetsG,H | | | | | |
| Expenses before reductions | .94% | .91% | .72% | .71% | .73% |
| Expenses net of fee waivers, if any | .94% | .91% | .72% | .71% | .73% |
| Expenses net of all reductions | .94% | .91% | .72% | .69% | .72% |
| Net investment income (loss) | .49%B | .13% | .37% | .39% | .09%C |
| Supplemental Data | | | | | |
| Net assets, end of period (in millions) | $2,080 | $2,535 | $1,835 | $1,640 | $1,385 |
| Portfolio turnover rateI | 63% | 40% | 58% | 87% | 165% |
A Calculated based on average shares outstanding during the period.
B Net Investment income per share reflects a large, non-recurring dividend which amounted to $.05 per share. Excluding this non-recurring dividend, the ratio of net investment income (loss) to average net assets would have been .34%.
C Net Investment income per share reflects a large, non-recurring dividend which amounted to $.02 per share. Excluding this non-recurring dividend, the ratio of net investment income (loss) to average net assets would have been .00 %.
D The amounts shown reflect certain reclassifications related to book to tax differences that were made in the year shown.
E Amount represents less than $.005 per share.
F Total returns would have been lower if certain expenses had not been reduced during the applicable periods shown.
G Fees and expenses of any underlying Fidelity Central Funds are not included in the Fund's expense ratio. The Fund indirectly bears its proportionate share of the expenses of any underlying Fidelity Central Funds.
H Expense ratios reflect operating expenses of the class. Expenses before reductions do not reflect amounts reimbursed by the investment adviser or reductions from brokerage service arrangements or reductions from other expense offset arrangements and do not represent the amount paid by the class during periods when reimbursements or reductions occur. Expenses net of fee waivers reflect expenses after reimbursement by the investment adviser but prior to reductions from brokerage service arrangements or other expense offset arrangements. Expenses net of all reductions represent the net expenses paid by the class.
I Amount does not include the portfolio activity of any underlying Fidelity Central Funds.
See accompanying notes which are an integral part of the financial statements.
Financial Highlights — Fidelity Growth Strategies Fund Class K
| Years ended November 30, | 2016 | 2015 | 2014 | 2013 | 2012 |
| Selected Per–Share Data | | | | | |
| Net asset value, beginning of period | $34.17 | $32.70 | $27.88 | $20.74 | $19.17 |
| Income from Investment Operations | | | | | |
| Net investment income (loss)A | .21B | .10 | .17 | .15 | .07C |
| Net realized and unrealized gain (loss) | (.14) | 1.52 | 4.76 | 7.14 | 1.50 |
| Total from investment operations | .07 | 1.62 | 4.93 | 7.29 | 1.57 |
| Distributions from net investment income | (.10) | (.15) | (.11) | (.13)D | – |
| Distributions from net realized gain | – | (.01) | – | (.02)D | – |
| Total distributions | (.10) | (.15)E | (.11) | (.15) | – |
| Redemption fees added to paid in capitalA,F | – | – | – | – | – |
| Net asset value, end of period | $34.14 | $34.17 | $32.70 | $27.88 | $20.74 |
| Total ReturnG | .20% | 5.00% | 17.75% | 35.42% | 8.19% |
| Ratios to Average Net AssetsH,I | | | | | |
| Expenses before reductions | .78% | .76% | .53% | .48% | .48% |
| Expenses net of fee waivers, if any | .78% | .76% | .53% | .48% | .48% |
| Expenses net of all reductions | .78% | .76% | .53% | .46% | .47% |
| Net investment income (loss) | .64%B | .28% | .56% | .62% | .34%C |
| Supplemental Data | | | | | |
| Net assets, end of period (in millions) | $475 | $699 | $385 | $342 | $274 |
| Portfolio turnover rateJ | 63% | 40% | 58% | 87% | 165% |
A Calculated based on average shares outstanding during the period.
B Net Investment income per share reflects a large, non-recurring dividend which amounted to $.05 per share. Excluding this non-recurring dividend, the ratio of net investment income (loss) to average net assets would have been .50%.
C Net Investment income per share reflects a large, non-recurring dividend which amounted to $.02 per share. Excluding this non-recurring dividend, the ratio of net investment income (loss) to average net assets would have been .25%.
D The amounts shown reflect certain reclassifications related to book to tax differences that were made in the year shown.
E Total distributions of $.15 per share is comprised of distributions from net investment income of $.145 and distributions from net realized gain of $.008 per share.
F Amount represents less than $.005 per share.
G Total returns would have been lower if certain expenses had not been reduced during the applicable periods shown.
H Fees and expenses of any underlying Fidelity Central Funds are not included in the Fund's expense ratio. The Fund indirectly bears its proportionate share of the expenses of any underlying Fidelity Central Funds.
I Expense ratios reflect operating expenses of the class. Expenses before reductions do not reflect amounts reimbursed by the investment adviser or reductions from brokerage service arrangements or reductions from other expense offset arrangements and do not represent the amount paid by the class during periods when reimbursements or reductions occur. Expenses net of fee waivers reflect expenses after reimbursement by the investment adviser but prior to reductions from brokerage service arrangements or other expense offset arrangements. Expenses net of all reductions represent the net expenses paid by the class.
J Amount does not include the portfolio activity of any underlying Fidelity Central Funds.
See accompanying notes which are an integral part of the financial statements.
Notes to Financial Statements
For the period ended November 30, 2016
(Amounts in thousands except percentages)
1. Organization.
Fidelity Growth Strategies Fund (the Fund) is a fund of Fidelity Mt. Vernon Street Trust (the Trust) and is authorized to issue an unlimited number of shares. The Trust is registered under the Investment Company Act of 1940, as amended (the 1940 Act), as an open-end management investment company organized as a Massachusetts business trust. The Fund offers Growth Strategies and Class K shares, each of which has equal rights as to assets and voting privileges. Each class has exclusive voting rights with respect to matters that affect that class.
2. Investments in Fidelity Central Funds.
The Fund invests in Fidelity Central Funds, which are open-end investment companies generally available only to other investment companies and accounts managed by the investment adviser and its affiliates. The Fund's Schedule of Investments lists each of the Fidelity Central Funds held as of period end, if any, as an investment of the Fund, but does not include the underlying holdings of each Fidelity Central Fund. As an Investing Fund, the Fund indirectly bears its proportionate share of the expenses of the underlying Fidelity Central Funds.
The Money Market Central Funds seek preservation of capital and current income and are managed by Fidelity Investments Money Management, Inc. (FIMM), an affiliate of the investment adviser. Annualized expenses of the Money Market Central Funds as of their most recent shareholder report date are less than .005%.
A complete unaudited list of holdings for each Fidelity Central Fund is available upon request or at the Securities and Exchange Commission (the SEC) website at www.sec.gov. In addition, the financial statements of the Fidelity Central Funds, which are not covered by the Fund's Report of Independent Registered Public Accounting Firm, are available on the SEC website or upon request.
3. Significant Accounting Policies.
The financial statements have been prepared in conformity with accounting principles generally accepted in the United States of America (GAAP), which require management to make certain estimates and assumptions at the date of the financial statements. Actual results could differ from those estimates. Subsequent events, if any, through the date that the financial statements were issued have been evaluated in the preparation of the financial statements. The following summarizes the significant accounting policies of the Fund:
Investment Valuation. Investments are valued as of 4:00 p.m. Eastern time on the last calendar day of the period. The Board of Trustees (the Board) has delegated the day to day responsibility for the valuation of the Fund's investments to the Fair Value Committee (the Committee) established by the Fund's investment adviser. In accordance with valuation policies and procedures approved by the Board, the Fund attempts to obtain prices from one or more third party pricing vendors or brokers to value its investments. When current market prices, quotations or currency exchange rates are not readily available or reliable, investments will be fair valued in good faith by the Committee, in accordance with procedures adopted by the Board. Factors used in determining fair value vary by investment type and may include market or investment specific events. The frequency with which these procedures are used cannot be predicted and they may be utilized to a significant extent. The Committee oversees the Fund's valuation policies and procedures and reports to the Board on the Committee's activities and fair value determinations. The Board monitors the appropriateness of the procedures used in valuing the Fund's investments and ratifies the fair value determinations of the Committee.
The Fund categorizes the inputs to valuation techniques used to value its investments into a disclosure hierarchy consisting of three levels as shown below:
- Level 1 – quoted prices in active markets for identical investments
- Level 2 – other significant observable inputs (including quoted prices for similar investments, interest rates, prepayment speeds, etc.)
- Level 3 – unobservable inputs (including the Fund's own assumptions based on the best information available)
Valuation techniques used to value the Fund's investments by major category are as follows:
Equity securities, including restricted securities, for which market quotations are readily available, are valued at the last reported sale price or official closing price as reported by a third party pricing vendor on the primary market or exchange on which they are traded and are categorized as Level 1 in the hierarchy. In the event there were no sales during the day or closing prices are not available, securities are valued at the last quoted bid price or may be valued using the last available price and are generally categorized as Level 2 in the hierarchy. For foreign equity securities, when market or security specific events arise, comparisons to the valuation of American Depositary Receipts (ADRs), futures contracts, Exchange-Traded Funds (ETFs) and certain indexes as well as quoted prices for similar securities may be used and would be categorized as Level 2 in the hierarchy. Utilizing these techniques may result in transfers between Level 1 and Level 2. For equity securities, including restricted securities, where observable inputs are limited, assumptions about market activity and risk are used and these securities may be categorized as Level 3 in the hierarchy.
Investments in open-end mutual funds, including the Fidelity Central Funds, are valued at their closing net asset value (NAV) each business day and are categorized as Level 1 in the hierarchy.
Changes in valuation techniques may result in transfers in or out of an assigned level within the disclosure hierarchy.
Investment Transactions and Income. For financial reporting purposes, the Fund's investment holdings and NAV include trades executed through the end of the last business day of the period. The NAV per share for processing shareholder transactions is calculated as of the close of business of the New York Stock Exchange (NYSE), normally 4:00 p.m. Eastern time and includes trades executed through the end of the prior business day. Gains and losses on securities sold are determined on the basis of identified cost and may include proceeds received from litigation. Dividend income is recorded on the ex-dividend date, except for certain dividends from foreign securities where the ex-dividend date may have passed, which are recorded as soon as the Fund is informed of the ex-dividend date. Non-cash dividends included in dividend income, if any, are recorded at the fair market value of the securities received. Income and capital gain distributions from Fidelity Central Funds, if any, are recorded on the ex-dividend date. Certain distributions received by the Fund represent a return of capital or capital gain. The Fund determines the components of these distributions subsequent to the ex-dividend date, based upon receipt of tax filings or other correspondence relating to the underlying investment. These distributions are recorded as a reduction of cost of investments and/or as a realized gain. Large, non-recurring dividends recognized by the Fund are presented separately on the Statement of Operations as "Special Dividends" and the impact of these dividends is presented in the Financial Highlights.
Class Allocations and Expenses. Investment income, realized and unrealized capital gains and losses, common expenses of the Fund, and certain fund-level expense reductions, if any, are allocated daily on a pro-rata basis to each class based on the relative net assets of each class to the total net assets of the Fund. Each class differs with respect to transfer agent fees incurred. Certain expense reductions may also differ by class. For the reporting period, the allocated portion of income and expenses to each class as a percent of its average net assets may vary due to the timing of recording these transactions in relation to fluctuating net assets of the classes. Expenses directly attributable to a fund are charged to that fund. Expenses attributable to more than one fund are allocated among the respective funds on the basis of relative net assets or other appropriate methods. Expense estimates are accrued in the period to which they relate and adjustments are made when actual amounts are known.
Deferred Trustee Compensation. Under a Deferred Compensation Plan (the Plan), independent Trustees may elect to defer receipt of a portion of their annual compensation. Deferred amounts are invested in a cross-section of Fidelity funds, are marked-to-market and remain in the Fund until distributed in accordance with the Plan. The investment of deferred amounts and the offsetting payable to the Trustees are included in the accompanying Statement of Assets and Liabilities.
Income Tax Information and Distributions to Shareholders. Each year, the Fund intends to qualify as a regulated investment company under Subchapter M of the Internal Revenue Code, including distributing substantially all of its taxable income and realized gains. As a result, no provision for U.S. Federal income taxes is required. As of November 30, 2016, the Fund did not have any unrecognized tax benefits in the financial statements; nor is the Fund aware of any tax positions for which it is reasonably possible that the total amounts of unrecognized tax benefits will significantly change in the next twelve months. The Fund files a U.S. federal tax return, in addition to state and local tax returns as required. The Fund's federal income tax returns are subject to examination by the Internal Revenue Service (IRS) for a period of three fiscal years after they are filed. State and local tax returns may be subject to examination for an additional fiscal year depending on the jurisdiction.
Distributions are declared and recorded on the ex-dividend date. Income dividends and capital gain distributions are declared separately for each class. Income and capital gain distributions are determined in accordance with income tax regulations, which may differ from GAAP.
Capital accounts within the financial statements are adjusted for permanent book-tax differences. These adjustments have no impact on net assets or the results of operations. Capital accounts are not adjusted for temporary book-tax differences which will reverse in a subsequent period.
Book-tax differences are primarily due to partnerships, deferred trustees compensation, capital loss carryforwards, and losses deferred due to wash sales.
The federal tax cost of investment securities and unrealized appreciation (depreciation) as of period end were as follows:
| Gross unrealized appreciation | $176,837 |
| Gross unrealized depreciation | (133,110) |
| Net unrealized appreciation (depreciation) on securities | $43,727 |
| Tax Cost | $2,638,927 |
The tax-based components of distributable earnings as of period end were as follows:
| Undistributed ordinary income | $12,949 |
| Capital loss carryforward | $(115,128) |
| Net unrealized appreciation (depreciation) on securities and other investments | $43,727 |
Capital loss carryforwards are only available to offset future capital gains of the Fund to the extent provided by regulations and may be limited. Under the Regulated Investment Company Modernization Act of 2010 (the Act), the Fund is permitted to carry forward capital losses incurred in taxable years beginning after December 22, 2010 for an unlimited period and such capital losses are required to be used prior to any losses that expire. The capital loss carryforward information presented below, including any applicable limitation, is estimated as of fiscal period end and is subject to adjustment.
| Fiscal year of expiration | |
| 2017 | $(115,128) |
The tax character of distributions paid was as follows:
| | November 30, 2016 | November 30, 2015 |
| Ordinary Income | $5,195 | $ 7,584 |
Short-Term Trading (Redemption) Fees. Shares held by investors in the Fund less than 90 days may have been subject to a redemption fee equal to 1.50% of the NAV of shares redeemed. All redemption fees, which reduce the proceeds of the shareholder redemption, are retained by the Fund and accounted for as an addition to paid in capital. In November 2016, the Board of Trustees approved the elimination of these redemption fees effective December 12, 2016.
4. Purchases and Sales of Investments.
Purchases and sales of securities, other than short-term securities, aggregated $1,773,154 and $2,416,125, respectively.
5. Fees and Other Transactions with Affiliates.
Management Fee. Fidelity Management & Research Company (the investment adviser) and its affiliates provide the Fund with investment management related services for which the Fund pays a monthly management fee. The management fee is the sum of an individual fund fee rate that is based on an annual rate of .35% of the Fund's average net assets and an annualized group fee rate that averaged .25% during the period. The group fee rate is based upon the average net assets of all the mutual funds advised by the investment adviser, including any mutual funds previously advised by the investment adviser that are currently advised by Fidelity SelectCo, LLC, an affiliate of the investment adviser. The group fee rate decreases as assets under management increase and increases as assets under management decrease. In addition, the management fee is subject to a performance adjustment (up to a maximum of +/- .20% of the Fund's average net assets over a 36 month performance period). The upward or downward adjustment to the management fee is based on the relative investment performance of Growth Strategies as compared to its benchmark index, the Russell Midcap Growth Index, over the same 36 month performance period. For the reporting period, the total annual management fee rate, including the performance adjustment, was .70% of the Fund's average net assets. The performance adjustment included in the management fee rate may be higher or lower than the maximum performance adjustment rate due to the difference between the average net assets for the reporting and performance periods.
Effective February 1, 2017, the Board of Trustees approved a reduction in the individual fund fee rate from .35% to .30%.
Transfer Agent Fees. Fidelity Investments Institutional Operations Company, Inc., (FIIOC), an affiliate of the investment adviser, is the transfer, dividend disbursing and shareholder servicing agent for each class of the Fund. FIIOC receives account fees and asset-based fees that vary according to the account size and type of account of the shareholders of Growth Strategies. FIIOC receives an asset-based fee of Class K's average net assets. FIIOC pays for typesetting, printing and mailing of shareholder reports, except proxy statements.
For the period, transfer agent fees for each class were as follows:
| | Amount | % of
Class-Level Average
Net Assets |
| Growth Strategies | $4,610 | .21 |
| Class K | 282 | .05 |
| | $4,892 | |
Accounting and Security Lending Fees. Fidelity Service Company, Inc. (FSC), an affiliate of the investment adviser, maintains the Fund's accounting records. The accounting fee is based on the level of average net assets for each month. Under a separate contract, FSC administers the security lending program. The security lending fee is based on the number and duration of lending transactions.
Brokerage Commissions. The Fund placed a portion of its portfolio transactions with brokerage firms which are affiliates of the investment adviser. Brokerage commissions are included in net realized gain (loss) and change in net unrealized appreciation (depreciation) in the Statement of Operations. The commissions paid to these affiliated firms were $62 for the period.
Interfund Trades. The Fund may purchase from or sell securities to other Fidelity Funds under procedures adopted by the Board. The procedures have been designed to ensure these interfund trades are executed in accordance with Rule 17a-7 of the 1940 Act. Interfund trades are included within the respective purchases and sales amounts shown in the Purchases and Sales of Investments note.
Other. During the period, the investment adviser reimbursed the Fund for certain losses in the amount of $1.
6. Committed Line of Credit.
The Fund participates with other funds managed by the investment adviser or an affiliate in a $4.25 billion credit facility (the "line of credit") to be utilized for temporary or emergency purposes to fund shareholder redemptions or for other short-term liquidity purposes. The Fund has agreed to pay commitment fees on its pro-rata portion of the line of credit, which amounted to $7 and is reflected in Miscellaneous expenses on the Statement of Operations. Interest is charged to the Fund based on its borrowing at a rate equal to .75% plus the higher of the Federal Funds Rate or one-month LIBOR. The Fund's average daily loan balance during the period for which loans were outstanding amounted to $5,000. The weighted average interest rate and interest expense was 1.037% and less than five hundred dollars, respectively.
7. Security Lending.
The Fund lends portfolio securities through a lending agent from time to time in order to earn additional income. For equity securities, a lending agent is used and may loan securities to certain qualified borrowers, including Fidelity Capital Markets (FCM), a broker-dealer affiliated with the Fund. On the settlement date of the loan, the Fund receives collateral (in the form of U.S. Treasury obligations, letters of credit and/or cash) against the loaned securities and maintains collateral in an amount not less than 100% of the market value of the loaned securities during the period of the loan. The market value of the loaned securities is determined at the close of business of the Fund and any additional required collateral is delivered to the Fund on the next business day. The Fund or borrower may terminate the loan at any time, and if the borrower defaults on its obligation to return the securities loaned because of insolvency or other reasons, the Fund may apply collateral received from the borrower against the obligation. The Fund may experience delays and costs in recovering the securities loaned. Any cash collateral received is invested in the Fidelity Securities Lending Cash Central Fund. The value of loaned securities and cash collateral at period end are disclosed on the Fund's Statement of Assets and Liabilities. At period end, there were no security loans outstanding with FCM. Security lending income represents the income earned on investing cash collateral, less rebates paid to borrowers and any lending agent fees associated with the loan, plus any premium payments received for lending certain types of securities. Security lending income is presented in the Statement of Operations as a component of income from Fidelity Central Funds. Total security lending income during the period amounted to $1,840, including $9 from securities loaned to FCM.
8. Expense Reductions.
Commissions paid to certain brokers with whom the investment adviser, or its affiliates, places trades on behalf of the Fund include an amount in addition to trade execution, which may be rebated back to the Fund to offset certain expenses. This amount totaled $14 for the period.
In addition, during the period the investment adviser reimbursed and/or waived a portion of fund-level operating expenses in the amount of $23.
9. Distributions to Shareholders.
Distributions to shareholders of each class were as follows:
| | Year ended
November 30, 2016 | Year ended
November 30, 2015 |
| From net investment income | | |
| Growth Strategies | $3,237 | $5,313 |
| Class K | 1,958 | 1,710 |
| Total | $5,195 | $7,023 |
| From net realized gain | | |
| Growth Strategies | $– | $467 |
| Class K | – | 94 |
| Total | $– | $561 |
10. Share Transactions.
Share transactions for each class were as follows and may contain automatic conversions between classes or exchanges between affiliated funds:
| | Shares | Shares | Dollars | Dollars |
| | Year ended November 30, 2016 | Year ended November 30, 2015 | Year ended November 30, 2016 | Year ended November 30, 2015 |
| Growth Strategies | | | | |
| Shares sold | 6,979 | 28,968 | $228,892 | $964,524 |
| Reinvestment of distributions | 94 | 179 | 3,102 | 5,600 |
| Shares redeemed | (20,401) | (10,968) | (674,632) | (368,991) |
| Net increase (decrease) | (13,328) | 18,179 | $(442,638) | $601,133 |
| Class K | | | | |
| Shares sold | 3,172 | 12,315 | $103,937 | $404,341 |
| Reinvestment of distributions | 59 | 57 | 1,958 | 1,804 |
| Shares redeemed | (9,765) | (3,697) | (328,868) | (126,565) |
| Net increase (decrease) | (6,534) | 8,675 | $(222,973) | $279,580 |
11. Other.
The Fund's organizational documents provide former and current trustees and officers with a limited indemnification against liabilities arising in connection with the performance of their duties to the Fund. In the normal course of business, the Fund may also enter into contracts that provide general indemnifications. The Fund's maximum exposure under these arrangements is unknown as this would be dependent on future claims that may be made against the Fund. The risk of material loss from such claims is considered remote.
Report of Independent Registered Public Accounting Firm
To the Trustees of Fidelity Mt. Vernon Street Trust and Shareholders of Fidelity Growth Strategies Fund:
In our opinion, the accompanying statement of assets and liabilities, including the schedule of investments, and the related statements of operations and of changes in net assets and the financial highlights present fairly, in all material respects, the financial position of Fidelity Growth Strategies Fund (a fund of Fidelity Mt. Vernon Street Trust) at November 30, 2016, the results of its operations for the year then ended, the changes in its net assets for each of the two years in the period then ended and the financial highlights for each of the five years in the period then ended, in conformity with accounting principles generally accepted in the United States of America. These financial statements and financial highlights (hereafter referred to as “financial statements”) are the responsibility of the Fidelity Growth Strategies Fund’s management. Our responsibility is to express an opinion on these financial statements based on our audits. We conducted our audits of these financial statements in accordance with the standards of the Public Company Accounting Oversight Board (United States). Those standards require that we plan and perform the audit to obtain reasonable assurance about whether the financial statements are free of material misstatement. An audit includes examining, on a test basis, evidence supporting the amounts and disclosures in the financial statements, assessing the accounting principles used and significant estimates made by management, and evaluating the overall financial statement presentation. We believe that our audits, which included confirmation of securities at November 30, 2016 by correspondence with the custodian and brokers, provide a reasonable basis for our opinion.
PricewaterhouseCoopers LLP
Boston, Massachusetts
January 18, 2017
Trustees and Officers
The Trustees, Members of the Advisory Board (if any), and officers of the trust and fund, as applicable, are listed below. The Board of Trustees governs the fund and is responsible for protecting the interests of shareholders. The Trustees are experienced executives who meet periodically throughout the year to oversee the fund's activities, review contractual arrangements with companies that provide services to the fund, oversee management of the risks associated with such activities and contractual arrangements, and review the fund's performance. Each of the Trustees oversees 170 funds.
The Trustees hold office without limit in time except that (a) any Trustee may resign; (b) any Trustee may be removed by written instrument, signed by at least two-thirds of the number of Trustees prior to such removal; (c) any Trustee who requests to be retired or who has become incapacitated by illness or injury may be retired by written instrument signed by a majority of the other Trustees; and (d) any Trustee may be removed at any special meeting of shareholders by a two-thirds vote of the outstanding voting securities of the trust. Each Trustee who is not an interested person (as defined in the 1940 Act) of the trust and the fund is referred to herein as an Independent Trustee. Each Independent Trustee shall retire not later than the last day of the calendar year in which his or her 75th birthday occurs. The Independent Trustees may waive this mandatory retirement age policy with respect to individual Trustees. Officers and Advisory Board Members hold office without limit in time, except that any officer or Advisory Board Member may resign or may be removed by a vote of a majority of the Trustees at any regular meeting or any special meeting of the Trustees. Except as indicated, each individual has held the office shown or other offices in the same company for the past five years.
The fund’s Statement of Additional Information (SAI) includes more information about the Trustees. To request a free copy, call Fidelity at 1-800-835-5092.
Experience, Skills, Attributes, and Qualifications of the Trustees. The Governance and Nominating Committee has adopted a statement of policy that describes the experience, qualifications, attributes, and skills that are necessary and desirable for potential Independent Trustee candidates (Statement of Policy). The Board believes that each Trustee satisfied at the time he or she was initially elected or appointed a Trustee, and continues to satisfy, the standards contemplated by the Statement of Policy. The Governance and Nominating Committee also engages professional search firms to help identify potential Independent Trustee candidates who have the experience, qualifications, attributes, and skills consistent with the Statement of Policy. From time to time, additional criteria based on the composition and skills of the current Independent Trustees, as well as experience or skills that may be appropriate in light of future changes to board composition, business conditions, and regulatory or other developments, have also been considered by the professional search firms and the Governance and Nominating Committee. In addition, the Board takes into account the Trustees' commitment and participation in Board and committee meetings, as well as their leadership of standing and ad hoc committees throughout their tenure.
In determining that a particular Trustee was and continues to be qualified to serve as a Trustee, the Board has considered a variety of criteria, none of which, in isolation, was controlling. The Board believes that, collectively, the Trustees have balanced and diverse experience, qualifications, attributes, and skills, which allow the Board to operate effectively in governing the fund and protecting the interests of shareholders. Information about the specific experience, skills, attributes, and qualifications of each Trustee, which in each case led to the Board's conclusion that the Trustee should serve (or continue to serve) as a trustee of the fund, is provided below.
Board Structure and Oversight Function. James C. Curvey is an interested person and currently serves as Chairman. The Trustees have determined that an interested Chairman is appropriate and benefits shareholders because an interested Chairman has a personal and professional stake in the quality and continuity of services provided to the fund. Independent Trustees exercise their informed business judgment to appoint an individual of their choosing to serve as Chairman, regardless of whether the Trustee happens to be independent or a member of management. The Independent Trustees have determined that they can act independently and effectively without having an Independent Trustee serve as Chairman and that a key structural component for assuring that they are in a position to do so is for the Independent Trustees to constitute a substantial majority for the Board. The Independent Trustees also regularly meet in executive session. Ned C. Lautenbach serves as Chairman of the Independent Trustees and as such (i) acts as a liaison between the Independent Trustees and management with respect to matters important to the Independent Trustees and (ii) with management prepares agendas for Board meetings.
Fidelity® funds are overseen by different Boards of Trustees. The fund's Board oversees Fidelity's high income and certain equity funds, and other Boards oversee Fidelity's investment-grade bond, money market, asset allocation, and sector funds. The asset allocation funds may invest in Fidelity® funds overseen by the fund's Board. The use of separate Boards, each with its own committee structure, allows the Trustees of each group of Fidelity® funds to focus on the unique issues of the funds they oversee, including common research, investment, and operational issues. On occasion, the separate Boards establish joint committees to address issues of overlapping consequences for the Fidelity® funds overseen by each Board.
The Trustees operate using a system of committees to facilitate the timely and efficient consideration of all matters of importance to the Trustees, the fund, and fund shareholders and to facilitate compliance with legal and regulatory requirements and oversight of the fund's activities and associated risks. The Board, acting through its committees, has charged FMR and its affiliates with (i) identifying events or circumstances the occurrence of which could have demonstrably adverse effects on the fund's business and/or reputation; (ii) implementing processes and controls to lessen the possibility that such events or circumstances occur or to mitigate the effects of such events or circumstances if they do occur; and (iii) creating and maintaining a system designed to evaluate continuously business and market conditions in order to facilitate the identification and implementation processes described in (i) and (ii) above. Because the day-to-day operations and activities of the fund are carried out by or through FMR, its affiliates, and other service providers, the fund's exposure to risks is mitigated but not eliminated by the processes overseen by the Trustees. While each of the Board's committees has responsibility for overseeing different aspects of the fund's activities, oversight is exercised primarily through the Operations, Audit, and Compliance Committees. In addition, the Independent Trustees have worked with FMR to enhance the Board's oversight of investment and financial risks, legal and regulatory risks, technology risks, and operational risks, including the development of additional risk reporting to the Board. For example, a working group comprised of Independent Trustees and FMR has worked and continues to work to review the Fidelity® funds' valuation-related activities, reporting and risk management. Appropriate personnel, including but not limited to the fund's Chief Compliance Officer (CCO), FMR's internal auditor, the independent accountants, the fund's Treasurer and portfolio management personnel, make periodic reports to the Board's committees, as appropriate, including an annual review of Fidelity's risk management program for the Fidelity® funds. The responsibilities of each standing committee, including their oversight responsibilities, are described further under "Standing Committees of the Trustees."
Interested Trustees*:
Correspondence intended for a Trustee who is an interested person may be sent to Fidelity Investments, 245 Summer Street, Boston, Massachusetts 02210.
Name, Year of Birth; Principal Occupations and Other Relevant Experience+
James C. Curvey (1935)
Year of Election or Appointment: 2007
Trustee
Chairman of the Board of Trustees
Mr. Curvey also serves as Trustee of other Fidelity® funds. Mr. Curvey is a Director of Fidelity Research & Analysis Co. (investment adviser firm, 2009-present), and Vice Chairman (2007-present) and Director of FMR LLC (diversified financial services company). In addition, Mr. Curvey serves as an Overseer for the Boston Symphony Orchestra and a member of the board of Artis-Naples, Naples, Florida, and as a Trustee for Brewster Academy, Wolfeboro, New Hampshire. Previously, Mr. Curvey served as a Director of Fidelity Investments Money Management, Inc. (investment adviser firm, 2009-2014) and a Director of FMR and FMR Co., Inc. (investment adviser firms, 2007-2014).
Charles S. Morrison (1960)
Year of Election or Appointment: 2014
Trustee
Mr. Morrison also serves as Trustee of other funds. He serves as President of Fidelity Management & Research Company (FMR) (investment adviser firm, 2016-present), a Director of Fidelity Investments Money Management, Inc. (FIMM) (investment adviser firm, 2014-present), Director of Fidelity SelectCo, LLC (investment adviser firm, 2014-present), President, Asset Management (2014-present), and is an employee of Fidelity Investments. Previously, Mr. Morrison served as Vice President of Fidelity's Fixed Income and Asset Allocation Funds (2012-2014), President, Fixed Income (2011-2014), Vice President of Fidelity's Money Market Funds (2005-2009), President, Money Market Group Leader of FMR (investment adviser firm, 2009), and Senior Vice President, Money Market Group of FMR (2004-2009). Mr. Morrison also served as Vice President of Fidelity's Bond Funds (2002-2005), certain Balanced Funds (2002-2005), and certain Asset Allocation Funds (2002-2007), and as Senior Vice President (2002-2005) of Fidelity's Bond Division.
* Determined to be an “Interested Trustee” by virtue of, among other things, his or her affiliation with the trust or various entities under common control with FMR.
+ The information includes the Trustee's principal occupation during the last five years and other information relating to the experience, attributes, and skills relevant to the Trustee's qualifications to serve as a Trustee, which led to the conclusion that the Trustee should serve as a Trustee for the fund.
Independent Trustees:
Correspondence intended for an Independent Trustee may be sent to Fidelity Investments, P.O. Box 55235, Boston, Massachusetts 02205-5235.
Name, Year of Birth; Principal Occupations and Other Relevant Experience+
Dennis J. Dirks (1948)
Year of Election or Appointment: 2005
Trustee
Mr. Dirks also serves as Trustee of other Fidelity® funds. Prior to his retirement in May 2003, Mr. Dirks was Chief Operating Officer and a member of the Board of The Depository Trust & Clearing Corporation (DTCC). He also served as President, Chief Operating Officer, and Board member of The Depository Trust Company (DTC) and President and Board member of the National Securities Clearing Corporation (NSCC). In addition, Mr. Dirks served as Chief Executive Officer and Board member of the Government Securities Clearing Corporation, Chief Executive Officer and Board member of the Mortgage-Backed Securities Clearing Corporation, as a Trustee and a member of the Finance Committee of Manhattan College (2005-2008), as a Trustee and a member of the Finance Committee of AHRC of Nassau County (2006-2008), and as a member of the Independent Directors Council (IDC) Governing Council (2010-2015). Mr. Dirks is a member of the Board of Directors for The Brookville Center for Children's Services, Inc. (2009-present) and the Finance Committee of the Asolo Repertory Theatre (2016-present).
Alan J. Lacy (1953)
Year of Election or Appointment: 2008
Trustee
Mr. Lacy also serves as Trustee of other Fidelity® funds. Mr. Lacy serves as Chairman (2014-present) and a member (2010-present) of the Board of Directors of Dave & Buster's Entertainment, Inc. (restaurant and entertainment complexes) and a Director of Bristol-Myers Squibb Company (global pharmaceuticals, 2008-present). He is a Trustee of the California Chapter of The Nature Conservancy (2015-present) and a Director of the Center for Advanced Study in the Behavioral Sciences at Stanford University (2015-present). In addition, Mr. Lacy served as Senior Adviser (2007-2014) of Oak Hill Capital Partners, L.P. (private equity) and also served as Chief Executive Officer (2005) and Vice Chairman (2005-2006) of Sears Holdings Corporation (retail) and Chief Executive Officer and Chairman of the Board of Sears, Roebuck and Co. (retail, 2000-2005). Previously, Mr. Lacy served as Chairman (2008-2011) and a member (2006-2015) of the Board of Trustees of the National Parks Conservation Association and as a member of the Board of Directors for The Western Union Company (global money transfer, 2006-2011), The Hillman Companies, Inc. (hardware wholesalers, 2010-2014), and Earth Fare, Inc. (retail grocery, 2010-2014).
Ned C. Lautenbach (1944)
Year of Election or Appointment: 2000
Trustee
Chairman of the Independent Trustees
Mr. Lautenbach also serves as Trustee of other Fidelity® funds. Mr. Lautenbach currently serves as the Lead Director of the Eaton Corporation Board of Directors (diversified industrial, 1997-present). Mr. Lautenbach is Chairman of the Board of Directors of Artis-Naples in Naples, Florida (2012-present), a member of the Council on Foreign Relations (1994-present), and currently Vice Chair of the Board of Governors, State University System of Florida (2013-present). Previously, Mr. Lautenbach was a Partner and Advisory Partner at Clayton, Dubilier & Rice, LLC (private equity investment, 1998-2010), as well as a Director of Sony Corporation (2006-2007). Mr. Lautenbach also had a 30-year career with IBM (technology company) during which time he served as Senior Vice President and a member of the Corporate Executive Committee (1968-1998).
Joseph Mauriello (1944)
Year of Election or Appointment: 2008
Trustee
Mr. Mauriello also serves as Trustee of other Fidelity® funds. Prior to his retirement in January 2006, Mr. Mauriello served in numerous senior management positions including Deputy Chairman and Chief Operating Officer (2004-2005), and Vice Chairman of Financial Services (2002-2004) of KPMG LLP US (professional services, 1965-2005). Mr. Mauriello currently serves as a member of the Board of Directors of XL Group plc. (global insurance and re-insurance, 2006-present) and the Independent Directors Council (IDC) Governing Council (2015-present). Previously, Mr. Mauriello served as a Director of the Hamilton Funds of the Bank of New York (2006-2007) and of Arcadia Resources Inc. (health care services and products, 2007-2012).
Robert W. Selander (1950)
Year of Election or Appointment: 2011
Trustee
Mr. Selander also serves as Trustee of other Fidelity® funds. Mr. Selander serves as a Director of The Western Union Company (global money transfer, 2014-present) and a non-executive Chairman of Health Equity, Inc. (health savings custodian, 2015-present). Previously, Mr. Selander served as a Member of the Advisory Board of certain Fidelity® funds (2011), and Executive Vice Chairman (2010), Chief Executive Officer (2009-2010), and President and Chief Executive Officer (1997-2009) of Mastercard, Inc.
Cornelia M. Small (1944)
Year of Election or Appointment: 2005
Trustee
Ms. Small also serves as Trustee of other Fidelity® funds. Ms. Small is a member of the Board of Directors (2009-present) and Chair of the Investment Committee (2010-present) of the Teagle Foundation. Ms. Small also serves on the Investment Committee of the Berkshire Taconic Community Foundation (2008-present). Previously, Ms. Small served as Chairperson (2002-2008) and a member of the Investment Committee and Chairperson (2008-2012) and a member of the Board of Trustees of Smith College. In addition, Ms. Small served as Chief Investment Officer, Director of Global Equity Investments, and a member of the Board of Directors of Scudder, Stevens & Clark and Scudder Kemper Investments.
William S. Stavropoulos (1939)
Year of Election or Appointment: 2002
Trustee
Vice Chairman of the Independent Trustees
Mr. Stavropoulos also serves as Trustee of other Fidelity® funds. Mr. Stavropoulos serves as President and Founder of the Michigan Baseball Foundation, the Great Lakes Loons (2007-present). Mr. Stavropoulos is Chairman Emeritus of the Board of Directors of The Dow Chemical Company, where he previously served in numerous senior management positions, including President, CEO (1995-2000; 2002-2004), Chairman of the Executive Committee (2000-2006), and as a member of the Board of Directors (1990-2006). Currently, Mr. Stavropoulos is Chairman of the Board of Directors of Univar Inc. (global distributor of commodity and specialty chemicals), a Director of Teradata Corporation (data warehousing and technology solutions), and a member of the Advisory Board for Metalmark Capital LLC (private equity investment, 2005-present). Mr. Stavropoulos is an operating advisor to Clayton, Dubilier & Rice, LLC (private equity investment). In addition, Mr. Stavropoulos is a member of the University of Notre Dame Advisory Council for the College of Science, a Trustee of the Rollin L. Gerstacker Foundation, and a Director of Artis-Naples in Naples, Florida. Previously, Mr. Stavropoulos served as a Director of Chemical Financial Corporation (bank holding company, 1993-2012) and Tyco International, Ltd. (multinational manufacturing and services, 2007-2012).
David M. Thomas (1949)
Year of Election or Appointment: 2008
Trustee
Mr. Thomas also serves as Trustee of other Fidelity® funds. Mr. Thomas serves as Non-Executive Chairman of the Board of Directors of Fortune Brands Home and Security (home and security products, 2011-present), as a member of the Board of Directors (2004-present) and Presiding Director (2013-present) of Interpublic Group of Companies, Inc. (marketing communication), and as a member of the Board of Trustees of the University of Florida (2013-present). Previously, Mr. Thomas served as Executive Chairman (2005-2006) and Chairman and Chief Executive Officer (2000-2005) of IMS Health, Inc. (pharmaceutical and healthcare information solutions), and a Director of Fortune Brands, Inc. (consumer products, 2000-2011).
+ The information includes the Trustee's principal occupation during the last five years and other information relating to the experience, attributes, and skills relevant to the Trustee's qualifications to serve as a Trustee, which led to the conclusion that the Trustee should serve as a Trustee for the fund.
Advisory Board Members and Officers:
Correspondence intended for an officer or Peter S. Lynch may be sent to Fidelity Investments, 245 Summer Street, Boston, Massachusetts 02210. Officers appear below in alphabetical order.
Name, Year of Birth; Principal Occupation
Peter S. Lynch (1944)
Year of Election or Appointment: 2003
Member of the Advisory Board
Mr. Lynch also serves as Member of the Advisory Board of other Fidelity® funds. Mr. Lynch is Vice Chairman and a Director of FMR (investment adviser firm) and FMR Co., Inc. (investment adviser firm). In addition, Mr. Lynch serves as a Trustee of Boston College and as the Chairman of the Inner-City Scholarship Fund. Previously, Mr. Lynch served on the Special Olympics International Board of Directors (1997-2006).
Marc R. Bryant (1966)
Year of Election or Appointment: 2015
Secretary and Chief Legal Officer (CLO)
Mr. Bryant also serves as Secretary and CLO of other funds. Mr. Bryant serves as CLO, Secretary, and Senior Vice President of Fidelity Management & Research Company (investment adviser firm, 2015-present) and FMR Co., Inc. (investment adviser firm, 2015-present); Secretary of Fidelity SelectCo, LLC (investment adviser firm, 2015-present) and Fidelity Investments Money Management, Inc. (investment adviser firm, 2015-present); and CLO of Fidelity Management & Research (Hong Kong) Limited and FMR Investment Management (UK) Limited (investment adviser firms, 2015-present) and Fidelity Management & Research (Japan) Limited (investment adviser firm, 2016-present). He is Senior Vice President and Deputy General Counsel of FMR LLC (diversified financial services company). Previously, Mr. Bryant served as Secretary and CLO of Fidelity Rutland Square Trust II (2010-2014) and Assistant Secretary of Fidelity's Fixed Income and Asset Allocation Funds (2013-2015). Prior to joining Fidelity Investments, Mr. Bryant served as a Senior Vice President and the Head of Global Retail Legal for AllianceBernstein L.P. (2006-2010), and as the General Counsel for ProFund Advisors LLC (2001-2006).
Jeffrey S. Christian (1961)
Year of Election or Appointment: 2016
Assistant Treasurer
Mr. Christian also serves as Assistant Treasurer of other funds. Mr. Christian is an employee of Fidelity Investments (2003-present).
William C. Coffey (1969)
Year of Election or Appointment: 2009
Assistant Secretary
Mr. Coffey also serves as Assistant Secretary of other funds. He is Senior Vice President and Deputy General Counsel of FMR LLC (diversified financial services company, 2010-present), and is an employee of Fidelity Investments. Previously, Mr. Coffey served as Vice President and Associate General Counsel of FMR LLC (2005-2009).
Jonathan Davis (1968)
Year of Election or Appointment: 2010
Assistant Treasurer
Mr. Davis also serves as Assistant Treasurer of other funds, and is an employee of Fidelity Investments. Previously, Mr. Davis served as Vice President and Associate General Counsel of FMR LLC (diversified financial services company, 2003-2010).
Adrien E. Deberghes (1967)
Year of Election or Appointment: 2016
Assistant Treasurer
Mr. Deberghes also serves as an officer of other funds. He serves as Executive Vice President of Fidelity Investments Money Management, Inc. (FIMM) (investment adviser firm, 2016-present) and is an employee of Fidelity Investments (2008-present). Prior to joining Fidelity Investments, Mr. Deberghes was Senior Vice President of Mutual Fund Administration at State Street Corporation (2007-2008), Senior Director of Mutual Fund Administration at Investors Bank & Trust (2005-2007), and Director of Finance for Dunkin' Brands (2000-2005). Previously, Mr. Deberghes served in other fund officer roles.
Stephanie J. Dorsey (1969)
Year of Election or Appointment: 2010
Assistant Treasurer
Ms. Dorsey also serves as an officer of other funds. She is an employee of Fidelity Investments (2008-present) and has served in other fund officer roles. Prior to joining Fidelity Investments, Ms. Dorsey served as Treasurer (2004-2008) of the JPMorgan Mutual Funds and Vice President (2004-2008) of JPMorgan Chase Bank.
Howard J. Galligan III (1966)
Year of Election or Appointment: 2014
Chief Financial Officer
Mr. Galligan also serves as Chief Financial Officer of other funds. Mr. Galligan serves as President of Fidelity Pricing and Cash Management Services (FPCMS) (2014-present) and as a Director of Strategic Advisers, Inc. (investment adviser firm, 2008-present). Previously, Mr. Galligan served as Chief Administrative Officer of Asset Management (2011-2014) and Chief Operating Officer and Senior Vice President of Investment Support for Strategic Advisers, Inc. (2003-2011).
Scott C. Goebel (1968)
Year of Election or Appointment: 2015
Vice President
Mr. Goebel serves as Vice President of other funds and is an employee of Fidelity Investments (2001-present). Previously, Mr. Goebel served as Senior Vice President of Fidelity Management & Research Company (FMR) (investment adviser firm, 2016), Secretary of Fidelity SelectCo, LLC (investment adviser firm, 2013-2015), Fidelity Investments Money Management, Inc. (FIMM) (investment adviser firm, 2010-2015), and Fidelity Research and Analysis Company (FRAC) (investment adviser firm, 2010-2015); General Counsel, Secretary, and Senior Vice President of FMR (investment adviser firm, 2008-2015) and FMR Co., Inc. (investment adviser firm, 2008-2015); Assistant Secretary of Fidelity Management & Research (Japan) Limited (investment adviser firm, 2008-2015) and Fidelity Management & Research (U.K.) Inc. (investment adviser firm, 2008-2015); Chief Legal Officer (CLO) of Fidelity Management & Research (Hong Kong) Limited (investment adviser firm, 2008-2015); Secretary and CLO of certain Fidelity® funds (2008-2015); Assistant Secretary of FIMM (2008-2010), FRAC (2008-2010), and certain funds (2007-2008); and as Vice President and Secretary of Fidelity Distributors Corporation (FDC) (2005-2007).
Brian B. Hogan (1964)
Year of Election or Appointment: 2009
Vice President
Mr. Hogan also serves as Trustee or Vice President of other funds. Mr. Hogan serves as a Director of FMR Investment Management (UK) Limited (investment adviser firm, 2015-present) and Fidelity SelectCo, LLC (investment adviser firm, 2014-present) and President of the Equity Division of FMR (investment adviser firm, 2009-present). Previously, Mr. Hogan served as Senior Vice President, Equity Research of FMR (2006-2009) and as a portfolio manager. Mr. Brian B. Hogan is not related to Mr. Colm A. Hogan.
Colm A. Hogan (1973)
Year of Election or Appointment: 2016
Deputy Treasurer
Mr. Hogan also serves as an officer of other funds. Mr. Hogan is an employee of Fidelity Investments (2005-present). Mr. Colm A. Hogan is not related to Mr. Brian B. Hogan.
Chris Maher (1972)
Year of Election or Appointment: 2013
Assistant Treasurer
Mr. Maher serves as Assistant Treasurer of other funds. Mr. Maher is Vice President of Valuation Oversight and is an employee of Fidelity Investments. Previously, Mr. Maher served as Vice President of Asset Management Compliance (2013), Vice President of the Program Management Group of FMR (investment adviser firm, 2010-2013), and Vice President of Valuation Oversight (2008-2010).
John F. Papandrea (1972)
Year of Election or Appointment: 2016
Anti-Money Laundering (AML) Officer
Mr. Papandrea also serves as AML Officer of other funds. Mr. Papandrea is Vice President of FMR LLC (diversified financial services company, 2008-present) and is an employee of Fidelity Investments (2005-present).
Melissa M. Reilly (1971)
Year of Election or Appointment: 2014
Vice President of certain Equity Funds
Ms. Reilly also serves as Vice President of other funds. Ms. Reilly is an employee of Fidelity Investments (2004-present).
Kenneth B. Robins (1969)
Year of Election or Appointment: 2016
Chief Compliance Officer
Mr. Robins also serves as an officer of other funds. Mr. Robins serves as Compliance Officer of Fidelity Management & Research Company and FMR Co., Inc. (investment adviser firms, 2016-present) and is an employee of Fidelity Investments (2004-present). Previously, Mr. Robins served as Executive Vice President of Fidelity Investments Money Management, Inc. (investment adviser firm, 2013-2016) and served in other fund officer roles.
Stacie M. Smith (1974)
Year of Election or Appointment: 2016
President and Treasurer
Ms. Smith also serves as an officer of other funds. She is an employee of Fidelity Investments (2009-present) and has served in other fund officer roles. Prior to joining Fidelity Investments, Ms. Smith served as Senior Audit Manager of Ernst & Young LLP (accounting firm, 1996-2009). Previously, Ms. Smith served as Deputy Treasurer of certain Fidelity® funds (2013-2016).
Marc L. Spector (1972)
Year of Election or Appointment: 2016
Assistant Treasurer
Mr. Spector also serves as an officer of other funds. Mr. Spector is an employee of Fidelity Investments (2016-present). Prior to joining Fidelity Investments, Mr. Spector served as Director at the Siegfried Group (accounting firm, 2013-2016), and prior to Siegfried Group as audit senior manager at Deloitte & Touche (accounting firm, 2005-2013).
Renee Stagnone (1975)
Year of Election or Appointment: 2016
Assistant Treasurer
Ms. Stagnone also serves as an officer of other funds. Ms. Stagnone is an employee of Fidelity Investments (1997-present). Previously, Ms. Stagnone served as Deputy Treasurer of certain Fidelity® funds (2013-2016).
Shareholder Expense Example
As a shareholder of the Fund, you incur two types of costs: (1) transaction costs, including redemption fees and (2) ongoing costs, including management fees and other Fund expenses. This Example is intended to help you understand your ongoing costs (in dollars) of investing in the Fund and to compare these costs with the ongoing costs of investing in other mutual funds.
The Example is based on an investment of $1,000 invested at the beginning of the period and held for the entire period (June 1, 2016 to November 30, 2016).
Actual Expenses
The first line of the accompanying table for each class of the Fund provides information about actual account values and actual expenses. You may use the information in this line, together with the amount you invested, to estimate the expenses that you paid over the period. Simply divide your account value by $1,000.00 (for example, an $8,600 account value divided by $1,000.00 = 8.6), then multiply the result by the number in the first line for a class of the Fund under the heading entitled "Expenses Paid During Period" to estimate the expenses you paid on your account during this period. A small balance maintenance fee of $12.00 that is charged once a year may apply for certain accounts with a value of less than $2,000. This fee is not included in the table below. If it was, the estimate of expenses you paid during the period would be higher, and your ending account value lower, by this amount. In addition, the Fund, as a shareholder in the underlying Fidelity Central Funds, will indirectly bear its pro-rata share of the fees and expenses incurred by the underlying Fidelity Central Funds. These fees and expenses are not included in the Fund's annualized expense ratio used to calculate the expense estimate in the table below.
Hypothetical Example for Comparison Purposes
The second line of the accompanying table for each class of the Fund provides information about hypothetical account values and hypothetical expenses based on a Class' actual expense ratio and an assumed rate of return of 5% per year before expenses, which is not the Class' actual return. The hypothetical account values and expenses may not be used to estimate the actual ending account balance or expenses you paid for the period. You may use this information to compare the ongoing costs of investing in the Fund and other funds. To do so, compare this 5% hypothetical example with the 5% hypothetical examples that appear in the shareholder reports of the other funds. A small balance maintenance fee of $12.00 that is charged once a year may apply for certain accounts with a value of less than $2,000. This fee is not included in the table below. If it was, the estimate of expenses you paid during the period would be higher, and your ending account value lower, by this amount. In addition, the Fund, as a shareholder in the underlying Fidelity Central Funds, will indirectly bear its pro-rata share of the fees and expenses incurred by the underlying Fidelity Central Funds. These fees and expenses are not included in the Fund's annualized expense ratio used to calculate the expense estimate in the table below.
Please note that the expenses shown in the table are meant to highlight your ongoing costs only and do not reflect any transaction costs. Therefore, the second line of the table is useful in comparing ongoing costs only, and will not help you determine the relative total costs of owning different funds. In addition, if these transactional costs were included, your costs would have been higher.
| | Annualized Expense Ratio-A | Beginning
Account Value
June 1, 2016 | Ending
Account Value
November 30, 2016 | Expenses Paid
During Period-B
June 1, 2016
to November 30, 2016 |
| Growth Strategies | .91% | | | |
| Actual | | $1,000.00 | $1,014.10 | 4.58C |
| Hypothetical-D | | $1,000.00 | $1,020.45 | 4.60C |
| Class K | .74% | | | |
| Actual | | $1,000.00 | $1,015.20 | 3.73C |
| Hypothetical-D | | $1,000.00 | $1,021.30 | 3.74C |
A Annualized expense ratio reflects expenses net of applicable fee waivers.
B Expenses are equal to each Class' annualized expense ratio, multiplied by the average account value over the period, multiplied by 183/366 (to reflect the one-half year period).
C If fees and changes to the Fund's Management Fee effective February 1, 2017, had been in effect during the current period, the annualized expense ratio and expenses paid would have been as shown in table below:
D 5% return per year before expenses
| | Annualized Expense Ratio
| Expenses Paid
|
| Growth Strategies | .86% | |
| Actual | | $4.33 |
| Hypothetical | | $4.34 |
| Class K | .69% | |
| Actual | | $3.48 |
| Hypothetical | | $3.49 |
Distributions (Unaudited)
The Board of Trustees of Fidelity Growth Strategies Fund voted to pay to shareholders of record at the opening of business on record date, the following distributions per share derived from capital gains realized from sales of portfolio securities, and dividends derived from net investment income:
| | Pay Date | Record Date | Dividends | Capital Gains |
| Fidelity Growth Strategies Fund | | | | |
| Growth Strategies | 12/28/16 | 12/27/16 | $0.184 | $0.015 |
| Class K | 12/28/16 | 12/27/16 | $0.233 | $0.015 |
|
Growth Strategies and Class K designate 100% of the dividends distributed during the fiscal year as qualifying for the dividends–received deduction for corporate shareholders.
Growth Strategies and Class K designate 100% of the dividends distributed during the fiscal year as amounts which may be taken into account as a dividend for purposes of the maximum rate under section 1(h)(11) of the Internal Revenue Code.
The fund will notify shareholders in January 2017 of amounts for use in preparing 2016 income tax returns.
Board Approval of Investment Advisory Contracts and Management Fees
Fidelity Growth Strategies Fund
Each year, the Board of Trustees, including the Independent Trustees (together, the Board), votes on the renewal of the management contract with Fidelity Management & Research Company (FMR) and the sub-advisory agreements (together, the Advisory Contracts) for the fund. The Board, assisted by the advice of fund counsel and Independent Trustees' counsel, requests and considers a broad range of information relevant to the renewal of the Advisory Contracts throughout the year.
The Board meets regularly and, at each of its meetings, covers an extensive agenda of topics and materials and considers factors that are relevant to its annual consideration of the renewal of the fund's Advisory Contracts, including the services and support provided to the fund and its shareholders. The Board has established various standing committees (Committees), each composed of and chaired by Independent Trustees with varying backgrounds, to which the Board has assigned specific subject matter responsibilities in order to enhance effective decision-making by the Board. The Board, acting directly and through its Committees, requests and receives information concerning the annual consideration of the renewal of the fund's Advisory Contracts. The Board also meets as needed to consider matters specifically related to the Board's annual consideration of the renewal of the Advisory Contracts. Members of the Board may also meet with trustees of other Fidelity funds through ad hoc joint committees to discuss certain matters relevant to all of the Fidelity funds.
At its July 2016 meeting, the Board unanimously determined to renew the fund's Advisory Contracts. In reaching its determination, the Board considered all factors it believed relevant, including (i) the nature, extent, and quality of the services to be provided to the fund and its shareholders (including the investment performance of the fund); (ii) the competitiveness of the fund's management fee and total expense ratio relative to peer funds; (iii) the total costs of the services to be provided by and the profits to be realized by Fidelity from its relationships with the fund; and (iv) the extent to which, if any, economies of scale exist and would be realized as the fund grows, and whether any economies of scale are appropriately shared with fund shareholders.
In considering whether to renew the Advisory Contracts for the fund, the Board reached a determination, with the assistance of fund counsel and Independent Trustees' counsel and through the exercise of its business judgment, that the renewal of the Advisory Contracts was in the best interests of the fund and its shareholders and that the compensation payable under the Advisory Contracts was fair and reasonable. The Board's decision to renew the Advisory Contracts was not based on any single factor, but rather was based on a comprehensive consideration of all the information provided to the Board at its meetings throughout the year. The Board, in reaching its determination to renew the Advisory Contracts, was aware that shareholders of the fund have a broad range of investment choices available to them, including a wide choice among funds offered by Fidelity's competitors, and that the fund's shareholders, who have the opportunity to review and weigh the disclosure provided by the fund in its prospectus and other public disclosures, have chosen to invest in this fund, which is part of the Fidelity family of funds.
Nature, Extent, and Quality of Services Provided. The Board considered Fidelity's staffing as it relates to the fund, including the backgrounds of investment personnel of Fidelity, and also considered the fund's investment objective, strategies, and related investment philosophy. The Independent Trustees also had discussions with senior management of Fidelity's investment operations and investment groups. The Board considered the structure of the investment personnel compensation program and whether this structure provides appropriate incentives to act in the best interests of the fund. Additionally, the Board considered the portfolio managers' investments, if any, in the funds that they manage.
Resources Dedicated to Investment Management and Support Services. The Board and the Fund Oversight and Research Committees reviewed the general qualifications and capabilities of Fidelity's investment staff, including its size, education, experience, and resources, as well as Fidelity's approach to recruiting, training, managing, and compensating investment personnel. The Board noted that Fidelity has continued to increase the resources devoted to non-U.S. offices, including expansion of Fidelity's global investment organization. The Board also noted that Fidelity's analysts have extensive resources, tools and capabilities that allow them to conduct sophisticated quantitative and fundamental analysis, as well as credit analysis of issuers, counterparties and guarantors. Further, the Board considered that Fidelity's investment professionals have sufficient access to global information and data so as to provide competitive investment results over time, and that those professionals also have access to sophisticated tools that permit them to assess portfolio construction and risk and performance attribution characteristics continuously, as well as to transmit new information and research conclusions rapidly around the world. Additionally, in its deliberations, the Board considered Fidelity's trading, risk management, compliance, and technology and operations capabilities and resources, which are integral parts of the investment management process.
Shareholder and Administrative Services. The Board considered (i) the nature, extent, quality, and cost of advisory, administrative, and shareholder services performed by FMR, the sub-advisers (together with FMR, the Investment Advisers), and their affiliates under the Advisory Contracts and under separate agreements covering transfer agency, pricing and bookkeeping, and securities lending services for the fund; (ii) the nature and extent of the supervision of third party service providers, principally custodians, subcustodians, and pricing vendors; and (iii) the resources devoted to, and the record of compliance with, the fund's compliance policies and procedures. The Board also reviewed the allocation of fund brokerage, including allocations to brokers affiliated with the Investment Advisers, the use of brokerage commissions to pay fund expenses, and the use of "soft" commission dollars to pay for research services.
The Board noted that the growth of fund assets over time across the complex allows Fidelity to reinvest in the development of services designed to enhance the value or convenience of the Fidelity funds as investment vehicles. These services include 24-hour access to account information and market information through telephone representatives and over the Internet, investor education materials and asset allocation tools, and the expanded availability of Fidelity Investor Centers.
In 2014, the Board formed an ad hoc Committee on Transfer Agency Fees to review the variety of transfer agency fee structures throughout the industry and Fidelity's competitive positioning with respect to industry participants.
Investment in a Large Fund Family. The Board considered the benefits to shareholders of investing in a Fidelity fund, including the benefits of investing in a fund that is part of a large family of funds offering a variety of investment disciplines and providing a large variety of mutual fund investor services. The Board noted that Fidelity had taken, or had made recommendations that resulted in the Fidelity funds taking, a number of actions over the previous year that benefited particular funds, including: (i) continuing to dedicate additional resources to investment research and to the support of the senior management team that oversees asset management; (ii) continuing efforts to enhance Fidelity's global research capabilities; (iii) launching new funds and making other enhancements to meet client needs; (iv) broadening eligibility requirements for certain lower-priced share classes of, and streamlining the fee structure for, certain existing equity index funds; (v) lowering expense caps for certain existing funds and classes to reduce expenses paid by shareholders; (vi) eliminating redemption fees for certain variable insurance product funds and classes; (vii) continuing to launch dedicated lower cost underlying funds to meet portfolio construction needs related to expanding underlying fund options for Fidelity funds of funds, specifically for the Freedom Fund product lines; (viii) launching a lower cost share class for use by the Freedom Index Fund product line; (ix) rationalizing product lines and gaining increased efficiencies through fund mergers and share class consolidations; (x) continuing to develop, acquire and implement systems and technology to improve services to the funds and shareholders, strengthen information security, and increase efficiency; (xi) implementing investment enhancements to further strengthen Fidelity's target date product line to increase investors' probability of success in achieving their goals; (xii) accelerating the conversion of all remaining Class B shares to Class A shares, which have a lower expense structure; and (xiii) implementing changes to Fidelity's money market fund product line in response to recent regulatory reforms.
Investment Performance. The Board considered whether the fund has operated in accordance with its investment objective, as well as its record of compliance with its investment restrictions and its performance history. The Board noted that there was a portfolio management change for the fund in August 2013.
The Board took into account discussions with representatives of the Investment Advisers about fund investment performance that occur at Board meetings throughout the year. In this regard the Board noted that as part of regularly scheduled fund reviews and other reports to the Board on fund performance, the Board considers annualized return information for the fund, for different time periods, measured against a securities market index ("benchmark index") and a peer group of funds with similar objectives ("peer group"), if any. In its evaluation of fund investment performance, the Board gave particular attention to information indicating changes in performance of certain Fidelity funds for specific time periods and discussed with the Investment Advisers the reasons for any overperformance or underperformance.
In addition to reviewing absolute and relative fund performance, the Independent Trustees periodically consider the appropriateness of fund performance metrics in evaluating the results achieved. In general, the Independent Trustees believe that fund performance should be evaluated based on net performance (after fees and expenses) of both the highest performing and lowest performing fund share classes, where applicable, compared to appropriate benchmark indices, over appropriate time periods that may include full market cycles, and compared to peer groups, as applicable, over the same periods, taking into account relevant factors including the following: general market conditions; issuer-specific information; and fund cash flows and other factors.
The Independent Trustees recognize that shareholders evaluate performance on a net basis over their own holding periods, for which one-, three-, and five-year periods are often used as a proxy. For this reason, the performance information reviewed by the Board also included net cumulative calendar year total return information for the fund and an appropriate benchmark index and peer group for the most recent one-, three-, and five-year periods, as shown below. Returns are shown compared to the 25th percentile (top of box, 75% beaten) and 75th percentile (bottom of box, 25% beaten) of the peer universe.
Fidelity Growth Strategies Fund

The Board also considered that the fund's management fee is subject to upward or downward adjustment depending upon whether, and to what extent, the fund's investment performance for the performance period exceeds, or is exceeded by, a securities index, thus leading to a performance adjustment for the same period. The Board noted that the performance adjustment provides FMR with a strong economic incentive to seek to achieve superior performance for the fund's shareholders and helps to more closely align the interests of FMR and the shareholders of the fund.
Based on its review, the Board concluded that the nature, extent, and quality of services provided to the fund under the Advisory Contracts should continue to benefit the shareholders of the fund.
Competitiveness of Management Fee and Total Expense Ratio. The Board considered the fund's management fee and total expense ratio compared to "mapped groups" of competitive funds and classes created for the purpose of facilitating the Trustees' competitive analysis of management fees and total expenses. Fidelity creates "mapped groups" by combining similar Broadridge investment objective categories that have comparable investment mandates. Combining Broadridge investment objective categories aids the Board's management fee and total expense ratio comparisons by broadening the competitive group used for comparison.
Management Fee. The Board considered two proprietary management fee comparisons for the 12-month periods shown in basis points (BP) in the chart below. The group of Broadridge funds used by the Board for management fee comparisons is referred to below as the "Total Mapped Group." The Total Mapped Group comparison focuses on a fund's standing in terms of gross management fees before expense reimbursements or caps, and without giving effect to the fund's performance adjustment, relative to the total universe of funds with comparable investment mandates, regardless of whether their management fee structures also are comparable. Funds with comparable investment mandates offer exposure to similar types of securities. Funds with comparable management fee structures have similar management fee contractual arrangements (
e.g., flat rate charged for advisory services, all-inclusive fee rate,
etc.). "TMG %" represents the percentage of funds in the Total Mapped Group that had management fees that were lower than the fund's. For example, a hypothetical TMG % of 20% would mean that 80% of the funds in the Total Mapped Group had higher, and 20% had lower, management fees than the fund. The fund's actual TMG %s and the number of funds in the Total Mapped Group are in the chart below. The "Asset-Size Peer Group" (ASPG) comparison focuses on a fund's standing relative to a subset of non-Fidelity funds within the Total Mapped Group that are similar in size and management fee structure without taking into account performance adjustments, if any. For example, if a fund is in the first quartile of the ASPG, the fund's management fee ranks in the least expensive or lowest 25% of funds in the ASPG. The ASPG represents at least 15% of the funds in the Total Mapped Group with comparable asset size and management fee structures, subject to a minimum of 50 funds (or all funds in the Total Mapped Group if fewer than 50). Additional information, such as the ASPG quartile in which the fund's management fee rate ranked and the impact of the fund's performance adjustment, is also included in the chart and considered by the Board.
Fidelity Growth Strategies Fund

The Board noted that the fund's management fee rate ranked below the median of its Total Mapped Group and below the median of its ASPG for 2015. The Board also noted the effect of the fund's performance adjustment, if any, on the fund's management fee ranking.
The Board noted that, in 2014, the ad hoc Committee on Group Fee was formed by it and the boards of other Fidelity funds to conduct an in-depth review of the "group fee" component of the management fee of funds with such management fee structures. The Committee's focus included the mechanics of the group fee, the competitive landscape of group fee structures, Fidelity funds with no group fee component and investment products not included in group fee assets. The Board also considered that, for funds subject to the group fee, FMR agreed to voluntarily waive fees over a specified period of time in amounts designed to account for assets converted from certain funds to certain collective investment trusts.
The Board also noted that, in 2013, the ad hoc Committee on Management Fees was formed to conduct an in-depth review of the management fee rates of Fidelity's active equity mutual funds. The Committee focused on the following areas: (i) standard fee structures; (ii) research consumption and trading evolution; (iii) management fee competitiveness/profitability by category; and (iv) factors that drive institutional pricing.
Based on its review, the Board concluded that the fund's management fee is fair and reasonable in light of the services that the fund receives and the other factors considered.
Total Expense Ratio. In its review of each class's total expense ratio, the Board considered the fund's management fee rate as well as other fund or class expenses, as applicable, such as transfer agent fees, pricing and bookkeeping fees, and custodial, legal, and audit fees. The Board noted the impact of the fund's performance adjustment. The Board also noted that Fidelity may agree to waive fees and expenses from time to time, and the extent to which, if any, it has done so for the fund. As part of its review, the Board also considered the current and historical total expense ratios of each class of the fund compared to competitive fund median expenses. Each class of the fund is compared to those funds and classes in the Total Mapped Group (used by the Board for management fee comparisons) that have a similar sales load structure.
The Board noted that the total expense ratio of each class ranked below the competitive median for 2015.
Fees Charged to Other Fidelity Clients. The Board also considered Fidelity fee structures and other information with respect to clients of Fidelity, such as other funds advised or subadvised by Fidelity, pension plan clients, and other institutional clients with similar mandates. The Board noted the findings of the 2013 ad hoc joint committee (created with the board of other Fidelity funds), which reviewed and compared Fidelity's institutional investment advisory business with its business of providing services to the Fidelity funds, including the differences in services provided, fees charged, and costs incurred, as well as competition in their respective marketplaces.
Based on its review of total expense ratios and fees charged to other Fidelity clients, the Board concluded that the total expense ratio of each class of the fund was reasonable in light of the services that the fund and its shareholders receive and the other factors considered.
Costs of the Services and Profitability. The Board considered the revenues earned and the expenses incurred by Fidelity in conducting the business of developing, marketing, distributing, managing, administering and servicing the fund and servicing the fund's shareholders. The Board also considered the level of Fidelity's profits in respect of all the Fidelity funds.
On an annual basis, Fidelity presents to the Board information about the profitability of its relationship with the fund. Fidelity calculates profitability information for each fund, as well as aggregate profitability information for groups of Fidelity funds and all Fidelity funds, using a series of detailed revenue and cost allocation methodologies which originate with the books and records of Fidelity on which Fidelity's audited financial statements are based. The Audit Committee of the Board reviews any significant changes from the prior year's methodologies.
PricewaterhouseCoopers LLP (PwC), independent registered public accounting firm and auditor to Fidelity and certain Fidelity funds, has been engaged annually by the Board as part of the Board's assessment of Fidelity's profitability analysis. PwC's engagement includes the review and assessment of the methodologies used by Fidelity in determining the revenues and expenses attributable to Fidelity's mutual fund business, and completion of agreed-upon procedures in respect of the mathematical accuracy of the fund profitability information and its conformity to established allocation methodologies. After considering PwC's reports issued under the engagement and information provided by Fidelity, the Board concluded that while other allocation methods may also be reasonable, Fidelity's profitability methodologies are reasonable in all material respects.
The Board also reviewed Fidelity's non-fund businesses and fall-out benefits related to the mutual fund business as well as cases where Fidelity's affiliates may benefit from or be related to the fund's business.
The Board considered the costs of the services provided by and the profits realized by Fidelity in connection with the operation of the fund and was satisfied that the profitability was not excessive.
Economies of Scale. The Board considered whether there have been economies of scale in respect of the management of the Fidelity funds, whether the Fidelity funds (including the fund) have appropriately benefited from any such economies of scale, and whether there is potential for realization of any further economies of scale. The Board considered the extent to which the fund will benefit from economies of scale as assets grow through increased services to the fund, through waivers or reimbursements, or through fee or expense ratio reductions. The Board also noted that in 2013, it and the boards of other Fidelity funds created an ad hoc committee (the Economies of Scale Committee) to analyze whether Fidelity attains economies of scale in respect of the management and servicing of the Fidelity funds, whether the Fidelity funds have appropriately benefited from such economies of scale, and whether there is potential for realization of any further economies of scale.
The Board recognized that the fund's management contract incorporates a "group fee" structure, which provides for lower group fee rates as total group assets increase, and for higher group fee rates as total group assets decrease (with "group assets" defined to include fund assets under FMR's management plus the assets of sector funds previously under FMR's management). FMR calculates the group fee rates based on a tiered asset "breakpoint" schedule that varies based on asset class. The Board considered that the group fee is designed to deliver the benefits of economies of scale to fund shareholders when total Fidelity fund assets increase, even if assets of any particular fund are unchanged or have declined, because some portion of Fidelity's costs are attributable to services provided to all Fidelity funds, and all funds benefit if those costs can be allocated among more assets. The Board concluded that, given the group fee structure, fund shareholders will benefit from lower management fees as group assets increase at the fund complex level, regardless of whether Fidelity achieves any such economies of scale.
The Board concluded, taking into account the analysis of the Economies of Scale Committee, that economies of scale, if any, are being appropriately shared between fund shareholders and Fidelity.
Additional Information Requested by the Board. In order to develop fully the factual basis for consideration of the Fidelity funds' Advisory Contracts, the Board requested and received additional information on certain topics, including: (i) fund performance trends and Fidelity's long-term strategies for certain funds; (ii) the various share classes employed by Fidelity and the attributes of each class, together with similar information on the distribution and servicing payments made by Fidelity or the funds to third-party participants in the distribution channels; (iii) fund profitability, and fund performance in relation to fund profitability; (iv) the methodology with respect to evaluating competitive fund data and peer group classifications and fee comparisons; (v) annual fund profitability margins; (vi) the realization of fall-out benefits in and attribution of fall-out benefits to certain Fidelity business units; (vii) the appropriateness of certain funds' benchmarks; (viii) the rationalization for certain share classes and expenses; (ix) sub-advisory fee rates for comparable investment mandates; (x) product strategy for certain underperforming funds; and (xi) Fidelity's resources and strategy for cybersecurity.
Based on its evaluation of all of the conclusions noted above, and after considering all factors it believed relevant, the Board concluded that the advisory fee structures are fair and reasonable, and that the fund's Advisory Contracts should be renewed.
Corporate Headquarters
245 Summer St.
Boston, MA 02210
www.fidelity.com
FEG-K-ANN-0117
1.863026.108
Fidelity® Growth Strategies Fund
Annual Report November 30, 2016 |
|
Contents
To view a fund's proxy voting guidelines and proxy voting record for the 12-month period ended June 30, visit http://www.fidelity.com/proxyvotingresults or visit the Securities and Exchange Commission's (SEC) web site at http://www.sec.gov.
You may also call 1-800-544-8544 to request a free copy of the proxy voting guidelines.
Standard & Poor's, S&P and S&P 500 are registered service marks of The McGraw-Hill Companies, Inc. and have been licensed for use by Fidelity Distributors Corporation.
Other third-party marks appearing herein are the property of their respective owners.
All other marks appearing herein are registered or unregistered trademarks or service marks of FMR LLC or an affiliated company. © 2017 FMR LLC. All rights reserved.
This report and the financial statements contained herein are submitted for the general information of the shareholders of the Fund. This report is not authorized for distribution to prospective investors in the Fund unless preceded or accompanied by an effective prospectus.
A fund files its complete schedule of portfolio holdings with the SEC for the first and third quarters of each fiscal year on Form N-Q. Forms N-Q are available on the SEC’s web site at http://www.sec.gov. A fund's Forms N-Q may be reviewed and copied at the SEC’s Public Reference Room in Washington, DC. Information regarding the operation of the SEC's Public Reference Room may be obtained by calling 1-800-SEC-0330.
For a complete list of a fund's portfolio holdings, view the most recent holdings listing, semiannual report, or annual report on Fidelity's web site at http://www.fidelity.com, http://www.institutional.fidelity.com, or http://www.401k.com, as applicable.
NOT FDIC INSURED •MAY LOSE VALUE •NO BANK GUARANTEE
Neither the Fund nor Fidelity Distributors Corporation is a bank.
Performance: The Bottom Line
Average annual total return reflects the change in the value of an investment, assuming reinvestment of distributions from dividend income and capital gains (the profits earned upon the sale of securities that have grown in value, if any) and assuming a constant rate of performance each year. The hypothetical investment and the average annual total returns do not reflect the deduction of taxes that a shareholder would pay on fund distributions or the redemption of fund shares. During periods of reimbursement by Fidelity, a fund’s total return will be greater than it would be had the reimbursement not occurred. How a fund did yesterday is no guarantee of how it will do tomorrow.
Average Annual Total Returns
| For the periods ended November 30, 2016 | Past 1 year | Past 5 years | Past 10 years |
| Fidelity® Growth Strategies Fund | 0.02% | 12.44% | 5.72% |
$10,000 Over 10 Years
Let's say hypothetically that $10,000 was invested in Fidelity® Growth Strategies Fund, a class of the fund, on November 30, 2006.
The chart shows how the value of your investment would have changed, and also shows how the Russell Midcap® Growth Index performed over the same period.
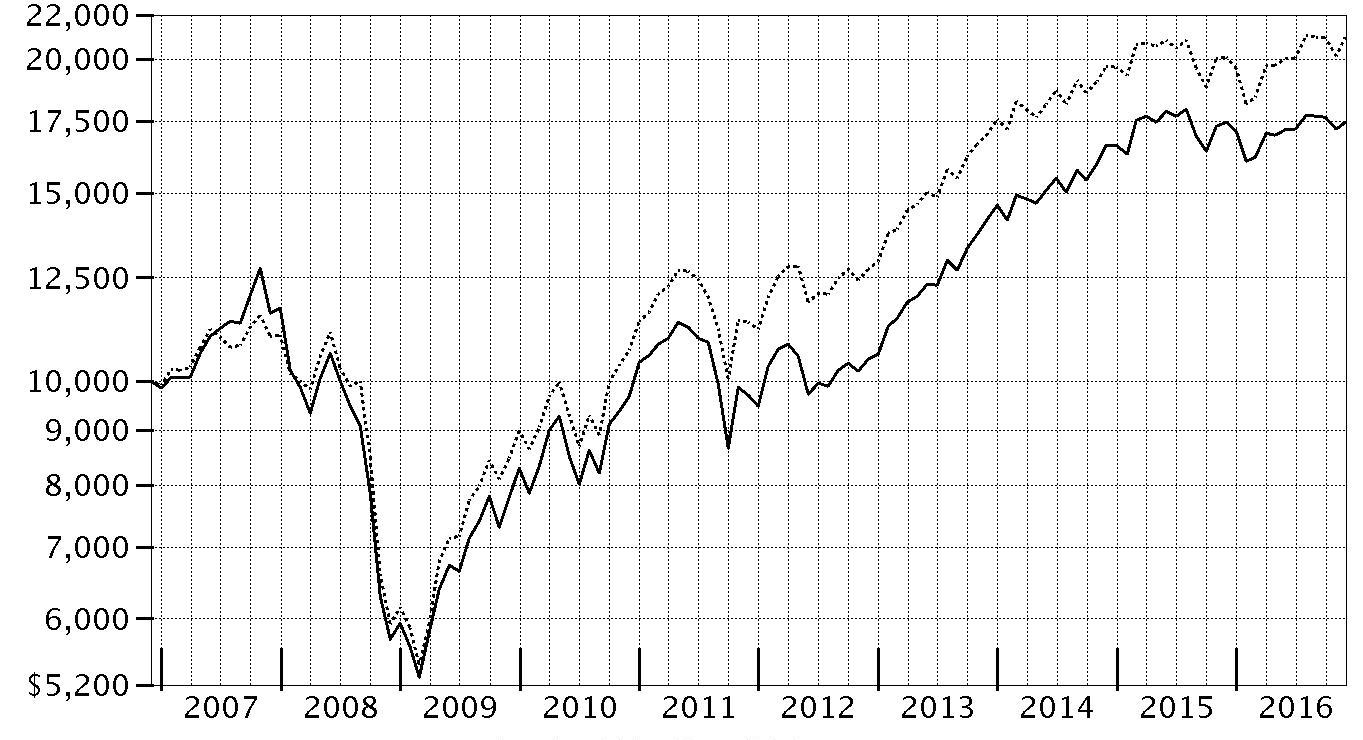
| Period Ending Values |
| $17,449 | Fidelity® Growth Strategies Fund |
| $20,992 | Russell Midcap® Growth Index |
Management's Discussion of Fund Performance
Market Recap: The S&P 500 index returned 8.06% for the 12 months ending November 30, 2016, rising sharply in the final month on post-election optimism for economic growth. The period began during a fairly volatile stretch, with stocks hampered by persistent oil-price weakness and U.S.-dollar strength. Markets regained positive momentum in February amid U.S. job gains, a rally in energy and other stimuli that helped keep the roughly seven-year uptrend intact. Markets tumbled briefly following the U.K.’s June 23 vote to exit the European Union – dubbed “Brexit” – then recovered quickly and settled into a flattish stretch until the November 8 U.S. presidential election. For the year, 10 of the 11 sectors in the S&P 500
® advanced, with six posting double-digit gains. Telecommunication services (+16%) led the way, its strength attributable to demand for dividend-paying equities early in the period, as well as to company-specific news. Cyclical sectors including industrials (+15%), financials (+14%), energy (+13%) and materials (+12%) posted strong gains, the latter two driven by a rebound in commodity prices. Conversely, real estate (+1%) lagged the index due to a late-period slump related to expectations for rising interest rates. Consumer discretionary (+3%) also underperformed, as competitive pressure continued to weigh on brick-and-mortar retailers.
Comments from Portfolio Manager Jean Park: For the year, the fund’s share classes delivered essentially flat results, lagging the 4.54% return of the Russell Midcap Growth Index. The fund’s investments in what I considered higher-quality stocks with strong free cash flow yields at reasonable valuations did not keep pace with the rest of the mid-cap market, which was buoyed by strong returns of lower-quality stocks. Stock selection hurt relative performance most, especially in the health care and consumer staples sectors. The fund’s biggest relative detractor came from avoiding strong-performing semiconductor maker Nvidia, which was added to the benchmark in July but which I thought was too expensive. An overweighting in Ireland-based generic-drugmaker Endo International, which suffered amid negative publicity and government scrutiny of drug-pricing policies, also hurt performance. I eliminated the position in August. Conversely, positioning in information technology and consumer discretionary was modestly beneficial. An out-of-benchmark stake in casino operator Las Vegas Sands proved the fund’s top individual contributor; I pared back the fund’s position on share-price strength, harvesting some long-term gains for tax efficiency. Restaurant chain Domino’s Pizza was another win and another position I trimmed to take profits.
The views expressed above reflect those of the portfolio manager(s) only through the end of the period as stated on the cover of this report and do not necessarily represent the views of Fidelity or any other person in the Fidelity organization. Any such views are subject to change at any time based upon market or other conditions and Fidelity disclaims any responsibility to update such views. These views may not be relied on as investment advice and, because investment decisions for a Fidelity fund are based on numerous factors, may not be relied on as an indication of trading intent on behalf of any Fidelity fund.
Investment Summary (Unaudited)
Top Ten Stocks as of November 30, 2016
| | % of fund's net assets | % of fund's net assets 6 months ago |
| O'Reilly Automotive, Inc. | 2.6 | 2.5 |
| Equifax, Inc. | 2.5 | 2.3 |
| AutoZone, Inc. | 2.5 | 2.4 |
| Electronic Arts, Inc. | 2.3 | 2.2 |
| VeriSign, Inc. | 2.2 | 1.4 |
| TransDigm Group, Inc. | 2.1 | 2.0 |
| Total System Services, Inc. | 2.1 | 2.1 |
| Fiserv, Inc. | 1.9 | 1.7 |
| Global Payments, Inc. | 1.7 | 2.4 |
| Ross Stores, Inc. | 1.7 | 1.2 |
| | 21.6 | |
Top Five Market Sectors as of November 30, 2016
| | % of fund's net assets | % of fund's net assets 6 months ago |
| Information Technology | 24.6 | 20.9 |
| Consumer Discretionary | 21.6 | 22.7 |
| Industrials | 15.3 | 16.3 |
| Health Care | 14.6 | 13.4 |
| Financials | 8.1 | 12.2 |
Prior period industry classifications reflect the categories in place as of the date indicated and have not been adjusted to reflect current industry classifications.
Asset Allocation (% of fund's net assets)
| As of November 30, 2016* |
| | Stocks | 98.9% |
| | Short-Term Investments and Net Other Assets (Liabilities) | 1.1% |

* Foreign investments - 6.5%
| As of May 31, 2016* |
| | Stocks | 98.3% |
| | Short-Term Investments and Net Other Assets (Liabilities) | 1.7% |

* Foreign investments - 9.4%
Investments November 30, 2016
Showing Percentage of Net Assets
| Common Stocks - 98.9% | | | |
| | | Shares | Value (000s) |
| CONSUMER DISCRETIONARY - 21.6% | | | |
| Auto Components - 1.6% | | | |
| Delphi Automotive PLC | | 110,243 | $7,056 |
| Tenneco, Inc. (a) | | 115,544 | 6,811 |
| Visteon Corp. | | 350,600 | 27,582 |
| | | | 41,449 |
| Diversified Consumer Services - 1.0% | | | |
| H&R Block, Inc. | | 566,547 | 12,555 |
| Service Corp. International | | 461,880 | 12,466 |
| | | | 25,021 |
| Hotels, Restaurants & Leisure - 3.9% | | | |
| Domino's Pizza, Inc. | | 154,000 | 25,878 |
| Jack in the Box, Inc. | | 174,000 | 18,099 |
| Las Vegas Sands Corp. | | 196,500 | 12,315 |
| Wyndham Worldwide Corp. | | 589,000 | 42,402 |
| | | | 98,694 |
| Household Durables - 1.9% | | | |
| Leggett & Platt, Inc. | | 247,000 | 11,871 |
| Newell Brands, Inc. | | 810,000 | 38,078 |
| | | | 49,949 |
| Internet & Direct Marketing Retail - 0.6% | | | |
| Liberty Interactive Corp. QVC Group Series A (a) | | 110,000 | 2,278 |
| TripAdvisor, Inc. (a) | | 277,000 | 13,374 |
| | | | 15,652 |
| Media - 2.9% | | | |
| Interpublic Group of Companies, Inc. | | 1,379,234 | 33,198 |
| Starz Series A (a) | | 792,000 | 26,817 |
| Viacom, Inc. Class B (non-vtg.) | | 412,900 | 15,475 |
| | | | 75,490 |
| Multiline Retail - 0.9% | | | |
| Dollar Tree, Inc. (a) | | 254,000 | 22,393 |
| Specialty Retail - 7.7% | | | |
| AutoZone, Inc. (a) | | 79,600 | 62,341 |
| L Brands, Inc. | | 335,000 | 23,524 |
| O'Reilly Automotive, Inc. (a) | | 242,000 | 66,419 |
| Ross Stores, Inc. | | 644,325 | 43,550 |
| | | | 195,834 |
| Textiles, Apparel & Luxury Goods - 1.1% | | | |
| Hanesbrands, Inc. | | 750,000 | 17,423 |
| VF Corp. | | 197,300 | 10,755 |
| | | | 28,178 |
|
| TOTAL CONSUMER DISCRETIONARY | | | 552,660 |
|
| CONSUMER STAPLES - 6.4% | | | |
| Beverages - 1.6% | | | |
| Dr. Pepper Snapple Group, Inc. | | 310,200 | 26,907 |
| Monster Beverage Corp. (a) | | 285,000 | 12,754 |
| | | | 39,661 |
| Food & Staples Retailing - 0.3% | | | |
| Kroger Co. | | 190,000 | 6,137 |
| Rite Aid Corp. (a) | | 175,000 | 1,393 |
| | | | 7,530 |
| Food Products - 2.6% | | | |
| Campbell Soup Co. | | 268,000 | 15,247 |
| Mead Johnson Nutrition Co. Class A | | 253,000 | 18,239 |
| The Hershey Co. | | 345,206 | 33,361 |
| | | | 66,847 |
| Personal Products - 1.2% | | | |
| Coty, Inc. Class A | | 802,000 | 15,005 |
| Estee Lauder Companies, Inc. Class A | | 207,000 | 16,084 |
| | | | 31,089 |
| Tobacco - 0.7% | | | |
| Reynolds American, Inc. | | 317,000 | 17,150 |
|
| TOTAL CONSUMER STAPLES | | | 162,277 |
|
| ENERGY - 0.5% | | | |
| Oil, Gas & Consumable Fuels - 0.5% | | | |
| Tesoro Corp. (b) | | 165,900 | 13,496 |
| FINANCIALS - 8.1% | | | |
| Banks - 2.3% | | | |
| Citizens Financial Group, Inc. | | 1,213,000 | 40,648 |
| Huntington Bancshares, Inc. | | 318,100 | 3,964 |
| Investors Bancorp, Inc. | | 940,000 | 12,728 |
| | | | 57,340 |
| Capital Markets - 2.4% | | | |
| MarketAxess Holdings, Inc. | | 30,500 | 5,056 |
| Moody's Corp. | | 365,734 | 36,756 |
| S&P Global, Inc. | | 168,000 | 19,990 |
| | | | 61,802 |
| Consumer Finance - 0.0% | | | |
| Credit Acceptance Corp. (a)(b) | | 300 | 58 |
| Diversified Financial Services - 0.6% | | | |
| Valvoline, Inc. (b) | | 713,000 | 14,966 |
| Insurance - 2.8% | | | |
| AmTrust Financial Services, Inc. | | 834,000 | 21,234 |
| Aon PLC | | 113,500 | 12,950 |
| Arch Capital Group Ltd. (a) | | 290,000 | 23,989 |
| Progressive Corp. | | 417,000 | 13,886 |
| | | | 72,059 |
|
| TOTAL FINANCIALS | | | 206,225 |
|
| HEALTH CARE - 14.6% | | | |
| Health Care Equipment & Supplies - 4.1% | | | |
| Edwards Lifesciences Corp. (a) | | 467,000 | 38,691 |
| Intuitive Surgical, Inc. (a) | | 56,400 | 36,307 |
| ResMed, Inc. (b) | | 499,700 | 30,722 |
| | | | 105,720 |
| Health Care Providers & Services - 7.5% | | | |
| Aetna, Inc. | | 46,000 | 6,019 |
| AmerisourceBergen Corp. | | 500,087 | 39,002 |
| Cardinal Health, Inc. | | 278,000 | 19,741 |
| Cigna Corp. | | 95,000 | 12,800 |
| DaVita HealthCare Partners, Inc. (a) | | 330,000 | 20,906 |
| HCA Holdings, Inc. (a) | | 280,000 | 19,849 |
| Henry Schein, Inc. (a) | | 119,166 | 17,751 |
| Laboratory Corp. of America Holdings (a) | | 128,000 | 16,109 |
| MEDNAX, Inc. (a) | | 288,940 | 18,917 |
| Universal Health Services, Inc. Class B | | 164,500 | 20,237 |
| | | | 191,331 |
| Life Sciences Tools & Services - 2.1% | | | |
| Charles River Laboratories International, Inc. (a) | | 339,300 | 24,124 |
| Mettler-Toledo International, Inc. (a) | | 72,800 | 29,995 |
| | | | 54,119 |
| Pharmaceuticals - 0.9% | | | |
| Jazz Pharmaceuticals PLC (a) | | 215,088 | 22,290 |
|
| TOTAL HEALTH CARE | | | 373,460 |
|
| INDUSTRIALS - 15.3% | | | |
| Aerospace & Defense - 3.5% | | | |
| Huntington Ingalls Industries, Inc. | | 201,000 | 35,931 |
| TransDigm Group, Inc. | | 213,425 | 53,661 |
| | | | 89,592 |
| Airlines - 1.3% | | | |
| Alaska Air Group, Inc. | | 170,000 | 13,986 |
| JetBlue Airways Corp. (a) | | 1,001,000 | 20,110 |
| | | | 34,096 |
| Commercial Services & Supplies - 1.2% | | | |
| Deluxe Corp. | | 217,000 | 14,691 |
| KAR Auction Services, Inc. | | 385,000 | 16,232 |
| | | | 30,923 |
| Electrical Equipment - 0.9% | | | |
| AMETEK, Inc. | | 480,000 | 22,728 |
| Industrial Conglomerates - 1.4% | | | |
| Roper Technologies, Inc. | | 195,597 | 35,425 |
| Machinery - 2.9% | | | |
| IDEX Corp. | | 230,000 | 21,530 |
| Toro Co. | | 365,024 | 19,321 |
| Wabtec Corp. (b) | | 379,400 | 32,124 |
| | | | 72,975 |
| Professional Services - 3.5% | | | |
| Equifax, Inc. | | 570,000 | 65,237 |
| Verisk Analytics, Inc. (a) | | 298,700 | 24,816 |
| | | | 90,053 |
| Trading Companies & Distributors - 0.6% | | | |
| W.W. Grainger, Inc. (b) | | 63,900 | 14,733 |
|
| TOTAL INDUSTRIALS | | | 390,525 |
|
| INFORMATION TECHNOLOGY - 24.6% | | | |
| Communications Equipment - 0.9% | | | |
| F5 Networks, Inc. (a) | | 154,217 | 21,706 |
| Electronic Equipment & Components - 1.4% | | | |
| Amphenol Corp. Class A | | 507,662 | 34,653 |
| Internet Software & Services - 2.2% | | | |
| VeriSign, Inc. (a)(b) | | 708,200 | 55,842 |
| IT Services - 9.8% | | | |
| Amdocs Ltd. | | 360,600 | 21,265 |
| Broadridge Financial Solutions, Inc. | | 477,014 | 30,882 |
| CoreLogic, Inc. (a) | | 104,000 | 3,924 |
| Fiserv, Inc. (a) | | 457,853 | 47,901 |
| FleetCor Technologies, Inc. (a) | | 152,100 | 22,715 |
| Genpact Ltd. (a) | | 314,373 | 7,523 |
| Global Payments, Inc. | | 650,000 | 44,558 |
| Paychex, Inc. | | 332,983 | 19,629 |
| Total System Services, Inc. | | 1,081,000 | 53,207 |
| | | | 251,604 |
| Semiconductors & Semiconductor Equipment - 5.1% | | | |
| Broadcom Ltd. | | 114,100 | 19,453 |
| KLA-Tencor Corp. | | 124,695 | 9,956 |
| Lam Research Corp. | | 407,500 | 43,203 |
| NXP Semiconductors NV (a) | | 296,285 | 29,377 |
| Skyworks Solutions, Inc. | | 378,700 | 29,103 |
| | | | 131,092 |
| Software - 5.2% | | | |
| Adobe Systems, Inc. (a) | | 102,000 | 10,487 |
| Check Point Software Technologies Ltd. (a) | | 300,264 | 24,721 |
| Electronic Arts, Inc. (a) | | 732,900 | 58,075 |
| Intuit, Inc. | | 180,000 | 20,462 |
| Manhattan Associates, Inc. (a) | | 384,000 | 20,122 |
| | | | 133,867 |
|
| TOTAL INFORMATION TECHNOLOGY | | | 628,764 |
|
| MATERIALS - 4.2% | | | |
| Chemicals - 3.2% | | | |
| Eastman Chemical Co. | | 211,000 | 15,850 |
| Sherwin-Williams Co. | | 126,084 | 33,875 |
| The Scotts Miracle-Gro Co. Class A | | 186,097 | 16,985 |
| Valspar Corp. | | 136,990 | 13,985 |
| | | | 80,695 |
| Containers & Packaging - 1.0% | | | |
| Ball Corp. | | 350,000 | 26,271 |
|
| TOTAL MATERIALS | | | 106,966 |
|
| REAL ESTATE - 3.6% | | | |
| Equity Real Estate Investment Trusts (REITs) - 3.4% | | | |
| Coresite Realty Corp. | | 226,000 | 15,940 |
| Digital Realty Trust, Inc. | | 226,000 | 20,867 |
| Equinix, Inc. | | 49,500 | 16,769 |
| Equity Lifestyle Properties, Inc. | | 85,457 | 5,933 |
| Extra Space Storage, Inc. | | 391,626 | 27,476 |
| | | | 86,985 |
| Real Estate Management & Development - 0.2% | | | |
| CBRE Group, Inc. (a) | | 214,900 | 6,241 |
|
| TOTAL REAL ESTATE | | | 93,226 |
|
| TOTAL COMMON STOCKS | | | |
| (Cost $2,483,871) | | | 2,527,599 |
|
| Money Market Funds - 6.1% | | | |
| Fidelity Cash Central Fund, 0.39% (c) | | 50,897,877 | 50,908 |
| Fidelity Securities Lending Cash Central Fund 0.48% (c)(d) | | 104,126,158 | 104,147 |
| TOTAL MONEY MARKET FUNDS | | | |
| (Cost $155,056) | | | 155,055 |
| TOTAL INVESTMENT PORTFOLIO - 105.0% | | | |
| (Cost $2,638,927) | | | 2,682,654 |
| NET OTHER ASSETS (LIABILITIES) - (5.0)% | | | (127,578) |
| NET ASSETS - 100% | | | $2,555,076 |
Legend
(a) Non-income producing
(b) Security or a portion of the security is on loan at period end.
(c) Affiliated fund that is generally available only to investment companies and other accounts managed by Fidelity Investments. The rate quoted is the annualized seven-day yield of the fund at period end. A complete unaudited listing of the fund's holdings as of its most recent quarter end is available upon request. In addition, each Fidelity Central Fund's financial statements, which are not covered by the Fund's Report of Independent Registered Public Accounting Firm, are available on the SEC's website or upon request.
(d) Investment made with cash collateral received from securities on loan.
Affiliated Central Funds
Information regarding fiscal year to date income earned by the Fund from investments in Fidelity Central Funds is as follows:
| Fund | Income earned |
| | (Amounts in thousands) |
| Fidelity Cash Central Fund | $138 |
| Fidelity Securities Lending Cash Central Fund | 1,840 |
| Total | $1,978 |
Investment Valuation
All investments are categorized as Level 1 under the Fair Value Hierarchy. The inputs or methodology used for valuing securities may not be an indication of the risk associated with investing in those securities. For more information on valuation inputs please refer to the Investment Valuation section in the accompanying Notes to Financial Statements.
See accompanying notes which are an integral part of the financial statements.
Financial Statements
Statement of Assets and Liabilities
| Amounts in thousands (except per-share amounts) | | November 30, 2016 |
| Assets | | |
Investment in securities, at value (including securities loaned of $101,582) — See accompanying schedule:
Unaffiliated issuers (cost $2,483,871) | $2,527,599 | |
| Fidelity Central Funds (cost $155,056) | 155,055 | |
| Total Investments (cost $2,638,927) | | $2,682,654 |
| Receivable for investments sold | | 45,725 |
| Receivable for fund shares sold | | 1,091 |
| Dividends receivable | | 2,933 |
| Distributions receivable from Fidelity Central Funds | | 79 |
| Prepaid expenses | | 7 |
| Other receivables | | 71 |
| Total assets | | 2,732,560 |
| Liabilities | | |
| Payable to custodian bank | $1,370 | |
| Payable for investments purchased | 67,194 | |
| Payable for fund shares redeemed | 2,917 | |
| Accrued management fee | 1,283 | |
| Other affiliated payables | 449 | |
| Other payables and accrued expenses | 143 | |
| Collateral on securities loaned, at value | 104,128 | |
| Total liabilities | | 177,484 |
| Net Assets | | $2,555,076 |
| Net Assets consist of: | | |
| Paid in capital | | $2,613,601 |
| Undistributed net investment income | | 11,987 |
| Accumulated undistributed net realized gain (loss) on investments | | (114,239) |
| Net unrealized appreciation (depreciation) on investments | | 43,727 |
| Net Assets | | $2,555,076 |
| Growth Strategies: | | |
| Net Asset Value, offering price and redemption price per share ($2,080,302 ÷ 61,422 shares) | | $33.87 |
| Class K: | | |
| Net Asset Value, offering price and redemption price per share ($474,774 ÷ 13,907 shares) | | $34.14 |
See accompanying notes which are an integral part of the financial statements.
Statement of Operations
| Amounts in thousands | | Year ended November 30, 2016 |
| Investment Income | | |
| Dividends | | $34,352 |
| Special dividends | | 4,212 |
| Income from Fidelity Central Funds | | 1,978 |
| Total income | | 40,542 |
| Expenses | | |
| Management fee | | |
| Basic fee | $16,992 | |
| Performance adjustment | 2,825 | |
| Transfer agent fees | 4,892 | |
| Accounting and security lending fees | 853 | |
| Custodian fees and expenses | 89 | |
| Independent trustees' fees and expenses | 13 | |
| Registration fees | 68 | |
| Audit | 61 | |
| Legal | 13 | |
| Miscellaneous | 24 | |
| Total expenses before reductions | 25,830 | |
| Expense reductions | (37) | 25,793 |
| Net investment income (loss) | | 14,749 |
| Realized and Unrealized Gain (Loss) | | |
| Net realized gain (loss) on: | | |
| Investment securities: | | |
| Unaffiliated issuers | 446,630 | |
| Fidelity Central Funds | 24 | |
| Total net realized gain (loss) | | 446,654 |
| Change in net unrealized appreciation (depreciation) on investment securities | | (468,799) |
| Net gain (loss) | | (22,145) |
| Net increase (decrease) in net assets resulting from operations | | $(7,396) |
See accompanying notes which are an integral part of the financial statements.
Statement of Changes in Net Assets
| Amounts in thousands | Year ended November 30, 2016 | Year ended November 30, 2015 |
| Increase (Decrease) in Net Assets | | |
| Operations | | |
| Net investment income (loss) | $14,749 | $4,820 |
| Net realized gain (loss) | 446,654 | 118,840 |
| Change in net unrealized appreciation (depreciation) | (468,799) | 15,704 |
| Net increase (decrease) in net assets resulting from operations | (7,396) | 139,364 |
| Distributions to shareholders from net investment income | (5,195) | (7,023) |
| Distributions to shareholders from net realized gain | – | (561) |
| Total distributions | (5,195) | (7,584) |
| Share transactions - net increase (decrease) | (665,611) | 880,713 |
| Redemption fees | 199 | 404 |
| Total increase (decrease) in net assets | (678,003) | 1,012,897 |
| Net Assets | | |
| Beginning of period | 3,233,079 | 2,220,182 |
| End of period | $2,555,076 | $3,233,079 |
| Other Information | | |
| Undistributed net investment income end of period | $11,987 | $3,212 |
See accompanying notes which are an integral part of the financial statements.
Financial Highlights — Fidelity Growth Strategies Fund
| Years ended November 30, | 2016 | 2015 | 2014 | 2013 | 2012 |
| Selected Per–Share Data | | | | | |
| Net asset value, beginning of period | $33.91 | $32.44 | $27.66 | $20.56 | $19.05 |
| Income from Investment Operations | | | | | |
| Net investment income (loss)A | .16B | .04 | .11 | .09 | .02C |
| Net realized and unrealized gain (loss) | (.16) | 1.53 | 4.72 | 7.10 | 1.49 |
| Total from investment operations | – | 1.57 | 4.83 | 7.19 | 1.51 |
| Distributions from net investment income | (.04) | (.09) | (.05) | (.07)D | – |
| Distributions from net realized gain | – | (.01) | – | (.02)D | – |
| Total distributions | (.04) | (.10) | (.05) | (.09) | – |
| Redemption fees added to paid in capitalA,E | – | – | – | – | – |
| Net asset value, end of period | $33.87 | $33.91 | $32.44 | $27.66 | $20.56 |
| Total ReturnF | .02% | 4.86% | 17.50% | 35.13% | 7.93% |
| Ratios to Average Net AssetsG,H | | | | | |
| Expenses before reductions | .94% | .91% | .72% | .71% | .73% |
| Expenses net of fee waivers, if any | .94% | .91% | .72% | .71% | .73% |
| Expenses net of all reductions | .94% | .91% | .72% | .69% | .72% |
| Net investment income (loss) | .49%B | .13% | .37% | .39% | .09%C |
| Supplemental Data | | | | | |
| Net assets, end of period (in millions) | $2,080 | $2,535 | $1,835 | $1,640 | $1,385 |
| Portfolio turnover rateI | 63% | 40% | 58% | 87% | 165% |
A Calculated based on average shares outstanding during the period.
B Net Investment income per share reflects a large, non-recurring dividend which amounted to $.05 per share. Excluding this non-recurring dividend, the ratio of net investment income (loss) to average net assets would have been .34%.
C Net Investment income per share reflects a large, non-recurring dividend which amounted to $.02 per share. Excluding this non-recurring dividend, the ratio of net investment income (loss) to average net assets would have been .00 %.
D The amounts shown reflect certain reclassifications related to book to tax differences that were made in the year shown.
E Amount represents less than $.005 per share.
F Total returns would have been lower if certain expenses had not been reduced during the applicable periods shown.
G Fees and expenses of any underlying Fidelity Central Funds are not included in the Fund's expense ratio. The Fund indirectly bears its proportionate share of the expenses of any underlying Fidelity Central Funds.
H Expense ratios reflect operating expenses of the class. Expenses before reductions do not reflect amounts reimbursed by the investment adviser or reductions from brokerage service arrangements or reductions from other expense offset arrangements and do not represent the amount paid by the class during periods when reimbursements or reductions occur. Expenses net of fee waivers reflect expenses after reimbursement by the investment adviser but prior to reductions from brokerage service arrangements or other expense offset arrangements. Expenses net of all reductions represent the net expenses paid by the class.
I Amount does not include the portfolio activity of any underlying Fidelity Central Funds.
See accompanying notes which are an integral part of the financial statements.
Financial Highlights — Fidelity Growth Strategies Fund Class K
| Years ended November 30, | 2016 | 2015 | 2014 | 2013 | 2012 |
| Selected Per–Share Data | | | | | |
| Net asset value, beginning of period | $34.17 | $32.70 | $27.88 | $20.74 | $19.17 |
| Income from Investment Operations | | | | | |
| Net investment income (loss)A | .21B | .10 | .17 | .15 | .07C |
| Net realized and unrealized gain (loss) | (.14) | 1.52 | 4.76 | 7.14 | 1.50 |
| Total from investment operations | .07 | 1.62 | 4.93 | 7.29 | 1.57 |
| Distributions from net investment income | (.10) | (.15) | (.11) | (.13)D | – |
| Distributions from net realized gain | – | (.01) | – | (.02)D | – |
| Total distributions | (.10) | (.15)E | (.11) | (.15) | – |
| Redemption fees added to paid in capitalA,F | – | – | – | – | – |
| Net asset value, end of period | $34.14 | $34.17 | $32.70 | $27.88 | $20.74 |
| Total ReturnG | .20% | 5.00% | 17.75% | 35.42% | 8.19% |
| Ratios to Average Net AssetsH,I | | | | | |
| Expenses before reductions | .78% | .76% | .53% | .48% | .48% |
| Expenses net of fee waivers, if any | .78% | .76% | .53% | .48% | .48% |
| Expenses net of all reductions | .78% | .76% | .53% | .46% | .47% |
| Net investment income (loss) | .64%B | .28% | .56% | .62% | .34%C |
| Supplemental Data | | | | | |
| Net assets, end of period (in millions) | $475 | $699 | $385 | $342 | $274 |
| Portfolio turnover rateJ | 63% | 40% | 58% | 87% | 165% |
A Calculated based on average shares outstanding during the period.
B Net Investment income per share reflects a large, non-recurring dividend which amounted to $.05 per share. Excluding this non-recurring dividend, the ratio of net investment income (loss) to average net assets would have been .50%.
C Net Investment income per share reflects a large, non-recurring dividend which amounted to $.02 per share. Excluding this non-recurring dividend, the ratio of net investment income (loss) to average net assets would have been .25%.
D The amounts shown reflect certain reclassifications related to book to tax differences that were made in the year shown.
E Total distributions of $.15 per share is comprised of distributions from net investment income of $.145 and distributions from net realized gain of $.008 per share.
F Amount represents less than $.005 per share.
G Total returns would have been lower if certain expenses had not been reduced during the applicable periods shown.
H Fees and expenses of any underlying Fidelity Central Funds are not included in the Fund's expense ratio. The Fund indirectly bears its proportionate share of the expenses of any underlying Fidelity Central Funds.
I Expense ratios reflect operating expenses of the class. Expenses before reductions do not reflect amounts reimbursed by the investment adviser or reductions from brokerage service arrangements or reductions from other expense offset arrangements and do not represent the amount paid by the class during periods when reimbursements or reductions occur. Expenses net of fee waivers reflect expenses after reimbursement by the investment adviser but prior to reductions from brokerage service arrangements or other expense offset arrangements. Expenses net of all reductions represent the net expenses paid by the class.
J Amount does not include the portfolio activity of any underlying Fidelity Central Funds.
See accompanying notes which are an integral part of the financial statements.
Notes to Financial Statements
For the period ended November 30, 2016
(Amounts in thousands except percentages)
1. Organization.
Fidelity Growth Strategies Fund (the Fund) is a fund of Fidelity Mt. Vernon Street Trust (the Trust) and is authorized to issue an unlimited number of shares. The Trust is registered under the Investment Company Act of 1940, as amended (the 1940 Act), as an open-end management investment company organized as a Massachusetts business trust. The Fund offers Growth Strategies and Class K shares, each of which has equal rights as to assets and voting privileges. Each class has exclusive voting rights with respect to matters that affect that class.
2. Investments in Fidelity Central Funds.
The Fund invests in Fidelity Central Funds, which are open-end investment companies generally available only to other investment companies and accounts managed by the investment adviser and its affiliates. The Fund's Schedule of Investments lists each of the Fidelity Central Funds held as of period end, if any, as an investment of the Fund, but does not include the underlying holdings of each Fidelity Central Fund. As an Investing Fund, the Fund indirectly bears its proportionate share of the expenses of the underlying Fidelity Central Funds.
The Money Market Central Funds seek preservation of capital and current income and are managed by Fidelity Investments Money Management, Inc. (FIMM), an affiliate of the investment adviser. Annualized expenses of the Money Market Central Funds as of their most recent shareholder report date are less than .005%.
A complete unaudited list of holdings for each Fidelity Central Fund is available upon request or at the Securities and Exchange Commission (the SEC) website at www.sec.gov. In addition, the financial statements of the Fidelity Central Funds, which are not covered by the Fund's Report of Independent Registered Public Accounting Firm, are available on the SEC website or upon request.
3. Significant Accounting Policies.
The financial statements have been prepared in conformity with accounting principles generally accepted in the United States of America (GAAP), which require management to make certain estimates and assumptions at the date of the financial statements. Actual results could differ from those estimates. Subsequent events, if any, through the date that the financial statements were issued have been evaluated in the preparation of the financial statements. The following summarizes the significant accounting policies of the Fund:
Investment Valuation. Investments are valued as of 4:00 p.m. Eastern time on the last calendar day of the period. The Board of Trustees (the Board) has delegated the day to day responsibility for the valuation of the Fund's investments to the Fair Value Committee (the Committee) established by the Fund's investment adviser. In accordance with valuation policies and procedures approved by the Board, the Fund attempts to obtain prices from one or more third party pricing vendors or brokers to value its investments. When current market prices, quotations or currency exchange rates are not readily available or reliable, investments will be fair valued in good faith by the Committee, in accordance with procedures adopted by the Board. Factors used in determining fair value vary by investment type and may include market or investment specific events. The frequency with which these procedures are used cannot be predicted and they may be utilized to a significant extent. The Committee oversees the Fund's valuation policies and procedures and reports to the Board on the Committee's activities and fair value determinations. The Board monitors the appropriateness of the procedures used in valuing the Fund's investments and ratifies the fair value determinations of the Committee.
The Fund categorizes the inputs to valuation techniques used to value its investments into a disclosure hierarchy consisting of three levels as shown below:
- Level 1 – quoted prices in active markets for identical investments
- Level 2 – other significant observable inputs (including quoted prices for similar investments, interest rates, prepayment speeds, etc.)
- Level 3 – unobservable inputs (including the Fund's own assumptions based on the best information available)
Valuation techniques used to value the Fund's investments by major category are as follows:
Equity securities, including restricted securities, for which market quotations are readily available, are valued at the last reported sale price or official closing price as reported by a third party pricing vendor on the primary market or exchange on which they are traded and are categorized as Level 1 in the hierarchy. In the event there were no sales during the day or closing prices are not available, securities are valued at the last quoted bid price or may be valued using the last available price and are generally categorized as Level 2 in the hierarchy. For foreign equity securities, when market or security specific events arise, comparisons to the valuation of American Depositary Receipts (ADRs), futures contracts, Exchange-Traded Funds (ETFs) and certain indexes as well as quoted prices for similar securities may be used and would be categorized as Level 2 in the hierarchy. Utilizing these techniques may result in transfers between Level 1 and Level 2. For equity securities, including restricted securities, where observable inputs are limited, assumptions about market activity and risk are used and these securities may be categorized as Level 3 in the hierarchy.
Investments in open-end mutual funds, including the Fidelity Central Funds, are valued at their closing net asset value (NAV) each business day and are categorized as Level 1 in the hierarchy.
Changes in valuation techniques may result in transfers in or out of an assigned level within the disclosure hierarchy.
Investment Transactions and Income. For financial reporting purposes, the Fund's investment holdings and NAV include trades executed through the end of the last business day of the period. The NAV per share for processing shareholder transactions is calculated as of the close of business of the New York Stock Exchange (NYSE), normally 4:00 p.m. Eastern time and includes trades executed through the end of the prior business day. Gains and losses on securities sold are determined on the basis of identified cost and may include proceeds received from litigation. Dividend income is recorded on the ex-dividend date, except for certain dividends from foreign securities where the ex-dividend date may have passed, which are recorded as soon as the Fund is informed of the ex-dividend date. Non-cash dividends included in dividend income, if any, are recorded at the fair market value of the securities received. Income and capital gain distributions from Fidelity Central Funds, if any, are recorded on the ex-dividend date. Certain distributions received by the Fund represent a return of capital or capital gain. The Fund determines the components of these distributions subsequent to the ex-dividend date, based upon receipt of tax filings or other correspondence relating to the underlying investment. These distributions are recorded as a reduction of cost of investments and/or as a realized gain. Large, non-recurring dividends recognized by the Fund are presented separately on the Statement of Operations as "Special Dividends" and the impact of these dividends is presented in the Financial Highlights.
Class Allocations and Expenses. Investment income, realized and unrealized capital gains and losses, common expenses of the Fund, and certain fund-level expense reductions, if any, are allocated daily on a pro-rata basis to each class based on the relative net assets of each class to the total net assets of the Fund. Each class differs with respect to transfer agent fees incurred. Certain expense reductions may also differ by class. For the reporting period, the allocated portion of income and expenses to each class as a percent of its average net assets may vary due to the timing of recording these transactions in relation to fluctuating net assets of the classes. Expenses directly attributable to a fund are charged to that fund. Expenses attributable to more than one fund are allocated among the respective funds on the basis of relative net assets or other appropriate methods. Expense estimates are accrued in the period to which they relate and adjustments are made when actual amounts are known.
Deferred Trustee Compensation. Under a Deferred Compensation Plan (the Plan), independent Trustees may elect to defer receipt of a portion of their annual compensation. Deferred amounts are invested in a cross-section of Fidelity funds, are marked-to-market and remain in the Fund until distributed in accordance with the Plan. The investment of deferred amounts and the offsetting payable to the Trustees are included in the accompanying Statement of Assets and Liabilities.
Income Tax Information and Distributions to Shareholders. Each year, the Fund intends to qualify as a regulated investment company under Subchapter M of the Internal Revenue Code, including distributing substantially all of its taxable income and realized gains. As a result, no provision for U.S. Federal income taxes is required. As of November 30, 2016, the Fund did not have any unrecognized tax benefits in the financial statements; nor is the Fund aware of any tax positions for which it is reasonably possible that the total amounts of unrecognized tax benefits will significantly change in the next twelve months. The Fund files a U.S. federal tax return, in addition to state and local tax returns as required. The Fund's federal income tax returns are subject to examination by the Internal Revenue Service (IRS) for a period of three fiscal years after they are filed. State and local tax returns may be subject to examination for an additional fiscal year depending on the jurisdiction.
Distributions are declared and recorded on the ex-dividend date. Income dividends and capital gain distributions are declared separately for each class. Income and capital gain distributions are determined in accordance with income tax regulations, which may differ from GAAP.
Capital accounts within the financial statements are adjusted for permanent book-tax differences. These adjustments have no impact on net assets or the results of operations. Capital accounts are not adjusted for temporary book-tax differences which will reverse in a subsequent period.
Book-tax differences are primarily due to partnerships, deferred trustees compensation, capital loss carryforwards, and losses deferred due to wash sales.
The federal tax cost of investment securities and unrealized appreciation (depreciation) as of period end were as follows:
| Gross unrealized appreciation | $176,837 |
| Gross unrealized depreciation | (133,110) |
| Net unrealized appreciation (depreciation) on securities | $43,727 |
| Tax Cost | $2,638,927 |
The tax-based components of distributable earnings as of period end were as follows:
| Undistributed ordinary income | $12,949 |
| Capital loss carryforward | $(115,128) |
| Net unrealized appreciation (depreciation) on securities and other investments | $43,727 |
Capital loss carryforwards are only available to offset future capital gains of the Fund to the extent provided by regulations and may be limited. Under the Regulated Investment Company Modernization Act of 2010 (the Act), the Fund is permitted to carry forward capital losses incurred in taxable years beginning after December 22, 2010 for an unlimited period and such capital losses are required to be used prior to any losses that expire. The capital loss carryforward information presented below, including any applicable limitation, is estimated as of fiscal period end and is subject to adjustment.
| Fiscal year of expiration | |
| 2017 | $(115,128) |
The tax character of distributions paid was as follows:
| | November 30, 2016 | November 30, 2015 |
| Ordinary Income | $5,195 | $ 7,584 |
Short-Term Trading (Redemption) Fees. Shares held by investors in the Fund less than 90 days may have been subject to a redemption fee equal to 1.50% of the NAV of shares redeemed. All redemption fees, which reduce the proceeds of the shareholder redemption, are retained by the Fund and accounted for as an addition to paid in capital. In November 2016, the Board of Trustees approved the elimination of these redemption fees effective December 12, 2016.
4. Purchases and Sales of Investments.
Purchases and sales of securities, other than short-term securities, aggregated $1,773,154 and $2,416,125, respectively.
5. Fees and Other Transactions with Affiliates.
Management Fee. Fidelity Management & Research Company (the investment adviser) and its affiliates provide the Fund with investment management related services for which the Fund pays a monthly management fee. The management fee is the sum of an individual fund fee rate that is based on an annual rate of .35% of the Fund's average net assets and an annualized group fee rate that averaged .25% during the period. The group fee rate is based upon the average net assets of all the mutual funds advised by the investment adviser, including any mutual funds previously advised by the investment adviser that are currently advised by Fidelity SelectCo, LLC, an affiliate of the investment adviser. The group fee rate decreases as assets under management increase and increases as assets under management decrease. In addition, the management fee is subject to a performance adjustment (up to a maximum of +/- .20% of the Fund's average net assets over a 36 month performance period). The upward or downward adjustment to the management fee is based on the relative investment performance of Growth Strategies as compared to its benchmark index, the Russell Midcap Growth Index, over the same 36 month performance period. For the reporting period, the total annual management fee rate, including the performance adjustment, was .70% of the Fund's average net assets. The performance adjustment included in the management fee rate may be higher or lower than the maximum performance adjustment rate due to the difference between the average net assets for the reporting and performance periods.
Effective February 1, 2017, the Board of Trustees approved a reduction in the individual fund fee rate from .35% to .30%.
Transfer Agent Fees. Fidelity Investments Institutional Operations Company, Inc., (FIIOC), an affiliate of the investment adviser, is the transfer, dividend disbursing and shareholder servicing agent for each class of the Fund. FIIOC receives account fees and asset-based fees that vary according to the account size and type of account of the shareholders of Growth Strategies. FIIOC receives an asset-based fee of Class K's average net assets. FIIOC pays for typesetting, printing and mailing of shareholder reports, except proxy statements.
For the period, transfer agent fees for each class were as follows:
| | Amount | % of
Class-Level Average
Net Assets |
| Growth Strategies | $4,610 | .21 |
| Class K | 282 | .05 |
| | $4,892 | |
Accounting and Security Lending Fees. Fidelity Service Company, Inc. (FSC), an affiliate of the investment adviser, maintains the Fund's accounting records. The accounting fee is based on the level of average net assets for each month. Under a separate contract, FSC administers the security lending program. The security lending fee is based on the number and duration of lending transactions.
Brokerage Commissions. The Fund placed a portion of its portfolio transactions with brokerage firms which are affiliates of the investment adviser. Brokerage commissions are included in net realized gain (loss) and change in net unrealized appreciation (depreciation) in the Statement of Operations. The commissions paid to these affiliated firms were $62 for the period.
Interfund Trades. The Fund may purchase from or sell securities to other Fidelity Funds under procedures adopted by the Board. The procedures have been designed to ensure these interfund trades are executed in accordance with Rule 17a-7 of the 1940 Act. Interfund trades are included within the respective purchases and sales amounts shown in the Purchases and Sales of Investments note.
Other. During the period, the investment adviser reimbursed the Fund for certain losses in the amount of $1.
6. Committed Line of Credit.
The Fund participates with other funds managed by the investment adviser or an affiliate in a $4.25 billion credit facility (the "line of credit") to be utilized for temporary or emergency purposes to fund shareholder redemptions or for other short-term liquidity purposes. The Fund has agreed to pay commitment fees on its pro-rata portion of the line of credit, which amounted to $7 and is reflected in Miscellaneous expenses on the Statement of Operations. Interest is charged to the Fund based on its borrowing at a rate equal to .75% plus the higher of the Federal Funds Rate or one-month LIBOR. The Fund's average daily loan balance during the period for which loans were outstanding amounted to $5,000. The weighted average interest rate and interest expense was 1.037% and less than five hundred dollars, respectively.
7. Security Lending.
The Fund lends portfolio securities through a lending agent from time to time in order to earn additional income. For equity securities, a lending agent is used and may loan securities to certain qualified borrowers, including Fidelity Capital Markets (FCM), a broker-dealer affiliated with the Fund. On the settlement date of the loan, the Fund receives collateral (in the form of U.S. Treasury obligations, letters of credit and/or cash) against the loaned securities and maintains collateral in an amount not less than 100% of the market value of the loaned securities during the period of the loan. The market value of the loaned securities is determined at the close of business of the Fund and any additional required collateral is delivered to the Fund on the next business day. The Fund or borrower may terminate the loan at any time, and if the borrower defaults on its obligation to return the securities loaned because of insolvency or other reasons, the Fund may apply collateral received from the borrower against the obligation. The Fund may experience delays and costs in recovering the securities loaned. Any cash collateral received is invested in the Fidelity Securities Lending Cash Central Fund. The value of loaned securities and cash collateral at period end are disclosed on the Fund's Statement of Assets and Liabilities. At period end, there were no security loans outstanding with FCM. Security lending income represents the income earned on investing cash collateral, less rebates paid to borrowers and any lending agent fees associated with the loan, plus any premium payments received for lending certain types of securities. Security lending income is presented in the Statement of Operations as a component of income from Fidelity Central Funds. Total security lending income during the period amounted to $1,840, including $9 from securities loaned to FCM.
8. Expense Reductions.
Commissions paid to certain brokers with whom the investment adviser, or its affiliates, places trades on behalf of the Fund include an amount in addition to trade execution, which may be rebated back to the Fund to offset certain expenses. This amount totaled $14 for the period.
In addition, during the period the investment adviser reimbursed and/or waived a portion of fund-level operating expenses in the amount of $23.
9. Distributions to Shareholders.
Distributions to shareholders of each class were as follows:
| | Year ended
November 30, 2016 | Year ended
November 30, 2015 |
| From net investment income | | |
| Growth Strategies | $3,237 | $5,313 |
| Class K | 1,958 | 1,710 |
| Total | $5,195 | $7,023 |
| From net realized gain | | |
| Growth Strategies | $– | $467 |
| Class K | – | 94 |
| Total | $– | $561 |
10. Share Transactions.
Share transactions for each class were as follows and may contain automatic conversions between classes or exchanges between affiliated funds:
| | Shares | Shares | Dollars | Dollars |
| | Year ended November 30, 2016 | Year ended November 30, 2015 | Year ended November 30, 2016 | Year ended November 30, 2015 |
| Growth Strategies | | | | |
| Shares sold | 6,979 | 28,968 | $228,892 | $964,524 |
| Reinvestment of distributions | 94 | 179 | 3,102 | 5,600 |
| Shares redeemed | (20,401) | (10,968) | (674,632) | (368,991) |
| Net increase (decrease) | (13,328) | 18,179 | $(442,638) | $601,133 |
| Class K | | | | |
| Shares sold | 3,172 | 12,315 | $103,937 | $404,341 |
| Reinvestment of distributions | 59 | 57 | 1,958 | 1,804 |
| Shares redeemed | (9,765) | (3,697) | (328,868) | (126,565) |
| Net increase (decrease) | (6,534) | 8,675 | $(222,973) | $279,580 |
11. Other.
The Fund's organizational documents provide former and current trustees and officers with a limited indemnification against liabilities arising in connection with the performance of their duties to the Fund. In the normal course of business, the Fund may also enter into contracts that provide general indemnifications. The Fund's maximum exposure under these arrangements is unknown as this would be dependent on future claims that may be made against the Fund. The risk of material loss from such claims is considered remote.
Report of Independent Registered Public Accounting Firm
To the Trustees of Fidelity Mt. Vernon Street Trust and Shareholders of Fidelity Growth Strategies Fund:
In our opinion, the accompanying statement of assets and liabilities, including the schedule of investments, and the related statements of operations and of changes in net assets and the financial highlights present fairly, in all material respects, the financial position of Fidelity Growth Strategies Fund (a fund of Fidelity Mt. Vernon Street Trust) at November 30, 2016, the results of its operations for the year then ended, the changes in its net assets for each of the two years in the period then ended and the financial highlights for each of the five years in the period then ended, in conformity with accounting principles generally accepted in the United States of America. These financial statements and financial highlights (hereafter referred to as “financial statements”) are the responsibility of the Fidelity Growth Strategies Fund’s management. Our responsibility is to express an opinion on these financial statements based on our audits. We conducted our audits of these financial statements in accordance with the standards of the Public Company Accounting Oversight Board (United States). Those standards require that we plan and perform the audit to obtain reasonable assurance about whether the financial statements are free of material misstatement. An audit includes examining, on a test basis, evidence supporting the amounts and disclosures in the financial statements, assessing the accounting principles used and significant estimates made by management, and evaluating the overall financial statement presentation. We believe that our audits, which included confirmation of securities at November 30, 2016 by correspondence with the custodian and brokers, provide a reasonable basis for our opinion.
PricewaterhouseCoopers LLP
Boston, Massachusetts
January 18, 2017
Trustees and Officers
The Trustees, Members of the Advisory Board (if any), and officers of the trust and fund, as applicable, are listed below. The Board of Trustees governs the fund and is responsible for protecting the interests of shareholders. The Trustees are experienced executives who meet periodically throughout the year to oversee the fund's activities, review contractual arrangements with companies that provide services to the fund, oversee management of the risks associated with such activities and contractual arrangements, and review the fund's performance. Each of the Trustees oversees 170 funds.
The Trustees hold office without limit in time except that (a) any Trustee may resign; (b) any Trustee may be removed by written instrument, signed by at least two-thirds of the number of Trustees prior to such removal; (c) any Trustee who requests to be retired or who has become incapacitated by illness or injury may be retired by written instrument signed by a majority of the other Trustees; and (d) any Trustee may be removed at any special meeting of shareholders by a two-thirds vote of the outstanding voting securities of the trust. Each Trustee who is not an interested person (as defined in the 1940 Act) of the trust and the fund is referred to herein as an Independent Trustee. Each Independent Trustee shall retire not later than the last day of the calendar year in which his or her 75th birthday occurs. The Independent Trustees may waive this mandatory retirement age policy with respect to individual Trustees. Officers and Advisory Board Members hold office without limit in time, except that any officer or Advisory Board Member may resign or may be removed by a vote of a majority of the Trustees at any regular meeting or any special meeting of the Trustees. Except as indicated, each individual has held the office shown or other offices in the same company for the past five years.
The fund’s Statement of Additional Information (SAI) includes more information about the Trustees. To request a free copy, call Fidelity at 1-800-544-8544.
Experience, Skills, Attributes, and Qualifications of the Trustees. The Governance and Nominating Committee has adopted a statement of policy that describes the experience, qualifications, attributes, and skills that are necessary and desirable for potential Independent Trustee candidates (Statement of Policy). The Board believes that each Trustee satisfied at the time he or she was initially elected or appointed a Trustee, and continues to satisfy, the standards contemplated by the Statement of Policy. The Governance and Nominating Committee also engages professional search firms to help identify potential Independent Trustee candidates who have the experience, qualifications, attributes, and skills consistent with the Statement of Policy. From time to time, additional criteria based on the composition and skills of the current Independent Trustees, as well as experience or skills that may be appropriate in light of future changes to board composition, business conditions, and regulatory or other developments, have also been considered by the professional search firms and the Governance and Nominating Committee. In addition, the Board takes into account the Trustees' commitment and participation in Board and committee meetings, as well as their leadership of standing and ad hoc committees throughout their tenure.
In determining that a particular Trustee was and continues to be qualified to serve as a Trustee, the Board has considered a variety of criteria, none of which, in isolation, was controlling. The Board believes that, collectively, the Trustees have balanced and diverse experience, qualifications, attributes, and skills, which allow the Board to operate effectively in governing the fund and protecting the interests of shareholders. Information about the specific experience, skills, attributes, and qualifications of each Trustee, which in each case led to the Board's conclusion that the Trustee should serve (or continue to serve) as a trustee of the fund, is provided below.
Board Structure and Oversight Function. James C. Curvey is an interested person and currently serves as Chairman. The Trustees have determined that an interested Chairman is appropriate and benefits shareholders because an interested Chairman has a personal and professional stake in the quality and continuity of services provided to the fund. Independent Trustees exercise their informed business judgment to appoint an individual of their choosing to serve as Chairman, regardless of whether the Trustee happens to be independent or a member of management. The Independent Trustees have determined that they can act independently and effectively without having an Independent Trustee serve as Chairman and that a key structural component for assuring that they are in a position to do so is for the Independent Trustees to constitute a substantial majority for the Board. The Independent Trustees also regularly meet in executive session. Ned C. Lautenbach serves as Chairman of the Independent Trustees and as such (i) acts as a liaison between the Independent Trustees and management with respect to matters important to the Independent Trustees and (ii) with management prepares agendas for Board meetings.
Fidelity® funds are overseen by different Boards of Trustees. The fund's Board oversees Fidelity's high income and certain equity funds, and other Boards oversee Fidelity's investment-grade bond, money market, asset allocation, and sector funds. The asset allocation funds may invest in Fidelity® funds overseen by the fund's Board. The use of separate Boards, each with its own committee structure, allows the Trustees of each group of Fidelity® funds to focus on the unique issues of the funds they oversee, including common research, investment, and operational issues. On occasion, the separate Boards establish joint committees to address issues of overlapping consequences for the Fidelity® funds overseen by each Board.
The Trustees operate using a system of committees to facilitate the timely and efficient consideration of all matters of importance to the Trustees, the fund, and fund shareholders and to facilitate compliance with legal and regulatory requirements and oversight of the fund's activities and associated risks. The Board, acting through its committees, has charged FMR and its affiliates with (i) identifying events or circumstances the occurrence of which could have demonstrably adverse effects on the fund's business and/or reputation; (ii) implementing processes and controls to lessen the possibility that such events or circumstances occur or to mitigate the effects of such events or circumstances if they do occur; and (iii) creating and maintaining a system designed to evaluate continuously business and market conditions in order to facilitate the identification and implementation processes described in (i) and (ii) above. Because the day-to-day operations and activities of the fund are carried out by or through FMR, its affiliates, and other service providers, the fund's exposure to risks is mitigated but not eliminated by the processes overseen by the Trustees. While each of the Board's committees has responsibility for overseeing different aspects of the fund's activities, oversight is exercised primarily through the Operations, Audit, and Compliance Committees. In addition, the Independent Trustees have worked with FMR to enhance the Board's oversight of investment and financial risks, legal and regulatory risks, technology risks, and operational risks, including the development of additional risk reporting to the Board. For example, a working group comprised of Independent Trustees and FMR has worked and continues to work to review the Fidelity® funds' valuation-related activities, reporting and risk management. Appropriate personnel, including but not limited to the fund's Chief Compliance Officer (CCO), FMR's internal auditor, the independent accountants, the fund's Treasurer and portfolio management personnel, make periodic reports to the Board's committees, as appropriate, including an annual review of Fidelity's risk management program for the Fidelity® funds. The responsibilities of each standing committee, including their oversight responsibilities, are described further under "Standing Committees of the Trustees."
Interested Trustees*:
Correspondence intended for a Trustee who is an interested person may be sent to Fidelity Investments, 245 Summer Street, Boston, Massachusetts 02210.
Name, Year of Birth; Principal Occupations and Other Relevant Experience+
James C. Curvey (1935)
Year of Election or Appointment: 2007
Trustee
Chairman of the Board of Trustees
Mr. Curvey also serves as Trustee of other Fidelity® funds. Mr. Curvey is a Director of Fidelity Research & Analysis Co. (investment adviser firm, 2009-present), and Vice Chairman (2007-present) and Director of FMR LLC (diversified financial services company). In addition, Mr. Curvey serves as an Overseer for the Boston Symphony Orchestra and a member of the board of Artis-Naples, Naples, Florida, and as a Trustee for Brewster Academy, Wolfeboro, New Hampshire. Previously, Mr. Curvey served as a Director of Fidelity Investments Money Management, Inc. (investment adviser firm, 2009-2014) and a Director of FMR and FMR Co., Inc. (investment adviser firms, 2007-2014).
Charles S. Morrison (1960)
Year of Election or Appointment: 2014
Trustee
Mr. Morrison also serves as Trustee of other funds. He serves as President of Fidelity Management & Research Company (FMR) (investment adviser firm, 2016-present), a Director of Fidelity Investments Money Management, Inc. (FIMM) (investment adviser firm, 2014-present), Director of Fidelity SelectCo, LLC (investment adviser firm, 2014-present), President, Asset Management (2014-present), and is an employee of Fidelity Investments. Previously, Mr. Morrison served as Vice President of Fidelity's Fixed Income and Asset Allocation Funds (2012-2014), President, Fixed Income (2011-2014), Vice President of Fidelity's Money Market Funds (2005-2009), President, Money Market Group Leader of FMR (investment adviser firm, 2009), and Senior Vice President, Money Market Group of FMR (2004-2009). Mr. Morrison also served as Vice President of Fidelity's Bond Funds (2002-2005), certain Balanced Funds (2002-2005), and certain Asset Allocation Funds (2002-2007), and as Senior Vice President (2002-2005) of Fidelity's Bond Division.
* Determined to be an “Interested Trustee” by virtue of, among other things, his or her affiliation with the trust or various entities under common control with FMR.
+ The information includes the Trustee's principal occupation during the last five years and other information relating to the experience, attributes, and skills relevant to the Trustee's qualifications to serve as a Trustee, which led to the conclusion that the Trustee should serve as a Trustee for the fund.
Independent Trustees:
Correspondence intended for an Independent Trustee may be sent to Fidelity Investments, P.O. Box 55235, Boston, Massachusetts 02205-5235.
Name, Year of Birth; Principal Occupations and Other Relevant Experience+
Dennis J. Dirks (1948)
Year of Election or Appointment: 2005
Trustee
Mr. Dirks also serves as Trustee of other Fidelity® funds. Prior to his retirement in May 2003, Mr. Dirks was Chief Operating Officer and a member of the Board of The Depository Trust & Clearing Corporation (DTCC). He also served as President, Chief Operating Officer, and Board member of The Depository Trust Company (DTC) and President and Board member of the National Securities Clearing Corporation (NSCC). In addition, Mr. Dirks served as Chief Executive Officer and Board member of the Government Securities Clearing Corporation, Chief Executive Officer and Board member of the Mortgage-Backed Securities Clearing Corporation, as a Trustee and a member of the Finance Committee of Manhattan College (2005-2008), as a Trustee and a member of the Finance Committee of AHRC of Nassau County (2006-2008), and as a member of the Independent Directors Council (IDC) Governing Council (2010-2015). Mr. Dirks is a member of the Board of Directors for The Brookville Center for Children's Services, Inc. (2009-present) and the Finance Committee of the Asolo Repertory Theatre (2016-present).
Alan J. Lacy (1953)
Year of Election or Appointment: 2008
Trustee
Mr. Lacy also serves as Trustee of other Fidelity® funds. Mr. Lacy serves as Chairman (2014-present) and a member (2010-present) of the Board of Directors of Dave & Buster's Entertainment, Inc. (restaurant and entertainment complexes) and a Director of Bristol-Myers Squibb Company (global pharmaceuticals, 2008-present). He is a Trustee of the California Chapter of The Nature Conservancy (2015-present) and a Director of the Center for Advanced Study in the Behavioral Sciences at Stanford University (2015-present). In addition, Mr. Lacy served as Senior Adviser (2007-2014) of Oak Hill Capital Partners, L.P. (private equity) and also served as Chief Executive Officer (2005) and Vice Chairman (2005-2006) of Sears Holdings Corporation (retail) and Chief Executive Officer and Chairman of the Board of Sears, Roebuck and Co. (retail, 2000-2005). Previously, Mr. Lacy served as Chairman (2008-2011) and a member (2006-2015) of the Board of Trustees of the National Parks Conservation Association and as a member of the Board of Directors for The Western Union Company (global money transfer, 2006-2011), The Hillman Companies, Inc. (hardware wholesalers, 2010-2014), and Earth Fare, Inc. (retail grocery, 2010-2014).
Ned C. Lautenbach (1944)
Year of Election or Appointment: 2000
Trustee
Chairman of the Independent Trustees
Mr. Lautenbach also serves as Trustee of other Fidelity® funds. Mr. Lautenbach currently serves as the Lead Director of the Eaton Corporation Board of Directors (diversified industrial, 1997-present). Mr. Lautenbach is Chairman of the Board of Directors of Artis-Naples in Naples, Florida (2012-present), a member of the Council on Foreign Relations (1994-present), and currently Vice Chair of the Board of Governors, State University System of Florida (2013-present). Previously, Mr. Lautenbach was a Partner and Advisory Partner at Clayton, Dubilier & Rice, LLC (private equity investment, 1998-2010), as well as a Director of Sony Corporation (2006-2007). Mr. Lautenbach also had a 30-year career with IBM (technology company) during which time he served as Senior Vice President and a member of the Corporate Executive Committee (1968-1998).
Joseph Mauriello (1944)
Year of Election or Appointment: 2008
Trustee
Mr. Mauriello also serves as Trustee of other Fidelity® funds. Prior to his retirement in January 2006, Mr. Mauriello served in numerous senior management positions including Deputy Chairman and Chief Operating Officer (2004-2005), and Vice Chairman of Financial Services (2002-2004) of KPMG LLP US (professional services, 1965-2005). Mr. Mauriello currently serves as a member of the Board of Directors of XL Group plc. (global insurance and re-insurance, 2006-present) and the Independent Directors Council (IDC) Governing Council (2015-present). Previously, Mr. Mauriello served as a Director of the Hamilton Funds of the Bank of New York (2006-2007) and of Arcadia Resources Inc. (health care services and products, 2007-2012).
Robert W. Selander (1950)
Year of Election or Appointment: 2011
Trustee
Mr. Selander also serves as Trustee of other Fidelity® funds. Mr. Selander serves as a Director of The Western Union Company (global money transfer, 2014-present) and a non-executive Chairman of Health Equity, Inc. (health savings custodian, 2015-present). Previously, Mr. Selander served as a Member of the Advisory Board of certain Fidelity® funds (2011), and Executive Vice Chairman (2010), Chief Executive Officer (2009-2010), and President and Chief Executive Officer (1997-2009) of Mastercard, Inc.
Cornelia M. Small (1944)
Year of Election or Appointment: 2005
Trustee
Ms. Small also serves as Trustee of other Fidelity® funds. Ms. Small is a member of the Board of Directors (2009-present) and Chair of the Investment Committee (2010-present) of the Teagle Foundation. Ms. Small also serves on the Investment Committee of the Berkshire Taconic Community Foundation (2008-present). Previously, Ms. Small served as Chairperson (2002-2008) and a member of the Investment Committee and Chairperson (2008-2012) and a member of the Board of Trustees of Smith College. In addition, Ms. Small served as Chief Investment Officer, Director of Global Equity Investments, and a member of the Board of Directors of Scudder, Stevens & Clark and Scudder Kemper Investments.
William S. Stavropoulos (1939)
Year of Election or Appointment: 2002
Trustee
Vice Chairman of the Independent Trustees
Mr. Stavropoulos also serves as Trustee of other Fidelity® funds. Mr. Stavropoulos serves as President and Founder of the Michigan Baseball Foundation, the Great Lakes Loons (2007-present). Mr. Stavropoulos is Chairman Emeritus of the Board of Directors of The Dow Chemical Company, where he previously served in numerous senior management positions, including President, CEO (1995-2000; 2002-2004), Chairman of the Executive Committee (2000-2006), and as a member of the Board of Directors (1990-2006). Currently, Mr. Stavropoulos is Chairman of the Board of Directors of Univar Inc. (global distributor of commodity and specialty chemicals), a Director of Teradata Corporation (data warehousing and technology solutions), and a member of the Advisory Board for Metalmark Capital LLC (private equity investment, 2005-present). Mr. Stavropoulos is an operating advisor to Clayton, Dubilier & Rice, LLC (private equity investment). In addition, Mr. Stavropoulos is a member of the University of Notre Dame Advisory Council for the College of Science, a Trustee of the Rollin L. Gerstacker Foundation, and a Director of Artis-Naples in Naples, Florida. Previously, Mr. Stavropoulos served as a Director of Chemical Financial Corporation (bank holding company, 1993-2012) and Tyco International, Ltd. (multinational manufacturing and services, 2007-2012).
David M. Thomas (1949)
Year of Election or Appointment: 2008
Trustee
Mr. Thomas also serves as Trustee of other Fidelity® funds. Mr. Thomas serves as Non-Executive Chairman of the Board of Directors of Fortune Brands Home and Security (home and security products, 2011-present), as a member of the Board of Directors (2004-present) and Presiding Director (2013-present) of Interpublic Group of Companies, Inc. (marketing communication), and as a member of the Board of Trustees of the University of Florida (2013-present). Previously, Mr. Thomas served as Executive Chairman (2005-2006) and Chairman and Chief Executive Officer (2000-2005) of IMS Health, Inc. (pharmaceutical and healthcare information solutions), and a Director of Fortune Brands, Inc. (consumer products, 2000-2011).
+ The information includes the Trustee's principal occupation during the last five years and other information relating to the experience, attributes, and skills relevant to the Trustee's qualifications to serve as a Trustee, which led to the conclusion that the Trustee should serve as a Trustee for the fund.
Advisory Board Members and Officers:
Correspondence intended for an officer or Peter S. Lynch may be sent to Fidelity Investments, 245 Summer Street, Boston, Massachusetts 02210. Officers appear below in alphabetical order.
Name, Year of Birth; Principal Occupation
Peter S. Lynch (1944)
Year of Election or Appointment: 2003
Member of the Advisory Board
Mr. Lynch also serves as Member of the Advisory Board of other Fidelity® funds. Mr. Lynch is Vice Chairman and a Director of FMR (investment adviser firm) and FMR Co., Inc. (investment adviser firm). In addition, Mr. Lynch serves as a Trustee of Boston College and as the Chairman of the Inner-City Scholarship Fund. Previously, Mr. Lynch served on the Special Olympics International Board of Directors (1997-2006).
Marc R. Bryant (1966)
Year of Election or Appointment: 2015
Secretary and Chief Legal Officer (CLO)
Mr. Bryant also serves as Secretary and CLO of other funds. Mr. Bryant serves as CLO, Secretary, and Senior Vice President of Fidelity Management & Research Company (investment adviser firm, 2015-present) and FMR Co., Inc. (investment adviser firm, 2015-present); Secretary of Fidelity SelectCo, LLC (investment adviser firm, 2015-present) and Fidelity Investments Money Management, Inc. (investment adviser firm, 2015-present); and CLO of Fidelity Management & Research (Hong Kong) Limited and FMR Investment Management (UK) Limited (investment adviser firms, 2015-present) and Fidelity Management & Research (Japan) Limited (investment adviser firm, 2016-present). He is Senior Vice President and Deputy General Counsel of FMR LLC (diversified financial services company). Previously, Mr. Bryant served as Secretary and CLO of Fidelity Rutland Square Trust II (2010-2014) and Assistant Secretary of Fidelity's Fixed Income and Asset Allocation Funds (2013-2015). Prior to joining Fidelity Investments, Mr. Bryant served as a Senior Vice President and the Head of Global Retail Legal for AllianceBernstein L.P. (2006-2010), and as the General Counsel for ProFund Advisors LLC (2001-2006).
Jeffrey S. Christian (1961)
Year of Election or Appointment: 2016
Assistant Treasurer
Mr. Christian also serves as Assistant Treasurer of other funds. Mr. Christian is an employee of Fidelity Investments (2003-present).
William C. Coffey (1969)
Year of Election or Appointment: 2009
Assistant Secretary
Mr. Coffey also serves as Assistant Secretary of other funds. He is Senior Vice President and Deputy General Counsel of FMR LLC (diversified financial services company, 2010-present), and is an employee of Fidelity Investments. Previously, Mr. Coffey served as Vice President and Associate General Counsel of FMR LLC (2005-2009).
Jonathan Davis (1968)
Year of Election or Appointment: 2010
Assistant Treasurer
Mr. Davis also serves as Assistant Treasurer of other funds, and is an employee of Fidelity Investments. Previously, Mr. Davis served as Vice President and Associate General Counsel of FMR LLC (diversified financial services company, 2003-2010).
Adrien E. Deberghes (1967)
Year of Election or Appointment: 2016
Assistant Treasurer
Mr. Deberghes also serves as an officer of other funds. He serves as Executive Vice President of Fidelity Investments Money Management, Inc. (FIMM) (investment adviser firm, 2016-present) and is an employee of Fidelity Investments (2008-present). Prior to joining Fidelity Investments, Mr. Deberghes was Senior Vice President of Mutual Fund Administration at State Street Corporation (2007-2008), Senior Director of Mutual Fund Administration at Investors Bank & Trust (2005-2007), and Director of Finance for Dunkin' Brands (2000-2005). Previously, Mr. Deberghes served in other fund officer roles.
Stephanie J. Dorsey (1969)
Year of Election or Appointment: 2010
Assistant Treasurer
Ms. Dorsey also serves as an officer of other funds. She is an employee of Fidelity Investments (2008-present) and has served in other fund officer roles. Prior to joining Fidelity Investments, Ms. Dorsey served as Treasurer (2004-2008) of the JPMorgan Mutual Funds and Vice President (2004-2008) of JPMorgan Chase Bank.
Howard J. Galligan III (1966)
Year of Election or Appointment: 2014
Chief Financial Officer
Mr. Galligan also serves as Chief Financial Officer of other funds. Mr. Galligan serves as President of Fidelity Pricing and Cash Management Services (FPCMS) (2014-present) and as a Director of Strategic Advisers, Inc. (investment adviser firm, 2008-present). Previously, Mr. Galligan served as Chief Administrative Officer of Asset Management (2011-2014) and Chief Operating Officer and Senior Vice President of Investment Support for Strategic Advisers, Inc. (2003-2011).
Scott C. Goebel (1968)
Year of Election or Appointment: 2015
Vice President
Mr. Goebel serves as Vice President of other funds and is an employee of Fidelity Investments (2001-present). Previously, Mr. Goebel served as Senior Vice President of Fidelity Management & Research Company (FMR) (investment adviser firm, 2016), Secretary of Fidelity SelectCo, LLC (investment adviser firm, 2013-2015), Fidelity Investments Money Management, Inc. (FIMM) (investment adviser firm, 2010-2015), and Fidelity Research and Analysis Company (FRAC) (investment adviser firm, 2010-2015); General Counsel, Secretary, and Senior Vice President of FMR (investment adviser firm, 2008-2015) and FMR Co., Inc. (investment adviser firm, 2008-2015); Assistant Secretary of Fidelity Management & Research (Japan) Limited (investment adviser firm, 2008-2015) and Fidelity Management & Research (U.K.) Inc. (investment adviser firm, 2008-2015); Chief Legal Officer (CLO) of Fidelity Management & Research (Hong Kong) Limited (investment adviser firm, 2008-2015); Secretary and CLO of certain Fidelity® funds (2008-2015); Assistant Secretary of FIMM (2008-2010), FRAC (2008-2010), and certain funds (2007-2008); and as Vice President and Secretary of Fidelity Distributors Corporation (FDC) (2005-2007).
Brian B. Hogan (1964)
Year of Election or Appointment: 2009
Vice President
Mr. Hogan also serves as Trustee or Vice President of other funds. Mr. Hogan serves as a Director of FMR Investment Management (UK) Limited (investment adviser firm, 2015-present) and Fidelity SelectCo, LLC (investment adviser firm, 2014-present) and President of the Equity Division of FMR (investment adviser firm, 2009-present). Previously, Mr. Hogan served as Senior Vice President, Equity Research of FMR (2006-2009) and as a portfolio manager. Mr. Brian B. Hogan is not related to Mr. Colm A. Hogan.
Colm A. Hogan (1973)
Year of Election or Appointment: 2016
Deputy Treasurer
Mr. Hogan also serves as an officer of other funds. Mr. Hogan is an employee of Fidelity Investments (2005-present). Mr. Colm A. Hogan is not related to Mr. Brian B. Hogan.
Chris Maher (1972)
Year of Election or Appointment: 2013
Assistant Treasurer
Mr. Maher serves as Assistant Treasurer of other funds. Mr. Maher is Vice President of Valuation Oversight and is an employee of Fidelity Investments. Previously, Mr. Maher served as Vice President of Asset Management Compliance (2013), Vice President of the Program Management Group of FMR (investment adviser firm, 2010-2013), and Vice President of Valuation Oversight (2008-2010).
John F. Papandrea (1972)
Year of Election or Appointment: 2016
Anti-Money Laundering (AML) Officer
Mr. Papandrea also serves as AML Officer of other funds. Mr. Papandrea is Vice President of FMR LLC (diversified financial services company, 2008-present) and is an employee of Fidelity Investments (2005-present).
Melissa M. Reilly (1971)
Year of Election or Appointment: 2014
Vice President of certain Equity Funds
Ms. Reilly also serves as Vice President of other funds. Ms. Reilly is an employee of Fidelity Investments (2004-present).
Kenneth B. Robins (1969)
Year of Election or Appointment: 2016
Chief Compliance Officer
Mr. Robins also serves as an officer of other funds. Mr. Robins serves as Compliance Officer of Fidelity Management & Research Company and FMR Co., Inc. (investment adviser firms, 2016-present) and is an employee of Fidelity Investments (2004-present). Previously, Mr. Robins served as Executive Vice President of Fidelity Investments Money Management, Inc. (investment adviser firm, 2013-2016) and served in other fund officer roles.
Stacie M. Smith (1974)
Year of Election or Appointment: 2016
President and Treasurer
Ms. Smith also serves as an officer of other funds. She is an employee of Fidelity Investments (2009-present) and has served in other fund officer roles. Prior to joining Fidelity Investments, Ms. Smith served as Senior Audit Manager of Ernst & Young LLP (accounting firm, 1996-2009). Previously, Ms. Smith served as Deputy Treasurer of certain Fidelity® funds (2013-2016).
Marc L. Spector (1972)
Year of Election or Appointment: 2016
Assistant Treasurer
Mr. Spector also serves as an officer of other funds. Mr. Spector is an employee of Fidelity Investments (2016-present). Prior to joining Fidelity Investments, Mr. Spector served as Director at the Siegfried Group (accounting firm, 2013-2016), and prior to Siegfried Group as audit senior manager at Deloitte & Touche (accounting firm, 2005-2013).
Renee Stagnone (1975)
Year of Election or Appointment: 2016
Assistant Treasurer
Ms. Stagnone also serves as an officer of other funds. Ms. Stagnone is an employee of Fidelity Investments (1997-present). Previously, Ms. Stagnone served as Deputy Treasurer of certain Fidelity® funds (2013-2016).
Shareholder Expense Example
As a shareholder of the Fund, you incur two types of costs: (1) transaction costs, including redemption fees and (2) ongoing costs, including management fees and other Fund expenses. This Example is intended to help you understand your ongoing costs (in dollars) of investing in the Fund and to compare these costs with the ongoing costs of investing in other mutual funds.
The Example is based on an investment of $1,000 invested at the beginning of the period and held for the entire period (June 1, 2016 to November 30, 2016).
Actual Expenses
The first line of the accompanying table for each class of the Fund provides information about actual account values and actual expenses. You may use the information in this line, together with the amount you invested, to estimate the expenses that you paid over the period. Simply divide your account value by $1,000.00 (for example, an $8,600 account value divided by $1,000.00 = 8.6), then multiply the result by the number in the first line for a class of the Fund under the heading entitled "Expenses Paid During Period" to estimate the expenses you paid on your account during this period. A small balance maintenance fee of $12.00 that is charged once a year may apply for certain accounts with a value of less than $2,000. This fee is not included in the table below. If it was, the estimate of expenses you paid during the period would be higher, and your ending account value lower, by this amount. In addition, the Fund, as a shareholder in the underlying Fidelity Central Funds, will indirectly bear its pro-rata share of the fees and expenses incurred by the underlying Fidelity Central Funds. These fees and expenses are not included in the Fund's annualized expense ratio used to calculate the expense estimate in the table below.
Hypothetical Example for Comparison Purposes
The second line of the accompanying table for each class of the Fund provides information about hypothetical account values and hypothetical expenses based on a Class' actual expense ratio and an assumed rate of return of 5% per year before expenses, which is not the Class' actual return. The hypothetical account values and expenses may not be used to estimate the actual ending account balance or expenses you paid for the period. You may use this information to compare the ongoing costs of investing in the Fund and other funds. To do so, compare this 5% hypothetical example with the 5% hypothetical examples that appear in the shareholder reports of the other funds. A small balance maintenance fee of $12.00 that is charged once a year may apply for certain accounts with a value of less than $2,000. This fee is not included in the table below. If it was, the estimate of expenses you paid during the period would be higher, and your ending account value lower, by this amount. In addition, the Fund, as a shareholder in the underlying Fidelity Central Funds, will indirectly bear its pro-rata share of the fees and expenses incurred by the underlying Fidelity Central Funds. These fees and expenses are not included in the Fund's annualized expense ratio used to calculate the expense estimate in the table below.
Please note that the expenses shown in the table are meant to highlight your ongoing costs only and do not reflect any transaction costs. Therefore, the second line of the table is useful in comparing ongoing costs only, and will not help you determine the relative total costs of owning different funds. In addition, if these transactional costs were included, your costs would have been higher.
| | Annualized Expense Ratio-A | Beginning
Account Value
June 1, 2016 | Ending
Account Value
November 30, 2016 | Expenses Paid
During Period-B
June 1, 2016
to November 30, 2016 |
| Growth Strategies | .91% | | | |
| Actual | | $1,000.00 | $1,014.10 | 4.58C |
| Hypothetical-D | | $1,000.00 | $1,020.45 | 4.60C |
| Class K | .74% | | | |
| Actual | | $1,000.00 | $1,015.20 | 3.73C |
| Hypothetical-D | | $1,000.00 | $1,021.30 | 3.74C |
A Annualized expense ratio reflects expenses net of applicable fee waivers.
B Expenses are equal to each Class' annualized expense ratio, multiplied by the average account value over the period, multiplied by 183/366 (to reflect the one-half year period).
C If fees and changes to the Fund's Management Fee effective February 1, 2017, had been in effect during the current period, the annualized expense ratio and expenses paid would have been as shown in table below:
D 5% return per year before expenses
| | Annualized Expense Ratio
| Expenses Paid
|
| Growth Strategies | .86% | |
| Actual | | $4.33 |
| Hypothetical | | $4.34 |
| Class K | .69% | |
| Actual | | $3.48 |
| Hypothetical | | $3.49 |
Distributions (Unaudited)
The Board of Trustees of Fidelity Growth Strategies Fund voted to pay to shareholders of record at the opening of business on record date, the following distributions per share derived from capital gains realized from sales of portfolio securities, and dividends derived from net investment income:
| | Pay Date | Record Date | Dividends | Capital Gains |
| Fidelity Growth Strategies Fund | | | | |
| Growth Strategies | 12/28/16 | 12/27/16 | $0.184 | $0.015 |
| Class K | 12/28/16 | 12/27/16 | $0.233 | $0.015 |
|
Growth Strategies and Class K designate 100% of the dividends distributed during the fiscal year as qualifying for the dividends–received deduction for corporate shareholders.
Growth Strategies and Class K designate 100% of the dividends distributed during the fiscal year as amounts which may be taken into account as a dividend for purposes of the maximum rate under section 1(h)(11) of the Internal Revenue Code.
The fund will notify shareholders in January 2017 of amounts for use in preparing 2016 income tax returns.
Board Approval of Investment Advisory Contracts and Management Fees
Fidelity Growth Strategies Fund
Each year, the Board of Trustees, including the Independent Trustees (together, the Board), votes on the renewal of the management contract with Fidelity Management & Research Company (FMR) and the sub-advisory agreements (together, the Advisory Contracts) for the fund. The Board, assisted by the advice of fund counsel and Independent Trustees' counsel, requests and considers a broad range of information relevant to the renewal of the Advisory Contracts throughout the year.
The Board meets regularly and, at each of its meetings, covers an extensive agenda of topics and materials and considers factors that are relevant to its annual consideration of the renewal of the fund's Advisory Contracts, including the services and support provided to the fund and its shareholders. The Board has established various standing committees (Committees), each composed of and chaired by Independent Trustees with varying backgrounds, to which the Board has assigned specific subject matter responsibilities in order to enhance effective decision-making by the Board. The Board, acting directly and through its Committees, requests and receives information concerning the annual consideration of the renewal of the fund's Advisory Contracts. The Board also meets as needed to consider matters specifically related to the Board's annual consideration of the renewal of the Advisory Contracts. Members of the Board may also meet with trustees of other Fidelity funds through ad hoc joint committees to discuss certain matters relevant to all of the Fidelity funds.
At its July 2016 meeting, the Board unanimously determined to renew the fund's Advisory Contracts. In reaching its determination, the Board considered all factors it believed relevant, including (i) the nature, extent, and quality of the services to be provided to the fund and its shareholders (including the investment performance of the fund); (ii) the competitiveness of the fund's management fee and total expense ratio relative to peer funds; (iii) the total costs of the services to be provided by and the profits to be realized by Fidelity from its relationships with the fund; and (iv) the extent to which, if any, economies of scale exist and would be realized as the fund grows, and whether any economies of scale are appropriately shared with fund shareholders.
In considering whether to renew the Advisory Contracts for the fund, the Board reached a determination, with the assistance of fund counsel and Independent Trustees' counsel and through the exercise of its business judgment, that the renewal of the Advisory Contracts was in the best interests of the fund and its shareholders and that the compensation payable under the Advisory Contracts was fair and reasonable. The Board's decision to renew the Advisory Contracts was not based on any single factor, but rather was based on a comprehensive consideration of all the information provided to the Board at its meetings throughout the year. The Board, in reaching its determination to renew the Advisory Contracts, was aware that shareholders of the fund have a broad range of investment choices available to them, including a wide choice among funds offered by Fidelity's competitors, and that the fund's shareholders, who have the opportunity to review and weigh the disclosure provided by the fund in its prospectus and other public disclosures, have chosen to invest in this fund, which is part of the Fidelity family of funds.
Nature, Extent, and Quality of Services Provided. The Board considered Fidelity's staffing as it relates to the fund, including the backgrounds of investment personnel of Fidelity, and also considered the fund's investment objective, strategies, and related investment philosophy. The Independent Trustees also had discussions with senior management of Fidelity's investment operations and investment groups. The Board considered the structure of the investment personnel compensation program and whether this structure provides appropriate incentives to act in the best interests of the fund. Additionally, the Board considered the portfolio managers' investments, if any, in the funds that they manage.
Resources Dedicated to Investment Management and Support Services. The Board and the Fund Oversight and Research Committees reviewed the general qualifications and capabilities of Fidelity's investment staff, including its size, education, experience, and resources, as well as Fidelity's approach to recruiting, training, managing, and compensating investment personnel. The Board noted that Fidelity has continued to increase the resources devoted to non-U.S. offices, including expansion of Fidelity's global investment organization. The Board also noted that Fidelity's analysts have extensive resources, tools and capabilities that allow them to conduct sophisticated quantitative and fundamental analysis, as well as credit analysis of issuers, counterparties and guarantors. Further, the Board considered that Fidelity's investment professionals have sufficient access to global information and data so as to provide competitive investment results over time, and that those professionals also have access to sophisticated tools that permit them to assess portfolio construction and risk and performance attribution characteristics continuously, as well as to transmit new information and research conclusions rapidly around the world. Additionally, in its deliberations, the Board considered Fidelity's trading, risk management, compliance, and technology and operations capabilities and resources, which are integral parts of the investment management process.
Shareholder and Administrative Services. The Board considered (i) the nature, extent, quality, and cost of advisory, administrative, and shareholder services performed by FMR, the sub-advisers (together with FMR, the Investment Advisers), and their affiliates under the Advisory Contracts and under separate agreements covering transfer agency, pricing and bookkeeping, and securities lending services for the fund; (ii) the nature and extent of the supervision of third party service providers, principally custodians, subcustodians, and pricing vendors; and (iii) the resources devoted to, and the record of compliance with, the fund's compliance policies and procedures. The Board also reviewed the allocation of fund brokerage, including allocations to brokers affiliated with the Investment Advisers, the use of brokerage commissions to pay fund expenses, and the use of "soft" commission dollars to pay for research services.
The Board noted that the growth of fund assets over time across the complex allows Fidelity to reinvest in the development of services designed to enhance the value or convenience of the Fidelity funds as investment vehicles. These services include 24-hour access to account information and market information through telephone representatives and over the Internet, investor education materials and asset allocation tools, and the expanded availability of Fidelity Investor Centers.
In 2014, the Board formed an ad hoc Committee on Transfer Agency Fees to review the variety of transfer agency fee structures throughout the industry and Fidelity's competitive positioning with respect to industry participants.
Investment in a Large Fund Family. The Board considered the benefits to shareholders of investing in a Fidelity fund, including the benefits of investing in a fund that is part of a large family of funds offering a variety of investment disciplines and providing a large variety of mutual fund investor services. The Board noted that Fidelity had taken, or had made recommendations that resulted in the Fidelity funds taking, a number of actions over the previous year that benefited particular funds, including: (i) continuing to dedicate additional resources to investment research and to the support of the senior management team that oversees asset management; (ii) continuing efforts to enhance Fidelity's global research capabilities; (iii) launching new funds and making other enhancements to meet client needs; (iv) broadening eligibility requirements for certain lower-priced share classes of, and streamlining the fee structure for, certain existing equity index funds; (v) lowering expense caps for certain existing funds and classes to reduce expenses paid by shareholders; (vi) eliminating redemption fees for certain variable insurance product funds and classes; (vii) continuing to launch dedicated lower cost underlying funds to meet portfolio construction needs related to expanding underlying fund options for Fidelity funds of funds, specifically for the Freedom Fund product lines; (viii) launching a lower cost share class for use by the Freedom Index Fund product line; (ix) rationalizing product lines and gaining increased efficiencies through fund mergers and share class consolidations; (x) continuing to develop, acquire and implement systems and technology to improve services to the funds and shareholders, strengthen information security, and increase efficiency; (xi) implementing investment enhancements to further strengthen Fidelity's target date product line to increase investors' probability of success in achieving their goals; (xii) accelerating the conversion of all remaining Class B shares to Class A shares, which have a lower expense structure; and (xiii) implementing changes to Fidelity's money market fund product line in response to recent regulatory reforms.
Investment Performance. The Board considered whether the fund has operated in accordance with its investment objective, as well as its record of compliance with its investment restrictions and its performance history. The Board noted that there was a portfolio management change for the fund in August 2013.
The Board took into account discussions with representatives of the Investment Advisers about fund investment performance that occur at Board meetings throughout the year. In this regard the Board noted that as part of regularly scheduled fund reviews and other reports to the Board on fund performance, the Board considers annualized return information for the fund, for different time periods, measured against a securities market index ("benchmark index") and a peer group of funds with similar objectives ("peer group"), if any. In its evaluation of fund investment performance, the Board gave particular attention to information indicating changes in performance of certain Fidelity funds for specific time periods and discussed with the Investment Advisers the reasons for any overperformance or underperformance.
In addition to reviewing absolute and relative fund performance, the Independent Trustees periodically consider the appropriateness of fund performance metrics in evaluating the results achieved. In general, the Independent Trustees believe that fund performance should be evaluated based on net performance (after fees and expenses) of both the highest performing and lowest performing fund share classes, where applicable, compared to appropriate benchmark indices, over appropriate time periods that may include full market cycles, and compared to peer groups, as applicable, over the same periods, taking into account relevant factors including the following: general market conditions; issuer-specific information; and fund cash flows and other factors.
The Independent Trustees recognize that shareholders evaluate performance on a net basis over their own holding periods, for which one-, three-, and five-year periods are often used as a proxy. For this reason, the performance information reviewed by the Board also included net cumulative calendar year total return information for the fund and an appropriate benchmark index and peer group for the most recent one-, three-, and five-year periods, as shown below. Returns are shown compared to the 25th percentile (top of box, 75% beaten) and 75th percentile (bottom of box, 25% beaten) of the peer universe.
Fidelity Growth Strategies Fund
The Board also considered that the fund's management fee is subject to upward or downward adjustment depending upon whether, and to what extent, the fund's investment performance for the performance period exceeds, or is exceeded by, a securities index, thus leading to a performance adjustment for the same period. The Board noted that the performance adjustment provides FMR with a strong economic incentive to seek to achieve superior performance for the fund's shareholders and helps to more closely align the interests of FMR and the shareholders of the fund.
Based on its review, the Board concluded that the nature, extent, and quality of services provided to the fund under the Advisory Contracts should continue to benefit the shareholders of the fund.
Competitiveness of Management Fee and Total Expense Ratio. The Board considered the fund's management fee and total expense ratio compared to "mapped groups" of competitive funds and classes created for the purpose of facilitating the Trustees' competitive analysis of management fees and total expenses. Fidelity creates "mapped groups" by combining similar Broadridge investment objective categories that have comparable investment mandates. Combining Broadridge investment objective categories aids the Board's management fee and total expense ratio comparisons by broadening the competitive group used for comparison.
Management Fee. The Board considered two proprietary management fee comparisons for the 12-month periods shown in basis points (BP) in the chart below. The group of Broadridge funds used by the Board for management fee comparisons is referred to below as the "Total Mapped Group." The Total Mapped Group comparison focuses on a fund's standing in terms of gross management fees before expense reimbursements or caps, and without giving effect to the fund's performance adjustment, relative to the total universe of funds with comparable investment mandates, regardless of whether their management fee structures also are comparable. Funds with comparable investment mandates offer exposure to similar types of securities. Funds with comparable management fee structures have similar management fee contractual arrangements (
e.g., flat rate charged for advisory services, all-inclusive fee rate,
etc.). "TMG %" represents the percentage of funds in the Total Mapped Group that had management fees that were lower than the fund's. For example, a hypothetical TMG % of 20% would mean that 80% of the funds in the Total Mapped Group had higher, and 20% had lower, management fees than the fund. The fund's actual TMG %s and the number of funds in the Total Mapped Group are in the chart below. The "Asset-Size Peer Group" (ASPG) comparison focuses on a fund's standing relative to a subset of non-Fidelity funds within the Total Mapped Group that are similar in size and management fee structure without taking into account performance adjustments, if any. For example, if a fund is in the first quartile of the ASPG, the fund's management fee ranks in the least expensive or lowest 25% of funds in the ASPG. The ASPG represents at least 15% of the funds in the Total Mapped Group with comparable asset size and management fee structures, subject to a minimum of 50 funds (or all funds in the Total Mapped Group if fewer than 50). Additional information, such as the ASPG quartile in which the fund's management fee rate ranked and the impact of the fund's performance adjustment, is also included in the chart and considered by the Board.
Fidelity Growth Strategies Fund
The Board noted that the fund's management fee rate ranked below the median of its Total Mapped Group and below the median of its ASPG for 2015. The Board also noted the effect of the fund's performance adjustment, if any, on the fund's management fee ranking.
The Board noted that, in 2014, the ad hoc Committee on Group Fee was formed by it and the boards of other Fidelity funds to conduct an in-depth review of the "group fee" component of the management fee of funds with such management fee structures. The Committee's focus included the mechanics of the group fee, the competitive landscape of group fee structures, Fidelity funds with no group fee component and investment products not included in group fee assets. The Board also considered that, for funds subject to the group fee, FMR agreed to voluntarily waive fees over a specified period of time in amounts designed to account for assets converted from certain funds to certain collective investment trusts.
The Board also noted that, in 2013, the ad hoc Committee on Management Fees was formed to conduct an in-depth review of the management fee rates of Fidelity's active equity mutual funds. The Committee focused on the following areas: (i) standard fee structures; (ii) research consumption and trading evolution; (iii) management fee competitiveness/profitability by category; and (iv) factors that drive institutional pricing.
Based on its review, the Board concluded that the fund's management fee is fair and reasonable in light of the services that the fund receives and the other factors considered.
Total Expense Ratio. In its review of each class's total expense ratio, the Board considered the fund's management fee rate as well as other fund or class expenses, as applicable, such as transfer agent fees, pricing and bookkeeping fees, and custodial, legal, and audit fees. The Board noted the impact of the fund's performance adjustment. The Board also noted that Fidelity may agree to waive fees and expenses from time to time, and the extent to which, if any, it has done so for the fund. As part of its review, the Board also considered the current and historical total expense ratios of each class of the fund compared to competitive fund median expenses. Each class of the fund is compared to those funds and classes in the Total Mapped Group (used by the Board for management fee comparisons) that have a similar sales load structure.
The Board noted that the total expense ratio of each class ranked below the competitive median for 2015.
Fees Charged to Other Fidelity Clients. The Board also considered Fidelity fee structures and other information with respect to clients of Fidelity, such as other funds advised or subadvised by Fidelity, pension plan clients, and other institutional clients with similar mandates. The Board noted the findings of the 2013 ad hoc joint committee (created with the board of other Fidelity funds), which reviewed and compared Fidelity's institutional investment advisory business with its business of providing services to the Fidelity funds, including the differences in services provided, fees charged, and costs incurred, as well as competition in their respective marketplaces.
Based on its review of total expense ratios and fees charged to other Fidelity clients, the Board concluded that the total expense ratio of each class of the fund was reasonable in light of the services that the fund and its shareholders receive and the other factors considered.
Costs of the Services and Profitability. The Board considered the revenues earned and the expenses incurred by Fidelity in conducting the business of developing, marketing, distributing, managing, administering and servicing the fund and servicing the fund's shareholders. The Board also considered the level of Fidelity's profits in respect of all the Fidelity funds.
On an annual basis, Fidelity presents to the Board information about the profitability of its relationship with the fund. Fidelity calculates profitability information for each fund, as well as aggregate profitability information for groups of Fidelity funds and all Fidelity funds, using a series of detailed revenue and cost allocation methodologies which originate with the books and records of Fidelity on which Fidelity's audited financial statements are based. The Audit Committee of the Board reviews any significant changes from the prior year's methodologies.
PricewaterhouseCoopers LLP (PwC), independent registered public accounting firm and auditor to Fidelity and certain Fidelity funds, has been engaged annually by the Board as part of the Board's assessment of Fidelity's profitability analysis. PwC's engagement includes the review and assessment of the methodologies used by Fidelity in determining the revenues and expenses attributable to Fidelity's mutual fund business, and completion of agreed-upon procedures in respect of the mathematical accuracy of the fund profitability information and its conformity to established allocation methodologies. After considering PwC's reports issued under the engagement and information provided by Fidelity, the Board concluded that while other allocation methods may also be reasonable, Fidelity's profitability methodologies are reasonable in all material respects.
The Board also reviewed Fidelity's non-fund businesses and fall-out benefits related to the mutual fund business as well as cases where Fidelity's affiliates may benefit from or be related to the fund's business.
The Board considered the costs of the services provided by and the profits realized by Fidelity in connection with the operation of the fund and was satisfied that the profitability was not excessive.
Economies of Scale. The Board considered whether there have been economies of scale in respect of the management of the Fidelity funds, whether the Fidelity funds (including the fund) have appropriately benefited from any such economies of scale, and whether there is potential for realization of any further economies of scale. The Board considered the extent to which the fund will benefit from economies of scale as assets grow through increased services to the fund, through waivers or reimbursements, or through fee or expense ratio reductions. The Board also noted that in 2013, it and the boards of other Fidelity funds created an ad hoc committee (the Economies of Scale Committee) to analyze whether Fidelity attains economies of scale in respect of the management and servicing of the Fidelity funds, whether the Fidelity funds have appropriately benefited from such economies of scale, and whether there is potential for realization of any further economies of scale.
The Board recognized that the fund's management contract incorporates a "group fee" structure, which provides for lower group fee rates as total group assets increase, and for higher group fee rates as total group assets decrease (with "group assets" defined to include fund assets under FMR's management plus the assets of sector funds previously under FMR's management). FMR calculates the group fee rates based on a tiered asset "breakpoint" schedule that varies based on asset class. The Board considered that the group fee is designed to deliver the benefits of economies of scale to fund shareholders when total Fidelity fund assets increase, even if assets of any particular fund are unchanged or have declined, because some portion of Fidelity's costs are attributable to services provided to all Fidelity funds, and all funds benefit if those costs can be allocated among more assets. The Board concluded that, given the group fee structure, fund shareholders will benefit from lower management fees as group assets increase at the fund complex level, regardless of whether Fidelity achieves any such economies of scale.
The Board concluded, taking into account the analysis of the Economies of Scale Committee, that economies of scale, if any, are being appropriately shared between fund shareholders and Fidelity.
Additional Information Requested by the Board. In order to develop fully the factual basis for consideration of the Fidelity funds' Advisory Contracts, the Board requested and received additional information on certain topics, including: (i) fund performance trends and Fidelity's long-term strategies for certain funds; (ii) the various share classes employed by Fidelity and the attributes of each class, together with similar information on the distribution and servicing payments made by Fidelity or the funds to third-party participants in the distribution channels; (iii) fund profitability, and fund performance in relation to fund profitability; (iv) the methodology with respect to evaluating competitive fund data and peer group classifications and fee comparisons; (v) annual fund profitability margins; (vi) the realization of fall-out benefits in and attribution of fall-out benefits to certain Fidelity business units; (vii) the appropriateness of certain funds' benchmarks; (viii) the rationalization for certain share classes and expenses; (ix) sub-advisory fee rates for comparable investment mandates; (x) product strategy for certain underperforming funds; and (xi) Fidelity's resources and strategy for cybersecurity.
Based on its evaluation of all of the conclusions noted above, and after considering all factors it believed relevant, the Board concluded that the advisory fee structures are fair and reasonable, and that the fund's Advisory Contracts should be renewed.
Corporate Headquarters
245 Summer St.
Boston, MA 02210
www.fidelity.com
FEG-ANN-0117
1.539208.119
Fidelity® New Millennium Fund®
Annual Report November 30, 2016 |
|
Contents
To view a fund's proxy voting guidelines and proxy voting record for the 12-month period ended June 30, visit http://www.fidelity.com/proxyvotingresults or visit the Securities and Exchange Commission's (SEC) web site at http://www.sec.gov.
You may also call 1-800-544-8544 to request a free copy of the proxy voting guidelines.
Standard & Poor's, S&P and S&P 500 are registered service marks of The McGraw-Hill Companies, Inc. and have been licensed for use by Fidelity Distributors Corporation.
Other third-party marks appearing herein are the property of their respective owners.
All other marks appearing herein are registered or unregistered trademarks or service marks of FMR LLC or an affiliated company. © 2017 FMR LLC. All rights reserved.
This report and the financial statements contained herein are submitted for the general information of the shareholders of the Fund. This report is not authorized for distribution to prospective investors in the Fund unless preceded or accompanied by an effective prospectus.
A fund files its complete schedule of portfolio holdings with the SEC for the first and third quarters of each fiscal year on Form N-Q. Forms N-Q are available on the SEC’s web site at http://www.sec.gov. A fund's Forms N-Q may be reviewed and copied at the SEC’s Public Reference Room in Washington, DC. Information regarding the operation of the SEC's Public Reference Room may be obtained by calling 1-800-SEC-0330.
For a complete list of a fund's portfolio holdings, view the most recent holdings listing, semiannual report, or annual report on Fidelity's web site at http://www.fidelity.com, http://www.institutional.fidelity.com, or http://www.401k.com, as applicable.
NOT FDIC INSURED •MAY LOSE VALUE •NO BANK GUARANTEE
Neither the Fund nor Fidelity Distributors Corporation is a bank.
Performance: The Bottom Line
Average annual total return reflects the change in the value of an investment, assuming reinvestment of distributions from dividend income and capital gains (the profits earned upon the sale of securities that have grown in value, if any) and assuming a constant rate of performance each year. The hypothetical investment and the average annual total returns do not reflect the deduction of taxes that a shareholder would pay on fund distributions or the redemption of fund shares. During periods of reimbursement by Fidelity, a fund’s total return will be greater than it would be had the reimbursement not occurred. How a fund did yesterday is no guarantee of how it will do tomorrow.
Average Annual Total Returns
| For the periods ended November 30, 2016 | Past 1 year | Past 5 years | Past 10 years |
| Fidelity® New Millennium Fund® | 8.57% | 13.32% | 8.26% |
$10,000 Over 10 Years
Let's say hypothetically that $10,000 was invested in Fidelity® New Millennium Fund® on November 30, 2006.
The chart shows how the value of your investment would have changed, and also shows how the S&P 500® Index performed over the same period.
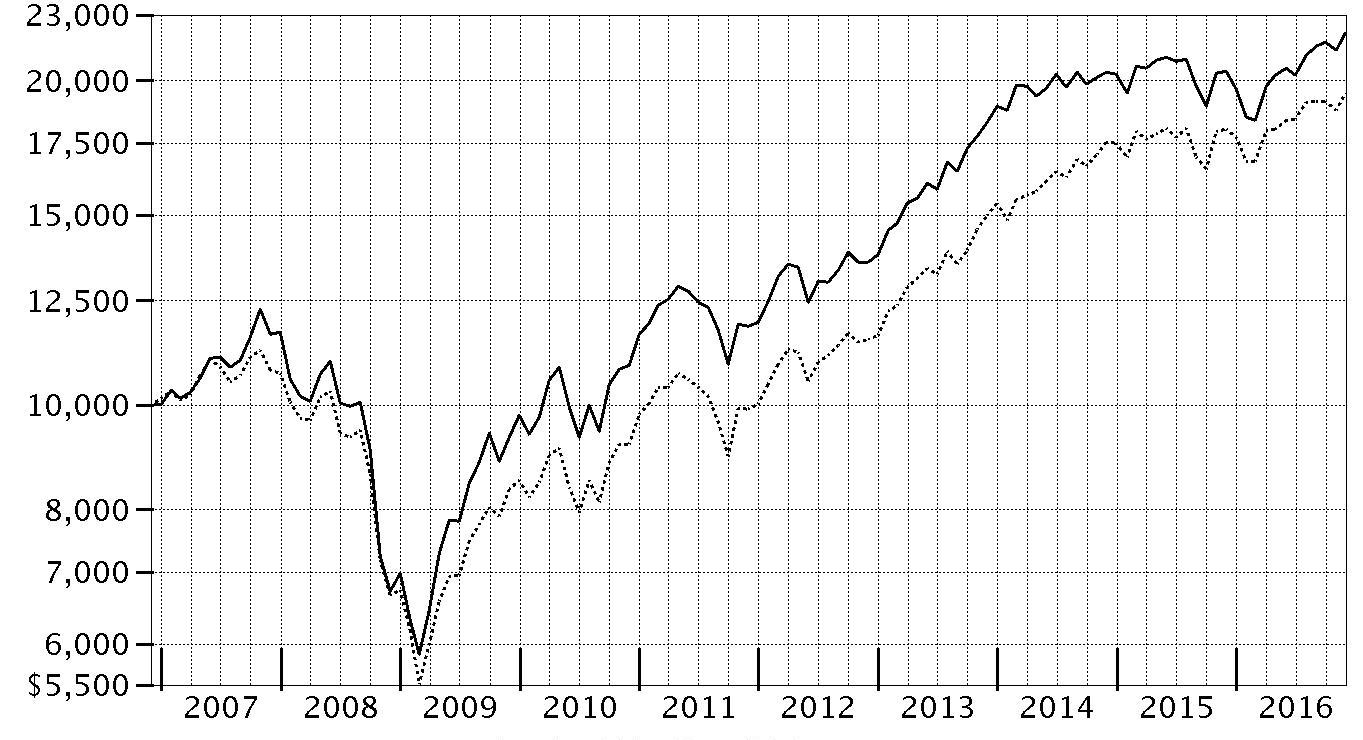
| Period Ending Values |
| $22,124 | Fidelity® New Millennium Fund® |
| $19,462 | S&P 500® Index |
Management's Discussion of Fund Performance
Market Recap: The S&P 500 index returned 8.06% for the 12 months ending November 30, 2016, rising sharply in the final month on post-election optimism for economic growth. The period began during a fairly volatile stretch, with stocks hampered by persistent oil-price weakness and U.S.-dollar strength. Markets regained positive momentum in February amid U.S. job gains, a rally in energy and other stimuli that helped keep the roughly seven-year uptrend intact. Markets tumbled briefly following the U.K.’s June 23 vote to exit the European Union – dubbed “Brexit” – then recovered quickly and settled into a flattish stretch until the November 8 U.S. presidential election. For the year, 10 of the 11 sectors in the S&P 500
® advanced, with six posting double-digit gains. Telecommunication services (+16%) led the way, its strength attributable to demand for dividend-paying equities early in the period, as well as to company-specific news. Cyclical sectors including industrials (+15%), financials (+14%), energy (+13%) and materials (+12%) posted strong gains, the latter two driven by a rebound in commodity prices. Conversely, real estate (+1%) lagged the index due to a late-period slump related to expectations for rising interest rates. Consumer discretionary (+3%) also underperformed, as competitive pressure continued to weigh on brick-and-mortar retailers.
Comments from Portfolio Manager John Roth: For the year, the fund rose 8.57%, modestly outpacing S&P 500 Index. Versus the benchmark, stock picking and an overweighting in the strong-performing energy drove the fund’s outperformance. A sizable stake in Williams Companies was the fund’s largest individual contributor by a wide margin. Williams Companies owns a majority stake in Williams Partners, a master limited partnership (MLP) and North American pipeline owner, and another big contributor. Shares of Williams Companies were buoyed by speculation it was a takeover target, although no deals materialized during the period. Relative results also were boosted by choices in health care, particularly an underweighting in the pharmaceuticals, biotechnology & life sciences industry. Here, it helped to avoid index components Allergan and Gilead Sciences, which returned -38% and -29%, respectively. The fund's biggest individual detractor was Oceaneering International, a provider of engineering services to the offshore oil and gas industry. The fund’s foreign investments also dragged on relative performance amid currency fluctuations. Specifically, the U.K.’s June vote to leave the European Union, along with the associated sharp decline in the value of the British pound, weighed on our choices here.
The views expressed above reflect those of the portfolio manager(s) only through the end of the period as stated on the cover of this report and do not necessarily represent the views of Fidelity or any other person in the Fidelity organization. Any such views are subject to change at any time based upon market or other conditions and Fidelity disclaims any responsibility to update such views. These views may not be relied on as investment advice and, because investment decisions for a Fidelity fund are based on numerous factors, may not be relied on as an indication of trading intent on behalf of any Fidelity fund.
Investment Summary (Unaudited)
Top Ten Stocks as of November 30, 2016
| | % of fund's net assets | % of fund's net assets 6 months ago |
| Bank of America Corp. | 2.9 | 1.8 |
| The Williams Companies, Inc. | 2.3 | 1.7 |
| Cisco Systems, Inc. | 2.2 | 2.2 |
| JPMorgan Chase & Co. | 2.0 | 0.0 |
| Chevron Corp. | 1.9 | 3.0 |
| Verizon Communications, Inc. | 1.7 | 1.8 |
| Eurofins Scientific SA | 1.7 | 1.5 |
| UnitedHealth Group, Inc. | 1.6 | 0.4 |
| Visa, Inc. Class A | 1.5 | 1.6 |
| American International Group, Inc. | 1.5 | 1.4 |
| | 19.3 | |
Top Five Market Sectors as of November 30, 2016
| | % of fund's net assets | % of fund's net assets 6 months ago |
| Financials | 19.2 | 18.2 |
| Information Technology | 18.8 | 17.4 |
| Energy | 15.6 | 17.5 |
| Industrials | 10.9 | 9.8 |
| Health Care | 9.9 | 9.3 |
Prior period industry classifications reflect the categories in place as of the date indicated and have not been adjusted to reflect current industry classifications.
Asset Allocation (% of fund's net assets)
| As of November 30, 2016* |
| | Stocks | 96.5% |
| | Bonds | 0.1% |
| | Other Investments | 0.2% |
| | Short-Term Investments and Net Other Assets (Liabilities) | 3.2% |

* Foreign investments - 13.4%
| As of May 31, 2016* |
| | Stocks | 98.7% |
| | Bonds | 0.1% |
| | Short-Term Investments and Net Other Assets (Liabilities) | 1.2% |

* Foreign investments - 16.9%
Percentages shown as 0.0% may reflect amounts less than 0.05%.
Investments November 30, 2016
Showing Percentage of Net Assets
| Common Stocks - 96.5% | | | |
| | | Shares | Value (000s) |
| CONSUMER DISCRETIONARY - 9.4% | | | |
| Auto Components - 0.6% | | | |
| Magna International, Inc. Class A (sub. vtg.) (a) | | 274,500 | $11,092 |
| Tenneco, Inc. (b) | | 134,200 | 7,911 |
| | | | 19,003 |
| Automobiles - 0.3% | | | |
| Tesla Motors, Inc. (b) | | 39,000 | 7,387 |
| Distributors - 0.5% | | | |
| Pool Corp. | | 160,400 | 16,138 |
| Hotels, Restaurants & Leisure - 1.9% | | | |
| ARAMARK Holdings Corp. | | 1,094,000 | 37,645 |
| Domino's Pizza, Inc. | | 39,200 | 6,587 |
| Noodles & Co. (a)(b) | | 1,142,458 | 4,798 |
| Whitbread PLC | | 227,498 | 9,860 |
| | | | 58,890 |
| Household Durables - 1.0% | | | |
| D.R. Horton, Inc. | | 550,700 | 15,265 |
| Toll Brothers, Inc. (b) | | 474,813 | 14,083 |
| | | | 29,348 |
| Internet & Direct Marketing Retail - 0.9% | | | |
| Etsy, Inc. (b) | | 287,293 | 3,562 |
| Priceline Group, Inc. (b) | | 16,000 | 24,059 |
| | | | 27,621 |
| Leisure Products - 0.3% | | | |
| New Academy Holding Co. LLC unit (b)(c)(d) | | 66,000 | 7,991 |
| Media - 0.2% | | | |
| WME Entertainment Parent, LLC Class A unit (d)(e) | | 3,577,796 | 7,349 |
| Multiline Retail - 0.5% | | | |
| Target Corp. | | 202,000 | 15,602 |
| Specialty Retail - 2.4% | | | |
| AutoZone, Inc. (b) | | 20,800 | 16,290 |
| Citi Trends, Inc. | | 482,366 | 8,374 |
| Tiffany & Co., Inc. (a) | | 330,000 | 27,218 |
| TJX Companies, Inc. | | 265,000 | 20,760 |
| | | | 72,642 |
| Textiles, Apparel & Luxury Goods - 0.8% | | | |
| Brunello Cucinelli SpA (a) | | 822,600 | 15,649 |
| Hermes International SCA | | 22,100 | 9,121 |
| | | | 24,770 |
|
| TOTAL CONSUMER DISCRETIONARY | | | 286,741 |
|
| CONSUMER STAPLES - 3.4% | | | |
| Beverages - 0.4% | | | |
| Constellation Brands, Inc. Class A (sub. vtg.) | | 77,000 | 11,638 |
| Food & Staples Retailing - 0.3% | | | |
| Tesco PLC (b) | | 3,245,200 | 8,471 |
| Food Products - 2.7% | | | |
| Amira Nature Foods Ltd. (a)(b) | | 1,082,352 | 7,955 |
| Amplify Snack Brands, Inc. (a)(b) | | 1,229,313 | 11,678 |
| Associated British Foods PLC | | 386,800 | 12,341 |
| General Mills, Inc. | | 348,300 | 21,225 |
| Greencore Group PLC | | 1,409,000 | 5,130 |
| Mead Johnson Nutrition Co. Class A | | 192,700 | 13,892 |
| The Hershey Co. | | 121,131 | 11,706 |
| | | | 83,927 |
|
| TOTAL CONSUMER STAPLES | | | 104,036 |
|
| ENERGY - 15.3% | | | |
| Energy Equipment & Services - 1.5% | | | |
| FMC Technologies, Inc. (b) | | 325,600 | 11,155 |
| Helmerich & Payne, Inc. (a) | | 168,300 | 12,732 |
| Oceaneering International, Inc. | | 585,052 | 15,592 |
| Odfjell Drilling A/S (b) | | 5,127,100 | 8,100 |
| | | | 47,579 |
| Oil, Gas & Consumable Fuels - 13.8% | | | |
| Anadarko Petroleum Corp. | | 474,800 | 32,832 |
| Antero Resources Corp. (b) | | 732,100 | 17,929 |
| Cabot Oil & Gas Corp. | | 711,100 | 15,730 |
| Chevron Corp. | | 520,400 | 58,056 |
| Cimarex Energy Co. | | 126,300 | 17,414 |
| ConocoPhillips Co. | | 899,200 | 43,629 |
| Denbury Resources, Inc. (a)(b) | | 2,486,300 | 9,398 |
| Diamondback Energy, Inc. (b) | | 215,500 | 23,242 |
| Energy Transfer Equity LP | | 918,700 | 15,645 |
| EOG Resources, Inc. | | 252,600 | 25,897 |
| GasLog Ltd. (a) | | 879,998 | 13,816 |
| Golar LNG Ltd. (a) | | 552,600 | 13,483 |
| Legacy Reserves LP | | 771,300 | 1,485 |
| Southwestern Energy Co. (b) | | 510,600 | 5,795 |
| Suncor Energy, Inc. | | 621,500 | 19,793 |
| The Williams Companies, Inc. | | 2,251,900 | 69,133 |
| Whiting Petroleum Corp. (b) | | 479,700 | 5,862 |
| Williams Partners LP | | 843,900 | 30,802 |
| | | | 419,941 |
|
| TOTAL ENERGY | | | 467,520 |
|
| FINANCIALS - 19.2% | | | |
| Banks - 9.1% | | | |
| Bank of America Corp. | | 4,140,500 | 87,449 |
| First Republic Bank | | 206,200 | 16,888 |
| JPMorgan Chase & Co. | | 757,200 | 60,705 |
| PNC Financial Services Group, Inc. | | 288,600 | 31,902 |
| Regions Financial Corp. | | 1,990,200 | 26,947 |
| SunTrust Banks, Inc. | | 424,112 | 22,033 |
| U.S. Bancorp | | 621,000 | 30,814 |
| | | | 276,738 |
| Capital Markets - 2.7% | | | |
| Apollo Investment Corp. | | 414,562 | 2,554 |
| KKR & Co. LP | | 1,235,604 | 18,905 |
| Morgan Stanley | | 813,300 | 33,638 |
| State Street Corp. | | 349,900 | 27,572 |
| | | | 82,669 |
| Insurance - 5.6% | | | |
| AIA Group Ltd. | | 2,385,200 | 14,545 |
| American International Group, Inc. | | 705,000 | 44,648 |
| Arch Capital Group Ltd. (b) | | 308,200 | 25,494 |
| Chubb Ltd. | | 309,709 | 39,643 |
| First American Financial Corp. | | 559,800 | 21,127 |
| FNF Group | | 810,900 | 25,900 |
| | | | 171,357 |
| Thrifts & Mortgage Finance - 1.8% | | | |
| Housing Development Finance Corp. Ltd. | | 425,968 | 7,830 |
| MGIC Investment Corp. (b) | | 1,967,300 | 17,843 |
| Radian Group, Inc. | | 1,919,923 | 27,954 |
| | | | 53,627 |
|
| TOTAL FINANCIALS | | | 584,391 |
|
| HEALTH CARE - 9.9% | | | |
| Health Care Equipment & Supplies - 2.6% | | | |
| Boston Scientific Corp. (b) | | 1,857,500 | 38,004 |
| DexCom, Inc. (b) | | 68,300 | 4,459 |
| Teleflex, Inc. | | 55,800 | 8,254 |
| The Cooper Companies, Inc. | | 106,441 | 17,508 |
| Zeltiq Aesthetics, Inc. (b) | | 265,382 | 11,679 |
| | | | 79,904 |
| Health Care Providers & Services - 3.1% | | | |
| Amplifon SpA (a) | | 1,041,550 | 9,990 |
| Capital Senior Living Corp. (a)(b) | | 558,100 | 8,695 |
| Corvel Corp. (b) | | 29,534 | 951 |
| Premier, Inc. (b) | | 239,400 | 7,216 |
| UnitedHealth Group, Inc. | | 301,900 | 47,797 |
| Universal Health Services, Inc. Class B | | 154,000 | 18,945 |
| | | | 93,594 |
| Health Care Technology - 0.7% | | | |
| HealthStream, Inc. (b) | | 425,610 | 10,666 |
| Medidata Solutions, Inc. (b) | | 165,500 | 9,141 |
| | | | 19,807 |
| Life Sciences Tools & Services - 2.5% | | | |
| Agilent Technologies, Inc. | | 377,200 | 16,589 |
| Eurofins Scientific SA | | 115,900 | 50,725 |
| Illumina, Inc. (b) | | 67,300 | 8,960 |
| | | | 76,274 |
| Pharmaceuticals - 1.0% | | | |
| Catalent, Inc. (b) | | 724,193 | 17,330 |
| Prestige Brands Holdings, Inc. (b) | | 300,000 | 14,271 |
| | | | 31,601 |
|
| TOTAL HEALTH CARE | | | 301,180 |
|
| INDUSTRIALS - 10.9% | | | |
| Aerospace & Defense - 4.1% | | | |
| General Dynamics Corp. | | 194,400 | 34,088 |
| KEYW Holding Corp. (a)(b) | | 1,576,737 | 19,757 |
| Northrop Grumman Corp. | | 70,700 | 17,650 |
| Space Exploration Technologies Corp. Class A (b)(d) | | 40,909 | 4,254 |
| Teledyne Technologies, Inc. (b) | | 112,800 | 14,085 |
| Textron, Inc. | | 426,600 | 19,636 |
| TransDigm Group, Inc. | | 61,600 | 15,488 |
| | | | 124,958 |
| Air Freight & Logistics - 2.4% | | | |
| C.H. Robinson Worldwide, Inc. (a) | | 244,600 | 18,308 |
| Expeditors International of Washington, Inc. | | 205,000 | 10,812 |
| FedEx Corp. | | 127,600 | 24,457 |
| Hub Group, Inc. Class A (b) | | 207,916 | 8,909 |
| PostNL NV (b) | | 2,339,400 | 11,529 |
| | | | 74,015 |
| Commercial Services & Supplies - 1.0% | | | |
| KAR Auction Services, Inc. | | 283,900 | 11,969 |
| Stericycle, Inc. (b) | | 125,800 | 9,180 |
| U.S. Ecology, Inc. | | 193,056 | 8,967 |
| | | | 30,116 |
| Construction & Engineering - 0.6% | | | |
| Jacobs Engineering Group, Inc. (b) | | 268,644 | 16,659 |
| Electrical Equipment - 0.4% | | | |
| Melrose Industries PLC | | 4,653,496 | 10,670 |
| Machinery - 0.5% | | | |
| Pentair PLC | | 124,900 | 7,177 |
| Rational AG | | 21,300 | 9,378 |
| | | | 16,555 |
| Road & Rail - 0.9% | | | |
| Genesee & Wyoming, Inc. Class A (b) | | 227,300 | 17,366 |
| Kansas City Southern | | 108,100 | 9,590 |
| | | | 26,956 |
| Trading Companies & Distributors - 1.0% | | | |
| Rush Enterprises, Inc. Class A (b) | | 294,100 | 8,897 |
| United Rentals, Inc. (b) | | 215,900 | 21,830 |
| | | | 30,727 |
|
| TOTAL INDUSTRIALS | | | 330,656 |
|
| INFORMATION TECHNOLOGY - 18.8% | | | |
| Communications Equipment - 3.0% | | | |
| Brocade Communications Systems, Inc. | | 1,073,600 | 13,248 |
| Cisco Systems, Inc. | | 2,237,900 | 66,734 |
| Juniper Networks, Inc. | | 392,700 | 10,815 |
| | | | 90,797 |
| Electronic Equipment & Components - 1.8% | | | |
| Amphenol Corp. Class A | | 280,182 | 19,125 |
| CDW Corp. | | 226,900 | 11,626 |
| IPG Photonics Corp. (b) | | 149,000 | 14,292 |
| Keysight Technologies, Inc. (b) | | 290,000 | 10,681 |
| | | | 55,724 |
| Internet Software & Services - 3.3% | | | |
| Akamai Technologies, Inc. (b) | | 375,300 | 25,033 |
| Alphabet, Inc.: | | | |
| Class A (b) | | 18,300 | 14,199 |
| Class C (b) | | 17,700 | 13,417 |
| Endurance International Group Holdings, Inc. (b) | | 1,110,200 | 8,826 |
| Facebook, Inc. Class A (b) | | 182,800 | 21,647 |
| GoDaddy, Inc. (a)(b) | | 489,700 | 17,306 |
| | | | 100,428 |
| IT Services - 4.0% | | | |
| First Data Corp. (f) | | 1,067,762 | 15,557 |
| First Data Corp. Class A (b) | | 1,372,000 | 19,990 |
| FleetCor Technologies, Inc. (b) | | 74,400 | 11,111 |
| Leidos Holdings, Inc. | | 178,000 | 9,114 |
| PayPal Holdings, Inc. (b) | | 557,200 | 21,887 |
| Visa, Inc. Class A | | 578,100 | 44,699 |
| | | | 122,358 |
| Semiconductors & Semiconductor Equipment - 3.2% | | | |
| Broadcom Ltd. | | 106,600 | 18,174 |
| Lam Research Corp. | | 97,200 | 10,305 |
| Linear Technology Corp. | | 155,800 | 9,742 |
| Maxim Integrated Products, Inc. | | 302,200 | 11,867 |
| Qualcomm, Inc. | | 556,400 | 37,908 |
| Xilinx, Inc. | | 157,800 | 8,518 |
| | | | 96,514 |
| Software - 2.3% | | | |
| ANSYS, Inc. (b) | | 131,500 | 12,365 |
| Aspen Technology, Inc. (b) | | 531,000 | 28,053 |
| Citrix Systems, Inc. (b) | | 207,300 | 17,979 |
| Mobileye NV (b) | | 330,000 | 12,286 |
| Trion World Network, Inc. (b)(d) | | 1,062,359 | 96 |
| Trion World Network, Inc.: | | | |
| warrants 8/10/17 (b)(d) | | 28,722 | 0 |
| warrants 10/3/18 (b)(d) | | 42,310 | 0 |
| | | | 70,779 |
| Technology Hardware, Storage & Peripherals - 1.2% | | | |
| Apple, Inc. | | 315,700 | 34,891 |
|
| TOTAL INFORMATION TECHNOLOGY | | | 571,491 |
|
| MATERIALS - 3.4% | | | |
| Chemicals - 2.1% | | | |
| Albemarle Corp. U.S. | | 168,200 | 14,765 |
| LyondellBasell Industries NV Class A | | 202,600 | 18,299 |
| Potash Corp. of Saskatchewan, Inc. | | 514,800 | 9,389 |
| PPG Industries, Inc. | | 206,000 | 19,762 |
| | | | 62,215 |
| Metals & Mining - 1.3% | | | |
| Franco-Nevada Corp. | | 143,800 | 8,353 |
| Freeport-McMoRan, Inc. | | 838,200 | 12,866 |
| Newcrest Mining Ltd. | | 541,982 | 7,704 |
| Novagold Resources, Inc. (b) | | 2,591,580 | 11,884 |
| | | | 40,807 |
|
| TOTAL MATERIALS | | | 103,022 |
|
| REAL ESTATE - 0.8% | | | |
| Equity Real Estate Investment Trusts (REITs) - 0.5% | | | |
| Cousins Properties, Inc. | | 901,553 | 7,131 |
| Parkway, Inc. (b) | | 112,694 | 2,209 |
| VEREIT, Inc. | | 471,400 | 3,908 |
| | | | 13,248 |
| Real Estate Management & Development - 0.3% | | | |
| Realogy Holdings Corp. | | 414,300 | 10,005 |
|
| TOTAL REAL ESTATE | | | 23,253 |
|
| TELECOMMUNICATION SERVICES - 1.7% | | | |
| Diversified Telecommunication Services - 1.7% | | | |
| Verizon Communications, Inc. | | 1,065,485 | 53,168 |
| UTILITIES - 3.7% | | | |
| Electric Utilities - 3.7% | | | |
| Alliant Energy Corp. | | 498,200 | 17,895 |
| Duke Energy Corp. | | 340,003 | 25,082 |
| Exelon Corp. | | 609,400 | 19,812 |
| IDACORP, Inc. | | 260,800 | 19,860 |
| OGE Energy Corp. | | 265,200 | 8,394 |
| Xcel Energy, Inc. | | 557,200 | 21,736 |
| | | | 112,779 |
| TOTAL COMMON STOCKS | | | |
| (Cost $2,511,523) | | | 2,938,237 |
| | | Principal Amount (000s) | Value (000s) |
|
| Corporate Bonds - 0.1% | | | |
| Convertible Bonds - 0.0% | | | |
| INFORMATION TECHNOLOGY - 0.0% | | | |
| Software - 0.0% | | | |
| Trion World Network, Inc. 12% 10/10/19 pay-in-kind (d)(g) | | 401 | 176 |
| Nonconvertible Bonds - 0.1% | | | |
| ENERGY - 0.1% | | | |
| Energy Equipment & Services - 0.1% | | | |
| Pacific Drilling V Ltd. 7.25% 12/1/17 (f) | | 9,250 | 3,978 |
| TOTAL CORPORATE BONDS | | | |
| (Cost $8,116) | | | 4,154 |
| | | Shares | Value (000s) |
|
| Other - 0.2% | | | |
| ENERGY - 0.2% | | | |
| Oil, Gas & Consumable Fuels - 0.2% | | | |
| Utica Shale Drilling Program (non-operating revenue interest) unit (d)(e) | | | |
| (Cost $5,578) | | 5,578,436 | 5,578 |
|
| Money Market Funds - 4.8% | | | |
| Fidelity Cash Central Fund, 0.39% (h) | | 58,473,566 | 58,485 |
| Fidelity Securities Lending Cash Central Fund 0.48% (h)(i) | | 86,330,619 | 86,348 |
| TOTAL MONEY MARKET FUNDS | | | |
| (Cost $144,818) | | | 144,833 |
| TOTAL INVESTMENT PORTFOLIO - 101.6% | | | |
| (Cost $2,670,035) | | | 3,092,802 |
| NET OTHER ASSETS (LIABILITIES) - (1.6)% | | | (48,107) |
| NET ASSETS - 100% | | | $3,044,695 |
Values shown as $0 may reflect amounts less than $500.
Legend
(a) Security or a portion of the security is on loan at period end.
(b) Non-income producing
(c) Investment is owned by an entity that is treated as a U.S. Corporation for tax purposes in which the Fund holds a percentage ownership.
(d) Restricted securities - Investment in securities not registered under the Securities Act of 1933 (excluding 144A issues). At the end of the period, the value of restricted securities (excluding 144A issues) amounted to $25,444,000 or 0.8% of net assets.
(e) Investment is owned by a wholly-owned subsidiary (Subsidiary) that is treated as a corporation for U.S. tax purposes.
(f) Security exempt from registration under Rule 144A of the Securities Act of 1933. These securities may be resold in transactions exempt from registration, normally to qualified institutional buyers. At the end of the period, the value of these securities amounted to $19,535,000 or 0.6% of net assets.
(g) Coupon rates for floating and adjustable rate securities reflect the rates in effect at period end.
(h) Affiliated fund that is generally available only to investment companies and other accounts managed by Fidelity Investments. The rate quoted is the annualized seven-day yield of the fund at period end. A complete unaudited listing of the fund's holdings as of its most recent quarter end is available upon request. In addition, each Fidelity Central Fund's financial statements, which are not covered by the Fund's Report of Independent Registered Public Accounting Firm, are available on the SEC's website or upon request.
(i) Investment made with cash collateral received from securities on loan.
Additional information on each restricted holding is as follows:
| Security | Acquisition Date | Acquisition Cost (000s) |
| New Academy Holding Co. LLC unit | 8/1/11 | $6,956 |
| Space Exploration Technologies Corp. Class A | 4/8/16 | $3,944 |
| Trion World Network, Inc. | 8/22/08 - 3/20/13 | $5,798 |
| Trion World Network, Inc. warrants 8/10/17 | 8/10/10 | $0 |
| Trion World Network, Inc. warrants 10/3/18 | 10/10/13 | $0 |
| Trion World Network, Inc. 12% 10/10/19 pay-in-kind | 10/10/13 - 10/10/16 | $401 |
| Utica Shale Drilling Program (non-operating revenue interest) unit | 10/5/16 - 11/4/16 | $5,578 |
| WME Entertainment Parent, LLC Class A unit | 8/16/16 | $7,349 |
Affiliated Central Funds
Information regarding fiscal year to date income earned by the Fund from investments in Fidelity Central Funds is as follows:
| Fund | Income earned |
| | (Amounts in thousands) |
| Fidelity Cash Central Fund | $259 |
| Fidelity Securities Lending Cash Central Fund | 1,997 |
| Total | $2,256 |
Investment Valuation
The following is a summary of the inputs used, as of November 30, 2016, involving the Fund's assets and liabilities carried at fair value. The inputs or methodology used for valuing securities may not be an indication of the risk associated with investing in those securities. For more information on valuation inputs, and their aggregation into the levels used below, please refer to the Investment Valuation section in the accompanying Notes to Financial Statements.
| | Valuation Inputs at Reporting Date: |
| Description | Total | Level 1 | Level 2 | Level 3 |
| (Amounts in thousands) | | | | |
| Investments in Securities: | | | | |
| Equities: | | | | |
| Consumer Discretionary | $286,741 | $271,401 | $-- | $15,340 |
| Consumer Staples | 104,036 | 95,565 | 8,471 | -- |
| Energy | 467,520 | 467,520 | -- | -- |
| Financials | 584,391 | 576,561 | 7,830 | -- |
| Health Care | 301,180 | 301,180 | -- | -- |
| Industrials | 330,656 | 326,402 | -- | 4,254 |
| Information Technology | 571,491 | 571,395 | -- | 96 |
| Materials | 103,022 | 95,318 | 7,704 | -- |
| Real Estate | 23,253 | 23,253 | -- | -- |
| Telecommunication Services | 53,168 | 53,168 | -- | -- |
| Utilities | 112,779 | 112,779 | -- | -- |
| Corporate Bonds | 4,154 | -- | 3,978 | 176 |
| Other | 5,578 | -- | -- | 5,578 |
| Money Market Funds | 144,833 | 144,833 | -- | -- |
| Total Investments in Securities: | $3,092,802 | $3,039,375 | $27,983 | $25,444 |
Other Information
Distribution of investments by country or territory of incorporation, as a percentage of Total Net Assets, is as follows (Unaudited):
| United States of America | 86.6% |
| Canada | 2.0% |
| Bermuda | 1.9% |
| Luxembourg | 1.7% |
| Netherlands | 1.4% |
| United Kingdom | 1.4% |
| Switzerland | 1.3% |
| Others (Individually Less Than 1%) | 3.7% |
| | 100.0% |
See accompanying notes which are an integral part of the financial statements.
Financial Statements
Statement of Assets and Liabilities
| Amounts in thousands (except per-share amount) | | November 30, 2016 |
| Assets | | |
Investment in securities, at value (including securities loaned of $88,268) — See accompanying schedule:
Unaffiliated issuers (cost $2,525,217) | $2,947,969 | |
| Fidelity Central Funds (cost $144,818) | 144,833 | |
| Total Investments (cost $2,670,035) | | $3,092,802 |
| Cash | | 7 |
| Receivable for investments sold | | 46,754 |
| Receivable for fund shares sold | | 1,966 |
| Dividends receivable | | 4,289 |
| Interest receivable | | 342 |
| Distributions receivable from Fidelity Central Funds | | 86 |
| Prepaid expenses | | 7 |
| Other receivables | | 242 |
| Total assets | | 3,146,495 |
| Liabilities | | |
| Payable for investments purchased | $12,579 | |
| Payable for fund shares redeemed | 1,453 | |
| Accrued management fee | 906 | |
| Other affiliated payables | 457 | |
| Other payables and accrued expenses | 81 | |
| Collateral on securities loaned, at value | 86,324 | |
| Total liabilities | | 101,800 |
| Net Assets | | $3,044,695 |
| Net Assets consist of: | | |
| Paid in capital | | $2,443,396 |
| Undistributed net investment income | | 30,997 |
| Accumulated undistributed net realized gain (loss) on investments and foreign currency transactions | | 147,538 |
| Net unrealized appreciation (depreciation) on investments and assets and liabilities in foreign currencies | | 422,764 |
| Net Assets, for 81,068 shares outstanding | | $3,044,695 |
| Net Asset Value, offering price and redemption price per share ($3,044,695 ÷ 81,068 shares) | | $37.56 |
See accompanying notes which are an integral part of the financial statements.
Statement of Operations
| Amounts in thousands | | Year ended November 30, 2016 |
| Investment Income | | |
| Dividends | | $49,430 |
| Interest | | 2,375 |
| Income from Fidelity Central Funds | | 2,256 |
| Total income | | 54,061 |
| Expenses | | |
| Management fee | | |
| Basic fee | $17,781 | |
| Performance adjustment | (6,532) | |
| Transfer agent fees | 4,670 | |
| Accounting and security lending fees | 893 | |
| Custodian fees and expenses | 68 | |
| Independent trustees' fees and expenses | 13 | |
| Registration fees | 39 | |
| Audit | 105 | |
| Legal | 9 | |
| Miscellaneous | 28 | |
| Total expenses before reductions | 17,074 | |
| Expense reductions | (120) | 16,954 |
| Net investment income (loss) | | 37,107 |
| Realized and Unrealized Gain (Loss) | | |
| Net realized gain (loss) on: | | |
| Investment securities: | | |
| Unaffiliated issuers | 153,929 | |
| Fidelity Central Funds | 12 | |
| Foreign currency transactions | (34) | |
| Total net realized gain (loss) | | 153,907 |
Change in net unrealized appreciation (depreciation) on:
Investment securities | 36,889 | |
| Total change in net unrealized appreciation (depreciation) | | 36,889 |
| Net gain (loss) | | 190,796 |
| Net increase (decrease) in net assets resulting from operations | | $227,903 |
See accompanying notes which are an integral part of the financial statements.
Statement of Changes in Net Assets
| Amounts in thousands | Year ended November 30, 2016 | Year ended November 30, 2015 |
| Increase (Decrease) in Net Assets | | |
| Operations | | |
| Net investment income (loss) | $37,107 | $37,763 |
| Net realized gain (loss) | 153,907 | 390,376 |
| Change in net unrealized appreciation (depreciation) | 36,889 | (433,579) |
| Net increase (decrease) in net assets resulting from operations | 227,903 | (5,440) |
| Distributions to shareholders from net investment income | (29,142) | (27,989) |
| Distributions to shareholders from net realized gain | (323,806) | (279,891) |
| Total distributions | (352,948) | (307,880) |
| Share transactions | | |
| Proceeds from sales of shares | 164,269 | 332,339 |
| Reinvestment of distributions | 337,203 | 294,067 |
| Cost of shares redeemed | (644,660) | (1,281,999) |
| Net increase (decrease) in net assets resulting from share transactions | (143,188) | (655,593) |
| Total increase (decrease) in net assets | (268,233) | (968,913) |
| Net Assets | | |
| Beginning of period | 3,312,928 | 4,281,841 |
| End of period | $3,044,695 | $3,312,928 |
| Other Information | | |
| Undistributed net investment income end of period | $30,997 | $27,454 |
| Shares | | |
| Sold | 4,743 | 8,503 |
| Issued in reinvestment of distributions | 10,236 | 7,811 |
| Redeemed | (18,882) | (33,051) |
| Net increase (decrease) | (3,903) | (16,737) |
See accompanying notes which are an integral part of the financial statements.
Financial Highlights — Fidelity New Millennium Fund
| Years ended November 30, | 2016 | 2015 | 2014 | 2013 | 2012 |
| Selected Per–Share Data | | | | | |
| Net asset value, beginning of period | $38.99 | $42.10 | $40.16 | $32.83 | $29.63 |
| Income from Investment Operations | | | | | |
| Net investment income (loss)A | .43 | .39 | .38B | .23 | .32 |
| Net realized and unrealized gain (loss) | 2.31 | (.46) | 3.89 | 10.14 | 3.85 |
| Total from investment operations | 2.74 | (.07) | 4.27 | 10.37 | 4.17 |
| Distributions from net investment income | (.35) | (.28) | (.19) | (.37) | (.13) |
| Distributions from net realized gain | (3.82) | (2.76) | (2.13) | (2.67) | (.84) |
| Total distributions | (4.17) | (3.04) | (2.33)C | (3.04) | (.97) |
| Net asset value, end of period | $37.56 | $38.99 | $42.10 | $40.16 | $32.83 |
| Total ReturnD | 8.57% | .08% | 11.31% | 34.78% | 14.63% |
| Ratios to Average Net AssetsE,F | | | | | |
| Expenses before reductions | .57% | .72% | .82% | .88% | .96% |
| Expenses net of fee waivers, if any | .57% | .72% | .82% | .88% | .96% |
| Expenses net of all reductions | .57% | .71% | .81% | .87% | .96% |
| Net investment income (loss) | 1.25% | 1.00% | .92%B | .65% | 1.02% |
| Supplemental Data | | | | | |
| Net assets, end of period (in millions) | $3,045 | $3,313 | $4,282 | $2,826 | $2,001 |
| Portfolio turnover rateG | 44% | 57% | 44% | 49% | 71% |
A Calculated based on average shares outstanding during the period.
B Net Investment income per share reflects a large, non-recurring dividend which amounted to $.13 per share. Excluding this non-recurring dividend, the ratio of net investment income (loss) to average net assets would have been .59%.
C Total distributions of $2.33 per share is comprised of distributions from net investment income of $.192 and distributions from net realized gain of $2.133 per share.
D Total returns would have been lower if certain expenses had not been reduced during the applicable periods shown.
E Fees and expenses of any underlying Fidelity Central Funds are not included in the Fund's expense ratio. The Fund indirectly bears its proportionate share of the expenses of any underlying Fidelity Central Funds.
F Expense ratios reflect operating expenses of the Fund. Expenses before reductions do not reflect amounts reimbursed by the investment adviser or reductions from brokerage service arrangements or reductions from other expense offset arrangements and do not represent the amount paid by the Fund during periods when reimbursements or reductions occur. Expenses net of fee waivers reflect expenses after reimbursement by the investment adviser but prior to reductions from brokerage service arrangements or other expense offset arrangements. Expenses net of all reductions represent the net expenses paid by the Fund.
G Amount does not include the portfolio activity of any underlying Fidelity Central Funds.
See accompanying notes which are an integral part of the financial statements.
Notes to Financial Statements
For the period ended November 30, 2016
(Amounts in thousands except percentages)
1. Organization.
Fidelity New Millennium Fund (the Fund) is a fund of Fidelity Mt. Vernon Street Trust (the Trust) and is authorized to issue an unlimited number of shares. Share transactions on the Statement of Changes in Net Assets may contain exchanges between affiliated funds. The Trust is registered under the Investment Company Act of 1940, as amended (the 1940 Act), as an open-end management investment company organized as a Massachusetts business trust.
2. Investments in Fidelity Central Funds.
The Fund invests in Fidelity Central Funds, which are open-end investment companies generally available only to other investment companies and accounts managed by the investment adviser and its affiliates. The Fund's Schedule of Investments lists each of the Fidelity Central Funds held as of period end, if any, as an investment of the Fund, but does not include the underlying holdings of each Fidelity Central Fund. As an Investing Fund, the Fund indirectly bears its proportionate share of the expenses of the underlying Fidelity Central Funds.
The Money Market Central Funds seek preservation of capital and current income and are managed by Fidelity Investments Money Management, Inc. (FIMM), an affiliate of the investment adviser. Annualized expenses of the Money Market Central Funds as of their most recent shareholder report date are less than .005%.
A complete unaudited list of holdings for each Fidelity Central Fund is available upon request or at the Securities and Exchange Commission (the SEC) website at www.sec.gov. In addition, the financial statements of the Fidelity Central Funds, which are not covered by the Fund's Report of Independent Registered Public Accounting Firm, are available on the SEC website or upon request.
3. Significant Accounting Policies.
The financial statements have been prepared in conformity with accounting principles generally accepted in the United States of America (GAAP), which require management to make certain estimates and assumptions at the date of the financial statements. Actual results could differ from those estimates. Subsequent events, if any, through the date that the financial statements were issued have been evaluated in the preparation of the financial statements. The following summarizes the significant accounting policies of the Fund:
Investment Valuation. Investments are valued as of 4:00 p.m. Eastern time on the last calendar day of the period. The Board of Trustees (the Board) has delegated the day to day responsibility for the valuation of the Fund's investments to the Fair Value Committee (the Committee) established by the Fund's investment adviser. In accordance with valuation policies and procedures approved by the Board, the Fund attempts to obtain prices from one or more third party pricing vendors or brokers to value its investments. When current market prices, quotations or currency exchange rates are not readily available or reliable, investments will be fair valued in good faith by the Committee, in accordance with procedures adopted by the Board. Factors used in determining fair value vary by investment type and may include market or investment specific events, changes in interest rates and credit quality. The frequency with which these procedures are used cannot be predicted and they may be utilized to a significant extent. The Committee oversees the Fund's valuation policies and procedures and reports to the Board on the Committee's activities and fair value determinations. The Board monitors the appropriateness of the procedures used in valuing the Fund's investments and ratifies the fair value determinations of the Committee.
The Fund categorizes the inputs to valuation techniques used to value its investments into a disclosure hierarchy consisting of three levels as shown below:
- Level 1 – quoted prices in active markets for identical investments
- Level 2 – other significant observable inputs (including quoted prices for similar investments, interest rates, prepayment speeds, etc.)
- Level 3 – unobservable inputs (including the Fund's own assumptions based on the best information available)
Valuation techniques used to value the Fund's investments by major category are as follows:
Equity securities, including restricted securities, for which market quotations are readily available, are valued at the last reported sale price or official closing price as reported by a third party pricing vendor on the primary market or exchange on which they are traded and are categorized as Level 1 in the hierarchy. In the event there were no sales during the day or closing prices are not available, securities are valued at the last quoted bid price or may be valued using the last available price and are generally categorized as Level 2 in the hierarchy. For foreign equity securities, when market or security specific events arise, comparisons to the valuation of American Depositary Receipts (ADRs), futures contracts, Exchange-Traded Funds (ETFs) and certain indexes as well as quoted prices for similar securities may be used and would be categorized as Level 2 in the hierarchy. Utilizing these techniques may result in transfers between Level 1 and Level 2. For equity securities, including restricted securities, where observable inputs are limited, assumptions about market activity and risk are used and these securities may be categorized as Level 3 in the hierarchy.
Debt securities, including restricted securities, are valued based on evaluated prices received from third party pricing vendors or from brokers who make markets in such securities. Corporate bonds are valued by pricing vendors who utilize matrix pricing which considers yield or price of bonds of comparable quality, coupon, maturity and type or by broker-supplied prices. When independent prices are unavailable or unreliable, debt securities may be valued utilizing pricing methodologies which consider similar factors that would be used by third party pricing vendors. Debt securities are generally categorized as Level 2 in the hierarchy but may be Level 3 depending on the circumstances.
Investments in open-end mutual funds, including the Fidelity Central Funds, are valued at their closing net asset value (NAV) each business day and are categorized as Level 1 in the hierarchy.
Changes in valuation techniques may result in transfers in or out of an assigned level within the disclosure hierarchy. The aggregate value of investments by input level as of November 30, 2016 is included at the end of the Fund's Schedule of Investments.
Foreign Currency. The Fund may use foreign currency contracts to facilitate transactions in foreign-denominated securities. Gains and losses from these transactions may arise from changes in the value of the foreign currency or if the counterparties do not perform under the contracts' terms.
Foreign-denominated assets, including investment securities, and liabilities are translated into U.S. dollars at the exchange rates at period end. Purchases and sales of investment securities, income and dividends received and expenses denominated in foreign currencies are translated into U.S. dollars at the exchange rate in effect on the transaction date.
The effects of exchange rate fluctuations on investments are included with the net realized and unrealized gain (loss) on investment securities. Other foreign currency transactions resulting in realized and unrealized gain (loss) are disclosed separately.
Investment Transactions and Income. For financial reporting purposes, the Fund's investment holdings and NAV include trades executed through the end of the last business day of the period. The NAV per share for processing shareholder transactions is calculated as of the close of business of the New York Stock Exchange (NYSE), normally 4:00 p.m. Eastern time and includes trades executed through the end of the prior business day. Gains and losses on securities sold are determined on the basis of identified cost and may include proceeds received from litigation. Dividend income is recorded on the ex-dividend date, except for certain dividends from foreign securities where the ex-dividend date may have passed, which are recorded as soon as the Fund is informed of the ex-dividend date. Non-cash dividends included in dividend income, if any, are recorded at the fair market value of the securities received. Income and capital gain distributions from Fidelity Central Funds, if any, are recorded on the ex-dividend date. Certain distributions received by the Fund represent a return of capital or capital gain. The Fund determines the components of these distributions subsequent to the ex-dividend date, based upon receipt of tax filings or other correspondence relating to the underlying investment. These distributions are recorded as a reduction of cost of investments and/or as a realized gain. Interest income is accrued as earned and includes coupon interest and amortization of premium and accretion of discount on debt securities as applicable. Investment income is recorded net of foreign taxes withheld where recovery of such taxes is uncertain. Debt obligations may be placed on non-accrual status and related interest income may be reduced by ceasing current accruals and writing off interest receivables when the collection of all or a portion of interest has become doubtful based on consistently applied procedures. A debt obligation is removed from non-accrual status when the issuer resumes interest payments or when collectability of interest is reasonably assured.
Expenses. Expenses directly attributable to a fund are charged to that fund. Expenses attributable to more than one fund are allocated among the respective funds on the basis of relative net assets or other appropriate methods. Expense estimates are accrued in the period to which they relate and adjustments are made when actual amounts are known.
Income Tax Information and Distributions to Shareholders. Each year, the Fund intends to qualify as a regulated investment company under Subchapter M of the Internal Revenue Code, including distributing substantially all of its taxable income and realized gains. As a result, no provision for U.S. Federal income taxes is required. As of November 30, 2016, the Fund did not have any unrecognized tax benefits in the financial statements; nor is the Fund aware of any tax positions for which it is reasonably possible that the total amounts of unrecognized tax benefits will significantly change in the next twelve months. The Fund files a U.S. federal tax return, in addition to state and local tax returns as required. The Fund's federal income tax returns are subject to examination by the Internal Revenue Service (IRS) for a period of three fiscal years after they are filed. State and local tax returns may be subject to examination for an additional fiscal year depending on the jurisdiction. Foreign taxes are provided for based on the Fund's understanding of the tax rules and rates that exist in the foreign markets in which it invests.
Distributions are declared and recorded on the ex-dividend date. Income and capital gain distributions are determined in accordance with income tax regulations, which may differ from GAAP. In addition, the Fund claimed a portion of the payment made to redeeming shareholders as a distribution for income tax purposes.
Capital accounts within the financial statements are adjusted for permanent book-tax differences. These adjustments have no impact on net assets or the results of operations. Capital accounts are not adjusted for temporary book-tax differences which will reverse in a subsequent period.
Book-tax differences are primarily due to foreign currency transactions, market discount, partnerships, deferred trustees compensation and losses deferred due to wash sales.
The federal tax cost of investment securities and unrealized appreciation (depreciation) as of period end were as follows:
| Gross unrealized appreciation | $622,257 |
| Gross unrealized depreciation | (196,730) |
| Net unrealized appreciation (depreciation) on securities | $425,527 |
The tax-based components of distributable earnings as of period end were as follows:
| Undistributed ordinary income | $31,710 |
| Undistributed long-term capital gain | $145,976 |
| Net unrealized appreciation (depreciation) on securities and other investments | $423,615 |
The tax character of distributions paid was as follows:
| | November 30, 2016 | November 30, 2015 |
| Ordinary Income | $29,142 | $ 44,620 |
| Long-term Capital Gains | 323,806 | 263,260 |
| Total | $352,948 | $ 307,880 |
Restricted Securities. The Fund may invest in securities that are subject to legal or contractual restrictions on resale. These securities generally may be resold in transactions exempt from registration or to the public if the securities are registered. Disposal of these securities may involve time-consuming negotiations and expense, and prompt sale at an acceptable price may be difficult. Information regarding restricted securities is included at the end of the Fund's Schedule of Investments.
Consolidated Subsidiary. The Fund invests in certain investments through a wholly-owned subsidiary ("Subsidiary"), which may be subject to federal and state taxes upon disposition.
As of period end, the Fund held an investment of $12,927 in these Subsidiaries, representing .42% of the Fund's net assets. The financial statements have been consolidated and include accounts of the Fund and each Subsidiary. Accordingly, all inter-company transactions and balances have been eliminated.
4. Purchases and Sales of Investments.
Purchases and sales of securities, other than short-term securities, aggregated $1,291,246 and $1,800,549, respectively.
5. Fees and Other Transactions with Affiliates.
Management Fee. Fidelity Management & Research Company (the investment adviser) and its affiliates provide the Fund with investment management related services for which the Fund pays a monthly management fee. The management fee is the sum of an individual fund fee rate that is based on an annual rate of .35% of the Fund's average net assets and an annualized group fee rate that averaged .25% during the period. The group fee rate is based upon the average net assets of all the mutual funds advised by the investment adviser, including any mutual funds previously advised by the investment adviser that are currently advised by Fidelity SelectCo, LLC, an affiliate of the investment adviser. The group fee rate decreases as assets under management increase and increases as assets under management decrease. In addition, the management fee is subject to a performance adjustment (up to a maximum of +/- .20% of the Fund's average net assets over a 36 month performance period). The upward or downward adjustment to the management fee is based on the Fund's relative investment performance as compared to its benchmark index, the S&P 500 Index, over the same 36 month performance period. For the reporting period, the total annual management fee rate, including the performance adjustment, was .38% of the Fund's average net assets. The performance adjustment included in the management fee rate may be higher or lower than the maximum performance adjustment rate due to the difference between the average net assets for the reporting and performance periods.
Effective February 1, 2017, the Board of Trustees approved a reduction in the individual fund fee rate from .35% to .30%.
Transfer Agent Fees. Fidelity Investments Institutional Operations Company, Inc. (FIIOC), an affiliate of the investment adviser, is the Fund's transfer, dividend disbursing and shareholder servicing agent. FIIOC receives account fees and asset-based fees that vary according to account size and type of account. FIIOC pays for typesetting, printing and mailing of shareholder reports, except proxy statements. For the period, the transfer agent fees were equivalent to an annual rate of .16% of average net assets.
Accounting and Security Lending Fees. Fidelity Service Company, Inc. (FSC), an affiliate of the investment adviser, maintains the Fund's accounting records. The accounting fee is based on the level of average net assets for each month. Under a separate contract, FSC administers the security lending program. The security lending fee is based on the number and duration of lending transactions.
Brokerage Commissions. The Fund placed a portion of its portfolio transactions with brokerage firms which are affiliates of the investment adviser. Brokerage commissions are included in net realized gain (loss) and change in net unrealized appreciation (depreciation) in the Statement of Operations. The commissions paid to these affiliated firms were $32 for the period.
Interfund Lending Program. Pursuant to an Exemptive Order issued by the SEC, the Fund, along with other registered investment companies having management contracts with Fidelity Management & Research Company (FMR) or other affiliated entities of FMR, may participate in an interfund lending program. This program provides an alternative credit facility allowing the funds to borrow from, or lend money to, other participating affiliated funds. At period end, there were no interfund loans outstanding. The Fund's activity in this program during the period for which loans were outstanding was as follows:
| Borrower or Lender | Average Loan Balance | Weighted Average Interest Rate | Interest Expense |
| Borrower | $7,128 | .60% | $-(a) |
(a) In the amount of less than five hundred dollars
Interfund Trades. The Fund may purchase from or sell securities to other Fidelity Funds under procedures adopted by the Board. The procedures have been designed to ensure these interfund trades are executed in accordance with Rule 17a-7 of the 1940 Act. Interfund trades are included within the respective purchases and sales amounts shown in the Purchases and Sales of Investments note.
6. Committed Line of Credit.
The Fund participates with other funds managed by the investment adviser or an affiliate in a $4.25 billion credit facility (the "line of credit") to be utilized for temporary or emergency purposes to fund shareholder redemptions or for other short-term liquidity purposes. The Fund has agreed to pay commitment fees on its pro-rata portion of the line of credit, which amounted to $8 and is reflected in Miscellaneous expenses on the Statement of Operations. During the period, the Fund did not borrow on this line of credit.
7. Security Lending.
The Fund lends portfolio securities through a lending agent from time to time in order to earn additional income. For equity securities, a lending agent is used and may loan securities to certain qualified borrowers, including Fidelity Capital Markets (FCM), a broker-dealer affiliated with the Fund. On the settlement date of the loan, the Fund receives collateral (in the form of U.S. Treasury obligations, letters of credit and/or cash) against the loaned securities and maintains collateral in an amount not less than 100% of the market value of the loaned securities during the period of the loan. The market value of the loaned securities is determined at the close of business of the Fund and any additional required collateral is delivered to the Fund on the next business day. The Fund or borrower may terminate the loan at any time, and if the borrower defaults on its obligation to return the securities loaned because of insolvency or other reasons, the Fund may apply collateral received from the borrower against the obligation. The Fund may experience delays and costs in recovering the securities loaned. Any cash collateral received is invested in the Fidelity Securities Lending Cash Central Fund. The value of loaned securities and cash collateral at period end are disclosed on the Fund's Statement of Assets and Liabilities. The value of securities loaned to FCM at period end was $79. Security lending income represents the income earned on investing cash collateral, less rebates paid to borrowers and any lending agent fees associated with the loan, plus any premium payments received for lending certain types of securities. Security lending income is presented in the Statement of Operations as a component of income from Fidelity Central Funds. Total security lending income during the period amounted to $1,997, including $32 from securities loaned to FCM.
8. Expense Reductions.
Commissions paid to certain brokers with whom the investment adviser, or its affiliates, places trades on behalf of the Fund include an amount in addition to trade execution, which may be rebated back to the Fund to offset certain expenses. This amount totaled $97 for the period.
In addition, during the period the investment adviser reimbursed and/or waived a portion of operating expenses in the amount of $23.
9. Other.
The Fund's organizational documents provide former and current trustees and officers with a limited indemnification against liabilities arising in connection with the performance of their duties to the Fund. In the normal course of business, the Fund may also enter into contracts that provide general indemnifications. The Fund's maximum exposure under these arrangements is unknown as this would be dependent on future claims that may be made against the Fund. The risk of material loss from such claims is considered remote.
Report of Independent Registered Public Accounting Firm
To the Trustees of Fidelity Mt. Vernon Street Trust and Shareholders of Fidelity New Millennium Fund:
In our opinion, the accompanying statement of assets and liabilities, including the schedule of investments, and the related statements of operations and of changes in net assets and the financial highlights present fairly, in all material respects, the financial position of Fidelity New Millennium Fund (a fund of Fidelity Mt. Vernon Street Trust) at November 30, 2016, the results of its operations for the year then ended, the changes in its net assets for each of the two years in the period then ended and the financial highlights for each of the five years in the period then ended, in conformity with accounting principles generally accepted in the United States of America. These financial statements and financial highlights (hereafter referred to as “financial statements”) are the responsibility of the Fidelity New Millennium Fund’s management. Our responsibility is to express an opinion on these financial statements based on our audits. We conducted our audits of these financial statements in accordance with the standards of the Public Company Accounting Oversight Board (United States). Those standards require that we plan and perform the audit to obtain reasonable assurance about whether the financial statements are free of material misstatement. An audit includes examining, on a test basis, evidence supporting the amounts and disclosures in the financial statements, assessing the accounting principles used and significant estimates made by management, and evaluating the overall financial statement presentation. We believe that our audits, which included confirmation of securities at November 30, 2016 by correspondence with the custodian and brokers, provide a reasonable basis for our opinion.
PricewaterhouseCoopers LLP
Boston, Massachusetts
January 18, 2017
Trustees and Officers
The Trustees, Members of the Advisory Board (if any), and officers of the trust and fund, as applicable, are listed below. The Board of Trustees governs the fund and is responsible for protecting the interests of shareholders. The Trustees are experienced executives who meet periodically throughout the year to oversee the fund's activities, review contractual arrangements with companies that provide services to the fund, oversee management of the risks associated with such activities and contractual arrangements, and review the fund's performance. Each of the Trustees oversees 170 funds.
The Trustees hold office without limit in time except that (a) any Trustee may resign; (b) any Trustee may be removed by written instrument, signed by at least two-thirds of the number of Trustees prior to such removal; (c) any Trustee who requests to be retired or who has become incapacitated by illness or injury may be retired by written instrument signed by a majority of the other Trustees; and (d) any Trustee may be removed at any special meeting of shareholders by a two-thirds vote of the outstanding voting securities of the trust. Each Trustee who is not an interested person (as defined in the 1940 Act) of the trust and the fund is referred to herein as an Independent Trustee. Each Independent Trustee shall retire not later than the last day of the calendar year in which his or her 75th birthday occurs. The Independent Trustees may waive this mandatory retirement age policy with respect to individual Trustees. Officers and Advisory Board Members hold office without limit in time, except that any officer or Advisory Board Member may resign or may be removed by a vote of a majority of the Trustees at any regular meeting or any special meeting of the Trustees. Except as indicated, each individual has held the office shown or other offices in the same company for the past five years.
The fund’s Statement of Additional Information (SAI) includes more information about the Trustees. To request a free copy, call Fidelity at 1-800-544-8544.
Experience, Skills, Attributes, and Qualifications of the Trustees. The Governance and Nominating Committee has adopted a statement of policy that describes the experience, qualifications, attributes, and skills that are necessary and desirable for potential Independent Trustee candidates (Statement of Policy). The Board believes that each Trustee satisfied at the time he or she was initially elected or appointed a Trustee, and continues to satisfy, the standards contemplated by the Statement of Policy. The Governance and Nominating Committee also engages professional search firms to help identify potential Independent Trustee candidates who have the experience, qualifications, attributes, and skills consistent with the Statement of Policy. From time to time, additional criteria based on the composition and skills of the current Independent Trustees, as well as experience or skills that may be appropriate in light of future changes to board composition, business conditions, and regulatory or other developments, have also been considered by the professional search firms and the Governance and Nominating Committee. In addition, the Board takes into account the Trustees' commitment and participation in Board and committee meetings, as well as their leadership of standing and ad hoc committees throughout their tenure.
In determining that a particular Trustee was and continues to be qualified to serve as a Trustee, the Board has considered a variety of criteria, none of which, in isolation, was controlling. The Board believes that, collectively, the Trustees have balanced and diverse experience, qualifications, attributes, and skills, which allow the Board to operate effectively in governing the fund and protecting the interests of shareholders. Information about the specific experience, skills, attributes, and qualifications of each Trustee, which in each case led to the Board's conclusion that the Trustee should serve (or continue to serve) as a trustee of the fund, is provided below.
Board Structure and Oversight Function. James C. Curvey is an interested person and currently serves as Chairman. The Trustees have determined that an interested Chairman is appropriate and benefits shareholders because an interested Chairman has a personal and professional stake in the quality and continuity of services provided to the fund. Independent Trustees exercise their informed business judgment to appoint an individual of their choosing to serve as Chairman, regardless of whether the Trustee happens to be independent or a member of management. The Independent Trustees have determined that they can act independently and effectively without having an Independent Trustee serve as Chairman and that a key structural component for assuring that they are in a position to do so is for the Independent Trustees to constitute a substantial majority for the Board. The Independent Trustees also regularly meet in executive session. Ned C. Lautenbach serves as Chairman of the Independent Trustees and as such (i) acts as a liaison between the Independent Trustees and management with respect to matters important to the Independent Trustees and (ii) with management prepares agendas for Board meetings.
Fidelity® funds are overseen by different Boards of Trustees. The fund's Board oversees Fidelity's high income and certain equity funds, and other Boards oversee Fidelity's investment-grade bond, money market, asset allocation, and sector funds. The asset allocation funds may invest in Fidelity® funds overseen by the fund's Board. The use of separate Boards, each with its own committee structure, allows the Trustees of each group of Fidelity® funds to focus on the unique issues of the funds they oversee, including common research, investment, and operational issues. On occasion, the separate Boards establish joint committees to address issues of overlapping consequences for the Fidelity® funds overseen by each Board.
The Trustees operate using a system of committees to facilitate the timely and efficient consideration of all matters of importance to the Trustees, the fund, and fund shareholders and to facilitate compliance with legal and regulatory requirements and oversight of the fund's activities and associated risks. The Board, acting through its committees, has charged FMR and its affiliates with (i) identifying events or circumstances the occurrence of which could have demonstrably adverse effects on the fund's business and/or reputation; (ii) implementing processes and controls to lessen the possibility that such events or circumstances occur or to mitigate the effects of such events or circumstances if they do occur; and (iii) creating and maintaining a system designed to evaluate continuously business and market conditions in order to facilitate the identification and implementation processes described in (i) and (ii) above. Because the day-to-day operations and activities of the fund are carried out by or through FMR, its affiliates, and other service providers, the fund's exposure to risks is mitigated but not eliminated by the processes overseen by the Trustees. While each of the Board's committees has responsibility for overseeing different aspects of the fund's activities, oversight is exercised primarily through the Operations, Audit, and Compliance Committees. In addition, the Independent Trustees have worked with FMR to enhance the Board's oversight of investment and financial risks, legal and regulatory risks, technology risks, and operational risks, including the development of additional risk reporting to the Board. For example, a working group comprised of Independent Trustees and FMR has worked and continues to work to review the Fidelity® funds' valuation-related activities, reporting and risk management. Appropriate personnel, including but not limited to the fund's Chief Compliance Officer (CCO), FMR's internal auditor, the independent accountants, the fund's Treasurer and portfolio management personnel, make periodic reports to the Board's committees, as appropriate, including an annual review of Fidelity's risk management program for the Fidelity® funds. The responsibilities of each standing committee, including their oversight responsibilities, are described further under "Standing Committees of the Trustees."
Interested Trustees*:
Correspondence intended for a Trustee who is an interested person may be sent to Fidelity Investments, 245 Summer Street, Boston, Massachusetts 02210.
Name, Year of Birth; Principal Occupations and Other Relevant Experience+
James C. Curvey (1935)
Year of Election or Appointment: 2007
Trustee
Chairman of the Board of Trustees
Mr. Curvey also serves as Trustee of other Fidelity® funds. Mr. Curvey is a Director of Fidelity Research & Analysis Co. (investment adviser firm, 2009-present), and Vice Chairman (2007-present) and Director of FMR LLC (diversified financial services company). In addition, Mr. Curvey serves as an Overseer for the Boston Symphony Orchestra and a member of the board of Artis-Naples, Naples, Florida, and as a Trustee for Brewster Academy, Wolfeboro, New Hampshire. Previously, Mr. Curvey served as a Director of Fidelity Investments Money Management, Inc. (investment adviser firm, 2009-2014) and a Director of FMR and FMR Co., Inc. (investment adviser firms, 2007-2014).
Charles S. Morrison (1960)
Year of Election or Appointment: 2014
Trustee
Mr. Morrison also serves as Trustee of other funds. He serves as President of Fidelity Management & Research Company (FMR) (investment adviser firm, 2016-present), a Director of Fidelity Investments Money Management, Inc. (FIMM) (investment adviser firm, 2014-present), Director of Fidelity SelectCo, LLC (investment adviser firm, 2014-present), President, Asset Management (2014-present), and is an employee of Fidelity Investments. Previously, Mr. Morrison served as Vice President of Fidelity's Fixed Income and Asset Allocation Funds (2012-2014), President, Fixed Income (2011-2014), Vice President of Fidelity's Money Market Funds (2005-2009), President, Money Market Group Leader of FMR (investment adviser firm, 2009), and Senior Vice President, Money Market Group of FMR (2004-2009). Mr. Morrison also served as Vice President of Fidelity's Bond Funds (2002-2005), certain Balanced Funds (2002-2005), and certain Asset Allocation Funds (2002-2007), and as Senior Vice President (2002-2005) of Fidelity's Bond Division.
* Determined to be an “Interested Trustee” by virtue of, among other things, his or her affiliation with the trust or various entities under common control with FMR.
+ The information includes the Trustee's principal occupation during the last five years and other information relating to the experience, attributes, and skills relevant to the Trustee's qualifications to serve as a Trustee, which led to the conclusion that the Trustee should serve as a Trustee for the fund.
Independent Trustees:
Correspondence intended for an Independent Trustee may be sent to Fidelity Investments, P.O. Box 55235, Boston, Massachusetts 02205-5235.
Name, Year of Birth; Principal Occupations and Other Relevant Experience+
Dennis J. Dirks (1948)
Year of Election or Appointment: 2005
Trustee
Mr. Dirks also serves as Trustee of other Fidelity® funds. Prior to his retirement in May 2003, Mr. Dirks was Chief Operating Officer and a member of the Board of The Depository Trust & Clearing Corporation (DTCC). He also served as President, Chief Operating Officer, and Board member of The Depository Trust Company (DTC) and President and Board member of the National Securities Clearing Corporation (NSCC). In addition, Mr. Dirks served as Chief Executive Officer and Board member of the Government Securities Clearing Corporation, Chief Executive Officer and Board member of the Mortgage-Backed Securities Clearing Corporation, as a Trustee and a member of the Finance Committee of Manhattan College (2005-2008), as a Trustee and a member of the Finance Committee of AHRC of Nassau County (2006-2008), and as a member of the Independent Directors Council (IDC) Governing Council (2010-2015). Mr. Dirks is a member of the Board of Directors for The Brookville Center for Children's Services, Inc. (2009-present) and the Finance Committee of the Asolo Repertory Theatre (2016-present).
Alan J. Lacy (1953)
Year of Election or Appointment: 2008
Trustee
Mr. Lacy also serves as Trustee of other Fidelity® funds. Mr. Lacy serves as Chairman (2014-present) and a member (2010-present) of the Board of Directors of Dave & Buster's Entertainment, Inc. (restaurant and entertainment complexes) and a Director of Bristol-Myers Squibb Company (global pharmaceuticals, 2008-present). He is a Trustee of the California Chapter of The Nature Conservancy (2015-present) and a Director of the Center for Advanced Study in the Behavioral Sciences at Stanford University (2015-present). In addition, Mr. Lacy served as Senior Adviser (2007-2014) of Oak Hill Capital Partners, L.P. (private equity) and also served as Chief Executive Officer (2005) and Vice Chairman (2005-2006) of Sears Holdings Corporation (retail) and Chief Executive Officer and Chairman of the Board of Sears, Roebuck and Co. (retail, 2000-2005). Previously, Mr. Lacy served as Chairman (2008-2011) and a member (2006-2015) of the Board of Trustees of the National Parks Conservation Association and as a member of the Board of Directors for The Western Union Company (global money transfer, 2006-2011), The Hillman Companies, Inc. (hardware wholesalers, 2010-2014), and Earth Fare, Inc. (retail grocery, 2010-2014).
Ned C. Lautenbach (1944)
Year of Election or Appointment: 2000
Trustee
Chairman of the Independent Trustees
Mr. Lautenbach also serves as Trustee of other Fidelity® funds. Mr. Lautenbach currently serves as the Lead Director of the Eaton Corporation Board of Directors (diversified industrial, 1997-present). Mr. Lautenbach is Chairman of the Board of Directors of Artis-Naples in Naples, Florida (2012-present), a member of the Council on Foreign Relations (1994-present), and currently Vice Chair of the Board of Governors, State University System of Florida (2013-present). Previously, Mr. Lautenbach was a Partner and Advisory Partner at Clayton, Dubilier & Rice, LLC (private equity investment, 1998-2010), as well as a Director of Sony Corporation (2006-2007). Mr. Lautenbach also had a 30-year career with IBM (technology company) during which time he served as Senior Vice President and a member of the Corporate Executive Committee (1968-1998).
Joseph Mauriello (1944)
Year of Election or Appointment: 2008
Trustee
Mr. Mauriello also serves as Trustee of other Fidelity® funds. Prior to his retirement in January 2006, Mr. Mauriello served in numerous senior management positions including Deputy Chairman and Chief Operating Officer (2004-2005), and Vice Chairman of Financial Services (2002-2004) of KPMG LLP US (professional services, 1965-2005). Mr. Mauriello currently serves as a member of the Board of Directors of XL Group plc. (global insurance and re-insurance, 2006-present) and the Independent Directors Council (IDC) Governing Council (2015-present). Previously, Mr. Mauriello served as a Director of the Hamilton Funds of the Bank of New York (2006-2007) and of Arcadia Resources Inc. (health care services and products, 2007-2012).
Robert W. Selander (1950)
Year of Election or Appointment: 2011
Trustee
Mr. Selander also serves as Trustee of other Fidelity® funds. Mr. Selander serves as a Director of The Western Union Company (global money transfer, 2014-present) and a non-executive Chairman of Health Equity, Inc. (health savings custodian, 2015-present). Previously, Mr. Selander served as a Member of the Advisory Board of certain Fidelity® funds (2011), and Executive Vice Chairman (2010), Chief Executive Officer (2009-2010), and President and Chief Executive Officer (1997-2009) of Mastercard, Inc.
Cornelia M. Small (1944)
Year of Election or Appointment: 2005
Trustee
Ms. Small also serves as Trustee of other Fidelity® funds. Ms. Small is a member of the Board of Directors (2009-present) and Chair of the Investment Committee (2010-present) of the Teagle Foundation. Ms. Small also serves on the Investment Committee of the Berkshire Taconic Community Foundation (2008-present). Previously, Ms. Small served as Chairperson (2002-2008) and a member of the Investment Committee and Chairperson (2008-2012) and a member of the Board of Trustees of Smith College. In addition, Ms. Small served as Chief Investment Officer, Director of Global Equity Investments, and a member of the Board of Directors of Scudder, Stevens & Clark and Scudder Kemper Investments.
William S. Stavropoulos (1939)
Year of Election or Appointment: 2002
Trustee
Vice Chairman of the Independent Trustees
Mr. Stavropoulos also serves as Trustee of other Fidelity® funds. Mr. Stavropoulos serves as President and Founder of the Michigan Baseball Foundation, the Great Lakes Loons (2007-present). Mr. Stavropoulos is Chairman Emeritus of the Board of Directors of The Dow Chemical Company, where he previously served in numerous senior management positions, including President, CEO (1995-2000; 2002-2004), Chairman of the Executive Committee (2000-2006), and as a member of the Board of Directors (1990-2006). Currently, Mr. Stavropoulos is Chairman of the Board of Directors of Univar Inc. (global distributor of commodity and specialty chemicals), a Director of Teradata Corporation (data warehousing and technology solutions), and a member of the Advisory Board for Metalmark Capital LLC (private equity investment, 2005-present). Mr. Stavropoulos is an operating advisor to Clayton, Dubilier & Rice, LLC (private equity investment). In addition, Mr. Stavropoulos is a member of the University of Notre Dame Advisory Council for the College of Science, a Trustee of the Rollin L. Gerstacker Foundation, and a Director of Artis-Naples in Naples, Florida. Previously, Mr. Stavropoulos served as a Director of Chemical Financial Corporation (bank holding company, 1993-2012) and Tyco International, Ltd. (multinational manufacturing and services, 2007-2012).
David M. Thomas (1949)
Year of Election or Appointment: 2008
Trustee
Mr. Thomas also serves as Trustee of other Fidelity® funds. Mr. Thomas serves as Non-Executive Chairman of the Board of Directors of Fortune Brands Home and Security (home and security products, 2011-present), as a member of the Board of Directors (2004-present) and Presiding Director (2013-present) of Interpublic Group of Companies, Inc. (marketing communication), and as a member of the Board of Trustees of the University of Florida (2013-present). Previously, Mr. Thomas served as Executive Chairman (2005-2006) and Chairman and Chief Executive Officer (2000-2005) of IMS Health, Inc. (pharmaceutical and healthcare information solutions), and a Director of Fortune Brands, Inc. (consumer products, 2000-2011).
+ The information includes the Trustee's principal occupation during the last five years and other information relating to the experience, attributes, and skills relevant to the Trustee's qualifications to serve as a Trustee, which led to the conclusion that the Trustee should serve as a Trustee for the fund.
Advisory Board Members and Officers:
Correspondence intended for an officer or Peter S. Lynch may be sent to Fidelity Investments, 245 Summer Street, Boston, Massachusetts 02210. Officers appear below in alphabetical order.
Name, Year of Birth; Principal Occupation
Peter S. Lynch (1944)
Year of Election or Appointment: 2003
Member of the Advisory Board
Mr. Lynch also serves as Member of the Advisory Board of other Fidelity® funds. Mr. Lynch is Vice Chairman and a Director of FMR (investment adviser firm) and FMR Co., Inc. (investment adviser firm). In addition, Mr. Lynch serves as a Trustee of Boston College and as the Chairman of the Inner-City Scholarship Fund. Previously, Mr. Lynch served on the Special Olympics International Board of Directors (1997-2006).
Marc R. Bryant (1966)
Year of Election or Appointment: 2015
Secretary and Chief Legal Officer (CLO)
Mr. Bryant also serves as Secretary and CLO of other funds. Mr. Bryant serves as CLO, Secretary, and Senior Vice President of Fidelity Management & Research Company (investment adviser firm, 2015-present) and FMR Co., Inc. (investment adviser firm, 2015-present); Secretary of Fidelity SelectCo, LLC (investment adviser firm, 2015-present) and Fidelity Investments Money Management, Inc. (investment adviser firm, 2015-present); and CLO of Fidelity Management & Research (Hong Kong) Limited and FMR Investment Management (UK) Limited (investment adviser firms, 2015-present) and Fidelity Management & Research (Japan) Limited (investment adviser firm, 2016-present). He is Senior Vice President and Deputy General Counsel of FMR LLC (diversified financial services company). Previously, Mr. Bryant served as Secretary and CLO of Fidelity Rutland Square Trust II (2010-2014) and Assistant Secretary of Fidelity's Fixed Income and Asset Allocation Funds (2013-2015). Prior to joining Fidelity Investments, Mr. Bryant served as a Senior Vice President and the Head of Global Retail Legal for AllianceBernstein L.P. (2006-2010), and as the General Counsel for ProFund Advisors LLC (2001-2006).
Jeffrey S. Christian (1961)
Year of Election or Appointment: 2016
Assistant Treasurer
Mr. Christian also serves as Assistant Treasurer of other funds. Mr. Christian is an employee of Fidelity Investments (2003-present).
William C. Coffey (1969)
Year of Election or Appointment: 2009
Assistant Secretary
Mr. Coffey also serves as Assistant Secretary of other funds. He is Senior Vice President and Deputy General Counsel of FMR LLC (diversified financial services company, 2010-present), and is an employee of Fidelity Investments. Previously, Mr. Coffey served as Vice President and Associate General Counsel of FMR LLC (2005-2009).
Jonathan Davis (1968)
Year of Election or Appointment: 2010
Assistant Treasurer
Mr. Davis also serves as Assistant Treasurer of other funds, and is an employee of Fidelity Investments. Previously, Mr. Davis served as Vice President and Associate General Counsel of FMR LLC (diversified financial services company, 2003-2010).
Adrien E. Deberghes (1967)
Year of Election or Appointment: 2016
Assistant Treasurer
Mr. Deberghes also serves as an officer of other funds. He serves as Executive Vice President of Fidelity Investments Money Management, Inc. (FIMM) (investment adviser firm, 2016-present) and is an employee of Fidelity Investments (2008-present). Prior to joining Fidelity Investments, Mr. Deberghes was Senior Vice President of Mutual Fund Administration at State Street Corporation (2007-2008), Senior Director of Mutual Fund Administration at Investors Bank & Trust (2005-2007), and Director of Finance for Dunkin' Brands (2000-2005). Previously, Mr. Deberghes served in other fund officer roles.
Stephanie J. Dorsey (1969)
Year of Election or Appointment: 2010
Assistant Treasurer
Ms. Dorsey also serves as an officer of other funds. She is an employee of Fidelity Investments (2008-present) and has served in other fund officer roles. Prior to joining Fidelity Investments, Ms. Dorsey served as Treasurer (2004-2008) of the JPMorgan Mutual Funds and Vice President (2004-2008) of JPMorgan Chase Bank.
Howard J. Galligan III (1966)
Year of Election or Appointment: 2014
Chief Financial Officer
Mr. Galligan also serves as Chief Financial Officer of other funds. Mr. Galligan serves as President of Fidelity Pricing and Cash Management Services (FPCMS) (2014-present) and as a Director of Strategic Advisers, Inc. (investment adviser firm, 2008-present). Previously, Mr. Galligan served as Chief Administrative Officer of Asset Management (2011-2014) and Chief Operating Officer and Senior Vice President of Investment Support for Strategic Advisers, Inc. (2003-2011).
Scott C. Goebel (1968)
Year of Election or Appointment: 2015
Vice President
Mr. Goebel serves as Vice President of other funds and is an employee of Fidelity Investments (2001-present). Previously, Mr. Goebel served as Senior Vice President of Fidelity Management & Research Company (FMR) (investment adviser firm, 2016), Secretary of Fidelity SelectCo, LLC (investment adviser firm, 2013-2015), Fidelity Investments Money Management, Inc. (FIMM) (investment adviser firm, 2010-2015), and Fidelity Research and Analysis Company (FRAC) (investment adviser firm, 2010-2015); General Counsel, Secretary, and Senior Vice President of FMR (investment adviser firm, 2008-2015) and FMR Co., Inc. (investment adviser firm, 2008-2015); Assistant Secretary of Fidelity Management & Research (Japan) Limited (investment adviser firm, 2008-2015) and Fidelity Management & Research (U.K.) Inc. (investment adviser firm, 2008-2015); Chief Legal Officer (CLO) of Fidelity Management & Research (Hong Kong) Limited (investment adviser firm, 2008-2015); Secretary and CLO of certain Fidelity® funds (2008-2015); Assistant Secretary of FIMM (2008-2010), FRAC (2008-2010), and certain funds (2007-2008); and as Vice President and Secretary of Fidelity Distributors Corporation (FDC) (2005-2007).
Brian B. Hogan (1964)
Year of Election or Appointment: 2009
Vice President
Mr. Hogan also serves as Trustee or Vice President of other funds. Mr. Hogan serves as a Director of FMR Investment Management (UK) Limited (investment adviser firm, 2015-present) and Fidelity SelectCo, LLC (investment adviser firm, 2014-present) and President of the Equity Division of FMR (investment adviser firm, 2009-present). Previously, Mr. Hogan served as Senior Vice President, Equity Research of FMR (2006-2009) and as a portfolio manager. Mr. Brian B. Hogan is not related to Mr. Colm A. Hogan.
Colm A. Hogan (1973)
Year of Election or Appointment: 2016
Deputy Treasurer
Mr. Hogan also serves as an officer of other funds. Mr. Hogan is an employee of Fidelity Investments (2005-present). Mr. Colm A. Hogan is not related to Mr. Brian B. Hogan.
Chris Maher (1972)
Year of Election or Appointment: 2013
Assistant Treasurer
Mr. Maher serves as Assistant Treasurer of other funds. Mr. Maher is Vice President of Valuation Oversight and is an employee of Fidelity Investments. Previously, Mr. Maher served as Vice President of Asset Management Compliance (2013), Vice President of the Program Management Group of FMR (investment adviser firm, 2010-2013), and Vice President of Valuation Oversight (2008-2010).
John F. Papandrea (1972)
Year of Election or Appointment: 2016
Anti-Money Laundering (AML) Officer
Mr. Papandrea also serves as AML Officer of other funds. Mr. Papandrea is Vice President of FMR LLC (diversified financial services company, 2008-present) and is an employee of Fidelity Investments (2005-present).
Melissa M. Reilly (1971)
Year of Election or Appointment: 2014
Vice President of certain Equity Funds
Ms. Reilly also serves as Vice President of other funds. Ms. Reilly is an employee of Fidelity Investments (2004-present).
Kenneth B. Robins (1969)
Year of Election or Appointment: 2016
Chief Compliance Officer
Mr. Robins also serves as an officer of other funds. Mr. Robins serves as Compliance Officer of Fidelity Management & Research Company and FMR Co., Inc. (investment adviser firms, 2016-present) and is an employee of Fidelity Investments (2004-present). Previously, Mr. Robins served as Executive Vice President of Fidelity Investments Money Management, Inc. (investment adviser firm, 2013-2016) and served in other fund officer roles.
Stacie M. Smith (1974)
Year of Election or Appointment: 2016
President and Treasurer
Ms. Smith also serves as an officer of other funds. She is an employee of Fidelity Investments (2009-present) and has served in other fund officer roles. Prior to joining Fidelity Investments, Ms. Smith served as Senior Audit Manager of Ernst & Young LLP (accounting firm, 1996-2009). Previously, Ms. Smith served as Deputy Treasurer of certain Fidelity® funds (2013-2016).
Marc L. Spector (1972)
Year of Election or Appointment: 2016
Assistant Treasurer
Mr. Spector also serves as an officer of other funds. Mr. Spector is an employee of Fidelity Investments (2016-present). Prior to joining Fidelity Investments, Mr. Spector served as Director at the Siegfried Group (accounting firm, 2013-2016), and prior to Siegfried Group as audit senior manager at Deloitte & Touche (accounting firm, 2005-2013).
Renee Stagnone (1975)
Year of Election or Appointment: 2016
Assistant Treasurer
Ms. Stagnone also serves as an officer of other funds. Ms. Stagnone is an employee of Fidelity Investments (1997-present). Previously, Ms. Stagnone served as Deputy Treasurer of certain Fidelity® funds (2013-2016).
Shareholder Expense Example
As a shareholder of the Fund, you incur two types of costs: (1) transaction costs and (2) ongoing costs, including management fees and other Fund expenses. This Example is intended to help you understand your ongoing costs (in dollars) of investing in the Fund and to compare these costs with the ongoing costs of investing in other mutual funds.
The Example is based on an investment of $1,000 invested at the beginning of the period and held for the entire period (June 1, 2016 to November 30, 2016).
Actual Expenses
The first line of the accompanying table provides information about actual account values and actual expenses. You may use the information in this line, together with the amount you invested, to estimate the expenses that you paid over the period. Simply divide your account value by $1,000.00 (for example, an $8,600 account value divided by $1,000.00 = 8.6), then multiply the result by the number in the first line under the heading entitled "Expenses Paid During Period" to estimate the expenses you paid on your account during this period. A small balance maintenance fee of $12.00 that is charged once a year may apply for certain accounts with a value of less than $2,000. This fee is not included in the table below. If it was, the estimate of expenses you paid during the period would be higher, and your ending account value lower, by this amount. In addition, the Fund, as a shareholder in the underlying Fidelity Central Funds, will indirectly bear its pro-rata share of the fees and expenses incurred by the underlying Fidelity Central Funds. These fees and expenses are not included in the Fund's annualized expense ratio used to calculate the expense estimate in the table below.
Hypothetical Example for Comparison Purposes
The second line of the accompanying table provides information about hypothetical account values and hypothetical expenses based on the Fund's actual expense ratio and an assumed rate of return of 5% per year before expenses, which is not the Fund's actual return. The hypothetical account values and expenses may not be used to estimate the actual ending account balance or expenses you paid for the period. You may use this information to compare the ongoing costs of investing in the Fund and other funds. To do so, compare this 5% hypothetical example with the 5% hypothetical examples that appear in the shareholder reports of the other funds. A small balance maintenance fee of $12.00 that is charged once a year may apply for certain accounts with a value of less than $2,000. This fee is not included in the table below. If it was, the estimate of expenses you paid during the period would be higher, and your ending account value lower, by this amount. In addition, the Fund, as a shareholder in the underlying Fidelity Central Funds, will indirectly bear its pro-rata share of the fees and expenses incurred by the underlying Fidelity Central Funds. These fees and expenses are not included in the Fund's annualized expense ratio used to calculate the expense estimate in the table below.
Please note that the expenses shown in the table are meant to highlight your ongoing costs only and do not reflect any transaction costs. Therefore, the second line of the table is useful in comparing ongoing costs only, and will not help you determine the relative total costs of owning different funds.
| | Annualized Expense Ratio-A | Beginning
Account Value
June 1, 2016 | Ending
Account Value
November 30, 2016 | Expenses Paid
During Period-B
June 1, 2016
to November 30, 2016 |
| Actual | .56% | $1,000.00 | $1,078.70 | $2.91-C |
| Hypothetical-D | | $1,000.00 | $1,022.20 | $2.83-C |
A Annualized expense ratio reflects expenses net of applicable fee waivers.
B Expenses are equal to the Fund's annualized expense ratio, multiplied by the average account value over the period, multiplied by 183/366 (to reflect the one-half year period).
C If fees and changes to the Fund's Management Fee effective February 1, 2017 had been in effect during the entire period, the annualized expense ratio would have been .51% and the expenses paid in the actual and hypothetical examples above would have been $2.65 and $2.58, respectively.
D 5% return per year before expenses
Distributions (Unaudited)
The Board of Trustees of New Millennium Fund voted to pay on December 28, 2016, to shareholders of record at the opening of business on December 27, 2016, a distribution of $1.819 per share derived from capital gains realized from sales of portfolio securities and a dividend of $0.426 per share from net investment income.
The fund hereby designates as a capital gain dividend with respect to the taxable year ended November 30, 2016, $150,972,948, or, if subsequently determined to be different, the net capital gain of such year.
The fund designates 100% of the dividends distributed during the fiscal year as qualifying for the dividends–received deduction for corporate shareholders.
The fund designates 100% of the dividends distributed during the fiscal year as amounts which may be taken into account as a dividend for the purposes of the maximum rate under section 1(h)(11) of the Internal Revenue Code.
The fund will notify shareholders in January 2017 of amounts for use in preparing 2016 income tax returns.
Board Approval of Investment Advisory Contracts and Management Fees
Fidelity New Millennium Fund
Each year, the Board of Trustees, including the Independent Trustees (together, the Board), votes on the renewal of the management contract with Fidelity Management & Research Company (FMR) and the sub-advisory agreements (together, the Advisory Contracts) for the fund. The Board, assisted by the advice of fund counsel and Independent Trustees' counsel, requests and considers a broad range of information relevant to the renewal of the Advisory Contracts throughout the year.
The Board meets regularly and, at each of its meetings, covers an extensive agenda of topics and materials and considers factors that are relevant to its annual consideration of the renewal of the fund's Advisory Contracts, including the services and support provided to the fund and its shareholders. The Board has established various standing committees (Committees), each composed of and chaired by Independent Trustees with varying backgrounds, to which the Board has assigned specific subject matter responsibilities in order to enhance effective decision-making by the Board. The Board, acting directly and through its Committees, requests and receives information concerning the annual consideration of the renewal of the fund's Advisory Contracts. The Board also meets as needed to consider matters specifically related to the Board's annual consideration of the renewal of the Advisory Contracts. Members of the Board may also meet with trustees of other Fidelity funds through ad hoc joint committees to discuss certain matters relevant to all of the Fidelity funds.
At its July 2016 meeting, the Board unanimously determined to renew the fund's Advisory Contracts. In reaching its determination, the Board considered all factors it believed relevant, including (i) the nature, extent, and quality of the services to be provided to the fund and its shareholders (including the investment performance of the fund); (ii) the competitiveness of the fund's management fee and total expense ratio relative to peer funds; (iii) the total costs of the services to be provided by and the profits to be realized by Fidelity from its relationships with the fund; and (iv) the extent to which, if any, economies of scale exist and would be realized as the fund grows, and whether any economies of scale are appropriately shared with fund shareholders.
In considering whether to renew the Advisory Contracts for the fund, the Board reached a determination, with the assistance of fund counsel and Independent Trustees' counsel and through the exercise of its business judgment, that the renewal of the Advisory Contracts was in the best interests of the fund and its shareholders and that the compensation payable under the Advisory Contracts was fair and reasonable. The Board's decision to renew the Advisory Contracts was not based on any single factor, but rather was based on a comprehensive consideration of all the information provided to the Board at its meetings throughout the year. The Board, in reaching its determination to renew the Advisory Contracts, was aware that shareholders of the fund have a broad range of investment choices available to them, including a wide choice among funds offered by Fidelity's competitors, and that the fund's shareholders, who have the opportunity to review and weigh the disclosure provided by the fund in its prospectus and other public disclosures, have chosen to invest in this fund, which is part of the Fidelity family of funds.
Nature, Extent, and Quality of Services Provided. The Board considered Fidelity's staffing as it relates to the fund, including the backgrounds of investment personnel of Fidelity, and also considered the fund's investment objective, strategies, and related investment philosophy. The Independent Trustees also had discussions with senior management of Fidelity's investment operations and investment groups. The Board considered the structure of the investment personnel compensation program and whether this structure provides appropriate incentives to act in the best interests of the fund. Additionally, the Board considered the portfolio managers' investments, if any, in the funds that they manage.
Resources Dedicated to Investment Management and Support Services. The Board and the Fund Oversight and Research Committees reviewed the general qualifications and capabilities of Fidelity's investment staff, including its size, education, experience, and resources, as well as Fidelity's approach to recruiting, training, managing, and compensating investment personnel. The Board noted that Fidelity has continued to increase the resources devoted to non-U.S. offices, including expansion of Fidelity's global investment organization. The Board also noted that Fidelity's analysts have extensive resources, tools and capabilities that allow them to conduct sophisticated quantitative and fundamental analysis, as well as credit analysis of issuers, counterparties and guarantors. Further, the Board considered that Fidelity's investment professionals have sufficient access to global information and data so as to provide competitive investment results over time, and that those professionals also have access to sophisticated tools that permit them to assess portfolio construction and risk and performance attribution characteristics continuously, as well as to transmit new information and research conclusions rapidly around the world. Additionally, in its deliberations, the Board considered Fidelity's trading, risk management, compliance, and technology and operations capabilities and resources, which are integral parts of the investment management process.
Shareholder and Administrative Services. The Board considered (i) the nature, extent, quality, and cost of advisory, administrative, and shareholder services performed by FMR, the sub-advisers (together with FMR, the Investment Advisers), and their affiliates under the Advisory Contracts and under separate agreements covering transfer agency, pricing and bookkeeping, and securities lending services for the fund; (ii) the nature and extent of the supervision of third party service providers, principally custodians, subcustodians, and pricing vendors; and (iii) the resources devoted to, and the record of compliance with, the fund's compliance policies and procedures. The Board also reviewed the allocation of fund brokerage, including allocations to brokers affiliated with the Investment Advisers, the use of brokerage commissions to pay fund expenses, and the use of "soft" commission dollars to pay for research services.
The Board noted that the growth of fund assets over time across the complex allows Fidelity to reinvest in the development of services designed to enhance the value or convenience of the Fidelity funds as investment vehicles. These services include 24-hour access to account information and market information through telephone representatives and over the Internet, investor education materials and asset allocation tools, and the expanded availability of Fidelity Investor Centers.
In 2014, the Board formed an ad hoc Committee on Transfer Agency Fees to review the variety of transfer agency fee structures throughout the industry and Fidelity's competitive positioning with respect to industry participants.
Investment in a Large Fund Family. The Board considered the benefits to shareholders of investing in a Fidelity fund, including the benefits of investing in a fund that is part of a large family of funds offering a variety of investment disciplines and providing a large variety of mutual fund investor services. The Board noted that Fidelity had taken, or had made recommendations that resulted in the Fidelity funds taking, a number of actions over the previous year that benefited particular funds, including: (i) continuing to dedicate additional resources to investment research and to the support of the senior management team that oversees asset management; (ii) continuing efforts to enhance Fidelity's global research capabilities; (iii) launching new funds and making other enhancements to meet client needs; (iv) broadening eligibility requirements for certain lower-priced share classes of, and streamlining the fee structure for, certain existing equity index funds; (v) lowering expense caps for certain existing funds and classes to reduce expenses paid by shareholders; (vi) eliminating redemption fees for certain variable insurance product funds and classes; (vii) continuing to launch dedicated lower cost underlying funds to meet portfolio construction needs related to expanding underlying fund options for Fidelity funds of funds, specifically for the Freedom Fund product lines; (viii) launching a lower cost share class for use by the Freedom Index Fund product line; (ix) rationalizing product lines and gaining increased efficiencies through fund mergers and share class consolidations; (x) continuing to develop, acquire and implement systems and technology to improve services to the funds and shareholders, strengthen information security, and increase efficiency; (xi) implementing investment enhancements to further strengthen Fidelity's target date product line to increase investors' probability of success in achieving their goals; (xii) accelerating the conversion of all remaining Class B shares to Class A shares, which have a lower expense structure; and (xiii) implementing changes to Fidelity's money market fund product line in response to recent regulatory reforms.
Investment Performance. The Board considered whether the fund has operated in accordance with its investment objective, as well as its record of compliance with its investment restrictions and its performance history.
The Board took into account discussions with representatives of the Investment Advisers about fund investment performance that occur at Board meetings throughout the year. In this regard the Board noted that as part of regularly scheduled fund reviews and other reports to the Board on fund performance, the Board considers annualized return information for the fund, for different time periods, measured against a securities market index ("benchmark index") and a peer group of funds with similar objectives ("peer group"), if any. In its evaluation of fund investment performance, the Board gave particular attention to information indicating changes in performance of certain Fidelity funds for specific time periods and discussed with the Investment Advisers the reasons for any overperformance or underperformance.
In addition to reviewing absolute and relative fund performance, the Independent Trustees periodically consider the appropriateness of fund performance metrics in evaluating the results achieved. In general, the Independent Trustees believe that fund performance should be evaluated based on net performance (after fees and expenses) of both the highest performing and lowest performing fund share classes, where applicable, compared to appropriate benchmark indices, over appropriate time periods that may include full market cycles, and compared to peer groups, as applicable, over the same periods, taking into account relevant factors including the following: general market conditions; issuer-specific information; and fund cash flows and other factors.
The Independent Trustees recognize that shareholders evaluate performance on a net basis over their own holding periods, for which one-, three-, and five-year periods are often used as a proxy. For this reason, the performance information reviewed by the Board also included net cumulative calendar year total return information for the fund and an appropriate benchmark index and peer group for the most recent one-, three-, and five-year periods, as shown below. Returns are shown compared to the 25th percentile (top of box, 75% beaten) and 75th percentile (bottom of box, 25% beaten) of the peer universe.
Fidelity New Millennium Fund

The Board has discussed the fund's underperformance with FMR and has engaged with FMR to consider what steps might be taken to remediate the fund's underperformance.
The Board also considered that the fund's management fee is subject to upward or downward adjustment depending upon whether, and to what extent, the fund's investment performance for the performance period exceeds, or is exceeded by, a securities index, thus leading to a performance adjustment for the same period. The Board noted that the performance adjustment provides FMR with a strong economic incentive to seek to achieve superior performance for the fund's shareholders and helps to more closely align the interests of FMR and the shareholders of the fund.
Based on its review, the Board concluded that the nature, extent, and quality of services provided to the fund under the Advisory Contracts should continue to benefit the shareholders of the fund.
Competitiveness of Management Fee and Total Expense Ratio. The Board considered the fund's management fee and total expense ratio compared to "mapped groups" of competitive funds and classes created for the purpose of facilitating the Trustees' competitive analysis of management fees and total expenses. Fidelity creates "mapped groups" by combining similar Broadridge investment objective categories that have comparable investment mandates. Combining Broadridge investment objective categories aids the Board's management fee and total expense ratio comparisons by broadening the competitive group used for comparison.
Management Fee. The Board considered two proprietary management fee comparisons for the 12-month periods shown in basis points (BP) in the chart below. The group of Broadridge funds used by the Board for management fee comparisons is referred to below as the "Total Mapped Group." The Total Mapped Group comparison focuses on a fund's standing in terms of gross management fees before expense reimbursements or caps, and without giving effect to the fund's performance adjustment, relative to the total universe of funds with comparable investment mandates, regardless of whether their management fee structures also are comparable. Funds with comparable investment mandates offer exposure to similar types of securities. Funds with comparable management fee structures have similar management fee contractual arrangements (
e.g., flat rate charged for advisory services, all-inclusive fee rate,
etc.). "TMG %" represents the percentage of funds in the Total Mapped Group that had management fees that were lower than the fund's. For example, a hypothetical TMG % of 20% would mean that 80% of the funds in the Total Mapped Group had higher, and 20% had lower, management fees than the fund. The fund's actual TMG %s and the number of funds in the Total Mapped Group are in the chart below. The "Asset-Size Peer Group" (ASPG) comparison focuses on a fund's standing relative to a subset of non-Fidelity funds within the Total Mapped Group that are similar in size and management fee structure without taking into account performance adjustments, if any. For example, if a fund is in the first quartile of the ASPG, the fund's management fee ranks in the least expensive or lowest 25% of funds in the ASPG. The ASPG represents at least 15% of the funds in the Total Mapped Group with comparable asset size and management fee structures, subject to a minimum of 50 funds (or all funds in the Total Mapped Group if fewer than 50). Additional information, such as the ASPG quartile in which the fund's management fee rate ranked and the impact of the fund's performance adjustment, is also included in the chart and considered by the Board.
Fidelity New Millennium Fund

The Board noted that the fund's management fee rate ranked below the median of its Total Mapped Group and below the median of its ASPG for 2015. The Board also noted the effect of the fund's performance adjustment, if any, on the fund's management fee ranking.
The Board noted that, in 2014, the ad hoc Committee on Group Fee was formed by it and the boards of other Fidelity funds to conduct an in-depth review of the "group fee" component of the management fee of funds with such management fee structures. The Committee's focus included the mechanics of the group fee, the competitive landscape of group fee structures, Fidelity funds with no group fee component and investment products not included in group fee assets. The Board also considered that, for funds subject to the group fee, FMR agreed to voluntarily waive fees over a specified period of time in amounts designed to account for assets converted from certain funds to certain collective investment trusts.
The Board also noted that, in 2013, the ad hoc Committee on Management Fees was formed to conduct an in-depth review of the management fee rates of Fidelity's active equity mutual funds. The Committee focused on the following areas: (i) standard fee structures; (ii) research consumption and trading evolution; (iii) management fee competitiveness/profitability by category; and (iv) factors that drive institutional pricing.
Based on its review, the Board concluded that the fund's management fee is fair and reasonable in light of the services that the fund receives and the other factors considered.
Total Expense Ratio. In its review of the fund's total expense ratio, the Board considered the fund's management fee rate as well as other fund expenses, such as transfer agent fees, pricing and bookkeeping fees, and custodial, legal, and audit fees. The Board noted the impact of the fund's performance adjustment. The Board also noted that Fidelity may agree to waive fees and expenses from time to time, and the extent to which, if any, it has done so for the fund. As part of its review, the Board also considered the current and historical total expense ratios of the fund compared to competitive fund median expenses. The fund is compared to those funds and classes in the Total Mapped Group (used by the Board for management fee comparisons) that have a similar sales load structure.
The Board noted that the fund's total expense ratio ranked below the competitive median for 2015.
Fees Charged to Other Fidelity Clients. The Board also considered Fidelity fee structures and other information with respect to clients of Fidelity, such as other funds advised or subadvised by Fidelity, pension plan clients, and other institutional clients with similar mandates. The Board noted the findings of the 2013 ad hoc joint committee (created with the board of other Fidelity funds), which reviewed and compared Fidelity's institutional investment advisory business with its business of providing services to the Fidelity funds, including the differences in services provided, fees charged, and costs incurred, as well as competition in their respective marketplaces.
Based on its review of total expense ratios and fees charged to other Fidelity clients, the Board concluded that the fund's total expense ratio was reasonable in light of the services that the fund and its shareholders receive and the other factors considered.
Costs of the Services and Profitability. The Board considered the revenues earned and the expenses incurred by Fidelity in conducting the business of developing, marketing, distributing, managing, administering and servicing the fund and servicing the fund's shareholders. The Board also considered the level of Fidelity's profits in respect of all the Fidelity funds.
On an annual basis, Fidelity presents to the Board information about the profitability of its relationship with the fund. Fidelity calculates profitability information for each fund, as well as aggregate profitability information for groups of Fidelity funds and all Fidelity funds, using a series of detailed revenue and cost allocation methodologies which originate with the books and records of Fidelity on which Fidelity's audited financial statements are based. The Audit Committee of the Board reviews any significant changes from the prior year's methodologies.
PricewaterhouseCoopers LLP (PwC), independent registered public accounting firm and auditor to Fidelity and certain Fidelity funds, has been engaged annually by the Board as part of the Board's assessment of Fidelity's profitability analysis. PwC's engagement includes the review and assessment of the methodologies used by Fidelity in determining the revenues and expenses attributable to Fidelity's mutual fund business, and completion of agreed-upon procedures in respect of the mathematical accuracy of the fund profitability information and its conformity to established allocation methodologies. After considering PwC's reports issued under the engagement and information provided by Fidelity, the Board concluded that while other allocation methods may also be reasonable, Fidelity's profitability methodologies are reasonable in all material respects.
The Board also reviewed Fidelity's non-fund businesses and fall-out benefits related to the mutual fund business as well as cases where Fidelity's affiliates may benefit from or be related to the fund's business.
The Board considered the costs of the services provided by and the profits realized by Fidelity in connection with the operation of the fund and was satisfied that the profitability was not excessive.
Economies of Scale. The Board considered whether there have been economies of scale in respect of the management of the Fidelity funds, whether the Fidelity funds (including the fund) have appropriately benefited from any such economies of scale, and whether there is potential for realization of any further economies of scale. The Board considered the extent to which the fund will benefit from economies of scale as assets grow through increased services to the fund, through waivers or reimbursements, or through fee or expense ratio reductions. The Board also noted that in 2013, it and the boards of other Fidelity funds created an ad hoc committee (the Economies of Scale Committee) to analyze whether Fidelity attains economies of scale in respect of the management and servicing of the Fidelity funds, whether the Fidelity funds have appropriately benefited from such economies of scale, and whether there is potential for realization of any further economies of scale.
The Board recognized that the fund's management contract incorporates a "group fee" structure, which provides for lower group fee rates as total group assets increase, and for higher group fee rates as total group assets decrease (with "group assets" defined to include fund assets under FMR's management plus the assets of sector funds previously under FMR's management). FMR calculates the group fee rates based on a tiered asset "breakpoint" schedule that varies based on asset class. The Board considered that the group fee is designed to deliver the benefits of economies of scale to fund shareholders when total Fidelity fund assets increase, even if assets of any particular fund are unchanged or have declined, because some portion of Fidelity's costs are attributable to services provided to all Fidelity funds, and all funds benefit if those costs can be allocated among more assets. The Board concluded that, given the group fee structure, fund shareholders will benefit from lower management fees as group assets increase at the fund complex level, regardless of whether Fidelity achieves any such economies of scale.
The Board concluded, taking into account the analysis of the Economies of Scale Committee, that economies of scale, if any, are being appropriately shared between fund shareholders and Fidelity.
Additional Information Requested by the Board. In order to develop fully the factual basis for consideration of the Fidelity funds' Advisory Contracts, the Board requested and received additional information on certain topics, including: (i) fund performance trends and Fidelity's long-term strategies for certain funds; (ii) the various share classes employed by Fidelity and the attributes of each class, together with similar information on the distribution and servicing payments made by Fidelity or the funds to third-party participants in the distribution channels; (iii) fund profitability, and fund performance in relation to fund profitability; (iv) the methodology with respect to evaluating competitive fund data and peer group classifications and fee comparisons; (v) annual fund profitability margins; (vi) the realization of fall-out benefits in and attribution of fall-out benefits to certain Fidelity business units; (vii) the appropriateness of certain funds' benchmarks; (viii) the rationalization for certain share classes and expenses; (ix) sub-advisory fee rates for comparable investment mandates; (x) product strategy for certain underperforming funds; and (xi) Fidelity's resources and strategy for cybersecurity.
Based on its evaluation of all of the conclusions noted above, and after considering all factors it believed relevant, the Board concluded that the advisory fee structures are fair and reasonable, and that the fund's Advisory Contracts should be renewed.
Corporate Headquarters
245 Summer St.
Boston, MA 02210
www.fidelity.com
NMF-ANN-0117
1.539033.119
Fidelity® Series Growth Company Fund Fidelity® Series Growth Company Fund
Class F
Annual Report November 30, 2016 |
|
Contents
To view a fund's proxy voting guidelines and proxy voting record for the 12-month period ended June 30, visit http://www.fidelity.com/proxyvotingresults or visit the Securities and Exchange Commission's (SEC) web site at http://www.sec.gov.
You may also call 1-800-544-8544, or for Class F, call 1-800-835-5092, to request a free copy of the proxy voting guidelines.
Standard & Poor's, S&P and S&P 500 are registered service marks of The McGraw-Hill Companies, Inc. and have been licensed for use by Fidelity Distributors Corporation.
Other third-party marks appearing herein are the property of their respective owners.
All other marks appearing herein are registered or unregistered trademarks or service marks of FMR LLC or an affiliated company. © 2017 FMR LLC. All rights reserved.
This report and the financial statements contained herein are submitted for the general information of the shareholders of the Fund. This report is not authorized for distribution to prospective investors in the Fund unless preceded or accompanied by an effective prospectus.
A fund files its complete schedule of portfolio holdings with the SEC for the first and third quarters of each fiscal year on Form N-Q. Forms N-Q are available on the SEC’s web site at http://www.sec.gov. A fund's Forms N-Q may be reviewed and copied at the SEC’s Public Reference Room in Washington, DC. Information regarding the operation of the SEC's Public Reference Room may be obtained by calling 1-800-SEC-0330.
For a complete list of a fund's portfolio holdings, view the most recent holdings listing, semiannual report, or annual report on Fidelity's web site at http://www.fidelity.com, http://www.institutional.fidelity.com, or http://www.401k.com, as applicable.
NOT FDIC INSURED •MAY LOSE VALUE •NO BANK GUARANTEE
Neither the Fund nor Fidelity Distributors Corporation is a bank.
Performance: The Bottom Line
Average annual total return reflects the change in the value of an investment, assuming reinvestment of distributions from dividend income and capital gains (the profits earned upon the sale of securities that have grown in value, if any) and assuming a constant rate of performance each year. The hypothetical investment and the average annual total returns do not reflect the deduction of taxes that a shareholder would pay on fund distributions or the redemption of fund shares. During periods of reimbursement by Fidelity, a fund’s total return will be greater than it would be had the reimbursement not occurred. How a fund did yesterday is no guarantee of how it will do tomorrow.
Average Annual Total Returns
| For the periods ended November 30, 2016 | Past 1 year | Life of fundA |
| Fidelity® Series Growth Company Fund | 3.38% | 10.65% |
| Class F | 3.54% | 10.83% |
A From November 7, 2013
$10,000 Over Life of Fund
Let's say hypothetically that $10,000 was invested in Fidelity® Series Growth Company Fund, a class of the fund, on November 7, 2013, when the fund started.
The chart shows how the value of your investment would have changed, and also shows how the Russell 3000® Growth Index performed over the same period.
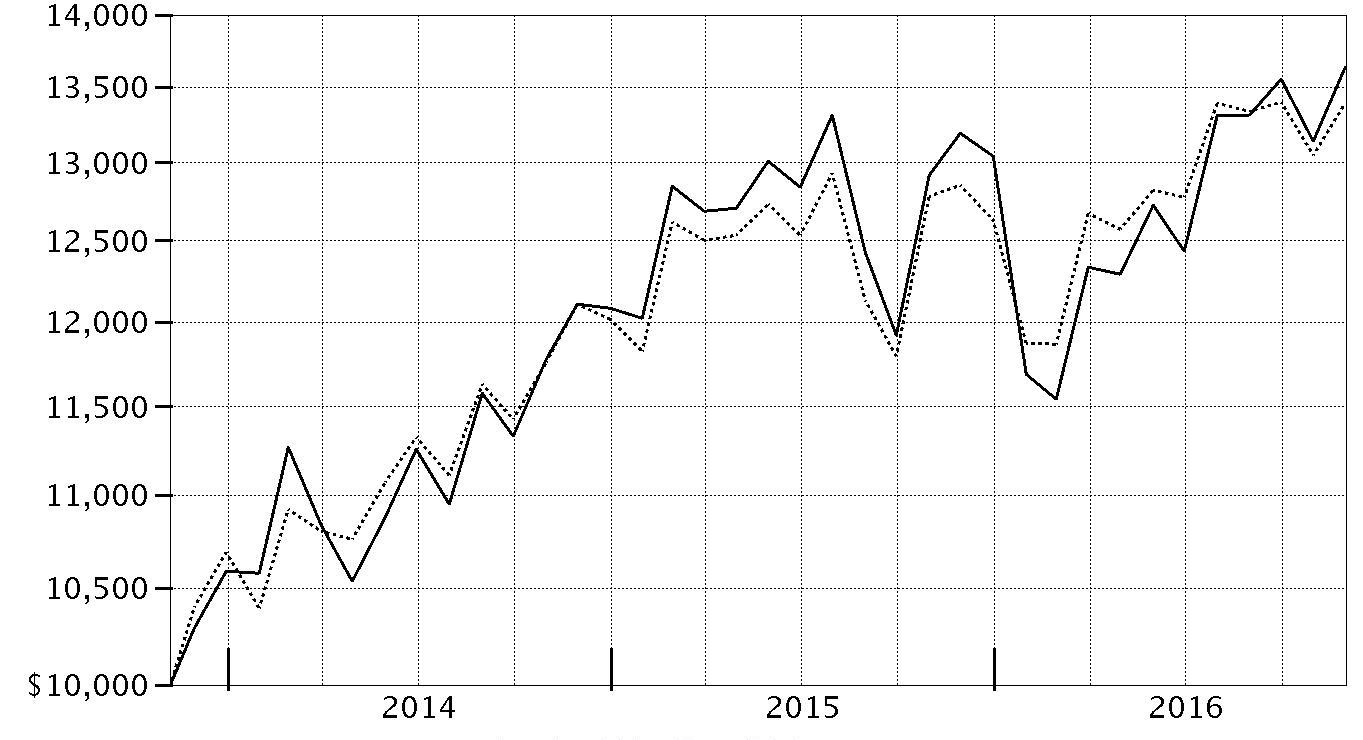
| Period Ending Values |
| $13,637 | Fidelity® Series Growth Company Fund |
| $13,395 | Russell 3000® Growth Index |
Management's Discussion of Fund Performance
Market Recap: The S&P 500 index returned 8.06% for the 12 months ending November 30, 2016, rising sharply in the final month on post-election optimism for economic growth. The period began during a fairly volatile stretch, with stocks hampered by persistent oil-price weakness and U.S.-dollar strength. Markets regained positive momentum in February amid U.S. job gains, a rally in energy and other stimuli that helped keep the roughly seven-year uptrend intact. Markets tumbled briefly following the U.K.’s June 23 vote to exit the European Union – dubbed “Brexit” – then recovered quickly and settled into a flattish stretch until the November 8 U.S. presidential election. For the year, 10 of the 11 sectors in the S&P 500 advanced, with six posting double-digit gains. Telecommunication services (+16%) led the way, its strength attributable to demand for dividend-paying equities early in the period, as well as to company-specific news. Cyclical sectors including industrials (+15%), financials (+14%), energy (+13%) and materials (+12%) posted strong gains, the latter two driven by a rebound in commodity prices. Conversely, real estate (+1%) lagged the index due to a late-period slump related to expectations for rising interest rates. Consumer discretionary (+3%) also underperformed, as competitive pressure continued to weigh on brick-and-mortar retailers.
Comments from Portfolio Manager Steven Wymer: For the year, the fund’s share classes returned roughly 3.5%, underperforming the 4.25% gain of the benchmark Russell 3000 Growth Index. Versus the benchmark, positioning in the pharmaceuticals, biotechnology & life sciences industry weighed most on the fund’s performance. In general, stocks here suffered amid concerns about drug pricing and political scrutiny of drug-pricing practices. The fund’s biggest relative detractor was drugmaker Alnylam Pharmaceuticals, which specializes in genetically defined diseases. Its stock returned -58% for the year, losing half its value in a single day on news the firm was discontinuing a key drug after 18 patients died in a late-stage clinical trial. Another major fund laggard was Regeneron Pharmaceuticals (-30%). The firm faced concerns about slowing sales growth of its drug Eylea, which treats macular (retinal) degeneration. Turning to the positive, security selection in semiconductors & semiconductor equipment was a big plus. The fund’s largest relative contributor by far was graphics chipset maker Nvidia, a top holding. Its share price more than doubled this period, boosted by consecutive quarters of the firm's better-than-expected financial results.
The views expressed above reflect those of the portfolio manager(s) only through the end of the period as stated on the cover of this report and do not necessarily represent the views of Fidelity or any other person in the Fidelity organization. Any such views are subject to change at any time based upon market or other conditions and Fidelity disclaims any responsibility to update such views. These views may not be relied on as investment advice and, because investment decisions for a Fidelity fund are based on numerous factors, may not be relied on as an indication of trading intent on behalf of any Fidelity fund.
Investment Summary (Unaudited)
Top Ten Stocks as of November 30, 2016
| | % of fund's net assets | % of fund's net assets 6 months ago |
| NVIDIA Corp. | 7.7 | 4.7 |
| Apple, Inc. | 4.8 | 4.2 |
| Amazon.com, Inc. | 4.6 | 4.4 |
| Alphabet, Inc. Class A | 3.9 | 4.0 |
| Facebook, Inc. Class A | 3.0 | 3.3 |
| Salesforce.com, Inc. | 3.0 | 4.7 |
| adidas AG | 2.2 | 1.2 |
| Microsoft Corp. | 2.2 | 1.4 |
| Alphabet, Inc. Class C | 1.9 | 2.0 |
| Alkermes PLC | 1.6 | 1.2 |
| | 34.9 | |
Top Five Market Sectors as of November 30, 2016
| | % of fund's net assets | % of fund's net assets 6 months ago |
| Information Technology | 40.5 | 38.0 |
| Consumer Discretionary | 20.0 | 21.0 |
| Health Care | 18.6 | 18.0 |
| Industrials | 6.9 | 7.6 |
| Consumer Staples | 6.1 | 8.8 |
Prior period industry classifications reflect the categories in place as of the date indicated and have not been adjusted to reflect current industry classifications.
Asset Allocation (% of fund's net assets)
| As of November 30, 2016 * |
| | Stocks | 97.9% |
| | Convertible Securities | 1.7% |
| | Short-Term Investments and Net Other Assets (Liabilities) | 0.4% |

* Foreign investments - 9.1%
| As of May 31, 2016 * |
| | Stocks | 98.0% |
| | Convertible Securities | 1.6% |
| | Short-Term Investments and Net Other Assets (Liabilities) | 0.4% |

* Foreign investments - 7.9%
Investments November 30, 2016
Showing Percentage of Net Assets
| Common Stocks - 97.9% | | | |
| | | Shares | Value |
| CONSUMER DISCRETIONARY - 19.9% | | | |
| Auto Components - 0.0% | | | |
| Adient PLC (a) | | 16,899 | $905,110 |
| Automobiles - 0.7% | | | |
| Tesla Motors, Inc. (a) | | 403,600 | 76,441,840 |
| Hotels, Restaurants & Leisure - 3.2% | | | |
| Buffalo Wild Wings, Inc. (a) | | 174,400 | 29,403,840 |
| China Lodging Group Ltd. ADR | | 136,500 | 7,149,870 |
| Chipotle Mexican Grill, Inc. (a) | | 42,500 | 16,844,025 |
| Dave & Buster's Entertainment, Inc. (a) | | 109,000 | 5,106,650 |
| Del Taco Restaurants, Inc. (a) | | 412,400 | 5,988,048 |
| Domino's Pizza, Inc. | | 84,000 | 14,115,360 |
| Dunkin' Brands Group, Inc. | | 128,800 | 6,992,552 |
| Hyatt Hotels Corp. Class A (a) | | 61,000 | 3,131,740 |
| Las Vegas Sands Corp. | | 278,600 | 17,459,862 |
| McDonald's Corp. | | 406,000 | 48,423,620 |
| Panera Bread Co. Class A (a)(b) | | 91,500 | 19,408,065 |
| Papa John's International, Inc. | | 307,200 | 27,144,192 |
| Shake Shack, Inc. Class A (a)(b) | | 53,900 | 1,987,832 |
| Starbucks Corp. | | 1,437,600 | 83,337,672 |
| Wingstop, Inc. | | 99,900 | 3,065,931 |
| Yum China Holdings, Inc. | | 742,000 | 20,865,040 |
| Yum! Brands, Inc. | | 367,700 | 23,308,503 |
| | | | 333,732,802 |
| Household Durables - 0.1% | | | |
| Newell Brands, Inc. | | 74,898 | 3,520,955 |
| Sony Corp. sponsored ADR | | 372,400 | 10,825,668 |
| | | | 14,346,623 |
| Internet & Direct Marketing Retail - 7.0% | | | |
| Amazon.com, Inc. (a) | | 631,899 | 474,284,432 |
| Ctrip.com International Ltd. ADR (a) | | 404,200 | 18,281,966 |
| Etsy, Inc. (a) | | 68,700 | 851,880 |
| Expedia, Inc. | | 318,600 | 39,522,330 |
| Groupon, Inc. Class A (a) | | 2,948,100 | 11,703,957 |
| JD.com, Inc. sponsored ADR (a) | | 103,300 | 2,775,671 |
| Netflix, Inc. (a) | | 586,900 | 68,667,300 |
| Priceline Group, Inc. (a) | | 39,900 | 59,996,832 |
| The Honest Co., Inc. (a)(c) | | 9,496 | 295,983 |
| TripAdvisor, Inc. (a) | | 39,600 | 1,911,888 |
| Vipshop Holdings Ltd. ADR (a) | | 1,409,600 | 15,815,712 |
| Wayfair LLC Class A (a)(b) | | 828,501 | 30,198,861 |
| | | | 724,306,812 |
| Leisure Products - 0.1% | | | |
| Callaway Golf Co. | | 740,900 | 9,001,935 |
| NJOY, Inc. (a)(c) | | 881,087 | 9 |
| | | | 9,001,944 |
| Media - 1.6% | | | |
| Comcast Corp. Class A | | 1,551,200 | 107,823,912 |
| Lions Gate Entertainment Corp. (b) | | 74,200 | 1,736,280 |
| The Walt Disney Co. | | 536,000 | 53,128,320 |
| Twenty-First Century Fox, Inc. Class A | | 133,500 | 3,752,685 |
| | | | 166,441,197 |
| Multiline Retail - 0.3% | | | |
| Dollar General Corp. | | 76,600 | 5,922,712 |
| Dollar Tree, Inc. (a) | | 174,400 | 15,375,104 |
| Target Corp. | | 88,600 | 6,843,464 |
| | | | 28,141,280 |
| Specialty Retail - 1.5% | | | |
| AutoNation, Inc. (a) | | 106,800 | 4,769,688 |
| CarMax, Inc. (a)(b) | | 95,448 | 5,515,940 |
| DavidsTea, Inc. (a) | | 303,200 | 2,895,560 |
| Home Depot, Inc. | | 747,400 | 96,713,560 |
| L Brands, Inc. | | 204,800 | 14,381,056 |
| Restoration Hardware Holdings, Inc. (a) | | 644,745 | 23,243,057 |
| TJX Companies, Inc. | | 114,200 | 8,946,428 |
| | | | 156,465,289 |
| Textiles, Apparel & Luxury Goods - 5.4% | | | |
| adidas AG | | 1,577,548 | 232,425,737 |
| Aritzia LP (a) | | 476,700 | 6,245,753 |
| Columbia Sportswear Co. | | 52,900 | 3,008,423 |
| Kate Spade & Co. (a) | | 1,087,734 | 16,152,850 |
| lululemon athletica, Inc. (a) | | 2,670,800 | 152,208,892 |
| NIKE, Inc. Class B | | 1,093,500 | 54,751,545 |
| Skechers U.S.A., Inc. Class A (sub. vtg.) (a) | | 2,973,600 | 67,738,608 |
| Tory Burch LLC unit (a)(c)(d) | | 248,840 | 13,820,574 |
| Under Armour, Inc.: | | | |
| Class A (sub. vtg.) (a)(b) | | 136,700 | 4,210,360 |
| Class C (non-vtg.) | | 136,859 | 3,528,225 |
| VF Corp. | | 180,600 | 9,844,506 |
| | | | 563,935,473 |
|
| TOTAL CONSUMER DISCRETIONARY | | | 2,073,718,370 |
|
| CONSUMER STAPLES - 6.1% | | | |
| Beverages - 2.4% | | | |
| Constellation Brands, Inc. Class A (sub. vtg.) | | 106,800 | 16,141,752 |
| Dr. Pepper Snapple Group, Inc. | | 60,300 | 5,230,422 |
| Monster Beverage Corp. (a) | | 2,652,500 | 118,699,375 |
| PepsiCo, Inc. | | 338,800 | 33,913,880 |
| The Coca-Cola Co. | | 1,776,700 | 71,689,845 |
| | | | 245,675,274 |
| Food & Staples Retailing - 1.2% | | | |
| Costco Wholesale Corp. | | 410,000 | 61,545,100 |
| CVS Health Corp. | | 308,900 | 23,751,321 |
| Drogasil SA | | 798,800 | 15,231,771 |
| Kroger Co. | | 121,100 | 3,911,530 |
| Sprouts Farmers Market LLC (a) | | 21,700 | 434,217 |
| Walgreens Boots Alliance, Inc. | | 196,000 | 16,607,080 |
| Whole Foods Market, Inc. | | 214,500 | 6,518,655 |
| | | | 127,999,674 |
| Food Products - 0.7% | | | |
| Campbell Soup Co. | | 44,900 | 2,554,361 |
| General Mills, Inc. | | 55,600 | 3,388,264 |
| Mead Johnson Nutrition Co. Class A | | 318,500 | 22,960,665 |
| Mondelez International, Inc. | | 206,800 | 8,528,432 |
| The Hain Celestial Group, Inc. (a) | | 112,000 | 4,389,280 |
| The Hershey Co. | | 91,800 | 8,871,552 |
| The Kraft Heinz Co. | | 153,800 | 12,557,770 |
| Tyson Foods, Inc. Class A | | 122,000 | 6,930,820 |
| | | | 70,181,144 |
| Household Products - 0.3% | | | |
| Church & Dwight Co., Inc. | | 273,100 | 11,959,049 |
| Colgate-Palmolive Co. | | 146,900 | 9,582,287 |
| Kimberly-Clark Corp. | | 85,700 | 9,907,777 |
| Procter & Gamble Co. | | 44,400 | 3,661,224 |
| | | | 35,110,337 |
| Personal Products - 0.7% | | | |
| Coty, Inc. Class A | | 2,658,400 | 49,738,664 |
| Herbalife Ltd. (a) | | 477,500 | 23,411,825 |
| | | | 73,150,489 |
| Tobacco - 0.8% | | | |
| Altria Group, Inc. | | 834,500 | 53,349,585 |
| Japan Tobacco, Inc. | | 139,500 | 4,836,268 |
| Philip Morris International, Inc. | | 153,700 | 13,568,636 |
| Reynolds American, Inc. | | 294,482 | 15,931,476 |
| | | | 87,685,965 |
|
| TOTAL CONSUMER STAPLES | | | 639,802,883 |
|
| ENERGY - 2.7% | | | |
| Energy Equipment & Services - 0.8% | | | |
| Baker Hughes, Inc. | | 663,700 | 42,695,821 |
| Halliburton Co. | | 164,800 | 8,749,232 |
| Schlumberger Ltd. | | 62,300 | 5,236,315 |
| U.S. Silica Holdings, Inc. | | 481,700 | 24,378,837 |
| | | | 81,060,205 |
| Oil, Gas & Consumable Fuels - 1.9% | | | |
| Anadarko Petroleum Corp. | | 144,400 | 9,985,260 |
| Cabot Oil & Gas Corp. | | 454,200 | 10,046,904 |
| Concho Resources, Inc. (a) | | 191,000 | 27,316,820 |
| Continental Resources, Inc. (a) | | 219,100 | 12,709,991 |
| EOG Resources, Inc. | | 459,100 | 47,066,932 |
| Hess Corp. | | 88,500 | 4,952,460 |
| Noble Energy, Inc. | | 353,800 | 13,501,008 |
| PDC Energy, Inc. (a) | | 159,738 | 11,892,494 |
| Pioneer Natural Resources Co. | | 190,893 | 36,468,199 |
| Range Resources Corp. | | 469,200 | 16,506,456 |
| Valero Energy Corp. | | 78,900 | 4,857,084 |
| | | | 195,303,608 |
|
| TOTAL ENERGY | | | 276,363,813 |
|
| FINANCIALS - 2.4% | | | |
| Banks - 1.0% | | | |
| Citigroup, Inc. | | 183,500 | 10,347,565 |
| HDFC Bank Ltd. sponsored ADR | | 472,711 | 30,499,314 |
| JPMorgan Chase & Co. | | 617,300 | 49,488,941 |
| Signature Bank (a) | | 19,900 | 2,983,209 |
| Wells Fargo & Co. | | 264,400 | 13,992,048 |
| | | | 107,311,077 |
| Capital Markets - 1.3% | | | |
| BlackRock, Inc. Class A | | 131,500 | 48,758,885 |
| BM&F BOVESPA SA | | 1,664,900 | 8,176,694 |
| Charles Schwab Corp. | | 2,015,100 | 77,903,766 |
| RPI International Holdings LP (c) | | 35,220 | 4,615,933 |
| | | | 139,455,278 |
| Consumer Finance - 0.1% | | | |
| American Express Co. | | 80,500 | 5,799,220 |
| Discover Financial Services | | 38,058 | 2,579,191 |
| | | | 8,378,411 |
|
| TOTAL FINANCIALS | | | 255,144,766 |
|
| HEALTH CARE - 18.1% | | | |
| Biotechnology - 13.7% | | | |
| AbbVie, Inc. | | 310,300 | 18,866,240 |
| AbbVie, Inc. (e) | | 176,584 | 10,628,944 |
| ACADIA Pharmaceuticals, Inc. (a) | | 1,185,574 | 31,998,642 |
| Adaptimmune Therapeutics PLC sponsored ADR (a) | | 207,000 | 863,190 |
| Adverum Biotechnologies, Inc. (a) | | 293,300 | 835,905 |
| Agios Pharmaceuticals, Inc. (a)(b) | | 449,528 | 26,167,025 |
| Aimmune Therapeutics, Inc. (a) | | 65,500 | 1,486,850 |
| Alder Biopharmaceuticals, Inc. (a) | | 143,700 | 3,384,135 |
| Alexion Pharmaceuticals, Inc. (a) | | 539,500 | 66,137,305 |
| Alkermes PLC (a) | | 2,915,659 | 165,696,901 |
| Alnylam Pharmaceuticals, Inc. (a) | | 1,429,466 | 62,710,673 |
| Amgen, Inc. | | 545,700 | 78,618,999 |
| Array BioPharma, Inc. (a) | | 1,877,900 | 15,201,601 |
| aTyr Pharma, Inc. (a) | | 166,974 | 517,619 |
| BeiGene Ltd. ADR (b) | | 545,998 | 17,308,137 |
| Biogen, Inc. (a) | | 102,900 | 30,259,803 |
| bluebird bio, Inc. (a)(b) | | 729,481 | 44,024,178 |
| Celgene Corp. (a) | | 366,900 | 43,481,319 |
| Celldex Therapeutics, Inc. (a) | | 1,607,843 | 6,125,882 |
| Cellectis SA sponsored ADR (a) | | 215,400 | 3,631,644 |
| Chimerix, Inc. (a) | | 870,731 | 4,257,875 |
| Coherus BioSciences, Inc. (a)(b) | | 623,500 | 16,772,150 |
| Corvus Pharmaceuticals, Inc. | | 102,900 | 1,587,747 |
| CytomX Therapeutics, Inc. (a) | | 203,638 | 2,268,527 |
| CytomX Therapeutics, Inc. (e) | | 207,739 | 2,314,212 |
| Dicerna Pharmaceuticals, Inc. (a) | | 263,028 | 783,823 |
| Editas Medicine, Inc. | | 380,862 | 5,434,901 |
| Exelixis, Inc. (a) | | 5,481,284 | 92,743,325 |
| Fate Therapeutics, Inc. (a) | | 222,273 | 653,483 |
| Five Prime Therapeutics, Inc. (a) | | 344,400 | 19,809,888 |
| Galapagos Genomics NV sponsored ADR (a) | | 348,834 | 20,623,066 |
| Genocea Biosciences, Inc. (a) | | 148,100 | 595,362 |
| Gilead Sciences, Inc. | | 843,700 | 62,180,690 |
| Global Blood Therapeutics, Inc. (a) | | 198,664 | 3,804,416 |
| Heron Therapeutics, Inc. (a) | | 275,451 | 4,228,173 |
| Intellia Therapeutics, Inc. (a)(b) | | 391,238 | 6,161,999 |
| Intercept Pharmaceuticals, Inc. (a) | | 47,700 | 4,823,424 |
| Intrexon Corp. (a) | | 179,500 | 5,237,810 |
| Ionis Pharmaceuticals, Inc. (a) | | 2,371,282 | 103,767,300 |
| Ironwood Pharmaceuticals, Inc. Class A (a) | | 1,769,456 | 27,612,361 |
| Lexicon Pharmaceuticals, Inc. (a) | | 2,036,777 | 31,020,114 |
| Macrogenics, Inc. (a) | | 47,443 | 1,230,197 |
| Merrimack Pharmaceuticals, Inc. (a)(b) | | 2,480,200 | 13,665,902 |
| Momenta Pharmaceuticals, Inc. (a) | | 1,641,795 | 23,231,399 |
| Opko Health, Inc. (a)(b) | | 131,674 | 1,368,093 |
| PhaseRx, Inc. (b) | | 108,100 | 227,010 |
| Protagonist Therapeutics, Inc. | | 78,767 | 1,965,237 |
| Prothena Corp. PLC (a) | | 637,420 | 37,620,528 |
| Regeneron Pharmaceuticals, Inc. (a) | | 367,100 | 139,219,004 |
| Regulus Therapeutics, Inc. (a) | | 922,740 | 2,260,713 |
| Rigel Pharmaceuticals, Inc. (a) | | 2,460,223 | 6,396,580 |
| Sage Therapeutics, Inc. (a) | | 559,826 | 28,052,881 |
| Seattle Genetics, Inc. (a) | | 1,013,417 | 65,679,556 |
| Seres Therapeutics, Inc. (a)(b) | | 395,592 | 3,951,964 |
| Seres Therapeutics, Inc. (e) | | 142,139 | 1,419,969 |
| Shire PLC sponsored ADR | | 31,085 | 5,427,441 |
| Spark Therapeutics, Inc. (a) | | 105,200 | 5,787,052 |
| Syros Pharmaceuticals, Inc. | | 237,460 | 3,224,707 |
| Syros Pharmaceuticals, Inc. | | 301,001 | 3,883,214 |
| TESARO, Inc. (a) | | 36,800 | 4,993,392 |
| Ultragenyx Pharmaceutical, Inc. (a) | | 241,300 | 18,891,377 |
| Versartis, Inc. (a) | | 165,833 | 2,064,621 |
| Vertex Pharmaceuticals, Inc. (a) | | 108,100 | 8,822,041 |
| | | | 1,424,008,516 |
| Health Care Equipment & Supplies - 1.5% | | | |
| Abbott Laboratories | | 171,000 | 6,509,970 |
| Align Technology, Inc. (a) | | 50,734 | 4,720,799 |
| Baxter International, Inc. | | 158,100 | 7,014,897 |
| Danaher Corp. | | 445,200 | 34,801,284 |
| DexCom, Inc. (a) | | 168,400 | 10,994,836 |
| Entellus Medical, Inc. (a)(b) | | 128,800 | 2,373,784 |
| Genmark Diagnostics, Inc. (a) | | 436,900 | 5,076,778 |
| Insulet Corp. (a) | | 610,720 | 20,550,728 |
| Intuitive Surgical, Inc. (a) | | 29,807 | 19,187,958 |
| Novocure Ltd. (a)(b) | | 428,400 | 3,320,100 |
| Novocure Ltd. (e) | | 149,451 | 1,158,245 |
| Penumbra, Inc. (a) | | 376,976 | 23,334,814 |
| Presbia PLC (a) | | 349,774 | 1,532,010 |
| St. Jude Medical, Inc. | | 123,700 | 9,797,040 |
| Zeltiq Aesthetics, Inc. (a)(b) | | 135,400 | 5,958,954 |
| | | | 156,332,197 |
| Health Care Providers & Services - 0.9% | | | |
| Cardinal Health, Inc. | | 229,000 | 16,261,290 |
| Express Scripts Holding Co. (a) | | 111,400 | 8,453,032 |
| Laboratory Corp. of America Holdings (a) | | 56,400 | 7,097,940 |
| McKesson Corp. | | 140,300 | 20,176,543 |
| UnitedHealth Group, Inc. | | 260,100 | 41,179,032 |
| | | | 93,167,837 |
| Health Care Technology - 0.3% | | | |
| athenahealth, Inc. (a)(b) | | 232,800 | 22,022,880 |
| Castlight Health, Inc. Class B (a)(b) | | 758,900 | 3,528,885 |
| Cerner Corp. (a) | | 68,600 | 3,414,908 |
| | | | 28,966,673 |
| Life Sciences Tools & Services - 0.1% | | | |
| Divi's Laboratories Ltd. | | 35,223 | 602,464 |
| Illumina, Inc. (a) | | 54,062 | 7,197,815 |
| | | | 7,800,279 |
| Pharmaceuticals - 1.6% | | | |
| Adimab LLC unit (a)(c)(d) | | 762,787 | 18,337,399 |
| Allergan PLC | | 93,193 | 18,107,400 |
| Avexis, Inc. | | 279,300 | 16,512,216 |
| Bristol-Myers Squibb Co. | | 855,800 | 48,301,352 |
| Castle Creek Pharmaceuticals, LLC Class A-2 unit (c)(d) | | 13,511 | 4,458,630 |
| Cempra, Inc. (a) | | 118,800 | 772,200 |
| Endocyte, Inc. (a)(b) | | 578,500 | 1,538,810 |
| Intra-Cellular Therapies, Inc. (a) | | 967,598 | 13,488,316 |
| Jazz Pharmaceuticals PLC (a) | | 135,500 | 14,041,865 |
| Kolltan Pharmaceuticals, Inc. rights (a) | | 1,692,030 | 284,261 |
| Mylan N.V. (a) | | 36,900 | 1,350,909 |
| Stemcentrx, Inc. rights 12/31/21 (a) | | 568,100 | 1,567,956 |
| Teva Pharmaceutical Industries Ltd. sponsored ADR | | 198,900 | 7,498,530 |
| The Medicines Company (a) | | 589,123 | 20,678,217 |
| Theravance Biopharma, Inc. (a) | | 92,900 | 2,586,336 |
| | | | 169,524,397 |
|
| TOTAL HEALTH CARE | | | 1,879,799,899 |
|
| INDUSTRIALS - 6.7% | | | |
| Aerospace & Defense - 0.8% | | | |
| Lockheed Martin Corp. | | 163,400 | 43,341,850 |
| Northrop Grumman Corp. | | 22,100 | 5,517,265 |
| Space Exploration Technologies Corp. Class A (a)(c) | | 98,001 | 10,191,124 |
| The Boeing Co. | | 191,100 | 28,772,016 |
| | | | 87,822,255 |
| Air Freight & Logistics - 0.4% | | | |
| FedEx Corp. | | 32,900 | 6,305,943 |
| United Parcel Service, Inc. Class B | | 334,800 | 38,810,016 |
| | | | 45,115,959 |
| Airlines - 2.6% | | | |
| Allegiant Travel Co. | | 116,300 | 19,003,420 |
| Delta Air Lines, Inc. | | 400,900 | 19,315,362 |
| InterGlobe Aviation Ltd. (a) | | 191,918 | 2,404,774 |
| JetBlue Airways Corp. (a) | | 2,902,600 | 58,313,234 |
| Ryanair Holdings PLC sponsored ADR | | 164,510 | 13,134,478 |
| Southwest Airlines Co. | | 924,200 | 43,076,962 |
| Spirit Airlines, Inc. (a) | | 670,400 | 37,274,240 |
| United Continental Holdings, Inc. (a) | | 756,400 | 52,153,780 |
| Wheels Up Partners Holdings LLC Series B unit (a)(c)(d) | | 1,843,115 | 4,957,979 |
| Wizz Air Holdings PLC (a) | | 938,442 | 19,679,234 |
| | | | 269,313,463 |
| Building Products - 0.1% | | | |
| Tyco International Ltd. | | 161,996 | 7,286,580 |
| Electrical Equipment - 0.3% | | | |
| AMETEK, Inc. | | 25,600 | 1,212,160 |
| Eaton Corp. PLC | | 154,900 | 10,302,399 |
| Emerson Electric Co. | | 135,500 | 7,647,620 |
| Fortive Corp. | | 222,600 | 12,240,774 |
| | | | 31,402,953 |
| Industrial Conglomerates - 0.9% | | | |
| 3M Co. | | 293,600 | 50,422,864 |
| Honeywell International, Inc. | | 385,100 | 43,878,294 |
| | | | 94,301,158 |
| Machinery - 1.3% | | | |
| Caterpillar, Inc. | | 865,800 | 82,735,848 |
| Cummins, Inc. | | 42,500 | 6,025,650 |
| Deere & Co. | | 112,700 | 11,292,540 |
| Illinois Tool Works, Inc. | | 106,100 | 13,281,598 |
| Wabtec Corp. | | 72,500 | 6,138,575 |
| Xylem, Inc. | | 228,300 | 11,775,714 |
| | | | 131,249,925 |
| Road & Rail - 0.3% | | | |
| Union Pacific Corp. | | 264,500 | 26,801,785 |
|
| TOTAL INDUSTRIALS | | | 693,294,078 |
|
| INFORMATION TECHNOLOGY - 39.6% | | | |
| Communications Equipment - 0.4% | | | |
| Arista Networks, Inc. (a) | | 20,900 | 1,981,529 |
| Cisco Systems, Inc. | | 207,000 | 6,172,740 |
| Infinera Corp. (a) | | 3,822,800 | 32,493,800 |
| Palo Alto Networks, Inc. (a) | | 28,500 | 3,829,545 |
| | | | 44,477,614 |
| Electronic Equipment & Components - 0.2% | | | |
| TE Connectivity Ltd. | | 39,600 | 2,678,544 |
| Trimble, Inc. (a) | | 500,400 | 14,106,276 |
| | | | 16,784,820 |
| Internet Software & Services - 10.6% | | | |
| Actua Corp. (a) | | 975,218 | 13,214,204 |
| Akamai Technologies, Inc. (a) | | 77,900 | 5,195,930 |
| Alibaba Group Holding Ltd. sponsored ADR (a) | | 409,900 | 38,538,798 |
| Alphabet, Inc.: | | | |
| Class A (a) | | 520,270 | 403,667,088 |
| Class C (a) | | 261,356 | 198,118,302 |
| Apptio, Inc. Class A | | 124,600 | 2,468,326 |
| Baidu.com, Inc. sponsored ADR (a) | | 6,800 | 1,135,260 |
| Criteo SA sponsored ADR (a)(b) | | 93,187 | 3,845,827 |
| eBay, Inc. (a) | | 948,100 | 26,366,661 |
| Facebook, Inc. Class A (a) | | 2,649,558 | 313,760,658 |
| GoDaddy, Inc. (a) | | 138,300 | 4,887,522 |
| Hortonworks, Inc. (a)(b) | | 89,300 | 811,737 |
| NAVER Corp. | | 2,693 | 1,824,949 |
| New Relic, Inc. (a) | | 165,446 | 5,246,293 |
| Nutanix, Inc.: | | | |
| Class A (a)(b) | | 284,900 | 9,116,800 |
| Class B | | 274,751 | 7,912,829 |
| Shopify, Inc. Class A (a) | | 1,175,749 | 48,993,460 |
| Tencent Holdings Ltd. | | 237,500 | 5,913,962 |
| Twitter, Inc. (a) | | 14,790 | 273,467 |
| Wix.com Ltd. (a) | | 308,407 | 15,266,147 |
| | | | 1,106,558,220 |
| IT Services - 2.7% | | | |
| Cognizant Technology Solutions Corp. Class A (a) | | 307,900 | 16,959,132 |
| IBM Corp. | | 52,300 | 8,484,106 |
| MasterCard, Inc. Class A | | 834,400 | 85,275,680 |
| PayPal Holdings, Inc. (a) | | 1,052,400 | 41,338,272 |
| Visa, Inc. Class A | | 1,602,700 | 123,920,764 |
| | | | 275,977,954 |
| Semiconductors & Semiconductor Equipment - 11.3% | | | |
| Advanced Micro Devices, Inc. (a) | | 1,367,800 | 12,187,098 |
| Applied Materials, Inc. | | 69,500 | 2,237,900 |
| Applied Micro Circuits Corp. (a) | | 1,824,174 | 15,961,523 |
| ASML Holding NV | | 70,600 | 7,280,978 |
| Broadcom Ltd. | | 212,836 | 36,286,410 |
| Cavium, Inc. (a) | | 697,600 | 39,784,128 |
| Cirrus Logic, Inc. (a) | | 884,900 | 48,669,500 |
| Cree, Inc. (a) | | 1,011,366 | 25,607,787 |
| Intel Corp. | | 122,700 | 4,257,690 |
| KLA-Tencor Corp. | | 84,300 | 6,730,512 |
| M/A-COM Technology Solutions Holdings, Inc. (a) | | 86,214 | 4,295,181 |
| Mellanox Technologies Ltd. (a) | | 245,500 | 10,175,975 |
| Micron Technology, Inc. (a) | | 102,300 | 1,997,919 |
| NVIDIA Corp. | | 8,738,483 | 805,688,128 |
| NXP Semiconductors NV (a) | | 88,800 | 8,804,520 |
| Qorvo, Inc. (a) | | 81,200 | 4,336,892 |
| Rambus, Inc. (a) | | 825,800 | 10,859,270 |
| Silicon Laboratories, Inc. (a) | | 980,000 | 65,023,000 |
| Skyworks Solutions, Inc. | | 44,078 | 3,387,394 |
| Taiwan Semiconductor Manufacturing Co. Ltd. sponsored ADR | | 441,400 | 13,105,166 |
| Texas Instruments, Inc. | | 660,600 | 48,838,158 |
| | | | 1,175,515,129 |
| Software - 9.4% | | | |
| Activision Blizzard, Inc. | | 2,327,500 | 85,209,775 |
| Adobe Systems, Inc. (a) | | 428,900 | 44,095,209 |
| Appirio, Inc. Escrow(c) | | 100,642 | 24,184 |
| Atlassian Corp. PLC | | 76,700 | 2,081,638 |
| Autodesk, Inc. (a) | | 218,800 | 15,887,068 |
| CyberArk Software Ltd. (a) | | 425,500 | 21,704,755 |
| Electronic Arts, Inc. (a) | | 710,600 | 56,307,944 |
| HubSpot, Inc. (a) | | 539,800 | 30,282,780 |
| Intuit, Inc. | | 161,400 | 18,347,952 |
| Microsoft Corp. | | 3,842,092 | 231,524,464 |
| Oracle Corp. | | 338,200 | 13,592,258 |
| Paylocity Holding Corp. (a) | | 62,900 | 2,082,619 |
| Proofpoint, Inc. (a) | | 140,100 | 10,789,101 |
| Red Hat, Inc. (a) | | 1,358,100 | 107,439,291 |
| Salesforce.com, Inc. (a) | | 4,331,942 | 311,899,824 |
| ServiceNow, Inc. (a) | | 156,900 | 13,046,235 |
| Zendesk, Inc. (a) | | 495,200 | 10,542,808 |
| | | | 974,857,905 |
| Technology Hardware, Storage & Peripherals - 5.0% | | | |
| Apple, Inc. | | 4,498,065 | 497,126,144 |
| Pure Storage, Inc. Class A (a)(b) | | 1,151,678 | 16,065,908 |
| Samsung Electronics Co. Ltd. | | 5,078 | 7,529,192 |
| Western Digital Corp. | | 34,420 | 2,191,177 |
| | | | 522,912,421 |
|
| TOTAL INFORMATION TECHNOLOGY | | | 4,117,084,063 |
|
| MATERIALS - 1.4% | | | |
| Chemicals - 1.4% | | | |
| AdvanSix, Inc. (a) | | 23,144 | 432,793 |
| CF Industries Holdings, Inc. | | 386,300 | 11,179,522 |
| E.I. du Pont de Nemours & Co. | | 427,000 | 31,431,470 |
| Monsanto Co. | | 270,691 | 27,802,673 |
| Praxair, Inc. | | 67,900 | 8,168,370 |
| The Dow Chemical Co. | | 415,300 | 23,140,516 |
| The Mosaic Co. | | 95,200 | 2,703,680 |
| The Scotts Miracle-Gro Co. Class A | | 476,560 | 43,495,631 |
| | | | 148,354,655 |
| REAL ESTATE - 0.3% | | | |
| Equity Real Estate Investment Trusts (REITs) - 0.3% | | | |
| American Tower Corp. | | 326,300 | 33,370,701 |
| TELECOMMUNICATION SERVICES - 0.7% | | | |
| Diversified Telecommunication Services - 0.2% | | | |
| Verizon Communications, Inc. | | 382,100 | 19,066,790 |
| Wireless Telecommunication Services - 0.5% | | | |
| T-Mobile U.S., Inc. (a) | | 912,000 | 49,439,520 |
|
| TOTAL TELECOMMUNICATION SERVICES | | | 68,506,310 |
|
| TOTAL COMMON STOCKS | | | |
| (Cost $7,441,158,275) | | | 10,185,439,538 |
|
| Preferred Stocks - 1.7% | | | |
| Convertible Preferred Stocks - 1.7% | | | |
| CONSUMER DISCRETIONARY - 0.1% | | | |
| Hotels, Restaurants & Leisure - 0.1% | | | |
| MOD Super Fast Pizza Holdings LLC Series 3 Preferred unit (c)(d) | | 16,248 | 2,225,976 |
| Household Durables - 0.0% | | | |
| Roku, Inc.: | | | |
| Series G, 8.00% (a)(c) | | 661,380 | 1,157,415 |
| Series H (c) | | 228,870 | 400,523 |
| | | | 1,557,938 |
| Internet & Direct Marketing Retail - 0.0% | | | |
| The Honest Co., Inc.: | | | |
| Series C (a)(c) | | 22,157 | 729,568 |
| Series D (a)(c) | | 19,064 | 695,382 |
| | | | 1,424,950 |
| Media - 0.0% | | | |
| Turn, Inc. Series E (a)(c) | | 205,882 | 652,461 |
| TOTAL CONSUMER DISCRETIONARY | | | 5,861,325 |
| CONSUMER STAPLES - 0.0% | | | |
| Food & Staples Retailing - 0.0% | | | |
| Blue Apron, Inc. Series D (a)(c) | | 195,094 | 2,823,010 |
| FINANCIALS - 0.0% | | | |
| Diversified Financial Services - 0.0% | | | |
| UNITY Biotechnology, Inc. Series B (c) | | 645,485 | 2,388,295 |
| HEALTH CARE - 0.5% | | | |
| Biotechnology - 0.4% | | | |
| 10X Genomics, Inc. Series C (c) | | 593,543 | 2,843,071 |
| Immunocore Ltd. Series A (a)(c) | | 18,504 | 4,085,670 |
| Intarcia Therapeutics, Inc. Series EE 0.00% (c) | | 116,544 | 6,992,640 |
| Moderna Therapeutics, Inc.: | | | |
| Series E (c) | | 1,403,070 | 12,318,955 |
| Series F (c) | | 1,538,270 | 13,506,011 |
| RaNA Therapeutics LLC Series B (a)(c) | | 1,211,240 | 835,756 |
| | | | 40,582,103 |
| Health Care Providers & Services - 0.1% | | | |
| Mulberry Health, Inc. Series A8 (c) | | 783,663 | 5,117,398 |
| Health Care Technology - 0.0% | | | |
| Codiak Biosciences, Inc.: | | | |
| Series A (c) | | 163,914 | 432,733 |
| Series B (c) | | 532,720 | 1,406,381 |
| | | | 1,839,114 |
| TOTAL HEALTH CARE | | | 47,538,615 |
| INDUSTRIALS - 0.2% | | | |
| Aerospace & Defense - 0.1% | | | |
| Space Exploration Technologies Corp. Series G (a)(c) | | 53,937 | 5,608,909 |
| Commercial Services & Supplies - 0.0% | | | |
| Domo, Inc. Series D (a)(c) | | 613,084 | 4,164,618 |
| Professional Services - 0.1% | | | |
| YourPeople, Inc. Series C (c) | | 1,527,000 | 14,552,310 |
| TOTAL INDUSTRIALS | | | 24,325,837 |
| INFORMATION TECHNOLOGY - 0.9% | | | |
| Internet Software & Services - 0.5% | | | |
| Jet.Com, Inc. Series B1 Escrow(c) | | 2,105,094 | 691,418 |
| Uber Technologies, Inc.: | | | |
| Series D, 8.00% (a)(c) | | 1,095,852 | 53,447,144 |
| Series E, 8.00% (a)(c) | | 51,852 | 2,528,938 |
| | | | 56,667,500 |
| IT Services - 0.1% | | | |
| AppNexus, Inc. Series E (a)(c) | | 209,665 | 5,451,290 |
| Software - 0.3% | | | |
| Appirio, Inc. Series E Escrow(c) | | 704,496 | 188,629 |
| Cloudera, Inc. Series F (a)(c) | | 113,172 | 3,399,879 |
| Cloudflare, Inc. Series D 0.08% (a)(c) | | 344,325 | 2,062,507 |
| Dataminr, Inc. Series D (a)(c) | | 442,241 | 3,064,244 |
| Snapchat, Inc. Series F (a)(c) | | 545,559 | 16,759,572 |
| Taboola.Com Ltd. Series E (a)(c) | | 331,426 | 4,344,001 |
| | | | 29,818,832 |
| TOTAL INFORMATION TECHNOLOGY | | | 91,937,622 |
| TELECOMMUNICATION SERVICES - 0.0% | | | |
| Wireless Telecommunication Services - 0.0% | | | |
| Altiostar Networks, Inc. Series E (c) | | 242,424 | 1,119,999 |
|
| TOTAL CONVERTIBLE PREFERRED STOCKS | | | 175,994,703 |
|
| Nonconvertible Preferred Stocks - 0.0% | | | |
| HEALTH CARE - 0.0% | | | |
| Biotechnology - 0.0% | | | |
| Yumanity Holdings LLC Class A (c) | | 130,754 | 1,009,421 |
| TOTAL PREFERRED STOCKS | | | |
| (Cost $140,419,949) | | | 177,004,124 |
| | | Principal Amount | Value |
|
| Convertible Bonds - 0.0% | | | |
| CONSUMER DISCRETIONARY - 0.0% | | | |
| Media - 0.0% | | | |
| Turn, Inc. 1.48% 3/2/23(c) | | | |
| (Cost $64,000) | | $64,000 | 64,000 |
| | | Shares | Value |
|
| Money Market Funds - 1.2% | | | |
| Fidelity Cash Central Fund, 0.39% (f) | | 44,179,563 | 44,188,399 |
| Fidelity Securities Lending Cash Central Fund 0.48% (f)(g) | | 77,530,926 | 77,546,433 |
| TOTAL MONEY MARKET FUNDS | | | |
| (Cost $121,720,323) | | | 121,734,832 |
| TOTAL INVESTMENT PORTFOLIO - 100.8% | | | |
| (Cost $7,703,362,547) | | | 10,484,242,494 |
| NET OTHER ASSETS (LIABILITIES) - (0.8)% | | | (78,095,861) |
| NET ASSETS - 100% | | | $10,406,146,633 |
Legend
(a) Non-income producing
(b) Security or a portion of the security is on loan at period end.
(c) Restricted securities - Investment in securities not registered under the Securities Act of 1933 (excluding 144A issues). At the end of the period, the value of restricted securities (excluding 144A issues) amounted to $233,769,939 or 2.2% of net assets.
(d) Investment is owned by a wholly-owned subsidiary (Subsidiary) that is treated as a corporation for U.S. tax purposes.
(e) Security exempt from registration under Rule 144A of the Securities Act of 1933. These securities may be resold in transactions exempt from registration, normally to qualified institutional buyers. At the end of the period, the value of these securities amounted to $15,521,370 or 0.1% of net assets.
(f) Affiliated fund that is generally available only to investment companies and other accounts managed by Fidelity Investments. The rate quoted is the annualized seven-day yield of the fund at period end. A complete unaudited listing of the fund's holdings as of its most recent quarter end is available upon request. In addition, each Fidelity Central Fund's financial statements which are not covered by the Fund's Report of Independent Registered Public Accounting Firm, are available on the SEC's website or upon request.
(g) Investment made with cash collateral received from securities on loan.
Additional information on each restricted holding is as follows:
| Security | Acquisition Date | Acquisition Cost |
| 10X Genomics, Inc. Series C | 2/23/16 | $2,658,004 |
| Adimab LLC unit | 9/17/14 - 6/5/15 | $11,583,995 |
| Altiostar Networks, Inc. Series E, 0.00% | 9/26/16 | $1,119,999 |
| Appirio, Inc. Escrow | 11/24/16 | $24,184 |
| Appirio, Inc. Series E Escrow | 11/24/16 | $188,629 |
| AppNexus, Inc. Series E | 8/1/14 | $4,200,051 |
| Blue Apron, Inc. Series D | 5/18/15 | $2,599,998 |
| Castle Creek Pharmaceuticals, LLC Class A-2 unit | 9/29/16 | $4,458,630 |
| Cloudera, Inc. Series F | 2/5/14 | $1,647,784 |
| Cloudflare, Inc. Series D 0.08% | 11/5/14 | $2,109,163 |
| Codiak Biosciences, Inc. Series A | 11/12/15 | $163,914 |
| Codiak Biosciences, Inc. Series B | 11/12/15 | $1,598,160 |
| Dataminr, Inc. Series D | 2/18/15 - 3/6/15 | $5,638,573 |
| Domo, Inc. Series D | 1/24/14 | $2,533,999 |
| Immunocore Ltd. Series A | 7/27/15 | $3,482,067 |
| Intarcia Therapeutics, Inc. Series EE 0.00% | 9/2/16 | $6,992,640 |
| Jet.Com, Inc. Series B1 Escrow | 9/19/16 | $691,418 |
| MOD Super Fast Pizza Holdings LLC Series 3 Preferred unit | 11/3/16 | $2,225,976 |
| Moderna Therapeutics, Inc. Series E, 0.00% | 12/18/14 | $10,570,104 |
| Moderna Therapeutics, Inc. Series F, 0.00% | 8/10/16 | $11,588,640 |
| Mulberry Health, Inc. Series A8 | 1/20/16 | $5,293,448 |
| NJOY, Inc. | 2/14/14 | $1,528,156 |
| RaNA Therapeutics LLC Series B | 7/17/15 | $1,308,139 |
| Roku, Inc. Series G, 8.00% | 10/1/14 | $859,496 |
| Roku, Inc. Series H | 11/9/15 | $349,919 |
| RPI International Holdings LP | 5/21/15 - 3/23/16 | $4,390,645 |
| Snapchat, Inc. Series F | 3/25/15 - 2/12/16 | $16,759,572 |
| Space Exploration Technologies Corp. Class A | 10/16/15 | $8,722,089 |
| Space Exploration Technologies Corp. Series G | 1/20/15 | $4,177,960 |
| Taboola.Com Ltd. Series E | 12/22/14 | $3,455,249 |
| The Honest Co., Inc. | 8/21/14 | $256,936 |
| The Honest Co., Inc. Series C | 8/21/14 | $599,509 |
| The Honest Co., Inc. Series D | 8/3/15 | $872,273 |
| Tory Burch LLC unit | 5/14/15 | $17,704,966 |
| Turn, Inc. Series E | 12/30/13 | $1,717,056 |
| Turn, Inc. 1.48% 3/2/23 | 3/2/16 | $64,000 |
| Uber Technologies, Inc. Series D, 8.00% | 6/6/14 | $17,000,007 |
| Uber Technologies, Inc. Series E, 8.00% | 12/5/14 | $1,727,583 |
| UNITY Biotechnology, Inc. Series B, 0.00% | 10/14/16 | $2,652,943 |
| Wheels Up Partners Holdings LLC Series B unit | 9/18/15 | $5,235,000 |
| YourPeople, Inc. Series C 0.00% | 5/1/15 | $22,753,949 |
| Yumanity Holdings LLC Class A | 2/8/16 | $883,727 |
Affiliated Central Funds
Information regarding fiscal year to date income earned by the Fund from investments in Fidelity Central Funds is as follows:
| Fund | Income earned |
| Fidelity Cash Central Fund | $149,635 |
| Fidelity Securities Lending Cash Central Fund | 1,838,428 |
| Total | $1,988,063 |
Investment Valuation
The following is a summary of the inputs used, as of November 30, 2016, involving the Fund's assets and liabilities carried at fair value. The inputs or methodology used for valuing securities may not be an indication of the risk associated with investing in those securities. For more information on valuation inputs, and their aggregation into the levels used below, please refer to the Investment Valuation section in the accompanying Notes to Financial Statements.
| | Valuation Inputs at Reporting Date: |
| Description | Total | Level 1 | Level 2 | Level 3 |
| Investments in Securities: | | | | |
| Equities: | | | | |
| Consumer Discretionary | $2,079,579,695 | $1,827,176,067 | $232,425,737 | $19,977,891 |
| Consumer Staples | 642,625,893 | 634,966,615 | 4,836,268 | 2,823,010 |
| Energy | 276,363,813 | 276,363,813 | -- | -- |
| Financials | 257,533,061 | 250,528,833 | -- | 7,004,228 |
| Health Care | 1,928,347,935 | 1,840,037,031 | 15,114,622 | 73,196,282 |
| Industrials | 717,619,915 | 675,740,201 | 2,404,774 | 39,474,940 |
| Information Technology | 4,209,021,685 | 4,103,233,088 | 13,826,791 | 91,961,806 |
| Materials | 148,354,655 | 148,354,655 | -- | -- |
| Real Estate | 33,370,701 | 33,370,701 | -- | -- |
| Telecommunication Services | 69,626,309 | 68,506,310 | -- | 1,119,999 |
| Corporate Bonds | 64,000 | -- | -- | 64,000 |
| Money Market Funds | 121,734,832 | 121,734,832 | -- | -- |
| Total Investments in Securities: | $10,484,242,494 | $9,980,012,146 | $268,608,192 | $235,622,156 |
The following is a reconciliation of Investments in Securities for which Level 3 inputs were used in determining value:
| Investments in Securities: | |
| Beginning Balance | $195,481,953 |
| Net Realized Gain (Loss) on Investment Securities | 10,901,561 |
| Net Unrealized Gain (Loss) on Investment Securities | 25,113,968 |
| Cost of Purchases | 91,462,660 |
| Proceeds of Sales | (87,337,986) |
| Amortization/Accretion | -- |
| Transfers into Level 3 | -- |
| Transfers out of Level 3 | -- |
| Ending Balance | $235,622,156 |
| The change in unrealized gain (loss) for the period attributable to Level 3 securities held at November 30, 2016 | $23,642,869 |
The information used in the above reconciliation represents fiscal year to date activity for any Investments in Securities identified as using Level 3 inputs at either the beginning or the end of the current fiscal period. Transfers in or out of Level 3 represent the beginning value of any Security or Instrument where a change in the pricing level occurred from the beginning to the end of the period. The cost of purchases and the proceeds of sales may include securities received or delivered through corporate actions or exchanges. Realized and unrealized gains (losses) disclosed in the reconciliation are included in Net Gain (Loss) on the Fund's Statement of Operations.
See accompanying notes which are an integral part of the financial statements.
Financial Statements
Statement of Assets and Liabilities
| | | November 30, 2016 |
| Assets | | |
Investment in securities, at value (including securities loaned of $73,957,969) — See accompanying schedule:
Unaffiliated issuers (cost $7,581,642,224) | $10,362,507,662 | |
| Fidelity Central Funds (cost $121,720,323) | 121,734,832 | |
| Total Investments (cost $7,703,362,547) | | $10,484,242,494 |
| Cash | | 246,924 |
| Restricted cash | | 100,000 |
| Receivable for investments sold | | 373,105,592 |
| Receivable for fund shares sold | | 7,264,032 |
| Dividends receivable | | 9,460,546 |
| Interest receivable | | 709 |
| Distributions receivable from Fidelity Central Funds | | 111,960 |
| Prepaid expenses | | 24,180 |
| Other receivables | | 22,998 |
| Total assets | | 10,874,579,435 |
| Liabilities | | |
| Payable for investments purchased | $8,901,740 | |
| Payable for fund shares redeemed | 372,238,239 | |
| Accrued management fee | 5,511,906 | |
| Payable for daily variation margin for derivative instruments | 3,463,074 | |
| Other affiliated payables | 654,287 | |
| Other payables and accrued expenses | 130,570 | |
| Collateral on securities loaned, at value | 77,532,986 | |
| Total liabilities | | 468,432,802 |
| Net Assets | | $10,406,146,633 |
| Net Assets consist of: | | |
| Paid in capital | | $7,392,945,560 |
| Undistributed net investment income | | 19,689,747 |
| Accumulated undistributed net realized gain (loss) on investments and foreign currency transactions | | 212,642,518 |
| Net unrealized appreciation (depreciation) on investments and assets and liabilities in foreign currencies | | 2,780,868,808 |
| Net Assets | | $10,406,146,633 |
| Series Growth Company: | | |
| Net Asset Value, offering price and redemption price per share ($4,032,150,803 ÷ 298,824,090 shares) | | $13.49 |
| Class F: | | |
| Net Asset Value, offering price and redemption price per share ($6,373,995,830 ÷ 471,704,097 shares) | | $13.51 |
See accompanying notes which are an integral part of the financial statements.
Statement of Operations
| | | Year ended November 30, 2016 |
| Investment Income | | |
| Dividends | | $88,096,449 |
| Interest | | 771 |
| Income from Fidelity Central Funds | | 1,988,063 |
| Total income | | 90,085,283 |
| Expenses | | |
| Management fee | | |
| Basic fee | $58,120,384 | |
| Performance adjustment | 1,335,757 | |
| Transfer agent fees | 6,735,338 | |
| Accounting and security lending fees | 1,340,126 | |
| Custodian fees and expenses | 333,456 | |
| Independent trustees' fees and expenses | 46,066 | |
| Audit | 152,235 | |
| Legal | 20,035 | |
| Interest | 16,297 | |
| Miscellaneous | 87,909 | |
| Total expenses before reductions | 68,187,603 | |
| Expense reductions | (194,330) | 67,993,273 |
| Net investment income (loss) | | 22,092,010 |
| Realized and Unrealized Gain (Loss) | | |
| Net realized gain (loss) on: | | |
| Investment securities: | | |
| Unaffiliated issuers | 235,549,117 | |
| Fidelity Central Funds | 2,449 | |
| Foreign currency transactions | (16,598) | |
| Futures contracts | (3,463,074) | |
| Total net realized gain (loss) | | 232,071,894 |
Change in net unrealized appreciation (depreciation) on:
Investment securities (net of decrease in deferred foreign taxes of $172,578) | 76,320,793 | |
| Assets and liabilities in foreign currencies | 2,937 | |
| Total change in net unrealized appreciation (depreciation) | | 76,323,730 |
| Net gain (loss) | | 308,395,624 |
| Net increase (decrease) in net assets resulting from operations | | $330,487,634 |
See accompanying notes which are an integral part of the financial statements.
Statement of Changes in Net Assets
| | Year ended November 30, 2016 | Year ended November 30, 2015 |
| Increase (Decrease) in Net Assets | | |
| Operations | | |
| Net investment income (loss) | $22,092,010 | $36,951,159 |
| Net realized gain (loss) | 232,071,894 | (15,647,293) |
| Change in net unrealized appreciation (depreciation) | 76,323,730 | 929,612,994 |
| Net increase (decrease) in net assets resulting from operations | 330,487,634 | 950,916,860 |
| Distributions to shareholders from net investment income | (37,257,434) | (29,612,988) |
| Distributions to shareholders from net realized gain | – | (59,029,508) |
| Total distributions | (37,257,434) | (88,642,496) |
| Share transactions - net increase (decrease) | (1,345,489,350) | 88,642,433 |
| Total increase (decrease) in net assets | (1,052,259,150) | 950,916,797 |
| Net Assets | | |
| Beginning of period | 11,458,405,783 | 10,507,488,986 |
| End of period | $10,406,146,633 | $11,458,405,783 |
| Other Information | | |
| Undistributed net investment income end of period | $19,689,747 | $35,069,004 |
See accompanying notes which are an integral part of the financial statements.
Financial Highlights — Fidelity Series Growth Company Fund
| Years ended November 30, | 2016 | 2015 | 2014 | 2013 A |
| Selected Per–Share Data | | | | |
| Net asset value, beginning of period | $13.08 | $12.10 | $10.29 | $10.00 |
| Income from Investment Operations | | | | |
| Net investment income (loss)B | .01 | .03 | .02 | .01 |
| Net realized and unrealized gain (loss) | .43 | 1.04 | 1.80 | .28 |
| Total from investment operations | .44 | 1.07 | 1.82 | .29 |
| Distributions from net investment income | (.03) | (.02) | (.01) | – |
| Distributions from net realized gain | – | (.07) | – | – |
| Total distributions | (.03) | (.09) | (.01) | – |
| Net asset value, end of period | $13.49 | $13.08 | $12.10 | $10.29 |
| Total ReturnC,D | 3.38% | 8.94% | 17.67% | 2.90% |
| Ratios to Average Net AssetsE,F | | | | |
| Expenses before reductions | .74% | .79% | .74% | .76%G |
| Expenses net of fee waivers, if any | .74% | .79% | .74% | .76%G |
| Expenses net of all reductions | .74% | .79% | .74% | .76%G |
| Net investment income (loss) | .11% | .24% | .22% | .87%G |
| Supplemental Data | | | | |
| Net assets, end of period (000 omitted) | $4,032,151 | $4,602,479 | $4,353,274 | $4,063,472 |
| Portfolio turnover rateH | 20% | 18% | 14% | 1%I |
A For the period November 7, 2013 (commencement of operations) to November 30, 2013.
B Calculated based on average shares outstanding during the period.
C Total returns for periods of less than one year are not annualized.
D Total returns would have been lower if certain expenses had not been reduced during the applicable periods shown.
E Fees and expenses of any underlying Fidelity Central Funds are not included in the Fund's expense ratio. The Fund indirectly bears its proportionate share of the expenses of any underlying Fidelity Central Funds.
F Expense ratios reflect operating expenses of the class. Expenses before reductions do not reflect amounts reimbursed by the investment adviser or reductions from brokerage service arrangements or reductions from other expense offset arrangements and do not represent the amount paid by the class during periods when reimbursements or reductions occur. Expense ratios before reductions for start-up periods may not be representative of longer-term operating periods. Expenses net of fee waivers reflect expenses after reimbursement by the investment adviser but prior to reductions from brokerage service arrangements or other expense offset arrangements. Expenses net of all reductions represent the net expenses paid by the class.
G Annualized
H Amount does not include the portfolio activity of any underlying Fidelity Central Funds.
I Amount not annualized.
See accompanying notes which are an integral part of the financial statements.
Financial Highlights — Fidelity Series Growth Company Fund Class F
| Years ended November 30, | 2016 | 2015 | 2014 | 2013 A |
| Selected Per–Share Data | | | | |
| Net asset value, beginning of period | $13.10 | $12.11 | $10.29 | $10.00 |
| Income from Investment Operations | | | | |
| Net investment income (loss)B | .03 | .05 | .04 | .01 |
| Net realized and unrealized gain (loss) | .43 | 1.05 | 1.79 | .28 |
| Total from investment operations | .46 | 1.10 | 1.83 | .29 |
| Distributions from net investment income | (.05) | (.04) | (.01) | – |
| Distributions from net realized gain | – | (.07) | – | – |
| Total distributions | (.05) | (.11) | (.01) | – |
| Net asset value, end of period | $13.51 | $13.10 | $12.11 | $10.29 |
| Total ReturnC,D | 3.54% | 9.20% | 17.80% | 2.90% |
| Ratios to Average Net AssetsE,F | | | | |
| Expenses before reductions | .58% | .63% | .57% | .57%G |
| Expenses net of fee waivers, if any | .58% | .63% | .57% | .57%G |
| Expenses net of all reductions | .58% | .63% | .57% | .57%G |
| Net investment income (loss) | .27% | .40% | .39% | 1.06%G |
| Supplemental Data | | | | |
| Net assets, end of period (000 omitted) | $6,373,996 | $6,855,927 | $6,154,215 | $5,239,424 |
| Portfolio turnover rateH | 20% | 18% | 14% | 1%I |
A For the period November 7, 2013 (commencement of operations) to November 30, 2013.
B Calculated based on average shares outstanding during the period.
C Total returns for periods of less than one year are not annualized.
D Total returns would have been lower if certain expenses had not been reduced during the applicable periods shown.
E Fees and expenses of any underlying Fidelity Central Funds are not included in the Fund's expense ratio. The Fund indirectly bears its proportionate share of the expenses of any underlying Fidelity Central Funds.
F Expense ratios reflect operating expenses of the class. Expenses before reductions do not reflect amounts reimbursed by the investment adviser or reductions from brokerage service arrangements or reductions from other expense offset arrangements and do not represent the amount paid by the class during periods when reimbursements or reductions occur. Expense ratios before reductions for start-up periods may not be representative of longer-term operating periods. Expenses net of fee waivers reflect expenses after reimbursement by the investment adviser but prior to reductions from brokerage service arrangements or other expense offset arrangements. Expenses net of all reductions represent the net expenses paid by the class.
G Annualized
H Amount does not include the portfolio activity of any underlying Fidelity Central Funds.
I Amount not annualized.
See accompanying notes which are an integral part of the financial statements.
Notes to Financial Statements
For the period ended November 30, 2016
1. Organization.
Fidelity Series Growth Company Fund (the Fund) is a fund of Fidelity Mt. Vernon Street Trust (the Trust) and is authorized to issue an unlimited number of shares. Shares of the Fund are only available for purchase by mutual funds for which Fidelity Management & Research Company (FMR) or an affiliate serves as an investment manager. The Trust is registered under the Investment Company Act of 1940, as amended (the 1940 Act), as an open-end management investment company organized as a Massachusetts business trust. The Fund offers Series Growth Company and Class F shares, each of which has equal rights as to assets and voting privileges. Each class has exclusive voting rights with respect to matters that affect that class.
2. Investments in Fidelity Central Funds.
The Fund invests in Fidelity Central Funds, which are open-end investment companies generally available only to other investment companies and accounts managed by the investment adviser and its affiliates. The Fund's Schedule of Investments lists each of the Fidelity Central Funds held as of period end, if any, as an investment of the Fund, but does not include the underlying holdings of each Fidelity Central Fund. As an Investing Fund, the Fund indirectly bears its proportionate share of the expenses of the underlying Fidelity Central Funds.
The Money Market Central Funds seek preservation of capital and current income and are managed by Fidelity Investments Money Management, Inc. (FIMM), an affiliate of the investment adviser. Annualized expenses of the Money Market Central Funds as of their most recent shareholder report date are less than .005%.
A complete unaudited list of holdings for each Fidelity Central Fund is available upon request or at the Securities and Exchange Commission (the SEC) website at www.sec.gov. In addition, the financial statements of the Fidelity Central Funds, which are not covered by the Fund's Report of Independent Registered Public Accounting Firm, are available on the SEC website or upon request.
3. Significant Accounting Policies.
The financial statements have been prepared in conformity with accounting principles generally accepted in the United States of America (GAAP), which require management to make certain estimates and assumptions at the date of the financial statements. Actual results could differ from those estimates. Subsequent events, if any, through the date that the financial statements were issued have been evaluated in the preparation of the financial statements. The following summarizes the significant accounting policies of the Fund:
Investment Valuation. Investments are valued as of 4:00 p.m. Eastern time on the last calendar day of the period. The Board of Trustees (the Board) has delegated the day to day responsibility for the valuation of the Fund's investments to the Fair Value Committee (the Committee) established by the Fund's investment adviser. In accordance with valuation policies and procedures approved by the Board, the Fund attempts to obtain prices from one or more third party pricing vendors or brokers to value its investments. When current market prices, quotations or currency exchange rates are not readily available or reliable, investments will be fair valued in good faith by the Committee, in accordance with procedures adopted by the Board. Factors used in determining fair value vary by investment type and may include market or investment specific events, changes in interest rates and credit quality. The frequency with which these procedures are used cannot be predicted and they may be utilized to a significant extent. The Committee oversees the Fund's valuation policies and procedures and reports to the Board on the Committee's activities and fair value determinations. The Board monitors the appropriateness of the procedures used in valuing the Fund's investments and ratifies the fair value determinations of the Committee.
The Fund categorizes the inputs to valuation techniques used to value its investments into a disclosure hierarchy consisting of three levels as shown below:
- Level 1 – quoted prices in active markets for identical investments
- Level 2 – other significant observable inputs (including quoted prices for similar investments, interest rates, prepayment speeds, etc.)
- Level 3 – unobservable inputs (including the Fund's own assumptions based on the best information available)
Valuation techniques used to value the Fund's investments by major category are as follows:
Equity securities, including restricted securities, for which market quotations are readily available, are valued at the last reported sale price or official closing price as reported by a third party pricing vendor on the primary market or exchange on which they are traded and are categorized as Level 1 in the hierarchy. In the event there were no sales during the day or closing prices are not available, securities are valued at the last quoted bid price or may be valued using the last available price and are generally categorized as Level 2 in the hierarchy. For foreign equity securities, when market or security specific events arise, comparisons to the valuation of American Depositary Receipts (ADRs), futures contracts, Exchange-Traded Funds (ETFs) and certain indexes as well as quoted prices for similar securities may be used and would be categorized as Level 2 in the hierarchy. Utilizing these techniques may result in transfers between Level 1 and Level 2. For equity securities, including restricted securities, where observable inputs are limited, assumptions about market activity and risk are used and these securities may be categorized as Level 3 in the hierarchy. Equity securities, including restricted securities, for which observable inputs are not available are valued using alternate valuation approaches, including the market approach and the income approach and are categorized as Level 3 in the hierarchy. The market approach generally consists of using comparable market transactions while the income approach generally consists of using the net present value of estimated future cash flows, adjusted as appropriate for liquidity, credit, market and/or other risk factors.
Debt securities, including restricted securities, are valued based on evaluated prices received from third party pricing vendors or from brokers who make markets in such securities. Corporate bonds are valued by pricing vendors who utilize matrix pricing which considers yield or price of bonds of comparable quality, coupon, maturity and type or by broker-supplied prices. When independent prices are unavailable or unreliable, debt securities may be valued utilizing pricing methodologies which consider similar factors that would be used by third party pricing vendors. Debt securities are generally categorized as Level 2 in the hierarchy but may be Level 3 depending on the circumstances.
Investments in open-end mutual funds, including the Fidelity Central Funds, are valued at their closing net asset value (NAV) each business day and are categorized as Level 1 in the hierarchy.
The following provides information on Level 3 securities held by the Fund that were valued at period end based on unobservable inputs. These amounts exclude valuations provided by a broker.
| Asset Type | Fair Value at 11/30/16 | Valuation Technique(s) | Unobservable Input | Amount or Range/Weighted Average | Impact to Valuation from an Increase in Input(a) |
| Corporate Bonds | $64,000 | Market approach | Transaction price | $100.00 | Increase |
| Equities | $235,558,156 | Discounted cash flow | Discount rate | 8.0% - 22.1% / 18.0% | Decrease |
| | | | Weighted average cost of capital (WACC) | 11.5% | Decrease |
| | | | Discount for lack of marketability | 10.0% - 25.0% / 23.7% | Decrease |
| | | | Growth rate | 2.0% - 2.5% / 2.1% | Increase |
| | | Market approach | Discount rate | 3.0% - 50.0% / 14.3% | Decrease |
| | | | Transaction price | $1.08 - $330.00 / $50.00 | Increase |
| | | | Tender price | $24.04 | Increase |
| | | | Discount for lack of marketability | 10.0% - 20.0% / 15.8% | Decrease |
| | | | Liquidity preference | $6.75 - $63.39 / $46.19 | Increase |
| | | | Premium rate | 6.0% - 169.0% / 55.4% | Increase |
| | | | Proxy discount | 12.0% - 36.1% / 19.5% | Decrease |
| | | | Proxy premium | 21.5% | Increase |
| | | Market comparable | Price/Earnings multiple (P/E) | 10.5 | Increase |
| | | | Enterprise value/EBITDA multiple | 9.3 | Increase |
| | | | Enterprise value/Sales multiple (EV/S) | 0.6 – 15.3 / 5.1 | Increase |
| | | | Enterprise value/Gross profit multiple (EV/GP) | 5.1 | Increase |
| | | Recovery value | Recovery value | 0.0% - 0.3% / 0.3% | Increase |
(a) Represents the expected directional change in the fair value of the Level 3 investments that would result from an increase in the corresponding input. A decrease to the unobservable input would have the opposite effect. Significant changes in these inputs could result in significantly higher or lower fair value measurements.
Changes in valuation techniques may result in transfers in or out of an assigned level within the disclosure hierarchy. The aggregate value of investments by input level as of November 30, 2016, as well as a roll forward of Level 3 investments, is included at the end of the Fund's Schedule of Investments.
Foreign Currency. The Fund may use foreign currency contracts to facilitate transactions in foreign-denominated securities. Gains and losses from these transactions may arise from changes in the value of the foreign currency or if the counterparties do not perform under the contracts' terms.
Foreign-denominated assets, including investment securities, and liabilities are translated into U.S. dollars at the exchange rates at period end. Purchases and sales of investment securities, income and dividends received and expenses denominated in foreign currencies are translated into U.S. dollars at the exchange rate in effect on the transaction date.
The effects of exchange rate fluctuations on investments are included with the net realized and unrealized gain (loss) on investment securities. Other foreign currency transactions resulting in realized and unrealized gain (loss) are disclosed separately.
Investment Transactions and Income. For financial reporting purposes, the Fund's investment holdings and NAV include trades executed through the end of the last business day of the period. The NAV per share for processing shareholder transactions is calculated as of the close of business of the New York Stock Exchange (NYSE), normally 4:00 p.m. Eastern time and includes trades executed through the end of the prior business day. Gains and losses on securities sold are determined on the basis of identified cost. Dividend income is recorded on the ex-dividend date, except for certain dividends from foreign securities where the ex-dividend date may have passed, which are recorded as soon as the Fund is informed of the ex-dividend date. Non-cash dividends included in dividend income, if any, are recorded at the fair market value of the securities received. Income and capital gain distributions from Fidelity Central Funds, if any, are recorded on the ex-dividend date. Certain distributions received by the Fund represent a return of capital or capital gain. The Fund determines the components of these distributions subsequent to the ex-dividend date, based upon receipt of tax filings or other correspondence relating to the underlying investment. These distributions are recorded as a reduction of cost of investments and/or as a realized gain. Interest income is accrued as earned and includes coupon interest and amortization of premium and accretion of discount on debt securities as applicable. Investment income is recorded net of foreign taxes withheld where recovery of such taxes is uncertain.
Class Allocations and Expenses. Investment income, realized and unrealized capital gains and losses, common expenses of the Fund, and certain fund-level expense reductions, if any, are allocated daily on a pro-rata basis to each class based on the relative net assets of each class to the total net assets of the Fund. Each class differs with respect to transfer agent fees incurred. Certain expense reductions may also differ by class. For the reporting period, the allocated portion of income and expenses to each class as a percent of its average net assets may vary due to the timing of recording these transactions in relation to fluctuating net assets of the classes. Expenses directly attributable to a fund are charged to that fund. Expenses attributable to more than one fund are allocated among the respective funds on the basis of relative net assets or other appropriate methods. Expense estimates are accrued in the period to which they relate and adjustments are made when actual amounts are known.
Income Tax Information and Distributions to Shareholders. Each year, the Fund intends to qualify as a regulated investment company under Subchapter M of the Internal Revenue Code, including distributing substantially all of its taxable income and realized gains. As a result, no provision for U.S. Federal income taxes is required. As of November 30, 2016, the Fund did not have any unrecognized tax benefits in the financial statements; nor is the Fund aware of any tax positions for which it is reasonably possible that the total amounts of unrecognized tax benefits will significantly change in the next twelve months. The Fund files a U.S. federal tax return, in addition to state and local tax returns as required. The Fund's federal income tax returns are subject to examination by the Internal Revenue Service (IRS) for a period of three fiscal years after they are filed. State and local tax returns may be subject to examination for an additional fiscal year depending on the jurisdiction. Foreign taxes are provided for based on the Fund's understanding of the tax rules and rates that exist in the foreign markets in which it invests.
Distributions are declared and recorded on the ex-dividend date. Income dividends and capital gain distributions are declared separately for each class. Income and capital gain distributions are determined in accordance with income tax regulations, which may differ from GAAP.
Capital accounts within the financial statements are adjusted for permanent book-tax differences. These adjustments have no impact on net assets or the results of operations. Capital accounts are not adjusted for temporary book-tax differences which will reverse in a subsequent period.
Book-tax differences are primarily due to foreign currency transactions, passive foreign investment companies (PFIC), capital loss carryforwards and losses deferred due to wash sales.
The federal tax cost of investment securities and unrealized appreciation (depreciation) as of period end were as follows:
| Gross unrealized appreciation | $3,252,005,547 |
| Gross unrealized depreciation | (478,229,211) |
| Net unrealized appreciation (depreciation) on securities | $2,773,776,336 |
| Tax Cost | $7,710,466,158 |
The tax-based components of distributable earnings as of period end were as follows:
| Undistributed ordinary income | $19,689,748 |
| Undistributed long-term capital gain | $219,746,130 |
| Net unrealized appreciation (depreciation) on securities and other investments | $2,773,765,197 |
The tax character of distributions paid was as follows:
| | November 30, 2016 | November 30, 2015 |
| Ordinary Income | $37,257,434 | $ 86,891,843 |
| Long-term Capital Gains | – | 1,750,653 |
| Total | $37,257,434 | $ 88,642,496 |
Restricted Securities. The Fund may invest in securities that are subject to legal or contractual restrictions on resale. These securities generally may be resold in transactions exempt from registration or to the public if the securities are registered. Disposal of these securities may involve time-consuming negotiations and expense, and prompt sale at an acceptable price may be difficult. Information regarding restricted securities is included at the end of the Fund's Schedule of Investments.
Consolidated Subsidiary. The Fund invests in certain investments through a wholly-owned subsidiary ("Subsidiary"), which may be subject to federal and state taxes upon disposition.
As of period end, the Fund held an investment of $43,900,558 in these Subsidiaries, representing .42% of the Fund's net assets. The financial statements have been consolidated and include accounts of the Fund and each Subsidiary. Accordingly, all inter-company transactions and balances have been eliminated.
Any cash held by the Subsidiaries is restricted as to its use and is presented as Restricted cash in the Statement of Assets and Liabilities.
4. Derivative Instruments.
Risk Exposures and the Use of Derivative Instruments. The Fund's investment objective allows the Fund to enter into various types of derivative contracts, including futures contracts. Derivatives are investments whose value is primarily derived from underlying assets, indices or reference rates and may be transacted on an exchange or over-the-counter (OTC). Derivatives may involve a future commitment to buy or sell a specified asset based on specified terms, to exchange future cash flows at periodic intervals based on a notional principal amount, or for one party to make one or more payments upon the occurrence of specified events in exchange for periodic payments from the other party.
The Fund used derivatives to increase returns and to manage exposure to certain risks as defined below. The success of any strategy involving derivatives depends on analysis of numerous economic factors, and if the strategies for investment do not work as intended, the Fund may not achieve its objectives.
The Fund's use of derivatives increased or decreased its exposure to the following risk:
| Equity Risk | Equity risk relates to the fluctuations in the value of financial instruments as a result of changes in market prices (other than those arising from interest rate risk or foreign exchange risk), whether caused by factors specific to an individual investment, its issuer, or all factors affecting all instruments traded in a market or market segment.
|
The Fund is also exposed to additional risks from investing in derivatives, such as liquidity risk and counterparty credit risk. Liquidity risk is the risk that the Fund will be unable to close out the derivative in the open market in a timely manner. Counterparty credit risk is the risk that the counterparty will not be able to fulfill its obligation to the Fund. Counterparty credit risk related to exchange-traded futures contracts may be mitigated by the protection provided by the exchange on which they trade.
Investing in derivatives may involve greater risks than investing in the underlying assets directly and, to varying degrees, may involve risk of loss in excess of any initial investment and collateral received and amounts recognized in the Statement of Assets and Liabilities. In addition, there may be the risk that the change in value of the derivative contract does not correspond to the change in value of the underlying instrument.
Futures Contracts. A futures contract is an agreement between two parties to buy or sell a specified underlying instrument for a fixed price at a specified future date. The Fund used futures contracts to manage its exposure to the stock market.
Upon entering into a futures contract, a fund is required to deposit either cash or securities (initial margin) with a clearing broker in an amount equal to a certain percentage of the face value of the contract. Futures contracts are marked-to-market daily and subsequent daily payments (variation margin) are made or received by a fund depending on the daily fluctuations in the value of the futures contracts and are recorded as unrealized appreciation or (depreciation). This receivable and/or payable, if any, is included in daily variation margin for derivative instruments in the Statement of Assets and Liabilities. Realized gain or (loss) is recorded upon the expiration or closing of a futures contract. The net realized gain (loss) and change in net unrealized appreciation (depreciation) on futures contracts during the period is included in the Statement of Operations.
Any open futures contracts at period end are presented in the Schedule of Investments under the caption "Futures Contracts". The underlying face amount at value reflects each contract's exposure to the underlying instrument or index at period end.
During the period, the Fund recognized net realized gain (loss) of $(3,463,074) related to its investment in futures contracts. This amount is included in the Statement of Operations.
5. Purchases and Sales of Investments.
Purchases and sales of securities, other than short-term securities, aggregated $2,136,727,920 and $3,325,989,850, respectively.
6. Fees and Other Transactions with Affiliates.
Management Fee. Fidelity Management & Research Company (the investment adviser) and its affiliates provide the Fund with investment management related services for which the Fund pays a monthly management fee. The management fee is the sum of an individual fund fee rate that is based on an annual rate of .30% of the Fund's average net assets and an annualized group fee rate that averaged .25% during the period. The group fee rate is based upon the average net assets of all the mutual funds advised by the investment adviser, including any mutual funds previously advised by the investment adviser that are currently advised by Fidelity SelectCo, LLC, an affiliate of the investment adviser. The group fee rate decreases as assets under management increase and increases as assets under management decrease. In addition, the management fee is subject to a performance adjustment (up to a maximum of +/- .20% of the Fund's average net assets over a 36 month performance period). The upward or downward adjustment to the management fee is based on the relative investment performance of Series Growth Company as compared to its benchmark index, the Russell 3000 Growth Index, over the same 36 month performance period. For the reporting period, the total annual management fee rate, including the performance adjustment, was .56% of the Fund's average net assets. The performance adjustment included in the management fee rate may be higher or lower than the maximum performance adjustment rate due to the difference between the average net assets for the reporting and performance periods.
Transfer Agent Fees. Fidelity Investments Institutional Operations Company, Inc., (FIIOC), an affiliate of the investment adviser, is the transfer, dividend disbursing and shareholder servicing agent for each class of the Fund. FIIOC receives account fees and asset-based fees that vary according to the account size and type of account of the shareholders of Series Growth Company. FIIOC receives no fees for providing transfer agency services to Class F. FIIOC pays for typesetting, printing and mailing of shareholder reports, except proxy statements.
For the period, transfer agent fees for each applicable class were as follows:
| | Amount | % of
Class-Level Average
Net Assets |
| Series Growth Company | $6,735,338 | .16 |
Accounting and Security Lending Fees. Fidelity Service Company, Inc. (FSC), an affiliate of the investment adviser, maintains the Fund's accounting records. The accounting fee is based on the level of average net assets for each month. Under a separate contract, FSC administers the security lending program. The security lending fee is based on the number and duration of lending transactions.
Brokerage Commissions. The Fund placed a portion of its portfolio transactions with brokerage firms which are affiliates of the investment adviser. Brokerage commissions are included in net realized gain (loss) and change in net unrealized appreciation (depreciation) in the Statement of Operations. The commissions paid to these affiliated firms were $71,057 for the period.
Interfund Lending Program. Pursuant to an Exemptive Order issued by the SEC, the Fund, along with other registered investment companies having management contracts with FMR or other affiliated entities of FMR, may participate in an interfund lending program. This program provides an alternative credit facility allowing the funds to borrow from, or lend money to, other participating affiliated funds. At period end, there were no interfund loans outstanding. The Fund's activity in this program during the period for which loans were outstanding was as follows:
| Borrower or Lender | Average Loan Balance | Weighted Average Interest Rate | Interest Expense |
| Borrower | $72,304,214 | .58% | $16,297 |
Interfund Trades. The Fund may purchase from or sell securities to other Fidelity Funds under procedures adopted by the Board. The procedures have been designed to ensure these interfund trades are executed in accordance with Rule 17a-7 of the 1940 Act. Interfund trades are included within the respective purchases and sales amounts shown in the Purchases and Sales of Investments note.
Other. During the period, the investment adviser reimbursed the Fund for certain losses in the amount of $7,827.
7. Committed Line of Credit.
The Fund participates with other funds managed by the investment adviser or an affiliate in a $4.25 billion credit facility (the "line of credit") to be utilized for temporary or emergency purposes to fund shareholder redemptions or for other short-term liquidity purposes. The Fund has agreed to pay commitment fees on its pro-rata portion of the line of credit, which amounted to $27,036 and is reflected in Miscellaneous expenses on the Statement of Operations. During the period, the Fund did not borrow on this line of credit.
8. Security Lending.
The Fund lends portfolio securities through a lending agent from time to time in order to earn additional income. For equity securities, a lending agent is used and may loan securities to certain qualified borrowers, including Fidelity Capital Markets (FCM), a broker-dealer affiliated with the Fund. On the settlement date of the loan, the Fund receives collateral (in the form of U.S. Treasury obligations, letters of credit and/or cash) against the loaned securities and maintains collateral in an amount not less than 100% of the market value of the loaned securities during the period of the loan. The market value of the loaned securities is determined at the close of business of the Fund and any additional required collateral is delivered to the Fund on the next business day. The Fund or borrower may terminate the loan at any time, and if the borrower defaults on its obligation to return the securities loaned because of insolvency or other reasons, the Fund may apply collateral received from the borrower against the obligation. The Fund may experience delays and costs in recovering the securities loaned. Any cash collateral received is invested in the Fidelity Securities Lending Cash Central Fund. The value of loaned securities and cash collateral at period end are disclosed on the Fund's Statement of Assets and Liabilities. Security lending income represents the income earned on investing cash collateral, less rebates paid to borrowers and any lending agent fees associated with the loan, plus any premium payments received for lending certain types of securities. Security lending income is presented in the Statement of Operations as a component of income from Fidelity Central Funds. Total security lending income during the period amounted to $1,838,428. During the period, there were no securities loaned to FCM.
9. Expense Reductions.
Commissions paid to certain brokers with whom the investment adviser, or its affiliates, places trades on behalf of the Fund include an amount in addition to trade execution, which may be rebated back to the Fund to offset certain expenses. This amount totaled $112,821 for the period. In addition, through arrangements with the Fund's custodian, credits realized as a result of certain uninvested cash balances were used to reduce the Fund's expenses. During the period, these credits reduced the Fund's custody by $80.
In addition, during the period the investment adviser reimbursed and/or waived a portion of fund-level operating expenses in the amount of $81,429.
10. Distributions to Shareholders.
Distributions to shareholders of each class were as follows:
| | Year ended
November 30, 2016 | Year ended
November 30, 2015 |
| From net investment income | | |
| Series Growth Company | $10,558,686 | $8,276,602 |
| Class F | 26,698,748 | 21,336,386 |
| Total | $37,257,434 | $29,612,988 |
| From net realized gain | | |
| Series Growth Company | $– | $24,475,300 |
| Class F | – | 34,554,208 |
| Total | $– | $59,029,508 |
11. Share Transactions.
Transactions for each class of shares were as follows:
| | Shares | Shares | Dollars | Dollars |
| | Year ended
November 30, 2016 | Year ended
November 30, 2015 | Year ended
November 30, 2016 | Year ended
November 30, 2015 |
| Series Growth Company | | | | |
| Shares sold | 2,063,132 | 5,591,937 | $25,665,235 | $72,622,934 |
| Reinvestment of distributions | 832,704 | 2,812,789 | 10,558,686 | 32,751,902 |
| Shares redeemed | (56,027,944) | (16,319,026) | (714,389,986) | (207,986,809) |
| Net increase (decrease) | (53,132,108) | (7,914,300) | $(678,166,065) | $(102,611,973) |
| Class F | | | | |
| Shares sold | 13,758,094 | 26,155,838 | $169,447,726 | $334,771,011 |
| Reinvestment of distributions | 2,107,241 | 4,800,256 | 26,698,748 | 55,890,594 |
| Shares redeemed | (67,666,109) | (15,442,203) | (863,469,759) | (199,407,199) |
| Net increase (decrease) | (51,800,774) | 15,513,891 | $(667,323,285) | $191,254,406 |
12. Other.
The Fund's organizational documents provide former and current trustees and officers with a limited indemnification against liabilities arising in connection with the performance of their duties to the Fund. In the normal course of business, the Fund may also enter into contracts that provide general indemnifications. The Fund's maximum exposure under these arrangements is unknown as this would be dependent on future claims that may be made against the Fund. The risk of material loss from such claims is considered remote.
At the end of the period, mutual funds managed by the investment adviser or its affiliates were the owners of record of all of the outstanding shares of the Fund.
Report of Independent Registered Public Accounting Firm
To the Trustees of Fidelity Mt. Vernon Street Trust and Shareholders of Fidelity Series Growth Company Fund:
We have audited the accompanying statement of assets and liabilities of Fidelity Series Growth Company Fund (the Fund), a fund of Fidelity Mt. Vernon Street Trust, including the schedule of investments, as of November 30, 2016, and the related statement of operations for the year then ended, the statement of changes in net assets for each of the two years in the period then ended, and the financial highlights for each of the periods presented. These financial statements and financial highlights are the responsibility of the Fund's management. Our responsibility is to express an opinion on these financial statements and financial highlights based on our audits.
We conducted our audits in accordance with the standards of the Public Company Accounting Oversight Board (United States). Those standards require that we plan and perform the audit to obtain reasonable assurance about whether the financial statements and financial highlights are free of material misstatement. The Fund is not required to have, nor were we engaged to perform, an audit of its internal control over financial reporting. Our audits included consideration of internal control over financial reporting as a basis for designing audit procedures that are appropriate in the circumstances, but not for the purpose of expressing an opinion on the effectiveness of the Fund's internal control over financial reporting. Accordingly, we express no such opinion. An audit also includes examining, on a test basis, evidence supporting the amounts and disclosures in the financial statements, assessing the accounting principles used and significant estimates made by management, as well as evaluating the overall financial statement presentation. Our procedures included confirmation of securities owned as of November 30, 2016, by correspondence with the custodians and brokers; when replies were not received from brokers, we performed other auditing procedures. We believe that our audits provide a reasonable basis for our opinion.
In our opinion, such financial statements and financial highlights referred to above present fairly, in all material respects, the financial position of Fidelity Series Growth Company Fund as of November 30, 2016, the results of its operations for the year then ended, the changes in its net assets for each of the two years in the period then ended, and the financial highlights for each of the periods presented, in conformity with accounting principles generally accepted in the United States of America.
DELOITTE & TOUCHE LLP
Boston, Massachusetts
January 23, 2017
Trustees and Officers
The Trustees, Members of the Advisory Board (if any), and officers of the trust and fund, as applicable, are listed below. The Board of Trustees governs the fund and is responsible for protecting the interests of shareholders. The Trustees are experienced executives who meet periodically throughout the year to oversee the fund's activities, review contractual arrangements with companies that provide services to the fund, oversee management of the risks associated with such activities and contractual arrangements, and review the fund's performance. Each of the Trustees oversees 170 funds.
The Trustees hold office without limit in time except that (a) any Trustee may resign; (b) any Trustee may be removed by written instrument, signed by at least two-thirds of the number of Trustees prior to such removal; (c) any Trustee who requests to be retired or who has become incapacitated by illness or injury may be retired by written instrument signed by a majority of the other Trustees; and (d) any Trustee may be removed at any special meeting of shareholders by a two-thirds vote of the outstanding voting securities of the trust. Each Trustee who is not an interested person (as defined in the 1940 Act) of the trust and the fund is referred to herein as an Independent Trustee. Each Independent Trustee shall retire not later than the last day of the calendar year in which his or her 75th birthday occurs. The Independent Trustees may waive this mandatory retirement age policy with respect to individual Trustees. Officers and Advisory Board Members hold office without limit in time, except that any officer or Advisory Board Member may resign or may be removed by a vote of a majority of the Trustees at any regular meeting or any special meeting of the Trustees. Except as indicated, each individual has held the office shown or other offices in the same company for the past five years.
The fund’s Statement of Additional Information (SAI) includes more information about the Trustees. To request a free copy, call Fidelity at 1-800-544-8544, or for Class F, call 1-800-835-5092.
Experience, Skills, Attributes, and Qualifications of the Trustees. The Governance and Nominating Committee has adopted a statement of policy that describes the experience, qualifications, attributes, and skills that are necessary and desirable for potential Independent Trustee candidates (Statement of Policy). The Board believes that each Trustee satisfied at the time he or she was initially elected or appointed a Trustee, and continues to satisfy, the standards contemplated by the Statement of Policy. The Governance and Nominating Committee also engages professional search firms to help identify potential Independent Trustee candidates who have the experience, qualifications, attributes, and skills consistent with the Statement of Policy. From time to time, additional criteria based on the composition and skills of the current Independent Trustees, as well as experience or skills that may be appropriate in light of future changes to board composition, business conditions, and regulatory or other developments, have also been considered by the professional search firms and the Governance and Nominating Committee. In addition, the Board takes into account the Trustees' commitment and participation in Board and committee meetings, as well as their leadership of standing and ad hoc committees throughout their tenure.
In determining that a particular Trustee was and continues to be qualified to serve as a Trustee, the Board has considered a variety of criteria, none of which, in isolation, was controlling. The Board believes that, collectively, the Trustees have balanced and diverse experience, qualifications, attributes, and skills, which allow the Board to operate effectively in governing the fund and protecting the interests of shareholders. Information about the specific experience, skills, attributes, and qualifications of each Trustee, which in each case led to the Board's conclusion that the Trustee should serve (or continue to serve) as a trustee of the fund, is provided below.
Board Structure and Oversight Function. James C. Curvey is an interested person and currently serves as Chairman. The Trustees have determined that an interested Chairman is appropriate and benefits shareholders because an interested Chairman has a personal and professional stake in the quality and continuity of services provided to the fund. Independent Trustees exercise their informed business judgment to appoint an individual of their choosing to serve as Chairman, regardless of whether the Trustee happens to be independent or a member of management. The Independent Trustees have determined that they can act independently and effectively without having an Independent Trustee serve as Chairman and that a key structural component for assuring that they are in a position to do so is for the Independent Trustees to constitute a substantial majority for the Board. The Independent Trustees also regularly meet in executive session. Ned C. Lautenbach serves as Chairman of the Independent Trustees and as such (i) acts as a liaison between the Independent Trustees and management with respect to matters important to the Independent Trustees and (ii) with management prepares agendas for Board meetings.
Fidelity® funds are overseen by different Boards of Trustees. The fund's Board oversees Fidelity's high income and certain equity funds, and other Boards oversee Fidelity's investment-grade bond, money market, asset allocation, and sector funds. The asset allocation funds may invest in Fidelity® funds overseen by the fund's Board. The use of separate Boards, each with its own committee structure, allows the Trustees of each group of Fidelity® funds to focus on the unique issues of the funds they oversee, including common research, investment, and operational issues. On occasion, the separate Boards establish joint committees to address issues of overlapping consequences for the Fidelity® funds overseen by each Board.
The Trustees operate using a system of committees to facilitate the timely and efficient consideration of all matters of importance to the Trustees, the fund, and fund shareholders and to facilitate compliance with legal and regulatory requirements and oversight of the fund's activities and associated risks. The Board, acting through its committees, has charged FMR and its affiliates with (i) identifying events or circumstances the occurrence of which could have demonstrably adverse effects on the fund's business and/or reputation; (ii) implementing processes and controls to lessen the possibility that such events or circumstances occur or to mitigate the effects of such events or circumstances if they do occur; and (iii) creating and maintaining a system designed to evaluate continuously business and market conditions in order to facilitate the identification and implementation processes described in (i) and (ii) above. Because the day-to-day operations and activities of the fund are carried out by or through FMR, its affiliates, and other service providers, the fund's exposure to risks is mitigated but not eliminated by the processes overseen by the Trustees. While each of the Board's committees has responsibility for overseeing different aspects of the fund's activities, oversight is exercised primarily through the Operations, Audit, and Compliance Committees. In addition, the Independent Trustees have worked with FMR to enhance the Board's oversight of investment and financial risks, legal and regulatory risks, technology risks, and operational risks, including the development of additional risk reporting to the Board. For example, a working group comprised of Independent Trustees and FMR has worked and continues to work to review the Fidelity® funds' valuation-related activities, reporting and risk management. Appropriate personnel, including but not limited to the fund's Chief Compliance Officer (CCO), FMR's internal auditor, the independent accountants, the fund's Treasurer and portfolio management personnel, make periodic reports to the Board's committees, as appropriate, including an annual review of Fidelity's risk management program for the Fidelity® funds. The responsibilities of each standing committee, including their oversight responsibilities, are described further under "Standing Committees of the Trustees."
Interested Trustees*:
Correspondence intended for a Trustee who is an interested person may be sent to Fidelity Investments, 245 Summer Street, Boston, Massachusetts 02210.
Name, Year of Birth; Principal Occupations and Other Relevant Experience+
James C. Curvey (1935)
Year of Election or Appointment: 2007
Trustee
Chairman of the Board of Trustees
Mr. Curvey also serves as Trustee of other Fidelity® funds. Mr. Curvey is a Director of Fidelity Research & Analysis Co. (investment adviser firm, 2009-present), and Vice Chairman (2007-present) and Director of FMR LLC (diversified financial services company). In addition, Mr. Curvey serves as an Overseer for the Boston Symphony Orchestra and a member of the board of Artis-Naples, Naples, Florida, and as a Trustee for Brewster Academy, Wolfeboro, New Hampshire. Previously, Mr. Curvey served as a Director of Fidelity Investments Money Management, Inc. (investment adviser firm, 2009-2014) and a Director of FMR and FMR Co., Inc. (investment adviser firms, 2007-2014).
Charles S. Morrison (1960)
Year of Election or Appointment: 2014
Trustee
Mr. Morrison also serves as Trustee of other funds. He serves as President of Fidelity Management & Research Company (FMR) (investment adviser firm, 2016-present), a Director of Fidelity Investments Money Management, Inc. (FIMM) (investment adviser firm, 2014-present), Director of Fidelity SelectCo, LLC (investment adviser firm, 2014-present), President, Asset Management (2014-present), and is an employee of Fidelity Investments. Previously, Mr. Morrison served as Vice President of Fidelity's Fixed Income and Asset Allocation Funds (2012-2014), President, Fixed Income (2011-2014), Vice President of Fidelity's Money Market Funds (2005-2009), President, Money Market Group Leader of FMR (investment adviser firm, 2009), and Senior Vice President, Money Market Group of FMR (2004-2009). Mr. Morrison also served as Vice President of Fidelity's Bond Funds (2002-2005), certain Balanced Funds (2002-2005), and certain Asset Allocation Funds (2002-2007), and as Senior Vice President (2002-2005) of Fidelity's Bond Division.
* Determined to be an “Interested Trustee” by virtue of, among other things, his or her affiliation with the trust or various entities under common control with FMR.
+ The information includes the Trustee's principal occupation during the last five years and other information relating to the experience, attributes, and skills relevant to the Trustee's qualifications to serve as a Trustee, which led to the conclusion that the Trustee should serve as a Trustee for the fund.
Independent Trustees:
Correspondence intended for an Independent Trustee may be sent to Fidelity Investments, P.O. Box 55235, Boston, Massachusetts 02205-5235.
Name, Year of Birth; Principal Occupations and Other Relevant Experience+
Dennis J. Dirks (1948)
Year of Election or Appointment: 2005
Trustee
Mr. Dirks also serves as Trustee of other Fidelity® funds. Prior to his retirement in May 2003, Mr. Dirks was Chief Operating Officer and a member of the Board of The Depository Trust & Clearing Corporation (DTCC). He also served as President, Chief Operating Officer, and Board member of The Depository Trust Company (DTC) and President and Board member of the National Securities Clearing Corporation (NSCC). In addition, Mr. Dirks served as Chief Executive Officer and Board member of the Government Securities Clearing Corporation, Chief Executive Officer and Board member of the Mortgage-Backed Securities Clearing Corporation, as a Trustee and a member of the Finance Committee of Manhattan College (2005-2008), as a Trustee and a member of the Finance Committee of AHRC of Nassau County (2006-2008), and as a member of the Independent Directors Council (IDC) Governing Council (2010-2015). Mr. Dirks is a member of the Board of Directors for The Brookville Center for Children's Services, Inc. (2009-present) and the Finance Committee of the Asolo Repertory Theatre (2016-present).
Alan J. Lacy (1953)
Year of Election or Appointment: 2008
Trustee
Mr. Lacy also serves as Trustee of other Fidelity® funds. Mr. Lacy serves as Chairman (2014-present) and a member (2010-present) of the Board of Directors of Dave & Buster's Entertainment, Inc. (restaurant and entertainment complexes) and a Director of Bristol-Myers Squibb Company (global pharmaceuticals, 2008-present). He is a Trustee of the California Chapter of The Nature Conservancy (2015-present) and a Director of the Center for Advanced Study in the Behavioral Sciences at Stanford University (2015-present). In addition, Mr. Lacy served as Senior Adviser (2007-2014) of Oak Hill Capital Partners, L.P. (private equity) and also served as Chief Executive Officer (2005) and Vice Chairman (2005-2006) of Sears Holdings Corporation (retail) and Chief Executive Officer and Chairman of the Board of Sears, Roebuck and Co. (retail, 2000-2005). Previously, Mr. Lacy served as Chairman (2008-2011) and a member (2006-2015) of the Board of Trustees of the National Parks Conservation Association and as a member of the Board of Directors for The Western Union Company (global money transfer, 2006-2011), The Hillman Companies, Inc. (hardware wholesalers, 2010-2014), and Earth Fare, Inc. (retail grocery, 2010-2014).
Ned C. Lautenbach (1944)
Year of Election or Appointment: 2000
Trustee
Chairman of the Independent Trustees
Mr. Lautenbach also serves as Trustee of other Fidelity® funds. Mr. Lautenbach currently serves as the Lead Director of the Eaton Corporation Board of Directors (diversified industrial, 1997-present). Mr. Lautenbach is Chairman of the Board of Directors of Artis-Naples in Naples, Florida (2012-present), a member of the Council on Foreign Relations (1994-present), and currently Vice Chair of the Board of Governors, State University System of Florida (2013-present). Previously, Mr. Lautenbach was a Partner and Advisory Partner at Clayton, Dubilier & Rice, LLC (private equity investment, 1998-2010), as well as a Director of Sony Corporation (2006-2007). Mr. Lautenbach also had a 30-year career with IBM (technology company) during which time he served as Senior Vice President and a member of the Corporate Executive Committee (1968-1998).
Joseph Mauriello (1944)
Year of Election or Appointment: 2008
Trustee
Mr. Mauriello also serves as Trustee of other Fidelity® funds. Prior to his retirement in January 2006, Mr. Mauriello served in numerous senior management positions including Deputy Chairman and Chief Operating Officer (2004-2005), and Vice Chairman of Financial Services (2002-2004) of KPMG LLP US (professional services, 1965-2005). Mr. Mauriello currently serves as a member of the Board of Directors of XL Group plc. (global insurance and re-insurance, 2006-present) and the Independent Directors Council (IDC) Governing Council (2015-present). Previously, Mr. Mauriello served as a Director of the Hamilton Funds of the Bank of New York (2006-2007) and of Arcadia Resources Inc. (health care services and products, 2007-2012).
Robert W. Selander (1950)
Year of Election or Appointment: 2011
Trustee
Mr. Selander also serves as Trustee of other Fidelity® funds. Mr. Selander serves as a Director of The Western Union Company (global money transfer, 2014-present) and a non-executive Chairman of Health Equity, Inc. (health savings custodian, 2015-present). Previously, Mr. Selander served as a Member of the Advisory Board of certain Fidelity® funds (2011), and Executive Vice Chairman (2010), Chief Executive Officer (2009-2010), and President and Chief Executive Officer (1997-2009) of Mastercard, Inc.
Cornelia M. Small (1944)
Year of Election or Appointment: 2005
Trustee
Ms. Small also serves as Trustee of other Fidelity® funds. Ms. Small is a member of the Board of Directors (2009-present) and Chair of the Investment Committee (2010-present) of the Teagle Foundation. Ms. Small also serves on the Investment Committee of the Berkshire Taconic Community Foundation (2008-present). Previously, Ms. Small served as Chairperson (2002-2008) and a member of the Investment Committee and Chairperson (2008-2012) and a member of the Board of Trustees of Smith College. In addition, Ms. Small served as Chief Investment Officer, Director of Global Equity Investments, and a member of the Board of Directors of Scudder, Stevens & Clark and Scudder Kemper Investments.
William S. Stavropoulos (1939)
Year of Election or Appointment: 2002
Trustee
Vice Chairman of the Independent Trustees
Mr. Stavropoulos also serves as Trustee of other Fidelity® funds. Mr. Stavropoulos serves as President and Founder of the Michigan Baseball Foundation, the Great Lakes Loons (2007-present). Mr. Stavropoulos is Chairman Emeritus of the Board of Directors of The Dow Chemical Company, where he previously served in numerous senior management positions, including President, CEO (1995-2000; 2002-2004), Chairman of the Executive Committee (2000-2006), and as a member of the Board of Directors (1990-2006). Currently, Mr. Stavropoulos is Chairman of the Board of Directors of Univar Inc. (global distributor of commodity and specialty chemicals), a Director of Teradata Corporation (data warehousing and technology solutions), and a member of the Advisory Board for Metalmark Capital LLC (private equity investment, 2005-present). Mr. Stavropoulos is an operating advisor to Clayton, Dubilier & Rice, LLC (private equity investment). In addition, Mr. Stavropoulos is a member of the University of Notre Dame Advisory Council for the College of Science, a Trustee of the Rollin L. Gerstacker Foundation, and a Director of Artis-Naples in Naples, Florida. Previously, Mr. Stavropoulos served as a Director of Chemical Financial Corporation (bank holding company, 1993-2012) and Tyco International, Ltd. (multinational manufacturing and services, 2007-2012).
David M. Thomas (1949)
Year of Election or Appointment: 2008
Trustee
Mr. Thomas also serves as Trustee of other Fidelity® funds. Mr. Thomas serves as Non-Executive Chairman of the Board of Directors of Fortune Brands Home and Security (home and security products, 2011-present), as a member of the Board of Directors (2004-present) and Presiding Director (2013-present) of Interpublic Group of Companies, Inc. (marketing communication), and as a member of the Board of Trustees of the University of Florida (2013-present). Previously, Mr. Thomas served as Executive Chairman (2005-2006) and Chairman and Chief Executive Officer (2000-2005) of IMS Health, Inc. (pharmaceutical and healthcare information solutions), and a Director of Fortune Brands, Inc. (consumer products, 2000-2011).
+ The information includes the Trustee's principal occupation during the last five years and other information relating to the experience, attributes, and skills relevant to the Trustee's qualifications to serve as a Trustee, which led to the conclusion that the Trustee should serve as a Trustee for the fund.
Advisory Board Members and Officers:
Correspondence intended for an officer or Peter S. Lynch may be sent to Fidelity Investments, 245 Summer Street, Boston, Massachusetts 02210. Officers appear below in alphabetical order.
Name, Year of Birth; Principal Occupation
Peter S. Lynch (1944)
Year of Election or Appointment: 2003
Member of the Advisory Board
Mr. Lynch also serves as Member of the Advisory Board of other Fidelity® funds. Mr. Lynch is Vice Chairman and a Director of FMR (investment adviser firm) and FMR Co., Inc. (investment adviser firm). In addition, Mr. Lynch serves as a Trustee of Boston College and as the Chairman of the Inner-City Scholarship Fund. Previously, Mr. Lynch served on the Special Olympics International Board of Directors (1997-2006).
Marc R. Bryant (1966)
Year of Election or Appointment: 2015
Secretary and Chief Legal Officer (CLO)
Mr. Bryant also serves as Secretary and CLO of other funds. Mr. Bryant serves as CLO, Secretary, and Senior Vice President of Fidelity Management & Research Company (investment adviser firm, 2015-present) and FMR Co., Inc. (investment adviser firm, 2015-present); Secretary of Fidelity SelectCo, LLC (investment adviser firm, 2015-present) and Fidelity Investments Money Management, Inc. (investment adviser firm, 2015-present); and CLO of Fidelity Management & Research (Hong Kong) Limited and FMR Investment Management (UK) Limited (investment adviser firms, 2015-present) and Fidelity Management & Research (Japan) Limited (investment adviser firm, 2016-present). He is Senior Vice President and Deputy General Counsel of FMR LLC (diversified financial services company). Previously, Mr. Bryant served as Secretary and CLO of Fidelity Rutland Square Trust II (2010-2014) and Assistant Secretary of Fidelity's Fixed Income and Asset Allocation Funds (2013-2015). Prior to joining Fidelity Investments, Mr. Bryant served as a Senior Vice President and the Head of Global Retail Legal for AllianceBernstein L.P. (2006-2010), and as the General Counsel for ProFund Advisors LLC (2001-2006).
Jeffrey S. Christian (1961)
Year of Election or Appointment: 2016
Assistant Treasurer
Mr. Christian also serves as Assistant Treasurer of other funds. Mr. Christian is an employee of Fidelity Investments (2003-present).
William C. Coffey (1969)
Year of Election or Appointment: 2009
Assistant Secretary
Mr. Coffey also serves as Assistant Secretary of other funds. He is Senior Vice President and Deputy General Counsel of FMR LLC (diversified financial services company, 2010-present), and is an employee of Fidelity Investments. Previously, Mr. Coffey served as Vice President and Associate General Counsel of FMR LLC (2005-2009).
Jonathan Davis (1968)
Year of Election or Appointment: 2010
Assistant Treasurer
Mr. Davis also serves as Assistant Treasurer of other funds, and is an employee of Fidelity Investments. Previously, Mr. Davis served as Vice President and Associate General Counsel of FMR LLC (diversified financial services company, 2003-2010).
Adrien E. Deberghes (1967)
Year of Election or Appointment: 2016
Assistant Treasurer
Mr. Deberghes also serves as an officer of other funds. He serves as Executive Vice President of Fidelity Investments Money Management, Inc. (FIMM) (investment adviser firm, 2016-present) and is an employee of Fidelity Investments (2008-present). Prior to joining Fidelity Investments, Mr. Deberghes was Senior Vice President of Mutual Fund Administration at State Street Corporation (2007-2008), Senior Director of Mutual Fund Administration at Investors Bank & Trust (2005-2007), and Director of Finance for Dunkin' Brands (2000-2005). Previously, Mr. Deberghes served in other fund officer roles.
Stephanie J. Dorsey (1969)
Year of Election or Appointment: 2010
Assistant Treasurer
Ms. Dorsey also serves as an officer of other funds. She is an employee of Fidelity Investments (2008-present) and has served in other fund officer roles. Prior to joining Fidelity Investments, Ms. Dorsey served as Treasurer (2004-2008) of the JPMorgan Mutual Funds and Vice President (2004-2008) of JPMorgan Chase Bank.
Howard J. Galligan III (1966)
Year of Election or Appointment: 2014
Chief Financial Officer
Mr. Galligan also serves as Chief Financial Officer of other funds. Mr. Galligan serves as President of Fidelity Pricing and Cash Management Services (FPCMS) (2014-present) and as a Director of Strategic Advisers, Inc. (investment adviser firm, 2008-present). Previously, Mr. Galligan served as Chief Administrative Officer of Asset Management (2011-2014) and Chief Operating Officer and Senior Vice President of Investment Support for Strategic Advisers, Inc. (2003-2011).
Scott C. Goebel (1968)
Year of Election or Appointment: 2015
Vice President
Mr. Goebel serves as Vice President of other funds and is an employee of Fidelity Investments (2001-present). Previously, Mr. Goebel served as Senior Vice President of Fidelity Management & Research Company (FMR) (investment adviser firm, 2016), Secretary of Fidelity SelectCo, LLC (investment adviser firm, 2013-2015), Fidelity Investments Money Management, Inc. (FIMM) (investment adviser firm, 2010-2015), and Fidelity Research and Analysis Company (FRAC) (investment adviser firm, 2010-2015); General Counsel, Secretary, and Senior Vice President of FMR (investment adviser firm, 2008-2015) and FMR Co., Inc. (investment adviser firm, 2008-2015); Assistant Secretary of Fidelity Management & Research (Japan) Limited (investment adviser firm, 2008-2015) and Fidelity Management & Research (U.K.) Inc. (investment adviser firm, 2008-2015); Chief Legal Officer (CLO) of Fidelity Management & Research (Hong Kong) Limited (investment adviser firm, 2008-2015); Secretary and CLO of certain Fidelity® funds (2008-2015); Assistant Secretary of FIMM (2008-2010), FRAC (2008-2010), and certain funds (2007-2008); and as Vice President and Secretary of Fidelity Distributors Corporation (FDC) (2005-2007).
Brian B. Hogan (1964)
Year of Election or Appointment: 2009
Vice President
Mr. Hogan also serves as Trustee or Vice President of other funds. Mr. Hogan serves as a Director of FMR Investment Management (UK) Limited (investment adviser firm, 2015-present) and Fidelity SelectCo, LLC (investment adviser firm, 2014-present) and President of the Equity Division of FMR (investment adviser firm, 2009-present). Previously, Mr. Hogan served as Senior Vice President, Equity Research of FMR (2006-2009) and as a portfolio manager. Mr. Brian B. Hogan is not related to Mr. Colm A. Hogan.
Colm A. Hogan (1973)
Year of Election or Appointment: 2016
Deputy Treasurer
Mr. Hogan also serves as an officer of other funds. Mr. Hogan is an employee of Fidelity Investments (2005-present). Mr. Colm A. Hogan is not related to Mr. Brian B. Hogan.
Chris Maher (1972)
Year of Election or Appointment: 2013
Assistant Treasurer
Mr. Maher serves as Assistant Treasurer of other funds. Mr. Maher is Vice President of Valuation Oversight and is an employee of Fidelity Investments. Previously, Mr. Maher served as Vice President of Asset Management Compliance (2013), Vice President of the Program Management Group of FMR (investment adviser firm, 2010-2013), and Vice President of Valuation Oversight (2008-2010).
John F. Papandrea (1972)
Year of Election or Appointment: 2016
Anti-Money Laundering (AML) Officer
Mr. Papandrea also serves as AML Officer of other funds. Mr. Papandrea is Vice President of FMR LLC (diversified financial services company, 2008-present) and is an employee of Fidelity Investments (2005-present).
Melissa M. Reilly (1971)
Year of Election or Appointment: 2014
Vice President of certain Equity Funds
Ms. Reilly also serves as Vice President of other funds. Ms. Reilly is an employee of Fidelity Investments (2004-present).
Kenneth B. Robins (1969)
Year of Election or Appointment: 2016
Chief Compliance Officer
Mr. Robins also serves as an officer of other funds. Mr. Robins serves as Compliance Officer of Fidelity Management & Research Company and FMR Co., Inc. (investment adviser firms, 2016-present) and is an employee of Fidelity Investments (2004-present). Previously, Mr. Robins served as Executive Vice President of Fidelity Investments Money Management, Inc. (investment adviser firm, 2013-2016) and served in other fund officer roles.
Stacie M. Smith (1974)
Year of Election or Appointment: 2016
President and Treasurer
Ms. Smith also serves as an officer of other funds. She is an employee of Fidelity Investments (2009-present) and has served in other fund officer roles. Prior to joining Fidelity Investments, Ms. Smith served as Senior Audit Manager of Ernst & Young LLP (accounting firm, 1996-2009). Previously, Ms. Smith served as Deputy Treasurer of certain Fidelity® funds (2013-2016).
Marc L. Spector (1972)
Year of Election or Appointment: 2016
Assistant Treasurer
Mr. Spector also serves as an officer of other funds. Mr. Spector is an employee of Fidelity Investments (2016-present). Prior to joining Fidelity Investments, Mr. Spector served as Director at the Siegfried Group (accounting firm, 2013-2016), and prior to Siegfried Group as audit senior manager at Deloitte & Touche (accounting firm, 2005-2013).
Renee Stagnone (1975)
Year of Election or Appointment: 2016
Assistant Treasurer
Ms. Stagnone also serves as an officer of other funds. Ms. Stagnone is an employee of Fidelity Investments (1997-present). Previously, Ms. Stagnone served as Deputy Treasurer of certain Fidelity® funds (2013-2016).
Shareholder Expense Example
As a shareholder of the Fund, you incur two types of costs: (1) transaction costs and (2) ongoing costs, including management fees and other Fund expenses. This Example is intended to help you understand your ongoing costs (in dollars) of investing in the Fund and to compare these costs with the ongoing costs of investing in other mutual funds.
The Example is based on an investment of $1,000 invested at the beginning of the period and held for the entire period (June 1, 2016 to November 30, 2016).
Actual Expenses
The first line of the accompanying table for each class of the Fund provides information about actual account values and actual expenses. You may use the information in this line, together with the amount you invested, to estimate the expenses that you paid over the period. Simply divide your account value by $1,000.00 (for example, an $8,600 account value divided by $1,000.00 = 8.6), then multiply the result by the number in the first line for a class of the Fund under the heading entitled "Expenses Paid During Period" to estimate the expenses you paid on your account during this period. In addition, the Fund, as a shareholder in the underlying Fidelity Central Funds, will indirectly bear its pro-rata share of the fees and expenses incurred by the underlying Fidelity Central Funds. These fees and expenses are not included in the Fund's annualized expense ratio used to calculate the expense estimate in the table below.
Hypothetical Example for Comparison Purposes
The second line of the accompanying table for each class of the Fund provides information about hypothetical account values and hypothetical expenses based on a Class' actual expense ratio and an assumed rate of return of 5% per year before expenses, which is not the Class' actual return. The hypothetical account values and expenses may not be used to estimate the actual ending account balance or expenses you paid for the period. You may use this information to compare the ongoing costs of investing in the Fund and other funds. To do so, compare this 5% hypothetical example with the 5% hypothetical examples that appear in the shareholder reports of the other funds. In addition, the Fund, as a shareholder in the underlying Fidelity Central Funds, will indirectly bear its pro-rata share of the fees and expenses incurred by the underlying Fidelity Central Funds. These fees and expenses are not included in the Fund's annualized expense ratio used to calculate the expense estimate in the table below.
Please note that the expenses shown in the table are meant to highlight your ongoing costs only and do not reflect any transaction costs. Therefore, the second line of the table is useful in comparing ongoing costs only, and will not help you determine the relative total costs of owning different funds.
| | Annualized Expense Ratio-A | Beginning
Account Value
June 1, 2016 | Ending
Account Value
November 30, 2016 | Expenses Paid
During Period-B
June 1, 2016
to November 30, 2016 |
| Series Growth Company | .75% | | | |
| Actual | | $1,000.00 | $1,071.50 | $3.88 |
| Hypothetical-C | | $1,000.00 | $1,021.25 | $3.79 |
| Class F | .59% | | | |
| Actual | | $1,000.00 | $1,073.10 | $3.06 |
| Hypothetical-C | | $1,000.00 | $1,022.05 | $2.98 |
A Annualized expense ratio reflects expenses net of applicable fee waivers.
B Expenses are equal to each Class' annualized expense ratio, multiplied by the average account value over the period, multiplied by 183/366 (to reflect the one-half year period).
C 5% return per year before expenses
Distributions (Unaudited)
The Board of Trustees Fidelity Series Growth Company Fund voted to pay to shareholders of record at the opening of business on record date, the following distributions per share derived from capital gains realized from sales of portfolio securities, and dividends derived from net investment income:
| | Pay Date | Record Date | Dividends | Capital Gains |
| Fidelity Series Growth Company Fund | | | | |
| Class F | 12/19/16 | 12/16/16 | $0.036 | $0.311 |
| Retail | 12/19/16 | 12/16/16 | $0.015 | $0.311 |
|
The fund hereby designates as a capital gain dividend with respect to the taxable year ended November 30 2016, $219,746,130, or, if subsequently determined to be different, the net capital gain of such year.
Fidelity Series Growth Company Fund and Class F designates 100% of the dividends distributed during the fiscal year as qualifying for the dividends–received deduction for corporate shareholders.
Fidelity Series Growth Company Fund and Class F designates 100% of the dividends distributed during the fiscal year as amounts which may be taken into account as a dividend for purposes of the maximum rate under section 1(h)(11) of the Internal Revenue Code.
The fund will notify shareholders in January 2017 of amounts for use in preparing 2016 income tax returns.
Board Approval of Investment Advisory Contracts and Management Fees
Fidelity Series Growth Company Fund
Each year, the Board of Trustees, including the Independent Trustees (together, the Board), votes on the renewal of the management contract with Fidelity Management & Research Company (FMR) and the sub-advisory agreements (together, the Advisory Contracts) for the fund. The Board, assisted by the advice of fund counsel and Independent Trustees' counsel, requests and considers a broad range of information relevant to the renewal of the Advisory Contracts throughout the year.
The Board meets regularly and, at each of its meetings, covers an extensive agenda of topics and materials and considers factors that are relevant to its annual consideration of the renewal of the fund's Advisory Contracts, including the services and support provided to the fund and its shareholders. The Board has established various standing committees (Committees), each composed of and chaired by Independent Trustees with varying backgrounds, to which the Board has assigned specific subject matter responsibilities in order to enhance effective decision-making by the Board. The Board, acting directly and through its Committees, requests and receives information concerning the annual consideration of the renewal of the fund's Advisory Contracts. The Board also meets as needed to consider matters specifically related to the Board's annual consideration of the renewal of the Advisory Contracts. Members of the Board may also meet with trustees of other Fidelity funds through ad hoc joint committees to discuss certain matters relevant to all of the Fidelity funds.
At its July 2016 meeting, the Board unanimously determined to renew the fund's Advisory Contracts. In reaching its determination, the Board considered all factors it believed relevant, including (i) the nature, extent, and quality of the services to be provided to the fund and its shareholders (including the investment performance of the fund); (ii) the competitiveness of the fund's management fee and total expense ratio relative to peer funds; (iii) the total costs of the services to be provided by and the profits to be realized by Fidelity from its relationships with the fund; and (iv) the extent to which, if any, economies of scale exist and would be realized as the fund grows, and whether any economies of scale are appropriately shared with fund shareholders.
In considering whether to renew the Advisory Contracts for the fund, the Board reached a determination, with the assistance of fund counsel and Independent Trustees' counsel and through the exercise of its business judgment, that the renewal of the Advisory Contracts was in the best interests of the fund and its shareholders and that the compensation payable under the Advisory Contracts was fair and reasonable. The Board's decision to renew the Advisory Contracts was not based on any single factor, but rather was based on a comprehensive consideration of all the information provided to the Board at its meetings throughout the year. The Board, in reaching its determination to renew the Advisory Contracts, was aware that shareholders of the fund have a broad range of investment choices available to them, including a wide choice among funds offered by Fidelity's competitors, and that the fund's shareholders, who have the opportunity to review and weigh the disclosure provided by the fund in its prospectus and other public disclosures, have chosen to invest in this fund, which is part of the Fidelity family of funds.
Nature, Extent, and Quality of Services Provided. The Board considered Fidelity's staffing as it relates to the fund, including the backgrounds of investment personnel of Fidelity, and also considered the fund's investment objective, strategies, and related investment philosophy. The Independent Trustees also had discussions with senior management of Fidelity's investment operations and investment groups. The Board considered the structure of the investment personnel compensation program and whether this structure provides appropriate incentives to act in the best interests of the fund. Additionally, the Board considered the portfolio managers' investments, if any, in the funds that they manage.
Resources Dedicated to Investment Management and Support Services. The Board and the Fund Oversight and Research Committees reviewed the general qualifications and capabilities of Fidelity's investment staff, including its size, education, experience, and resources, as well as Fidelity's approach to recruiting, training, managing, and compensating investment personnel. The Board noted that Fidelity has continued to increase the resources devoted to non-U.S. offices, including expansion of Fidelity's global investment organization. The Board also noted that Fidelity's analysts have extensive resources, tools and capabilities that allow them to conduct sophisticated quantitative and fundamental analysis, as well as credit analysis of issuers, counterparties and guarantors. Further, the Board considered that Fidelity's investment professionals have sufficient access to global information and data so as to provide competitive investment results over time, and that those professionals also have access to sophisticated tools that permit them to assess portfolio construction and risk and performance attribution characteristics continuously, as well as to transmit new information and research conclusions rapidly around the world. Additionally, in its deliberations, the Board considered Fidelity's trading, risk management, compliance, and technology and operations capabilities and resources, which are integral parts of the investment management process.
Shareholder and Administrative Services. The Board considered (i) the nature, extent, quality, and cost of advisory, administrative, and shareholder services performed by FMR, the sub-advisers (together with FMR, the Investment Advisers), and their affiliates under the Advisory Contracts and under separate agreements covering transfer agency, pricing and bookkeeping, and securities lending services for the fund; (ii) the nature and extent of the supervision of third party service providers, principally custodians, subcustodians, and pricing vendors; and (iii) the resources devoted to, and the record of compliance with, the fund's compliance policies and procedures. The Board also reviewed the allocation of fund brokerage, including allocations to brokers affiliated with the Investment Advisers, the use of brokerage commissions to pay fund expenses, and the use of "soft" commission dollars to pay for research services.
The Board noted that the growth of fund assets over time across the complex allows Fidelity to reinvest in the development of services designed to enhance the value or convenience of the Fidelity funds as investment vehicles. These services include 24-hour access to account information and market information through telephone representatives and over the Internet, investor education materials and asset allocation tools, and the expanded availability of Fidelity Investor Centers.
In 2014, the Board formed an ad hoc Committee on Transfer Agency Fees to review the variety of transfer agency fee structures throughout the industry and Fidelity's competitive positioning with respect to industry participants.
Investment in a Large Fund Family. The Board considered the benefits to shareholders of investing in a Fidelity fund, including the benefits of investing in a fund that is part of a large family of funds offering a variety of investment disciplines and providing a large variety of mutual fund investor services. The Board noted that Fidelity had taken, or had made recommendations that resulted in the Fidelity funds taking, a number of actions over the previous year that benefited particular funds, including: (i) continuing to dedicate additional resources to investment research and to the support of the senior management team that oversees asset management; (ii) continuing efforts to enhance Fidelity's global research capabilities; (iii) launching new funds and making other enhancements to meet client needs; (iv) broadening eligibility requirements for certain lower-priced share classes of, and streamlining the fee structure for, certain existing equity index funds; (v) lowering expense caps for certain existing funds and classes to reduce expenses paid by shareholders; (vi) eliminating redemption fees for certain variable insurance product funds and classes; (vii) continuing to launch dedicated lower cost underlying funds to meet portfolio construction needs related to expanding underlying fund options for Fidelity funds of funds, specifically for the Freedom Fund product lines; (viii) launching a lower cost share class for use by the Freedom Index Fund product line; (ix) rationalizing product lines and gaining increased efficiencies through fund mergers and share class consolidations; (x) continuing to develop, acquire and implement systems and technology to improve services to the funds and shareholders, strengthen information security, and increase efficiency; (xi) implementing investment enhancements to further strengthen Fidelity's target date product line to increase investors' probability of success in achieving their goals; (xii) accelerating the conversion of all remaining Class B shares to Class A shares, which have a lower expense structure; and (xiii) implementing changes to Fidelity's money market fund product line in response to recent regulatory reforms.
Investment Performance. The Board considered whether the fund has operated in accordance with its investment objective, as well as its record of compliance with its investment restrictions and its performance history.
The Board took into account discussions with representatives of the Investment Advisers about fund investment performance that occur at Board meetings throughout the year. In this regard the Board noted that as part of regularly scheduled fund reviews and other reports to the Board on fund performance, the Board considers annualized return information for the fund, for different time periods, measured against a securities market index ("benchmark index") and a peer group of funds with similar objectives ("peer group"), if any. In its evaluation of fund investment performance, the Board gave particular attention to information indicating changes in performance of certain Fidelity funds for specific time periods and discussed with the Investment Advisers the reasons for any overperformance or underperformance.
In addition to reviewing absolute and relative fund performance, the Independent Trustees periodically consider the appropriateness of fund performance metrics in evaluating the results achieved. In general, the Independent Trustees believe that fund performance should be evaluated based on net performance (after fees and expenses) of both the highest performing and lowest performing fund share classes, where applicable, compared to appropriate benchmark indices, over appropriate time periods that may include full market cycles, and compared to peer groups, as applicable, over the same periods, taking into account relevant factors including the following: general market conditions; issuer-specific information; and fund cash flows and other factors.
The Independent Trustees recognize that shareholders evaluate performance on a net basis over their own holding periods, for which one-, three-, and five-year periods are often used as a proxy. For this reason, the performance information reviewed by the Board also included net cumulative calendar year total return information for the fund and an appropriate benchmark index and peer group for the most recent one-year period, as shown below. Returns are shown compared to the 25th percentile (top of box, 75% beaten) and 75th percentile (bottom of box, 25% beaten) of the peer universe.
Fidelity Series Growth Company Fund
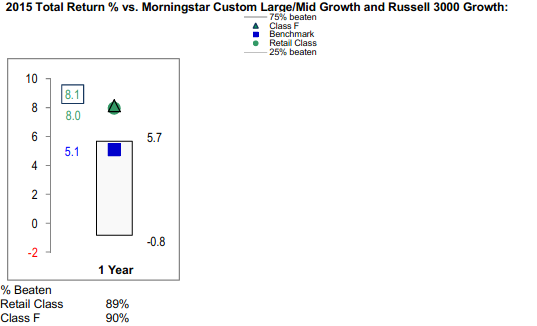
The Board also considered that the fund's management fee is subject to upward or downward adjustment depending upon whether, and to what extent, the fund's investment performance for the performance period exceeds, or is exceeded by, a securities index, thus leading to a performance adjustment for the same period. The Board noted that the performance adjustment provides FMR with a strong economic incentive to seek to achieve superior performance for the fund's shareholders and helps to more closely align the interests of FMR and the shareholders of the fund.
Based on its review, the Board concluded that the nature, extent, and quality of services provided to the fund under the Advisory Contracts should continue to benefit the shareholders of the fund.
Competitiveness of Management Fee and Total Expense Ratio. The Board considered the fund's management fee and total expense ratio compared to "mapped groups" of competitive funds and classes created for the purpose of facilitating the Trustees' competitive analysis of management fees and total expenses. Fidelity creates "mapped groups" by combining similar Broadridge investment objective categories that have comparable investment mandates. Combining Broadridge investment objective categories aids the Board's management fee and total expense ratio comparisons by broadening the competitive group used for comparison.
Management Fee. The Board considered two proprietary management fee comparisons for the 12-month periods shown in basis points (BP) in the chart below. The group of Broadridge funds used by the Board for management fee comparisons is referred to below as the "Total Mapped Group." The Total Mapped Group comparison focuses on a fund's standing in terms of gross management fees before expense reimbursements or caps, and without giving effect to the fund's performance adjustment, relative to the total universe of funds with comparable investment mandates, regardless of whether their management fee structures also are comparable. Funds with comparable investment mandates offer exposure to similar types of securities. Funds with comparable management fee structures have similar management fee contractual arrangements (
e.g., flat rate charged for advisory services, all-inclusive fee rate,
etc.). "TMG %" represents the percentage of funds in the Total Mapped Group that had management fees that were lower than the fund's. For example, a hypothetical TMG % of 20% would mean that 80% of the funds in the Total Mapped Group had higher, and 20% had lower, management fees than the fund. The fund's actual TMG %s and the number of funds in the Total Mapped Group are in the chart below. The "Asset-Size Peer Group" (ASPG) comparison focuses on a fund's standing relative to a subset of non-Fidelity funds within the Total Mapped Group that are similar in size and management fee structure without taking into account performance adjustments, if any. For example, if a fund is in the first quartile of the ASPG, the fund's management fee ranks in the least expensive or lowest 25% of funds in the ASPG. The ASPG represents at least 15% of the funds in the Total Mapped Group with comparable asset size and management fee structures, subject to a minimum of 50 funds (or all funds in the Total Mapped Group if fewer than 50). Additional information, such as the ASPG quartile in which the fund's management fee rate ranked and the impact of the fund's performance adjustment, is also included in the chart and considered by the Board.
Fidelity Series Growth Company Fund

The Board noted that the fund's management fee rate ranked below the median of its Total Mapped Group and below the median of its ASPG for 2015. The Board also noted the effect of the fund's performance adjustment, if any, on the fund's management fee ranking.
The Board noted that, in 2014, the ad hoc Committee on Group Fee was formed by it and the boards of other Fidelity funds to conduct an in-depth review of the "group fee" component of the management fee of funds with such management fee structures. The Committee's focus included the mechanics of the group fee, the competitive landscape of group fee structures, Fidelity funds with no group fee component and investment products not included in group fee assets. The Board also considered that, for funds subject to the group fee, FMR agreed to voluntarily waive fees over a specified period of time in amounts designed to account for assets converted from certain funds to certain collective investment trusts.
The Board also noted that, in 2013, the ad hoc Committee on Management Fees was formed to conduct an in-depth review of the management fee rates of Fidelity's active equity mutual funds. The Committee focused on the following areas: (i) standard fee structures; (ii) research consumption and trading evolution; (iii) management fee competitiveness/profitability by category; and (iv) factors that drive institutional pricing.
Based on its review, the Board concluded that the fund's management fee is fair and reasonable in light of the services that the fund receives and the other factors considered.
Total Expense Ratio. In its review of each class's total expense ratio, the Board considered the fund's management fee rate as well as other fund or class expenses, as applicable, such as transfer agent fees, pricing and bookkeeping fees, and custodial, legal, and audit fees. The Board noted the impact of the fund's performance adjustment. The Board also noted that Fidelity may agree to waive fees and expenses from time to time, and the extent to which, if any, it has done so for the fund. As part of its review, the Board also considered the current and historical total expense ratios of each class of the fund compared to competitive fund median expenses. Each class of the fund is compared to those funds and classes in the Total Mapped Group (used by the Board for management fee comparisons) that have a similar sales load structure.
The Board noted that the total expense ratio of each class ranked below the competitive median for 2015.
Fees Charged to Other Fidelity Clients. The Board also considered Fidelity fee structures and other information with respect to clients of Fidelity, such as other funds advised or subadvised by Fidelity, pension plan clients, and other institutional clients with similar mandates. The Board noted the findings of the 2013 ad hoc joint committee (created with the board of other Fidelity funds), which reviewed and compared Fidelity's institutional investment advisory business with its business of providing services to the Fidelity funds, including the differences in services provided, fees charged, and costs incurred, as well as competition in their respective marketplaces.
Based on its review of total expense ratios and fees charged to other Fidelity clients, the Board concluded that the total expense ratio of each class of the fund was reasonable in light of the services that the fund and its shareholders receive and the other factors considered.
Costs of the Services and Profitability. The Board considered the revenues earned and the expenses incurred by Fidelity in conducting the business of developing, marketing, distributing, managing, administering and servicing the fund and servicing the fund's shareholders. The Board also considered the level of Fidelity's profits in respect of all the Fidelity funds.
On an annual basis, Fidelity presents to the Board information about the profitability of its relationship with the fund. Fidelity calculates profitability information for each fund, as well as aggregate profitability information for groups of Fidelity funds and all Fidelity funds, using a series of detailed revenue and cost allocation methodologies which originate with the books and records of Fidelity on which Fidelity's audited financial statements are based. The Audit Committee of the Board reviews any significant changes from the prior year's methodologies.
PricewaterhouseCoopers LLP (PwC), independent registered public accounting firm and auditor to Fidelity and certain Fidelity funds, has been engaged annually by the Board as part of the Board's assessment of Fidelity's profitability analysis. PwC's engagement includes the review and assessment of the methodologies used by Fidelity in determining the revenues and expenses attributable to Fidelity's mutual fund business, and completion of agreed-upon procedures in respect of the mathematical accuracy of the fund profitability information and its conformity to established allocation methodologies. After considering PwC's reports issued under the engagement and information provided by Fidelity, the Board concluded that while other allocation methods may also be reasonable, Fidelity's profitability methodologies are reasonable in all material respects.
The Board also reviewed Fidelity's non-fund businesses and fall-out benefits related to the mutual fund business as well as cases where Fidelity's affiliates may benefit from or be related to the fund's business.
The Board considered the costs of the services provided by and the profits realized by Fidelity in connection with the operation of the fund and was satisfied that the profitability was not excessive.
Economies of Scale. The Board considered whether there have been economies of scale in respect of the management of the Fidelity funds, whether the Fidelity funds (including the fund) have appropriately benefited from any such economies of scale, and whether there is potential for realization of any further economies of scale. The Board considered the extent to which the fund will benefit from economies of scale as assets grow through increased services to the fund, through waivers or reimbursements, or through fee or expense ratio reductions. The Board also noted that in 2013, it and the boards of other Fidelity funds created an ad hoc committee (the Economies of Scale Committee) to analyze whether Fidelity attains economies of scale in respect of the management and servicing of the Fidelity funds, whether the Fidelity funds have appropriately benefited from such economies of scale, and whether there is potential for realization of any further economies of scale.
The Board recognized that the fund's management contract incorporates a "group fee" structure, which provides for lower group fee rates as total group assets increase, and for higher group fee rates as total group assets decrease (with "group assets" defined to include fund assets under FMR's management plus the assets of sector funds previously under FMR's management). FMR calculates the group fee rates based on a tiered asset "breakpoint" schedule that varies based on asset class. The Board considered that the group fee is designed to deliver the benefits of economies of scale to fund shareholders when total Fidelity fund assets increase, even if assets of any particular fund are unchanged or have declined, because some portion of Fidelity's costs are attributable to services provided to all Fidelity funds, and all funds benefit if those costs can be allocated among more assets. The Board also considered that although the fund is offered only to other Fidelity funds, it continues to incur investment management expenses. The Board further noted that the fund may continue to realize benefits from the group fee structure, even though assets may not be expected to grow significantly at the fund level. The Board concluded that, given the group fee structure, fund shareholders will benefit from lower management fees as group assets increase at the fund complex level, regardless of whether Fidelity achieves any such economies of scale.
The Board concluded, taking into account the analysis of the Economies of Scale Committee, that economies of scale, if any, are being appropriately shared between fund shareholders and Fidelity.
Approval of New Advisory Contracts. The Board also voted to approve a new management contract and new sub-advisory agreements for the fund (New Advisory Contracts) that will take effect if the shareholders of certain other Fidelity funds that invest in the fund (referred to herein as Freedom Funds) approve new management contracts for the Freedom Funds. Under the New Advisory Contracts the fund will no longer pay a management fee to FMR. The new sub-advisory agreements provide that FMR or its affiliates will pay the fees based on a portion of the management fees received by an affiliate of FMR under its management contracts with the Freedom Funds. The Board noted the New Advisory Contracts are expected to result in an overall decrease in the fees and expenses payable by the fund. The Board considered that the approval of the New Advisory Contracts will not result in any changes to (i) the investment process or strategies employed in the management of the fund's assets; (ii) the nature, extent and quality of services provided to the fund; or (iii) the day-to-day management of the fund and the personnel primarily responsible for such management. The Board considered that the new management contract does not have a performance fee adjustment, but noted that FMR will no longer charge a management fee for the fund. The Board also considered that the New Advisory Contracts provide that FMR or an affiliate undertakes to pay all operating expenses of the fund, except transfer agent fees, 12b-1 fees, Independent Trustee expenses, custodian fees and expenses, expenses related to proxy solicitations, interest, taxes, brokerage expenses, and extraordinary expenses (such as litigation expenses).
Additional Information Requested by the Board. In order to develop fully the factual basis for consideration of the Fidelity funds' Advisory Contracts, the Board requested and received additional information on certain topics, including: (i) fund performance trends and Fidelity's long-term strategies for certain funds; (ii) the various share classes employed by Fidelity and the attributes of each class, together with similar information on the distribution and servicing payments made by Fidelity or the funds to third-party participants in the distribution channels; (iii) fund profitability, and fund performance in relation to fund profitability; (iv) the methodology with respect to evaluating competitive fund data and peer group classifications and fee comparisons; (v) annual fund profitability margins; (vi) the realization of fall-out benefits in and attribution of fall-out benefits to certain Fidelity business units; (vii) the appropriateness of certain funds' benchmarks; (viii) the rationalization for certain share classes and expenses; (ix) sub-advisory fee rates for comparable investment mandates; (x) product strategy for certain underperforming funds; and (xi) Fidelity's resources and strategy for cybersecurity.
Based on its evaluation of all of the conclusions noted above, and after considering all factors it believed relevant, the Board concluded that the advisory fee structures are fair and reasonable, and that the fund's Advisory Contracts should be renewed.
Corporate Headquarters
245 Summer St.
Boston, MA 02210
www.fidelity.com
XS7-ANN-0117
1.968007.103
Item 2.
Code of Ethics
As of the end of the period, November 30, 2016, Fidelity Mt. Vernon Street Trust (the trust) has adopted a code of ethics, as defined in Item 2 of Form N-CSR, that applies to its President and Treasurer and its Chief Financial Officer. A copy of the code of ethics is filed as an exhibit to this Form N-CSR.
Item 3.
Audit Committee Financial Expert
The Board of Trustees of the trust has determined that Joseph Mauriello is an audit committee financial expert, as defined in Item 3 of Form N-CSR. Mr. Mauriello is independent for purposes of Item 3 of Form N-CSR.
Item 4.
Principal Accountant Fees and Services
Fees and Services
The following table presents fees billed by Deloitte & Touche LLP, the member firms of Deloitte Touche Tohmatsu, and their respective affiliates (collectively, “Deloitte Entities”) in each of the last two fiscal years for services rendered to Fidelity Growth Company Fund and Fidelity Series Growth Company Fund (the “Funds”):
Services Billed by Deloitte Entities
November 30, 2016 FeesA
| | | | |
| Audit Fees | Audit-Related Fees | Tax Fees | All Other Fees |
Fidelity Growth Company Fund | $160,000 | $- | $6,200 | $3,700 |
Fidelity Series Growth Company Fund | $82,000 | $- | $6,500 | $1,700 |
| | | | |
| Audit Fees | Audit-Related Fees | Tax Fees | All Other Fees |
Fidelity Growth Company Fund | $101,000 | $- | $6,000 | $8,500 |
Fidelity Series Growth Company Fund | $46,000 | $- | $5,800 | $2,900 |
A Amounts may reflect rounding.
The following table presents fees billed by PricewaterhouseCoopers LLP (“PwC”) in each of the last two fiscal years for services rendered to Fidelity Growth Strategies Fund, and Fidelity New Millennium Fund (the “Funds”):
Services Billed by PwC
November 30, 2016 FeesA
| | | | |
| Audit Fees | Audit-Related Fees | Tax Fees | All Other Fees |
Fidelity Growth Strategies Fund | $54,000 | $- | $4,100 | $2,400 |
Fidelity New Millennium Fund | $74,000 | $- | $4,300 | $2,900 |
| | | | |
| Audit Fees | Audit-Related Fees | Tax Fees | All Other Fees |
Fidelity Growth Strategies Fund | $53,000 | $- | $3,300 | $2,700 |
Fidelity New Millennium Fund | $60,000 | $- | $17,300 | $3,100 |
A Amounts may reflect rounding.
The following table presents fees billed by PwC and Deloitte Entities that were required to be approved by the Audit Committee for services that relate directly to the operations and financial reporting of the Funds and that are rendered on behalf of Fidelity Management & Research Company (“FMR”) and entities controlling, controlled by, or under common control with FMR (not including any sub-adviser whose role is primarily portfolio management and is subcontracted with or overseen by another investment adviser) that provide ongoing services to the Funds (“Fund Service Providers”):
Services Billed by Deloitte Entities
| | |
| November 30, 2016A | November 30, 2015A |
Audit-Related Fees | $35,000 | $- |
Tax Fees | $- | $10,000 |
All Other Fees | $- | $10,000 |
A Amounts may reflect rounding.
Services Billed by PwC
| | |
| November 30, 2016A | November 30, 2015A |
Audit-Related Fees | $5,315,000 | $5,890,000 |
Tax Fees | $10,000 | $- |
All Other Fees | $- | $- |
A Amounts may reflect rounding.
“Audit-Related Fees” represent fees billed for assurance and related services that are reasonably related to the performance of the fund audit or the review of the fund's financial statements and that are not reported under Audit Fees.
“Tax Fees” represent fees billed for tax compliance, tax advice or tax planning that relate directly to the operations and financial reporting of the fund.
“All Other Fees” represent fees billed for services provided to the fund or Fund Service Provider, a significant portion of which are assurance related, that relate directly to the operations and financial reporting of the fund, excluding those services that are reported under Audit Fees, Audit-Related Fees or Tax Fees.
Assurance services must be performed by an independent public accountant.
* * *
The aggregate non-audit fees billed by PwC and Deloitte Entities for services rendered to the Funds, FMR (not including any sub-adviser whose role is primarily portfolio management and is subcontracted with or overseen by another investment adviser), and any Fund Service Provider for each of the last two fiscal years of the Funds are as follows:
| | |
Billed By | November 30, 2016 A | November 30, 2015 A |
Deloitte Entities | $285,000 | $155,000 |
PwC | $6,615,000 | $7,075,000 |
A Amounts may reflect rounding.
The trust's Audit Committee has considered non-audit services that were not pre-approved that were provided by PwC and Deloitte Entities to Fund Service Providers to be compatible with maintaining the independence of PwC and Deloitte Entities in their audits of the Funds, taking into account representations from PwC and Deloitte Entities, in accordance with Public Company Accounting Oversight Board rules, regarding their independence from the Funds and their related entities and FMR’s review of the appropriateness and permissibility under applicable law of such non-audit services prior to their provision to the Fund Service Providers.
Audit Committee Pre-Approval Policies and Procedures
The trust’s Audit Committee must pre-approve all audit and non-audit services provided by a fund’s independent registered public accounting firm relating to the operations or financial reporting of the fund. Prior to the commencement of any audit or non-audit services to a fund, the Audit Committee reviews the services to determine whether they are appropriate and permissible under applicable law.
The Audit Committee has adopted policies and procedures to, among other purposes, provide a framework for the Committee’s consideration of non-audit services by the audit firms that audit the Fidelity funds. The policies and procedures require that any non-audit service provided by a fund audit firm to a Fidelity fund and any non-audit service provided by a fund auditor to a Fund Service Provider that relates directly to the operations and financial reporting of a Fidelity fund (“Covered Service”) are subject to approval by the Audit Committee before such service is provided.
All Covered Services must be approved in advance of provision of the service either: (i) by formal resolution of the Audit Committee, or (ii) by oral or written approval of the service by the Chair of the Audit Committee (or if the Chair is unavailable, such other member of the Audit Committee as may be designated by the Chair to act in the Chair’s absence). The approval contemplated by (ii) above is permitted where the Treasurer determines that action on such an engagement is necessary before the next meeting of the Audit Committee.
Non-audit services provided by a fund audit firm to a Fund Service Provider that do not relate directly to the operations and financial reporting of a Fidelity fund are reported to the Audit Committee on a periodic basis.
Non-Audit Services Approved Pursuant to Rule 2-01(c)(7)(i)(C) and (ii) of Regulation S-X (“De Minimis Exception”)
There were no non-audit services approved or required to be approved by the Audit Committee pursuant to the De Minimis Exception during the Funds’ last two fiscal years relating to services provided to (i) the Funds or (ii) any Fund Service Provider that relate directly to the operations and financial reporting of the Funds.
Item 5.
Audit Committee of Listed Registrants
Not applicable.
Item 6.
Investments
(a)
Not applicable.
(b)
Not applicable
Item 7.
Disclosure of Proxy Voting Policies and Procedures for Closed-End Management Investment Companies
Not applicable.
Item 8.
Portfolio Managers of Closed-End Management Investment Companies
Not applicable.
Item 9.
Purchase of Equity Securities by Closed-End Management Investment Company and Affiliated Purchasers
Not applicable.
Item 10.
Submission of Matters to a Vote of Security Holders
There were no material changes to the procedures by which shareholders may recommend nominees to the trust’s Board of Trustees.
Item 11.
Controls and Procedures
(a)(i) The President and Treasurer and the Chief Financial Officer have concluded that the trust’s disclosure controls and procedures (as defined in Rule 30a-3(c) under the Investment Company Act) provide reasonable assurances that material information relating to the trust is made known to them by the appropriate persons, based on their evaluation of these controls and procedures as of a date within 90 days of the filing date of this report.
(a)(ii) There was no change in the trust’s internal control over financial reporting (as defined in Rule 30a-3(d) under the Investment Company Act) that occurred during the second fiscal quarter of the period covered by this report that has materially affected, or is reasonably likely to materially affect, the trust’s internal control over financial reporting.
Item 12.
Exhibits
| | |
(a) | (1) | Code of Ethics pursuant to Item 2 of Form N-CSR is filed and attached hereto as EX-99.CODE ETH. |
(a) | (2) | Certification pursuant to Rule 30a-2(a) under the Investment Company Act of 1940 (17 CFR 270.30a-2(a)) is filed and attached hereto as Exhibit 99.CERT. |
(a) | (3) | Not applicable. |
(b) | | Certification pursuant to Rule 30a-2(b) under the Investment Company Act of 1940 (17 CFR 270.30a-2(b)) is furnished and attached hereto as Exhibit 99.906CERT. |
SIGNATURES
Pursuant to the requirements of the Securities Exchange Act of 1934 and the Investment Company Act of 1940, the registrant has duly caused this report to be signed on its behalf by the undersigned, thereunto duly authorized.
Fidelity Mt. Vernon Street Trust
| |
By: | /s/Stacie M. Smith |
| Stacie M. Smith |
| President and Treasurer |
| |
Date: | January 25, 2017 |
Pursuant to the requirements of the Securities Exchange Act of 1934 and the Investment Company Act of 1940, this report has been signed below by the following persons on behalf of the registrant and in the capacities and on the dates indicated.
| |
By: | /s/ Stacie M. Smith |
| Stacie M. Smith |
| President and Treasurer |
| |
Date: | January 25, 2017 |
| |
By: | /s/Howard J. Galligan III |
| Howard J. Galligan III |
| Chief Financial Officer |
| |
Date: | January 25, 2017 |