UNITED STATES
SECURITIES AND EXCHANGE COMMISSION
Washington, D.C. 20549
FORM N-CSR
CERTIFIED SHAREHOLDER REPORT OF REGISTERED
MANAGEMENT INVESTMENT COMPANIES
Investment Company Act file number 811-03587
Fidelity Financial Trust
(Exact name of registrant as specified in charter)
245 Summer St., Boston, MA 02210
(Address of principal executive offices) (Zip code)
Margaret Carey, Secretary
245 Summer St.
Boston, Massachusetts 02210
(Name and address of agent for service)
Registrant's telephone number, including area code:
617-563-7000
Date of fiscal year end: | November 30 |
Date of reporting period: | May 31, 2023 |
Item 1.
Reports to Stockholders


Contents
Top Holdings (% of Fund's net assets) | ||
| (excluding cash equivalents) | ||
| Palo Alto Networks, Inc. 0.375% 6/1/25 | 2.6 | |
| DraftKings, Inc. 0% 3/15/28 | 2.2 | |
| Wells Fargo & Co. 7.50% | 1.5 | |
| Snap, Inc. 0.125% 3/1/28 | 1.3 | |
| Unity Software, Inc. 0% 11/15/26 | 1.3 | |
| DHT Holdings, Inc. | 1.1 | |
| Bank of America Corp. 7.25% | 1.1 | |
| Wayfair LLC 0.625% 10/1/25 | 1.0 | |
| Northern Oil & Gas, Inc. 3.625% 4/15/29 | 1.0 | |
| Turning Point Brands, Inc. 2.5% 7/15/24 | 1.0 | |
| 14.1 | ||
| Market Sectors (% of Fund's net assets) | ||
| Information Technology | 28.8 | |
| Consumer Discretionary | 11.6 | |
| Health Care | 10.6 | |
| Communication Services | 8.4 | |
| Industrials | 6.9 | |
| Utilities | 6.7 | |
| Energy | 5.1 | |
| Financials | 4.7 | |
| Consumer Staples | 2.1 | |
| Real Estate | 1.9 | |
| Materials | 0.8 | |
Quality Diversification (% of Fund's net assets) |
 |
| We have used ratings from Moody's Investors Service, Inc. Where Moody's® ratings are not available, we have used S&P® ratings. All ratings are as of the date indicated and do not reflect subsequent changes. |
Asset Allocation (% of Fund's net assets) |
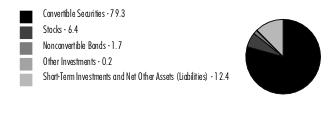 |
Written options - (0.1)% |
| Corporate Bonds - 74.0% | |||
Principal Amount (a) (000s) | Value ($) (000s) | ||
| Convertible Bonds - 72.3% | |||
| COMMUNICATION SERVICES - 7.3% | |||
| Diversified Telecommunication Services - 0.0% | |||
| Radius Global Infrastructure, Inc. 2.5% 9/15/26 (b) | 264 | 258 | |
| Entertainment - 1.8% | |||
| Liberty Media Corp. 0.5% 12/1/50 (b) | 1,721 | 1,787 | |
| Liberty Media Corp. Liberty Formula One 2.25% 8/15/27 (b) | 8,245 | 8,595 | |
| Live Nation Entertainment, Inc. 3.125% 1/15/29 (b) | 11,224 | 11,712 | |
| Spotify U.S.A., Inc. 0% 3/15/26 | 2,910 | 2,479 | |
| Zynga, Inc. 0% 12/15/26 | 5,479 | 4,383 | |
| 28,956 | |||
| Interactive Media & Services - 3.3% | |||
| IAC FinanceCo 2, Inc. 0.875% 6/15/26 (b) | 3,612 | 3,129 | |
| IAC FinanceCo 3, Inc. 2% 1/15/30 (b) | 3,607 | 2,983 | |
| Liberty TripAdvisor Holdings, Inc. 0.5% 6/30/51 (b) | 13,129 | 9,873 | |
| Snap, Inc.: | |||
| 0% 5/1/27 | 10,175 | 7,357 | |
| 0.125% 3/1/28 | 30,651 | 21,486 | |
| 0.25% 5/1/25 | 2,787 | 2,614 | |
| 0.75% 8/1/26 | 4,240 | 3,771 | |
| TripAdvisor, Inc. 0.25% 4/1/26 | 5,185 | 4,301 | |
| 55,514 | |||
| Media - 2.2% | |||
| Cable One, Inc. 0% 3/15/26 | 262 | 212 | |
| DISH Network Corp.: | |||
| 0% 12/15/25 | 236 | 108 | |
| 2.375% 3/15/24 | 4,776 | 4,119 | |
| 3.375% 8/15/26 | 20,287 | 9,105 | |
| Gannett Co., Inc. 4.75% 4/15/24 | 1,450 | 1,102 | |
| Liberty Broadband Corp. 3.125% 3/31/53 (b) | 8,650 | 8,192 | |
| Liberty Interactive LLC 1.75% 9/30/46 (b) | 1,748 | 1,662 | |
| Liberty Media Corp. 3.75% 3/15/28 (b) | 5,200 | 5,236 | |
| Magnite, Inc. 0.25% 3/15/26 | 7,345 | 6,115 | |
| TechTarget, Inc. 0% 12/15/26 | 260 | 205 | |
| 36,056 | |||
TOTAL COMMUNICATION SERVICES | 120,784 | ||
| CONSUMER DISCRETIONARY - 9.7% | |||
| Automobile Components - 0.1% | |||
| LCI Industries 1.125% 5/15/26 | 210 | 190 | |
| Patrick Industries, Inc. 1.75% 12/1/28 | 2,383 | 2,109 | |
| 2,299 | |||
| Automobiles - 1.4% | |||
| Ford Motor Co. 0% 3/15/26 | 8,343 | 8,134 | |
| Rivian Automotive, Inc. 4.625% 3/15/29 (b) | 13,220 | 13,306 | |
| Winnebago Industries, Inc. 1.5% 4/1/25 | 2,250 | 2,431 | |
| 23,871 | |||
| Broadline Retail - 0.6% | |||
| Etsy, Inc.: | |||
| 0.125% 10/1/26 | 4,822 | 5,591 | |
| 0.125% 9/1/27 | 4,882 | 3,976 | |
| 0.25% 6/15/28 | 210 | 159 | |
| 9,726 | |||
| Diversified Consumer Services - 0.0% | |||
| 2U, Inc. 2.25% 5/1/25 | 278 | 184 | |
| Hotels, Restaurants & Leisure - 5.5% | |||
| Airbnb, Inc. 0% 3/15/26 | 209 | 181 | |
| Booking Holdings, Inc. 0.75% 5/1/25 | 8,118 | 11,507 | |
| Carnival Corp. 5.75% 12/1/27 (b) | 6,950 | 8,132 | |
| Cracker Barrel Old Country Store, Inc. 0.625% 6/15/26 | 6,544 | 5,656 | |
| DraftKings, Inc. 0% 3/15/28 | 49,293 | 36,403 | |
| Expedia, Inc. 0% 2/15/26 | 225 | 197 | |
| Marriott Vacations Worldwide Corp.: | |||
| 0% 1/15/26 | 200 | 187 | |
| 3.25% 12/15/27(b) | 6,640 | 6,301 | |
| NCL Corp. Ltd.: | |||
| 1.125% 2/15/27 | 257 | 200 | |
| 2.5% 2/15/27 | 2,510 | 2,023 | |
| 5.375% 8/1/25 | 127 | 141 | |
| Penn Entertainment, Inc. 2.75% 5/15/26 | 4,160 | 5,285 | |
| Royal Caribbean Cruises Ltd. 6% 8/15/25 (b) | 7,980 | 14,256 | |
| 90,469 | |||
| Leisure Products - 0.8% | |||
| Peloton Interactive, Inc. 0% 2/15/26 | 11,367 | 8,327 | |
| Topgolf Callaway Brands Corp. 2.75% 5/1/26 | 3,690 | 4,363 | |
| 12,690 | |||
| Specialty Retail - 1.3% | |||
| Burlington Stores, Inc. 2.25% 4/15/25 | 190 | 190 | |
| National Vision Holdings, Inc. 2.5% 5/15/25 | 3,617 | 3,838 | |
| The RealReal, Inc. 1% 3/1/28 | 2,304 | 945 | |
| Wayfair LLC: | |||
| 0.625% 10/1/25 | 20,823 | 17,075 | |
| 1.125% 11/1/24 | 120 | 111 | |
| 22,159 | |||
TOTAL CONSUMER DISCRETIONARY | 161,398 | ||
| CONSUMER STAPLES - 1.6% | |||
| Consumer Staples Distribution & Retail - 0.3% | |||
| Chefs' Warehouse Holdings 2.375% 12/15/28 (b) | 4,220 | 4,171 | |
| Food Products - 0.3% | |||
| Freshpet, Inc. 3% 4/1/28 (b) | 1,700 | 1,868 | |
| Post Holdings, Inc. 2.5% 8/15/27 (b) | 3,090 | 3,129 | |
| 4,997 | |||
| Tobacco - 1.0% | |||
| Turning Point Brands, Inc. 2.5% 7/15/24 | 17,611 | 16,744 | |
TOTAL CONSUMER STAPLES | 25,912 | ||
| ENERGY - 3.1% | |||
| Oil, Gas & Consumable Fuels - 3.1% | |||
| CNX Resources Corp. 2.25% 5/1/26 | 3,271 | 4,364 | |
| EQT Corp. 1.75% 5/1/26 | 5,956 | 14,224 | |
| Northern Oil & Gas, Inc. 3.625% 4/15/29 (b) | 16,156 | 16,780 | |
| Peabody Energy Corp. 3.25% 3/1/28 | 2,047 | 2,472 | |
| Pioneer Natural Resources Co. 0.25% 5/15/25 | 6,375 | 13,301 | |
| 51,141 | |||
| FINANCIALS - 1.8% | |||
| Capital Markets - 0.0% | |||
| Coinbase Global, Inc. 0.5% 6/1/26 | 248 | 173 | |
| Consumer Finance - 0.9% | |||
| EZCORP, Inc. 3.75% 12/15/29 (b) | 1,180 | 1,158 | |
| LendingTree, Inc. 0.5% 7/15/25 | 9,943 | 7,010 | |
| SoFi Technologies, Inc. 0% 10/15/26 (b) | 9,811 | 7,329 | |
| 15,497 | |||
| Financial Services - 0.9% | |||
| Affirm Holdings, Inc. 0% 11/15/26 | 5,457 | 3,670 | |
| Block, Inc.: | |||
| 0% 5/1/26 | 309 | 255 | |
| 0.125% 3/1/25 | 147 | 136 | |
| 0.25% 11/1/27 | 295 | 225 | |
| Repay Holdings Corp. 0% 2/1/26 (b) | 2,027 | 1,619 | |
| Shift4 Payments, Inc.: | |||
| 0% 12/15/25 | 3,583 | 3,750 | |
| 0.5% 8/1/27 | 5,495 | 4,739 | |
| 14,394 | |||
TOTAL FINANCIALS | 30,064 | ||
| HEALTH CARE - 10.5% | |||
| Biotechnology - 2.8% | |||
| Alnylam Pharmaceuticals, Inc. 1% 9/15/27 (b) | 7,620 | 7,239 | |
| BridgeBio Pharma, Inc. 2.25% 2/1/29 | 11,200 | 6,769 | |
| Cerevel Therapeutics Holdings 2.5% 8/15/27 (b) | 680 | 666 | |
| Coherus BioSciences, Inc. 1.5% 4/15/26 | 205 | 125 | |
| Dynavax Technologies Corp. 2.5% 5/15/26 | 200 | 259 | |
| Exact Sciences Corp.: | |||
| 0.375% 3/15/27 | 258 | 259 | |
| 0.375% 3/1/28 | 279 | 268 | |
| 1% 1/15/25 | 166 | 209 | |
| 2% 3/1/30(b) | 7,798 | 9,783 | |
| Halozyme Therapeutics, Inc. 1% 8/15/28 (b) | 3,180 | 2,784 | |
| Insmed, Inc.: | |||
| 0.75% 6/1/28 | 3,200 | 2,568 | |
| 1.75% 1/15/25 | 2,000 | 1,839 | |
| Mirum Pharmaceuticals, Inc. 4% 5/1/29 (b) | 2,160 | 2,444 | |
| Natera, Inc. 2.25% 5/1/27 | 1,392 | 1,963 | |
| Sarepta Therapeutics, Inc.: | |||
| 1.25% 9/15/27(b) | 7,627 | 8,733 | |
| 1.5% 11/15/24 | 760 | 1,373 | |
| 47,281 | |||
| Health Care Equipment & Supplies - 5.1% | |||
| CONMED Corp. 2.25% 6/15/27 (b) | 2,740 | 2,899 | |
| DexCom, Inc.: | |||
| 0.25% 11/15/25 | 8,437 | 8,780 | |
| 0.375% 5/15/28(b) | 8,270 | 8,208 | |
| 0.75% 12/1/23 | 4,637 | 13,218 | |
| Envista Holdings Corp. 2.375% 6/1/25 | 4,917 | 7,840 | |
| Glaukos Corp. 2.75% 6/15/27 | 2,154 | 2,877 | |
| Haemonetics Corp. 0% 3/1/26 | 270 | 230 | |
| Insulet Corp. 0.375% 9/1/26 | 5,772 | 7,665 | |
| Integer Holdings Corp. 2.125% 2/15/28 (b) | 9,239 | 10,468 | |
| Integra LifeSciences Holdings Corp. 0.5% 8/15/25 | 230 | 207 | |
| Lantheus Holdings, Inc. 2.625% 12/15/27 (b) | 2,990 | 3,977 | |
| LivaNova U.S.A., Inc. 3% 12/15/25 | 4,024 | 4,074 | |
| Mesa Laboratories, Inc. 1.375% 8/15/25 | 1,437 | 1,260 | |
| Nevro Corp. 2.75% 4/1/25 | 1,023 | 939 | |
| NuVasive, Inc. 0.375% 3/15/25 | 3,750 | 3,354 | |
| Omnicell, Inc. 0.25% 9/15/25 | 2,491 | 2,497 | |
| TransMedics Group, Inc. 1.5% 6/1/28 (b) | 5,010 | 5,238 | |
| Varex Imaging Corp. 4% 6/1/25 | 190 | 231 | |
| 83,962 | |||
| Health Care Providers & Services - 0.9% | |||
| Accolade, Inc. 0.5% 4/1/26 | 13,916 | 11,202 | |
| Guardant Health, Inc. 0% 11/15/27 | 4,885 | 3,401 | |
| NeoGenomics, Inc. 1.25% 5/1/25 | 750 | 704 | |
| 15,307 | |||
| Health Care Technology - 0.9% | |||
| Health Catalyst, Inc. 2.5% 4/15/25 | 1,647 | 1,547 | |
| Nextgen Healthcare, Inc. 3.75% 11/15/27 (b) | 5,220 | 4,998 | |
| Teladoc Health, Inc. 1.25% 6/1/27 | 5,479 | 4,350 | |
| Veradigm, Inc. 0.875% 1/1/27 | 3,846 | 4,091 | |
| 14,986 | |||
| Life Sciences Tools & Services - 0.3% | |||
| Nanostring Technologies, Inc. 2.625% 3/1/25 | 1,826 | 1,449 | |
| Repligen Corp. 0.375% 7/15/24 | 2,430 | 3,680 | |
| 5,129 | |||
| Pharmaceuticals - 0.5% | |||
| Innoviva, Inc. 2.125% 3/15/28 | 200 | 164 | |
| Jazz Investments I Ltd. 2% 6/15/26 | 7,146 | 7,369 | |
| 7,533 | |||
TOTAL HEALTH CARE | 174,198 | ||
| INDUSTRIALS - 4.4% | |||
| Aerospace & Defense - 0.4% | |||
| Parsons Corp. 0.25% 8/15/25 | 6,218 | 6,824 | |
| Air Freight & Logistics - 0.1% | |||
| Air Transport Services Group, Inc. 1.125% 10/15/24 | 2,096 | 1,956 | |
| Construction & Engineering - 0.2% | |||
| Granite Construction, Inc. 3.75% 5/15/28 (b) | 4,100 | 4,216 | |
| Electrical Equipment - 1.3% | |||
| Array Technologies, Inc. 1% 12/1/28 | 4,489 | 5,046 | |
| Bloom Energy Corp. 3% 6/1/28 (b) | 2,530 | 2,582 | |
| Stem, Inc. 4.25% 4/1/30 (b) | 5,995 | 5,791 | |
| Sunrun, Inc. 0% 2/1/26 | 2,633 | 1,784 | |
| TPI Composites, Inc. 5.25% 3/15/28 (b) | 6,367 | 6,246 | |
| 21,449 | |||
| Ground Transportation - 0.4% | |||
| Lyft, Inc. 1.5% 5/15/25 | 2,024 | 1,816 | |
| Uber Technologies, Inc. 0% 12/15/25 | 5,200 | 4,664 | |
| 6,480 | |||
| Machinery - 0.6% | |||
| John Bean Technologies Corp. 0.25% 5/15/26 | 247 | 226 | |
| Middleby Corp. 1% 9/1/25 | 8,430 | 9,773 | |
| 9,999 | |||
| Passenger Airlines - 0.9% | |||
| American Airlines Group, Inc. 6.5% 7/1/25 | 7,005 | 8,095 | |
| JetBlue Airways Corp. 0.5% 4/1/26 | 4,981 | 3,875 | |
| Southwest Airlines Co. 1.25% 5/1/25 | 3,404 | 3,607 | |
| 15,577 | |||
| Professional Services - 0.4% | |||
| Ceridian HCM Holding, Inc. 0.25% 3/15/26 | 197 | 173 | |
| KBR, Inc. 2.5% 11/1/23 | 2,729 | 6,339 | |
| 6,512 | |||
| Trading Companies & Distributors - 0.1% | |||
| Xometry, Inc. 1% 2/1/27 | 1,400 | 1,005 | |
TOTAL INDUSTRIALS | 74,018 | ||
| INFORMATION TECHNOLOGY - 27.4% | |||
| Communications Equipment - 0.4% | |||
| Lumentum Holdings, Inc.: | |||
| 0.25% 3/15/24 | 2,999 | 3,090 | |
| 0.5% 12/15/26 | 3,674 | 3,215 | |
| 0.5% 6/15/28 | 200 | 154 | |
| 6,459 | |||
| Electronic Equipment, Instruments & Components - 0.3% | |||
| Insight Enterprises, Inc. 0.75% 2/15/25 | 2,684 | 5,320 | |
| Par Technology Corp. 1.5% 10/15/27 | 261 | 208 | |
| 5,528 | |||
| IT Services - 6.2% | |||
| Akamai Technologies, Inc.: | |||
| 0.125% 5/1/25 | 8,104 | 8,814 | |
| 0.375% 9/1/27 | 7,268 | 7,178 | |
| BigCommerce Holdings, Inc. 0.25% 10/1/26 | 11,929 | 9,173 | |
| Cloudflare, Inc. 0% 8/15/26 | 9,035 | 7,766 | |
| Digitalocean Holdings, Inc. 0% 12/1/26 | 14,689 | 11,449 | |
| Fastly, Inc. 0% 3/15/26 | 12,275 | 10,102 | |
| MongoDB, Inc. 0.25% 1/15/26 | 8,149 | 12,256 | |
| Okta, Inc.: | |||
| 0.125% 9/1/25 | 10,298 | 9,464 | |
| 0.375% 6/15/26 | 11,911 | 10,357 | |
| Perficient, Inc. 0.125% 11/15/26 | 4,337 | 3,524 | |
| Shopify, Inc. 0.125% 11/1/25 | 8,080 | 7,264 | |
| Wix.com Ltd. 0% 8/15/25 | 6,688 | 5,782 | |
| 103,129 | |||
| Semiconductors & Semiconductor Equipment - 2.9% | |||
| Enphase Energy, Inc.: | |||
| 0% 3/1/26 | 208 | 199 | |
| 0% 3/1/28 | 156 | 150 | |
| onsemi: | |||
| 0% 5/1/27 | 9,173 | 15,154 | |
| 0.5% 3/1/29(b) | 11,120 | 11,690 | |
| Semtech Corp. 1.625% 11/1/27 (b) | 4,026 | 3,476 | |
| SolarEdge Technologies, Inc. 0% 9/15/25 | 3,440 | 4,281 | |
| Veeco Instruments, Inc. 2.875% 6/1/29 (b) | 820 | 883 | |
| Wolfspeed, Inc.: | |||
| 0.25% 2/15/28 | 2,170 | 1,560 | |
| 1.75% 5/1/26 | 881 | 1,084 | |
| 1.875% 12/1/29(b) | 12,145 | 8,866 | |
| 47,343 | |||
| Software - 17.6% | |||
| Altair Engineering, Inc.: | |||
| 0.25% 6/1/24 | 3,124 | 4,931 | |
| 1.75% 6/15/27(b) | 5,850 | 6,906 | |
| Avalara, Inc. 0.25% 8/1/26 | 3,525 | 3,516 | |
| Bentley Systems, Inc.: | |||
| 0.125% 1/15/26 | 3,500 | 3,467 | |
| 0.375% 7/1/27 | 8,526 | 7,469 | |
| Bill Holdings, Inc.: | |||
| 0% 12/1/25 | 140 | 140 | |
| 0% 4/1/27 | 6,912 | 5,586 | |
| BlackLine, Inc.: | |||
| 0% 3/15/26 | 9,971 | 8,419 | |
| 0.125% 8/1/24 | 7,892 | 7,822 | |
| Box, Inc. 0% 1/15/26 | 4,133 | 5,011 | |
| Cerence, Inc. 3% 6/1/25 | 1,133 | 1,189 | |
| Confluent, Inc. 0% 1/15/27 | 13,001 | 10,498 | |
| CyberArk Software Ltd. 0% 11/15/24 | 4,989 | 5,697 | |
| Datadog, Inc. 0.125% 6/15/25 | 118 | 144 | |
| Dropbox, Inc.: | |||
| 0% 3/1/26 | 1,969 | 1,782 | |
| 0% 3/1/28 | 2,025 | 1,817 | |
| Everbridge, Inc.: | |||
| 0% 3/15/26 | 6,786 | 5,615 | |
| 0.125% 12/15/24 | 4,904 | 4,401 | |
| Guidewire Software, Inc. 1.25% 3/15/25 | 2,797 | 2,751 | |
| HubSpot, Inc. 0.375% 6/1/25 | 7,967 | 14,807 | |
| InterDigital, Inc. 3.5% 6/1/27 (b) | 3,270 | 3,998 | |
| LivePerson, Inc. 0% 12/15/26 | 9,227 | 5,903 | |
| MicroStrategy, Inc.: | |||
| 0% 2/15/27 | 27,610 | 16,225 | |
| 0.75% 12/15/25 | 6,600 | 6,474 | |
| Model N, Inc. 1.875% 3/15/28 (b) | 2,570 | 2,561 | |
| Pagerduty, Inc. 1.25% 7/1/25 | 1,647 | 1,674 | |
| Palo Alto Networks, Inc. 0.375% 6/1/25 | 20,146 | 43,347 | |
| Pegasystems, Inc. 0.75% 3/1/25 | 1,489 | 1,356 | |
| Porch Group, Inc. 0.75% 9/15/26 (b) | 7,852 | 3,026 | |
| Progress Software Corp. 1% 4/15/26 | 4,250 | 4,771 | |
| Q2 Holdings, Inc. 0.75% 6/1/26 | 2,453 | 2,082 | |
| Rapid7, Inc.: | |||
| 0.25% 3/15/27 | 10,933 | 9,840 | |
| 2.25% 5/1/25 | 3,728 | 3,881 | |
| RingCentral, Inc.: | |||
| 0% 3/1/25 | 7,082 | 6,476 | |
| 0% 3/15/26 | 6,321 | 5,256 | |
| Splunk, Inc.: | |||
| 1.125% 9/15/25 | 7,367 | 7,220 | |
| 1.125% 6/15/27 | 5,000 | 4,290 | |
| Tyler Technologies, Inc. 0.25% 3/15/26 | 13,651 | 13,869 | |
| Unity Software, Inc. 0% 11/15/26 | 26,949 | 21,209 | |
| Varonis Systems, Inc. 1.25% 8/15/25 | 2,684 | 2,955 | |
| Verint Systems, Inc. 0.25% 4/15/26 | 1,780 | 1,581 | |
| Veritone, Inc. 1.75% 11/15/26 | 334 | 220 | |
| Workiva, Inc. 1.125% 8/15/26 | 9,483 | 12,944 | |
| Zscaler, Inc. 0.125% 7/1/25 | 8,780 | 9,856 | |
| 292,982 | |||
TOTAL INFORMATION TECHNOLOGY | 455,441 | ||
| MATERIALS - 0.8% | |||
| Chemicals - 0.2% | |||
| Livent Corp. 4.125% 7/15/25 | 1,384 | 3,744 | |
| Metals & Mining - 0.6% | |||
| MP Materials Corp. 0.25% 4/1/26 (b) | 7,480 | 6,437 | |
| United States Steel Corp. 5% 11/1/26 | 1,447 | 2,442 | |
| 8,879 | |||
TOTAL MATERIALS | 12,623 | ||
| REAL ESTATE - 1.9% | |||
| Equity Real Estate Investment Trusts (REITs) - 0.7% | |||
| Pebblebrook Hotel Trust 1.75% 12/15/26 | 182 | 154 | |
| Summit Hotel Properties, Inc. 1.5% 2/15/26 | 187 | 160 | |
| Uniti Fiber Holdings, Inc. 4% 6/15/24 (b) | 3,071 | 2,927 | |
| Uniti Group, Inc. 7.5% 12/1/27 (b) | 2,165 | 1,612 | |
| Welltower OP LLC 2.75% 5/15/28 (b) | 6,650 | 6,557 | |
| 11,410 | |||
| Real Estate Management & Development - 1.2% | |||
| Realogy Group LLC/Realogy Co-Issuer Corp. 0.25% 6/15/26 | 268 | 191 | |
| Redfin Corp.: | |||
| 0% 10/15/25 | 410 | 329 | |
| 0.5% 4/1/27 | 12,939 | 8,855 | |
| Zillow Group, Inc.: | |||
| 1.375% 9/1/26 | 8,356 | 10,015 | |
| 2.75% 5/15/25 | 187 | 192 | |
| 19,582 | |||
TOTAL REAL ESTATE | 30,992 | ||
| UTILITIES - 3.8% | |||
| Electric Utilities - 3.2% | |||
| Alliant Energy Corp. 3.875% 3/15/26 (b) | 2,600 | 2,610 | |
| Duke Energy Corp. 4.125% 4/15/26 (b) | 13,980 | 13,840 | |
| FirstEnergy Corp. 4% 5/1/26 (b) | 7,430 | 7,404 | |
| NRG Energy, Inc. 2.75% 6/1/48 | 4,314 | 4,413 | |
| PPL Capital Funding, Inc. 2.875% 3/15/28 (b) | 10,840 | 10,428 | |
| Southern Co. 3.875% 12/15/25 (b) | 13,930 | 14,034 | |
| 52,729 | |||
| Independent Power and Renewable Electricity Producers - 0.3% | |||
| NextEra Energy Partners LP: | |||
| 0% 6/15/24(b) | 210 | 197 | |
| 2.5% 6/15/26(b) | 180 | 162 | |
| Ormat Technologies, Inc. 2.5% 7/15/27 (b) | 1,700 | 1,908 | |
| Sunnova Energy International, Inc.: | |||
| 0.25% 12/1/26 | 200 | 153 | |
| 2.625% 2/15/28(b) | 3,980 | 3,162 | |
| 5,582 | |||
| Multi-Utilities - 0.3% | |||
| CMS Energy Corp. 3.375% 5/1/28 (b) | 5,810 | 5,769 | |
TOTAL UTILITIES | 64,080 | ||
| TOTAL CONVERTIBLE BONDS | 1,200,651 | ||
| Nonconvertible Bonds - 1.7% | |||
| COMMUNICATION SERVICES - 0.6% | |||
| Media - 0.6% | |||
| Gannett Holdings LLC 6% 11/1/26 (b) | 11,650 | 9,699 | |
| CONSUMER STAPLES - 0.5% | |||
| Tobacco - 0.5% | |||
| Turning Point Brands, Inc. 5.625% 2/15/26 (b) | 9,153 | 8,375 | |
| ENERGY - 0.3% | |||
| Oil, Gas & Consumable Fuels - 0.3% | |||
| Calumet Specialty Products Partners LP/Calumet Finance Corp. 11% 4/15/25 (b) | 2,380 | 2,451 | |
| SFL Corp. Ltd. 7.25% 5/12/26 (b) | 2,800 | 2,664 | |
| 5,115 | |||
| INFORMATION TECHNOLOGY - 0.3% | |||
| Software - 0.3% | |||
| Veritas U.S., Inc./Veritas Bermuda Ltd. 7.5% 9/1/25 (b) | 7,690 | 5,749 | |
| TOTAL NONCONVERTIBLE BONDS | 28,938 | ||
| TOTAL CORPORATE BONDS (Cost $1,211,536) | 1,229,589 | ||
| Common Stocks - 6.4% | |||
| Shares | Value ($) (000s) | ||
| COMMUNICATION SERVICES - 0.5% | |||
| Interactive Media & Services - 0.2% | |||
| Snap, Inc. Class A (c) | 350,000 | 3,570 | |
| Media - 0.3% | |||
| Gannett Co., Inc. (c)(d) | 2,135,023 | 4,740 | |
TOTAL COMMUNICATION SERVICES | 8,310 | ||
| CONSUMER DISCRETIONARY - 1.7% | |||
| Automobiles - 0.9% | |||
| Ford Motor Co. | 470,600 | 5,647 | |
| Tesla, Inc. (c)(e) | 45,900 | 9,360 | |
| 15,007 | |||
| Hotels, Restaurants & Leisure - 0.8% | |||
| A&W Revenue Royalties Income Fund | 164,000 | 4,285 | |
| Super Group SGHC Ltd. (c)(d) | 3,208,777 | 9,338 | |
| 13,623 | |||
TOTAL CONSUMER DISCRETIONARY | 28,630 | ||
| ENERGY - 1.7% | |||
| Oil, Gas & Consumable Fuels - 1.7% | |||
| Calumet Specialty Products Partners LP (c) | 313,501 | 4,919 | |
| DHT Holdings, Inc. | 2,393,512 | 18,406 | |
| Scorpio Tankers, Inc. (e) | 100,000 | 4,577 | |
| 27,902 | |||
| HEALTH CARE - 0.1% | |||
| Biotechnology - 0.1% | |||
| BridgeBio Pharma, Inc. (c) | 133,500 | 1,832 | |
| INDUSTRIALS - 1.3% | |||
| Electrical Equipment - 0.9% | |||
| Babcock & Wilcox Enterprises, Inc. (c) | 3,001,838 | 14,409 | |
| Ground Transportation - 0.4% | |||
| Uber Technologies, Inc. (c) | 176,300 | 6,687 | |
TOTAL INDUSTRIALS | 21,096 | ||
| INFORMATION TECHNOLOGY - 1.1% | |||
| Semiconductors & Semiconductor Equipment - 0.8% | |||
| NVIDIA Corp. (e) | 27,200 | 10,291 | |
| onsemi (c) | 40,171 | 3,358 | |
| 13,649 | |||
| Software - 0.3% | |||
| Everbridge, Inc. (c) | 163,772 | 3,934 | |
| LivePerson, Inc. (c) | 19,797 | 73 | |
| 4,007 | |||
TOTAL INFORMATION TECHNOLOGY | 17,656 | ||
| TOTAL COMMON STOCKS (Cost $117,002) | 105,426 | ||
| Convertible Preferred Stocks - 7.0% | |||
| Shares | Value ($) (000s) | ||
| CONSUMER DISCRETIONARY - 0.2% | |||
| Automobile Components - 0.2% | |||
| Aptiv PLC Series A, 5.50% | 36,600 | 3,572 | |
| FINANCIALS - 2.9% | |||
| Banks - 2.6% | |||
| Bank of America Corp. 7.25% | 15,795 | 18,322 | |
| Wells Fargo & Co. 7.50% | 21,543 | 24,451 | |
| 42,773 | |||
| Capital Markets - 0.3% | |||
| KKR & Co. LP Series C, 6.00% | 76,600 | 4,682 | |
TOTAL FINANCIALS | 47,455 | ||
| INDUSTRIALS - 1.2% | |||
| Construction & Engineering - 0.3% | |||
| Fluor Corp. 6.50% | 4,350 | 5,497 | |
| Machinery - 0.9% | |||
| Chart Industries, Inc. | 152,800 | 7,334 | |
| RBC Bearings, Inc. | 78,400 | 7,821 | |
| 15,155 | |||
TOTAL INDUSTRIALS | 20,652 | ||
| UTILITIES - 2.7% | |||
| Electric Utilities - 2.4% | |||
| American Electric Power Co., Inc. 6.125% | 96,600 | 4,692 | |
| NextEra Energy, Inc.: | |||
| 6.219% | 176,100 | 8,425 | |
| 6.296% | 295,400 | 13,405 | |
| PG&E Corp. | 86,200 | 12,671 | |
| 39,193 | |||
| Gas Utilities - 0.0% | |||
| UGI Corp. 7.125% | 2,000 | 133 | |
| Independent Power and Renewable Electricity Producers - 0.3% | |||
| The AES Corp. 6.875% | 59,700 | 4,647 | |
| Multi-Utilities - 0.0% | |||
| NiSource, Inc. 7.75% | 2,200 | 222 | |
TOTAL UTILITIES | 44,195 | ||
| TOTAL CONVERTIBLE PREFERRED STOCKS (Cost $117,286) | 115,874 | ||
| Preferred Securities - 0.2% | |||
Principal Amount (a) (000s) | Value ($) (000s) | ||
| UTILITIES - 0.2% | |||
| Independent Power and Renewable Electricity Producers - 0.2% | |||
Vistra Corp. 7% (b)(f)(g) (Cost $3,126) | 3,345 | 3,050 | |
| Money Market Funds - 12.0% | |||
| Shares | Value ($) (000s) | ||
| Fidelity Cash Central Fund 5.14% (h) | 198,418,688 | 198,458 | |
| Fidelity Securities Lending Cash Central Fund 5.14% (h)(i) | 779,029 | 779 | |
| TOTAL MONEY MARKET FUNDS (Cost $199,237) | 199,237 | ||
| TOTAL INVESTMENT IN SECURITIES - 99.6% (Cost $1,648,187) | 1,653,176 |
NET OTHER ASSETS (LIABILITIES) - 0.4% | 7,438 |
| NET ASSETS - 100.0% | 1,660,614 |
| Written Options | ||||||
| Counterparty | Number of Contracts | Notional Amount ($) (000s) | Exercise Price ($) | Expiration Date | Value ($) (000s) | |
| Call Options | ||||||
| NVIDIA Corp. | Chicago Board Options Exchange | 272 | 10,291 | 350.00 | 07/21/23 | (1,213) |
| Scorpio Tankers, Inc. | Chicago Board Options Exchange | 1,000 | 4,577 | 75.00 | 07/21/23 | (10) |
| Tesla, Inc. | Chicago Board Options Exchange | 50 | 1,020 | 265.00 | 07/21/23 | (16) |
| TOTAL WRITTEN OPTIONS | (1,239) | |||||
| (a) | Amount is stated in United States dollars unless otherwise noted. |
| (b) | Security exempt from registration under Rule 144A of the Securities Act of 1933. These securities may be resold in transactions exempt from registration, normally to qualified institutional buyers. At the end of the period, the value of these securities amounted to $368,189,000 or 22.2% of net assets. |
| (c) | Non-income producing |
| (d) | Security or a portion of the security is on loan at period end. |
| (e) | Security or a portion of the security is pledged as collateral for options written. At period end, the value of securities pledged amounted to $15,888,000. |
| (f) | Security is perpetual in nature with no stated maturity date. |
| (g) | Coupon rates for floating and adjustable rate securities reflect the rates in effect at period end. |
| (h) | Affiliated fund that is generally available only to investment companies and other accounts managed by Fidelity Investments. The rate quoted is the annualized seven-day yield of the fund at period end. A complete unaudited listing of the fund's holdings as of its most recent quarter end is available upon request. In addition, each Fidelity Central Fund's financial statements are available on the SEC's website or upon request. |
| (i) | Investment made with cash collateral received from securities on loan. |
| Affiliate (Amounts in thousands) | Value, beginning of period ($) | Purchases ($) | Sales Proceeds ($) | Dividend Income ($) | Realized Gain (loss) ($) | Change in Unrealized appreciation (depreciation) ($) | Value, end of period ($) | % ownership, end of period |
| Fidelity Cash Central Fund 5.14% | 42,677 | 465,023 | 309,242 | 1,926 | - | - | 198,458 | 0.5% |
| Fidelity Securities Lending Cash Central Fund 5.14% | 23,170 | 56,092 | 78,483 | 54 | - | - | 779 | 0.0% |
| Total | 65,847 | 521,115 | 387,725 | 1,980 | - | - | 199,237 | |
| Valuation Inputs at Reporting Date: | ||||
Description (Amounts in thousands) | Total ($) | Level 1 ($) | Level 2 ($) | Level 3 ($) |
Investments in Securities: | ||||
| Equities: | ||||
Communication Services | 8,310 | 8,310 | - | - |
Consumer Discretionary | 32,202 | 28,630 | 3,572 | - |
Energy | 27,902 | 27,902 | - | - |
Financials | 47,455 | - | 47,455 | - |
Health Care | 1,832 | 1,832 | - | - |
Industrials | 41,748 | 21,096 | 20,652 | - |
Information Technology | 17,656 | 17,656 | - | - |
Utilities | 44,195 | - | 44,195 | - |
| Corporate Bonds | 1,229,589 | - | 1,229,589 | - |
| Preferred Securities | 3,050 | - | 3,050 | - |
| Money Market Funds | 199,237 | 199,237 | - | - |
| Total Investments in Securities: | 1,653,176 | 304,663 | 1,348,513 | - |
Derivative Instruments: | ||||
| Liabilities | ||||
Written Options | (1,239) | (1,239) | - | - |
| Total Liabilities | (1,239) | (1,239) | - | - |
| Total Derivative Instruments: | (1,239) | (1,239) | - | - |
Primary Risk Exposure / Derivative Type | Value | |
| (Amounts in thousands) | Asset ($) | Liability ($) |
| Equity Risk | ||
Written Options (a) | 0 | (1,239) |
| Total Equity Risk | 0 | (1,239) |
| Total Value of Derivatives | 0 | (1,239) |
| Statement of Assets and Liabilities | ||||
| Amounts in thousands (except per-share amounts) | May 31, 2023 (Unaudited) | |||
| Assets | ||||
| Investment in securities, at value (including securities loaned of $730) - See accompanying schedule: | ||||
Unaffiliated issuers (cost $1,448,950) | $ | 1,453,939 | ||
Fidelity Central Funds (cost $199,237) | 199,237 | |||
| Total Investment in Securities (cost $1,648,187) | $ | 1,653,176 | ||
| Foreign currency held at value (cost $17) | 17 | |||
| Receivable for investments sold | 5,548 | |||
| Receivable for fund shares sold | 193 | |||
| Dividends receivable | 1,607 | |||
| Interest receivable | 4,526 | |||
| Distributions receivable from Fidelity Central Funds | 723 | |||
| Other receivables | 8 | |||
Total assets | 1,665,798 | |||
| Liabilities | ||||
| Payable for investments purchased | $ | 1,194 | ||
| Payable for fund shares redeemed | 932 | |||
| Accrued management fee | 762 | |||
| Distribution and service plan fees payable | 18 | |||
| Written options, at value (premium receivable $360) | 1,239 | |||
| Other affiliated payables | 224 | |||
| Other payables and accrued expenses | 35 | |||
| Collateral on securities loaned | 780 | |||
| Total Liabilities | 5,184 | |||
| Net Assets | $ | 1,660,614 | ||
| Net Assets consist of: | ||||
| Paid in capital | $ | 1,601,056 | ||
| Total accumulated earnings (loss) | 59,558 | |||
| Net Assets | $ | 1,660,614 | ||
| Net Asset Value and Maximum Offering Price | ||||
| Class A : | ||||
Net Asset Value and redemption price per share ($43,208 ÷ 1,429 shares) (a)(b) | $ | 30.25 | ||
| Maximum offering price per share (100/94.25 of $30.25) | $ | 32.10 | ||
| Class M : | ||||
Net Asset Value and redemption price per share ($7,578 ÷ 250 shares) (a)(b) | $ | 30.29 | ||
| Maximum offering price per share (100/96.50 of $30.29) | $ | 31.39 | ||
| Class C : | ||||
Net Asset Value and offering price per share ($7,175 ÷ 239 shares) (a) | $ | 30.02 | ||
| Convertible Securities : | ||||
Net Asset Value , offering price and redemption price per share ($1,455,694 ÷ 47,823 shares) | $ | 30.44 | ||
| Class I : | ||||
Net Asset Value , offering price and redemption price per share ($88,859 ÷ 2,925 shares) | $ | 30.38 | ||
| Class Z : | ||||
Net Asset Value , offering price and redemption price per share ($58,100 ÷ 1,914 shares) (b) | $ | 30.35 | ||
(a)Redemption price per share is equal to net asset value less any applicable contingent deferred sales charge. | ||||
(b)Corresponding Net Asset Value does not calculate due to rounding of fractional net assets and/or shares | ||||
| Statement of Operations | ||||
| Amounts in thousands | Six months ended May 31, 2023 (Unaudited) | |||
| Investment Income | ||||
| Dividends | $ | 8,215 | ||
| Interest | 21,665 | |||
| Income from Fidelity Central Funds (including $54 from security lending) | 1,980 | |||
| Total Income | 31,860 | |||
| Expenses | ||||
| Management fee | ||||
| Basic fee | $ | 3,578 | ||
| Performance adjustment | 1,172 | |||
| Transfer agent fees | 1,123 | |||
| Distribution and service plan fees | 113 | |||
| Accounting fees | 230 | |||
| Custodian fees and expenses | 13 | |||
| Independent trustees' fees and expenses | 6 | |||
| Registration fees | 90 | |||
| Audit | 30 | |||
| Legal | 2 | |||
| Miscellaneous | 4 | |||
| Total expenses before reductions | 6,361 | |||
| Expense reductions | (41) | |||
| Total expenses after reductions | 6,320 | |||
| Net Investment income (loss) | 25,540 | |||
| Realized and Unrealized Gain (Loss) | ||||
| Net realized gain (loss) on: | ||||
| Investment Securities: | ||||
| Unaffiliated issuers | 37,554 | |||
| Written options | 213 | |||
| Total net realized gain (loss) | 37,767 | |||
| Change in net unrealized appreciation (depreciation) on: | ||||
| Investment Securities: | ||||
| Unaffiliated issuers | (72,732) | |||
| Written options | (879) | |||
| Total change in net unrealized appreciation (depreciation) | (73,611) | |||
| Net gain (loss) | (35,844) | |||
| Net increase (decrease) in net assets resulting from operations | $ | (10,304) | ||
| Statement of Changes in Net Assets | ||||
| Amount in thousands | Six months ended May 31, 2023 (Unaudited) | Year ended November 30, 2022 | ||
| Increase (Decrease) in Net Assets | ||||
| Operations | ||||
| Net investment income (loss) | $ | 25,540 | $ | 35,641 |
| Net realized gain (loss) | 37,767 | 52,681 | ||
| Change in net unrealized appreciation (depreciation) | (73,611) | (338,145) | ||
| Net increase (decrease) in net assets resulting from operations | (10,304) | (249,823) | ||
| Distributions to shareholders | (50,644) | (376,367) | ||
| Share transactions - net increase (decrease) | (13,967) | 184,864 | ||
| Total increase (decrease) in net assets | (74,915) | (441,326) | ||
| Net Assets | ||||
| Beginning of period | 1,735,529 | 2,176,855 | ||
| End of period | $ | 1,660,614 | $ | 1,735,529 |
| Fidelity Advisor® Convertible Securities Fund Class A |
Six months ended (Unaudited) May 31, 2023 | Years ended November 30, 2022 | 2021 | 2020 | 2019 | 2018 | |||||||
Selected Per-Share Data | ||||||||||||
| Net asset value, beginning of period | $ | 31.39 | $ | 43.06 | $ | 40.70 | $ | 30.97 | $ | 28.07 | $ | 28.49 |
| Income from Investment Operations | ||||||||||||
Net investment income (loss) A,B | .42 | .53 | .42 | .70 | .43 | .76 C | ||||||
| Net realized and unrealized gain (loss) | (.67) | (4.80) | 5.89 | 10.23 | 4.38 | .25 | ||||||
| Total from investment operations | (.25) | (4.27) | 6.31 | 10.93 | 4.81 | 1.01 | ||||||
| Distributions from net investment income | (.47) | (.48) | (.81) | (.63) | (.40) | (.85) | ||||||
| Distributions from net realized gain | (.43) | (6.92) | (3.14) | (.57) | (1.51) | (.58) | ||||||
| Total distributions | (.89) D | (7.40) | (3.95) | (1.20) | (1.91) | (1.43) | ||||||
| Net asset value, end of period | $ | 30.25 | $ | 31.39 | $ | 43.06 | $ | 40.70 | $ | 30.97 | $ | 28.07 |
Total Return E,F,G | (.71)% | (12.04)% | 16.43% | 36.42% | 18.75% | 3.60% | ||||||
Ratios to Average Net Assets B,H,I | ||||||||||||
| Expenses before reductions | 1.04% J | 1.02% | .97% | .93% | .81% | .75% | ||||||
| Expenses net of fee waivers, if any | 1.04% J | 1.02% | .97% | .92% | .80% | .75% | ||||||
| Expenses net of all reductions | 1.03% J | 1.02% | .97% | .92% | .80% | .75% | ||||||
| Net investment income (loss) | 2.76% J | 1.63% | .98% | 2.11% | 1.52% | 2.66% C | ||||||
| Supplemental Data | ||||||||||||
| Net assets, end of period (in millions) | $ | 43 | $ | 46 | $ | 57 | $ | 40 | $ | 25 | $ | 19 |
Portfolio turnover rate K | 83% J | 85% | 87% | 147% | 151% | 176% |
| Fidelity Advisor® Convertible Securities Fund Class M |
Six months ended (Unaudited) May 31, 2023 | Years ended November 30, 2022 | 2021 | 2020 | 2019 | 2018 | |||||||
Selected Per-Share Data | ||||||||||||
| Net asset value, beginning of period | $ | 31.44 | $ | 43.09 | $ | 40.73 | $ | 30.98 | $ | 28.09 | $ | 28.47 |
| Income from Investment Operations | ||||||||||||
Net investment income (loss) A,B | .38 | .45 | .31 | .61 | .35 | .68 C | ||||||
| Net realized and unrealized gain (loss) | (.67) | (4.79) | 5.89 | 10.26 | 4.36 | .25 | ||||||
| Total from investment operations | (.29) | (4.34) | 6.20 | 10.87 | 4.71 | .93 | ||||||
| Distributions from net investment income | (.43) | (.38) | (.70) | (.55) | (.32) | (.73) | ||||||
| Distributions from net realized gain | (.43) | (6.92) | (3.14) | (.57) | (1.51) | (.58) | ||||||
| Total distributions | (.86) | (7.31) D | (3.84) | (1.12) | (1.82) D | (1.31) | ||||||
| Net asset value, end of period | $ | 30.29 | $ | 31.44 | $ | 43.09 | $ | 40.73 | $ | 30.98 | $ | 28.09 |
Total Return E,F,G | (.87)% | (12.24)% | 16.10% | 36.10% | 18.34% | 3.31% | ||||||
Ratios to Average Net Assets B,H,I | ||||||||||||
| Expenses before reductions | 1.30% J | 1.28% | 1.23% | 1.19% | 1.09% | 1.04% | ||||||
| Expenses net of fee waivers, if any | 1.29% J | 1.28% | 1.22% | 1.19% | 1.09% | 1.04% | ||||||
| Expenses net of all reductions | 1.29% J | 1.28% | 1.22% | 1.19% | 1.08% | 1.03% | ||||||
| Net investment income (loss) | 2.50% J | 1.38% | .73% | 1.84% | 1.24% | 2.38% C | ||||||
| Supplemental Data | ||||||||||||
| Net assets, end of period (in millions) | $ | 8 | $ | 8 | $ | 11 | $ | 9 | $ | 6 | $ | 6 |
Portfolio turnover rate K | 83% J | 85% | 87% | 147% | 151% | 176% |
| Fidelity Advisor® Convertible Securities Fund Class C |
Six months ended (Unaudited) May 31, 2023 | Years ended November 30, 2022 | 2021 | 2020 | 2019 | 2018 | |||||||
Selected Per-Share Data | ||||||||||||
| Net asset value, beginning of period | $ | 31.15 | $ | 42.73 | $ | 40.42 | $ | 30.76 | $ | 27.89 | $ | 28.31 |
| Income from Investment Operations | ||||||||||||
Net investment income (loss) A,B | .30 | .29 | .09 | .44 | .22 | .54 C | ||||||
| Net realized and unrealized gain (loss) | (.65) | (4.76) | 5.85 | 10.19 | 4.34 | .25 | ||||||
| Total from investment operations | (.35) | (4.47) | 5.94 | 10.63 | 4.56 | .79 | ||||||
| Distributions from net investment income | (.35) | (.18) | (.49) | (.40) | (.18) | (.63) | ||||||
| Distributions from net realized gain | (.43) | (6.92) | (3.14) | (.57) | (1.51) | (.58) | ||||||
| Total distributions | (.78) | (7.11) D | (3.63) | (.97) | (1.69) | (1.21) | ||||||
| Net asset value, end of period | $ | 30.02 | $ | 31.15 | $ | 42.73 | $ | 40.42 | $ | 30.76 | $ | 27.89 |
Total Return E,F,G | (1.08)% | (12.70)% | 15.53% | 35.42% | 17.82% | 2.82% | ||||||
Ratios to Average Net Assets B,H,I | ||||||||||||
| Expenses before reductions | 1.81% J | 1.79% | 1.74% | 1.69% | 1.55% | 1.50% | ||||||
| Expenses net of fee waivers, if any | 1.80% J | 1.79% | 1.74% | 1.69% | 1.55% | 1.50% | ||||||
| Expenses net of all reductions | 1.80% J | 1.79% | 1.74% | 1.68% | 1.55% | 1.49% | ||||||
| Net investment income (loss) | 1.99% J | .86% | .21% | 1.35% | .77% | 1.92% C | ||||||
| Supplemental Data | ||||||||||||
| Net assets, end of period (in millions) | $ | 7 | $ | 8 | $ | 19 | $ | 24 | $ | 17 | $ | 17 |
Portfolio turnover rate K | 83% J | 85% | 87% | 147% | 151% | 176% |
| Fidelity® Convertible Securities Fund |
Six months ended (Unaudited) May 31, 2023 | Years ended November 30, 2022 | 2021 | 2020 | 2019 | 2018 | |||||||
Selected Per-Share Data | ||||||||||||
| Net asset value, beginning of period | $ | 31.58 | $ | 43.29 | $ | 40.89 | $ | 31.09 | $ | 28.18 | $ | 28.59 |
| Income from Investment Operations | ||||||||||||
Net investment income (loss) A,B | .47 | .64 | .55 | .80 | .52 | .85 C | ||||||
| Net realized and unrealized gain (loss) | (.67) | (4.84) | 5.92 | 10.29 | 4.38 | .25 | ||||||
| Total from investment operations | (.20) | (4.20) | 6.47 | 11.09 | 4.90 | 1.10 | ||||||
| Distributions from net investment income | (.51) | (.59) | (.93) | (.72) | (.48) | (.93) | ||||||
| Distributions from net realized gain | (.43) | (6.92) | (3.14) | (.57) | (1.51) | (.58) | ||||||
| Total distributions | (.94) | (7.51) | (4.07) | (1.29) | (1.99) | (1.51) | ||||||
| Net asset value, end of period | $ | 30.44 | $ | 31.58 | $ | 43.29 | $ | 40.89 | $ | 31.09 | $ | 28.18 |
Total Return D,E | (.55)% | (11.79)% | 16.78% | 36.88% | 19.04% | 3.93% | ||||||
Ratios to Average Net Assets B,F,G | ||||||||||||
| Expenses before reductions | .74% H | .72% | .67% | .63% | .51% | .46% | ||||||
| Expenses net of fee waivers, if any | .74% H | .72% | .67% | .63% | .51% | .46% | ||||||
| Expenses net of all reductions | .74% H | .72% | .67% | .62% | .51% | .45% | ||||||
| Net investment income (loss) | 3.05% H | 1.93% | 1.28% | 2.41% | 1.81% | 2.96% C | ||||||
| Supplemental Data | ||||||||||||
| Net assets, end of period (in millions) | $ | 1,456 | $ | 1,539 | $ | 1,922 | $ | 1,791 | $ | 1,429 | $ | 1,278 |
Portfolio turnover rate I | 83% H | 85% | 87% | 147% | 151% | 176% |
| Fidelity Advisor® Convertible Securities Fund Class I |
Six months ended (Unaudited) May 31, 2023 | Years ended November 30, 2022 | 2021 | 2020 | 2019 | 2018 | |||||||
Selected Per-Share Data | ||||||||||||
| Net asset value, beginning of period | $ | 31.51 | $ | 43.20 | $ | 40.82 | $ | 31.04 | $ | 28.13 | $ | 28.55 |
| Income from Investment Operations | ||||||||||||
Net investment income (loss) A,B | .47 | .62 | .53 | .79 | .52 | .84 C | ||||||
| Net realized and unrealized gain (loss) | (.67) | (4.81) | 5.91 | 10.27 | 4.38 | .24 | ||||||
| Total from investment operations | (.20) | (4.19) | 6.44 | 11.06 | 4.90 | 1.08 | ||||||
| Distributions from net investment income | (.50) | (.58) | (.92) | (.71) | �� | (.48) | (.92) | |||||
| Distributions from net realized gain | (.43) | (6.92) | (3.14) | (.57) | (1.51) | (.58) | ||||||
| Total distributions | (.93) | (7.50) | (4.06) | (1.28) | (1.99) | (1.50) | ||||||
| Net asset value, end of period | $ | 30.38 | $ | 31.51 | $ | 43.20 | $ | 40.82 | $ | 31.04 | $ | 28.13 |
Total Return D,E | (.55)% | (11.80)% | 16.72% | 36.84% | 19.07% | 3.87% | ||||||
Ratios to Average Net Assets B,F,G | ||||||||||||
| Expenses before reductions | .75% H | .75% | .70% | .65% | .52% | .47% | ||||||
| Expenses net of fee waivers, if any | .74% H | .75% | .70% | .65% | .52% | .47% | ||||||
| Expenses net of all reductions | .74% H | .75% | .70% | .64% | .52% | .47% | ||||||
| Net investment income (loss) | 3.05% H | 1.90% | 1.25% | 2.39% | 1.80% | 2.94% C | ||||||
| Supplemental Data | ||||||||||||
| Net assets, end of period (in millions) | $ | 89 | $ | 93 | $ | 110 | $ | 65 | $ | 61 | $ | 32 |
Portfolio turnover rate I | 83% H | 85% | 87% | 147% | 151% | 176% |
| Fidelity Advisor® Convertible Securities Fund Class Z |
Six months ended (Unaudited) May 31, 2023 | Years ended November 30, 2022 | 2021 | 2020 | 2019 | 2018 A | |||||||
Selected Per-Share Data | ||||||||||||
| Net asset value, beginning of period | $ | 31.50 | $ | 43.19 | $ | 40.81 | $ | 31.03 | $ | 28.14 | $ | 29.30 |
| Income from Investment Operations | ||||||||||||
Net investment income (loss) B,C | .48 | .66 | .58 | .83 | .56 | .10 | ||||||
| Net realized and unrealized gain (loss) | (.67) | (4.81) | 5.91 | 10.27 | 4.35 | (.90) | ||||||
| Total from investment operations | (.19) | (4.15) | 6.49 | 11.10 | 4.91 | (.80) | ||||||
| Distributions from net investment income | (.53) | (.62) | (.97) | (.75) | (.51) | (.36) | ||||||
| Distributions from net realized gain | (.43) | (6.92) | (3.14) | (.57) | (1.51) | - | ||||||
| Total distributions | (.96) | (7.54) | (4.11) | (1.32) | (2.02) | (.36) | ||||||
| Net asset value, end of period | $ | 30.35 | $ | 31.50 | $ | 43.19 | $ | 40.81 | $ | 31.03 | $ | 28.14 |
Total Return D,E | (.54)% | (11.69)% | 16.86% | 37.01% | 19.15% | (2.74)% | ||||||
Ratios to Average Net Assets C,F,G | ||||||||||||
| Expenses before reductions | .65% H | .63% | .59% | .53% | .41% | .37% H | ||||||
| Expenses net of fee waivers, if any | .65% H | .63% | .59% | .53% | .41% | .37% H | ||||||
| Expenses net of all reductions | .65% H | .63% | .59% | .53% | .41% | .36% H | ||||||
| Net investment income (loss) | 3.14% H | 2.02% | 1.36% | 2.50% | 1.91% | 2.35% H | ||||||
| Supplemental Data | ||||||||||||
| Net assets, end of period (in millions) | $ | 58 | $ | 42 | $ | 57 | $ | 35 | $ | 32 | $ | 1 |
Portfolio turnover rate I | 83% H | 85% | 87% | 147% | 151% | 176% |
| Fidelity Central Fund | Investment Manager | Investment Objective | Investment Practices | Expense Ratio A |
| Fidelity Money Market Central Funds | Fidelity Management & Research Company LLC (FMR) | Each fund seeks to obtain a high level of current income consistent with the preservation of capital and liquidity. | Short-term Investments | Less than .005% |
| Gross unrealized appreciation | $124,223 |
| Gross unrealized depreciation | (106,009) |
| Net unrealized appreciation (depreciation) | $18,214 |
| Tax cost | $1,634,083 |
| Equity Risk | Equity risk relates to the fluctuations in the value of financial instruments as a result of changes in market prices (other than those arising from interest rate risk or foreign exchange risk), whether caused by factors specific to an individual investment, its issuer, or all factors affecting all instruments traded in a market or market segment. |
| Purchases ($) | Sales ($) | |
| Fidelity Convertible Securities Fund | 656,578 | 876,643 |
| Distribution Fee | Service Fee | Total Fees | Retained by FDC | |
| Class A | - % | .25% | $55 | $1 |
| Class M | .25% | .25% | 20 | - A |
| Class C | .75% | .25% | 38 | 6 |
| $113 | $7 |
| Retained by FDC | |
| Class A | $ 17 |
| Class M | - A |
Class C B | 5 |
| $22 |
| Amount | % of Class-Level Average Net Assets A | |
| Class A | $ 40 | .18 |
| Class M | 7 | .19 |
| Class C | 8 | .20 |
| Convertible Securities | 1,007 | .13 |
| Class I | 50 | .14 |
| Class Z | 11 | .04 |
| $1,123 |
| % of Average Net Assets | |
| Fidelity Convertible Securities Fund | .03 |
| Amount | |
| Fidelity Convertible Securities Fund | $ 3 |
| Purchases ($) | Sales ($) | Realized Gain (Loss) ($) | |
| Fidelity Convertible Securities Fund | 7,052 | 14,975 | 688 |
| Amount | |
| Fidelity Convertible Securities Fund | $2 |
| Total Security Lending Fees Paid to NFS | Security Lending Income From Securities Loaned to NFS | Value of Securities Loaned to NFS at Period End | |
| Fidelity Convertible Securities Fund | $6 | $ 2 | $- |
Six months ended May 31, 2023 | Year ended November 30, 2022 | |
| Fidelity Convertible Securities Fund | ||
| Distributions to shareholders | ||
| Class A | $ 1,288 | $9,999 |
| Class M | 218 | 1,853 |
| Class C | 201 | 3,063 |
| Convertible Securities | 45,668 | 334,483 |
| Class I | 1,943 | 16,854 |
| Class Z | 1,326 | 10,115 |
Total | $50,644 | $376,367 |
| Shares | Shares | Dollars | Dollars | |
Six months ended May 31, 2023 | Year ended November 30, 2022 | Six months ended May 31, 2023 | Year ended November 30, 2022 | |
| Fidelity Convertible Securities Fund | ||||
| Class A | ||||
| Shares sold | 87 | 345 | $2,632 | $11,765 |
| Reinvestment of distributions | 42 | 267 | 1,244 | 9,618 |
| Shares redeemed | (164) | (476) | (4,987) | (15,584) |
| Net increase (decrease) | (35) | 136 | $(1,111) | $5,799 |
| Class M | ||||
| Shares sold | 4 | 22 | $128 | $739 |
| Reinvestment of distributions | 7 | 51 | 216 | 1,834 |
| Shares redeemed | (18) | (73) | (551) | (2,434) |
| Net increase (decrease) | (7) | - | $(207) | $139 |
| Class C | ||||
| Shares sold | 34 | 62 | $1,026 | $2,080 |
| Reinvestment of distributions | 7 | 84 | 200 | 3,040 |
| Shares redeemed | (63) | (330) | (1,895) | (11,038) |
| Net increase (decrease) | (22) | (184) | $(669) | $(5,918) |
| Convertible Securities | ||||
| Shares sold | 1,714 | 3,810 | $52,706 | $127,430 |
| Reinvestment of distributions | 1,368 | 8,254 | 40,702 | 298,970 |
| Shares redeemed | (3,973) | (7,761) | (121,589) | (256,520) |
| Net increase (decrease) | (891) | 4,303 | $(28,181) | $169,880 |
| Class I | ||||
| Shares sold | 1,440 | 3,547 | $43,480 | $116,065 |
| Reinvestment of distributions | 64 | 436 | 1,909 | 15,728 |
| Shares redeemed | (1,519) | (3,593) | (46,716) | (118,871) |
| Net increase (decrease) | (15) | 390 | $(1,327) | $12,922 |
| Class Z | ||||
| Shares sold | 847 | 880 | $25,907 | $29,080 |
| Reinvestment of distributions | 42 | 253 | 1,243 | 9,135 |
| Shares redeemed | (314) | (1,115) | (9,622) | (36,173) |
| Net increase (decrease) | 575 | 18 | $17,528 | $2,042 |
| The Example is based on an investment of $1,000 invested at the beginning of the period and held for the entire period (December 1, 2022 to May 31, 2023). |
Annualized Expense Ratio- A | Beginning Account Value December 1, 2022 | Ending Account Value May 31, 2023 | Expenses Paid During Period- C December 1, 2022 to May 31, 2023 | |||||||
| Fidelity® Convertible Securities Fund | ||||||||||
| Class A | 1.04% | |||||||||
| Actual | $ 1,000 | $ 992.90 | $ 5.17 | |||||||
Hypothetical- B | $ 1,000 | $ 1,019.75 | $ 5.24 | |||||||
| Class M | 1.29% | |||||||||
| Actual | $ 1,000 | $ 991.30 | $ 6.40 | |||||||
Hypothetical- B | $ 1,000 | $ 1,018.50 | $ 6.49 | |||||||
| Class C | 1.80% | |||||||||
| Actual | $ 1,000 | $ 989.20 | $ 8.93 | |||||||
Hypothetical- B | $ 1,000 | $ 1,015.96 | $ 9.05 | |||||||
| Fidelity® Convertible Securities Fund | .74% | |||||||||
| Actual | $ 1,000 | $ 994.50 | $ 3.68 | |||||||
Hypothetical- B | $ 1,000 | $ 1,021.24 | $ 3.73 | |||||||
| Class I | .74% | |||||||||
| Actual | $ 1,000 | $ 994.50 | $ 3.68 | |||||||
Hypothetical- B | $ 1,000 | $ 1,021.24 | $ 3.73 | |||||||
| Class Z | .65% | |||||||||
| Actual | $ 1,000 | $ 994.60 | $ 3.23 | |||||||
Hypothetical- B | $ 1,000 | $ 1,021.69 | $ 3.28 | |||||||
- Highly liquid investments - cash or convertible to cash within three business days or less
- Moderately liquid investments - convertible to cash in three to seven calendar days
- Less liquid investments - can be sold or disposed of, but not settled, within seven calendar days
- Illiquid investments - cannot be sold or disposed of within seven calendar days
 |


Contents
Top Holdings (% of Fund's net assets) | ||
| Johnson & Johnson | 3.5 | |
| Exxon Mobil Corp. | 2.8 | |
| Comcast Corp. Class A | 2.8 | |
| Wells Fargo & Co. | 2.7 | |
| Unilever PLC sponsored ADR | 2.3 | |
| Cisco Systems, Inc. | 2.3 | |
| Verizon Communications, Inc. | 1.9 | |
| Sanofi SA sponsored ADR | 1.9 | |
| M&T Bank Corp. | 1.9 | |
| Microchip Technology, Inc. | 1.8 | |
| 23.9 | ||
| Market Sectors (% of Fund's net assets) | ||
| Financials | 19.9 | |
| Health Care | 15.1 | |
| Information Technology | 10.9 | |
| Consumer Staples | 9.9 | |
| Industrials | 9.6 | |
| Energy | 7.5 | |
| Communication Services | 6.8 | |
| Utilities | 6.8 | |
| Real Estate | 4.1 | |
| Consumer Discretionary | 4.0 | |
| Materials | 2.1 | |
Asset Allocation (% of Fund's net assets) |
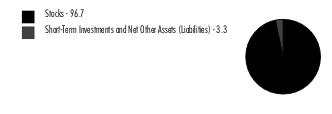 |
Written Options - (0.0)% |
Percentages shown as 0.0% may reflect amounts less than 0.05%. |
Geographic Diversification (% of Fund's net assets) |
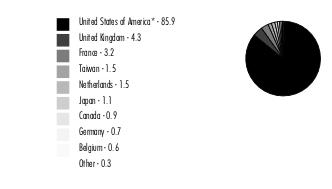 |
* Includes Short-Term investments and Net Other Assets (Liabilities). Percentages are adjusted for the effect of derivatives, if applicable. |
| Common Stocks - 96.7% | |||
| Shares | Value ($) (000s) | ||
| COMMUNICATION SERVICES - 6.8% | |||
| Diversified Telecommunication Services - 2.6% | |||
| Deutsche Telekom AG | 1,673,400 | 37,125 | |
| Verizon Communications, Inc. | 2,987,100 | 106,430 | |
| 143,555 | |||
| Entertainment - 0.8% | |||
| Activision Blizzard, Inc. | 547,200 | 43,885 | |
| Media - 3.4% | |||
| Comcast Corp. Class A | 3,993,300 | 157,136 | |
| Omnicom Group, Inc. | 345,100 | 30,434 | |
| 187,570 | |||
TOTAL COMMUNICATION SERVICES | 375,010 | ||
| CONSUMER DISCRETIONARY - 4.0% | |||
| Broadline Retail - 0.7% | |||
| eBay, Inc. | 866,300 | 36,852 | |
| Household Durables - 0.5% | |||
| Whirlpool Corp. (a) | 206,200 | 26,660 | |
| Leisure Products - 0.3% | |||
| Hasbro, Inc. | 327,400 | 19,431 | |
| Specialty Retail - 2.0% | |||
| Best Buy Co., Inc. | 274,700 | 19,962 | |
| Lowe's Companies, Inc. | 235,400 | 47,346 | |
| Williams-Sonoma, Inc. (a) | 373,900 | 42,441 | |
| 109,749 | |||
| Textiles, Apparel & Luxury Goods - 0.5% | |||
| Tapestry, Inc. | 732,200 | 29,303 | |
TOTAL CONSUMER DISCRETIONARY | 221,995 | ||
| CONSUMER STAPLES - 9.9% | |||
| Beverages - 3.1% | |||
| Anheuser-Busch InBev SA NV ADR (a) | 670,600 | 35,810 | |
| Coca-Cola European Partners PLC | 975,600 | 60,868 | |
| Keurig Dr. Pepper, Inc. | 891,900 | 27,756 | |
| The Coca-Cola Co. (b) | 813,800 | 48,551 | |
| 172,985 | |||
| Consumer Staples Distribution & Retail - 0.8% | |||
| Albertsons Companies, Inc. | 2,213,900 | 45,075 | |
| Food Products - 0.5% | |||
| Tyson Foods, Inc. Class A | 563,500 | 28,536 | |
| Household Products - 2.0% | |||
| Energizer Holdings, Inc. | 501,300 | 16,342 | |
| Reckitt Benckiser Group PLC | 594,500 | 46,229 | |
| Reynolds Consumer Products, Inc. (a) | 1,613,500 | 44,274 | |
| 106,845 | |||
| Personal Care Products - 2.5% | |||
| Kenvue, Inc. (a) | 520,100 | 13,049 | |
| Unilever PLC sponsored ADR (a) | 2,519,300 | 125,814 | |
| 138,863 | |||
| Tobacco - 1.0% | |||
| Philip Morris International, Inc. (b) | 615,200 | 55,374 | |
TOTAL CONSUMER STAPLES | 547,678 | ||
| ENERGY - 7.5% | |||
| Oil, Gas & Consumable Fuels - 7.5% | |||
| Enterprise Products Partners LP | 3,621,200 | 91,725 | |
| Exxon Mobil Corp. | 1,543,100 | 157,674 | |
| Parkland Corp. | 1,114,200 | 27,791 | |
| Shell PLC ADR | 1,448,600 | 81,122 | |
| TotalEnergies SE | 964,500 | 54,428 | |
| 412,740 | |||
| FINANCIALS - 19.9% | |||
| Banks - 10.2% | |||
| Cullen/Frost Bankers, Inc. | 292,400 | 29,298 | |
| Huntington Bancshares, Inc. | 4,708,600 | 48,546 | |
| JPMorgan Chase & Co. | 285,600 | 38,759 | |
| M&T Bank Corp. (a) | 869,100 | 103,562 | |
| PNC Financial Services Group, Inc. | 837,500 | 97,008 | |
| U.S. Bancorp | 3,279,200 | 98,048 | |
| Wells Fargo & Co. | 3,707,408 | 147,592 | |
| 562,813 | |||
| Capital Markets - 2.9% | |||
| Bank of New York Mellon Corp. | 945,900 | 38,025 | |
| CME Group, Inc. | 250,700 | 44,813 | |
| LPL Financial | 171,900 | 33,483 | |
| State Street Corp. | 407,500 | 27,718 | |
| UBS Group AG (c) | 674,200 | 12,749 | |
| 156,788 | |||
| Financial Services - 3.2% | |||
| Fidelity National Information Services, Inc. | 1,134,500 | 61,910 | |
| Global Payments, Inc. | 693,000 | 67,699 | |
| Visa, Inc. Class A | 222,000 | 49,069 | |
| 178,678 | |||
| Insurance - 3.6% | |||
| Assurant, Inc. | 144,600 | 17,351 | |
| AXA SA | 2,158,900 | 61,206 | |
| Chubb Ltd. | 265,779 | 49,382 | |
| First American Financial Corp. | 390,200 | 21,434 | |
| The Travelers Companies, Inc. | 278,000 | 47,049 | |
| 196,422 | |||
TOTAL FINANCIALS | 1,094,701 | ||
| HEALTH CARE - 15.1% | |||
| Health Care Providers & Services - 3.9% | |||
| AmerisourceBergen Corp. | 164,800 | 28,041 | |
| Cigna Group | 226,600 | 56,063 | |
| Elevance Health, Inc. | 153,800 | 68,875 | |
| UnitedHealth Group, Inc. (b) | 123,700 | 60,272 | |
| 213,251 | |||
| Pharmaceuticals - 11.2% | |||
| Bristol-Myers Squibb Co. | 1,498,700 | 96,576 | |
| Johnson & Johnson | 1,255,066 | 194,610 | |
| Merck & Co., Inc. (b) | 867,200 | 95,748 | |
| Organon & Co. | 1,240,470 | 24,053 | |
| Roche Holding AG (participation certificate) | 184,910 | 58,895 | |
| Royalty Pharma PLC | 1,307,000 | 42,791 | |
| Sanofi SA sponsored ADR | 2,076,500 | 105,943 | |
| 618,616 | |||
TOTAL HEALTH CARE | 831,867 | ||
| INDUSTRIALS - 9.6% | |||
| Aerospace & Defense - 1.0% | |||
| General Dynamics Corp. | 284,000 | 57,987 | |
| Building Products - 1.2% | |||
| Carlisle Companies, Inc. | 122,000 | 25,918 | |
| Owens Corning | 358,400 | 38,109 | |
| 64,027 | |||
| Electrical Equipment - 1.4% | |||
| Regal Rexnord Corp. | 604,400 | 78,506 | |
| Industrial Conglomerates - 1.1% | |||
| Hitachi Ltd. | 1,016,700 | 58,714 | |
| Machinery - 2.1% | |||
| Allison Transmission Holdings, Inc. | 1,139,600 | 53,903 | |
| Parker Hannifin Corp. | 195,300 | 62,582 | |
| 116,485 | |||
| Professional Services - 2.8% | |||
| Genpact Ltd. | 762,100 | 28,030 | |
| Manpower, Inc. | 266,000 | 18,665 | |
| Robert Half International, Inc. | 273,300 | 17,770 | |
| Science Applications International Corp. | 426,200 | 41,482 | |
| SS&C Technologies Holdings, Inc. | 869,200 | 47,771 | |
| 153,718 | |||
TOTAL INDUSTRIALS | 529,437 | ||
| INFORMATION TECHNOLOGY - 10.9% | |||
| Communications Equipment - 2.3% | |||
| Cisco Systems, Inc. | 2,521,100 | 125,223 | |
| IT Services - 3.6% | |||
| Amdocs Ltd. | 684,328 | 64,443 | |
| Capgemini SA | 333,900 | 58,104 | |
| Cognizant Technology Solutions Corp. Class A | 473,700 | 29,602 | |
| IBM Corp. | 362,100 | 46,562 | |
| 198,711 | |||
| Semiconductors & Semiconductor Equipment - 3.3% | |||
| Microchip Technology, Inc. | 1,305,850 | 98,278 | |
| Taiwan Semiconductor Manufacturing Co. Ltd. sponsored ADR | 856,500 | 84,442 | |
| 182,720 | |||
| Software - 1.7% | |||
| Gen Digital, Inc. | 318,725 | 5,590 | |
| Microsoft Corp. | 206,800 | 67,911 | |
| Open Text Corp. | 543,500 | 22,597 | |
| 96,098 | |||
TOTAL INFORMATION TECHNOLOGY | 602,752 | ||
| MATERIALS - 2.1% | |||
| Chemicals - 1.6% | |||
| Celanese Corp. Class A | 298,600 | 31,060 | |
| CF Industries Holdings, Inc. | 662,800 | 40,769 | |
| Olin Corp. | 389,400 | 18,423 | |
| 90,252 | |||
| Containers & Packaging - 0.5% | |||
| Berry Global Group, Inc. | 483,300 | 27,650 | |
TOTAL MATERIALS | 117,902 | ||
| REAL ESTATE - 4.1% | |||
| Equity Real Estate Investment Trusts (REITs) - 4.1% | |||
| Alexandria Real Estate Equities, Inc. | 261,400 | 29,658 | |
| American Tower Corp. | 177,400 | 32,720 | |
| Corporate Office Properties Trust (SBI) | 1,513,700 | 34,543 | |
| Crown Castle International Corp. | 224,400 | 25,404 | |
| Digital Realty Trust, Inc. | 322,200 | 33,013 | |
| Essex Property Trust, Inc. | 118,700 | 25,646 | |
| Gaming & Leisure Properties | 284,100 | 13,677 | |
| Public Storage | 117,500 | 33,288 | |
| 227,949 | |||
| UTILITIES - 6.8% | |||
| Electric Utilities - 4.4% | |||
| Duke Energy Corp. (b) | 926,300 | 82,709 | |
| Edison International | 1,047,794 | 70,747 | |
| Exelon Corp. | 1,067,100 | 42,311 | |
| FirstEnergy Corp. | 1,197,100 | 44,760 | |
| 240,527 | |||
| Independent Power and Renewable Electricity Producers - 0.8% | |||
| Vistra Corp. | 1,808,100 | 43,340 | |
| Multi-Utilities - 1.6% | |||
| Dominion Energy, Inc. | 693,600 | 34,874 | |
| Sempra Energy | 384,500 | 55,187 | |
| 90,061 | |||
TOTAL UTILITIES | 373,928 | ||
| TOTAL COMMON STOCKS (Cost $5,014,561) | 5,335,959 | ||
| Money Market Funds - 7.0% | |||
| Shares | Value ($) (000s) | ||
| Fidelity Cash Central Fund 5.14% (d) | 171,839,472 | 171,874 | |
| Fidelity Securities Lending Cash Central Fund 5.14% (d)(e) | 211,084,667 | 211,106 | |
| TOTAL MONEY MARKET FUNDS (Cost $382,980) | 382,980 | ||
| TOTAL INVESTMENT IN SECURITIES - 103.7% (Cost $5,397,541) | 5,718,939 |
NET OTHER ASSETS (LIABILITIES) - (3.7)% | (201,798) |
| NET ASSETS - 100.0% | 5,517,141 |
| Written Options | ||||||
| Counterparty | Number of Contracts | Notional Amount ($) (000s) | Exercise Price ($) | Expiration Date | Value ($) (000s) | |
| Call Options | ||||||
| Duke Energy Corp. | Chicago Board Options Exchange | 1,369 | 12,224 | 105.00 | 07/21/23 | (10) |
| Merck & Co., Inc. | Chicago Board Options Exchange | 837 | 9,241 | 125.00 | 07/21/23 | (17) |
| Philip Morris International, Inc. | Chicago Board Options Exchange | 609 | 5,482 | 100.00 | 06/16/23 | (3) |
| The Coca-Cola Co. | Chicago Board Options Exchange | 1,217 | 7,261 | 67.50 | 07/21/23 | (4) |
| UnitedHealth Group, Inc. | Chicago Board Options Exchange | 76 | 3,703 | 520.00 | 07/21/23 | (32) |
| TOTAL WRITTEN OPTIONS | (66) | |||||
| (a) | Security or a portion of the security is on loan at period end. |
| (b) | Security or a portion of the security is pledged as collateral for options written. At period end, the value of securities pledged amounted to $37,911,000. |
| (c) | Non-income producing |
| (d) | Affiliated fund that is generally available only to investment companies and other accounts managed by Fidelity Investments. The rate quoted is the annualized seven-day yield of the fund at period end. A complete unaudited listing of the fund's holdings as of its most recent quarter end is available upon request. In addition, each Fidelity Central Fund's financial statements are available on the SEC's website or upon request. |
| (e) | Investment made with cash collateral received from securities on loan. |
| Affiliate (Amounts in thousands) | Value, beginning of period ($) | Purchases ($) | Sales Proceeds ($) | Dividend Income ($) | Realized Gain (loss) ($) | Change in Unrealized appreciation (depreciation) ($) | Value, end of period ($) | % ownership, end of period |
| Fidelity Cash Central Fund 5.14% | 189,261 | 534,919 | 552,306 | 3,944 | - | - | 171,874 | 0.4% |
| Fidelity Securities Lending Cash Central Fund 5.14% | 181,944 | 591,857 | 562,695 | 450 | - | - | 211,106 | 0.7% |
| Total | 371,205 | 1,126,776 | 1,115,001 | 4,394 | - | - | 382,980 | |
| Valuation Inputs at Reporting Date: | ||||
Description (Amounts in thousands) | Total ($) | Level 1 ($) | Level 2 ($) | Level 3 ($) |
Investments in Securities: | ||||
| Equities: | ||||
Communication Services | 375,010 | 337,885 | 37,125 | - |
Consumer Discretionary | 221,995 | 221,995 | - | - |
Consumer Staples | 547,678 | 501,449 | 46,229 | - |
Energy | 412,740 | 358,312 | 54,428 | - |
Financials | 1,094,701 | 1,033,495 | 61,206 | - |
Health Care | 831,867 | 772,972 | 58,895 | - |
Industrials | 529,437 | 529,437 | - | - |
Information Technology | 602,752 | 602,752 | - | - |
Materials | 117,902 | 117,902 | - | - |
Real Estate | 227,949 | 227,949 | - | - |
Utilities | 373,928 | 373,928 | - | - |
| Money Market Funds | 382,980 | 382,980 | - | - |
| Total Investments in Securities: | 5,718,939 | 5,461,056 | 257,883 | - |
Derivative Instruments: | ||||
| Liabilities | ||||
Written Options | (66) | (66) | - | - |
| Total Liabilities | (66) | (66) | - | - |
| Total Derivative Instruments: | (66) | (66) | - | - |
Primary Risk Exposure / Derivative Type | Value | |
| (Amounts in thousands) | Asset ($) | Liability ($) |
| Equity Risk | ||
Written Options (a) | 0 | (66) |
| Total Equity Risk | 0 | (66) |
| Total Value of Derivatives | 0 | (66) |
| Statement of Assets and Liabilities | ||||
| Amounts in thousands (except per-share amounts) | May 31, 2023 (Unaudited) | |||
| Assets | ||||
| Investment in securities, at value (including securities loaned of $200,220) - See accompanying schedule: | ||||
Unaffiliated issuers (cost $5,014,561) | $ | 5,335,959 | ||
Fidelity Central Funds (cost $382,980) | 382,980 | |||
| Total Investment in Securities (cost $5,397,541) | $ | 5,718,939 | ||
| Receivable for investments sold | 3,990 | |||
| Receivable for fund shares sold | 435 | |||
| Dividends receivable | 20,843 | |||
| Distributions receivable from Fidelity Central Funds | 1,079 | |||
| Prepaid expenses | 1 | |||
| Other receivables | 138 | |||
Total assets | 5,745,425 | |||
| Liabilities | ||||
| Payable for investments purchased | $ | 9,585 | ||
| Payable for fund shares redeemed | 4,829 | |||
| Accrued management fee | 2,001 | |||
| Written options, at value (premium received $431) | 66 | |||
| Other affiliated payables | 643 | |||
| Other payables and accrued expenses | 54 | |||
| Collateral on securities loaned | 211,106 | |||
| Total Liabilities | 228,284 | |||
| Net Assets | $ | 5,517,141 | ||
| Net Assets consist of: | ||||
| Paid in capital | $ | 5,045,856 | ||
| Total accumulated earnings (loss) | 471,285 | |||
| Net Assets | $ | 5,517,141 | ||
| Net Asset Value and Maximum Offering Price | ||||
| Equity Dividend Income : | ||||
Net Asset Value , offering price and redemption price per share ($4,742,826 ÷ 188,651 shares) | $ | 25.14 | ||
| Class K : | ||||
Net Asset Value , offering price and redemption price per share ($774,315 ÷ 30,808 shares) | $ | 25.13 | ||
| Statement of Operations | ||||
| Amounts in thousands | Six months ended May 31, 2023 (Unaudited) | |||
| Investment Income | ||||
| Dividends | $ | 89,124 | ||
| Income from Fidelity Central Funds (including $450 from security lending) | 4,394 | |||
| Total Income | 93,518 | |||
| Expenses | ||||
| Management fee | $ | 12,364 | ||
| Transfer agent fees | 3,415 | |||
| Accounting fees | 496 | |||
| Custodian fees and expenses | 129 | |||
| Independent trustees' fees and expenses | 18 | |||
| Registration fees | 58 | |||
| Audit | 51 | |||
| Legal | 3 | |||
| Miscellaneous | 15 | |||
| Total expenses before reductions | 16,549 | |||
| Expense reductions | (135) | |||
| Total expenses after reductions | 16,414 | |||
| Net Investment income (loss) | 77,104 | |||
| Realized and Unrealized Gain (Loss) | ||||
| Net realized gain (loss) on: | ||||
| Investment Securities: | ||||
| Unaffiliated issuers | 98,625 | |||
| Foreign currency transactions | 127 | |||
| Total net realized gain (loss) | 98,752 | |||
| Change in net unrealized appreciation (depreciation) on: | ||||
| Investment Securities: | ||||
| Unaffiliated issuers | (443,689) | |||
| Assets and liabilities in foreign currencies | (5) | |||
| Written options | 365 | |||
| Total change in net unrealized appreciation (depreciation) | (443,329) | |||
| Net gain (loss) | (344,577) | |||
| Net increase (decrease) in net assets resulting from operations | $ | (267,473) | ||
| Statement of Changes in Net Assets | ||||
| Amount in thousands | Six months ended May 31, 2023 (Unaudited) | Year ended November 30, 2022 | ||
| Increase (Decrease) in Net Assets | ||||
| Operations | ||||
| Net investment income (loss) | $ | 77,104 | $ | 132,281 |
| Net realized gain (loss) | 98,752 | 318,761 | ||
| Change in net unrealized appreciation (depreciation) | (443,329) | 91,598 | ||
| Net increase (decrease) in net assets resulting from operations | (267,473) | 542,640 | ||
| Distributions to shareholders | (349,322) | (636,444) | ||
| Share transactions - net increase (decrease) | 135,792 | 429,005 | ||
| Total increase (decrease) in net assets | (481,003) | 335,201 | ||
| Net Assets | ||||
| Beginning of period | 5,998,144 | 5,662,943 | ||
| End of period | $ | 5,517,141 | $ | 5,998,144 |
| Fidelity® Equity Dividend Income Fund |
Six months ended (Unaudited) May 31, 2023 | Years ended November 30, 2022 | 2021 | 2020 | 2019 | 2018 | |||||||
Selected Per-Share Data | ||||||||||||
| Net asset value, beginning of period | $ | 28.03 | $ | 28.54 | $ | 24.68 | $ | 26.64 | $ | 27.18 | $ | 29.62 |
| Income from Investment Operations | ||||||||||||
Net investment income (loss) A,B | .35 | .62 | .63 | .62 | .65 | .66 | ||||||
| Net realized and unrealized gain (loss) | (1.60) | 2.06 | 3.88 | (.46) | 1.92 | (.27) | ||||||
| Total from investment operations | (1.25) | 2.68 | 4.51 | .16 | 2.57 | .39 | ||||||
| Distributions from net investment income | (.28) | (.59) | (.64) | (.63) | (.62) | (.66) | ||||||
| Distributions from net realized gain | (1.36) | (2.60) | (.01) | (1.50) | (2.49) | (2.18) | ||||||
| Total distributions | (1.64) | (3.19) | (.65) | (2.12) C | (3.11) | (2.83) C | ||||||
| Net asset value, end of period | $ | 25.14 | $ | 28.03 | $ | 28.54 | $ | 24.68 | $ | 26.64 | $ | 27.18 |
Total Return D,E | (4.56)% | 9.72% | 18.40% | .76% | 12.07% | 1.28% | ||||||
Ratios to Average Net Assets B,F,G | ||||||||||||
| Expenses before reductions | .58% H | .58% | .58% | .60% | .60% | .61% | ||||||
| Expenses net of fee waivers, if any | .58% H | .57% | .58% | .60% | .60% | .61% | ||||||
| Expenses net of all reductions | .58% H | .57% | .58% | .59% | .60% | .60% | ||||||
| Net investment income (loss) | 2.65% H | 2.28% | 2.21% | 2.72% | 2.65% | 2.39% | ||||||
| Supplemental Data | ||||||||||||
| Net assets, end of period (in millions) | $ | 4,743 | $ | 5,186 | $ | 4,903 | $ | 4,409 | $ | 4,949 | $ | 4,882 |
Portfolio turnover rate I | 41% H | 48% | 47% | 71% | 52% | 56% |
| Fidelity® Equity Dividend Income Fund Class K |
Six months ended (Unaudited) May 31, 2023 | Years ended November 30, 2022 | 2021 | 2020 | 2019 | 2018 | |||||||
Selected Per-Share Data | ||||||||||||
| Net asset value, beginning of period | $ | 28.03 | $ | 28.53 | $ | 24.67 | $ | 26.64 | $ | 27.18 | $ | 29.62 |
| Income from Investment Operations | ||||||||||||
Net investment income (loss) A,B | .36 | .65 | .65 | .63 | .68 | .69 | ||||||
| Net realized and unrealized gain (loss) | (1.61) | 2.06 | 3.89 | (.45) | 1.91 | (.27) | ||||||
| Total from investment operations | (1.25) | 2.71 | 4.54 | .18 | 2.59 | .42 | ||||||
| Distributions from net investment income | (.29) | (.62) | (.66) | (.65) | (.64) | (.69) | ||||||
| Distributions from net realized gain | (1.36) | (2.60) | (.01) | (1.50) | (2.49) | (2.18) | ||||||
| Total distributions | (1.65) | (3.21) C | (.68) C | (2.15) | (3.13) | (2.86) C | ||||||
| Net asset value, end of period | $ | 25.13 | $ | 28.03 | $ | 28.53 | $ | 24.67 | $ | 26.64 | $ | 27.18 |
Total Return D,E | (4.55)% | 9.86% | 18.51% | .84% | 12.18% | 1.39% | ||||||
Ratios to Average Net Assets B,F,G | ||||||||||||
| Expenses before reductions | .49% H | .49% | .49% | .51% | .51% | .51% | ||||||
| Expenses net of fee waivers, if any | .49% H | .49% | .49% | .51% | .51% | .51% | ||||||
| Expenses net of all reductions | .49% H | .49% | .49% | .50% | .51% | .50% | ||||||
| Net investment income (loss) | 2.73% H | 2.37% | 2.30% | 2.81% | 2.74% | 2.49% | ||||||
| Supplemental Data | ||||||||||||
| Net assets, end of period (in millions) | $ | 774 | $ | 812 | $ | 760 | $ | 696 | $ | 300 | $ | 220 |
Portfolio turnover rate I | 41% H | 48% | 47% | 71% | 52% | 56% |
| Fidelity Central Fund | Investment Manager | Investment Objective | Investment Practices | Expense Ratio A |
| Fidelity Money Market Central Funds | Fidelity Management & Research Company LLC (FMR) | Each fund seeks to obtain a high level of current income consistent with the preservation of capital and liquidity. | Short-term Investments | Less than .005% |
| Gross unrealized appreciation | $714,089 |
| Gross unrealized depreciation | (394,557) |
| Net unrealized appreciation (depreciation) | $319,532 |
| Tax cost | $5,399,772 |
| Equity Risk | Equity risk relates to the fluctuations in the value of financial instruments as a result of changes in market prices (other than those arising from interest rate risk or foreign exchange risk), whether caused by factors specific to an individual investment, its issuer, or all factors affecting all instruments traded in a market or market segment. |
| Purchases ($) | Sales ($) | |
| Fidelity Equity Dividend Income Fund | 1,151,527 | 1,258,403 |
| Amount | % of Class-Level Average Net Assets A | |
| Equity Dividend Income | $3,250 | .13 |
| Class K | 165 | .04 |
| $3,415 |
| % of Average Net Assets | |
| Fidelity Equity Dividend Income Fund | .02 |
| Amount | |
| Fidelity Equity Dividend Income Fund | $25 |
| Purchases ($) | Sales ($) | Realized Gain (Loss) ($) | |
| Fidelity Equity Dividend Income Fund | 141,671 | 90,105 | 16,643 |
| Amount | |
| Fidelity Equity Dividend Income Fund | $6 |
| Total Security Lending Fees Paid to NFS | Security Lending Income From Securities Loaned to NFS | Value of Securities Loaned to NFS at Period End | |
| Fidelity Equity Dividend Income Fund | $49 | $10 | $11,392 |
Six months ended May 31, 2023 | Year ended November 30, 2022 | |
| Fidelity Equity Dividend Income Fund | ||
| Distributions to shareholders | ||
| Equity Dividend Income | $302,522 | $551,350 |
| Class K | 46,800 | 85,094 |
Total | $349,322 | $636,444 |
| Shares | Shares | Dollars | Dollars | |
Six months ended May 31, 2023 | Year ended November 30, 2022 | Six months ended May 31, 2023 | Year ended November 30, 2022 | |
| Fidelity Equity Dividend Income Fund | ||||
| Equity Dividend Income | ||||
| Shares sold | 4,982 | 13,861 | $131,542 | $380,818 |
| Reinvestment of distributions | 10,962 | 18,689 | 281,332 | 515,591 |
| Shares redeemed | (12,284) | (19,380) | (322,208) | (528,369) |
| Net increase (decrease) | 3,660 | 13,170 | $90,666 | $368,040 |
| Class K | ||||
| Shares sold | 4,705 | 10,839 | $122,498 | $295,244 |
| Reinvestment of distributions | 1,824 | 3,085 | 46,800 | 85,094 |
| Shares redeemed | (4,694) | (11,583) | (124,172) | (319,373) |
| Net increase (decrease) | 1,835 | 2,341 | $45,126 | $60,965 |
| The Example is based on an investment of $1,000 invested at the beginning of the period and held for the entire period (December 1, 2022 to May 31, 2023). |
Annualized Expense Ratio- A | Beginning Account Value December 1, 2022 | Ending Account Value May 31, 2023 | Expenses Paid During Period- C December 1, 2022 to May 31, 2023 | |||||||
| Fidelity® Equity Dividend Income Fund | ||||||||||
| Fidelity® Equity Dividend Income Fund | .58% | |||||||||
| Actual | $ 1,000 | $ 954.40 | $ 2.83 | |||||||
Hypothetical- B | $ 1,000 | $ 1,022.04 | $ 2.92 | |||||||
| Class K | .49% | |||||||||
| Actual | $ 1,000 | $ 954.50 | $ 2.39 | |||||||
Hypothetical- B | $ 1,000 | $ 1,022.49 | $ 2.47 | |||||||
- Highly liquid investments - cash or convertible to cash within three business days or less
- Moderately liquid investments - convertible to cash in three to seven calendar days
- Less liquid investments - can be sold or disposed of, but not settled, within seven calendar days
- Illiquid investments - cannot be sold or disposed of within seven calendar days
 |
Item 2.
Code of Ethics
Not applicable.
Item 3.
Audit Committee Financial Expert
Not applicable.
Item 4.
Principal Accountant Fees and Services
Not applicable.
Item 5.
Audit Committee of Listed Registrants
Not applicable.
Item 6.
Investments
(a)
Not applicable.
(b)
Not applicable
Item 7.
Disclosure of Proxy Voting Policies and Procedures for Closed-End Management Investment Companies
Not applicable.
Item 8.
Portfolio Managers of Closed-End Management Investment Companies
Not applicable.
Item 9.
Purchase of Equity Securities by Closed-End Management Investment Company and Affiliated Purchasers
Not applicable.
Item 10.
Submission of Matters to a Vote of Security Holders
There were no material changes to the procedures by which shareholders may recommend nominees to the Fidelity Financial Trust’s Board of Trustees.
Item 11.
Controls and Procedures
(a)(i) The President and Treasurer and the Chief Financial Officer have concluded that the Fidelity Financial Trust’s (the “Trust”) disclosure controls and procedures (as defined
in Rule 30a-3(c) under the Investment Company Act) provide reasonable assurances that material information relating to the Trust is made known to them by the appropriate persons, based on their evaluation of these controls and procedures as of a date within 90 days of the filing date of this report.
(a)(ii) There was no change in the Trust’s internal control over financial reporting (as defined in Rule 30a-3(d) under the Investment Company Act) that occurred during the period covered by this report that has materially affected, or is reasonably likely to materially affect, the Trust’s internal control over financial reporting.
Item 12.
Disclosure of Securities Lending Activities for Closed-End Management
Investment Companies
Not applicable.
Item 13.
Exhibits
(a) | (1) | Not applicable. |
(a) | (2) | |
(a) | (3) | Not applicable. |
(b) |
SIGNATURES
Pursuant to the requirements of the Securities Exchange Act of 1934 and the Investment Company Act of 1940, the registrant has duly caused this report to be signed on its behalf by the undersigned, thereunto duly authorized.
Fidelity Financial Trust
By: | /s/Stacie M. Smith |
Stacie M. Smith | |
President and Treasurer | |
Date: | July 20, 2023 |
Pursuant to the requirements of the Securities Exchange Act of 1934 and the Investment Company Act of 1940, this report has been signed below by the following persons on behalf of the registrant and in the capacities and on the dates indicated.
By: | /s/Stacie M. Smith |
Stacie M. Smith | |
President and Treasurer | |
Date: | July 20, 2023 |
By: | /s/John J. Burke III |
John J. Burke III | |
Chief Financial Officer | |
Date: | July 20, 2023 |