UNITED STATES
SECURITIES AND EXCHANGE COMMISSION
Washington, D.C. 20549
FORM N-CSR
CERTIFIED SHAREHOLDER REPORT OF REGISTERED
MANAGEMENT INVESTMENT COMPANIES
Investment Company Act file number 811-3587
Fidelity Financial Trust
(Exact name of registrant as specified in charter)
82 Devonshire St., Boston, Massachusetts 02109
(Address of principal executive offices) (Zip code)
Scott C. Goebel, Secretary
82 Devonshire St.
Boston, Massachusetts 02109
(Name and address of agent for service)
Registrant's telephone number, including area code: 617-563-7000
Date of fiscal year end: | November 30 |
|
|
Date of reporting period: | November 30, 2010 |
Item 1. Reports to Stockholders
Fidelity®
Convertible Securities
Fund
Annual Report
November 30, 2010
(2_fidelity_logos) (Registered_Trademark)
Contents
Chairman's Message | The Chairman's message to shareholders. | |
Performance | How the fund has done over time. | |
Management's Discussion of Fund Performance | The Portfolio Manager's review of fund performance and strategy. | |
Shareholder Expense Example | An example of shareholder expenses. | |
Investment Changes | A summary of major shifts in the fund's investments over the past six months. | |
Investments | A complete list of the fund's investments with their market values. | |
Financial Statements | Statements of assets and liabilities, operations, and changes in net assets, as well as financial highlights. | |
Notes | Notes to the financial statements. | |
Report of Independent Registered Public Accounting Firm |
| |
Trustees and Officers |
| |
Distributions |
| |
Board Approval of Investment Advisory Contracts and Management Fees |
|
To view a fund's proxy voting guidelines and proxy voting record for the 12-month period ended June 30, visit http://www.fidelity.com/proxyvotingresults or visit the Securities and Exchange Commission's (SEC) web site at http://www.sec.gov. You may also call 1-800-544-8544 to request a free copy of the proxy voting guidelines.
Standard & Poor's, S&P and S&P 500 are registered service marks of The McGraw-Hill Companies, Inc. and have been licensed for use by Fidelity Distributors Corporation.
Other third party marks appearing herein are the property of their respective owners.
All other marks appearing herein are registered or unregistered trademarks or service marks of FMR LLC or an affiliated company.
Annual Report
This report and the financial statements contained herein are submitted for the general information of the shareholders of the fund. This report is not authorized for distribution to prospective investors in the fund unless preceded or accompanied by an effective prospectus.
A fund files its complete schedule of portfolio holdings with the SEC for the first and third quarters of each fiscal year on Form N-Q. Forms N-Q are available on the SEC's web site at http://www.sec.gov. A fund's Forms N-Q may be reviewed and copied at the SEC's Public Reference Room in Washington, DC. Information regarding the operation of the SEC's Public Reference Room may be obtained by calling 1-800-SEC-0330. For a complete list of a fund's portfolio holdings, view the most recent holdings listing, semiannual report, or annual report on Fidelity's web site at http://www.fidelity.com or http://www.advisor.fidelity.com, or http://www.401k.com, as applicable.
NOT FDIC INSURED • MAY LOSE VALUE • NO BANK GUARANTEE
Neither the fund nor Fidelity Distributors Corporation is a bank.
Annual Report
Chairman's Message
(photo_of_James_C_Curvey)
Dear Shareholder:
Equities have staged a rally in the second half of 2010, shaking off concerns about the European debt crisis and the possibility of a double-dip recession in the U.S. Although the short-term surge pushed major equity indexes back into positive territory for the year, several questions remain about the longer-term outlook, including lackluster economic growth and persistently high unemployment. Financial markets are always unpredictable, of course, but there also are several time-tested investment principles that can help put the odds in your favor.
One of the basic tenets is to invest for the long term. Over time, riding out the markets' inevitable ups and downs has proven much more effective than selling into panic or chasing the hottest trend. Even missing only a few of the markets' best days can significantly diminish investor returns. Patience also affords the benefits of compounding - of earning interest on additional income or reinvested dividends and capital gains. There can be tax advantages and cost benefits to consider as well. While staying the course doesn't eliminate risk, it can considerably lessen the effect of short-term declines.
You can further manage your investing risk through diversification. And today, more than ever, geographic diversification should be taken into account. Studies indicate that asset allocation is the single most important determinant of a portfolio's long-term success. The right mix of stocks, bonds and cash - aligned to your particular risk tolerance and investment objective - is very important. Age-appropriate rebalancing is also an essential aspect of asset allocation. For younger investors, an emphasis on equities - which historically have been the best-performing asset class over time - is encouraged. As investors near their specific goal, such as retirement or sending a child to college, consideration may be given to replacing volatile assets (e.g. common stocks) with more-stable fixed investments (bonds or savings plans).
A third principle - investing regularly - can help lower the average cost of your purchases. Investing a certain amount of money each month or quarter helps ensure you won't pay for all your shares at market highs. This strategy - known as dollar cost averaging - also reduces "emotion" from investing, helping shareholders avoid selling weak performers just prior to an upswing, or chasing a hot performer just before a correction.
We invite you to contact us via the Internet, through our Investor Centers or by phone. It is our privilege to provide you the information you need to make the investments that are right for you.
Sincerely,
(The acting chairman's signature appears here.)
James C. Curvey
Acting Chairman
Annual Report
Performance: The Bottom Line
Average annual total return reflects the change in the value of an investment, assuming reinvestment of the fund's distributions from dividend income and capital gains (the profits earned upon the sale of securities that have grown in value, if any) and assuming a constant rate of performance each year. The $10,000 table and the fund's returns do not reflect the deduction of taxes that a shareholder would pay on fund distributions or the redemption of fund shares. During periods of reimbursement by Fidelity, a fund's total return will be greater than it would be had the reimbursement not occurred. How a fund did yesterday is no guarantee of how it will do tomorrow.
Average Annual Total Returns
Periods ended November 30, 2010 | Past 1 | Past 5 | Past 10 |
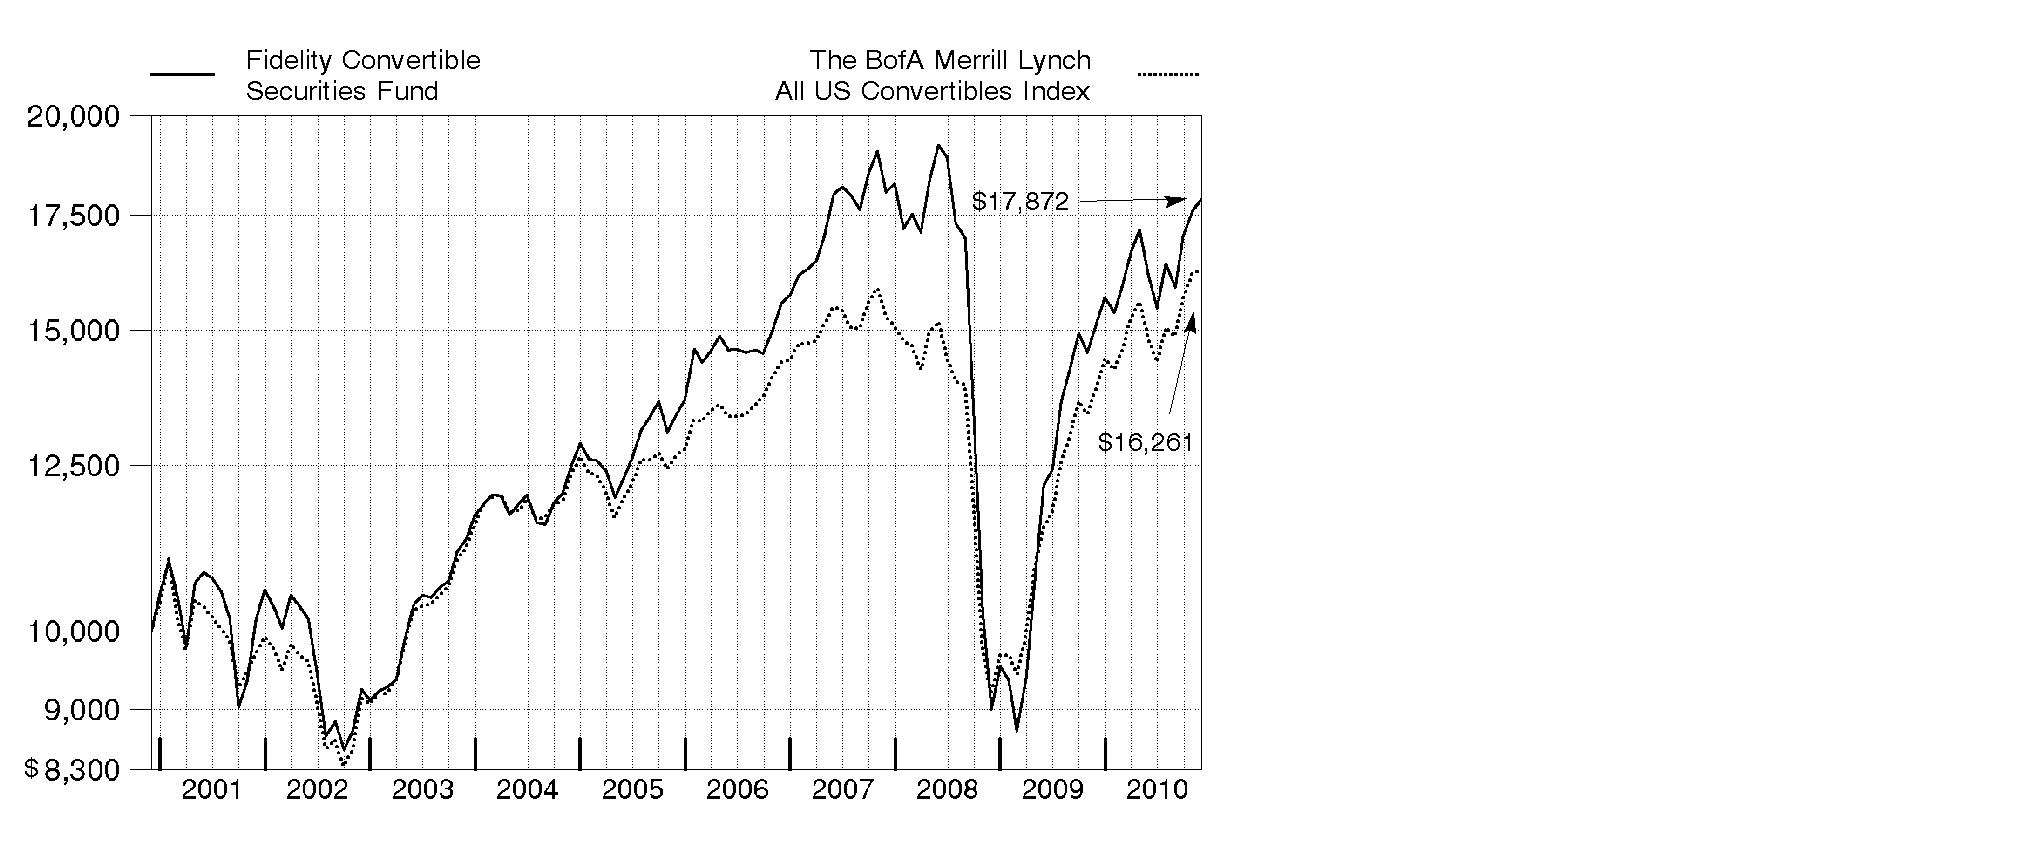
Fidelity® Convertible Securities Fund | 18.37% | 5.99% | 5.98% |
$10,000 Over 10 Years
Let's say hypothetically that $10,000 was invested in Fidelity® Convertible Securities Fund on November 30, 2000. The chart shows how the value of your investment would have changed, and also shows how The BofA Merrill Lynch All US Convertibles Index performed over the same period.
Annual Report
Management's Discussion of Fund Performance
Market Recap: Convertible securities enjoyed a strong run for the 12 months ending November 30, 2010, benefiting from their hybrid nature - with both equity- and fixed-income characteristics - in a period of low yields, heightened market volatility and rising stock prices. Convertibles returned 17.24%, according to The BofA Merrill LynchSM All US Convertibles Index, ranking them among the top-performing asset classes for the period. High-yield bonds, as measured by The BofA Merrill Lynch US High Yield Constrained Index, appreciated 16.63%, while the S&P 500® Index, a common proxy for the performance of large-capitalization U.S. equities, rose 9.94%, and the Barclays Capital® U.S. Aggregate Bond Index, which tracks taxable investment-grade bonds, gained 6.02%. With the U.S. economy still showing signs of weakness, particularly in the housing and labor markets, the Federal Reserve kept the benchmark federal funds target rate at a historically low range of 0% to 0.25%. In an ultra-low-yield environment, the income component of convertible securities became particularly attractive to investors, as did the sensitivity of convertibles to price movements in the underlying equities. On the supply side, corporate America continued to access the convertible security marketplace to help repair debt-laden balance sheets built up during the recent financial market meltdown and subsequent recession.
Comments from Thomas Soviero, Portfolio Manager of Fidelity® Convertible Securities Fund: For the year, the fund's Retail Class shares returned 18.37%, outperforming the BofA Merrill Lynch convertibles index. The fund benefited from strong security selection in energy, overweighting industrials - particularly transportation, although this advantage was offset somewhat by weak security selection here - and significantly underweighting health care. Conversely, poor picks in diversified financials hurt. In terms of individual issuers, contributors included oil and natural gas pipeline operator El Paso, coal producer Peabody Energy, fiber-optic products provider Finisar, circuit board manufacturer Merix - acquired by Viasystems Group during the period - and not owning oil rig operator Transocean and biotechnology company Amgen, two lagging index components. Individual detractors included Bank of America - a case of untimely ownership - Freeport-McMoRan Copper & Gold, an out-of-benchmark position in Tenet Healthcare, Inverness Medical Innovations - now known as Alere - and underweighting Ford Motor. The fund's modest cash position also held back performance. Some holdings I've mentioned were sold by period end.
The views expressed above reflect those of the portfolio manager(s) only through the end of the period as stated on the cover of this report and do not necessarily represent the views of Fidelity or any other person in the Fidelity organization. Any such views are subject to change at any time based upon market or other conditions and Fidelity disclaims any responsibility to update such views. These views may not be relied on as investment advice and, because investment decisions for a Fidelity fund are based on numerous factors, may not be relied on as an indication of trading intent on behalf of any Fidelity fund.
Annual Report
Shareholder Expense Example
As a shareholder of the Fund, you incur two types of costs: (1) transaction costs, including sales charges (loads) on purchase payments or redemption proceeds, and (2) ongoing costs, including management fees, distribution and/or service (12b-1) fees and other Fund expenses. This Example is intended to help you understand your ongoing costs (in dollars) of investing in the Fund and to compare these costs with the ongoing costs of investing in other mutual funds.
The Example is based on an investment of $1,000 invested at the beginning of the period and held for the entire period (June 1, 2010 to November 30, 2010).
Actual Expenses
The first line of the accompanying table for each class of the Fund provides information about actual account values and actual expenses. You may use the information in this line, together with the amount you invested, to estimate the expenses that you paid over the period. Simply divide your account value by $1,000.00 (for example, an $8,600 account value divided by $1,000.00 = 8.6), then multiply the result by the number in the first line for a class of the Fund under the heading entitled "Expenses Paid During Period" to estimate the expenses you paid on your account during this period. A small balance maintenance fee of $12.00 that is charged once a year may apply for certain accounts with a value of less than $2,000. This fee is not included in the table below. If it was, the estimate of expenses you paid during the period would be higher, and your ending account value lower, by this amount. In addition, the Fund, as a shareholder in the underlying Fidelity Central Funds, will indirectly bear its pro-rata share of the fees and expenses incurred by the underlying Fidelity Central Funds. These fees and expenses are not included in the Fund's annualized expense ratio used to calculate the expense estimate in the table below.
Hypothetical Example for Comparison Purposes
The second line of the accompanying table for each class of the Fund provides information about hypothetical account values and hypothetical expenses based on a Class' actual expense ratio and an assumed rate of return of 5% per year before expenses, which is not the Class' actual return. The hypothetical account values and expenses may not be used to estimate the actual ending account balance or expenses you paid for the period. You may use this information to compare the ongoing costs of investing in the Fund and other funds. To do so, compare this 5% hypothetical example with the 5% hypothetical examples that appear in the shareholder reports of the other funds. A small balance maintenance fee of $12.00 that is charged once a year may apply for certain accounts with a value of less than $2,000. This fee is not included in the table below. If it was, the estimate of expenses you paid during the period would be higher, and your ending account value lower, by this amount. In addition, the Fund, as a shareholder in the underlying Fidelity Central Funds, will indirectly bear its pro-rata share of the fees and expenses incurred by the underlying Fidelity Central Funds. These fees and expenses are not included in the Fund's annualized expense ratio used to calculate the expense estimate in the table below.
Please note that the expenses shown in the table are meant to highlight your ongoing costs only and do not reflect any transaction costs. Therefore, the second line of the table is useful in comparing ongoing costs only, and will not help you determine the relative total costs of owning different funds. In addition, if these transactional costs were included, your costs would have been higher.
Annual Report
Shareholder Expense Example - continued
| Annualized | Beginning | Ending | Expenses Paid |
Class A | .84% |
|
|
|
Actual |
| $ 1,000.00 | $ 1,105.20 | $ 4.43 |
HypotheticalA |
| $ 1,000.00 | $ 1,020.86 | $ 4.26 |
Class T | 1.06% |
|
|
|
Actual |
| $ 1,000.00 | $ 1,104.30 | $ 5.59 |
HypotheticalA |
| $ 1,000.00 | $ 1,019.75 | $ 5.37 |
Class B | 1.65% |
|
|
|
Actual |
| $ 1,000.00 | $ 1,101.00 | $ 8.69 |
HypotheticalA |
| $ 1,000.00 | $ 1,016.80 | $ 8.34 |
Class C | 1.62% |
|
|
|
Actual |
| $ 1,000.00 | $ 1,101.30 | $ 8.53 |
HypotheticalA |
| $ 1,000.00 | $ 1,016.95 | $ 8.19 |
Convertible Securities | .51% |
|
|
|
Actual |
| $ 1,000.00 | $ 1,107.30 | $ 2.69 |
HypotheticalA |
| $ 1,000.00 | $ 1,022.51 | $ 2.59 |
Institutional Class | .56% |
|
|
|
Actual |
| $ 1,000.00 | $ 1,106.90 | $ 2.96 |
HypotheticalA |
| $ 1,000.00 | $ 1,022.26 | $ 2.84 |
A 5% return per year before expenses
* Expenses are equal to each Class' annualized expense ratio, multiplied by the average account value over the period, multiplied by 183/365 (to reflect the one-half year period).
Annual Report
Investment Changes (Unaudited)
Top Ten Investments as of November 30, 2010 | ||
(excluding cash equivalents) | % of fund's | % of fund's net assets |
Peabody Energy Corp. 4.75% 12/15/66 | 6.6 | 4.6 |
El Paso Corp. 4.99% | 6.0 | 5.1 |
Wells Fargo & Co. 7.50% | 5.1 | 4.9 |
Ford Motor Co. 4.25% 11/15/16 | 3.3 | 2.4 |
General Motors Co. 4.75% | 3.0 | 0.0 |
Intel Corp. 3.25% 8/1/39 | 3.0 | 3.0 |
Celanese Corp. Class A | 2.3 | 3.7 |
Chesapeake Energy Corp. 2.5% 5/15/37 | 2.3 | 2.4 |
Hertz Global Holdings, Inc. 5.25% 6/1/14 | 2.0 | 1.9 |
Bank of America Corp. Series L, 7.25% | 1.9 | 1.9 |
| 35.5 | |
Top Five Market Sectors as of November 30, 2010 | ||
| % of fund's | % of fund's net assets |
Energy | 23.4 | 19.2 |
Information Technology | 17.9 | 17.5 |
Financials | 13.3 | 16.7 |
Industrials | 13.1 | 11.8 |
Consumer Discretionary | 13.0 | 10.6 |
Asset Allocation (% of fund's net assets) | |||||||
As of November 30, 2010 * | As of May 31, 2010** | ||||||
 | Convertible |
| | Convertible |
| ||
 | Stocks 9.6% |
| | Stocks 14.0% |
| ||
 | Nonconvertible |
| | Nonconvertible |
| ||
 | Short-Term |
| | Short-Term |
| ||
 | Floating Rate Loans 0.0% |
|  | Floating Rate Loans 0.4% |
| ||
* Foreign investments | 4.2% |
| ** Foreign investments | 3.5% |
| ||

Annual Report
Investments November 30, 2010
Showing Percentage of Net Assets
Corporate Bonds - 64.2% | ||||
| Principal | Value (000s) | ||
Convertible Bonds - 64.1% | ||||
CONSUMER DISCRETIONARY - 6.3% | ||||
Auto Components - 0.1% | ||||
BorgWarner, Inc. 3.5% 4/15/12 | $ 910 | $ 1,714 | ||
Automobiles - 3.3% | ||||
Ford Motor Co. 4.25% 11/15/16 | 40,000 | 77,152 | ||
Diversified Consumer Services - 0.6% | ||||
Ingersoll-Rand Global Holding Co. Ltd. 4.5% 4/15/12 | 490 | 1,132 | ||
Regis Corp. 5% 7/15/14 | 2,230 | 2,983 | ||
Stewart Enterprises, Inc. 3.375% 7/15/16 (g) | 11,000 | 9,989 | ||
| 14,104 | |||
Hotels, Restaurants & Leisure - 0.5% | ||||
MGM Mirage, Inc. 4.25% 4/15/15 (g) | 12,300 | 12,192 | ||
Media - 1.0% | ||||
Virgin Media, Inc. 6.5% 11/15/16 | 8,000 | 12,630 | ||
XM Satellite Radio, Inc. 7% 12/1/14 (g) | 10,000 | 11,381 | ||
| 24,011 | |||
Specialty Retail - 0.8% | ||||
Asbury Automotive Group, Inc. 3% 9/15/12 (g) | 3,000 | 2,936 | ||
Charming Shoppes, Inc. 1.125% 5/1/14 | 10,000 | 8,388 | ||
Sonic Automotive, Inc. 5% 10/1/29 | 1,180 | 1,403 | ||
United Auto Group, Inc. 3.5% 4/1/26 | 4,533 | 4,601 | ||
| 17,328 | |||
TOTAL CONSUMER DISCRETIONARY | 146,501 | |||
CONSUMER STAPLES - 2.3% | ||||
Beverages - 0.7% | ||||
Molson Coors Brewing Co. 2.5% 7/30/13 | 14,000 | 15,739 | ||
Food & Staples Retailing - 0.6% | ||||
The Pantry, Inc. 3% 11/15/12 | 14,000 | 13,624 | ||
Food Products - 1.0% | ||||
Smithfield Foods, Inc. 4% 6/30/13 | 22,250 | 24,257 | ||
TOTAL CONSUMER STAPLES | 53,620 | |||
ENERGY - 16.2% | ||||
Energy Equipment & Services - 1.9% | ||||
Exterran Holdings, Inc. 4.25% 6/15/14 | 10,000 | 12,136 | ||
Global Industries Ltd. 2.75% 8/1/27 (g) | 10,000 | 7,400 | ||
Corporate Bonds - continued | ||||
| Principal | Value (000s) | ||
Convertible Bonds - continued | ||||
ENERGY - continued | ||||
Energy Equipment & Services - continued | ||||
Hornbeck Offshore Services, Inc. 1.625% 11/15/26 (d)(g) | $ 5,000 | $ 4,558 | ||
Newpark Resources, Inc. 4% 10/1/17 | 4,500 | 4,002 | ||
Oil States International, Inc. 2.375% 7/1/25 (g) | 4,500 | 8,565 | ||
SESI LLC 1.5% 12/15/26 (d)(g) | 7,000 | 6,948 | ||
| 43,609 | |||
Oil, Gas & Consumable Fuels - 14.3% | ||||
Alpha Natural Resources, Inc. 2.375% 4/15/15 | 35,000 | 42,669 | ||
Chesapeake Energy Corp. 2.5% 5/15/37 | 62,750 | 52,321 | ||
Goodrich Petroleum Corp. 3.25% 12/1/26 | 6,000 | 5,865 | ||
International Coal Group, Inc. 4% 4/1/17 | 2,160 | 3,168 | ||
Massey Energy Co. 3.25% 8/1/15 | 5,000 | 4,872 | ||
Peabody Energy Corp. 4.75% 12/15/66 | 122,250 | 152,657 | ||
Pioneer Natural Resources Co. 2.875% 1/15/38 | 20,000 | 28,350 | ||
Quicksilver Resources, Inc. 1.875% 11/1/24 (g) | 14,500 | 15,648 | ||
Western Refining, Inc. 5.75% 6/15/14 | 24,185 | 27,614 | ||
| 333,164 | |||
TOTAL ENERGY | 376,773 | |||
FINANCIALS - 0.9% | ||||
Diversified Financial Services - 0.9% | ||||
The NASDAQ Stock Market, Inc. 2.5% 8/15/13 | 20,000 | 19,826 | ||
HEALTH CARE - 5.0% | ||||
Health Care Equipment & Supplies - 2.4% | ||||
Alere, Inc. 3% 5/15/16 | 31,000 | 30,729 | ||
Kinetic Concepts, Inc. 3.25% 4/15/15 (g) | 15,000 | 15,593 | ||
SonoSite, Inc. 3.75% 7/15/14 | 7,000 | 7,533 | ||
Volcano Corp. 2.875% 9/1/15 | 1,890 | 2,151 | ||
| 56,006 | |||
Health Care Providers & Services - 0.3% | ||||
Omnicare, Inc. 3.25% 12/15/35 | 7,000 | 6,510 | ||
Life Sciences Tools & Services - 0.2% | ||||
Charles River Laboratories International, Inc. 2.25% 6/15/13 (g) | 4,000 | 3,930 | ||
Pharmaceuticals - 2.1% | ||||
Biovail Corp. 5.375% 8/1/14 | 10,000 | 19,256 | ||
Corporate Bonds - continued | ||||
| Principal | Value (000s) | ||
Convertible Bonds - continued | ||||
HEALTH CARE - continued | ||||
Pharmaceuticals - continued | ||||
Nektar Therapeutics 3.25% 9/28/12 | $ 9,000 | $ 8,764 | ||
Valeant Pharmaceuticals International 4% 11/15/13 | 10,000 | 20,488 | ||
| 48,508 | |||
TOTAL HEALTH CARE | 114,954 | |||
INDUSTRIALS - 13.1% | ||||
Aerospace & Defense - 0.9% | ||||
Alliant Techsystems, Inc. 2.75% 9/15/11 | 14,000 | 14,210 | ||
GenCorp, Inc. 4.0625% 12/31/39 (g) | 7,830 | 7,125 | ||
| 21,335 | |||
Airlines - 4.3% | ||||
AMR Corp. 6.25% 10/15/14 | 17,990 | 21,671 | ||
Continental Airlines, Inc. 4.5% 1/15/15 | 9,280 | 15,335 | ||
UAL Corp.: | ||||
4.5% 6/30/21 (g) | 10,500 | 11,106 | ||
4.5% 6/30/21 | 5,000 | 5,289 | ||
6% 10/15/29 | 3,600 | 12,094 | ||
US Airways Group, Inc. 7% 9/30/20 (g) | 4,810 | 4,810 | ||
US Airways Group, Inc. 7.25% 5/15/14 | 11,200 | 29,605 | ||
| 99,910 | |||
Commercial Services & Supplies - 1.3% | ||||
Metalico, Inc. 7% 4/30/28 | 34,000 | 30,600 | ||
Construction & Engineering - 0.4% | ||||
MasTec, Inc. 4.25% 12/15/14 (g) | 8,000 | 9,480 | ||
Electrical Equipment - 0.7% | ||||
General Cable Corp. 4.5% 11/15/29 (d) | 14,800 | 16,814 | ||
Industrial Conglomerates - 0.1% | ||||
Textron, Inc. 4.5% 5/1/13 | 1,440 | 2,609 | ||
Machinery - 2.2% | ||||
Greenbrier Companies, Inc.: | ||||
2.375% 5/15/26 (g) | 5,500 | 4,985 | ||
2.375% 5/15/26 | 8,000 | 7,250 | ||
Terex Corp. 4% 6/1/15 | 14,590 | 24,310 | ||
Trinity Industries, Inc. 3.875% 6/1/36 | 15,000 | 14,025 | ||
| 50,570 | |||
Corporate Bonds - continued | ||||
| Principal | Value (000s) | ||
Convertible Bonds - continued | ||||
INDUSTRIALS - continued | ||||
Marine - 1.1% | ||||
Excel Maritime Carriers Ltd. 1.875% 10/15/27 (g) | $ 34,000 | $ 25,500 | ||
Road & Rail - 2.0% | ||||
Hertz Global Holdings, Inc. 5.25% 6/1/14 | 28,000 | 46,427 | ||
Trading Companies & Distributors - 0.1% | ||||
United Rentals, Inc. 4% 11/15/15 | 960 | 1,855 | ||
TOTAL INDUSTRIALS | 305,100 | |||
INFORMATION TECHNOLOGY - 15.7% | ||||
Communications Equipment - 1.9% | ||||
CommScope, Inc. 3.25% 7/1/15 | 10,000 | 13,140 | ||
Finisar Corp. 5% 10/15/29 (g) | 2,500 | 4,919 | ||
JDS Uniphase Corp. 1% 5/15/26 (g) | 14,000 | 13,195 | ||
L-3 Communications Corp. 3% 8/1/35 | 3,000 | 3,015 | ||
Lucent Technologies, Inc. 2.875% 6/15/25 | 10,000 | 9,494 | ||
| 43,763 | |||
Computers & Peripherals - 1.2% | ||||
EMC Corp. 1.75% 12/1/13 (g) | 17,000 | 24,384 | ||
Hutchinson Technology, Inc. 3.25% 1/15/26 | 5,000 | 3,431 | ||
| 27,815 | |||
Electronic Equipment & Components - 1.5% | ||||
Anixter International, Inc. 1% 2/15/13 (g) | 4,540 | 4,951 | ||
Itron, Inc. 2.5% 8/1/26 | 5,000 | 5,319 | ||
Newport Corp. 2.5% 2/15/12 (g) | 3,750 | 3,841 | ||
SYNNEX Corp. 4% 5/15/18 (g) | 10,000 | 11,725 | ||
Vishay Intertechnology, Inc. 2.25% 11/15/40 (g) | 7,000 | 8,002 | ||
| 33,838 | |||
Internet Software & Services - 0.9% | ||||
Equinix, Inc. 3% 10/15/14 | 10,000 | 9,759 | ||
VeriSign, Inc. 3.25% 8/15/37 | 10,000 | 11,419 | ||
| 21,178 | |||
IT Services - 1.8% | ||||
Alliance Data Systems Corp. 4.75% 5/15/14 | 10,200 | 15,326 | ||
CACI International, Inc. 2.125% 5/1/14 | 6,000 | 6,645 | ||
DST Systems, Inc. 4.125% 8/15/23 | 8,100 | 9,052 | ||
Telvent GIT SA 5.5% 4/15/15 (g) | 10,000 | 10,363 | ||
| 41,386 | |||
Corporate Bonds - continued | ||||
| Principal | Value (000s) | ||
Convertible Bonds - continued | ||||
INFORMATION TECHNOLOGY - continued | ||||
Semiconductors & Semiconductor Equipment - 8.0% | ||||
Advanced Micro Devices, Inc. 6% 5/1/15 | $ 11,916 | $ 11,884 | ||
Amkor Technology, Inc. 6% 4/15/14 | 10,890 | 26,596 | ||
Evergreen Solar, Inc. 4% 7/15/13 | 4,000 | 1,740 | ||
Intel Corp. 3.25% 8/1/39 (g) | 58,000 | 70,574 | ||
Micron Technology, Inc. 4.25% 10/15/13 | 6,130 | 9,938 | ||
ON Semiconductor Corp.: | ||||
1.875% 12/15/25 (g) | 3,750 | 4,854 | ||
2.625% 12/15/26 | 35,330 | 37,759 | ||
PMC-Sierra, Inc. 2.25% 10/15/25 | 10,000 | 10,831 | ||
SunPower Corp. 4.75% 4/15/14 | 2,020 | 1,773 | ||
Xilinx, Inc. 3.125% 3/15/37 | 10,000 | 9,914 | ||
| 185,863 | |||
Software - 0.4% | ||||
Nuance Communications, Inc. 2.75% 8/15/27 | 9,085 | 10,425 | ||
TOTAL INFORMATION TECHNOLOGY | 364,268 | |||
MATERIALS - 2.6% | ||||
Chemicals - 1.2% | ||||
Ferro Corp. 6.5% 8/15/13 | 27,000 | 28,856 | ||
Containers & Packaging - 0.2% | ||||
Owens-Brockway Glass Container, Inc. 3% 6/1/15 (g) | 5,010 | 4,901 | ||
Metals & Mining - 1.2% | ||||
Alcoa, Inc. 5.25% 3/15/14 | 5,000 | 10,819 | ||
ArcelorMittal SA 5% 5/15/14 | 2,170 | 2,795 | ||
Goldcorp, Inc. 2% 8/1/14 | 5,000 | 6,100 | ||
Newmont Mining Corp. 1.625% 7/15/17 | 5,000 | 7,038 | ||
| 26,752 | |||
TOTAL MATERIALS | 60,509 | |||
TELECOMMUNICATION SERVICES - 2.0% | ||||
Diversified Telecommunication Services - 0.7% | ||||
Level 3 Communications, Inc. 7% 3/15/15 | 10,000 | 9,488 | ||
Time Warner Telecom, Inc. 2.375% 4/1/26 | 6,000 | 6,510 | ||
| 15,998 | |||
Corporate Bonds - continued | ||||
| Principal | Value (000s) | ||
Convertible Bonds - continued | ||||
TELECOMMUNICATION SERVICES - continued | ||||
Wireless Telecommunication Services - 1.3% | ||||
Leap Wireless International, Inc. 4.5% 7/15/14 | $ 33,000 | $ 29,825 | ||
TOTAL TELECOMMUNICATION SERVICES | 45,823 | |||
TOTAL CONVERTIBLE BONDS | 1,487,374 | |||
Nonconvertible Bonds - 0.1% | ||||
CONSUMER DISCRETIONARY - 0.1% | ||||
Hotels, Restaurants & Leisure - 0.1% | ||||
Ambassadors International, Inc. 10% 1/15/12 pay-in-kind (g) | 2,392 | 1,794 | ||
TOTAL CORPORATE BONDS (Cost $1,320,655) | 1,489,168 | |||
Common Stocks - 9.6% | |||
Shares |
| ||
CONSUMER DISCRETIONARY - 1.0% | |||
Auto Components - 0.6% | |||
Johnson Controls, Inc. | 344,134 | 12,540 | |
Diversified Consumer Services - 0.4% | |||
Service Corp. International | 1,143,000 | 9,213 | |
Hotels, Restaurants & Leisure - 0.0% | |||
Ambassadors International, Inc. (a)(f) | 230,377 | 389 | |
Media - 0.0% | |||
HMH Holdings, Inc. (a)(h) | 52,880 | 304 | |
HMH Holdings, Inc. warrants 3/9/17 (a) | 164,823 | 82 | |
| 386 | ||
TOTAL CONSUMER DISCRETIONARY | 22,528 | ||
ENERGY - 0.3% | |||
Oil, Gas & Consumable Fuels - 0.3% | |||
McMoRan Exploration Co. (a)(e) | 450,000 | 6,719 | |
Common Stocks - continued | |||
Shares | Value (000s) | ||
FINANCIALS - 3.8% | |||
Commercial Banks - 3.1% | |||
Huntington Bancshares, Inc. | 5,820,500 | $ 33,963 | |
KeyCorp | 5,014,100 | 37,756 | |
| 71,719 | ||
Diversified Financial Services - 0.7% | |||
Bank of America Corp. | 1,484,085 | 16,251 | |
TOTAL FINANCIALS | 87,970 | ||
INFORMATION TECHNOLOGY - 2.2% | |||
Communications Equipment - 0.8% | |||
Finisar Corp. (a)(e) | 974,120 | 18,625 | |
Electronic Equipment & Components - 0.4% | |||
Viasystems Group, Inc. (a) | 549,643 | 9,536 | |
Semiconductors & Semiconductor Equipment - 1.0% | |||
Amkor Technology, Inc. (a)(e) | 843,200 | 5,869 | |
ON Semiconductor Corp. (a) | 2,169,500 | 17,692 | |
| 23,561 | ||
TOTAL INFORMATION TECHNOLOGY | 51,722 | ||
MATERIALS - 2.3% | |||
Chemicals - 2.3% | |||
Celanese Corp. Class A | 1,469,230 | 54,362 | |
TOTAL COMMON STOCKS (Cost $191,939) | 223,301 | ||
Convertible Preferred Stocks - 24.6% | |||
|
|
|
|
CONSUMER DISCRETIONARY - 5.6% | |||
Automobiles - 4.0% | |||
Ford Motor Co. Capital Trust II 6.50% | 450,000 | 23,135 | |
General Motors Co. 4.75% (a) | 1,400,000 | 70,980 | |
| 94,115 | ||
Household Durables - 0.1% | |||
Stanley Black & Decker, Inc. 4.75% (a) | 13,500 | 1,377 | |
Leisure Equipment & Products - 0.5% | |||
Callaway Golf Co. 7.50% | 100,000 | 12,563 | |
Convertible Preferred Stocks - continued | |||
Shares | Value (000s) | ||
CONSUMER DISCRETIONARY - continued | |||
Media - 1.0% | |||
Interpublic Group of Companies, Inc. 5.25% | 10,000 | $ 10,037 | |
LodgeNet Entertainment Corp. 10.00% (g) | 11,118 | 12,287 | |
| 22,324 | ||
TOTAL CONSUMER DISCRETIONARY | 130,379 | ||
CONSUMER STAPLES - 2.1% | |||
Food Products - 2.1% | |||
Archer Daniels Midland Co. 6.25% | 600,000 | 22,608 | |
Bunge Ltd.: | |||
4.875% | 237,000 | 21,078 | |
5.125% | 10,000 | 5,869 | |
| 49,555 | ||
ENERGY - 6.9% | |||
Oil, Gas & Consumable Fuels - 6.9% | |||
Apache Corp. 6.00% | 94,200 | 5,713 | |
El Paso Corp.: | |||
4.99% (g) | 119,290 | 139,023 | |
4.99% | 10,000 | 11,654 | |
Goodrich Petroleum Corp. 5.375% | 100,000 | 3,169 | |
| 159,559 | ||
FINANCIALS - 8.6% | |||
Commercial Banks - 5.2% | |||
Huntington Bancshares, Inc. 8.50% | 2,100 | 2,258 | |
Wells Fargo & Co. 7.50% | 120,550 | 118,994 | |
| 121,252 | ||
Diversified Financial Services - 3.1% | |||
Bank of America Corp. Series L, 7.25% | 47,085 | 43,789 | |
Citigroup, Inc. 7.50% | 215,400 | 26,925 | |
| 70,714 | ||
Insurance - 0.3% | |||
Assured Guaranty Ltd. 8.50% | 100,000 | 7,114 | |
TOTAL FINANCIALS | 199,080 | ||
Convertible Preferred Stocks - continued | |||
Shares | Value (000s) | ||
HEALTH CARE - 1.4% | |||
Health Care Providers & Services - 1.4% | |||
Tenet Healthcare Corp. 7.00% | 40,000 | $ 31,708 | |
TOTAL CONVERTIBLE PREFERRED STOCKS (Cost $571,865) | 570,281 | ||
Money Market Funds - 2.2% | |||
|
|
|
|
Fidelity Cash Central Fund, 0.24% (b) | 33,967,973 | 33,968 | |
Fidelity Securities Lending Cash Central Fund, 0.25% (b)(c) | 18,147,250 | 18,147 | |
TOTAL MONEY MARKET FUNDS (Cost $52,115) | 52,115 | ||
TOTAL INVESTMENT PORTFOLIO - 100.6% (Cost $2,136,574) | 2,334,865 | ||
NET OTHER ASSETS (LIABILITIES) - (0.6)% | (13,582) | ||
NET ASSETS - 100% | $ 2,321,283 | ||
Legend |
(a) Non-income producing |
(b) Affiliated fund that is available only to investment companies and other accounts managed by Fidelity Investments. The rate quoted is the annualized seven-day yield of the fund at period end. A complete unaudited listing of the fund's holdings as of its most recent quarter end is available upon request. In addition, each Fidelity Central Fund's financial statements, which are not covered by the Fund's Report of Independent Registered Public Accounting Firm, are available on the SEC's website or upon request. |
(c) Investment made with cash collateral received from securities on loan. |
(d) Security initially issued at one coupon which converts to a higher coupon at a specified date. The rate shown is the rate at period end. |
(e) Security or a portion of the security is on loan at period end. |
(f) Affiliated company |
(g) Security exempt from registration under Rule 144A of the Securities Act of 1933. These securities may be resold in transactions exempt from registration, normally to qualified institutional buyers. At the end of the period, the value of these securities amounted to $476,959,000 or 20.5% of net assets. |
(h) Restricted securities - Investment in securities not registered under the Securities Act of 1933 (excluding 144A issues). At the end of the period, the value of restricted securities (excluding 144A issues) amounted to $304,000 or 0.0% of net assets. |
Additional information on each holding is as follows: |
Security | Acquisition | Acquisition |
HMH Holdings, Inc. | 8/1/08 - 12/31/09 | $ 6,902 |
Affiliated Central Funds |
Information regarding fiscal year to date income earned by the Fund from investments in Fidelity Central Funds is as follows: |
Fund | Income earned |
Fidelity Cash Central Fund | $ 190 |
Fidelity Securities Lending Cash Central Fund | 53 |
Total | $ 243 |
Other Affiliated Issuers |
An affiliated company is a company in which the Fund has ownership of at least 5% of the voting securities. Fiscal year to date transactions with companies which are or were affiliates are as follows: |
Affiliate | Value, | Purchases | Sales | Dividend | Value, |
Ambassadors International, Inc. | $ 758 | $ - | $ - | $ - | $ 389 |
Total | $ 758 | $ - | $ - | $ - | $ 389 |
Other Information |
The following is a summary of the inputs used, as of November 30, 2010, involving the Fund's assets and liabilities carried at fair value. The inputs or methodology used for valuing securities may not be an indication of the risk associated with investing in those securities. For more information on valuation inputs, and their aggregation into the levels used in the tables below, please refer to the Security Valuation section in the accompanying Notes to Financial Statements. |
Valuation Inputs at Reporting Date: | ||||
Description | Total | Level 1 | Level 2 | Level 3 |
Investments in Securities: | ||||
Equities: | ||||
Consumer Discretionary | $ 152,907 | $ 93,122 | $ 59,703 | $ 82 |
Consumer Staples | 49,555 | - | 49,555 | - |
Energy | 166,278 | 12,432 | 153,846 | - |
Financials | 287,050 | 253,011 | 34,039 | - |
Health Care | 31,708 | - | 31,708 | - |
Information Technology | 51,722 | 51,722 | - | - |
Materials | 54,362 | 54,362 | - | - |
Corporate Bonds | 1,489,168 | - | 1,487,374 | 1,794 |
Money Market Funds | 52,115 | 52,115 | - | - |
Total Investments in Securities: | $ 2,334,865 | $ 516,764 | $ 1,816,225 | $ 1,876 |
The following is a reconciliation of Investments in Securities for which Level 3 inputs were used in determining value: |
(Amounts in thousands) |
|
Investments in Securities: | |
Beginning Balance | $ 3,577 |
Total Realized Gain (Loss) | 6,233 |
Total Unrealized Gain (Loss) | 544 |
Cost of Purchases | 289 |
Proceeds of Sales | (9,558) |
Amortization/Accretion | 791 |
Transfers in to Level 3 | - |
Transfers out of Level 3 | - |
Ending Balance | $ 1,876 |
The change in unrealized gain (loss) for the period attributable to Level 3 securities held at November 30, 2010 | $ (598) |
The information used in the above reconciliation represents fiscal year to date activity for any Investments in Securities identified as using Level 3 inputs at either the beginning or the end of the current fiscal period. Transfers in or out of Level 3 represent the beginning value of any Security or Instrument where a change in the pricing level occurred from the beginning to the end of the period. The cost of purchases and the proceeds of sales may include securities received or delivered through corporate actions or exchanges. Realized and unrealized gains (losses) disclosed in the reconciliation are included in Net Gain (Loss) on the Fund's Statement of Operations. |
The composition of credit quality ratings as a percentage of net assets is as follows (Unaudited): |
AAA,AA,A | 4.1% |
BBB | 2.8% |
BB | 19.5% |
B | 12.9% |
CCC,CC,C | 11.7% |
Not Rated | 13.2% |
Equities | 34.2% |
Short-Term Investments and Net Other Assets | 1.6% |
| 100.0% |
We have used ratings from Moody's Investors Service, Inc. Where Moody's® ratings are not available, we have used S&P® ratings. All ratings are as of the report date and do not reflect subsequent changes. |
Income Tax Information |
At November 30, 2010, the Fund had a capital loss carryforward of approximately $298,128,000 all of which will expire in fiscal 2017. Capital loss carryforwards are only available to offset future capital gains of the Fund to the extent provided by regulations and may be limited. |
See accompanying notes which are an integral part of the financial statements.
Annual Report
Financial Statements
Statement of Assets and Liabilities
Amounts in thousands (except per-share amounts) | November 30, 2010 | |
|
|
|
Assets | ||
Investment in securities, at value (including securities loaned of $17,073) - See accompanying schedule: Unaffiliated issuers (cost $2,079,819) | $ 2,282,361 |
|
Fidelity Central Funds (cost $52,115) | 52,115 |
|
Other affiliated issuers (cost $4,640) | 389 |
|
Total Investments (cost $2,136,574) |
| $ 2,334,865 |
Receivable for investments sold | 6,386 | |
Receivable for fund shares sold | 2,050 | |
Dividends receivable | 3,557 | |
Interest receivable | 12,938 | |
Distributions receivable from Fidelity Central Funds | 18 | |
Prepaid expenses | 8 | |
Other receivables | 35 | |
Total assets | 2,359,857 | |
|
|
|
Liabilities | ||
Payable for fund shares redeemed | 19,320 | |
Accrued management fee | 608 | |
Distribution and service plan fees payable | 10 | |
Other affiliated payables | 424 | |
Other payables and accrued expenses | 65 | |
Collateral on securities loaned, at value | 18,147 | |
Total liabilities | 38,574 | |
|
|
|
Net Assets | $ 2,321,283 | |
Net Assets consist of: |
| |
Paid in capital | $ 2,398,529 | |
Undistributed net investment income | 26,134 | |
Accumulated undistributed net realized gain (loss) on investments | (301,671) | |
Net unrealized appreciation (depreciation) on investments and assets and liabilities in foreign currencies | 198,291 | |
Net Assets | $ 2,321,283 | |
See accompanying notes which are an integral part of the financial statements.
Annual Report
Statement of Assets and Liabilities - continued
Amounts in thousands (except per-share amounts) | November 30, 2010 | |
|
|
|
Calculation of Maximum Offering Price Class A: | $ 24.22 | |
|
|
|
Maximum offering price per share (100/94.25 of $24.22) | $ 25.70 | |
Class T: | $ 24.23 | |
|
|
|
Maximum offering price per share (100/96.50 of $24.23) | $ 25.11 | |
Class B: | $ 24.17 | |
|
|
|
Class C: | $ 24.14 | |
|
|
|
Convertible Securities: | $ 24.29 | |
|
|
|
Institutional Class: | $ 24.27 | |
A Redemption price per share is equal to net asset value less any applicable contingent deferred sales charge.
See accompanying notes which are an integral part of the financial statements.
Annual Report
Financial Statements - continued
Statement of Operations
Amounts in thousands | Year ended November 30, 2010 | |
|
|
|
Investment Income |
|
|
Dividends |
| $ 36,443 |
Interest |
| 61,403 |
Income from Fidelity Central Funds |
| 243 |
Total income |
| 98,089 |
|
|
|
Expenses | ||
Management fee | $ 10,828 | |
Performance adjustment | (2,341) | |
Transfer agent fees | 4,380 | |
Distribution and service plan fees | 88 | |
Accounting and security lending fees | 720 | |
Custodian fees and expenses | 37 | |
Independent trustees' compensation | 14 | |
Registration fees | 134 | |
Audit | 76 | |
Legal | 25 | |
Miscellaneous | 39 | |
Total expenses before reductions | 14,000 | |
Expense reductions | (46) | 13,954 |
Net investment income (loss) | 84,135 | |
Realized and Unrealized Gain (Loss) Net realized gain (loss) on: | ||
Investment securities: |
|
|
Unaffiliated issuers | 77,313 | |
Capital gain distributions from Fidelity Central Funds | 1 |
|
Total net realized gain (loss) |
| 77,314 |
Change in net unrealized appreciation (depreciation) on investment securities | 227,214 | |
Net gain (loss) | 304,528 | |
Net increase (decrease) in net assets resulting from operations | $ 388,663 | |
See accompanying notes which are an integral part of the financial statements.
Annual Report
Statement of Changes in Net Assets
Amounts in thousands | Year ended | Year ended |
Increase (Decrease) in Net Assets |
|
|
Operations |
|
|
Net investment income (loss) | $ 84,135 | $ 101,950 |
Net realized gain (loss) | 77,314 | (232,140) |
Change in net unrealized appreciation (depreciation) | 227,214 | 1,040,568 |
Net increase (decrease) in net assets resulting | 388,663 | 910,378 |
Distributions to shareholders from net investment income | (87,526) | (103,307) |
Share transactions - net increase (decrease) | (332,532) | 106,423 |
Total increase (decrease) in net assets | (31,395) | 913,494 |
|
|
|
Net Assets | ||
Beginning of period | 2,352,678 | 1,439,184 |
End of period (including undistributed net investment income of $26,134 and undistributed net investment income of $29,835, respectively) | $ 2,321,283 | $ 2,352,678 |
See accompanying notes which are an integral part of the financial statements.
Annual Report
Financial Highlights - Class A
Years ended November 30, | 2010 | 2009 H |
Selected Per-Share Data |
|
|
Net asset value, beginning of period | $ 21.25 | $ 12.79 |
Income from Investment Operations |
|
|
Net investment income (loss) E | .75 | .58 |
Net realized and unrealized gain (loss) | 3.01 | 8.53 |
Total from investment operations | 3.76 | 9.11 |
Distributions from net investment income | (.79) | (.65) |
Net asset value, end of period | $ 24.22 | $ 21.25 |
Total Return B, C, D | 18.05% | 72.83% |
Ratios to Average Net Assets F, I |
|
|
Expenses before reductions | .87% | 1.04% A |
Expenses net of fee waivers, if any | .87% | 1.04% A |
Expenses net of all reductions | .87% | 1.04% A |
Net investment income (loss) | 3.29% | 3.70% A |
Supplemental Data |
|
|
Net assets, end of period (in millions) | $ 19 | $ 6 |
Portfolio turnover rate G | 28% | 31% |
A Annualized
B Total returns for periods of less than one year are not annualized.
C Total returns would have been lower had certain expenses not been reduced during the periods shown.
D Total returns do not include the effect of the sales charges.
E Calculated based on average shares outstanding during the period.
F Fees and expenses of the underlying Fidelity Central Funds are not included in the Fund's expense ratio. The Fund indirectly bears its proportionate share of the expenses of any underlying Fidelity Central Funds.
G Amount does not include the portfolio activity of any underlying Fidelity Central Funds.
H For the period February 19, 2009 (commencement of sale of shares) to November 30, 2009.
I Expense ratios reflect operating expenses of the class. Expenses before reductions do not reflect amounts reimbursed by the investment adviser or reductions from brokerage service arrangements or reductions from other expense offset arrangements and do not represent the amount paid by the class during periods when reimbursements or reductions occur. Expense ratios before reductions for start-up periods may not be representative of longer-term operating periods. Expenses net of fee waivers reflect expenses after reimbursement by the investment adviser but prior to reductions from brokerage service arrangements or other expense offset arrangements. Expenses net of all reductions represent the net expenses paid by the class.
See accompanying notes which are an integral part of the financial statements.
Annual Report
Financial Highlights - Class T
Years ended November 30, | 2010 | 2009 H |
Selected Per-Share Data |
|
|
Net asset value, beginning of period | $ 21.25 | $ 12.79 |
Income from Investment Operations |
|
|
Net investment income (loss) E | .69 | .57 |
Net realized and unrealized gain (loss) | 3.01 | 8.52 |
Total from investment operations | 3.70 | 9.09 |
Distributions from net investment income | (.72) | (.63) |
Net asset value, end of period | $ 24.23 | $ 21.25 |
Total Return B, C, D | 17.74% | 72.60% |
Ratios to Average Net Assets F, I |
|
|
Expenses before reductions | 1.13% | 1.25% A |
Expenses net of fee waivers, if any | 1.13% | 1.25% A |
Expenses net of all reductions | 1.13% | 1.25% A |
Net investment income (loss) | 3.03% | 3.83% A |
Supplemental Data |
|
|
Net assets, end of period (in millions) | $ 4 | $ 2 |
Portfolio turnover rate G | 28% | 31% |
A Annualized
B Total returns for periods of less than one year are not annualized.
C Total returns would have been lower had certain expenses not been reduced during the periods shown.
D Total returns do not include the effect of the sales charges.
E Calculated based on average shares outstanding during the period.
F Fees and expenses of the underlying Fidelity Central Funds are not included in the Fund's expense ratio. The Fund indirectly bears its proportionate share of the expenses of any underlying Fidelity Central Funds.
G Amount does not include the portfolio activity of any underlying Fidelity Central Funds.
H For the period February 19, 2009 (commencement of sale of shares) to November 30, 2009.
I Expense ratios reflect operating expenses of the class. Expenses before reductions do not reflect amounts reimbursed by the investment adviser or reductions from brokerage service arrangements or reductions from other expense offset arrangements and do not represent the amount paid by the class during periods when reimbursements or reductions occur. Expense ratios before reductions for start-up periods may not be representative of longer-term operating periods. Expenses net of fee waivers reflect expenses after reimbursement by the investment adviser but prior to reductions from brokerage service arrangements or other expense offset arrangements. Expenses net of all reductions represent the net expenses paid by the class.
See accompanying notes which are an integral part of the financial statements.
Annual Report
Financial Highlights - Class B
Years ended November 30, | 2010 | 2009 H |
Selected Per-Share Data |
|
|
Net asset value, beginning of period | $ 21.22 | $ 12.79 |
Income from Investment Operations |
|
|
Net investment income (loss) E | .56 | .50 |
Net realized and unrealized gain (loss) | 3.01 | 8.51 |
Total from investment operations | 3.57 | 9.01 |
Distributions from net investment income | (.62) | (.58) |
Net asset value, end of period | $ 24.17 | $ 21.22 |
Total Return B, C, D | 17.08% | 71.85% |
Ratios to Average Net Assets F, I |
|
|
Expenses before reductions | 1.69% | 1.78% A |
Expenses net of fee waivers, if any | 1.69% | 1.78% A |
Expenses net of all reductions | 1.69% | 1.78% A |
Net investment income (loss) | 2.47% | 3.41% A |
Supplemental Data |
|
|
Net assets, end of period (in millions) | $ 1 | $ 1 |
Portfolio turnover rate G | 28% | 31% |
A Annualized
B Total returns for periods of less than one year are not annualized.
C Total returns would have been lower had certain expenses not been reduced during the periods shown.
D Total returns do not include the effect of the contingent deferred sales charge.
E Calculated based on average shares outstanding during the period.
F Fees and expenses of the underlying Fidelity Central Funds are not included in the Fund's expense ratio. The Fund indirectly bears its proportionate share of the expenses of any underlying Fidelity Central Funds.
G Amount does not include the portfolio activity of any underlying Fidelity Central Funds.
H For the period February 19, 2009 (commencement of sale of shares) to November 30, 2009.
I Expense ratios reflect operating expenses of the class. Expenses before reductions do not reflect amounts reimbursed by the investment adviser or reductions from brokerage service arrangements or reductions from other expense offset arrangements and do not represent the amount paid by the class during periods when reimbursements or reductions occur. Expense ratios before reductions for start-up periods may not be representative of longer-term operating periods. Expenses net of fee waivers reflect expenses after reimbursement by the investment adviser but prior to reductions from brokerage service arrangements or other expense offset arrangements. Expenses net of all reductions represent the net expenses paid by the class.
See accompanying notes which are an integral part of the financial statements.
Annual Report
Financial Highlights - Class C
Years ended November 30, | 2010 | 2009 H |
Selected Per-Share Data |
|
|
Net asset value, beginning of period | $ 21.20 | $ 12.79 |
Income from Investment Operations |
|
|
Net investment income (loss) E | .56 | .47 |
Net realized and unrealized gain (loss) | 3.01 | 8.53 |
Total from investment operations | 3.57 | 9.00 |
Distributions from net investment income | (.63) | (.59) |
Net asset value, end of period | $ 24.14 | $ 21.20 |
Total Return B, C, D | 17.13% | 71.81% |
Ratios to Average Net Assets F, I |
|
|
Expenses before reductions | 1.66% | 1.80% A |
Expenses net of fee waivers, if any | 1.66% | 1.80% A |
Expenses net of all reductions | 1.66% | 1.80% A |
Net investment income (loss) | 2.50% | 3.17% A |
Supplemental Data |
|
|
Net assets, end of period (in millions) | $ 5 | $ 2 |
Portfolio turnover rate G | 28% | 31% |
A Annualized
B Total returns for periods of less than one year are not annualized.
C Total returns would have been lower had certain expenses not been reduced during the periods shown.
D Total returns do not include the effect of the contingent deferred sales charge.
E Calculated based on average shares outstanding during the period.
F Fees and expenses of the underlying Fidelity Central Funds are not included in the Fund's expense ratio. The Fund indirectly bears its proportionate share of the expenses of any underlying Fidelity Central Funds.
G Amount does not include the portfolio activity of any underlying Fidelity Central Funds.
H For the period February 19, 2009 (commencement of sale of shares) to November 30, 2009.
I Expense ratios reflect operating expenses of the class. Expenses before reductions do not reflect amounts reimbursed by the investment adviser or reductions from brokerage service arrangements or reductions from other expense offset arrangements and do not represent the amount paid by the class during periods when reimbursements or reductions occur. Expense ratios before reductions for start-up periods may not be representative of longer-term operating periods. Expenses net of fee waivers reflect expenses after reimbursement by the investment adviser but prior to reductions from brokerage service arrangements or other expense offset arrangements. Expenses net of all reductions represent the net expenses paid by the class.
See accompanying notes which are an integral part of the financial statements.
Annual Report
Financial Highlights - Convertible Securities
Years ended November 30, | 2010 | 2009 | 2008 | 2007 | 2006 |
Selected Per-Share Data |
|
|
|
| |
Net asset value, beginning of period | $ 21.30 | $ 13.55 | $ 28.71 | $ 25.21 | $ 22.14 |
Income from Investment Operations |
|
|
|
|
|
Net investment income (loss) B | .81 | .96 | .76 | .59 | .49 |
Net realized and unrealized gain (loss) | 3.02 | 7.78 | (14.43) | 3.43 | 3.09 |
Total from investment operations | 3.83 | 8.74 | (13.67) | 4.02 | 3.58 |
Distributions from net investment income | (.84) | (.99) | (.64) | (.50) | (.50) |
Distributions from net realized gain | - | - | (.85) | (.02) | (.01) |
Total distributions | (.84) | (.99) | (1.49) | (.52) | (.51) |
Net asset value, end of period | $ 24.29 | $ 21.30 | $ 13.55 | $ 28.71 | $ 25.21 |
Total Return A | 18.37% | 67.65% | (50.09)% | 16.02% | 16.38% |
Ratios to Average Net Assets C, E |
|
|
|
| |
Expenses before reductions | .59% | .70% | .78% | .79% | .83% |
Expenses net of fee waivers, if any | .59% | .69% | .78% | .79% | .83% |
Expenses net of all reductions | .59% | .69% | .78% | .79% | .83% |
Net investment income (loss) | 3.57% | 5.59% | 3.06% | 2.11% | 2.09% |
Supplemental Data |
|
|
|
| |
Net assets, end of period (in millions) | $ 2,287 | $ 2,340 | $ 1,439 | $ 2,919 | $ 2,083 |
Portfolio turnover rate D | 28% | 31% | 39% | 24% | 35% |
A Total returns would have been lower had certain expenses not been reduced during the periods shown.
B Calculated based on average shares outstanding during the period.
C Fees and expenses of the underlying Fidelity Central Funds are not included in the Fund's expense ratio. The Fund indirectly bears its proportionate share of the expenses of any underlying Fidelity Central Funds.
D Amount does not include the portfolio activity of any underlying Fidelity Central Funds.
E Expense ratios reflect operating expenses of the class. Expenses before reductions do not reflect amounts reimbursed by the investment adviser or reductions from brokerage service arrangements or reductions from other expense offset arrangements and do not represent the amount paid by the class during periods when reimbursements or reductions occur. Expenses net of fee waivers reflect expenses after reimbursement by the investment adviser but prior to reductions from brokerage service arrangements or other expense offset arrangements. Expenses net of all reductions represent the net expenses paid by the class.
See accompanying notes which are an integral part of the financial statements.
Annual Report
Financial Highlights - Institutional Class
Years ended November 30, | 2010 | 2009 G |
Selected Per-Share Data |
|
|
Net asset value, beginning of period | $ 21.29 | $ 12.79 |
Income from Investment Operations |
|
|
Net investment income (loss) D | .80 | .63 |
Net realized and unrealized gain (loss) | 3.02 | 8.54 |
Total from investment operations | 3.82 | 9.17 |
Distributions from net investment income | (.84) | (.67) |
Net asset value, end of period | $ 24.27 | $ 21.29 |
Total Return B, C | 18.34% | 73.31% |
Ratios to Average Net Assets E, H |
|
|
Expenses before reductions | .60% | .73% A |
Expenses net of fee waivers, if any | .60% | .73% A |
Expenses net of all reductions | .60% | .73% A |
Net investment income (loss) | 3.56% | 4.19% A |
Supplemental Data |
|
|
Net assets, end of period (in millions) | $ 6 | $ 3 |
Portfolio turnover rate F | 28% | 31% |
A Annualized
B Total returns for periods of less than one year are not annualized.
C Total returns would have been lower had certain expenses not been reduced during the periods shown.
D Calculated based on average shares outstanding during the period.
E Fees and expenses of the underlying Fidelity Central Funds are not included in the Fund's expense ratio. The Fund indirectly bears its proportionate share of the expenses of any underlying Fidelity Central Funds.
F Amount does not include the portfolio activity of any underlying Fidelity Central Funds.
G For the period February 19, 2009 (commencement of sale of shares) to November 30, 2009.
H Expense ratios reflect operating expenses of the class. Expenses before reductions do not reflect amounts reimbursed by the investment adviser or reductions from brokerage service arrangements or reductions from other expense offset arrangements and do not represent the amount paid by the class during periods when reimbursements or reductions occur. Expense ratios before reductions for start-up periods may not be representative of longer-term operating periods. Expenses net of fee waivers reflect expenses after reimbursement by the investment adviser but prior to reductions from brokerage service arrangements or other expense offset arrangements. Expenses net of all reductions represent the net expenses paid by the class.
See accompanying notes which are an integral part of the financial statements.
Annual Report
Notes to Financial Statements
For the period ended November 30, 2010
(Amounts in thousands except ratios)
1. Organization.
Fidelity Convertible Securities Fund (the Fund) is a fund of Fidelity Financial Trust (the Trust) and is authorized to issue an unlimited number of shares. The Trust is registered under the Investment Company Act of 1940, as amended (the 1940 Act), as an open-end management investment company organized as a Massachusetts business trust. The Fund offers Class A, Class T, Class C, Convertible Securities and Institutional Class shares, each of which, along with Class B shares, has equal rights as to assets and voting privileges. Effective after the close of business on September 1, 2010, Class B shares were closed to new accounts and additional purchases by existing shareholders. Each class has exclusive voting rights with respect to matters that affect that class. Class B shares will automatically convert to Class A shares after a holding period of seven years from the initial date of purchase. Investment income, realized and unrealized capital gains and losses, the common expenses of the Fund, and certain fund-level expense reductions, if any, are allocated on a pro-rata basis to each class based on the relative net assets of each class to the total net assets of the Fund. Each class differs with respect to transfer agent and distribution and service plan fees incurred. Certain expense reductions also differ by class.
2. Investments in Fidelity Central Funds.
The Fund may invest in Fidelity Central Funds, which are open-end investment companies available only to other investment companies and accounts managed by Fidelity Management & Research Company (FMR) and its affiliates. The Fund's Schedule of Investments lists each of the Fidelity Central Funds held as of period end, if any, as an investment of the Fund, but does not include the underlying holdings of each Fidelity Central Fund. As an Investing Fund, the Fund indirectly bears its proportionate share of the expenses of the underlying Fidelity Central Funds.
The Money Market Central Funds seek preservation of capital and current income and are managed by Fidelity Investments Money Management, Inc. (FIMM), an affiliate of FMR.
A complete unaudited list of holdings for each Fidelity Central Fund is available upon request or at the Securities and Exchange Commission (the SEC) web site at www.sec.gov. In addition, the financial statements of the Fidelity Central Funds, which are not covered by the Fund's Report of Independent Registered Public Accounting Firm, are available on the SEC web site or upon request.
3. Significant Accounting Policies.
The financial statements have been prepared in conformity with accounting principles generally accepted in the United States of America (GAAP), which require management to make certain estimates and assumptions at the date of the financial statements.
Annual Report
Notes to Financial Statements - continued
(Amounts in thousands except ratios)
3. Significant Accounting Policies - continued
Actual results could differ from those estimates. The following summarizes the significant accounting policies of the Fund:
Security Valuation. Investments are valued as of 4:00 p.m. Eastern time on the last calendar day of the period. The Fund uses independent pricing services approved by the Board of Trustees to value its investments. When current market prices or quotations are not readily available or reliable, valuations may be determined in good faith in accordance with procedures adopted by the Board of Trustees. Factors used in determining value may include market or security specific events, changes in interest rates and credit quality. The frequency with which these procedures are used cannot be predicted and they may be utilized to a significant extent. The value used for net asset value (NAV) calculation under these procedures may differ from published prices for the same securities.
The Fund categorizes the inputs to valuation techniques used to value its investments into a disclosure hierarchy consisting of three levels as shown below.
Level 1 - quoted prices in active markets for identical investments
Level 2 - other significant observable inputs (including quoted prices for similar investments, interest rates, prepayment speeds, etc.)
Level 3 - unobservable inputs (including the Fund's own assumptions based on the best information available)
Changes in valuation techniques may result in transfers in or out of an assigned level within the disclosure hierarchy. The aggregate value of investments by input level, as of November 30, 2010, as well as a roll forward of Level 3 securities, is included at the end of the Fund's Schedule of Investments. Valuation techniques used to value the Fund's investments by major category are as follows.
Equity securities, including restricted securities, for which market quotations are readily available, are valued at the last reported sale price or official closing price as reported by an independent pricing service on the primary market or exchange on which they are traded and are categorized as Level 1 in the hierarchy. In the event there were no sales during the day or closing prices are not available, securities are valued at the last quoted bid price or may be valued using the last available price and are generally categorized as Level 2 in the hierarchy. For foreign equity securities, when significant market or security specific events arise, comparisons to the valuation of American Depositary Receipts (ADRs), futures contracts, Exchange-traded funds (ETFs) and certain indexes as well as quoted prices for similar securities are used and are categorized as Level 2 in the hierarchy in these circumstances. Utilizing these techniques may result in transfers between Level 1 and Level 2. For restricted equity securities and private placements where
Annual Report
3. Significant Accounting Policies - continued
Security Valuation - continued
observable inputs are limited, assumptions about market activity and risk are used and are categorized as Level 3 in the hierarchy.
Debt securities, including restricted securities, are valued based on evaluated prices received from independent pricing services or from dealers who make markets in such securities. For corporate bonds, pricing services utilize matrix pricing which considers yield or price of bonds of comparable quality, coupon, maturity and type as well as dealer supplied prices and are generally categorized as Level 2 in the hierarchy.
Investments in open-end mutual funds, including the Fidelity Central Funds, are valued at their closing net asset value each business day and are categorized as Level 1 in the hierarchy.
When independent prices are unavailable or unreliable, debt securities may be valued utilizing pricing matrices which consider similar factors that would be used by independent pricing services. These are generally categorized as Level 2 in the hierarchy but may be Level 3 depending on the circumstances. The Fund invests a significant portion of its assets in below investment grade securities. The value of these securities can be more volatile due to changes in the credit quality of the issuer and is sensitive to changes in economic, market and regulatory conditions.
Investment Transactions and Income. For financial reporting purposes, the Fund's investment holdings and NAV include trades executed through the end of the last business day of the period. The NAV per share for processing shareholder transactions is calculated as of the close of business of the New York Stock Exchange (NYSE), normally 4:00 p.m. Eastern time and includes trades executed through the end of the prior business day. Gains and losses on securities sold are determined on the basis of identified cost and may include proceeds received from litigation. Dividend income is recorded on the ex-dividend date, except for certain dividends from foreign securities where the ex-dividend date may have passed, which are recorded as soon as the Fund is informed of the ex-dividend date. Non-cash dividends included in dividend income, if any, are recorded at the fair market value of the securities received. Distributions received on securities that represent a return of capital or capital gain are recorded as a reduction of cost of investments and/or as a realized gain. The Fund estimates the components of distributions received that may be considered return of capital distributions or capital gain distributions. Interest income and distributions from the Fidelity Central Funds are accrued as earned. Interest income includes coupon interest and amortization of premium and accretion of discount on debt securities.
Expenses. Most expenses of the Trust can be directly attributed to a fund. Expenses which cannot be directly attributed are apportioned amongst each fund in the Trust.
Annual Report
Notes to Financial Statements - continued
(Amounts in thousands except ratios)
3. Significant Accounting Policies - continued
Expenses - continued
Expense estimates are accrued in the period to which they relate and adjustments are made when actual amounts are known.
Income Tax Information and Distributions to Shareholders. Each year the Fund intends to qualify as a regulated investment company, including distributing substantially all of its taxable income and realized gains under Subchapter M of the Internal Revenue Code and filing its U.S. federal tax return. As a result, no provision for income taxes is required. As of November 30, 2010, the Fund did not have any unrecognized tax benefits in the accompanying financial statements. A fund's federal tax return is subject to examination by the Internal Revenue Service (IRS) for a period of three years.
Distributions are declared and recorded on the ex-dividend date. Income dividends and capital gain distributions are declared separately for each class. Income and capital gain distributions are determined in accordance with income tax regulations, which may differ from GAAP.
Capital accounts within the financial statements are adjusted for permanent book-tax differences. These adjustments have no impact on net assets or the results of operations. Temporary book-tax differences will reverse in a subsequent period.
Book-tax differences are primarily due to the short-term gain distributions from the Fidelity Central Funds, market discount, deferred trustees compensation, capital loss carryforwards, and losses deferred due to wash sales and excise tax regulations.
The federal tax cost of investment securities and unrealized appreciation (depreciation) as of period end were as follows:
Gross unrealized appreciation | $ 308,237 |
Gross unrealized depreciation | (104,170) |
Net unrealized appreciation (depreciation) | $ 204,067 |
|
|
Tax Cost | $ 2,130,798 |
The tax-based components of distributable earnings as of period end were as follows:
Undistributed ordinary income | $ 16,422 |
Capital loss carryforward | $ (298,128) |
Net unrealized appreciation (depreciation) | $ 204,067 |
Annual Report
3. Significant Accounting Policies - continued
Income Tax Information and Distributions to Shareholders - continued
The tax character of distributions paid was as follows:
| November 30, 2010 | November 30, 2009 |
Ordinary Income | $ 87,526 | $ 103,307 |
4. Operating Policies.
Restricted Securities. The Fund may invest in securities that are subject to legal or contractual restrictions on resale. These securities generally may be resold in transactions exempt from registration or to the public if the securities are registered. Disposal of these securities may involve time-consuming negotiations and expense, and prompt sale at an acceptable price may be difficult. Information regarding restricted securities is included at the end of the Fund's Schedule of Investments.
5. Purchases and Sales of Investments.
Purchases and sales of securities, other than short-term securities, aggregated $622,447 and $821,810, respectively.
6. Fees and Other Transactions with Affiliates.
Management Fee. FMR and its affiliates provide the Fund with investment management related services for which the Fund pays a monthly management fee. The management fee is the sum of an individual fund fee rate that is based on an annual rate of .20% of the Fund's average net assets and a group fee rate that averaged .26% during the period. The group fee rate is based upon the average net assets of all the mutual funds advised by FMR. The group fee rate decreases as assets under management increase and increases as assets under management decrease. In addition, the management fee is subject to a performance adjustment (up to a maximum of ± .15% of the Fund's average net assets over a 36 month performance period). The upward or downward adjustment to the management fee is based on the relative investment performance of Convertible Securities as compared to an appropriate benchmark index. For the period, the total annual management fee rate, including the performance adjustment, was .36% of the Fund's average net assets.
Distribution and Service Plan Fees. In accordance with Rule 12b-1 of the 1940 Act, the Fund has adopted separate Distribution and Service Plans for each class of shares. Certain classes pay Fidelity Distributors Corporation (FDC), an affiliate of FMR, separate Distribution and Service Fees, each of which is based on an annual percentage of each class' average net assets. In addition, FDC may pay financial intermediaries for
Annual Report
Notes to Financial Statements - continued
(Amounts in thousands except ratios)
6. Fees and Other Transactions with Affiliates - continued
Distribution and Service Plan Fees - continued
selling shares of the Fund and providing shareholder support services. For the period, the Distribution and Service Fee rates, total fees and amounts retained by FDC were as follows:
| Distribution | Service | Total Fees | Retained |
Class A | 0% | .25% | $ 29 | $ 2 |
Class T | .25% | .25% | 15 | -* |
Class B | .75% | .25% | 10 | 8 |
Class C | .75% | .25% | 34 | 20 |
|
|
| $ 88 | $ 30 |
* Amount represents less than $1,000
Sales Load. FDC receives a front-end sales charge of up to 5.75% for selling Class A shares, and 3.50% for selling Class T shares, some of which is paid to financial intermediaries for selling shares of the Fund. FDC receives the proceeds of contingent deferred sales charges levied on Class A, Class T, Class B, and Class C redemptions. These charges depend on the holding period. The deferred sales charges range from 5% to 1% for Class B, 1% for Class C, 1.00% for certain purchases of Class A shares (1.00% to .50% prior to July 12, 2010) and .25% for certain purchases of Class T shares.
For the period, sales charge amounts retained by FDC were as follows:
| Retained |
Class A | $ 20 |
Class T | 2 |
Class B* | 6 |
Class C* | 1 |
| $ 29 |
* When Class B and Class C shares are initially sold, FDC pays commissions from its own resources to financial intermediaries through which the sales are made.
Transfer Agent Fees. Fidelity Investments Institutional Operations Company, Inc. (FIIOC), an affiliate of FMR, is the transfer, dividend disbursing and shareholder servicing agent for each class of the Fund. FIIOC receives account fees and asset-based fees that vary according to the account size and type of account of the shareholders of the respective classes of the Fund. FIIOC pays for typesetting, printing and mailing of shareholder reports, except proxy statements.
Annual Report
6. Fees and Other Transactions with Affiliates - continued
Transfer Agent Fees - continued
For the period, transfer agent fees for each class were as follows:
| Amount | % of |
Class A | $ 25 | .22 |
Class T | 7 | .22 |
Class B | 3 | .29 |
Class C | 9 | .26 |
Convertible Securities | 4,324 | .19 |
Institutional Class | 12 | .19 |
| $ 4,380 |
|
Accounting and Security Lending Fees. Fidelity Service Company, Inc. (FSC), an affiliate of FMR, maintains the Fund's accounting records. The accounting fee is based on the level of average net assets for the month. Under a separate contract, FSC administers the security lending program. The security lending fee is based on the number and duration of lending transactions.
Brokerage Commissions. The Fund placed a portion of its portfolio transactions with brokerage firms which are affiliates of the investment adviser. The commissions paid to these affiliated firms were $5 for the period.
7. Committed Line of Credit.
The Fund participates with other funds managed by FMR or an affiliate in a $3.75 billion credit facility (the "line of credit") to be utilized for temporary or emergency purposes to fund shareholder redemptions or for other short-term liquidity purposes. The Fund has agreed to pay commitment fees on its pro-rata portion of the line of credit, which amounted to $9 and is reflected in Miscellaneous expenses on the Statement of Operations. During the period, there were no borrowings on this line of credit.
8. Security Lending.
The Fund lends portfolio securities through a lending agent from time to time in order to earn additional income. The lending agent may loan securities to certain qualified borrowers, including Fidelity Capital Markets (FCM), a broker-dealer affiliated with the Fund. On the settlement date of the loan, the Fund receives collateral (in the form of U.S. Treasury obligations, letters of credit and/or cash) against the loaned securities and maintains collateral in an amount not less than 100% of the market value of the loaned
Annual Report
Notes to Financial Statements - continued
(Amounts in thousands except ratios)
8. Security Lending - continued
securities during the period of the loan. The market value of the loaned securities is determined at the close of business of the Fund and any additional required collateral is delivered to the Fund on the next business day. If the borrower defaults on its obligation to return the securities loaned because of insolvency or other reasons, a fund could experience delays and costs in recovering the securities loaned or in gaining access to the collateral. Any cash collateral received is invested in the Fidelity Securities Lending Cash Central Fund. The value of loaned securities and cash collateral at period end are disclosed on the Fund's Statement of Assets and Liabilities. Security lending income represents the income earned on investing cash collateral, less rebates paid to borrowers and lending agent fees associated with the loan, plus any premium payments received for lending certain types of securities. Security lending income is presented in the Statement of Operations as a component of income from Fidelity Central Funds. Total security lending income during the period amounted to $53. During the period, there were no securities loaned to FCM.
9. Expense Reductions.
FMR voluntarily agreed to reimburse a portion of Convertible Securities operating expenses. During the period, the reimbursement reduced the Class' expenses by $45. In addition, through arrangements with the Fund's custodian, credits realized as a result of uninvested cash balances were used to reduce the Fund's expenses. During the period, these credits reduced the Fund's custody expenses by $1.
10. Distributions to Shareholders.
Distributions to shareholders of each class were as follows:
Years ended November 30, | 2010 | 2009A |
From net investment income |
|
|
Class A | $ 362 | $ 62 |
Class T | 84 | 28 |
Class B | 26 | 9 |
Class C | 87 | 24 |
Convertible Securities | 86,745 | 103,134 |
Institutional Class | 222 | 50 |
Total | $ 87,526 | $ 103,307 |
A Distributions for Class A, Class T, Class B, Class C and Institutional Class are for the period February 19, 2009 (commencement of sale of shares) to November 30, 2009.
Annual Report
11. Share Transactions.
Transactions for each class of shares were as follows:
| Shares | Dollars | ||
Years ended November 30, | 2010 | 2009 A | 2010 | 2009 A |
Class A |
|
|
|
|
Shares sold | 1,087 | 306 | $ 24,711 | $ 5,806 |
Reinvestment of distributions | 13 | 3 | 297 | 54 |
Shares redeemed | (592) | (39) | (13,289) | (801) |
Net increase (decrease) | 508 | 270 | $ 11,719 | $ 5,059 |
Class T |
|
|
|
|
Shares sold | 218 | 95 | $ 5,074 | $ 1,656 |
Reinvestment of distributions | 4 | 2 | 81 | 27 |
Shares redeemed | (168) | (6) | (3,714) | (110) |
Net increase (decrease) | 54 | 91 | $ 1,441 | $ 1,573 |
Class B |
|
|
|
|
Shares sold | 44 | 30 | $ 1,007 | $ 491 |
Reinvestment of distributions | 1 | - | 17 | 8 |
Shares redeemed | (27) | - | (604) | (5) |
Net increase (decrease) | 18 | 30 | $ 420 | $ 494 |
Class C |
|
|
|
|
Shares sold | 180 | 91 | $ 4,099 | $ 1,573 |
Reinvestment of distributions | 3 | 1 | 72 | 23 |
Shares redeemed | (52) | (13) | (1,197) | (248) |
Net increase (decrease) | 131 | 79 | $ 2,974 | $ 1,348 |
Convertible Securities |
|
|
|
|
Shares sold | 18,970 | 36,051 | $ 430,425 | $ 630,445 |
Reinvestment of distributions | 3,506 | 6,070 | 78,155 | 92,808 |
Shares redeemed | (38,186) | (38,505) | (860,169) | (627,813) |
Net increase (decrease) | (15,710) | 3,616 | $ (351,589) | $ 95,440 |
Institutional Class |
|
|
|
|
Shares sold | 400 | 173 | $ 9,185 | $ 3,107 |
Reinvestment of distributions | 6 | 2 | 133 | 44 |
Shares redeemed | (298) | (30) | (6,815) | (642) |
Net increase (decrease) | 108 | 145 | $ 2,503 | $ 2,509 |
A Share transactions for Class A, Class T, Class B, Class C and Institutional Class are for the period February 19, 2009 (commencement of sale of shares) to November 30, 2009.
Annual Report
Notes to Financial Statements - continued
(Amounts in thousands except ratios)
12. Other.
The Fund's organizational documents provide former and current trustees and officers with a limited indemnification against liabilities arising in connection with the performance of their duties to the Fund. In the normal course of business, the Fund may also enter into contracts that provide general indemnifications. The Fund's maximum exposure under these arrangements is unknown as this would be dependent on future claims that may be made against the Fund. The risk of material loss from such claims is considered remote.
Annual Report
Report of Independent Registered Public Accounting Firm
To the Trustees of Fidelity Financial Trust and the Shareholders of Fidelity Convertible Securities Fund:
In our opinion, the accompanying statement of assets and liabilities, including the schedule of investments, and the related statements of operations and of changes in net assets and the financial highlights present fairly, in all material respects, the financial position of Fidelity Convertible Securities Fund (a fund of Fidelity Financial Trust) at November 30, 2010, the results of its operations for the year then ended, the changes in its net assets for each of the two years in the period then ended and the financial highlights for each of the periods indicated, in conformity with accounting principles generally accepted in the United States of America. These financial statements and financial highlights (hereafter referred to as "financial statements") are the responsibility of the Fidelity Convertible Securities Fund's management. Our responsibility is to express an opinion on these financial statements based on our audits. We conducted our audits of these financial statements in accordance with the standards of the Public Company Accounting Oversight Board (United States). Those standards require that we plan and perform the audit to obtain reasonable assurance about whether the financial statements are free of material misstatement. An audit includes examining, on a test basis, evidence supporting the amounts and disclosures in the financial statements, assessing the accounting principles used and significant estimates made by management, and evaluating the overall financial statement presentation. We believe that our audits, which included confirmation of securities at November 30, 2010 by correspondence with the custodian and brokers, provide a reasonable basis for our opinion.
/s/ PricewaterhouseCoopers LLP
PricewaterhouseCoopers LLP
Boston, Massachusetts
January 18, 2011
Annual Report
Trustees and Officers
The Trustees, Members of the Advisory Board, and executive officers of the trust and fund, as applicable, are listed below. The Board of Trustees governs the fund and is responsible for protecting the interests of shareholders. The Trustees are experienced executives who meet periodically throughout the year to oversee the fund's activities, review contractual arrangements with companies that provide services to the fund, oversee management of the risks associated with such activities and contractual arrangements, and review the fund's performance. Except for Mr. James C. Curvey, each of the Trustees oversees 219 funds advised by FMR or an affiliate. Mr. Curvey oversees 408 funds advised by FMR or an affiliate.
The Trustees hold office without limit in time except that (a) any Trustee may resign; (b) any Trustee may be removed by written instrument, signed by at least two-thirds of the number of Trustees prior to such removal; (c) any Trustee who requests to be retired or who has become incapacitated by illness or injury may be retired by written instrument signed by a majority of the other Trustees; and (d) any Trustee may be removed at any special meeting of shareholders by a two-thirds vote of the outstanding voting securities of the trust. Each Trustee who is not an interested person (as defined in the 1940 Act) (Independent Trustee), shall retire not later than the last day of the calendar year in which his or her 72nd birthday occurs. The Independent Trustees may waive this mandatory retirement age policy with respect to individual Trustees. The executive officers and Advisory Board Members hold office without limit in time, except that any officer and Advisory Board Member may resign or may be removed by a vote of a majority of the Trustees at any regular meeting or any special meeting of the Trustees. Except as indicated, each individual has held the office shown or other offices in the same company for the past five years.
Experience, Skills, Attributes, and Qualifications of the Fund's Trustees. The Governance and Nominating Committee has adopted a statement of policy that describes the experience, qualifications, attributes, and skills that are necessary and desirable for potential Independent Trustee candidates (Statement of Policy). The Board believes that each Trustee satisfied at the time he or she was initially elected or appointed a Trustee, and continues to satisfy, the standards contemplated by the Statement of Policy. The Governance and Nominating Committee also engages professional search firms to help identify potential Independent Trustee candidates who have the experience, qualifications, attributes, and skills consistent with the Statement of Policy. From time to time, additional criteria based on the composition and skills of the current Independent Trustees, as well as experience or skills that may be appropriate in light of future changes to board composition, business conditions, and regulatory or other developments, have also been considered by the professional search firms and the Governance and Nominating Committee. In addition, the Board takes into account the Trustees' commitment and participation in Board and committee meetings, as well as their leadership of standing and ad hoc committees throughout their tenure.
In determining that a particular Trustee was and continues to be qualified to serve as a Trustee, the Board has considered a variety of criteria, none of which, in isolation, was controlling. The Board believes that, collectively, the Trustees have balanced and diverse experience, qualifications, attributes, and skills, which allow the Board to operate effectively in governing the fund and protecting the interests of shareholders. Information about the specific experience, skills, attributes, and qualifications of each Trustee, which in each case led to the Board's conclusion that the Trustee should serve (or continue to serve) as a trustee of the fund, is provided below.
Annual Report
Trustees and Officers - continued
Board Structure and Oversight Function. James C. Curvey is an interested person (as defined in the 1940 Act) and currently serves as Acting Chairman. The Trustees have determined that an interested Chairman is appropriate and benefits shareholders because an interested Chairman has a personal and professional stake in the quality and continuity of services provided to the fund. Independent Trustees exercise their informed business judgment to appoint an individual of their choosing to serve as Chairman, regardless of whether the Trustee happens to be independent or a member of management. The Independent Trustees have determined that they can act independently and effectively without having an Independent Trustee serve as Chairman and that a key structural component for assuring that they are in a position to do so is for the Independent Trustees to constitute a substantial majority for the Board. The Independent Trustees also regularly meet in executive session. Ned C. Lautenbach serves as Chairman of the Independent Trustees and as such (i) acts as a liaison between the Independent Trustees and management with respect to matters important to the Independent Trustees and (ii) with management prepares agendas for Board meetings.
Fidelity funds are overseen by different Boards of Trustees. The fund's Board oversees Fidelity's equity and high income funds and another Board oversees Fidelity's investment-grade bond, money market, and asset allocation funds. The asset allocation funds may invest in Fidelity funds overseen by the fund's Board. The use of separate Boards, each with its own committee structure, allows the Trustees of each group of Fidelity funds to focus on the unique issues of the funds they oversee, including common research, investment, and operational issues. On occasion, the separate Boards establish joint committees to address issues of overlapping consequences for the Fidelity funds overseen by each Board.
The Trustees operate using a system of committees to facilitate the timely and efficient consideration of all matters of importance to the Trustees, the fund, and fund shareholders and to facilitate compliance with legal and regulatory requirements and oversight of the fund's activities and associated risks. The Board, acting through its committees, has charged FMR and its affiliates with (i) identifying events or circumstances the occurrence of which could have demonstrably adverse effects on the fund's business and/or reputation; (ii) implementing processes and controls to lessen the possibility that such events or circumstances occur or to mitigate the effects of such events or circumstances if they do occur; and (iii) creating and maintaining a system designed to evaluate continuously business and market conditions in order to facilitate the identification and implementation processes described in (i) and (ii) above. Because the day-to-day operations and activities of the fund's are carried out by or through FMR, its affiliates and other service providers, the fund's exposure to risks is mitigated but not eliminated by the processes overseen by the Trustees. While each of the Board's committees has responsibility for overseeing different aspects of the fund's activities, oversight is exercised primarily through the Operations, Audit, and Compliance Committees. Appropriate personnel, including but not limited to the fund's Chief Compliance Officer (CCO), FMR's internal auditor, the independent accountants, the fund's Treasurer and portfolio management personnel, make periodic reports to the Board's committees, as appropriate. The responsibilities of each committee, including their oversight responsibilities, are described further under "Standing Committees of the Fund's Trustees."
Annual Report
The fund's Statement of Additional Information (SAI) includes more information about the Trustees. To request a free copy, call Fidelity at 1-800-544-8544.
Interested Trustees*:
Correspondence intended for each Trustee who is an interested person may be sent to Fidelity Investments, 82 Devonshire Street, Boston, Massachusetts 02109.
Name, Age; Principal Occupations and Other Relevant Experience+ | |
James C. Curvey (75) | |
| Year of Election or Appointment: 2007 Mr. Curvey is Trustee and Acting Chairman of the Board of Trustees of certain Trusts. Mr. Curvey also serves as Trustee (2007-present) of other investment companies advised by FMR. Mr. Curvey is a Director of Fidelity Investments Money Management, Inc. (2009-present), Director of Fidelity Research & Analysis Co. (2009-present) and Director of FMR and FMR Co., Inc. (2007-present). Mr. Curvey is also Vice Chairman (2007-present) and Director of FMR LLC. In addition, Mr. Curvey serves as an Overseer for the Boston Symphony Orchestra and a member of the Trustees of Villanova University. Previously, Mr. Curvey was the Vice Chairman (2006-2007) and Director (2000-2007) of FMR Corp. |
Ronald P. O'Hanley (54) | |
| Year of Election or Appointment: 2011 Ronald P. O'Hanley is President, Asset Management and Corporate Services, for Fidelity Investments and a member of Fidelity's Executive Committee (2010-present). Previously, Mr. O'Hanley served as President and Chief Executive Officer of BNY Mellon Asset Management (2007-2010). Mr. O'Hanley also served as Vice Chairman of Bank New York Mellon Corp. and a member of that firm's Executive Committee. Prior to the 2007 merger of The Bank of New York and Mellon Financial Corporation, he was Vice Chairman of Mellon Financial Corporation and President and Chief Executive Officer of Mellon Asset Management. He joined Mellon in February 1997. Mr. O'Hanley currently serves as Chairman of the Boston Public Library Foundation Board of Directors and sits on the Board of Directors of Beth Israel Deaconess Medical Center, the Board of Trustees of the Marine Biological Laboratory and the Advisory Board of the Maxwell School of Citizenship and Public Administration at Syracuse University. Mr. O'Hanley also chairs the Council on Asset Management for the Financial Services Roundtable and is a member of the Board of Directors of Institutional Investor's U.S. Institute. |
* Trustees have been determined to be "Interested Trustees" by virtue of, among other things, their affiliation with the trust or various entities under common control with FMR.
+ The information above includes each Trustee's principal occupation during the last five years and other information relating to the experience, attributes, and skills relevant to each Trustee's qualifications to serve as a Trustee, which led to the conclusion that each Trustee should serve as a Trustee for the fund.
Annual Report
Independent Trustees:
Correspondence intended for each Independent Trustee (that is, the Trustees other than the Interested Trustees) may be sent to Fidelity Investments, P.O. Box 55235, Boston, Massachusetts 02205-5235.
Name, Age; Principal Occupations and Other Relevant Experience+ | |
Dennis J. Dirks (62) | |
| Year of Election or Appointment: 2005 Prior to his retirement in May 2003, Mr. Dirks was Chief Operating Officer and a member of the Board of The Depository Trust & Clearing Corporation (DTCC). He also served as President, Chief Operating Officer, and Board member of The Depository Trust Company (DTC) and President and Board member of the National Securities Clearing Corporation (NSCC). In addition, Mr. Dirks served as Chief Executive Officer and Board member of the Government Securities Clearing Corporation, Chief Executive Officer and Board member of the Mortgage-Backed Securities Clearing Corporation, as a Trustee and a member of the Finance Committee of Manhattan College (2005-2008), and as a Trustee and a member of the Finance Committee of AHRC of Nassau County (2006-2008). Mr. Dirks is a member of the Independent Directors Council (IDC) Governing Council (2010-Present) and Board of Directors for The Brookville Center for Children's Services, Inc. (2009-present). |
Alan J. Lacy (57) | |
| Year of Election or Appointment: 2008 Mr. Lacy serves as Senior Adviser (2007-present) of Oak Hill Capital Partners, L.P. (private equity). Mr. Lacy also served as Chief Executive Officer (2000-2005) and Vice Chairman (2005-2006) of Sears Holdings Corporation and Sears, Roebuck and Co. (retail). In addition, Mr. Lacy serves as a member of the Board of Directors of The Western Union Company (global money transfer, 2006-present) and Bristol-Myers Squibb Company (global pharmaceuticals, 2007-present). Mr. Lacy is Chairman (2008-present) and a member (2006-present) of the Board of Trustees of The National Parks Conservation Association. |
Ned C. Lautenbach (66) | |
| Year of Election or Appointment: 2000 Mr. Lautenbach is Chairman of the Independent Trustees of the Equity and High Income Funds (2006-present). Mr. Lautenbach currently serves as the Lead Director of the Eaton Corporation Board of Directors (diversified industrial, 1997-present). Mr. Lautenbach is also a member of the Board of Directors of the Philharmonic Center for the Arts in Naples, Florida (1999-present); a member of the Board of Trustees of Fairfield University (2005-present); and a member of the Council on Foreign Relations (1994-present). Previously, Mr. Lautenbach was a Partner/Advisory Partner at Clayton, Dubilier & Rice, Inc. (private equity investment, 1998-2010), as well as a Director of Sony Corporation (2006-2007). |
Joseph Mauriello (66) | |
| Year of Election or Appointment: 2008 Prior to his retirement in January 2006, Mr. Mauriello served in numerous senior management positions including Deputy Chairman and Chief Operating Officer (2004-2005), and Vice Chairman of Financial Services (2002-2004) of KPMG LLP US (professional services, 1965-2005). Mr. Mauriello currently serves as a member of the Board of Directors of XL Group plc. (global insurance and re-insurance, 2006-present) and of Arcadia Resources Inc. (health care services and products, 2007-present). Previously, Mr. Mauriello served as a Director of the Hamilton Funds of the Bank of New York (2006-2007). |
Cornelia M. Small (66) | |
| Year of Election or Appointment: 2005 Ms. Small is a member of the Board of Directors of the Teagle Foundation (2009-present). Ms. Small is also a member of the Investment Committee, and Chair (2008-present) and a member of the Board of Trustees of Smith College. In addition, Ms. Small serves on the Investment Committee of the Berkshire Taconic Community Foundation (2008-present). Previously, Ms. Small served as Chairperson of the Investment Committee (2002-2008) of Smith College. In addition, Ms. Small served as Chief Investment Officer, Director of Global Equity Investments, and a member of the Board of Directors of Scudder, Stevens & Clark and Scudder Kemper Investments. |
William S. Stavropoulos (71) | |
| Year of Election or Appointment: 2001 Mr. Stavropoulos is Vice Chairman of the Independent Trustees of the Equity and High Income Funds (2006-present). Mr. Stavropoulos serves as President and Founder of the Michigan Baseball Foundation, the Great Lakes Loons (2007-present). Mr. Stavropoulos is Chairman Emeritus of the Board of Directors of The Dow Chemical Company, where he previously served in numerous senior management positions, including President, CEO (1995-2000; 2002-2004), Chairman of the Executive Committee (2000-2006), and as a member of the Board of Directors (1990-2006). Currently, Mr. Stavropoulos is Chairman of Univar (global distributor of commodity and specialty chemicals, 2010-present), a Director of Teradata Corporation (data warehousing and technology solutions, 2008-present), Chemical Financial Corporation, Maersk Inc. (industrial conglomerate), Tyco International, Inc. (multinational manufacturing and services, 2007-present), and a member of the Advisory Board for Metalmark Capital (private equity investment, 2005-present). Mr. Stavropoulos is a special advisor to Clayton, Dubilier & Rice, LLC (private equity investment). In addition, Mr. Stavropoulos is a member of the University of Notre Dame Advisory Council for the College of Science. |
David M. Thomas (61) | |
| Year of Election or Appointment: 2008 Previously, Mr. Thomas served as Executive Chairman (2005-2006) and Chairman and Chief Executive Officer (2000-2005) of IMS Health, Inc. (pharmaceutical and healthcare information solutions). In addition, Mr. Thomas serves as a member of the Board of Directors of Fortune Brands, Inc. (consumer products), and Interpublic Group of Companies, Inc. (marketing communication, 2004-present). |
Michael E. Wiley (60) | |
| Year of Election or Appointment: 2008 Mr. Wiley also serves as a Director of Asia Pacific Exploration Consolidated (international oil and gas exploration and production, 2008-present). Mr. Wiley serves as a Director of Tesoro Corporation (independent oil refiner and marketer, 2005-present), and a Director of Bill Barrett Corporation (exploration and production, 2005-present). In addition, Mr. Wiley also serves as a Director of Post Oak Bank (privately-held bank, 2004-present). Previously, Mr. Wiley served as a member of the Board of Trustees of the University of Tulsa (2000-2006; 2007-2010), as a Senior Energy Advisor of Katzenbach Partners, LLC (consulting, 2006-2007), as an Advisory Director of Riverstone Holdings (private investment), Chairman, President, and CEO of Baker Hughes, Inc. (oilfield services, 2000-2004), and as Director of Spinnaker Exploration Company (exploration and production, 2001-2005). |
Annual Report
Trustees and Officers - continued
+ The information above includes each Trustee's principal occupation during the last five years and other information relating to the experience, attributes, and skills relevant to each Trustee's qualifications to serve as a Trustee, which led to the conclusion that each Trustee should serve as a Trustee for the fund.
Advisory Board Members and Executive Officers:
Correspondence intended for each executive officer, Edward C. Johnson 3d, and Peter S. Lynch may be sent to Fidelity Investments, 82 Devonshire Street, Boston, Massachusetts 02109.
Name, Age; Principal Occupation | |
Edward C. Johnson 3d (80) | |
| Year of Election or Appointment: 2011 Member of the Advisory Board of Fidelity's Equity and High Income Funds. Formerly Trustee and Chairman of the Board of Trustees of certain Trusts, Mr. Johnson serves as Chief Executive Officer, Chairman, and a Director of FMR LLC; Chairman and a Director of FMR; and Chairman and a Director of FMR Co., Inc. In addition, Mr. Johnson serves as Chairman and Director of FIL Limited. Previously, Mr. Johnson served as President of FMR LLC (2006-2007). |
Peter S. Lynch (66) | |
| Year of Election or Appointment: 2003 Member of the Advisory Board of Fidelity's Equity and High Income Funds. Mr. Lynch is Vice Chairman and a Director of FMR and FMR Co., Inc. In addition, Mr. Lynch serves as a Trustee of Boston College and as the Chairman of the Inner-City Scholarship Fund. Previously, Mr. Lynch served on the Special Olympics International Board of Directors (1997-2006). |
Kenneth B. Robins (41) | |
| Year of Election or Appointment: 2008 President and Treasurer of Fidelity's Equity and High Income Funds. Mr. Robins also serves as President and Treasurer (2010-present) and Assistant Treasurer (2009-present) of other Fidelity funds and is an employee of Fidelity Investments (2004-present). Previously, Mr. Robins served as Deputy Treasurer of the Fidelity funds (2005-2008) and Treasurer and Chief Financial Officer of The North Carolina Capital Management Trust: Cash and Term Portfolios (2006-2008). |
Thomas C. Hense (46) | |
| Year of Election or Appointment: 2008 or 2010 Vice President of Fidelity's High Income (2008), Small Cap (2008), and Value (2010) Funds. Previously, Mr. Hense served as a portfolio manager for Fidelity's Institutional Money Management Group (Pyramis) (2003-2008). |
Brian B. Hogan (46) | |
| Year of Election or Appointment: 2009 Vice President of certain Equity Funds and Vice President of Sector Funds. Mr. Hogan also serves as President of FMR's Equity Division (2009-present). Previously, Mr. Hogan served as Senior Vice President, Equity Research of FMR (2006-2009) and as a portfolio manager. |
Scott C. Goebel (42) | |
| Year of Election or Appointment: 2008 Secretary and Chief Legal Officer (CLO) of the Fidelity funds. Mr. Goebel also serves as Secretary and CLO of The North Carolina Capital Management Trust: Cash and Term Portfolio (2008-present); General Counsel, Secretary, and Senior Vice President of FMR (2008-present) and FMR Co., Inc. (2008-present); Deputy General Counsel of FMR LLC; Chief Legal Officer of Fidelity Management & Research (Hong Kong) Limited (2008-present) and Assistant Secretary of Fidelity Management & Research (Japan) Inc. (2008-present), Fidelity Investments Money Management, Inc. (2008-present), Fidelity Management & Research (U.K.) Inc. (2008-present), and Fidelity Research and Analysis Company (2008-present). Previously, Mr. Goebel served as Assistant Secretary of the Funds (2007-2008) and as Vice President and Secretary of Fidelity Distributors Corporation (FDC) (2005-2007). |
William C. Coffey (41) | |
| Year of Election or Appointment: 2009 Assistant Secretary of Fidelity's Equity and High Income Funds. Mr. Coffey also serves as Senior Vice President and Deputy General Counsel of FMR LLC (2010-present), and is an employee of Fidelity Investments. Previously, Mr. Coffey served as Vice President and Associate General Counsel of FMR LLC (2005-2009). |
Holly C. Laurent (56) | |
| Year of Election or Appointment: 2008 Anti-Money Laundering (AML) Officer of the Fidelity funds. Ms. Laurent also serves as AML Officer of The North Carolina Capital Management Trust: Cash and Term Portfolio (2008-present) and is an employee of Fidelity Investments. Previously, Ms. Laurent was Senior Vice President and Head of Legal for Fidelity Business Services India Pvt. Ltd. (2006-2008), and Senior Vice President, Deputy General Counsel and Group Head for FMR LLC (2005-2006). |
Christine Reynolds (52) | |
| Year of Election or Appointment: 2008 Chief Financial Officer of the Fidelity funds. Ms. Reynolds became President of Fidelity Pricing and Cash Management Services (FPCMS) in August 2008. Ms. Reynolds served as Chief Operating Officer of FPCMS (2007-2008). Previously, Ms. Reynolds served as President, Treasurer, and Anti-Money Laundering officer of the Fidelity funds (2004-2007). |
Kenneth A. Rathgeber (63) | |
| Year of Election or Appointment: 2004 Chief Compliance Officer of Fidelity's Equity and High Income Funds. Mr. Rathgeber is Chief Compliance Officer of Fidelity Management & Research (Hong Kong) Limited (2008-present), Fidelity Management & Research (Japan) Inc. (2008-present), FMR (2005-present), FMR Co., Inc. (2005-present), Fidelity Management & Research (U.K.) Inc. (2005-present), Fidelity Research & Analysis Company (2005-present), Fidelity Investments Money Management, Inc. (2005-present), Pyramis Global Advisors, LLC (2005-present), and Strategic Advisers, Inc. (2005-present). |
Jeffrey S. Christian (49) | |
| Year of Election or Appointment: 2009 Deputy Treasurer of the Fidelity funds. Mr. Christian is an employee of Fidelity Investments. Previously, Mr. Christian served as Chief Financial Officer (2008-2009) of certain Fidelity funds and Senior Vice President of Fidelity Pricing and Cash Management Services (FPCMS) (2004-2009). |
Bryan A. Mehrmann (49) | |
| Year of Election or Appointment: 2005 Deputy Treasurer of the Fidelity funds. Mr. Mehrmann is an employee of Fidelity Investments. |
Adrien E. Deberghes (43) | |
| Year of Election or Appointment: 2008 Deputy Treasurer of Fidelity's Equity and High Income Funds. Mr. Deberghes also serves as Assistant Treasurer of other Fidelity funds (2010-present) and is an employee of Fidelity Investments (2008-present). Previously, Mr. Deberghes served as Senior Vice President of Mutual Fund Administration at State Street Corporation (2007-2008), Senior Director of Mutual Fund Administration at Investors Bank & Trust (2005-2007), and Director of Finance for Dunkin' Brands (2000-2005). |
Stephanie J. Dorsey (41) | |
| Year of Election or Appointment: 2010 Assistant Treasurer of Fidelity's Equity and High Income Funds. Ms. Dorsey also serves as Deputy Treasurer of other Fidelity funds (2008-present) and is an employee of Fidelity Investments (2008-present). Previously, Ms. Dorsey served as Treasurer (2004-2008) of the JPMorgan Mutual Funds and Vice President (2004-2008) of JPMorgan Chase Bank. |
John R. Hebble (52) | |
| Year of Election or Appointment: 2009 Assistant Treasurer of Fidelity's Equity and High Income Funds. Mr. Hebble also serves as Treasurer and Chief Financial Officer of The North Carolina Capital Management Trust: Cash and Term Portfolio (2008-present), President and Treasurer of other Fidelity funds (2008-present) and is an employee of Fidelity Investments. |
Gary W. Ryan (52) | |
| Year of Election or Appointment: 2005 Assistant Treasurer of the Fidelity funds. Mr. Ryan is an employee of Fidelity Investments. Previously, Mr. Ryan served as Vice President of Fund Reporting in Fidelity Pricing and Cash Management Services (FPCMS) (1999-2005). |
Jonathan Davis (42) | |
| Year of Election or Appointment: 2010 Assistant Treasurer of the Fidelity funds. Mr. Davis is an employee of Fidelity Investments. Previously, Mr. Davis served as Vice President and Associate General Counsel of FMR LLC (2003-2010). |
Annual Report
Distributions (Unaudited)
A total of .08% of the dividends distributed during the fiscal year was derived from interest on U.S. Government securities which is generally exempt from state income tax.
The fund designates $48,972,364 of distributions paid during the period January 1, 2010 to November 30, 2010 as qualifying to be taxed as interest-related dividends for nonresident alien shareholders.
The fund designates 3%, 3%, and 3%; of the dividends distributed in April 2010, July 2010, and October 2010, respectively during the fiscal year as amounts which may be taken into account as a dividend for purposes of the maximum rate under section 1(h)(11) of the Internal Revenue Code.
The fund will notify shareholders in January 2011 of amounts for use in preparing 2010 income tax returns.
Annual Report
Board Approval of Investment Advisory Contracts and Management Fees
Fidelity Convertible Securities Fund
Each year, the Board of Trustees, including the Independent Trustees (together, the Board), votes on the renewal of the management contract and sub-advisory agreements (together, the Advisory Contracts) for the fund. The Board, assisted by the advice of fund counsel and Independent Trustees' counsel, requests and considers a broad range of information relevant to the renewal of the Advisory Contracts throughout the year.
The Board meets regularly and considers at each of its meetings factors that are relevant to its annual consideration of the renewal of the fund's Advisory Contracts, including the services and support provided to the fund and its shareholders. The Board has established various standing committees, each composed of Independent Trustees with varying backgrounds, to which the Board has assigned specific subject matter responsibilities in order to enhance effective decision-making by the Board. The Board, acting directly and through its Committees, requests and receives information concerning the annual consideration of the renewal of the fund's Advisory Contracts. The Board also meets as needed to consider matters specifically related to the Board's annual consideration of the renewal of Advisory Contracts. Members of the Board may also meet with trustees of other Fidelity funds through ad hoc joint committees to discuss certain matters relevant to the Fidelity funds.
At its July 2010 meeting, the Board of Trustees, including the Independent Trustees, unanimously determined to renew the fund's Advisory Contracts. In reaching its determination, the Board considered all factors it believed relevant, including (i) the nature, extent, and quality of the services to be provided to the fund and its shareholders (including the investment performance of the fund); (ii) the competitiveness of the fund's management fee and total expenses; (iii) the total costs of the services to be provided by and the profits to be realized by Fidelity from its relationship with the fund; (iv) the extent to which economies of scale would be realized as the fund grows; and (v) whether fee levels reflect these economies of scale, if any, for the benefit of fund shareholders.
In considering whether to renew the Advisory Contracts for the fund, the Board reached a determination, with the assistance of fund counsel and Independent Trustees' counsel and through the exercise of its business judgment, that the renewal of the Advisory Contracts is in the best interests of fund shareholders and that the compensation to be received by Fidelity under the management contract is fair and reasonable. The Board's decision to renew the Advisory Contracts was not based on any single factor noted above, but rather was based on a comprehensive consideration of all the information provided to the Board at its meetings throughout the year. The Board, in reaching its determination to renew the Advisory Contracts, is aware that shareholders in the fund have a broad range of investment choices available to them, including a wide choice among mutual funds offered by Fidelity's competitors, and that the fund's shareholders, with the opportunity to review and weigh the disclosure provided by the fund in its prospectus and other public disclosures, have chosen to invest in this fund, managed by Fidelity.
Annual Report
Board Approval of Investment Advisory Contracts and
Management Fees - continued
Nature, Extent, and Quality of Services Provided. The Board considered the staffing within the investment adviser, FMR, and the sub-advisers (together, the Investment Advisers), including the backgrounds of the fund's investment personnel and the fund's investment objective and discipline. The Independent Trustees also had discussions with senior management of Fidelity's investment operations and investment groups. The Board considered the structure of the portfolio manager compensation program and whether this structure provides appropriate incentives to act in the best interest of the fund.
Resources Dedicated to Investment Management and Support Services. The Board and the equity research subcommittee of the Board's Fund Oversight Committee reviewed the size, education, and experience of the Investment Advisers' investment staff, their use of technology, and the Investment Advisers' approach to recruiting, training, and retaining portfolio managers and other research, advisory, and management personnel. The Board noted that Fidelity's analysts have access to a variety of technological tools and market and securities data that enable them to perform both fundamental and quantitative analysis and to specialize in various disciplines. The Board considered Fidelity's extensive global research capabilities that enable the Investment Advisers to aggregate data from various sources in an effort to produce positive investment results. The Board also considered that Fidelity's portfolio managers and analysts have access to daily portfolio attribution that allows for monitoring of a fund's portfolio, as well as an electronic communication system that provides immediate real-time access to research concerning issuers and credit enhancers. The Board noted FMR's continued focus on strengthening the organization and discipline of equity portfolio management and research.
Shareholder and Administrative Services. The Board considered (i) the nature, extent, quality, and cost of advisory, administrative, and shareholder services performed by the Investment Advisers and their affiliates under the Advisory Contracts and under separate agreements covering transfer agency, pricing and bookkeeping, and securities lending services for the fund; (ii) the nature and extent of the investment adviser's supervision of third party service providers, principally custodians and subcustodians; and (iii) the resources devoted to, and the record of compliance with, the fund's compliance policies and procedures. The Board also reviewed the allocation of fund brokerage, including allocations to brokers affiliated with the Investment Advisers, the use of brokerage commissions to pay fund expenses, and the use of "soft" commission dollars to pay for research services.
The Board noted that the growth of fund assets over time across the complex allows Fidelity to reinvest in the development of services designed to enhance the value or convenience of the Fidelity funds as investment vehicles. These services include 24-hour access to account information and market information through phone representatives and over the Internet, and investor education materials and asset allocation tools.
Annual Report
Investment in a Large Fund Family. The Board considered the benefits to shareholders of investing in a Fidelity fund, including the benefits of investing in a fund that is part of a large family of funds offering a variety of investment disciplines and providing a large variety of mutual fund investor services. The Board noted that Fidelity had taken, or had made recommendations that resulted in the Fidelity funds taking, a number of actions over the previous year that benefited particular funds, including (i) dedicating additional resources to investment research and restructuring and broadening the focus of the investment research teams; (ii) bolstering the senior management team that oversees asset management; (iii) launching Class F of certain funds as a lower-fee class available to Freedom K and Freedom Index Funds; (iv) lowering the initial investment minimums and ongoing balance requirements for Real Estate High Income Fund; (v) eliminating subsequent purchase minimums for all funds and adding a waiver of the investment minimum requirement for new accounts opened with the proceeds of a systematic withdrawal plan; (vi) eliminating the withdrawal minimum and maximum limits for systematic withdrawals from Advisor funds; (vii) expanding sales load waivers on Class A shares for Destiny Planholders and expanding Institutional Class eligibility for Class O Destiny Planholders; and (viii) changing certain Class A and Class T sales charge structures to further align them with industry practices.
Investment Performance. The Board considered whether the fund has operated in accordance with its investment objective, as well as its record of compliance with its investment restrictions. It also reviewed the fund's absolute investment performance for the retail class, as well as the fund's relative investment performance for the retail class measured over multiple periods against (i) a broad-based securities market index, and (ii) a peer group of mutual funds deemed appropriate by Fidelity and reviewed by the Board. The following charts considered by the Board show, over the one-, three-, and five-year periods ended December 31, 2009, the cumulative total returns of the retail class of the fund, the cumulative total returns of a broad-based securities market index ("benchmark"), and a range of cumulative total returns of a peer group of mutual funds identified by Lipper Inc. as having an investment objective similar to that of the fund. (The Advisor classes of the fund had less than one year of performance as of Decem-ber 31, 2009.) The box within each chart shows the 25th percentile return (bottom of box) and the 75th percentile return (top of box) of the peer group. Returns shown above the box are in the first quartile and returns shown below the box are in the fourth quartile. The percentage beaten number noted below each chart corresponds to the percentile box and represents the percentage of funds in the peer group whose performance was equal to or lower than that of the retail class of the fund.
Annual Report
Board Approval of Investment Advisory Contracts and
Management Fees - continued
Fidelity Convertible Securities Fund
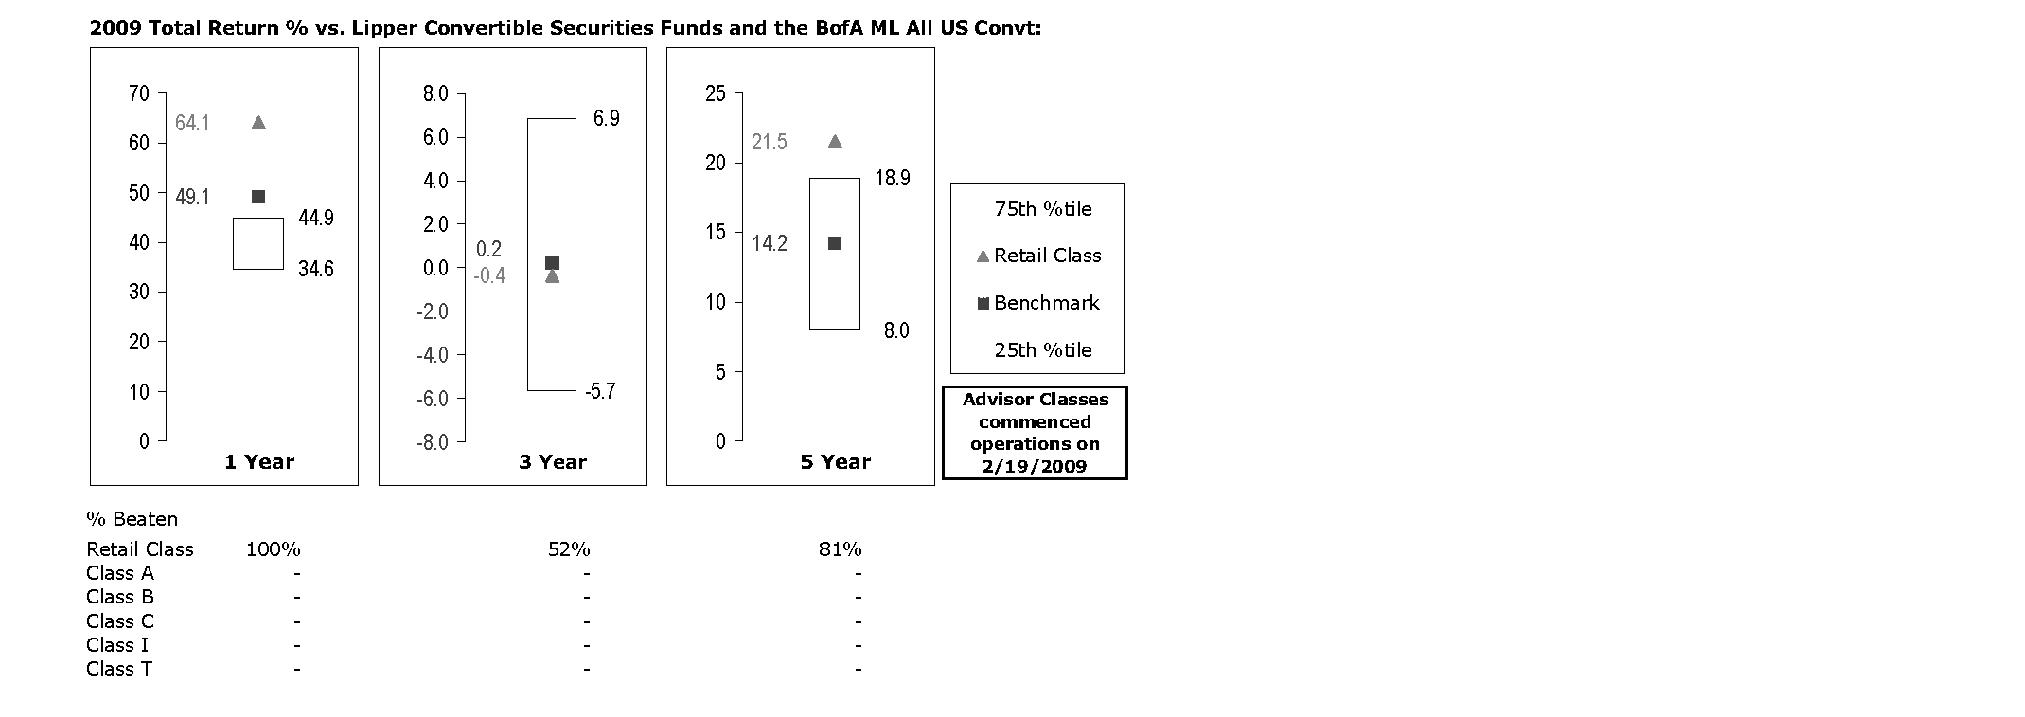
The Board reviewed the fund's relative investment performance against its peer group and noted that the performance of the retail class of the fund was in the first quartile for the one- and five-year periods and the second quartile for the three-year period. The Board also noted that the investment performance of the retail class of the fund compared favorably to its benchmark for the one- and five-year periods, although the fund's three-year cumulative total return was lower than its benchmark. The Board also reviewed the fund's performance since inception as well as performance in the current year.
The Board also considered that the fund's management fee is subject to upward or downward adjustment depending upon whether, and to what extent, the fund's investment performance for the performance period exceeds, or is exceeded by, the record (over the same period) of a Board-approved performance adjustment index. The Board realizes that the performance adjustment provides FMR with a strong economic incentive to seek to achieve superior performance for the fund's shareholders and helps to more closely align the interests of FMR and the fund's shareholders.
Based on its review, and giving particular weight to the nature and quality of the resources dedicated by the Investment Advisers to maintain and improve relative performance and factoring in the unprecedented market events in recent years, the Board concluded that the nature, extent, and quality of investment management and support services and of shareholder and administrative services provided to the fund will benefit the fund's shareholders, particularly in light of the Board's view that the fund's shareholders benefit from investing in a fund that is part of a large family of funds offering a variety of investment disciplines and services.
Annual Report
Competitiveness of Management Fee and Total Fund Expenses. The Board considered the fund's management fee and total expenses compared to "mapped groups" of competitive funds and classes. Fidelity creates "mapped groups" by combining similar Lipper investment objective categories that have comparable management fee characteristics. Combining Lipper investment objective categories aids the Board's management fee and total expense comparisons by broadening the competitive group used for comparison and by reducing the number of universes to which various Fidelity funds are compared.
Management Fee. The Board considered two proprietary management fee comparisons for the 12-month periods shown in the chart below. The group of Lipper funds used by the Board for management fee comparisons is referred to below as the "Total Mapped Group." The Total Mapped Group is broader than the Lipper peer group used by the Board for performance comparisons because the Total Mapped Group combines several Lipper investment objective categories while the Lipper peer group does not. The Total Mapped Group comparison focuses on a fund's standing relative to the total universe of comparable funds available to investors, in terms of gross management fees before expense reimbursements or caps, and without giving effect to the fund's performance adjustment. "TMG %" represents the percentage of funds in the Total Mapped Group that had management fees that were lower than the fund's. For example, a TMG % of 12% means that 88% of the funds in the Total Mapped Group had higher management fees than the fund. The "Asset-Size Peer Group" (ASPG) comparison focuses on a fund's standing relative to non-Fidelity funds similar in size to the fund within the Total Mapped Group. The ASPG represents at least 15% of the funds in the Total Mapped Group with comparable asset size and management fee characteristics, subject to a minimum of 50 funds (or all funds in the Total Mapped Group if fewer than 50). Additional information, such as the ASPG quartile in which the fund's management fee ranked and the impact of the fund's performance adjustment, is also included in the chart and considered by the Board.
Annual Report
Board Approval of Investment Advisory Contracts and
Management Fees - continued
Fidelity Convertible Securities Fund

The Board noted that the fund's management fee ranked below the median of its Total Mapped Group and below the median of its ASPG for 2009. The Board also noted the effect of the fund's negative performance adjustment on the fund's management fee ranking. The Board noted that the performance adjustment for each year represents calculations for performance periods that differ from the periods shown in the performance charts above.
Based on its review, the Board concluded that the fund's management fee is fair and reasonable in light of the services that the fund receives and the other factors considered.
Total Expenses. In its review of each class's total expenses, the Board considered the fund's management fee as well as other fund or class expenses, as applicable, such as transfer agent fees, pricing and bookkeeping fees, fund-paid 12b-1 fees, and custodial, legal, and audit fees. The Board also noted the effects of any waivers and reimbursements on fees and expenses, as well as the impact of the fund's performance adjustment. As part of its review, the Board also considered current and historical total expenses of each class of the fund compared to competitive fund median expenses. Each class of the fund is compared to those funds and classes in the Total Mapped Group (used by the Board for management fee comparisons) that have a similar sales load structure.
The Board noted that the total expenses of each class ranked below its competitive median for 2009.
Annual Report
Fees Charged to Other Fidelity Clients. The Board also considered Fidelity fee structures and other information with respect to clients of FMR and its affiliates, such as other mutual funds advised or subadvised by FMR or its affiliates, pension plan clients, and other institutional clients. In March 2010, the Board created an ad hoc joint committee with the board of other Fidelity funds (the Committee) to review and compare Fidelity's institutional investment advisory business with its business of providing services to the Fidelity funds, including the differences in services provided, fees charged, and costs incurred, as well as competition in their respective marketplaces.
Based on its review of total expenses and fees charged to other Fidelity clients, the Board concluded that the total expenses of each class of the fund were reasonable in light of the services that the fund and its shareholders receive and the other factors considered, including the findings of the Committee.
Costs of the Services and Profitability. The Board considered the revenues earned and the expenses incurred by Fidelity in conducting the business of developing, marketing, distributing, managing, administering and servicing the fund and its shareholders. The Board also considered the level of Fidelity's profits in respect of all the Fidelity funds.
On an annual basis, FMR presents to the Board Fidelity's profitability for the fund. Fidelity calculates the profitability for each fund, as well as aggregate profitability for groups of Fidelity funds and all Fidelity funds, using a series of detailed revenue and cost allocation methodologies which originate with the audited books and records of Fidelity. The Audit Committee of the Board reviews any significant changes from the prior year's methodologies.
PricewaterhouseCoopers LLP (PwC), independent registered public accounting firm and auditor to Fidelity and certain Fidelity funds, has been engaged annually by the Board as part of the Board's assessment of Fidelity's profitability analysis. PwC's engagement includes the review and assessment of Fidelity's methodologies used in determining the revenues and expenses attributable to Fidelity's mutual fund business, and completion of agreed-upon procedures surrounding the mathematical accuracy of fund profitability and its conformity to allocation methodologies. After considering PwC's reports issued under the engagement and information provided by Fidelity, the Board believes that while other allocation methods may also be reasonable, Fidelity's profitability methodologies are reasonable in all material respects.
The Board has also reviewed Fidelity's non-fund businesses and fall-out benefits related to the mutual fund business as well as cases where Fidelity's affiliates may benefit from or be related to the fund's business.
Annual Report
Board Approval of Investment Advisory Contracts and
Management Fees - continued
The Board considered the costs of the services provided by and the profits realized by Fidelity in connection with the operation of the fund and were satisfied that the profitability was not excessive in the circumstances.
Economies of Scale. The Board considered whether there have been economies of scale in respect of the management of the Fidelity funds, whether the Fidelity funds (including the fund) have appropriately benefited from any such economies of scale, and whether there is potential for realization of any further economies of scale. The Board considered the extent to which the fund will benefit from economies of scale through increased services to the fund, through waivers or reimbursements, or through fee or expense reductions.
In February 2009, the Board and the board of other Fidelity funds created an ad hoc committee (the Economies of Scale Committee) to analyze whether FMR attains economies of scale in respect of the management and servicing of the Fidelity funds, whether the Fidelity funds have appropriately benefited from such economies of scale, and whether there is potential for realization of any further economies of scale.
The Board recognized that the fund's management contract incorporates a "group fee" structure, which provides for lower group fee rates as total fund assets under FMR's management increase, and for higher group fee rates as total fund assets under FMR's management decrease. FMR calculates the group fee rates based on a tiered asset "breakpoint" schedule that varies based on asset class. The Board considered that the group fee is designed to deliver the benefits of economies of scale to fund shareholders when total Fidelity fund assets increase, even if assets of any particular fund are unchanged or have declined, because some portion of Fidelity's costs are attributable to services provided to all Fidelity funds, and all funds benefit if those costs can be allocated among more assets. The Board concluded that, given the group fee structure, fund shareholders will benefit from lower management fees as assets under FMR's management increase at the fund complex level, regardless of whether Fidelity achieves any such economies of scale.
The Board concluded, considering the findings of the Economies of Scale Committee, that any potential economies of scale are being appropriately shared between fund shareholders and Fidelity.
Additional Information Requested by the Board. In order to develop fully the factual basis for consideration of the Fidelity funds' Advisory Contracts, the Board requested and received additional information on certain topics, including (i) fund performance trends, actions to be taken by FMR to improve certain funds' overall performance, and Fidelity's long-term strategies for certain funds; (ii) portfolio manager changes that have occurred during the past year and length of portfolio manager tenure for different categories of funds over time; (iii) Fidelity's compensation structure for portfolio managers, research analysts, and other key personnel, the rationale for the compensation structure, and how the compensation structure provides appropriate performance incentives; (iv) the amount of the investment that each portfolio manager has made in the Fidelity fund(s) that he or she manages; (v) management and other fees paid by FMR to affiliated sub-advisers on behalf of the Fidelity funds; (vi) Fidelity's fee structures and rationale for recommending different fees among different categories of funds; (vii) Fidelity's rationale for recommending which funds should have a performance adjustment component as part of their management fees; (viii) the rationale for any differences between fund fee structures and fee structures in place for other Fidelity clients; and (ix) explanations regarding the relative total expenses borne by certain funds and classes, total expense competitive trends, and actions that might be taken by FMR to reduce total expenses for certain funds and classes.
Annual Report
Based on its evaluation of all of the conclusions noted above, and after considering all factors it believed relevant, the Board ultimately concluded that the advisory fee structures are fair and reasonable, and that the fund's Advisory Contracts should be renewed.
Annual Report
Investment Adviser
Fidelity Management & Research Company
Boston, MA
Investment Sub-Advisers
FMR Co., Inc.
Fidelity Management & Research (U.K.) Inc.
Fidelity Research & Analysis Company
Fidelity Management & Research (Hong Kong) Limited
Fidelity Management & Research (Japan) Inc.
General Distributor
Fidelity Distributors Corporation
Boston, MA
Transfer and Service Agents
Fidelity Investments Institutional Operations Company, Inc.
Boston, MA
Fidelity Service Company, Inc.
Boston, MA
Custodian
Citibank, N.A.
New York, NY
The Fidelity Telephone Connection
Mutual Fund 24-Hour Service
Exchanges/Redemptions
and Account Assistance 1-800-544-6666
Product Information 1-800-544-6666
Retirement Accounts 1-800-544-4774
(8 a.m. - 9 p.m.)
TDD Service 1-800-544-0118
for the deaf and hearing impaired
(9 a.m. - 9 p.m. Eastern time)
Fidelity Automated Service
Telephone (FAST®)
1-800-544-5555
Automated line for quickest service
CVS-UANN-0111
1.786706.107

(Fidelity Investment logo)(registered trademark)
Fidelity Advisor®
Convertible Securities
Fund - Class A, Class T, Class B
and Class C
Annual Report
November 30, 2010
Class A, Class T, Class B, and Class C are classes of Fidelity® Convertible Securities Fund
(2_fidelity_logos) (Registered_Trademark)
Contents
Chairman's Message | The Chairman's message to shareholders. | |
Performance | How the fund has done over time. | |
Management's Discussion of Fund Performance | The Portfolio Manager's review of fund performance and strategy. | |
Shareholder Expense Example | An example of shareholder expenses. | |
Investment Changes | A summary of major shifts in the fund's investments over the past six months. | |
Investments | A complete list of the fund's investments with their market values. | |
Financial Statements | Statements of assets and liabilities, operations, and changes in net assets, as well as financial highlights. | |
Notes | Notes to the financial statements. | |
Report of Independent Registered Public Accounting Firm |
| |
Trustees and Officers |
| |
Distributions |
| |
Board Approval of Investment Advisory Contracts and Management Fees |
|
To view a fund's proxy voting guidelines and proxy voting record for the 12-month period ended June 30, visit http://www.fidelity.com/proxyvotingresults or visit the Securities and Exchange Commission's (SEC) web site at http://www.sec.gov. You may also call 1-877-208-0098 to request a free copy of the proxy voting guidelines.
Standard & Poor's, S&P and S&P 500 are registered service marks of The McGraw-Hill Companies, Inc. and have been licensed for use by Fidelity Distributors Corporation.
Other third party marks appearing herein are the property of their respective owners.
All other marks appearing herein are registered or unregistered trademarks or service marks of FMR LLC or an affiliated company.
Annual Report
This report and the financial statements contained herein are submitted for the general information of the shareholders of the fund. This report is not authorized for distribution to prospective investors in the fund unless preceded or accompanied by an effective prospectus.
A fund files its complete schedule of portfolio holdings with the SEC for the first and third quarters of each fiscal year on Form N-Q. Forms N-Q are available on the SEC's web site at http://www.sec.gov. A fund's Forms N-Q may be reviewed and copied at the SEC's Public Reference Room in Washington, DC. Information regarding the operation of the SEC's Public Reference Room may be obtained by calling 1-800-SEC-0330. For a complete list of a fund's portfolio holdings, view the most recent holdings listing, semiannual report, or annual report on Fidelity's web site at http://www.fidelity.com or http://www.advisor.fidelity.com, or http://www.401k.com, as applicable.
NOT FDIC INSURED • MAY LOSE VALUE • NO BANK GUARANTEE
Neither the fund nor Fidelity Distributors Corporation is a bank.
Annual Report
Chairman's Message
(photo_of_James_C_Curvey)
Dear Shareholder:
Equities have staged a rally in the second half of 2010, shaking off concerns about the European debt crisis and the possibility of a double-dip recession in the U.S. Although the short-term surge pushed major equity indexes back into positive territory for the year, several questions remain about the longer-term outlook, including lackluster economic growth and persistently high unemployment. Financial markets are always unpredictable, of course, but there also are several time-tested investment principles that can help put the odds in your favor.
One of the basic tenets is to invest for the long term. Over time, riding out the markets' inevitable ups and downs has proven much more effective than selling into panic or chasing the hottest trend. Even missing only a few of the markets' best days can significantly diminish investor returns. Patience also affords the benefits of compounding - of earning interest on additional income or reinvested dividends and capital gains. There can be tax advantages and cost benefits to consider as well. While staying the course doesn't eliminate risk, it can considerably lessen the effect of short-term declines.
You can further manage your investing risk through diversification. And today, more than ever, geographic diversification should be taken into account. Studies indicate that asset allocation is the single most important determinant of a portfolio's long-term success. The right mix of stocks, bonds and cash - aligned to your particular risk tolerance and investment objective - is very important. Age-appropriate rebalancing is also an essential aspect of asset allocation. For younger investors, an emphasis on equities - which historically have been the best-performing asset class over time - is encouraged. As investors near their specific goal, such as retirement or sending a child to college, consideration may be given to replacing volatile assets (e.g. common stocks) with more-stable fixed investments (bonds or savings plans).
A third principle - investing regularly - can help lower the average cost of your purchases. Investing a certain amount of money each month or quarter helps ensure you won't pay for all your shares at market highs. This strategy - known as dollar cost averaging - also reduces "emotion" from investing, helping shareholders avoid selling weak performers just prior to an upswing, or chasing a hot performer just before a correction.
We invite you to contact us via the Internet, through our Investor Centers or by phone. It is our privilege to provide you the information you need to make the investments that are right for you.
Sincerely,
(The acting chairman's signature appears here.)
James C. Curvey
Acting Chairman
Annual Report
Performance: The Bottom Line
Average annual total return reflects the change in the value of an investment, assuming reinvestment of the class' distributions from dividend income and capital gains (the profits earned upon the sale of securities that have grown in value, if any) and assuming a constant rate of performance each year. The $10,000 table and the fund's returns do not reflect the deduction of taxes that a shareholder would pay on fund distributions or the redemption of fund shares. During periods of reimbursement by Fidelity, a fund's total return will be greater than it would be had the reimbursement not occurred. How a fund did yesterday is no guarantee of how it will do tomorrow.
Average Annual Total Returns
Periods ended November 30, 2010 | Past 1 | Past 5 | Past 10 |
Class A (incl. 5.75% sales charge)A | 11.26% | 4.63% | 5.30% |
Class T (incl. 3.50% sales charge)B | 13.62% | 5.04% | 5.50% |
Class B (incl. contingent deferred sales charge) C | 12.08% | 5.25% | 5.77% |
Class C (incl. contingent deferred sales charge) D | 16.13% | 5.58% | 5.78% |
A Class A shares bear a 0.25% 12b-1 fee. The initial offering of Class A shares took place on February 19, 2009. Returns prior to February 19, 2009 are those of Fidelity Convertible Securities Fund, the original class of the fund, which has no 12b-1 fee. Had Class A shares' 12b-1 fee been reflected, returns prior to February 19, 2009 would have been lower.
B Class T shares bear a 0.50% 12b-1 fee. The initial offering of Class T shares took place on February 19, 2009. Returns prior to February 19, 2009 are those of Fidelity Convertible Securities Fund, the original class of the fund, which has no 12b-1 fee. Had Class T shares' 12b-1 fee been reflected, returns prior to February 19, 2009 would have been lower.
C Class B shares bear a 1.00% 12b-1 fee. The initial offering of Class B shares took place on February 19, 2009. Returns prior to February 19, 2009 are those of Fidelity Convertible Securities Fund, the original class of the fund, which has no 12b-1 fee. Had Class B shares' 12b-1 fee been reflected, returns prior to February 19, 2009 would have been lower. Class B shares' contingent deferred sales charges included in the past one year, past five years, and past 10 years total return figures are 5%, 2%, and 0%, respectively.
D Class C shares bear a 1.00% 12b-1 fee. The initial offering of Class C shares took place on February 19, 2009. Returns prior to February 19, 2009 are those of Fidelity Convertible Securities Fund, the original class of the fund, which has no 12b-1 fee. Had Class C shares' 12b-1 fee been reflected, returns prior to February 19, 2009 would have been lower. Class C shares' contingent deferred sales charges included in the past one year, past five years, and past 10 years total return figures are 1%, 0%, and 0%, respectively.
Annual Report
$10,000 Over 10 Years
Let's say hypothetically that $10,000 was invested in Fidelity Advisor® Convertible Securities Fund - Class A on November 30, 2000, and the current 5.75% sales charge was paid. The chart shows how the value of your investment would have changed, and also shows how The BofA Merrill Lynch All US Convertibles Index performed over the same period. The initial offering of Fidelity Advisor Convertible Securities Fund - Class A took place on February 19, 2009. See the previous page for additional information regarding the performance of Fidelity Advisor Convertible Securities Fund - Class A.
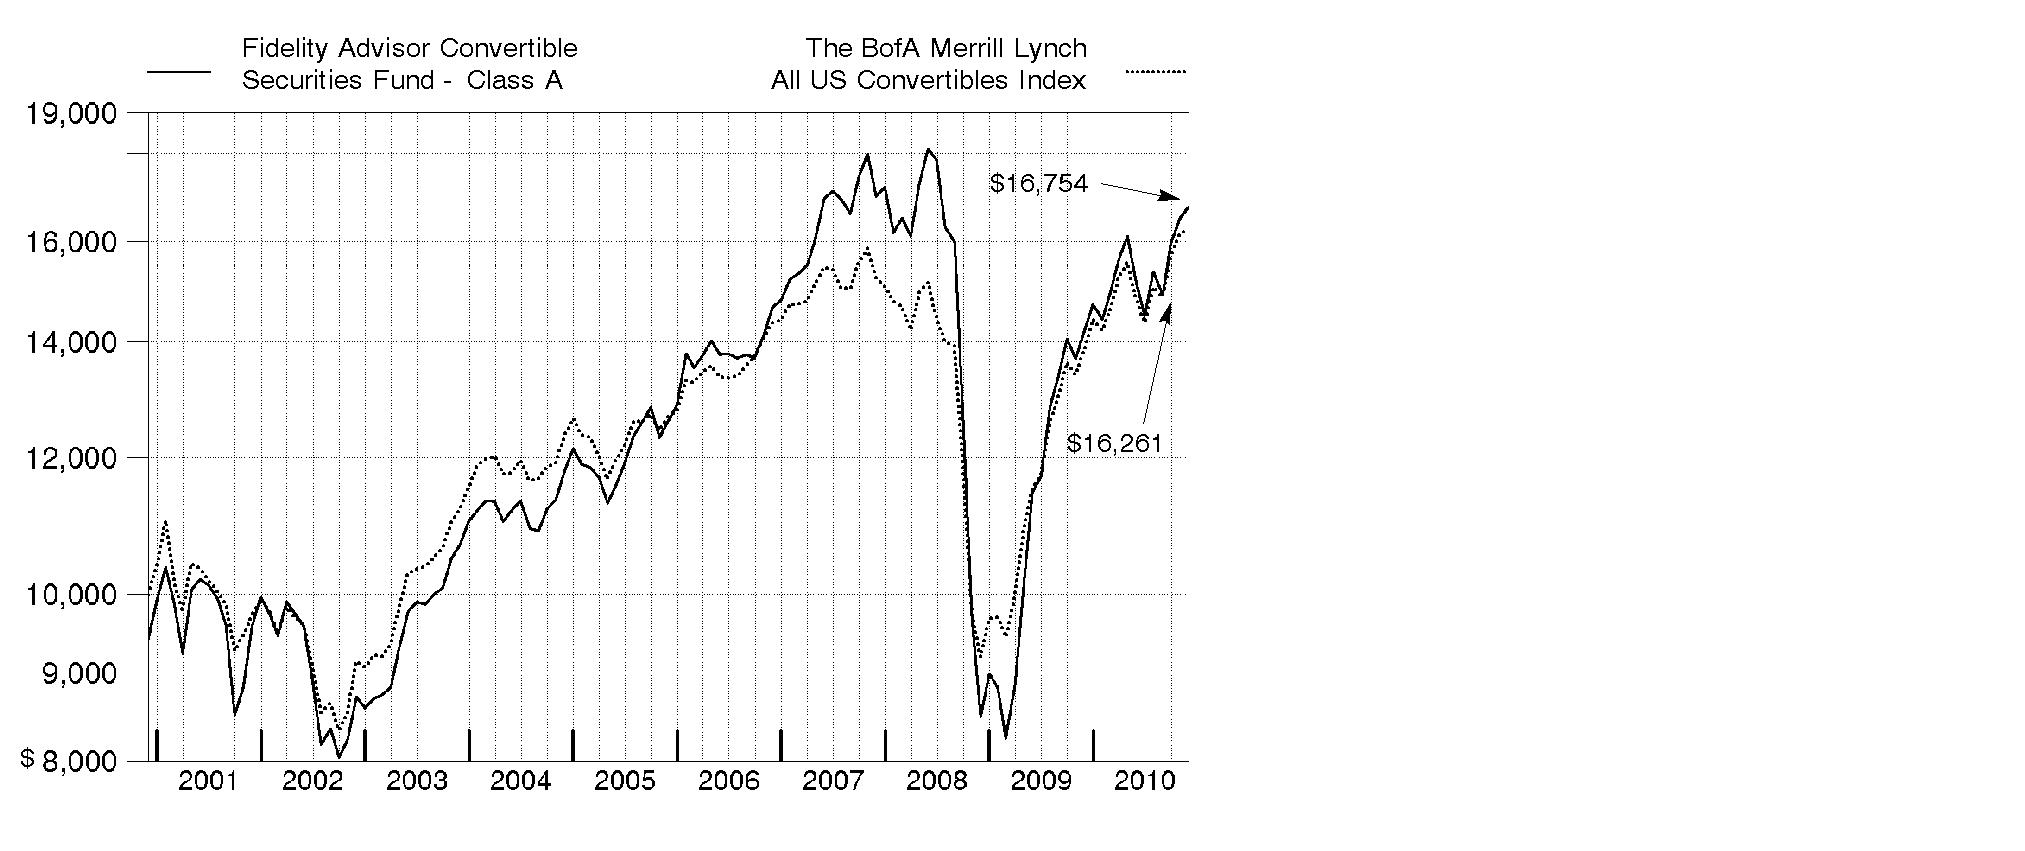
Annual Report
Management's Discussion of Fund Performance
Market Recap: Convertible securities enjoyed a strong run for the 12 months ending November 30, 2010, benefiting from their hybrid nature - with both equity- and fixed-income characteristics - in a period of low yields, heightened market volatility and rising stock prices. Convertibles returned 17.24%, according to The BofA Merrill LynchSM All US Convertibles Index, ranking them among the top-performing asset classes for the period. High-yield bonds, as measured by The BofA Merrill Lynch US High Yield Constrained Index, appreciated 16.63%, while the S&P 500® Index, a common proxy for the performance of large-capitalization U.S. equities, rose 9.94%, and the Barclays Capital® U.S. Aggregate Bond Index, which tracks taxable investment-grade bonds, gained 6.02%. With the U.S. economy still showing signs of weakness, particularly in the housing and labor markets, the Federal Reserve kept the benchmark federal funds target rate at a historically low range of 0% to 0.25%. In an ultra-low-yield environment, the income component of convertible securities became particularly attractive to investors, as did the sensitivity of convertibles to price movements in the underlying equities. On the supply side, corporate America continued to access the convertible security marketplace to help repair debt-laden balance sheets built up during the recent financial market meltdown and subsequent recession.
Comments from Thomas Soviero, Portfolio Manager of Fidelity Advisor® Convertible Securities Fund: For the year, the fund's Class A, Class T, Class B and Class C shares returned 18.05%, 17.74%, 17.08% and 17.13%, respectively (excluding sales charges), straddling the BofA Merrill Lynch convertibles index. The fund benefited from strong security selection in energy, overweighting industrials - particularly transportation, although this advantage was offset somewhat by weak security selection here - and significantly underweighting health care. Conversely, poor picks in diversified financials hurt. In terms of individual issuers, contributors included oil and natural gas pipeline operator El Paso, coal producer Peabody Energy, fiber-optic products provider Finisar, circuit board manufacturer Merix - acquired by Viasystems Group during the period - and not owning oil rig operator Transocean and biotechnology company Amgen, two lagging index components. Individual detractors included Bank of America - a case of untimely ownership - Freeport-McMoRan Copper & Gold, an out-of-benchmark position in Tenet Healthcare, Inverness Medical Innovations - now known as Alere - and underweighting Ford Motor. The fund's modest cash position also held back performance. Some holdings I've mentioned were sold by period end.
Comments from Thomas Soviero, Portfolio Manager of Fidelity Advisor® Convertible Securities Fund: For the year, the fund's Institutional Class shares returned 18.34%, outperforming the BofA Merrill Lynch convertibles index. The fund benefited from strong security selection in energy, overweighting industrials - particularly transportation, although this advantage was offset somewhat by weak security selection here - and significantly underweighting health care. Conversely, poor picks in diversified financials hurt. In terms of individual issuers, contributors included oil and natural gas pipeline operator El Paso, coal producer Peabody Energy, fiber-optic products provider Finisar, circuit board manufacturer Merix - acquired by Viasystems Group during the period - and not owning oil rig operator Transocean and biotechnology company Amgen, two lagging index components. Individual detractors included Bank of America - a case of untimely ownership - Freeport-McMoRan Copper & Gold, an out-of-benchmark position in Tenet Healthcare, Inverness Medical Innovations - now known as Alere - and underweighting Ford Motor. The fund's modest cash position also held back performance. Some holdings I've mentioned were sold by period end.
Annual Report
The views expressed above reflect those of the portfolio manager(s) only through the end of the period as stated on the cover of this report and do not necessarily represent the views of Fidelity or any other person in the Fidelity organization. Any such views are subject to change at any time based upon market or other conditions and Fidelity disclaims any responsibility to update such views. These views may not be relied on as investment advice and, because investment decisions for a Fidelity fund are based on numerous factors, may not be relied on as an indication of trading intent on behalf of any Fidelity fund.
Annual Report
Shareholder Expense Example
As a shareholder of the Fund, you incur two types of costs: (1) transaction costs, including sales charges (loads) on purchase payments or redemption proceeds, and (2) ongoing costs, including management fees, distribution and/or service (12b-1) fees and other Fund expenses. This Example is intended to help you understand your ongoing costs (in dollars) of investing in the Fund and to compare these costs with the ongoing costs of investing in other mutual funds.
The Example is based on an investment of $1,000 invested at the beginning of the period and held for the entire period (June 1, 2010 to November 30, 2010).
Actual Expenses
The first line of the accompanying table for each class of the Fund provides information about actual account values and actual expenses. You may use the information in this line, together with the amount you invested, to estimate the expenses that you paid over the period. Simply divide your account value by $1,000.00 (for example, an $8,600 account value divided by $1,000.00 = 8.6), then multiply the result by the number in the first line for a class of the Fund under the heading entitled "Expenses Paid During Period" to estimate the expenses you paid on your account during this period. A small balance maintenance fee of $12.00 that is charged once a year may apply for certain accounts with a value of less than $2,000. This fee is not included in the table below. If it was, the estimate of expenses you paid during the period would be higher, and your ending account value lower, by this amount. In addition, the Fund, as a shareholder in the underlying Fidelity Central Funds, will indirectly bear its pro-rata share of the fees and expenses incurred by the underlying Fidelity Central Funds. These fees and expenses are not included in the Fund's annualized expense ratio used to calculate the expense estimate in the table below.
Hypothetical Example for Comparison Purposes
The second line of the accompanying table for each class of the Fund provides information about hypothetical account values and hypothetical expenses based on a Class' actual expense ratio and an assumed rate of return of 5% per year before expenses, which is not the Class' actual return. The hypothetical account values and expenses may not be used to estimate the actual ending account balance or expenses you paid for the period. You may use this information to compare the ongoing costs of investing in the Fund and other funds. To do so, compare this 5% hypothetical example with the 5% hypothetical examples that appear in the shareholder reports of the other funds. A small balance maintenance fee of $12.00 that is charged once a year may apply for certain accounts with a value of less than $2,000. This fee is not included in the table below. If it was, the estimate of expenses you paid during the period would be higher, and your ending account value lower, by this amount. In addition, the Fund, as a shareholder in the underlying Fidelity Central Funds, will indirectly bear its pro-rata share of the fees and expenses incurred by the underlying Fidelity Central Funds. These fees and expenses are not included in the Fund's annualized expense ratio used to calculate the expense estimate in the table below.
Please note that the expenses shown in the table are meant to highlight your ongoing costs only and do not reflect any transaction costs. Therefore, the second line of the table is useful in comparing ongoing costs only, and will not help you determine the relative total costs of owning different funds. In addition, if these transactional costs were included, your costs would have been higher.
Annual Report
| Annualized | Beginning | Ending | Expenses Paid |
Class A | .84% |
|
|
|
Actual |
| $ 1,000.00 | $ 1,105.20 | $ 4.43 |
HypotheticalA |
| $ 1,000.00 | $ 1,020.86 | $ 4.26 |
Class T | 1.06% |
|
|
|
Actual |
| $ 1,000.00 | $ 1,104.30 | $ 5.59 |
HypotheticalA |
| $ 1,000.00 | $ 1,019.75 | $ 5.37 |
Class B | 1.65% |
|
|
|
Actual |
| $ 1,000.00 | $ 1,101.00 | $ 8.69 |
HypotheticalA |
| $ 1,000.00 | $ 1,016.80 | $ 8.34 |
Class C | 1.62% |
|
|
|
Actual |
| $ 1,000.00 | $ 1,101.30 | $ 8.53 |
HypotheticalA |
| $ 1,000.00 | $ 1,016.95 | $ 8.19 |
Convertible Securities | .51% |
|
|
|
Actual |
| $ 1,000.00 | $ 1,107.30 | $ 2.69 |
HypotheticalA |
| $ 1,000.00 | $ 1,022.51 | $ 2.59 |
Institutional Class | .56% |
|
|
|
Actual |
| $ 1,000.00 | $ 1,106.90 | $ 2.96 |
HypotheticalA |
| $ 1,000.00 | $ 1,022.26 | $ 2.84 |
A 5% return per year before expenses
* Expenses are equal to each Class' annualized expense ratio, multiplied by the average account value over the period, multiplied by 183/365 (to reflect the one-half year period).
Annual Report
Investment Changes (Unaudited)
Top Ten Investments as of November 30, 2010 | ||
(excluding cash equivalents) | % of fund's | % of fund's net assets |
Peabody Energy Corp. 4.75% 12/15/66 | 6.6 | 4.6 |
El Paso Corp. 4.99% | 6.0 | 5.1 |
Wells Fargo & Co. 7.50% | 5.1 | 4.9 |
Ford Motor Co. 4.25% 11/15/16 | 3.3 | 2.4 |
General Motors Co. 4.75% | 3.0 | 0.0 |
Intel Corp. 3.25% 8/1/39 | 3.0 | 3.0 |
Celanese Corp. Class A | 2.3 | 3.7 |
Chesapeake Energy Corp. 2.5% 5/15/37 | 2.3 | 2.4 |
Hertz Global Holdings, Inc. 5.25% 6/1/14 | 2.0 | 1.9 |
Bank of America Corp. Series L, 7.25% | 1.9 | 1.9 |
| 35.5 | |
Top Five Market Sectors as of November 30, 2010 | ||
| % of fund's | % of fund's net assets |
Energy | 23.4 | 19.2 |
Information Technology | 17.9 | 17.5 |
Financials | 13.3 | 16.7 |
Industrials | 13.1 | 11.8 |
Consumer Discretionary | 13.0 | 10.6 |
Asset Allocation (% of fund's net assets) | |||||||
As of November 30, 2010 * | As of May 31, 2010** | ||||||
| Convertible |
| | Convertible |
| ||
| Stocks 9.6% |
| | Stocks 14.0% |
| ||
| Nonconvertible |
| | Nonconvertible |
| ||
| Short-Term |
| | Short-Term |
| ||
| Floating Rate Loans 0.0% |
|  | Floating Rate Loans 0.4% |
| ||
* Foreign investments | 4.2% |
| ** Foreign investments | 3.5% |
| ||

Annual Report
Investments November 30, 2010
Showing Percentage of Net Assets
Corporate Bonds - 64.2% | ||||
| Principal | Value (000s) | ||
Convertible Bonds - 64.1% | ||||
CONSUMER DISCRETIONARY - 6.3% | ||||
Auto Components - 0.1% | ||||
BorgWarner, Inc. 3.5% 4/15/12 | $ 910 | $ 1,714 | ||
Automobiles - 3.3% | ||||
Ford Motor Co. 4.25% 11/15/16 | 40,000 | 77,152 | ||
Diversified Consumer Services - 0.6% | ||||
Ingersoll-Rand Global Holding Co. Ltd. 4.5% 4/15/12 | 490 | 1,132 | ||
Regis Corp. 5% 7/15/14 | 2,230 | 2,983 | ||
Stewart Enterprises, Inc. 3.375% 7/15/16 (g) | 11,000 | 9,989 | ||
| 14,104 | |||
Hotels, Restaurants & Leisure - 0.5% | ||||
MGM Mirage, Inc. 4.25% 4/15/15 (g) | 12,300 | 12,192 | ||
Media - 1.0% | ||||
Virgin Media, Inc. 6.5% 11/15/16 | 8,000 | 12,630 | ||
XM Satellite Radio, Inc. 7% 12/1/14 (g) | 10,000 | 11,381 | ||
| 24,011 | |||
Specialty Retail - 0.8% | ||||
Asbury Automotive Group, Inc. 3% 9/15/12 (g) | 3,000 | 2,936 | ||
Charming Shoppes, Inc. 1.125% 5/1/14 | 10,000 | 8,388 | ||
Sonic Automotive, Inc. 5% 10/1/29 | 1,180 | 1,403 | ||
United Auto Group, Inc. 3.5% 4/1/26 | 4,533 | 4,601 | ||
| 17,328 | |||
TOTAL CONSUMER DISCRETIONARY | 146,501 | |||
CONSUMER STAPLES - 2.3% | ||||
Beverages - 0.7% | ||||
Molson Coors Brewing Co. 2.5% 7/30/13 | 14,000 | 15,739 | ||
Food & Staples Retailing - 0.6% | ||||
The Pantry, Inc. 3% 11/15/12 | 14,000 | 13,624 | ||
Food Products - 1.0% | ||||
Smithfield Foods, Inc. 4% 6/30/13 | 22,250 | 24,257 | ||
TOTAL CONSUMER STAPLES | 53,620 | |||
ENERGY - 16.2% | ||||
Energy Equipment & Services - 1.9% | ||||
Exterran Holdings, Inc. 4.25% 6/15/14 | 10,000 | 12,136 | ||
Global Industries Ltd. 2.75% 8/1/27 (g) | 10,000 | 7,400 | ||
Corporate Bonds - continued | ||||
| Principal | Value (000s) | ||
Convertible Bonds - continued | ||||
ENERGY - continued | ||||
Energy Equipment & Services - continued | ||||
Hornbeck Offshore Services, Inc. 1.625% 11/15/26 (d)(g) | $ 5,000 | $ 4,558 | ||
Newpark Resources, Inc. 4% 10/1/17 | 4,500 | 4,002 | ||
Oil States International, Inc. 2.375% 7/1/25 (g) | 4,500 | 8,565 | ||
SESI LLC 1.5% 12/15/26 (d)(g) | 7,000 | 6,948 | ||
| 43,609 | |||
Oil, Gas & Consumable Fuels - 14.3% | ||||
Alpha Natural Resources, Inc. 2.375% 4/15/15 | 35,000 | 42,669 | ||
Chesapeake Energy Corp. 2.5% 5/15/37 | 62,750 | 52,321 | ||
Goodrich Petroleum Corp. 3.25% 12/1/26 | 6,000 | 5,865 | ||
International Coal Group, Inc. 4% 4/1/17 | 2,160 | 3,168 | ||
Massey Energy Co. 3.25% 8/1/15 | 5,000 | 4,872 | ||
Peabody Energy Corp. 4.75% 12/15/66 | 122,250 | 152,657 | ||
Pioneer Natural Resources Co. 2.875% 1/15/38 | 20,000 | 28,350 | ||
Quicksilver Resources, Inc. 1.875% 11/1/24 (g) | 14,500 | 15,648 | ||
Western Refining, Inc. 5.75% 6/15/14 | 24,185 | 27,614 | ||
| 333,164 | |||
TOTAL ENERGY | 376,773 | |||
FINANCIALS - 0.9% | ||||
Diversified Financial Services - 0.9% | ||||
The NASDAQ Stock Market, Inc. 2.5% 8/15/13 | 20,000 | 19,826 | ||
HEALTH CARE - 5.0% | ||||
Health Care Equipment & Supplies - 2.4% | ||||
Alere, Inc. 3% 5/15/16 | 31,000 | 30,729 | ||
Kinetic Concepts, Inc. 3.25% 4/15/15 (g) | 15,000 | 15,593 | ||
SonoSite, Inc. 3.75% 7/15/14 | 7,000 | 7,533 | ||
Volcano Corp. 2.875% 9/1/15 | 1,890 | 2,151 | ||
| 56,006 | |||
Health Care Providers & Services - 0.3% | ||||
Omnicare, Inc. 3.25% 12/15/35 | 7,000 | 6,510 | ||
Life Sciences Tools & Services - 0.2% | ||||
Charles River Laboratories International, Inc. 2.25% 6/15/13 (g) | 4,000 | 3,930 | ||
Pharmaceuticals - 2.1% | ||||
Biovail Corp. 5.375% 8/1/14 | 10,000 | 19,256 | ||
Corporate Bonds - continued | ||||
| Principal | Value (000s) | ||
Convertible Bonds - continued | ||||
HEALTH CARE - continued | ||||
Pharmaceuticals - continued | ||||
Nektar Therapeutics 3.25% 9/28/12 | $ 9,000 | $ 8,764 | ||
Valeant Pharmaceuticals International 4% 11/15/13 | 10,000 | 20,488 | ||
| 48,508 | |||
TOTAL HEALTH CARE | 114,954 | |||
INDUSTRIALS - 13.1% | ||||
Aerospace & Defense - 0.9% | ||||
Alliant Techsystems, Inc. 2.75% 9/15/11 | 14,000 | 14,210 | ||
GenCorp, Inc. 4.0625% 12/31/39 (g) | 7,830 | 7,125 | ||
| 21,335 | |||
Airlines - 4.3% | ||||
AMR Corp. 6.25% 10/15/14 | 17,990 | 21,671 | ||
Continental Airlines, Inc. 4.5% 1/15/15 | 9,280 | 15,335 | ||
UAL Corp.: | ||||
4.5% 6/30/21 (g) | 10,500 | 11,106 | ||
4.5% 6/30/21 | 5,000 | 5,289 | ||
6% 10/15/29 | 3,600 | 12,094 | ||
US Airways Group, Inc. 7% 9/30/20 (g) | 4,810 | 4,810 | ||
US Airways Group, Inc. 7.25% 5/15/14 | 11,200 | 29,605 | ||
| 99,910 | |||
Commercial Services & Supplies - 1.3% | ||||
Metalico, Inc. 7% 4/30/28 | 34,000 | 30,600 | ||
Construction & Engineering - 0.4% | ||||
MasTec, Inc. 4.25% 12/15/14 (g) | 8,000 | 9,480 | ||
Electrical Equipment - 0.7% | ||||
General Cable Corp. 4.5% 11/15/29 (d) | 14,800 | 16,814 | ||
Industrial Conglomerates - 0.1% | ||||
Textron, Inc. 4.5% 5/1/13 | 1,440 | 2,609 | ||
Machinery - 2.2% | ||||
Greenbrier Companies, Inc.: | ||||
2.375% 5/15/26 (g) | 5,500 | 4,985 | ||
2.375% 5/15/26 | 8,000 | 7,250 | ||
Terex Corp. 4% 6/1/15 | 14,590 | 24,310 | ||
Trinity Industries, Inc. 3.875% 6/1/36 | 15,000 | 14,025 | ||
| 50,570 | |||
Corporate Bonds - continued | ||||
| Principal | Value (000s) | ||
Convertible Bonds - continued | ||||
INDUSTRIALS - continued | ||||
Marine - 1.1% | ||||
Excel Maritime Carriers Ltd. 1.875% 10/15/27 (g) | $ 34,000 | $ 25,500 | ||
Road & Rail - 2.0% | ||||
Hertz Global Holdings, Inc. 5.25% 6/1/14 | 28,000 | 46,427 | ||
Trading Companies & Distributors - 0.1% | ||||
United Rentals, Inc. 4% 11/15/15 | 960 | 1,855 | ||
TOTAL INDUSTRIALS | 305,100 | |||
INFORMATION TECHNOLOGY - 15.7% | ||||
Communications Equipment - 1.9% | ||||
CommScope, Inc. 3.25% 7/1/15 | 10,000 | 13,140 | ||
Finisar Corp. 5% 10/15/29 (g) | 2,500 | 4,919 | ||
JDS Uniphase Corp. 1% 5/15/26 (g) | 14,000 | 13,195 | ||
L-3 Communications Corp. 3% 8/1/35 | 3,000 | 3,015 | ||
Lucent Technologies, Inc. 2.875% 6/15/25 | 10,000 | 9,494 | ||
| 43,763 | |||
Computers & Peripherals - 1.2% | ||||
EMC Corp. 1.75% 12/1/13 (g) | 17,000 | 24,384 | ||
Hutchinson Technology, Inc. 3.25% 1/15/26 | 5,000 | 3,431 | ||
| 27,815 | |||
Electronic Equipment & Components - 1.5% | ||||
Anixter International, Inc. 1% 2/15/13 (g) | 4,540 | 4,951 | ||
Itron, Inc. 2.5% 8/1/26 | 5,000 | 5,319 | ||
Newport Corp. 2.5% 2/15/12 (g) | 3,750 | 3,841 | ||
SYNNEX Corp. 4% 5/15/18 (g) | 10,000 | 11,725 | ||
Vishay Intertechnology, Inc. 2.25% 11/15/40 (g) | 7,000 | 8,002 | ||
| 33,838 | |||
Internet Software & Services - 0.9% | ||||
Equinix, Inc. 3% 10/15/14 | 10,000 | 9,759 | ||
VeriSign, Inc. 3.25% 8/15/37 | 10,000 | 11,419 | ||
| 21,178 | |||
IT Services - 1.8% | ||||
Alliance Data Systems Corp. 4.75% 5/15/14 | 10,200 | 15,326 | ||
CACI International, Inc. 2.125% 5/1/14 | 6,000 | 6,645 | ||
DST Systems, Inc. 4.125% 8/15/23 | 8,100 | 9,052 | ||
Telvent GIT SA 5.5% 4/15/15 (g) | 10,000 | 10,363 | ||
| 41,386 | |||
Corporate Bonds - continued | ||||
| Principal | Value (000s) | ||
Convertible Bonds - continued | ||||
INFORMATION TECHNOLOGY - continued | ||||
Semiconductors & Semiconductor Equipment - 8.0% | ||||
Advanced Micro Devices, Inc. 6% 5/1/15 | $ 11,916 | $ 11,884 | ||
Amkor Technology, Inc. 6% 4/15/14 | 10,890 | 26,596 | ||
Evergreen Solar, Inc. 4% 7/15/13 | 4,000 | 1,740 | ||
Intel Corp. 3.25% 8/1/39 (g) | 58,000 | 70,574 | ||
Micron Technology, Inc. 4.25% 10/15/13 | 6,130 | 9,938 | ||
ON Semiconductor Corp.: | ||||
1.875% 12/15/25 (g) | 3,750 | 4,854 | ||
2.625% 12/15/26 | 35,330 | 37,759 | ||
PMC-Sierra, Inc. 2.25% 10/15/25 | 10,000 | 10,831 | ||
SunPower Corp. 4.75% 4/15/14 | 2,020 | 1,773 | ||
Xilinx, Inc. 3.125% 3/15/37 | 10,000 | 9,914 | ||
| 185,863 | |||
Software - 0.4% | ||||
Nuance Communications, Inc. 2.75% 8/15/27 | 9,085 | 10,425 | ||
TOTAL INFORMATION TECHNOLOGY | 364,268 | |||
MATERIALS - 2.6% | ||||
Chemicals - 1.2% | ||||
Ferro Corp. 6.5% 8/15/13 | 27,000 | 28,856 | ||
Containers & Packaging - 0.2% | ||||
Owens-Brockway Glass Container, Inc. 3% 6/1/15 (g) | 5,010 | 4,901 | ||
Metals & Mining - 1.2% | ||||
Alcoa, Inc. 5.25% 3/15/14 | 5,000 | 10,819 | ||
ArcelorMittal SA 5% 5/15/14 | 2,170 | 2,795 | ||
Goldcorp, Inc. 2% 8/1/14 | 5,000 | 6,100 | ||
Newmont Mining Corp. 1.625% 7/15/17 | 5,000 | 7,038 | ||
| 26,752 | |||
TOTAL MATERIALS | 60,509 | |||
TELECOMMUNICATION SERVICES - 2.0% | ||||
Diversified Telecommunication Services - 0.7% | ||||
Level 3 Communications, Inc. 7% 3/15/15 | 10,000 | 9,488 | ||
Time Warner Telecom, Inc. 2.375% 4/1/26 | 6,000 | 6,510 | ||
| 15,998 | |||
Corporate Bonds - continued | ||||
| Principal | Value (000s) | ||
Convertible Bonds - continued | ||||
TELECOMMUNICATION SERVICES - continued | ||||
Wireless Telecommunication Services - 1.3% | ||||
Leap Wireless International, Inc. 4.5% 7/15/14 | $ 33,000 | $ 29,825 | ||
TOTAL TELECOMMUNICATION SERVICES | 45,823 | |||
TOTAL CONVERTIBLE BONDS | 1,487,374 | |||
Nonconvertible Bonds - 0.1% | ||||
CONSUMER DISCRETIONARY - 0.1% | ||||
Hotels, Restaurants & Leisure - 0.1% | ||||
Ambassadors International, Inc. 10% 1/15/12 pay-in-kind (g) | 2,392 | 1,794 | ||
TOTAL CORPORATE BONDS (Cost $1,320,655) | 1,489,168 | |||
Common Stocks - 9.6% | |||
Shares |
| ||
CONSUMER DISCRETIONARY - 1.0% | |||
Auto Components - 0.6% | |||
Johnson Controls, Inc. | 344,134 | 12,540 | |
Diversified Consumer Services - 0.4% | |||
Service Corp. International | 1,143,000 | 9,213 | |
Hotels, Restaurants & Leisure - 0.0% | |||
Ambassadors International, Inc. (a)(f) | 230,377 | 389 | |
Media - 0.0% | |||
HMH Holdings, Inc. (a)(h) | 52,880 | 304 | |
HMH Holdings, Inc. warrants 3/9/17 (a) | 164,823 | 82 | |
| 386 | ||
TOTAL CONSUMER DISCRETIONARY | 22,528 | ||
ENERGY - 0.3% | |||
Oil, Gas & Consumable Fuels - 0.3% | |||
McMoRan Exploration Co. (a)(e) | 450,000 | 6,719 | |
Common Stocks - continued | |||
Shares | Value (000s) | ||
FINANCIALS - 3.8% | |||
Commercial Banks - 3.1% | |||
Huntington Bancshares, Inc. | 5,820,500 | $ 33,963 | |
KeyCorp | 5,014,100 | 37,756 | |
| 71,719 | ||
Diversified Financial Services - 0.7% | |||
Bank of America Corp. | 1,484,085 | 16,251 | |
TOTAL FINANCIALS | 87,970 | ||
INFORMATION TECHNOLOGY - 2.2% | |||
Communications Equipment - 0.8% | |||
Finisar Corp. (a)(e) | 974,120 | 18,625 | |
Electronic Equipment & Components - 0.4% | |||
Viasystems Group, Inc. (a) | 549,643 | 9,536 | |
Semiconductors & Semiconductor Equipment - 1.0% | |||
Amkor Technology, Inc. (a)(e) | 843,200 | 5,869 | |
ON Semiconductor Corp. (a) | 2,169,500 | 17,692 | |
| 23,561 | ||
TOTAL INFORMATION TECHNOLOGY | 51,722 | ||
MATERIALS - 2.3% | |||
Chemicals - 2.3% | |||
Celanese Corp. Class A | 1,469,230 | 54,362 | |
TOTAL COMMON STOCKS (Cost $191,939) | 223,301 | ||
Convertible Preferred Stocks - 24.6% | |||
|
|
|
|
CONSUMER DISCRETIONARY - 5.6% | |||
Automobiles - 4.0% | |||
Ford Motor Co. Capital Trust II 6.50% | 450,000 | 23,135 | |
General Motors Co. 4.75% (a) | 1,400,000 | 70,980 | |
| 94,115 | ||
Household Durables - 0.1% | |||
Stanley Black & Decker, Inc. 4.75% (a) | 13,500 | 1,377 | |
Leisure Equipment & Products - 0.5% | |||
Callaway Golf Co. 7.50% | 100,000 | 12,563 | |
Convertible Preferred Stocks - continued | |||
Shares | Value (000s) | ||
CONSUMER DISCRETIONARY - continued | |||
Media - 1.0% | |||
Interpublic Group of Companies, Inc. 5.25% | 10,000 | $ 10,037 | |
LodgeNet Entertainment Corp. 10.00% (g) | 11,118 | 12,287 | |
| 22,324 | ||
TOTAL CONSUMER DISCRETIONARY | 130,379 | ||
CONSUMER STAPLES - 2.1% | |||
Food Products - 2.1% | |||
Archer Daniels Midland Co. 6.25% | 600,000 | 22,608 | |
Bunge Ltd.: | |||
4.875% | 237,000 | 21,078 | |
5.125% | 10,000 | 5,869 | |
| 49,555 | ||
ENERGY - 6.9% | |||
Oil, Gas & Consumable Fuels - 6.9% | |||
Apache Corp. 6.00% | 94,200 | 5,713 | |
El Paso Corp.: | |||
4.99% (g) | 119,290 | 139,023 | |
4.99% | 10,000 | 11,654 | |
Goodrich Petroleum Corp. 5.375% | 100,000 | 3,169 | |
| 159,559 | ||
FINANCIALS - 8.6% | |||
Commercial Banks - 5.2% | |||
Huntington Bancshares, Inc. 8.50% | 2,100 | 2,258 | |
Wells Fargo & Co. 7.50% | 120,550 | 118,994 | |
| 121,252 | ||
Diversified Financial Services - 3.1% | |||
Bank of America Corp. Series L, 7.25% | 47,085 | 43,789 | |
Citigroup, Inc. 7.50% | 215,400 | 26,925 | |
| 70,714 | ||
Insurance - 0.3% | |||
Assured Guaranty Ltd. 8.50% | 100,000 | 7,114 | |
TOTAL FINANCIALS | 199,080 | ||
Convertible Preferred Stocks - continued | |||
Shares | Value (000s) | ||
HEALTH CARE - 1.4% | |||
Health Care Providers & Services - 1.4% | |||
Tenet Healthcare Corp. 7.00% | 40,000 | $ 31,708 | |
TOTAL CONVERTIBLE PREFERRED STOCKS (Cost $571,865) | 570,281 | ||
Money Market Funds - 2.2% | |||
|
|
|
|
Fidelity Cash Central Fund, 0.24% (b) | 33,967,973 | 33,968 | |
Fidelity Securities Lending Cash Central Fund, 0.25% (b)(c) | 18,147,250 | 18,147 | |
TOTAL MONEY MARKET FUNDS (Cost $52,115) | 52,115 | ||
TOTAL INVESTMENT PORTFOLIO - 100.6% (Cost $2,136,574) | 2,334,865 | ||
NET OTHER ASSETS (LIABILITIES) - (0.6)% | (13,582) | ||
NET ASSETS - 100% | $ 2,321,283 | ||
Legend |
(a) Non-income producing |
(b) Affiliated fund that is available only to investment companies and other accounts managed by Fidelity Investments. The rate quoted is the annualized seven-day yield of the fund at period end. A complete unaudited listing of the fund's holdings as of its most recent quarter end is available upon request. In addition, each Fidelity Central Fund's financial statements, which are not covered by the Fund's Report of Independent Registered Public Accounting Firm, are available on the SEC's website or upon request. |
(c) Investment made with cash collateral received from securities on loan. |
(d) Security initially issued at one coupon which converts to a higher coupon at a specified date. The rate shown is the rate at period end. |
(e) Security or a portion of the security is on loan at period end. |
(f) Affiliated company |
(g) Security exempt from registration under Rule 144A of the Securities Act of 1933. These securities may be resold in transactions exempt from registration, normally to qualified institutional buyers. At the end of the period, the value of these securities amounted to $476,959,000 or 20.5% of net assets. |
(h) Restricted securities - Investment in securities not registered under the Securities Act of 1933 (excluding 144A issues). At the end of the period, the value of restricted securities (excluding 144A issues) amounted to $304,000 or 0.0% of net assets. |
Additional information on each holding is as follows: |
Security | Acquisition | Acquisition |
HMH Holdings, Inc. | 8/1/08 - 12/31/09 | $ 6,902 |
Affiliated Central Funds |
Information regarding fiscal year to date income earned by the Fund from investments in Fidelity Central Funds is as follows: |
Fund | Income earned |
Fidelity Cash Central Fund | $ 190 |
Fidelity Securities Lending Cash Central Fund | 53 |
Total | $ 243 |
Other Affiliated Issuers |
An affiliated company is a company in which the Fund has ownership of at least 5% of the voting securities. Fiscal year to date transactions with companies which are or were affiliates are as follows: |
Affiliate | Value, | Purchases | Sales | Dividend | Value, |
Ambassadors International, Inc. | $ 758 | $ - | $ - | $ - | $ 389 |
Total | $ 758 | $ - | $ - | $ - | $ 389 |
Other Information |
The following is a summary of the inputs used, as of November 30, 2010, involving the Fund's assets and liabilities carried at fair value. The inputs or methodology used for valuing securities may not be an indication of the risk associated with investing in those securities. For more information on valuation inputs, and their aggregation into the levels used in the tables below, please refer to the Security Valuation section in the accompanying Notes to Financial Statements. |
Valuation Inputs at Reporting Date: | ||||
Description | Total | Level 1 | Level 2 | Level 3 |
Investments in Securities: | ||||
Equities: | ||||
Consumer Discretionary | $ 152,907 | $ 93,122 | $ 59,703 | $ 82 |
Consumer Staples | 49,555 | - | 49,555 | - |
Energy | 166,278 | 12,432 | 153,846 | - |
Financials | 287,050 | 253,011 | 34,039 | - |
Health Care | 31,708 | - | 31,708 | - |
Information Technology | 51,722 | 51,722 | - | - |
Materials | 54,362 | 54,362 | - | - |
Corporate Bonds | 1,489,168 | - | 1,487,374 | 1,794 |
Money Market Funds | 52,115 | 52,115 | - | - |
Total Investments in Securities: | $ 2,334,865 | $ 516,764 | $ 1,816,225 | $ 1,876 |
The following is a reconciliation of Investments in Securities for which Level 3 inputs were used in determining value: |
(Amounts in thousands) |
|
Investments in Securities: | |
Beginning Balance | $ 3,577 |
Total Realized Gain (Loss) | 6,233 |
Total Unrealized Gain (Loss) | 544 |
Cost of Purchases | 289 |
Proceeds of Sales | (9,558) |
Amortization/Accretion | 791 |
Transfers in to Level 3 | - |
Transfers out of Level 3 | - |
Ending Balance | $ 1,876 |
The change in unrealized gain (loss) for the period attributable to Level 3 securities held at November 30, 2010 | $ (598) |
The information used in the above reconciliation represents fiscal year to date activity for any Investments in Securities identified as using Level 3 inputs at either the beginning or the end of the current fiscal period. Transfers in or out of Level 3 represent the beginning value of any Security or Instrument where a change in the pricing level occurred from the beginning to the end of the period. The cost of purchases and the proceeds of sales may include securities received or delivered through corporate actions or exchanges. Realized and unrealized gains (losses) disclosed in the reconciliation are included in Net Gain (Loss) on the Fund's Statement of Operations. |
The composition of credit quality ratings as a percentage of net assets is as follows (Unaudited): |
AAA,AA,A | 4.1% |
BBB | 2.8% |
BB | 19.5% |
B | 12.9% |
CCC,CC,C | 11.7% |
Not Rated | 13.2% |
Equities | 34.2% |
Short-Term Investments and Net Other Assets | 1.6% |
| 100.0% |
We have used ratings from Moody's Investors Service, Inc. Where Moody's® ratings are not available, we have used S&P® ratings. All ratings are as of the report date and do not reflect subsequent changes. |
Income Tax Information |
At November 30, 2010, the Fund had a capital loss carryforward of approximately $298,128,000 all of which will expire in fiscal 2017. Capital loss carryforwards are only available to offset future capital gains of the Fund to the extent provided by regulations and may be limited. |
See accompanying notes which are an integral part of the financial statements.
Annual Report
Financial Statements
Statement of Assets and Liabilities
Amounts in thousands (except per-share amounts) | November 30, 2010 | |
|
|
|
Assets | ||
Investment in securities, at value (including securities loaned of $17,073) - See accompanying schedule: Unaffiliated issuers (cost $2,079,819) | $ 2,282,361 |
|
Fidelity Central Funds (cost $52,115) | 52,115 |
|
Other affiliated issuers (cost $4,640) | 389 |
|
Total Investments (cost $2,136,574) |
| $ 2,334,865 |
Receivable for investments sold | 6,386 | |
Receivable for fund shares sold | 2,050 | |
Dividends receivable | 3,557 | |
Interest receivable | 12,938 | |
Distributions receivable from Fidelity Central Funds | 18 | |
Prepaid expenses | 8 | |
Other receivables | 35 | |
Total assets | 2,359,857 | |
|
|
|
Liabilities | ||
Payable for fund shares redeemed | 19,320 | |
Accrued management fee | 608 | |
Distribution and service plan fees payable | 10 | |
Other affiliated payables | 424 | |
Other payables and accrued expenses | 65 | |
Collateral on securities loaned, at value | 18,147 | |
Total liabilities | 38,574 | |
|
|
|
Net Assets | $ 2,321,283 | |
Net Assets consist of: |
| |
Paid in capital | $ 2,398,529 | |
Undistributed net investment income | 26,134 | |
Accumulated undistributed net realized gain (loss) on investments | (301,671) | |
Net unrealized appreciation (depreciation) on investments and assets and liabilities in foreign currencies | 198,291 | |
Net Assets | $ 2,321,283 | |
See accompanying notes which are an integral part of the financial statements.
Annual Report
Financial Statements - continued
Statement of Assets and Liabilities - continued
Amounts in thousands (except per-share amounts) | November 30, 2010 | |
|
|
|
Calculation of Maximum Offering Price Class A: | $ 24.22 | |
|
|
|
Maximum offering price per share (100/94.25 of $24.22) | $ 25.70 | |
Class T: | $ 24.23 | |
|
|
|
Maximum offering price per share (100/96.50 of $24.23) | $ 25.11 | |
Class B: | $ 24.17 | |
|
|
|
Class C: | $ 24.14 | |
|
|
|
Convertible Securities: | $ 24.29 | |
|
|
|
Institutional Class: | $ 24.27 | |
A Redemption price per share is equal to net asset value less any applicable contingent deferred sales charge.
See accompanying notes which are an integral part of the financial statements.
Annual Report
Statement of Operations
Amounts in thousands | Year ended November 30, 2010 | |
|
|
|
Investment Income |
|
|
Dividends |
| $ 36,443 |
Interest |
| 61,403 |
Income from Fidelity Central Funds |
| 243 |
Total income |
| 98,089 |
|
|
|
Expenses | ||
Management fee | $ 10,828 | |
Performance adjustment | (2,341) | |
Transfer agent fees | 4,380 | |
Distribution and service plan fees | 88 | |
Accounting and security lending fees | 720 | |
Custodian fees and expenses | 37 | |
Independent trustees' compensation | 14 | |
Registration fees | 134 | |
Audit | 76 | |
Legal | 25 | |
Miscellaneous | 39 | |
Total expenses before reductions | 14,000 | |
Expense reductions | (46) | 13,954 |
Net investment income (loss) | 84,135 | |
Realized and Unrealized Gain (Loss) Net realized gain (loss) on: | ||
Investment securities: |
|
|
Unaffiliated issuers | 77,313 | |
Capital gain distributions from Fidelity Central Funds | 1 |
|
Total net realized gain (loss) |
| 77,314 |
Change in net unrealized appreciation (depreciation) on investment securities | 227,214 | |
Net gain (loss) | 304,528 | |
Net increase (decrease) in net assets resulting from operations | $ 388,663 | |
See accompanying notes which are an integral part of the financial statements.
Annual Report
Financial Statements - continued
Statement of Changes in Net Assets
Amounts in thousands | Year ended | Year ended |
Increase (Decrease) in Net Assets |
|
|
Operations |
|
|
Net investment income (loss) | $ 84,135 | $ 101,950 |
Net realized gain (loss) | 77,314 | (232,140) |
Change in net unrealized appreciation (depreciation) | 227,214 | 1,040,568 |
Net increase (decrease) in net assets resulting | 388,663 | 910,378 |
Distributions to shareholders from net investment income | (87,526) | (103,307) |
Share transactions - net increase (decrease) | (332,532) | 106,423 |
Total increase (decrease) in net assets | (31,395) | 913,494 |
|
|
|
Net Assets | ||
Beginning of period | 2,352,678 | 1,439,184 |
End of period (including undistributed net investment income of $26,134 and undistributed net investment income of $29,835, respectively) | $ 2,321,283 | $ 2,352,678 |
See accompanying notes which are an integral part of the financial statements.
Annual Report
Financial Highlights - Class A
Years ended November 30, | 2010 | 2009 H |
Selected Per-Share Data |
|
|
Net asset value, beginning of period | $ 21.25 | $ 12.79 |
Income from Investment Operations |
|
|
Net investment income (loss) E | .75 | .58 |
Net realized and unrealized gain (loss) | 3.01 | 8.53 |
Total from investment operations | 3.76 | 9.11 |
Distributions from net investment income | (.79) | (.65) |
Net asset value, end of period | $ 24.22 | $ 21.25 |
Total Return B, C, D | 18.05% | 72.83% |
Ratios to Average Net Assets F, I |
|
|
Expenses before reductions | .87% | 1.04% A |
Expenses net of fee waivers, if any | .87% | 1.04% A |
Expenses net of all reductions | .87% | 1.04% A |
Net investment income (loss) | 3.29% | 3.70% A |
Supplemental Data |
|
|
Net assets, end of period (in millions) | $ 19 | $ 6 |
Portfolio turnover rate G | 28% | 31% |
A Annualized
B Total returns for periods of less than one year are not annualized.
C Total returns would have been lower had certain expenses not been reduced during the periods shown.
D Total returns do not include the effect of the sales charges.
E Calculated based on average shares outstanding during the period.
F Fees and expenses of the underlying Fidelity Central Funds are not included in the Fund's expense ratio. The Fund indirectly bears its proportionate share of the expenses of any underlying Fidelity Central Funds.
G Amount does not include the portfolio activity of any underlying Fidelity Central Funds.
H For the period February 19, 2009 (commencement of sale of shares) to November 30, 2009.
I Expense ratios reflect operating expenses of the class. Expenses before reductions do not reflect amounts reimbursed by the investment adviser or reductions from brokerage service arrangements or reductions from other expense offset arrangements and do not represent the amount paid by the class during periods when reimbursements or reductions occur. Expense ratios before reductions for start-up periods may not be representative of longer-term operating periods. Expenses net of fee waivers reflect expenses after reimbursement by the investment adviser but prior to reductions from brokerage service arrangements or other expense offset arrangements. Expenses net of all reductions represent the net expenses paid by the class.
See accompanying notes which are an integral part of the financial statements.
Annual Report
Financial Highlights - Class T
Years ended November 30, | 2010 | 2009 H |
Selected Per-Share Data |
|
|
Net asset value, beginning of period | $ 21.25 | $ 12.79 |
Income from Investment Operations |
|
|
Net investment income (loss) E | .69 | .57 |
Net realized and unrealized gain (loss) | 3.01 | 8.52 |
Total from investment operations | 3.70 | 9.09 |
Distributions from net investment income | (.72) | (.63) |
Net asset value, end of period | $ 24.23 | $ 21.25 |
Total Return B, C, D | 17.74% | 72.60% |
Ratios to Average Net Assets F, I |
|
|
Expenses before reductions | 1.13% | 1.25% A |
Expenses net of fee waivers, if any | 1.13% | 1.25% A |
Expenses net of all reductions | 1.13% | 1.25% A |
Net investment income (loss) | 3.03% | 3.83% A |
Supplemental Data |
|
|
Net assets, end of period (in millions) | $ 4 | $ 2 |
Portfolio turnover rate G | 28% | 31% |
A Annualized
B Total returns for periods of less than one year are not annualized.
C Total returns would have been lower had certain expenses not been reduced during the periods shown.
D Total returns do not include the effect of the sales charges.
E Calculated based on average shares outstanding during the period.
F Fees and expenses of the underlying Fidelity Central Funds are not included in the Fund's expense ratio. The Fund indirectly bears its proportionate share of the expenses of any underlying Fidelity Central Funds.
G Amount does not include the portfolio activity of any underlying Fidelity Central Funds.
H For the period February 19, 2009 (commencement of sale of shares) to November 30, 2009.
I Expense ratios reflect operating expenses of the class. Expenses before reductions do not reflect amounts reimbursed by the investment adviser or reductions from brokerage service arrangements or reductions from other expense offset arrangements and do not represent the amount paid by the class during periods when reimbursements or reductions occur. Expense ratios before reductions for start-up periods may not be representative of longer-term operating periods. Expenses net of fee waivers reflect expenses after reimbursement by the investment adviser but prior to reductions from brokerage service arrangements or other expense offset arrangements. Expenses net of all reductions represent the net expenses paid by the class.
See accompanying notes which are an integral part of the financial statements.
Annual Report
Financial Highlights - Class B
Years ended November 30, | 2010 | 2009 H |
Selected Per-Share Data |
|
|
Net asset value, beginning of period | $ 21.22 | $ 12.79 |
Income from Investment Operations |
|
|
Net investment income (loss) E | .56 | .50 |
Net realized and unrealized gain (loss) | 3.01 | 8.51 |
Total from investment operations | 3.57 | 9.01 |
Distributions from net investment income | (.62) | (.58) |
Net asset value, end of period | $ 24.17 | $ 21.22 |
Total Return B, C, D | 17.08% | 71.85% |
Ratios to Average Net Assets F, I |
|
|
Expenses before reductions | 1.69% | 1.78% A |
Expenses net of fee waivers, if any | 1.69% | 1.78% A |
Expenses net of all reductions | 1.69% | 1.78% A |
Net investment income (loss) | 2.47% | 3.41% A |
Supplemental Data |
|
|
Net assets, end of period (in millions) | $ 1 | $ 1 |
Portfolio turnover rate G | 28% | 31% |
A Annualized
B Total returns for periods of less than one year are not annualized.
C Total returns would have been lower had certain expenses not been reduced during the periods shown.
D Total returns do not include the effect of the contingent deferred sales charge.
E Calculated based on average shares outstanding during the period.
F Fees and expenses of the underlying Fidelity Central Funds are not included in the Fund's expense ratio. The Fund indirectly bears its proportionate share of the expenses of any underlying Fidelity Central Funds.
G Amount does not include the portfolio activity of any underlying Fidelity Central Funds.
H For the period February 19, 2009 (commencement of sale of shares) to November 30, 2009.
I Expense ratios reflect operating expenses of the class. Expenses before reductions do not reflect amounts reimbursed by the investment adviser or reductions from brokerage service arrangements or reductions from other expense offset arrangements and do not represent the amount paid by the class during periods when reimbursements or reductions occur. Expense ratios before reductions for start-up periods may not be representative of longer-term operating periods. Expenses net of fee waivers reflect expenses after reimbursement by the investment adviser but prior to reductions from brokerage service arrangements or other expense offset arrangements. Expenses net of all reductions represent the net expenses paid by the class.
See accompanying notes which are an integral part of the financial statements.
Annual Report
Financial Highlights - Class C
Years ended November 30, | 2010 | 2009 H |
Selected Per-Share Data |
|
|
Net asset value, beginning of period | $ 21.20 | $ 12.79 |
Income from Investment Operations |
|
|
Net investment income (loss) E | .56 | .47 |
Net realized and unrealized gain (loss) | 3.01 | 8.53 |
Total from investment operations | 3.57 | 9.00 |
Distributions from net investment income | (.63) | (.59) |
Net asset value, end of period | $ 24.14 | $ 21.20 |
Total Return B, C, D | 17.13% | 71.81% |
Ratios to Average Net Assets F, I |
|
|
Expenses before reductions | 1.66% | 1.80% A |
Expenses net of fee waivers, if any | 1.66% | 1.80% A |
Expenses net of all reductions | 1.66% | 1.80% A |
Net investment income (loss) | 2.50% | 3.17% A |
Supplemental Data |
|
|
Net assets, end of period (in millions) | $ 5 | $ 2 |
Portfolio turnover rate G | 28% | 31% |
A Annualized
B Total returns for periods of less than one year are not annualized.
C Total returns would have been lower had certain expenses not been reduced during the periods shown.
D Total returns do not include the effect of the contingent deferred sales charge.
E Calculated based on average shares outstanding during the period.
F Fees and expenses of the underlying Fidelity Central Funds are not included in the Fund's expense ratio. The Fund indirectly bears its proportionate share of the expenses of any underlying Fidelity Central Funds.
G Amount does not include the portfolio activity of any underlying Fidelity Central Funds.
H For the period February 19, 2009 (commencement of sale of shares) to November 30, 2009.
I Expense ratios reflect operating expenses of the class. Expenses before reductions do not reflect amounts reimbursed by the investment adviser or reductions from brokerage service arrangements or reductions from other expense offset arrangements and do not represent the amount paid by the class during periods when reimbursements or reductions occur. Expense ratios before reductions for start-up periods may not be representative of longer-term operating periods. Expenses net of fee waivers reflect expenses after reimbursement by the investment adviser but prior to reductions from brokerage service arrangements or other expense offset arrangements. Expenses net of all reductions represent the net expenses paid by the class.
See accompanying notes which are an integral part of the financial statements.
Annual Report
Financial Highlights - Convertible Securities
Years ended November 30, | 2010 | 2009 | 2008 | 2007 | 2006 |
Selected Per-Share Data |
|
|
|
| |
Net asset value, beginning of period | $ 21.30 | $ 13.55 | $ 28.71 | $ 25.21 | $ 22.14 |
Income from Investment Operations |
|
|
|
|
|
Net investment income (loss) B | .81 | .96 | .76 | .59 | .49 |
Net realized and unrealized gain (loss) | 3.02 | 7.78 | (14.43) | 3.43 | 3.09 |
Total from investment operations | 3.83 | 8.74 | (13.67) | 4.02 | 3.58 |
Distributions from net investment income | (.84) | (.99) | (.64) | (.50) | (.50) |
Distributions from net realized gain | - | - | (.85) | (.02) | (.01) |
Total distributions | (.84) | (.99) | (1.49) | (.52) | (.51) |
Net asset value, end of period | $ 24.29 | $ 21.30 | $ 13.55 | $ 28.71 | $ 25.21 |
Total Return A | 18.37% | 67.65% | (50.09)% | 16.02% | 16.38% |
Ratios to Average Net Assets C, E |
|
|
|
| |
Expenses before reductions | .59% | .70% | .78% | .79% | .83% |
Expenses net of fee waivers, if any | .59% | .69% | .78% | .79% | .83% |
Expenses net of all reductions | .59% | .69% | .78% | .79% | .83% |
Net investment income (loss) | 3.57% | 5.59% | 3.06% | 2.11% | 2.09% |
Supplemental Data |
|
|
|
| |
Net assets, end of period (in millions) | $ 2,287 | $ 2,340 | $ 1,439 | $ 2,919 | $ 2,083 |
Portfolio turnover rate D | 28% | 31% | 39% | 24% | 35% |
A Total returns would have been lower had certain expenses not been reduced during the periods shown.
B Calculated based on average shares outstanding during the period.
C Fees and expenses of the underlying Fidelity Central Funds are not included in the Fund's expense ratio. The Fund indirectly bears its proportionate share of the expenses of any underlying Fidelity Central Funds.
D Amount does not include the portfolio activity of any underlying Fidelity Central Funds.
E Expense ratios reflect operating expenses of the class. Expenses before reductions do not reflect amounts reimbursed by the investment adviser or reductions from brokerage service arrangements or reductions from other expense offset arrangements and do not represent the amount paid by the class during periods when reimbursements or reductions occur. Expenses net of fee waivers reflect expenses after reimbursement by the investment adviser but prior to reductions from brokerage service arrangements or other expense offset arrangements. Expenses net of all reductions represent the net expenses paid by the class.
See accompanying notes which are an integral part of the financial statements.
Annual Report
Financial Highlights - Institutional Class
Years ended November 30, | 2010 | 2009 G |
Selected Per-Share Data |
|
|
Net asset value, beginning of period | $ 21.29 | $ 12.79 |
Income from Investment Operations |
|
|
Net investment income (loss) D | .80 | .63 |
Net realized and unrealized gain (loss) | 3.02 | 8.54 |
Total from investment operations | 3.82 | 9.17 |
Distributions from net investment income | (.84) | (.67) |
Net asset value, end of period | $ 24.27 | $ 21.29 |
Total Return B, C | 18.34% | 73.31% |
Ratios to Average Net Assets E, H |
|
|
Expenses before reductions | .60% | .73% A |
Expenses net of fee waivers, if any | .60% | .73% A |
Expenses net of all reductions | .60% | .73% A |
Net investment income (loss) | 3.56% | 4.19% A |
Supplemental Data |
|
|
Net assets, end of period (in millions) | $ 6 | $ 3 |
Portfolio turnover rate F | 28% | 31% |
A Annualized
B Total returns for periods of less than one year are not annualized.
C Total returns would have been lower had certain expenses not been reduced during the periods shown.
D Calculated based on average shares outstanding during the period.
E Fees and expenses of the underlying Fidelity Central Funds are not included in the Fund's expense ratio. The Fund indirectly bears its proportionate share of the expenses of any underlying Fidelity Central Funds.
F Amount does not include the portfolio activity of any underlying Fidelity Central Funds.
G For the period February 19, 2009 (commencement of sale of shares) to November 30, 2009.
H Expense ratios reflect operating expenses of the class. Expenses before reductions do not reflect amounts reimbursed by the investment adviser or reductions from brokerage service arrangements or reductions from other expense offset arrangements and do not represent the amount paid by the class during periods when reimbursements or reductions occur. Expense ratios before reductions for start-up periods may not be representative of longer-term operating periods. Expenses net of fee waivers reflect expenses after reimbursement by the investment adviser but prior to reductions from brokerage service arrangements or other expense offset arrangements. Expenses net of all reductions represent the net expenses paid by the class.
See accompanying notes which are an integral part of the financial statements.
Annual Report
Notes to Financial Statements
For the period ended November 30, 2010
(Amounts in thousands except ratios)
1. Organization.
Fidelity Convertible Securities Fund (the Fund) is a fund of Fidelity Financial Trust (the Trust) and is authorized to issue an unlimited number of shares. The Trust is registered under the Investment Company Act of 1940, as amended (the 1940 Act), as an open-end management investment company organized as a Massachusetts business trust. The Fund offers Class A, Class T, Class C, Convertible Securities and Institutional Class shares, each of which, along with Class B shares, has equal rights as to assets and voting privileges. Effective after the close of business on September 1, 2010, Class B shares were closed to new accounts and additional purchases by existing shareholders. Each class has exclusive voting rights with respect to matters that affect that class. Class B shares will automatically convert to Class A shares after a holding period of seven years from the initial date of purchase. Investment income, realized and unrealized capital gains and losses, the common expenses of the Fund, and certain fund-level expense reductions, if any, are allocated on a pro-rata basis to each class based on the relative net assets of each class to the total net assets of the Fund. Each class differs with respect to transfer agent and distribution and service plan fees incurred. Certain expense reductions also differ by class.
2. Investments in Fidelity Central Funds.
The Fund may invest in Fidelity Central Funds, which are open-end investment companies available only to other investment companies and accounts managed by Fidelity Management & Research Company (FMR) and its affiliates. The Fund's Schedule of Investments lists each of the Fidelity Central Funds held as of period end, if any, as an investment of the Fund, but does not include the underlying holdings of each Fidelity Central Fund. As an Investing Fund, the Fund indirectly bears its proportionate share of the expenses of the underlying Fidelity Central Funds.
The Money Market Central Funds seek preservation of capital and current income and are managed by Fidelity Investments Money Management, Inc. (FIMM), an affiliate of FMR.
A complete unaudited list of holdings for each Fidelity Central Fund is available upon request or at the Securities and Exchange Commission (the SEC) web site at www.sec.gov. In addition, the financial statements of the Fidelity Central Funds, which are not covered by the Fund's Report of Independent Registered Public Accounting Firm, are available on the SEC web site or upon request.
3. Significant Accounting Policies.
The financial statements have been prepared in conformity with accounting principles generally accepted in the United States of America (GAAP), which require management to make certain estimates and assumptions at the date of the financial statements.
Annual Report
3. Significant Accounting Policies - continued
Actual results could differ from those estimates. The following summarizes the significant accounting policies of the Fund:
Security Valuation. Investments are valued as of 4:00 p.m. Eastern time on the last calendar day of the period. The Fund uses independent pricing services approved by the Board of Trustees to value its investments. When current market prices or quotations are not readily available or reliable, valuations may be determined in good faith in accordance with procedures adopted by the Board of Trustees. Factors used in determining value may include market or security specific events, changes in interest rates and credit quality. The frequency with which these procedures are used cannot be predicted and they may be utilized to a significant extent. The value used for net asset value (NAV) calculation under these procedures may differ from published prices for the same securities.
The Fund categorizes the inputs to valuation techniques used to value its investments into a disclosure hierarchy consisting of three levels as shown below.
Level 1 - quoted prices in active markets for identical investments
Level 2 - other significant observable inputs (including quoted prices for similar investments, interest rates, prepayment speeds, etc.)
Level 3 - unobservable inputs (including the Fund's own assumptions based on the best information available)
Changes in valuation techniques may result in transfers in or out of an assigned level within the disclosure hierarchy. The aggregate value of investments by input level, as of November 30, 2010, as well as a roll forward of Level 3 securities, is included at the end of the Fund's Schedule of Investments. Valuation techniques used to value the Fund's investments by major category are as follows.
Equity securities, including restricted securities, for which market quotations are readily available, are valued at the last reported sale price or official closing price as reported by an independent pricing service on the primary market or exchange on which they are traded and are categorized as Level 1 in the hierarchy. In the event there were no sales during the day or closing prices are not available, securities are valued at the last quoted bid price or may be valued using the last available price and are generally categorized as Level 2 in the hierarchy. For foreign equity securities, when significant market or security specific events arise, comparisons to the valuation of American Depositary Receipts (ADRs), futures contracts, Exchange-traded funds (ETFs) and certain indexes as well as quoted prices for similar securities are used and are categorized as Level 2 in the hierarchy in these circumstances. Utilizing these techniques may result in transfers between Level 1 and Level 2. For restricted equity securities and private placements where
Annual Report
Notes to Financial Statements - continued
(Amounts in thousands except ratios)
3. Significant Accounting Policies - continued
Security Valuation - continued
observable inputs are limited, assumptions about market activity and risk are used and are categorized as Level 3 in the hierarchy.
Debt securities, including restricted securities, are valued based on evaluated prices received from independent pricing services or from dealers who make markets in such securities. For corporate bonds, pricing services utilize matrix pricing which considers yield or price of bonds of comparable quality, coupon, maturity and type as well as dealer supplied prices and are generally categorized as Level 2 in the hierarchy.
Investments in open-end mutual funds, including the Fidelity Central Funds, are valued at their closing net asset value each business day and are categorized as Level 1 in the hierarchy.
When independent prices are unavailable or unreliable, debt securities may be valued utilizing pricing matrices which consider similar factors that would be used by independent pricing services. These are generally categorized as Level 2 in the hierarchy but may be Level 3 depending on the circumstances. The Fund invests a significant portion of its assets in below investment grade securities. The value of these securities can be more volatile due to changes in the credit quality of the issuer and is sensitive to changes in economic, market and regulatory conditions.
Investment Transactions and Income. For financial reporting purposes, the Fund's investment holdings and NAV include trades executed through the end of the last business day of the period. The NAV per share for processing shareholder transactions is calculated as of the close of business of the New York Stock Exchange (NYSE), normally 4:00 p.m. Eastern time and includes trades executed through the end of the prior business day. Gains and losses on securities sold are determined on the basis of identified cost and may include proceeds received from litigation. Dividend income is recorded on the ex-dividend date, except for certain dividends from foreign securities where the ex-dividend date may have passed, which are recorded as soon as the Fund is informed of the ex-dividend date. Non-cash dividends included in dividend income, if any, are recorded at the fair market value of the securities received. Distributions received on securities that represent a return of capital or capital gain are recorded as a reduction of cost of investments and/or as a realized gain. The Fund estimates the components of distributions received that may be considered return of capital distributions or capital gain distributions. Interest income and distributions from the Fidelity Central Funds are accrued as earned. Interest income includes coupon interest and amortization of premium and accretion of discount on debt securities.
Expenses. Most expenses of the Trust can be directly attributed to a fund. Expenses which cannot be directly attributed are apportioned amongst each fund in the Trust.
Annual Report
3. Significant Accounting Policies - continued
Expenses - continued
Expense estimates are accrued in the period to which they relate and adjustments are made when actual amounts are known.
Income Tax Information and Distributions to Shareholders. Each year the Fund intends to qualify as a regulated investment company, including distributing substantially all of its taxable income and realized gains under Subchapter M of the Internal Revenue Code and filing its U.S. federal tax return. As a result, no provision for income taxes is required. As of November 30, 2010, the Fund did not have any unrecognized tax benefits in the accompanying financial statements. A fund's federal tax return is subject to examination by the Internal Revenue Service (IRS) for a period of three years.
Distributions are declared and recorded on the ex-dividend date. Income dividends and capital gain distributions are declared separately for each class. Income and capital gain distributions are determined in accordance with income tax regulations, which may differ from GAAP.
Capital accounts within the financial statements are adjusted for permanent book-tax differences. These adjustments have no impact on net assets or the results of operations. Temporary book-tax differences will reverse in a subsequent period.
Book-tax differences are primarily due to the short-term gain distributions from the Fidelity Central Funds, market discount, deferred trustees compensation, capital loss carryforwards, and losses deferred due to wash sales and excise tax regulations.
The federal tax cost of investment securities and unrealized appreciation (depreciation) as of period end were as follows:
Gross unrealized appreciation | $ 308,237 |
Gross unrealized depreciation | (104,170) |
Net unrealized appreciation (depreciation) | $ 204,067 |
|
|
Tax Cost | $ 2,130,798 |
The tax-based components of distributable earnings as of period end were as follows:
Undistributed ordinary income | $ 16,422 |
Capital loss carryforward | $ (298,128) |
Net unrealized appreciation (depreciation) | $ 204,067 |
Annual Report
Notes to Financial Statements - continued
(Amounts in thousands except ratios)
3. Significant Accounting Policies - continued
Income Tax Information and Distributions to Shareholders - continued
The tax character of distributions paid was as follows:
| November 30, 2010 | November 30, 2009 |
Ordinary Income | $ 87,526 | $ 103,307 |
4. Operating Policies.
Restricted Securities. The Fund may invest in securities that are subject to legal or contractual restrictions on resale. These securities generally may be resold in transactions exempt from registration or to the public if the securities are registered. Disposal of these securities may involve time-consuming negotiations and expense, and prompt sale at an acceptable price may be difficult. Information regarding restricted securities is included at the end of the Fund's Schedule of Investments.
5. Purchases and Sales of Investments.
Purchases and sales of securities, other than short-term securities, aggregated $622,447 and $821,810, respectively.
6. Fees and Other Transactions with Affiliates.
Management Fee. FMR and its affiliates provide the Fund with investment management related services for which the Fund pays a monthly management fee. The management fee is the sum of an individual fund fee rate that is based on an annual rate of .20% of the Fund's average net assets and a group fee rate that averaged .26% during the period. The group fee rate is based upon the average net assets of all the mutual funds advised by FMR. The group fee rate decreases as assets under management increase and increases as assets under management decrease. In addition, the management fee is subject to a performance adjustment (up to a maximum of ± .15% of the Fund's average net assets over a 36 month performance period). The upward or downward adjustment to the management fee is based on the relative investment performance of Convertible Securities as compared to an appropriate benchmark index. For the period, the total annual management fee rate, including the performance adjustment, was .36% of the Fund's average net assets.
Distribution and Service Plan Fees. In accordance with Rule 12b-1 of the 1940 Act, the Fund has adopted separate Distribution and Service Plans for each class of shares. Certain classes pay Fidelity Distributors Corporation (FDC), an affiliate of FMR, separate Distribution and Service Fees, each of which is based on an annual percentage of each class' average net assets. In addition, FDC may pay financial intermediaries for
Annual Report
6. Fees and Other Transactions with Affiliates - continued
Distribution and Service Plan Fees - continued
selling shares of the Fund and providing shareholder support services. For the period, the Distribution and Service Fee rates, total fees and amounts retained by FDC were as follows:
| Distribution | Service | Total Fees | Retained |
Class A | 0% | .25% | $ 29 | $ 2 |
Class T | .25% | .25% | 15 | -* |
Class B | .75% | .25% | 10 | 8 |
Class C | .75% | .25% | 34 | 20 |
|
|
| $ 88 | $ 30 |
* Amount represents less than $1,000
Sales Load. FDC receives a front-end sales charge of up to 5.75% for selling Class A shares, and 3.50% for selling Class T shares, some of which is paid to financial intermediaries for selling shares of the Fund. FDC receives the proceeds of contingent deferred sales charges levied on Class A, Class T, Class B, and Class C redemptions. These charges depend on the holding period. The deferred sales charges range from 5% to 1% for Class B, 1% for Class C, 1.00% for certain purchases of Class A shares (1.00% to .50% prior to July 12, 2010) and .25% for certain purchases of Class T shares.
For the period, sales charge amounts retained by FDC were as follows:
| Retained |
Class A | $ 20 |
Class T | 2 |
Class B* | 6 |
Class C* | 1 |
| $ 29 |
* When Class B and Class C shares are initially sold, FDC pays commissions from its own resources to financial intermediaries through which the sales are made.
Transfer Agent Fees. Fidelity Investments Institutional Operations Company, Inc. (FIIOC), an affiliate of FMR, is the transfer, dividend disbursing and shareholder servicing agent for each class of the Fund. FIIOC receives account fees and asset-based fees that vary according to the account size and type of account of the shareholders of the respective classes of the Fund. FIIOC pays for typesetting, printing and mailing of shareholder reports, except proxy statements.
Annual Report
Notes to Financial Statements - continued
(Amounts in thousands except ratios)
6. Fees and Other Transactions with Affiliates - continued
Transfer Agent Fees - continued
For the period, transfer agent fees for each class were as follows:
| Amount | % of |
Class A | $ 25 | .22 |
Class T | 7 | .22 |
Class B | 3 | .29 |
Class C | 9 | .26 |
Convertible Securities | 4,324 | .19 |
Institutional Class | 12 | .19 |
| $ 4,380 |
|
Accounting and Security Lending Fees. Fidelity Service Company, Inc. (FSC), an affiliate of FMR, maintains the Fund's accounting records. The accounting fee is based on the level of average net assets for the month. Under a separate contract, FSC administers the security lending program. The security lending fee is based on the number and duration of lending transactions.
Brokerage Commissions. The Fund placed a portion of its portfolio transactions with brokerage firms which are affiliates of the investment adviser. The commissions paid to these affiliated firms were $5 for the period.
7. Committed Line of Credit.
The Fund participates with other funds managed by FMR or an affiliate in a $3.75 billion credit facility (the "line of credit") to be utilized for temporary or emergency purposes to fund shareholder redemptions or for other short-term liquidity purposes. The Fund has agreed to pay commitment fees on its pro-rata portion of the line of credit, which amounted to $9 and is reflected in Miscellaneous expenses on the Statement of Operations. During the period, there were no borrowings on this line of credit.
8. Security Lending.
The Fund lends portfolio securities through a lending agent from time to time in order to earn additional income. The lending agent may loan securities to certain qualified borrowers, including Fidelity Capital Markets (FCM), a broker-dealer affiliated with the Fund. On the settlement date of the loan, the Fund receives collateral (in the form of U.S. Treasury obligations, letters of credit and/or cash) against the loaned securities and maintains collateral in an amount not less than 100% of the market value of the loaned
Annual Report
8. Security Lending - continued
securities during the period of the loan. The market value of the loaned securities is determined at the close of business of the Fund and any additional required collateral is delivered to the Fund on the next business day. If the borrower defaults on its obligation to return the securities loaned because of insolvency or other reasons, a fund could experience delays and costs in recovering the securities loaned or in gaining access to the collateral. Any cash collateral received is invested in the Fidelity Securities Lending Cash Central Fund. The value of loaned securities and cash collateral at period end are disclosed on the Fund's Statement of Assets and Liabilities. Security lending income represents the income earned on investing cash collateral, less rebates paid to borrowers and lending agent fees associated with the loan, plus any premium payments received for lending certain types of securities. Security lending income is presented in the Statement of Operations as a component of income from Fidelity Central Funds. Total security lending income during the period amounted to $53. During the period, there were no securities loaned to FCM.
9. Expense Reductions.
FMR voluntarily agreed to reimburse a portion of Convertible Securities operating expenses. During the period, the reimbursement reduced the Class' expenses by $45. In addition, through arrangements with the Fund's custodian, credits realized as a result of uninvested cash balances were used to reduce the Fund's expenses. During the period, these credits reduced the Fund's custody expenses by $1.
10. Distributions to Shareholders.
Distributions to shareholders of each class were as follows:
Years ended November 30, | 2010 | 2009A |
From net investment income |
|
|
Class A | $ 362 | $ 62 |
Class T | 84 | 28 |
Class B | 26 | 9 |
Class C | 87 | 24 |
Convertible Securities | 86,745 | 103,134 |
Institutional Class | 222 | 50 |
Total | $ 87,526 | $ 103,307 |
A Distributions for Class A, Class T, Class B, Class C and Institutional Class are for the period February 19, 2009 (commencement of sale of shares) to November 30, 2009.
Annual Report
Notes to Financial Statements - continued
(Amounts in thousands except ratios)
11. Share Transactions.
Transactions for each class of shares were as follows:
| Shares | Dollars | ||
Years ended November 30, | 2010 | 2009 A | 2010 | 2009 A |
Class A |
|
|
|
|
Shares sold | 1,087 | 306 | $ 24,711 | $ 5,806 |
Reinvestment of distributions | 13 | 3 | 297 | 54 |
Shares redeemed | (592) | (39) | (13,289) | (801) |
Net increase (decrease) | 508 | 270 | $ 11,719 | $ 5,059 |
Class T |
|
|
|
|
Shares sold | 218 | 95 | $ 5,074 | $ 1,656 |
Reinvestment of distributions | 4 | 2 | 81 | 27 |
Shares redeemed | (168) | (6) | (3,714) | (110) |
Net increase (decrease) | 54 | 91 | $ 1,441 | $ 1,573 |
Class B |
|
|
|
|
Shares sold | 44 | 30 | $ 1,007 | $ 491 |
Reinvestment of distributions | 1 | - | 17 | 8 |
Shares redeemed | (27) | - | (604) | (5) |
Net increase (decrease) | 18 | 30 | $ 420 | $ 494 |
Class C |
|
|
|
|
Shares sold | 180 | 91 | $ 4,099 | $ 1,573 |
Reinvestment of distributions | 3 | 1 | 72 | 23 |
Shares redeemed | (52) | (13) | (1,197) | (248) |
Net increase (decrease) | 131 | 79 | $ 2,974 | $ 1,348 |
Convertible Securities |
|
|
|
|
Shares sold | 18,970 | 36,051 | $ 430,425 | $ 630,445 |
Reinvestment of distributions | 3,506 | 6,070 | 78,155 | 92,808 |
Shares redeemed | (38,186) | (38,505) | (860,169) | (627,813) |
Net increase (decrease) | (15,710) | 3,616 | $ (351,589) | $ 95,440 |
Institutional Class |
|
|
|
|
Shares sold | 400 | 173 | $ 9,185 | $ 3,107 |
Reinvestment of distributions | 6 | 2 | 133 | 44 |
Shares redeemed | (298) | (30) | (6,815) | (642) |
Net increase (decrease) | 108 | 145 | $ 2,503 | $ 2,509 |
A Share transactions for Class A, Class T, Class B, Class C and Institutional Class are for the period February 19, 2009 (commencement of sale of shares) to November 30, 2009.
Annual Report
12. Other.
The Fund's organizational documents provide former and current trustees and officers with a limited indemnification against liabilities arising in connection with the performance of their duties to the Fund. In the normal course of business, the Fund may also enter into contracts that provide general indemnifications. The Fund's maximum exposure under these arrangements is unknown as this would be dependent on future claims that may be made against the Fund. The risk of material loss from such claims is considered remote.
Annual Report
Report of Independent Registered Public Accounting Firm
To the Trustees of Fidelity Financial Trust and the Shareholders of Fidelity Convertible Securities Fund:
In our opinion, the accompanying statement of assets and liabilities, including the schedule of investments, and the related statements of operations and of changes in net assets and the financial highlights present fairly, in all material respects, the financial position of Fidelity Convertible Securities Fund (a fund of Fidelity Financial Trust) at November 30, 2010, the results of its operations for the year then ended, the changes in its net assets for each of the two years in the period then ended and the financial highlights for each of the periods indicated, in conformity with accounting principles generally accepted in the United States of America. These financial statements and financial highlights (hereafter referred to as "financial statements") are the responsibility of the Fidelity Convertible Securities Fund's management. Our responsibility is to express an opinion on these financial statements based on our audits. We conducted our audits of these financial statements in accordance with the standards of the Public Company Accounting Oversight Board (United States). Those standards require that we plan and perform the audit to obtain reasonable assurance about whether the financial statements are free of material misstatement. An audit includes examining, on a test basis, evidence supporting the amounts and disclosures in the financial statements, assessing the accounting principles used and significant estimates made by management, and evaluating the overall financial statement presentation. We believe that our audits, which included confirmation of securities at November 30, 2010 by correspondence with the custodian and brokers, provide a reasonable basis for our opinion.
/s/ PricewaterhouseCoopers LLP
PricewaterhouseCoopers LLP
Boston, Massachusetts
January 18, 2011
Annual Report
Trustees and Officers
The Trustees, Members of the Advisory Board, and executive officers of the trust and fund, as applicable, are listed below. The Board of Trustees governs the fund and is responsible for protecting the interests of shareholders. The Trustees are experienced executives who meet periodically throughout the year to oversee the fund's activities, review contractual arrangements with companies that provide services to the fund, oversee management of the risks associated with such activities and contractual arrangements, and review the fund's performance. Except for Mr. James C. Curvey, each of the Trustees oversees 219 funds advised by FMR or an affiliate. Mr. Curvey oversees 408 funds advised by FMR or an affiliate.
The Trustees hold office without limit in time except that (a) any Trustee may resign; (b) any Trustee may be removed by written instrument, signed by at least two-thirds of the number of Trustees prior to such removal; (c) any Trustee who requests to be retired or who has become incapacitated by illness or injury may be retired by written instrument signed by a majority of the other Trustees; and (d) any Trustee may be removed at any special meeting of shareholders by a two-thirds vote of the outstanding voting securities of the trust. Each Trustee who is not an interested person (as defined in the 1940 Act) (Independent Trustee), shall retire not later than the last day of the calendar year in which his or her 72nd birthday occurs. The Independent Trustees may waive this mandatory retirement age policy with respect to individual Trustees. The executive officers and Advisory Board Members hold office without limit in time, except that any officer and Advisory Board Member may resign or may be removed by a vote of a majority of the Trustees at any regular meeting or any special meeting of the Trustees. Except as indicated, each individual has held the office shown or other offices in the same company for the past five years.
Experience, Skills, Attributes, and Qualifications of the Fund's Trustees. The Governance and Nominating Committee has adopted a statement of policy that describes the experience, qualifications, attributes, and skills that are necessary and desirable for potential Independent Trustee candidates (Statement of Policy). The Board believes that each Trustee satisfied at the time he or she was initially elected or appointed a Trustee, and continues to satisfy, the standards contemplated by the Statement of Policy. The Governance and Nominating Committee also engages professional search firms to help identify potential Independent Trustee candidates who have the experience, qualifications, attributes, and skills consistent with the Statement of Policy. From time to time, additional criteria based on the composition and skills of the current Independent Trustees, as well as experience or skills that may be appropriate in light of future changes to board composition, business conditions, and regulatory or other developments, have also been considered by the professional search firms and the Governance and Nominating Committee. In addition, the Board takes into account the Trustees' commitment and participation in Board and committee meetings, as well as their leadership of standing and ad hoc committees throughout their tenure.
In determining that a particular Trustee was and continues to be qualified to serve as a Trustee, the Board has considered a variety of criteria, none of which, in isolation, was controlling. The Board believes that, collectively, the Trustees have balanced and diverse experience, qualifications, attributes, and skills, which allow the Board to operate effectively in governing the fund and protecting the interests of shareholders. Information about the specific experience, skills, attributes, and qualifications of each Trustee, which in each case led to the Board's conclusion that the Trustee should serve (or continue to serve) as a trustee of the fund, is provided below.
Annual Report
Board Structure and Oversight Function. James C. Curvey is an interested person (as defined in the 1940 Act) and currently serves as Acting Chairman. The Trustees have determined that an interested Chairman is appropriate and benefits shareholders because an interested Chairman has a personal and professional stake in the quality and continuity of services provided to the fund. Independent Trustees exercise their informed business judgment to appoint an individual of their choosing to serve as Chairman, regardless of whether the Trustee happens to be independent or a member of management. The Independent Trustees have determined that they can act independently and effectively without having an Independent Trustee serve as Chairman and that a key structural component for assuring that they are in a position to do so is for the Independent Trustees to constitute a substantial majority for the Board. The Independent Trustees also regularly meet in executive session. Ned C. Lautenbach serves as Chairman of the Independent Trustees and as such (i) acts as a liaison between the Independent Trustees and management with respect to matters important to the Independent Trustees and (ii) with management prepares agendas for Board meetings.
Fidelity funds are overseen by different Boards of Trustees. The fund's Board oversees Fidelity's equity and high income funds and another Board oversees Fidelity's investment-grade bond, money market, and asset allocation funds. The asset allocation funds may invest in Fidelity funds overseen by the fund's Board. The use of separate Boards, each with its own committee structure, allows the Trustees of each group of Fidelity funds to focus on the unique issues of the funds they oversee, including common research, investment, and operational issues. On occasion, the separate Boards establish joint committees to address issues of overlapping consequences for the Fidelity funds overseen by each Board.
The Trustees operate using a system of committees to facilitate the timely and efficient consideration of all matters of importance to the Trustees, the fund, and fund shareholders and to facilitate compliance with legal and regulatory requirements and oversight of the fund's activities and associated risks. The Board, acting through its committees, has charged FMR and its affiliates with (i) identifying events or circumstances the occurrence of which could have demonstrably adverse effects on the fund's business and/or reputation; (ii) implementing processes and controls to lessen the possibility that such events or circumstances occur or to mitigate the effects of such events or circumstances if they do occur; and (iii) creating and maintaining a system designed to evaluate continuously business and market conditions in order to facilitate the identification and implementation processes described in (i) and (ii) above. Because the day-to-day operations and activities of the fund's are carried out by or through FMR, its affiliates and other service providers, the fund's exposure to risks is mitigated but not eliminated by the processes overseen by the Trustees. While each of the Board's committees has responsibility for overseeing different aspects of the fund's activities, oversight is exercised primarily through the Operations, Audit, and Compliance Committees. Appropriate personnel, including but not limited to the fund's Chief Compliance Officer (CCO), FMR's internal auditor, the independent accountants, the fund's Treasurer and portfolio management personnel, make periodic reports to the Board's committees, as appropriate. The responsibilities of each committee, including their oversight responsibilities, are described further under "Standing Committees of the Fund's Trustees."
Annual Report
Trustees and Officers - continued
The fund's Statement of Additional Information (SAI) includes more information about the Trustees. To request a free copy, call Fidelity at 1-877-208-0098.
Interested Trustees*:
Correspondence intended for each Trustee who is an interested person may be sent to Fidelity Investments, 82 Devonshire Street, Boston, Massachusetts 02109.
Name, Age; Principal Occupations and Other Relevant Experience+ | |
James C. Curvey (75) | |
| Year of Election or Appointment: 2007 Mr. Curvey is Trustee and Acting Chairman of the Board of Trustees of certain Trusts. Mr. Curvey also serves as Trustee (2007-present) of other investment companies advised by FMR. Mr. Curvey is a Director of Fidelity Investments Money Management, Inc. (2009-present), Director of Fidelity Research & Analysis Co. (2009-present) and Director of FMR and FMR Co., Inc. (2007-present). Mr. Curvey is also Vice Chairman (2007-present) and Director of FMR LLC. In addition, Mr. Curvey serves as an Overseer for the Boston Symphony Orchestra and a member of the Trustees of Villanova University. Previously, Mr. Curvey was the Vice Chairman (2006-2007) and Director (2000-2007) of FMR Corp. |
Ronald P. O'Hanley (54) | |
| Year of Election or Appointment: 2011 Ronald P. O'Hanley is President, Asset Management and Corporate Services, for Fidelity Investments and a member of Fidelity's Executive Committee (2010-present). Previously, Mr. O'Hanley served as President and Chief Executive Officer of BNY Mellon Asset Management (2007-2010). Mr. O'Hanley also served as Vice Chairman of Bank New York Mellon Corp. and a member of that firm's Executive Committee. Prior to the 2007 merger of The Bank of New York and Mellon Financial Corporation, he was Vice Chairman of Mellon Financial Corporation and President and Chief Executive Officer of Mellon Asset Management. He joined Mellon in February 1997. Mr. O'Hanley currently serves as Chairman of the Boston Public Library Foundation Board of Directors and sits on the Board of Directors of Beth Israel Deaconess Medical Center, the Board of Trustees of the Marine Biological Laboratory and the Advisory Board of the Maxwell School of Citizenship and Public Administration at Syracuse University. Mr. O'Hanley also chairs the Council on Asset Management for the Financial Services Roundtable and is a member of the Board of Directors of Institutional Investor's U.S. Institute. |
* Trustees have been determined to be "Interested Trustees" by virtue of, among other things, their affiliation with the trust or various entities under common control with FMR.
+ The information above includes each Trustee's principal occupation during the last five years and other information relating to the experience, attributes, and skills relevant to each Trustee's qualifications to serve as a Trustee, which led to the conclusion that each Trustee should serve as a Trustee for the fund.
Annual Report
Trustees and Officers - continued
Independent Trustees:
Correspondence intended for each Independent Trustee (that is, the Trustees other than the Interested Trustees) may be sent to Fidelity Investments, P.O. Box 55235, Boston, Massachusetts 02205-5235.
Name, Age; Principal Occupations and Other Relevant Experience+ | |
Dennis J. Dirks (62) | |
| Year of Election or Appointment: 2005 Prior to his retirement in May 2003, Mr. Dirks was Chief Operating Officer and a member of the Board of The Depository Trust & Clearing Corporation (DTCC). He also served as President, Chief Operating Officer, and Board member of The Depository Trust Company (DTC) and President and Board member of the National Securities Clearing Corporation (NSCC). In addition, Mr. Dirks served as Chief Executive Officer and Board member of the Government Securities Clearing Corporation, Chief Executive Officer and Board member of the Mortgage-Backed Securities Clearing Corporation, as a Trustee and a member of the Finance Committee of Manhattan College (2005-2008), and as a Trustee and a member of the Finance Committee of AHRC of Nassau County (2006-2008). Mr. Dirks is a member of the Independent Directors Council (IDC) Governing Council (2010-Present) and Board of Directors for The Brookville Center for Children's Services, Inc. (2009-present). |
Alan J. Lacy (57) | |
| Year of Election or Appointment: 2008 Mr. Lacy serves as Senior Adviser (2007-present) of Oak Hill Capital Partners, L.P. (private equity). Mr. Lacy also served as Chief Executive Officer (2000-2005) and Vice Chairman (2005-2006) of Sears Holdings Corporation and Sears, Roebuck and Co. (retail). In addition, Mr. Lacy serves as a member of the Board of Directors of The Western Union Company (global money transfer, 2006-present) and Bristol-Myers Squibb Company (global pharmaceuticals, 2007-present). Mr. Lacy is Chairman (2008-present) and a member (2006-present) of the Board of Trustees of The National Parks Conservation Association. |
Ned C. Lautenbach (66) | |
| Year of Election or Appointment: 2000 Mr. Lautenbach is Chairman of the Independent Trustees of the Equity and High Income Funds (2006-present). Mr. Lautenbach currently serves as the Lead Director of the Eaton Corporation Board of Directors (diversified industrial, 1997-present). Mr. Lautenbach is also a member of the Board of Directors of the Philharmonic Center for the Arts in Naples, Florida (1999-present); a member of the Board of Trustees of Fairfield University (2005-present); and a member of the Council on Foreign Relations (1994-present). Previously, Mr. Lautenbach was a Partner/Advisory Partner at Clayton, Dubilier & Rice, Inc. (private equity investment, 1998-2010), as well as a Director of Sony Corporation (2006-2007). |
Joseph Mauriello (66) | |
| Year of Election or Appointment: 2008 Prior to his retirement in January 2006, Mr. Mauriello served in numerous senior management positions including Deputy Chairman and Chief Operating Officer (2004-2005), and Vice Chairman of Financial Services (2002-2004) of KPMG LLP US (professional services, 1965-2005). Mr. Mauriello currently serves as a member of the Board of Directors of XL Group plc. (global insurance and re-insurance, 2006-present) and of Arcadia Resources Inc. (health care services and products, 2007-present). Previously, Mr. Mauriello served as a Director of the Hamilton Funds of the Bank of New York (2006-2007). |
Cornelia M. Small (66) | |
| Year of Election or Appointment: 2005 Ms. Small is a member of the Board of Directors of the Teagle Foundation (2009-present). Ms. Small is also a member of the Investment Committee, and Chair (2008-present) and a member of the Board of Trustees of Smith College. In addition, Ms. Small serves on the Investment Committee of the Berkshire Taconic Community Foundation (2008-present). Previously, Ms. Small served as Chairperson of the Investment Committee (2002-2008) of Smith College. In addition, Ms. Small served as Chief Investment Officer, Director of Global Equity Investments, and a member of the Board of Directors of Scudder, Stevens & Clark and Scudder Kemper Investments. |
William S. Stavropoulos (71) | |
| Year of Election or Appointment: 2001 Mr. Stavropoulos is Vice Chairman of the Independent Trustees of the Equity and High Income Funds (2006-present). Mr. Stavropoulos serves as President and Founder of the Michigan Baseball Foundation, the Great Lakes Loons (2007-present). Mr. Stavropoulos is Chairman Emeritus of the Board of Directors of The Dow Chemical Company, where he previously served in numerous senior management positions, including President, CEO (1995-2000; 2002-2004), Chairman of the Executive Committee (2000-2006), and as a member of the Board of Directors (1990-2006). Currently, Mr. Stavropoulos is Chairman of Univar (global distributor of commodity and specialty chemicals, 2010-present), a Director of Teradata Corporation (data warehousing and technology solutions, 2008-present), Chemical Financial Corporation, Maersk Inc. (industrial conglomerate), Tyco International, Inc. (multinational manufacturing and services, 2007-present), and a member of the Advisory Board for Metalmark Capital (private equity investment, 2005-present). Mr. Stavropoulos is a special advisor to Clayton, Dubilier & Rice, LLC (private equity investment). In addition, Mr. Stavropoulos is a member of the University of Notre Dame Advisory Council for the College of Science. |
David M. Thomas (61) | |
| Year of Election or Appointment: 2008 Previously, Mr. Thomas served as Executive Chairman (2005-2006) and Chairman and Chief Executive Officer (2000-2005) of IMS Health, Inc. (pharmaceutical and healthcare information solutions). In addition, Mr. Thomas serves as a member of the Board of Directors of Fortune Brands, Inc. (consumer products), and Interpublic Group of Companies, Inc. (marketing communication, 2004-present). |
Michael E. Wiley (60) | |
| Year of Election or Appointment: 2008 Mr. Wiley also serves as a Director of Asia Pacific Exploration Consolidated (international oil and gas exploration and production, 2008-present). Mr. Wiley serves as a Director of Tesoro Corporation (independent oil refiner and marketer, 2005-present), and a Director of Bill Barrett Corporation (exploration and production, 2005-present). In addition, Mr. Wiley also serves as a Director of Post Oak Bank (privately-held bank, 2004-present). Previously, Mr. Wiley served as a member of the Board of Trustees of the University of Tulsa (2000-2006; 2007-2010), as a Senior Energy Advisor of Katzenbach Partners, LLC (consulting, 2006-2007), as an Advisory Director of Riverstone Holdings (private investment), Chairman, President, and CEO of Baker Hughes, Inc. (oilfield services, 2000-2004), and as Director of Spinnaker Exploration Company (exploration and production, 2001-2005). |
Annual Report
+ The information above includes each Trustee's principal occupation during the last five years and other information relating to the experience, attributes, and skills relevant to each Trustee's qualifications to serve as a Trustee, which led to the conclusion that each Trustee should serve as a Trustee for the fund.
Advisory Board Members and Executive Officers:
Correspondence intended for each executive officer, Edward C. Johnson 3d, and Peter S. Lynch may be sent to Fidelity Investments, 82 Devonshire Street, Boston, Massachusetts 02109.
Name, Age; Principal Occupation | |
Edward C. Johnson 3d (80) | |
| Year of Election or Appointment: 2011 Member of the Advisory Board of Fidelity's Equity and High Income Funds. Formerly Trustee and Chairman of the Board of Trustees of certain Trusts, Mr. Johnson serves as Chief Executive Officer, Chairman, and a Director of FMR LLC; Chairman and a Director of FMR; and Chairman and a Director of FMR Co., Inc. In addition, Mr. Johnson serves as Chairman and Director of FIL Limited. Previously, Mr. Johnson served as President of FMR LLC (2006-2007). |
Peter S. Lynch (66) | |
| Year of Election or Appointment: 2003 Member of the Advisory Board of Fidelity's Equity and High Income Funds. Mr. Lynch is Vice Chairman and a Director of FMR and FMR Co., Inc. In addition, Mr. Lynch serves as a Trustee of Boston College and as the Chairman of the Inner-City Scholarship Fund. Previously, Mr. Lynch served on the Special Olympics International Board of Directors (1997-2006). |
Kenneth B. Robins (41) | |
| Year of Election or Appointment: 2008 President and Treasurer of Fidelity's Equity and High Income Funds. Mr. Robins also serves as President and Treasurer (2010-present) and Assistant Treasurer (2009-present) of other Fidelity funds and is an employee of Fidelity Investments (2004-present). Previously, Mr. Robins served as Deputy Treasurer of the Fidelity funds (2005-2008) and Treasurer and Chief Financial Officer of The North Carolina Capital Management Trust: Cash and Term Portfolios (2006-2008). |
Thomas C. Hense (46) | |
| Year of Election or Appointment: 2008 or 2010 Vice President of Fidelity's High Income (2008), Small Cap (2008), and Value (2010) Funds. Previously, Mr. Hense served as a portfolio manager for Fidelity's Institutional Money Management Group (Pyramis) (2003-2008). |
Brian B. Hogan (46) | |
| Year of Election or Appointment: 2009 Vice President of certain Equity Funds and Vice President of Sector Funds. Mr. Hogan also serves as President of FMR's Equity Division (2009-present). Previously, Mr. Hogan served as Senior Vice President, Equity Research of FMR (2006-2009) and as a portfolio manager. |
Scott C. Goebel (42) | |
| Year of Election or Appointment: 2008 Secretary and Chief Legal Officer (CLO) of the Fidelity funds. Mr. Goebel also serves as Secretary and CLO of The North Carolina Capital Management Trust: Cash and Term Portfolio (2008-present); General Counsel, Secretary, and Senior Vice President of FMR (2008-present) and FMR Co., Inc. (2008-present); Deputy General Counsel of FMR LLC; Chief Legal Officer of Fidelity Management & Research (Hong Kong) Limited (2008-present) and Assistant Secretary of Fidelity Management & Research (Japan) Inc. (2008-present), Fidelity Investments Money Management, Inc. (2008-present), Fidelity Management & Research (U.K.) Inc. (2008-present), and Fidelity Research and Analysis Company (2008-present). Previously, Mr. Goebel served as Assistant Secretary of the Funds (2007-2008) and as Vice President and Secretary of Fidelity Distributors Corporation (FDC) (2005-2007). |
William C. Coffey (41) | |
| Year of Election or Appointment: 2009 Assistant Secretary of Fidelity's Equity and High Income Funds. Mr. Coffey also serves as Senior Vice President and Deputy General Counsel of FMR LLC (2010-present), and is an employee of Fidelity Investments. Previously, Mr. Coffey served as Vice President and Associate General Counsel of FMR LLC (2005-2009). |
Holly C. Laurent (56) | |
| Year of Election or Appointment: 2008 Anti-Money Laundering (AML) Officer of the Fidelity funds. Ms. Laurent also serves as AML Officer of The North Carolina Capital Management Trust: Cash and Term Portfolio (2008-present) and is an employee of Fidelity Investments. Previously, Ms. Laurent was Senior Vice President and Head of Legal for Fidelity Business Services India Pvt. Ltd. (2006-2008), and Senior Vice President, Deputy General Counsel and Group Head for FMR LLC (2005-2006). |
Christine Reynolds (52) | |
| Year of Election or Appointment: 2008 Chief Financial Officer of the Fidelity funds. Ms. Reynolds became President of Fidelity Pricing and Cash Management Services (FPCMS) in August 2008. Ms. Reynolds served as Chief Operating Officer of FPCMS (2007-2008). Previously, Ms. Reynolds served as President, Treasurer, and Anti-Money Laundering officer of the Fidelity funds (2004-2007). |
Kenneth A. Rathgeber (63) | |
| Year of Election or Appointment: 2004 Chief Compliance Officer of Fidelity's Equity and High Income Funds. Mr. Rathgeber is Chief Compliance Officer of Fidelity Management & Research (Hong Kong) Limited (2008-present), Fidelity Management & Research (Japan) Inc. (2008-present), FMR (2005-present), FMR Co., Inc. (2005-present), Fidelity Management & Research (U.K.) Inc. (2005-present), Fidelity Research & Analysis Company (2005-present), Fidelity Investments Money Management, Inc. (2005-present), Pyramis Global Advisors, LLC (2005-present), and Strategic Advisers, Inc. (2005-present). |
Jeffrey S. Christian (49) | |
| Year of Election or Appointment: 2009 Deputy Treasurer of the Fidelity funds. Mr. Christian is an employee of Fidelity Investments. Previously, Mr. Christian served as Chief Financial Officer (2008-2009) of certain Fidelity funds and Senior Vice President of Fidelity Pricing and Cash Management Services (FPCMS) (2004-2009). |
Bryan A. Mehrmann (49) | |
| Year of Election or Appointment: 2005 Deputy Treasurer of the Fidelity funds. Mr. Mehrmann is an employee of Fidelity Investments. |
Adrien E. Deberghes (43) | |
| Year of Election or Appointment: 2008 Deputy Treasurer of Fidelity's Equity and High Income Funds. Mr. Deberghes also serves as Assistant Treasurer of other Fidelity funds (2010-present) and is an employee of Fidelity Investments (2008-present). Previously, Mr. Deberghes served as Senior Vice President of Mutual Fund Administration at State Street Corporation (2007-2008), Senior Director of Mutual Fund Administration at Investors Bank & Trust (2005-2007), and Director of Finance for Dunkin' Brands (2000-2005). |
Stephanie J. Dorsey (41) | |
| Year of Election or Appointment: 2010 Assistant Treasurer of Fidelity's Equity and High Income Funds. Ms. Dorsey also serves as Deputy Treasurer of other Fidelity funds (2008-present) and is an employee of Fidelity Investments (2008-present). Previously, Ms. Dorsey served as Treasurer (2004-2008) of the JPMorgan Mutual Funds and Vice President (2004-2008) of JPMorgan Chase Bank. |
John R. Hebble (52) | |
| Year of Election or Appointment: 2009 Assistant Treasurer of Fidelity's Equity and High Income Funds. Mr. Hebble also serves as Treasurer and Chief Financial Officer of The North Carolina Capital Management Trust: Cash and Term Portfolio (2008-present), President and Treasurer of other Fidelity funds (2008-present) and is an employee of Fidelity Investments. |
Gary W. Ryan (52) | |
| Year of Election or Appointment: 2005 Assistant Treasurer of the Fidelity funds. Mr. Ryan is an employee of Fidelity Investments. Previously, Mr. Ryan served as Vice President of Fund Reporting in Fidelity Pricing and Cash Management Services (FPCMS) (1999-2005). |
Jonathan Davis (42) | |
| Year of Election or Appointment: 2010 Assistant Treasurer of the Fidelity funds. Mr. Davis is an employee of Fidelity Investments. Previously, Mr. Davis served as Vice President and Associate General Counsel of FMR LLC (2003-2010). |
Annual Report
Distributions (Unaudited)
A total of .08% of the dividends distributed during the fiscal year was derived from interest on U.S. Government securities which is generally exempt from state income tax.
The fund designates $48,972,364 of distributions paid during the period January 1, 2010 to November 30, 2010 as qualifying to be taxed as interest-related dividends for nonresident alien shareholders.
Class A designates 3%, 3%, and 3%; Class T designates 3%, 4%, and 3%; Class B designates 4%, 5%, and 4%; and Class C designates 4%, 4%, and 4%; of the dividends distributed in April 2010, July 2010, and October 2010, respectively during the fiscal year as amounts which may be taken into account as a dividend for purposes of the maximum rate under section 1(h)(11) of the Internal Revenue Code.
The fund will notify shareholders in January 2011 of amounts for use in preparing 2010 income tax returns.
Annual Report
Board Approval of Investment Advisory Contracts and Management Fees
Fidelity Convertible Securities Fund
Each year, the Board of Trustees, including the Independent Trustees (together, the Board), votes on the renewal of the management contract and sub-advisory agreements (together, the Advisory Contracts) for the fund. The Board, assisted by the advice of fund counsel and Independent Trustees' counsel, requests and considers a broad range of information relevant to the renewal of the Advisory Contracts throughout the year.
The Board meets regularly and considers at each of its meetings factors that are relevant to its annual consideration of the renewal of the fund's Advisory Contracts, including the services and support provided to the fund and its shareholders. The Board has established various standing committees, each composed of Independent Trustees with varying backgrounds, to which the Board has assigned specific subject matter responsibilities in order to enhance effective decision-making by the Board. The Board, acting directly and through its Committees, requests and receives information concerning the annual consideration of the renewal of the fund's Advisory Contracts. The Board also meets as needed to consider matters specifically related to the Board's annual consideration of the renewal of Advisory Contracts. Members of the Board may also meet with trustees of other Fidelity funds through ad hoc joint committees to discuss certain matters relevant to the Fidelity funds.
At its July 2010 meeting, the Board of Trustees, including the Independent Trustees, unanimously determined to renew the fund's Advisory Contracts. In reaching its determination, the Board considered all factors it believed relevant, including (i) the nature, extent, and quality of the services to be provided to the fund and its shareholders (including the investment performance of the fund); (ii) the competitiveness of the fund's management fee and total expenses; (iii) the total costs of the services to be provided by and the profits to be realized by Fidelity from its relationship with the fund; (iv) the extent to which economies of scale would be realized as the fund grows; and (v) whether fee levels reflect these economies of scale, if any, for the benefit of fund shareholders.
In considering whether to renew the Advisory Contracts for the fund, the Board reached a determination, with the assistance of fund counsel and Independent Trustees' counsel and through the exercise of its business judgment, that the renewal of the Advisory Contracts is in the best interests of fund shareholders and that the compensation to be received by Fidelity under the management contract is fair and reasonable. The Board's decision to renew the Advisory Contracts was not based on any single factor noted above, but rather was based on a comprehensive consideration of all the information provided to the Board at its meetings throughout the year. The Board, in reaching its determination to renew the Advisory Contracts, is aware that shareholders in the fund have a broad range of investment choices available to them, including a wide choice among mutual funds offered by Fidelity's competitors, and that the fund's shareholders, with the opportunity to review and weigh the disclosure provided by the fund in its prospectus and other public disclosures, have chosen to invest in this fund, managed by Fidelity.
Annual Report
Nature, Extent, and Quality of Services Provided. The Board considered the staffing within the investment adviser, FMR, and the sub-advisers (together, the Investment Advisers), including the backgrounds of the fund's investment personnel and the fund's investment objective and discipline. The Independent Trustees also had discussions with senior management of Fidelity's investment operations and investment groups. The Board considered the structure of the portfolio manager compensation program and whether this structure provides appropriate incentives to act in the best interest of the fund.
Resources Dedicated to Investment Management and Support Services. The Board and the equity research subcommittee of the Board's Fund Oversight Committee reviewed the size, education, and experience of the Investment Advisers' investment staff, their use of technology, and the Investment Advisers' approach to recruiting, training, and retaining portfolio managers and other research, advisory, and management personnel. The Board noted that Fidelity's analysts have access to a variety of technological tools and market and securities data that enable them to perform both fundamental and quantitative analysis and to specialize in various disciplines. The Board considered Fidelity's extensive global research capabilities that enable the Investment Advisers to aggregate data from various sources in an effort to produce positive investment results. The Board also considered that Fidelity's portfolio managers and analysts have access to daily portfolio attribution that allows for monitoring of a fund's portfolio, as well as an electronic communication system that provides immediate real-time access to research concerning issuers and credit enhancers. The Board noted FMR's continued focus on strengthening the organization and discipline of equity portfolio management and research.
Shareholder and Administrative Services. The Board considered (i) the nature, extent, quality, and cost of advisory, administrative, and shareholder services performed by the Investment Advisers and their affiliates under the Advisory Contracts and under separate agreements covering transfer agency, pricing and bookkeeping, and securities lending services for the fund; (ii) the nature and extent of the investment adviser's supervision of third party service providers, principally custodians and subcustodians; and (iii) the resources devoted to, and the record of compliance with, the fund's compliance policies and procedures. The Board also reviewed the allocation of fund brokerage, including allocations to brokers affiliated with the Investment Advisers, the use of brokerage commissions to pay fund expenses, and the use of "soft" commission dollars to pay for research services.
The Board noted that the growth of fund assets over time across the complex allows Fidelity to reinvest in the development of services designed to enhance the value or convenience of the Fidelity funds as investment vehicles. These services include 24-hour access to account information and market information through phone representatives and over the Internet, and investor education materials and asset allocation tools.
Annual Report
Board Approval of Investment Advisory Contracts and
Management Fees - continued
Investment in a Large Fund Family. The Board considered the benefits to shareholders of investing in a Fidelity fund, including the benefits of investing in a fund that is part of a large family of funds offering a variety of investment disciplines and providing a large variety of mutual fund investor services. The Board noted that Fidelity had taken, or had made recommendations that resulted in the Fidelity funds taking, a number of actions over the previous year that benefited particular funds, including (i) dedicating additional resources to investment research and restructuring and broadening the focus of the investment research teams; (ii) bolstering the senior management team that oversees asset management; (iii) launching Class F of certain funds as a lower-fee class available to Freedom K and Freedom Index Funds; (iv) lowering the initial investment minimums and ongoing balance requirements for Real Estate High Income Fund; (v) eliminating subsequent purchase minimums for all funds and adding a waiver of the investment minimum requirement for new accounts opened with the proceeds of a systematic withdrawal plan; (vi) eliminating the withdrawal minimum and maximum limits for systematic withdrawals from Advisor funds; (vii) expanding sales load waivers on Class A shares for Destiny Planholders and expanding Institutional Class eligibility for Class O Destiny Planholders; and (viii) changing certain Class A and Class T sales charge structures to further align them with industry practices.
Investment Performance. The Board considered whether the fund has operated in accordance with its investment objective, as well as its record of compliance with its investment restrictions. It also reviewed the fund's absolute investment performance for the retail class, as well as the fund's relative investment performance for the retail class measured over multiple periods against (i) a broad-based securities market index, and (ii) a peer group of mutual funds deemed appropriate by Fidelity and reviewed by the Board. The following charts considered by the Board show, over the one-, three-, and five-year periods ended December 31, 2009, the cumulative total returns of the retail class of the fund, the cumulative total returns of a broad-based securities market index ("benchmark"), and a range of cumulative total returns of a peer group of mutual funds identified by Lipper Inc. as having an investment objective similar to that of the fund. (The Advisor classes of the fund had less than one year of performance as of Decem-ber 31, 2009.) The box within each chart shows the 25th percentile return (bottom of box) and the 75th percentile return (top of box) of the peer group. Returns shown above the box are in the first quartile and returns shown below the box are in the fourth quartile. The percentage beaten number noted below each chart corresponds to the percentile box and represents the percentage of funds in the peer group whose performance was equal to or lower than that of the retail class of the fund.
Annual Report
Fidelity Convertible Securities Fund

The Board reviewed the fund's relative investment performance against its peer group and noted that the performance of the retail class of the fund was in the first quartile for the one- and five-year periods and the second quartile for the three-year period. The Board also noted that the investment performance of the retail class of the fund compared favorably to its benchmark for the one- and five-year periods, although the fund's three-year cumulative total return was lower than its benchmark. The Board also reviewed the fund's performance since inception as well as performance in the current year.
The Board also considered that the fund's management fee is subject to upward or downward adjustment depending upon whether, and to what extent, the fund's investment performance for the performance period exceeds, or is exceeded by, the record (over the same period) of a Board-approved performance adjustment index. The Board realizes that the performance adjustment provides FMR with a strong economic incentive to seek to achieve superior performance for the fund's shareholders and helps to more closely align the interests of FMR and the fund's shareholders.
Based on its review, and giving particular weight to the nature and quality of the resources dedicated by the Investment Advisers to maintain and improve relative performance and factoring in the unprecedented market events in recent years, the Board concluded that the nature, extent, and quality of investment management and support services and of shareholder and administrative services provided to the fund will benefit the fund's shareholders, particularly in light of the Board's view that the fund's shareholders benefit from investing in a fund that is part of a large family of funds offering a variety of investment disciplines and services.
Annual Report
Board Approval of Investment Advisory Contracts and
Management Fees - continued
Competitiveness of Management Fee and Total Fund Expenses. The Board considered the fund's management fee and total expenses compared to "mapped groups" of competitive funds and classes. Fidelity creates "mapped groups" by combining similar Lipper investment objective categories that have comparable management fee characteristics. Combining Lipper investment objective categories aids the Board's management fee and total expense comparisons by broadening the competitive group used for comparison and by reducing the number of universes to which various Fidelity funds are compared.
Management Fee. The Board considered two proprietary management fee comparisons for the 12-month periods shown in the chart below. The group of Lipper funds used by the Board for management fee comparisons is referred to below as the "Total Mapped Group." The Total Mapped Group is broader than the Lipper peer group used by the Board for performance comparisons because the Total Mapped Group combines several Lipper investment objective categories while the Lipper peer group does not. The Total Mapped Group comparison focuses on a fund's standing relative to the total universe of comparable funds available to investors, in terms of gross management fees before expense reimbursements or caps, and without giving effect to the fund's performance adjustment. "TMG %" represents the percentage of funds in the Total Mapped Group that had management fees that were lower than the fund's. For example, a TMG % of 12% means that 88% of the funds in the Total Mapped Group had higher management fees than the fund. The "Asset-Size Peer Group" (ASPG) comparison focuses on a fund's standing relative to non-Fidelity funds similar in size to the fund within the Total Mapped Group. The ASPG represents at least 15% of the funds in the Total Mapped Group with comparable asset size and management fee characteristics, subject to a minimum of 50 funds (or all funds in the Total Mapped Group if fewer than 50). Additional information, such as the ASPG quartile in which the fund's management fee ranked and the impact of the fund's performance adjustment, is also included in the chart and considered by the Board.
Annual Report
Fidelity Convertible Securities Fund
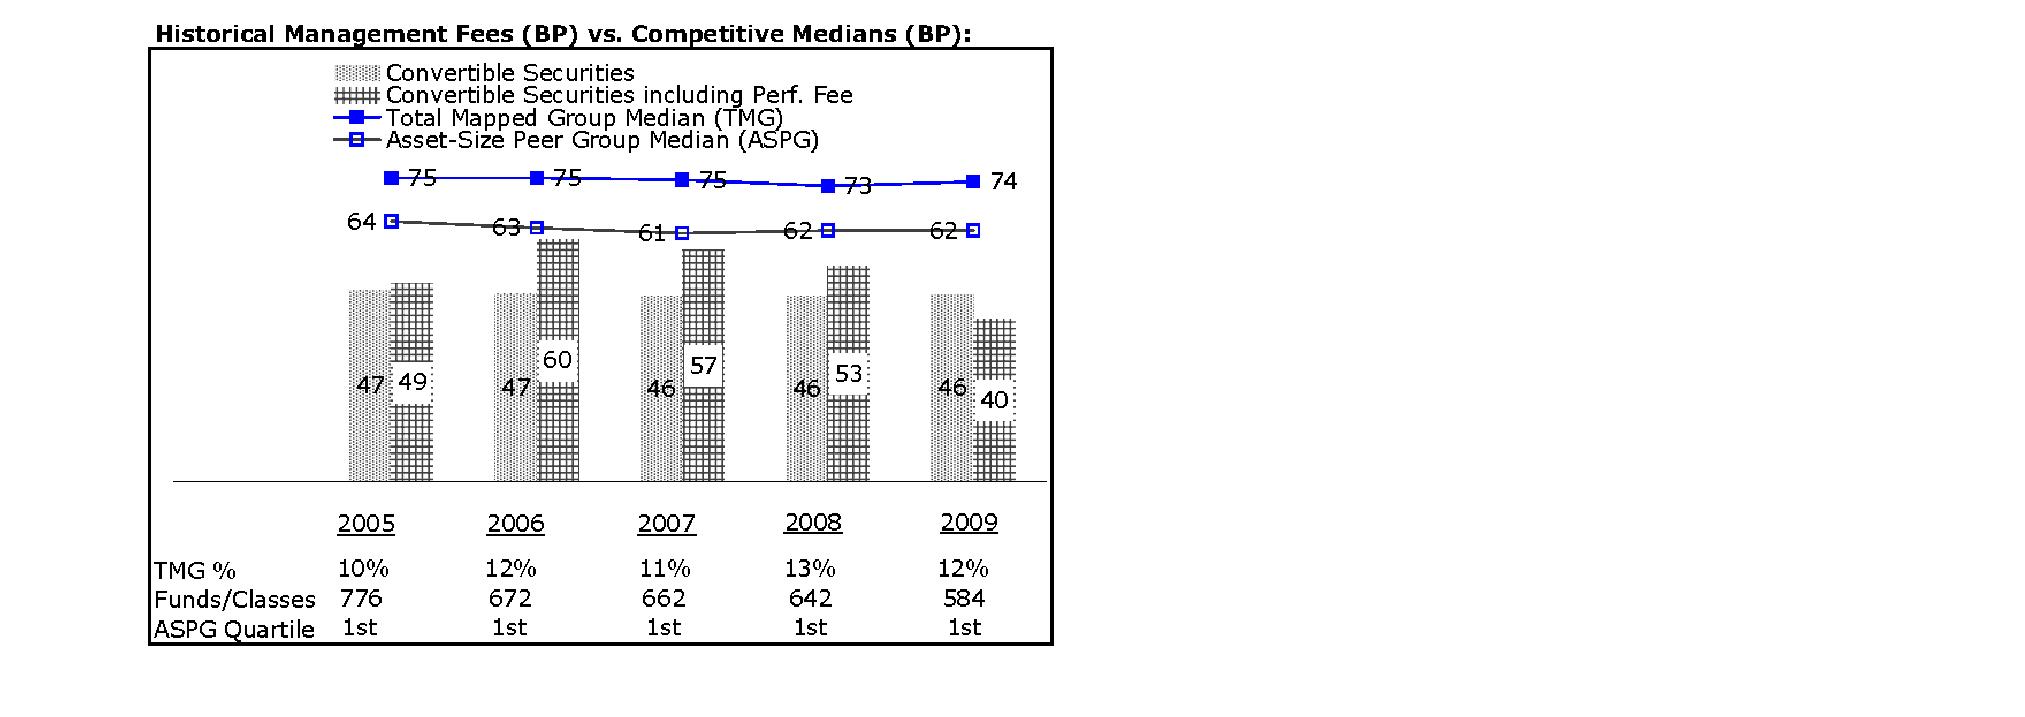
The Board noted that the fund's management fee ranked below the median of its Total Mapped Group and below the median of its ASPG for 2009. The Board also noted the effect of the fund's negative performance adjustment on the fund's management fee ranking. The Board noted that the performance adjustment for each year represents calculations for performance periods that differ from the periods shown in the performance charts above.
Based on its review, the Board concluded that the fund's management fee is fair and reasonable in light of the services that the fund receives and the other factors considered.
Total Expenses. In its review of each class's total expenses, the Board considered the fund's management fee as well as other fund or class expenses, as applicable, such as transfer agent fees, pricing and bookkeeping fees, fund-paid 12b-1 fees, and custodial, legal, and audit fees. The Board also noted the effects of any waivers and reimbursements on fees and expenses, as well as the impact of the fund's performance adjustment. As part of its review, the Board also considered current and historical total expenses of each class of the fund compared to competitive fund median expenses. Each class of the fund is compared to those funds and classes in the Total Mapped Group (used by the Board for management fee comparisons) that have a similar sales load structure.
The Board noted that the total expenses of each class ranked below its competitive median for 2009.
Annual Report
Board Approval of Investment Advisory Contracts and
Management Fees - continued
Fees Charged to Other Fidelity Clients. The Board also considered Fidelity fee structures and other information with respect to clients of FMR and its affiliates, such as other mutual funds advised or subadvised by FMR or its affiliates, pension plan clients, and other institutional clients. In March 2010, the Board created an ad hoc joint committee with the board of other Fidelity funds (the Committee) to review and compare Fidelity's institutional investment advisory business with its business of providing services to the Fidelity funds, including the differences in services provided, fees charged, and costs incurred, as well as competition in their respective marketplaces.
Based on its review of total expenses and fees charged to other Fidelity clients, the Board concluded that the total expenses of each class of the fund were reasonable in light of the services that the fund and its shareholders receive and the other factors considered, including the findings of the Committee.
Costs of the Services and Profitability. The Board considered the revenues earned and the expenses incurred by Fidelity in conducting the business of developing, marketing, distributing, managing, administering and servicing the fund and its shareholders. The Board also considered the level of Fidelity's profits in respect of all the Fidelity funds.
On an annual basis, FMR presents to the Board Fidelity's profitability for the fund. Fidelity calculates the profitability for each fund, as well as aggregate profitability for groups of Fidelity funds and all Fidelity funds, using a series of detailed revenue and cost allocation methodologies which originate with the audited books and records of Fidelity. The Audit Committee of the Board reviews any significant changes from the prior year's methodologies.
PricewaterhouseCoopers LLP (PwC), independent registered public accounting firm and auditor to Fidelity and certain Fidelity funds, has been engaged annually by the Board as part of the Board's assessment of Fidelity's profitability analysis. PwC's engagement includes the review and assessment of Fidelity's methodologies used in determining the revenues and expenses attributable to Fidelity's mutual fund business, and completion of agreed-upon procedures surrounding the mathematical accuracy of fund profitability and its conformity to allocation methodologies. After considering PwC's reports issued under the engagement and information provided by Fidelity, the Board believes that while other allocation methods may also be reasonable, Fidelity's profitability methodologies are reasonable in all material respects.
The Board has also reviewed Fidelity's non-fund businesses and fall-out benefits related to the mutual fund business as well as cases where Fidelity's affiliates may benefit from or be related to the fund's business.
Annual Report
The Board considered the costs of the services provided by and the profits realized by Fidelity in connection with the operation of the fund and were satisfied that the profitability was not excessive in the circumstances.
Economies of Scale. The Board considered whether there have been economies of scale in respect of the management of the Fidelity funds, whether the Fidelity funds (including the fund) have appropriately benefited from any such economies of scale, and whether there is potential for realization of any further economies of scale. The Board considered the extent to which the fund will benefit from economies of scale through increased services to the fund, through waivers or reimbursements, or through fee or expense reductions.
In February 2009, the Board and the board of other Fidelity funds created an ad hoc committee (the Economies of Scale Committee) to analyze whether FMR attains economies of scale in respect of the management and servicing of the Fidelity funds, whether the Fidelity funds have appropriately benefited from such economies of scale, and whether there is potential for realization of any further economies of scale.
The Board recognized that the fund's management contract incorporates a "group fee" structure, which provides for lower group fee rates as total fund assets under FMR's management increase, and for higher group fee rates as total fund assets under FMR's management decrease. FMR calculates the group fee rates based on a tiered asset "breakpoint" schedule that varies based on asset class. The Board considered that the group fee is designed to deliver the benefits of economies of scale to fund shareholders when total Fidelity fund assets increase, even if assets of any particular fund are unchanged or have declined, because some portion of Fidelity's costs are attributable to services provided to all Fidelity funds, and all funds benefit if those costs can be allocated among more assets. The Board concluded that, given the group fee structure, fund shareholders will benefit from lower management fees as assets under FMR's management increase at the fund complex level, regardless of whether Fidelity achieves any such economies of scale.
The Board concluded, considering the findings of the Economies of Scale Committee, that any potential economies of scale are being appropriately shared between fund shareholders and Fidelity.
Additional Information Requested by the Board. In order to develop fully the factual basis for consideration of the Fidelity funds' Advisory Contracts, the Board requested and received additional information on certain topics, including (i) fund performance trends, actions to be taken by FMR to improve certain funds' overall performance, and Fidelity's long-term strategies for certain funds; (ii) portfolio manager changes that have occurred during the past year and length of portfolio manager tenure for different categories of funds over time; (iii) Fidelity's compensation structure for portfolio managers, research analysts, and other key personnel, the rationale for the compensation structure, and how the compensation structure provides appropriate performance incentives; (iv) the amount of the investment that each portfolio manager has made in the Fidelity fund(s) that he or she manages; (v) management and other fees paid by FMR to affiliated sub-advisers on behalf of the Fidelity funds; (vi) Fidelity's fee structures and rationale for recommending different fees among different categories of funds; (vii) Fidelity's rationale for recommending which funds should have a performance adjustment component as part of their management fees; (viii) the rationale for any differences between fund fee structures and fee structures in place for other Fidelity clients; and (ix) explanations regarding the relative total expenses borne by certain funds and classes, total expense competitive trends, and actions that might be taken by FMR to reduce total expenses for certain funds and classes.
Annual Report
Board Approval of Investment Advisory Contracts and
Management Fees - continued
Based on its evaluation of all of the conclusions noted above, and after considering all factors it believed relevant, the Board ultimately concluded that the advisory fee structures are fair and reasonable, and that the fund's Advisory Contracts should be renewed.
Annual Report
Investment Adviser
Fidelity Management & Research Company
Boston, MA
Investment Sub-Advisers
FMR Co., Inc.
Fidelity Research & Analysis Company
Fidelity Management & Research
(U.K.) Inc.
Fidelity Management & Research
(Hong Kong) Limited
Fidelity Management & Research
(Japan) Inc.
General Distributor
Fidelity Distributors Corporation
Boston, MA
Transfer and Service Agents
Fidelity Investments Institutional
Operations Company, Inc.
Boston, MA
Fidelity Service Company, Inc.
Boston, MA
Custodian
Citibank, N.A.
New York, NY
ACVS-UANN-0111
1.884066.101

(Fidelity Investment logo)(registered trademark)
Fidelity Advisor®
Convertible Securities
Fund - Institutional Class
Annual Report
November 30, 2010
Institutional Class is a class
of Fidelity® Convertible
Securities Fund
(2_fidelity_logos) (Registered_Trademark)
Contents
Chairman's Message | The Chairman's message to shareholders. | |
Performance | How the fund has done over time. | |
Management's Discussion of Fund Performance | The Portfolio Manager's review of fund performance and strategy. | |
Shareholder Expense Example | An example of shareholder expenses. | |
Investment Changes | A summary of major shifts in the fund's investments over the past six months. | |
Investments | A complete list of the fund's investments with their market values. | |
Financial Statements | Statements of assets and liabilities, operations, and changes in net assets, as well as financial highlights. | |
Notes | Notes to the financial statements. | |
Report of Independent Registered Public Accounting Firm |
| |
Trustees and Officers |
| |
Distributions |
| |
Board Approval of Investment Advisory Contracts and Management Fees |
|
To view a fund's proxy voting guidelines and proxy voting record for the 12-month period ended June 30, visit http://www.fidelity.com/proxyvotingresults or visit the Securities and Exchange Commission's (SEC) web site at http://www.sec.gov. You may also call 1-877-208-0098 to request a free copy of the proxy voting guidelines.
Standard & Poor's, S&P and S&P 500 are registered service marks of The McGraw-Hill Companies, Inc. and have been licensed for use by Fidelity Distributors Corporation.
Other third party marks appearing herein are the property of their respective owners.
All other marks appearing herein are registered or unregistered trademarks or service marks of FMR LLC or an affiliated company.
Annual Report
This report and the financial statements contained herein are submitted for the general information of the shareholders of the fund. This report is not authorized for distribution to prospective investors in the fund unless preceded or accompanied by an effective prospectus.
A fund files its complete schedule of portfolio holdings with the SEC for the first and third quarters of each fiscal year on Form N-Q. Forms N-Q are available on the SEC's web site at http://www.sec.gov. A fund's Forms N-Q may be reviewed and copied at the SEC's Public Reference Room in Washington, DC. Information regarding the operation of the SEC's Public Reference Room may be obtained by calling 1-800-SEC-0330. For a complete list of a fund's portfolio holdings, view the most recent holdings listing, semiannual report, or annual report on Fidelity's web site at http://www.fidelity.com or http://www.advisor.fidelity.com, or http://www.401k.com, as applicable.
NOT FDIC INSURED • MAY LOSE VALUE • NO BANK GUARANTEE
Neither the fund nor Fidelity Distributors Corporation is a bank.
Annual Report
Chairman's Message
(photo_of_James_C_Curvey)
Dear Shareholder:
Equities have staged a rally in the second half of 2010, shaking off concerns about the European debt crisis and the possibility of a double-dip recession in the U.S. Although the short-term surge pushed major equity indexes back into positive territory for the year, several questions remain about the longer-term outlook, including lackluster economic growth and persistently high unemployment. Financial markets are always unpredictable, of course, but there also are several time-tested investment principles that can help put the odds in your favor.
One of the basic tenets is to invest for the long term. Over time, riding out the markets' inevitable ups and downs has proven much more effective than selling into panic or chasing the hottest trend. Even missing only a few of the markets' best days can significantly diminish investor returns. Patience also affords the benefits of compounding - of earning interest on additional income or reinvested dividends and capital gains. There can be tax advantages and cost benefits to consider as well. While staying the course doesn't eliminate risk, it can considerably lessen the effect of short-term declines.
You can further manage your investing risk through diversification. And today, more than ever, geographic diversification should be taken into account. Studies indicate that asset allocation is the single most important determinant of a portfolio's long-term success. The right mix of stocks, bonds and cash - aligned to your particular risk tolerance and investment objective - is very important. Age-appropriate rebalancing is also an essential aspect of asset allocation. For younger investors, an emphasis on equities - which historically have been the best-performing asset class over time - is encouraged. As investors near their specific goal, such as retirement or sending a child to college, consideration may be given to replacing volatile assets (e.g. common stocks) with more-stable fixed investments (bonds or savings plans).
A third principle - investing regularly - can help lower the average cost of your purchases. Investing a certain amount of money each month or quarter helps ensure you won't pay for all your shares at market highs. This strategy - known as dollar cost averaging - also reduces "emotion" from investing, helping shareholders avoid selling weak performers just prior to an upswing, or chasing a hot performer just before a correction.
We invite you to contact us via the Internet, through our Investor Centers or by phone. It is our privilege to provide you the information you need to make the investments that are right for you.
Sincerely,
(The acting chairman's signature appears here.)
James C. Curvey
Acting Chairman
Annual Report
Performance: The Bottom Line
Average annual total return reflects the change in the value of an investment, assuming reinvestment of the class' distributions from dividend income and capital gains (the profits earned upon the sale of securities that have grown in value, if any) and assuming a constant rate of performance each year. The $10,000 table and the fund's returns do not reflect the deduction of taxes that a shareholder would pay on fund distributions or the redemption of fund shares. During periods of reimbursement by Fidelity, a fund's total return will be greater than it would be had the reimbursement not occurred. How a fund did yesterday is no guarantee of how it will do tomorrow.
Average Annual Total Returns
Periods ended November 30, 2010 |
| Past 1 | Past 5 | Past 10 |
Institutional ClassA |
| 18.34% | 5.98% | 5.98% |
A The initial offering of Institutional Class shares took place on February 19, 2009. Returns prior to February 19, 2009 are those of Fidelity Convertible Securities Fund, the original class of the fund.
$10,000 Over 10 Years
Let's say hypothetically that $10,000 was invested in Fidelity Advisor® Convertible Securities Fund - Institutional Class on November 30, 2000. The chart shows how the value of your investment would have changed, and also shows how The BofA Merrill Lynch All US Convertibles Index performed over the same period. The initial offering of Fidelity Advisor Convertible Securities Fund - Institutional Class took place on February 19, 2009. See above for additional information regarding the performance of Fidelity Advisor Convertible Securities Fund - Institutional Class.
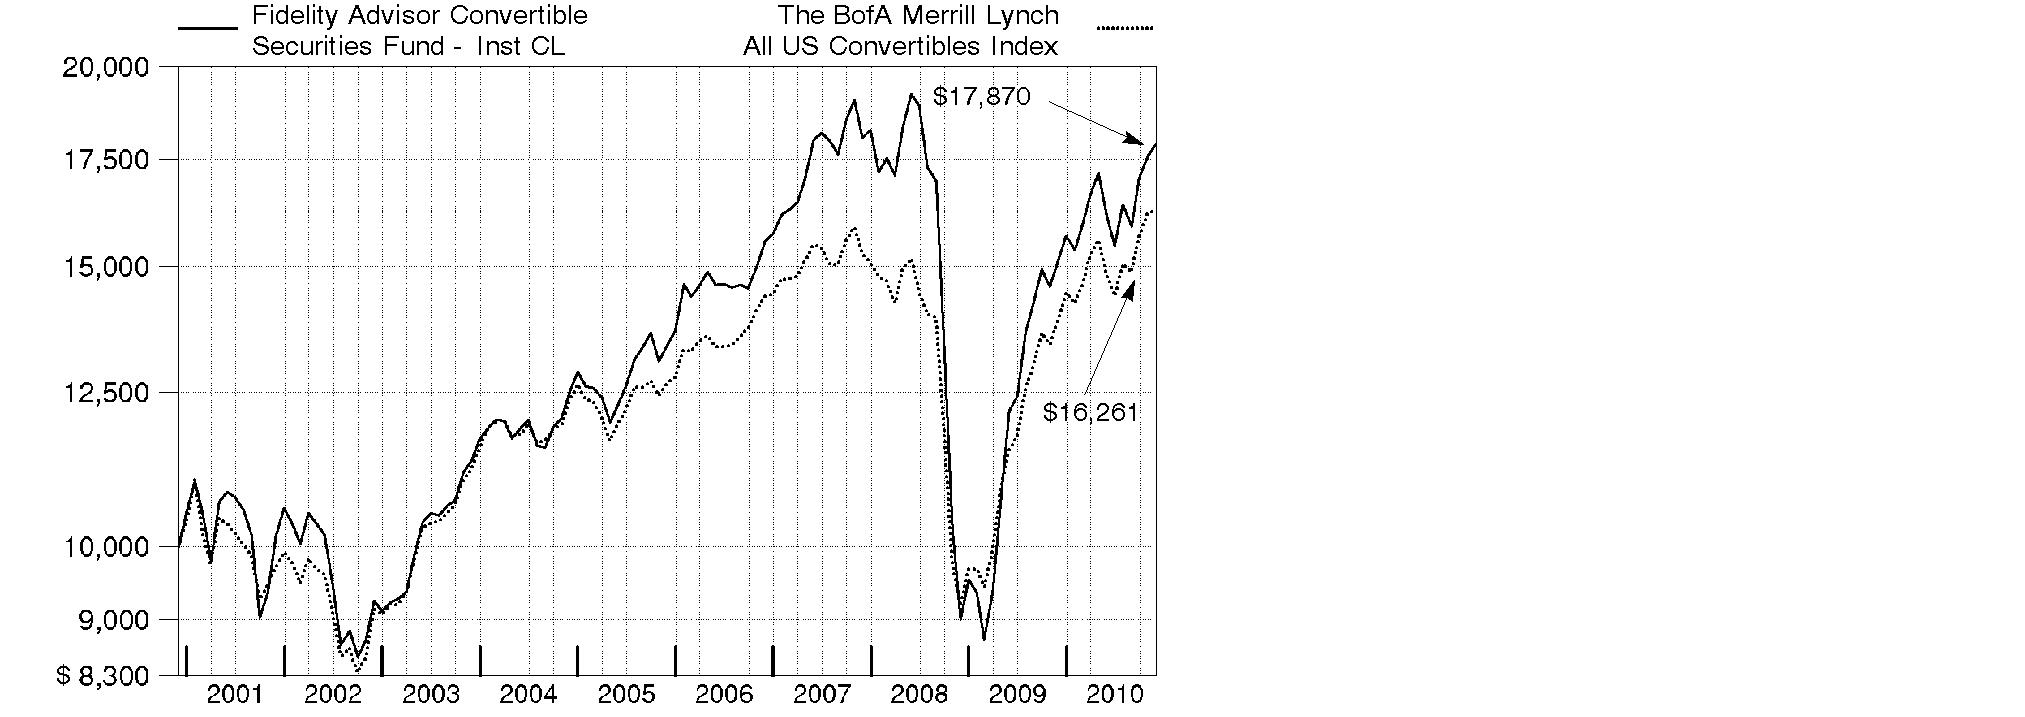
Annual Report
Management's Discussion of Fund Performance
Market Recap: Convertible securities enjoyed a strong run for the 12 months ending November 30, 2010, benefiting from their hybrid nature - with both equity- and fixed-income characteristics - in a period of low yields, heightened market volatility and rising stock prices. Convertibles returned 17.24%, according to The BofA Merrill LynchSM All US Convertibles Index, ranking them among the top-performing asset classes for the period. High-yield bonds, as measured by The BofA Merrill Lynch US High Yield Constrained Index, appreciated 16.63%, while the S&P 500® Index, a common proxy for the performance of large-capitalization U.S. equities, rose 9.94%, and the Barclays Capital® U.S. Aggregate Bond Index, which tracks taxable investment-grade bonds, gained 6.02%. With the U.S. economy still showing signs of weakness, particularly in the housing and labor markets, the Federal Reserve kept the benchmark federal funds target rate at a historically low range of 0% to 0.25%. In an ultra-low-yield environment, the income component of convertible securities became particularly attractive to investors, as did the sensitivity of convertibles to price movements in the underlying equities. On the supply side, corporate America continued to access the convertible security marketplace to help repair debt-laden balance sheets built up during the recent financial market meltdown and subsequent recession.
Comments from Thomas Soviero, Portfolio Manager of Fidelity Advisor® Convertible Securities Fund: For the year, the fund's Class A, Class T, Class B and Class C shares returned 18.05%, 17.74%, 17.08% and 17.13%, respectively (excluding sales charges), straddling the BofA Merrill Lynch convertibles index. The fund benefited from strong security selection in energy, overweighting industrials - particularly transportation, although this advantage was offset somewhat by weak security selection here - and significantly underweighting health care. Conversely, poor picks in diversified financials hurt. In terms of individual issuers, contributors included oil and natural gas pipeline operator El Paso, coal producer Peabody Energy, fiber-optic products provider Finisar, circuit board manufacturer Merix - acquired by Viasystems Group during the period - and not owning oil rig operator Transocean and biotechnology company Amgen, two lagging index components. Individual detractors included Bank of America - a case of untimely ownership - Freeport-McMoRan Copper & Gold, an out-of-benchmark position in Tenet Healthcare, Inverness Medical Innovations - now known as Alere - and underweighting Ford Motor. The fund's modest cash position also held back performance. Some holdings I've mentioned were sold by period end.
Comments from Thomas Soviero, Portfolio Manager of Fidelity Advisor® Convertible Securities Fund: For the year, the fund's Institutional Class shares returned 18.34%, outperforming the BofA Merrill Lynch convertibles index. The fund benefited from strong security selection in energy, overweighting industrials - particularly transportation, although this advantage was offset somewhat by weak security selection here - and significantly underweighting health care. Conversely, poor picks in diversified financials hurt. In terms of individual issuers, contributors included oil and natural gas pipeline operator El Paso, coal producer Peabody Energy, fiber-optic products provider Finisar, circuit board manufacturer Merix - acquired by Viasystems Group during the period - and not owning oil rig operator Transocean and biotechnology company Amgen, two lagging index components. Individual detractors included Bank of America - a case of untimely ownership - Freeport-McMoRan Copper & Gold, an out-of-benchmark position in Tenet Healthcare, Inverness Medical Innovations - now known as Alere - and underweighting Ford Motor. The fund's modest cash position also held back performance. Some holdings I've mentioned were sold by period end.
Annual Report
The views expressed above reflect those of the portfolio manager(s) only through the end of the period as stated on the cover of this report and do not necessarily represent the views of Fidelity or any other person in the Fidelity organization. Any such views are subject to change at any time based upon market or other conditions and Fidelity disclaims any responsibility to update such views. These views may not be relied on as investment advice and, because investment decisions for a Fidelity fund are based on numerous factors, may not be relied on as an indication of trading intent on behalf of any Fidelity fund.
Annual Report
Shareholder Expense Example
As a shareholder of the Fund, you incur two types of costs: (1) transaction costs, including sales charges (loads) on purchase payments or redemption proceeds, and (2) ongoing costs, including management fees, distribution and/or service (12b-1) fees and other Fund expenses. This Example is intended to help you understand your ongoing costs (in dollars) of investing in the Fund and to compare these costs with the ongoing costs of investing in other mutual funds.
The Example is based on an investment of $1,000 invested at the beginning of the period and held for the entire period (June 1, 2010 to November 30, 2010).
Actual Expenses
The first line of the accompanying table for each class of the Fund provides information about actual account values and actual expenses. You may use the information in this line, together with the amount you invested, to estimate the expenses that you paid over the period. Simply divide your account value by $1,000.00 (for example, an $8,600 account value divided by $1,000.00 = 8.6), then multiply the result by the number in the first line for a class of the Fund under the heading entitled "Expenses Paid During Period" to estimate the expenses you paid on your account during this period. A small balance maintenance fee of $12.00 that is charged once a year may apply for certain accounts with a value of less than $2,000. This fee is not included in the table below. If it was, the estimate of expenses you paid during the period would be higher, and your ending account value lower, by this amount. In addition, the Fund, as a shareholder in the underlying Fidelity Central Funds, will indirectly bear its pro-rata share of the fees and expenses incurred by the underlying Fidelity Central Funds. These fees and expenses are not included in the Fund's annualized expense ratio used to calculate the expense estimate in the table below.
Hypothetical Example for Comparison Purposes
The second line of the accompanying table for each class of the Fund provides information about hypothetical account values and hypothetical expenses based on a Class' actual expense ratio and an assumed rate of return of 5% per year before expenses, which is not the Class' actual return. The hypothetical account values and expenses may not be used to estimate the actual ending account balance or expenses you paid for the period. You may use this information to compare the ongoing costs of investing in the Fund and other funds. To do so, compare this 5% hypothetical example with the 5% hypothetical examples that appear in the shareholder reports of the other funds. A small balance maintenance fee of $12.00 that is charged once a year may apply for certain accounts with a value of less than $2,000. This fee is not included in the table below. If it was, the estimate of expenses you paid during the period would be higher, and your ending account value lower, by this amount. In addition, the Fund, as a shareholder in the underlying Fidelity Central Funds, will indirectly bear its pro-rata share of the fees and expenses incurred by the underlying Fidelity Central Funds. These fees and expenses are not included in the Fund's annualized expense ratio used to calculate the expense estimate in the table below.
Please note that the expenses shown in the table are meant to highlight your ongoing costs only and do not reflect any transaction costs. Therefore, the second line of the table is useful in comparing ongoing costs only, and will not help you determine the relative total costs of owning different funds. In addition, if these transactional costs were included, your costs would have been higher.
Annual Report
| Annualized | Beginning | Ending | Expenses Paid |
Class A | .84% |
|
|
|
Actual |
| $ 1,000.00 | $ 1,105.20 | $ 4.43 |
HypotheticalA |
| $ 1,000.00 | $ 1,020.86 | $ 4.26 |
Class T | 1.06% |
|
|
|
Actual |
| $ 1,000.00 | $ 1,104.30 | $ 5.59 |
HypotheticalA |
| $ 1,000.00 | $ 1,019.75 | $ 5.37 |
Class B | 1.65% |
|
|
|
Actual |
| $ 1,000.00 | $ 1,101.00 | $ 8.69 |
HypotheticalA |
| $ 1,000.00 | $ 1,016.80 | $ 8.34 |
Class C | 1.62% |
|
|
|
Actual |
| $ 1,000.00 | $ 1,101.30 | $ 8.53 |
HypotheticalA |
| $ 1,000.00 | $ 1,016.95 | $ 8.19 |
Convertible Securities | .51% |
|
|
|
Actual |
| $ 1,000.00 | $ 1,107.30 | $ 2.69 |
HypotheticalA |
| $ 1,000.00 | $ 1,022.51 | $ 2.59 |
Institutional Class | .56% |
|
|
|
Actual |
| $ 1,000.00 | $ 1,106.90 | $ 2.96 |
HypotheticalA |
| $ 1,000.00 | $ 1,022.26 | $ 2.84 |
A 5% return per year before expenses
* Expenses are equal to each Class' annualized expense ratio, multiplied by the average account value over the period, multiplied by 183/365 (to reflect the one-half year period).
Annual Report
Investment Changes (Unaudited)
Top Ten Investments as of November 30, 2010 | ||
(excluding cash equivalents) | % of fund's | % of fund's net assets |
Peabody Energy Corp. 4.75% 12/15/66 | 6.6 | 4.6 |
El Paso Corp. 4.99% | 6.0 | 5.1 |
Wells Fargo & Co. 7.50% | 5.1 | 4.9 |
Ford Motor Co. 4.25% 11/15/16 | 3.3 | 2.4 |
General Motors Co. 4.75% | 3.0 | 0.0 |
Intel Corp. 3.25% 8/1/39 | 3.0 | 3.0 |
Celanese Corp. Class A | 2.3 | 3.7 |
Chesapeake Energy Corp. 2.5% 5/15/37 | 2.3 | 2.4 |
Hertz Global Holdings, Inc. 5.25% 6/1/14 | 2.0 | 1.9 |
Bank of America Corp. Series L, 7.25% | 1.9 | 1.9 |
| 35.5 | |
Top Five Market Sectors as of November 30, 2010 | ||
| % of fund's | % of fund's net assets |
Energy | 23.4 | 19.2 |
Information Technology | 17.9 | 17.5 |
Financials | 13.3 | 16.7 |
Industrials | 13.1 | 11.8 |
Consumer Discretionary | 13.0 | 10.6 |
Asset Allocation (% of fund's net assets) | |||||||
As of November 30, 2010 * | As of May 31, 2010** | ||||||
| Convertible |
| | Convertible |
| ||
| Stocks 9.6% |
| | Stocks 14.0% |
| ||
| Nonconvertible |
| | Nonconvertible |
| ||
| Short-Term |
| | Short-Term |
| ||
| Floating Rate Loans 0.0% |
| | Floating Rate Loans 0.4% |
| ||
* Foreign investments | 4.2% |
| ** Foreign investments | 3.5% |
| ||

Annual Report
Investments November 30, 2010
Showing Percentage of Net Assets
Corporate Bonds - 64.2% | ||||
| Principal | Value (000s) | ||
Convertible Bonds - 64.1% | ||||
CONSUMER DISCRETIONARY - 6.3% | ||||
Auto Components - 0.1% | ||||
BorgWarner, Inc. 3.5% 4/15/12 | $ 910 | $ 1,714 | ||
Automobiles - 3.3% | ||||
Ford Motor Co. 4.25% 11/15/16 | 40,000 | 77,152 | ||
Diversified Consumer Services - 0.6% | ||||
Ingersoll-Rand Global Holding Co. Ltd. 4.5% 4/15/12 | 490 | 1,132 | ||
Regis Corp. 5% 7/15/14 | 2,230 | 2,983 | ||
Stewart Enterprises, Inc. 3.375% 7/15/16 (g) | 11,000 | 9,989 | ||
| 14,104 | |||
Hotels, Restaurants & Leisure - 0.5% | ||||
MGM Mirage, Inc. 4.25% 4/15/15 (g) | 12,300 | 12,192 | ||
Media - 1.0% | ||||
Virgin Media, Inc. 6.5% 11/15/16 | 8,000 | 12,630 | ||
XM Satellite Radio, Inc. 7% 12/1/14 (g) | 10,000 | 11,381 | ||
| 24,011 | |||
Specialty Retail - 0.8% | ||||
Asbury Automotive Group, Inc. 3% 9/15/12 (g) | 3,000 | 2,936 | ||
Charming Shoppes, Inc. 1.125% 5/1/14 | 10,000 | 8,388 | ||
Sonic Automotive, Inc. 5% 10/1/29 | 1,180 | 1,403 | ||
United Auto Group, Inc. 3.5% 4/1/26 | 4,533 | 4,601 | ||
| 17,328 | |||
TOTAL CONSUMER DISCRETIONARY | 146,501 | |||
CONSUMER STAPLES - 2.3% | ||||
Beverages - 0.7% | ||||
Molson Coors Brewing Co. 2.5% 7/30/13 | 14,000 | 15,739 | ||
Food & Staples Retailing - 0.6% | ||||
The Pantry, Inc. 3% 11/15/12 | 14,000 | 13,624 | ||
Food Products - 1.0% | ||||
Smithfield Foods, Inc. 4% 6/30/13 | 22,250 | 24,257 | ||
TOTAL CONSUMER STAPLES | 53,620 | |||
ENERGY - 16.2% | ||||
Energy Equipment & Services - 1.9% | ||||
Exterran Holdings, Inc. 4.25% 6/15/14 | 10,000 | 12,136 | ||
Global Industries Ltd. 2.75% 8/1/27 (g) | 10,000 | 7,400 | ||
Corporate Bonds - continued | ||||
| Principal | Value (000s) | ||
Convertible Bonds - continued | ||||
ENERGY - continued | ||||
Energy Equipment & Services - continued | ||||
Hornbeck Offshore Services, Inc. 1.625% 11/15/26 (d)(g) | $ 5,000 | $ 4,558 | ||
Newpark Resources, Inc. 4% 10/1/17 | 4,500 | 4,002 | ||
Oil States International, Inc. 2.375% 7/1/25 (g) | 4,500 | 8,565 | ||
SESI LLC 1.5% 12/15/26 (d)(g) | 7,000 | 6,948 | ||
| 43,609 | |||
Oil, Gas & Consumable Fuels - 14.3% | ||||
Alpha Natural Resources, Inc. 2.375% 4/15/15 | 35,000 | 42,669 | ||
Chesapeake Energy Corp. 2.5% 5/15/37 | 62,750 | 52,321 | ||
Goodrich Petroleum Corp. 3.25% 12/1/26 | 6,000 | 5,865 | ||
International Coal Group, Inc. 4% 4/1/17 | 2,160 | 3,168 | ||
Massey Energy Co. 3.25% 8/1/15 | 5,000 | 4,872 | ||
Peabody Energy Corp. 4.75% 12/15/66 | 122,250 | 152,657 | ||
Pioneer Natural Resources Co. 2.875% 1/15/38 | 20,000 | 28,350 | ||
Quicksilver Resources, Inc. 1.875% 11/1/24 (g) | 14,500 | 15,648 | ||
Western Refining, Inc. 5.75% 6/15/14 | 24,185 | 27,614 | ||
| 333,164 | |||
TOTAL ENERGY | 376,773 | |||
FINANCIALS - 0.9% | ||||
Diversified Financial Services - 0.9% | ||||
The NASDAQ Stock Market, Inc. 2.5% 8/15/13 | 20,000 | 19,826 | ||
HEALTH CARE - 5.0% | ||||
Health Care Equipment & Supplies - 2.4% | ||||
Alere, Inc. 3% 5/15/16 | 31,000 | 30,729 | ||
Kinetic Concepts, Inc. 3.25% 4/15/15 (g) | 15,000 | 15,593 | ||
SonoSite, Inc. 3.75% 7/15/14 | 7,000 | 7,533 | ||
Volcano Corp. 2.875% 9/1/15 | 1,890 | 2,151 | ||
| 56,006 | |||
Health Care Providers & Services - 0.3% | ||||
Omnicare, Inc. 3.25% 12/15/35 | 7,000 | 6,510 | ||
Life Sciences Tools & Services - 0.2% | ||||
Charles River Laboratories International, Inc. 2.25% 6/15/13 (g) | 4,000 | 3,930 | ||
Pharmaceuticals - 2.1% | ||||
Biovail Corp. 5.375% 8/1/14 | 10,000 | 19,256 | ||
Corporate Bonds - continued | ||||
| Principal | Value (000s) | ||
Convertible Bonds - continued | ||||
HEALTH CARE - continued | ||||
Pharmaceuticals - continued | ||||
Nektar Therapeutics 3.25% 9/28/12 | $ 9,000 | $ 8,764 | ||
Valeant Pharmaceuticals International 4% 11/15/13 | 10,000 | 20,488 | ||
| 48,508 | |||
TOTAL HEALTH CARE | 114,954 | |||
INDUSTRIALS - 13.1% | ||||
Aerospace & Defense - 0.9% | ||||
Alliant Techsystems, Inc. 2.75% 9/15/11 | 14,000 | 14,210 | ||
GenCorp, Inc. 4.0625% 12/31/39 (g) | 7,830 | 7,125 | ||
| 21,335 | |||
Airlines - 4.3% | ||||
AMR Corp. 6.25% 10/15/14 | 17,990 | 21,671 | ||
Continental Airlines, Inc. 4.5% 1/15/15 | 9,280 | 15,335 | ||
UAL Corp.: | ||||
4.5% 6/30/21 (g) | 10,500 | 11,106 | ||
4.5% 6/30/21 | 5,000 | 5,289 | ||
6% 10/15/29 | 3,600 | 12,094 | ||
US Airways Group, Inc. 7% 9/30/20 (g) | 4,810 | 4,810 | ||
US Airways Group, Inc. 7.25% 5/15/14 | 11,200 | 29,605 | ||
| 99,910 | |||
Commercial Services & Supplies - 1.3% | ||||
Metalico, Inc. 7% 4/30/28 | 34,000 | 30,600 | ||
Construction & Engineering - 0.4% | ||||
MasTec, Inc. 4.25% 12/15/14 (g) | 8,000 | 9,480 | ||
Electrical Equipment - 0.7% | ||||
General Cable Corp. 4.5% 11/15/29 (d) | 14,800 | 16,814 | ||
Industrial Conglomerates - 0.1% | ||||
Textron, Inc. 4.5% 5/1/13 | 1,440 | 2,609 | ||
Machinery - 2.2% | ||||
Greenbrier Companies, Inc.: | ||||
2.375% 5/15/26 (g) | 5,500 | 4,985 | ||
2.375% 5/15/26 | 8,000 | 7,250 | ||
Terex Corp. 4% 6/1/15 | 14,590 | 24,310 | ||
Trinity Industries, Inc. 3.875% 6/1/36 | 15,000 | 14,025 | ||
| 50,570 | |||
Corporate Bonds - continued | ||||
| Principal | Value (000s) | ||
Convertible Bonds - continued | ||||
INDUSTRIALS - continued | ||||
Marine - 1.1% | ||||
Excel Maritime Carriers Ltd. 1.875% 10/15/27 (g) | $ 34,000 | $ 25,500 | ||
Road & Rail - 2.0% | ||||
Hertz Global Holdings, Inc. 5.25% 6/1/14 | 28,000 | 46,427 | ||
Trading Companies & Distributors - 0.1% | ||||
United Rentals, Inc. 4% 11/15/15 | 960 | 1,855 | ||
TOTAL INDUSTRIALS | 305,100 | |||
INFORMATION TECHNOLOGY - 15.7% | ||||
Communications Equipment - 1.9% | ||||
CommScope, Inc. 3.25% 7/1/15 | 10,000 | 13,140 | ||
Finisar Corp. 5% 10/15/29 (g) | 2,500 | 4,919 | ||
JDS Uniphase Corp. 1% 5/15/26 (g) | 14,000 | 13,195 | ||
L-3 Communications Corp. 3% 8/1/35 | 3,000 | 3,015 | ||
Lucent Technologies, Inc. 2.875% 6/15/25 | 10,000 | 9,494 | ||
| 43,763 | |||
Computers & Peripherals - 1.2% | ||||
EMC Corp. 1.75% 12/1/13 (g) | 17,000 | 24,384 | ||
Hutchinson Technology, Inc. 3.25% 1/15/26 | 5,000 | 3,431 | ||
| 27,815 | |||
Electronic Equipment & Components - 1.5% | ||||
Anixter International, Inc. 1% 2/15/13 (g) | 4,540 | 4,951 | ||
Itron, Inc. 2.5% 8/1/26 | 5,000 | 5,319 | ||
Newport Corp. 2.5% 2/15/12 (g) | 3,750 | 3,841 | ||
SYNNEX Corp. 4% 5/15/18 (g) | 10,000 | 11,725 | ||
Vishay Intertechnology, Inc. 2.25% 11/15/40 (g) | 7,000 | 8,002 | ||
| 33,838 | |||
Internet Software & Services - 0.9% | ||||
Equinix, Inc. 3% 10/15/14 | 10,000 | 9,759 | ||
VeriSign, Inc. 3.25% 8/15/37 | 10,000 | 11,419 | ||
| 21,178 | |||
IT Services - 1.8% | ||||
Alliance Data Systems Corp. 4.75% 5/15/14 | 10,200 | 15,326 | ||
CACI International, Inc. 2.125% 5/1/14 | 6,000 | 6,645 | ||
DST Systems, Inc. 4.125% 8/15/23 | 8,100 | 9,052 | ||
Telvent GIT SA 5.5% 4/15/15 (g) | 10,000 | 10,363 | ||
| 41,386 | |||
Corporate Bonds - continued | ||||
| Principal | Value (000s) | ||
Convertible Bonds - continued | ||||
INFORMATION TECHNOLOGY - continued | ||||
Semiconductors & Semiconductor Equipment - 8.0% | ||||
Advanced Micro Devices, Inc. 6% 5/1/15 | $ 11,916 | $ 11,884 | ||
Amkor Technology, Inc. 6% 4/15/14 | 10,890 | 26,596 | ||
Evergreen Solar, Inc. 4% 7/15/13 | 4,000 | 1,740 | ||
Intel Corp. 3.25% 8/1/39 (g) | 58,000 | 70,574 | ||
Micron Technology, Inc. 4.25% 10/15/13 | 6,130 | 9,938 | ||
ON Semiconductor Corp.: | ||||
1.875% 12/15/25 (g) | 3,750 | 4,854 | ||
2.625% 12/15/26 | 35,330 | 37,759 | ||
PMC-Sierra, Inc. 2.25% 10/15/25 | 10,000 | 10,831 | ||
SunPower Corp. 4.75% 4/15/14 | 2,020 | 1,773 | ||
Xilinx, Inc. 3.125% 3/15/37 | 10,000 | 9,914 | ||
| 185,863 | |||
Software - 0.4% | ||||
Nuance Communications, Inc. 2.75% 8/15/27 | 9,085 | 10,425 | ||
TOTAL INFORMATION TECHNOLOGY | 364,268 | |||
MATERIALS - 2.6% | ||||
Chemicals - 1.2% | ||||
Ferro Corp. 6.5% 8/15/13 | 27,000 | 28,856 | ||
Containers & Packaging - 0.2% | ||||
Owens-Brockway Glass Container, Inc. 3% 6/1/15 (g) | 5,010 | 4,901 | ||
Metals & Mining - 1.2% | ||||
Alcoa, Inc. 5.25% 3/15/14 | 5,000 | 10,819 | ||
ArcelorMittal SA 5% 5/15/14 | 2,170 | 2,795 | ||
Goldcorp, Inc. 2% 8/1/14 | 5,000 | 6,100 | ||
Newmont Mining Corp. 1.625% 7/15/17 | 5,000 | 7,038 | ||
| 26,752 | |||
TOTAL MATERIALS | 60,509 | |||
TELECOMMUNICATION SERVICES - 2.0% | ||||
Diversified Telecommunication Services - 0.7% | ||||
Level 3 Communications, Inc. 7% 3/15/15 | 10,000 | 9,488 | ||
Time Warner Telecom, Inc. 2.375% 4/1/26 | 6,000 | 6,510 | ||
| 15,998 | |||
Corporate Bonds - continued | ||||
| Principal | Value (000s) | ||
Convertible Bonds - continued | ||||
TELECOMMUNICATION SERVICES - continued | ||||
Wireless Telecommunication Services - 1.3% | ||||
Leap Wireless International, Inc. 4.5% 7/15/14 | $ 33,000 | $ 29,825 | ||
TOTAL TELECOMMUNICATION SERVICES | 45,823 | |||
TOTAL CONVERTIBLE BONDS | 1,487,374 | |||
Nonconvertible Bonds - 0.1% | ||||
CONSUMER DISCRETIONARY - 0.1% | ||||
Hotels, Restaurants & Leisure - 0.1% | ||||
Ambassadors International, Inc. 10% 1/15/12 pay-in-kind (g) | 2,392 | 1,794 | ||
TOTAL CORPORATE BONDS (Cost $1,320,655) | 1,489,168 | |||
Common Stocks - 9.6% | |||
Shares |
| ||
CONSUMER DISCRETIONARY - 1.0% | |||
Auto Components - 0.6% | |||
Johnson Controls, Inc. | 344,134 | 12,540 | |
Diversified Consumer Services - 0.4% | |||
Service Corp. International | 1,143,000 | 9,213 | |
Hotels, Restaurants & Leisure - 0.0% | |||
Ambassadors International, Inc. (a)(f) | 230,377 | 389 | |
Media - 0.0% | |||
HMH Holdings, Inc. (a)(h) | 52,880 | 304 | |
HMH Holdings, Inc. warrants 3/9/17 (a) | 164,823 | 82 | |
| 386 | ||
TOTAL CONSUMER DISCRETIONARY | 22,528 | ||
ENERGY - 0.3% | |||
Oil, Gas & Consumable Fuels - 0.3% | |||
McMoRan Exploration Co. (a)(e) | 450,000 | 6,719 | |
Common Stocks - continued | |||
Shares | Value (000s) | ||
FINANCIALS - 3.8% | |||
Commercial Banks - 3.1% | |||
Huntington Bancshares, Inc. | 5,820,500 | $ 33,963 | |
KeyCorp | 5,014,100 | 37,756 | |
| 71,719 | ||
Diversified Financial Services - 0.7% | |||
Bank of America Corp. | 1,484,085 | 16,251 | |
TOTAL FINANCIALS | 87,970 | ||
INFORMATION TECHNOLOGY - 2.2% | |||
Communications Equipment - 0.8% | |||
Finisar Corp. (a)(e) | 974,120 | 18,625 | |
Electronic Equipment & Components - 0.4% | |||
Viasystems Group, Inc. (a) | 549,643 | 9,536 | |
Semiconductors & Semiconductor Equipment - 1.0% | |||
Amkor Technology, Inc. (a)(e) | 843,200 | 5,869 | |
ON Semiconductor Corp. (a) | 2,169,500 | 17,692 | |
| 23,561 | ||
TOTAL INFORMATION TECHNOLOGY | 51,722 | ||
MATERIALS - 2.3% | |||
Chemicals - 2.3% | |||
Celanese Corp. Class A | 1,469,230 | 54,362 | |
TOTAL COMMON STOCKS (Cost $191,939) | 223,301 | ||
Convertible Preferred Stocks - 24.6% | |||
|
|
|
|
CONSUMER DISCRETIONARY - 5.6% | |||
Automobiles - 4.0% | |||
Ford Motor Co. Capital Trust II 6.50% | 450,000 | 23,135 | |
General Motors Co. 4.75% (a) | 1,400,000 | 70,980 | |
| 94,115 | ||
Household Durables - 0.1% | |||
Stanley Black & Decker, Inc. 4.75% (a) | 13,500 | 1,377 | |
Leisure Equipment & Products - 0.5% | |||
Callaway Golf Co. 7.50% | 100,000 | 12,563 | |
Convertible Preferred Stocks - continued | |||
Shares | Value (000s) | ||
CONSUMER DISCRETIONARY - continued | |||
Media - 1.0% | |||
Interpublic Group of Companies, Inc. 5.25% | 10,000 | $ 10,037 | |
LodgeNet Entertainment Corp. 10.00% (g) | 11,118 | 12,287 | |
| 22,324 | ||
TOTAL CONSUMER DISCRETIONARY | 130,379 | ||
CONSUMER STAPLES - 2.1% | |||
Food Products - 2.1% | |||
Archer Daniels Midland Co. 6.25% | 600,000 | 22,608 | |
Bunge Ltd.: | |||
4.875% | 237,000 | 21,078 | |
5.125% | 10,000 | 5,869 | |
| 49,555 | ||
ENERGY - 6.9% | |||
Oil, Gas & Consumable Fuels - 6.9% | |||
Apache Corp. 6.00% | 94,200 | 5,713 | |
El Paso Corp.: | |||
4.99% (g) | 119,290 | 139,023 | |
4.99% | 10,000 | 11,654 | |
Goodrich Petroleum Corp. 5.375% | 100,000 | 3,169 | |
| 159,559 | ||
FINANCIALS - 8.6% | |||
Commercial Banks - 5.2% | |||
Huntington Bancshares, Inc. 8.50% | 2,100 | 2,258 | |
Wells Fargo & Co. 7.50% | 120,550 | 118,994 | |
| 121,252 | ||
Diversified Financial Services - 3.1% | |||
Bank of America Corp. Series L, 7.25% | 47,085 | 43,789 | |
Citigroup, Inc. 7.50% | 215,400 | 26,925 | |
| 70,714 | ||
Insurance - 0.3% | |||
Assured Guaranty Ltd. 8.50% | 100,000 | 7,114 | |
TOTAL FINANCIALS | 199,080 | ||
Convertible Preferred Stocks - continued | |||
Shares | Value (000s) | ||
HEALTH CARE - 1.4% | |||
Health Care Providers & Services - 1.4% | |||
Tenet Healthcare Corp. 7.00% | 40,000 | $ 31,708 | |
TOTAL CONVERTIBLE PREFERRED STOCKS (Cost $571,865) | 570,281 | ||
Money Market Funds - 2.2% | |||
|
|
|
|
Fidelity Cash Central Fund, 0.24% (b) | 33,967,973 | 33,968 | |
Fidelity Securities Lending Cash Central Fund, 0.25% (b)(c) | 18,147,250 | 18,147 | |
TOTAL MONEY MARKET FUNDS (Cost $52,115) | 52,115 | ||
TOTAL INVESTMENT PORTFOLIO - 100.6% (Cost $2,136,574) | 2,334,865 | ||
NET OTHER ASSETS (LIABILITIES) - (0.6)% | (13,582) | ||
NET ASSETS - 100% | $ 2,321,283 | ||
Legend |
(a) Non-income producing |
(b) Affiliated fund that is available only to investment companies and other accounts managed by Fidelity Investments. The rate quoted is the annualized seven-day yield of the fund at period end. A complete unaudited listing of the fund's holdings as of its most recent quarter end is available upon request. In addition, each Fidelity Central Fund's financial statements, which are not covered by the Fund's Report of Independent Registered Public Accounting Firm, are available on the SEC's website or upon request. |
(c) Investment made with cash collateral received from securities on loan. |
(d) Security initially issued at one coupon which converts to a higher coupon at a specified date. The rate shown is the rate at period end. |
(e) Security or a portion of the security is on loan at period end. |
(f) Affiliated company |
(g) Security exempt from registration under Rule 144A of the Securities Act of 1933. These securities may be resold in transactions exempt from registration, normally to qualified institutional buyers. At the end of the period, the value of these securities amounted to $476,959,000 or 20.5% of net assets. |
(h) Restricted securities - Investment in securities not registered under the Securities Act of 1933 (excluding 144A issues). At the end of the period, the value of restricted securities (excluding 144A issues) amounted to $304,000 or 0.0% of net assets. |
Additional information on each holding is as follows: |
Security | Acquisition | Acquisition |
HMH Holdings, Inc. | 8/1/08 - 12/31/09 | $ 6,902 |
Affiliated Central Funds |
Information regarding fiscal year to date income earned by the Fund from investments in Fidelity Central Funds is as follows: |
Fund | Income earned |
Fidelity Cash Central Fund | $ 190 |
Fidelity Securities Lending Cash Central Fund | 53 |
Total | $ 243 |
Other Affiliated Issuers |
An affiliated company is a company in which the Fund has ownership of at least 5% of the voting securities. Fiscal year to date transactions with companies which are or were affiliates are as follows: |
Affiliate | Value, | Purchases | Sales | Dividend | Value, |
Ambassadors International, Inc. | $ 758 | $ - | $ - | $ - | $ 389 |
Total | $ 758 | $ - | $ - | $ - | $ 389 |
Other Information |
The following is a summary of the inputs used, as of November 30, 2010, involving the Fund's assets and liabilities carried at fair value. The inputs or methodology used for valuing securities may not be an indication of the risk associated with investing in those securities. For more information on valuation inputs, and their aggregation into the levels used in the tables below, please refer to the Security Valuation section in the accompanying Notes to Financial Statements. |
Valuation Inputs at Reporting Date: | ||||
Description | Total | Level 1 | Level 2 | Level 3 |
Investments in Securities: | ||||
Equities: | ||||
Consumer Discretionary | $ 152,907 | $ 93,122 | $ 59,703 | $ 82 |
Consumer Staples | 49,555 | - | 49,555 | - |
Energy | 166,278 | 12,432 | 153,846 | - |
Financials | 287,050 | 253,011 | 34,039 | - |
Health Care | 31,708 | - | 31,708 | - |
Information Technology | 51,722 | 51,722 | - | - |
Materials | 54,362 | 54,362 | - | - |
Corporate Bonds | 1,489,168 | - | 1,487,374 | 1,794 |
Money Market Funds | 52,115 | 52,115 | - | - |
Total Investments in Securities: | $ 2,334,865 | $ 516,764 | $ 1,816,225 | $ 1,876 |
The following is a reconciliation of Investments in Securities for which Level 3 inputs were used in determining value: |
(Amounts in thousands) |
|
Investments in Securities: | |
Beginning Balance | $ 3,577 |
Total Realized Gain (Loss) | 6,233 |
Total Unrealized Gain (Loss) | 544 |
Cost of Purchases | 289 |
Proceeds of Sales | (9,558) |
Amortization/Accretion | 791 |
Transfers in to Level 3 | - |
Transfers out of Level 3 | - |
Ending Balance | $ 1,876 |
The change in unrealized gain (loss) for the period attributable to Level 3 securities held at November 30, 2010 | $ (598) |
The information used in the above reconciliation represents fiscal year to date activity for any Investments in Securities identified as using Level 3 inputs at either the beginning or the end of the current fiscal period. Transfers in or out of Level 3 represent the beginning value of any Security or Instrument where a change in the pricing level occurred from the beginning to the end of the period. The cost of purchases and the proceeds of sales may include securities received or delivered through corporate actions or exchanges. Realized and unrealized gains (losses) disclosed in the reconciliation are included in Net Gain (Loss) on the Fund's Statement of Operations. |
The composition of credit quality ratings as a percentage of net assets is as follows (Unaudited): |
AAA,AA,A | 4.1% |
BBB | 2.8% |
BB | 19.5% |
B | 12.9% |
CCC,CC,C | 11.7% |
Not Rated | 13.2% |
Equities | 34.2% |
Short-Term Investments and Net Other Assets | 1.6% |
| 100.0% |
We have used ratings from Moody's Investors Service, Inc. Where Moody's® ratings are not available, we have used S&P® ratings. All ratings are as of the report date and do not reflect subsequent changes. |
Income Tax Information |
At November 30, 2010, the Fund had a capital loss carryforward of approximately $298,128,000 all of which will expire in fiscal 2017. Capital loss carryforwards are only available to offset future capital gains of the Fund to the extent provided by regulations and may be limited. |
See accompanying notes which are an integral part of the financial statements.
Annual Report
Financial Statements
Statement of Assets and Liabilities
Amounts in thousands (except per-share amounts) | November 30, 2010 | |
|
|
|
Assets | ||
Investment in securities, at value (including securities loaned of $17,073) - See accompanying schedule: Unaffiliated issuers (cost $2,079,819) | $ 2,282,361 |
|
Fidelity Central Funds (cost $52,115) | 52,115 |
|
Other affiliated issuers (cost $4,640) | 389 |
|
Total Investments (cost $2,136,574) |
| $ 2,334,865 |
Receivable for investments sold | 6,386 | |
Receivable for fund shares sold | 2,050 | |
Dividends receivable | 3,557 | |
Interest receivable | 12,938 | |
Distributions receivable from Fidelity Central Funds | 18 | |
Prepaid expenses | 8 | |
Other receivables | 35 | |
Total assets | 2,359,857 | |
|
|
|
Liabilities | ||
Payable for fund shares redeemed | 19,320 | |
Accrued management fee | 608 | |
Distribution and service plan fees payable | 10 | |
Other affiliated payables | 424 | |
Other payables and accrued expenses | 65 | |
Collateral on securities loaned, at value | 18,147 | |
Total liabilities | 38,574 | |
|
|
|
Net Assets | $ 2,321,283 | |
Net Assets consist of: |
| |
Paid in capital | $ 2,398,529 | |
Undistributed net investment income | 26,134 | |
Accumulated undistributed net realized gain (loss) on investments | (301,671) | |
Net unrealized appreciation (depreciation) on investments and assets and liabilities in foreign currencies | 198,291 | |
Net Assets | $ 2,321,283 | |
See accompanying notes which are an integral part of the financial statements.
Annual Report
Financial Statements - continued
Statement of Assets and Liabilities - continued
Amounts in thousands (except per-share amounts) | November 30, 2010 | |
|
|
|
Calculation of Maximum Offering Price Class A: | $ 24.22 | |
|
|
|
Maximum offering price per share (100/94.25 of $24.22) | $ 25.70 | |
Class T: | $ 24.23 | |
|
|
|
Maximum offering price per share (100/96.50 of $24.23) | $ 25.11 | |
Class B: | $ 24.17 | |
|
|
|
Class C: | $ 24.14 | |
|
|
|
Convertible Securities: | $ 24.29 | |
|
|
|
Institutional Class: | $ 24.27 | |
A Redemption price per share is equal to net asset value less any applicable contingent deferred sales charge.
See accompanying notes which are an integral part of the financial statements.
Annual Report
Statement of Operations
Amounts in thousands | Year ended November 30, 2010 | |
|
|
|
Investment Income |
|
|
Dividends |
| $ 36,443 |
Interest |
| 61,403 |
Income from Fidelity Central Funds |
| 243 |
Total income |
| 98,089 |
|
|
|
Expenses | ||
Management fee | $ 10,828 | |
Performance adjustment | (2,341) | |
Transfer agent fees | 4,380 | |
Distribution and service plan fees | 88 | |
Accounting and security lending fees | 720 | |
Custodian fees and expenses | 37 | |
Independent trustees' compensation | 14 | |
Registration fees | 134 | |
Audit | 76 | |
Legal | 25 | |
Miscellaneous | 39 | |
Total expenses before reductions | 14,000 | |
Expense reductions | (46) | 13,954 |
Net investment income (loss) | 84,135 | |
Realized and Unrealized Gain (Loss) Net realized gain (loss) on: | ||
Investment securities: |
|
|
Unaffiliated issuers | 77,313 | |
Capital gain distributions from Fidelity Central Funds | 1 |
|
Total net realized gain (loss) |
| 77,314 |
Change in net unrealized appreciation (depreciation) on investment securities | 227,214 | |
Net gain (loss) | 304,528 | |
Net increase (decrease) in net assets resulting from operations | $ 388,663 | |
See accompanying notes which are an integral part of the financial statements.
Annual Report
Financial Statements - continued
Statement of Changes in Net Assets
Amounts in thousands | Year ended | Year ended |
Increase (Decrease) in Net Assets |
|
|
Operations |
|
|
Net investment income (loss) | $ 84,135 | $ 101,950 |
Net realized gain (loss) | 77,314 | (232,140) |
Change in net unrealized appreciation (depreciation) | 227,214 | 1,040,568 |
Net increase (decrease) in net assets resulting | 388,663 | 910,378 |
Distributions to shareholders from net investment income | (87,526) | (103,307) |
Share transactions - net increase (decrease) | (332,532) | 106,423 |
Total increase (decrease) in net assets | (31,395) | 913,494 |
|
|
|
Net Assets | ||
Beginning of period | 2,352,678 | 1,439,184 |
End of period (including undistributed net investment income of $26,134 and undistributed net investment income of $29,835, respectively) | $ 2,321,283 | $ 2,352,678 |
See accompanying notes which are an integral part of the financial statements.
Annual Report
Financial Highlights - Class A
Years ended November 30, | 2010 | 2009 H |
Selected Per-Share Data |
|
|
Net asset value, beginning of period | $ 21.25 | $ 12.79 |
Income from Investment Operations |
|
|
Net investment income (loss) E | .75 | .58 |
Net realized and unrealized gain (loss) | 3.01 | 8.53 |
Total from investment operations | 3.76 | 9.11 |
Distributions from net investment income | (.79) | (.65) |
Net asset value, end of period | $ 24.22 | $ 21.25 |
Total Return B, C, D | 18.05% | 72.83% |
Ratios to Average Net Assets F, I |
|
|
Expenses before reductions | .87% | 1.04% A |
Expenses net of fee waivers, if any | .87% | 1.04% A |
Expenses net of all reductions | .87% | 1.04% A |
Net investment income (loss) | 3.29% | 3.70% A |
Supplemental Data |
|
|
Net assets, end of period (in millions) | $ 19 | $ 6 |
Portfolio turnover rate G | 28% | 31% |
A Annualized
B Total returns for periods of less than one year are not annualized.
C Total returns would have been lower had certain expenses not been reduced during the periods shown.
D Total returns do not include the effect of the sales charges.
E Calculated based on average shares outstanding during the period.
F Fees and expenses of the underlying Fidelity Central Funds are not included in the Fund's expense ratio. The Fund indirectly bears its proportionate share of the expenses of any underlying Fidelity Central Funds.
G Amount does not include the portfolio activity of any underlying Fidelity Central Funds.
H For the period February 19, 2009 (commencement of sale of shares) to November 30, 2009.
I Expense ratios reflect operating expenses of the class. Expenses before reductions do not reflect amounts reimbursed by the investment adviser or reductions from brokerage service arrangements or reductions from other expense offset arrangements and do not represent the amount paid by the class during periods when reimbursements or reductions occur. Expense ratios before reductions for start-up periods may not be representative of longer-term operating periods. Expenses net of fee waivers reflect expenses after reimbursement by the investment adviser but prior to reductions from brokerage service arrangements or other expense offset arrangements. Expenses net of all reductions represent the net expenses paid by the class.
See accompanying notes which are an integral part of the financial statements.
Annual Report
Financial Highlights - Class T
Years ended November 30, | 2010 | 2009 H |
Selected Per-Share Data |
|
|
Net asset value, beginning of period | $ 21.25 | $ 12.79 |
Income from Investment Operations |
|
|
Net investment income (loss) E | .69 | .57 |
Net realized and unrealized gain (loss) | 3.01 | 8.52 |
Total from investment operations | 3.70 | 9.09 |
Distributions from net investment income | (.72) | (.63) |
Net asset value, end of period | $ 24.23 | $ 21.25 |
Total Return B, C, D | 17.74% | 72.60% |
Ratios to Average Net Assets F, I |
|
|
Expenses before reductions | 1.13% | 1.25% A |
Expenses net of fee waivers, if any | 1.13% | 1.25% A |
Expenses net of all reductions | 1.13% | 1.25% A |
Net investment income (loss) | 3.03% | 3.83% A |
Supplemental Data |
|
|
Net assets, end of period (in millions) | $ 4 | $ 2 |
Portfolio turnover rate G | 28% | 31% |
A Annualized
B Total returns for periods of less than one year are not annualized.
C Total returns would have been lower had certain expenses not been reduced during the periods shown.
D Total returns do not include the effect of the sales charges.
E Calculated based on average shares outstanding during the period.
F Fees and expenses of the underlying Fidelity Central Funds are not included in the Fund's expense ratio. The Fund indirectly bears its proportionate share of the expenses of any underlying Fidelity Central Funds.
G Amount does not include the portfolio activity of any underlying Fidelity Central Funds.
H For the period February 19, 2009 (commencement of sale of shares) to November 30, 2009.
I Expense ratios reflect operating expenses of the class. Expenses before reductions do not reflect amounts reimbursed by the investment adviser or reductions from brokerage service arrangements or reductions from other expense offset arrangements and do not represent the amount paid by the class during periods when reimbursements or reductions occur. Expense ratios before reductions for start-up periods may not be representative of longer-term operating periods. Expenses net of fee waivers reflect expenses after reimbursement by the investment adviser but prior to reductions from brokerage service arrangements or other expense offset arrangements. Expenses net of all reductions represent the net expenses paid by the class.
See accompanying notes which are an integral part of the financial statements.
Annual Report
Financial Highlights - Class B
Years ended November 30, | 2010 | 2009 H |
Selected Per-Share Data |
|
|
Net asset value, beginning of period | $ 21.22 | $ 12.79 |
Income from Investment Operations |
|
|
Net investment income (loss) E | .56 | .50 |
Net realized and unrealized gain (loss) | 3.01 | 8.51 |
Total from investment operations | 3.57 | 9.01 |
Distributions from net investment income | (.62) | (.58) |
Net asset value, end of period | $ 24.17 | $ 21.22 |
Total Return B, C, D | 17.08% | 71.85% |
Ratios to Average Net Assets F, I |
|
|
Expenses before reductions | 1.69% | 1.78% A |
Expenses net of fee waivers, if any | 1.69% | 1.78% A |
Expenses net of all reductions | 1.69% | 1.78% A |
Net investment income (loss) | 2.47% | 3.41% A |
Supplemental Data |
|
|
Net assets, end of period (in millions) | $ 1 | $ 1 |
Portfolio turnover rate G | 28% | 31% |
A Annualized
B Total returns for periods of less than one year are not annualized.
C Total returns would have been lower had certain expenses not been reduced during the periods shown.
D Total returns do not include the effect of the contingent deferred sales charge.
E Calculated based on average shares outstanding during the period.
F Fees and expenses of the underlying Fidelity Central Funds are not included in the Fund's expense ratio. The Fund indirectly bears its proportionate share of the expenses of any underlying Fidelity Central Funds.
G Amount does not include the portfolio activity of any underlying Fidelity Central Funds.
H For the period February 19, 2009 (commencement of sale of shares) to November 30, 2009.
I Expense ratios reflect operating expenses of the class. Expenses before reductions do not reflect amounts reimbursed by the investment adviser or reductions from brokerage service arrangements or reductions from other expense offset arrangements and do not represent the amount paid by the class during periods when reimbursements or reductions occur. Expense ratios before reductions for start-up periods may not be representative of longer-term operating periods. Expenses net of fee waivers reflect expenses after reimbursement by the investment adviser but prior to reductions from brokerage service arrangements or other expense offset arrangements. Expenses net of all reductions represent the net expenses paid by the class.
See accompanying notes which are an integral part of the financial statements.
Annual Report
Financial Highlights - Class C
Years ended November 30, | 2010 | 2009 H |
Selected Per-Share Data |
|
|
Net asset value, beginning of period | $ 21.20 | $ 12.79 |
Income from Investment Operations |
|
|
Net investment income (loss) E | .56 | .47 |
Net realized and unrealized gain (loss) | 3.01 | 8.53 |
Total from investment operations | 3.57 | 9.00 |
Distributions from net investment income | (.63) | (.59) |
Net asset value, end of period | $ 24.14 | $ 21.20 |
Total Return B, C, D | 17.13% | 71.81% |
Ratios to Average Net Assets F, I |
|
|
Expenses before reductions | 1.66% | 1.80% A |
Expenses net of fee waivers, if any | 1.66% | 1.80% A |
Expenses net of all reductions | 1.66% | 1.80% A |
Net investment income (loss) | 2.50% | 3.17% A |
Supplemental Data |
|
|
Net assets, end of period (in millions) | $ 5 | $ 2 |
Portfolio turnover rate G | 28% | 31% |
A Annualized
B Total returns for periods of less than one year are not annualized.
C Total returns would have been lower had certain expenses not been reduced during the periods shown.
D Total returns do not include the effect of the contingent deferred sales charge.
E Calculated based on average shares outstanding during the period.
F Fees and expenses of the underlying Fidelity Central Funds are not included in the Fund's expense ratio. The Fund indirectly bears its proportionate share of the expenses of any underlying Fidelity Central Funds.
G Amount does not include the portfolio activity of any underlying Fidelity Central Funds.
H For the period February 19, 2009 (commencement of sale of shares) to November 30, 2009.
I Expense ratios reflect operating expenses of the class. Expenses before reductions do not reflect amounts reimbursed by the investment adviser or reductions from brokerage service arrangements or reductions from other expense offset arrangements and do not represent the amount paid by the class during periods when reimbursements or reductions occur. Expense ratios before reductions for start-up periods may not be representative of longer-term operating periods. Expenses net of fee waivers reflect expenses after reimbursement by the investment adviser but prior to reductions from brokerage service arrangements or other expense offset arrangements. Expenses net of all reductions represent the net expenses paid by the class.
See accompanying notes which are an integral part of the financial statements.
Annual Report
Financial Highlights - Convertible Securities
Years ended November 30, | 2010 | 2009 | 2008 | 2007 | 2006 |
Selected Per-Share Data |
|
|
|
| |
Net asset value, beginning of period | $ 21.30 | $ 13.55 | $ 28.71 | $ 25.21 | $ 22.14 |
Income from Investment Operations |
|
|
|
|
|
Net investment income (loss) B | .81 | .96 | .76 | .59 | .49 |
Net realized and unrealized gain (loss) | 3.02 | 7.78 | (14.43) | 3.43 | 3.09 |
Total from investment operations | 3.83 | 8.74 | (13.67) | 4.02 | 3.58 |
Distributions from net investment income | (.84) | (.99) | (.64) | (.50) | (.50) |
Distributions from net realized gain | - | - | (.85) | (.02) | (.01) |
Total distributions | (.84) | (.99) | (1.49) | (.52) | (.51) |
Net asset value, end of period | $ 24.29 | $ 21.30 | $ 13.55 | $ 28.71 | $ 25.21 |
Total Return A | 18.37% | 67.65% | (50.09)% | 16.02% | 16.38% |
Ratios to Average Net Assets C, E |
|
|
|
| |
Expenses before reductions | .59% | .70% | .78% | .79% | .83% |
Expenses net of fee waivers, if any | .59% | .69% | .78% | .79% | .83% |
Expenses net of all reductions | .59% | .69% | .78% | .79% | .83% |
Net investment income (loss) | 3.57% | 5.59% | 3.06% | 2.11% | 2.09% |
Supplemental Data |
|
|
|
| |
Net assets, end of period (in millions) | $ 2,287 | $ 2,340 | $ 1,439 | $ 2,919 | $ 2,083 |
Portfolio turnover rate D | 28% | 31% | 39% | 24% | 35% |
A Total returns would have been lower had certain expenses not been reduced during the periods shown.
B Calculated based on average shares outstanding during the period.
C Fees and expenses of the underlying Fidelity Central Funds are not included in the Fund's expense ratio. The Fund indirectly bears its proportionate share of the expenses of any underlying Fidelity Central Funds.
D Amount does not include the portfolio activity of any underlying Fidelity Central Funds.
E Expense ratios reflect operating expenses of the class. Expenses before reductions do not reflect amounts reimbursed by the investment adviser or reductions from brokerage service arrangements or reductions from other expense offset arrangements and do not represent the amount paid by the class during periods when reimbursements or reductions occur. Expenses net of fee waivers reflect expenses after reimbursement by the investment adviser but prior to reductions from brokerage service arrangements or other expense offset arrangements. Expenses net of all reductions represent the net expenses paid by the class.
See accompanying notes which are an integral part of the financial statements.
Annual Report
Financial Highlights - Institutional Class
Years ended November 30, | 2010 | 2009 G |
Selected Per-Share Data |
|
|
Net asset value, beginning of period | $ 21.29 | $ 12.79 |
Income from Investment Operations |
|
|
Net investment income (loss) D | .80 | .63 |
Net realized and unrealized gain (loss) | 3.02 | 8.54 |
Total from investment operations | 3.82 | 9.17 |
Distributions from net investment income | (.84) | (.67) |
Net asset value, end of period | $ 24.27 | $ 21.29 |
Total Return B, C | 18.34% | 73.31% |
Ratios to Average Net Assets E, H |
|
|
Expenses before reductions | .60% | .73% A |
Expenses net of fee waivers, if any | .60% | .73% A |
Expenses net of all reductions | .60% | .73% A |
Net investment income (loss) | 3.56% | 4.19% A |
Supplemental Data |
|
|
Net assets, end of period (in millions) | $ 6 | $ 3 |
Portfolio turnover rate F | 28% | 31% |
A Annualized
B Total returns for periods of less than one year are not annualized.
C Total returns would have been lower had certain expenses not been reduced during the periods shown.
D Calculated based on average shares outstanding during the period.
E Fees and expenses of the underlying Fidelity Central Funds are not included in the Fund's expense ratio. The Fund indirectly bears its proportionate share of the expenses of any underlying Fidelity Central Funds.
F Amount does not include the portfolio activity of any underlying Fidelity Central Funds.
G For the period February 19, 2009 (commencement of sale of shares) to November 30, 2009.
H Expense ratios reflect operating expenses of the class. Expenses before reductions do not reflect amounts reimbursed by the investment adviser or reductions from brokerage service arrangements or reductions from other expense offset arrangements and do not represent the amount paid by the class during periods when reimbursements or reductions occur. Expense ratios before reductions for start-up periods may not be representative of longer-term operating periods. Expenses net of fee waivers reflect expenses after reimbursement by the investment adviser but prior to reductions from brokerage service arrangements or other expense offset arrangements. Expenses net of all reductions represent the net expenses paid by the class.
See accompanying notes which are an integral part of the financial statements.
Annual Report
Notes to Financial Statements
For the period ended November 30, 2010
(Amounts in thousands except ratios)
1. Organization.
Fidelity Convertible Securities Fund (the Fund) is a fund of Fidelity Financial Trust (the Trust) and is authorized to issue an unlimited number of shares. The Trust is registered under the Investment Company Act of 1940, as amended (the 1940 Act), as an open-end management investment company organized as a Massachusetts business trust. The Fund offers Class A, Class T, Class C, Convertible Securities and Institutional Class shares, each of which, along with Class B shares, has equal rights as to assets and voting privileges. Effective after the close of business on September 1, 2010, Class B shares were closed to new accounts and additional purchases by existing shareholders. Each class has exclusive voting rights with respect to matters that affect that class. Class B shares will automatically convert to Class A shares after a holding period of seven years from the initial date of purchase. Investment income, realized and unrealized capital gains and losses, the common expenses of the Fund, and certain fund-level expense reductions, if any, are allocated on a pro-rata basis to each class based on the relative net assets of each class to the total net assets of the Fund. Each class differs with respect to transfer agent and distribution and service plan fees incurred. Certain expense reductions also differ by class.
2. Investments in Fidelity Central Funds.
The Fund may invest in Fidelity Central Funds, which are open-end investment companies available only to other investment companies and accounts managed by Fidelity Management & Research Company (FMR) and its affiliates. The Fund's Schedule of Investments lists each of the Fidelity Central Funds held as of period end, if any, as an investment of the Fund, but does not include the underlying holdings of each Fidelity Central Fund. As an Investing Fund, the Fund indirectly bears its proportionate share of the expenses of the underlying Fidelity Central Funds.
The Money Market Central Funds seek preservation of capital and current income and are managed by Fidelity Investments Money Management, Inc. (FIMM), an affiliate of FMR.
A complete unaudited list of holdings for each Fidelity Central Fund is available upon request or at the Securities and Exchange Commission (the SEC) web site at www.sec.gov. In addition, the financial statements of the Fidelity Central Funds, which are not covered by the Fund's Report of Independent Registered Public Accounting Firm, are available on the SEC web site or upon request.
3. Significant Accounting Policies.
The financial statements have been prepared in conformity with accounting principles generally accepted in the United States of America (GAAP), which require management to make certain estimates and assumptions at the date of the financial statements.
Annual Report
3. Significant Accounting Policies - continued
Actual results could differ from those estimates. The following summarizes the significant accounting policies of the Fund:
Security Valuation. Investments are valued as of 4:00 p.m. Eastern time on the last calendar day of the period. The Fund uses independent pricing services approved by the Board of Trustees to value its investments. When current market prices or quotations are not readily available or reliable, valuations may be determined in good faith in accordance with procedures adopted by the Board of Trustees. Factors used in determining value may include market or security specific events, changes in interest rates and credit quality. The frequency with which these procedures are used cannot be predicted and they may be utilized to a significant extent. The value used for net asset value (NAV) calculation under these procedures may differ from published prices for the same securities.
The Fund categorizes the inputs to valuation techniques used to value its investments into a disclosure hierarchy consisting of three levels as shown below.
Level 1 - quoted prices in active markets for identical investments
Level 2 - other significant observable inputs (including quoted prices for similar investments, interest rates, prepayment speeds, etc.)
Level 3 - unobservable inputs (including the Fund's own assumptions based on the best information available)
Changes in valuation techniques may result in transfers in or out of an assigned level within the disclosure hierarchy. The aggregate value of investments by input level, as of November 30, 2010, as well as a roll forward of Level 3 securities, is included at the end of the Fund's Schedule of Investments. Valuation techniques used to value the Fund's investments by major category are as follows.
Equity securities, including restricted securities, for which market quotations are readily available, are valued at the last reported sale price or official closing price as reported by an independent pricing service on the primary market or exchange on which they are traded and are categorized as Level 1 in the hierarchy. In the event there were no sales during the day or closing prices are not available, securities are valued at the last quoted bid price or may be valued using the last available price and are generally categorized as Level 2 in the hierarchy. For foreign equity securities, when significant market or security specific events arise, comparisons to the valuation of American Depositary Receipts (ADRs), futures contracts, Exchange-traded funds (ETFs) and certain indexes as well as quoted prices for similar securities are used and are categorized as Level 2 in the hierarchy in these circumstances. Utilizing these techniques may result in transfers between Level 1 and Level 2. For restricted equity securities and private placements where
Annual Report
Notes to Financial Statements - continued
(Amounts in thousands except ratios)
3. Significant Accounting Policies - continued
Security Valuation - continued
observable inputs are limited, assumptions about market activity and risk are used and are categorized as Level 3 in the hierarchy.
Debt securities, including restricted securities, are valued based on evaluated prices received from independent pricing services or from dealers who make markets in such securities. For corporate bonds, pricing services utilize matrix pricing which considers yield or price of bonds of comparable quality, coupon, maturity and type as well as dealer supplied prices and are generally categorized as Level 2 in the hierarchy.
Investments in open-end mutual funds, including the Fidelity Central Funds, are valued at their closing net asset value each business day and are categorized as Level 1 in the hierarchy.
When independent prices are unavailable or unreliable, debt securities may be valued utilizing pricing matrices which consider similar factors that would be used by independent pricing services. These are generally categorized as Level 2 in the hierarchy but may be Level 3 depending on the circumstances. The Fund invests a significant portion of its assets in below investment grade securities. The value of these securities can be more volatile due to changes in the credit quality of the issuer and is sensitive to changes in economic, market and regulatory conditions.
Investment Transactions and Income. For financial reporting purposes, the Fund's investment holdings and NAV include trades executed through the end of the last business day of the period. The NAV per share for processing shareholder transactions is calculated as of the close of business of the New York Stock Exchange (NYSE), normally 4:00 p.m. Eastern time and includes trades executed through the end of the prior business day. Gains and losses on securities sold are determined on the basis of identified cost and may include proceeds received from litigation. Dividend income is recorded on the ex-dividend date, except for certain dividends from foreign securities where the ex-dividend date may have passed, which are recorded as soon as the Fund is informed of the ex-dividend date. Non-cash dividends included in dividend income, if any, are recorded at the fair market value of the securities received. Distributions received on securities that represent a return of capital or capital gain are recorded as a reduction of cost of investments and/or as a realized gain. The Fund estimates the components of distributions received that may be considered return of capital distributions or capital gain distributions. Interest income and distributions from the Fidelity Central Funds are accrued as earned. Interest income includes coupon interest and amortization of premium and accretion of discount on debt securities.
Expenses. Most expenses of the Trust can be directly attributed to a fund. Expenses which cannot be directly attributed are apportioned amongst each fund in the Trust.
Annual Report
3. Significant Accounting Policies - continued
Expenses - continued
Expense estimates are accrued in the period to which they relate and adjustments are made when actual amounts are known.
Income Tax Information and Distributions to Shareholders. Each year the Fund intends to qualify as a regulated investment company, including distributing substantially all of its taxable income and realized gains under Subchapter M of the Internal Revenue Code and filing its U.S. federal tax return. As a result, no provision for income taxes is required. As of November 30, 2010, the Fund did not have any unrecognized tax benefits in the accompanying financial statements. A fund's federal tax return is subject to examination by the Internal Revenue Service (IRS) for a period of three years.
Distributions are declared and recorded on the ex-dividend date. Income dividends and capital gain distributions are declared separately for each class. Income and capital gain distributions are determined in accordance with income tax regulations, which may differ from GAAP.
Capital accounts within the financial statements are adjusted for permanent book-tax differences. These adjustments have no impact on net assets or the results of operations. Temporary book-tax differences will reverse in a subsequent period.
Book-tax differences are primarily due to the short-term gain distributions from the Fidelity Central Funds, market discount, deferred trustees compensation, capital loss carryforwards, and losses deferred due to wash sales and excise tax regulations.
The federal tax cost of investment securities and unrealized appreciation (depreciation) as of period end were as follows:
Gross unrealized appreciation | $ 308,237 |
Gross unrealized depreciation | (104,170) |
Net unrealized appreciation (depreciation) | $ 204,067 |
|
|
Tax Cost | $ 2,130,798 |
The tax-based components of distributable earnings as of period end were as follows:
Undistributed ordinary income | $ 16,422 |
Capital loss carryforward | $ (298,128) |
Net unrealized appreciation (depreciation) | $ 204,067 |
Annual Report
Notes to Financial Statements - continued
(Amounts in thousands except ratios)
3. Significant Accounting Policies - continued
Income Tax Information and Distributions to Shareholders - continued
The tax character of distributions paid was as follows:
| November 30, 2010 | November 30, 2009 |
Ordinary Income | $ 87,526 | $ 103,307 |
4. Operating Policies.
Restricted Securities. The Fund may invest in securities that are subject to legal or contractual restrictions on resale. These securities generally may be resold in transactions exempt from registration or to the public if the securities are registered. Disposal of these securities may involve time-consuming negotiations and expense, and prompt sale at an acceptable price may be difficult. Information regarding restricted securities is included at the end of the Fund's Schedule of Investments.
5. Purchases and Sales of Investments.
Purchases and sales of securities, other than short-term securities, aggregated $622,447 and $821,810, respectively.
6. Fees and Other Transactions with Affiliates.
Management Fee. FMR and its affiliates provide the Fund with investment management related services for which the Fund pays a monthly management fee. The management fee is the sum of an individual fund fee rate that is based on an annual rate of .20% of the Fund's average net assets and a group fee rate that averaged .26% during the period. The group fee rate is based upon the average net assets of all the mutual funds advised by FMR. The group fee rate decreases as assets under management increase and increases as assets under management decrease. In addition, the management fee is subject to a performance adjustment (up to a maximum of ± .15% of the Fund's average net assets over a 36 month performance period). The upward or downward adjustment to the management fee is based on the relative investment performance of Convertible Securities as compared to an appropriate benchmark index. For the period, the total annual management fee rate, including the performance adjustment, was .36% of the Fund's average net assets.
Distribution and Service Plan Fees. In accordance with Rule 12b-1 of the 1940 Act, the Fund has adopted separate Distribution and Service Plans for each class of shares. Certain classes pay Fidelity Distributors Corporation (FDC), an affiliate of FMR, separate Distribution and Service Fees, each of which is based on an annual percentage of each class' average net assets. In addition, FDC may pay financial intermediaries for
Annual Report
6. Fees and Other Transactions with Affiliates - continued
Distribution and Service Plan Fees - continued
selling shares of the Fund and providing shareholder support services. For the period, the Distribution and Service Fee rates, total fees and amounts retained by FDC were as follows:
| Distribution | Service | Total Fees | Retained |
Class A | 0% | .25% | $ 29 | $ 2 |
Class T | .25% | .25% | 15 | -* |
Class B | .75% | .25% | 10 | 8 |
Class C | .75% | .25% | 34 | 20 |
|
|
| $ 88 | $ 30 |
* Amount represents less than $1,000
Sales Load. FDC receives a front-end sales charge of up to 5.75% for selling Class A shares, and 3.50% for selling Class T shares, some of which is paid to financial intermediaries for selling shares of the Fund. FDC receives the proceeds of contingent deferred sales charges levied on Class A, Class T, Class B, and Class C redemptions. These charges depend on the holding period. The deferred sales charges range from 5% to 1% for Class B, 1% for Class C, 1.00% for certain purchases of Class A shares (1.00% to .50% prior to July 12, 2010) and .25% for certain purchases of Class T shares.
For the period, sales charge amounts retained by FDC were as follows:
| Retained |
Class A | $ 20 |
Class T | 2 |
Class B* | 6 |
Class C* | 1 |
| $ 29 |
* When Class B and Class C shares are initially sold, FDC pays commissions from its own resources to financial intermediaries through which the sales are made.
Transfer Agent Fees. Fidelity Investments Institutional Operations Company, Inc. (FIIOC), an affiliate of FMR, is the transfer, dividend disbursing and shareholder servicing agent for each class of the Fund. FIIOC receives account fees and asset-based fees that vary according to the account size and type of account of the shareholders of the respective classes of the Fund. FIIOC pays for typesetting, printing and mailing of shareholder reports, except proxy statements.
Annual Report
Notes to Financial Statements - continued
(Amounts in thousands except ratios)
6. Fees and Other Transactions with Affiliates - continued
Transfer Agent Fees - continued
For the period, transfer agent fees for each class were as follows:
| Amount | % of |
Class A | $ 25 | .22 |
Class T | 7 | .22 |
Class B | 3 | .29 |
Class C | 9 | .26 |
Convertible Securities | 4,324 | .19 |
Institutional Class | 12 | .19 |
| $ 4,380 |
|
Accounting and Security Lending Fees. Fidelity Service Company, Inc. (FSC), an affiliate of FMR, maintains the Fund's accounting records. The accounting fee is based on the level of average net assets for the month. Under a separate contract, FSC administers the security lending program. The security lending fee is based on the number and duration of lending transactions.
Brokerage Commissions. The Fund placed a portion of its portfolio transactions with brokerage firms which are affiliates of the investment adviser. The commissions paid to these affiliated firms were $5 for the period.
7. Committed Line of Credit.
The Fund participates with other funds managed by FMR or an affiliate in a $3.75 billion credit facility (the "line of credit") to be utilized for temporary or emergency purposes to fund shareholder redemptions or for other short-term liquidity purposes. The Fund has agreed to pay commitment fees on its pro-rata portion of the line of credit, which amounted to $9 and is reflected in Miscellaneous expenses on the Statement of Operations. During the period, there were no borrowings on this line of credit.
8. Security Lending.
The Fund lends portfolio securities through a lending agent from time to time in order to earn additional income. The lending agent may loan securities to certain qualified borrowers, including Fidelity Capital Markets (FCM), a broker-dealer affiliated with the Fund. On the settlement date of the loan, the Fund receives collateral (in the form of U.S. Treasury obligations, letters of credit and/or cash) against the loaned securities and maintains collateral in an amount not less than 100% of the market value of the loaned
Annual Report
8. Security Lending - continued
securities during the period of the loan. The market value of the loaned securities is determined at the close of business of the Fund and any additional required collateral is delivered to the Fund on the next business day. If the borrower defaults on its obligation to return the securities loaned because of insolvency or other reasons, a fund could experience delays and costs in recovering the securities loaned or in gaining access to the collateral. Any cash collateral received is invested in the Fidelity Securities Lending Cash Central Fund. The value of loaned securities and cash collateral at period end are disclosed on the Fund's Statement of Assets and Liabilities. Security lending income represents the income earned on investing cash collateral, less rebates paid to borrowers and lending agent fees associated with the loan, plus any premium payments received for lending certain types of securities. Security lending income is presented in the Statement of Operations as a component of income from Fidelity Central Funds. Total security lending income during the period amounted to $53. During the period, there were no securities loaned to FCM.
9. Expense Reductions.
FMR voluntarily agreed to reimburse a portion of Convertible Securities operating expenses. During the period, the reimbursement reduced the Class' expenses by $45. In addition, through arrangements with the Fund's custodian, credits realized as a result of uninvested cash balances were used to reduce the Fund's expenses. During the period, these credits reduced the Fund's custody expenses by $1.
10. Distributions to Shareholders.
Distributions to shareholders of each class were as follows:
Years ended November 30, | 2010 | 2009A |
From net investment income |
|
|
Class A | $ 362 | $ 62 |
Class T | 84 | 28 |
Class B | 26 | 9 |
Class C | 87 | 24 |
Convertible Securities | 86,745 | 103,134 |
Institutional Class | 222 | 50 |
Total | $ 87,526 | $ 103,307 |
A Distributions for Class A, Class T, Class B, Class C and Institutional Class are for the period February 19, 2009 (commencement of sale of shares) to November 30, 2009.
Annual Report
Notes to Financial Statements - continued
(Amounts in thousands except ratios)
11. Share Transactions.
Transactions for each class of shares were as follows:
| Shares | Dollars | ||
Years ended November 30, | 2010 | 2009 A | 2010 | 2009 A |
Class A |
|
|
|
|
Shares sold | 1,087 | 306 | $ 24,711 | $ 5,806 |
Reinvestment of distributions | 13 | 3 | 297 | 54 |
Shares redeemed | (592) | (39) | (13,289) | (801) |
Net increase (decrease) | 508 | 270 | $ 11,719 | $ 5,059 |
Class T |
|
|
|
|
Shares sold | 218 | 95 | $ 5,074 | $ 1,656 |
Reinvestment of distributions | 4 | 2 | 81 | 27 |
Shares redeemed | (168) | (6) | (3,714) | (110) |
Net increase (decrease) | 54 | 91 | $ 1,441 | $ 1,573 |
Class B |
|
|
|
|
Shares sold | 44 | 30 | $ 1,007 | $ 491 |
Reinvestment of distributions | 1 | - | 17 | 8 |
Shares redeemed | (27) | - | (604) | (5) |
Net increase (decrease) | 18 | 30 | $ 420 | $ 494 |
Class C |
|
|
|
|
Shares sold | 180 | 91 | $ 4,099 | $ 1,573 |
Reinvestment of distributions | 3 | 1 | 72 | 23 |
Shares redeemed | (52) | (13) | (1,197) | (248) |
Net increase (decrease) | 131 | 79 | $ 2,974 | $ 1,348 |
Convertible Securities |
|
|
|
|
Shares sold | 18,970 | 36,051 | $ 430,425 | $ 630,445 |
Reinvestment of distributions | 3,506 | 6,070 | 78,155 | 92,808 |
Shares redeemed | (38,186) | (38,505) | (860,169) | (627,813) |
Net increase (decrease) | (15,710) | 3,616 | $ (351,589) | $ 95,440 |
Institutional Class |
|
|
|
|
Shares sold | 400 | 173 | $ 9,185 | $ 3,107 |
Reinvestment of distributions | 6 | 2 | 133 | 44 |
Shares redeemed | (298) | (30) | (6,815) | (642) |
Net increase (decrease) | 108 | 145 | $ 2,503 | $ 2,509 |
A Share transactions for Class A, Class T, Class B, Class C and Institutional Class are for the period February 19, 2009 (commencement of sale of shares) to November 30, 2009.
Annual Report
12. Other.
The Fund's organizational documents provide former and current trustees and officers with a limited indemnification against liabilities arising in connection with the performance of their duties to the Fund. In the normal course of business, the Fund may also enter into contracts that provide general indemnifications. The Fund's maximum exposure under these arrangements is unknown as this would be dependent on future claims that may be made against the Fund. The risk of material loss from such claims is considered remote.
Annual Report
Report of Independent Registered Public Accounting Firm
To the Trustees of Fidelity Financial Trust and the Shareholders of Fidelity Convertible Securities Fund:
In our opinion, the accompanying statement of assets and liabilities, including the schedule of investments, and the related statements of operations and of changes in net assets and the financial highlights present fairly, in all material respects, the financial position of Fidelity Convertible Securities Fund (a fund of Fidelity Financial Trust) at November 30, 2010, the results of its operations for the year then ended, the changes in its net assets for each of the two years in the period then ended and the financial highlights for each of the periods indicated, in conformity with accounting principles generally accepted in the United States of America. These financial statements and financial highlights (hereafter referred to as "financial statements") are the responsibility of the Fidelity Convertible Securities Fund's management. Our responsibility is to express an opinion on these financial statements based on our audits. We conducted our audits of these financial statements in accordance with the standards of the Public Company Accounting Oversight Board (United States). Those standards require that we plan and perform the audit to obtain reasonable assurance about whether the financial statements are free of material misstatement. An audit includes examining, on a test basis, evidence supporting the amounts and disclosures in the financial statements, assessing the accounting principles used and significant estimates made by management, and evaluating the overall financial statement presentation. We believe that our audits, which included confirmation of securities at November 30, 2010 by correspondence with the custodian and brokers, provide a reasonable basis for our opinion.
/s/ PricewaterhouseCoopers LLP
PricewaterhouseCoopers LLP
Boston, Massachusetts
January 18, 2011
Annual Report
Trustees and Officers
The Trustees, Members of the Advisory Board, and executive officers of the trust and fund, as applicable, are listed below. The Board of Trustees governs the fund and is responsible for protecting the interests of shareholders. The Trustees are experienced executives who meet periodically throughout the year to oversee the fund's activities, review contractual arrangements with companies that provide services to the fund, oversee management of the risks associated with such activities and contractual arrangements, and review the fund's performance. Except for Mr. James C. Curvey, each of the Trustees oversees 219 funds advised by FMR or an affiliate. Mr. Curvey oversees 408 funds advised by FMR or an affiliate.
The Trustees hold office without limit in time except that (a) any Trustee may resign; (b) any Trustee may be removed by written instrument, signed by at least two-thirds of the number of Trustees prior to such removal; (c) any Trustee who requests to be retired or who has become incapacitated by illness or injury may be retired by written instrument signed by a majority of the other Trustees; and (d) any Trustee may be removed at any special meeting of shareholders by a two-thirds vote of the outstanding voting securities of the trust. Each Trustee who is not an interested person (as defined in the 1940 Act) (Independent Trustee), shall retire not later than the last day of the calendar year in which his or her 72nd birthday occurs. The Independent Trustees may waive this mandatory retirement age policy with respect to individual Trustees. The executive officers and Advisory Board Members hold office without limit in time, except that any officer and Advisory Board Member may resign or may be removed by a vote of a majority of the Trustees at any regular meeting or any special meeting of the Trustees. Except as indicated, each individual has held the office shown or other offices in the same company for the past five years.
Experience, Skills, Attributes, and Qualifications of the Fund's Trustees. The Governance and Nominating Committee has adopted a statement of policy that describes the experience, qualifications, attributes, and skills that are necessary and desirable for potential Independent Trustee candidates (Statement of Policy). The Board believes that each Trustee satisfied at the time he or she was initially elected or appointed a Trustee, and continues to satisfy, the standards contemplated by the Statement of Policy. The Governance and Nominating Committee also engages professional search firms to help identify potential Independent Trustee candidates who have the experience, qualifications, attributes, and skills consistent with the Statement of Policy. From time to time, additional criteria based on the composition and skills of the current Independent Trustees, as well as experience or skills that may be appropriate in light of future changes to board composition, business conditions, and regulatory or other developments, have also been considered by the professional search firms and the Governance and Nominating Committee. In addition, the Board takes into account the Trustees' commitment and participation in Board and committee meetings, as well as their leadership of standing and ad hoc committees throughout their tenure.
In determining that a particular Trustee was and continues to be qualified to serve as a Trustee, the Board has considered a variety of criteria, none of which, in isolation, was controlling. The Board believes that, collectively, the Trustees have balanced and diverse experience, qualifications, attributes, and skills, which allow the Board to operate effectively in governing the fund and protecting the interests of shareholders. Information about the specific experience, skills, attributes, and qualifications of each Trustee, which in each case led to the Board's conclusion that the Trustee should serve (or continue to serve) as a trustee of the fund, is provided below.
Annual Report
Board Structure and Oversight Function. James C. Curvey is an interested person (as defined in the 1940 Act) and currently serves as Acting Chairman. The Trustees have determined that an interested Chairman is appropriate and benefits shareholders because an interested Chairman has a personal and professional stake in the quality and continuity of services provided to the fund. Independent Trustees exercise their informed business judgment to appoint an individual of their choosing to serve as Chairman, regardless of whether the Trustee happens to be independent or a member of management. The Independent Trustees have determined that they can act independently and effectively without having an Independent Trustee serve as Chairman and that a key structural component for assuring that they are in a position to do so is for the Independent Trustees to constitute a substantial majority for the Board. The Independent Trustees also regularly meet in executive session. Ned C. Lautenbach serves as Chairman of the Independent Trustees and as such (i) acts as a liaison between the Independent Trustees and management with respect to matters important to the Independent Trustees and (ii) with management prepares agendas for Board meetings.
Fidelity funds are overseen by different Boards of Trustees. The fund's Board oversees Fidelity's equity and high income funds and another Board oversees Fidelity's investment-grade bond, money market, and asset allocation funds. The asset allocation funds may invest in Fidelity funds overseen by the fund's Board. The use of separate Boards, each with its own committee structure, allows the Trustees of each group of Fidelity funds to focus on the unique issues of the funds they oversee, including common research, investment, and operational issues. On occasion, the separate Boards establish joint committees to address issues of overlapping consequences for the Fidelity funds overseen by each Board.
The Trustees operate using a system of committees to facilitate the timely and efficient consideration of all matters of importance to the Trustees, the fund, and fund shareholders and to facilitate compliance with legal and regulatory requirements and oversight of the fund's activities and associated risks. The Board, acting through its committees, has charged FMR and its affiliates with (i) identifying events or circumstances the occurrence of which could have demonstrably adverse effects on the fund's business and/or reputation; (ii) implementing processes and controls to lessen the possibility that such events or circumstances occur or to mitigate the effects of such events or circumstances if they do occur; and (iii) creating and maintaining a system designed to evaluate continuously business and market conditions in order to facilitate the identification and implementation processes described in (i) and (ii) above. Because the day-to-day operations and activities of the fund's are carried out by or through FMR, its affiliates and other service providers, the fund's exposure to risks is mitigated but not eliminated by the processes overseen by the Trustees. While each of the Board's committees has responsibility for overseeing different aspects of the fund's activities, oversight is exercised primarily through the Operations, Audit, and Compliance Committees. Appropriate personnel, including but not limited to the fund's Chief Compliance Officer (CCO), FMR's internal auditor, the independent accountants, the fund's Treasurer and portfolio management personnel, make periodic reports to the Board's committees, as appropriate. The responsibilities of each committee, including their oversight responsibilities, are described further under "Standing Committees of the Fund's Trustees."
Annual Report
Trustees and Officers - continued
The fund's Statement of Additional Information (SAI) includes more information about the Trustees. To request a free copy, call Fidelity at 1-877-208-0098.
Interested Trustees*:
Correspondence intended for each Trustee who is an interested person may be sent to Fidelity Investments, 82 Devonshire Street, Boston, Massachusetts 02109.
Name, Age; Principal Occupations and Other Relevant Experience+ | |
James C. Curvey (75) | |
| Year of Election or Appointment: 2007 Mr. Curvey is Trustee and Acting Chairman of the Board of Trustees of certain Trusts. Mr. Curvey also serves as Trustee (2007-present) of other investment companies advised by FMR. Mr. Curvey is a Director of Fidelity Investments Money Management, Inc. (2009-present), Director of Fidelity Research & Analysis Co. (2009-present) and Director of FMR and FMR Co., Inc. (2007-present). Mr. Curvey is also Vice Chairman (2007-present) and Director of FMR LLC. In addition, Mr. Curvey serves as an Overseer for the Boston Symphony Orchestra and a member of the Trustees of Villanova University. Previously, Mr. Curvey was the Vice Chairman (2006-2007) and Director (2000-2007) of FMR Corp. |
Ronald P. O'Hanley (54) | |
| Year of Election or Appointment: 2011 Ronald P. O'Hanley is President, Asset Management and Corporate Services, for Fidelity Investments and a member of Fidelity's Executive Committee (2010-present). Previously, Mr. O'Hanley served as President and Chief Executive Officer of BNY Mellon Asset Management (2007-2010). Mr. O'Hanley also served as Vice Chairman of Bank New York Mellon Corp. and a member of that firm's Executive Committee. Prior to the 2007 merger of The Bank of New York and Mellon Financial Corporation, he was Vice Chairman of Mellon Financial Corporation and President and Chief Executive Officer of Mellon Asset Management. He joined Mellon in February 1997. Mr. O'Hanley currently serves as Chairman of the Boston Public Library Foundation Board of Directors and sits on the Board of Directors of Beth Israel Deaconess Medical Center, the Board of Trustees of the Marine Biological Laboratory and the Advisory Board of the Maxwell School of Citizenship and Public Administration at Syracuse University. Mr. O'Hanley also chairs the Council on Asset Management for the Financial Services Roundtable and is a member of the Board of Directors of Institutional Investor's U.S. Institute. |
* Trustees have been determined to be "Interested Trustees" by virtue of, among other things, their affiliation with the trust or various entities under common control with FMR.
+ The information above includes each Trustee's principal occupation during the last five years and other information relating to the experience, attributes, and skills relevant to each Trustee's qualifications to serve as a Trustee, which led to the conclusion that each Trustee should serve as a Trustee for the fund.
Annual Report
Trustees and Officers - continued
Independent Trustees:
Correspondence intended for each Independent Trustee (that is, the Trustees other than the Interested Trustees) may be sent to Fidelity Investments, P.O. Box 55235, Boston, Massachusetts 02205-5235.
Name, Age; Principal Occupations and Other Relevant Experience+ | |
Dennis J. Dirks (62) | |
| Year of Election or Appointment: 2005 Prior to his retirement in May 2003, Mr. Dirks was Chief Operating Officer and a member of the Board of The Depository Trust & Clearing Corporation (DTCC). He also served as President, Chief Operating Officer, and Board member of The Depository Trust Company (DTC) and President and Board member of the National Securities Clearing Corporation (NSCC). In addition, Mr. Dirks served as Chief Executive Officer and Board member of the Government Securities Clearing Corporation, Chief Executive Officer and Board member of the Mortgage-Backed Securities Clearing Corporation, as a Trustee and a member of the Finance Committee of Manhattan College (2005-2008), and as a Trustee and a member of the Finance Committee of AHRC of Nassau County (2006-2008). Mr. Dirks is a member of the Independent Directors Council (IDC) Governing Council (2010-Present) and Board of Directors for The Brookville Center for Children's Services, Inc. (2009-present). |
Alan J. Lacy (57) | |
| Year of Election or Appointment: 2008 Mr. Lacy serves as Senior Adviser (2007-present) of Oak Hill Capital Partners, L.P. (private equity). Mr. Lacy also served as Chief Executive Officer (2000-2005) and Vice Chairman (2005-2006) of Sears Holdings Corporation and Sears, Roebuck and Co. (retail). In addition, Mr. Lacy serves as a member of the Board of Directors of The Western Union Company (global money transfer, 2006-present) and Bristol-Myers Squibb Company (global pharmaceuticals, 2007-present). Mr. Lacy is Chairman (2008-present) and a member (2006-present) of the Board of Trustees of The National Parks Conservation Association. |
Ned C. Lautenbach (66) | |
| Year of Election or Appointment: 2000 Mr. Lautenbach is Chairman of the Independent Trustees of the Equity and High Income Funds (2006-present). Mr. Lautenbach currently serves as the Lead Director of the Eaton Corporation Board of Directors (diversified industrial, 1997-present). Mr. Lautenbach is also a member of the Board of Directors of the Philharmonic Center for the Arts in Naples, Florida (1999-present); a member of the Board of Trustees of Fairfield University (2005-present); and a member of the Council on Foreign Relations (1994-present). Previously, Mr. Lautenbach was a Partner/Advisory Partner at Clayton, Dubilier & Rice, Inc. (private equity investment, 1998-2010), as well as a Director of Sony Corporation (2006-2007). |
Joseph Mauriello (66) | |
| Year of Election or Appointment: 2008 Prior to his retirement in January 2006, Mr. Mauriello served in numerous senior management positions including Deputy Chairman and Chief Operating Officer (2004-2005), and Vice Chairman of Financial Services (2002-2004) of KPMG LLP US (professional services, 1965-2005). Mr. Mauriello currently serves as a member of the Board of Directors of XL Group plc. (global insurance and re-insurance, 2006-present) and of Arcadia Resources Inc. (health care services and products, 2007-present). Previously, Mr. Mauriello served as a Director of the Hamilton Funds of the Bank of New York (2006-2007). |
Cornelia M. Small (66) | |
| Year of Election or Appointment: 2005 Ms. Small is a member of the Board of Directors of the Teagle Foundation (2009-present). Ms. Small is also a member of the Investment Committee, and Chair (2008-present) and a member of the Board of Trustees of Smith College. In addition, Ms. Small serves on the Investment Committee of the Berkshire Taconic Community Foundation (2008-present). Previously, Ms. Small served as Chairperson of the Investment Committee (2002-2008) of Smith College. In addition, Ms. Small served as Chief Investment Officer, Director of Global Equity Investments, and a member of the Board of Directors of Scudder, Stevens & Clark and Scudder Kemper Investments. |
William S. Stavropoulos (71) | |
| Year of Election or Appointment: 2001 Mr. Stavropoulos is Vice Chairman of the Independent Trustees of the Equity and High Income Funds (2006-present). Mr. Stavropoulos serves as President and Founder of the Michigan Baseball Foundation, the Great Lakes Loons (2007-present). Mr. Stavropoulos is Chairman Emeritus of the Board of Directors of The Dow Chemical Company, where he previously served in numerous senior management positions, including President, CEO (1995-2000; 2002-2004), Chairman of the Executive Committee (2000-2006), and as a member of the Board of Directors (1990-2006). Currently, Mr. Stavropoulos is Chairman of Univar (global distributor of commodity and specialty chemicals, 2010-present), a Director of Teradata Corporation (data warehousing and technology solutions, 2008-present), Chemical Financial Corporation, Maersk Inc. (industrial conglomerate), Tyco International, Inc. (multinational manufacturing and services, 2007-present), and a member of the Advisory Board for Metalmark Capital (private equity investment, 2005-present). Mr. Stavropoulos is a special advisor to Clayton, Dubilier & Rice, LLC (private equity investment). In addition, Mr. Stavropoulos is a member of the University of Notre Dame Advisory Council for the College of Science. |
David M. Thomas (61) | |
| Year of Election or Appointment: 2008 Previously, Mr. Thomas served as Executive Chairman (2005-2006) and Chairman and Chief Executive Officer (2000-2005) of IMS Health, Inc. (pharmaceutical and healthcare information solutions). In addition, Mr. Thomas serves as a member of the Board of Directors of Fortune Brands, Inc. (consumer products), and Interpublic Group of Companies, Inc. (marketing communication, 2004-present). |
Michael E. Wiley (60) | |
| Year of Election or Appointment: 2008 Mr. Wiley also serves as a Director of Asia Pacific Exploration Consolidated (international oil and gas exploration and production, 2008-present). Mr. Wiley serves as a Director of Tesoro Corporation (independent oil refiner and marketer, 2005-present), and a Director of Bill Barrett Corporation (exploration and production, 2005-present). In addition, Mr. Wiley also serves as a Director of Post Oak Bank (privately-held bank, 2004-present). Previously, Mr. Wiley served as a member of the Board of Trustees of the University of Tulsa (2000-2006; 2007-2010), as a Senior Energy Advisor of Katzenbach Partners, LLC (consulting, 2006-2007), as an Advisory Director of Riverstone Holdings (private investment), Chairman, President, and CEO of Baker Hughes, Inc. (oilfield services, 2000-2004), and as Director of Spinnaker Exploration Company (exploration and production, 2001-2005). |
Annual Report
+ The information above includes each Trustee's principal occupation during the last five years and other information relating to the experience, attributes, and skills relevant to each Trustee's qualifications to serve as a Trustee, which led to the conclusion that each Trustee should serve as a Trustee for the fund.
Advisory Board Members and Executive Officers:
Correspondence intended for each executive officer, Edward C. Johnson 3d, and Peter S. Lynch may be sent to Fidelity Investments, 82 Devonshire Street, Boston, Massachusetts 02109.
Name, Age; Principal Occupation | |
Edward C. Johnson 3d (80) | |
| Year of Election or Appointment: 2011 Member of the Advisory Board of Fidelity's Equity and High Income Funds. Formerly Trustee and Chairman of the Board of Trustees of certain Trusts, Mr. Johnson serves as Chief Executive Officer, Chairman, and a Director of FMR LLC; Chairman and a Director of FMR; and Chairman and a Director of FMR Co., Inc. In addition, Mr. Johnson serves as Chairman and Director of FIL Limited. Previously, Mr. Johnson served as President of FMR LLC (2006-2007). |
Peter S. Lynch (66) | |
| Year of Election or Appointment: 2003 Member of the Advisory Board of Fidelity's Equity and High Income Funds. Mr. Lynch is Vice Chairman and a Director of FMR and FMR Co., Inc. In addition, Mr. Lynch serves as a Trustee of Boston College and as the Chairman of the Inner-City Scholarship Fund. Previously, Mr. Lynch served on the Special Olympics International Board of Directors (1997-2006). |
Kenneth B. Robins (41) | |
| Year of Election or Appointment: 2008 President and Treasurer of Fidelity's Equity and High Income Funds. Mr. Robins also serves as President and Treasurer (2010-present) and Assistant Treasurer (2009-present) of other Fidelity funds and is an employee of Fidelity Investments (2004-present). Previously, Mr. Robins served as Deputy Treasurer of the Fidelity funds (2005-2008) and Treasurer and Chief Financial Officer of The North Carolina Capital Management Trust: Cash and Term Portfolios (2006-2008). |
Thomas C. Hense (46) | |
| Year of Election or Appointment: 2008 or 2010 Vice President of Fidelity's High Income (2008), Small Cap (2008), and Value (2010) Funds. Previously, Mr. Hense served as a portfolio manager for Fidelity's Institutional Money Management Group (Pyramis) (2003-2008). |
Brian B. Hogan (46) | |
| Year of Election or Appointment: 2009 Vice President of certain Equity Funds and Vice President of Sector Funds. Mr. Hogan also serves as President of FMR's Equity Division (2009-present). Previously, Mr. Hogan served as Senior Vice President, Equity Research of FMR (2006-2009) and as a portfolio manager. |
Scott C. Goebel (42) | |
| Year of Election or Appointment: 2008 Secretary and Chief Legal Officer (CLO) of the Fidelity funds. Mr. Goebel also serves as Secretary and CLO of The North Carolina Capital Management Trust: Cash and Term Portfolio (2008-present); General Counsel, Secretary, and Senior Vice President of FMR (2008-present) and FMR Co., Inc. (2008-present); Deputy General Counsel of FMR LLC; Chief Legal Officer of Fidelity Management & Research (Hong Kong) Limited (2008-present) and Assistant Secretary of Fidelity Management & Research (Japan) Inc. (2008-present), Fidelity Investments Money Management, Inc. (2008-present), Fidelity Management & Research (U.K.) Inc. (2008-present), and Fidelity Research and Analysis Company (2008-present). Previously, Mr. Goebel served as Assistant Secretary of the Funds (2007-2008) and as Vice President and Secretary of Fidelity Distributors Corporation (FDC) (2005-2007). |
William C. Coffey (41) | |
| Year of Election or Appointment: 2009 Assistant Secretary of Fidelity's Equity and High Income Funds. Mr. Coffey also serves as Senior Vice President and Deputy General Counsel of FMR LLC (2010-present), and is an employee of Fidelity Investments. Previously, Mr. Coffey served as Vice President and Associate General Counsel of FMR LLC (2005-2009). |
Holly C. Laurent (56) | |
| Year of Election or Appointment: 2008 Anti-Money Laundering (AML) Officer of the Fidelity funds. Ms. Laurent also serves as AML Officer of The North Carolina Capital Management Trust: Cash and Term Portfolio (2008-present) and is an employee of Fidelity Investments. Previously, Ms. Laurent was Senior Vice President and Head of Legal for Fidelity Business Services India Pvt. Ltd. (2006-2008), and Senior Vice President, Deputy General Counsel and Group Head for FMR LLC (2005-2006). |
Christine Reynolds (52) | |
| Year of Election or Appointment: 2008 Chief Financial Officer of the Fidelity funds. Ms. Reynolds became President of Fidelity Pricing and Cash Management Services (FPCMS) in August 2008. Ms. Reynolds served as Chief Operating Officer of FPCMS (2007-2008). Previously, Ms. Reynolds served as President, Treasurer, and Anti-Money Laundering officer of the Fidelity funds (2004-2007). |
Kenneth A. Rathgeber (63) | |
| Year of Election or Appointment: 2004 Chief Compliance Officer of Fidelity's Equity and High Income Funds. Mr. Rathgeber is Chief Compliance Officer of Fidelity Management & Research (Hong Kong) Limited (2008-present), Fidelity Management & Research (Japan) Inc. (2008-present), FMR (2005-present), FMR Co., Inc. (2005-present), Fidelity Management & Research (U.K.) Inc. (2005-present), Fidelity Research & Analysis Company (2005-present), Fidelity Investments Money Management, Inc. (2005-present), Pyramis Global Advisors, LLC (2005-present), and Strategic Advisers, Inc. (2005-present). |
Jeffrey S. Christian (49) | |
| Year of Election or Appointment: 2009 Deputy Treasurer of the Fidelity funds. Mr. Christian is an employee of Fidelity Investments. Previously, Mr. Christian served as Chief Financial Officer (2008-2009) of certain Fidelity funds and Senior Vice President of Fidelity Pricing and Cash Management Services (FPCMS) (2004-2009). |
Bryan A. Mehrmann (49) | |
| Year of Election or Appointment: 2005 Deputy Treasurer of the Fidelity funds. Mr. Mehrmann is an employee of Fidelity Investments. |
Adrien E. Deberghes (43) | |
| Year of Election or Appointment: 2008 Deputy Treasurer of Fidelity's Equity and High Income Funds. Mr. Deberghes also serves as Assistant Treasurer of other Fidelity funds (2010-present) and is an employee of Fidelity Investments (2008-present). Previously, Mr. Deberghes served as Senior Vice President of Mutual Fund Administration at State Street Corporation (2007-2008), Senior Director of Mutual Fund Administration at Investors Bank & Trust (2005-2007), and Director of Finance for Dunkin' Brands (2000-2005). |
Stephanie J. Dorsey (41) | |
| Year of Election or Appointment: 2010 Assistant Treasurer of Fidelity's Equity and High Income Funds. Ms. Dorsey also serves as Deputy Treasurer of other Fidelity funds (2008-present) and is an employee of Fidelity Investments (2008-present). Previously, Ms. Dorsey served as Treasurer (2004-2008) of the JPMorgan Mutual Funds and Vice President (2004-2008) of JPMorgan Chase Bank. |
John R. Hebble (52) | |
| Year of Election or Appointment: 2009 Assistant Treasurer of Fidelity's Equity and High Income Funds. Mr. Hebble also serves as Treasurer and Chief Financial Officer of The North Carolina Capital Management Trust: Cash and Term Portfolio (2008-present), President and Treasurer of other Fidelity funds (2008-present) and is an employee of Fidelity Investments. |
Gary W. Ryan (52) | |
| Year of Election or Appointment: 2005 Assistant Treasurer of the Fidelity funds. Mr. Ryan is an employee of Fidelity Investments. Previously, Mr. Ryan served as Vice President of Fund Reporting in Fidelity Pricing and Cash Management Services (FPCMS) (1999-2005). |
Jonathan Davis (42) | |
| Year of Election or Appointment: 2010 Assistant Treasurer of the Fidelity funds. Mr. Davis is an employee of Fidelity Investments. Previously, Mr. Davis served as Vice President and Associate General Counsel of FMR LLC (2003-2010). |
Annual Report
Distributions (Unaudited)
A total of .08% of the dividends distributed during the fiscal year was derived from interest on U.S. Government securities which is generally exempt from state income tax.
The fund designates $48,972,364 of distributions paid during the period January 1, 2010 to November 30, 2010 as qualifying to be taxed as interest-related dividends for nonresident alien shareholders.
The fund designates 3%, 3%, and 3%; of the dividends distributed in April 2010, July 2010, and October 2010, respectively during the fiscal year as amounts which may be taken into account as a dividend for purposes of the maximum rate under section 1(h)(11) of the Internal Revenue Code.
The fund will notify shareholders in January 2011 of amounts for use in preparing 2010 income tax returns.
Annual Report
Board Approval of Investment Advisory Contracts and Management Fees
Fidelity Convertible Securities Fund
Each year, the Board of Trustees, including the Independent Trustees (together, the Board), votes on the renewal of the management contract and sub-advisory agreements (together, the Advisory Contracts) for the fund. The Board, assisted by the advice of fund counsel and Independent Trustees' counsel, requests and considers a broad range of information relevant to the renewal of the Advisory Contracts throughout the year.
The Board meets regularly and considers at each of its meetings factors that are relevant to its annual consideration of the renewal of the fund's Advisory Contracts, including the services and support provided to the fund and its shareholders. The Board has established various standing committees, each composed of Independent Trustees with varying backgrounds, to which the Board has assigned specific subject matter responsibilities in order to enhance effective decision-making by the Board. The Board, acting directly and through its Committees, requests and receives information concerning the annual consideration of the renewal of the fund's Advisory Contracts. The Board also meets as needed to consider matters specifically related to the Board's annual consideration of the renewal of Advisory Contracts. Members of the Board may also meet with trustees of other Fidelity funds through ad hoc joint committees to discuss certain matters relevant to the Fidelity funds.
At its July 2010 meeting, the Board of Trustees, including the Independent Trustees, unanimously determined to renew the fund's Advisory Contracts. In reaching its determination, the Board considered all factors it believed relevant, including (i) the nature, extent, and quality of the services to be provided to the fund and its shareholders (including the investment performance of the fund); (ii) the competitiveness of the fund's management fee and total expenses; (iii) the total costs of the services to be provided by and the profits to be realized by Fidelity from its relationship with the fund; (iv) the extent to which economies of scale would be realized as the fund grows; and (v) whether fee levels reflect these economies of scale, if any, for the benefit of fund shareholders.
In considering whether to renew the Advisory Contracts for the fund, the Board reached a determination, with the assistance of fund counsel and Independent Trustees' counsel and through the exercise of its business judgment, that the renewal of the Advisory Contracts is in the best interests of fund shareholders and that the compensation to be received by Fidelity under the management contract is fair and reasonable. The Board's decision to renew the Advisory Contracts was not based on any single factor noted above, but rather was based on a comprehensive consideration of all the information provided to the Board at its meetings throughout the year. The Board, in reaching its determination to renew the Advisory Contracts, is aware that shareholders in the fund have a broad range of investment choices available to them, including a wide choice among mutual funds offered by Fidelity's competitors, and that the fund's shareholders, with the opportunity to review and weigh the disclosure provided by the fund in its prospectus and other public disclosures, have chosen to invest in this fund, managed by Fidelity.
Annual Report
Nature, Extent, and Quality of Services Provided. The Board considered the staffing within the investment adviser, FMR, and the sub-advisers (together, the Investment Advisers), including the backgrounds of the fund's investment personnel and the fund's investment objective and discipline. The Independent Trustees also had discussions with senior management of Fidelity's investment operations and investment groups. The Board considered the structure of the portfolio manager compensation program and whether this structure provides appropriate incentives to act in the best interest of the fund.
Resources Dedicated to Investment Management and Support Services. The Board and the equity research subcommittee of the Board's Fund Oversight Committee reviewed the size, education, and experience of the Investment Advisers' investment staff, their use of technology, and the Investment Advisers' approach to recruiting, training, and retaining portfolio managers and other research, advisory, and management personnel. The Board noted that Fidelity's analysts have access to a variety of technological tools and market and securities data that enable them to perform both fundamental and quantitative analysis and to specialize in various disciplines. The Board considered Fidelity's extensive global research capabilities that enable the Investment Advisers to aggregate data from various sources in an effort to produce positive investment results. The Board also considered that Fidelity's portfolio managers and analysts have access to daily portfolio attribution that allows for monitoring of a fund's portfolio, as well as an electronic communication system that provides immediate real-time access to research concerning issuers and credit enhancers. The Board noted FMR's continued focus on strengthening the organization and discipline of equity portfolio management and research.
Shareholder and Administrative Services. The Board considered (i) the nature, extent, quality, and cost of advisory, administrative, and shareholder services performed by the Investment Advisers and their affiliates under the Advisory Contracts and under separate agreements covering transfer agency, pricing and bookkeeping, and securities lending services for the fund; (ii) the nature and extent of the investment adviser's supervision of third party service providers, principally custodians and subcustodians; and (iii) the resources devoted to, and the record of compliance with, the fund's compliance policies and procedures. The Board also reviewed the allocation of fund brokerage, including allocations to brokers affiliated with the Investment Advisers, the use of brokerage commissions to pay fund expenses, and the use of "soft" commission dollars to pay for research services.
The Board noted that the growth of fund assets over time across the complex allows Fidelity to reinvest in the development of services designed to enhance the value or convenience of the Fidelity funds as investment vehicles. These services include 24-hour access to account information and market information through phone representatives and over the Internet, and investor education materials and asset allocation tools.
Annual Report
Board Approval of Investment Advisory Contracts and
Management Fees - continued
Investment in a Large Fund Family. The Board considered the benefits to shareholders of investing in a Fidelity fund, including the benefits of investing in a fund that is part of a large family of funds offering a variety of investment disciplines and providing a large variety of mutual fund investor services. The Board noted that Fidelity had taken, or had made recommendations that resulted in the Fidelity funds taking, a number of actions over the previous year that benefited particular funds, including (i) dedicating additional resources to investment research and restructuring and broadening the focus of the investment research teams; (ii) bolstering the senior management team that oversees asset management; (iii) launching Class F of certain funds as a lower-fee class available to Freedom K and Freedom Index Funds; (iv) lowering the initial investment minimums and ongoing balance requirements for Real Estate High Income Fund; (v) eliminating subsequent purchase minimums for all funds and adding a waiver of the investment minimum requirement for new accounts opened with the proceeds of a systematic withdrawal plan; (vi) eliminating the withdrawal minimum and maximum limits for systematic withdrawals from Advisor funds; (vii) expanding sales load waivers on Class A shares for Destiny Planholders and expanding Institutional Class eligibility for Class O Destiny Planholders; and (viii) changing certain Class A and Class T sales charge structures to further align them with industry practices.
Investment Performance. The Board considered whether the fund has operated in accordance with its investment objective, as well as its record of compliance with its investment restrictions. It also reviewed the fund's absolute investment performance for the retail class, as well as the fund's relative investment performance for the retail class measured over multiple periods against (i) a broad-based securities market index, and (ii) a peer group of mutual funds deemed appropriate by Fidelity and reviewed by the Board. The following charts considered by the Board show, over the one-, three-, and five-year periods ended December 31, 2009, the cumulative total returns of the retail class of the fund, the cumulative total returns of a broad-based securities market index ("benchmark"), and a range of cumulative total returns of a peer group of mutual funds identified by Lipper Inc. as having an investment objective similar to that of the fund. (The Advisor classes of the fund had less than one year of performance as of Decem-ber 31, 2009.) The box within each chart shows the 25th percentile return (bottom of box) and the 75th percentile return (top of box) of the peer group. Returns shown above the box are in the first quartile and returns shown below the box are in the fourth quartile. The percentage beaten number noted below each chart corresponds to the percentile box and represents the percentage of funds in the peer group whose performance was equal to or lower than that of the retail class of the fund.
Annual Report
Fidelity Convertible Securities Fund

The Board reviewed the fund's relative investment performance against its peer group and noted that the performance of the retail class of the fund was in the first quartile for the one- and five-year periods and the second quartile for the three-year period. The Board also noted that the investment performance of the retail class of the fund compared favorably to its benchmark for the one- and five-year periods, although the fund's three-year cumulative total return was lower than its benchmark. The Board also reviewed the fund's performance since inception as well as performance in the current year.
The Board also considered that the fund's management fee is subject to upward or downward adjustment depending upon whether, and to what extent, the fund's investment performance for the performance period exceeds, or is exceeded by, the record (over the same period) of a Board-approved performance adjustment index. The Board realizes that the performance adjustment provides FMR with a strong economic incentive to seek to achieve superior performance for the fund's shareholders and helps to more closely align the interests of FMR and the fund's shareholders.
Based on its review, and giving particular weight to the nature and quality of the resources dedicated by the Investment Advisers to maintain and improve relative performance and factoring in the unprecedented market events in recent years, the Board concluded that the nature, extent, and quality of investment management and support services and of shareholder and administrative services provided to the fund will benefit the fund's shareholders, particularly in light of the Board's view that the fund's shareholders benefit from investing in a fund that is part of a large family of funds offering a variety of investment disciplines and services.
Annual Report
Board Approval of Investment Advisory Contracts and
Management Fees - continued
Competitiveness of Management Fee and Total Fund Expenses. The Board considered the fund's management fee and total expenses compared to "mapped groups" of competitive funds and classes. Fidelity creates "mapped groups" by combining similar Lipper investment objective categories that have comparable management fee characteristics. Combining Lipper investment objective categories aids the Board's management fee and total expense comparisons by broadening the competitive group used for comparison and by reducing the number of universes to which various Fidelity funds are compared.
Management Fee. The Board considered two proprietary management fee comparisons for the 12-month periods shown in the chart below. The group of Lipper funds used by the Board for management fee comparisons is referred to below as the "Total Mapped Group." The Total Mapped Group is broader than the Lipper peer group used by the Board for performance comparisons because the Total Mapped Group combines several Lipper investment objective categories while the Lipper peer group does not. The Total Mapped Group comparison focuses on a fund's standing relative to the total universe of comparable funds available to investors, in terms of gross management fees before expense reimbursements or caps, and without giving effect to the fund's performance adjustment. "TMG %" represents the percentage of funds in the Total Mapped Group that had management fees that were lower than the fund's. For example, a TMG % of 12% means that 88% of the funds in the Total Mapped Group had higher management fees than the fund. The "Asset-Size Peer Group" (ASPG) comparison focuses on a fund's standing relative to non-Fidelity funds similar in size to the fund within the Total Mapped Group. The ASPG represents at least 15% of the funds in the Total Mapped Group with comparable asset size and management fee characteristics, subject to a minimum of 50 funds (or all funds in the Total Mapped Group if fewer than 50). Additional information, such as the ASPG quartile in which the fund's management fee ranked and the impact of the fund's performance adjustment, is also included in the chart and considered by the Board.
Annual Report
Fidelity Convertible Securities Fund

The Board noted that the fund's management fee ranked below the median of its Total Mapped Group and below the median of its ASPG for 2009. The Board also noted the effect of the fund's negative performance adjustment on the fund's management fee ranking. The Board noted that the performance adjustment for each year represents calculations for performance periods that differ from the periods shown in the performance charts above.
Based on its review, the Board concluded that the fund's management fee is fair and reasonable in light of the services that the fund receives and the other factors considered.
Total Expenses. In its review of each class's total expenses, the Board considered the fund's management fee as well as other fund or class expenses, as applicable, such as transfer agent fees, pricing and bookkeeping fees, fund-paid 12b-1 fees, and custodial, legal, and audit fees. The Board also noted the effects of any waivers and reimbursements on fees and expenses, as well as the impact of the fund's performance adjustment. As part of its review, the Board also considered current and historical total expenses of each class of the fund compared to competitive fund median expenses. Each class of the fund is compared to those funds and classes in the Total Mapped Group (used by the Board for management fee comparisons) that have a similar sales load structure.
The Board noted that the total expenses of each class ranked below its competitive median for 2009.
Annual Report
Board Approval of Investment Advisory Contracts and
Management Fees - continued
Fees Charged to Other Fidelity Clients. The Board also considered Fidelity fee structures and other information with respect to clients of FMR and its affiliates, such as other mutual funds advised or subadvised by FMR or its affiliates, pension plan clients, and other institutional clients. In March 2010, the Board created an ad hoc joint committee with the board of other Fidelity funds (the Committee) to review and compare Fidelity's institutional investment advisory business with its business of providing services to the Fidelity funds, including the differences in services provided, fees charged, and costs incurred, as well as competition in their respective marketplaces.
Based on its review of total expenses and fees charged to other Fidelity clients, the Board concluded that the total expenses of each class of the fund were reasonable in light of the services that the fund and its shareholders receive and the other factors considered, including the findings of the Committee.
Costs of the Services and Profitability. The Board considered the revenues earned and the expenses incurred by Fidelity in conducting the business of developing, marketing, distributing, managing, administering and servicing the fund and its shareholders. The Board also considered the level of Fidelity's profits in respect of all the Fidelity funds.
On an annual basis, FMR presents to the Board Fidelity's profitability for the fund. Fidelity calculates the profitability for each fund, as well as aggregate profitability for groups of Fidelity funds and all Fidelity funds, using a series of detailed revenue and cost allocation methodologies which originate with the audited books and records of Fidelity. The Audit Committee of the Board reviews any significant changes from the prior year's methodologies.
PricewaterhouseCoopers LLP (PwC), independent registered public accounting firm and auditor to Fidelity and certain Fidelity funds, has been engaged annually by the Board as part of the Board's assessment of Fidelity's profitability analysis. PwC's engagement includes the review and assessment of Fidelity's methodologies used in determining the revenues and expenses attributable to Fidelity's mutual fund business, and completion of agreed-upon procedures surrounding the mathematical accuracy of fund profitability and its conformity to allocation methodologies. After considering PwC's reports issued under the engagement and information provided by Fidelity, the Board believes that while other allocation methods may also be reasonable, Fidelity's profitability methodologies are reasonable in all material respects.
The Board has also reviewed Fidelity's non-fund businesses and fall-out benefits related to the mutual fund business as well as cases where Fidelity's affiliates may benefit from or be related to the fund's business.
Annual Report
The Board considered the costs of the services provided by and the profits realized by Fidelity in connection with the operation of the fund and were satisfied that the profitability was not excessive in the circumstances.
Economies of Scale. The Board considered whether there have been economies of scale in respect of the management of the Fidelity funds, whether the Fidelity funds (including the fund) have appropriately benefited from any such economies of scale, and whether there is potential for realization of any further economies of scale. The Board considered the extent to which the fund will benefit from economies of scale through increased services to the fund, through waivers or reimbursements, or through fee or expense reductions.
In February 2009, the Board and the board of other Fidelity funds created an ad hoc committee (the Economies of Scale Committee) to analyze whether FMR attains economies of scale in respect of the management and servicing of the Fidelity funds, whether the Fidelity funds have appropriately benefited from such economies of scale, and whether there is potential for realization of any further economies of scale.
The Board recognized that the fund's management contract incorporates a "group fee" structure, which provides for lower group fee rates as total fund assets under FMR's management increase, and for higher group fee rates as total fund assets under FMR's management decrease. FMR calculates the group fee rates based on a tiered asset "breakpoint" schedule that varies based on asset class. The Board considered that the group fee is designed to deliver the benefits of economies of scale to fund shareholders when total Fidelity fund assets increase, even if assets of any particular fund are unchanged or have declined, because some portion of Fidelity's costs are attributable to services provided to all Fidelity funds, and all funds benefit if those costs can be allocated among more assets. The Board concluded that, given the group fee structure, fund shareholders will benefit from lower management fees as assets under FMR's management increase at the fund complex level, regardless of whether Fidelity achieves any such economies of scale.
The Board concluded, considering the findings of the Economies of Scale Committee, that any potential economies of scale are being appropriately shared between fund shareholders and Fidelity.
Additional Information Requested by the Board. In order to develop fully the factual basis for consideration of the Fidelity funds' Advisory Contracts, the Board requested and received additional information on certain topics, including (i) fund performance trends, actions to be taken by FMR to improve certain funds' overall performance, and Fidelity's long-term strategies for certain funds; (ii) portfolio manager changes that have occurred during the past year and length of portfolio manager tenure for different categories of funds over time; (iii) Fidelity's compensation structure for portfolio managers, research analysts, and other key personnel, the rationale for the compensation structure, and how the compensation structure provides appropriate performance incentives; (iv) the amount of the investment that each portfolio manager has made in the Fidelity fund(s) that he or she manages; (v) management and other fees paid by FMR to affiliated sub-advisers on behalf of the Fidelity funds; (vi) Fidelity's fee structures and rationale for recommending different fees among different categories of funds; (vii) Fidelity's rationale for recommending which funds should have a performance adjustment component as part of their management fees; (viii) the rationale for any differences between fund fee structures and fee structures in place for other Fidelity clients; and (ix) explanations regarding the relative total expenses borne by certain funds and classes, total expense competitive trends, and actions that might be taken by FMR to reduce total expenses for certain funds and classes.
Annual Report
Board Approval of Investment Advisory Contracts and
Management Fees - continued
Based on its evaluation of all of the conclusions noted above, and after considering all factors it believed relevant, the Board ultimately concluded that the advisory fee structures are fair and reasonable, and that the fund's Advisory Contracts should be renewed.
Annual Report
Investment Adviser
Fidelity Management & Research Company
Boston, MA
Investment Sub-Advisers
FMR Co., Inc.
Fidelity Research & Analysis Company
Fidelity Management & Research
(U.K.) Inc.
Fidelity Management & Research
(Hong Kong) Limited
Fidelity Management & Research
(Japan) Inc.
General Distributor
Fidelity Distributors Corporation
Boston, MA
Transfer and Service Agents
Fidelity Investments Institutional
Operations Company, Inc.
Boston, MA
Fidelity Service Company, Inc.
Boston, MA
Custodian
Citibank, N.A.
New York, NY
ACVSI-UANN-0111
1.884058.101
Fidelity®
Equity-Income II
Fund
Annual Report
November 30, 2010
(2_fidelity_logos) (Registered_Trademark)
Contents
Chairman's Message | The Chairman's message to shareholders. | |
Performance | How the fund has done over time. | |
Management's Discussion of Fund Performance | The Portfolio Manager's review of fund performance and strategy. | |
Shareholder Expense Example | An example of shareholder expenses. | |
Investment Changes | A summary of major shifts in the fund's investments over the past six months. | |
Investments | A complete list of the fund's investments with their market values. | |
Financial Statements | Statements of assets and liabilities, operations, and changes in net assets, as well as financial highlights. | |
Notes | Notes to the financial statements. | |
Report of Independent Registered Public Accounting Firm |
| |
Trustees and Officers |
| |
Distributions |
| |
Board Approval of Investment Advisory Contracts and Management Fees |
|
To view a fund's proxy voting guidelines and proxy voting record for the 12-month period ended June 30, visit http://www.fidelity.com/proxyvotingresults or visit the Securities and Exchange Commission's (SEC) web site at http://www.sec.gov. You may also call 1-800-544-8544 to request a free copy of the proxy voting guidelines.
Standard & Poor's, S&P and S&P 500 are registered service marks of The McGraw-Hill Companies, Inc. and have been licensed for use by Fidelity Distributors Corporation.
Other third party marks appearing herein are the property of their respective owners.
All other marks appearing herein are registered or unregistered trademarks or service marks of FMR LLC or an affiliated company.
Annual Report
This report and the financial statements contained herein are submitted for the general information of the shareholders of the fund. This report is not authorized for distribution to prospective investors in the fund unless preceded or accompanied by an effective prospectus.
A fund files its complete schedule of portfolio holdings with the SEC for the first and third quarters of each fiscal year on Form N-Q. Forms N-Q are available on the SEC's web site at http://www.sec.gov. A fund's Forms N-Q may be reviewed and copied at the SEC's Public Reference Room in Washington, DC. Information regarding the operation of the SEC's Public Reference Room may be obtained by calling 1-800-SEC-0330. For a complete list of a fund's portfolio holdings, view the most recent holdings listing, semiannual report, or annual report on Fidelity's web site at http://www.fidelity.com, http://www.advisor.fidelity.com, or http://www.401k.com, as applicable.
NOT FDIC INSURED • MAY LOSE VALUE • NO BANK GUARANTEE
Neither the fund nor Fidelity Distributors Corporation is a bank.
Annual Report
Chairman's Message
(photo_of_James_C_Curvey)
Dear Shareholder:
Equities have staged a rally in the second half of 2010, shaking off concerns about the European debt crisis and the possibility of a double-dip recession in the U.S. Although the short-term surge pushed major equity indexes back into positive territory for the year, several questions remain about the longer-term outlook, including lackluster economic growth and persistently high unemployment. Financial markets are always unpredictable, of course, but there also are several time-tested investment principles that can help put the odds in your favor.
One of the basic tenets is to invest for the long term. Over time, riding out the markets' inevitable ups and downs has proven much more effective than selling into panic or chasing the hottest trend. Even missing only a few of the markets' best days can significantly diminish investor returns. Patience also affords the benefits of compounding - of earning interest on additional income or reinvested dividends and capital gains. There can be tax advantages and cost benefits to consider as well. While staying the course doesn't eliminate risk, it can considerably lessen the effect of short-term declines.
You can further manage your investing risk through diversification. And today, more than ever, geographic diversification should be taken into account. Studies indicate that asset allocation is the single most important determinant of a portfolio's long-term success. The right mix of stocks, bonds and cash - aligned to your particular risk tolerance and investment objective - is very important. Age-appropriate rebalancing is also an essential aspect of asset allocation. For younger investors, an emphasis on equities - which historically have been the best-performing asset class over time - is encouraged. As investors near their specific goal, such as retirement or sending a child to college, consideration may be given to replacing volatile assets (e.g. common stocks) with more-stable fixed investments (bonds or savings plans).
A third principle - investing regularly - can help lower the average cost of your purchases. Investing a certain amount of money each month or quarter helps ensure you won't pay for all your shares at market highs. This strategy - known as dollar cost averaging - also reduces "emotion" from investing, helping shareholders avoid selling weak performers just prior to an upswing, or chasing a hot performer just before a correction.
We invite you to contact us via the Internet, through our Investor Centers or by phone. It is our privilege to provide you the information you need to make the investments that are right for you.
Sincerely,
(The acting chairman's signature appears here.)
James C. Curvey
Acting Chairman
Annual Report
Performance: The Bottom Line
Average annual total return reflects the change in the value of an investment, assuming reinvestment of the class' distributions from dividend income and capital gains (the profits earned upon the sale of securities that have grown in value, if any) and assuming a constant rate of performance each year. The $10,000 table and the fund's returns do not reflect the deduction of taxes that a shareholder would pay on fund distributions or the redemption of fund shares. During periods of reimbursement by Fidelity, a fund's total return will be greater than it would be had the reimbursement not occurred. How a fund did yesterday is no guarantee of how it will do tomorrow.
Average Annual Total Returns
Periods ended November 30, 2010 | Past 1 | Past 5 | Past 10 |
Fidelity® Equity-Income II Fund | 5.57% | -1.54% | 1.55% |
$10,000 Over 10 Years
Let's say hypothetically that $10,000 was invested in Fidelity® Equity-Income II Fund, a class of the fund, on November 30, 2000. The chart shows how the value of your investment would have changed, and also shows how the Russell 3000® Value Index performed over the same period.
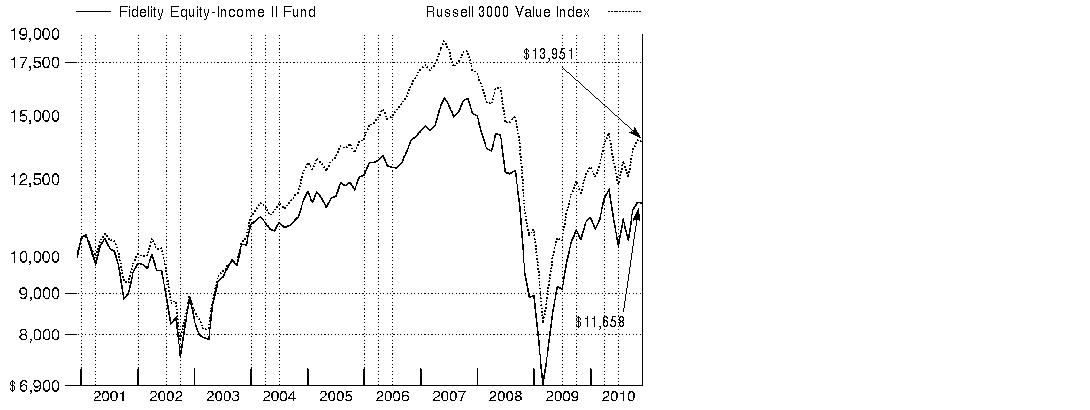
Annual Report
Management's Discussion of Fund Performance
Market Recap: Despite bouts of volatility and concern over European debt woes, major U.S. stock markets recorded solid gains for the year ending November 30, 2010, lifted by economic optimism, encouraging earnings reports and a wave of corporate mergers. Stocks extended their 2009 upswing in the first five months of the period on signs the Great Recession was over. However, high unemployment in the U.S. and sovereign debt problems in Europe sent equities falling during the spring. Markets vacillated for much of the summer before regaining momentum in the fall, with the large-cap S&P 500® Index posting its best September/October performance since 1998. By November, however, Ireland's debt took center stage, along with slower growth in China and additional quantitative easing in the U.S., unnerving investors and cooling down markets. For the full 12 months, the S&P 500® rose 9.94%, while the blue-chip-laden Dow Jones Industrial AverageSM added 9.33%. Both were bested by the technology-heavy Nasdaq Composite® Index, which advanced 17.58%. Overall, it was a broad-based rally, with economically sensitive sectors among the biggest gainers. Stocks of mid- and small-sized companies fared better than their larger-cap counterparts, advancing 24.04% and 26.98%, respectively, as measured by the Russell Midcap® and Russell 2000® indexes.
Comments from Stephen Petersen, Portfolio Manager of Fidelity® Equity-Income II Fund: For the year, the fund's Retail Class shares returned 5.57%, trailing the 10.08% gain of the Russell 3000® Value Index. The largest detractor was security selection within consumer discretionary, especially auto-related names, but the negative impact was more than offset by overweighting this strong-performing group. Positioning in financials also detracted, as did poor picks in energy, information technology and utilities. On the upside, the fund's holdings in industrials and telecommunication services helped, as did overweighting the energy and technology sectors. On an individual security basis, large positions in financial services giant Bank of America and brokerage firm Morgan Stanley hurt the most. Within consumer discretionary, individual detractors included Toll Brothers, which struggled due to a disappointing housing market recovery, and tax-preparation firm H&R Block, which felt the impact of a reduction in the number of tax filers. The biggest boost came from timely ownership of Exxon Mobil, followed by stakes in telecom firm Qwest Communications International and truck engine maker Cummins.
The views expressed above reflect those of the portfolio manager(s) only through the end of the period as stated on the cover of this report and do not necessarily represent the views of Fidelity or any other person in the Fidelity organization. Any such views are subject to change at any time based upon market or other conditions and Fidelity disclaims any responsibility to update such views. These views may not be relied on as investment advice and, because investment decisions for a Fidelity fund are based on numerous factors, may not be relied on as an indication of trading intent on behalf of any Fidelity fund.
Annual Report
Shareholder Expense Example
As a shareholder of the Fund, you incur two types of costs: (1) transaction costs, and (2) ongoing costs, including management fees and other Fund expenses. This Example is intended to help you understand your ongoing costs (in dollars) of investing in the Fund and to compare these costs with the ongoing costs of investing in other mutual funds.
The Example is based on an investment of $1,000 invested at the beginning of the period and held for the entire period (June 1, 2010 to November 30, 2010).
Actual Expenses
The first line of the accompanying table for each class of the Fund provides information about actual account values and actual expenses. You may use the information in this line, together with the amount you invested, to estimate the expenses that you paid over the period. Simply divide your account value by $1,000.00 (for example, an $8,600 account value divided by $1,000.00 = 8.6), then multiply the result by the number in the first line for a class of the Fund under the heading entitled "Expenses Paid During Period" to estimate the expenses you paid on your account during this period. A small balance maintenance fee of $12.00 that is charged once a year may apply for certain accounts with a value of less than $2,000. This fee is not included in the table below. If it was, the estimate of expenses you paid during the period would be higher, and your ending account value lower, by this amount. In addition, the Fund, as a shareholder in the underlying Fidelity Central Funds, will indirectly bear its pro-rata share of the fees and expenses incurred by the underlying Fidelity Central Funds. These fees and expenses are not included in the Fund's annualized expense ratio used to calculate the expense estimate in the table below.
Hypothetical Example for Comparison Purposes
The second line of the accompanying table for each class of the Fund provides information about hypothetical account values and hypothetical expenses based on a Class' actual expense ratio and an assumed rate of return of 5% per year before expenses, which is not the Class' actual return. The hypothetical account values and expenses may not be used to estimate the actual ending account balance or expenses you paid for the period. You may use this information to compare the ongoing costs of investing in the Fund and other funds. To do so, compare this 5% hypothetical example with the 5% hypothetical examples that appear in the shareholder reports of the other funds. A small balance maintenance fee of $12.00 that is charged once a year may apply for certain accounts with a value of less than $2,000. This fee is not included in the table below. If it was, the estimate of expenses you paid during the period would be higher, and your ending account value lower, by this amount. In addition, the Fund, as a shareholder in the underlying Fidelity Central Funds, will indirectly bear its pro-rata share of the fees and expenses incurred by the underlying Fidelity Central Funds. These fees and expenses are not included in the Fund's annualized expense ratio used to calculate the expense estimate in the table below.
Please note that the expenses shown in the table are meant to highlight your ongoing costs only and do not reflect any transaction costs. Therefore, the second line of the table is useful in comparing ongoing costs only, and will not help you determine the relative total costs of owning different funds.
Annual Report
Shareholder Expense Example - continued
| Annualized Expense Ratio | Beginning | Ending | Expenses Paid |
Equity-Income II | .69% |
|
|
|
Actual |
| $ 1,000.00 | $ 1,051.60 | $ 3.55 |
HypotheticalA |
| $ 1,000.00 | $ 1,021.61 | $ 3.50 |
Class K | .54% |
|
|
|
Actual |
| $ 1,000.00 | $ 1,053.00 | $ 2.78 |
HypotheticalA |
| $ 1,000.00 | $ 1,022.36 | $ 2.74 |
A 5% return per year before expenses
* Expenses are equal to each Class' annualized expense ratio, multiplied by the average account value over the period, multiplied by 183/365 (to reflect the one-half year period).
Annual Report
Investment Changes (Unaudited)
Top Ten Stocks as of November 30, 2010 | ||
| % of fund's | % of fund's net assets |
JPMorgan Chase & Co. | 3.2 | 3.7 |
Wells Fargo & Co. | 3.1 | 3.4 |
Chevron Corp. | 2.5 | 2.4 |
AT&T, Inc. | 2.3 | 2.4 |
Exxon Mobil Corp. | 2.2 | 3.2 |
Pfizer, Inc. | 2.1 | 2.1 |
Bank of America Corp. | 2.1 | 3.6 |
PNC Financial Services Group, Inc. | 2.0 | 2.5 |
Royal Dutch Shell PLC Class A sponsored ADR | 1.6 | 1.5 |
General Electric Co. | 1.6 | 1.4 |
| 22.7 | |
Top Five Market Sectors as of November 30, 2010 | ||
| % of fund's | % of fund's net assets |
Financials | 26.3 | 27.7 |
Consumer Discretionary | 14.8 | 16.2 |
Energy | 14.4 | 15.2 |
Industrials | 11.2 | 10.6 |
Health Care | 8.5 | 6.8 |
Asset Allocation (% of fund's net assets) | |||||||
As of November 30, 2010 * | As of May 31, 2010 ** | ||||||
| Stocks 96.6% |
| | Stocks 97.9% |
| ||
| Convertible |
| | Convertible |
| ||
| Short-Term |
| | Short-Term |
| ||
* Foreign investments | 11.6% |
| ** Foreign investments | 12.2% |
| ||

Annual Report
Investments November 30, 2010
Showing Percentage of Net Assets
Common Stocks - 96.4% | |||
Shares | Value (000s) | ||
CONSUMER DISCRETIONARY - 13.7% | |||
Auto Components - 1.3% | |||
Johnson Controls, Inc. | 1,084,990 | $ 39,537 | |
Michelin CGDE Series B | 199,256 | 13,478 | |
The Goodyear Tire & Rubber Co. (a) | 1,526,234 | 14,591 | |
| 67,606 | ||
Automobiles - 1.7% | |||
Daimler AG (Germany) (a) | 280,476 | 18,153 | |
Ford Motor Co. (a) | 1,044,086 | 16,643 | |
Harley-Davidson, Inc. | 1,273,858 | 39,846 | |
Thor Industries, Inc. | 192,700 | 5,690 | |
Winnebago Industries, Inc. (a) | 374,600 | 3,926 | |
| 84,258 | ||
Diversified Consumer Services - 0.4% | |||
H&R Block, Inc. | 1,654,800 | 20,834 | |
Household Durables - 3.7% | |||
KB Home | 276,700 | 3,127 | |
Lennar Corp. Class A | 562,700 | 8,547 | |
Newell Rubbermaid, Inc. | 1,574,174 | 26,399 | |
PulteGroup, Inc. (a) | 639,300 | 4,002 | |
Stanley Black & Decker, Inc. | 654,786 | 38,979 | |
Techtronic Industries Co. Ltd. | 3,853,000 | 4,188 | |
Toll Brothers, Inc. (a) | 4,402,250 | 79,020 | |
Whirlpool Corp. | 355,488 | 25,951 | |
| 190,213 | ||
Internet & Catalog Retail - 0.2% | |||
Liberty Media Corp. Interactive Series A (a) | 776,284 | 12,001 | |
Media - 2.2% | |||
Belo Corp. Series A (a) | 912,073 | 5,290 | |
Comcast Corp.: | |||
Class A | 998,400 | 19,968 | |
Class A (special) (non-vtg.) | 839,800 | 15,931 | |
The Walt Disney Co. | 1,270,614 | 46,390 | |
Time Warner, Inc. | 897,617 | 26,471 | |
| 114,050 | ||
Multiline Retail - 1.5% | |||
Kohl's Corp. (a) | 385,412 | 21,745 | |
Macy's, Inc. | 1,021,919 | 26,243 | |
Target Corp. | 481,156 | 27,397 | |
Tuesday Morning Corp. (a) | 468,400 | 2,436 | |
| 77,821 | ||
Common Stocks - continued | |||
Shares | Value (000s) | ||
CONSUMER DISCRETIONARY - continued | |||
Specialty Retail - 2.3% | |||
Home Depot, Inc. | 1,902,200 | $ 57,465 | |
Lowe's Companies, Inc. | 952,500 | 21,622 | |
OfficeMax, Inc. (a) | 553,000 | 9,451 | |
RadioShack Corp. | 523,800 | 9,664 | |
Staples, Inc. | 907,116 | 19,966 | |
| 118,168 | ||
Textiles, Apparel & Luxury Goods - 0.4% | |||
Phillips-Van Heusen Corp. | 159,454 | 10,817 | |
Warnaco Group, Inc. (a) | 152,059 | 8,188 | |
| 19,005 | ||
TOTAL CONSUMER DISCRETIONARY | 703,956 | ||
CONSUMER STAPLES - 5.3% | |||
Beverages - 1.0% | |||
Carlsberg AS Series B | 129,700 | 12,241 | |
PepsiCo, Inc. | 153,241 | 9,904 | |
The Coca-Cola Co. | 447,390 | 28,262 | |
| 50,407 | ||
Food & Staples Retailing - 1.2% | |||
CVS Caremark Corp. | 396,300 | 12,285 | |
Kroger Co. | 989,900 | 23,312 | |
Walgreen Co. | 691,427 | 24,096 | |
Winn-Dixie Stores, Inc. (a) | 547,110 | 3,326 | |
| 63,019 | ||
Food Products - 0.4% | |||
Nestle SA | 417,105 | 22,670 | |
Household Products - 1.5% | |||
Kimberly-Clark Corp. | 220,421 | 13,642 | |
Procter & Gamble Co. | 1,046,810 | 63,929 | |
| 77,571 | ||
Personal Products - 0.2% | |||
Avon Products, Inc. | 306,359 | 8,750 | |
Tobacco - 1.0% | |||
Philip Morris International, Inc. | 876,959 | 49,890 | |
TOTAL CONSUMER STAPLES | 272,307 | ||
Common Stocks - continued | |||
Shares | Value (000s) | ||
ENERGY - 14.3% | |||
Energy Equipment & Services - 2.6% | |||
Baker Hughes, Inc. | 830,763 | $ 43,333 | |
Halliburton Co. | 707,345 | 26,766 | |
Noble Corp. | 1,085,891 | 36,833 | |
Pride International, Inc. (a) | 602,129 | 18,726 | |
Transocean Ltd. (a) | 114,028 | 7,643 | |
| 133,301 | ||
Oil, Gas & Consumable Fuels - 11.7% | |||
Anadarko Petroleum Corp. | 443,098 | 28,429 | |
Apache Corp. | 198,400 | 21,356 | |
BP PLC sponsored ADR | 1,117,542 | 44,702 | |
Chevron Corp. | 1,584,970 | 128,335 | |
ConocoPhillips | 881,915 | 53,065 | |
CONSOL Energy, Inc. | 515,700 | 21,639 | |
Devon Energy Corp. | 204,786 | 14,452 | |
Exxon Mobil Corp. | 1,635,885 | 113,792 | |
Marathon Oil Corp. | 745,068 | 24,937 | |
Occidental Petroleum Corp. | 451,795 | 39,835 | |
Royal Dutch Shell PLC Class A sponsored ADR (d) | 1,381,600 | 83,822 | |
Southwestern Energy Co. (a) | 723,030 | 26,174 | |
| 600,538 | ||
TOTAL ENERGY | 733,839 | ||
FINANCIALS - 25.4% | |||
Capital Markets - 4.5% | |||
Bank of New York Mellon Corp. | 1,523,010 | 41,106 | |
Bank Sarasin & Co. Ltd. Series B (Reg.) | 234,912 | 8,765 | |
Goldman Sachs Group, Inc. | 344,597 | 53,805 | |
Morgan Stanley | 2,647,392 | 64,755 | |
State Street Corp. | 786,700 | 33,985 | |
UBS AG (a) | 621,000 | 9,354 | |
UBS AG (NY Shares) (a) | 1,476,635 | 22,253 | |
| 234,023 | ||
Commercial Banks - 8.5% | |||
Associated Banc-Corp. | 1,929,552 | 24,689 | |
Barclays PLC | 5,065,833 | 20,351 | |
BB&T Corp. | 1,254,403 | 29,102 | |
BNP Paribas SA | 40,500 | 2,397 | |
Comerica, Inc. | 455,900 | 16,636 | |
Huntington Bancshares, Inc. | 1,520,800 | 8,874 | |
Common Stocks - continued | |||
Shares | Value (000s) | ||
FINANCIALS - continued | |||
Commercial Banks - continued | |||
KeyCorp | 2,964,574 | $ 22,323 | |
Mitsubishi UFJ Financial Group, Inc. sponsored ADR | 3,711,800 | 17,483 | |
PNC Financial Services Group, Inc. | 1,931,400 | 104,006 | |
U.S. Bancorp, Delaware | 1,370,100 | 32,581 | |
Wells Fargo & Co. | 5,850,408 | 159,190 | |
| 437,632 | ||
Consumer Finance - 1.4% | |||
American Express Co. | 475,231 | 20,539 | |
Capital One Financial Corp. | 277,933 | 10,347 | |
Discover Financial Services | 1,673,300 | 30,588 | |
SLM Corp. (a) | 867,281 | 10,017 | |
| 71,491 | ||
Diversified Financial Services - 7.4% | |||
Bank of America Corp. | 9,954,173 | 108,998 | |
Citigroup, Inc. (a) | 15,367,311 | 64,543 | |
CME Group, Inc. | 35,388 | 10,194 | |
JPMorgan Chase & Co. | 4,465,753 | 166,935 | |
Moody's Corp. (d) | 1,118,580 | 30,012 | |
| 380,682 | ||
Insurance - 1.4% | |||
Berkshire Hathaway, Inc. Class B (a) | 107,800 | 8,590 | |
First American Financial Corp. | 577,562 | 8,184 | |
Hartford Financial Services Group, Inc. | 495,700 | 11,034 | |
Marsh & McLennan Companies, Inc. | 468,900 | 11,760 | |
Unum Group | 1,172,809 | 25,204 | |
XL Capital Ltd. Class A | 386,032 | 7,589 | |
| 72,361 | ||
Real Estate Investment Trusts - 1.6% | |||
Boston Properties, Inc. | 125,575 | 10,523 | |
Camden Property Trust (SBI) | 141,673 | 7,235 | |
HCP, Inc. | 660,323 | 21,744 | |
ProLogis Trust | 327,800 | 4,265 | |
Rayonier, Inc. | 163,429 | 8,328 | |
Segro PLC | 1,191,112 | 5,063 | |
Ventas, Inc. | 257,373 | 13,196 | |
Weyerhaeuser Co. | 661,308 | 11,037 | |
| 81,391 | ||
Real Estate Management & Development - 0.6% | |||
CB Richard Ellis Group, Inc. Class A (a) | 971,608 | 18,645 | |
Common Stocks - continued | |||
Shares | Value (000s) | ||
FINANCIALS - continued | |||
Real Estate Management & Development - continued | |||
Indiabulls Real Estate Ltd. (a) | 2,558,497 | $ 8,589 | |
Unite Group PLC (a) | 631,797 | 1,839 | |
| 29,073 | ||
TOTAL FINANCIALS | 1,306,653 | ||
HEALTH CARE - 8.5% | |||
Biotechnology - 1.3% | |||
Amgen, Inc. (a) | 647,900 | 34,138 | |
Cephalon, Inc. (a) | 141,400 | 8,977 | |
Gilead Sciences, Inc. (a) | 611,459 | 22,318 | |
| 65,433 | ||
Health Care Equipment & Supplies - 1.4% | |||
C. R. Bard, Inc. | 188,805 | 16,020 | |
CareFusion Corp. (a) | 1,018,443 | 23,292 | |
Covidien PLC | 247,090 | 10,395 | |
Stryker Corp. | 412,400 | 20,657 | |
| 70,364 | ||
Health Care Providers & Services - 0.5% | |||
UnitedHealth Group, Inc. | 694,800 | 25,374 | |
Pharmaceuticals - 5.3% | |||
GlaxoSmithKline PLC | 388,123 | 7,350 | |
GlaxoSmithKline PLC sponsored ADR | 40,500 | 1,550 | |
Johnson & Johnson | 799,311 | 49,198 | |
Merck & Co., Inc. | 2,369,628 | 81,681 | |
Pfizer, Inc. | 6,738,535 | 109,771 | |
Sanofi-Aventis | 433,968 | 26,303 | |
| 275,853 | ||
TOTAL HEALTH CARE | 437,024 | ||
INDUSTRIALS - 11.2% | |||
Aerospace & Defense - 2.8% | |||
Goodrich Corp. | 118,058 | 10,126 | |
Honeywell International, Inc. | 859,500 | 42,726 | |
Spirit AeroSystems Holdings, Inc. Class A (a) | 428,062 | 8,334 | |
The Boeing Co. | 449,317 | 28,653 | |
United Technologies Corp. | 696,228 | 52,405 | |
| 142,244 | ||
Common Stocks - continued | |||
Shares | Value (000s) | ||
INDUSTRIALS - continued | |||
Building Products - 0.4% | |||
Armstrong World Industries, Inc. | 111,359 | $ 5,398 | |
Masco Corp. | 1,273,300 | 13,892 | |
| 19,290 | ||
Commercial Services & Supplies - 0.4% | |||
Pitney Bowes, Inc. | 326,700 | 7,168 | |
Republic Services, Inc. | 473,705 | 13,330 | |
| 20,498 | ||
Construction & Engineering - 0.6% | |||
Fluor Corp. | 265,994 | 15,382 | |
KBR, Inc. | 663,126 | 17,957 | |
| 33,339 | ||
Industrial Conglomerates - 3.7% | |||
General Electric Co. | 5,287,797 | 83,706 | |
Koninklijke Philips Electronics NV unit | 380,200 | 10,303 | |
Rheinmetall AG | 322,342 | 20,800 | |
Siemens AG sponsored ADR | 430,400 | 47,258 | |
Textron, Inc. | 789,400 | 17,651 | |
Tyco International Ltd. | 364,800 | 13,822 | |
| 193,540 | ||
Machinery - 2.4% | |||
Briggs & Stratton Corp. | 1,091,495 | 19,003 | |
Caterpillar, Inc. | 95,700 | 8,096 | |
Cummins, Inc. | 385,000 | 37,391 | |
Harsco Corp. | 81,700 | 1,966 | |
Ingersoll-Rand Co. Ltd. | 622,053 | 25,504 | |
Kennametal, Inc. | 231,600 | 7,833 | |
Navistar International Corp. (a) | 267,930 | 13,713 | |
SPX Corp. | 134,400 | 8,827 | |
| 122,333 | ||
Road & Rail - 0.9% | |||
CSX Corp. | 365,100 | 22,202 | |
Union Pacific Corp. | 257,800 | 23,230 | |
| 45,432 | ||
TOTAL INDUSTRIALS | 576,676 | ||
INFORMATION TECHNOLOGY - 6.9% | |||
Communications Equipment - 0.6% | |||
Cisco Systems, Inc. (a) | 821,015 | 15,731 | |
Common Stocks - continued | |||
Shares | Value (000s) | ||
INFORMATION TECHNOLOGY - continued | |||
Communications Equipment - continued | |||
Comverse Technology, Inc. (a) | 1,494,580 | $ 11,493 | |
Motorola, Inc. (a) | 674,862 | 5,169 | |
| 32,393 | ||
Computers & Peripherals - 1.0% | |||
Hewlett-Packard Co. | 1,193,648 | 50,050 | |
Electronic Equipment & Components - 1.5% | |||
Agilent Technologies, Inc. (a) | 653,184 | 22,875 | |
Arrow Electronics, Inc. (a) | 237,538 | 7,366 | |
Avnet, Inc. (a) | 471,200 | 14,442 | |
Tyco Electronics Ltd. | 1,024,571 | 31,167 | |
| 75,850 | ||
IT Services - 0.4% | |||
CoreLogic, Inc. (a) | 270,575 | 4,927 | |
MoneyGram International, Inc. (a) | 340,342 | 834 | |
Visa, Inc. Class A | 204,568 | 15,107 | |
| 20,868 | ||
Office Electronics - 0.4% | |||
Xerox Corp. | 1,661,123 | 19,036 | |
Semiconductors & Semiconductor Equipment - 3.0% | |||
Analog Devices, Inc. | 151,700 | 5,394 | |
Applied Materials, Inc. | 2,672,600 | 33,220 | |
Intel Corp. | 2,921,200 | 61,696 | |
Micron Technology, Inc. (a) | 1,472,300 | 10,689 | |
National Semiconductor Corp. | 1,549,502 | 20,686 | |
Samsung Electronics Co. Ltd. | 11,955 | 8,527 | |
Teradyne, Inc. (a) | 303,600 | 3,601 | |
Varian Semiconductor Equipment Associates, Inc. (a) | 435,300 | 13,725 | |
| 157,538 | ||
TOTAL INFORMATION TECHNOLOGY | 355,735 | ||
MATERIALS - 2.5% | |||
Chemicals - 1.6% | |||
Clariant AG (Reg.) (a) | 1,233,742 | 22,274 | |
Dow Chemical Co. | 734,932 | 22,915 | |
E.I. du Pont de Nemours & Co. | 620,209 | 29,144 | |
PPG Industries, Inc. | 121,400 | 9,464 | |
| 83,797 | ||
Common Stocks - continued | |||
Shares | Value (000s) | ||
MATERIALS - continued | |||
Construction Materials - 0.2% | |||
HeidelbergCement AG | 177,100 | $ 9,620 | |
Metals & Mining - 0.7% | |||
Alcoa, Inc. | 1,207,232 | 15,839 | |
Commercial Metals Co. | 407,409 | 6,262 | |
Freeport-McMoRan Copper & Gold, Inc. | 124,737 | 12,638 | |
| 34,739 | ||
TOTAL MATERIALS | 128,156 | ||
TELECOMMUNICATION SERVICES - 5.0% | |||
Diversified Telecommunication Services - 4.5% | |||
AT&T, Inc. | 4,288,800 | 119,186 | |
Qwest Communications International, Inc. | 5,183,800 | 36,287 | |
Verizon Communications, Inc. | 2,446,218 | 78,303 | |
| 233,776 | ||
Wireless Telecommunication Services - 0.5% | |||
Sprint Nextel Corp. (a) | 6,081,147 | 22,987 | |
TOTAL TELECOMMUNICATION SERVICES | 256,763 | ||
UTILITIES - 3.6% | |||
Electric Utilities - 2.3% | |||
Allegheny Energy, Inc. | 835,197 | 19,059 | |
American Electric Power Co., Inc. | 1,198,309 | 42,660 | |
Entergy Corp. | 278,700 | 19,855 | |
FirstEnergy Corp. (d) | 1,013,931 | 35,599 | |
| 117,173 | ||
Independent Power Producers & Energy Traders - 0.5% | |||
AES Corp. (a) | 2,587,200 | 27,968 | |
Multi-Utilities - 0.8% | |||
Alliant Energy Corp. | 317,045 | 11,512 | |
PG&E Corp. | 277,603 | 13,028 | |
Public Service Enterprise Group, Inc. | 555,217 | 17,117 | |
Veolia Environnement | 60,700 | 1,598 | |
| 43,255 | ||
TOTAL UTILITIES | 188,396 | ||
TOTAL COMMON STOCKS (Cost $4,550,626) | 4,959,505 | ||
Preferred Stocks - 1.8% | |||
Shares | Value (000s) | ||
Convertible Preferred Stocks - 1.6% | |||
CONSUMER DISCRETIONARY - 0.6% | |||
Automobiles - 0.6% | |||
General Motors Co. 4.75% (a) | 607,000 | $ 30,775 | |
Household Durables - 0.0% | |||
Stanley Black & Decker, Inc. 4.75% (a) | 12,800 | 1,306 | |
TOTAL CONSUMER DISCRETIONARY | 32,081 | ||
ENERGY - 0.1% | |||
Oil, Gas & Consumable Fuels - 0.1% | |||
Apache Corp. 6.00% | 102,900 | 6,241 | |
FINANCIALS - 0.8% | |||
Commercial Banks - 0.2% | |||
Huntington Bancshares, Inc. 8.50% | 7,600 | 8,170 | |
Diversified Financial Services - 0.2% | |||
Citigroup, Inc. 7.50% | 81,000 | 10,125 | |
Insurance - 0.4% | |||
Hartford Financial Services Group, Inc. Series F 7.25% | 285,900 | 6,594 | |
XL Capital Ltd. 10.75% | 462,200 | 13,200 | |
| 19,794 | ||
TOTAL FINANCIALS | 38,089 | ||
UTILITIES - 0.1% | |||
Electric Utilities - 0.1% | |||
PPL Corp. 9.50% | 112,300 | 6,075 | |
TOTAL CONVERTIBLE PREFERRED STOCKS | 82,486 | ||
Nonconvertible Preferred Stocks - 0.2% | |||
CONSUMER DISCRETIONARY - 0.2% | |||
Automobiles - 0.2% | |||
Volkswagen AG | 76,000 | 12,211 | |
TOTAL PREFERRED STOCKS (Cost $81,305) | 94,697 | ||
Convertible Bonds - 0.5% | ||||
| Principal Amount (000s) | Value (000s) | ||
CONSUMER DISCRETIONARY - 0.3% | ||||
Hotels, Restaurants & Leisure - 0.3% | ||||
MGM Mirage, Inc. 4.25% 4/15/15 (e) | $ 13,500 | $ 13,382 | ||
Leisure Equipment & Products - 0.0% | ||||
Eastman Kodak Co. 7% 4/1/17 | 1,890 | 1,854 | ||
TOTAL CONSUMER DISCRETIONARY | 15,236 | |||
FINANCIALS - 0.1% | ||||
Thrifts & Mortgage Finance - 0.1% | ||||
MGIC Investment Corp. 9% 4/1/63 (e) | 5,910 | 6,013 | ||
INFORMATION TECHNOLOGY - 0.1% | ||||
Semiconductors & Semiconductor Equipment - 0.1% | ||||
Micron Technology, Inc. 1.875% 6/1/27 | 3,686 | 3,366 | ||
TOTAL CONVERTIBLE BONDS (Cost $24,120) | 24,615 | |||
Money Market Funds - 2.2% | |||
Shares |
| ||
Fidelity Cash Central Fund, 0.24% (b) | 63,981,758 | 63,982 | |
Fidelity Securities Lending Cash Central Fund, 0.25% (b)(c) | 49,809,150 | 49,809 | |
TOTAL MONEY MARKET FUNDS (Cost $113,791) | 113,791 | ||
TOTAL INVESTMENT PORTFOLIO - 100.9% (Cost $4,769,842) | 5,192,608 | ||
NET OTHER ASSETS (LIABILITIES) - (0.9)% | (47,382) | ||
NET ASSETS - 100% | $ 5,145,226 | ||
Legend |
(a) Non-income producing |
(b) Affiliated fund that is available only to investment companies and other accounts managed by Fidelity Investments. The rate quoted is the annualized seven-day yield of the fund at period end. A complete unaudited listing of the fund's holdings as of its most recent quarter end is available upon request. In addition, each Fidelity Central Fund's financial statements, which are not covered by the Fund's Report of Independent Registered Public Accounting Firm, are available on the SEC's website or upon request. |
(c) Investment made with cash collateral received from securities on loan. |
(d) Security or a portion of the security is on loan at period end. |
(e) Security exempt from registration under Rule 144A of the Securities Act of 1933. These securities may be resold in transactions exempt from registration, normally to qualified institutional |
Affiliated Central Funds |
Information regarding fiscal year to date income earned by the Fund from investments in Fidelity Central Funds is as follows: |
Fund | Income earned |
Fidelity Cash Central Fund | $ 65 |
Fidelity Securities Lending Cash Central Fund | 640 |
Total | $ 705 |
Other Information |
The following is a summary of the inputs used, as of November 30, 2010, involving the Fund's assets and liabilities carried at fair value. The inputs or methodology used for valuing securities may not be an indication of the risk associated with investing in those securities. For more information on valuation inputs, and their aggregation into the levels used in the table below, please refer to the Security Valuation section in the accompanying Notes to Financial Statements. |
Valuation Inputs at Reporting Date: | ||||
Description | Total | Level 1 | Level 2 | Level 3 |
Investments in Securities: | ||||
Equities: | ||||
Consumer Discretionary | $ 748,248 | $ 746,942 | $ 1,306 | $ - |
Consumer Staples | 272,307 | 272,307 | - | - |
Energy | 740,080 | 740,080 | - | - |
Financials | 1,344,742 | 1,298,318 | 46,424 | - |
Health Care | 437,024 | 403,371 | 33,653 | - |
Industrials | 576,676 | 576,676 | - | - |
Information Technology | 355,735 | 355,735 | - | - |
Materials | 128,156 | 128,156 | - | - |
Telecommunication Services | 256,763 | 256,763 | - | - |
Utilities | 194,471 | 186,798 | 7,673 | - |
Corporate Bonds | 24,615 | - | 24,615 | - |
Money Market Funds | 113,791 | 113,791 | - | - |
Total Investments in Securities: | $ 5,192,608 | $ 5,078,937 | $ 113,671 | $ - |
Distribution of investments by country of issue, as a percentage of total net assets, is as follows: (Unaudited) |
United States of America | 88.4% |
Switzerland | 3.4% |
United Kingdom | 3.1% |
Germany | 2.1% |
Ireland | 1.1% |
Others (Individually Less Than 1%) | 1.9% |
| 100.0% |
Income Tax Information |
At November 30, 2010, the Fund had a capital loss carryforward of approximately $1,810,776,000 of which $801,080,000 and $1,009,696,000 will expire in fiscal 2016 and 2017, respectively. Capital loss carryforwards are only available to offset future capital gains of the Fund to the extent provided by regulations and may be limited. |
See accompanying notes which are an integral part of the financial statements.
Annual Report
Financial Statements
Statement of Assets and Liabilities
Amounts in thousands (except per-share amounts) | November 30, 2010 | |
|
|
|
Assets | ||
Investment in securities, at value (including securities loaned of $48,193) - See accompanying schedule: Unaffiliated issuers (cost $4,656,051) | $ 5,078,817 |
|
Fidelity Central Funds (cost $113,791) | 113,791 |
|
Total Investments (cost $4,769,842) |
| $ 5,192,608 |
Cash | 2,105 | |
Receivable for investments sold | 7,855 | |
Receivable for fund shares sold | 838 | |
Dividends receivable | 11,661 | |
Interest receivable | 186 | |
Distributions receivable from Fidelity Central Funds | 119 | |
Prepaid expenses | 18 | |
Other receivables | 304 | |
Total assets | 5,215,694 | |
|
|
|
Liabilities | ||
Payable for investments purchased | $ 6,683 | |
Payable for fund shares redeemed | 10,673 | |
Accrued management fee | 2,025 | |
Other affiliated payables | 920 | |
Other payables and accrued expenses | 358 | |
Collateral on securities loaned, at value | 49,809 | |
Total liabilities | 70,468 | |
|
|
|
Net Assets | $ 5,145,226 | |
Net Assets consist of: |
| |
Paid in capital | $ 6,651,241 | |
Undistributed net investment income | 20,142 | |
Accumulated undistributed net realized gain (loss) on investments and foreign currency transactions | (1,948,933) | |
Net unrealized appreciation (depreciation) on investments and assets and liabilities in foreign currencies | 422,776 | |
Net Assets | $ 5,145,226 | |
See accompanying notes which are an integral part of the financial statements.
Annual Report
Statement of Assets and Liabilities - continued
Amounts in thousands (except per-share amounts) | November 30, 2010 | |
|
|
|
Equity-Income II: Net Asset Value, offering price and redemption price per share ($4,776,821 ÷ 284,085 shares) | $ 16.81 | |
|
|
|
Class K: Net Asset Value, offering price and redemption price per share ($368,405 ÷ 21,908 shares) | $ 16.82 | |
See accompanying notes which are an integral part of the financial statements.
Annual Report
Financial Statements - continued
Statement of Operations
Amounts in thousands | Year ended November 30, 2010 | |
|
|
|
Investment Income |
|
|
Dividends |
| $ 116,026 |
Interest |
| 2,633 |
Income from Fidelity Central Funds |
| 705 |
Total income |
| 119,364 |
|
|
|
Expenses | ||
Management fee | $ 24,320 | |
Transfer agent fees | 10,313 | |
Accounting and security lending fees | 1,131 | |
Custodian fees and expenses | 162 | |
Independent trustees' compensation | 32 | |
Registration fees | 54 | |
Audit | 78 | |
Legal | 28 | |
Interest | 3 | |
Miscellaneous | 75 | |
Total expenses before reductions | 36,196 | |
Expense reductions | (156) | 36,040 |
Net investment income (loss) | 83,324 | |
Realized and Unrealized Gain (Loss) Net realized gain (loss) on: | ||
Investment securities: |
|
|
Unaffiliated issuers (net of foreign taxes of $194) | 519,565 | |
Foreign currency transactions | (249) | |
Capital gain distributions from Fidelity Central Funds | 1 |
|
Total net realized gain (loss) |
| 519,317 |
Change in net unrealized appreciation (depreciation) on: Investment securities (net of decrease in deferred foreign taxes of $84) | (309,549) | |
Assets and liabilities in foreign currencies | 9 | |
Total change in net unrealized appreciation (depreciation) |
| (309,540) |
Net gain (loss) | 209,777 | |
Net increase (decrease) in net assets resulting from operations | $ 293,101 | |
See accompanying notes which are an integral part of the financial statements.
Annual Report
Statement of Changes in Net Assets
Amounts in thousands | Year ended | Year ended |
Increase (Decrease) in Net Assets |
|
|
Operations |
|
|
Net investment income (loss) | $ 83,324 | $ 98,006 |
Net realized gain (loss) | 519,317 | (645,454) |
Change in net unrealized appreciation (depreciation) | (309,540) | 1,598,050 |
Net increase (decrease) in net assets resulting | 293,101 | 1,050,602 |
Distributions to shareholders from net investment income | (78,814) | (107,786) |
Share transactions - net increase (decrease) | (564,531) | (813,458) |
Total increase (decrease) in net assets | (350,244) | 129,358 |
|
|
|
Net Assets | ||
Beginning of period | 5,495,470 | 5,366,112 |
End of period (including undistributed net investment income of $20,142 and undistributed net investment income of $15,841, respectively) | $ 5,145,226 | $ 5,495,470 |
See accompanying notes which are an integral part of the financial statements.
Annual Report
Financial Highlights - Equity-Income II
Years ended November 30, | 2010 | 2009 | 2008 | 2007 | 2006 |
Selected Per-Share Data |
|
|
|
|
|
Net asset value, beginning of period | $ 16.16 | $ 13.32 | $ 24.29 | $ 25.12 | $ 24.57 |
Income from Investment Operations |
|
|
|
|
|
Net investment income (loss) B | .26 | .27 | .33 | .33 | .35 |
Net realized and unrealized gain (loss) | .63 | 2.86 | (9.72) | 1.29 | 2.44 |
Total from investment operations | .89 | 3.13 | (9.39) | 1.62 | 2.79 |
Distributions from net investment income | (.24) | (.29) | (.36) | (.38) | (.33) |
Distributions from net realized gain | - | - | (1.22) | (2.07) | (1.91) |
Total distributions | (.24) | (.29) | (1.58) | (2.45) | (2.24) |
Net asset value, end of period | $ 16.81 | $ 16.16 | $ 13.32 | $ 24.29 | $ 25.12 |
Total Return A | 5.57% | 24.07% | (41.13)% | 6.90% | 12.28% |
Ratios to Average Net Assets C, E |
|
|
|
|
|
Expenses before reductions | .69% | .75% | .67% | .65% | .67% |
Expenses net of fee waivers, if any | .69% | .75% | .67% | .65% | .67% |
Expenses net of all reductions | .69% | .74% | .67% | .65% | .66% |
Net investment income (loss) | 1.57% | 1.98% | 1.70% | 1.34% | 1.50% |
Supplemental Data |
|
|
|
|
|
Net assets, end of period (in millions) | $ 4,777 | $ 5,288 | $ 5,212 | $ 10,530 | $ 11,635 |
Portfolio turnover rate D | 30% | 75% | 76% | 47% | 160% |
A Total returns would have been lower had certain expenses not been reduced during the periods shown.
B Calculated based on average shares outstanding during the period.
C Fees and expenses of the underlying Fidelity Central Funds are not included in the Fund's expense ratio. The Fund indirectly bears its proportionate share of the expenses of any underlying Fidelity Central Funds.
D Amount does not include the portfolio activity of any underlying Fidelity Central Funds.
E Expense ratios reflect operating expenses of the class. Expenses before reductions do not reflect amounts reimbursed by the investment adviser or reductions from brokerage service arrangements or reductions from other expense offset arrangements and do not represent the amount paid by the class during periods when reimbursements or reductions occur. Expenses net of fee waivers reflect expenses after reimbursement by the investment adviser but prior to reductions from brokerage service arrangements or other expense offset arrangements. Expenses net of all reductions represent the net expenses paid by the class.
See accompanying notes which are an integral part of the financial statements.
Annual Report
Financial Highlights - Class K
Years ended November 30, | 2010 | 2009 | 2008 G |
Selected Per-Share Data |
|
|
|
Net asset value, beginning of period | $ 16.16 | $ 13.32 | $ 21.42 |
Income from Investment Operations |
|
|
|
Net investment income (loss) D | .28 | .29 | .17 |
Net realized and unrealized gain (loss) | .65 | 2.87 | (8.08) |
Total from investment operations | .93 | 3.16 | (7.91) |
Distributions from net investment income | (.27) | (.32) | (.19) |
Net asset value, end of period | $ 16.82 | $ 16.16 | $ 13.32 |
Total Return B, C | 5.80% | 24.30% | (37.13)% |
Ratios to Average Net Assets E, H |
|
|
|
Expenses before reductions | .54% | .56% | .54% A |
Expenses net of fee waivers, if any | .54% | .56% | .54%A |
Expenses net of all reductions | .54% | .56% | .54%A |
Net investment income (loss) | 1.72% | 2.17% | 2.11%A |
Supplemental Data |
|
|
|
Net assets, end of period (in millions) | $ 368 | $ 208 | $ 154 |
Portfolio turnover rate F | 30% | 75% | 76% |
A Annualized
B Total returns for periods of less than one year are not annualized.
C Total returns would have been lower had certain expenses not been reduced during the periods shown.
D Calculated based on average shares outstanding during the period.
E Fees and expenses of the underlying Fidelity Central Funds are not included in the Fund's expense ratio. The Fund indirectly bears its proportionate share of the expenses of any underlying Fidelity Central Funds.
F Amount does not include the portfolio activity of any underlying Fidelity Central Funds.
G For the period May 9, 2008 (commencement of sale of shares) to November 30, 2008.
H Expense ratios reflect operating expenses of the class. Expenses before reductions do not reflect amounts reimbursed by the investment adviser or reductions from brokerage service arrangements or reductions from other expense offset arrangements and do not represent the amount paid by the class during periods when reimbursements or reductions occur. Expense ratios before reductions for start-up periods may not be representative of longer-term operating periods. Expenses net of fee waivers reflect expenses after reimbursement by the investment adviser but prior to reductions from brokerage service arrangements or other expense offset arrangements. Expenses net of all reductions represent the net expenses paid by the class.
See accompanying notes which are an integral part of the financial statements.
Annual Report
Notes to Financial Statements
For the period ended November 30, 2010
(Amounts in thousands except ratios)
1. Organization.
Fidelity Equity-Income II Fund (the Fund) is a fund of Fidelity Financial Trust (the Trust) and is authorized to issue an unlimited number of shares. The Trust is registered under the Investment Company Act of 1940, as amended (the 1940 Act), as an open-end management investment company organized as a Massachusetts business trust. The Fund offers Equity-Income II and Class K shares, each of which has equal rights as to assets and voting privileges. Each class has exclusive voting rights with respect to matters that affect that class. Investment income, realized and unrealized capital gains and losses, the common expenses of the Fund, and certain fund-level expense reductions, if any, are allocated on a pro-rata basis to each class based on the relative net assets of each class to the total net assets of the Fund. Each class differs with respect to transfer agent fees incurred. Certain expense reductions also differ by class.
2. Investments in Fidelity Central Funds.
The Fund may invest in Fidelity Central Funds, which are open-end investment companies available only to other investment companies and accounts managed by Fidelity Management & Research Company (FMR) and its affiliates. The Fund's Schedule of Investments lists each of the Fidelity Central Funds held as of period end, if any, as an investment of the Fund, but does not include the underlying holdings of each Fidelity Central Fund. As an Investing Fund, the Fund indirectly bears its proportionate share of the expenses of the underlying Fidelity Central Funds.
The Money Market Central Funds seek preservation of capital and current income and are managed by Fidelity Investments Money Management, Inc. (FIMM), an affiliate of FMR.
A complete unaudited list of holdings for each Fidelity Central Fund is available upon request or at the Securities and Exchange Commission (the SEC) web site at www.sec.gov. In addition, the financial statements of the Fidelity Central Funds, which are not covered by the Fund's Report of Independent Registered Public Accounting Firm, are available on the SEC web site or upon request.
3. Significant Accounting Policies.
The financial statements have been prepared in conformity with accounting principles generally accepted in the United States of America (GAAP), which require management to make certain estimates and assumptions at the date of the financial statements. Actual results could differ from those estimates. The following summarizes the significant accounting policies of the Fund:
Annual Report
3. Significant Accounting Policies - continued
Security Valuation. Investments are valued as of 4:00 p.m. Eastern time on the last calendar day of the period. The Fund uses independent pricing services approved by the Board of Trustees to value its investments. When current market prices or quotations are not readily available or reliable, valuations may be determined in good faith in accordance with procedures adopted by the Board of Trustees. Factors used in determining value may include market or security specific events, changes in interest rates and credit quality. The frequency with which these procedures are used cannot be predicted and they may be utilized to a significant extent. The value used for net asset value (NAV) calculation under these procedures may differ from published prices for the same securities.
The Fund categorizes the inputs to valuation techniques used to value its investments into a disclosure hierarchy consisting of three levels as shown below.
Level 1 - quoted prices in active markets for identical investments
Level 2 - other significant observable inputs (including quoted prices for similar investments, interest rates, prepayment speeds, etc.)
Level 3 - unobservable inputs (including the Fund's own assumptions based on the best information available)
Changes in valuation techniques may result in transfers in or out of an assigned level within the disclosure hierarchy. The aggregate value of investments by input level, as of November 30, 2010 is included at the end of the Fund's Schedule of Investments. Valuation techniques used to value the Fund's investments by major category are as follows.
Equity securities, including restricted securities, for which market quotations are readily available, are valued at the last reported sale price or official closing price as reported by an independent pricing service on the primary market or exchange on which they are traded and are categorized as Level 1 in the hierarchy. In the event there were no sales during the day or closing prices are not available, securities are valued at the last quoted bid price or may be valued using the last available price and are generally categorized as Level 2 in the hierarchy. For foreign equity securities, when significant market or security specific events arise, comparisons to the valuation of American Depositary Receipts (ADRs), futures contracts, Exchange-traded funds (ETFs) and certain indexes as well as quoted prices for similar securities are used and are categorized as Level 2 in the hierarchy in these circumstances. Utilizing these techniques may result in transfers between Level 1 and Level 2. For restricted equity securities and private placements where observable inputs are limited, assumptions about market activity and risk are used and are categorized as Level 3 in the hierarchy.
Annual Report
Notes to Financial Statements - continued
(Amounts in thousands except ratios)
3. Significant Accounting Policies - continued
Security Valuation - continued
Debt securities, including restricted securities, are valued based on evaluated prices received from independent pricing services or from dealers who make markets in such securities. For corporate bonds, pricing services utilize matrix pricing which considers yield or price of bonds of comparable quality, coupon, maturity and type as well as dealer supplied prices and are generally categorized as Level 2 in the hierarchy.
Investments in open-end mutual funds, including the Fidelity Central Funds, are valued at their closing net asset value each business day and are categorized as Level 1 in the hierarchy.
When independent prices are unavailable or unreliable, debt securities may be valued utilizing pricing matrices which consider similar factors that would be used by independent pricing services. These are generally categorized as Level 2 in the hierarchy but may be Level 3 depending on the circumstances.
Foreign Currency. The Fund uses foreign currency contracts to facilitate transactions in foreign-denominated securities. Gains and losses from these transactions may arise from changes in the value of the foreign currency or if the counterparties do not perform under the contracts' terms.
Foreign-denominated assets, including investment securities, and liabilities are translated into U.S. dollars at the exchange rate at period end. Purchases and sales of investment securities, income and dividends received and expenses denominated in foreign currencies are translated into U.S. dollars at the exchange rate in effect on the transaction date.
The effects of exchange rate fluctuations on investments are included with the net realized and unrealized gain (loss) on investment securities. Other foreign currency transactions resulting in realized and unrealized gain (loss) are disclosed separately.
Investment Transactions and Income. For financial reporting purposes, the Fund's investment holdings and NAV include trades executed through the end of the last business day of the period. The NAV per share for processing shareholder transactions is calculated as of the close of business of the New York Stock Exchange (NYSE), normally 4:00 p.m. Eastern time and includes trades executed through the end of the prior business day. Gains and losses on securities sold are determined on the basis of identified cost and may include proceeds received from litigation. Dividend income is recorded on the ex-dividend date, except for certain dividends from foreign securities where the ex-dividend date may have passed, which are recorded as soon as the Fund is informed of the ex-dividend date. Non-cash dividends included in dividend income, if any, are
Annual Report
3. Significant Accounting Policies - continued
Investment Transactions and Income - continued
recorded at the fair market value of the securities received. Distributions received on securities that represent a return of capital or capital gain are recorded as a reduction of cost of investments and/or as a realized gain. The Fund estimates the components of distributions received that may be considered return of capital distributions or capital gain distributions. Interest income and distributions from the Fidelity Central Funds are accrued as earned. Interest income includes coupon interest and amortization of premium and accretion of discount on debt securities. Investment income is recorded net of foreign taxes withheld where recovery of such taxes is uncertain.
Expenses. Most expenses of the Trust can be directly attributed to a fund. Expenses which cannot be directly attributed are apportioned amongst each fund in the Trust. Expense estimates are accrued in the period to which they relate and adjustments are made when actual amounts are known.
Deferred Trustee Compensation. Under a Deferred Compensation Plan (the Plan), independent Trustees may elect to defer receipt of a portion of their annual compensation. Deferred amounts are invested in a cross-section of Fidelity funds, are marked-to-market and remain in the Fund until distributed in accordance with the Plan. The investment of deferred amounts and the offsetting payable to the Trustees are included in the accompanying Statement of Assets and Liabilities.
Income Tax Information and Distributions to Shareholders. Each year the Fund intends to qualify as a regulated investment company, including distributing substantially all of its taxable income and realized gains under Subchapter M of the Internal Revenue Code and filing its U.S. federal tax return. As a result, no provision for income taxes is required. As of November 30, 2010, the Fund did not have any unrecognized tax benefits in the accompanying financial statements. A fund's federal tax return is subject to examination by the Internal Revenue Service (IRS) for a period of three years. Foreign taxes are provided for based on the Fund's understanding of the tax rules and rates that exist in the foreign markets in which it invests.
Distributions are declared and recorded on the ex-dividend date. Income dividends and capital gain distributions are declared separately for each class. Income and capital gain distributions are determined in accordance with income tax regulations, which may differ from GAAP.
Capital accounts within the financial statements are adjusted for permanent book-tax differences. These adjustments have no impact on net assets or the results of operations. Temporary book-tax differences will reverse in a subsequent period.
Annual Report
Notes to Financial Statements - continued
(Amounts in thousands except ratios)
3. Significant Accounting Policies - continued
Income Tax Information and Distributions to Shareholders - continued
Book-tax differences are primarily due to short-term gain distributions from the Fidelity Central Funds, foreign currency transactions, certain foreign taxes, market discount, deferred trustees compensation, capital loss carryforwards and losses due to wash sales.
The federal tax cost of investment securities and unrealized appreciation (depreciation) as of period end were as follows:
Gross unrealized appreciation | $ 831,232 |
Gross unrealized depreciation | (546,552) |
Net unrealized appreciation (depreciation) | $ 284,680 |
|
|
Tax Cost | $ 4,907,928 |
The tax-based components of distributable earnings as of period end were as follows:
Undistributed ordinary income | $ 20,359 |
Capital loss carryforward | $ (1,810,776) |
Net unrealized appreciation (depreciation) | $ 284,690 |
The tax character of distributions paid was as follows:
| November 30, 2010 | November 30, 2009 |
Ordinary Income | $ 78,814 | $ 107,786 |
4. Operating Policies.
Restricted Securities. The Fund may invest in securities that are subject to legal or contractual restrictions on resale. These securities generally may be resold in transactions exempt from registration or to the public if the securities are registered. Disposal of these securities may involve time-consuming negotiations and expense, and prompt sale at an acceptable price may be difficult. Information regarding restricted securities is included at the end of the Fund's Schedule of Investments.
5. Purchases and Sales of Investments.
Purchases and sales of securities, other than short-term securities, aggregated $1,542,718 and $2,124,828, respectively.
Annual Report
6. Fees and Other Transactions with Affiliates.
Management Fee. FMR and its affiliates provide the Fund with investment management related services for which the Fund pays a monthly management fee. The management fee is the sum of an individual fund fee rate that is based on an annual rate of .20% of the Fund's average net assets and a group fee rate that averaged .26% during the period. The group fee rate is based upon the average net assets of all the mutual funds advised by FMR. The group fee rate decreases as assets under management increase and increases as assets under management decrease. For the period, the total annual management fee rate was .46% of the Fund's average net assets.
Transfer Agent Fees. Fidelity Investments Institutional Operations Company, Inc. (FIIOC), an affiliate of FMR, is the transfer, dividend disbursing and shareholder servicing agent for each class of the Fund. FIIOC receives account fees and asset-based fees that vary according to the account size and type of account of the shareholders of Equity-Income II. FIIOC receives an asset-based fee of Class K's average net assets. FIIOC pays for typesetting, printing and mailing of shareholder reports, except proxy statements. For the period, transfer agent fees for each class were as follows:
| Amount | % of |
Equity-Income II | $ 10,181 | .20 |
Class K | 132 | .05 |
| $ 10,313 |
|
Accounting and Security Lending Fees. Fidelity Service Company, Inc. (FSC), an affiliate of FMR, maintains the Fund's accounting records. The accounting fee is based on the level of average net assets for the month. Under a separate contract, FSC administers the security lending program. The security lending fee is based on the number and duration of lending transactions.
Brokerage Commissions. The Fund placed a portion of its portfolio transactions with brokerage firms which are affiliates of the investment adviser. The commissions paid to these affiliated firms were $19 for the period.
Interfund Lending Program. Pursuant to an Exemptive Order issued by the SEC, the Fund, along with other registered investment companies having management contracts with FMR, may participate in an interfund lending program. This program provides an alternative credit facility allowing the funds to borrow from, or lend money to, other participating affiliated funds. At period end, there were no interfund loans outstanding.
Annual Report
Notes to Financial Statements - continued
(Amounts in thousands except ratios)
6. Fees and Other Transactions with Affiliates - continued
Interfund Lending Program - continued
The Fund's activity in this program during the period for which loans were outstanding was as follows:
Borrower or Lender | Average Daily | Weighted Average Interest Rate | Interest |
Borrower | $ 7,877 | .42% | $ 3 |
7. Committed Line of Credit.
The Fund participates with other funds managed by FMR or an affiliate in a $3.75 billion credit facility (the "line of credit") to be utilized for temporary or emergency purposes to fund shareholder redemptions or for other short-term liquidity purposes. The Fund has agreed to pay commitment fees on its pro-rata portion of the line of credit, which amounted to $21 and is reflected in Miscellaneous expenses on the Statement of Operations. During the period, there were no borrowings on this line of credit.
8. Security Lending.
The Fund lends portfolio securities through a lending agent from time to time in order to earn additional income. The lending agent may loan securities to certain qualified borrowers, including Fidelity Capital Markets (FCM), a broker-dealer affiliated with the Fund. On the settlement date of the loan, the Fund receives collateral (in the form of U.S. Treasury obligations, letters of credit and/or cash) against the loaned securities and maintains collateral in an amount not less than 100% of the market value of the loaned securities during the period of the loan. The market value of the loaned securities is determined at the close of business of the Fund and any additional required collateral is delivered to the Fund on the next business day. If the borrower defaults on its obligation to return the securities loaned because of insolvency or other reasons, a fund could experience delays and costs in recovering the securities loaned or in gaining access to the collateral. Any cash collateral received is invested in the Fidelity Securities Lending Cash Central Fund. The value of loaned securities and cash collateral at period end are disclosed on the Fund's Statement of Assets and Liabilities. Security lending income represents the income earned on investing cash collateral, less rebates paid to borrowers and lending agent fees associated with the loan, plus any premium payments received for lending certain types of securities. Security lending income is presented in the Statement of Operations as a component of income from Fidelity Central Funds. Total security lending income during the period amounted to $640. During the period, there were no securities loaned to FCM.
Annual Report
9. Expense Reductions.
Many of the brokers with whom FMR places trades on behalf of the Fund provided services to the Fund in addition to trade execution. These services included payments of certain expenses on behalf of the Fund totaling $156 for the period.
10. Distributions to Shareholders.
Distributions to shareholders of each class were as follows:
Years ended November 30, | 2010 | 2009 |
From net investment income |
|
|
Equity-Income II | $ 74,940 | $ 103,988 |
Class K | 3,874 | 3,798 |
Total | $ 78,814 | $ 107,786 |
11. Share Transactions.
Transactions for each class of shares were as follows:
| Shares | Dollars | ||
Years ended November 30, | 2010 | 2009 A | 2010 | 2009 A |
Equity-Income II |
|
|
|
|
Shares sold | 11,830 | 20,468 | $ 195,399 | $ 264,593 |
Conversion to Class K | - | (6,298) | - | (80,663) |
Reinvestment of distributions | 4,305 | 7,638 | 71,108 | 98,777 |
Shares redeemed | (59,267) | (85,985) | (980,367) | (1,111,308) |
Net increase (decrease) | (43,132) | (64,177) | $ (713,860) | $ (828,601) |
Class K |
|
|
|
|
Shares sold | 12,200 | 3,143 | $ 201,326 | $ 41,178 |
Conversion from Equity-Income II | - | 6,298 | - | 80,663 |
Reinvestment of distributions | 235 | 293 | 3,874 | 3,798 |
Shares redeemed | (3,385) | (8,420) | (55,871) | (110,496) |
Net increase (decrease) | 9,050 | 1,314 | $ 149,329 | $ 15,143 |
A Conversion transactions for Class K and Equity-Income II are presented for the period December 1, 2008 through August 31, 2009
12. Other.
The Fund's organizational documents provide former and current trustees and officers with a limited indemnification against liabilities arising in connection with the performance of their duties to the Fund. In the normal course of business, the Fund may also enter into contracts that provide general indemnifications. The Fund's maximum exposure under these arrangements is unknown as this would be dependent on future claims that may be made against the Fund. The risk of material loss from such claims is considered remote.
Annual Report
Report of Independent Registered Public Accounting Firm
To the Trustees of Fidelity Financial Trust and the Shareholders of Fidelity Equity-Income II Fund:
In our opinion, the accompanying statement of assets and liabilities, including the schedule of investments, and the related statements of operations and of changes in net assets and the financial highlights present fairly, in all material respects, the financial position of Fidelity Equity-Income II Fund (a fund of Fidelity Financial Trust) at November 30, 2010, the results of its operations for the year then ended, the changes in its net assets for each of the two years in the period then ended and the financial highlights for each of the periods indicated, in conformity with accounting principles generally accepted in the United States of America. These financial statements and financial highlights (hereafter referred to as "financial statements") are the responsibility of the Fidelity Equity-Income II Fund's management. Our responsibility is to express an opinion on these financial statements based on our audits. We conducted our audits of these financial statements in accordance with the standards of the Public Company Accounting Oversight Board (United States). Those standards require that we plan and perform the audit to obtain reasonable assurance about whether the financial statements are free of material misstatement. An audit includes examining, on a test basis, evidence supporting the amounts and disclosures in the financial statements, assessing the accounting principles used and significant estimates made by management, and evaluating the overall financial statement presentation. We believe that our audits, which included confirmation of securities at November 30, 2010 by correspondence with the custodian and brokers, provide a reasonable basis for our opinion.
/s/ PricewaterhouseCoopers LLP
PricewaterhouseCoopers LLP
Boston, Massachusetts
January 14, 2011
Annual Report
Trustees and Officers
The Trustees, Members of the Advisory Board, and executive officers of the trust and fund, as applicable, are listed below. The Board of Trustees governs the fund and is responsible for protecting the interests of shareholders. The Trustees are experienced executives who meet periodically throughout the year to oversee the fund's activities, review contractual arrangements with companies that provide services to the fund, oversee management of the risks associated with such activities and contractual arrangements, and review the fund's performance. Except for James C. Curvey, each of the Trustees oversees 219 funds advised by FMR or an affiliate. Mr. Curvey oversees 408 funds advised by FMR or an affiliate.
The Trustees hold office without limit in time except that (a) any Trustee may resign; (b) any Trustee may be removed by written instrument, signed by at least two-thirds of the number of Trustees prior to such removal; (c) any Trustee who requests to be retired or who has become incapacitated by illness or injury may be retired by written instrument signed by a majority of the other Trustees; and (d) any Trustee may be removed at any special meeting of shareholders by a two-thirds vote of the outstanding voting securities of the trust. Each Trustee who is not an interested person (as defined in the 1940 Act) (Independent Trustee), shall retire not later than the last day of the calendar year in which his or her 72nd birthday occurs. The Independent Trustees may waive this mandatory retirement age policy with respect to individual Trustees. The executive officers and Advisory Board Members hold office without limit in time, except that any officer and Advisory Board Member may resign or may be removed by a vote of a majority of the Trustees at any regular meeting or any special meeting of the Trustees. Except as indicated, each individual has held the office shown or other offices in the same company for the past five years.
Experience, Skills, Attributes, and Qualifications of the Fund's Trustees. The Governance and Nominating Committee has adopted a statement of policy that describes the experience, qualifications, attributes, and skills that are necessary and desirable for potential Independent Trustee candidates (Statement of Policy). The Board believes that each Trustee satisfied at the time he or she was initially elected or appointed a Trustee, and continues to satisfy, the standards contemplated by the Statement of Policy. The Governance and Nominating Committee also engages professional search firms to help identify potential Independent Trustee candidates who have the experience, qualifications, attributes, and skills consistent with the Statement of Policy. From time to time, additional criteria based on the composition and skills of the current Independent Trustees, as well as experience or skills that may be appropriate in light of future changes to board composition, business conditions, and regulatory or other developments, have also been considered by the professional search firms and the Governance and Nominating Committee. In addition, the Board takes into account the Trustees' commitment and participation in Board and committee meetings, as well as their leadership of standing and ad hoc committees throughout their tenure.
In determining that a particular Trustee was and continues to be qualified to serve as a Trustee, the Board has considered a variety of criteria, none of which, in isolation, was controlling. The Board believes that, collectively, the Trustees have balanced and diverse experience, qualifications, attributes, and skills, which allow the Board to operate effectively in governing the fund and protecting the interests of shareholders. Information about the specific experience, skills, attributes, and qualifications of each Trustee, which in each case led to the Board's conclusion that the Trustee should serve (or continue to serve) as a trustee of the fund, is provided below.
Annual Report
Trustees and Officers - continued
Board Structure and Oversight Function. James C. Curvey is an interested person (as defined in the 1940 Act) and currently serves as Acting Chairman. The Trustees have determined that an interested Chairman is appropriate and benefits shareholders because an interested Chairman has a personal and professional stake in the quality and continuity of services provided to the fund. Independent Trustees exercise their informed business judgment to appoint an individual of their choosing to serve as Chairman, regardless of whether the Trustee happens to be independent or a member of management. The Independent Trustees have determined that they can act independently and effectively without having an Independent Trustee serve as Chairman and that a key structural component for assuring that they are in a position to do so is for the Independent Trustees to constitute a substantial majority for the Board. The Independent Trustees also regularly meet in executive session. Ned C. Lautenbach serves as Chairman of the Independent Trustees and as such (i) acts as a liaison between the Independent Trustees and management with respect to matters important to the Independent Trustees and (ii) with management prepares agendas for Board meetings.
Fidelity funds are overseen by different Boards of Trustees. The fund's Board oversees Fidelity's equity and high income funds and another Board oversees Fidelity's investment-grade bond, money market, and asset allocation funds. The asset allocation funds may invest in Fidelity funds overseen by the fund's Board. The use of separate Boards, each with its own committee structure, allows the Trustees of each group of Fidelity funds to focus on the unique issues of the funds they oversee, including common research, investment, and operational issues. On occasion, the separate Boards establish joint committees to address issues of overlapping consequences for the Fidelity funds overseen by each Board.
The Trustees operate using a system of committees to facilitate the timely and efficient consideration of all matters of importance to the Trustees, the fund, and fund shareholders and to facilitate compliance with legal and regulatory requirements and oversight of the fund's activities and associated risks. The Board, acting through its committees, has charged FMR and its affiliates with (i) identifying events or circumstances the occurrence of which could have demonstrably adverse effects on the fund's business and/or reputation; (ii) implementing processes and controls to lessen the possibility that such events or circumstances occur or to mitigate the effects of such events or circumstances if they do occur; and (iii) creating and maintaining a system designed to evaluate continuously business and market conditions in order to facilitate the identification and implementation processes described in (i) and (ii) above. Because the day-to-day operations and activities of the fund are carried out by or through FMR, its affiliates and other service providers, the fund's exposure to risks is mitigated but not eliminated by the processes overseen by the Trustees. While each of the Board's committees has responsibility for overseeing different aspects of the fund's activities, oversight is exercised primarily through the Operations, Audit, and Compliance Committees. Appropriate personnel, including but not limited to the fund's Chief Compliance Officer (CCO), FMR's internal auditor, the independent accountants, the fund's Treasurer and portfolio management personnel, make periodic reports to the Board's committees, as appropriate. The responsibilities of each committee, including their oversight responsibilities, are described further under "Standing Committees of the Fund's Trustees."
Annual Report
The fund's Statement of Additional Information (SAI) includes more information about the Trustees. To request a free copy, call Fidelity at 1-800-544-8544.
Interested Trustees*:
Correspondence intended for each Trustee who is an interested person may be sent to Fidelity Investments, 82 Devonshire Street, Boston, Massachusetts 02109.
Name, Age; Principal Occupations and Other Relevant Experience+ | |
James C. Curvey (75) | |
| Year of Election or Appointment: 2007 Mr. Curvey is Trustee and Acting Chairman of the Board of Trustees of certain Trusts. Mr. Curvey also serves as Trustee (2007-present) of other investment companies advised by FMR. Mr. Curvey is a Director of Fidelity Investments Money Management, Inc. (2009-present), Director of Fidelity Research & Analysis Co. (2009-present) and Director of FMR and FMR Co., Inc. (2007-present). Mr. Curvey is also Vice Chairman (2007-present) and Director of FMR LLC. In addition, Mr. Curvey serves as an Overseer for the Boston Symphony Orchestra and a member of the Trustees of Villanova University. Previously, Mr. Curvey was the Vice Chairman (2006-2007) and Director (2000-2007) of FMR Corp. |
Ronald P. O'Hanley (54) | |
| Year of Election or Appointment: 2011 Ronald P. O'Hanley is President, Asset Management and Corporate Services, for Fidelity Investments and a member of Fidelity's Executive Committee (2010-present). Previously, Mr. O'Hanley served as President and Chief Executive Officer of BNY Mellon Asset Management (2007-2010). Mr. O'Hanley also served as Vice Chairman of Bank New York Mellon Corp. and a member of that firm's Executive Committee. Prior to the 2007 merger of The Bank of New York and Mellon Financial Corporation, he was Vice Chairman of Mellon Financial Corporation and President and Chief Executive Officer of Mellon Asset Management. He joined Mellon in February 1997. Mr. O'Hanley currently serves as Chairman of the Boston Public Library Foundation Board of Directors and sits on the Board of Directors of Beth Israel Deaconess Medical Center, the Board of Trustees of the Marine Biological Laboratory and the Advisory Board of the Maxwell School of Citizenship and Public Administration at Syracuse University. Mr. O'Hanley also chairs the Council on Asset Management for the Financial Services Roundtable and is a member of the Board of Directors of Institutional Investor's U.S. Institute. |
Annual Report
Trustees and Officers - continued
* Trustees have been determined to be "Interested Trustees" by virtue of, among other things, their affiliation with the trust or various entities under common control with FMR.
+ The information above includes each Trustee's principal occupation during the last five years and other information relating to the experience, attributes, and skills relevant to each Trustee's qualifications to serve as a Trustee, which led to the conclusion that each Trustee should serve as a Trustee for the fund.
Independent Trustees:
Correspondence intended for each Independent Trustee (that is, the Trustees other than the Interested Trustees) may be sent to Fidelity Investments, P.O. Box 55235, Boston, Massachusetts 02205-5235.
Name, Age; Principal Occupations and Other Relevant Experience+ | |
Dennis J. Dirks (62) | |
| Year of Election or Appointment: 2005 Prior to his retirement in May 2003, Mr. Dirks was Chief Operating Officer and a member of the Board of The Depository Trust & Clearing Corporation (DTCC). He also served as President, Chief Operating Officer, and Board member of The Depository Trust Company (DTC) and President and Board member of the National Securities Clearing Corporation (NSCC). In addition, Mr. Dirks served as Chief Executive Officer and Board member of the Government Securities Clearing Corporation, Chief Executive Officer and Board member of the Mortgage-Backed Securities Clearing Corporation, as a Trustee and a member of the Finance Committee of Manhattan College (2005-2008), and as a Trustee and a member of the Finance Committee of AHRC of Nassau County (2006-2008). Mr. Dirks is a member of the Independent Directors Council (IDC) Governing Council (2010-Present) and Board of Directors for The Brookville Center for Children's Services, Inc. (2009-present). |
Alan J. Lacy (57) | |
| Year of Election or Appointment: 2008 Mr. Lacy serves as Senior Adviser (2007-present) of Oak Hill Capital Partners, L.P. (private equity). Mr. Lacy also served as Chief Executive Officer (2000-2005) and Vice Chairman (2005-2006) of Sears Holdings Corporation and Sears, Roebuck and Co. (retail). In addition, Mr. Lacy serves as a member of the Board of Directors of The Western Union Company (global money transfer, 2006-present) and Bristol-Myers Squibb Company (global pharmaceuticals, 2007-present). Mr. Lacy is Chairman (2008-present) and a member (2006-present) of the Board of Trustees of The National Parks Conservation Association. |
Ned C. Lautenbach (66) | |
| Year of Election or Appointment: 2000 Mr. Lautenbach is Chairman of the Independent Trustees of the Equity and High Income Funds (2006-present). Mr. Lautenbach currently serves as the Lead Director of the Eaton Corporation Board of Directors (diversified industrial, 1997-present). Mr. Lautenbach is also a member of the Board of Directors of the Philharmonic Center for the Arts in Naples, Florida (1999-present); a member of the Board of Trustees of Fairfield University (2005-present); and a member of the Council on Foreign Relations (1994-present). Previously, Mr. Lautenbach was a Partner/Advisory Partner at Clayton, Dubilier & Rice, Inc. (private equity investment, 1998-2010), as well as a Director of Sony Corporation (2006-2007). |
Joseph Mauriello (66) | |
| Year of Election or Appointment: 2008 Prior to his retirement in January 2006, Mr. Mauriello served in numerous senior management positions including Deputy Chairman and Chief Operating Officer (2004-2005), and Vice Chairman of Financial Services (2002-2004) of KPMG LLP US (professional services, 1965-2005). Mr. Mauriello currently serves as a member of the Board of Directors of XL Group plc. (global insurance and re-insurance, 2006-present) and of Arcadia Resources Inc. (health care services and products, 2007- |
Cornelia M. Small (66) | |
| Year of Election or Appointment: 2005 Ms. Small is a member of the Board of Directors of the Teagle Foundation (2009-present). Ms. Small is also a member of the Investment Committee, and Chair (2008-present) and a member of the Board of Trustees of Smith College. In addition, Ms. Small serves on the Investment Committee of the Berkshire Taconic Community Foundation (2008- |
William S. Stavropoulos (71) | |
| Year of Election or Appointment: 2002 Mr. Stavropoulos is Vice Chairman of the Independent Trustees of the Equity and High Income Funds (2006-present). Mr. Stavropoulos serves as President and Founder of the Michigan Baseball Foundation, the Great Lakes Loons (2007-present). Mr. Stavropoulos is Chairman Emeritus of the Board of Directors of The Dow Chemical Company, where he previously served in numerous senior management positions, including President, CEO (1995-2000; 2002-2004), Chairman of the Executive Committee (2000-2006), and as a member of the Board of Directors (1990-2006). Currently, Mr. Stavropoulos is Chairman of Univar (global distributor of commodity and specialty chemicals, 2010-present), a Director of Teradata Corporation (data warehousing and technology solutions, 2008-present), Chemical Financial Corporation, Maersk Inc. (industrial conglomerate), Tyco International, Inc. (multinational manufacturing and services, 2007-present), and a member of the Advisory Board for Metalmark Capital (private equity investment, 2005- |
David M. Thomas (61) | |
| Year of Election or Appointment: 2008 Previously, Mr. Thomas served as Executive Chairman (2005-2006) and Chairman and Chief Executive Officer (2000-2005) of IMS Health, Inc. (pharmaceutical and healthcare information solutions). In addition, Mr. Thomas serves as a member of the Board of Directors of Fortune Brands, Inc. (consumer products), and Interpublic Group of Companies, Inc. (marketing communication, 2004-present). |
Michael E. Wiley (60) | |
| Year of Election or Appointment: 2008 Mr. Wiley also serves as a Director of Asia Pacific Exploration Consolidated (international oil and gas exploration and production, 2008-present). Mr. Wiley serves as a Director of Tesoro Corporation (independent oil refiner and marketer, 2005-present), and a Director of Bill Barrett Corporation (exploration and production, 2005-present). In addition, Mr. Wiley also serves as a Director of Post Oak Bank (privately-held bank, 2004-present). Previously, Mr. Wiley served as a member of the Board of Trustees of the University of Tulsa (2000-2006; 2007-2010), as a Senior Energy Advisor of Katzenbach Partners, LLC (consulting, 2006-2007), as an Advisory Director of Riverstone Holdings (private investment), Chairman, President, and CEO of Baker Hughes, Inc. (oilfield services, 2000-2004), and as Director of Spinnaker Exploration Company (exploration and production, 2001-2005). |
Annual Report
+ The information above includes each Trustee's principal occupation during the last five years and other information relating to the experience, attributes, and skills relevant to each Trustee's qualifications to serve as a Trustee, which led to the conclusion that each Trustee should serve as a Trustee for the fund.
Advisory Board Members and Executive Officers:
Correspondence intended for each executive officer, Edward C. Johnson 3d, and Peter S. Lynch may be sent to Fidelity Investments, 82 Devonshire Street, Boston, Massachusetts 02109.
Name, Age; Principal Occupation | |
Edward C. Johnson 3d (80) | |
| Year of Election or Appointment: 2011 Member of the Advisory Board of Fidelity's Equity and High Income Funds. Formerly Trustee and Chairman of the Board of Trustees of certain Trusts, Mr. Johnson serves as Chief Executive Officer, Chairman, and a Director of FMR LLC; Chairman and a Director of FMR; and Chairman and a Director of FMR Co., Inc. In addition, Mr. Johnson serves as Chairman and Director of FIL Limited. Previously, Mr. Johnson served as President of FMR LLC (2006-2007). |
Peter S. Lynch (66) | |
| Year of Election or Appointment: 2003 Member of the Advisory Board of Fidelity's Equity and High Income Funds. Mr. Lynch is Vice Chairman and a Director of FMR and FMR Co., Inc. In addition, Mr. Lynch serves as a Trustee of Boston College and as the Chairman of the Inner-City Scholarship Fund. Previously, Mr. Lynch served on the Special Olympics International Board of Directors (1997-2006). |
Kenneth B. Robins (41) | |
| Year of Election or Appointment: 2008 President and Treasurer of Fidelity's Equity and High Income Funds. Mr. Robins also serves as President and Treasurer (2010-present) and Assistant Treasurer (2009-present) of other Fidelity funds and is an employee of Fidelity Investments (2004-present). Previously, Mr. Robins served as Deputy Treasurer of the Fidelity funds (2005-2008) and Treasurer and Chief Financial Officer of The North Carolina Capital Management Trust: Cash and Term Portfolios (2006-2008). |
Bruce T. Herring (45) | |
| Year of Election or Appointment: 2006 Vice President of certain Equity Funds. Mr. Herring also serves as Chief Investment Officer and Director of Fidelity Management & Research (U.K.) Inc. (2010-present) and Group Chief Investments Officer of FMR. Previously, Mr. Herring served as Vice President (2005-2006) and Senior Vice President (2006-2007) of Fidelity Management & Research Company, Vice President of FMR Co., Inc. (2001-2007) and as a portfolio manager for Fidelity U.S. Equity Funds. |
Brian B. Hogan (46) | |
| Year of Election or Appointment: 2009 Vice President of certain Equity Funds and Vice President of Sector Funds. Mr. Hogan also serves as President of FMR's Equity Division (2009-present). Previously, Mr. Hogan served as Senior Vice President, Equity Research of FMR (2006-2009) and as a portfolio manager. |
Scott C. Goebel (42) | |
| Year of Election or Appointment: 2008 Secretary and Chief Legal Officer (CLO) of the Fidelity funds. Mr. Goebel also serves as Secretary and CLO of The North Carolina Capital Management Trust: Cash and Term Portfolio (2008-present); General Counsel, Secretary, and Senior Vice President of FMR (2008-present) and FMR Co., Inc. (2008-present); Deputy General Counsel of FMR LLC; Chief Legal Officer of Fidelity Management & Research (Hong Kong) Limited (2008-present) and Assistant Secretary of Fidelity Management & Research (Japan) Inc. (2008-present), Fidelity Investments Money Management, Inc. (2008-present), Fidelity Management & Research (U.K.) Inc. (2008-present), and Fidelity Research and Analysis Company (2008-present). Previously, Mr. Goebel served as Assistant Secretary of the Funds (2007-2008) and as Vice President and Secretary of Fidelity Distributors Corporation (FDC) (2005-2007). |
William C. Coffey (41) | |
| Year of Election or Appointment: 2009 Assistant Secretary of Fidelity's Equity and High Income Funds. Mr. Coffey also serves as Senior Vice President and Deputy General Counsel of FMR LLC (2010-present), and is an employee of Fidelity Investments. Previously, Mr. Coffey served as Vice President and Associate General Counsel of FMR LLC (2005-2009). |
Holly C. Laurent (56) | |
| Year of Election or Appointment: 2008 Anti-Money Laundering (AML) Officer of the Fidelity funds. Ms. Laurent also serves as AML Officer of The North Carolina Capital Management Trust: Cash and Term Portfolio (2008-present) and is an employee of Fidelity Investments. Previously, Ms. Laurent was Senior Vice President and Head of Legal for Fidelity Business Services India Pvt. Ltd. (2006-2008), and Senior Vice President, Deputy General Counsel and Group Head for FMR LLC (2005-2006). |
Christine Reynolds (52) | |
| Year of Election or Appointment: 2008 Chief Financial Officer of the Fidelity funds. Ms. Reynolds became President of Fidelity Pricing and Cash Management Services (FPCMS) in August 2008. Ms. Reynolds served as Chief Operating Officer of FPCMS (2007-2008). Previously, Ms. Reynolds served as President, Treasurer, and Anti-Money Laundering officer of the Fidelity funds (2004-2007). |
Kenneth A. Rathgeber (63) | |
| Year of Election or Appointment: 2004 Chief Compliance Officer of Fidelity's Equity and High Income Funds. Mr. Rathgeber is Chief Compliance Officer of Fidelity Management & Research (Hong Kong) Limited (2008-present), Fidelity Management & Research (Japan) Inc. (2008-present), FMR (2005-present), FMR Co., Inc. (2005-present), Fidelity Management & Research (U.K.) Inc. (2005-present), Fidelity Research & Analysis Company (2005-present), Fidelity Investments Money Management, Inc. (2005-present), Pyramis Global Advisors, LLC (2005-present), and Strategic Advisers, Inc. (2005-present). |
Jeffrey S. Christian (49) | |
| Year of Election or Appointment: 2009 Deputy Treasurer of the Fidelity funds. Mr. Christian is an employee of Fidelity Investments. Previously, Mr. Christian served as Chief Financial Officer (2008-2009) of certain Fidelity funds and Senior Vice President of Fidelity Pricing and Cash Management Services (FPCMS) (2004-2009). |
Bryan A. Mehrmann (49) | |
| Year of Election or Appointment: 2005 Deputy Treasurer of the Fidelity funds. Mr. Mehrmann is an employee of Fidelity Investments. |
Adrien E. Deberghes (43) | |
| Year of Election or Appointment: 2008 Deputy Treasurer of Fidelity's Equity and High Income Funds. Mr. Deberghes also serves as Assistant Treasurer of other Fidelity funds (2010-present) and is an employee of Fidelity Investments (2008- |
Stephanie J. Dorsey (41) | |
| Year of Election or Appointment: 2010 Assistant Treasurer of Fidelity's Equity and High Income Funds. Ms. Dorsey also serves as Deputy Treasurer of other Fidelity funds (2008-present) and is an employee of Fidelity Investments (2008- |
John R. Hebble (52) | |
| Year of Election or Appointment: 2009 Assistant Treasurer of Fidelity's Equity and High Income Funds. Mr. Hebble also serves as Treasurer and Chief Financial Officer of The North Carolina Capital Management Trust: Cash and Term Portfolio (2008-present), President and Treasurer of other Fidelity funds (2008-present) and is an employee of Fidelity Investments. |
Gary W. Ryan (52) | |
| Year of Election or Appointment: 2005 Assistant Treasurer of the Fidelity funds. Mr. Ryan is an employee of Fidelity Investments. Previously, Mr. Ryan served as Vice President of Fund Reporting in Fidelity Pricing and Cash Management Services (FPCMS) (1999-2005). |
Jonathan Davis (42) | |
| Year of Election or Appointment: 2010 Assistant Treasurer of the Fidelity funds. Mr. Davis is an employee of Fidelity Investments. Previously, Mr. Davis served as Vice President and Associate General Counsel of FMR LLC (2003-2010). |
Annual Report
Distributions (Unaudited)
A total of .02% of the dividends distributed during the fiscal year was derived from interest on U.S. Government securities which is generally exempt from state income tax.
Equity Income II designates 100% of the dividends distributed during the fiscal year as qualifying for the dividends-received deduction for corporate shareholders.
Equity Income II designates 100% of the dividends distributed during the fiscal year as amounts which may be taken into account as a dividend for the purposes of the maximum rate under section 1 (h)(11) of the Internal Revenue Code.
The fund will notify shareholders in January 2011 of amounts for use in preparing 2010 income tax returns.
Annual Report
Board Approval of Investment Advisory Contracts and Management Fees
Fidelity Equity-Income II Fund
Each year, the Board of Trustees, including the Independent Trustees (together, the Board), votes on the renewal of the management contract and sub-advisory agreements (together, the Advisory Contracts) for the fund. The Board, assisted by the advice of fund counsel and Independent Trustees' counsel, requests and considers a broad range of information relevant to the renewal of the Advisory Contracts throughout the year.
The Board meets regularly and considers at each of its meetings factors that are relevant to its annual consideration of the renewal of the fund's Advisory Contracts, including the services and support provided to the fund and its shareholders. The Board has established various standing committees, each composed of Independent Trustees with varying backgrounds, to which the Board has assigned specific subject matter responsibilities in order to enhance effective decision-making by the Board. The Board, acting directly and through its Committees, requests and receives information concerning the annual consideration of the renewal of the fund's Advisory Contracts. The Board also meets as needed to consider matters specifically related to the Board's annual consideration of the renewal of Advisory Contracts. Members of the Board may also meet with trustees of other Fidelity funds through ad hoc joint committees to discuss certain matters relevant to the Fidelity funds.
At its July 2010 meeting, the Board of Trustees, including the Independent Trustees, unanimously determined to renew the fund's Advisory Contracts. In reaching its determination, the Board considered all factors it believed relevant, including (i) the nature, extent, and quality of the services to be provided to the fund and its shareholders (including the investment performance of the fund); (ii) the competitiveness of the fund's management fee and total expenses; (iii) the total costs of the services to be provided by and the profits to be realized by Fidelity from its relationship with the fund; (iv) the extent to which economies of scale would be realized as the fund grows; and (v) whether fee levels reflect these economies of scale, if any, for the benefit of fund shareholders.
In considering whether to renew the Advisory Contracts for the fund, the Board reached a determination, with the assistance of fund counsel and Independent Trustees' counsel and through the exercise of its business judgment, that the renewal of the Advisory Contracts is in the best interests of fund shareholders and that the compensation to be received by Fidelity under the management contract is fair and reasonable. The Board's decision to renew the Advisory Contracts was not based on any single factor noted above, but rather was based on a comprehensive consideration of all the information provided to the Board at its meetings throughout the year. The Board, in reaching its determination to renew the Advisory Contracts, is aware that shareholders in the fund have a broad range of investment choices available to them, including a wide choice among mutual funds offered by Fidelity's competitors, and that the fund's shareholders, with the opportunity to review and weigh the disclosure provided by the fund in its prospectus and other public disclosures, have chosen to invest in this fund, managed by Fidelity.
Annual Report
Board Approval of Investment Advisory Contracts and
Management Fees - continued
Nature, Extent, and Quality of Services Provided. The Board considered the staffing within the investment adviser, FMR, and the sub-advisers (together, the Investment Advisers), including the backgrounds of the fund's investment personnel and the fund's investment objective and discipline. The Independent Trustees also had discussions with senior management of Fidelity's investment operations and investment groups. The Board considered the structure of the portfolio manager compensation program and whether this structure provides appropriate incentives to act in the best interest of the fund.
Resources Dedicated to Investment Management and Support Services. The Board and the equity research subcommittee of the Board's Fund Oversight Committee reviewed the size, education, and experience of the Investment Advisers' investment staff, their use of technology, and the Investment Advisers' approach to recruiting, training, and retaining portfolio managers and other research, advisory, and management personnel. The Board noted that Fidelity's analysts have access to a variety of technological tools and market and securities data that enable them to perform both fundamental and quantitative analysis and to specialize in various disciplines. The Board considered Fidelity's extensive global research capabilities that enable the Investment Advisers to aggregate data from various sources in an effort to produce positive investment results. The Board also considered that Fidelity's portfolio managers and analysts have access to daily portfolio attribution that allows for monitoring of a fund's portfolio, as well as an electronic communication system that provides immediate real-time access to research concerning issuers and credit enhancers. The Board noted FMR's continued focus on strengthening the organization and discipline of equity portfolio management and research.
Shareholder and Administrative Services. The Board considered (i) the nature, extent, quality, and cost of advisory, administrative, and shareholder services performed by the Investment Advisers and their affiliates under the Advisory Contracts and under separate agreements covering transfer agency, pricing and bookkeeping, and securities lending services for the fund; (ii) the nature and extent of the investment adviser's supervision of third party service providers, principally custodians and subcustodians; and (iii) the resources devoted to, and the record of compliance with, the fund's compliance policies and procedures. The Board also reviewed the allocation of fund brokerage, including allocations to brokers affiliated with the Investment Advisers, the use of brokerage commissions to pay fund expenses, and the use of "soft" commission dollars to pay for research services.
The Board noted that the growth of fund assets over time across the complex allows Fidelity to reinvest in the development of services designed to enhance the value or convenience of the Fidelity funds as investment vehicles. These services include 24-hour access to account information and market information through phone representatives and over the Internet, and investor education materials and asset allocation tools.
Annual Report
Investment in a Large Fund Family. The Board considered the benefits to shareholders of investing in a Fidelity fund, including the benefits of investing in a fund that is part of a large family of funds offering a variety of investment disciplines and providing a large variety of mutual fund investor services. The Board noted that Fidelity had taken, or had made recommendations that resulted in the Fidelity funds taking, a number of actions over the previous year that benefited particular funds, including (i) dedicating additional resources to investment research and restructuring and broadening the focus of the investment research teams; (ii) bolstering the senior management team that oversees asset management; (iii) launching Class F of certain funds as a lower-fee class available to Freedom K and Freedom Index Funds; (iv) lowering the initial investment minimums and ongoing balance requirements for Real Estate High Income Fund; (v) eliminating subsequent purchase minimums for all funds and adding a waiver of the investment minimum requirement for new accounts opened with the proceeds of a systematic withdrawal plan; (vi) eliminating the withdrawal minimum and maximum limits for systematic withdrawals from Advisor funds; (vii) expanding sales load waivers on Class A shares for Destiny Planholders and expanding Institutional Class eligibility for Class O Destiny Planholders; and (viii) changing certain Class A and Class T sales charge structures to further align them with industry practices.
Investment Performance. The Board considered whether the fund has operated in accordance with its investment objective, as well as its record of compliance with its investment restrictions. It also reviewed the fund's absolute investment performance for each class, as well as the fund's relative investment performance for each class measured over multiple periods against (i) a broad-based securities market index, and (ii) a peer group of mutual funds deemed appropriate by Fidelity and reviewed by the Board. The following charts considered by the Board show, over the one-, three-, and five-year periods ended December 31, 2009, as available, the cumulative total returns of Class K and the retail class of the fund, the cumulative total returns of a broad-based securities market index ("benchmark"), and a range of cumulative total returns of a peer group of mutual funds identified by Lipper Inc. as having an investment objective similar to that of the fund. The box within each chart shows the 25th percentile return (bottom of box) and the 75th percentile return (top of box) of the peer group. Returns shown above the box are in the first quartile and returns shown below the box are in the fourth quartile. The percentage beaten numbers noted below each chart correspond to the percentile box and represent the percentage of funds in the peer group whose performance was equal to or lower than that of the class indicated.
Annual Report
Board Approval of Investment Advisory Contracts and
Management Fees - continued
Fidelity Equity-Income II Fund
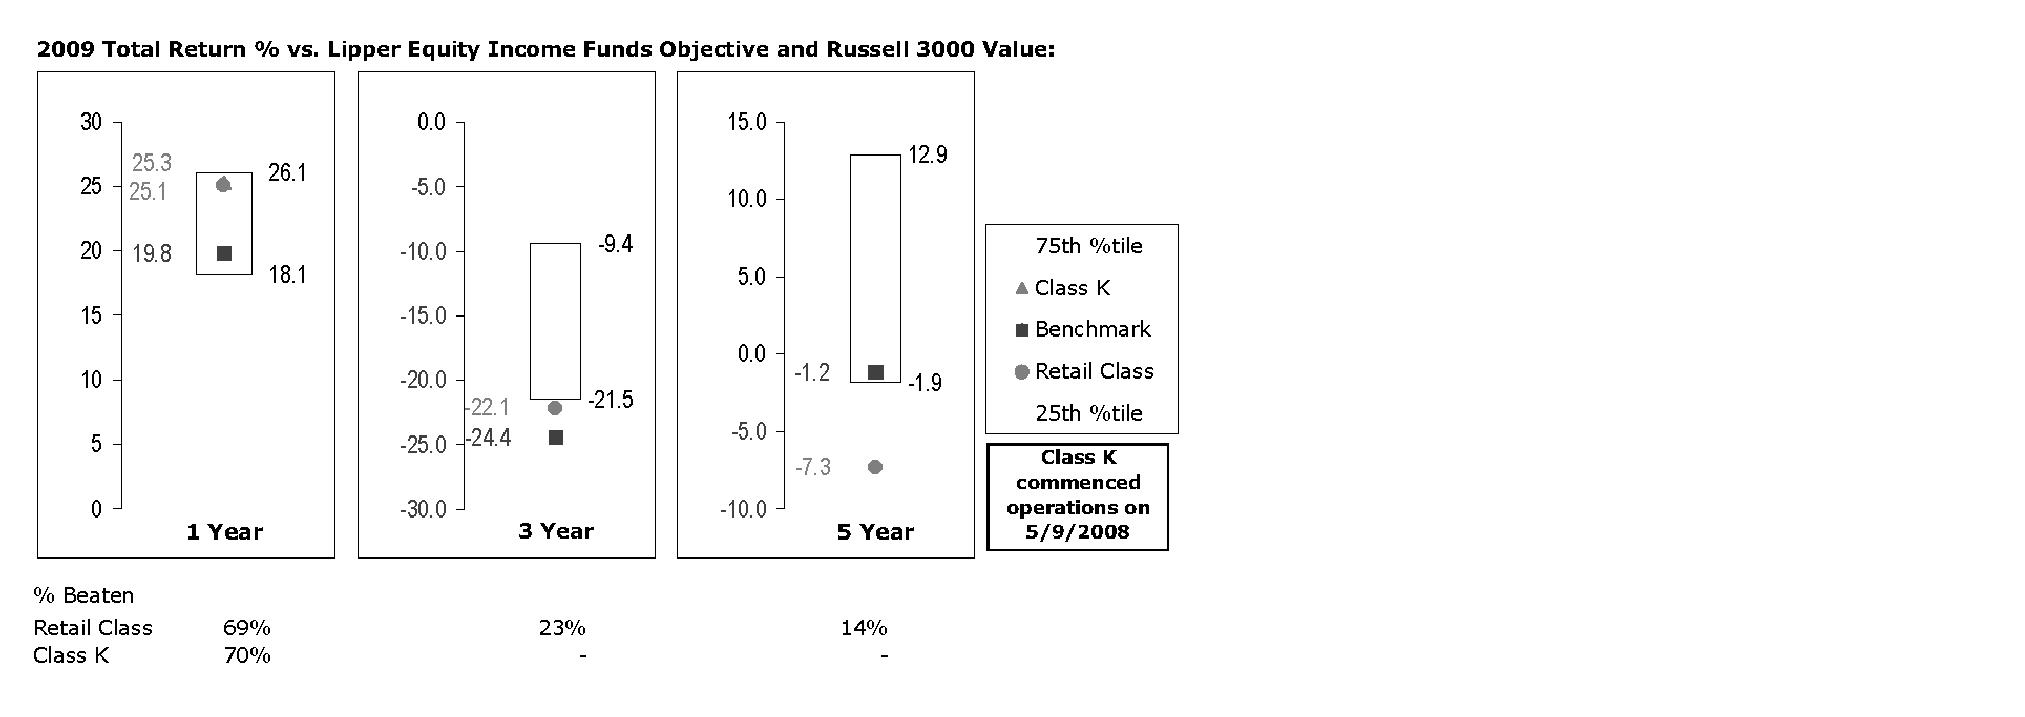
The Board reviewed the fund's relative investment performance against its peer group and noted that the performance of the retail class of the fund (the class with the longer performance record) was in the second quartile for the one-year period and the fourth quartile for the three- and five-year periods. The Board also noted that the investment performance of the retail class of the fund compared favorably to its benchmark for the one- and three-year periods, although the fund's five-year cumulative total return was lower than its benchmark. The Board considered that the variations in performance between the fund's classes reflect the variations in class expenses, which result in lower performance for the higher expense class. The Board also reviewed the fund's performance since inception as well as performance in the current year.
Based on its review, and giving particular weight to the nature and quality of the resources dedicated by the Investment Advisers to maintain and improve relative performance and factoring in the unprecedented market events in recent years, the Board concluded that the nature, extent, and quality of investment management and support services and of shareholder and administrative services provided to the fund will benefit the fund's shareholders, particularly in light of the Board's view that the fund's shareholders benefit from investing in a fund that is part of a large family of funds offering a variety of investment disciplines and services.
Competitiveness of Management Fee and Total Fund Expenses. The Board considered the fund's management fee and total expenses compared to "mapped groups" of competitive funds and classes. Fidelity creates "mapped groups" by combining similar Lipper investment objective categories that have comparable management fee characteristics. Combining Lipper investment objective categories aids the Board's management fee and total expense comparisons by broadening the competitive group used for comparison and by reducing the number of universes to which various Fidelity funds are compared.
Annual Report
Management Fee. The Board considered two proprietary management fee comparisons for the 12-month periods shown in the chart below. The group of Lipper funds used by the Board for management fee comparisons is referred to below as the "Total Mapped Group." The Total Mapped Group is broader than the Lipper peer group used by the Board for performance comparisons because the Total Mapped Group combines several Lipper investment objective categories while the Lipper peer group does not. The Total Mapped Group comparison focuses on a fund's standing relative to the total universe of comparable funds available to investors, in terms of gross management fees before expense reimbursements or caps. "TMG %" represents the percentage of funds in the Total Mapped Group that had management fees that were lower than the fund's. For example, a TMG % of 12% means that 88% of the funds in the Total Mapped Group had higher management fees than the fund. The "Asset-Size Peer Group" (ASPG) comparison focuses on a fund's standing relative to non-Fidelity funds similar in size to the fund within the Total Mapped Group. The ASPG represents at least 15% of the funds in the Total Mapped Group with comparable asset size and management fee characteristics, subject to a minimum of 50 funds (or all funds in the Total Mapped Group if fewer than 50). Additional information, such as the ASPG quartile in which the fund's management fee ranked, is also included in the chart and considered by the Board.
Fidelity Equity-Income II Fund
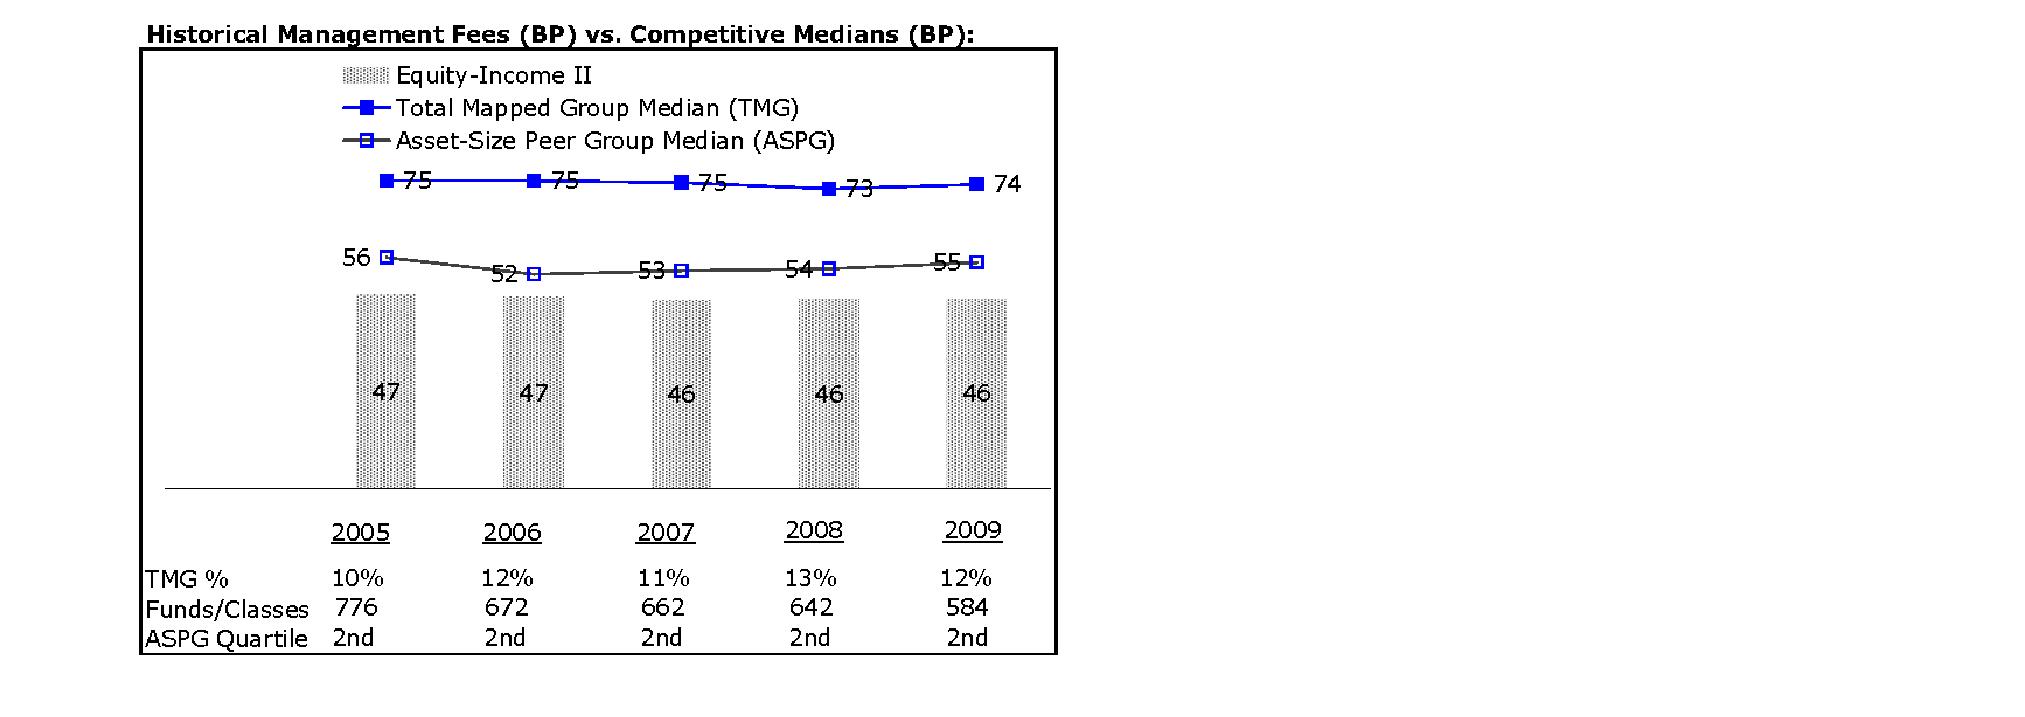
Annual Report
Board Approval of Investment Advisory Contracts and
Management Fees - continued
The Board noted that the fund's management fee ranked below the median of its Total Mapped Group and below the median of its ASPG for 2009.
Based on its review, the Board concluded that the fund's management fee is fair and reasonable in light of the services that the fund receives and the other factors considered.
Total Expenses. In its review of each class's total expenses, the Board considered the fund's management fee as well as other fund or class expenses, as applicable, such as transfer agent fees, pricing and bookkeeping fees, and custodial, legal, and audit fees. The Board also noted the effects of any waivers and reimbursements on fees and expenses. As part of its review, the Board also considered current and historical total expenses of each class of the fund compared to competitive fund median expenses. Each class of the fund is compared to those funds and classes in the Total Mapped Group (used by the Board for management fee comparisons) that have a similar sales load structure.
The Board noted that the total expenses of each class ranked below its competitive median for 2009.
Fees Charged to Other Fidelity Clients. The Board also considered Fidelity fee structures and other information with respect to clients of FMR and its affiliates, such as other mutual funds advised or subadvised by FMR or its affiliates, pension plan clients, and other institutional clients. In March 2010, the Board created an ad hoc joint committee with the board of other Fidelity funds (the Committee) to review and compare Fidelity's institutional investment advisory business with its business of providing services to the Fidelity funds, including the differences in services provided, fees charged, and costs incurred, as well as competition in their respective marketplaces.
Based on its review of total expenses and fees charged to other Fidelity clients, the Board concluded that the total expenses of each class of the fund were reasonable in light of the services that the fund and its shareholders receive and the other factors considered, including the findings of the Committee.
Costs of the Services and Profitability. The Board considered the revenues earned and the expenses incurred by Fidelity in conducting the business of developing, marketing, distributing, managing, administering and servicing the fund and its shareholders. The Board also considered the level of Fidelity's profits in respect of all the Fidelity funds.
On an annual basis, FMR presents to the Board Fidelity's profitability for the fund. Fidelity calculates the profitability for each fund, as well as aggregate profitability for groups of Fidelity funds and all Fidelity funds, using a series of detailed revenue and cost allocation methodologies which originate with the audited books and records of Fidelity. The Audit Committee of the Board reviews any significant changes from the prior year's methodologies.
Annual Report
PricewaterhouseCoopers LLP (PwC), independent registered public accounting firm and auditor to Fidelity and certain Fidelity funds, has been engaged annually by the Board as part of the Board's assessment of Fidelity's profitability analysis. PwC's engagement includes the review and assessment of Fidelity's methodologies used in determining the revenues and expenses attributable to Fidelity's mutual fund business, and completion of agreed-upon procedures surrounding the mathematical accuracy of fund profitability and its conformity to allocation methodologies. After considering PwC's reports issued under the engagement and information provided by Fidelity, the Board believes that while other allocation methods may also be reasonable, Fidelity's profitability methodologies are reasonable in all material respects.
The Board has also reviewed Fidelity's non-fund businesses and fall-out benefits related to the mutual fund business as well as cases where Fidelity's affiliates may benefit from or be related to the fund's business.
The Board considered the costs of the services provided by and the profits realized by Fidelity in connection with the operation of the fund and were satisfied that the profitability was not excessive in the circumstances.
Economies of Scale. The Board considered whether there have been economies of scale in respect of the management of the Fidelity funds, whether the Fidelity funds (including the fund) have appropriately benefited from any such economies of scale, and whether there is potential for realization of any further economies of scale. The Board considered the extent to which the fund will benefit from economies of scale through increased services to the fund, through waivers or reimbursements, or through fee or expense reductions.
In February 2009, the Board and the board of other Fidelity funds created an ad hoc committee (the Economies of Scale Committee) to analyze whether FMR attains economies of scale in respect of the management and servicing of the Fidelity funds, whether the Fidelity funds have appropriately benefited from such economies of scale, and whether there is potential for realization of any further economies of scale.
The Board recognized that the fund's management contract incorporates a "group fee" structure, which provides for lower group fee rates as total fund assets under FMR's management increase, and for higher group fee rates as total fund assets under FMR's management decrease. FMR calculates the group fee rates based on a tiered asset "breakpoint" schedule that varies based on asset class. The Board considered that the group fee is designed to deliver the benefits of economies of scale to fund shareholders when total Fidelity fund assets increase, even if assets of any particular fund are unchanged or have declined, because some portion of Fidelity's costs are attributable to services provided to all Fidelity funds, and all funds benefit if those costs can be allocated among more assets. The Board concluded that, given the group fee structure, fund shareholders will benefit from lower management fees as assets under FMR's management increase at the fund complex level, regardless of whether Fidelity achieves any such economies of scale.
Annual Report
Board Approval of Investment Advisory Contracts and
Management Fees - continued
The Board concluded, considering the findings of the Economies of Scale Committee, that any potential economies of scale are being appropriately shared between fund shareholders and Fidelity.
Additional Information Requested by the Board. In order to develop fully the factual basis for consideration of the Fidelity funds' Advisory Contracts, the Board requested and received additional information on certain topics, including (i) fund performance trends, actions to be taken by FMR to improve certain funds' overall performance, and Fidelity's long-term strategies for certain funds; (ii) portfolio manager changes that have occurred during the past year and length of portfolio manager tenure for different categories of funds over time; (iii) Fidelity's compensation structure for portfolio managers, research analysts, and other key personnel, the rationale for the compensation structure, and how the compensation structure provides appropriate performance incentives; (iv) the amount of the investment that each portfolio manager has made in the Fidelity fund(s) that he or she manages; (v) management and other fees paid by FMR to affiliated sub-advisers on behalf of the Fidelity funds; (vi) Fidelity's fee structures and rationale for recommending different fees among different categories of funds; (vii) Fidelity's rationale for recommending which funds should have a performance adjustment component as part of their management fees; (viii) the rationale for any differences between fund fee structures and fee structures in place for other Fidelity clients; and (ix) explanations regarding the relative total expenses borne by certain funds and classes, total expense competitive trends, and actions that might be taken by FMR to reduce total expenses for certain funds and classes.
Based on its evaluation of all of the conclusions noted above, and after considering all factors it believed relevant, the Board ultimately concluded that the advisory fee structures are fair and reasonable, and that the fund's Advisory Contracts should be renewed.
Annual Report
Investment Adviser
Fidelity Management & Research Company
Boston, MA
Investment Sub-Advisers
FMR Co., Inc.
Fidelity Management & Research (U.K.) Inc.
Fidelity Research & Analysis Company
Fidelity Management & Research
(Hong Kong) Limited
Fidelity Management & Research (Japan) Inc.
General Distributor
Fidelity Distributors Corporation
Boston, MA
Transfer and Service Agents
Fidelity Investments Institutional
Operations Company, Inc.
Boston, MA
Fidelity Service Company, Inc.
Boston, MA
Custodian
The Northern Trust Company
Chicago, IL
The Fidelity Telephone Connection
Mutual Fund 24-Hour Service
Exchanges/Redemptions
and Account Assistance 1-800-544-6666
Product Information 1-800-544-8888
Retirement Accounts 1-800-544-4774
(8 a.m. - 9 p.m.)
TDD Service 1-800-544-0118
for the deaf and hearing impaired
(9 a.m. - 9 p.m. Eastern time)
Fidelity Automated Service
Telephone (FAST®)
1-800-544-5555
Automated line for quickest service
EII-UANN-0111
1.786707.107
Fidelity®
Equity-Income II
Fund -
Class K
Annual Report
November 30, 2010
(2_fidelity_logos) (Registered_Trademark)
Contents
Chairman's Message | The Chairman's message to shareholders. | |
Performance | How the fund has done over time. | |
Management's Discussion of Fund Performance | The Portfolio Manager's review of fund performance and strategy. | |
Shareholder Expense Example | An example of shareholder expenses. | |
Investment Changes | A summary of major shifts in the fund's investments over the past six months. | |
Investments | A complete list of the fund's investments with their market values. | |
Financial Statements | Statements of assets and liabilities, operations, and changes in net assets, as well as financial highlights. | |
Notes | Notes to the financial statements. | |
Report of Independent Registered Public Accounting Firm |
| |
Trustees and Officers |
| |
Distributions |
| |
Board Approval of Investment Advisory Contracts and Management Fees |
|
To view a fund's proxy voting guidelines and proxy voting record for the 12-month period ended June 30, visit http://www.fidelity.com/proxyvotingresults or visit the Securities and Exchange Commission's (SEC) web site at http://www.sec.gov. You may also call 1-800-835-5092 to request a free copy of the proxy voting guidelines.
Standard & Poor's, S&P and S&P 500 are registered service marks of The McGraw-Hill Companies, Inc. and have been licensed for use by Fidelity Distributors Corporation.
Other third party marks appearing herein are the property of their respective owners.
All other marks appearing herein are registered or unregistered trademarks or service marks of FMR LLC or an affiliated company.
Annual Report
This report and the financial statements contained herein are submitted for the general information of the shareholders of the fund. This report is not authorized for distribution to prospective investors in the fund unless preceded or accompanied by an effective prospectus.
A fund files its complete schedule of portfolio holdings with the SEC for the first and third quarters of each fiscal year on Form N-Q. Forms N-Q are available on the SEC's web site at http://www.sec.gov. A fund's Forms N-Q may be reviewed and copied at the SEC's Public Reference Room in Washington, DC. Information regarding the operation of the SEC's Public Reference Room may be obtained by calling 1-800-SEC-0330. For a complete list of a fund's portfolio holdings, view the most recent holdings listing, semiannual report, or annual report on Fidelity's web site at http://www.fidelity.com, http://www.advisor.fidelity.com or http://www.401k.com, as applicable.
NOT FDIC INSURED • MAY LOSE VALUE • NO BANK GUARANTEE
Neither the fund nor Fidelity Distributors Corporation is a bank.
Annual Report
Chairman's Message
(photo_of_James_C_Curvey)
Dear Shareholder:
Equities have staged a rally in the second half of 2010, shaking off concerns about the European debt crisis and the possibility of a double-dip recession in the U.S. Although the short-term surge pushed major equity indexes back into positive territory for the year, several questions remain about the longer-term outlook, including lackluster economic growth and persistently high unemployment. Financial markets are always unpredictable, of course, but there also are several time-tested investment principles that can help put the odds in your favor.
One of the basic tenets is to invest for the long term. Over time, riding out the markets' inevitable ups and downs has proven much more effective than selling into panic or chasing the hottest trend. Even missing only a few of the markets' best days can significantly diminish investor returns. Patience also affords the benefits of compounding - of earning interest on additional income or reinvested dividends and capital gains. There can be tax advantages and cost benefits to consider as well. While staying the course doesn't eliminate risk, it can considerably lessen the effect of short-term declines.
You can further manage your investing risk through diversification. And today, more than ever, geographic diversification should be taken into account. Studies indicate that asset allocation is the single most important determinant of a portfolio's long-term success. The right mix of stocks, bonds and cash - aligned to your particular risk tolerance and investment objective - is very important. Age-appropriate rebalancing is also an essential aspect of asset allocation. For younger investors, an emphasis on equities - which historically have been the best-performing asset class over time - is encouraged. As investors near their specific goal, such as retirement or sending a child to college, consideration may be given to replacing volatile assets (e.g. common stocks) with more-stable fixed investments (bonds or savings plans).
A third principle - investing regularly - can help lower the average cost of your purchases. Investing a certain amount of money each month or quarter helps ensure you won't pay for all your shares at market highs. This strategy - known as dollar cost averaging - also reduces "emotion" from investing, helping shareholders avoid selling weak performers just prior to an upswing, or chasing a hot performer just before a correction.
We invite you to contact us via the Internet, through our Investor Centers or by phone. It is our privilege to provide you the information you need to make the investments that are right for you.
Sincerely,
(The acting chairman's signature appears here.)
James C. Curvey
Acting Chairman
Annual Report
Performance: The Bottom Line
Average annual total return reflects the change in the value of an investment, assuming reinvestment of the class' distributions from dividend income and capital gains (the profits earned upon the sale of securities that have grown in value, if any) and assuming a constant rate of performance each year. The $10,000 table and the fund's returns do not reflect the deduction of taxes that a shareholder would pay on fund distributions or the redemption of fund shares. During periods of reimbursement by Fidelity, a fund's total return will be greater than it would be had the reimbursement not occurred. How a fund did yesterday is no guarantee of how it will do tomorrow.
Average Annual Total Returns
Periods ended November 30, 2010 | Past 1 | Past 5 | Past 10 |
Class KA | 5.80% | -1.44% | 1.59% |
A The initial offering of Class K shares took place on May 9, 2008. Returns prior to May 9, 2008 are
those of Fidelity® Equity-Income II Fund, the original class of the fund.
$10,000 Over 10 Years
Let's say hypothetically that $10,000 was invested in Fidelity® Equity-Income II Fund - Class K, a class of the fund, on November 30, 2000. The chart shows how the value of your investment would have changed, and also shows how the Russell 3000® Value Index performed over the same period. The initial offering of Class K took place on May 9, 2008. See above for additional information regarding the performance of Class K.
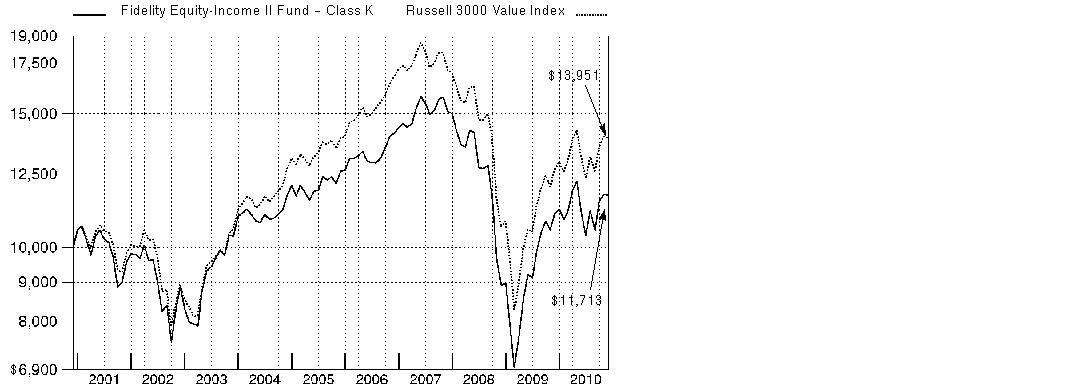
Annual Report
Management's Discussion of Fund Performance
Market Recap: Despite bouts of volatility and concern over European debt woes, major U.S. stock markets recorded solid gains for the year ending November 30, 2010, lifted by economic optimism, encouraging earnings reports and a wave of corporate mergers. Stocks extended their 2009 upswing in the first five months of the period on signs the Great Recession was over. However, high unemployment in the U.S. and sovereign debt problems in Europe sent equities falling during the spring. Markets vacillated for much of the summer before regaining momentum in the fall, with the large-cap S&P 500® Index posting its best September/October performance since 1998. By November, however, Ireland's debt took center stage, along with slower growth in China and additional quantitative easing in the U.S., unnerving investors and cooling down markets. For the full 12 months, the S&P 500® rose 9.94%, while the blue-chip-laden Dow Jones Industrial AverageSM added 9.33%. Both were bested by the technology-heavy Nasdaq Composite® Index, which advanced 17.58%. Overall, it was a broad-based rally, with economically sensitive sectors among the biggest gainers. Stocks of mid- and small-sized companies fared better than their larger-cap counterparts, advancing 24.04% and 26.98%, respectively, as measured by the Russell Midcap® and Russell 2000® indexes.
Comments from Stephen Petersen, Portfolio Manager of Fidelity ® Equity-Income II Fund: For the year, the fund's Class K shares returned 5.80%, trailing the 10.08% gain of the Russell 3000® Value Index. The largest detractor was security selection within consumer discretionary, especially auto-related names, but the negative impact was more than offset by overweighting this strong-performing group. Positioning in financials also detracted, as did poor picks in energy, information technology and utilities. On the upside, the fund's holdings in industrials and telecommunication services helped, as did overweighting the energy and technology sectors. On an individual security basis, large positions in financial services giant Bank of America and brokerage firm Morgan Stanley hurt the most. Within consumer discretionary, individual detractors included Toll Brothers, which struggled due to a disappointing housing market recovery, and tax-preparation firm H&R Block, which felt the impact of a reduction in the number of tax filers. The biggest boost came from timely ownership of Exxon Mobil, followed by stakes in telecom firm Qwest Communications International and truck engine maker Cummins.
The views expressed above reflect those of the portfolio manager(s) only through the end of the period as stated on the cover of this report and do not necessarily represent the views of Fidelity or any other person in the Fidelity organization. Any such views are subject to change at any time based upon market or other conditions and Fidelity disclaims any responsibility to update such views. These views may not be relied on as investment advice and, because investment decisions for a Fidelity fund are based on numerous factors, may not be relied on as an indication of trading intent on behalf of any Fidelity fund.
Annual Report
Shareholder Expense Example
As a shareholder of the Fund, you incur two types of costs: (1) transaction costs, and (2) ongoing costs, including management fees and other Fund expenses. This Example is intended to help you understand your ongoing costs (in dollars) of investing in the Fund and to compare these costs with the ongoing costs of investing in other mutual funds.
The Example is based on an investment of $1,000 invested at the beginning of the period and held for the entire period (June 1, 2010 to November 30, 2010).
Actual Expenses
The first line of the accompanying table for each class of the Fund provides information about actual account values and actual expenses. You may use the information in this line, together with the amount you invested, to estimate the expenses that you paid over the period. Simply divide your account value by $1,000.00 (for example, an $8,600 account value divided by $1,000.00 = 8.6), then multiply the result by the number in the first line for a class of the Fund under the heading entitled "Expenses Paid During Period" to estimate the expenses you paid on your account during this period. A small balance maintenance fee of $12.00 that is charged once a year may apply for certain accounts with a value of less than $2,000. This fee is not included in the table below. If it was, the estimate of expenses you paid during the period would be higher, and your ending account value lower, by this amount. In addition, the Fund, as a shareholder in the underlying Fidelity Central Funds, will indirectly bear its pro-rata share of the fees and expenses incurred by the underlying Fidelity Central Funds. These fees and expenses are not included in the Fund's annualized expense ratio used to calculate the expense estimate in the table below.
Hypothetical Example for Comparison Purposes
The second line of the accompanying table for each class of the Fund provides information about hypothetical account values and hypothetical expenses based on a Class' actual expense ratio and an assumed rate of return of 5% per year before expenses, which is not the Class' actual return. The hypothetical account values and expenses may not be used to estimate the actual ending account balance or expenses you paid for the period. You may use this information to compare the ongoing costs of investing in the Fund and other funds. To do so, compare this 5% hypothetical example with the 5% hypothetical examples that appear in the shareholder reports of the other funds. A small balance maintenance fee of $12.00 that is charged once a year may apply for certain accounts with a value of less than $2,000. This fee is not included in the table below. If it was, the estimate of expenses you paid during the period would be higher, and your ending account value lower, by this amount. In addition, the Fund, as a shareholder in the underlying Fidelity Central Funds, will indirectly bear its pro-rata share of the fees and expenses incurred by the underlying Fidelity Central Funds. These fees and expenses are not included in the Fund's annualized expense ratio used to calculate the expense estimate in the table below.
Please note that the expenses shown in the table are meant to highlight your ongoing costs only and do not reflect any transaction costs. Therefore, the second line of the table is useful in comparing ongoing costs only, and will not help you determine the relative total costs of owning different funds.
Annual Report
| Annualized Expense Ratio | Beginning | Ending | Expenses Paid |
Equity-Income II | .69% |
|
|
|
Actual |
| $ 1,000.00 | $ 1,051.60 | $ 3.55 |
HypotheticalA |
| $ 1,000.00 | $ 1,021.61 | $ 3.50 |
Class K | .54% |
|
|
|
Actual |
| $ 1,000.00 | $ 1,053.00 | $ 2.78 |
HypotheticalA |
| $ 1,000.00 | $ 1,022.36 | $ 2.74 |
A 5% return per year before expenses
* Expenses are equal to each Class' annualized expense ratio, multiplied by the average account value over the period, multiplied by 183/365 (to reflect the one-half year period).
Annual Report
Investment Changes (Unaudited)
Top Ten Stocks as of November 30, 2010 | ||
| % of fund's | % of fund's net assets |
JPMorgan Chase & Co. | 3.2 | 3.7 |
Wells Fargo & Co. | 3.1 | 3.4 |
Chevron Corp. | 2.5 | 2.4 |
AT&T, Inc. | 2.3 | 2.4 |
Exxon Mobil Corp. | 2.2 | 3.2 |
Pfizer, Inc. | 2.1 | 2.1 |
Bank of America Corp. | 2.1 | 3.6 |
PNC Financial Services Group, Inc. | 2.0 | 2.5 |
Royal Dutch Shell PLC Class A sponsored ADR | 1.6 | 1.5 |
General Electric Co. | 1.6 | 1.4 |
| 22.7 | |
Top Five Market Sectors as of November 30, 2010 | ||
| % of fund's | % of fund's net assets |
Financials | 26.3 | 27.7 |
Consumer Discretionary | 14.8 | 16.2 |
Energy | 14.4 | 15.2 |
Industrials | 11.2 | 10.6 |
Health Care | 8.5 | 6.8 |
Asset Allocation (% of fund's net assets) | |||||||
As of November 30, 2010 * | As of May 31, 2010 ** | ||||||
| Stocks 96.6% |
| | Stocks 97.9% |
| ||
| Convertible |
| | Convertible |
| ||
| Short-Term |
| | Short-Term |
| ||
* Foreign investments | 11.6% |
| ** Foreign investments | 12.2% |
| ||

Annual Report
Investments November 30, 2010
Showing Percentage of Net Assets
Common Stocks - 96.4% | |||
Shares | Value (000s) | ||
CONSUMER DISCRETIONARY - 13.7% | |||
Auto Components - 1.3% | |||
Johnson Controls, Inc. | 1,084,990 | $ 39,537 | |
Michelin CGDE Series B | 199,256 | 13,478 | |
The Goodyear Tire & Rubber Co. (a) | 1,526,234 | 14,591 | |
| 67,606 | ||
Automobiles - 1.7% | |||
Daimler AG (Germany) (a) | 280,476 | 18,153 | |
Ford Motor Co. (a) | 1,044,086 | 16,643 | |
Harley-Davidson, Inc. | 1,273,858 | 39,846 | |
Thor Industries, Inc. | 192,700 | 5,690 | |
Winnebago Industries, Inc. (a) | 374,600 | 3,926 | |
| 84,258 | ||
Diversified Consumer Services - 0.4% | |||
H&R Block, Inc. | 1,654,800 | 20,834 | |
Household Durables - 3.7% | |||
KB Home | 276,700 | 3,127 | |
Lennar Corp. Class A | 562,700 | 8,547 | |
Newell Rubbermaid, Inc. | 1,574,174 | 26,399 | |
PulteGroup, Inc. (a) | 639,300 | 4,002 | |
Stanley Black & Decker, Inc. | 654,786 | 38,979 | |
Techtronic Industries Co. Ltd. | 3,853,000 | 4,188 | |
Toll Brothers, Inc. (a) | 4,402,250 | 79,020 | |
Whirlpool Corp. | 355,488 | 25,951 | |
| 190,213 | ||
Internet & Catalog Retail - 0.2% | |||
Liberty Media Corp. Interactive Series A (a) | 776,284 | 12,001 | |
Media - 2.2% | |||
Belo Corp. Series A (a) | 912,073 | 5,290 | |
Comcast Corp.: | |||
Class A | 998,400 | 19,968 | |
Class A (special) (non-vtg.) | 839,800 | 15,931 | |
The Walt Disney Co. | 1,270,614 | 46,390 | |
Time Warner, Inc. | 897,617 | 26,471 | |
| 114,050 | ||
Multiline Retail - 1.5% | |||
Kohl's Corp. (a) | 385,412 | 21,745 | |
Macy's, Inc. | 1,021,919 | 26,243 | |
Target Corp. | 481,156 | 27,397 | |
Tuesday Morning Corp. (a) | 468,400 | 2,436 | |
| 77,821 | ||
Common Stocks - continued | |||
Shares | Value (000s) | ||
CONSUMER DISCRETIONARY - continued | |||
Specialty Retail - 2.3% | |||
Home Depot, Inc. | 1,902,200 | $ 57,465 | |
Lowe's Companies, Inc. | 952,500 | 21,622 | |
OfficeMax, Inc. (a) | 553,000 | 9,451 | |
RadioShack Corp. | 523,800 | 9,664 | |
Staples, Inc. | 907,116 | 19,966 | |
| 118,168 | ||
Textiles, Apparel & Luxury Goods - 0.4% | |||
Phillips-Van Heusen Corp. | 159,454 | 10,817 | |
Warnaco Group, Inc. (a) | 152,059 | 8,188 | |
| 19,005 | ||
TOTAL CONSUMER DISCRETIONARY | 703,956 | ||
CONSUMER STAPLES - 5.3% | |||
Beverages - 1.0% | |||
Carlsberg AS Series B | 129,700 | 12,241 | |
PepsiCo, Inc. | 153,241 | 9,904 | |
The Coca-Cola Co. | 447,390 | 28,262 | |
| 50,407 | ||
Food & Staples Retailing - 1.2% | |||
CVS Caremark Corp. | 396,300 | 12,285 | |
Kroger Co. | 989,900 | 23,312 | |
Walgreen Co. | 691,427 | 24,096 | |
Winn-Dixie Stores, Inc. (a) | 547,110 | 3,326 | |
| 63,019 | ||
Food Products - 0.4% | |||
Nestle SA | 417,105 | 22,670 | |
Household Products - 1.5% | |||
Kimberly-Clark Corp. | 220,421 | 13,642 | |
Procter & Gamble Co. | 1,046,810 | 63,929 | |
| 77,571 | ||
Personal Products - 0.2% | |||
Avon Products, Inc. | 306,359 | 8,750 | |
Tobacco - 1.0% | |||
Philip Morris International, Inc. | 876,959 | 49,890 | |
TOTAL CONSUMER STAPLES | 272,307 | ||
Common Stocks - continued | |||
Shares | Value (000s) | ||
ENERGY - 14.3% | |||
Energy Equipment & Services - 2.6% | |||
Baker Hughes, Inc. | 830,763 | $ 43,333 | |
Halliburton Co. | 707,345 | 26,766 | |
Noble Corp. | 1,085,891 | 36,833 | |
Pride International, Inc. (a) | 602,129 | 18,726 | |
Transocean Ltd. (a) | 114,028 | 7,643 | |
| 133,301 | ||
Oil, Gas & Consumable Fuels - 11.7% | |||
Anadarko Petroleum Corp. | 443,098 | 28,429 | |
Apache Corp. | 198,400 | 21,356 | |
BP PLC sponsored ADR | 1,117,542 | 44,702 | |
Chevron Corp. | 1,584,970 | 128,335 | |
ConocoPhillips | 881,915 | 53,065 | |
CONSOL Energy, Inc. | 515,700 | 21,639 | |
Devon Energy Corp. | 204,786 | 14,452 | |
Exxon Mobil Corp. | 1,635,885 | 113,792 | |
Marathon Oil Corp. | 745,068 | 24,937 | |
Occidental Petroleum Corp. | 451,795 | 39,835 | |
Royal Dutch Shell PLC Class A sponsored ADR (d) | 1,381,600 | 83,822 | |
Southwestern Energy Co. (a) | 723,030 | 26,174 | |
| 600,538 | ||
TOTAL ENERGY | 733,839 | ||
FINANCIALS - 25.4% | |||
Capital Markets - 4.5% | |||
Bank of New York Mellon Corp. | 1,523,010 | 41,106 | |
Bank Sarasin & Co. Ltd. Series B (Reg.) | 234,912 | 8,765 | |
Goldman Sachs Group, Inc. | 344,597 | 53,805 | |
Morgan Stanley | 2,647,392 | 64,755 | |
State Street Corp. | 786,700 | 33,985 | |
UBS AG (a) | 621,000 | 9,354 | |
UBS AG (NY Shares) (a) | 1,476,635 | 22,253 | |
| 234,023 | ||
Commercial Banks - 8.5% | |||
Associated Banc-Corp. | 1,929,552 | 24,689 | |
Barclays PLC | 5,065,833 | 20,351 | |
BB&T Corp. | 1,254,403 | 29,102 | |
BNP Paribas SA | 40,500 | 2,397 | |
Comerica, Inc. | 455,900 | 16,636 | |
Huntington Bancshares, Inc. | 1,520,800 | 8,874 | |
Common Stocks - continued | |||
Shares | Value (000s) | ||
FINANCIALS - continued | |||
Commercial Banks - continued | |||
KeyCorp | 2,964,574 | $ 22,323 | |
Mitsubishi UFJ Financial Group, Inc. sponsored ADR | 3,711,800 | 17,483 | |
PNC Financial Services Group, Inc. | 1,931,400 | 104,006 | |
U.S. Bancorp, Delaware | 1,370,100 | 32,581 | |
Wells Fargo & Co. | 5,850,408 | 159,190 | |
| 437,632 | ||
Consumer Finance - 1.4% | |||
American Express Co. | 475,231 | 20,539 | |
Capital One Financial Corp. | 277,933 | 10,347 | |
Discover Financial Services | 1,673,300 | 30,588 | |
SLM Corp. (a) | 867,281 | 10,017 | |
| 71,491 | ||
Diversified Financial Services - 7.4% | |||
Bank of America Corp. | 9,954,173 | 108,998 | |
Citigroup, Inc. (a) | 15,367,311 | 64,543 | |
CME Group, Inc. | 35,388 | 10,194 | |
JPMorgan Chase & Co. | 4,465,753 | 166,935 | |
Moody's Corp. (d) | 1,118,580 | 30,012 | |
| 380,682 | ||
Insurance - 1.4% | |||
Berkshire Hathaway, Inc. Class B (a) | 107,800 | 8,590 | |
First American Financial Corp. | 577,562 | 8,184 | |
Hartford Financial Services Group, Inc. | 495,700 | 11,034 | |
Marsh & McLennan Companies, Inc. | 468,900 | 11,760 | |
Unum Group | 1,172,809 | 25,204 | |
XL Capital Ltd. Class A | 386,032 | 7,589 | |
| 72,361 | ||
Real Estate Investment Trusts - 1.6% | |||
Boston Properties, Inc. | 125,575 | 10,523 | |
Camden Property Trust (SBI) | 141,673 | 7,235 | |
HCP, Inc. | 660,323 | 21,744 | |
ProLogis Trust | 327,800 | 4,265 | |
Rayonier, Inc. | 163,429 | 8,328 | |
Segro PLC | 1,191,112 | 5,063 | |
Ventas, Inc. | 257,373 | 13,196 | |
Weyerhaeuser Co. | 661,308 | 11,037 | |
| 81,391 | ||
Real Estate Management & Development - 0.6% | |||
CB Richard Ellis Group, Inc. Class A (a) | 971,608 | 18,645 | |
Common Stocks - continued | |||
Shares | Value (000s) | ||
FINANCIALS - continued | |||
Real Estate Management & Development - continued | |||
Indiabulls Real Estate Ltd. (a) | 2,558,497 | $ 8,589 | |
Unite Group PLC (a) | 631,797 | 1,839 | |
| 29,073 | ||
TOTAL FINANCIALS | 1,306,653 | ||
HEALTH CARE - 8.5% | |||
Biotechnology - 1.3% | |||
Amgen, Inc. (a) | 647,900 | 34,138 | |
Cephalon, Inc. (a) | 141,400 | 8,977 | |
Gilead Sciences, Inc. (a) | 611,459 | 22,318 | |
| 65,433 | ||
Health Care Equipment & Supplies - 1.4% | |||
C. R. Bard, Inc. | 188,805 | 16,020 | |
CareFusion Corp. (a) | 1,018,443 | 23,292 | |
Covidien PLC | 247,090 | 10,395 | |
Stryker Corp. | 412,400 | 20,657 | |
| 70,364 | ||
Health Care Providers & Services - 0.5% | |||
UnitedHealth Group, Inc. | 694,800 | 25,374 | |
Pharmaceuticals - 5.3% | |||
GlaxoSmithKline PLC | 388,123 | 7,350 | |
GlaxoSmithKline PLC sponsored ADR | 40,500 | 1,550 | |
Johnson & Johnson | 799,311 | 49,198 | |
Merck & Co., Inc. | 2,369,628 | 81,681 | |
Pfizer, Inc. | 6,738,535 | 109,771 | |
Sanofi-Aventis | 433,968 | 26,303 | |
| 275,853 | ||
TOTAL HEALTH CARE | 437,024 | ||
INDUSTRIALS - 11.2% | |||
Aerospace & Defense - 2.8% | |||
Goodrich Corp. | 118,058 | 10,126 | |
Honeywell International, Inc. | 859,500 | 42,726 | |
Spirit AeroSystems Holdings, Inc. Class A (a) | 428,062 | 8,334 | |
The Boeing Co. | 449,317 | 28,653 | |
United Technologies Corp. | 696,228 | 52,405 | |
| 142,244 | ||
Common Stocks - continued | |||
Shares | Value (000s) | ||
INDUSTRIALS - continued | |||
Building Products - 0.4% | |||
Armstrong World Industries, Inc. | 111,359 | $ 5,398 | |
Masco Corp. | 1,273,300 | 13,892 | |
| 19,290 | ||
Commercial Services & Supplies - 0.4% | |||
Pitney Bowes, Inc. | 326,700 | 7,168 | |
Republic Services, Inc. | 473,705 | 13,330 | |
| 20,498 | ||
Construction & Engineering - 0.6% | |||
Fluor Corp. | 265,994 | 15,382 | |
KBR, Inc. | 663,126 | 17,957 | |
| 33,339 | ||
Industrial Conglomerates - 3.7% | |||
General Electric Co. | 5,287,797 | 83,706 | |
Koninklijke Philips Electronics NV unit | 380,200 | 10,303 | |
Rheinmetall AG | 322,342 | 20,800 | |
Siemens AG sponsored ADR | 430,400 | 47,258 | |
Textron, Inc. | 789,400 | 17,651 | |
Tyco International Ltd. | 364,800 | 13,822 | |
| 193,540 | ||
Machinery - 2.4% | |||
Briggs & Stratton Corp. | 1,091,495 | 19,003 | |
Caterpillar, Inc. | 95,700 | 8,096 | |
Cummins, Inc. | 385,000 | 37,391 | |
Harsco Corp. | 81,700 | 1,966 | |
Ingersoll-Rand Co. Ltd. | 622,053 | 25,504 | |
Kennametal, Inc. | 231,600 | 7,833 | |
Navistar International Corp. (a) | 267,930 | 13,713 | |
SPX Corp. | 134,400 | 8,827 | |
| 122,333 | ||
Road & Rail - 0.9% | |||
CSX Corp. | 365,100 | 22,202 | |
Union Pacific Corp. | 257,800 | 23,230 | |
| 45,432 | ||
TOTAL INDUSTRIALS | 576,676 | ||
INFORMATION TECHNOLOGY - 6.9% | |||
Communications Equipment - 0.6% | |||
Cisco Systems, Inc. (a) | 821,015 | 15,731 | |
Common Stocks - continued | |||
Shares | Value (000s) | ||
INFORMATION TECHNOLOGY - continued | |||
Communications Equipment - continued | |||
Comverse Technology, Inc. (a) | 1,494,580 | $ 11,493 | |
Motorola, Inc. (a) | 674,862 | 5,169 | |
| 32,393 | ||
Computers & Peripherals - 1.0% | |||
Hewlett-Packard Co. | 1,193,648 | 50,050 | |
Electronic Equipment & Components - 1.5% | |||
Agilent Technologies, Inc. (a) | 653,184 | 22,875 | |
Arrow Electronics, Inc. (a) | 237,538 | 7,366 | |
Avnet, Inc. (a) | 471,200 | 14,442 | |
Tyco Electronics Ltd. | 1,024,571 | 31,167 | |
| 75,850 | ||
IT Services - 0.4% | |||
CoreLogic, Inc. (a) | 270,575 | 4,927 | |
MoneyGram International, Inc. (a) | 340,342 | 834 | |
Visa, Inc. Class A | 204,568 | 15,107 | |
| 20,868 | ||
Office Electronics - 0.4% | |||
Xerox Corp. | 1,661,123 | 19,036 | |
Semiconductors & Semiconductor Equipment - 3.0% | |||
Analog Devices, Inc. | 151,700 | 5,394 | |
Applied Materials, Inc. | 2,672,600 | 33,220 | |
Intel Corp. | 2,921,200 | 61,696 | |
Micron Technology, Inc. (a) | 1,472,300 | 10,689 | |
National Semiconductor Corp. | 1,549,502 | 20,686 | |
Samsung Electronics Co. Ltd. | 11,955 | 8,527 | |
Teradyne, Inc. (a) | 303,600 | 3,601 | |
Varian Semiconductor Equipment Associates, Inc. (a) | 435,300 | 13,725 | |
| 157,538 | ||
TOTAL INFORMATION TECHNOLOGY | 355,735 | ||
MATERIALS - 2.5% | |||
Chemicals - 1.6% | |||
Clariant AG (Reg.) (a) | 1,233,742 | 22,274 | |
Dow Chemical Co. | 734,932 | 22,915 | |
E.I. du Pont de Nemours & Co. | 620,209 | 29,144 | |
PPG Industries, Inc. | 121,400 | 9,464 | |
| 83,797 | ||
Common Stocks - continued | |||
Shares | Value (000s) | ||
MATERIALS - continued | |||
Construction Materials - 0.2% | |||
HeidelbergCement AG | 177,100 | $ 9,620 | |
Metals & Mining - 0.7% | |||
Alcoa, Inc. | 1,207,232 | 15,839 | |
Commercial Metals Co. | 407,409 | 6,262 | |
Freeport-McMoRan Copper & Gold, Inc. | 124,737 | 12,638 | |
| 34,739 | ||
TOTAL MATERIALS | 128,156 | ||
TELECOMMUNICATION SERVICES - 5.0% | |||
Diversified Telecommunication Services - 4.5% | |||
AT&T, Inc. | 4,288,800 | 119,186 | |
Qwest Communications International, Inc. | 5,183,800 | 36,287 | |
Verizon Communications, Inc. | 2,446,218 | 78,303 | |
| 233,776 | ||
Wireless Telecommunication Services - 0.5% | |||
Sprint Nextel Corp. (a) | 6,081,147 | 22,987 | |
TOTAL TELECOMMUNICATION SERVICES | 256,763 | ||
UTILITIES - 3.6% | |||
Electric Utilities - 2.3% | |||
Allegheny Energy, Inc. | 835,197 | 19,059 | |
American Electric Power Co., Inc. | 1,198,309 | 42,660 | |
Entergy Corp. | 278,700 | 19,855 | |
FirstEnergy Corp. (d) | 1,013,931 | 35,599 | |
| 117,173 | ||
Independent Power Producers & Energy Traders - 0.5% | |||
AES Corp. (a) | 2,587,200 | 27,968 | |
Multi-Utilities - 0.8% | |||
Alliant Energy Corp. | 317,045 | 11,512 | |
PG&E Corp. | 277,603 | 13,028 | |
Public Service Enterprise Group, Inc. | 555,217 | 17,117 | |
Veolia Environnement | 60,700 | 1,598 | |
| 43,255 | ||
TOTAL UTILITIES | 188,396 | ||
TOTAL COMMON STOCKS (Cost $4,550,626) | 4,959,505 | ||
Preferred Stocks - 1.8% | |||
Shares | Value (000s) | ||
Convertible Preferred Stocks - 1.6% | |||
CONSUMER DISCRETIONARY - 0.6% | |||
Automobiles - 0.6% | |||
General Motors Co. 4.75% (a) | 607,000 | $ 30,775 | |
Household Durables - 0.0% | |||
Stanley Black & Decker, Inc. 4.75% (a) | 12,800 | 1,306 | |
TOTAL CONSUMER DISCRETIONARY | 32,081 | ||
ENERGY - 0.1% | |||
Oil, Gas & Consumable Fuels - 0.1% | |||
Apache Corp. 6.00% | 102,900 | 6,241 | |
FINANCIALS - 0.8% | |||
Commercial Banks - 0.2% | |||
Huntington Bancshares, Inc. 8.50% | 7,600 | 8,170 | |
Diversified Financial Services - 0.2% | |||
Citigroup, Inc. 7.50% | 81,000 | 10,125 | |
Insurance - 0.4% | |||
Hartford Financial Services Group, Inc. Series F 7.25% | 285,900 | 6,594 | |
XL Capital Ltd. 10.75% | 462,200 | 13,200 | |
| 19,794 | ||
TOTAL FINANCIALS | 38,089 | ||
UTILITIES - 0.1% | |||
Electric Utilities - 0.1% | |||
PPL Corp. 9.50% | 112,300 | 6,075 | |
TOTAL CONVERTIBLE PREFERRED STOCKS | 82,486 | ||
Nonconvertible Preferred Stocks - 0.2% | |||
CONSUMER DISCRETIONARY - 0.2% | |||
Automobiles - 0.2% | |||
Volkswagen AG | 76,000 | 12,211 | |
TOTAL PREFERRED STOCKS (Cost $81,305) | 94,697 | ||
Convertible Bonds - 0.5% | ||||
| Principal Amount (000s) | Value (000s) | ||
CONSUMER DISCRETIONARY - 0.3% | ||||
Hotels, Restaurants & Leisure - 0.3% | ||||
MGM Mirage, Inc. 4.25% 4/15/15 (e) | $ 13,500 | $ 13,382 | ||
Leisure Equipment & Products - 0.0% | ||||
Eastman Kodak Co. 7% 4/1/17 | 1,890 | 1,854 | ||
TOTAL CONSUMER DISCRETIONARY | 15,236 | |||
FINANCIALS - 0.1% | ||||
Thrifts & Mortgage Finance - 0.1% | ||||
MGIC Investment Corp. 9% 4/1/63 (e) | 5,910 | 6,013 | ||
INFORMATION TECHNOLOGY - 0.1% | ||||
Semiconductors & Semiconductor Equipment - 0.1% | ||||
Micron Technology, Inc. 1.875% 6/1/27 | 3,686 | 3,366 | ||
TOTAL CONVERTIBLE BONDS (Cost $24,120) | 24,615 | |||
Money Market Funds - 2.2% | |||
Shares |
| ||
Fidelity Cash Central Fund, 0.24% (b) | 63,981,758 | 63,982 | |
Fidelity Securities Lending Cash Central Fund, 0.25% (b)(c) | 49,809,150 | 49,809 | |
TOTAL MONEY MARKET FUNDS (Cost $113,791) | 113,791 | ||
TOTAL INVESTMENT PORTFOLIO - 100.9% (Cost $4,769,842) | 5,192,608 | ||
NET OTHER ASSETS (LIABILITIES) - (0.9)% | (47,382) | ||
NET ASSETS - 100% | $ 5,145,226 | ||
Legend |
(a) Non-income producing |
(b) Affiliated fund that is available only to investment companies and other accounts managed by Fidelity Investments. The rate quoted is the annualized seven-day yield of the fund at period end. A complete unaudited listing of the fund's holdings as of its most recent quarter end is available upon request. In addition, each Fidelity Central Fund's financial statements, which are not covered by the Fund's Report of Independent Registered Public Accounting Firm, are available on the SEC's website or upon request. |
(c) Investment made with cash collateral received from securities on loan. |
(d) Security or a portion of the security is on loan at period end. |
(e) Security exempt from registration under Rule 144A of the Securities Act of 1933. These securities may be resold in transactions exempt from registration, normally to qualified institutional |
Affiliated Central Funds |
Information regarding fiscal year to date income earned by the Fund from investments in Fidelity Central Funds is as follows: |
Fund | Income earned |
Fidelity Cash Central Fund | $ 65 |
Fidelity Securities Lending Cash Central Fund | 640 |
Total | $ 705 |
Other Information |
The following is a summary of the inputs used, as of November 30, 2010, involving the Fund's assets and liabilities carried at fair value. The inputs or methodology used for valuing securities may not be an indication of the risk associated with investing in those securities. For more information on valuation inputs, and their aggregation into the levels used in the table below, please refer to the Security Valuation section in the accompanying Notes to Financial Statements. |
Valuation Inputs at Reporting Date: | ||||
Description | Total | Level 1 | Level 2 | Level 3 |
Investments in Securities: | ||||
Equities: | ||||
Consumer Discretionary | $ 748,248 | $ 746,942 | $ 1,306 | $ - |
Consumer Staples | 272,307 | 272,307 | - | - |
Energy | 740,080 | 740,080 | - | - |
Financials | 1,344,742 | 1,298,318 | 46,424 | - |
Health Care | 437,024 | 403,371 | 33,653 | - |
Industrials | 576,676 | 576,676 | - | - |
Information Technology | 355,735 | 355,735 | - | - |
Materials | 128,156 | 128,156 | - | - |
Telecommunication Services | 256,763 | 256,763 | - | - |
Utilities | 194,471 | 186,798 | 7,673 | - |
Corporate Bonds | 24,615 | - | 24,615 | - |
Money Market Funds | 113,791 | 113,791 | - | - |
Total Investments in Securities: | $ 5,192,608 | $ 5,078,937 | $ 113,671 | $ - |
Distribution of investments by country of issue, as a percentage of total net assets, is as follows: (Unaudited) |
United States of America | 88.4% |
Switzerland | 3.4% |
United Kingdom | 3.1% |
Germany | 2.1% |
Ireland | 1.1% |
Others (Individually Less Than 1%) | 1.9% |
| 100.0% |
Income Tax Information |
At November 30, 2010, the Fund had a capital loss carryforward of approximately $1,810,776,000 of which $801,080,000 and $1,009,696,000 will expire in fiscal 2016 and 2017, respectively. Capital loss carryforwards are only available to offset future capital gains of the Fund to the extent provided by regulations and may be limited. |
See accompanying notes which are an integral part of the financial statements.
Annual Report
Financial Statements
Statement of Assets and Liabilities
Amounts in thousands (except per-share amounts) | November 30, 2010 | |
|
|
|
Assets | ||
Investment in securities, at value (including securities loaned of $48,193) - See accompanying schedule: Unaffiliated issuers (cost $4,656,051) | $ 5,078,817 |
|
Fidelity Central Funds (cost $113,791) | 113,791 |
|
Total Investments (cost $4,769,842) |
| $ 5,192,608 |
Cash | 2,105 | |
Receivable for investments sold | 7,855 | |
Receivable for fund shares sold | 838 | |
Dividends receivable | 11,661 | |
Interest receivable | 186 | |
Distributions receivable from Fidelity Central Funds | 119 | |
Prepaid expenses | 18 | |
Other receivables | 304 | |
Total assets | 5,215,694 | |
|
|
|
Liabilities | ||
Payable for investments purchased | $ 6,683 | |
Payable for fund shares redeemed | 10,673 | |
Accrued management fee | 2,025 | |
Other affiliated payables | 920 | |
Other payables and accrued expenses | 358 | |
Collateral on securities loaned, at value | 49,809 | |
Total liabilities | 70,468 | |
|
|
|
Net Assets | $ 5,145,226 | |
Net Assets consist of: |
| |
Paid in capital | $ 6,651,241 | |
Undistributed net investment income | 20,142 | |
Accumulated undistributed net realized gain (loss) on investments and foreign currency transactions | (1,948,933) | |
Net unrealized appreciation (depreciation) on investments and assets and liabilities in foreign currencies | 422,776 | |
Net Assets | $ 5,145,226 | |
See accompanying notes which are an integral part of the financial statements.
Annual Report
Financial Statements - continued
Statement of Assets and Liabilities - continued
Amounts in thousands (except per-share amounts) | November 30, 2010 | |
|
|
|
Equity-Income II: Net Asset Value, offering price and redemption price per share ($4,776,821 ÷ 284,085 shares) | $ 16.81 | |
|
|
|
Class K: Net Asset Value, offering price and redemption price per share ($368,405 ÷ 21,908 shares) | $ 16.82 | |
See accompanying notes which are an integral part of the financial statements.
Annual Report
Statement of Operations
Amounts in thousands | Year ended November 30, 2010 | |
|
|
|
Investment Income |
|
|
Dividends |
| $ 116,026 |
Interest |
| 2,633 |
Income from Fidelity Central Funds |
| 705 |
Total income |
| 119,364 |
|
|
|
Expenses | ||
Management fee | $ 24,320 | |
Transfer agent fees | 10,313 | |
Accounting and security lending fees | 1,131 | |
Custodian fees and expenses | 162 | |
Independent trustees' compensation | 32 | |
Registration fees | 54 | |
Audit | 78 | |
Legal | 28 | |
Interest | 3 | |
Miscellaneous | 75 | |
Total expenses before reductions | 36,196 | |
Expense reductions | (156) | 36,040 |
Net investment income (loss) | 83,324 | |
Realized and Unrealized Gain (Loss) Net realized gain (loss) on: | ||
Investment securities: |
|
|
Unaffiliated issuers (net of foreign taxes of $194) | 519,565 | |
Foreign currency transactions | (249) | |
Capital gain distributions from Fidelity Central Funds | 1 |
|
Total net realized gain (loss) |
| 519,317 |
Change in net unrealized appreciation (depreciation) on: Investment securities (net of decrease in deferred foreign taxes of $84) | (309,549) | |
Assets and liabilities in foreign currencies | 9 | |
Total change in net unrealized appreciation (depreciation) |
| (309,540) |
Net gain (loss) | 209,777 | |
Net increase (decrease) in net assets resulting from operations | $ 293,101 | |
See accompanying notes which are an integral part of the financial statements.
Annual Report
Financial Statements - continued
Statement of Changes in Net Assets
Amounts in thousands | Year ended | Year ended |
Increase (Decrease) in Net Assets |
|
|
Operations |
|
|
Net investment income (loss) | $ 83,324 | $ 98,006 |
Net realized gain (loss) | 519,317 | (645,454) |
Change in net unrealized appreciation (depreciation) | (309,540) | 1,598,050 |
Net increase (decrease) in net assets resulting | 293,101 | 1,050,602 |
Distributions to shareholders from net investment income | (78,814) | (107,786) |
Share transactions - net increase (decrease) | (564,531) | (813,458) |
Total increase (decrease) in net assets | (350,244) | 129,358 |
|
|
|
Net Assets | ||
Beginning of period | 5,495,470 | 5,366,112 |
End of period (including undistributed net investment income of $20,142 and undistributed net investment income of $15,841, respectively) | $ 5,145,226 | $ 5,495,470 |
See accompanying notes which are an integral part of the financial statements.
Annual Report
Financial Highlights - Equity-Income II
Years ended November 30, | 2010 | 2009 | 2008 | 2007 | 2006 |
Selected Per-Share Data |
|
|
|
|
|
Net asset value, beginning of period | $ 16.16 | $ 13.32 | $ 24.29 | $ 25.12 | $ 24.57 |
Income from Investment Operations |
|
|
|
|
|
Net investment income (loss) B | .26 | .27 | .33 | .33 | .35 |
Net realized and unrealized gain (loss) | .63 | 2.86 | (9.72) | 1.29 | 2.44 |
Total from investment operations | .89 | 3.13 | (9.39) | 1.62 | 2.79 |
Distributions from net investment income | (.24) | (.29) | (.36) | (.38) | (.33) |
Distributions from net realized gain | - | - | (1.22) | (2.07) | (1.91) |
Total distributions | (.24) | (.29) | (1.58) | (2.45) | (2.24) |
Net asset value, end of period | $ 16.81 | $ 16.16 | $ 13.32 | $ 24.29 | $ 25.12 |
Total Return A | 5.57% | 24.07% | (41.13)% | 6.90% | 12.28% |
Ratios to Average Net Assets C, E |
|
|
|
|
|
Expenses before reductions | .69% | .75% | .67% | .65% | .67% |
Expenses net of fee waivers, if any | .69% | .75% | .67% | .65% | .67% |
Expenses net of all reductions | .69% | .74% | .67% | .65% | .66% |
Net investment income (loss) | 1.57% | 1.98% | 1.70% | 1.34% | 1.50% |
Supplemental Data |
|
|
|
|
|
Net assets, end of period (in millions) | $ 4,777 | $ 5,288 | $ 5,212 | $ 10,530 | $ 11,635 |
Portfolio turnover rate D | 30% | 75% | 76% | 47% | 160% |
A Total returns would have been lower had certain expenses not been reduced during the periods shown.
B Calculated based on average shares outstanding during the period.
C Fees and expenses of the underlying Fidelity Central Funds are not included in the Fund's expense ratio. The Fund indirectly bears its proportionate share of the expenses of any underlying Fidelity Central Funds.
D Amount does not include the portfolio activity of any underlying Fidelity Central Funds.
E Expense ratios reflect operating expenses of the class. Expenses before reductions do not reflect amounts reimbursed by the investment adviser or reductions from brokerage service arrangements or reductions from other expense offset arrangements and do not represent the amount paid by the class during periods when reimbursements or reductions occur. Expenses net of fee waivers reflect expenses after reimbursement by the investment adviser but prior to reductions from brokerage service arrangements or other expense offset arrangements. Expenses net of all reductions represent the net expenses paid by the class.
See accompanying notes which are an integral part of the financial statements.
Annual Report
Financial Highlights - Class K
Years ended November 30, | 2010 | 2009 | 2008 G |
Selected Per-Share Data |
|
|
|
Net asset value, beginning of period | $ 16.16 | $ 13.32 | $ 21.42 |
Income from Investment Operations |
|
|
|
Net investment income (loss) D | .28 | .29 | .17 |
Net realized and unrealized gain (loss) | .65 | 2.87 | (8.08) |
Total from investment operations | .93 | 3.16 | (7.91) |
Distributions from net investment income | (.27) | (.32) | (.19) |
Net asset value, end of period | $ 16.82 | $ 16.16 | $ 13.32 |
Total Return B, C | 5.80% | 24.30% | (37.13)% |
Ratios to Average Net Assets E, H |
|
|
|
Expenses before reductions | .54% | .56% | .54% A |
Expenses net of fee waivers, if any | .54% | .56% | .54%A |
Expenses net of all reductions | .54% | .56% | .54%A |
Net investment income (loss) | 1.72% | 2.17% | 2.11%A |
Supplemental Data |
|
|
|
Net assets, end of period (in millions) | $ 368 | $ 208 | $ 154 |
Portfolio turnover rate F | 30% | 75% | 76% |
A Annualized
B Total returns for periods of less than one year are not annualized.
C Total returns would have been lower had certain expenses not been reduced during the periods shown.
D Calculated based on average shares outstanding during the period.
E Fees and expenses of the underlying Fidelity Central Funds are not included in the Fund's expense ratio. The Fund indirectly bears its proportionate share of the expenses of any underlying Fidelity Central Funds.
F Amount does not include the portfolio activity of any underlying Fidelity Central Funds.
G For the period May 9, 2008 (commencement of sale of shares) to November 30, 2008.
H Expense ratios reflect operating expenses of the class. Expenses before reductions do not reflect amounts reimbursed by the investment adviser or reductions from brokerage service arrangements or reductions from other expense offset arrangements and do not represent the amount paid by the class during periods when reimbursements or reductions occur. Expense ratios before reductions for start-up periods may not be representative of longer-term operating periods. Expenses net of fee waivers reflect expenses after reimbursement by the investment adviser but prior to reductions from brokerage service arrangements or other expense offset arrangements. Expenses net of all reductions represent the net expenses paid by the class.
See accompanying notes which are an integral part of the financial statements.
Annual Report
Notes to Financial Statements
For the period ended November 30, 2010
(Amounts in thousands except ratios)
1. Organization.
Fidelity Equity-Income II Fund (the Fund) is a fund of Fidelity Financial Trust (the Trust) and is authorized to issue an unlimited number of shares. The Trust is registered under the Investment Company Act of 1940, as amended (the 1940 Act), as an open-end management investment company organized as a Massachusetts business trust. The Fund offers Equity-Income II and Class K shares, each of which has equal rights as to assets and voting privileges. Each class has exclusive voting rights with respect to matters that affect that class. Investment income, realized and unrealized capital gains and losses, the common expenses of the Fund, and certain fund-level expense reductions, if any, are allocated on a pro-rata basis to each class based on the relative net assets of each class to the total net assets of the Fund. Each class differs with respect to transfer agent fees incurred. Certain expense reductions also differ by class.
2. Investments in Fidelity Central Funds.
The Fund may invest in Fidelity Central Funds, which are open-end investment companies available only to other investment companies and accounts managed by Fidelity Management & Research Company (FMR) and its affiliates. The Fund's Schedule of Investments lists each of the Fidelity Central Funds held as of period end, if any, as an investment of the Fund, but does not include the underlying holdings of each Fidelity Central Fund. As an Investing Fund, the Fund indirectly bears its proportionate share of the expenses of the underlying Fidelity Central Funds.
The Money Market Central Funds seek preservation of capital and current income and are managed by Fidelity Investments Money Management, Inc. (FIMM), an affiliate of FMR.
A complete unaudited list of holdings for each Fidelity Central Fund is available upon request or at the Securities and Exchange Commission (the SEC) web site at www.sec.gov. In addition, the financial statements of the Fidelity Central Funds, which are not covered by the Fund's Report of Independent Registered Public Accounting Firm, are available on the SEC web site or upon request.
3. Significant Accounting Policies.
The financial statements have been prepared in conformity with accounting principles generally accepted in the United States of America (GAAP), which require management to make certain estimates and assumptions at the date of the financial statements. Actual results could differ from those estimates. The following summarizes the significant accounting policies of the Fund:
Annual Report
3. Significant Accounting Policies - continued
Security Valuation. Investments are valued as of 4:00 p.m. Eastern time on the last calendar day of the period. The Fund uses independent pricing services approved by the Board of Trustees to value its investments. When current market prices or quotations are not readily available or reliable, valuations may be determined in good faith in accordance with procedures adopted by the Board of Trustees. Factors used in determining value may include market or security specific events, changes in interest rates and credit quality. The frequency with which these procedures are used cannot be predicted and they may be utilized to a significant extent. The value used for net asset value (NAV) calculation under these procedures may differ from published prices for the same securities.
The Fund categorizes the inputs to valuation techniques used to value its investments into a disclosure hierarchy consisting of three levels as shown below.
Level 1 - quoted prices in active markets for identical investments
Level 2 - other significant observable inputs (including quoted prices for similar investments, interest rates, prepayment speeds, etc.)
Level 3 - unobservable inputs (including the Fund's own assumptions based on the best information available)
Changes in valuation techniques may result in transfers in or out of an assigned level within the disclosure hierarchy. The aggregate value of investments by input level, as of November 30, 2010 is included at the end of the Fund's Schedule of Investments. Valuation techniques used to value the Fund's investments by major category are as follows.
Equity securities, including restricted securities, for which market quotations are readily available, are valued at the last reported sale price or official closing price as reported by an independent pricing service on the primary market or exchange on which they are traded and are categorized as Level 1 in the hierarchy. In the event there were no sales during the day or closing prices are not available, securities are valued at the last quoted bid price or may be valued using the last available price and are generally categorized as Level 2 in the hierarchy. For foreign equity securities, when significant market or security specific events arise, comparisons to the valuation of American Depositary Receipts (ADRs), futures contracts, Exchange-traded funds (ETFs) and certain indexes as well as quoted prices for similar securities are used and are categorized as Level 2 in the hierarchy in these circumstances. Utilizing these techniques may result in transfers between Level 1 and Level 2. For restricted equity securities and private placements where observable inputs are limited, assumptions about market activity and risk are used and are categorized as Level 3 in the hierarchy.
Annual Report
Notes to Financial Statements - continued
(Amounts in thousands except ratios)
3. Significant Accounting Policies - continued
Security Valuation - continued
Debt securities, including restricted securities, are valued based on evaluated prices received from independent pricing services or from dealers who make markets in such securities. For corporate bonds, pricing services utilize matrix pricing which considers yield or price of bonds of comparable quality, coupon, maturity and type as well as dealer supplied prices and are generally categorized as Level 2 in the hierarchy.
Investments in open-end mutual funds, including the Fidelity Central Funds, are valued at their closing net asset value each business day and are categorized as Level 1 in the hierarchy.
When independent prices are unavailable or unreliable, debt securities may be valued utilizing pricing matrices which consider similar factors that would be used by independent pricing services. These are generally categorized as Level 2 in the hierarchy but may be Level 3 depending on the circumstances.
Foreign Currency. The Fund uses foreign currency contracts to facilitate transactions in foreign-denominated securities. Gains and losses from these transactions may arise from changes in the value of the foreign currency or if the counterparties do not perform under the contracts' terms.
Foreign-denominated assets, including investment securities, and liabilities are translated into U.S. dollars at the exchange rate at period end. Purchases and sales of investment securities, income and dividends received and expenses denominated in foreign currencies are translated into U.S. dollars at the exchange rate in effect on the transaction date.
The effects of exchange rate fluctuations on investments are included with the net realized and unrealized gain (loss) on investment securities. Other foreign currency transactions resulting in realized and unrealized gain (loss) are disclosed separately.
Investment Transactions and Income. For financial reporting purposes, the Fund's investment holdings and NAV include trades executed through the end of the last business day of the period. The NAV per share for processing shareholder transactions is calculated as of the close of business of the New York Stock Exchange (NYSE), normally 4:00 p.m. Eastern time and includes trades executed through the end of the prior business day. Gains and losses on securities sold are determined on the basis of identified cost and may include proceeds received from litigation. Dividend income is recorded on the ex-dividend date, except for certain dividends from foreign securities where the ex-dividend date may have passed, which are recorded as soon as the Fund is informed of the ex-dividend date. Non-cash dividends included in dividend income, if any, are
Annual Report
3. Significant Accounting Policies - continued
Investment Transactions and Income - continued
recorded at the fair market value of the securities received. Distributions received on securities that represent a return of capital or capital gain are recorded as a reduction of cost of investments and/or as a realized gain. The Fund estimates the components of distributions received that may be considered return of capital distributions or capital gain distributions. Interest income and distributions from the Fidelity Central Funds are accrued as earned. Interest income includes coupon interest and amortization of premium and accretion of discount on debt securities. Investment income is recorded net of foreign taxes withheld where recovery of such taxes is uncertain.
Expenses. Most expenses of the Trust can be directly attributed to a fund. Expenses which cannot be directly attributed are apportioned amongst each fund in the Trust. Expense estimates are accrued in the period to which they relate and adjustments are made when actual amounts are known.
Deferred Trustee Compensation. Under a Deferred Compensation Plan (the Plan), independent Trustees may elect to defer receipt of a portion of their annual compensation. Deferred amounts are invested in a cross-section of Fidelity funds, are marked-to-market and remain in the Fund until distributed in accordance with the Plan. The investment of deferred amounts and the offsetting payable to the Trustees are included in the accompanying Statement of Assets and Liabilities.
Income Tax Information and Distributions to Shareholders. Each year the Fund intends to qualify as a regulated investment company, including distributing substantially all of its taxable income and realized gains under Subchapter M of the Internal Revenue Code and filing its U.S. federal tax return. As a result, no provision for income taxes is required. As of November 30, 2010, the Fund did not have any unrecognized tax benefits in the accompanying financial statements. A fund's federal tax return is subject to examination by the Internal Revenue Service (IRS) for a period of three years. Foreign taxes are provided for based on the Fund's understanding of the tax rules and rates that exist in the foreign markets in which it invests.
Distributions are declared and recorded on the ex-dividend date. Income dividends and capital gain distributions are declared separately for each class. Income and capital gain distributions are determined in accordance with income tax regulations, which may differ from GAAP.
Capital accounts within the financial statements are adjusted for permanent book-tax differences. These adjustments have no impact on net assets or the results of operations. Temporary book-tax differences will reverse in a subsequent period.
Annual Report
Notes to Financial Statements - continued
(Amounts in thousands except ratios)
3. Significant Accounting Policies - continued
Income Tax Information and Distributions to Shareholders - continued
Book-tax differences are primarily due to short-term gain distributions from the Fidelity Central Funds, foreign currency transactions, certain foreign taxes, market discount, deferred trustees compensation, capital loss carryforwards and losses due to wash sales.
The federal tax cost of investment securities and unrealized appreciation (depreciation) as of period end were as follows:
Gross unrealized appreciation | $ 831,232 |
Gross unrealized depreciation | (546,552) |
Net unrealized appreciation (depreciation) | $ 284,680 |
|
|
Tax Cost | $ 4,907,928 |
The tax-based components of distributable earnings as of period end were as follows:
Undistributed ordinary income | $ 20,359 |
Capital loss carryforward | $ (1,810,776) |
Net unrealized appreciation (depreciation) | $ 284,690 |
The tax character of distributions paid was as follows:
| November 30, 2010 | November 30, 2009 |
Ordinary Income | $ 78,814 | $ 107,786 |
4. Operating Policies.
Restricted Securities. The Fund may invest in securities that are subject to legal or contractual restrictions on resale. These securities generally may be resold in transactions exempt from registration or to the public if the securities are registered. Disposal of these securities may involve time-consuming negotiations and expense, and prompt sale at an acceptable price may be difficult. Information regarding restricted securities is included at the end of the Fund's Schedule of Investments.
5. Purchases and Sales of Investments.
Purchases and sales of securities, other than short-term securities, aggregated $1,542,718 and $2,124,828, respectively.
Annual Report
6. Fees and Other Transactions with Affiliates.
Management Fee. FMR and its affiliates provide the Fund with investment management related services for which the Fund pays a monthly management fee. The management fee is the sum of an individual fund fee rate that is based on an annual rate of .20% of the Fund's average net assets and a group fee rate that averaged .26% during the period. The group fee rate is based upon the average net assets of all the mutual funds advised by FMR. The group fee rate decreases as assets under management increase and increases as assets under management decrease. For the period, the total annual management fee rate was .46% of the Fund's average net assets.
Transfer Agent Fees. Fidelity Investments Institutional Operations Company, Inc. (FIIOC), an affiliate of FMR, is the transfer, dividend disbursing and shareholder servicing agent for each class of the Fund. FIIOC receives account fees and asset-based fees that vary according to the account size and type of account of the shareholders of Equity-Income II. FIIOC receives an asset-based fee of Class K's average net assets. FIIOC pays for typesetting, printing and mailing of shareholder reports, except proxy statements. For the period, transfer agent fees for each class were as follows:
| Amount | % of |
Equity-Income II | $ 10,181 | .20 |
Class K | 132 | .05 |
| $ 10,313 |
|
Accounting and Security Lending Fees. Fidelity Service Company, Inc. (FSC), an affiliate of FMR, maintains the Fund's accounting records. The accounting fee is based on the level of average net assets for the month. Under a separate contract, FSC administers the security lending program. The security lending fee is based on the number and duration of lending transactions.
Brokerage Commissions. The Fund placed a portion of its portfolio transactions with brokerage firms which are affiliates of the investment adviser. The commissions paid to these affiliated firms were $19 for the period.
Interfund Lending Program. Pursuant to an Exemptive Order issued by the SEC, the Fund, along with other registered investment companies having management contracts with FMR, may participate in an interfund lending program. This program provides an alternative credit facility allowing the funds to borrow from, or lend money to, other participating affiliated funds. At period end, there were no interfund loans outstanding.
Annual Report
Notes to Financial Statements - continued
(Amounts in thousands except ratios)
6. Fees and Other Transactions with Affiliates - continued
Interfund Lending Program - continued
The Fund's activity in this program during the period for which loans were outstanding was as follows:
Borrower or Lender | Average Daily | Weighted Average Interest Rate | Interest |
Borrower | $ 7,877 | .42% | $ 3 |
7. Committed Line of Credit.
The Fund participates with other funds managed by FMR or an affiliate in a $3.75 billion credit facility (the "line of credit") to be utilized for temporary or emergency purposes to fund shareholder redemptions or for other short-term liquidity purposes. The Fund has agreed to pay commitment fees on its pro-rata portion of the line of credit, which amounted to $21 and is reflected in Miscellaneous expenses on the Statement of Operations. During the period, there were no borrowings on this line of credit.
8. Security Lending.
The Fund lends portfolio securities through a lending agent from time to time in order to earn additional income. The lending agent may loan securities to certain qualified borrowers, including Fidelity Capital Markets (FCM), a broker-dealer affiliated with the Fund. On the settlement date of the loan, the Fund receives collateral (in the form of U.S. Treasury obligations, letters of credit and/or cash) against the loaned securities and maintains collateral in an amount not less than 100% of the market value of the loaned securities during the period of the loan. The market value of the loaned securities is determined at the close of business of the Fund and any additional required collateral is delivered to the Fund on the next business day. If the borrower defaults on its obligation to return the securities loaned because of insolvency or other reasons, a fund could experience delays and costs in recovering the securities loaned or in gaining access to the collateral. Any cash collateral received is invested in the Fidelity Securities Lending Cash Central Fund. The value of loaned securities and cash collateral at period end are disclosed on the Fund's Statement of Assets and Liabilities. Security lending income represents the income earned on investing cash collateral, less rebates paid to borrowers and lending agent fees associated with the loan, plus any premium payments received for lending certain types of securities. Security lending income is presented in the Statement of Operations as a component of income from Fidelity Central Funds. Total security lending income during the period amounted to $640. During the period, there were no securities loaned to FCM.
Annual Report
9. Expense Reductions.
Many of the brokers with whom FMR places trades on behalf of the Fund provided services to the Fund in addition to trade execution. These services included payments of certain expenses on behalf of the Fund totaling $156 for the period.
10. Distributions to Shareholders.
Distributions to shareholders of each class were as follows:
Years ended November 30, | 2010 | 2009 |
From net investment income |
|
|
Equity-Income II | $ 74,940 | $ 103,988 |
Class K | 3,874 | 3,798 |
Total | $ 78,814 | $ 107,786 |
11. Share Transactions.
Transactions for each class of shares were as follows:
| Shares | Dollars | ||
Years ended November 30, | 2010 | 2009 A | 2010 | 2009 A |
Equity-Income II |
|
|
|
|
Shares sold | 11,830 | 20,468 | $ 195,399 | $ 264,593 |
Conversion to Class K | - | (6,298) | - | (80,663) |
Reinvestment of distributions | 4,305 | 7,638 | 71,108 | 98,777 |
Shares redeemed | (59,267) | (85,985) | (980,367) | (1,111,308) |
Net increase (decrease) | (43,132) | (64,177) | $ (713,860) | $ (828,601) |
Class K |
|
|
|
|
Shares sold | 12,200 | 3,143 | $ 201,326 | $ 41,178 |
Conversion from Equity-Income II | - | 6,298 | - | 80,663 |
Reinvestment of distributions | 235 | 293 | 3,874 | 3,798 |
Shares redeemed | (3,385) | (8,420) | (55,871) | (110,496) |
Net increase (decrease) | 9,050 | 1,314 | $ 149,329 | $ 15,143 |
A Conversion transactions for Class K and Equity-Income II are presented for the period December 1, 2008 through August 31, 2009
12. Other.
The Fund's organizational documents provide former and current trustees and officers with a limited indemnification against liabilities arising in connection with the performance of their duties to the Fund. In the normal course of business, the Fund may also enter into contracts that provide general indemnifications. The Fund's maximum exposure under these arrangements is unknown as this would be dependent on future claims that may be made against the Fund. The risk of material loss from such claims is considered remote.
Annual Report
Report of Independent Registered Public Accounting Firm
To the Trustees of Fidelity Financial Trust and the Shareholders of Fidelity Equity-Income II Fund:
In our opinion, the accompanying statement of assets and liabilities, including the schedule of investments, and the related statements of operations and of changes in net assets and the financial highlights present fairly, in all material respects, the financial position of Fidelity Equity-Income II Fund (a fund of Fidelity Financial Trust) at November 30, 2010, the results of its operations for the year then ended, the changes in its net assets for each of the two years in the period then ended and the financial highlights for each of the periods indicated, in conformity with accounting principles generally accepted in the United States of America. These financial statements and financial highlights (hereafter referred to as "financial statements") are the responsibility of the Fidelity Equity-Income II Fund's management. Our responsibility is to express an opinion on these financial statements based on our audits. We conducted our audits of these financial statements in accordance with the standards of the Public Company Accounting Oversight Board (United States). Those standards require that we plan and perform the audit to obtain reasonable assurance about whether the financial statements are free of material misstatement. An audit includes examining, on a test basis, evidence supporting the amounts and disclosures in the financial statements, assessing the accounting principles used and significant estimates made by management, and evaluating the overall financial statement presentation. We believe that our audits, which included confirmation of securities at November 30, 2010 by correspondence with the custodian and brokers, provide a reasonable basis for our opinion.
/s/ PricewaterhouseCoopers LLP
PricewaterhouseCoopers LLP
Boston, Massachusetts
January 14, 2011
Annual Report
Trustees and Officers
The Trustees, Members of the Advisory Board, and executive officers of the trust and fund, as applicable, are listed below. The Board of Trustees governs the fund and is responsible for protecting the interests of shareholders. The Trustees are experienced executives who meet periodically throughout the year to oversee the fund's activities, review contractual arrangements with companies that provide services to the fund, oversee management of the risks associated with such activities and contractual arrangements, and review the fund's performance. Except for James C. Curvey, each of the Trustees oversees 219 funds advised by FMR or an affiliate. Mr. Curvey oversees 408 funds advised by FMR or an affiliate.
The Trustees hold office without limit in time except that (a) any Trustee may resign; (b) any Trustee may be removed by written instrument, signed by at least two-thirds of the number of Trustees prior to such removal; (c) any Trustee who requests to be retired or who has become incapacitated by illness or injury may be retired by written instrument signed by a majority of the other Trustees; and (d) any Trustee may be removed at any special meeting of shareholders by a two-thirds vote of the outstanding voting securities of the trust. Each Trustee who is not an interested person (as defined in the 1940 Act) (Independent Trustee), shall retire not later than the last day of the calendar year in which his or her 72nd birthday occurs. The Independent Trustees may waive this mandatory retirement age policy with respect to individual Trustees. The executive officers and Advisory Board Members hold office without limit in time, except that any officer and Advisory Board Member may resign or may be removed by a vote of a majority of the Trustees at any regular meeting or any special meeting of the Trustees. Except as indicated, each individual has held the office shown or other offices in the same company for the past five years.
Experience, Skills, Attributes, and Qualifications of the Fund's Trustees. The Governance and Nominating Committee has adopted a statement of policy that describes the experience, qualifications, attributes, and skills that are necessary and desirable for potential Independent Trustee candidates (Statement of Policy). The Board believes that each Trustee satisfied at the time he or she was initially elected or appointed a Trustee, and continues to satisfy, the standards contemplated by the Statement of Policy. The Governance and Nominating Committee also engages professional search firms to help identify potential Independent Trustee candidates who have the experience, qualifications, attributes, and skills consistent with the Statement of Policy. From time to time, additional criteria based on the composition and skills of the current Independent Trustees, as well as experience or skills that may be appropriate in light of future changes to board composition, business conditions, and regulatory or other developments, have also been considered by the professional search firms and the Governance and Nominating Committee. In addition, the Board takes into account the Trustees' commitment and participation in Board and committee meetings, as well as their leadership of standing and ad hoc committees throughout their tenure.
In determining that a particular Trustee was and continues to be qualified to serve as a Trustee, the Board has considered a variety of criteria, none of which, in isolation, was controlling. The Board believes that, collectively, the Trustees have balanced and diverse experience, qualifications, attributes, and skills, which allow the Board to operate effectively in governing the fund and protecting the interests of shareholders. Information about the specific experience, skills, attributes, and qualifications of each Trustee, which in each case led to the Board's conclusion that the Trustee should serve (or continue to serve) as a trustee of the fund, is provided below.
Annual Report
Trustees and Officers - continued
Board Structure and Oversight Function. James C. Curvey is an interested person (as defined in the 1940 Act) and currently serves as Acting Chairman. The Trustees have determined that an interested Chairman is appropriate and benefits shareholders because an interested Chairman has a personal and professional stake in the quality and continuity of services provided to the fund. Independent Trustees exercise their informed business judgment to appoint an individual of their choosing to serve as Chairman, regardless of whether the Trustee happens to be independent or a member of management. The Independent Trustees have determined that they can act independently and effectively without having an Independent Trustee serve as Chairman and that a key structural component for assuring that they are in a position to do so is for the Independent Trustees to constitute a substantial majority for the Board. The Independent Trustees also regularly meet in executive session. Ned C. Lautenbach serves as Chairman of the Independent Trustees and as such (i) acts as a liaison between the Independent Trustees and management with respect to matters important to the Independent Trustees and (ii) with management prepares agendas for Board meetings.
Fidelity funds are overseen by different Boards of Trustees. The fund's Board oversees Fidelity's equity and high income funds and another Board oversees Fidelity's investment-grade bond, money market, and asset allocation funds. The asset allocation funds may invest in Fidelity funds overseen by the fund's Board. The use of separate Boards, each with its own committee structure, allows the Trustees of each group of Fidelity funds to focus on the unique issues of the funds they oversee, including common research, investment, and operational issues. On occasion, the separate Boards establish joint committees to address issues of overlapping consequences for the Fidelity funds overseen by each Board.
The Trustees operate using a system of committees to facilitate the timely and efficient consideration of all matters of importance to the Trustees, the fund, and fund shareholders and to facilitate compliance with legal and regulatory requirements and oversight of the fund's activities and associated risks. The Board, acting through its committees, has charged FMR and its affiliates with (i) identifying events or circumstances the occurrence of which could have demonstrably adverse effects on the fund's business and/or reputation; (ii) implementing processes and controls to lessen the possibility that such events or circumstances occur or to mitigate the effects of such events or circumstances if they do occur; and (iii) creating and maintaining a system designed to evaluate continuously business and market conditions in order to facilitate the identification and implementation processes described in (i) and (ii) above. Because the day-to-day operations and activities of the fund are carried out by or through FMR, its affiliates and other service providers, the fund's exposure to risks is mitigated but not eliminated by the processes overseen by the Trustees. While each of the Board's committees has responsibility for overseeing different aspects of the fund's activities, oversight is exercised primarily through the Operations, Audit, and Compliance Committees. Appropriate personnel, including but not limited to the fund's Chief Compliance Officer (CCO), FMR's internal auditor, the independent accountants, the fund's Treasurer and portfolio management personnel, make periodic reports to the Board's committees, as appropriate. The responsibilities of each committee, including their oversight responsibilities, are described further under "Standing Committees of the Fund's Trustees."
Annual Report
The fund's Statement of Additional Information (SAI) includes more information about the Trustees. To request a free copy, call Fidelity at 1-800-835-5092.
Interested Trustees*:
Correspondence intended for each Trustee who is an interested person may be sent to Fidelity Investments, 82 Devonshire Street, Boston, Massachusetts 02109.
Name, Age; Principal Occupations and Other Relevant Experience+ | |
James C. Curvey (75) | |
| Year of Election or Appointment: 2007 Mr. Curvey is Trustee and Acting Chairman of the Board of Trustees of certain Trusts. Mr. Curvey also serves as Trustee (2007-present) of other investment companies advised by FMR. Mr. Curvey is a Director of Fidelity Investments Money Management, Inc. (2009-present), Director of Fidelity Research & Analysis Co. (2009-present) and Director of FMR and FMR Co., Inc. (2007-present). Mr. Curvey is also Vice Chairman (2007-present) and Director of FMR LLC. In addition, Mr. Curvey serves as an Overseer for the Boston Symphony Orchestra and a member of the Trustees of Villanova University. Previously, Mr. Curvey was the Vice Chairman (2006-2007) and Director (2000-2007) of FMR Corp. |
Ronald P. O'Hanley (54) | |
| Year of Election or Appointment: 2011 Ronald P. O'Hanley is President, Asset Management and Corporate Services, for Fidelity Investments and a member of Fidelity's Executive Committee (2010-present). Previously, Mr. O'Hanley served as President and Chief Executive Officer of BNY Mellon Asset Management (2007-2010). Mr. O'Hanley also served as Vice Chairman of Bank New York Mellon Corp. and a member of that firm's Executive Committee. Prior to the 2007 merger of The Bank of New York and Mellon Financial Corporation, he was Vice Chairman of Mellon Financial Corporation and President and Chief Executive Officer of Mellon Asset Management. He joined Mellon in February 1997. Mr. O'Hanley currently serves as Chairman of the Boston Public Library Foundation Board of Directors and sits on the Board of Directors of Beth Israel Deaconess Medical Center, the Board of Trustees of the Marine Biological Laboratory and the Advisory Board of the Maxwell School of Citizenship and Public Administration at Syracuse University. Mr. O'Hanley also chairs the Council on Asset Management for the Financial Services Roundtable and is a member of the Board of Directors of Institutional Investor's U.S. Institute. |
Annual Report
Trustees and Officers - continued
* Trustees have been determined to be "Interested Trustees" by virtue of, among other things, their affiliation with the trust or various entities under common control with FMR.
+ The information above includes each Trustee's principal occupation during the last five years and other information relating to the experience, attributes, and skills relevant to each Trustee's qualifications to serve as a Trustee, which led to the conclusion that each Trustee should serve as a Trustee for the fund.
Independent Trustees:
Correspondence intended for each Independent Trustee (that is, the Trustees other than the Interested Trustees) may be sent to Fidelity Investments, P.O. Box 55235, Boston, Massachusetts 02205-5235.
Name, Age; Principal Occupations and Other Relevant Experience+ | |
Dennis J. Dirks (62) | |
| Year of Election or Appointment: 2005 Prior to his retirement in May 2003, Mr. Dirks was Chief Operating Officer and a member of the Board of The Depository Trust & Clearing Corporation (DTCC). He also served as President, Chief Operating Officer, and Board member of The Depository Trust Company (DTC) and President and Board member of the National Securities Clearing Corporation (NSCC). In addition, Mr. Dirks served as Chief Executive Officer and Board member of the Government Securities Clearing Corporation, Chief Executive Officer and Board member of the Mortgage-Backed Securities Clearing Corporation, as a Trustee and a member of the Finance Committee of Manhattan College (2005-2008), and as a Trustee and a member of the Finance Committee of AHRC of Nassau County (2006-2008). Mr. Dirks is a member of the Independent Directors Council (IDC) Governing Council (2010-Present) and Board of Directors for The Brookville Center for Children's Services, Inc. (2009-present). |
Alan J. Lacy (57) | |
| Year of Election or Appointment: 2008 Mr. Lacy serves as Senior Adviser (2007-present) of Oak Hill Capital Partners, L.P. (private equity). Mr. Lacy also served as Chief Executive Officer (2000-2005) and Vice Chairman (2005-2006) of Sears Holdings Corporation and Sears, Roebuck and Co. (retail). In addition, Mr. Lacy serves as a member of the Board of Directors of The Western Union Company (global money transfer, 2006-present) and Bristol-Myers Squibb Company (global pharmaceuticals, 2007-present). Mr. Lacy is Chairman (2008-present) and a member (2006-present) of the Board of Trustees of The National Parks Conservation Association. |
Ned C. Lautenbach (66) | |
| Year of Election or Appointment: 2000 Mr. Lautenbach is Chairman of the Independent Trustees of the Equity and High Income Funds (2006-present). Mr. Lautenbach currently serves as the Lead Director of the Eaton Corporation Board of Directors (diversified industrial, 1997-present). Mr. Lautenbach is also a member of the Board of Directors of the Philharmonic Center for the Arts in Naples, Florida (1999-present); a member of the Board of Trustees of Fairfield University (2005-present); and a member of the Council on Foreign Relations (1994-present). Previously, Mr. Lautenbach was a Partner/Advisory Partner at Clayton, Dubilier & Rice, Inc. (private equity investment, 1998-2010), as well as a Director of Sony Corporation (2006-2007). |
Joseph Mauriello (66) | |
| Year of Election or Appointment: 2008 Prior to his retirement in January 2006, Mr. Mauriello served in numerous senior management positions including Deputy Chairman and Chief Operating Officer (2004-2005), and Vice Chairman of Financial Services (2002-2004) of KPMG LLP US (professional services, 1965-2005). Mr. Mauriello currently serves as a member of the Board of Directors of XL Group plc. (global insurance and re-insurance, 2006-present) and of Arcadia Resources Inc. (health care services and products, 2007- |
Cornelia M. Small (66) | |
| Year of Election or Appointment: 2005 Ms. Small is a member of the Board of Directors of the Teagle Foundation (2009-present). Ms. Small is also a member of the Investment Committee, and Chair (2008-present) and a member of the Board of Trustees of Smith College. In addition, Ms. Small serves on the Investment Committee of the Berkshire Taconic Community Foundation (2008- |
William S. Stavropoulos (71) | |
| Year of Election or Appointment: 2002 Mr. Stavropoulos is Vice Chairman of the Independent Trustees of the Equity and High Income Funds (2006-present). Mr. Stavropoulos serves as President and Founder of the Michigan Baseball Foundation, the Great Lakes Loons (2007-present). Mr. Stavropoulos is Chairman Emeritus of the Board of Directors of The Dow Chemical Company, where he previously served in numerous senior management positions, including President, CEO (1995-2000; 2002-2004), Chairman of the Executive Committee (2000-2006), and as a member of the Board of Directors (1990-2006). Currently, Mr. Stavropoulos is Chairman of Univar (global distributor of commodity and specialty chemicals, 2010-present), a Director of Teradata Corporation (data warehousing and technology solutions, 2008-present), Chemical Financial Corporation, Maersk Inc. (industrial conglomerate), Tyco International, Inc. (multinational manufacturing and services, 2007-present), and a member of the Advisory Board for Metalmark Capital (private equity investment, 2005- |
David M. Thomas (61) | |
| Year of Election or Appointment: 2008 Previously, Mr. Thomas served as Executive Chairman (2005-2006) and Chairman and Chief Executive Officer (2000-2005) of IMS Health, Inc. (pharmaceutical and healthcare information solutions). In addition, Mr. Thomas serves as a member of the Board of Directors of Fortune Brands, Inc. (consumer products), and Interpublic Group of Companies, Inc. (marketing communication, 2004-present). |
Michael E. Wiley (60) | |
| Year of Election or Appointment:2008 Mr. Wiley also serves as a Director of Asia Pacific Exploration Consolidated (international oil and gas exploration and production, 2008-present). Mr. Wiley serves as a Director of Tesoro Corporation (independent oil refiner and marketer, 2005-present), and a Director of Bill Barrett Corporation (exploration and production, 2005-present). In addition, Mr. Wiley also serves as a Director of Post Oak Bank (privately-held bank, 2004-present). Previously, Mr. Wiley served as a member of the Board of Trustees of the University of Tulsa (2000-2006; 2007-2010), as a Senior Energy Advisor of Katzenbach Partners, LLC (consulting, 2006-2007), as an Advisory Director of Riverstone Holdings (private investment), Chairman, President, and CEO of Baker Hughes, Inc. (oilfield services, 2000-2004), and as Director of Spinnaker Exploration Company (exploration and production, 2001-2005). |
Annual Report
+ The information above includes each Trustee's principal occupation during the last five years and other information relating to the experience, attributes, and skills relevant to each Trustee's qualifications to serve as a Trustee, which led to the conclusion that each Trustee should serve as a Trustee for the fund.
Advisory Board Members and Executive Officers:
Correspondence intended for each executive officer, Edward C. Johnson 3d, and Peter S. Lynch may be sent to Fidelity Investments, 82 Devonshire Street, Boston, Massachusetts 02109.
Name, Age; Principal Occupation | |
Edward C. Johnson 3d (80) | |
| Year of Election or Appointment: 2011 Member of the Advisory Board of Fidelity's Equity and High Income Funds. Formerly Trustee and Chairman of the Board of Trustees of certain Trusts, Mr. Johnson serves as Chief Executive Officer, Chairman, and a Director of FMR LLC; Chairman and a Director of FMR; and Chairman and a Director of FMR Co., Inc. In addition, Mr. Johnson serves as Chairman and Director of FIL Limited. Previously, Mr. Johnson served as President of FMR LLC (2006-2007). |
Peter S. Lynch (66) | |
| Year of Election or Appointment: 2003 Member of the Advisory Board of Fidelity's Equity and High Income Funds. Mr. Lynch is Vice Chairman and a Director of FMR and FMR Co., Inc. In addition, Mr. Lynch serves as a Trustee of Boston College and as the Chairman of the Inner-City Scholarship Fund. Previously, Mr. Lynch served on the Special Olympics International Board of Directors (1997-2006). |
Kenneth B. Robins (41) | |
| Year of Election or Appointment: 2008 President and Treasurer of Fidelity's Equity and High Income Funds. Mr. Robins also serves as President and Treasurer (2010-present) and Assistant Treasurer (2009-present) of other Fidelity funds and is an employee of Fidelity Investments (2004-present). Previously, Mr. Robins served as Deputy Treasurer of the Fidelity funds (2005-2008) and Treasurer and Chief Financial Officer of The North Carolina Capital Management Trust: Cash and Term Portfolios (2006-2008). |
Bruce T. Herring (45) | |
| Year of Election or Appointment: 2006 Vice President of certain Equity Funds. Mr. Herring also serves as Chief Investment Officer and Director of Fidelity Management & Research (U.K.) Inc. (2010-present) and Group Chief Investments Officer of FMR. Previously, Mr. Herring served as Vice President (2005-2006) and Senior Vice President (2006-2007) of Fidelity Management & Research Company, Vice President of FMR Co., Inc. (2001-2007) and as a portfolio manager for Fidelity U.S. Equity Funds. |
Brian B. Hogan (46) | |
| Year of Election or Appointment: 2009 Vice President of certain Equity Funds and Vice President of Sector Funds. Mr. Hogan also serves as President of FMR's Equity Division (2009-present). Previously, Mr. Hogan served as Senior Vice President, Equity Research of FMR (2006-2009) and as a portfolio manager. |
Scott C. Goebel (42) | |
| Year of Election or Appointment: 2008 Secretary and Chief Legal Officer (CLO) of the Fidelity funds. Mr. Goebel also serves as Secretary and CLO of The North Carolina Capital Management Trust: Cash and Term Portfolio (2008-present); General Counsel, Secretary, and Senior Vice President of FMR (2008-present) and FMR Co., Inc. (2008-present); Deputy General Counsel of FMR LLC; Chief Legal Officer of Fidelity Management & Research (Hong Kong) Limited (2008-present) and Assistant Secretary of Fidelity Management & Research (Japan) Inc. (2008-present), Fidelity Investments Money Management, Inc. (2008-present), Fidelity Management & Research (U.K.) Inc. (2008-present), and Fidelity Research and Analysis Company (2008-present). Previously, Mr. Goebel served as Assistant Secretary of the Funds (2007-2008) and as Vice President and Secretary of Fidelity Distributors Corporation (FDC) (2005-2007). |
William C. Coffey (41) | |
| Year of Election or Appointment: 2009 Assistant Secretary of Fidelity's Equity and High Income Funds. Mr. Coffey also serves as Senior Vice President and Deputy General Counsel of FMR LLC (2010-present), and is an employee of Fidelity Investments. Previously, Mr. Coffey served as Vice President and Associate General Counsel of FMR LLC (2005-2009). |
Holly C. Laurent (56) | |
| Year of Election or Appointment: 2008 Anti-Money Laundering (AML) Officer of the Fidelity funds. Ms. Laurent also serves as AML Officer of The North Carolina Capital Management Trust: Cash and Term Portfolio (2008-present) and is an employee of Fidelity Investments. Previously, Ms. Laurent was Senior Vice President and Head of Legal for Fidelity Business Services India Pvt. Ltd. (2006-2008), and Senior Vice President, Deputy General Counsel and Group Head for FMR LLC (2005-2006). |
Christine Reynolds (52) | |
| Year of Election or Appointment: 2008 Chief Financial Officer of the Fidelity funds. Ms. Reynolds became President of Fidelity Pricing and Cash Management Services (FPCMS) in August 2008. Ms. Reynolds served as Chief Operating Officer of FPCMS (2007-2008). Previously, Ms. Reynolds served as President, Treasurer, and Anti-Money Laundering officer of the Fidelity funds (2004-2007). |
Kenneth A. Rathgeber (63) | |
| Year of Election or Appointment: 2004 Chief Compliance Officer of Fidelity's Equity and High Income Funds. Mr. Rathgeber is Chief Compliance Officer of Fidelity Management & Research (Hong Kong) Limited (2008-present), Fidelity Management & Research (Japan) Inc. (2008-present), FMR (2005-present), FMR Co., Inc. (2005-present), Fidelity Management & Research (U.K.) Inc. (2005-present), Fidelity Research & Analysis Company (2005-present), Fidelity Investments Money Management, Inc. (2005-present), Pyramis Global Advisors, LLC (2005-present), and Strategic Advisers, Inc. (2005-present). |
Jeffrey S. Christian (49) | |
| Year of Election or Appointment: 2009 Deputy Treasurer of the Fidelity funds. Mr. Christian is an employee of Fidelity Investments. Previously, Mr. Christian served as Chief Financial Officer (2008-2009) of certain Fidelity funds and Senior Vice President of Fidelity Pricing and Cash Management Services (FPCMS) (2004-2009). |
Bryan A. Mehrmann (49) | |
| Year of Election or Appointment: 2005 Deputy Treasurer of the Fidelity funds. Mr. Mehrmann is an employee of Fidelity Investments. |
Adrien E. Deberghes (43) | |
| Year of Election or Appointment: 2008 Deputy Treasurer of Fidelity's Equity and High Income Funds. Mr. Deberghes also serves as Assistant Treasurer of other Fidelity funds (2010-present) and is an employee of Fidelity Investments (2008- |
Stephanie J. Dorsey (41) | |
| Year of Election or Appointment: 2010 Assistant Treasurer of Fidelity's Equity and High Income Funds. Ms. Dorsey also serves as Deputy Treasurer of other Fidelity funds (2008-present) and is an employee of Fidelity Investments (2008- |
John R. Hebble (52) | |
| Year of Election or Appointment: 2009 Assistant Treasurer of Fidelity's Equity and High Income Funds. Mr. Hebble also serves as Treasurer and Chief Financial Officer of The North Carolina Capital Management Trust: Cash and Term Portfolio (2008-present), President and Treasurer of other Fidelity funds (2008-present) and is an employee of Fidelity Investments. |
Gary W. Ryan (52) | |
| Year of Election or Appointment: 2005 Assistant Treasurer of the Fidelity funds. Mr. Ryan is an employee of Fidelity Investments. Previously, Mr. Ryan served as Vice President of Fund Reporting in Fidelity Pricing and Cash Management Services (FPCMS) (1999-2005). |
Jonathan Davis (42) | |
| Year of Election or Appointment: 2010 Assistant Treasurer of the Fidelity funds. Mr. Davis is an employee of Fidelity Investments. Previously, Mr. Davis served as Vice President and Associate General Counsel of FMR LLC (2003-2010). |
Annual Report
Distributions (Unaudited)
A total of .02% of the dividends distributed during the fiscal year was derived from interest on U.S. Government securities which is generally exempt from state income tax.
Class K designates 100% of the dividends distributed during the fiscal year as qualifying for the dividends-received deduction for corporate shareholders.
Class K designates 100% of the dividends distributed during the fiscal year as amounts which may be taken into account as a dividend for the purposes of the maximum rate under section 1 (h)(11) of the Internal Revenue Code.
The fund will notify shareholders in January 2011 of amounts for use in preparing 2010 income tax returns.
Annual Report
Board Approval of Investment Advisory Contracts and Management Fees
Fidelity Equity-Income II Fund
Each year, the Board of Trustees, including the Independent Trustees (together, the Board), votes on the renewal of the management contract and sub-advisory agreements (together, the Advisory Contracts) for the fund. The Board, assisted by the advice of fund counsel and Independent Trustees' counsel, requests and considers a broad range of information relevant to the renewal of the Advisory Contracts throughout the year.
The Board meets regularly and considers at each of its meetings factors that are relevant to its annual consideration of the renewal of the fund's Advisory Contracts, including the services and support provided to the fund and its shareholders. The Board has established various standing committees, each composed of Independent Trustees with varying backgrounds, to which the Board has assigned specific subject matter responsibilities in order to enhance effective decision-making by the Board. The Board, acting directly and through its Committees, requests and receives information concerning the annual consideration of the renewal of the fund's Advisory Contracts. The Board also meets as needed to consider matters specifically related to the Board's annual consideration of the renewal of Advisory Contracts. Members of the Board may also meet with trustees of other Fidelity funds through ad hoc joint committees to discuss certain matters relevant to the Fidelity funds.
At its July 2010 meeting, the Board of Trustees, including the Independent Trustees, unanimously determined to renew the fund's Advisory Contracts. In reaching its determination, the Board considered all factors it believed relevant, including (i) the nature, extent, and quality of the services to be provided to the fund and its shareholders (including the investment performance of the fund); (ii) the competitiveness of the fund's management fee and total expenses; (iii) the total costs of the services to be provided by and the profits to be realized by Fidelity from its relationship with the fund; (iv) the extent to which economies of scale would be realized as the fund grows; and (v) whether fee levels reflect these economies of scale, if any, for the benefit of fund shareholders.
In considering whether to renew the Advisory Contracts for the fund, the Board reached a determination, with the assistance of fund counsel and Independent Trustees' counsel and through the exercise of its business judgment, that the renewal of the Advisory Contracts is in the best interests of fund shareholders and that the compensation to be received by Fidelity under the management contract is fair and reasonable. The Board's decision to renew the Advisory Contracts was not based on any single factor noted above, but rather was based on a comprehensive consideration of all the information provided to the Board at its meetings throughout the year. The Board, in reaching its determination to renew the Advisory Contracts, is aware that shareholders in the fund have a broad range of investment choices available to them, including a wide choice among mutual funds offered by Fidelity's competitors, and that the fund's shareholders, with the opportunity to review and weigh the disclosure provided by the fund in its prospectus and other public disclosures, have chosen to invest in this fund, managed by Fidelity.
Annual Report
Board Approval of Investment Advisory Contracts and
Management Fees - continued
Nature, Extent, and Quality of Services Provided. The Board considered the staffing within the investment adviser, FMR, and the sub-advisers (together, the Investment Advisers), including the backgrounds of the fund's investment personnel and the fund's investment objective and discipline. The Independent Trustees also had discussions with senior management of Fidelity's investment operations and investment groups. The Board considered the structure of the portfolio manager compensation program and whether this structure provides appropriate incentives to act in the best interest of the fund.
Resources Dedicated to Investment Management and Support Services. The Board and the equity research subcommittee of the Board's Fund Oversight Committee reviewed the size, education, and experience of the Investment Advisers' investment staff, their use of technology, and the Investment Advisers' approach to recruiting, training, and retaining portfolio managers and other research, advisory, and management personnel. The Board noted that Fidelity's analysts have access to a variety of technological tools and market and securities data that enable them to perform both fundamental and quantitative analysis and to specialize in various disciplines. The Board considered Fidelity's extensive global research capabilities that enable the Investment Advisers to aggregate data from various sources in an effort to produce positive investment results. The Board also considered that Fidelity's portfolio managers and analysts have access to daily portfolio attribution that allows for monitoring of a fund's portfolio, as well as an electronic communication system that provides immediate real-time access to research concerning issuers and credit enhancers. The Board noted FMR's continued focus on strengthening the organization and discipline of equity portfolio management and research.
Shareholder and Administrative Services. The Board considered (i) the nature, extent, quality, and cost of advisory, administrative, and shareholder services performed by the Investment Advisers and their affiliates under the Advisory Contracts and under separate agreements covering transfer agency, pricing and bookkeeping, and securities lending services for the fund; (ii) the nature and extent of the investment adviser's supervision of third party service providers, principally custodians and subcustodians; and (iii) the resources devoted to, and the record of compliance with, the fund's compliance policies and procedures. The Board also reviewed the allocation of fund brokerage, including allocations to brokers affiliated with the Investment Advisers, the use of brokerage commissions to pay fund expenses, and the use of "soft" commission dollars to pay for research services.
The Board noted that the growth of fund assets over time across the complex allows Fidelity to reinvest in the development of services designed to enhance the value or convenience of the Fidelity funds as investment vehicles. These services include 24-hour access to account information and market information through phone representatives and over the Internet, and investor education materials and asset allocation tools.
Annual Report
Investment in a Large Fund Family. The Board considered the benefits to shareholders of investing in a Fidelity fund, including the benefits of investing in a fund that is part of a large family of funds offering a variety of investment disciplines and providing a large variety of mutual fund investor services. The Board noted that Fidelity had taken, or had made recommendations that resulted in the Fidelity funds taking, a number of actions over the previous year that benefited particular funds, including (i) dedicating additional resources to investment research and restructuring and broadening the focus of the investment research teams; (ii) bolstering the senior management team that oversees asset management; (iii) launching Class F of certain funds as a lower-fee class available to Freedom K and Freedom Index Funds; (iv) lowering the initial investment minimums and ongoing balance requirements for Real Estate High Income Fund; (v) eliminating subsequent purchase minimums for all funds and adding a waiver of the investment minimum requirement for new accounts opened with the proceeds of a systematic withdrawal plan; (vi) eliminating the withdrawal minimum and maximum limits for systematic withdrawals from Advisor funds; (vii) expanding sales load waivers on Class A shares for Destiny Planholders and expanding Institutional Class eligibility for Class O Destiny Planholders; and (viii) changing certain Class A and Class T sales charge structures to further align them with industry practices.
Investment Performance. The Board considered whether the fund has operated in accordance with its investment objective, as well as its record of compliance with its investment restrictions. It also reviewed the fund's absolute investment performance for each class, as well as the fund's relative investment performance for each class measured over multiple periods against (i) a broad-based securities market index, and (ii) a peer group of mutual funds deemed appropriate by Fidelity and reviewed by the Board. The following charts considered by the Board show, over the one-, three-, and five-year periods ended December 31, 2009, as available, the cumulative total returns of Class K and the retail class of the fund, the cumulative total returns of a broad-based securities market index ("benchmark"), and a range of cumulative total returns of a peer group of mutual funds identified by Lipper Inc. as having an investment objective similar to that of the fund. The box within each chart shows the 25th percentile return (bottom of box) and the 75th percentile return (top of box) of the peer group. Returns shown above the box are in the first quartile and returns shown below the box are in the fourth quartile. The percentage beaten numbers noted below each chart correspond to the percentile box and represent the percentage of funds in the peer group whose performance was equal to or lower than that of the class indicated.
Annual Report
Board Approval of Investment Advisory Contracts and
Management Fees - continued
Fidelity Equity-Income II Fund

The Board reviewed the fund's relative investment performance against its peer group and noted that the performance of the retail class of the fund (the class with the longer performance record) was in the second quartile for the one-year period and the fourth quartile for the three- and five-year periods. The Board also noted that the investment performance of the retail class of the fund compared favorably to its benchmark for the one- and three-year periods, although the fund's five-year cumulative total return was lower than its benchmark. The Board considered that the variations in performance between the fund's classes reflect the variations in class expenses, which result in lower performance for the higher expense class. The Board also reviewed the fund's performance since inception as well as performance in the current year.
Based on its review, and giving particular weight to the nature and quality of the resources dedicated by the Investment Advisers to maintain and improve relative performance and factoring in the unprecedented market events in recent years, the Board concluded that the nature, extent, and quality of investment management and support services and of shareholder and administrative services provided to the fund will benefit the fund's shareholders, particularly in light of the Board's view that the fund's shareholders benefit from investing in a fund that is part of a large family of funds offering a variety of investment disciplines and services.
Competitiveness of Management Fee and Total Fund Expenses. The Board considered the fund's management fee and total expenses compared to "mapped groups" of competitive funds and classes. Fidelity creates "mapped groups" by combining similar Lipper investment objective categories that have comparable management fee characteristics. Combining Lipper investment objective categories aids the Board's management fee and total expense comparisons by broadening the competitive group used for comparison and by reducing the number of universes to which various Fidelity funds are compared.
Annual Report
Management Fee. The Board considered two proprietary management fee comparisons for the 12-month periods shown in the chart below. The group of Lipper funds used by the Board for management fee comparisons is referred to below as the "Total Mapped Group." The Total Mapped Group is broader than the Lipper peer group used by the Board for performance comparisons because the Total Mapped Group combines several Lipper investment objective categories while the Lipper peer group does not. The Total Mapped Group comparison focuses on a fund's standing relative to the total universe of comparable funds available to investors, in terms of gross management fees before expense reimbursements or caps. "TMG %" represents the percentage of funds in the Total Mapped Group that had management fees that were lower than the fund's. For example, a TMG % of 12% means that 88% of the funds in the Total Mapped Group had higher management fees than the fund. The "Asset-Size Peer Group" (ASPG) comparison focuses on a fund's standing relative to non-Fidelity funds similar in size to the fund within the Total Mapped Group. The ASPG represents at least 15% of the funds in the Total Mapped Group with comparable asset size and management fee characteristics, subject to a minimum of 50 funds (or all funds in the Total Mapped Group if fewer than 50). Additional information, such as the ASPG quartile in which the fund's management fee ranked, is also included in the chart and considered by the Board.
Fidelity Equity-Income II Fund

Annual Report
Board Approval of Investment Advisory Contracts and
Management Fees - continued
The Board noted that the fund's management fee ranked below the median of its Total Mapped Group and below the median of its ASPG for 2009.
Based on its review, the Board concluded that the fund's management fee is fair and reasonable in light of the services that the fund receives and the other factors considered.
Total Expenses. In its review of each class's total expenses, the Board considered the fund's management fee as well as other fund or class expenses, as applicable, such as transfer agent fees, pricing and bookkeeping fees, and custodial, legal, and audit fees. The Board also noted the effects of any waivers and reimbursements on fees and expenses. As part of its review, the Board also considered current and historical total expenses of each class of the fund compared to competitive fund median expenses. Each class of the fund is compared to those funds and classes in the Total Mapped Group (used by the Board for management fee comparisons) that have a similar sales load structure.
The Board noted that the total expenses of each class ranked below its competitive median for 2009.
Fees Charged to Other Fidelity Clients. The Board also considered Fidelity fee structures and other information with respect to clients of FMR and its affiliates, such as other mutual funds advised or subadvised by FMR or its affiliates, pension plan clients, and other institutional clients. In March 2010, the Board created an ad hoc joint committee with the board of other Fidelity funds (the Committee) to review and compare Fidelity's institutional investment advisory business with its business of providing services to the Fidelity funds, including the differences in services provided, fees charged, and costs incurred, as well as competition in their respective marketplaces.
Based on its review of total expenses and fees charged to other Fidelity clients, the Board concluded that the total expenses of each class of the fund were reasonable in light of the services that the fund and its shareholders receive and the other factors considered, including the findings of the Committee.
Costs of the Services and Profitability. The Board considered the revenues earned and the expenses incurred by Fidelity in conducting the business of developing, marketing, distributing, managing, administering and servicing the fund and its shareholders. The Board also considered the level of Fidelity's profits in respect of all the Fidelity funds.
On an annual basis, FMR presents to the Board Fidelity's profitability for the fund. Fidelity calculates the profitability for each fund, as well as aggregate profitability for groups of Fidelity funds and all Fidelity funds, using a series of detailed revenue and cost allocation methodologies which originate with the audited books and records of Fidelity. The Audit Committee of the Board reviews any significant changes from the prior year's methodologies.
Annual Report
PricewaterhouseCoopers LLP (PwC), independent registered public accounting firm and auditor to Fidelity and certain Fidelity funds, has been engaged annually by the Board as part of the Board's assessment of Fidelity's profitability analysis. PwC's engagement includes the review and assessment of Fidelity's methodologies used in determining the revenues and expenses attributable to Fidelity's mutual fund business, and completion of agreed-upon procedures surrounding the mathematical accuracy of fund profitability and its conformity to allocation methodologies. After considering PwC's reports issued under the engagement and information provided by Fidelity, the Board believes that while other allocation methods may also be reasonable, Fidelity's profitability methodologies are reasonable in all material respects.
The Board has also reviewed Fidelity's non-fund businesses and fall-out benefits related to the mutual fund business as well as cases where Fidelity's affiliates may benefit from or be related to the fund's business.
The Board considered the costs of the services provided by and the profits realized by Fidelity in connection with the operation of the fund and were satisfied that the profitability was not excessive in the circumstances.
Economies of Scale. The Board considered whether there have been economies of scale in respect of the management of the Fidelity funds, whether the Fidelity funds (including the fund) have appropriately benefited from any such economies of scale, and whether there is potential for realization of any further economies of scale. The Board considered the extent to which the fund will benefit from economies of scale through increased services to the fund, through waivers or reimbursements, or through fee or expense reductions.
In February 2009, the Board and the board of other Fidelity funds created an ad hoc committee (the Economies of Scale Committee) to analyze whether FMR attains economies of scale in respect of the management and servicing of the Fidelity funds, whether the Fidelity funds have appropriately benefited from such economies of scale, and whether there is potential for realization of any further economies of scale.
The Board recognized that the fund's management contract incorporates a "group fee" structure, which provides for lower group fee rates as total fund assets under FMR's management increase, and for higher group fee rates as total fund assets under FMR's management decrease. FMR calculates the group fee rates based on a tiered asset "breakpoint" schedule that varies based on asset class. The Board considered that the group fee is designed to deliver the benefits of economies of scale to fund shareholders when total Fidelity fund assets increase, even if assets of any particular fund are unchanged or have declined, because some portion of Fidelity's costs are attributable to services provided to all Fidelity funds, and all funds benefit if those costs can be allocated among more assets. The Board concluded that, given the group fee structure, fund shareholders will benefit from lower management fees as assets under FMR's management increase at the fund complex level, regardless of whether Fidelity achieves any such economies of scale.
Annual Report
Board Approval of Investment Advisory Contracts and
Management Fees - continued
The Board concluded, considering the findings of the Economies of Scale Committee, that any potential economies of scale are being appropriately shared between fund shareholders and Fidelity.
Additional Information Requested by the Board. In order to develop fully the factual basis for consideration of the Fidelity funds' Advisory Contracts, the Board requested and received additional information on certain topics, including (i) fund performance trends, actions to be taken by FMR to improve certain funds' overall performance, and Fidelity's long-term strategies for certain funds; (ii) portfolio manager changes that have occurred during the past year and length of portfolio manager tenure for different categories of funds over time; (iii) Fidelity's compensation structure for portfolio managers, research analysts, and other key personnel, the rationale for the compensation structure, and how the compensation structure provides appropriate performance incentives; (iv) the amount of the investment that each portfolio manager has made in the Fidelity fund(s) that he or she manages; (v) management and other fees paid by FMR to affiliated sub-advisers on behalf of the Fidelity funds; (vi) Fidelity's fee structures and rationale for recommending different fees among different categories of funds; (vii) Fidelity's rationale for recommending which funds should have a performance adjustment component as part of their management fees; (viii) the rationale for any differences between fund fee structures and fee structures in place for other Fidelity clients; and (ix) explanations regarding the relative total expenses borne by certain funds and classes, total expense competitive trends, and actions that might be taken by FMR to reduce total expenses for certain funds and classes.
Based on its evaluation of all of the conclusions noted above, and after considering all factors it believed relevant, the Board ultimately concluded that the advisory fee structures are fair and reasonable, and that the fund's Advisory Contracts should be renewed.
Annual Report
Investment Adviser
Fidelity Management & Research Company
Boston, MA
Investment Sub-Advisers
FMR Co., Inc.
Fidelity Management & Research (U.K.) Inc.
Fidelity Research & Analysis Company
Fidelity Management & Research
(Hong Kong) Limited
Fidelity Management & Research (Japan) Inc.
General Distributor
Fidelity Distributors Corporation
Boston, MA
Transfer and Service Agents
Fidelity Investments Institutional
Operations Company, Inc.
Boston, MA
Fidelity Service Company, Inc.
Boston, MA
Custodian
The Northern Trust Company
Chicago, IL
EII-K-UANN-0111
1.863190.102
Fidelity®
Independence
Fund
Annual Report
November 30, 2010
(2_fidelity_logos) (Registered_Trademark)
Contents
Chairman's Message | The Chairman's message to shareholders. | |
Performance | How the fund has done over time. | |
Management's Discussion of Fund Performance | The Portfolio Manager's review of fund performance and strategy. | |
Shareholder Expense Example | An example of shareholder expenses. | |
Investment Changes | A summary of major shifts in the fund's investments over the past six months. | |
Investments | A complete list of the fund's investments with their market values. | |
Financial Statements | Statements of assets and liabilities, operations, and changes in net assets, as well as financial highlights. | |
Notes | Notes to the financial statements. | |
Report of Independent Registered Public Accounting Firm |
| |
Trustees and Officers |
| |
Distributions |
| |
Board Approval of Investment Advisory Contracts and Management Fees |
|
To view a fund's proxy voting guidelines and proxy voting record for the 12-month period ended June 30, visit http://www.fidelity.com/proxyvotingresults or visit the Securities and Exchange Commission's (SEC) website at http://www.sec.gov. You may also call 1-800-544-8544 to request a free copy of the proxy voting guidelines.
Standard & Poor's, S&P and S&P 500 are registered service marks of The McGraw-Hill Companies, Inc. and have been licensed for use by Fidelity Distributors Corporation.
Other third party marks appearing herein are the property of their respective owners.
All other marks appearing herein are registered or unregistered trademarks or service marks of FMR LLC or an affiliated company.
Annual Report
This report and the financial statements contained herein are submitted for the general information of the shareholders of the fund. This report is not authorized for distribution to prospective investors in the fund unless preceded or accompanied by an effective prospectus.
A fund files its complete schedule of portfolio holdings with the SEC for the first and third quarters of each fiscal year on Form N-Q. Forms N-Q are available on the SEC's web site at http://www.sec.gov. A fund's Forms N-Q may be reviewed and copied at the SEC's Public Reference Room in Washington, DC. Information regarding the operation of the SEC's Public Reference Room may be obtained by calling 1-800-SEC-0330. For a complete list of a fund's portfolio holdings, view the most recent holdings listing, semiannual report, or annual report on Fidelity's web site at http://www.fidelity.com, http://www.advisor.fidelity.com, or http://www.401k.com, as applicable.
NOT FDIC INSURED • MAY LOSE VALUE • NO BANK GUARANTEE
Neither the fund nor Fidelity Distributors Corporation is a bank.
Annual Report
Chairman's Message
(photo_of_James_C_Curvey)
Dear Shareholder:
Equities have staged a rally in the second half of 2010, shaking off concerns about the European debt crisis and the possibility of a double-dip recession in the U.S. Although the short-term surge pushed major equity indexes back into positive territory for the year, several questions remain about the longer-term outlook, including lackluster economic growth and persistently high unemployment. Financial markets are always unpredictable, of course, but there also are several time-tested investment principles that can help put the odds in your favor.
One of the basic tenets is to invest for the long term. Over time, riding out the markets' inevitable ups and downs has proven much more effective than selling into panic or chasing the hottest trend. Even missing only a few of the markets' best days can significantly diminish investor returns. Patience also affords the benefits of compounding - of earning interest on additional income or reinvested dividends and capital gains. There can be tax advantages and cost benefits to consider as well. While staying the course doesn't eliminate risk, it can considerably lessen the effect of short-term declines.
You can further manage your investing risk through diversification. And today, more than ever, geographic diversification should be taken into account. Studies indicate that asset allocation is the single most important determinant of a portfolio's long-term success. The right mix of stocks, bonds and cash - aligned to your particular risk tolerance and investment objective - is very important. Age-appropriate rebalancing is also an essential aspect of asset allocation. For younger investors, an emphasis on equities - which historically have been the best-performing asset class over time - is encouraged. As investors near their specific goal, such as retirement or sending a child to college, consideration may be given to replacing volatile assets (e.g. common stocks) with more-stable fixed investments (bonds or savings plans).
A third principle - investing regularly - can help lower the average cost of your purchases. Investing a certain amount of money each month or quarter helps ensure you won't pay for all your shares at market highs. This strategy - known as dollar cost averaging - also reduces "emotion" from investing, helping shareholders avoid selling weak performers just prior to an upswing, or chasing a hot performer just before a correction.
We invite you to contact us via the Internet, through our Investor Centers or by phone. It is our privilege to provide you the information you need to make the investments that are right for you.
Sincerely,
(The acting chairman's signature appears here.)
James C. Curvey
Acting Chairman
Annual Report
Performance: The Bottom Line
Average annual total return reflects the change in the value of an investment, assuming reinvestment of the class' distributions from dividend income and capital gains (the profits earned upon the sale of securities that have grown in value, if any) and assuming a constant rate of performance each year. The $10,000 table and the fund's returns do not reflect the deduction of taxes that a shareholder would pay on fund distributions or the redemption of fund shares. During periods of reimbursement by Fidelity, a fund's total return will be greater than it would be had the reimbursement not occurred. How a fund did yesterday is no guarantee of how it will do tomorrow.
Average Annual Total Returns
Periods ended November 30, 2010 | Past 1 | Past 5 | Past 10 |
Fidelity® Independence Fund | 22.18% | 4.56% | 2.12% |
$10,000 Over 10 Years
Let's say hypothetically that $10,000 was invested in Fidelity ® Independence Fund, a class of the fund, on November 30, 2000. The chart shows how the value of your investment would have changed, and also shows how the S&P 500® Index performed over the same period.
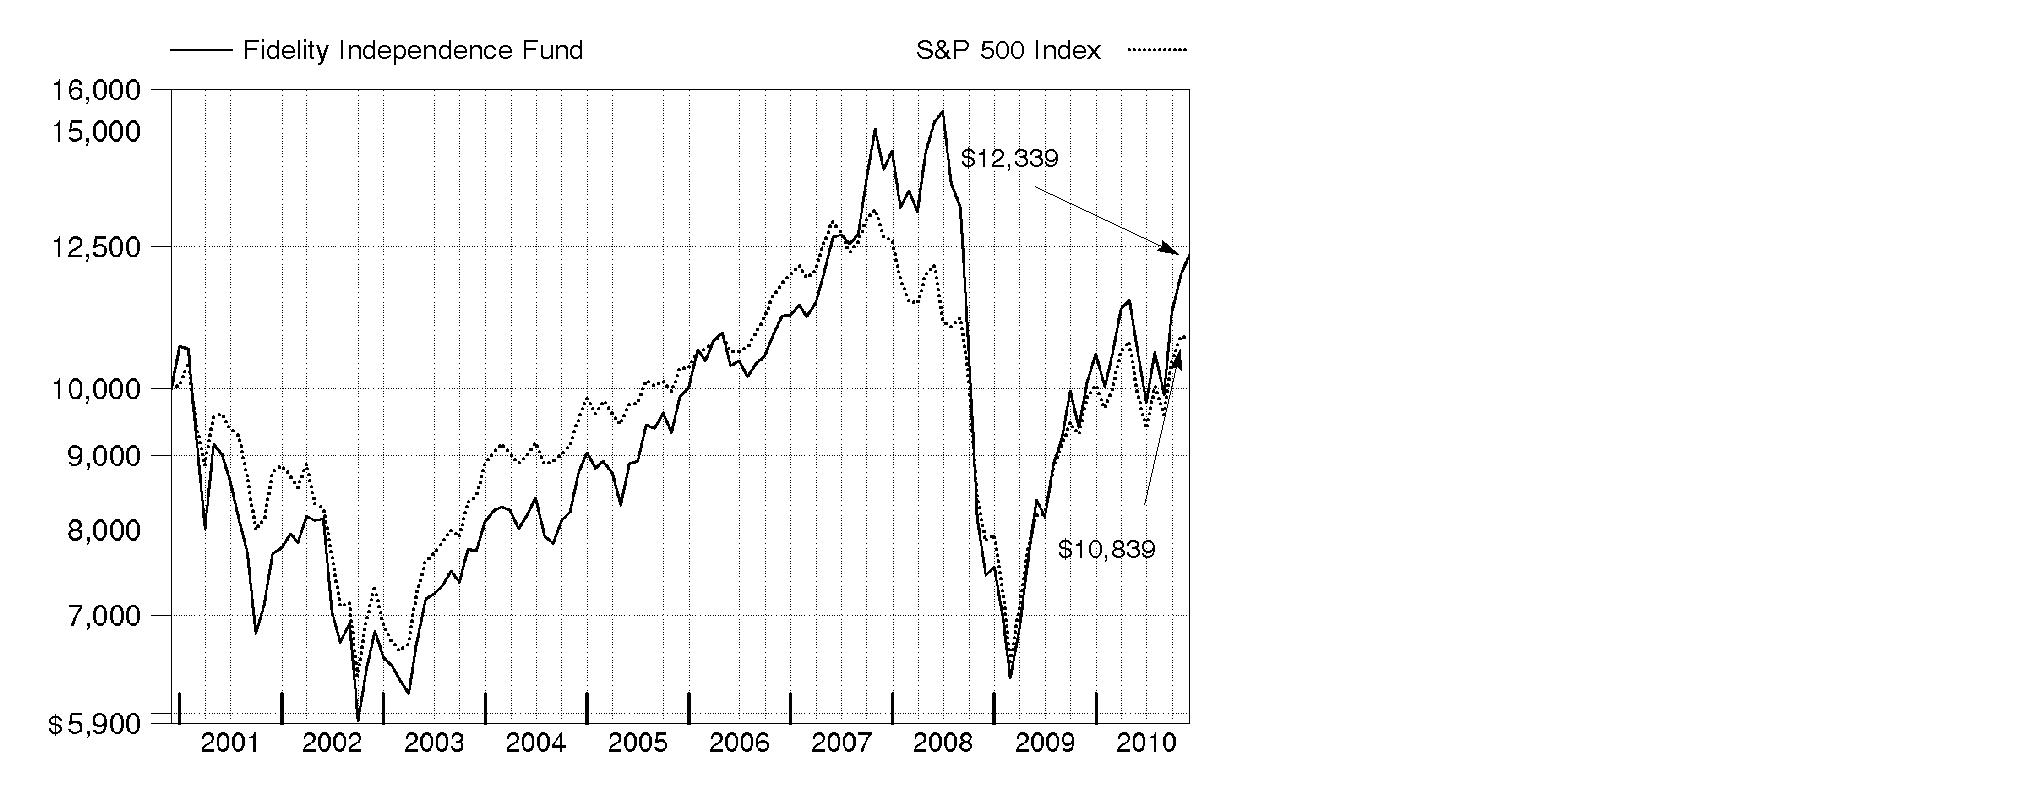
Annual Report
Management's Discussion of Fund Performance
Market Recap: Despite bouts of volatility and concern over European debt woes, major U.S. stock markets recorded solid gains for the year ending November 30, 2010, lifted by economic optimism, encouraging earnings reports and a wave of corporate mergers. Stocks extended their 2009 upswing in the first five months of the period on signs the Great Recession was over. However, high unemployment in the U.S. and sovereign debt problems in Europe sent equities falling during the spring. Markets vacillated for much of the summer before regaining momentum in the fall, with the large-cap S&P 500 ® Index posting its best September/October performance since 1998. By November, however, Ireland's debt took center stage, along with slower growth in China and additional quantitative easing in the U.S., unnerving investors and cooling down markets. For the full 12 months, the S&P 500 ® rose 9.94%, while the blue-chip-laden Dow Jones Industrial AverageSM added 9.33%. Both were bested by the technology-heavy Nasdaq Composite ® Index, which advanced 17.58%. Overall, it was a broad-based rally, with economically sensitive sectors among the biggest gainers. Stocks of mid- and small-sized companies fared better than their larger-cap counterparts, advancing 24.04% and 26.98%, respectively, as measured by the Russell Midcap ® and Russell 2000 ® indexes.
Comments from Robert Bertelson, Portfolio Manager of Fidelity ® Independence Fund: During the year, the fund's Retail Class shares returned 22.18%, significantly outpacing the S&P 500. Stock selection in information technology, industrials, consumer discretionary, health care and materials lifted relative performance the most. Solid picks and overweighted exposure to mid- and small-caps, as well as underweighting mega-caps, also aided our results. Delta Air Lines was the fund's top individual contributor, benefiting from an improving economy, as well as increased business and leisure travel, among other factors. Continental Airlines, which merged with United Airlines to form United Continental Holdings, benefited from similar trends. Consumer electronics/computer maker Apple, China's leading Internet search/advertising provider Baidu, footwear maker Deckers Outdoor and Concho Resources, an oil producer, also helped. I sold Baidu to nail down profits. All of the contributors I've mentioned, except for Apple, were out-of-index positions. Conversely, financials had a negative impact, mainly due to weak stock selection. The biggest individual detractor was an out-of-benchmark stake in Canadian smart phone maker Research In Motion, whose BlackBerry lost market share to competitors. Other detractors included networking equipment maker Cisco Systems and two large financials, JPMorgan Chase and Wells Fargo. Untimely ownership of Google also hurt.
The views expressed above reflect those of the portfolio manager(s) only through the end of the period as stated on the cover of this report and do not necessarily represent the views of Fidelity or any other person in the Fidelity organization. Any such views are subject to change at any time based upon market or other conditions and Fidelity disclaims any responsibility to update such views. These views may not be relied on as investment advice and, because investment decisions for a Fidelity fund are based on numerous factors, may not be relied on as an indication of trading intent on behalf of any Fidelity fund.
Annual Report
Shareholder Expense Example
As a shareholder of the Fund, you incur two types of costs: (1) transaction costs, and (2) ongoing costs, including management fees and other Fund expenses. This Example is intended to help you understand your ongoing costs (in dollars) of investing in the Fund and to compare these costs with the ongoing costs of investing in other mutual funds.
The Example is based on an investment of $1,000 invested at the beginning of the period and held for the entire period (June 1, 2010 to November 30, 2010).
Actual Expenses
The first line of the accompanying table for each class of the Fund provides information about actual account values and actual expenses. You may use the information in this line, together with the amount you invested, to estimate the expenses that you paid over the period. Simply divide your account value by $1,000.00 (for example, an $8,600 account value divided by $1,000.00 = 8.6), then multiply the result by the number in the first line for a class of the Fund under the heading entitled "Expenses Paid During Period" to estimate the expenses you paid on your account during this period. A small balance maintenance fee of $12.00 that is charged once a year may apply for certain accounts with a value of less than $2,000. This fee is not included in the table below. If it was, the estimate of expenses you paid during the period would be higher, and your ending account value lower, by this amount. In addition, the Fund, as a shareholder in the underlying Fidelity Central Funds, will indirectly bear its pro-rata share of the fees and expenses incurred by the underlying Fidelity Central Funds. These fees and expenses are not included in the Fund's annualized expense ratio used to calculate the expense estimate in the table below.
Hypothetical Example for Comparison Purposes
The second line of the accompanying table for each class of the Fund provides information about hypothetical account values and hypothetical expenses based on a Class' actual expense ratio and an assumed rate of return of 5% per year before expenses, which is not the Class' actual return. The hypothetical account values and expenses may not be used to estimate the actual ending account balance or expenses you paid for the period. You may use this information to compare the ongoing costs of investing in the Fund and other funds. To do so, compare this 5% hypothetical example with the 5% hypothetical examples that appear in the shareholder reports of the other funds. A small balance maintenance fee of $12.00 that is charged once a year may apply for certain accounts with a value of less than $2,000. This fee is not included in the table below. If it was, the estimate of expenses you paid during the period would be higher, and your ending account value lower, by this amount. In addition, the Fund, as a shareholder in the underlying Fidelity Central Funds, will indirectly bear its pro-rata share of the fees and expenses incurred by the underlying Fidelity Central Funds. These fees and expenses are not included in the Fund's annualized expense ratio used to calculate the expense estimate in the table below.
Please note that the expenses shown in the table are meant to highlight your ongoing costs only and do not reflect any transaction costs. Therefore, the second line of the table is useful in comparing ongoing costs only, and will not help you determine the relative total costs of owning different funds.
Annual Report
Shareholder Expense Example - continued
| Annualized Expense Ratio | Beginning | Ending | Expenses Paid |
Independence | .83% |
|
|
|
Actual |
| $ 1,000.00 | $ 1,168.00 | $ 4.51 |
HypotheticalA |
| $ 1,000.00 | $ 1,020.91 | $ 4.20 |
Class K | .69% |
|
|
|
Actual |
| $ 1,000.00 | $ 1,169.00 | $ 3.75 |
HypotheticalA |
| $ 1,000.00 | $ 1,021.61 | $ 3.50 |
A 5% return per year before expenses
* Expenses are equal to each Class' annualized expense ratio, multiplied by the average account value over the period, multiplied by 183/365 (to reflect the one-half year period).
Annual Report
Investment Changes (Unaudited)
Top Ten Stocks as of November 30, 2010 | ||
| % of fund's | % of fund's net assets |
Apple, Inc. | 5.5 | 4.7 |
Delta Air Lines, Inc. | 3.4 | 4.0 |
Google, Inc. Class A | 3.0 | 0.2 |
United Continental Holdings, Inc. | 2.6 | 2.4 |
Express Scripts, Inc. | 2.1 | 2.2 |
Schlumberger Ltd. | 1.9 | 1.2 |
Amazon.com, Inc. | 1.8 | 1.2 |
Macy's, Inc. | 1.8 | 1.6 |
Broadcom Corp. Class A | 1.6 | 0.9 |
Caterpillar, Inc. | 1.6 | 0.9 |
| 25.3 | |
Top Five Market Sectors as of November 30, 2010 | ||
| % of fund's | % of fund's net assets |
Information Technology | 25.9 | 24.6 |
Consumer Discretionary | 22.8 | 16.9 |
Industrials | 17.5 | 20.2 |
Materials | 10.0 | 4.1 |
Energy | 8.8 | 7.2 |
Asset Allocation (% of fund's net assets) | |||||||
As of November 30, 2010 * | As of May 31, 2010 ** | ||||||
| Stocks 99.7% |
| | Stocks 99.7% |
| ||
| Short-Term |
| | Short-Term |
| ||
* Foreign investments | 17.6% |
| ** Foreign investments | 13.1% |
| ||

Annual Report
Investments November 30, 2010
Showing Percentage of Net Assets
Common Stocks - 99.3% | |||
Shares | Value (000s) | ||
CONSUMER DISCRETIONARY - 22.4% | |||
Auto Components - 1.1% | |||
Autoliv, Inc. | 200,000 | $ 14,684 | |
BorgWarner, Inc. (a) | 500,000 | 30,170 | |
| 44,854 | ||
Automobiles - 2.1% | |||
Bayerische Motoren Werke AG (BMW) | 700,000 | 52,629 | |
Daimler AG (Germany) (a) | 300,000 | 19,417 | |
General Motors Co. | 505,300 | 17,281 | |
| 89,327 | ||
Hotels, Restaurants & Leisure - 3.2% | |||
Chipotle Mexican Grill, Inc. (a) | 150,000 | 38,774 | |
Ctrip.com International Ltd. sponsored ADR (a) | 596,900 | 26,156 | |
Las Vegas Sands Corp. (a) | 769,000 | 38,512 | |
Panera Bread Co. Class A (a) | 55,906 | 5,604 | |
Starwood Hotels & Resorts Worldwide, Inc. | 500,000 | 28,420 | |
| 137,466 | ||
Household Durables - 1.3% | |||
Cyrela Brazil Realty SA | 1,463,800 | 18,522 | |
Gafisa SA sponsored ADR (d) | 2,584,000 | 37,106 | |
| 55,628 | ||
Internet & Catalog Retail - 3.2% | |||
Amazon.com, Inc. (a) | 444,800 | 78,018 | |
Expedia, Inc. | 800,000 | 21,064 | |
Priceline.com, Inc. (a) | 97,000 | 38,223 | |
| 137,305 | ||
Media - 0.3% | |||
Discovery Communications, Inc. (a) | 300,000 | 12,234 | |
Multiline Retail - 3.6% | |||
Dollarama, Inc. (a) | 200,000 | 5,714 | |
Macy's, Inc. | 2,970,800 | 76,290 | |
Nordstrom, Inc. | 1,075,100 | 46,014 | |
Target Corp. | 400,000 | 22,776 | |
| 150,794 | ||
Specialty Retail - 1.9% | |||
Tiffany & Co., Inc. | 500,000 | 31,050 | |
Williams-Sonoma, Inc. | 1,436,100 | 47,779 | |
| 78,829 | ||
Textiles, Apparel & Luxury Goods - 5.7% | |||
Coach, Inc. | 900,000 | 50,886 | |
Common Stocks - continued | |||
Shares | Value (000s) | ||
CONSUMER DISCRETIONARY - continued | |||
Textiles, Apparel & Luxury Goods - continued | |||
Deckers Outdoor Corp. (a) | 850,000 | $ 65,365 | |
Fossil, Inc. (a) | 500,000 | 33,825 | |
LVMH Moet Hennessy - Louis Vuitton | 50,000 | 7,583 | |
NIKE, Inc. Class B | 100,000 | 8,613 | |
Phillips-Van Heusen Corp. | 625,800 | 42,454 | |
Steven Madden Ltd. (a) | 300,000 | 13,575 | |
The Swatch Group AG (Bearer) | 40,000 | 16,061 | |
Vera Bradley, Inc. | 133,889 | 4,384 | |
| 242,746 | ||
TOTAL CONSUMER DISCRETIONARY | 949,183 | ||
CONSUMER STAPLES - 1.5% | |||
Beverages - 0.2% | |||
Hansen Natural Corp. (a) | 200,000 | 10,644 | |
Personal Products - 1.3% | |||
Estee Lauder Companies, Inc. Class A | 371,600 | 27,840 | |
Hengan International Group Co. Ltd. | 2,781,000 | 25,643 | |
| 53,483 | ||
TOTAL CONSUMER STAPLES | 64,127 | ||
ENERGY - 8.8% | |||
Energy Equipment & Services - 3.1% | |||
Dril-Quip, Inc. (a) | 278,300 | 21,552 | |
Noble Corp. | 200,000 | 6,784 | |
Saipem SpA | 400,000 | 16,644 | |
Schlumberger Ltd. | 1,042,006 | 80,589 | |
Transocean Ltd. (a) | 100,000 | 6,703 | |
| 132,272 | ||
Oil, Gas & Consumable Fuels - 5.7% | |||
Alpha Natural Resources, Inc. (a) | 600,000 | 29,736 | |
Anadarko Petroleum Corp. | 300,000 | 19,248 | |
Cimarex Energy Co. | 150,000 | 12,081 | |
Concho Resources, Inc. (a) | 666,300 | 55,136 | |
Peabody Energy Corp. | 400,000 | 23,524 | |
Pioneer Natural Resources Co. | 600,000 | 48,066 | |
Common Stocks - continued | |||
Shares | Value (000s) | ||
ENERGY - continued | |||
Oil, Gas & Consumable Fuels - continued | |||
Southwestern Energy Co. (a) | 254,900 | $ 9,227 | |
Whiting Petroleum Corp. (a) | 400,000 | 44,020 | |
| 241,038 | ||
TOTAL ENERGY | 373,310 | ||
FINANCIALS - 5.5% | |||
Capital Markets - 1.0% | |||
BlackRock, Inc. Class A | 250,000 | 40,750 | |
Commercial Banks - 2.8% | |||
Banco do Brasil SA | 1,600,000 | 30,694 | |
BBVA Banco Frances SA sponsored ADR (d) | 800,000 | 9,032 | |
Itau Unibanco Banco Multiplo SA ADR | 1,214,700 | 28,339 | |
Wells Fargo & Co. | 1,878,600 | 51,117 | |
| 119,182 | ||
Diversified Financial Services - 1.4% | |||
Apollo Global Management LLC (e) | 1,703,400 | 11,924 | |
JPMorgan Chase & Co. | 1,250,200 | 46,732 | |
| 58,656 | ||
Real Estate Investment Trusts - 0.3% | |||
Public Storage | 150,000 | 14,490 | |
TOTAL FINANCIALS | 233,078 | ||
HEALTH CARE - 7.3% | |||
Biotechnology - 1.2% | |||
Gilead Sciences, Inc. (a) | 600,000 | 21,900 | |
United Therapeutics Corp. (a) | 485,300 | 30,540 | |
| 52,440 | ||
Health Care Equipment & Supplies - 1.1% | |||
Edwards Lifesciences Corp. (a) | 375,000 | 24,885 | |
Volcano Corp. (a) | 800,000 | 21,240 | |
| 46,125 | ||
Health Care Providers & Services - 3.9% | |||
Express Scripts, Inc. (a) | 1,677,800 | 87,397 | |
HMS Holdings Corp. (a) | 271,500 | 17,107 | |
Medco Health Solutions, Inc. (a) | 949,800 | 58,242 | |
| 162,746 | ||
Common Stocks - continued | |||
Shares | Value (000s) | ||
HEALTH CARE - continued | |||
Health Care Technology - 0.4% | |||
SXC Health Solutions Corp. (a) | 400,000 | $ 15,293 | |
Pharmaceuticals - 0.7% | |||
Valeant Pharmaceuticals International, Inc. | 1,156,460 | 29,976 | |
TOTAL HEALTH CARE | 306,580 | ||
INDUSTRIALS - 17.5% | |||
Aerospace & Defense - 1.6% | |||
BE Aerospace, Inc. (a) | 400,000 | 14,200 | |
Goodrich Corp. | 294,200 | 25,234 | |
Precision Castparts Corp. | 100,000 | 13,807 | |
The Boeing Co. | 89,500 | 5,707 | |
United Technologies Corp. | 100,000 | 7,527 | |
| 66,475 | ||
Air Freight & Logistics - 0.3% | |||
Air Lease Corp. Class A (a)(e) | 500,600 | 10,262 | |
Airlines - 6.2% | |||
Delta Air Lines, Inc. (a) | 10,450,775 | 142,967 | |
Southwest Airlines Co. | 766,900 | 10,215 | |
United Continental Holdings, Inc. (a) | 3,970,000 | 109,890 | |
| 263,072 | ||
Construction & Engineering - 0.1% | |||
KBR, Inc. | 200,000 | 5,416 | |
Electrical Equipment - 0.5% | |||
Emerson Electric Co. | 400,000 | 22,028 | |
Machinery - 7.4% | |||
Caterpillar, Inc. | 793,000 | 67,088 | |
Cummins, Inc. | 582,200 | 56,543 | |
Dover Corp. | 500,000 | 27,405 | |
Kennametal, Inc. | 900,000 | 30,438 | |
MAN SE | 300,000 | 35,244 | |
PACCAR, Inc. | 400,000 | 21,544 | |
Parker Hannifin Corp. | 727,500 | 58,367 | |
Sandvik AB | 900,000 | 15,224 | |
Weg SA | 36,500 | 480 | |
| 312,333 | ||
Common Stocks - continued | |||
Shares | Value (000s) | ||
INDUSTRIALS - continued | |||
Road & Rail - 1.3% | |||
CSX Corp. | 462,700 | $ 28,137 | |
Union Pacific Corp. | 281,400 | 25,357 | |
| 53,494 | ||
Trading Companies & Distributors - 0.1% | |||
Mills Estruturas e Servicos de Engenharia SA (a) | 401,000 | 5,787 | |
TOTAL INDUSTRIALS | 738,867 | ||
INFORMATION TECHNOLOGY - 25.9% | |||
Communications Equipment - 4.2% | |||
Cisco Systems, Inc. (a) | 599,300 | 11,483 | |
HTC Corp. | 400,000 | 11,089 | |
Juniper Networks, Inc. (a) | 1,742,300 | 59,273 | |
Research In Motion Ltd. (a) | 975,600 | 60,341 | |
Riverbed Technology, Inc. (a) | 1,000,000 | 33,910 | |
| 176,096 | ||
Computers & Peripherals - 7.6% | |||
Apple, Inc. (a) | 745,700 | 232,023 | |
EMC Corp. (a) | 1,200,000 | 25,788 | |
NetApp, Inc. (a) | 1,300,000 | 66,209 | |
| 324,020 | ||
Internet Software & Services - 5.7% | |||
Akamai Technologies, Inc. (a) | 400,000 | 20,876 | |
eBay, Inc. (a) | 1,600,400 | 46,620 | |
Google, Inc. Class A (a) | 225,000 | 125,035 | |
Mail.ru Group Ltd. GDR unit (a)(e) | 107,500 | 4,408 | |
Rackspace Hosting, Inc. (a) | 200,000 | 5,834 | |
Tencent Holdings Ltd. | 1,787,500 | 39,755 | |
| 242,528 | ||
IT Services - 1.4% | |||
Cognizant Technology Solutions Corp. Class A (a) | 900,000 | 58,482 | |
Semiconductors & Semiconductor Equipment - 3.8% | |||
ARM Holdings PLC sponsored ADR (d) | 900,000 | 16,875 | |
Broadcom Corp. Class A | 1,545,500 | 68,759 | |
Marvell Technology Group Ltd. (a) | 2,877,400 | 55,505 | |
NXP Semiconductors NV | 872,000 | 10,970 | |
TriQuint Semiconductor, Inc. (a) | 600,000 | 7,146 | |
| 159,255 | ||
Common Stocks - continued | |||
Shares | Value (000s) | ||
INFORMATION TECHNOLOGY - continued | |||
Software - 3.2% | |||
Citrix Systems, Inc. (a) | 570,600 | $ 37,899 | |
Informatica Corp. (a) | 1,350,200 | 55,736 | |
NCsoft Corp. | 35,000 | 7,496 | |
RealPage, Inc. | 215,641 | 5,909 | |
Solera Holdings, Inc. | 300,000 | 14,400 | |
Taleo Corp. Class A (a) | 500,000 | 15,350 | |
| 136,790 | ||
TOTAL INFORMATION TECHNOLOGY | 1,097,171 | ||
MATERIALS - 10.0% | |||
Chemicals - 7.0% | |||
Celanese Corp. Class A | 750,000 | 27,750 | |
CF Industries Holdings, Inc. | 450,000 | 54,347 | |
Dow Chemical Co. | 1,992,200 | 62,117 | |
Ferro Corp. (a) | 569,400 | 8,125 | |
FMC Corp. | 500,000 | 38,910 | |
LyondellBasell Industries NV Class A (a) | 1,200,000 | 35,052 | |
PPG Industries, Inc. | 500,000 | 38,980 | |
Rockwood Holdings, Inc. (a) | 778,300 | 29,708 | |
| 294,989 | ||
Metals & Mining - 3.0% | |||
Alcoa, Inc. | 2,826,600 | 37,085 | |
Freeport-McMoRan Copper & Gold, Inc. | 600,000 | 60,792 | |
United States Steel Corp. (d) | 600,000 | 29,166 | |
| 127,043 | ||
TOTAL MATERIALS | 422,032 | ||
TELECOMMUNICATION SERVICES - 0.4% | |||
Wireless Telecommunication Services - 0.4% | |||
NII Holdings, Inc. (a) | 450,000 | 17,442 | |
TOTAL COMMON STOCKS (Cost $3,276,763) | 4,201,790 | ||
Nonconvertible Preferred Stocks - 0.4% | |||
Shares | Value (000s) | ||
CONSUMER DISCRETIONARY - 0.4% | |||
Automobiles - 0.4% | |||
Volkswagen AG (Cost $17,941) | 117,800 | $ 18,927 | |
Money Market Funds - 1.8% | |||
|
|
|
|
Fidelity Cash Central Fund, 0.24% (b) | 16,275,949 | 16,276 | |
Fidelity Securities Lending Cash Central Fund, 0.25% (b)(c) | 58,628,150 | 58,628 | |
TOTAL MONEY MARKET FUNDS (Cost $74,904) | 74,904 | ||
TOTAL INVESTMENT PORTFOLIO - 101.5% (Cost $3,369,608) | 4,295,621 | ||
NET OTHER ASSETS (LIABILITIES) - (1.5)% | (63,988) | ||
NET ASSETS - 100% | $ 4,231,633 | ||
Legend |
(a) Non-income producing |
(b) Affiliated fund that is available only to investment companies and other accounts managed by Fidelity Investments. The rate quoted is the annualized seven-day yield of the fund at period end. A complete unaudited listing of the fund's holdings as of its most recent quarter end is available upon request. In addition, each Fidelity Central Fund's financial statements, which are not covered by the Fund's Report of Independent Registered Public Accounting Firm, are available on the SEC's website or upon request. |
(c) Investment made with cash collateral received from securities on loan. |
(d) Security or a portion of the security is on loan at period end. |
(e) Security exempt from registration under Rule 144A of the Securities Act of 1933. These securities may be resold in transactions exempt from registration, normally to qualified institutional |
Affiliated Central Funds |
Information regarding fiscal year to date income earned by the Fund from investments in Fidelity Central Funds is as follows: |
Fund | Income earned |
Fidelity Cash Central Fund | $ 13 |
Fidelity Securities Lending Cash Central Fund | 561 |
Total | $ 574 |
Other Information |
The following is a summary of the inputs used, as of November 30, 2010, involving the Fund's assets and liabilities carried at fair value. The inputs or methodology used for valuing securities may not be an indication of the risk associated with investing in those securities. For more information on valuation inputs, and their aggregation into the levels used in the tables below, please refer to the Security Valuation section in the accompanying Notes to Financial Statements. |
Valuation Inputs at Reporting Date: | ||||
Description | Total | Level 1 | Level 2 | Level 3 |
Investments in Securities: | ||||
Equities: | ||||
Consumer Discretionary | $ 968,110 | $ 968,110 | $ - | $ - |
Consumer Staples | 64,127 | 64,127 | - | - |
Energy | 373,310 | 373,310 | - | - |
Financials | 233,078 | 221,154 | 11,924 | - |
Health Care | 306,580 | 306,580 | - | - |
Industrials | 738,867 | 728,605 | - | 10,262 |
Information Technology | 1,097,171 | 1,097,171 | - | - |
Materials | 422,032 | 422,032 | - | - |
Telecommunication Services | 17,442 | 17,442 | - | - |
Money Market Funds | 74,904 | 74,904 | - | - |
Total Investments in Securities: | $ 4,295,621 | $ 4,273,435 | $ 11,924 | $ 10,262 |
The following is a reconciliation of Investments in Securities for which Level 3 inputs were used in determining value: |
(Amounts in thousands) |
|
Investments in Securities: | |
Beginning Balance | $ - |
Total Realized Gain (Loss) | - |
Total Unrealized Gain (Loss) | 250 |
Cost of Purchases | 10,012 |
Proceeds of Sales | - |
Amortization/Accretion | - |
Transfers in to Level 3 | - |
Transfers out of Level 3 | - |
Ending Balance | $ 10,262 |
The change in unrealized gain (loss) for the period attributable to Level 3 securities held at November 30, 2010 | $ 250 |
The information used in the above reconciliation represents fiscal year to date activity for any Investments in Securities identified as using Level 3 inputs at either the beginning or the end of the current fiscal period. Transfers in or out of Level 3 represent the beginning value of any Security or Instrument where a change in the pricing level occurred from the beginning to the end of the period. The cost of purchases and the proceeds of sales may include securities received or delivered through corporate actions or exchanges. Realized and unrealized gains (losses) disclosed in the reconciliation are included in Net Gain (Loss) on the Fund's Statement of Operations. |
Distribution of investments by country of issue, as a percentage of total net assets, is as follows: (Unaudited) |
United States of America | 82.4% |
Germany | 2.9% |
Brazil | 2.8% |
Canada | 2.6% |
Cayman Islands | 2.1% |
Netherlands Antilles | 1.9% |
Bermuda | 1.3% |
Netherlands | 1.1% |
Others (Individually Less Than 1%) | 2.9% |
| 100.0% |
Income Tax Information |
At November 30, 2010, the Fund had a capital loss carryforward of approximately $1,483,260,000 of which $710,362,000 and $772,898,000 will expire in fiscal 2016 and 2017, respectively. Capital loss carryforwards are only available to offset future capital gains of the Fund to the extent provided by regulations and may be limited. |
See accompanying notes which are an integral part of the financial statements.
Annual Report
Financial Statements
Statement of Assets and Liabilities
Amounts in thousands (except per-share amounts) | November 30, 2010 | |
|
|
|
Assets | ||
Investment in securities, at value (including securities loaned of $58,039) - See accompanying schedule: Unaffiliated issuers (cost $3,294,704) | $ 4,220,717 |
|
Fidelity Central Funds (cost $74,904) | 74,904 |
|
Total Investments (cost $3,369,608) |
| $ 4,295,621 |
Receivable for investments sold | 51,707 | |
Receivable for fund shares sold | 2,545 | |
Dividends receivable | 4,331 | |
Distributions receivable from Fidelity Central Funds | 130 | |
Prepaid expenses | 13 | |
Other receivables | 294 | |
Total assets | 4,354,641 | |
|
|
|
Liabilities | ||
Payable for investments purchased | $ 57,317 | |
Payable for fund shares redeemed | 4,065 | |
Accrued management fee | 2,126 | |
Other affiliated payables | 703 | |
Other payables and accrued expenses | 169 | |
Collateral on securities loaned, at value | 58,628 | |
Total liabilities | 123,008 | |
|
|
|
Net Assets | $ 4,231,633 | |
Net Assets consist of: |
| |
Paid in capital | $ 4,802,504 | |
Accumulated net investment loss | (96) | |
Accumulated undistributed net realized gain (loss) on investments and foreign currency transactions | (1,496,770) | |
Net unrealized appreciation (depreciation) on investments and assets and liabilities in foreign currencies | 925,995 | |
Net Assets | $ 4,231,633 | |
See accompanying notes which are an integral part of the financial statements.
Annual Report
Financial Statements - continued
Statement of Assets and Liabilities - continued
Amounts in thousands (except per-share amounts) | November 30, 2010 | |
|
|
|
Independence: Net Asset Value, offering price and redemption price per share ($3,988,237 ÷ 171,224 shares) | $ 23.29 | |
|
|
|
Class K: Net Asset Value, offering price and redemption price per share ($243,396 ÷ 10,442 shares) | $ 23.31 | |
See accompanying notes which are an integral part of the financial statements.
Annual Report
Statement of Operations
Amounts in thousands | Year ended November 30, 2010 | |
|
|
|
Investment Income |
|
|
Dividends |
| $ 29,463 |
Income from Fidelity Central Funds |
| 574 |
Total income |
| 30,037 |
|
|
|
Expenses | ||
Management fee | $ 22,155 | |
Performance adjustment | 5,177 | |
Transfer agent fees | 7,547 | |
Accounting and security lending fees | 1,079 | |
Custodian fees and expenses | 154 | |
Independent trustees' compensation | 23 | |
Appreciation in deferred trustee compensation account | 1 | |
Registration fees | 56 | |
Audit | 71 | |
Legal | 24 | |
Interest | 3 | |
Miscellaneous | 53 | |
Total expenses before reductions | 36,343 | |
Expense reductions | (289) | 36,054 |
Net investment income (loss) | (6,017) | |
Realized and Unrealized Gain (Loss) Net realized gain (loss) on: | ||
Investment securities: |
|
|
Unaffiliated issuers | 606,270 | |
Foreign currency transactions | (1,044) | |
Futures contracts | 683 | |
Capital gain distributions from Fidelity Central Funds | 5 |
|
Total net realized gain (loss) |
| 605,914 |
Change in net unrealized appreciation (depreciation) on: Investment securities | 204,917 | |
Assets and liabilities in foreign currencies | (32) | |
Total change in net unrealized appreciation (depreciation) |
| 204,885 |
Net gain (loss) | 810,799 | |
Net increase (decrease) in net assets resulting from operations | $ 804,782 | |
See accompanying notes which are an integral part of the financial statements.
Annual Report
Financial Statements - continued
Statement of Changes in Net Assets
Amounts in thousands | Year ended | Year ended |
Increase (Decrease) in Net Assets |
|
|
Operations |
|
|
Net investment income (loss) | $ (6,017) | $ 13,175 |
Net realized gain (loss) | 605,914 | (303,965) |
Change in net unrealized appreciation (depreciation) | 204,885 | 1,385,715 |
Net increase (decrease) in net assets resulting | 804,782 | 1,094,925 |
Distributions to shareholders from net investment income | (7,207) | (20,945) |
Distributions to shareholders from net realized gain | (1,044) | - |
Total distributions | (8,251) | (20,945) |
Share transactions - net increase (decrease) | (566,877) | (556,508) |
Total increase (decrease) in net assets | 229,654 | 517,472 |
|
|
|
Net Assets | ||
Beginning of period | 4,001,979 | 3,484,507 |
End of period (including accumulated net investment loss of $96 and undistributed net investment income of $6,577, respectively) | $ 4,231,633 | $ 4,001,979 |
See accompanying notes which are an integral part of the financial statements.
Annual Report
Financial Highlights - Independence
Years ended November 30, | 2010 | 2009 | 2008 | 2007 | 2006 |
Selected Per-Share Data |
|
|
|
|
|
Net asset value, beginning of period | $ 19.10 | $ 14.17 | $ 27.60 | $ 22.03 | $ 19.46 |
Income from Investment Operations |
|
|
|
|
|
Net investment income (loss) B | (.03) | .06 | .08 | .07 | .08 |
Net realized and unrealized gain (loss) | 4.26 | 4.96 | (12.75) | 5.60 | 2.54 |
Total from investment operations | 4.23 | 5.02 | (12.67) | 5.67 | 2.62 |
Distributions from net investment income | (.03) | (.09) | (.01) | (.10) | (.05) |
Distributions from net realized gain | (.01) | - | (.75) | - | - |
Total distributions | (.04) | (.09) | (.76) | (.10) | (.05) |
Net asset value, end of period | $ 23.29 | $ 19.10 | $ 14.17 | $ 27.60 | $ 22.03 |
Total Return A | 22.18% | 35.62% | (47.19)% | 25.85% | 13.49% |
Ratios to Average Net Assets C, E |
|
|
|
|
|
Expenses before reductions | .92% | .92% | .91% | .90% | .87% |
Expenses net of fee waivers, if any | .92% | .92% | .91% | .90% | .87% |
Expenses net of all reductions | .92% | .91% | .90% | .89% | .86% |
Net investment income (loss) | (.16)% | .36% | .34% | .31% | .41% |
Supplemental Data |
|
|
|
|
|
Net assets, end of period (in millions) | $ 3,988 | $ 3,824 | $ 3,407 | $ 5,899 | $ 4,723 |
Portfolio turnover rate D | 103% | 173% | 173% | 175% | 169% |
A Total returns would have been lower had certain expenses not been reduced during the periods shown.
B Calculated based on average shares outstanding during the period.
C Fees and expenses of the underlying Fidelity Central Funds are not included in the Fund's expense ratio. The Fund indirectly bears its proportionate share of the expenses of any underlying Fidelity Central Funds.
D Amount does not include the portfolio activity of any underlying Fidelity Central Funds.
E Expense ratios reflect operating expenses of the class. Expenses before reductions do not reflect amounts reimbursed by the investment adviser or reductions from brokerage service arrangements or reductions from other expense offset arrangements and do not represent the amount paid by the class during periods when reimbursements or reductions occur. Expenses net of fee waivers reflect expenses after reimbursement by the investment adviser but prior to reductions from brokerage service arrangements or other expense offset arrangements. Expenses net of all reductions represent the net expenses paid by the class.
See accompanying notes which are an integral part of the financial statements.
Annual Report
Financial Highlights - Class K
Years ended November 30, | 2010 | 2009 | 2008 G |
Selected Per-Share Data |
|
|
|
Net asset value, beginning of period | $ 19.12 | $ 14.18 | $ 28.56 |
Income from Investment Operations |
|
|
|
Net investment income (loss) D | - I | .09 | .09 |
Net realized and unrealized gain (loss) | 4.26 | 4.96 | (14.47) |
Total from investment operations | 4.26 | 5.05 | (14.38) |
Distributions from net investment income | (.07) | (.11) | - |
Distributions from net realized gain | (.01) | - | - |
Total distributions | (.07) J | (.11) | - |
Net asset value, end of period | $ 23.31 | $ 19.12 | $ 14.18 |
Total Return B, C | 22.37% | 35.94% | (50.35)% |
Ratios to Average Net Assets E, H |
|
|
|
Expenses before reductions | .78% | .73% | .79% A |
Expenses net of fee waivers, if any | .78% | .73% | .79%A |
Expenses net of all reductions | .77% | .72% | .78%A |
Net investment income (loss) | (.01)% | .56% | 1.04%A |
Supplemental Data |
|
|
|
Net assets, end of period (in millions) | $ 243 | $ 178 | $ 78 |
Portfolio turnover rate F | 103% | 173% | 173% |
A Annualized
B Total returns for periods of less than one year are not annualized.
C Total returns would have been lower had certain expenses not been reduced during the periods shown.
D Calculated based on average shares outstanding during the period.
E Fees and expenses of the underlying Fidelity Central Funds are not included in the Fund's expense ratio. The Fund indirectly bears its proportionate share of the expenses of any underlying Fidelity Central Funds.
F Amount does not include the portfolio activity of any underlying Fidelity Central Funds.
G For the period May 9, 2008 (commencement of sale of shares) to November 30, 2008.
H Expense ratios reflect operating expenses of the class. Expenses before reductions do not reflect amounts reimbursed by the investment adviser or reductions from brokerage service arrangements or reductions from other expense offset arrangements and do not represent the amount paid by the class during periods when reimbursements or reductions occur. Expense ratios before reductions for start-up periods may not be representative of longer-term operating periods. Expenses net of fee waivers reflect expenses after reimbursement by the investment adviser but prior to reductions from brokerage service arrangements or other expense offset arrangements. Expenses net of all reductions represent the net expenses paid by the class.
I Amount represents less than $.01 per share.
J Total distributions of $.07 per share is comprised of distributions from net investment income of $.067 and distributions from net realized gain of $.005 per share.
See accompanying notes which are an integral part of the financial statements.
Annual Report
Notes to Financial Statements
For the period ended November 30, 2010
(Amounts in thousands except ratios)
1. Organization.
Fidelity Independence Fund (the Fund) is a fund of Fidelity Financial Trust (the Trust) and is authorized to issue an unlimited number of shares. The Trust is registered under the Investment Company Act of 1940, as amended (the 1940 Act), as an open-end management investment company organized as a Massachusetts business trust. The Fund offers Independence and Class K shares, each of which has equal rights as to assets and voting privileges. Each class has exclusive voting rights with respect to matters that affect that class. Investment income, realized and unrealized capital gains and losses, the common expenses of the Fund, and certain fund-level expense reductions, if any, are allocated on a pro-rata basis to each class based on the relative net assets of each class to the total net assets of the Fund. Each class differs with respect to transfer agent fees incurred. Certain expense reductions also differ by class. The Fund's investments in emerging markets can be subject to social, economic, regulatory, and political uncertainties and can be extremely volatile.
2. Investments in Fidelity Central Funds.
The Fund may invest in Fidelity Central Funds, which are open-end investment companies available only to other investment companies and accounts managed by Fidelity Management & Research Company (FMR) and its affiliates. The Fund's Schedule of Investments lists each of the Fidelity Central Funds held as of period end, if any, as an investment of the Fund, but does not include the underlying holdings of each Fidelity Central Fund. As an Investing Fund, the Fund indirectly bears its proportionate share of the expenses of the underlying Fidelity Central Funds.
The Money Market Central Funds seek preservation of capital and current income and are managed by Fidelity Investments Money Management, Inc. (FIMM), an affiliate of FMR.
A complete unaudited list of holdings for each Fidelity Central Fund is available upon request or at the Securities and Exchange Commission (the SEC) web site at www.sec.gov. In addition, the financial statements of the Fidelity Central Funds, which are not covered by the Fund's Report of Independent Registered Public Accounting Firm, are available on the SEC web site or upon request.
3. Significant Accounting Policies.
The financial statements have been prepared in conformity with accounting principles generally accepted in the United States of America (GAAP), which require management to make certain estimates and assumptions at the date of the financial statements. Actual results could differ from those estimates. The following summarizes the significant accounting policies of the Fund:
Annual Report
Notes to Financial Statements - continued
(Amounts in thousands except ratios)
3. Significant Accounting Policies - continued
Security Valuation. Investments are valued as of 4:00 p.m. Eastern time on the last calendar day of the period. The Fund uses independent pricing services approved by the Board of Trustees to value its investments. When current market prices or quotations are not readily available or reliable, valuations may be determined in good faith in accordance with procedures adopted by the Board of Trustees. Factors used in determining value may include market or security specific events. The frequency with which these procedures are used cannot be predicted and they may be utilized to a significant extent. The value used for net asset value (NAV) calculation under these procedures may differ from published prices for the same securities.
The Fund categorizes the inputs to valuation techniques used to value its investments into a disclosure hierarchy consisting of three levels as shown below.
Level 1 - quoted prices in active markets for identical investments
Level 2 - other significant observable inputs (including quoted prices for similar investments, interest rates, prepayment speeds, etc.)
Level 3 - unobservable inputs (including the Fund's own assumptions based on the best information available)
Changes in valuation techniques may result in transfers in or out of an assigned level within the disclosure hierarchy. The aggregate value of investments by input level, as of November 30, 2010, as well as a roll forward of Level 3 securities, is included at the end of the Fund's Schedule of Investments. Valuation techniques used to value the Fund's investments by major category are as follows.
Equity securities, including restricted securities, for which market quotations are readily available, are valued at the last reported sale price or official closing price as reported by an independent pricing service on the primary market or exchange on which they are traded and are categorized as Level 1 in the hierarchy. In the event there were no sales during the day or closing prices are not available, securities are valued at the last quoted bid price or may be valued using the last available price and are generally categorized as Level 2 in the hierarchy. For foreign equity securities, when significant market or security specific events arise, comparisons to the valuation of American Depositary Receipts (ADRs), futures contracts, Exchange-traded funds (ETFs) and certain indexes as well as quoted prices for similar securities are used and are categorized as Level 2 in the hierarchy in these circumstances. Utilizing these techniques may result in transfers between Level 1 and Level 2. For restricted equity securities and private placements where observable inputs are limited, assumptions about market activity and risk are used and are categorized as Level 3 in the hierarchy.
Annual Report
3. Significant Accounting Policies - continued
Security Valuation - continued
Investments in open-end mutual funds, including the Fidelity Central Funds, are valued at their closing net asset value each business day and are categorized as Level 1 in the hierarchy.
Foreign Currency. The Fund uses foreign currency contracts to facilitate transactions in foreign-denominated securities. Gains and losses from these transactions may arise from changes in the value of the foreign currency or if the counterparties do not perform under the contracts' terms.
Foreign-denominated assets, including investment securities, and liabilities are translated into U.S. dollars at the exchange rate at period end. Purchases and sales of investment securities, income and dividends received and expenses denominated in foreign currencies are translated into U.S. dollars at the exchange rate in effect on the transaction date.
The effects of exchange rate fluctuations on investments are included with the net realized and unrealized gain (loss) on investment securities. Other foreign currency transactions resulting in realized and unrealized gain (loss) are disclosed separately.
Investment Transactions and Income. For financial reporting purposes, the Fund's investment holdings and NAV include trades executed through the end of the last business day of the period. The NAV per share for processing shareholder transactions is calculated as of the close of business of the New York Stock Exchange (NYSE), normally 4:00 p.m. Eastern time and includes trades executed through the end of the prior business day. Gains and losses on securities sold are determined on the basis of identified cost and may include proceeds received from litigation. Dividend income is recorded on the ex-dividend date, except for certain dividends from foreign securities where the ex-dividend date may have passed, which are recorded as soon as the Fund is informed of the ex-dividend date. Non-cash dividends included in dividend income, if any, are recorded at the fair market value of the securities received. Distributions received on securities that represent a return of capital or capital gain are recorded as a reduction of cost of investments and/or as a realized gain. The Fund estimates the components of distributions received that may be considered return of capital distributions or capital gain distributions. Interest income and distributions from the Fidelity Central Funds are accrued as earned. Interest income includes coupon interest and amortization of premium and accretion of discount on debt securities. Investment income is recorded net of foreign taxes withheld where recovery of such taxes is uncertain.
Annual Report
Notes to Financial Statements - continued
(Amounts in thousands except ratios)
3. Significant Accounting Policies - continued
Expenses. Most expenses of the Trust can be directly attributed to a fund. Expenses which cannot be directly attributed are apportioned amongst each fund in the Trust. Expense estimates are accrued in the period to which they relate and adjustments are made when actual amounts are known.
Deferred Trustee Compensation. Under a Deferred Compensation Plan (the Plan), independent Trustees may elect to defer receipt of a portion of their annual compensation. Deferred amounts are invested in a cross-section of Fidelity funds, are marked-to-market and remain in the Fund until distributed in accordance with the Plan. The investment of deferred amounts and the offsetting payable to the Trustees are included in the accompanying Statement of Assets and Liabilities.
Income Tax Information and Distributions to Shareholders. Each year the Fund intends to qualify as a regulated investment company, including distributing substantially all of its taxable income and realized gains under Subchapter M of the Internal Revenue Code and filing its U.S. federal tax return. As a result, no provision for income taxes is required. As of November 30, 2010, the Fund did not have any unrecognized tax benefits in the accompanying financial statements. A fund's federal tax return is subject to examination by the Internal Revenue Service (IRS) for a period of three years. Foreign taxes are provided for based on the Fund's understanding of the tax rules and rates that exist in the foreign markets in which it invests.
Distributions are declared and recorded on the ex-dividend date. Income dividends and capital gain distributions are declared separately for each class. Income and capital gain distributions are determined in accordance with income tax regulations, which may differ from GAAP.
Capital accounts within the financial statements are adjusted for permanent book-tax differences. These adjustments have no impact on net assets or the results of operations. Temporary book-tax differences will reverse in a subsequent period.
Book-tax differences are primarily due to futures transactions, foreign currency transactions, market discount, partnerships, deferred trustees compensation, net operating losses, capital loss carryforwards and losses deferred due to wash sales and excise tax regulations.
The federal tax cost of investment securities and unrealized appreciation (depreciation) as of period end were as follows:
Gross unrealized appreciation | $ 984,561 |
Gross unrealized depreciation | (72,059) |
Net unrealized appreciation (depreciation) | $ 912,502 |
|
|
Tax Cost | $ 3,383,119 |
Annual Report
3. Significant Accounting Policies - continued
Income Tax Information and Distributions to Shareholders - continued
The tax-based components of distributable earnings as of period end were as follows:
Capital loss carryforward | $ (1,483,260) |
Net unrealized appreciation (depreciation) | $ 912,484 |
The tax character of distributions paid was as follows:
| November 30, 2010 | November 30, 2009 |
Ordinary Income | $ 8,251 | $ 20,945 |
4. Operating Policies.
Restricted Securities. The Fund may invest in securities that are subject to legal or contractual restrictions on resale. These securities generally may be resold in transactions exempt from registration or to the public if the securities are registered. Disposal of these securities may involve time-consuming negotiations and expense, and prompt sale at an acceptable price may be difficult. Information regarding restricted securities is included at the end of the Fund's Schedule of Investments.
5. Derivative Instruments.
Risk Exposures and the Use of Derivative Instruments. The Fund uses derivative instruments (derivatives), including futures contracts, in order to meet its investment objectives. The strategy is to use derivatives to increase returns, to gain exposure to certain types of assets and to manage exposure to certain risks as defined below. The success of any strategy involving derivatives depends on analysis of numerous economic factors, and if the strategies for investment do not work as intended, the Fund may not achieve its objectives.
The Fund's use of derivatives may increase or decrease its exposure to the following risk:
Equity Risk | Equity risk relates to the fluctuations in the value of financial instruments as a result of changes in market prices (other than those arising from interest rate risk or foreign exchange risk), whether caused by factors specific to an individual investment, its issuer, or all factors affecting all instruments traded in a market or market segment. |
The Fund is also exposed to additional risks from investing in derivatives, such as liquidity risk and counterparty credit risk. Liquidity risk is the risk that the Fund will be unable to sell the derivative in the open market in a timely manner. Counterparty credit
Annual Report
Notes to Financial Statements - continued
(Amounts in thousands except ratios)
5. Derivative Instruments - continued
Risk Exposures and the Use of Derivative Instruments - continued
risk is the risk that the counterparty will not be able to fulfill its obligation to the Fund. The Fund's maximum risk of loss from counterparty credit risk is generally the aggregate unrealized appreciation and unpaid counterparty fees in excess of any collateral pledged by the counterparty to the Fund. Counterparty risk related to exchange-traded futures contracts is minimal because of the protection provided by the exchange on which they trade. Risk of loss may exceed the amounts recognized in the Statement of Assets and Liabilities.
Futures Contracts. A futures contract is an agreement between two parties to buy or sell a specified underlying instrument for a fixed price at a specified future date. The Fund uses futures contracts to manage its exposure to the stock market.
Upon entering into a futures contract, a fund is required to deposit either cash or securities (initial margin) with a clearing broker in an amount equal to a certain percentage of the face value of the contract. Futures contracts are marked-to-market daily and subsequent payments (variation margin) are made or received by a fund depending on the daily fluctuations in the value of the futures contracts and are recorded as unrealized appreciation or (depreciation). Realized gain or (loss) is recorded upon the expiration or closing of a futures contract. The net realized gain (loss) and change in net unrealized appreciation (depreciation) on futures contracts during the period is included in the Statement of Operations.
The underlying face amount at value of open futures contracts at period end, if any, is shown in the Schedule of Investments under the caption "Futures Contracts." This amount reflects each contract's exposure to the underlying instrument at period end. Securities deposited to meet initial margin requirements are identified in the Schedule of Investments. The receivable and/or payable for the variation margin are reflected in the Statement of Assets and Liabilities.
Certain risks may arise upon entering into futures contracts, including the risk that an illiquid market may limit the ability to close out a futures contract prior to settlement date.
During the period the Fund recognized net realized gain (loss) of $683 and a change in net unrealized appreciation (depreciation) of $0 related to its investment in futures contracts. These amounts are included in the Statement of Operations.
6. Purchases and Sales of Investments.
Purchases and sales of securities, other than short-term securities, aggregated $4,035,524 and $4,609,822, respectively.
Annual Report
7. Fees and Other Transactions with Affiliates.
Management Fee. FMR and its affiliates provide the Fund with investment management related services for which the Fund pays a monthly management fee. The management fee is the sum of an individual fund fee rate that is based on an annual rate of .30% of the Fund's average net assets and a group fee rate that averaged .26% during the period. The group fee rate is based upon the average net assets of all the mutual funds advised by FMR. The group fee rate decreases as assets under management increase and increases as assets under management decrease. In addition, the management fee is subject to a performance adjustment (up to a maximum of ± .20% of the Fund's average net assets over a 36 month performance period). The upward or downward adjustment to the management fee is based on the relative investment performance of Independence as compared to an appropriate benchmark index. For the period, the total annual management fee rate, including the performance adjustment, was .69% of the Fund's average net assets.
Transfer Agent Fees. Fidelity Investments Institutional Operations Company, Inc. (FIIOC), an affiliate of FMR, is the transfer, dividend disbursing and shareholder servicing agent for each class of the Fund. FIIOC receives account fees and asset-based fees that vary according to the account size and type of account of the shareholders of Independence. FIIOC receives an asset-based fee of Class K's average net assets. FIIOC pays for typesetting, printing and mailing of shareholder reports, except proxy statements. For the period, transfer agent fees for each class were as follows:
| Amount | % of |
Independence | $ 7,451 | .20 |
Class K | 96 | .05 |
| $ 7,547 |
|
Accounting and Security Lending Fees. Fidelity Service Company, Inc. (FSC), an affiliate of FMR, maintains the Fund's accounting records. The accounting fee is based on the level of average net assets for the month. Under a separate contract, FSC administers the security lending program. The security lending fee is based on the number and duration of lending transactions.
Brokerage Commissions. The Fund placed a portion of its portfolio transactions with brokerage firms which are affiliates of the investment adviser. The commissions paid to these affiliated firms were $84 for the period.
Interfund Lending Program. Pursuant to an Exemptive Order issued by the SEC, the Fund, along with other registered investment companies having management contracts with FMR, may participate in an interfund lending program. This program provides an alternative credit facility allowing the funds to borrow from, or lend money to, other
Annual Report
Notes to Financial Statements - continued
(Amounts in thousands except ratios)
7. Fees and Other Transactions with Affiliates - continued
Interfund Lending Program - continued
participating affiliated funds. At period end, there were no interfund loans outstanding. The Fund's activity in this program during the period for which loans were outstanding was as follows:
Borrower or Lender | Average Daily | Weighted Average Interest Rate | Interest |
Borrower | $ 8,196 | .42% | $ 3 |
8. Committed Line of Credit.
The Fund participates with other funds managed by FMR or an affiliate in a $3.75 billion credit facility (the "line of credit") to be utilized for temporary or emergency purposes to fund shareholder redemptions or for other short-term liquidity purposes. The Fund has agreed to pay commitment fees on its pro-rata portion of the line of credit, which amounted to $16 and is reflected in Miscellaneous expenses on the Statement of Operations. During the period, there were no borrowings on this line of credit.
9. Security Lending.
The Fund lends portfolio securities through a lending agent from time to time in order to earn additional income. The lending agent may loan securities to certain qualified borrowers, including Fidelity Capital Markets (FCM), a broker-dealer affiliated with the Fund. On the settlement date of the loan, the Fund receives collateral (in the form of U.S. Treasury obligations, letters of credit and/or cash) against the loaned securities and maintains collateral in an amount not less than 100% of the market value of the loaned securities during the period of the loan. The market value of the loaned securities is determined at the close of business of the Fund and any additional required collateral is delivered to the Fund on the next business day. If the borrower defaults on its obligation to return the securities loaned because of insolvency or other reasons, a fund could experience delays and costs in recovering the securities loaned or in gaining access to the collateral. Any cash collateral received is invested in the Fidelity Securities Lending Cash Central Fund. The value of loaned securities and cash collateral at period end are disclosed on the Fund's Statement of Assets and Liabilities. Security lending income represents the income earned on investing cash collateral, less rebates paid to borrowers and lending agent fees associated with the loan, plus any premium payments received for lending certain types of securities. Security lending income is presented in the Statement of Operations as a component of income from Fidelity Central Funds. Total security lending income during the period amounted to $561. During the period, there were no securities loaned to FCM.
Annual Report
10. Expense Reductions.
Many of the brokers with whom FMR places trades on behalf of the Fund provided services to the Fund in addition to trade execution. These services included payments of certain expenses on behalf of the Fund totaling $289 for the period.
11. Distributions to Shareholders.
Distributions to shareholders of each class were as follows:
Years ended November 30, | 2010 | 2009 |
From net investment income |
|
|
Independence | $ 6,585 | $ 20,326 |
Class K | 622 | 619 |
Total | $ 7,207 | $ 20,945 |
From net realized gain |
|
|
Independence | $ 998 | $ - |
Class K | 46 | - |
Total | $ 1,044 | $ - |
12. Share Transactions.
Transactions for each class of shares were as follows:
| Shares | Dollars | ||
Years ended November 30, | 2010 | 2009 A | 2010 | 2009 A |
Independence |
|
|
|
|
Shares sold | 11,119 | 19,015 | $ 231,763 | $ 286,391 |
Conversion to Class K | - | (4,612) | - | (73,200) |
Reinvestment of distributions | 385 | 1,443 | 7,469 | 20,026 |
Shares redeemed | (40,468) | (56,069) | (829,719) | (841,423) |
Net increase (decrease) | (28,964) | (40,223) | $ (590,487) | $ (608,206) |
Class K |
|
|
|
|
Shares sold | 5,967 | 3,711 | $ 122,003 | $ 53,643 |
Conversion from Independence | - | 4,612 | - | 73,200 |
Reinvestment of distributions | 35 | 45 | 669 | 619 |
Shares redeemed | (4,890) | (4,524) | (99,062) | (75,764) |
Net increase (decrease) | 1,112 | 3,844 | $ 23,610 | $ 51,698 |
A Conversion transactions for Class K and Independence are presented for the period December 1, 2008 through August 31, 2009.
Annual Report
Notes to Financial Statements - continued
(Amounts in thousands except ratios)
13. Other.
The Fund's organizational documents provide former and current trustees and officers with a limited indemnification against liabilities arising in connection with the performance of their duties to the Fund. In the normal course of business, the Fund may also enter into contracts that provide general indemnifications. The Fund's maximum exposure under these arrangements is unknown as this would be dependent on future claims that may be made against the Fund. The risk of material loss from such claims is considered remote.
Annual Report
Report of Independent Registered Public Accounting Firm
To the Trustees of Fidelity Financial Trust and the Shareholders of Fidelity Independence Fund:
In our opinion, the accompanying statement of assets and liabilities, including the schedule of investments, and the related statements of operations and of changes in net assets and the financial highlights present fairly, in all material respects, the financial position of Fidelity Independence Fund (a fund of Fidelity Financial Trust) at November 30, 2010, the results of its operations for the year then ended, the changes in its net assets for each of the two years in the period then ended and the financial highlights for each of the periods indicated, in conformity with accounting principles generally accepted in the United States of America. These financial statements and financial highlights (hereafter referred to as "financial statements") are the responsibility of the Fidelity Independence Fund's management. Our responsibility is to express an opinion on these financial statements based on our audits. We conducted our audits of these financial statements in accordance with the standards of the Public Company Accounting Oversight Board (United States). Those standards require that we plan and perform the audit to obtain reasonable assurance about whether the financial statements are free of material misstatement. An audit includes examining, on a test basis, evidence supporting the amounts and disclosures in the financial statements, assessing the accounting principles used and significant estimates made by management, and evaluating the overall financial statement presentation. We believe that our audits, which included confirmation of securities at November 30, 2010 by correspondence with the custodian and brokers, provide a reasonable basis for our opinion.
/s/ PricewaterhouseCoopers LLP
PricewaterhouseCoopers LLP
Boston, Massachusetts
January 14, 2011
Annual Report
Trustees and Officers
The Trustees, Members of the Advisory Board, and executive officers of the trust and fund, as applicable, are listed below. The Board of Trustees governs the fund and is responsible for protecting the interests of shareholders. The Trustees are experienced executives who meet periodically throughout the year to oversee the fund's activities, review contractual arrangements with companies that provide services to the fund, oversee management of the risks associated with such activities and contractual arrangements, and review the fund's performance. Except for James C. Curvey, each of the Trustees oversees 219 funds advised by FMR or an affiliate. Mr. Curvey oversees 408 funds advised by FMR or an affiliate.
The Trustees hold office without limit in time except that (a) any Trustee may resign; (b) any Trustee may be removed by written instrument, signed by at least two-thirds of the number of Trustees prior to such removal; (c) any Trustee who requests to be retired or who has become incapacitated by illness or injury may be retired by written instrument signed by a majority of the other Trustees; and (d) any Trustee may be removed at any special meeting of shareholders by a two-thirds vote of the outstanding voting securities of the trust. Each Trustee who is not an interested person (as defined in the 1940 Act) (Independent Trustee), shall retire not later than the last day of the calendar year in which his or her 72nd birthday occurs. The Independent Trustees may waive this mandatory retirement age policy with respect to individual Trustees. The executive officers and Advisory Board Members hold office without limit in time, except that any officer and Advisory Board Member may resign or may be removed by a vote of a majority of the Trustees at any regular meeting or any special meeting of the Trustees. Except as indicated, each individual has held the office shown or other offices in the same company for the past five years.
Experience, Skills, Attributes, and Qualifications of the Fund's Trustees. The Governance and Nominating Committee has adopted a statement of policy that describes the experience, qualifications, attributes, and skills that are necessary and desirable for potential Independent Trustee candidates (Statement of Policy). The Board believes that each Trustee satisfied at the time he or she was initially elected or appointed a Trustee, and continues to satisfy, the standards contemplated by the Statement of Policy. The Governance and Nominating Committee also engages professional search firms to help identify potential Independent Trustee candidates who have the experience, qualifications, attributes, and skills consistent with the Statement of Policy. From time to time, additional criteria based on the composition and skills of the current Independent Trustees, as well as experience or skills that may be appropriate in light of future changes to board composition, business conditions, and regulatory or other developments, have also been considered by the professional search firms and the Governance and Nominating Committee. In addition, the Board takes into account the Trustees' commitment and participation in Board and committee meetings, as well as their leadership of standing and ad hoc committees throughout their tenure.
In determining that a particular Trustee was and continues to be qualified to serve as a Trustee, the Board has considered a variety of criteria, none of which, in isolation, was controlling. The Board believes that, collectively, the Trustees have balanced and diverse experience, qualifications, attributes, and skills, which allow the Board to operate effectively in governing the fund and protecting the interests of shareholders. Information about the specific experience, skills, attributes, and qualifications of each Trustee, which in each case led to the Board's conclusion that the Trustee should serve (or continue to serve) as a trustee of the fund, is provided below.
Annual Report
Board Structure and Oversight Function. James C. Curvey is an interested person (as defined in the 1940 Act) and currently serves as Acting Chairman. The Trustees have determined that an interested Chairman is appropriate and benefits shareholders because an interested Chairman has a personal and professional stake in the quality and continuity of services provided to the fund. Independent Trustees exercise their informed business judgment to appoint an individual of their choosing to serve as Chairman, regardless of whether the Trustee happens to be independent or a member of management. The Independent Trustees have determined that they can act independently and effectively without having an Independent Trustee serve as Chairman and that a key structural component for assuring that they are in a position to do so is for the Independent Trustees to constitute a substantial majority for the Board. The Independent Trustees also regularly meet in executive session. Ned C. Lautenbach serves as Chairman of the Independent Trustees and as such (i) acts as a liaison between the Independent Trustees and management with respect to matters important to the Independent Trustees and (ii) with management prepares agendas for Board meetings.
Fidelity funds are overseen by different Boards of Trustees. The fund's Board oversees Fidelity's equity and high income funds and another Board oversees Fidelity's investment-grade bond, money market, and asset allocation funds. The asset allocation funds may invest in Fidelity funds overseen by the fund's Board. The use of separate Boards, each with its own committee structure, allows the Trustees of each group of Fidelity funds to focus on the unique issues of the funds they oversee, including common research, investment, and operational issues. On occasion, the separate Boards establish joint committees to address issues of overlapping consequences for the Fidelity funds overseen by each Board.
The Trustees operate using a system of committees to facilitate the timely and efficient consideration of all matters of importance to the Trustees, the fund, and fund shareholders and to facilitate compliance with legal and regulatory requirements and oversight of the fund's activities and associated risks. The Board, acting through its committees, has charged FMR and its affiliates with (i) identifying events or circumstances the occurrence of which could have demonstrably adverse effects on the fund's business and/or reputation; (ii) implementing processes and controls to lessen the possibility that such events or circumstances occur or to mitigate the effects of such events or circumstances if they do occur; and (iii) creating and maintaining a system designed to evaluate continuously business and market conditions in order to facilitate the identification and implementation processes described in (i) and (ii) above. Because the day-to-day operations and activities of the fund are carried out by or through FMR, its affiliates and other service providers, the fund's exposure to risks is mitigated but not eliminated by the processes overseen by the Trustees. While each of the Board's committees has responsibility for overseeing different aspects of the fund's activities, oversight is exercised primarily through the Operations, Audit, and Compliance Committees. Appropriate personnel, including but not limited to the fund's Chief Compliance Officer (CCO), FMR's internal auditor, the independent accountants, the fund's Treasurer and portfolio management personnel, make periodic reports to the Board's committees, as appropriate. The responsibilities of each committee, including their oversight responsibilities, are described further under "Standing Committees of the Fund's Trustees."
Annual Report
Trustees and Officers - continued
The fund's Statement of Additional Information (SAI) includes more information about the Trustees. To request a free copy, call Fidelity at 1-800-544-8544.
Interested Trustees*:
Correspondence intended for each Trustee who is an interested person may be sent to Fidelity Investments, 82 Devonshire Street, Boston, Massachusetts 02109.
Name, Age; Principal Occupations and Other Relevant Experience+ | |
James C. Curvey (75) | |
| Year of Election or Appointment: 2007 Mr. Curvey is Trustee and Acting Chairman of the Board of Trustees of certain Trusts. Mr. Curvey also serves as Trustee (2007-present) of other investment companies advised by FMR. Mr. Curvey is a Director of Fidelity Investments Money Management, Inc. (2009-present), Director of Fidelity Research & Analysis Co. (2009-present) and Director of FMR and FMR Co., Inc. (2007-present). Mr. Curvey is also Vice Chairman (2007-present) and Director of FMR LLC. In addition, Mr. Curvey serves as an Overseer for the Boston Symphony Orchestra and a member of the Trustees of Villanova University. Previously, Mr. Curvey was the Vice Chairman (2006-2007) and Director (2000-2007) of FMR Corp. |
Ronald P. O'Hanley (54) | |
| Year of Election or Appointment: 2011 Ronald P. O'Hanley is President, Asset Management and Corporate Services, for Fidelity Investments and a member of Fidelity's Executive Committee (2010-present). Previously, Mr. O'Hanley served as President and Chief Executive Officer of BNY Mellon Asset Management (2007-2010). Mr. O'Hanley also served as Vice Chairman of Bank New York Mellon Corp. and a member of that firm's Executive Committee. Prior to the 2007 merger of The Bank of New York and Mellon Financial Corporation, he was Vice Chairman of Mellon Financial Corporation and President and Chief Executive Officer of Mellon Asset Management. He joined Mellon in February 1997. Mr. O'Hanley currently serves as Chairman of the Boston Public Library Foundation Board of Directors and sits on the Board of Directors of Beth Israel Deaconess Medical Center, the Board of Trustees of the Marine Biological Laboratory and the Advisory Board of the Maxwell School of Citizenship and Public Administration at Syracuse University. Mr. O'Hanley also chairs the Council on Asset Management for the Financial Services Roundtable and is a member of the Board of Directors of Institutional Investor's U.S. Institute. |
Annual Report
* Trustees have been determined to be "Interested Trustees" by virtue of, among other things, their affiliation with the trust or various entities under common control with FMR.
+ The information above includes each Trustee's principal occupation during the last five years and other information relating to the experience, attributes, and skills relevant to each Trustee's qualifications to serve as a Trustee, which led to the conclusion that each Trustee should serve as a Trustee for the fund.
Independent Trustees:
Correspondence intended for each Independent Trustee (that is, the Trustees other than the Interested Trustees) may be sent to Fidelity Investments, P.O. Box 55235, Boston, Massachusetts 02205-5235.
Name, Age; Principal Occupations and Other Relevant Experience+ | |
Dennis J. Dirks (62) | |
| Year of Election or Appointment: 2005 Prior to his retirement in May 2003, Mr. Dirks was Chief Operating Officer and a member of the Board of The Depository Trust & Clearing Corporation (DTCC). He also served as President, Chief Operating Officer, and Board member of The Depository Trust Company (DTC) and President and Board member of the National Securities Clearing Corporation (NSCC). In addition, Mr. Dirks served as Chief Executive Officer and Board member of the Government Securities Clearing Corporation, Chief Executive Officer and Board member of the Mortgage-Backed Securities Clearing Corporation, as a Trustee and a member of the Finance Committee of Manhattan College (2005-2008), and as a Trustee and a member of the Finance Committee of AHRC of Nassau County (2006-2008). Mr. Dirks is a member of the Independent Directors Council (IDC) Governing Council (2010-Present) and Board of Directors for The Brookville Center for Children's Services, Inc. (2009-present). |
Alan J. Lacy (57) | |
| Year of Election or Appointment: 2008 Mr. Lacy serves as Senior Adviser (2007-present) of Oak Hill Capital Partners, L.P. (private equity). Mr. Lacy also served as Chief Executive Officer (2000-2005) and Vice Chairman (2005-2006) of Sears Holdings Corporation and Sears, Roebuck and Co. (retail). In addition, Mr. Lacy serves as a member of the Board of Directors of The Western Union Company (global money transfer, 2006-present) and Bristol- |
Ned C. Lautenbach (66) | |
| Year of Election or Appointment: 2000 Mr. Lautenbach is Chairman of the Independent Trustees of the Equity and High Income Funds (2006-present). Mr. Lautenbach currently serves as the Lead Director of the Eaton Corporation Board of Directors (diversified industrial, 1997-present). Mr. Lautenbach is also a member of the Board of Directors of the Philharmonic Center for the Arts in Naples, Florida (1999-present); a member of the Board of Trustees of Fairfield University (2005-present); and a member of the Council on Foreign Relations (1994-present). Previously, Mr. Lautenbach was a Partner/Advisory Partner at Clayton, Dubilier & Rice, Inc. (private equity investment, 1998-2010), as well as a Director of Sony Corporation (2006-2007). |
Joseph Mauriello (66) | |
| Year of Election or Appointment: 2008 Prior to his retirement in January 2006, Mr. Mauriello served in numerous senior management positions including Deputy Chairman and Chief Operating Officer (2004-2005), and Vice Chairman of Financial Services (2002-2004) of KPMG LLP US (professional services, 1965-2005). Mr. Mauriello currently serves as a member of the Board of Directors of XL Group plc. (global insurance and re-insurance, 2006-present) and of Arcadia Resources Inc. (health care services and products, 2007- |
Cornelia M. Small (66) | |
| Year of Election or Appointment: 2005 Ms. Small is a member of the Board of Directors of the Teagle Foundation (2009-present). Ms. Small is also a member of the Investment Committee, and Chair (2008-present) and a member of the Board of Trustees of Smith College. In addition, Ms. Small serves on the Investment Committee of the Berkshire Taconic Community Foundation (2008- |
William S. Stavropoulos (71) | |
| Year of Election or Appointment: 2002 Mr. Stavropoulos is Vice Chairman of the Independent Trustees of the Equity and High Income Funds (2006-present). Mr. Stavropoulos serves as President and Founder of the Michigan Baseball Foundation, the Great Lakes Loons (2007-present). Mr. Stavropoulos is Chairman Emeritus of the Board of Directors of The Dow Chemical Company, where he previously served in numerous senior management positions, including President, CEO (1995-2000; 2002-2004), Chairman of the Executive Committee (2000-2006), and as a member of the Board of Directors (1990-2006). Currently, Mr. Stavropoulos is Chairman of Univar (global distributor of commodity and specialty chemicals, 2010-present), a Director of Teradata Corporation (data warehousing and technology solutions, 2008-present), Chemical Financial Corporation, Maersk Inc. (industrial conglomerate), Tyco International, Inc. (multinational manufacturing and services, 2007-present), and a member of the Advisory Board for Metalmark Capital (private equity investment, 2005- |
David M. Thomas (61) | |
| Year of Election or Appointment: 2008 Previously, Mr. Thomas served as Executive Chairman (2005-2006) and Chairman and Chief Executive Officer (2000-2005) of IMS Health, Inc. (pharmaceutical and healthcare information solutions). In addition, Mr. Thomas serves as a member of the Board of Directors of Fortune Brands, Inc. (consumer products), and Interpublic Group of Companies, Inc. (marketing communication, 2004-present). |
Michael E. Wiley (60) | |
| Year of Election or Appointment: 2008 Mr. Wiley also serves as a Director of Asia Pacific Exploration Consolidated (international oil and gas exploration and production, 2008-present). Mr. Wiley serves as a Director of Tesoro Corporation (independent oil refiner and marketer, 2005-present), and a Director of Bill Barrett Corporation (exploration and production, 2005-present). In addition, Mr. Wiley also serves as a Director of Post Oak Bank (privately-held bank, 2004-present). Previously, Mr. Wiley served as a member of the Board of Trustees of the University of Tulsa (2000-2006; 2007-2010), as a Senior Energy Advisor of Katzenbach Partners, LLC (consulting, 2006-2007), as an Advisory Director of Riverstone Holdings (private investment), Chairman, President, and CEO of Baker Hughes, Inc. (oilfield services, 2000-2004), and as Director of Spinnaker Exploration Company (exploration and production, 2001-2005). |
Annual Report
Trustees and Officers - continued
+ The information above includes each Trustee's principal occupation during the last five years and other information relating to the experience, attributes, and skills relevant to each Trustee's qualifications to serve as a Trustee, which led to the conclusion that each Trustee should serve as a Trustee for the fund.
Advisory Board Members and Executive Officers:
Correspondence intended for each executive officer, Edward C. Johnson 3d, and Peter S. Lynch may be sent to Fidelity Investments, 82 Devonshire Street, Boston, Massachusetts 02109.
Name, Age; Principal Occupation | |
Edward C. Johnson 3d (80) | |
| Year of Election or Appointment: 2011 Member of the Advisory Board of Fidelity's Equity and High Income Funds. Formerly Trustee and Chairman of the Board of Trustees of certain Trusts, Mr. Johnson serves as Chief Executive Officer, Chairman, and a Director of FMR LLC; Chairman and a Director of FMR; and Chairman and a Director of FMR Co., Inc. In addition, Mr. Johnson serves as Chairman and Director of FIL Limited. Previously, Mr. Johnson served as President of FMR LLC (2006-2007). |
Peter S. Lynch (66) | |
| Year of Election or Appointment: 2003 Member of the Advisory Board of Fidelity's Equity and High Income Funds. Mr. Lynch is Vice Chairman and a Director of FMR and FMR Co., Inc. In addition, Mr. Lynch serves as a Trustee of Boston College and as the Chairman of the Inner-City Scholarship Fund. Previously, Mr. Lynch served on the Special Olympics International Board of Directors (1997-2006). |
Kenneth B. Robins (41) | |
| Year of Election or Appointment: 2008 President and Treasurer of Fidelity's Equity and High Income Funds. Mr. Robins also serves as President and Treasurer (2010-present) and Assistant Treasurer (2009-present) of other Fidelity funds and is an employee of Fidelity Investments (2004-present). Previously, Mr. Robins served as Deputy Treasurer of the Fidelity funds (2005-2008) and Treasurer and Chief Financial Officer of The North Carolina Capital Management Trust: Cash and Term Portfolios (2006-2008). |
Bruce T. Herring (45) | |
| Year of Election or Appointment: 2006 Vice President of certain Equity Funds. Mr. Herring also serves as Chief Investment Officer and Director of Fidelity Management & Research (U.K.) Inc. (2010-present) and Group Chief Investments Officer of FMR. Previously, Mr. Herring served as Vice President (2005-2006) and Senior Vice President (2006-2007) of Fidelity Management & Research Company, Vice President of FMR Co., Inc. (2001-2007) and as a portfolio manager for Fidelity U.S. Equity Funds. |
Brian B. Hogan (46) | |
| Year of Election or Appointment: 2009 Vice President of certain Equity Funds and Vice President of Sector Funds. Mr. Hogan also serves as President of FMR's Equity Division (2009-present). Previously, Mr. Hogan served as Senior Vice President, Equity Research of FMR (2006-2009) and as a portfolio manager. |
Scott C. Goebel (42) | |
| Year of Election or Appointment: 2008 Secretary and Chief Legal Officer (CLO) of the Fidelity funds. Mr. Goebel also serves as Secretary and CLO of The North Carolina Capital Management Trust: Cash and Term Portfolio (2008-present); General Counsel, Secretary, and Senior Vice President of FMR (2008-present) and FMR Co., Inc. (2008-present); Deputy General Counsel of FMR LLC; Chief Legal Officer of Fidelity Management & Research (Hong Kong) Limited (2008-present) and Assistant Secretary of Fidelity Management & Research (Japan) Inc. (2008-present), Fidelity Investments Money Management, Inc. (2008-present), Fidelity Management & Research (U.K.) Inc. (2008-present), and Fidelity Research and Analysis Company (2008-present). Previously, Mr. Goebel served as Assistant Secretary of the Funds (2007-2008) and as Vice President and Secretary of Fidelity Distributors Corporation (FDC) (2005-2007). |
William C. Coffey (41) | |
| Year of Election or Appointment: 2009 Assistant Secretary of Fidelity's Equity and High Income Funds. Mr. Coffey also serves as Senior Vice President and Deputy General Counsel of FMR LLC (2010-present), and is an employee of Fidelity Investments. Previously, Mr. Coffey served as Vice President and Associate General Counsel of FMR LLC (2005-2009). |
Holly C. Laurent (56) | |
| Year of Election or Appointment: 2008 Anti-Money Laundering (AML) Officer of the Fidelity funds. Ms. Laurent also serves as AML Officer of The North Carolina Capital Management Trust: Cash and Term Portfolio (2008-present) and is an employee of Fidelity Investments. Previously, Ms. Laurent was Senior Vice President and Head of Legal for Fidelity Business Services India Pvt. Ltd. (2006-2008), and Senior Vice President, Deputy General Counsel and Group Head for FMR LLC (2005-2006). |
Christine Reynolds (52) | |
| Year of Election or Appointment: 2008 Chief Financial Officer of the Fidelity funds. Ms. Reynolds became President of Fidelity Pricing and Cash Management Services (FPCMS) in August 2008. Ms. Reynolds served as Chief Operating Officer of FPCMS (2007-2008). Previously, Ms. Reynolds served as President, Treasurer, and Anti-Money Laundering officer of the Fidelity funds (2004-2007). |
Kenneth A. Rathgeber (63) | |
| Year of Election or Appointment: 2004 Chief Compliance Officer of Fidelity's Equity and High Income Funds. Mr. Rathgeber is Chief Compliance Officer of Fidelity Management & Research (Hong Kong) Limited (2008-present), Fidelity Management & Research (Japan) Inc. (2008-present), FMR (2005-present), FMR Co., Inc. (2005-present), Fidelity Management & Research (U.K.) Inc. (2005-present), Fidelity Research & Analysis Company (2005-present), Fidelity Investments Money Management, Inc. (2005-present), Pyramis Global Advisors, LLC (2005-present), and Strategic Advisers, Inc. (2005-present). |
Jeffrey S. Christian (49) | |
| Year of Election or Appointment: 2009 Deputy Treasurer of the Fidelity funds. Mr. Christian is an employee of Fidelity Investments. Previously, Mr. Christian served as Chief Financial Officer (2008-2009) of certain Fidelity funds and Senior Vice President of Fidelity Pricing and Cash Management Services (FPCMS) (2004-2009). |
Bryan A. Mehrmann (49) | |
| Year of Election or Appointment: 2005 Deputy Treasurer of the Fidelity funds. Mr. Mehrmann is an employee of Fidelity Investments. |
Adrien E. Deberghes (43) | |
| Year of Election or Appointment: 2008 Deputy Treasurer of Fidelity's Equity and High Income Funds. Mr. Deberghes also serves as Assistant Treasurer of other Fidelity funds (2010-present) and is an employee of Fidelity Investments (2008- |
Stephanie J. Dorsey (41) | |
| Year of Election or Appointment: 2010 Assistant Treasurer of Fidelity's Equity and High Income Funds. Ms. Dorsey also serves as Deputy Treasurer of other Fidelity funds (2008-present) and is an employee of Fidelity Investments (2008- |
John R. Hebble (52) | |
| Year of Election or Appointment: 2009 Assistant Treasurer of Fidelity's Equity and High Income Funds. Mr. Hebble also serves as Treasurer and Chief Financial Officer of The North Carolina Capital Management Trust: Cash and Term Portfolio (2008-present), President and Treasurer of other Fidelity funds (2008-present) and is an employee of Fidelity Investments. |
Gary W. Ryan (52) | |
| Year of Election or Appointment: 2005 Assistant Treasurer of the Fidelity funds. Mr. Ryan is an employee of Fidelity Investments. Previously, Mr. Ryan served as Vice President of Fund Reporting in Fidelity Pricing and Cash Management Services (FPCMS) (1999-2005). |
Jonathan Davis (42) | |
| Year of Election or Appointment: 2010 Assistant Treasurer of the Fidelity funds. Mr. Davis is an employee of Fidelity Investments. Previously, Mr. Davis served as Vice President and Associate General Counsel of FMR LLC (2003-2010). |
Annual Report
Distributions (Unaudited)
Independence designates 100% of the dividend distributed during the fiscal year as qualifying for the dividends-received deduction for corporate shareholders.
Independence designates 100%, of the dividend distributed during the fiscal year as amounts which may be taken into account as a dividend for the purposes of the maximum rate under section 1(h)(11) of the Internal Revenue Code.
The fund will notify shareholders in January 2011 of amounts for use in preparing 2010 income tax returns.
Annual Report
Board Approval of Investment Advisory Contracts and Management Fees
Fidelity Independence Fund
Each year, the Board of Trustees, including the Independent Trustees (together, the Board), votes on the renewal of the management contract and sub-advisory agreements (together, the Advisory Contracts) for the fund. The Board, assisted by the advice of fund counsel and Independent Trustees' counsel, requests and considers a broad range of information relevant to the renewal of the Advisory Contracts throughout the year.
The Board meets regularly and considers at each of its meetings factors that are relevant to its annual consideration of the renewal of the fund's Advisory Contracts, including the services and support provided to the fund and its shareholders. The Board has established various standing committees, each composed of Independent Trustees with varying backgrounds, to which the Board has assigned specific subject matter responsibilities in order to enhance effective decision-making by the Board. The Board, acting directly and through its Committees, requests and receives information concerning the annual consideration of the renewal of the fund's Advisory Contracts. The Board also meets as needed to consider matters specifically related to the Board's annual consideration of the renewal of Advisory Contracts. Members of the Board may also meet with trustees of other Fidelity funds through ad hoc joint committees to discuss certain matters relevant to the Fidelity funds.
At its July 2010 meeting, the Board of Trustees, including the Independent Trustees, unanimously determined to renew the fund's Advisory Contracts. In reaching its determination, the Board considered all factors it believed relevant, including (i) the nature, extent, and quality of the services to be provided to the fund and its shareholders (including the investment performance of the fund); (ii) the competitiveness of the fund's management fee and total expenses; (iii) the total costs of the services to be provided by and the profits to be realized by Fidelity from its relationship with the fund; (iv) the extent to which economies of scale would be realized as the fund grows; and (v) whether fee levels reflect these economies of scale, if any, for the benefit of fund shareholders.
In considering whether to renew the Advisory Contracts for the fund, the Board reached a determination, with the assistance of fund counsel and Independent Trustees' counsel and through the exercise of its business judgment, that the renewal of the Advisory Contracts is in the best interests of fund shareholders and that the compensation to be received by Fidelity under the management contract is fair and reasonable. The Board's decision to renew the Advisory Contracts was not based on any single factor noted above, but rather was based on a comprehensive consideration of all the information provided to the Board at its meetings throughout the year. The Board, in reaching its determination to renew the Advisory Contracts, is aware that shareholders in the fund have a broad range of investment choices available to them, including a wide choice among mutual funds offered by Fidelity's competitors, and that the fund's shareholders, with the opportunity to review and weigh the disclosure provided by the fund in its prospectus and other public disclosures, have chosen to invest in this fund, managed by Fidelity.
Annual Report
Nature, Extent, and Quality of Services Provided. The Board considered the staffing within the investment adviser, FMR, and the sub-advisers (together, the Investment Advisers), including the backgrounds of the fund's investment personnel and the fund's investment objective and discipline. The Independent Trustees also had discussions with senior management of Fidelity's investment operations and investment groups. The Board considered the structure of the portfolio manager compensation program and whether this structure provides appropriate incentives to act in the best interest of the fund.
Resources Dedicated to Investment Management and Support Services. The Board and the equity research subcommittee of the Board's Fund Oversight Committee reviewed the size, education, and experience of the Investment Advisers' investment staff, their use of technology, and the Investment Advisers' approach to recruiting, training, and retaining portfolio managers and other research, advisory, and management personnel. The Board noted that Fidelity's analysts have access to a variety of technological tools and market and securities data that enable them to perform both fundamental and quantitative analysis and to specialize in various disciplines. The Board considered Fidelity's extensive global research capabilities that enable the Investment Advisers to aggregate data from various sources in an effort to produce positive investment results. The Board also considered that Fidelity's portfolio managers and analysts have access to daily portfolio attribution that allows for monitoring of a fund's portfolio, as well as an electronic communication system that provides immediate real-time access to research concerning issuers and credit enhancers. The Board noted FMR's continued focus on strengthening the organization and discipline of equity portfolio management and research.
Shareholder and Administrative Services. The Board considered (i) the nature, extent, quality, and cost of advisory, administrative, and shareholder services performed by the Investment Advisers and their affiliates under the Advisory Contracts and under separate agreements covering transfer agency, pricing and bookkeeping, and securities lending services for the fund; (ii) the nature and extent of the investment adviser's supervision of third party service providers, principally custodians and subcustodians; and (iii) the resources devoted to, and the record of compliance with, the fund's compliance policies and procedures. The Board also reviewed the allocation of fund brokerage, including allocations to brokers affiliated with the Investment Advisers, the use of brokerage commissions to pay fund expenses, and the use of "soft" commission dollars to pay for research services.
The Board noted that the growth of fund assets over time across the complex allows Fidelity to reinvest in the development of services designed to enhance the value or convenience of the Fidelity funds as investment vehicles. These services include 24-hour access to account information and market information through phone representatives and over the Internet, and investor education materials and asset allocation tools.
Annual Report
Board Approval of Investment Advisory Contracts and
Management Fees - continued
Investment in a Large Fund Family. The Board considered the benefits to shareholders of investing in a Fidelity fund, including the benefits of investing in a fund that is part of a large family of funds offering a variety of investment disciplines and providing a large variety of mutual fund investor services. The Board noted that Fidelity had taken, or had made recommendations that resulted in the Fidelity funds taking, a number of actions over the previous year that benefited particular funds, including (i) dedicating additional resources to investment research and restructuring and broadening the focus of the investment research teams; (ii) bolstering the senior management team that oversees asset management; (iii) launching Class F of certain funds as a lower-fee class available to Freedom K and Freedom Index Funds; (iv) lowering the initial investment minimums and ongoing balance requirements for Real Estate High Income Fund; (v) eliminating subsequent purchase minimums for all funds and adding a waiver of the investment minimum requirement for new accounts opened with the proceeds of a systematic withdrawal plan; (vi) eliminating the withdrawal minimum and maximum limits for systematic withdrawals from Advisor funds; (vii) expanding sales load waivers on Class A shares for Destiny Planholders and expanding Institutional Class eligibility for Class O Destiny Planholders; and (viii) changing certain Class A and Class T sales charge structures to further align them with industry practices.
Investment Performance. The Board considered whether the fund has operated in accordance with its investment objective, as well as its record of compliance with its investment restrictions. It also reviewed the fund's absolute investment performance for each class, as well as the fund's relative investment performance for each class measured over multiple periods against (i) a broad-based securities market index, and (ii) a custom peer group of mutual funds deemed appropriate by Fidelity and reviewed by the Board. The following charts considered by the Board show, over the one-, three-, and five-year periods ended December 31, 2009, as available, the cumulative total returns of Class K and the retail class of the fund, the cumulative total returns of a broad-based securities market index ("benchmark"), and a range of cumulative total returns of a custom peer group of mutual funds defined by FMR based on categories assigned by Morningstar, Inc. The box within each chart shows the 25th percentile return (bottom of box) and the 75th percentile return (top of box) of the peer group. Returns shown above the box are in the first quartile and returns shown below the box are in the fourth quartile. The percentage beaten numbers noted below each chart correspond to the percentile box and represent the percentage of funds in the peer group whose performance was equal to or lower than that of the class indicated. The fund's custom peer group, defined by FMR, is a peer group that FMR believes provides a more meaningful performance comparison than the peer group assigned by Morningstar, Inc., which assigns mutual funds to categories based on their investment styles as measured by their underlying portfolio holdings.
Annual Report
Fidelity Independence Fund

The Board reviewed the fund's relative investment performance against its peer group and noted that the performance of the retail class of the fund (the class with the longer performance record) was in the first quartile for all the periods shown. The Board also noted that the investment performance of the retail class of the fund compared favorably to its benchmark for all the periods shown. The Board considered that the variations in performance between the fund's classes reflect the variations in class expenses, which result in lower performance for the higher expense class. The Board also reviewed the fund's performance since inception as well as performance in the current year.
The Board also considered that the fund's management fee is subject to upward or downward adjustment depending upon whether, and to what extent, the fund's investment performance for the performance period exceeds, or is exceeded by, the record (over the same period) of a Board-approved performance adjustment index. The Board realizes that the performance adjustment provides FMR with a strong economic incentive to seek to achieve superior performance for the fund's shareholders and helps to more closely align the interests of FMR and the fund's shareholders.
Based on its review, and giving particular weight to the nature and quality of the resources dedicated by the Investment Advisers to maintain and improve relative performance and factoring in the unprecedented market events in recent years, the Board concluded that the nature, extent, and quality of investment management and support services and of shareholder and administrative services provided to the fund will benefit the fund's shareholders, particularly in light of the Board's view that the fund's shareholders benefit from investing in a fund that is part of a large family of funds offering a variety of investment disciplines and services.
Annual Report
Board Approval of Investment Advisory Contracts and
Management Fees - continued
Competitiveness of Management Fee and Total Fund Expenses. The Board considered the fund's management fee and total expenses compared to "mapped groups" of competitive funds and classes. Fidelity creates "mapped groups" by combining similar Lipper investment objective categories that have comparable management fee characteristics. Combining Lipper investment objective categories aids the Board's management fee and total expense comparisons by broadening the competitive group used for comparison and by reducing the number of universes to which various Fidelity funds are compared.
Management Fee. The Board considered two proprietary management fee comparisons for the 12-month periods shown in the chart below. The group of Lipper funds used by the Board for management fee comparisons is referred to below as the "Total Mapped Group." The Total Mapped Group comparison focuses on a fund's standing relative to the total universe of comparable funds available to investors, in terms of gross management fees before expense reimbursements or caps, and without giving effect to the fund's performance adjustment. "TMG %" represents the percentage of funds in the Total Mapped Group that had management fees that were lower than the fund's. For example, a TMG % of 10% means that 90% of the funds in the Total Mapped Group had higher management fees than the fund. The "Asset-Size Peer Group" (ASPG) comparison focuses on a fund's standing relative to non-Fidelity funds similar in size to the fund within the Total Mapped Group. The ASPG represents at least 15% of the funds in the Total Mapped Group with comparable asset size and management fee characteristics, subject to a minimum of 50 funds (or all funds in the Total Mapped Group if fewer than 50). Additional information, such as the ASPG quartile in which the fund's management fee ranked and the impact of the fund's performance adjustment, is also included in the chart and considered by the Board.
Annual Report
Fidelity Independence Fund
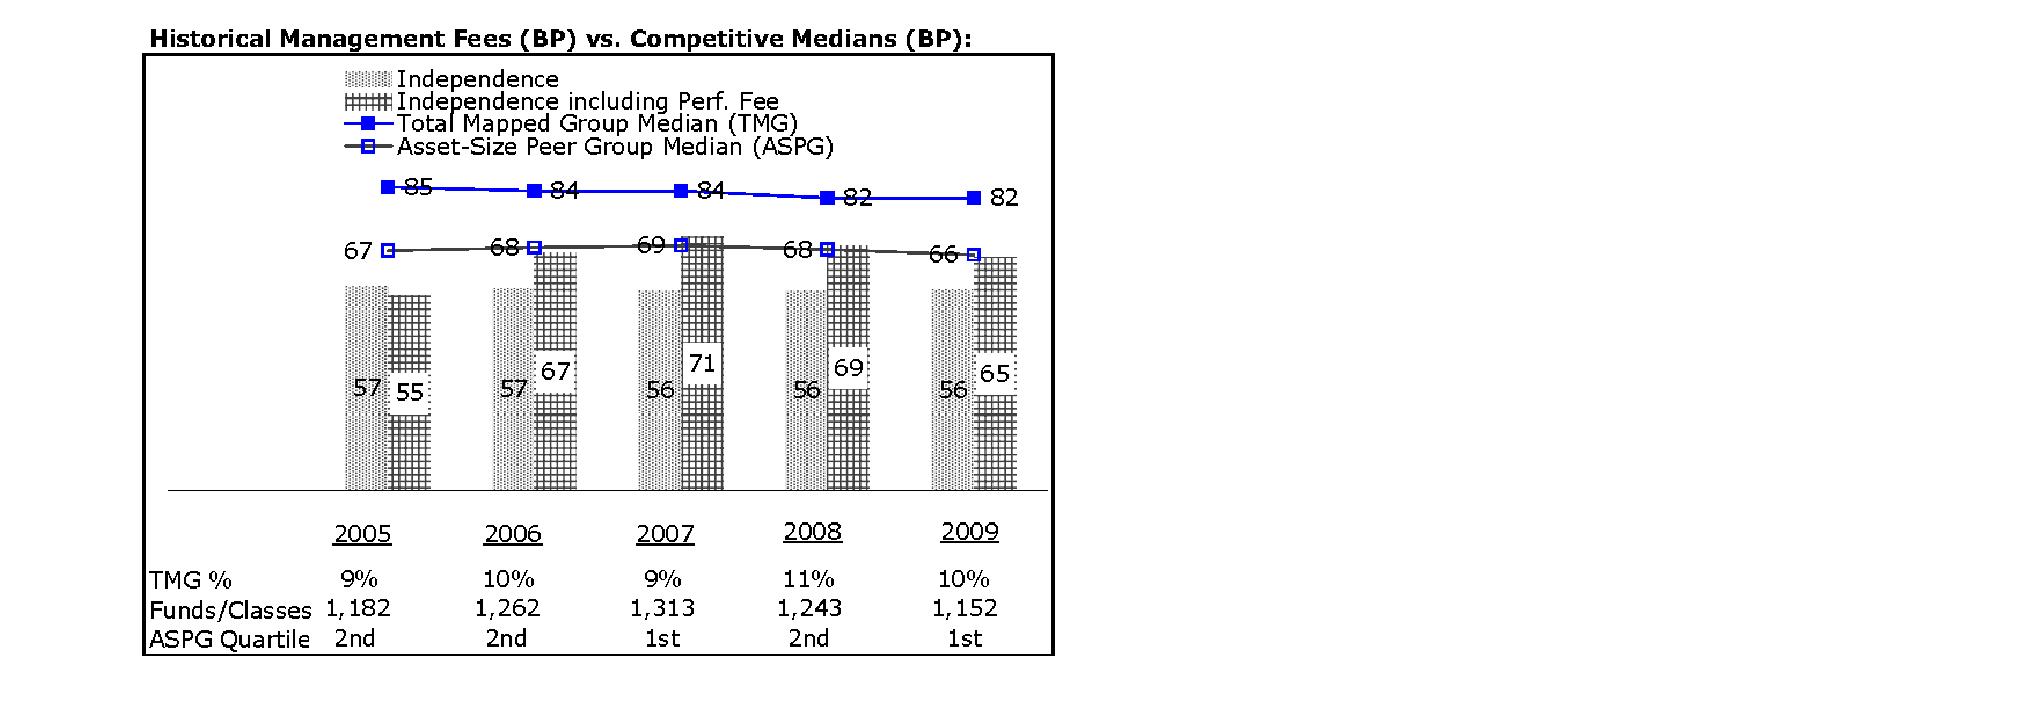
The Board noted that the fund's management fee ranked below the median of its Total Mapped Group and below the median of its ASPG for 2009. The Board also noted the effect of the fund's positive performance adjustment on the fund's management fee ranking. The Board noted that the performance adjustment for each year represents calculations for performance periods that differ from the periods shown in the performance charts above.
Based on its review, the Board concluded that the fund's management fee is fair and reasonable in light of the services that the fund receives and the other factors considered.
Total Expenses. In its review of each class's total expenses, the Board considered the fund's management fee as well as other fund or class expenses, as applicable, such as transfer agent fees, pricing and bookkeeping fees, and custodial, legal, and audit fees. The Board also noted the effects of any waivers and reimbursements on fees and expenses, as well as the impact of the fund's performance adjustment. As part of its review, the Board also considered current and historical total expenses of each class of the fund compared to competitive fund median expenses. Each class of the fund is compared to those funds and classes in the Total Mapped Group (used by the Board for management fee comparisons) that have a similar sales load structure.
The Board noted that the total expenses of each class ranked below its competitive median for 2009.
Annual Report
Board Approval of Investment Advisory Contracts and
Management Fees - continued
Fees Charged to Other Fidelity Clients. The Board also considered Fidelity fee structures and other information with respect to clients of FMR and its affiliates, such as other mutual funds advised or subadvised by FMR or its affiliates, pension plan clients, and other institutional clients. In March 2010, the Board created an ad hoc joint committee with the board of other Fidelity funds (the Committee) to review and compare Fidelity's institutional investment advisory business with its business of providing services to the Fidelity funds, including the differences in services provided, fees charged, and costs incurred, as well as competition in their respective marketplaces.
Based on its review of total expenses and fees charged to other Fidelity clients, the Board concluded that the total expenses of each class of the fund were reasonable in light of the services that the fund and its shareholders receive and the other factors considered, including the findings of the Committee.
Costs of the Services and Profitability. The Board considered the revenues earned and the expenses incurred by Fidelity in conducting the business of developing, marketing, distributing, managing, administering and servicing the fund and its shareholders. The Board also considered the level of Fidelity's profits in respect of all the Fidelity funds.
On an annual basis, FMR presents to the Board Fidelity's profitability for the fund. Fidelity calculates the profitability for each fund, as well as aggregate profitability for groups of Fidelity funds and all Fidelity funds, using a series of detailed revenue and cost allocation methodologies which originate with the audited books and records of Fidelity. The Audit Committee of the Board reviews any significant changes from the prior year's methodologies.
PricewaterhouseCoopers LLP (PwC), independent registered public accounting firm and auditor to Fidelity and certain Fidelity funds, has been engaged annually by the Board as part of the Board's assessment of Fidelity's profitability analysis. PwC's engagement includes the review and assessment of Fidelity's methodologies used in determining the revenues and expenses attributable to Fidelity's mutual fund business, and completion of agreed-upon procedures surrounding the mathematical accuracy of fund profitability and its conformity to allocation methodologies. After considering PwC's reports issued under the engagement and information provided by Fidelity, the Board believes that while other allocation methods may also be reasonable, Fidelity's profitability methodologies are reasonable in all material respects.
The Board has also reviewed Fidelity's non-fund businesses and fall-out benefits related to the mutual fund business as well as cases where Fidelity's affiliates may benefit from or be related to the fund's business.
Annual Report
The Board considered the costs of the services provided by and the profits realized by Fidelity in connection with the operation of the fund and were satisfied that the profitability was not excessive in the circumstances.
Economies of Scale. The Board considered whether there have been economies of scale in respect of the management of the Fidelity funds, whether the Fidelity funds (including the fund) have appropriately benefited from any such economies of scale, and whether there is potential for realization of any further economies of scale. The Board considered the extent to which the fund will benefit from economies of scale through increased services to the fund, through waivers or reimbursements, or through fee or expense reductions.
In February 2009, the Board and the board of other Fidelity funds created an ad hoc committee (the Economies of Scale Committee) to analyze whether FMR attains economies of scale in respect of the management and servicing of the Fidelity funds, whether the Fidelity funds have appropriately benefited from such economies of scale, and whether there is potential for realization of any further economies of scale.
The Board recognized that the fund's management contract incorporates a "group fee" structure, which provides for lower group fee rates as total fund assets under FMR's management increase, and for higher group fee rates as total fund assets under FMR's management decrease. FMR calculates the group fee rates based on a tiered asset "breakpoint" schedule that varies based on asset class. The Board considered that the group fee is designed to deliver the benefits of economies of scale to fund shareholders when total Fidelity fund assets increase, even if assets of any particular fund are unchanged or have declined, because some portion of Fidelity's costs are attributable to services provided to all Fidelity funds, and all funds benefit if those costs can be allocated among more assets. The Board concluded that, given the group fee structure, fund shareholders will benefit from lower management fees as assets under FMR's management increase at the fund complex level, regardless of whether Fidelity achieves any such economies of scale.
The Board concluded, considering the findings of the Economies of Scale Committee, that any potential economies of scale are being appropriately shared between fund shareholders and Fidelity.
Additional Information Requested by the Board. In order to develop fully the factual basis for consideration of the Fidelity funds' Advisory Contracts, the Board requested and received additional information on certain topics, including (i) fund performance trends, actions to be taken by FMR to improve certain funds' overall performance, and Fidelity's long-term strategies for certain funds; (ii) portfolio manager changes that have occurred during the past year and length of portfolio manager tenure for different categories of funds over time; (iii) Fidelity's compensation structure for portfolio managers, research analysts, and other key personnel, the rationale for the compensation structure, and how the compensation structure provides appropriate performance incentives; (iv) the amount of the investment that each portfolio manager has made in the Fidelity fund(s) that he or she manages; (v) management and other fees paid by FMR to affiliated sub-advisers on behalf of the Fidelity funds; (vi) Fidelity's fee structures and rationale for recommending different fees among different categories of funds; (vii) Fidelity's rationale for recommending which funds should have a performance adjustment component as part of their management fees; (viii) the rationale for any differences between fund fee structures and fee structures in place for other Fidelity clients; and (ix) explanations regarding the relative total expenses borne by certain funds and classes, total expense competitive trends, and actions that might be taken by FMR to reduce total expenses for certain funds and classes.
Annual Report
Board Approval of Investment Advisory Contracts and
Management Fees - continued
Based on its evaluation of all of the conclusions noted above, and after considering all factors it believed relevant, the Board ultimately concluded that the advisory fee structures are fair and reasonable, and that the fund's Advisory Contracts should be renewed.
Annual Report
Investment Adviser
Fidelity Management & Research Company
Boston, MA
Investment Sub-Advisers
FMR Co., Inc.
Fidelity Management & Research
(U.K.) Inc.
Fidelity Research & Analysis Company
Fidelity Management & Research
(Hong Kong) Limited
Fidelity Management & Research
(Japan) Inc.
General Distributor
Fidelity Distributors Corporation
Boston, MA
Transfer and Service Agents
Fidelity Investments Institutional
Operations Company, Inc.
Boston, MA
Fidelity Service Company, Inc.
Boston, MA
Custodian
The Northern Trust Company
Chicago, Illinois
The Fidelity Telephone Connection
Mutual Fund 24-Hour Service
Exchanges/Redemptions
and Account Assistance 1-800-544-6666
Product Information 1-800-544-6666
Retirement Accounts 1-800-544-4774
(8 a.m. - 9 p.m.)
TDD Service 1-800-544-0118
for the deaf and hearing impaired
(9 a.m. - 9 p.m. Eastern time)
Fidelity Automated Service
Telephone (FAST®)
1-800-544-5555
Automated line for quickest service
FRE-UANN-0111
1.786709.107
Fidelity®
Independence
Fund -
Class K
Annual Report
November 30, 2010
(2_fidelity_logos) (Registered_Trademark)
Contents
Chairman's Message | The Chairman's message to shareholders. | |
Performance | How the fund has done over time. | |
Management's Discussion of Fund Performance | The Portfolio Manager's review of fund performance and strategy. | |
Shareholder Expense Example | An example of shareholder expenses. | |
Investment Changes | A summary of major shifts in the fund's investments over the past six months. | |
Investments | A complete list of the fund's investments with their market values. | |
Financial Statements | Statements of assets and liabilities, operations, and changes in net assets, as well as financial highlights. | |
Notes | Notes to the financial statements. | |
Report of Independent Registered Public Accounting Firm |
| |
Trustees and Officers |
| |
Distributions |
| |
Board Approval of Investment Advisory Contracts and Management Fees |
|
To view a fund's proxy voting guidelines and proxy voting record for the 12-month period ended June 30, visit http://www.fidelity.com/proxyvotingresults or visit the Securities and Exchange Commission's (SEC) website at http://www.sec.gov. You may also call 1-800-835-5092 to request a free copy of the proxy voting guidelines.
Standard & Poor's, S&P and S&P 500 are registered service marks of The McGraw-Hill Companies, Inc. and have been licensed for use by Fidelity Distributors Corporation.
Other third party marks appearing herein are the property of their respective owners.
All other marks appearing herein are registered or unregistered trademarks or service marks of FMR LLC or an affiliated company.
Annual Report
This report and the financial statements contained herein are submitted for the general information of the shareholders of the fund. This report is not authorized for distribution to prospective investors in the fund unless preceded or accompanied by an effective prospectus.
A fund files its complete schedule of portfolio holdings with the SEC for the first and third quarters of each fiscal year on Form N-Q. Forms N-Q are available on the SEC's web site at http://www.sec.gov. A fund's Forms N-Q may be reviewed and copied at the SEC's Public Reference Room in Washington, DC. Information regarding the operation of the SEC's Public Reference Room may be obtained by calling 1-800-SEC-0330. For a complete list of a fund's portfolio holdings, view the most recent holdings listing, semiannual report, or annual report on Fidelity's web site at http://www.fidelity.com, http://www.advisor.fidelity.com or http://www.401k.com, as applicable.
NOT FDIC INSURED • MAY LOSE VALUE • NO BANK GUARANTEE
Neither the fund nor Fidelity Distributors Corporation is a bank.
Annual Report
Chairman's Message
(photo_of_James_C_Curvey)
Dear Shareholder:
Equities have staged a rally in the second half of 2010, shaking off concerns about the European debt crisis and the possibility of a double-dip recession in the U.S. Although the short-term surge pushed major equity indexes back into positive territory for the year, several questions remain about the longer-term outlook, including lackluster economic growth and persistently high unemployment. Financial markets are always unpredictable, of course, but there also are several time-tested investment principles that can help put the odds in your favor.
One of the basic tenets is to invest for the long term. Over time, riding out the markets' inevitable ups and downs has proven much more effective than selling into panic or chasing the hottest trend. Even missing only a few of the markets' best days can significantly diminish investor returns. Patience also affords the benefits of compounding - of earning interest on additional income or reinvested dividends and capital gains. There can be tax advantages and cost benefits to consider as well. While staying the course doesn't eliminate risk, it can considerably lessen the effect of short-term declines.
You can further manage your investing risk through diversification. And today, more than ever, geographic diversification should be taken into account. Studies indicate that asset allocation is the single most important determinant of a portfolio's long-term success. The right mix of stocks, bonds and cash - aligned to your particular risk tolerance and investment objective - is very important. Age-appropriate rebalancing is also an essential aspect of asset allocation. For younger investors, an emphasis on equities - which historically have been the best-performing asset class over time - is encouraged. As investors near their specific goal, such as retirement or sending a child to college, consideration may be given to replacing volatile assets (e.g. common stocks) with more-stable fixed investments (bonds or savings plans).
A third principle - investing regularly - can help lower the average cost of your purchases. Investing a certain amount of money each month or quarter helps ensure you won't pay for all your shares at market highs. This strategy - known as dollar cost averaging - also reduces "emotion" from investing, helping shareholders avoid selling weak performers just prior to an upswing, or chasing a hot performer just before a correction.
We invite you to contact us via the Internet, through our Investor Centers or by phone. It is our privilege to provide you the information you need to make the investments that are right for you.
Sincerely,
(The acting chairman's signature appears here.)
James C. Curvey
Acting Chairman
Annual Report
Performance: The Bottom Line
Average annual total return reflects the change in the value of an investment, assuming reinvestment of the class' distributions from dividend income and capital gains (the profits earned upon the sale of securities that have grown in value, if any) and assuming a constant rate of performance each year. The $10,000 table and the fund's returns do not reflect the deduction of taxes that a shareholder would pay on fund distributions or the redemption of fund shares. During periods of reimbursement by Fidelity, a fund's total return will be greater than it would be had the reimbursement not occurred. How a fund did yesterday is no guarantee of how it will do tomorrow.
Average Annual Total Returns
Periods ended November 30, 2010 | Past 1 | Past 5 | Past 10 |
Class K A | 22.37% | 4.66% | 2.17% |
A The initial offering of Class K shares took place on May 9, 2008. Returns prior to May 9, 2008 are those of Fidelity Independence Fund, the original class of the fund.
$10,000 Over 10 Years
Let's say hypothetically that $10,000 was invested in Fidelity Independence Fund - Class K on November 30, 2000. The chart shows how the value of your investment would have changed, and also shows how the S&P 500® Index performed over the same period. The initial offering of Class K took place on May 9, 2008. See above for additional information regarding the performance of Class K.
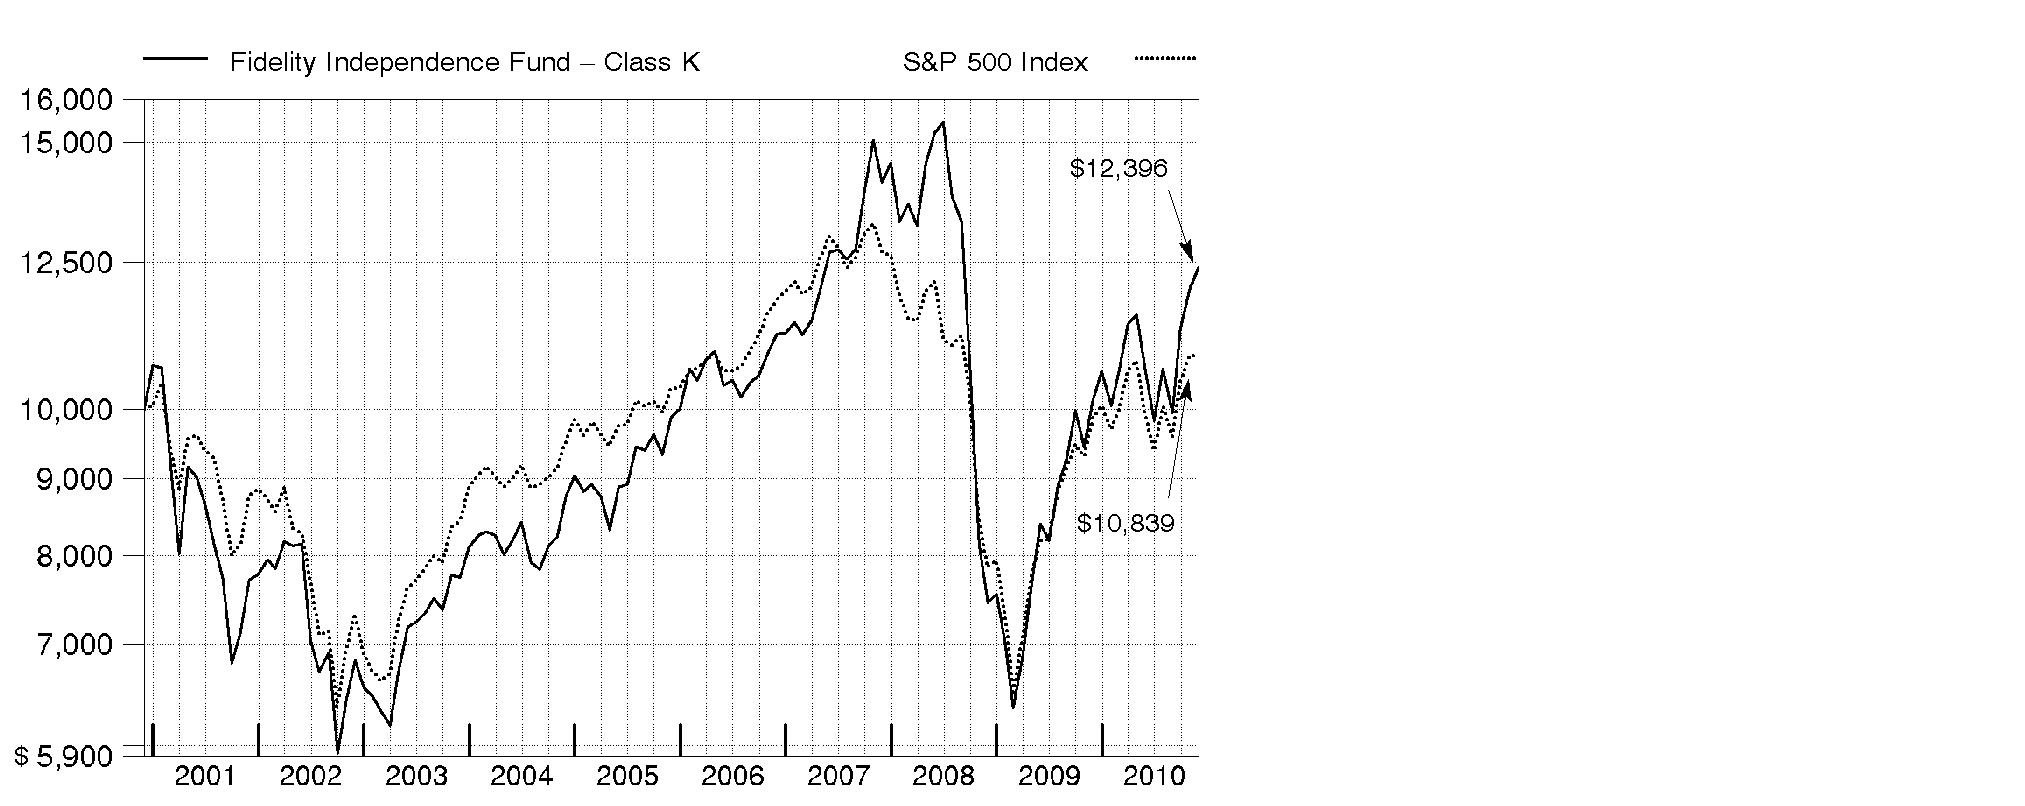
Annual Report
Management's Discussion of Fund Performance
Market Recap: Despite bouts of volatility and concern over European debt woes, major U.S. stock markets recorded solid gains for the year ending November 30, 2010, lifted by economic optimism, encouraging earnings reports and a wave of corporate mergers. Stocks extended their 2009 upswing in the first five months of the period on signs the Great Recession was over. However, high unemployment in the U.S. and sovereign debt problems in Europe sent equities falling during the spring. Markets vacillated for much of the summer before regaining momentum in the fall, with the large-cap S&P 500® Index posting its best September/October performance since 1998. By November, however, Ireland's debt took center stage, along with slower growth in China and additional quantitative easing in the U.S., unnerving investors and cooling down markets. For the full 12 months, the S&P 500® rose 9.94%, while the blue-chip-laden Dow Jones Industrial AverageSM added 9.33%. Both were bested by the technology-heavy Nasdaq Composite® Index, which advanced 17.58%. Overall, it was a broad-based rally, with economically sensitive sectors among the biggest gainers. Stocks of mid- and small-sized companies fared better than their larger-cap counterparts, advancing 24.04% and 26.98%, respectively, as measured by the Russell Midcap® and Russell 2000® indexes.
Comments from Robert Bertelson, Portfolio Manager of Fidelity ® Independence Fund: During the year, the fund's Class K shares returned 22.37%, significantly outpacing the S&P 500. Stock selection in information technology, industrials, consumer discretionary, health care and materials lifted relative performance the most. Solid picks and overweighted exposure to mid- and small-caps, as well as underweighting mega-caps, also aided our results. Delta Air Lines was the fund's top individual contributor, benefiting from an improving economy, as well as increased business and leisure travel, among other factors. Continental Airlines, which merged with United Airlines to form United Continental Holdings, benefited from similar trends. Consumer electronics/computer maker Apple, China's leading Internet search/advertising provider Baidu, footwear maker Deckers Outdoor and Concho Resources, an oil producer, also helped. I sold Baidu to nail down profits. All of the contributors I've mentioned, except for Apple, were out-of-index positions. Conversely, financials had a negative impact, mainly due to weak stock selection. The biggest individual detractor was an out-of-benchmark stake in Canadian smart phone maker Research In Motion, whose BlackBerry lost market share to competitors. Other detractors included networking equipment maker Cisco Systems and two large financials, JPMorgan Chase and Wells Fargo. Untimely ownership of Google also hurt.
The views expressed above reflect those of the portfolio manager(s) only through the end of the period as stated on the cover of this report and do not necessarily represent the views of Fidelity or any other person in the Fidelity organization. Any such views are subject to change at any time based upon market or other conditions and Fidelity disclaims any responsibility to update such views. These views may not be relied on as investment advice and, because investment decisions for a Fidelity fund are based on numerous factors, may not be relied on as an indication of trading intent on behalf of any Fidelity fund.
Annual Report
Shareholder Expense Example
As a shareholder of the Fund, you incur two types of costs: (1) transaction costs, and (2) ongoing costs, including management fees and other Fund expenses. This Example is intended to help you understand your ongoing costs (in dollars) of investing in the Fund and to compare these costs with the ongoing costs of investing in other mutual funds.
The Example is based on an investment of $1,000 invested at the beginning of the period and held for the entire period (June 1, 2010 to November 30, 2010).
Actual Expenses
The first line of the accompanying table for each class of the Fund provides information about actual account values and actual expenses. You may use the information in this line, together with the amount you invested, to estimate the expenses that you paid over the period. Simply divide your account value by $1,000.00 (for example, an $8,600 account value divided by $1,000.00 = 8.6), then multiply the result by the number in the first line for a class of the Fund under the heading entitled "Expenses Paid During Period" to estimate the expenses you paid on your account during this period. A small balance maintenance fee of $12.00 that is charged once a year may apply for certain accounts with a value of less than $2,000. This fee is not included in the table below. If it was, the estimate of expenses you paid during the period would be higher, and your ending account value lower, by this amount. In addition, the Fund, as a shareholder in the underlying Fidelity Central Funds, will indirectly bear its pro-rata share of the fees and expenses incurred by the underlying Fidelity Central Funds. These fees and expenses are not included in the Fund's annualized expense ratio used to calculate the expense estimate in the table below.
Hypothetical Example for Comparison Purposes
The second line of the accompanying table for each class of the Fund provides information about hypothetical account values and hypothetical expenses based on a Class' actual expense ratio and an assumed rate of return of 5% per year before expenses, which is not the Class' actual return. The hypothetical account values and expenses may not be used to estimate the actual ending account balance or expenses you paid for the period. You may use this information to compare the ongoing costs of investing in the Fund and other funds. To do so, compare this 5% hypothetical example with the 5% hypothetical examples that appear in the shareholder reports of the other funds. A small balance maintenance fee of $12.00 that is charged once a year may apply for certain accounts with a value of less than $2,000. This fee is not included in the table below. If it was, the estimate of expenses you paid during the period would be higher, and your ending account value lower, by this amount. In addition, the Fund, as a shareholder in the underlying Fidelity Central Funds, will indirectly bear its pro-rata share of the fees and expenses incurred by the underlying Fidelity Central Funds. These fees and expenses are not included in the Fund's annualized expense ratio used to calculate the expense estimate in the table below.
Please note that the expenses shown in the table are meant to highlight your ongoing costs only and do not reflect any transaction costs. Therefore, the second line of the table is useful in comparing ongoing costs only, and will not help you determine the relative total costs of owning different funds.
Annual Report
| Annualized Expense Ratio | Beginning | Ending | Expenses Paid |
Independence | .83% |
|
|
|
Actual |
| $ 1,000.00 | $ 1,168.00 | $ 4.51 |
HypotheticalA |
| $ 1,000.00 | $ 1,020.91 | $ 4.20 |
Class K | .69% |
|
|
|
Actual |
| $ 1,000.00 | $ 1,169.00 | $ 3.75 |
HypotheticalA |
| $ 1,000.00 | $ 1,021.61 | $ 3.50 |
A 5% return per year before expenses
* Expenses are equal to each Class' annualized expense ratio, multiplied by the average account value over the period, multiplied by 183/365 (to reflect the one-half year period).
Annual Report
Investment Changes (Unaudited)
Top Ten Stocks as of November 30, 2010 | ||
| % of fund's | % of fund's net assets |
Apple, Inc. | 5.5 | 4.7 |
Delta Air Lines, Inc. | 3.4 | 4.0 |
Google, Inc. Class A | 3.0 | 0.2 |
United Continental Holdings, Inc. | 2.6 | 2.4 |
Express Scripts, Inc. | 2.1 | 2.2 |
Schlumberger Ltd. | 1.9 | 1.2 |
Amazon.com, Inc. | 1.8 | 1.2 |
Macy's, Inc. | 1.8 | 1.6 |
Broadcom Corp. Class A | 1.6 | 0.9 |
Caterpillar, Inc. | 1.6 | 0.9 |
| 25.3 | |
Top Five Market Sectors as of November 30, 2010 | ||
| % of fund's | % of fund's net assets |
Information Technology | 25.9 | 24.6 |
Consumer Discretionary | 22.8 | 16.9 |
Industrials | 17.5 | 20.2 |
Materials | 10.0 | 4.1 |
Energy | 8.8 | 7.2 |
Asset Allocation (% of fund's net assets) | |||||||
As of November 30, 2010 * | As of May 31, 2010 ** | ||||||
| Stocks 99.7% |
| | Stocks 99.7% |
| ||
| Short-Term |
| | Short-Term |
| ||
* Foreign investments | 17.6% |
| ** Foreign investments | 13.1% |
| ||

Annual Report
Investments November 30, 2010
Showing Percentage of Net Assets
Common Stocks - 99.3% | |||
Shares | Value (000s) | ||
CONSUMER DISCRETIONARY - 22.4% | |||
Auto Components - 1.1% | |||
Autoliv, Inc. | 200,000 | $ 14,684 | |
BorgWarner, Inc. (a) | 500,000 | 30,170 | |
| 44,854 | ||
Automobiles - 2.1% | |||
Bayerische Motoren Werke AG (BMW) | 700,000 | 52,629 | |
Daimler AG (Germany) (a) | 300,000 | 19,417 | |
General Motors Co. | 505,300 | 17,281 | |
| 89,327 | ||
Hotels, Restaurants & Leisure - 3.2% | |||
Chipotle Mexican Grill, Inc. (a) | 150,000 | 38,774 | |
Ctrip.com International Ltd. sponsored ADR (a) | 596,900 | 26,156 | |
Las Vegas Sands Corp. (a) | 769,000 | 38,512 | |
Panera Bread Co. Class A (a) | 55,906 | 5,604 | |
Starwood Hotels & Resorts Worldwide, Inc. | 500,000 | 28,420 | |
| 137,466 | ||
Household Durables - 1.3% | |||
Cyrela Brazil Realty SA | 1,463,800 | 18,522 | |
Gafisa SA sponsored ADR (d) | 2,584,000 | 37,106 | |
| 55,628 | ||
Internet & Catalog Retail - 3.2% | |||
Amazon.com, Inc. (a) | 444,800 | 78,018 | |
Expedia, Inc. | 800,000 | 21,064 | |
Priceline.com, Inc. (a) | 97,000 | 38,223 | |
| 137,305 | ||
Media - 0.3% | |||
Discovery Communications, Inc. (a) | 300,000 | 12,234 | |
Multiline Retail - 3.6% | |||
Dollarama, Inc. (a) | 200,000 | 5,714 | |
Macy's, Inc. | 2,970,800 | 76,290 | |
Nordstrom, Inc. | 1,075,100 | 46,014 | |
Target Corp. | 400,000 | 22,776 | |
| 150,794 | ||
Specialty Retail - 1.9% | |||
Tiffany & Co., Inc. | 500,000 | 31,050 | |
Williams-Sonoma, Inc. | 1,436,100 | 47,779 | |
| 78,829 | ||
Textiles, Apparel & Luxury Goods - 5.7% | |||
Coach, Inc. | 900,000 | 50,886 | |
Common Stocks - continued | |||
Shares | Value (000s) | ||
CONSUMER DISCRETIONARY - continued | |||
Textiles, Apparel & Luxury Goods - continued | |||
Deckers Outdoor Corp. (a) | 850,000 | $ 65,365 | |
Fossil, Inc. (a) | 500,000 | 33,825 | |
LVMH Moet Hennessy - Louis Vuitton | 50,000 | 7,583 | |
NIKE, Inc. Class B | 100,000 | 8,613 | |
Phillips-Van Heusen Corp. | 625,800 | 42,454 | |
Steven Madden Ltd. (a) | 300,000 | 13,575 | |
The Swatch Group AG (Bearer) | 40,000 | 16,061 | |
Vera Bradley, Inc. | 133,889 | 4,384 | |
| 242,746 | ||
TOTAL CONSUMER DISCRETIONARY | 949,183 | ||
CONSUMER STAPLES - 1.5% | |||
Beverages - 0.2% | |||
Hansen Natural Corp. (a) | 200,000 | 10,644 | |
Personal Products - 1.3% | |||
Estee Lauder Companies, Inc. Class A | 371,600 | 27,840 | |
Hengan International Group Co. Ltd. | 2,781,000 | 25,643 | |
| 53,483 | ||
TOTAL CONSUMER STAPLES | 64,127 | ||
ENERGY - 8.8% | |||
Energy Equipment & Services - 3.1% | |||
Dril-Quip, Inc. (a) | 278,300 | 21,552 | |
Noble Corp. | 200,000 | 6,784 | |
Saipem SpA | 400,000 | 16,644 | |
Schlumberger Ltd. | 1,042,006 | 80,589 | |
Transocean Ltd. (a) | 100,000 | 6,703 | |
| 132,272 | ||
Oil, Gas & Consumable Fuels - 5.7% | |||
Alpha Natural Resources, Inc. (a) | 600,000 | 29,736 | |
Anadarko Petroleum Corp. | 300,000 | 19,248 | |
Cimarex Energy Co. | 150,000 | 12,081 | |
Concho Resources, Inc. (a) | 666,300 | 55,136 | |
Peabody Energy Corp. | 400,000 | 23,524 | |
Pioneer Natural Resources Co. | 600,000 | 48,066 | |
Common Stocks - continued | |||
Shares | Value (000s) | ||
ENERGY - continued | |||
Oil, Gas & Consumable Fuels - continued | |||
Southwestern Energy Co. (a) | 254,900 | $ 9,227 | |
Whiting Petroleum Corp. (a) | 400,000 | 44,020 | |
| 241,038 | ||
TOTAL ENERGY | 373,310 | ||
FINANCIALS - 5.5% | |||
Capital Markets - 1.0% | |||
BlackRock, Inc. Class A | 250,000 | 40,750 | |
Commercial Banks - 2.8% | |||
Banco do Brasil SA | 1,600,000 | 30,694 | |
BBVA Banco Frances SA sponsored ADR (d) | 800,000 | 9,032 | |
Itau Unibanco Banco Multiplo SA ADR | 1,214,700 | 28,339 | |
Wells Fargo & Co. | 1,878,600 | 51,117 | |
| 119,182 | ||
Diversified Financial Services - 1.4% | |||
Apollo Global Management LLC (e) | 1,703,400 | 11,924 | |
JPMorgan Chase & Co. | 1,250,200 | 46,732 | |
| 58,656 | ||
Real Estate Investment Trusts - 0.3% | |||
Public Storage | 150,000 | 14,490 | |
TOTAL FINANCIALS | 233,078 | ||
HEALTH CARE - 7.3% | |||
Biotechnology - 1.2% | |||
Gilead Sciences, Inc. (a) | 600,000 | 21,900 | |
United Therapeutics Corp. (a) | 485,300 | 30,540 | |
| 52,440 | ||
Health Care Equipment & Supplies - 1.1% | |||
Edwards Lifesciences Corp. (a) | 375,000 | 24,885 | |
Volcano Corp. (a) | 800,000 | 21,240 | |
| 46,125 | ||
Health Care Providers & Services - 3.9% | |||
Express Scripts, Inc. (a) | 1,677,800 | 87,397 | |
HMS Holdings Corp. (a) | 271,500 | 17,107 | |
Medco Health Solutions, Inc. (a) | 949,800 | 58,242 | |
| 162,746 | ||
Common Stocks - continued | |||
Shares | Value (000s) | ||
HEALTH CARE - continued | |||
Health Care Technology - 0.4% | |||
SXC Health Solutions Corp. (a) | 400,000 | $ 15,293 | |
Pharmaceuticals - 0.7% | |||
Valeant Pharmaceuticals International, Inc. | 1,156,460 | 29,976 | |
TOTAL HEALTH CARE | 306,580 | ||
INDUSTRIALS - 17.5% | |||
Aerospace & Defense - 1.6% | |||
BE Aerospace, Inc. (a) | 400,000 | 14,200 | |
Goodrich Corp. | 294,200 | 25,234 | |
Precision Castparts Corp. | 100,000 | 13,807 | |
The Boeing Co. | 89,500 | 5,707 | |
United Technologies Corp. | 100,000 | 7,527 | |
| 66,475 | ||
Air Freight & Logistics - 0.3% | |||
Air Lease Corp. Class A (a)(e) | 500,600 | 10,262 | |
Airlines - 6.2% | |||
Delta Air Lines, Inc. (a) | 10,450,775 | 142,967 | |
Southwest Airlines Co. | 766,900 | 10,215 | |
United Continental Holdings, Inc. (a) | 3,970,000 | 109,890 | |
| 263,072 | ||
Construction & Engineering - 0.1% | |||
KBR, Inc. | 200,000 | 5,416 | |
Electrical Equipment - 0.5% | |||
Emerson Electric Co. | 400,000 | 22,028 | |
Machinery - 7.4% | |||
Caterpillar, Inc. | 793,000 | 67,088 | |
Cummins, Inc. | 582,200 | 56,543 | |
Dover Corp. | 500,000 | 27,405 | |
Kennametal, Inc. | 900,000 | 30,438 | |
MAN SE | 300,000 | 35,244 | |
PACCAR, Inc. | 400,000 | 21,544 | |
Parker Hannifin Corp. | 727,500 | 58,367 | |
Sandvik AB | 900,000 | 15,224 | |
Weg SA | 36,500 | 480 | |
| 312,333 | ||
Common Stocks - continued | |||
Shares | Value (000s) | ||
INDUSTRIALS - continued | |||
Road & Rail - 1.3% | |||
CSX Corp. | 462,700 | $ 28,137 | |
Union Pacific Corp. | 281,400 | 25,357 | |
| 53,494 | ||
Trading Companies & Distributors - 0.1% | |||
Mills Estruturas e Servicos de Engenharia SA (a) | 401,000 | 5,787 | |
TOTAL INDUSTRIALS | 738,867 | ||
INFORMATION TECHNOLOGY - 25.9% | |||
Communications Equipment - 4.2% | |||
Cisco Systems, Inc. (a) | 599,300 | 11,483 | |
HTC Corp. | 400,000 | 11,089 | |
Juniper Networks, Inc. (a) | 1,742,300 | 59,273 | |
Research In Motion Ltd. (a) | 975,600 | 60,341 | |
Riverbed Technology, Inc. (a) | 1,000,000 | 33,910 | |
| 176,096 | ||
Computers & Peripherals - 7.6% | |||
Apple, Inc. (a) | 745,700 | 232,023 | |
EMC Corp. (a) | 1,200,000 | 25,788 | |
NetApp, Inc. (a) | 1,300,000 | 66,209 | |
| 324,020 | ||
Internet Software & Services - 5.7% | |||
Akamai Technologies, Inc. (a) | 400,000 | 20,876 | |
eBay, Inc. (a) | 1,600,400 | 46,620 | |
Google, Inc. Class A (a) | 225,000 | 125,035 | |
Mail.ru Group Ltd. GDR unit (a)(e) | 107,500 | 4,408 | |
Rackspace Hosting, Inc. (a) | 200,000 | 5,834 | |
Tencent Holdings Ltd. | 1,787,500 | 39,755 | |
| 242,528 | ||
IT Services - 1.4% | |||
Cognizant Technology Solutions Corp. Class A (a) | 900,000 | 58,482 | |
Semiconductors & Semiconductor Equipment - 3.8% | |||
ARM Holdings PLC sponsored ADR (d) | 900,000 | 16,875 | |
Broadcom Corp. Class A | 1,545,500 | 68,759 | |
Marvell Technology Group Ltd. (a) | 2,877,400 | 55,505 | |
NXP Semiconductors NV | 872,000 | 10,970 | |
TriQuint Semiconductor, Inc. (a) | 600,000 | 7,146 | |
| 159,255 | ||
Common Stocks - continued | |||
Shares | Value (000s) | ||
INFORMATION TECHNOLOGY - continued | |||
Software - 3.2% | |||
Citrix Systems, Inc. (a) | 570,600 | $ 37,899 | |
Informatica Corp. (a) | 1,350,200 | 55,736 | |
NCsoft Corp. | 35,000 | 7,496 | |
RealPage, Inc. | 215,641 | 5,909 | |
Solera Holdings, Inc. | 300,000 | 14,400 | |
Taleo Corp. Class A (a) | 500,000 | 15,350 | |
| 136,790 | ||
TOTAL INFORMATION TECHNOLOGY | 1,097,171 | ||
MATERIALS - 10.0% | |||
Chemicals - 7.0% | |||
Celanese Corp. Class A | 750,000 | 27,750 | |
CF Industries Holdings, Inc. | 450,000 | 54,347 | |
Dow Chemical Co. | 1,992,200 | 62,117 | |
Ferro Corp. (a) | 569,400 | 8,125 | |
FMC Corp. | 500,000 | 38,910 | |
LyondellBasell Industries NV Class A (a) | 1,200,000 | 35,052 | |
PPG Industries, Inc. | 500,000 | 38,980 | |
Rockwood Holdings, Inc. (a) | 778,300 | 29,708 | |
| 294,989 | ||
Metals & Mining - 3.0% | |||
Alcoa, Inc. | 2,826,600 | 37,085 | |
Freeport-McMoRan Copper & Gold, Inc. | 600,000 | 60,792 | |
United States Steel Corp. (d) | 600,000 | 29,166 | |
| 127,043 | ||
TOTAL MATERIALS | 422,032 | ||
TELECOMMUNICATION SERVICES - 0.4% | |||
Wireless Telecommunication Services - 0.4% | |||
NII Holdings, Inc. (a) | 450,000 | 17,442 | |
TOTAL COMMON STOCKS (Cost $3,276,763) | 4,201,790 | ||
Nonconvertible Preferred Stocks - 0.4% | |||
Shares | Value (000s) | ||
CONSUMER DISCRETIONARY - 0.4% | |||
Automobiles - 0.4% | |||
Volkswagen AG (Cost $17,941) | 117,800 | $ 18,927 | |
Money Market Funds - 1.8% | |||
|
|
|
|
Fidelity Cash Central Fund, 0.24% (b) | 16,275,949 | 16,276 | |
Fidelity Securities Lending Cash Central Fund, 0.25% (b)(c) | 58,628,150 | 58,628 | |
TOTAL MONEY MARKET FUNDS (Cost $74,904) | 74,904 | ||
TOTAL INVESTMENT PORTFOLIO - 101.5% (Cost $3,369,608) | 4,295,621 | ||
NET OTHER ASSETS (LIABILITIES) - (1.5)% | (63,988) | ||
NET ASSETS - 100% | $ 4,231,633 | ||
Legend |
(a) Non-income producing |
(b) Affiliated fund that is available only to investment companies and other accounts managed by Fidelity Investments. The rate quoted is the annualized seven-day yield of the fund at period end. A complete unaudited listing of the fund's holdings as of its most recent quarter end is available upon request. In addition, each Fidelity Central Fund's financial statements, which are not covered by the Fund's Report of Independent Registered Public Accounting Firm, are available on the SEC's website or upon request. |
(c) Investment made with cash collateral received from securities on loan. |
(d) Security or a portion of the security is on loan at period end. |
(e) Security exempt from registration under Rule 144A of the Securities Act of 1933. These securities may be resold in transactions exempt from registration, normally to qualified institutional |
Affiliated Central Funds |
Information regarding fiscal year to date income earned by the Fund from investments in Fidelity Central Funds is as follows: |
Fund | Income earned |
Fidelity Cash Central Fund | $ 13 |
Fidelity Securities Lending Cash Central Fund | 561 |
Total | $ 574 |
Other Information |
The following is a summary of the inputs used, as of November 30, 2010, involving the Fund's assets and liabilities carried at fair value. The inputs or methodology used for valuing securities may not be an indication of the risk associated with investing in those securities. For more information on valuation inputs, and their aggregation into the levels used in the tables below, please refer to the Security Valuation section in the accompanying Notes to Financial Statements. |
Valuation Inputs at Reporting Date: | ||||
Description | Total | Level 1 | Level 2 | Level 3 |
Investments in Securities: | ||||
Equities: | ||||
Consumer Discretionary | $ 968,110 | $ 968,110 | $ - | $ - |
Consumer Staples | 64,127 | 64,127 | - | - |
Energy | 373,310 | 373,310 | - | - |
Financials | 233,078 | 221,154 | 11,924 | - |
Health Care | 306,580 | 306,580 | - | - |
Industrials | 738,867 | 728,605 | - | 10,262 |
Information Technology | 1,097,171 | 1,097,171 | - | - |
Materials | 422,032 | 422,032 | - | - |
Telecommunication Services | 17,442 | 17,442 | - | - |
Money Market Funds | 74,904 | 74,904 | - | - |
Total Investments in Securities: | $ 4,295,621 | $ 4,273,435 | $ 11,924 | $ 10,262 |
The following is a reconciliation of Investments in Securities for which Level 3 inputs were used in determining value: |
(Amounts in thousands) |
|
Investments in Securities: | |
Beginning Balance | $ - |
Total Realized Gain (Loss) | - |
Total Unrealized Gain (Loss) | 250 |
Cost of Purchases | 10,012 |
Proceeds of Sales | - |
Amortization/Accretion | - |
Transfers in to Level 3 | - |
Transfers out of Level 3 | - |
Ending Balance | $ 10,262 |
The change in unrealized gain (loss) for the period attributable to Level 3 securities held at November 30, 2010 | $ 250 |
The information used in the above reconciliation represents fiscal year to date activity for any Investments in Securities identified as using Level 3 inputs at either the beginning or the end of the current fiscal period. Transfers in or out of Level 3 represent the beginning value of any Security or Instrument where a change in the pricing level occurred from the beginning to the end of the period. The cost of purchases and the proceeds of sales may include securities received or delivered through corporate actions or exchanges. Realized and unrealized gains (losses) disclosed in the reconciliation are included in Net Gain (Loss) on the Fund's Statement of Operations. |
Distribution of investments by country of issue, as a percentage of total net assets, is as follows: (Unaudited) |
United States of America | 82.4% |
Germany | 2.9% |
Brazil | 2.8% |
Canada | 2.6% |
Cayman Islands | 2.1% |
Netherlands Antilles | 1.9% |
Bermuda | 1.3% |
Netherlands | 1.1% |
Others (Individually Less Than 1%) | 2.9% |
| 100.0% |
Income Tax Information |
At November 30, 2010, the Fund had a capital loss carryforward of approximately $1,483,260,000 of which $710,362,000 and $772,898,000 will expire in fiscal 2016 and 2017, respectively. Capital loss carryforwards are only available to offset future capital gains of the Fund to the extent provided by regulations and may be limited. |
See accompanying notes which are an integral part of the financial statements.
Annual Report
Financial Statements
Statement of Assets and Liabilities
Amounts in thousands (except per-share amounts) | November 30, 2010 | |
|
|
|
Assets | ||
Investment in securities, at value (including securities loaned of $58,039) - See accompanying schedule: Unaffiliated issuers (cost $3,294,704) | $ 4,220,717 |
|
Fidelity Central Funds (cost $74,904) | 74,904 |
|
Total Investments (cost $3,369,608) |
| $ 4,295,621 |
Receivable for investments sold | 51,707 | |
Receivable for fund shares sold | 2,545 | |
Dividends receivable | 4,331 | |
Distributions receivable from Fidelity Central Funds | 130 | |
Prepaid expenses | 13 | |
Other receivables | 294 | |
Total assets | 4,354,641 | |
|
|
|
Liabilities | ||
Payable for investments purchased | $ 57,317 | |
Payable for fund shares redeemed | 4,065 | |
Accrued management fee | 2,126 | |
Other affiliated payables | 703 | |
Other payables and accrued expenses | 169 | |
Collateral on securities loaned, at value | 58,628 | |
Total liabilities | 123,008 | |
|
|
|
Net Assets | $ 4,231,633 | |
Net Assets consist of: |
| |
Paid in capital | $ 4,802,504 | |
Accumulated net investment loss | (96) | |
Accumulated undistributed net realized gain (loss) on investments and foreign currency transactions | (1,496,770) | |
Net unrealized appreciation (depreciation) on investments and assets and liabilities in foreign currencies | 925,995 | |
Net Assets | $ 4,231,633 | |
See accompanying notes which are an integral part of the financial statements.
Annual Report
Statement of Assets and Liabilities - continued
Amounts in thousands (except per-share amounts) | November 30, 2010 | |
|
|
|
Independence: Net Asset Value, offering price and redemption price per share ($3,988,237 ÷ 171,224 shares) | $ 23.29 | |
|
|
|
Class K: Net Asset Value, offering price and redemption price per share ($243,396 ÷ 10,442 shares) | $ 23.31 | |
See accompanying notes which are an integral part of the financial statements.
Annual Report
Financial Statements - continued
Statement of Operations
Amounts in thousands | Year ended November 30, 2010 | |
|
|
|
Investment Income |
|
|
Dividends |
| $ 29,463 |
Income from Fidelity Central Funds |
| 574 |
Total income |
| 30,037 |
|
|
|
Expenses | ||
Management fee | $ 22,155 | |
Performance adjustment | 5,177 | |
Transfer agent fees | 7,547 | |
Accounting and security lending fees | 1,079 | |
Custodian fees and expenses | 154 | |
Independent trustees' compensation | 23 | |
Appreciation in deferred trustee compensation account | 1 | |
Registration fees | 56 | |
Audit | 71 | |
Legal | 24 | |
Interest | 3 | |
Miscellaneous | 53 | |
Total expenses before reductions | 36,343 | |
Expense reductions | (289) | 36,054 |
Net investment income (loss) | (6,017) | |
Realized and Unrealized Gain (Loss) Net realized gain (loss) on: | ||
Investment securities: |
|
|
Unaffiliated issuers | 606,270 | |
Foreign currency transactions | (1,044) | |
Futures contracts | 683 | |
Capital gain distributions from Fidelity Central Funds | 5 |
|
Total net realized gain (loss) |
| 605,914 |
Change in net unrealized appreciation (depreciation) on: Investment securities | 204,917 | |
Assets and liabilities in foreign currencies | (32) | |
Total change in net unrealized appreciation (depreciation) |
| 204,885 |
Net gain (loss) | 810,799 | |
Net increase (decrease) in net assets resulting from operations | $ 804,782 | |
See accompanying notes which are an integral part of the financial statements.
Annual Report
Statement of Changes in Net Assets
Amounts in thousands | Year ended | Year ended |
Increase (Decrease) in Net Assets |
|
|
Operations |
|
|
Net investment income (loss) | $ (6,017) | $ 13,175 |
Net realized gain (loss) | 605,914 | (303,965) |
Change in net unrealized appreciation (depreciation) | 204,885 | 1,385,715 |
Net increase (decrease) in net assets resulting | 804,782 | 1,094,925 |
Distributions to shareholders from net investment income | (7,207) | (20,945) |
Distributions to shareholders from net realized gain | (1,044) | - |
Total distributions | (8,251) | (20,945) |
Share transactions - net increase (decrease) | (566,877) | (556,508) |
Total increase (decrease) in net assets | 229,654 | 517,472 |
|
|
|
Net Assets | ||
Beginning of period | 4,001,979 | 3,484,507 |
End of period (including accumulated net investment loss of $96 and undistributed net investment income of $6,577, respectively) | $ 4,231,633 | $ 4,001,979 |
See accompanying notes which are an integral part of the financial statements.
Annual Report
Financial Highlights - Independence
Years ended November 30, | 2010 | 2009 | 2008 | 2007 | 2006 |
Selected Per-Share Data |
|
|
|
|
|
Net asset value, beginning of period | $ 19.10 | $ 14.17 | $ 27.60 | $ 22.03 | $ 19.46 |
Income from Investment Operations |
|
|
|
|
|
Net investment income (loss) B | (.03) | .06 | .08 | .07 | .08 |
Net realized and unrealized gain (loss) | 4.26 | 4.96 | (12.75) | 5.60 | 2.54 |
Total from investment operations | 4.23 | 5.02 | (12.67) | 5.67 | 2.62 |
Distributions from net investment income | (.03) | (.09) | (.01) | (.10) | (.05) |
Distributions from net realized gain | (.01) | - | (.75) | - | - |
Total distributions | (.04) | (.09) | (.76) | (.10) | (.05) |
Net asset value, end of period | $ 23.29 | $ 19.10 | $ 14.17 | $ 27.60 | $ 22.03 |
Total Return A | 22.18% | 35.62% | (47.19)% | 25.85% | 13.49% |
Ratios to Average Net Assets C, E |
|
|
|
|
|
Expenses before reductions | .92% | .92% | .91% | .90% | .87% |
Expenses net of fee waivers, if any | .92% | .92% | .91% | .90% | .87% |
Expenses net of all reductions | .92% | .91% | .90% | .89% | .86% |
Net investment income (loss) | (.16)% | .36% | .34% | .31% | .41% |
Supplemental Data |
|
|
|
|
|
Net assets, end of period (in millions) | $ 3,988 | $ 3,824 | $ 3,407 | $ 5,899 | $ 4,723 |
Portfolio turnover rate D | 103% | 173% | 173% | 175% | 169% |
A Total returns would have been lower had certain expenses not been reduced during the periods shown.
B Calculated based on average shares outstanding during the period.
C Fees and expenses of the underlying Fidelity Central Funds are not included in the Fund's expense ratio. The Fund indirectly bears its proportionate share of the expenses of any underlying Fidelity Central Funds.
D Amount does not include the portfolio activity of any underlying Fidelity Central Funds.
E Expense ratios reflect operating expenses of the class. Expenses before reductions do not reflect amounts reimbursed by the investment adviser or reductions from brokerage service arrangements or reductions from other expense offset arrangements and do not represent the amount paid by the class during periods when reimbursements or reductions occur. Expenses net of fee waivers reflect expenses after reimbursement by the investment adviser but prior to reductions from brokerage service arrangements or other expense offset arrangements. Expenses net of all reductions represent the net expenses paid by the class.
See accompanying notes which are an integral part of the financial statements.
Annual Report
Financial Highlights - Class K
Years ended November 30, | 2010 | 2009 | 2008 G |
Selected Per-Share Data |
|
|
|
Net asset value, beginning of period | $ 19.12 | $ 14.18 | $ 28.56 |
Income from Investment Operations |
|
|
|
Net investment income (loss) D | - I | .09 | .09 |
Net realized and unrealized gain (loss) | 4.26 | 4.96 | (14.47) |
Total from investment operations | 4.26 | 5.05 | (14.38) |
Distributions from net investment income | (.07) | (.11) | - |
Distributions from net realized gain | (.01) | - | - |
Total distributions | (.07) J | (.11) | - |
Net asset value, end of period | $ 23.31 | $ 19.12 | $ 14.18 |
Total Return B, C | 22.37% | 35.94% | (50.35)% |
Ratios to Average Net Assets E, H |
|
|
|
Expenses before reductions | .78% | .73% | .79% A |
Expenses net of fee waivers, if any | .78% | .73% | .79%A |
Expenses net of all reductions | .77% | .72% | .78%A |
Net investment income (loss) | (.01)% | .56% | 1.04%A |
Supplemental Data |
|
|
|
Net assets, end of period (in millions) | $ 243 | $ 178 | $ 78 |
Portfolio turnover rate F | 103% | 173% | 173% |
A Annualized
B Total returns for periods of less than one year are not annualized.
C Total returns would have been lower had certain expenses not been reduced during the periods shown.
D Calculated based on average shares outstanding during the period.
E Fees and expenses of the underlying Fidelity Central Funds are not included in the Fund's expense ratio. The Fund indirectly bears its proportionate share of the expenses of any underlying Fidelity Central Funds.
F Amount does not include the portfolio activity of any underlying Fidelity Central Funds.
G For the period May 9, 2008 (commencement of sale of shares) to November 30, 2008.
H Expense ratios reflect operating expenses of the class. Expenses before reductions do not reflect amounts reimbursed by the investment adviser or reductions from brokerage service arrangements or reductions from other expense offset arrangements and do not represent the amount paid by the class during periods when reimbursements or reductions occur. Expense ratios before reductions for start-up periods may not be representative of longer-term operating periods. Expenses net of fee waivers reflect expenses after reimbursement by the investment adviser but prior to reductions from brokerage service arrangements or other expense offset arrangements. Expenses net of all reductions represent the net expenses paid by the class.
I Amount represents less than $.01 per share.
J Total distributions of $.07 per share is comprised of distributions from net investment income of $.067 and distributions from net realized gain of $.005 per share.
See accompanying notes which are an integral part of the financial statements.
Annual Report
Notes to Financial Statements
For the period ended November 30, 2010
(Amounts in thousands except ratios)
1. Organization.
Fidelity Independence Fund (the Fund) is a fund of Fidelity Financial Trust (the Trust) and is authorized to issue an unlimited number of shares. The Trust is registered under the Investment Company Act of 1940, as amended (the 1940 Act), as an open-end management investment company organized as a Massachusetts business trust. The Fund offers Independence and Class K shares, each of which has equal rights as to assets and voting privileges. Each class has exclusive voting rights with respect to matters that affect that class. Investment income, realized and unrealized capital gains and losses, the common expenses of the Fund, and certain fund-level expense reductions, if any, are allocated on a pro-rata basis to each class based on the relative net assets of each class to the total net assets of the Fund. Each class differs with respect to transfer agent fees incurred. Certain expense reductions also differ by class. The Fund's investments in emerging markets can be subject to social, economic, regulatory, and political uncertainties and can be extremely volatile.
2. Investments in Fidelity Central Funds.
The Fund may invest in Fidelity Central Funds, which are open-end investment companies available only to other investment companies and accounts managed by Fidelity Management & Research Company (FMR) and its affiliates. The Fund's Schedule of Investments lists each of the Fidelity Central Funds held as of period end, if any, as an investment of the Fund, but does not include the underlying holdings of each Fidelity Central Fund. As an Investing Fund, the Fund indirectly bears its proportionate share of the expenses of the underlying Fidelity Central Funds.
The Money Market Central Funds seek preservation of capital and current income and are managed by Fidelity Investments Money Management, Inc. (FIMM), an affiliate of FMR.
A complete unaudited list of holdings for each Fidelity Central Fund is available upon request or at the Securities and Exchange Commission (the SEC) web site at www.sec.gov. In addition, the financial statements of the Fidelity Central Funds, which are not covered by the Fund's Report of Independent Registered Public Accounting Firm, are available on the SEC web site or upon request.
3. Significant Accounting Policies.
The financial statements have been prepared in conformity with accounting principles generally accepted in the United States of America (GAAP), which require management to make certain estimates and assumptions at the date of the financial statements. Actual results could differ from those estimates. The following summarizes the significant accounting policies of the Fund:
Annual Report
3. Significant Accounting Policies - continued
Security Valuation. Investments are valued as of 4:00 p.m. Eastern time on the last calendar day of the period. The Fund uses independent pricing services approved by the Board of Trustees to value its investments. When current market prices or quotations are not readily available or reliable, valuations may be determined in good faith in accordance with procedures adopted by the Board of Trustees. Factors used in determining value may include market or security specific events. The frequency with which these procedures are used cannot be predicted and they may be utilized to a significant extent. The value used for net asset value (NAV) calculation under these procedures may differ from published prices for the same securities.
The Fund categorizes the inputs to valuation techniques used to value its investments into a disclosure hierarchy consisting of three levels as shown below.
Level 1 - quoted prices in active markets for identical investments
Level 2 - other significant observable inputs (including quoted prices for similar investments, interest rates, prepayment speeds, etc.)
Level 3 - unobservable inputs (including the Fund's own assumptions based on the best information available)
Changes in valuation techniques may result in transfers in or out of an assigned level within the disclosure hierarchy. The aggregate value of investments by input level, as of November 30, 2010, as well as a roll forward of Level 3 securities, is included at the end of the Fund's Schedule of Investments. Valuation techniques used to value the Fund's investments by major category are as follows.
Equity securities, including restricted securities, for which market quotations are readily available, are valued at the last reported sale price or official closing price as reported by an independent pricing service on the primary market or exchange on which they are traded and are categorized as Level 1 in the hierarchy. In the event there were no sales during the day or closing prices are not available, securities are valued at the last quoted bid price or may be valued using the last available price and are generally categorized as Level 2 in the hierarchy. For foreign equity securities, when significant market or security specific events arise, comparisons to the valuation of American Depositary Receipts (ADRs), futures contracts, Exchange-traded funds (ETFs) and certain indexes as well as quoted prices for similar securities are used and are categorized as Level 2 in the hierarchy in these circumstances. Utilizing these techniques may result in transfers between Level 1 and Level 2. For restricted equity securities and private placements where observable inputs are limited, assumptions about market activity and risk are used and are categorized as Level 3 in the hierarchy.
Annual Report
Notes to Financial Statements - continued
(Amounts in thousands except ratios)
3. Significant Accounting Policies - continued
Security Valuation - continued
Investments in open-end mutual funds, including the Fidelity Central Funds, are valued at their closing net asset value each business day and are categorized as Level 1 in the hierarchy.
Foreign Currency. The Fund uses foreign currency contracts to facilitate transactions in foreign-denominated securities. Gains and losses from these transactions may arise from changes in the value of the foreign currency or if the counterparties do not perform under the contracts' terms.
Foreign-denominated assets, including investment securities, and liabilities are translated into U.S. dollars at the exchange rate at period end. Purchases and sales of investment securities, income and dividends received and expenses denominated in foreign currencies are translated into U.S. dollars at the exchange rate in effect on the transaction date.
The effects of exchange rate fluctuations on investments are included with the net realized and unrealized gain (loss) on investment securities. Other foreign currency transactions resulting in realized and unrealized gain (loss) are disclosed separately.
Investment Transactions and Income. For financial reporting purposes, the Fund's investment holdings and NAV include trades executed through the end of the last business day of the period. The NAV per share for processing shareholder transactions is calculated as of the close of business of the New York Stock Exchange (NYSE), normally 4:00 p.m. Eastern time and includes trades executed through the end of the prior business day. Gains and losses on securities sold are determined on the basis of identified cost and may include proceeds received from litigation. Dividend income is recorded on the ex-dividend date, except for certain dividends from foreign securities where the ex-dividend date may have passed, which are recorded as soon as the Fund is informed of the ex-dividend date. Non-cash dividends included in dividend income, if any, are recorded at the fair market value of the securities received. Distributions received on securities that represent a return of capital or capital gain are recorded as a reduction of cost of investments and/or as a realized gain. The Fund estimates the components of distributions received that may be considered return of capital distributions or capital gain distributions. Interest income and distributions from the Fidelity Central Funds are accrued as earned. Interest income includes coupon interest and amortization of premium and accretion of discount on debt securities. Investment income is recorded net of foreign taxes withheld where recovery of such taxes is uncertain.
Annual Report
3. Significant Accounting Policies - continued
Expenses. Most expenses of the Trust can be directly attributed to a fund. Expenses which cannot be directly attributed are apportioned amongst each fund in the Trust. Expense estimates are accrued in the period to which they relate and adjustments are made when actual amounts are known.
Deferred Trustee Compensation. Under a Deferred Compensation Plan (the Plan), independent Trustees may elect to defer receipt of a portion of their annual compensation. Deferred amounts are invested in a cross-section of Fidelity funds, are marked-to-market and remain in the Fund until distributed in accordance with the Plan. The investment of deferred amounts and the offsetting payable to the Trustees are included in the accompanying Statement of Assets and Liabilities.
Income Tax Information and Distributions to Shareholders. Each year the Fund intends to qualify as a regulated investment company, including distributing substantially all of its taxable income and realized gains under Subchapter M of the Internal Revenue Code and filing its U.S. federal tax return. As a result, no provision for income taxes is required. As of November 30, 2010, the Fund did not have any unrecognized tax benefits in the accompanying financial statements. A fund's federal tax return is subject to examination by the Internal Revenue Service (IRS) for a period of three years. Foreign taxes are provided for based on the Fund's understanding of the tax rules and rates that exist in the foreign markets in which it invests.
Distributions are declared and recorded on the ex-dividend date. Income dividends and capital gain distributions are declared separately for each class. Income and capital gain distributions are determined in accordance with income tax regulations, which may differ from GAAP.
Capital accounts within the financial statements are adjusted for permanent book-tax differences. These adjustments have no impact on net assets or the results of operations. Temporary book-tax differences will reverse in a subsequent period.
Book-tax differences are primarily due to futures transactions, foreign currency transactions, market discount, partnerships, deferred trustees compensation, net operating losses, capital loss carryforwards and losses deferred due to wash sales and excise tax regulations.
The federal tax cost of investment securities and unrealized appreciation (depreciation) as of period end were as follows:
Gross unrealized appreciation | $ 984,561 |
Gross unrealized depreciation | (72,059) |
Net unrealized appreciation (depreciation) | $ 912,502 |
|
|
Tax Cost | $ 3,383,119 |
Annual Report
Notes to Financial Statements - continued
(Amounts in thousands except ratios)
3. Significant Accounting Policies - continued
Income Tax Information and Distributions to Shareholders - continued
The tax-based components of distributable earnings as of period end were as follows:
Capital loss carryforward | $ (1,483,260) |
Net unrealized appreciation (depreciation) | $ 912,484 |
The tax character of distributions paid was as follows:
| November 30, 2010 | November 30, 2009 |
Ordinary Income | $ 8,251 | $ 20,945 |
4. Operating Policies.
Restricted Securities. The Fund may invest in securities that are subject to legal or contractual restrictions on resale. These securities generally may be resold in transactions exempt from registration or to the public if the securities are registered. Disposal of these securities may involve time-consuming negotiations and expense, and prompt sale at an acceptable price may be difficult. Information regarding restricted securities is included at the end of the Fund's Schedule of Investments.
5. Derivative Instruments.
Risk Exposures and the Use of Derivative Instruments. The Fund uses derivative instruments (derivatives), including futures contracts, in order to meet its investment objectives. The strategy is to use derivatives to increase returns, to gain exposure to certain types of assets and to manage exposure to certain risks as defined below. The success of any strategy involving derivatives depends on analysis of numerous economic factors, and if the strategies for investment do not work as intended, the Fund may not achieve its objectives.
The Fund's use of derivatives may increase or decrease its exposure to the following risk:
Equity Risk | Equity risk relates to the fluctuations in the value of financial instruments as a result of changes in market prices (other than those arising from interest rate risk or foreign exchange risk), whether caused by factors specific to an individual investment, its issuer, or all factors affecting all instruments traded in a market or market segment. |
The Fund is also exposed to additional risks from investing in derivatives, such as liquidity risk and counterparty credit risk. Liquidity risk is the risk that the Fund will be unable to sell the derivative in the open market in a timely manner. Counterparty credit
Annual Report
5. Derivative Instruments - continued
Risk Exposures and the Use of Derivative Instruments - continued
risk is the risk that the counterparty will not be able to fulfill its obligation to the Fund. The Fund's maximum risk of loss from counterparty credit risk is generally the aggregate unrealized appreciation and unpaid counterparty fees in excess of any collateral pledged by the counterparty to the Fund. Counterparty risk related to exchange-traded futures contracts is minimal because of the protection provided by the exchange on which they trade. Risk of loss may exceed the amounts recognized in the Statement of Assets and Liabilities.
Futures Contracts. A futures contract is an agreement between two parties to buy or sell a specified underlying instrument for a fixed price at a specified future date. The Fund uses futures contracts to manage its exposure to the stock market.
Upon entering into a futures contract, a fund is required to deposit either cash or securities (initial margin) with a clearing broker in an amount equal to a certain percentage of the face value of the contract. Futures contracts are marked-to-market daily and subsequent payments (variation margin) are made or received by a fund depending on the daily fluctuations in the value of the futures contracts and are recorded as unrealized appreciation or (depreciation). Realized gain or (loss) is recorded upon the expiration or closing of a futures contract. The net realized gain (loss) and change in net unrealized appreciation (depreciation) on futures contracts during the period is included in the Statement of Operations.
The underlying face amount at value of open futures contracts at period end, if any, is shown in the Schedule of Investments under the caption "Futures Contracts." This amount reflects each contract's exposure to the underlying instrument at period end. Securities deposited to meet initial margin requirements are identified in the Schedule of Investments. The receivable and/or payable for the variation margin are reflected in the Statement of Assets and Liabilities.
Certain risks may arise upon entering into futures contracts, including the risk that an illiquid market may limit the ability to close out a futures contract prior to settlement date.
During the period the Fund recognized net realized gain (loss) of $683 and a change in net unrealized appreciation (depreciation) of $0 related to its investment in futures contracts. These amounts are included in the Statement of Operations.
6. Purchases and Sales of Investments.
Purchases and sales of securities, other than short-term securities, aggregated $4,035,524 and $4,609,822, respectively.
Annual Report
Notes to Financial Statements - continued
(Amounts in thousands except ratios)
7. Fees and Other Transactions with Affiliates.
Management Fee. FMR and its affiliates provide the Fund with investment management related services for which the Fund pays a monthly management fee. The management fee is the sum of an individual fund fee rate that is based on an annual rate of .30% of the Fund's average net assets and a group fee rate that averaged .26% during the period. The group fee rate is based upon the average net assets of all the mutual funds advised by FMR. The group fee rate decreases as assets under management increase and increases as assets under management decrease. In addition, the management fee is subject to a performance adjustment (up to a maximum of ± .20% of the Fund's average net assets over a 36 month performance period). The upward or downward adjustment to the management fee is based on the relative investment performance of Independence as compared to an appropriate benchmark index. For the period, the total annual management fee rate, including the performance adjustment, was .69% of the Fund's average net assets.
Transfer Agent Fees. Fidelity Investments Institutional Operations Company, Inc. (FIIOC), an affiliate of FMR, is the transfer, dividend disbursing and shareholder servicing agent for each class of the Fund. FIIOC receives account fees and asset-based fees that vary according to the account size and type of account of the shareholders of Independence. FIIOC receives an asset-based fee of Class K's average net assets. FIIOC pays for typesetting, printing and mailing of shareholder reports, except proxy statements. For the period, transfer agent fees for each class were as follows:
| Amount | % of |
Independence | $ 7,451 | .20 |
Class K | 96 | .05 |
| $ 7,547 |
|
Accounting and Security Lending Fees. Fidelity Service Company, Inc. (FSC), an affiliate of FMR, maintains the Fund's accounting records. The accounting fee is based on the level of average net assets for the month. Under a separate contract, FSC administers the security lending program. The security lending fee is based on the number and duration of lending transactions.
Brokerage Commissions. The Fund placed a portion of its portfolio transactions with brokerage firms which are affiliates of the investment adviser. The commissions paid to these affiliated firms were $84 for the period.
Interfund Lending Program. Pursuant to an Exemptive Order issued by the SEC, the Fund, along with other registered investment companies having management contracts with FMR, may participate in an interfund lending program. This program provides an alternative credit facility allowing the funds to borrow from, or lend money to, other
Annual Report
7. Fees and Other Transactions with Affiliates - continued
Interfund Lending Program - continued
participating affiliated funds. At period end, there were no interfund loans outstanding. The Fund's activity in this program during the period for which loans were outstanding was as follows:
Borrower or Lender | Average Daily | Weighted Average Interest Rate | Interest |
Borrower | $ 8,196 | .42% | $ 3 |
8. Committed Line of Credit.
The Fund participates with other funds managed by FMR or an affiliate in a $3.75 billion credit facility (the "line of credit") to be utilized for temporary or emergency purposes to fund shareholder redemptions or for other short-term liquidity purposes. The Fund has agreed to pay commitment fees on its pro-rata portion of the line of credit, which amounted to $16 and is reflected in Miscellaneous expenses on the Statement of Operations. During the period, there were no borrowings on this line of credit.
9. Security Lending.
The Fund lends portfolio securities through a lending agent from time to time in order to earn additional income. The lending agent may loan securities to certain qualified borrowers, including Fidelity Capital Markets (FCM), a broker-dealer affiliated with the Fund. On the settlement date of the loan, the Fund receives collateral (in the form of U.S. Treasury obligations, letters of credit and/or cash) against the loaned securities and maintains collateral in an amount not less than 100% of the market value of the loaned securities during the period of the loan. The market value of the loaned securities is determined at the close of business of the Fund and any additional required collateral is delivered to the Fund on the next business day. If the borrower defaults on its obligation to return the securities loaned because of insolvency or other reasons, a fund could experience delays and costs in recovering the securities loaned or in gaining access to the collateral. Any cash collateral received is invested in the Fidelity Securities Lending Cash Central Fund. The value of loaned securities and cash collateral at period end are disclosed on the Fund's Statement of Assets and Liabilities. Security lending income represents the income earned on investing cash collateral, less rebates paid to borrowers and lending agent fees associated with the loan, plus any premium payments received for lending certain types of securities. Security lending income is presented in the Statement of Operations as a component of income from Fidelity Central Funds. Total security lending income during the period amounted to $561. During the period, there were no securities loaned to FCM.
Annual Report
Notes to Financial Statements - continued
(Amounts in thousands except ratios)
10. Expense Reductions.
Many of the brokers with whom FMR places trades on behalf of the Fund provided services to the Fund in addition to trade execution. These services included payments of certain expenses on behalf of the Fund totaling $289 for the period.
11. Distributions to Shareholders.
Distributions to shareholders of each class were as follows:
Years ended November 30, | 2010 | 2009 |
From net investment income |
|
|
Independence | $ 6,585 | $ 20,326 |
Class K | 622 | 619 |
Total | $ 7,207 | $ 20,945 |
From net realized gain |
|
|
Independence | $ 998 | $ - |
Class K | 46 | - |
Total | $ 1,044 | $ - |
12. Share Transactions.
Transactions for each class of shares were as follows:
| Shares | Dollars | ||
Years ended November 30, | 2010 | 2009 A | 2010 | 2009 A |
Independence |
|
|
|
|
Shares sold | 11,119 | 19,015 | $ 231,763 | $ 286,391 |
Conversion to Class K | - | (4,612) | - | (73,200) |
Reinvestment of distributions | 385 | 1,443 | 7,469 | 20,026 |
Shares redeemed | (40,468) | (56,069) | (829,719) | (841,423) |
Net increase (decrease) | (28,964) | (40,223) | $ (590,487) | $ (608,206) |
Class K |
|
|
|
|
Shares sold | 5,967 | 3,711 | $ 122,003 | $ 53,643 |
Conversion from Independence | - | 4,612 | - | 73,200 |
Reinvestment of distributions | 35 | 45 | 669 | 619 |
Shares redeemed | (4,890) | (4,524) | (99,062) | (75,764) |
Net increase (decrease) | 1,112 | 3,844 | $ 23,610 | $ 51,698 |
A Conversion transactions for Class K and Independence are presented for the period December 1, 2008 through August 31, 2009.
Annual Report
13. Other.
The Fund's organizational documents provide former and current trustees and officers with a limited indemnification against liabilities arising in connection with the performance of their duties to the Fund. In the normal course of business, the Fund may also enter into contracts that provide general indemnifications. The Fund's maximum exposure under these arrangements is unknown as this would be dependent on future claims that may be made against the Fund. The risk of material loss from such claims is considered remote.
Annual Report
Report of Independent Registered Public Accounting Firm
To the Trustees of Fidelity Financial Trust and the Shareholders of Fidelity Independence Fund:
In our opinion, the accompanying statement of assets and liabilities, including the schedule of investments, and the related statements of operations and of changes in net assets and the financial highlights present fairly, in all material respects, the financial position of Fidelity Independence Fund (a fund of Fidelity Financial Trust) at November 30, 2010, the results of its operations for the year then ended, the changes in its net assets for each of the two years in the period then ended and the financial highlights for each of the periods indicated, in conformity with accounting principles generally accepted in the United States of America. These financial statements and financial highlights (hereafter referred to as "financial statements") are the responsibility of the Fidelity Independence Fund's management. Our responsibility is to express an opinion on these financial statements based on our audits. We conducted our audits of these financial statements in accordance with the standards of the Public Company Accounting Oversight Board (United States). Those standards require that we plan and perform the audit to obtain reasonable assurance about whether the financial statements are free of material misstatement. An audit includes examining, on a test basis, evidence supporting the amounts and disclosures in the financial statements, assessing the accounting principles used and significant estimates made by management, and evaluating the overall financial statement presentation. We believe that our audits, which included confirmation of securities at November 30, 2010 by correspondence with the custodian and brokers, provide a reasonable basis for our opinion.
/s/ PricewaterhouseCoopers LLP
PricewaterhouseCoopers LLP
Boston, Massachusetts
January 14, 2011
Annual Report
Trustees and Officers
The Trustees, Members of the Advisory Board, and executive officers of the trust and fund, as applicable, are listed below. The Board of Trustees governs the fund and is responsible for protecting the interests of shareholders. The Trustees are experienced executives who meet periodically throughout the year to oversee the fund's activities, review contractual arrangements with companies that provide services to the fund, oversee management of the risks associated with such activities and contractual arrangements, and review the fund's performance. Except for James C. Curvey, each of the Trustees oversees 219 funds advised by FMR or an affiliate. Mr. Curvey oversees 408 funds advised by FMR or an affiliate.
The Trustees hold office without limit in time except that (a) any Trustee may resign; (b) any Trustee may be removed by written instrument, signed by at least two-thirds of the number of Trustees prior to such removal; (c) any Trustee who requests to be retired or who has become incapacitated by illness or injury may be retired by written instrument signed by a majority of the other Trustees; and (d) any Trustee may be removed at any special meeting of shareholders by a two-thirds vote of the outstanding voting securities of the trust. Each Trustee who is not an interested person (as defined in the 1940 Act) (Independent Trustee), shall retire not later than the last day of the calendar year in which his or her 72nd birthday occurs. The Independent Trustees may waive this mandatory retirement age policy with respect to individual Trustees. The executive officers and Advisory Board Members hold office without limit in time, except that any officer and Advisory Board Member may resign or may be removed by a vote of a majority of the Trustees at any regular meeting or any special meeting of the Trustees. Except as indicated, each individual has held the office shown or other offices in the same company for the past five years.
Experience, Skills, Attributes, and Qualifications of the Fund's Trustees. The Governance and Nominating Committee has adopted a statement of policy that describes the experience, qualifications, attributes, and skills that are necessary and desirable for potential Independent Trustee candidates (Statement of Policy). The Board believes that each Trustee satisfied at the time he or she was initially elected or appointed a Trustee, and continues to satisfy, the standards contemplated by the Statement of Policy. The Governance and Nominating Committee also engages professional search firms to help identify potential Independent Trustee candidates who have the experience, qualifications, attributes, and skills consistent with the Statement of Policy. From time to time, additional criteria based on the composition and skills of the current Independent Trustees, as well as experience or skills that may be appropriate in light of future changes to board composition, business conditions, and regulatory or other developments, have also been considered by the professional search firms and the Governance and Nominating Committee. In addition, the Board takes into account the Trustees' commitment and participation in Board and committee meetings, as well as their leadership of standing and ad hoc committees throughout their tenure.
In determining that a particular Trustee was and continues to be qualified to serve as a Trustee, the Board has considered a variety of criteria, none of which, in isolation, was controlling. The Board believes that, collectively, the Trustees have balanced and diverse experience, qualifications, attributes, and skills, which allow the Board to operate effectively in governing the fund and protecting the interests of shareholders. Information about the specific experience, skills, attributes, and qualifications of each Trustee, which in each case led to the Board's conclusion that the Trustee should serve (or continue to serve) as a trustee of the fund, is provided below.
Annual Report
Trustees and Officers - continued
Board Structure and Oversight Function. James C. Curvey is an interested person (as defined in the 1940 Act) and currently serves as Acting Chairman. The Trustees have determined that an interested Chairman is appropriate and benefits shareholders because an interested Chairman has a personal and professional stake in the quality and continuity of services provided to the fund. Independent Trustees exercise their informed business judgment to appoint an individual of their choosing to serve as Chairman, regardless of whether the Trustee happens to be independent or a member of management. The Independent Trustees have determined that they can act independently and effectively without having an Independent Trustee serve as Chairman and that a key structural component for assuring that they are in a position to do so is for the Independent Trustees to constitute a substantial majority for the Board. The Independent Trustees also regularly meet in executive session. Ned C. Lautenbach serves as Chairman of the Independent Trustees and as such (i) acts as a liaison between the Independent Trustees and management with respect to matters important to the Independent Trustees and (ii) with management prepares agendas for Board meetings.
Fidelity funds are overseen by different Boards of Trustees. The fund's Board oversees Fidelity's equity and high income funds and another Board oversees Fidelity's investment-grade bond, money market, and asset allocation funds. The asset allocation funds may invest in Fidelity funds overseen by the fund's Board. The use of separate Boards, each with its own committee structure, allows the Trustees of each group of Fidelity funds to focus on the unique issues of the funds they oversee, including common research, investment, and operational issues. On occasion, the separate Boards establish joint committees to address issues of overlapping consequences for the Fidelity funds overseen by each Board.
The Trustees operate using a system of committees to facilitate the timely and efficient consideration of all matters of importance to the Trustees, the fund, and fund shareholders and to facilitate compliance with legal and regulatory requirements and oversight of the fund's activities and associated risks. The Board, acting through its committees, has charged FMR and its affiliates with (i) identifying events or circumstances the occurrence of which could have demonstrably adverse effects on the fund's business and/or reputation; (ii) implementing processes and controls to lessen the possibility that such events or circumstances occur or to mitigate the effects of such events or circumstances if they do occur; and (iii) creating and maintaining a system designed to evaluate continuously business and market conditions in order to facilitate the identification and implementation processes described in (i) and (ii) above. Because the day-to-day operations and activities of the fund are carried out by or through FMR, its affiliates and other service providers, the fund's exposure to risks is mitigated but not eliminated by the processes overseen by the Trustees. While each of the Board's committees has responsibility for overseeing different aspects of the fund's activities, oversight is exercised primarily through the Operations, Audit, and Compliance Committees. Appropriate personnel, including but not limited to the fund's Chief Compliance Officer (CCO), FMR's internal auditor, the independent accountants, the fund's Treasurer and portfolio management personnel, make periodic reports to the Board's committees, as appropriate. The responsibilities of each committee, including their oversight responsibilities, are described further under "Standing Committees of the Fund's Trustees."
Annual Report
The fund's Statement of Additional Information (SAI) includes more information about the Trustees. To request a free copy, call Fidelity at 1-800-835-5092.
Interested Trustees*:
Correspondence intended for each Trustee who is an interested person may be sent to Fidelity Investments, 82 Devonshire Street, Boston, Massachusetts 02109.
Name, Age; Principal Occupations and Other Relevant Experience+ | |
James C. Curvey (75) | |
| Year of Election or Appointment: 2007 Mr. Curvey is Trustee and Acting Chairman of the Board of Trustees of certain Trusts. Mr. Curvey also serves as Trustee (2007-present) of other investment companies advised by FMR. Mr. Curvey is a Director of Fidelity Investments Money Management, Inc. (2009-present), Director of Fidelity Research & Analysis Co. (2009-present) and Director of FMR and FMR Co., Inc. (2007-present). Mr. Curvey is also Vice Chairman (2007-present) and Director of FMR LLC. In addition, Mr. Curvey serves as an Overseer for the Boston Symphony Orchestra and a member of the Trustees of Villanova University. Previously, Mr. Curvey was the Vice Chairman (2006-2007) and Director (2000-2007) of FMR Corp. |
Ronald P. O'Hanley (54) | |
| Year of Election or Appointment: 2011 Ronald P. O'Hanley is President, Asset Management and Corporate Services, for Fidelity Investments and a member of Fidelity's Executive Committee (2010-present). Previously, Mr. O'Hanley served as President and Chief Executive Officer of BNY Mellon Asset Management (2007-2010). Mr. O'Hanley also served as Vice Chairman of Bank New York Mellon Corp. and a member of that firm's Executive Committee. Prior to the 2007 merger of The Bank of New York and Mellon Financial Corporation, he was Vice Chairman of Mellon Financial Corporation and President and Chief Executive Officer of Mellon Asset Management. He joined Mellon in February 1997. Mr. O'Hanley currently serves as Chairman of the Boston Public Library Foundation Board of Directors and sits on the Board of Directors of Beth Israel Deaconess Medical Center, the Board of Trustees of the Marine Biological Laboratory and the Advisory Board of the Maxwell School of Citizenship and Public Administration at Syracuse University. Mr. O'Hanley also chairs the Council on Asset Management for the Financial Services Roundtable and is a member of the Board of Directors of Institutional Investor's U.S. Institute. |
Annual Report
Trustees and Officers - continued
* Trustees have been determined to be "Interested Trustees" by virtue of, among other things, their affiliation with the trust or various entities under common control with FMR.
+ The information above includes each Trustee's principal occupation during the last five years and other information relating to the experience, attributes, and skills relevant to each Trustee's qualifications to serve as a Trustee, which led to the conclusion that each Trustee should serve as a Trustee for the fund.
Independent Trustees:
Correspondence intended for each Independent Trustee (that is, the Trustees other than the Interested Trustees) may be sent to Fidelity Investments, P.O. Box 55235, Boston, Massachusetts 02205-5235.
Name, Age; Principal Occupations and Other Relevant Experience+ | |
Dennis J. Dirks (62) | |
| Year of Election or Appointment: 2005 Prior to his retirement in May 2003, Mr. Dirks was Chief Operating Officer and a member of the Board of The Depository Trust & Clearing Corporation (DTCC). He also served as President, Chief Operating Officer, and Board member of The Depository Trust Company (DTC) and President and Board member of the National Securities Clearing Corporation (NSCC). In addition, Mr. Dirks served as Chief Executive Officer and Board member of the Government Securities Clearing Corporation, Chief Executive Officer and Board member of the Mortgage-Backed Securities Clearing Corporation, as a Trustee and a member of the Finance Committee of Manhattan College (2005-2008), and as a Trustee and a member of the Finance Committee of AHRC of Nassau County (2006-2008). Mr. Dirks is a member of the Independent Directors Council (IDC) Governing Council (2010-Present) and Board of Directors for The Brookville Center for Children's Services, Inc. (2009-present). |
Alan J. Lacy (57) | |
| Year of Election or Appointment: 2008 Mr. Lacy serves as Senior Adviser (2007-present) of Oak Hill Capital Partners, L.P. (private equity). Mr. Lacy also served as Chief Executive Officer (2000-2005) and Vice Chairman (2005-2006) of Sears Holdings Corporation and Sears, Roebuck and Co. (retail). In addition, Mr. Lacy serves as a member of the Board of Directors of The Western Union Company (global money transfer, 2006-present) and Bristol- |
Ned C. Lautenbach (66) | |
| Year of Election or Appointment: 2000 Mr. Lautenbach is Chairman of the Independent Trustees of the Equity and High Income Funds (2006-present). Mr. Lautenbach currently serves as the Lead Director of the Eaton Corporation Board of Directors (diversified industrial, 1997-present). Mr. Lautenbach is also a member of the Board of Directors of the Philharmonic Center for the Arts in Naples, Florida (1999-present); a member of the Board of Trustees of Fairfield University (2005-present); and a member of the Council on Foreign Relations (1994-present). Previously, Mr. Lautenbach was a Partner/Advisory Partner at Clayton, Dubilier & Rice, Inc. (private equity investment, 1998-2010), as well as a Director of Sony Corporation (2006-2007). |
Joseph Mauriello (66) | |
| Year of Election or Appointment: 2008 Prior to his retirement in January 2006, Mr. Mauriello served in numerous senior management positions including Deputy Chairman and Chief Operating Officer (2004-2005), and Vice Chairman of Financial Services (2002-2004) of KPMG LLP US (professional services, 1965-2005). Mr. Mauriello currently serves as a member of the Board of Directors of XL Group plc. (global insurance and re-insurance, 2006-present) and of Arcadia Resources Inc. (health care services and products, 2007- |
Cornelia M. Small (66) | |
| Year of Election or Appointment: 2005 Ms. Small is a member of the Board of Directors of the Teagle Foundation (2009-present). Ms. Small is also a member of the Investment Committee, and Chair (2008-present) and a member of the Board of Trustees of Smith College. In addition, Ms. Small serves on the Investment Committee of the Berkshire Taconic Community Foundation (2008- |
William S. Stavropoulos (71) | |
| Year of Election or Appointment: 2002 Mr. Stavropoulos is Vice Chairman of the Independent Trustees of the Equity and High Income Funds (2006-present). Mr. Stavropoulos serves as President and Founder of the Michigan Baseball Foundation, the Great Lakes Loons (2007-present). Mr. Stavropoulos is Chairman Emeritus of the Board of Directors of The Dow Chemical Company, where he previously served in numerous senior management positions, including President, CEO (1995-2000; 2002-2004), Chairman of the Executive Committee (2000-2006), and as a member of the Board of Directors (1990-2006). Currently, Mr. Stavropoulos is Chairman of Univar (global distributor of commodity and specialty chemicals, 2010-present), a Director of Teradata Corporation (data warehousing and technology solutions, 2008-present), Chemical Financial Corporation, Maersk Inc. (industrial conglomerate), Tyco International, Inc. (multinational manufacturing and services, 2007-present), and a member of the Advisory Board for Metalmark Capital (private equity investment, 2005- |
David M. Thomas (61) | |
| Year of Election or Appointment: 2008 Previously, Mr. Thomas served as Executive Chairman (2005-2006) and Chairman and Chief Executive Officer (2000-2005) of IMS Health, Inc. (pharmaceutical and healthcare information solutions). In addition, Mr. Thomas serves as a member of the Board of Directors of Fortune Brands, Inc. (consumer products), and Interpublic Group of Companies, Inc. (marketing communication, 2004-present). |
Michael E. Wiley (60) | |
| Year of Election or Appointment: 2008 Mr. Wiley also serves as a Director of Asia Pacific Exploration Consolidated (international oil and gas exploration and production, 2008-present). Mr. Wiley serves as a Director of Tesoro Corporation (independent oil refiner and marketer, 2005-present), and a Director of Bill Barrett Corporation (exploration and production, 2005-present). In addition, Mr. Wiley also serves as a Director of Post Oak Bank (privately-held bank, 2004-present). Previously, Mr. Wiley served as a member of the Board of Trustees of the University of Tulsa (2000-2006; 2007- |
Annual Report
+ The information above includes each Trustee's principal occupation during the last five years and other information relating to the experience, attributes, and skills relevant to each Trustee's qualifications to serve as a Trustee, which led to the conclusion that each Trustee should serve as a Trustee for the fund.
Advisory Board Members and Executive Officers:
Correspondence intended for each executive officer, Edward C. Johnson 3d, and Peter S. Lynch may be sent to Fidelity Investments, 82 Devonshire Street, Boston, Massachusetts 02109.
Name, Age; Principal Occupation | |
Edward C. Johnson 3d (80) | |
| Year of Election or Appointment: 2011 Member of the Advisory Board of Fidelity's Equity and High Income Funds. Formerly Trustee and Chairman of the Board of Trustees of certain Trusts, Mr. Johnson serves as Chief Executive Officer, Chairman, and a Director of FMR LLC; Chairman and a Director of FMR; and Chairman and a Director of FMR Co., Inc. In addition, Mr. Johnson serves as Chairman and Director of FIL Limited. Previously, Mr. Johnson served as President of FMR LLC (2006-2007). |
Peter S. Lynch (66) | |
| Year of Election or Appointment: 2003 Member of the Advisory Board of Fidelity's Equity and High Income Funds. Mr. Lynch is Vice Chairman and a Director of FMR and FMR Co., Inc. In addition, Mr. Lynch serves as a Trustee of Boston College and as the Chairman of the Inner-City Scholarship Fund. Previously, Mr. Lynch served on the Special Olympics International Board of Directors (1997-2006). |
Kenneth B. Robins (41) | |
| Year of Election or Appointment: 2008 President and Treasurer of Fidelity's Equity and High Income Funds. Mr. Robins also serves as President and Treasurer (2010-present) and Assistant Treasurer (2009-present) of other Fidelity funds and is an employee of Fidelity Investments (2004-present). Previously, Mr. Robins served as Deputy Treasurer of the Fidelity funds (2005-2008) and Treasurer and Chief Financial Officer of The North Carolina Capital Management Trust: Cash and Term Portfolios (2006-2008). |
Bruce T. Herring (45) | |
| Year of Election or Appointment: 2006 Vice President of certain Equity Funds. Mr. Herring also serves as Chief Investment Officer and Director of Fidelity Management & Research (U.K.) Inc. (2010-present) and Group Chief Investments Officer of FMR. Previously, Mr. Herring served as Vice President (2005-2006) and Senior Vice President (2006-2007) of Fidelity Management & Research Company, Vice President of FMR Co., Inc. (2001-2007) and as a portfolio manager for Fidelity U.S. Equity Funds. |
Brian B. Hogan (46) | |
| Year of Election or Appointment: 2009 Vice President of certain Equity Funds and Vice President of Sector Funds. Mr. Hogan also serves as President of FMR's Equity Division (2009-present). Previously, Mr. Hogan served as Senior Vice President, Equity Research of FMR (2006-2009) and as a portfolio manager. |
Scott C. Goebel (42) | |
| Year of Election or Appointment: 2008 Secretary and Chief Legal Officer (CLO) of the Fidelity funds. Mr. Goebel also serves as Secretary and CLO of The North Carolina Capital Management Trust: Cash and Term Portfolio (2008-present); General Counsel, Secretary, and Senior Vice President of FMR (2008-present) and FMR Co., Inc. (2008-present); Deputy General Counsel of FMR LLC; Chief Legal Officer of Fidelity Management & Research (Hong Kong) Limited (2008-present) and Assistant Secretary of Fidelity Management & Research (Japan) Inc. (2008-present), Fidelity Investments Money Management, Inc. (2008-present), Fidelity Management & Research (U.K.) Inc. (2008-present), and Fidelity Research and Analysis Company (2008-present). Previously, Mr. Goebel served as Assistant Secretary of the Funds (2007-2008) and as Vice President and Secretary of Fidelity Distributors Corporation (FDC) (2005-2007). |
William C. Coffey (41) | |
| Year of Election or Appointment: 2009 Assistant Secretary of Fidelity's Equity and High Income Funds. Mr. Coffey also serves as Senior Vice President and Deputy General Counsel of FMR LLC (2010-present), and is an employee of Fidelity Investments. Previously, Mr. Coffey served as Vice President and Associate General Counsel of FMR LLC (2005-2009). |
Holly C. Laurent (56) | |
| Year of Election or Appointment: 2008 Anti-Money Laundering (AML) Officer of the Fidelity funds. Ms. Laurent also serves as AML Officer of The North Carolina Capital Management Trust: Cash and Term Portfolio (2008-present) and is an employee of Fidelity Investments. Previously, Ms. Laurent was Senior Vice President and Head of Legal for Fidelity Business Services India Pvt. Ltd. (2006-2008), and Senior Vice President, Deputy General Counsel and Group Head for FMR LLC (2005-2006). |
Christine Reynolds (52) | |
| Year of Election or Appointment: 2008 Chief Financial Officer of the Fidelity funds. Ms. Reynolds became President of Fidelity Pricing and Cash Management Services (FPCMS) in August 2008. Ms. Reynolds served as Chief Operating Officer of FPCMS (2007-2008). Previously, Ms. Reynolds served as President, Treasurer, and Anti-Money Laundering officer of the Fidelity funds (2004-2007). |
Kenneth A. Rathgeber (63) | |
| Year of Election or Appointment: 2004 Chief Compliance Officer of Fidelity's Equity and High Income Funds. Mr. Rathgeber is Chief Compliance Officer of Fidelity Management & Research (Hong Kong) Limited (2008-present), Fidelity Management & Research (Japan) Inc. (2008-present), FMR (2005-present), FMR Co., Inc. (2005-present), Fidelity Management & Research (U.K.) Inc. (2005-present), Fidelity Research & Analysis Company (2005-present), Fidelity Investments Money Management, Inc. (2005-present), Pyramis Global Advisors, LLC (2005-present), and Strategic Advisers, Inc. (2005-present). |
Jeffrey S. Christian (49) | |
| Year of Election or Appointment: 2009 Deputy Treasurer of the Fidelity funds. Mr. Christian is an employee of Fidelity Investments. Previously, Mr. Christian served as Chief Financial Officer (2008-2009) of certain Fidelity funds and Senior Vice President of Fidelity Pricing and Cash Management Services (FPCMS) (2004-2009). |
Bryan A. Mehrmann (49) | |
| Year of Election or Appointment: 2005 Deputy Treasurer of the Fidelity funds. Mr. Mehrmann is an employee of Fidelity Investments. |
Adrien E. Deberghes (43) | |
| Year of Election or Appointment: 2008 Deputy Treasurer of Fidelity's Equity and High Income Funds. Mr. Deberghes also serves as Assistant Treasurer of other Fidelity funds (2010-present) and is an employee of Fidelity Investments (2008- |
Stephanie J. Dorsey (41) | |
| Year of Election or Appointment: 2010 Assistant Treasurer of Fidelity's Equity and High Income Funds. Ms. Dorsey also serves as Deputy Treasurer of other Fidelity funds (2008-present) and is an employee of Fidelity Investments (2008- |
John R. Hebble (52) | |
| Year of Election or Appointment: 2009 Assistant Treasurer of Fidelity's Equity and High Income Funds. Mr. Hebble also serves as Treasurer and Chief Financial Officer of The North Carolina Capital Management Trust: Cash and Term Portfolio (2008-present), President and Treasurer of other Fidelity funds (2008-present) and is an employee of Fidelity Investments. |
Gary W. Ryan (52) | |
| Year of Election or Appointment: 2005 Assistant Treasurer of the Fidelity funds. Mr. Ryan is an employee of Fidelity Investments. Previously, Mr. Ryan served as Vice President of Fund Reporting in Fidelity Pricing and Cash Management Services (FPCMS) (1999-2005). |
Jonathan Davis (42) | |
| Year of Election or Appointment: 2010 Assistant Treasurer of the Fidelity funds. Mr. Davis is an employee of Fidelity Investments. Previously, Mr. Davis served as Vice President and Associate General Counsel of FMR LLC (2003-2010). |
Annual Report
Distributions (Unaudited)
Class K designates 100% of the dividend distributed during the fiscal year as qualifying for the dividends-received deduction for corporate shareholders.
Class K designates 100%, of the dividend distributed during the fiscal year as amounts which may be taken into account as a dividend for the purposes of the maximum rate under section 1(h)(11) of the Internal Revenue Code.
The fund will notify shareholders in January 2011 of amounts for use in preparing 2010 income tax returns.
Annual Report
Board Approval of Investment Advisory Contracts and Management Fees
Fidelity Independence Fund
Each year, the Board of Trustees, including the Independent Trustees (together, the Board), votes on the renewal of the management contract and sub-advisory agreements (together, the Advisory Contracts) for the fund. The Board, assisted by the advice of fund counsel and Independent Trustees' counsel, requests and considers a broad range of information relevant to the renewal of the Advisory Contracts throughout the year.
The Board meets regularly and considers at each of its meetings factors that are relevant to its annual consideration of the renewal of the fund's Advisory Contracts, including the services and support provided to the fund and its shareholders. The Board has established various standing committees, each composed of Independent Trustees with varying backgrounds, to which the Board has assigned specific subject matter responsibilities in order to enhance effective decision-making by the Board. The Board, acting directly and through its Committees, requests and receives information concerning the annual consideration of the renewal of the fund's Advisory Contracts. The Board also meets as needed to consider matters specifically related to the Board's annual consideration of the renewal of Advisory Contracts. Members of the Board may also meet with trustees of other Fidelity funds through ad hoc joint committees to discuss certain matters relevant to the Fidelity funds.
At its July 2010 meeting, the Board of Trustees, including the Independent Trustees, unanimously determined to renew the fund's Advisory Contracts. In reaching its determination, the Board considered all factors it believed relevant, including (i) the nature, extent, and quality of the services to be provided to the fund and its shareholders (including the investment performance of the fund); (ii) the competitiveness of the fund's management fee and total expenses; (iii) the total costs of the services to be provided by and the profits to be realized by Fidelity from its relationship with the fund; (iv) the extent to which economies of scale would be realized as the fund grows; and (v) whether fee levels reflect these economies of scale, if any, for the benefit of fund shareholders.
In considering whether to renew the Advisory Contracts for the fund, the Board reached a determination, with the assistance of fund counsel and Independent Trustees' counsel and through the exercise of its business judgment, that the renewal of the Advisory Contracts is in the best interests of fund shareholders and that the compensation to be received by Fidelity under the management contract is fair and reasonable. The Board's decision to renew the Advisory Contracts was not based on any single factor noted above, but rather was based on a comprehensive consideration of all the information provided to the Board at its meetings throughout the year. The Board, in reaching its determination to renew the Advisory Contracts, is aware that shareholders in the fund have a broad range of investment choices available to them, including a wide choice among mutual funds offered by Fidelity's competitors, and that the fund's shareholders, with the opportunity to review and weigh the disclosure provided by the fund in its prospectus and other public disclosures, have chosen to invest in this fund, managed by Fidelity.
Annual Report
Board Approval of Investment Advisory Contracts and
Management Fees - continued
Nature, Extent, and Quality of Services Provided. The Board considered the staffing within the investment adviser, FMR, and the sub-advisers (together, the Investment Advisers), including the backgrounds of the fund's investment personnel and the fund's investment objective and discipline. The Independent Trustees also had discussions with senior management of Fidelity's investment operations and investment groups. The Board considered the structure of the portfolio manager compensation program and whether this structure provides appropriate incentives to act in the best interest of the fund.
Resources Dedicated to Investment Management and Support Services. The Board and the equity research subcommittee of the Board's Fund Oversight Committee reviewed the size, education, and experience of the Investment Advisers' investment staff, their use of technology, and the Investment Advisers' approach to recruiting, training, and retaining portfolio managers and other research, advisory, and management personnel. The Board noted that Fidelity's analysts have access to a variety of technological tools and market and securities data that enable them to perform both fundamental and quantitative analysis and to specialize in various disciplines. The Board considered Fidelity's extensive global research capabilities that enable the Investment Advisers to aggregate data from various sources in an effort to produce positive investment results. The Board also considered that Fidelity's portfolio managers and analysts have access to daily portfolio attribution that allows for monitoring of a fund's portfolio, as well as an electronic communication system that provides immediate real-time access to research concerning issuers and credit enhancers. The Board noted FMR's continued focus on strengthening the organization and discipline of equity portfolio management and research.
Shareholder and Administrative Services. The Board considered (i) the nature, extent, quality, and cost of advisory, administrative, and shareholder services performed by the Investment Advisers and their affiliates under the Advisory Contracts and under separate agreements covering transfer agency, pricing and bookkeeping, and securities lending services for the fund; (ii) the nature and extent of the investment adviser's supervision of third party service providers, principally custodians and subcustodians; and (iii) the resources devoted to, and the record of compliance with, the fund's compliance policies and procedures. The Board also reviewed the allocation of fund brokerage, including allocations to brokers affiliated with the Investment Advisers, the use of brokerage commissions to pay fund expenses, and the use of "soft" commission dollars to pay for research services.
The Board noted that the growth of fund assets over time across the complex allows Fidelity to reinvest in the development of services designed to enhance the value or convenience of the Fidelity funds as investment vehicles. These services include 24-hour access to account information and market information through phone representatives and over the Internet, and investor education materials and asset allocation tools.
Annual Report
Investment in a Large Fund Family. The Board considered the benefits to shareholders of investing in a Fidelity fund, including the benefits of investing in a fund that is part of a large family of funds offering a variety of investment disciplines and providing a large variety of mutual fund investor services. The Board noted that Fidelity had taken, or had made recommendations that resulted in the Fidelity funds taking, a number of actions over the previous year that benefited particular funds, including (i) dedicating additional resources to investment research and restructuring and broadening the focus of the investment research teams; (ii) bolstering the senior management team that oversees asset management; (iii) launching Class F of certain funds as a lower-fee class available to Freedom K and Freedom Index Funds; (iv) lowering the initial investment minimums and ongoing balance requirements for Real Estate High Income Fund; (v) eliminating subsequent purchase minimums for all funds and adding a waiver of the investment minimum requirement for new accounts opened with the proceeds of a systematic withdrawal plan; (vi) eliminating the withdrawal minimum and maximum limits for systematic withdrawals from Advisor funds; (vii) expanding sales load waivers on Class A shares for Destiny Planholders and expanding Institutional Class eligibility for Class O Destiny Planholders; and (viii) changing certain Class A and Class T sales charge structures to further align them with industry practices.
Investment Performance. The Board considered whether the fund has operated in accordance with its investment objective, as well as its record of compliance with its investment restrictions. It also reviewed the fund's absolute investment performance for each class, as well as the fund's relative investment performance for each class measured over multiple periods against (i) a broad-based securities market index, and (ii) a custom peer group of mutual funds deemed appropriate by Fidelity and reviewed by the Board. The following charts considered by the Board show, over the one-, three-, and five-year periods ended December 31, 2009, as available, the cumulative total returns of Class K and the retail class of the fund, the cumulative total returns of a broad-based securities market index ("benchmark"), and a range of cumulative total returns of a custom peer group of mutual funds defined by FMR based on categories assigned by Morningstar, Inc. The box within each chart shows the 25th percentile return (bottom of box) and the 75th percentile return (top of box) of the peer group. Returns shown above the box are in the first quartile and returns shown below the box are in the fourth quartile. The percentage beaten numbers noted below each chart correspond to the percentile box and represent the percentage of funds in the peer group whose performance was equal to or lower than that of the class indicated. The fund's custom peer group, defined by FMR, is a peer group that FMR believes provides a more meaningful performance comparison than the peer group assigned by Morningstar, Inc., which assigns mutual funds to categories based on their investment styles as measured by their underlying portfolio holdings.
Annual Report
Board Approval of Investment Advisory Contracts and
Management Fees - continued
Fidelity Independence Fund
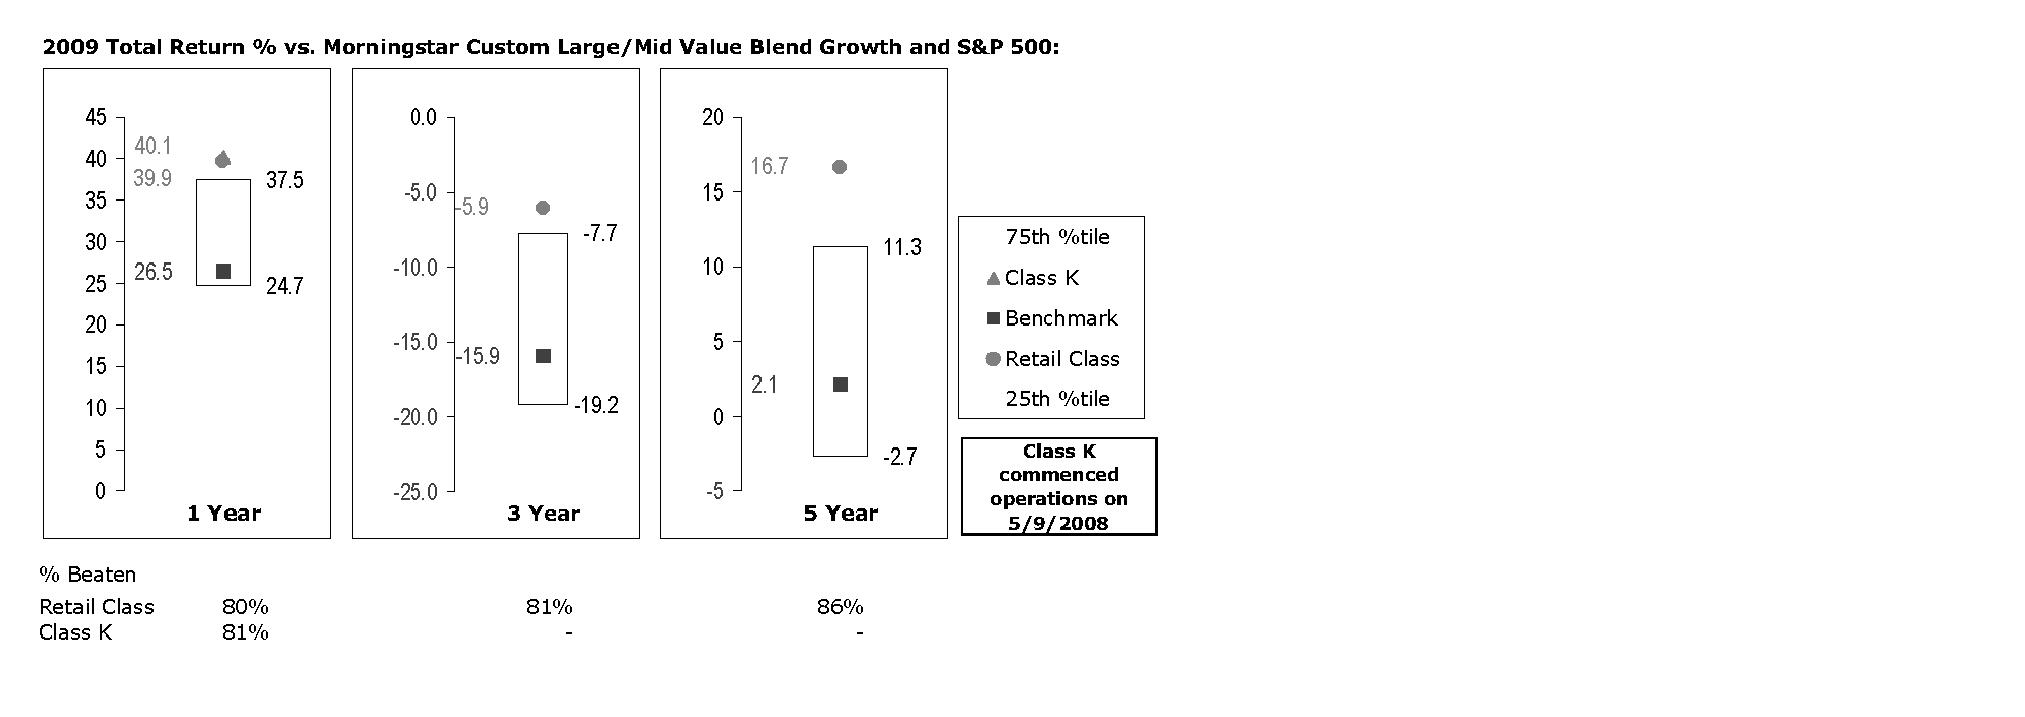
The Board reviewed the fund's relative investment performance against its peer group and noted that the performance of the retail class of the fund (the class with the longer performance record) was in the first quartile for all the periods shown. The Board also noted that the investment performance of the retail class of the fund compared favorably to its benchmark for all the periods shown. The Board considered that the variations in performance between the fund's classes reflect the variations in class expenses, which result in lower performance for the higher expense class. The Board also reviewed the fund's performance since inception as well as performance in the current year.
The Board also considered that the fund's management fee is subject to upward or downward adjustment depending upon whether, and to what extent, the fund's investment performance for the performance period exceeds, or is exceeded by, the record (over the same period) of a Board-approved performance adjustment index. The Board realizes that the performance adjustment provides FMR with a strong economic incentive to seek to achieve superior performance for the fund's shareholders and helps to more closely align the interests of FMR and the fund's shareholders.
Based on its review, and giving particular weight to the nature and quality of the resources dedicated by the Investment Advisers to maintain and improve relative performance and factoring in the unprecedented market events in recent years, the Board concluded that the nature, extent, and quality of investment management and support services and of shareholder and administrative services provided to the fund will benefit the fund's shareholders, particularly in light of the Board's view that the fund's shareholders benefit from investing in a fund that is part of a large family of funds offering a variety of investment disciplines and services.
Annual Report
Competitiveness of Management Fee and Total Fund Expenses. The Board considered the fund's management fee and total expenses compared to "mapped groups" of competitive funds and classes. Fidelity creates "mapped groups" by combining similar Lipper investment objective categories that have comparable management fee characteristics. Combining Lipper investment objective categories aids the Board's management fee and total expense comparisons by broadening the competitive group used for comparison and by reducing the number of universes to which various Fidelity funds are compared.
Management Fee. The Board considered two proprietary management fee comparisons for the 12-month periods shown in the chart below. The group of Lipper funds used by the Board for management fee comparisons is referred to below as the "Total Mapped Group." The Total Mapped Group comparison focuses on a fund's standing relative to the total universe of comparable funds available to investors, in terms of gross management fees before expense reimbursements or caps, and without giving effect to the fund's performance adjustment. "TMG %" represents the percentage of funds in the Total Mapped Group that had management fees that were lower than the fund's. For example, a TMG % of 10% means that 90% of the funds in the Total Mapped Group had higher management fees than the fund. The "Asset-Size Peer Group" (ASPG) comparison focuses on a fund's standing relative to non-Fidelity funds similar in size to the fund within the Total Mapped Group. The ASPG represents at least 15% of the funds in the Total Mapped Group with comparable asset size and management fee characteristics, subject to a minimum of 50 funds (or all funds in the Total Mapped Group if fewer than 50). Additional information, such as the ASPG quartile in which the fund's management fee ranked and the impact of the fund's performance adjustment, is also included in the chart and considered by the Board.
Annual Report
Board Approval of Investment Advisory Contracts and
Management Fees - continued
Fidelity Independence Fund

The Board noted that the fund's management fee ranked below the median of its Total Mapped Group and below the median of its ASPG for 2009. The Board also noted the effect of the fund's positive performance adjustment on the fund's management fee ranking. The Board noted that the performance adjustment for each year represents calculations for performance periods that differ from the periods shown in the performance charts above.
Based on its review, the Board concluded that the fund's management fee is fair and reasonable in light of the services that the fund receives and the other factors considered.
Total Expenses. In its review of each class's total expenses, the Board considered the fund's management fee as well as other fund or class expenses, as applicable, such as transfer agent fees, pricing and bookkeeping fees, and custodial, legal, and audit fees. The Board also noted the effects of any waivers and reimbursements on fees and expenses, as well as the impact of the fund's performance adjustment. As part of its review, the Board also considered current and historical total expenses of each class of the fund compared to competitive fund median expenses. Each class of the fund is compared to those funds and classes in the Total Mapped Group (used by the Board for management fee comparisons) that have a similar sales load structure.
The Board noted that the total expenses of each class ranked below its competitive median for 2009.
Annual Report
Fees Charged to Other Fidelity Clients. The Board also considered Fidelity fee structures and other information with respect to clients of FMR and its affiliates, such as other mutual funds advised or subadvised by FMR or its affiliates, pension plan clients, and other institutional clients. In March 2010, the Board created an ad hoc joint committee with the board of other Fidelity funds (the Committee) to review and compare Fidelity's institutional investment advisory business with its business of providing services to the Fidelity funds, including the differences in services provided, fees charged, and costs incurred, as well as competition in their respective marketplaces.
Based on its review of total expenses and fees charged to other Fidelity clients, the Board concluded that the total expenses of each class of the fund were reasonable in light of the services that the fund and its shareholders receive and the other factors considered, including the findings of the Committee.
Costs of the Services and Profitability. The Board considered the revenues earned and the expenses incurred by Fidelity in conducting the business of developing, marketing, distributing, managing, administering and servicing the fund and its shareholders. The Board also considered the level of Fidelity's profits in respect of all the Fidelity funds.
On an annual basis, FMR presents to the Board Fidelity's profitability for the fund. Fidelity calculates the profitability for each fund, as well as aggregate profitability for groups of Fidelity funds and all Fidelity funds, using a series of detailed revenue and cost allocation methodologies which originate with the audited books and records of Fidelity. The Audit Committee of the Board reviews any significant changes from the prior year's methodologies.
PricewaterhouseCoopers LLP (PwC), independent registered public accounting firm and auditor to Fidelity and certain Fidelity funds, has been engaged annually by the Board as part of the Board's assessment of Fidelity's profitability analysis. PwC's engagement includes the review and assessment of Fidelity's methodologies used in determining the revenues and expenses attributable to Fidelity's mutual fund business, and completion of agreed-upon procedures surrounding the mathematical accuracy of fund profitability and its conformity to allocation methodologies. After considering PwC's reports issued under the engagement and information provided by Fidelity, the Board believes that while other allocation methods may also be reasonable, Fidelity's profitability methodologies are reasonable in all material respects.
The Board has also reviewed Fidelity's non-fund businesses and fall-out benefits related to the mutual fund business as well as cases where Fidelity's affiliates may benefit from or be related to the fund's business.
Annual Report
Board Approval of Investment Advisory Contracts and
Management Fees - continued
The Board considered the costs of the services provided by and the profits realized by Fidelity in connection with the operation of the fund and were satisfied that the profitability was not excessive in the circumstances.
Economies of Scale. The Board considered whether there have been economies of scale in respect of the management of the Fidelity funds, whether the Fidelity funds (including the fund) have appropriately benefited from any such economies of scale, and whether there is potential for realization of any further economies of scale. The Board considered the extent to which the fund will benefit from economies of scale through increased services to the fund, through waivers or reimbursements, or through fee or expense reductions.
In February 2009, the Board and the board of other Fidelity funds created an ad hoc committee (the Economies of Scale Committee) to analyze whether FMR attains economies of scale in respect of the management and servicing of the Fidelity funds, whether the Fidelity funds have appropriately benefited from such economies of scale, and whether there is potential for realization of any further economies of scale.
The Board recognized that the fund's management contract incorporates a "group fee" structure, which provides for lower group fee rates as total fund assets under FMR's management increase, and for higher group fee rates as total fund assets under FMR's management decrease. FMR calculates the group fee rates based on a tiered asset "breakpoint" schedule that varies based on asset class. The Board considered that the group fee is designed to deliver the benefits of economies of scale to fund shareholders when total Fidelity fund assets increase, even if assets of any particular fund are unchanged or have declined, because some portion of Fidelity's costs are attributable to services provided to all Fidelity funds, and all funds benefit if those costs can be allocated among more assets. The Board concluded that, given the group fee structure, fund shareholders will benefit from lower management fees as assets under FMR's management increase at the fund complex level, regardless of whether Fidelity achieves any such economies of scale.
The Board concluded, considering the findings of the Economies of Scale Committee, that any potential economies of scale are being appropriately shared between fund shareholders and Fidelity.
Additional Information Requested by the Board. In order to develop fully the factual basis for consideration of the Fidelity funds' Advisory Contracts, the Board requested and received additional information on certain topics, including (i) fund performance trends, actions to be taken by FMR to improve certain funds' overall performance, and Fidelity's long-term strategies for certain funds; (ii) portfolio manager changes that have occurred during the past year and length of portfolio manager tenure for different categories of funds over time; (iii) Fidelity's compensation structure for portfolio managers, research analysts, and other key personnel, the rationale for the compensation structure, and how the compensation structure provides appropriate performance incentives; (iv) the amount of the investment that each portfolio manager has made in the Fidelity fund(s) that he or she manages; (v) management and other fees paid by FMR to affiliated sub-advisers on behalf of the Fidelity funds; (vi) Fidelity's fee structures and rationale for recommending different fees among different categories of funds; (vii) Fidelity's rationale for recommending which funds should have a performance adjustment component as part of their management fees; (viii) the rationale for any differences between fund fee structures and fee structures in place for other Fidelity clients; and (ix) explanations regarding the relative total expenses borne by certain funds and classes, total expense competitive trends, and actions that might be taken by FMR to reduce total expenses for certain funds and classes.
Annual Report
Based on its evaluation of all of the conclusions noted above, and after considering all factors it believed relevant, the Board ultimately concluded that the advisory fee structures are fair and reasonable, and that the fund's Advisory Contracts should be renewed.
Annual Report
Investment Adviser
Fidelity Management & Research Company
Boston, MA
Investment Sub-Advisers
FMR Co., Inc.
Fidelity Management & Research
(U.K.) Inc.
Fidelity Research & Analysis Company
Fidelity Management & Research
(Hong Kong) Limited
Fidelity Management & Research
(Japan) Inc.
General Distributor
Fidelity Distributors Corporation
Boston, MA
Transfer and Service Agents
Fidelity Investments Institutional
Operations Company, Inc.
Boston, MA
Fidelity Service Company, Inc.
Boston, MA
Custodian
The Northern Trust Company
Chicago, Illinois
FRE-K-UANN-0111
1.863212.102
Item 2. Code of Ethics
As of the end of the period, November 30, 2010, Fidelity Financial Trust (the trust) has adopted a code of ethics, as defined in Item 2 of Form N-CSR, that applies to its President and Treasurer and its Chief Financial Officer. A copy of the code of ethics is filed as an exhibit to this Form N-CSR.
Item 3. Audit Committee Financial Expert
The Board of Trustees of the trust has determined that Joseph Mauriello is an audit committee financial expert, as defined in Item 3 of Form N-CSR. Mr. Mauriello is independent for purposes of Item 3 of Form N-CSR.
Item 4. Principal Accountant Fees and Services
Fees and Services
The following table presents fees billed by PricewaterhouseCoopers LLP ("PwC") in each of the last two fiscal years for services rendered to Fidelity Convertible Securities Fund, Fidelity Equity-Income Fund II, and Fidelity Independence Fund (the "Funds"):
Services Billed by PwC
November 30, 2010 FeesA
| Audit Fees | Audit-Related Fees | Tax Fees | All Other Fees |
Fidelity Convertible Securities Fund | $70,000 | $- | $3,200 | $3,000 |
Fidelity Equity-Income Fund II | $63,000 | $- | $4,100 | $4,500 |
Fidelity Independence Fund | $61,000 | $- | $3,200 | $3,800 |
November 30, 2009 FeesA
| Audit Fees | Audit-Related Fees | Tax Fees | All Other Fees |
Fidelity Convertible Securities Fund | $74,000 | $- | $3,200 | $2,900 |
Fidelity Equity-Income Fund II | $67,000 | $- | $4,200 | $5,300 |
Fidelity Independence Fund | $63,000 | $- | $3,200 | $4,200 |
A Amounts may reflect rounding.
The following table presents fees billed by PwC that were required to be approved by the Audit Committee for services that relate directly to the operations and financial reporting of the Funds and that are rendered on behalf of Fidelity Management & Research Company ("FMR") and entities controlling, controlled by, or under common control with FMR (not including any sub-adviser whose role is primarily portfolio management and is subcontracted with or overseen by another investment adviser) that provide ongoing services to the Funds ("Fund Service Providers"):
Services Billed by PwC
| November 30, 2010A | November 30, 2009A |
Audit-Related Fees | $2,605,000 | $2,755,000 |
Tax Fees | $- | $- |
All Other Fees | $510,000 | $- |
A Amounts may reflect rounding.
"Audit-Related Fees" represent fees billed for assurance and related services that are reasonably related to the performance of the fund audit or the review of the fund's financial statements and that are not reported under Audit Fees.
"Tax Fees" represent fees billed for tax compliance, tax advice or tax planning that relate directly to the operations and financial reporting of the fund.
"All Other Fees" represent fees billed for services provided to the fund or Fund Service Provider, a significant portion of which are assurance related, that relate directly to the operations and financial reporting of the fund, excluding those services that are reported under Audit Fees, Audit-Related Fees or Tax Fees.
Assurance services must be performed by an independent public accountant.
* * *
The aggregate non-audit fees billed by PwC for services rendered to the Funds, FMR (not including any sub-adviser whose role is primarily portfolio management and is subcontracted with or overseen by another investment adviser), and any Fund Service Provider for each of the last two fiscal years of the Funds are as follows:
Billed By | November 30, 2010 A | November 30, 2009 A |
PwC | $4,725,000 | $4,435,000 |
A Amounts may reflect rounding.
The trust's Audit Committee has considered non-audit services that were not pre-approved that were provided by PwC to Fund Service Providers to be compatible with maintaining the independence of PwC in its audit of the Funds, taking into account representations from PwC, in accordance with Public Company Accounting Oversight Board rules, regarding its independence from the Funds and their related entities and FMR's review of the appropriateness and permissibility under applicable law of such non-audit services prior to their provision to the Fund Service Providers.
Audit Committee Pre-Approval Policies and Procedures
The trust's Audit Committee must pre-approve all audit and non-audit services provided by a fund's independent registered public accounting firm relating to the operations or financial reporting of the fund. Prior to the commencement of any audit or non-audit services to a fund, the Audit Committee reviews the services to determine whether they are appropriate and permissible under applicable law.
The Audit Committee has adopted policies and procedures to, among other purposes, provide a framework for the Committee's consideration of non-audit services by the audit firms that audit the Fidelity funds. The policies and procedures require that any non-audit service provided by a fund audit firm to a Fidelity fund and any non-audit service provided by a fund auditor to a Fund Service Provider that relates directly to the operations and financial reporting of a Fidelity fund ("Covered Service") are subject to approval by the Audit Committee before such service is provided.
All Covered Services must be approved in advance of provision of the service either: (i) by formal resolution of the Audit Committee, or (ii) by oral or written approval of the service by the Chair of the Audit Committee (or if the Chair is unavailable, such other member of the Audit Committee as may be designated by the Chair to act in the Chair's absence). The approval contemplated by (ii) above is permitted where the Treasurer determines that action on such an engagement is necessary before the next meeting of the Audit Committee.
Non-audit services provided by a fund audit firm to a Fund Service Provider that do not relate directly to the operations and financial reporting of a Fidelity fund are reported to the Audit Committee on a periodic basis.
Non-Audit Services Approved Pursuant to Rule 2-01(c)(7)(i)(C) and (ii) of Regulation S-X ("De Minimis Exception")
There were no non-audit services approved or required to be approved by the Audit Committee pursuant to the De Minimis Exception during the Funds' last two fiscal years relating to services provided to (i) the Funds or (ii) any Fund Service Provider that relate directly to the operations and financial reporting of the Funds.
Item 5. Audit Committee of Listed Registrants
Not applicable.
Item 6. Investments
(a) Not applicable.
(b) Not applicable
Item 7. Disclosure of Proxy Voting Policies and Procedures for Closed-End Management Investment Companies
Not applicable.
Item 8. Portfolio Managers of Closed-End Management Investment Companies
Not applicable.
Item 9. Purchase of Equity Securities by Closed-End Management Investment Company and Affiliated Purchasers
Not applicable.
Item 10. Submission of Matters to a Vote of Security Holders
There were no material changes to the procedures by which shareholders may recommend nominees to the trust's Board of Trustees.
Item 11. Controls and Procedures
(a)(i) The President and Treasurer and the Chief Financial Officer have concluded that the trust's disclosure controls and procedures (as defined in Rule 30a-3(c) under the Investment Company Act) provide reasonable assurances that material information relating to the trust is made known to them by the appropriate persons, based on their evaluation of these controls and procedures as of a date within 90 days of the filing date of this report.
(a)(ii) There was no change in the trust's internal control over financial reporting (as defined in Rule 30a-3(d) under the Investment Company Act) that occurred during the second fiscal quarter of the period covered by this report that has materially affected, or is reasonably likely to materially affect, the trust's internal control over financial reporting.
Item 12. Exhibits
(a) | (1) | Code of Ethics pursuant to Item 2 of Form N-CSR is filed and attached hereto as EX-99.CODE ETH. |
(a) | (2) | Certification pursuant to Rule 30a-2(a) under the Investment Company Act of 1940 (17 CFR 270.30a-2(a)) is filed and attached hereto as Exhibit 99.CERT. |
(a) | (3) | Not applicable. |
(b) |
| Certification pursuant to Rule 30a-2(b) under the Investment Company Act of 1940 (17 CFR 270.30a-2(b)) is furnished and attached hereto as Exhibit 99.906CERT. |
SIGNATURES
Pursuant to the requirements of the Securities Exchange Act of 1934 and the Investment Company Act of 1940, the registrant has duly caused this report to be signed on its behalf by the undersigned, thereunto duly authorized.
Fidelity Financial Trust
By: | /s/Kenneth B. Robins |
| Kenneth B. Robins |
| President and Treasurer |
|
|
Date: | January 27, 2011 |
Pursuant to the requirements of the Securities Exchange Act of 1934 and the Investment Company Act of 1940, this report has been signed below by the following persons on behalf of the registrant and in the capacities and on the dates indicated.
By: | /s/Kenneth B. Robins |
| Kenneth B. Robins |
| President and Treasurer |
|
|
Date: | January 27, 2011 |
By: | /s/Christine Reynolds |
| Christine Reynolds |
| Chief Financial Officer |
|
|
Date: | January 27, 2011 |