October 17, 2012 Bank of America 3Q12 Financial Results
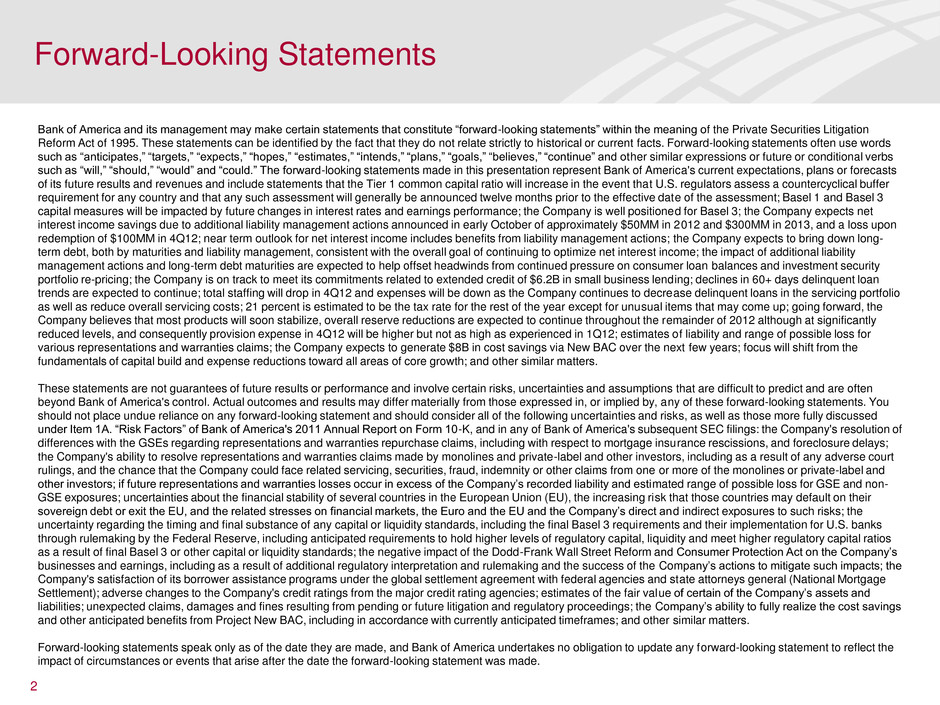
Bank of America and its management may make certain statements that constitute “forward-looking statements” within the meaning of the Private Securities Litigation Reform Act of 1995. These statements can be identified by the fact that they do not relate strictly to historical or current facts. Forward-looking statements often use words such as “anticipates,” “targets,” “expects,” “hopes,” “estimates,” “intends,” “plans,” “goals,” “believes,” “continue” and other similar expressions or future or conditional verbs such as “will,” “should,” “would” and “could.” The forward-looking statements made in this presentation represent Bank of America's current expectations, plans or forecasts of its future results and revenues and include statements that the Tier 1 common capital ratio will increase in the event that U.S. regulators assess a countercyclical buffer requirement for any country and that any such assessment will generally be announced twelve months prior to the effective date of the assessment; Basel 1 and Basel 3 capital measures will be impacted by future changes in interest rates and earnings performance; the Company is well positioned for Basel 3; the Company expects net interest income savings due to additional liability management actions announced in early October of approximately $50MM in 2012 and $300MM in 2013, and a loss upon redemption of $100MM in 4Q12; near term outlook for net interest income includes benefits from liability management actions; the Company expects to bring down long- term debt, both by maturities and liability management, consistent with the overall goal of continuing to optimize net interest income; the impact of additional liability management actions and long-term debt maturities are expected to help offset headwinds from continued pressure on consumer loan balances and investment security portfolio re-pricing; the Company is on track to meet its commitments related to extended credit of $6.2B in small business lending; declines in 60+ days delinquent loan trends are expected to continue; total staffing will drop in 4Q12 and expenses will be down as the Company continues to decrease delinquent loans in the servicing portfolio as well as reduce overall servicing costs; 21 percent is estimated to be the tax rate for the rest of the year except for unusual items that may come up; going forward, the Company believes that most products will soon stabilize, overall reserve reductions are expected to continue throughout the remainder of 2012 although at significantly reduced levels, and consequently provision expense in 4Q12 will be higher but not as high as experienced in 1Q12; estimates of liability and range of possible loss for various representations and warranties claims; the Company expects to generate $8B in cost savings via New BAC over the next few years; focus will shift from the fundamentals of capital build and expense reductions toward all areas of core growth; and other similar matters. These statements are not guarantees of future results or performance and involve certain risks, uncertainties and assumptions that are difficult to predict and are often beyond Bank of America's control. Actual outcomes and results may differ materially from those expressed in, or implied by, any of these forward-looking statements. You should not place undue reliance on any forward-looking statement and should consider all of the following uncertainties and risks, as well as those more fully discussed under Item 1A. “Risk Factors” of Bank of America's 2011 Annual Report on Form 10-K, and in any of Bank of America's subsequent SEC filings: the Company's resolution of differences with the GSEs regarding representations and warranties repurchase claims, including with respect to mortgage insurance rescissions, and foreclosure delays; the Company's ability to resolve representations and warranties claims made by monolines and private-label and other investors, including as a result of any adverse court rulings, and the chance that the Company could face related servicing, securities, fraud, indemnity or other claims from one or more of the monolines or private-label and other investors; if future representations and warranties losses occur in excess of the Company’s recorded liability and estimated range of possible loss for GSE and non- GSE exposures; uncertainties about the financial stability of several countries in the European Union (EU), the increasing risk that those countries may default on their sovereign debt or exit the EU, and the related stresses on financial markets, the Euro and the EU and the Company’s direct and indirect exposures to such risks; the uncertainty regarding the timing and final substance of any capital or liquidity standards, including the final Basel 3 requirements and their implementation for U.S. banks through rulemaking by the Federal Reserve, including anticipated requirements to hold higher levels of regulatory capital, liquidity and meet higher regulatory capital ratios as a result of final Basel 3 or other capital or liquidity standards; the negative impact of the Dodd-Frank Wall Street Reform and Consumer Protection Act on the Company’s businesses and earnings, including as a result of additional regulatory interpretation and rulemaking and the success of the Company’s actions to mitigate such impacts; the Company's satisfaction of its borrower assistance programs under the global settlement agreement with federal agencies and state attorneys general (National Mortgage Settlement); adverse changes to the Company's credit ratings from the major credit rating agencies; estimates of the fair value of certain of the Company’s assets and liabilities; unexpected claims, damages and fines resulting from pending or future litigation and regulatory proceedings; the Company’s ability to fully realize the cost savings and other anticipated benefits from Project New BAC, including in accordance with currently anticipated timeframes; and other similar matters. Forward-looking statements speak only as of the date they are made, and Bank of America undertakes no obligation to update any forward-looking statement to reflect the impact of circumstances or events that arise after the date the forward-looking statement was made. 2 Forward-Looking Statements
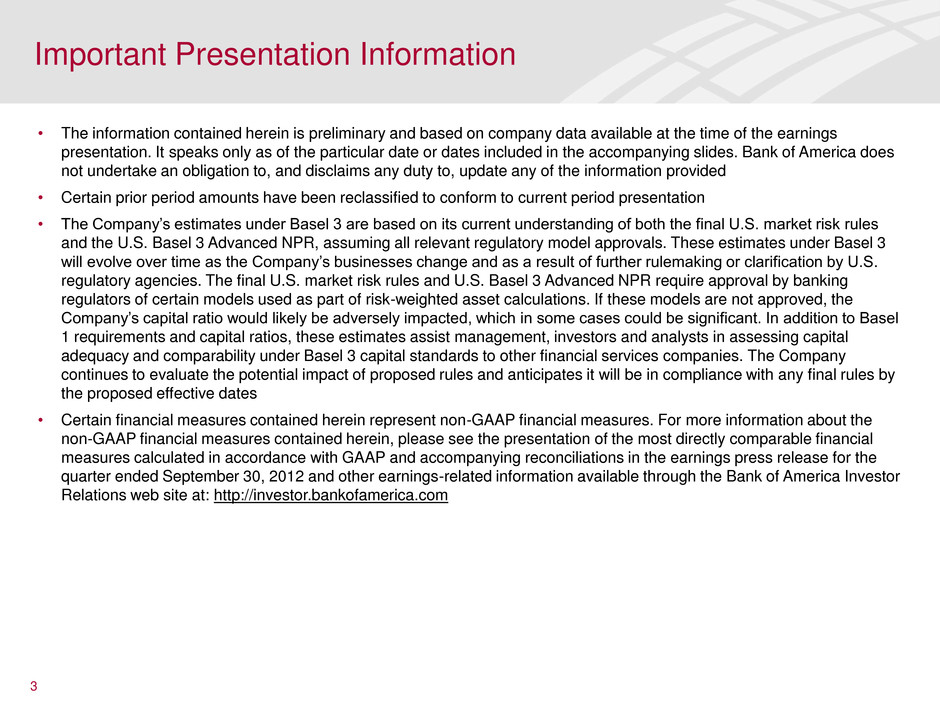
• The information contained herein is preliminary and based on company data available at the time of the earnings presentation. It speaks only as of the particular date or dates included in the accompanying slides. Bank of America does not undertake an obligation to, and disclaims any duty to, update any of the information provided • Certain prior period amounts have been reclassified to conform to current period presentation • The Company’s estimates under Basel 3 are based on its current understanding of both the final U.S. market risk rules and the U.S. Basel 3 Advanced NPR, assuming all relevant regulatory model approvals. These estimates under Basel 3 will evolve over time as the Company’s businesses change and as a result of further rulemaking or clarification by U.S. regulatory agencies. The final U.S. market risk rules and U.S. Basel 3 Advanced NPR require approval by banking regulators of certain models used as part of risk-weighted asset calculations. If these models are not approved, the Company’s capital ratio would likely be adversely impacted, which in some cases could be significant. In addition to Basel 1 requirements and capital ratios, these estimates assist management, investors and analysts in assessing capital adequacy and comparability under Basel 3 capital standards to other financial services companies. The Company continues to evaluate the potential impact of proposed rules and anticipates it will be in compliance with any final rules by the proposed effective dates • Certain financial measures contained herein represent non-GAAP financial measures. For more information about the non-GAAP financial measures contained herein, please see the presentation of the most directly comparable financial measures calculated in accordance with GAAP and accompanying reconciliations in the earnings press release for the quarter ended September 30, 2012 and other earnings-related information available through the Bank of America Investor Relations web site at: http://investor.bankofamerica.com 3 Important Presentation Information
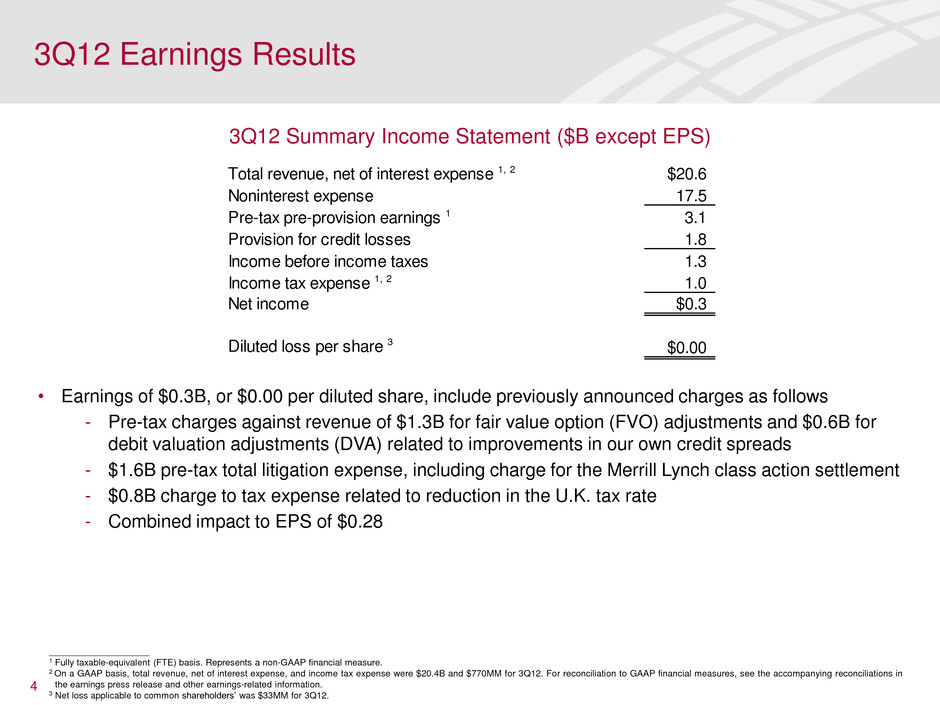
3Q12 Earnings Results 4 3Q12 Summary Income Statement ($B except EPS) ____________________ 1 Fully taxable-equivalent (FTE) basis. Represents a non-GAAP financial measure. 2 On a GAAP basis, total revenue, net of interest expense, and income tax expense were $20.4B and $770MM for 3Q12. For reconciliation to GAAP financial measures, see the accompanying reconciliations in the earnings press release and other earnings-related information. 3 Net loss applicable to common shareholders’ was $33MM for 3Q12. Total revenue, net of interest expense 1, 2 $20.6 Noninterest expense 17.5 Pre-tax pre-provision earnings 1 3.1 Provision for credit losses 1.8 Income before income taxes 1.3 Income tax expense 1, 2 1.0 Net income $0.3 Diluted loss per share 3 $0.00 • Earnings of $0.3B, or $0.00 per diluted share, include previously announced charges as follows Pre-tax charges against revenue of $1.3B for fair value option (FVO) adjustments and $0.6B for debit valuation adjustments (DVA) related to improvements in our own credit spreads $1.6B pre-tax total litigation expense, including charge for the Merrill Lynch class action settlement $0.8B charge to tax expense related to reduction in the U.K. tax rate Combined impact to EPS of $0.28
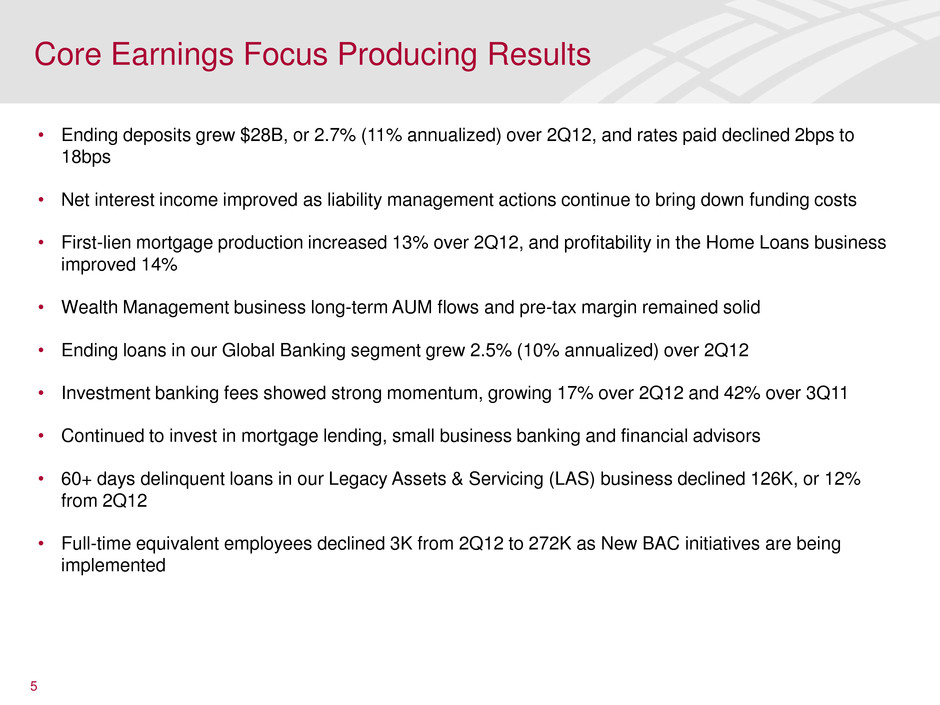
Core Earnings Focus Producing Results 5 • Ending deposits grew $28B, or 2.7% (11% annualized) over 2Q12, and rates paid declined 2bps to 18bps • Net interest income improved as liability management actions continue to bring down funding costs • First-lien mortgage production increased 13% over 2Q12, and profitability in the Home Loans business improved 14% • Wealth Management business long-term AUM flows and pre-tax margin remained solid • Ending loans in our Global Banking segment grew 2.5% (10% annualized) over 2Q12 • Investment banking fees showed strong momentum, growing 17% over 2Q12 and 42% over 3Q11 • Continued to invest in mortgage lending, small business banking and financial advisors • 60+ days delinquent loans in our Legacy Assets & Servicing (LAS) business declined 126K, or 12% from 2Q12 • Full-time equivalent employees declined 3K from 2Q12 to 272K as New BAC initiatives are being implemented
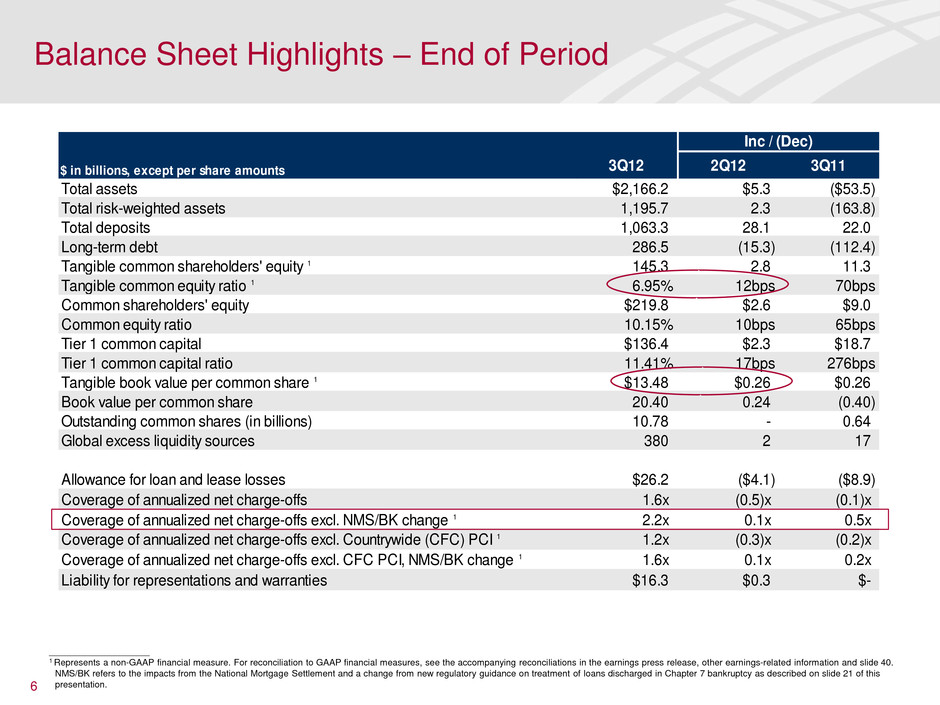
$ in billions, except per share amounts 3Q12 2Q12 3Q11 Total assets $2,166.2 $5.3 ($53.5) Total risk-weighted assets 1,195.7 2.3 (163.8) Total deposits 1,063.3 28.1 22.0 Long-term debt 286.5 (15.3) (112.4) Tangible common shareholders' equity 1 145.3 2.8 11.3 Tangible common equity ratio 1 6.95% 12bps 70bps Common shareholders' equity $219.8 $2.6 $9.0 Common equity ratio 10.15% 10bps 65bps Tier 1 common capital $136.4 $2.3 $18.7 Tier 1 common capital ratio 11.41% 17bps 276bps Tangible book value per common share 1 $13.48 $0.26 $0.26 Book value per common share 20.40 0.24 (0.40) Outstanding common shares (in billions) 10.78 - 0.64 Global excess liquidity sources 380 2 17 Allowance for loan and lease losses $26.2 ($4.1) ($8.9) Coverage of annualized net charge-offs 1.6x (0.5)x (0.1)x Coverage of annualized net charge-offs excl. NMS/BK change 1 2.2x 0.1x 0.5x Coverage of annualized net charge-offs excl. Countrywide (CFC) PCI 1 1.2x (0.3)x (0.2)x Coverage of annualized net charge-offs excl. CFC PCI, NMS/BK change 1 1.6x 0.1x 0.2x Liability for representations and warranties $16.3 $0.3 $- Inc / (Dec) ____________________ 1 Represents a non-GAAP financial measure. For reconciliation to GAAP financial measures, see the accompanying reconciliations in the earnings press release, other earnings-related information and slide 40. NMS/BK refers to the impacts from the National Mortgage Settlement and a change from new regulatory guidance on treatment of loans discharged in Chapter 7 bankruptcy as described on slide 21 of this presentation. 6 Balance Sheet Highlights – End of Period
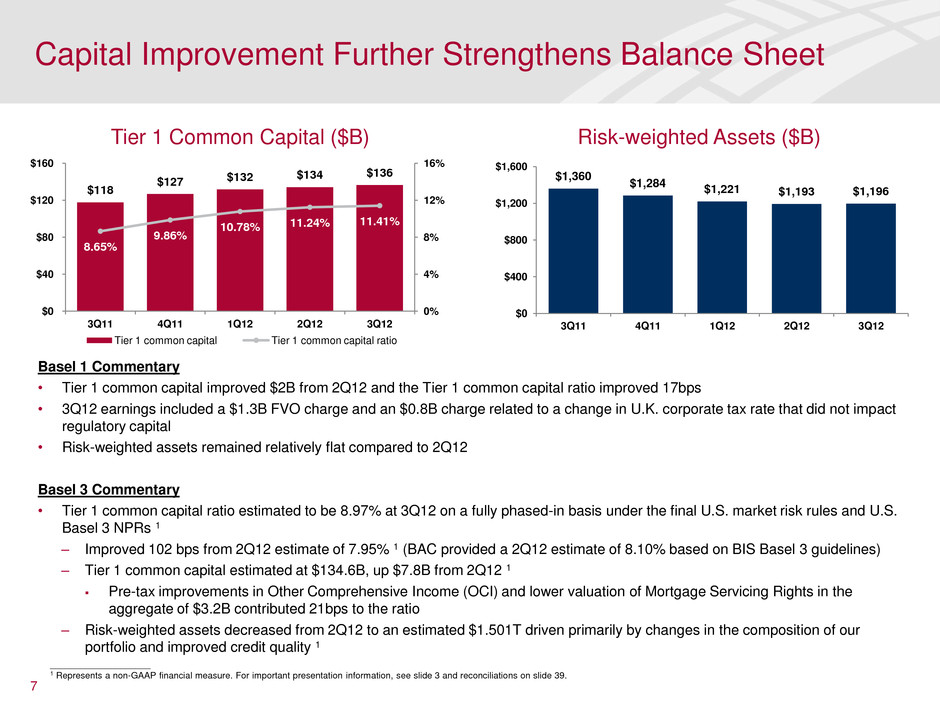
Capital Improvement Further Strengthens Balance Sheet 7 $118 $127 $132 $134 $136 8.65% 9.86% 10.78% 11.24% 11.41% 0% 4% 8% 12% 16% $0 $40 $80 $120 $160 3Q11 4Q11 1Q12 2Q12 3Q12 Tier 1 common capital Tier 1 common capital ratio Tier 1 Common Capital ($B) Risk-weighted Assets ($B) $1,360 $1,284 $1,221 $1,193 $1,196 $0 $400 $800 $1,200 $1,600 3Q11 4Q11 1Q12 2Q12 3Q12 Basel 1 Commentary • Tier 1 common capital improved $2B from 2Q12 and the Tier 1 common capital ratio improved 17bps • 3Q12 earnings included a $1.3B FVO charge and an $0.8B charge related to a change in U.K. corporate tax rate that did not impact regulatory capital • Risk-weighted assets remained relatively flat compared to 2Q12 Basel 3 Commentary • Tier 1 common capital ratio estimated to be 8.97% at 3Q12 on a fully phased-in basis under the final U.S. market risk rules and U.S. Basel 3 NPRs 1 – Improved 102 bps from 2Q12 estimate of 7.95% 1 (BAC provided a 2Q12 estimate of 8.10% based on BIS Basel 3 guidelines) – Tier 1 common capital estimated at $134.6B, up $7.8B from 2Q12 1 Pre-tax improvements in Other Comprehensive Income (OCI) and lower valuation of Mortgage Servicing Rights in the aggregate of $3.2B contributed 21bps to the ratio – Risk-weighted assets decreased from 2Q12 to an estimated $1.501T driven primarily by changes in the composition of our portfolio and improved credit quality 1 ____________________ 1 Represents a non-GAAP financial measure. For important presentation information, see slide 3 and reconciliations on slide 39.
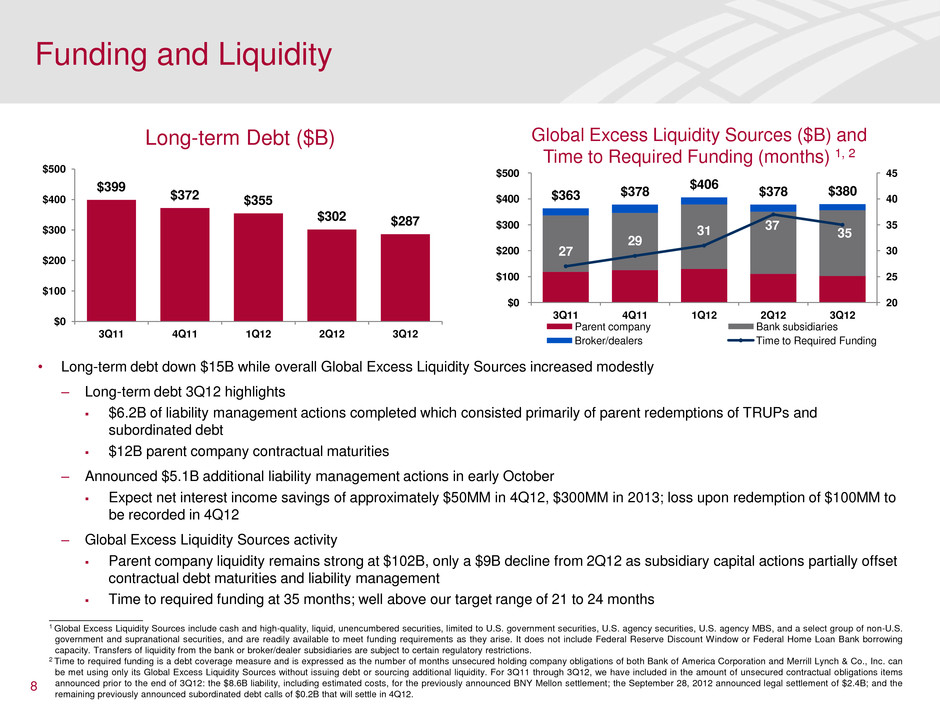
Funding and Liquidity • Long-term debt down $15B while overall Global Excess Liquidity Sources increased modestly – Long-term debt 3Q12 highlights $6.2B of liability management actions completed which consisted primarily of parent redemptions of TRUPs and subordinated debt $12B parent company contractual maturities – Announced $5.1B additional liability management actions in early October Expect net interest income savings of approximately $50MM in 4Q12, $300MM in 2013; loss upon redemption of $100MM to be recorded in 4Q12 – Global Excess Liquidity Sources activity Parent company liquidity remains strong at $102B, only a $9B decline from 2Q12 as subsidiary capital actions partially offset contractual debt maturities and liability management Time to required funding at 35 months; well above our target range of 21 to 24 months 8 Global Excess Liquidity Sources ($B) and Time to Required Funding (months) 1, 2 1 Global Excess Liquidity Sources include cash and high-quality, liquid, unencumbered securities, limited to U.S. government securities, U.S. agency securities, U.S. agency MBS, and a select group of non-U.S. government and supranational securities, and are readily available to meet funding requirements as they arise. It does not include Federal Reserve Discount Window or Federal Home Loan Bank borrowing capacity. Transfers of liquidity from the bank or broker/dealer subsidiaries are subject to certain regulatory restrictions. 2 Time to required funding is a debt coverage measure and is expressed as the number of months unsecured holding company obligations of both Bank of America Corporation and Merrill Lynch & Co., Inc. can be met using only its Global Excess Liquidity Sources without issuing debt or sourcing additional liquidity. For 3Q11 through 3Q12, we have included in the amount of unsecured contractual obligations items announced prior to the end of 3Q12: the $8.6B liability, including estimated costs, for the previously announced BNY Mellon settlement; the September 28, 2012 announced legal settlement of $2.4B; and the remaining previously announced subordinated debt calls of $0.2B that will settle in 4Q12. $363 $378 $406 $378 $380 27 29 31 37 35 20 25 30 35 40 45 $0 $100 $200 $300 $400 $500 3Q11 4Q11 1Q12 2Q12 3Q12 Parent company Bank subsidiaries Broker/dealers Time to Required Funding Long-term Debt ($B) $399 $372 $355 $302 $287 $0 $100 $200 $300 $400 $500 3Q11 4Q11 1Q12 2Q12 3Q12
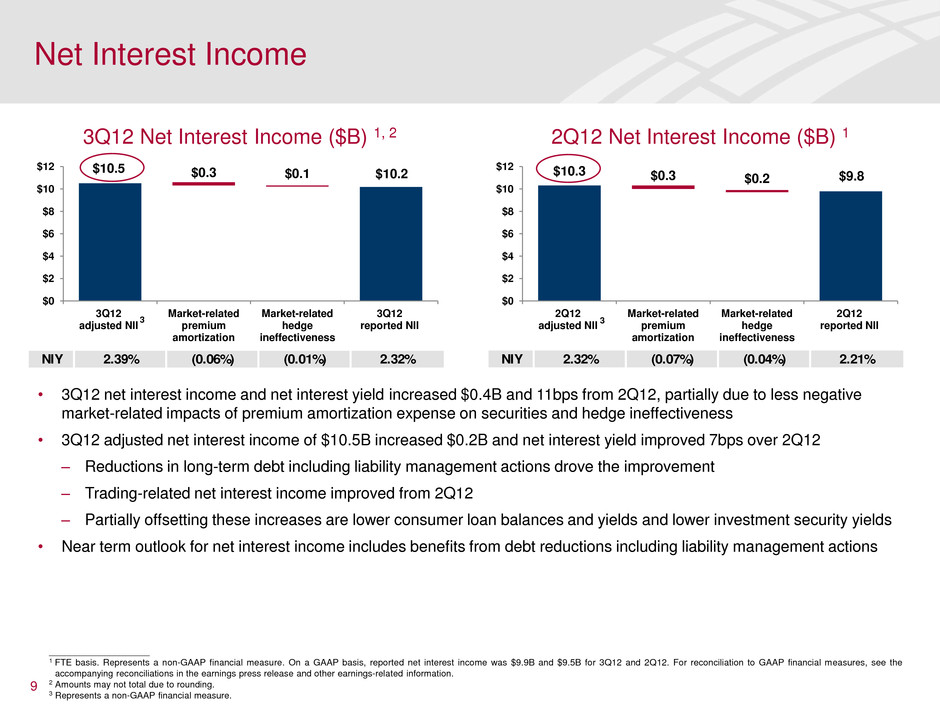
• 3Q12 net interest income and net interest yield increased $0.4B and 11bps from 2Q12, partially due to less negative market-related impacts of premium amortization expense on securities and hedge ineffectiveness • 3Q12 adjusted net interest income of $10.5B increased $0.2B and net interest yield improved 7bps over 2Q12 – Reductions in long-term debt including liability management actions drove the improvement – Trading-related net interest income improved from 2Q12 – Partially offsetting these increases are lower consumer loan balances and yields and lower investment security yields • Near term outlook for net interest income includes benefits from debt reductions including liability management actions 9 2Q12 Net Interest Income ($B) 1 $10.3 $9.8 $0.3 $0.2 $0 $2 $4 $6 $8 $10 $12 2Q12 adjusted NII Market-related premium amortization Market-related hedge ineffectiveness 2Q12 reported NII $10.5 $10.2 $0.3 $0.1 $0 $2 $4 $6 $8 $10 $12 3Q12 adjusted NII Market-related premium amortization Market-related hedge ineffectiveness 3Q12 reported NII 3Q12 Net Interest Income ($B) 1, 2 NIY 2.32% (0.07%) (0.04%) 2.21%NIY 2.39% (0.06%) (0. 1%) 2.32% Net Interest Income ____________________ 1 FTE basis. Represents a non-GAAP financial measure. On a GAAP basis, reported net interest income was $9.9B and $9.5B for 3Q12 and 2Q12. For reconciliation to GAAP financial measures, see the accompanying reconciliations in the earnings press release and other earnings-related information. 2 Amounts may not total due to rounding. 3 Represents a non-GAAP financial measure. 3 3
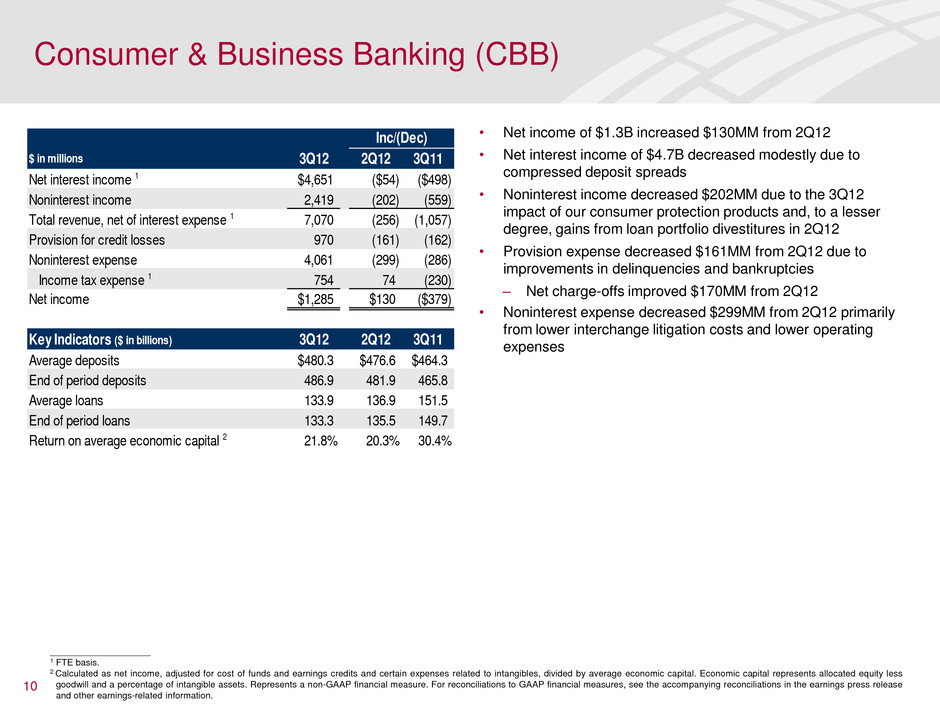
10 • Net income of $1.3B increased $130MM from 2Q12 • Net interest income of $4.7B decreased modestly due to compressed deposit spreads • Noninterest income decreased $202MM due to the 3Q12 impact of our consumer protection products and, to a lesser degree, gains from loan portfolio divestitures in 2Q12 • Provision expense decreased $161MM from 2Q12 due to improvements in delinquencies and bankruptcies – Net charge-offs improved $170MM from 2Q12 • Noninterest expense decreased $299MM from 2Q12 primarily from lower interchange litigation costs and lower operating expenses Consumer & Business Banking (CBB) $ in millions 2Q12 3Q11 Net interest income 1 $4,651 ($54) ($498) Noninterest income 2,419 (202) (559) Total revenue, net of interest expense 1 7,070 (256) (1,057) Provision for credit losses 970 (161) (162) Noninterest expense 4,061 (299) (286) Income tax expense 1 754 74 (230) Net income $1,285 $130 ($379) Key Indicators ($ in billions) 3Q12 2Q12 3Q11 Average deposits $480.3 $476.6 $464.3 End of period deposits 486.9 481.9 465.8 Average loans 133.9 136.9 151.5 End of period loans 133.3 135.5 149.7 Return on average economic capital 2 21.8% 20.3% 30.4% Inc/(Dec) 3Q12 ____________________ 1 FTE basis. 2 Calculated as net income, adjusted for cost of funds and earnings credits and certain expenses related to intangibles, divided by average economic capital. Economic capital represents allocated equity less goodwill and a percentage of intangible assets. Represents a non-GAAP financial measure. For reconciliations to GAAP financial measures, see the accompanying reconciliations in the earnings press release and other earnings-related information.
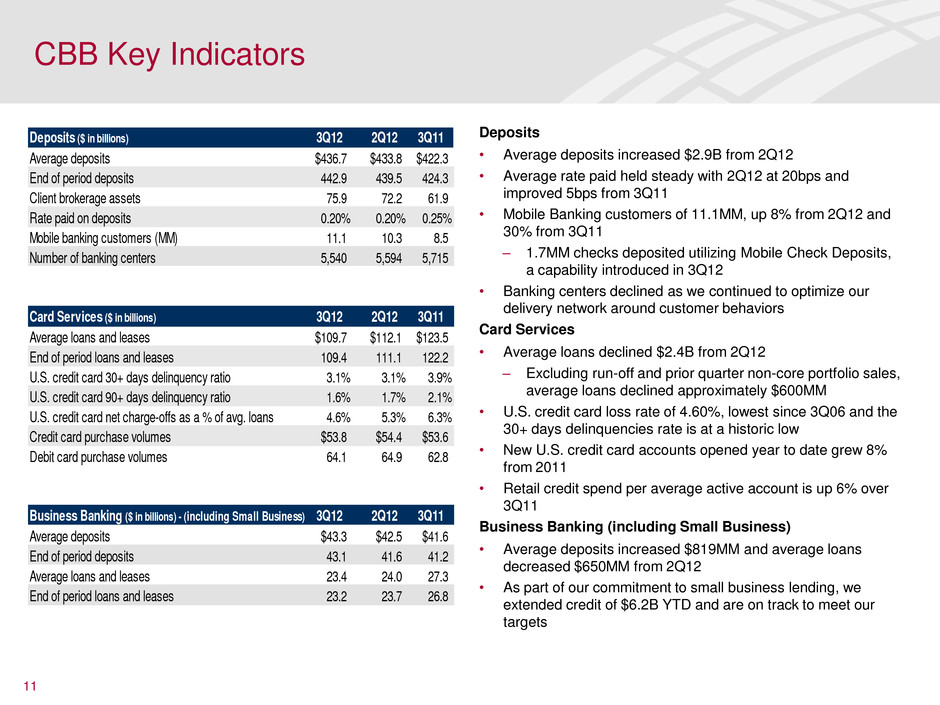
11 Deposits • Average deposits increased $2.9B from 2Q12 • Average rate paid held steady with 2Q12 at 20bps and improved 5bps from 3Q11 • Mobile Banking customers of 11.1MM, up 8% from 2Q12 and 30% from 3Q11 – 1.7MM checks deposited utilizing Mobile Check Deposits, a capability introduced in 3Q12 • Banking centers declined as we continued to optimize our delivery network around customer behaviors Card Services • Average loans declined $2.4B from 2Q12 – Excluding run-off and prior quarter non-core portfolio sales, average loans declined approximately $600MM • U.S. credit card loss rate of 4.60%, lowest since 3Q06 and the 30+ days delinquencies rate is at a historic low • New U.S. credit card accounts opened year to date grew 8% from 2011 • Retail credit spend per average active account is up 6% over 3Q11 Business Banking (including Small Business) • Average deposits increased $819MM and average loans decreased $650MM from 2Q12 • As part of our commitment to small business lending, we extended credit of $6.2B YTD and are on track to meet our targets CBB Key Indicators Deposits ($ in billions) 3Q12 2Q12 3Q11 Average deposits $436.7 $433.8 $422.3 End of period deposits 442.9 439.5 424.3 Client brokerage assets 75.9 72.2 61.9 Rate paid on deposits 0.20% 0.20% 0.25% Mobile banking customers (MM) 11.1 10.3 8.5 Number of banking centers 5,540 5,594 5,715 Card Services ($ in billions) 3Q12 2Q12 3Q11 Average loans and leases $109.7 $112.1 $123.5 End of period loans and leases 109.4 111.1 122.2 U.S. credit card 30+ days delinquency ratio 3.1% 3.1% 3.9% U.S. credit card 90+ days delinquency ratio 1.6% 1.7% 2.1% U.S. credit card net charge-offs as a % of avg. loans 4.6% 5.3% 6.3% Credit card purchase volumes $53.8 $54.4 $53.6 Debit card purchase volumes 64.1 64.9 62.8 usiness Banking ($ in billions) - (including Small Business) 3Q12 2Q12 3Q11 Average deposits $43.3 $42.5 $41.6 End of period deposits 43.1 41.6 41.2 Average loans and leases 23.4 24.0 27.3 End of period loans and leases 23.2 23.7 26.8

12 ____________________ 1 FTE basis. 2 CRES includes Home Loans and Legacy Assets & Servicing. The results of certain mortgage servicing right activities, including net hedge results which were previously included in Home Loans, together with any related assets or liabilities used as economic hedges are included in Legacy Assets & Servicing. • 3Q12 net loss of $877MM, an increase of $111MM from 2Q12 – Home Loans recorded a profit of $264MM 2 – Legacy Assets & Servicing lost $1.1B 2 • First-lien mortgage originations increased 13% to $20B • Revenue, net of interest expense, increased $575MM from 2Q12 – Servicing revenue improved due to favorable MSR results, net of hedge performance, partially offset by a decrease in servicing fees driven by a smaller servicing portfolio – Total production income increased $145MM Representations and warranties provision was $307MM in 3Q12 compared to $395MM in 2Q12 – Higher other income driven by the sale of a business • Provision for credit losses increased principally from new regulatory guidance on bankruptcy loans, partially offset by a provision benefit in the home equity PCI portfolio • 3Q12 expenses increased $672MM – Increased litigation of $0.3B – Increased servicing costs $0.3B – Increased cost of other mortgage-related matters $0.1B • During 3Q12, the MSR asset decreased $621MM to $5.1B – The capitalized MSR rate ended the period at 45bps vs. 47bps in 2Q12 Consumer Real Estate Services (CRES) $ in millions 2Q12 3Q11 Net interest income 1 $729 $15 ($193) Noninterest income 2,367 560 467 Total revenue, net of interest expense 1 3,096 575 274 Provision for credit losses 264 78 (654) Noninterest expense 4,224 672 398 Income tax benefit 1 (515) (64) 286 Net loss ($877) ($111) $244 Key Indicators ($ in billions) 3Q12 2Q12 3Q11 Average loans and leases $103.7 $106.7 $120.1 Total Corporation home loan originations: First mortgage 20.3 18.0 33.0 Retail 20.3 18.0 17.1 Correspondent - - 15.9 Home equity 0.9 0.9 0.8 MSR, end of period (EOP) 5.1 5.7 7.9 Capitalized MSR (bps) 45 47 52 Serviced for investors (EOP, trillions) 1.1 1.2 1.5 Servicing income 1.6 1.3 1.3 Core production income 0.9 0.9 0.8 Inc/(Dec) 3Q12
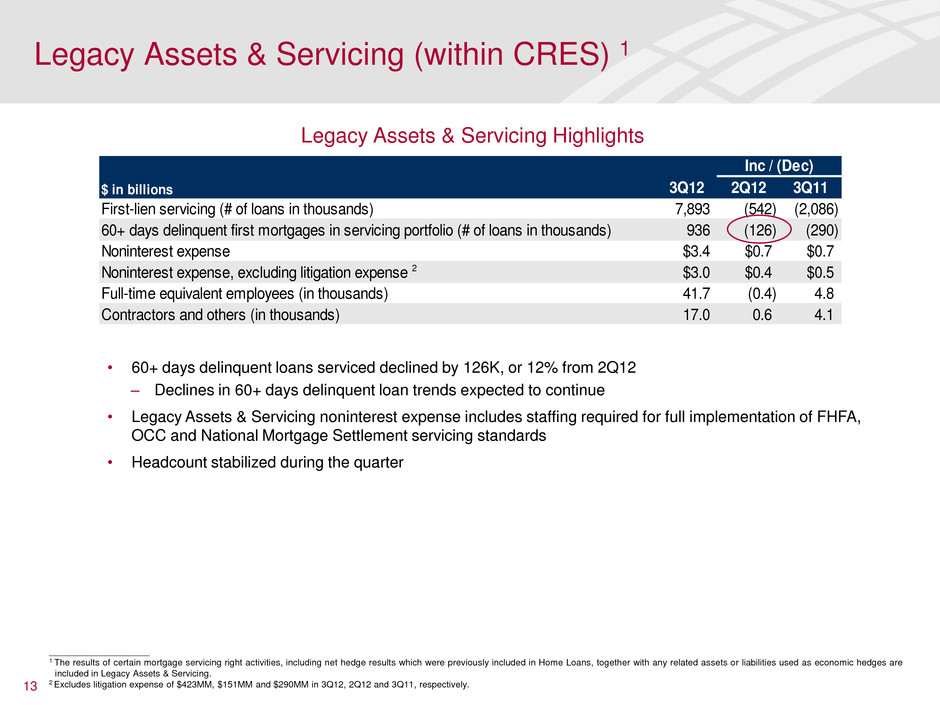
13 Legacy Assets & Servicing (within CRES) 1 ____________________ 1 The results of certain mortgage servicing right activities, including net hedge results which were previously included in Home Loans, together with any related assets or liabilities used as economic hedges are included in Legacy Assets & Servicing. 2 Excludes litigation expense of $423MM, $151MM and $290MM in 3Q12, 2Q12 and 3Q11, respectively. • 60+ days delinquent loans serviced declined by 126K, or 12% from 2Q12 – Declines in 60+ days delinquent loan trends expected to continue • Legacy Assets & Servicing noninterest expense includes staffing required for full implementation of FHFA, OCC and National Mortgage Settlement servicing standards • Headcount stabilized during the quarter $ in billions 2Q12 3Q11 First-lien servicing (# of loans in thousands) 7,893 (542) (2,086) 60+ days delinquent first mortgages in servicing portfolio (# of loans in thousands) 936 (126) (290) Noninterest expense $3.4 $0.7 $0.7 Noninterest expense, excluding litigation expense 2 $3.0 $0.4 $0.5 Full-time equivalent employees (in thousands) 41.7 (0.4) 4.8 Contractors and others (in thousands) 17.0 0.6 4.1 Inc / (Dec) 3Q12 Legacy Assets & Servicing Highlights
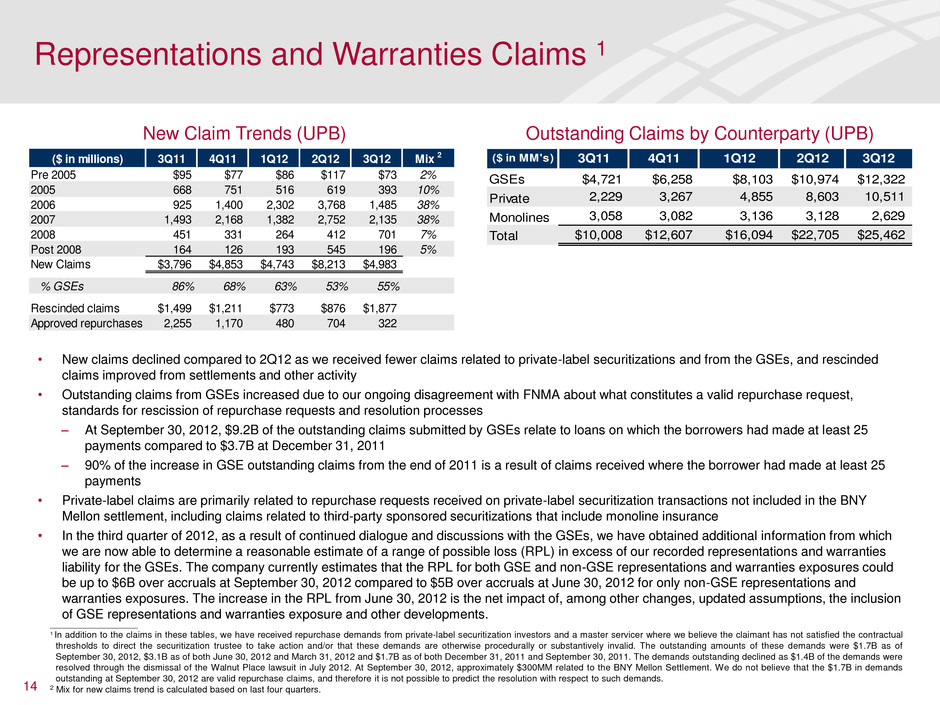
Representations and Warranties Claims 1 14 • New claims declined compared to 2Q12 as we received fewer claims related to private-label securitizations and from the GSEs, and rescinded claims improved from settlements and other activity • Outstanding claims from GSEs increased due to our ongoing disagreement with FNMA about what constitutes a valid repurchase request, standards for rescission of repurchase requests and resolution processes – At September 30, 2012, $9.2B of the outstanding claims submitted by GSEs relate to loans on which the borrowers had made at least 25 payments compared to $3.7B at December 31, 2011 – 90% of the increase in GSE outstanding claims from the end of 2011 is a result of claims received where the borrower had made at least 25 payments • Private-label claims are primarily related to repurchase requests received on private-label securitization transactions not included in the BNY Mellon settlement, including claims related to third-party sponsored securitizations that include monoline insurance • In the third quarter of 2012, as a result of continued dialogue and discussions with the GSEs, we have obtained additional information from which we are now able to determine a reasonable estimate of a range of possible loss (RPL) in excess of our recorded representations and warranties liability for the GSEs. The company currently estimates that the RPL for both GSE and non-GSE representations and warranties exposures could be up to $6B over accruals at September 30, 2012 compared to $5B over accruals at June 30, 2012 for only non-GSE representations and warranties exposures. The increase in the RPL from June 30, 2012 is the net impact of, among other changes, updated assumptions, the inclusion of GSE representations and warranties exposure and other developments. ($ in MM's) 3Q11 4Q11 1Q12 2Q12 3Q12 GSEs $4,721 $6,258 $8,103 $10,974 $12,322 Private 2,229 3,267 4,855 8,603 10,511 Monolines 3,058 3,082 3,136 3,128 2,629 Total $10,008 $12,607 $16,094 $22,705 $25,462 Outstanding Claims by Counterparty (UPB) ____________________ 1 In addition to the claims in these tables, we have received repurchase demands from private-label securitization investors and a master servicer where we believe the claimant has not satisfied the contractual thresholds to direct the securitization trustee to take action and/or that these demands are otherwise procedurally or substantively invalid. The outstanding amounts of these demands were $1.7B as of September 30, 2012, $3.1B as of both June 30, 2012 and March 31, 2012 and $1.7B as of both December 31, 2011 and September 30, 2011. The demands outstanding declined as $1.4B of the demands were resolved through the dismissal of the Walnut Place lawsuit in July 2012. At September 30, 2012, approximately $300MM related to the BNY Mellon Settlement. We do not believe that the $1.7B in demands outstanding at September 30, 2012 are valid repurchase claims, and therefore it is not possible to predict the resolution with respect to such demands. 2 Mix for new claims trend is calculated based on last four quarters. ($ in millions) 3Q11 4Q11 1Q12 2Q12 3Q12 Mix 2 Pre 2005 $95 $77 $86 $117 $73 2% 2005 668 751 516 619 393 10% 2006 925 1,400 2,302 3,768 1,485 38% 2007 1,493 2,168 1,382 2,752 2,135 38% 2008 451 331 264 412 701 7% Post 2008 164 126 193 545 196 5% New Claims $3,796 $4,853 $4,743 $8,213 $4,983 % GSEs 86% 68% 63% 53% 55% Rescinded claims $1,499 $1,2 1 $773 $876 $1,877 Approved repurchases 2,255 1,170 480 704 322 New Claim Trends (UPB)
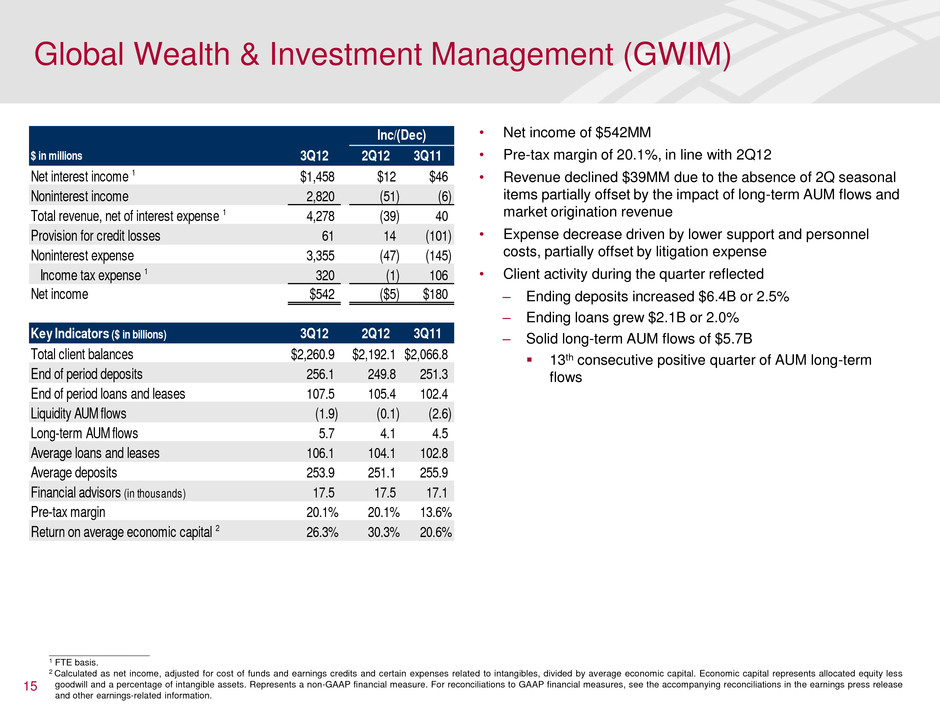
15 • Net income of $542MM • Pre-tax margin of 20.1%, in line with 2Q12 • Revenue declined $39MM due to the absence of 2Q seasonal items partially offset by the impact of long-term AUM flows and market origination revenue • Expense decrease driven by lower support and personnel costs, partially offset by litigation expense • Client activity during the quarter reflected – Ending deposits increased $6.4B or 2.5% – Ending loans grew $2.1B or 2.0% – Solid long-term AUM flows of $5.7B 13th consecutive positive quarter of AUM long-term flows Global Wealth & Investment Management (GWIM) $ in millions 2Q12 3Q11 Net interest income 1 $1,458 $12 $46 Noninterest income 2,820 (51) (6) Total revenue, net of interest expense 1 4,278 (39) 40 Provision for credit losses 61 14 (101) Noninterest expense 3,355 (47) (145) Income tax expense 1 320 (1) 106 Net income $542 ($5) $180 Key Indicators ($ in billions) 3Q12 2Q12 3Q11 Total client balances $2,260.9 $2,192.1 $2,066.8 End of period deposits 256.1 249.8 251.3 End of period loans and leases 107.5 105.4 102.4 Liquidity AUM flows (1.9) (0.1) (2.6) Long-term AUM flows 5.7 4.1 4.5 Average loans and l ases 106.1 104.1 102.8 Average deposits 253.9 251.1 255.9 Financial advisors (in th usands) 17.5 17.5 17.1 Pre-tax margin 20.1% 20.1% 13.6% Return on average economic capital 2 26.3% 30.3% 20.6% Inc/(Dec) 3Q12 ____________________ 1 FTE basis. 2 Calculated as net income, adjusted for cost of funds and earnings credits and certain expenses related to intangibles, divided by average economic capital. Economic capital represents allocated equity less goodwill and a percentage of intangible assets. Represents a non-GAAP financial measure. For reconciliations to GAAP financial measures, see the accompanying reconciliations in the earnings press release and other earnings-related information.
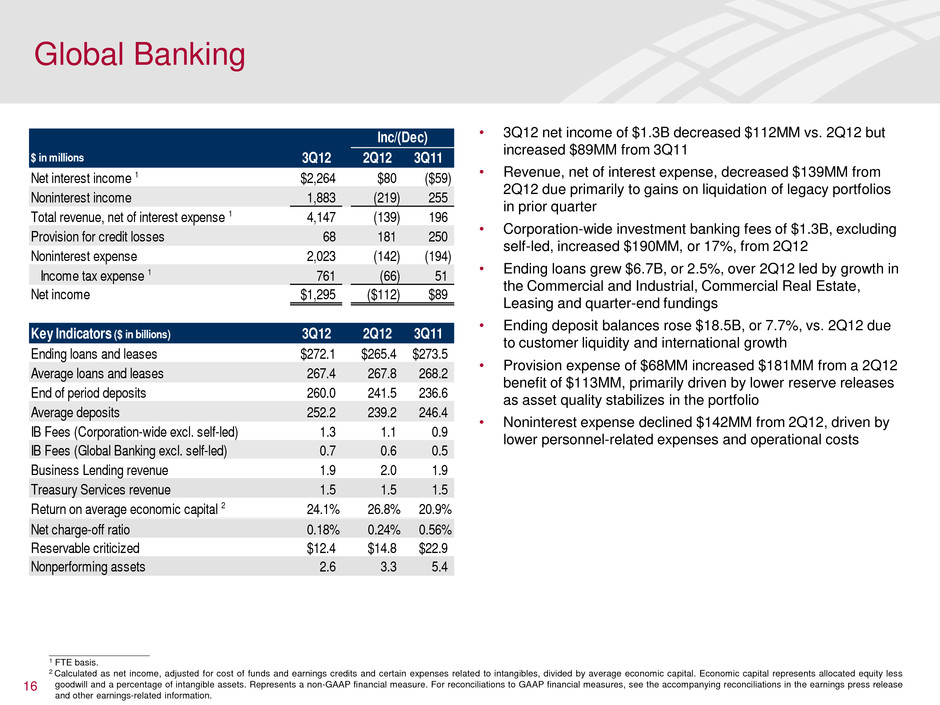
16 • 3Q12 net income of $1.3B decreased $112MM vs. 2Q12 but increased $89MM from 3Q11 • Revenue, net of interest expense, decreased $139MM from 2Q12 due primarily to gains on liquidation of legacy portfolios in prior quarter • Corporation-wide investment banking fees of $1.3B, excluding self-led, increased $190MM, or 17%, from 2Q12 • Ending loans grew $6.7B, or 2.5%, over 2Q12 led by growth in the Commercial and Industrial, Commercial Real Estate, Leasing and quarter-end fundings • Ending deposit balances rose $18.5B, or 7.7%, vs. 2Q12 due to customer liquidity and international growth • Provision expense of $68MM increased $181MM from a 2Q12 benefit of $113MM, primarily driven by lower reserve releases as asset quality stabilizes in the portfolio • Noninterest expense declined $142MM from 2Q12, driven by lower personnel-related expenses and operational costs Global Banking $ in millions 2Q12 3Q11 Net interest income 1 $2,264 $80 ($59) Noninterest income 1,883 (219) 255 Total revenue, net of interest expense 1 4,147 (139) 196 Provision for credit losses 68 181 250 Noninterest expense 2,023 (142) (194) Income tax expense 1 761 (66) 51 Net income $1,295 ($112) $89 Key Indicators ($ in billions) 3Q12 2Q12 3Q11 Ending loans and leases $272.1 $265.4 $273.5 Average loans and leases 267.4 267.8 268.2 End of period deposits 260.0 241.5 236.6 Average deposits 252.2 239.2 246.4 IB Fees (Corporation-wide excl. self-led) 1.3 1.1 0.9 IB Fees (Global Banking excl. self-led) 0.7 0.6 0.5 Business Lending revenue 1.9 2.0 1.9 Treasury Services rev nu 1.5 1.5 1.5 Return on average con mic capital 2 24.1% 26.8% 20.9%0.0 0.0 0.0 Net charge-off rati 0.18% 0.24% 0.56% Reservable criticized $12.4 $14.8 $22.9 Nonperforming assets 2.6 3.3 5.4 Inc/(Dec) 3Q12 ____________________ 1 FTE basis. 2 Calculated as net income, adjusted for cost of funds and earnings credits and certain expenses related to intangibles, divided by average economic capital. Economic capital represents allocated equity less goodwill and a percentage of intangible assets. Represents a non-GAAP financial measure. For reconciliations to GAAP financial measures, see the accompanying reconciliations in the earnings press release and other earnings-related information.
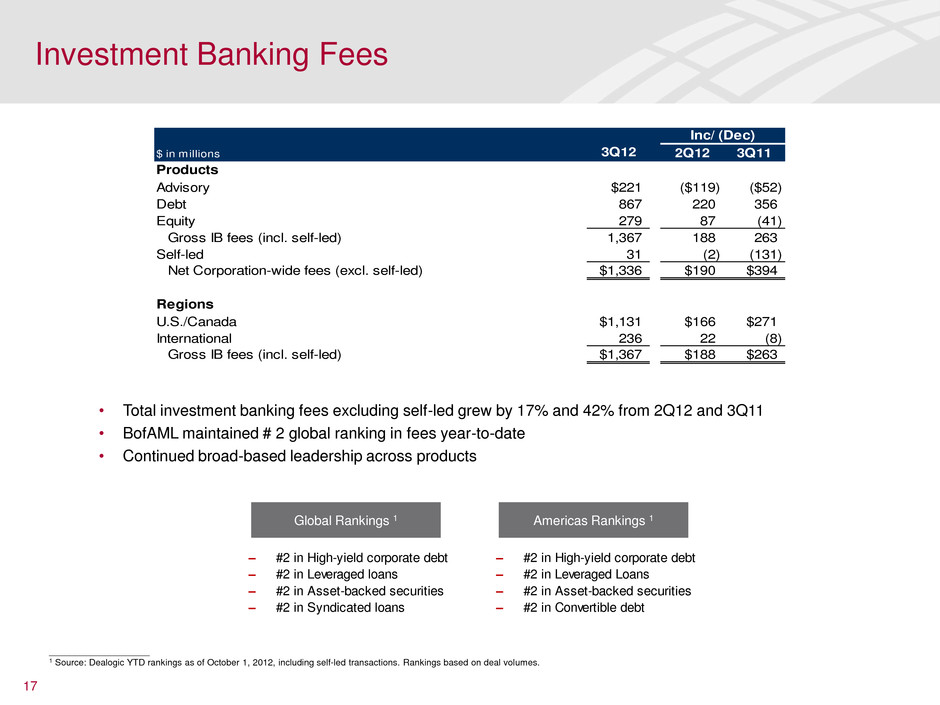
Investment Banking Fees $ in millions 2Q12 3Q11 Products Advisory $221 ($119) ($52) Debt 867 220 356 Equity 279 87 (41) Gross IB fees (incl. self-led) 1,367 188 263 Self-led 31 (2) (131) Net Corporation-wide fees (excl. self-led) $1,336 $190 $394 Regions U.S./Canada $1,131 $166 $271 International 236 22 (8) Gross IB fees (incl. self-led) $1,367 $188 $263 Inc/ (Dec) 3Q12 17 • Total investment banking fees excluding self-led grew by 17% and 42% from 2Q12 and 3Q11 • BofAML maintained # 2 global ranking in fees year-to-date • Continued broad-based leadership across products – #2 in High-yield corporate debt – #2 in Leveraged loans – #2 in Asset-backed securities – #2 in Syndicated loans Global Rankings 1 Americas Rankings 1 – #2 in High-yield corporate debt – #2 in Leveraged Loans – #2 in Ass t-backed securities – #2 in Convertible debt ____________________ 1 Source: Dealogic YTD rankings as of October 1, 2012, including self-led transactions. Rankings based on deal volumes.
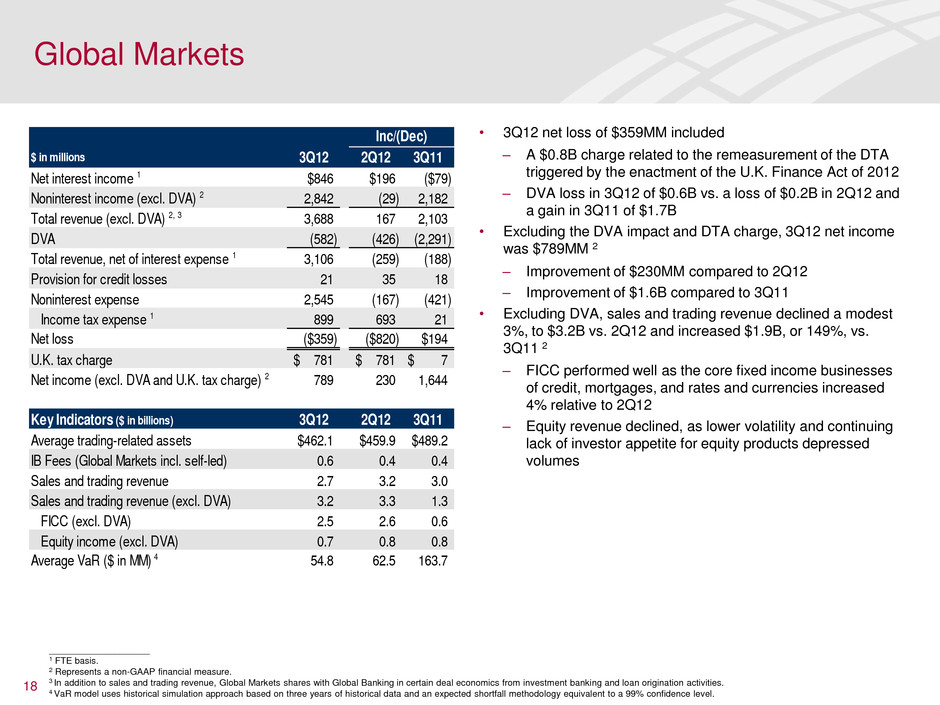
18 • 3Q12 net loss of $359MM included – A $0.8B charge related to the remeasurement of the DTA triggered by the enactment of the U.K. Finance Act of 2012 – DVA loss in 3Q12 of $0.6B vs. a loss of $0.2B in 2Q12 and a gain in 3Q11 of $1.7B • Excluding the DVA impact and DTA charge, 3Q12 net income was $789MM 2 – Improvement of $230MM compared to 2Q12 – Improvement of $1.6B compared to 3Q11 • Excluding DVA, sales and trading revenue declined a modest 3%, to $3.2B vs. 2Q12 and increased $1.9B, or 149%, vs. 3Q11 2 – FICC performed well as the core fixed income businesses of credit, mortgages, and rates and currencies increased 4% relative to 2Q12 – Equity revenue declined, as lower volatility and continuing lack of investor appetite for equity products depressed volumes ____________________ 1 FTE basis. 2 Represents a non-GAAP financial measure. 3 In addition to sales and trading revenue, Global Markets shares with Global Banking in certain deal economics from investment banking and loan origination activities. 4 VaR model uses historical simulation approach based on three years of historical data and an expected shortfall methodology equivalent to a 99% confidence level. Global Markets $ in millions 2Q12 3Q11 Net interest income 1 $846 $196 ($79) Noninterest income (excl. DVA) 2 2,842 (29) 2,182 Total revenue (excl. DVA) 2, 3 3,688 167 2,103 DVA (582) (426) (2,291) Total revenue, net of interest expense 1 3,106 (259) (188) Provision for credit losses 21 35 18 Noninterest expense 2,545 (167) (421) Income tax expense 1 899 693 21 Net loss ($359) ($820) $194 U.K. tax charge 781$ 781$ 7$ Net income (excl. DVA and U.K. tax charge) 2 789 230 1,644 Key Indicators ($ in billions) 3Q12 2Q12 3Q11 Average trading-related assets $462.1 $459.9 $489.2 IB Fees (Global Markets incl. self-led) 0.6 0.4 0.4 Sales and trading eve ue 2.7 3.2 3.0 Sales and trading revenue (excl. DVA) 3.2 3.3 1.3 FICC (excl. DVA) 2.5 2.6 0.6 Equity income (excl. DVA) 0.7 0.8 0.8 Average VaR ($ in MM) 4 54.8 62.5 163.7 Inc/(Dec) 3Q12
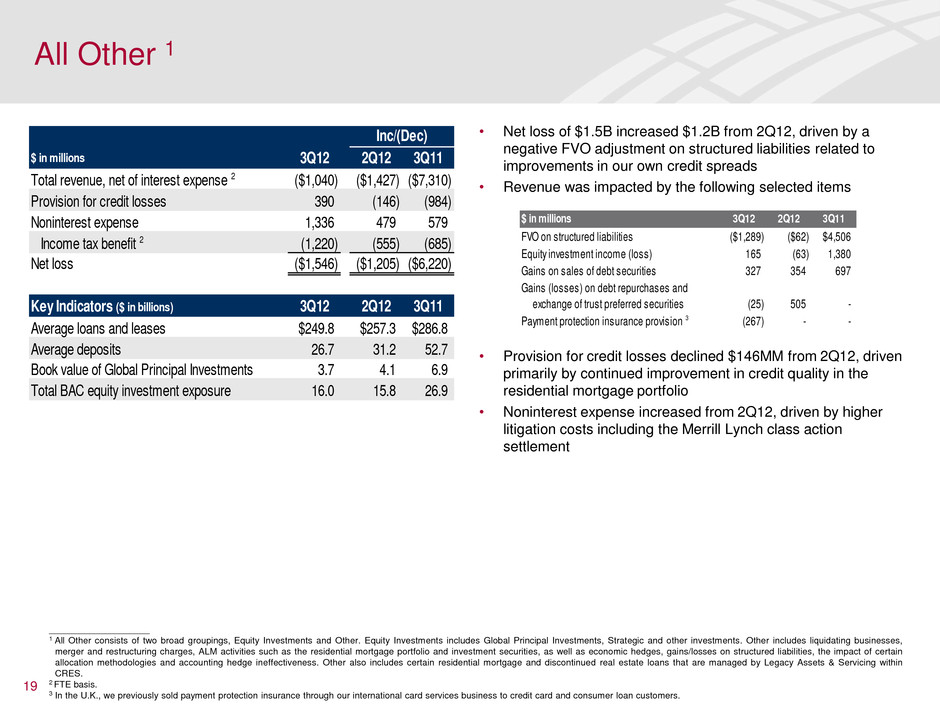
• Net loss of $1.5B increased $1.2B from 2Q12, driven by a negative FVO adjustment on structured liabilities related to improvements in our own credit spreads • Revenue was impacted by the following selected items • Provision for credit losses declined $146MM from 2Q12, driven primarily by continued improvement in credit quality in the residential mortgage portfolio • Noninterest expense increased from 2Q12, driven by higher litigation costs including the Merrill Lynch class action settlement ____________________ 1 All Other consists of two broad groupings, Equity Investments and Other. Equity Investments includes Global Principal Investments, Strategic and other investments. Other includes liquidating businesses, merger and restructuring charges, ALM activities such as the residential mortgage portfolio and investment securities, as well as economic hedges, gains/losses on structured liabilities, the impact of certain allocation methodologies and accounting hedge ineffectiveness. Other also includes certain residential mortgage and discontinued real estate loans that are managed by Legacy Assets & Servicing within CRES. 2 FTE basis. 3 In the U.K., we previously sold payment protection insurance through our international card services business to credit card and consumer loan customers. 19 All Other 1 $ in millions 2Q12 3Q11 Total revenue, net of interest expense 2 ($1,040) ($1,427) ($7,310) Provision for credit losses 390 (146) (984) Noninterest expense 1,336 479 579 Income tax benefit 2 (1,220) (555) (685) Net loss ($1,546) ($1,205) ($6,220) Key Indicators ($ in billions) 3Q12 2Q12 3Q11 Average loans and leases $249.8 $257.3 $286.8 Average deposits 26.7 31.2 52.7 Book value of Global Principal Investments 3.7 4.1 6.9 Total BAC equity inv stm nt xposure 16.0 15.8 26.9 Inc/(Dec) 3Q12 $ in millions 3Q12 2Q12 3Q11 FVO on tructured liabilities ($1,289) ($62) $4,506 Equity investment income (loss) 165 (63) 1,380 Gains on sales of debt securities 327 354 697 (25) 505 - Payment protection i surance provision 3 (267) - - Gains (losses) on debt repurchases and exchange of trust preferred securities
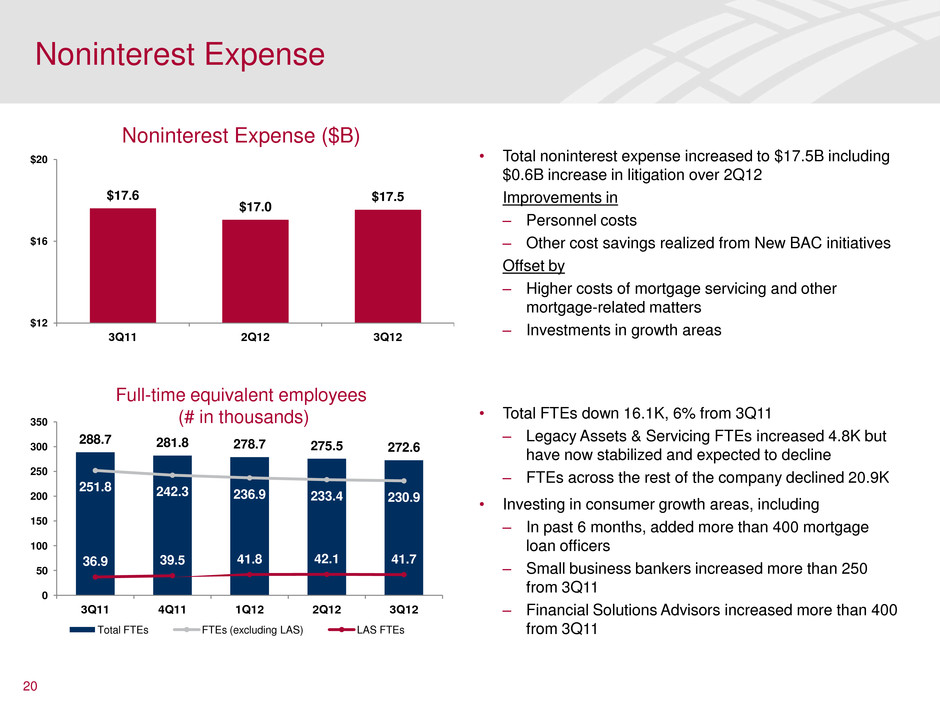
Noninterest Expense Noninterest Expense ($B) 20 288.7 281.8 278.7 275.5 272.6 251.8 242.3 236.9 233.4 230.9 36.9 39.5 41.8 42.1 41.7 0 50 100 150 200 250 300 350 3Q11 4Q11 1Q12 2Q12 3Q12 Total FTEs FTEs (excluding LAS) LAS FTEs Full-time equivalent employees (# in thousands) $17.6 $17.0 $17.5 $12 $16 $20 3Q11 2Q12 3Q12 • Total FTEs down 16.1K, 6% from 3Q11 – Legacy Assets & Servicing FTEs increased 4.8K but have now stabilized and expected to decline – FTEs across the rest of the company declined 20.9K • Investing in consumer growth areas, including – In past 6 months, added more than 400 mortgage loan officers – Small business bankers increased more than 250 from 3Q11 – Financial Solutions Advisors increased more than 400 from 3Q11 • Total noninterest expense increased to $17.5B including $0.6B increase in litigation over 2Q12 Improvements in – Personnel costs – Other cost savings realized from New BAC initiatives Offset by – Higher costs of mortgage servicing and other mortgage-related matters – Investments in growth areas
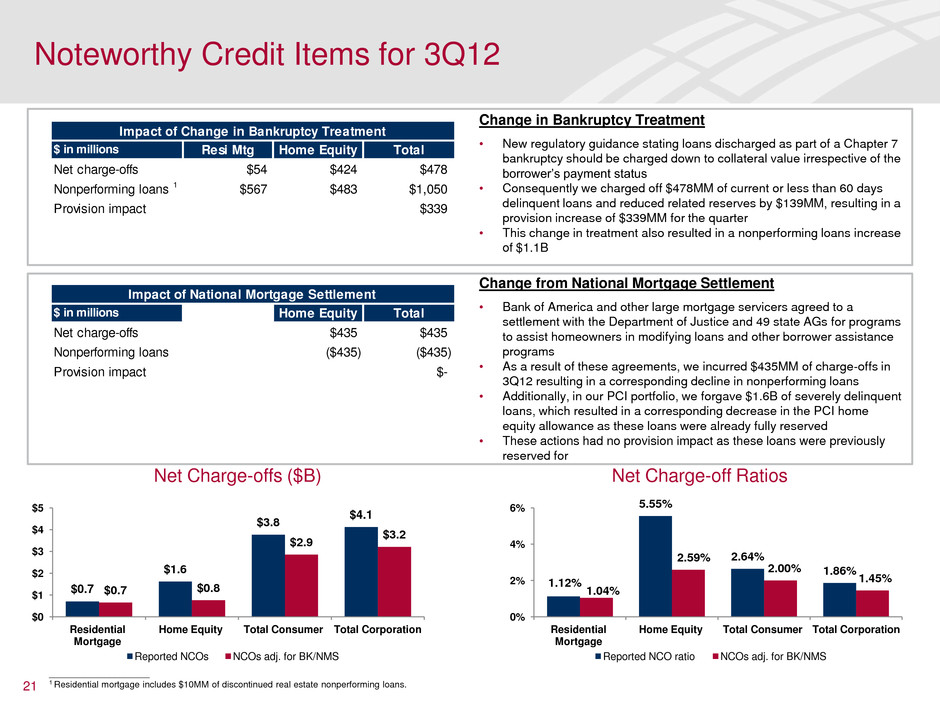
Noteworthy Credit Items for 3Q12 21 $0.7 $1.6 $3.8 $4.1 $0.7 $0.8 $2.9 $3.2 $0 $1 $2 $3 $4 $5 Residential Mortgage Home Equity Total Consumer Total Corporation Reported NCOs NCOs adj. for BK/NMS Net Charge-offs ($B) 1.12% 5.55% 2.64% 1.86% 1.04% 2.59% 2.00% 1.45% 0% 2% 4% 6% Residential Mortgage Home Equity Total Consumer Total Corporation Reported NCO ratio NCOs adj. for BK/NMS Net Charge-off Ratios Change in Bankruptcy Treatment • New regulatory guidance stating loans discharged as part of a Chapter 7 bankruptcy should be charged down to collateral value irrespective of the borrower’s payment status • Consequently we charged off $478MM of current or less than 60 days delinquent loans and reduced related reserves by $139MM, resulting in a provision increase of $339MM for the quarter • This change in treatment also resulted in a nonperforming loans increase of $1.1B Change from National Mortgage Settlement • Bank of America and other large mortgage servicers agreed to a settlement with the Department of Justice and 49 state AGs for programs to assist homeowners in modifying loans and other borrower assistance programs • As a result of these agreements, we incurred $435MM of charge-offs in 3Q12 resulting in a corresponding decline in nonperforming loans • Additionally, in our PCI portfolio, we forgave $1.6B of severely delinquent loans, which resulted in a corresponding decrease in the PCI home equity allowance as these loans were already fully reserved • These actions had no provision impact as these loans were previously reserved for $ in millions Resi Mtg Home Equity Total Net charge-offs $54 $424 $478 Nonperforming loans 1 $567 $483 $1,050 Provision impact $339 Impact of Change in Bankruptcy Treatment $ in millions Resi Mtg Home Equity Total Net charge-offs $435 $435 Nonperforming loans ($435) ($435) Provision impact $- Impact of National Mortgage Settlement ____________________ 1 Residential mortgage includes $10MM of discontinued real estate nonperforming loans.
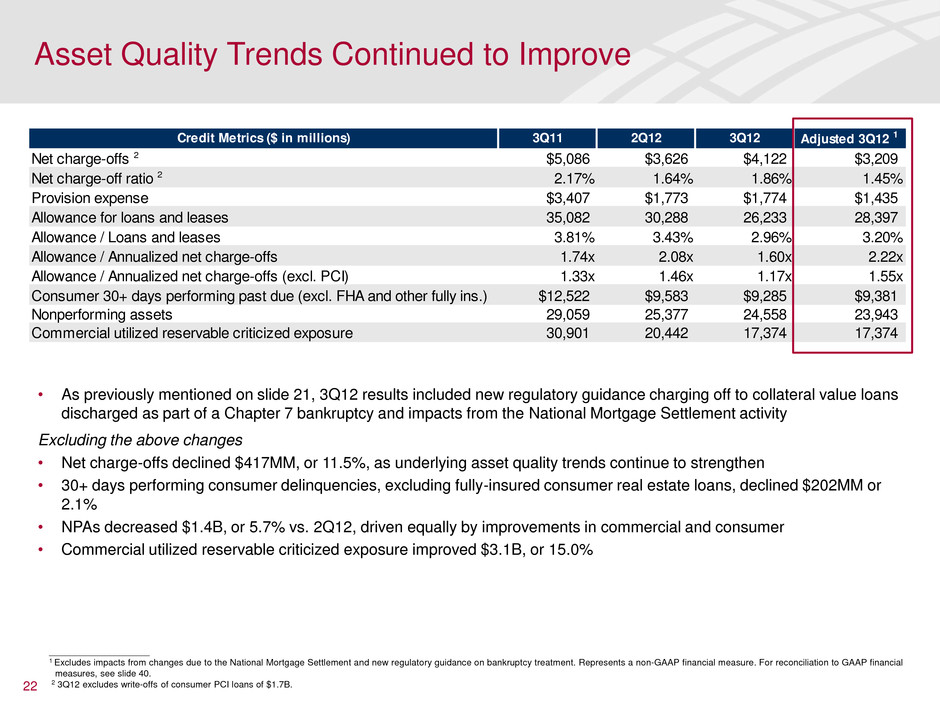
Asset Quality Trends Continued to Improve 22 • As previously mentioned on slide 21, 3Q12 results included new regulatory guidance charging off to collateral value loans discharged as part of a Chapter 7 bankruptcy and impacts from the National Mortgage Settlement activity Excluding the above changes • Net charge-offs declined $417MM, or 11.5%, as underlying asset quality trends continue to strengthen • 30+ days performing consumer delinquencies, excluding fully-insured consumer real estate loans, declined $202MM or 2.1% • NPAs decreased $1.4B, or 5.7% vs. 2Q12, driven equally by improvements in commercial and consumer • Commercial utilized reservable criticized exposure improved $3.1B, or 15.0% ____________________ 1 Excludes impacts from changes due to the National Mortgage Settlement and new regulatory guidance on bankruptcy treatment. Represents a non-GAAP financial measure. For reconciliation to GAAP financial measures, see slide 40. 2 3Q12 excludes write-offs of consumer PCI loans of $1.7B. Credit Metrics ($ in millions) 3Q11 2Q12 3Q12 Adjusted 3Q12 1 Net charge-offs 2 $5,086 $3,626 $4,122 $3,209 Net charge-off ratio 2 2.17% 1.64% 1.86% 1.45% Provision expense $3,407 $1,773 $1,774 $1,435 Allowance for loans and leases 35,082 30,288 26,233 28,397 Allowance / Loans and leases 3.81% 3.43% 2.96% 3.20% Allowance / Annualized net charge-offs 1.74x 2.08x 1.60x 2.22x Allowance / Annualized net charge-offs (excl. PCI) 1.33x 1.46x 1.17x 1.55x Consumer 30+ days performing past due (excl. FHA and other fully ins.) $12,522 $9,583 $9,285 $9,381 Nonperforming assets 29,059 25,377 24,558 23,943 Commercial utilized reservable criticized exposure 30,901 20,442 17,374 17,374
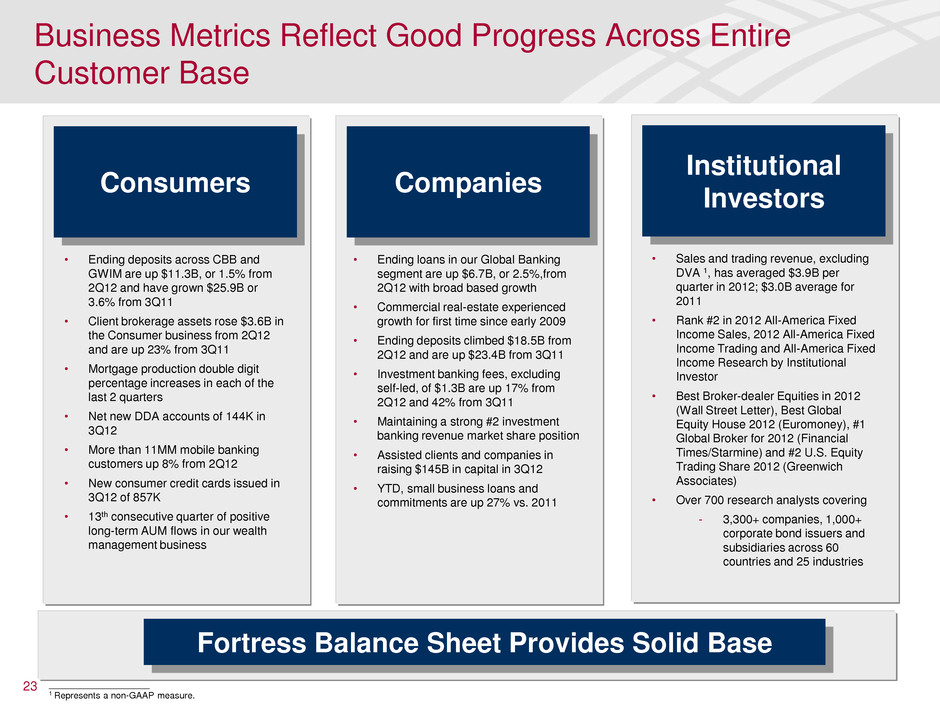
Business Metrics Reflect Good Progress Across Entire Customer Base 23 Consumers • Ending deposits across CBB and GWIM are up $11.3B, or 1.5% from 2Q12 and have grown $25.9B or 3.6% from 3Q11 • Client brokerage assets rose $3.6B in the Consumer business from 2Q12 and are up 23% from 3Q11 • Mortgage production double digit percentage increases in each of the last 2 quarters • Net new DDA accounts of 144K in 3Q12 • More than 11MM mobile banking customers up 8% from 2Q12 • New consumer credit cards issued in 3Q12 of 857K • 13th consecutive quarter of positive long-term AUM flows in our wealth management business Companies Institutional Investors • Sales and trading revenue, excluding DVA 1, has averaged $3.9B per quarter in 2012; $3.0B average for 2011 • Rank #2 in 2012 All-America Fixed Income Sales, 2012 All-America Fixed Income Trading and All-America Fixed Income Research by Institutional Investor • Best Broker-dealer Equities in 2012 (Wall Street Letter), Best Global Equity House 2012 (Euromoney), #1 Global Broker for 2012 (Financial Times/Starmine) and #2 U.S. Equity Trading Share 2012 (Greenwich Associates) • Over 700 research analysts covering 3,300+ companies, 1,000+ corporate bond issuers and subsidiaries across 60 countries and 25 industries • Ending loans in our Global Banking segment are up $6.7B, or 2.5%,from 2Q12 with broad based growth • Commercial real-estate experienced growth for first time since early 2009 • Ending deposits climbed $18.5B from 2Q12 and are up $23.4B from 3Q11 • Investment banking fees, excluding self-led, of $1.3B are up 17% from 2Q12 and 42% from 3Q11 • Maintaining a strong #2 investment banking revenue market share position • Assisted clients and companies in raising $145B in capital in 3Q12 • YTD, small business loans and commitments are up 27% vs. 2011 Fortress Balance Sheet Provides Solid Base ____________________ 1 Represents a non-GAAP measure.
Appendix
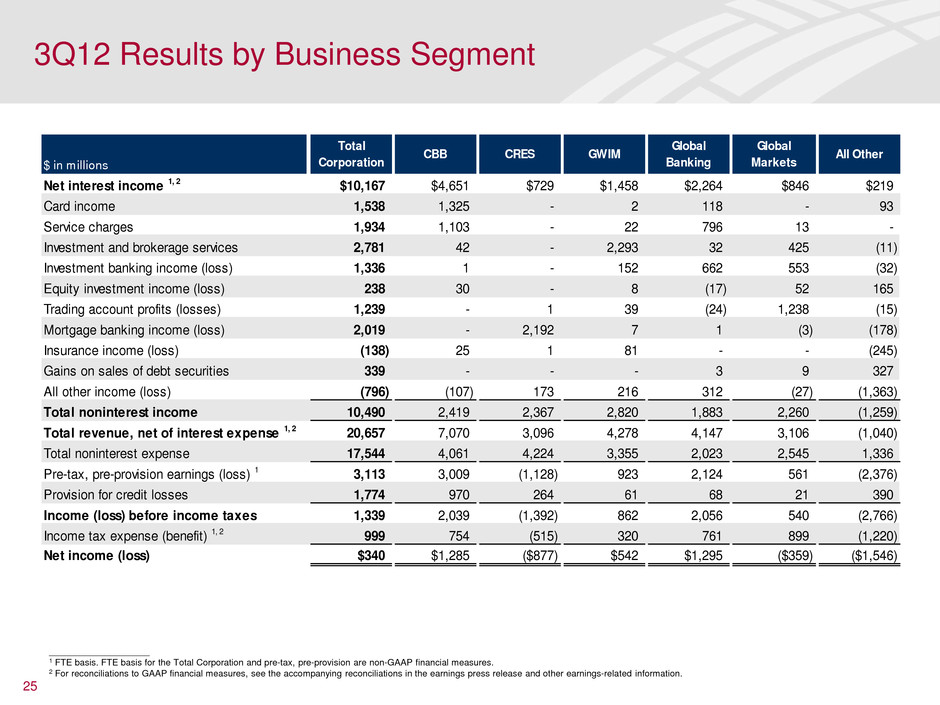
____________________ 1 FTE basis. FTE basis for the Total Corporation and pre-tax, pre-provision are non-GAAP financial measures. 2 For reconciliations to GAAP financial measures, see the accompanying reconciliations in the earnings press release and other earnings-related information. 25 3Q12 Results by Business Segment $ in millions Total Corporation CBB CRES GWIM Global Banking Global Markets All Other Net interest income 1, 2 $10,167 $4,651 $729 $1,458 $2,264 $846 $219 Card income 1,538 1,325 - 2 118 - 93 Service charges 1,934 1,103 - 22 796 13 - Investment and brokerage services 2,781 42 - 2,293 32 425 (11) Investment banking income (loss) 1,336 1 - 152 662 553 (32) Equity investment income (loss) 238 30 - 8 (17) 52 165 Trading account profits (losses) 1,239 - 1 39 (24) 1,238 (15) Mortgage banking income (loss) 2,019 - 2,192 7 1 (3) (178) Insurance income (loss) (138) 25 1 81 - - (245) Gains on sales of debt securities 339 - - - 3 9 327 All other income (loss) (796) (107) 173 216 312 (27) (1,363) Total noninterest income 10,490 2,419 2,367 2,820 1,883 2,260 (1,259) Total revenue, net of interest expense 1, 2 20,657 7,070 3,096 4,278 4,147 3,106 (1,040) Total noninterest expense 17,544 4,061 4,224 3,355 2,023 2,545 1,336 Pre-tax, pre-provision earnings (loss) 1 3,113 3,009 (1,128) 923 2,124 561 (2,376) Provision for credit losses 1,774 970 264 61 68 21 390 Income (loss) before income taxes 1,339 2,039 (1,392) 862 2,056 540 (2,766) Income tax expense (benefit) 1, 2 999 754 (515) 320 761 899 (1,220) Net income (loss) $340 $1,285 ($877) $542 $1,295 ($359) ($1,546)
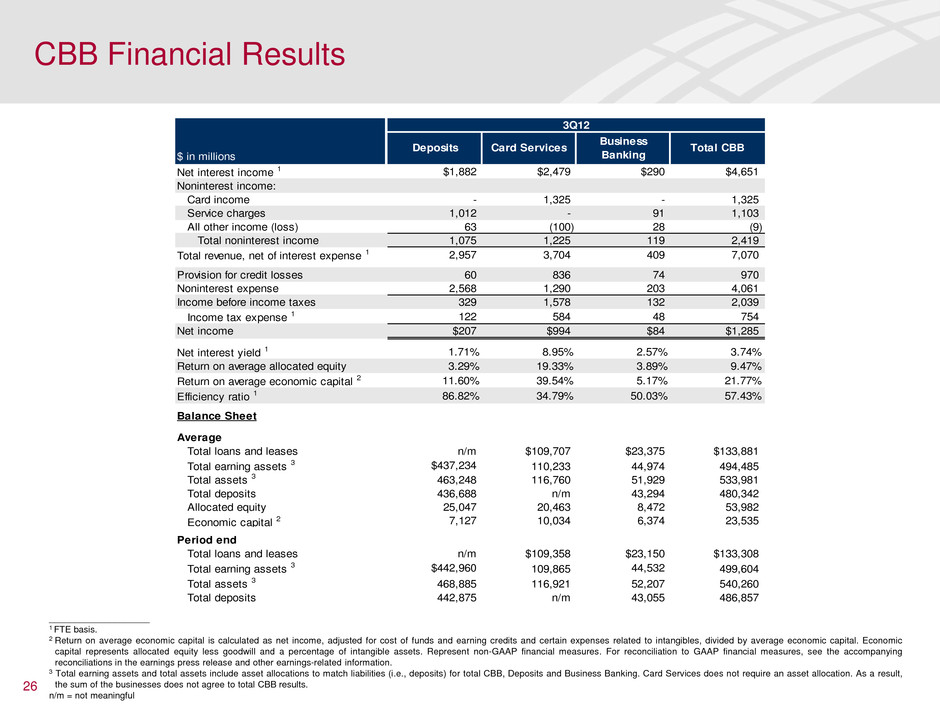
26 ____________________ 1 FTE basis. 2 Return on average economic capital is calculated as net income, adjusted for cost of funds and earning credits and certain expenses related to intangibles, divided by average economic capital. Economic capital represents allocated equity less goodwill and a percentage of intangible assets. Represent non-GAAP financial measures. For reconciliation to GAAP financial measures, see the accompanying reconciliations in the earnings press release and other earnings-related information. 3 Total earning assets and total assets include asset allocations to match liabilities (i.e., deposits) for total CBB, Deposits and Business Banking. Card Services does not require an asset allocation. As a result, the sum of the businesses does not agree to total CBB results. n/m = not meaningful CBB Financial Results Net interest income 1 $1,882 $2,479 $290 $4,651 Noninterest income: Card income - 1,325 - 1,325 Service charges 1,012 - 91 1,103 All other income (loss) 63 (100) 28 (9) Total noninterest income 1,075 1,225 119 2,419 Total revenue, net of interest expense 1 2,957 3,704 409 7,070 Provision for credit losses 60 836 74 970 Noninterest expense 2,568 1,290 203 4,061 Income before income taxes 329 1,578 132 2,039 Income tax expense 1 122 584 48 754 Net income $207 $994 $84 $1,285 Net interest yield 1 1.71% 8.95% 2.57% 3.74% Return on average allocated equity 3.29% 19.33% 3.89% 9.47% Return on average economic capital 2 11.60% 39.54% 5.17% 21.77% Efficiency ratio 1 86.82% 34.79% 50.03% 57.43% Balance Sheet Average Total loans and leases n/m $109,707 $23,375 $133,881 Total earning assets 3 $437,234 110,233 44,974 494,485 Total assets 3 463,248 116,760 51,929 533,981 Total deposits 436,688 n/m 43,294 480,342 Allocated equity 25,047 20,463 8,472 53,982 Economic capital 2 7,127 10,034 6,374 23,535 Period end Total loans and leases n/m $109,358 $23,150 $133,308 Total earning assets 3 $442,960 109,865 44,532 499,604 Total assets 3 468,885 116,921 52,207 540,260 Total deposits 442,875 n/m 43,055 486,857 $ in millions Total CBBDeposits Card Services Business Banking 3Q12
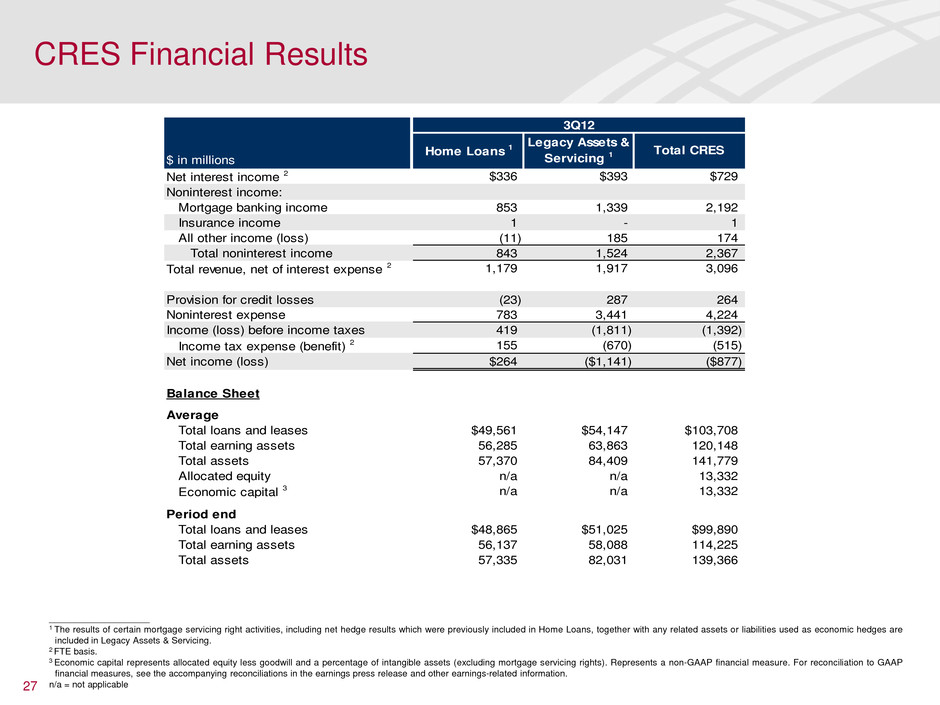
27 ____________________ 1 The results of certain mortgage servicing right activities, including net hedge results which were previously included in Home Loans, together with any related assets or liabilities used as economic hedges are included in Legacy Assets & Servicing. 2 FTE basis. 3 Economic capital represents allocated equity less goodwill and a percentage of intangible assets (excluding mortgage servicing rights). Represents a non-GAAP financial measure. For reconciliation to GAAP financial measures, see the accompanying reconciliations in the earnings press release and other earnings-related information. n/a = not applicable CRES Financial Results Net interest income 2 $336 $393 $729 Noninterest income: Mortgage banking income 853 1,339 2,192 Insurance income 1 - 1 All other income (loss) (11) 185 174 Total noninterest income 843 1,524 2,367 Total revenue, net of interest expense 2 1,179 1,917 3,096 Provision for credit losses (23) 287 264 Noninterest expense 783 3,441 4,224 Income (loss) before income taxes 419 (1,811) (1,392) Income tax expense (benefit) 2 155 (670) (515) Net income (loss) $264 ($1,141) ($877) Balance Sheet Average Total loans and leases $49,561 $54,147 $103,708 Total earning assets 56,285 63,863 120,148 Total assets 57,370 84,409 141,779 Allocated equity n/a n/a 13,332 Economic capital 3 n/a n/a 13,332 Period end Total loans and leases $48,865 $51,025 $99,890 Total earning assets 56,137 58,088 114,225 Total assets 57,335 82,031 139,366 $ in millions Total CRESHome Loans 1 Legacy Assets & Servicing 1 3Q12

Representations and Warranties Information
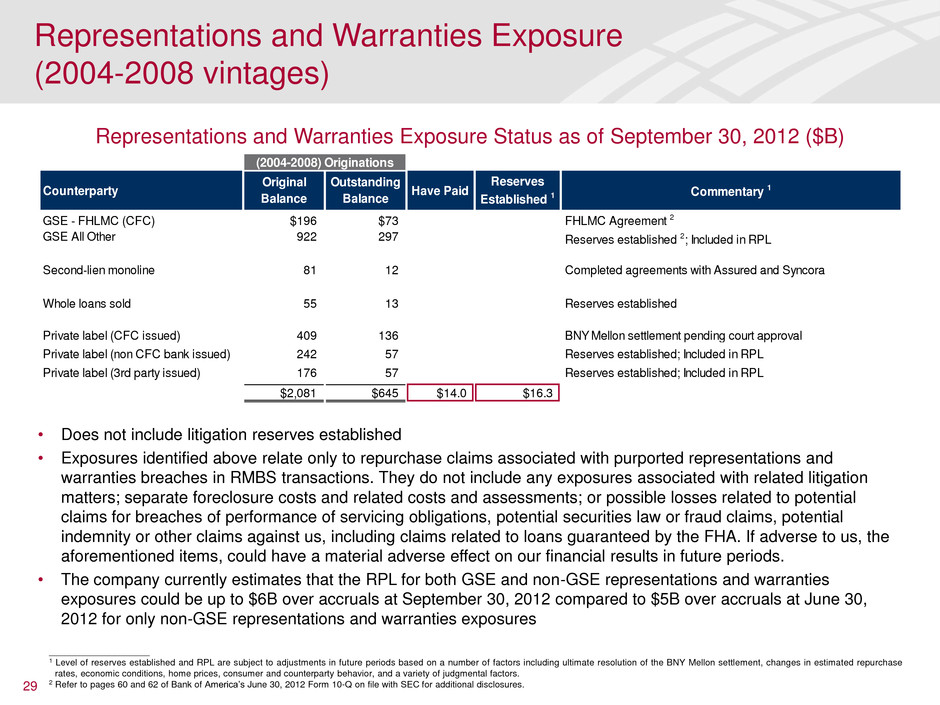
• Does not include litigation reserves established • Exposures identified above relate only to repurchase claims associated with purported representations and warranties breaches in RMBS transactions. They do not include any exposures associated with related litigation matters; separate foreclosure costs and related costs and assessments; or possible losses related to potential claims for breaches of performance of servicing obligations, potential securities law or fraud claims, potential indemnity or other claims against us, including claims related to loans guaranteed by the FHA. If adverse to us, the aforementioned items, could have a material adverse effect on our financial results in future periods. • The company currently estimates that the RPL for both GSE and non-GSE representations and warranties exposures could be up to $6B over accruals at September 30, 2012 compared to $5B over accruals at June 30, 2012 for only non-GSE representations and warranties exposures 29 ____________________ 1 Level of reserves established and RPL are subject to adjustments in future periods based on a number of factors including ultimate resolution of the BNY Mellon settlement, changes in estimated repurchase rates, economic conditions, home prices, consumer and counterparty behavior, and a variety of judgmental factors. 2 Refer to pages 60 and 62 of Bank of America’s June 30, 2012 Form 10-Q on file with SEC for additional disclosures. Representations and Warranties Exposure Status as of September 30, 2012 ($B) Representations and Warranties Exposure (2004-2008 vintages) Counterparty Original Balance Outstanding Balance Have Paid Reserves Established 1 Commentary 1 GSE - FHLMC (CFC) $196 $73 FHLMC Agreement 2 GSE All Other 922 297 Reserves established 2; Included in RPL Second-lien monoline 81 12 Completed agreements with Assured and Syncora Whole loans sold 55 13 Reserves established Privat label (CFC issued) 409 136 BNY Mellon settlement pending court approval Pr vate l bel (non CFC bank issued) 242 57 Reserves established; Included in RPL Private label (3rd party issued) 176 57 Reserves established; Included in RPL $2,081 $645 $14.0 $16.3 (2004-2008) Originations
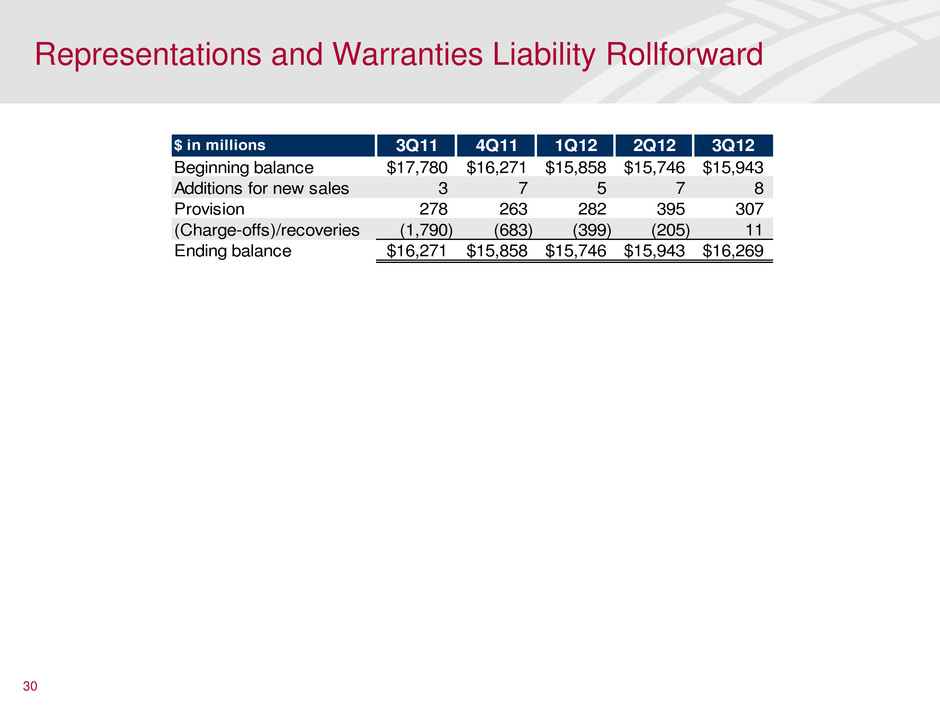
30 Representations and Warranties Liability Rollforward $ in millions 3Q11 4Q11 1Q12 2Q12 3Q12 Beginning balance $17,780 $16,271 $15,858 $15,746 $15,943 Additions for new sales 3 7 5 7 8 Provision 278 263 282 395 307 (Charge-offs)/recoveries (1,790) (683) (399) (205) 11 Ending balance $16,271 $15,858 $15,746 $15,943 $16,269
Additional Asset Quality Information
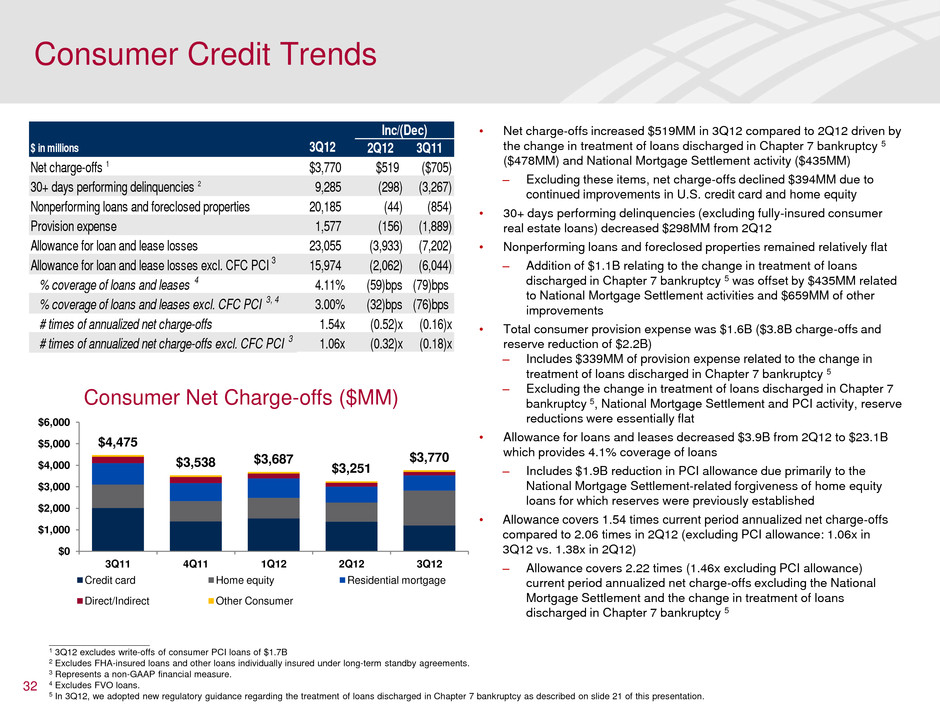
• Net charge-offs increased $519MM in 3Q12 compared to 2Q12 driven by the change in treatment of loans discharged in Chapter 7 bankruptcy 5 ($478MM) and National Mortgage Settlement activity ($435MM) – Excluding these items, net charge-offs declined $394MM due to continued improvements in U.S. credit card and home equity • 30+ days performing delinquencies (excluding fully-insured consumer real estate loans) decreased $298MM from 2Q12 • Nonperforming loans and foreclosed properties remained relatively flat – Addition of $1.1B relating to the change in treatment of loans discharged in Chapter 7 bankruptcy 5 was offset by $435MM related to National Mortgage Settlement activities and $659MM of other improvements • Total consumer provision expense was $1.6B ($3.8B charge-offs and reserve reduction of $2.2B) – Includes $339MM of provision expense related to the change in treatment of loans discharged in Chapter 7 bankruptcy 5 – Excluding the change in treatment of loans discharged in Chapter 7 bankruptcy 5, National Mortgage Settlement and PCI activity, reserve reductions were essentially flat • Allowance for loans and leases decreased $3.9B from 2Q12 to $23.1B which provides 4.1% coverage of loans – Includes $1.9B reduction in PCI allowance due primarily to the National Mortgage Settlement-related forgiveness of home equity loans for which reserves were previously established • Allowance covers 1.54 times current period annualized net charge-offs compared to 2.06 times in 2Q12 (excluding PCI allowance: 1.06x in 3Q12 vs. 1.38x in 2Q12) – Allowance covers 2.22 times (1.46x excluding PCI allowance) current period annualized net charge-offs excluding the National Mortgage Settlement and the change in treatment of loans discharged in Chapter 7 bankruptcy 5 32 ____________________ 1 3Q12 excludes write-offs of consumer PCI loans of $1.7B 2 Excludes FHA-insured loans and other loans individually insured under long-term standby agreements. 3 Represents a non-GAAP financial measure. 4 Excludes FVO loans. 5 In 3Q12, we adopted new regulatory guidance regarding the treatment of loans discharged in Chapter 7 bankruptcy as described on slide 21 of this presentation. Consumer Credit Trends $ in millions 2Q12 3Q11 Net charge-offs 1 $3,770 $519 ($705) 30+ days performing delinquencies 2 9,285 (298) (3,267) Nonperforming loans and foreclosed properties 20,185 (44) (854) Provision expense 1,577 (156) (1,889) Allowance for loan and lease losses 23,055 (3,933) (7,202) Allowance for loan and lease losses excl. CFC PCI 3 15,974 (2,062) (6,044) % coverage of loan and leases 4 4.11% (59)bps (79)bps % coverage of loans and l ses excl. CFC PCI 3, 4 3.00% (32)bps (76)bps # times of annualized net charge-offs 1.54x (0.52)x (0.16)x # times of annualized net charge-offs excl. CFC PCI 3 1.06x (0.32)x (0.18)x 3Q12 Inc/(Dec) Consumer Net Charge-offs ($MM) $4,475 $3,538 $3,687 $3,251 $3,770 $0 $1,000 $2,000 $3,000 $4,000 $5,000 $6,000 3Q11 4Q11 1Q12 2Q12 3Q12 Credit card Home equity Residential mortgage Direct/Indirect Other Consumer
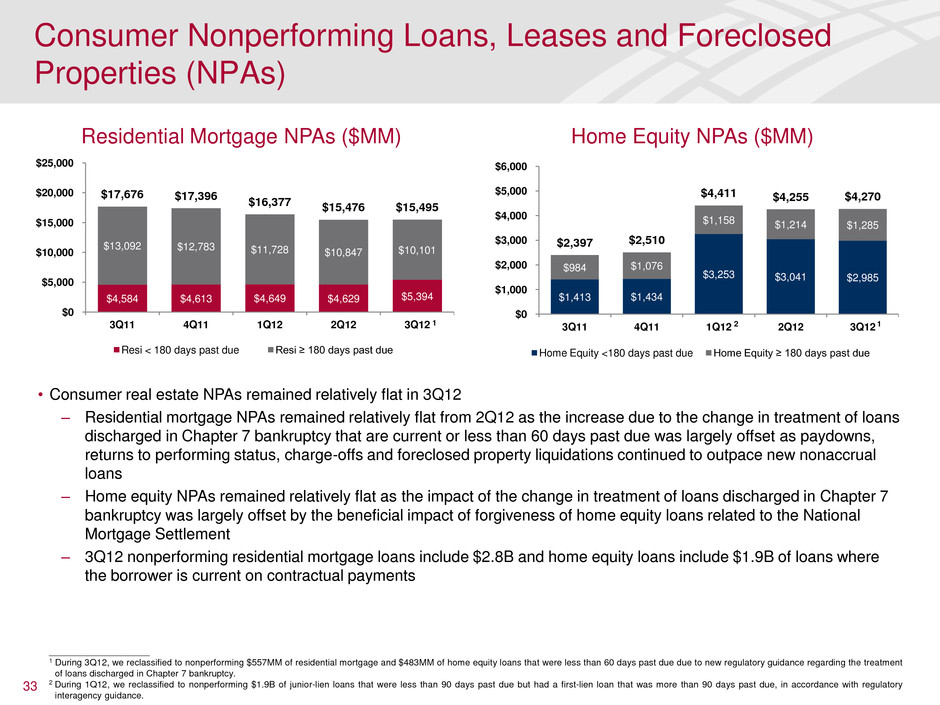
33 Residential Mortgage NPAs ($MM) Home Equity NPAs ($MM) Consumer Nonperforming Loans, Leases and Foreclosed Properties (NPAs) $4,584 $4,613 $4,649 $4,629 $5,394 $13,092 $12,783 $11,728 $10,847 $10,101 $17,676 $17,396 $16,377 $15,476 $15,495 $0 $5,000 $10,000 $15,000 $20,000 $25,000 3Q11 4Q11 1Q12 2Q12 3Q12 Resi < 180 days past due Resi ≥ 180 days past due $1,413 $1,434 $3,253 $3,041 $2,985 $984 $1,076 $1,158 $1,214 $1,285 $2,397 $2,510 $4,411 $4,255 $4,270 $0 $1,000 $2,000 $3,000 $4,000 $5,000 $6,000 3Q11 4Q11 1Q12 2Q12 3Q12 Home Equity <180 days past due Home Equity ≥ 180 days past due • Consumer real estate NPAs remained relatively flat in 3Q12 – Residential mortgage NPAs remained relatively flat from 2Q12 as the increase due to the change in treatment of loans discharged in Chapter 7 bankruptcy that are current or less than 60 days past due was largely offset as paydowns, returns to performing status, charge-offs and foreclosed property liquidations continued to outpace new nonaccrual loans – Home equity NPAs remained relatively flat as the impact of the change in treatment of loans discharged in Chapter 7 bankruptcy was largely offset by the beneficial impact of forgiveness of home equity loans related to the National Mortgage Settlement – 3Q12 nonperforming residential mortgage loans include $2.8B and home equity loans include $1.9B of loans where the borrower is current on contractual payments ____________________ 1 During 3Q12, we reclassified to nonperforming $557MM of residential mortgage and $483MM of home equity loans that were less than 60 days past due due to new regulatory guidance regarding the treatment of loans discharged in Chapter 7 bankruptcy. 2 During 1Q12, we reclassified to nonperforming $1.9B of junior-lien loans that were less than 90 days past due but had a first-lien loan that was more than 90 days past due, in accordance with regulatory interagency guidance. 1 2 1
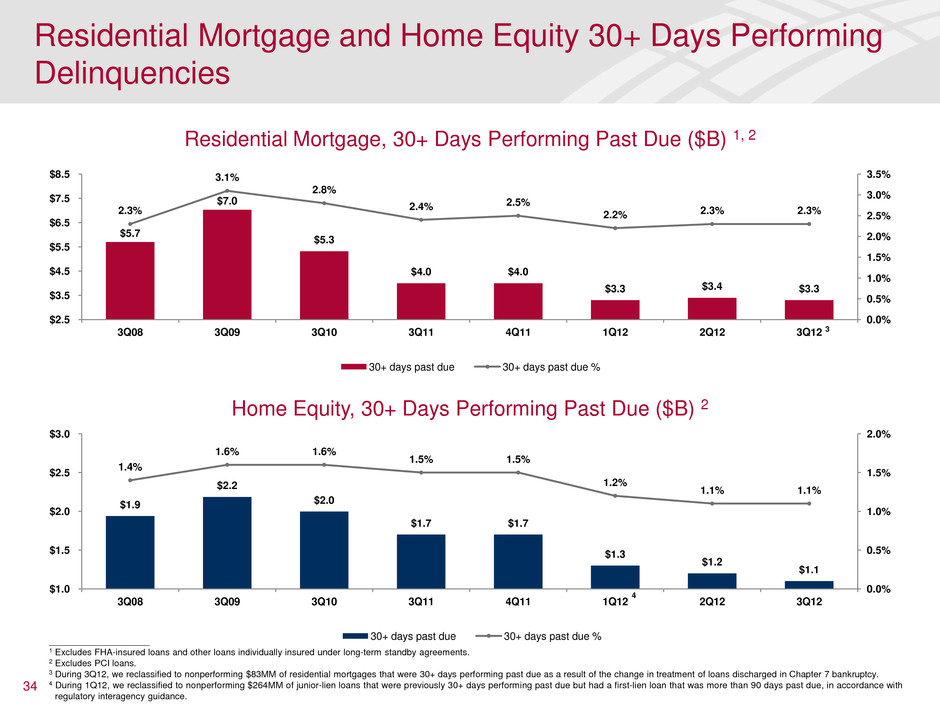
34 ____________________ 1 Excludes FHA-insured loans and other loans individually insured under long-term standby agreements. 2 Excludes PCI loans. 3 During 3Q12, we reclassified to nonperforming $83MM of residential mortgages that were 30+ days performing past due as a result of the change in treatment of loans discharged in Chapter 7 bankruptcy. 4 During 1Q12, we reclassified to nonperforming $264MM of junior-lien loans that were previously 30+ days performing past due but had a first-lien loan that was more than 90 days past due, in accordance with regulatory interagency guidance. Residential Mortgage, 30+ Days Performing Past Due ($B) 1, 2 Home Equity, 30+ Days Performing Past Due ($B) 2 Residential Mortgage and Home Equity 30+ Days Performing Delinquencies $5.7 $7.0 $5.3 $4.0 $4.0 $3.3 $3.4 $3.3 2.3% 3.1% 2.8% 2.4% 2.5% 2.2% 2.3% 2.3% 0.0% 0.5% 1.0% 1.5% 2.0% 2.5% 3.0% 3.5% $2.5 $3.5 $4.5 $5.5 $6.5 $7.5 $8.5 3Q08 3Q09 3Q10 3Q11 4Q11 1Q12 2Q12 3Q12 30+ days past due 30+ days past due % $1.9 $2.2 $2.0 $1.7 $1.7 $1.3 $1.2 $1.1 1.4% 1.6% 1.6% 1.5% 1.5% 1.2% 1.1% 1.1% 0.0% 0.5% 1.0% 1.5% 2.0% $1.0 $1.5 $2.0 $2.5 $3.0 3Q08 3Q09 3Q10 3Q11 4Q11 1Q12 2Q12 3Q12 30+ days past due 30+ days past due % 4 3
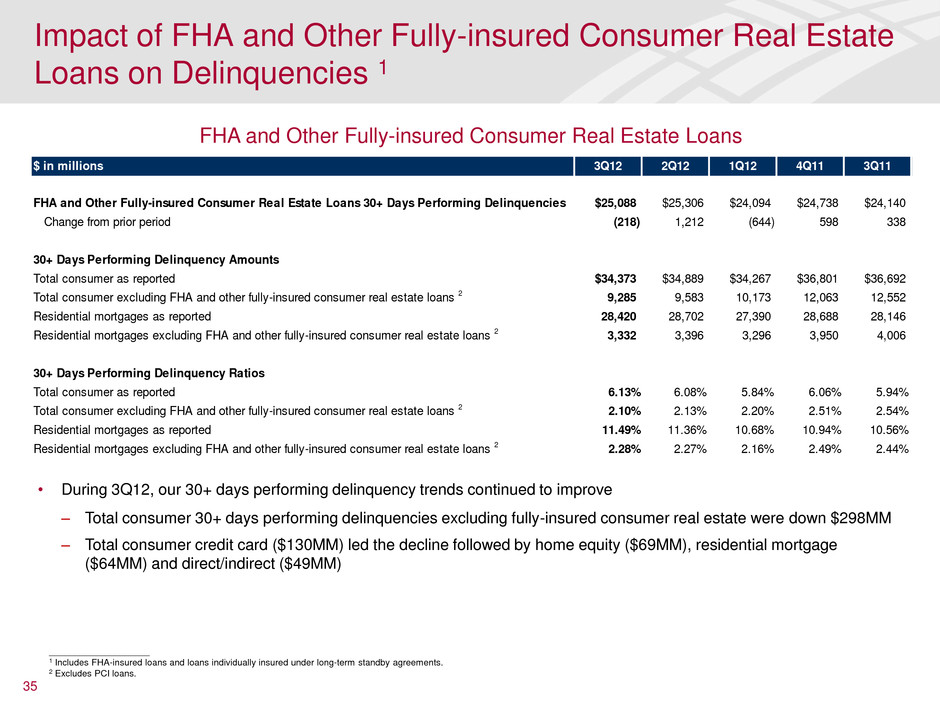
35 ____________________ 1 Includes FHA-insured loans and loans individually insured under long-term standby agreements. 2 Excludes PCI loans. FHA and Other Fully-insured Consumer Real Estate Loans • During 3Q12, our 30+ days performing delinquency trends continued to improve – Total consumer 30+ days performing delinquencies excluding fully-insured consumer real estate were down $298MM – Total consumer credit card ($130MM) led the decline followed by home equity ($69MM), residential mortgage ($64MM) and direct/indirect ($49MM) Impact of FHA and Other Fully-insured Consumer Real Estate Loans on Delinquencies 1 $ in millions 3Q12 2Q12 1Q12 4Q11 3Q11 FHA and Other Fully-insured Consumer Real Estate Loans 30+ Days Performing Delinquencies $25,088 $25,306 $24,094 $24,738 $24,140 Change from prior period (218) 1,212 (644) 598 338 30+ Days Performing Delinquency Amounts Total consumer as reported $34,373 $34,889 $34,267 $36,801 $36,692 Total consumer excluding FHA and other fully-insured consumer real estate loans 2 9,285 9,583 10,173 12,063 12,552 Residential mortgages as reported 28,420 28,702 27,390 28,688 28,146 Residential mortgages excluding FHA and other fully-insured consumer real estate loans 2 3,332 3,396 3,296 3,950 4,006 30+ Day Performing Delinquency Ratios Total consumer as reported 6.13% 6.08% 5.84% 6.06% 5.94% Total consumer excluding FHA and other fully-insured consumer real estate loans 2 2.10% 2.13% 2.20% 2.51% 2.54% Residential mortgages as reported 11.49% 11.36% 10.68% 10.94% 10.56% Residential mortgages excluding FHA and other fully-insured consumer real estate loans 2 2.28% 2.27% 2.16% 2.49% 2.44%
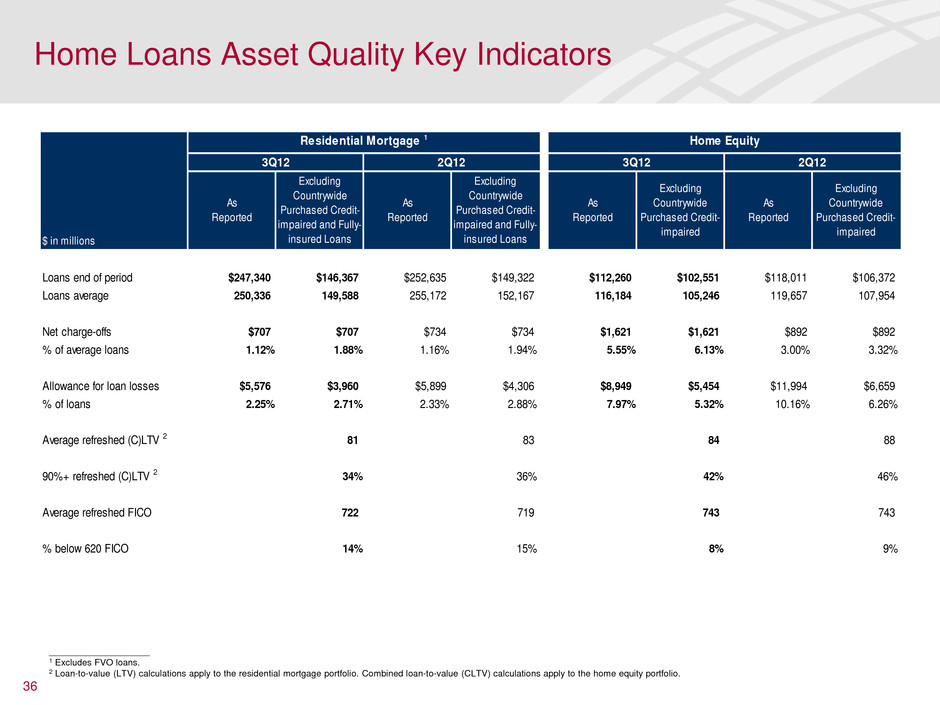
36 ____________________ 1 Excludes FVO loans. 2 Loan-to-value (LTV) calculations apply to the residential mortgage portfolio. Combined loan-to-value (CLTV) calculations apply to the home equity portfolio. Home Loans Asset Quality Key Indicators As Reported Excluding Countrywide Purchased Credit- impaired and Fully- insured Loans As Reported Excluding Countrywide Purchased Credit- impaired and Fully- insured Loans As Reported Excluding Countrywide Purchased Credit- impaired As Reported Excluding Countrywide Purchased Credit- impaired Loans end of period $247,340 $146,367 $252,635 $149,322 $112,260 $102,551 $118,011 $106,372 Loans average 250,336 149,588 255,172 152,167 116,184 105,246 119,657 107,954 Net charge-offs $707 $707 $734 $734 $1,621 $1,621 $892 $892 % of average loans 1.12% 1.88% 1.16% 1.94% 5.55% 6.13% 3.00% 3.32% Allowance for loan losses $5,576 $3,960 $5,899 $4,306 $8,949 $5,454 $11,994 $6,659 % of loans 2.25% 2.71% 2.33% 2.88% 7.97% 5.32% 10.16% 6.26% Average refreshed (C)LTV 2 81 83 84 88 90%+ refreshed (C)LTV 2 34% 36% 42% 46% Average refreshed FICO 722 719 743 743 % below 620 FICO 14% 15% 8% 9% $ in millions Residential Mortgage 1 Home Equity 3Q12 2Q12 3Q12 2Q12
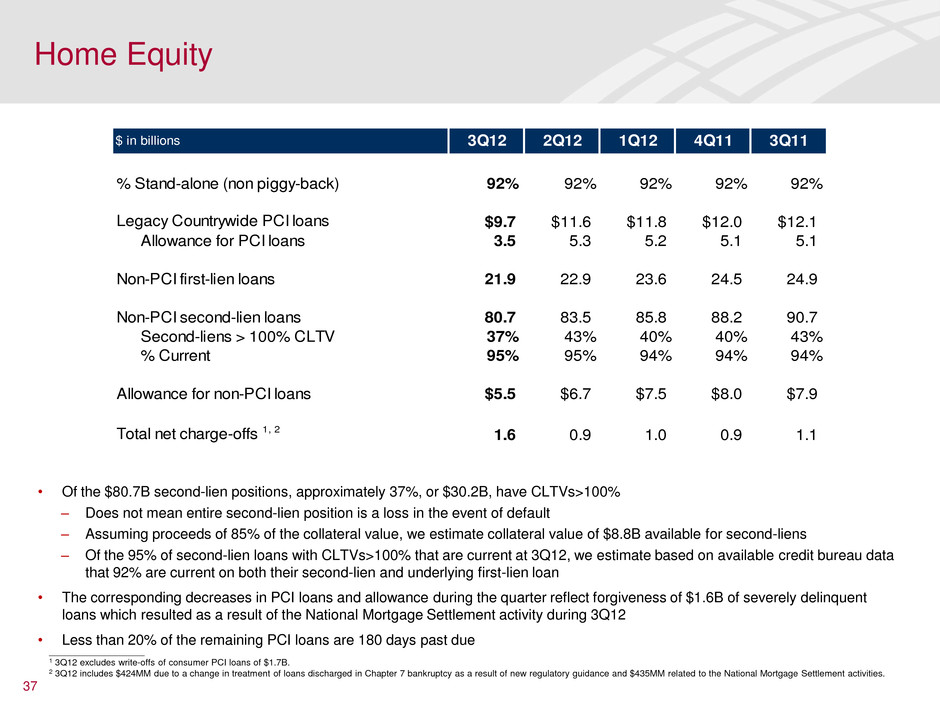
37 Home Equity • Of the $80.7B second-lien positions, approximately 37%, or $30.2B, have CLTVs>100% – Does not mean entire second-lien position is a loss in the event of default – Assuming proceeds of 85% of the collateral value, we estimate collateral value of $8.8B available for second-liens – Of the 95% of second-lien loans with CLTVs>100% that are current at 3Q12, we estimate based on available credit bureau data that 92% are current on both their second-lien and underlying first-lien loan • The corresponding decreases in PCI loans and allowance during the quarter reflect forgiveness of $1.6B of severely delinquent loans which resulted as a result of the National Mortgage Settlement activity during 3Q12 • Less than 20% of the remaining PCI loans are 180 days past due ___________________ 1 3Q12 excludes write-offs of consumer PCI loans of $1.7B. 2 3Q12 includes $424MM due to a change in treatment of loans discharged in Chapter 7 bankruptcy as a result of new regulatory guidance and $435MM related to the National Mortgage Settlement activities. $ in billions 3Q12 2Q12 1Q12 4Q11 3Q11 % Stand-alone (non piggy-back) 92% 92% 92% 92% 92% Legacy Countrywide PCI loans $9.7 $11.6 $11.8 $12.0 $12.1 Allowance for PCI loans 3.5 5.3 5.2 5.1 5.1 Non-PCI first-lien loans 21.9 22.9 23.6 24.5 24.9 Non-PCI second-lien loans 80.7 83.5 85.8 88.2 90.7 Second-liens > 100% CLTV 37% 43% 40% 40% 43% % Current 95% 95% 94% 94% 94% Allowance for non-PCI loans $5.5 $6.7 $7.5 $8.0 $7.9 Total net charge-offs 1, 2 1.6 0.9 1.0 0.9 1.1

• Net charge-offs in 3Q12 decreased slightly compared to 2Q12, but were $259MM (42%) lower than 3Q11 • Nonperforming loans, leases and foreclosed properties decreased $775MM (15%) from 2Q12 and $3.6B (45%) from 3Q11 – 11th consecutive quarter with declines; 68% decline from 4Q09 peak • Reservable criticized decreased $3.1B (15%) from 2Q12 and $13.5B (44%) from 3Q11 – 12th consecutive quarter with declines; 71% decline from 3Q09 peak • Recorded a reserve reduction of $155MM including unfunded lending commitments, $180MM lower than prior quarter. – Driven by stabilization in credit quality – Resulted in a $3.2B allowance for loan and lease losses which covers 2.27 times current period annualized net charge-offs compared to 2.18 times in 2Q12 38 ____________________ 1 Excludes FVO loans. Commercial Credit Trends $ in millions 2Q12 3Q11 Net charge-offs $352 ($23) ($259) Nonperforming loans, leases and foreclosed properties 4,373 (775) (3,647) Reservable criticiz d 17,374 (3,068) (13,527) Provision expens 197 157 197 Allowance for loan and lease losses 3,178 (122) (1,647) % coverage of lo ns and leases 1 0.98% (9)bps (61)bps # times annualized net charge-offs 2.27x 0.09x 0.28x 3Q12 Inc/(Dec) Commercial Net Charge-offs ($MM) $611 $516 $369 $375 $352 -$100 $100 $300 $500 $700 $900 3Q11 4Q11 1Q12 2Q12 3Q12 Small business Commercial real estate Commercial & Industrial Commercial lease financing
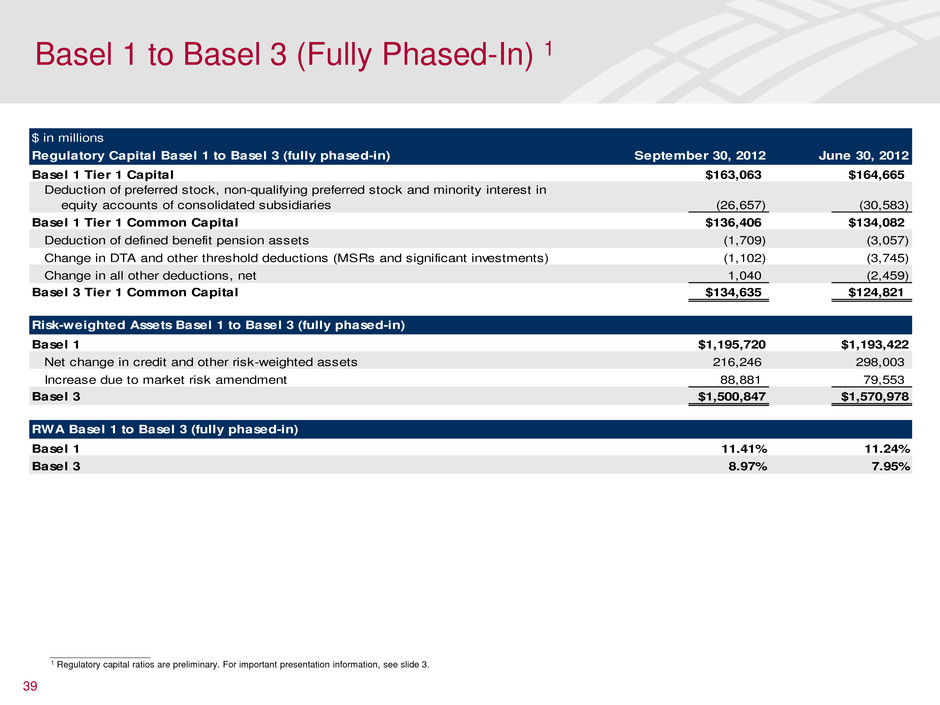
Basel 1 to Basel 3 (Fully Phased-In) 1 39 $ in millions Regulatory Capital Basel 1 to Basel 3 (fully phased-in) Basel 1 Tier 1 Capital $163,063 $164,665 Deduction of preferred stock, non-qualifying preferred stock and minority interest in equity accounts of consolidated subsidiaries (26,657) (30,583) Basel 1 Tier 1 Common Capital $136,406 $134,082 Deduction of defined benefit pension assets (1,709) (3,057) Change in DTA and other threshold deductions (MSRs and significant investments) (1,102) (3,745) Change in all other deductions, net 1,040 (2,459) Basel 3 Tier 1 Common Capital $134,635 $124,821 Risk-weighted Assets Basel 1 to Basel 3 (fully phased-in) Basel 1 $1,195,720 $1,193,422 Net change in credit and other risk-weighted assets 216,246 298,003 Increase due to market risk amendment 88,881 79,553 Basel 3 $1,500,847 $1,570,978 RWA Basel 1 to Basel 3 (fully phased-in) Basel 1 11.41% 11.24% Basel 3 8.97% 7.95% September 30, 2012 June 30, 2012 ____________________ 1 Regulatory capital ratios are preliminary. For important presentation information, see slide 3.
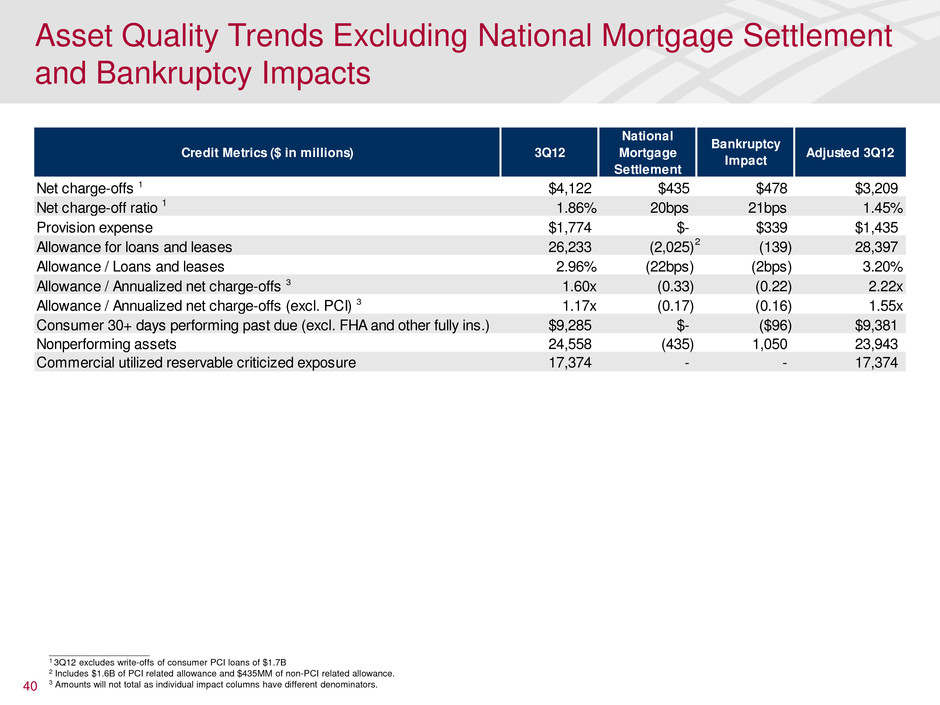
Asset Quality Trends Excluding National Mortgage Settlement and Bankruptcy Impacts 40 Credit Metrics ($ in millions) 3Q12 National Mortgage Settlement Bankruptcy Impact Adjusted 3Q12 Net charge-offs 1 $4,122 $435 $478 $3,209 Net charge-off ratio 1 1.86% 20bps 21bps 1.45% Provision expense $1,774 $- $339 $1,435 Allowance for loans and leases 26,233 (2,025) (139) 28,397 Allowance / Loans and leases 2.96% (22bps) (2bps) 3.20% Allowance / Annualized net charge-offs 3 1.60x (0.33) (0.22) 2.22x Allowance / Annualized net charge-offs (excl. PCI) 3 1.17x (0.17) (0.16) 1.55x Consumer 30+ days performing past due (excl. FHA and other fully ins.) $9,285 $- ($96) $9,381 Nonperforming assets 24,558 (435) 1,050 23,943 Commercial utilized reservable criticized exposure 17,374 - - 17,374 2 ____________________ 1 3Q12 excludes write-offs of consumer PCI loans of $1.7B 2 Includes $1.6B of PCI related allowance and $435MM of non-PCI related allowance. 3 Amounts will not total as individual impact columns have different denominators.
