Exhibit 99.2

Supplemental Information
Third Quarter 2002
October 15, 2002
This information is preliminary and based on company data available at the time of the presentation. It speaks only as of the particular date or dates included in the accompanying pages. Bank of America does not undertake an obligation to, and disclaims any duty to, correct or update any of the information provided. Any forward-looking statements in this information are subject to the forward-looking language contained in Bank of America’s reports filed with the SEC pursuant to the Securities Exchange Act of 1934, which are available at the SEC's website (www.sec.gov) or at Bank of America’s website (www.bankofamerica.com). Bank of America’s future financial performance is subject to risks and uncertainties as described in its SEC filings.
Bank of America Corporation
Results Overview
· | Diluted EPS of $1.45, up 4% from prior quarter and 6% over the third quarter of 2001, excluding prior year goodwill amortization expense and business exit charges. |
· | Consumer and Commercial Banking revenue grew 7% over the prior quarter and 11% over the third quarter of 2001. |
· | Consumer revenue strength included solid growth in net interest income as well as fee growth in mortgage, card and account service charge revenue. |
· | Steady deposit growth continues as a result of material improvements in customer satisfaction from quality and productivity initiatives as well as new account growth. |
· | Our market sensitive businesses, Global Corporate and Investment Banking, Asset Management and Equity Investments, experienced revenue declines of 18% from the prior quarter due to the continued weak market conditions. |
· | Net charge-offs declined from the prior quarter level as well as the third quarter 2001 level. |
· | Nonperforming assets rose 4% from prior quarter. |
Bank of America Corporation
Consolidated Financial Highlights
Year-to-Date 2002 | Year-to-Date 2001 | Third Quarter 2002 | Second Quarter 2002 | First Quarter 2002 | Fourth Quarter 2001 | Third Quarter 2001 | ||||||||||||||||||||||
(Dollars in millions, except per share information; shares in thousands) | ||||||||||||||||||||||||||||
Income statement | ||||||||||||||||||||||||||||
| Total revenue | $ | 25,690 | $ | 25,823 | $ | 8,522 | $ | 8,575 | $ | 8,593 | $ | 8,815 | $ | 8,633 | ||||||||||||||
| Provision for credit losses | 2,532 | 2,886 | 804 | 888 | 840 | 1,401 | 1,251 | |||||||||||||||||||||
| Gains on sales of securities | 326 | 82 | 189 | 93 | 44 | 393 | 97 | |||||||||||||||||||||
| Business exit costs | — | 1,305 | — | — | — | — | 1,305 | |||||||||||||||||||||
| Other noninterest expense | 13,604 | 14,081 | 4,620 | 4,490 | 4,494 | 5,324 | 4,606 | |||||||||||||||||||||
| Income tax expense | 3,245 | 2,899 | 1,052 | 1,069 | 1,124 | 426 | 727 | |||||||||||||||||||||
| Net income | 6,635 | 4,734 | 2,235 | 2,221 | 2,179 | 2,057 | 841 | |||||||||||||||||||||
| Diluted earnings per common share (1) | 4.22 | 2.90 | 1.45 | 1.40 | 1.38 | 1.28 | 0.51 | |||||||||||||||||||||
| Average diluted common shares outstanding | 1,573,203 | 1,632,928 | 1,546,347 | 1,592,250 | 1,581,848 | 1,602,886 | 1,634,063 | |||||||||||||||||||||
| Cash dividends paid per common share | $ | 1.80 | $ | 1.68 | $ | 0.60 | $ | 0.60 | $ | 0.60 | $ | 0.60 | $ | 0.56 | ||||||||||||||
Performance ratios | ||||||||||||||||||||||||||||
| Return on average assets | 1.36 | % | 0.98 | % | 1.33 | % | 1.38 | % | 1.39 | % | 1.25 | % | 0.52 | % | ||||||||||||||
| Return on average common shareholders’ equity | 18.71 | 13.03 | 19.02 | 18.47 | 18.64 | 16.70 | 6.78 | |||||||||||||||||||||
| Efficiency ratio (taxable-equivalent basis) | 52.09 | 59.00 | 53.19 | 51.34 | 51.74 | 59.80 | 67.79 | |||||||||||||||||||||
| Book value per share of common stock | $ | 32.07 | $ | 31.66 | $ | 32.07 | $ | 31.47 | $ | 31.15 | $ | 31.07 | $ | 31.66 | ||||||||||||||
| Market price per share of common stock: | ||||||||||||||||||||||||||||
| High for the period | $ | 77.08 | $ | 65.54 | $ | 71.94 | $ | 77.08 | $ | 69.61 | $ | 64.99 | $ | 65.54 | ||||||||||||||
| Low for the period | 57.51 | 45.00 | 57.90 | 66.82 | 57.51 | 52.10 | 50.25 | |||||||||||||||||||||
| Closing price | 63.80 | 58.40 | 63.80 | 70.36 | 68.02 | 62.95 | 58.40 | |||||||||||||||||||||
| Market capitalization | 95,838 | 92,396 | 95,838 | 106,642 | 105,058 | 98,158 | 92,396 | |||||||||||||||||||||
| Number of banking centers | 4,226 | 4,259 | 4,226 | 4,232 | 4,246 | 4,253 | 4,259 | |||||||||||||||||||||
| Number of ATM's | 12,489 | 12,986 | 12,489 | 12,827 | 13,161 | 13,113 | 12,986 | |||||||||||||||||||||
| Full-time equivalent employees | 134,135 | 143,824 | 134,135 | 135,489 | 137,240 | 142,670 | 143,824 | |||||||||||||||||||||
| (1) | Includes goodwill amortization of $.29 per share for year-to-date 2001 and $.09 per share in the fourth and third quarters of 2001. |
Year-to-Date 2002 | Year-to-Date 2001 | Third Quarter 2002 | Second Quarter 2002 | First Quarter 2002 | Fourth Quarter 2001 | Third Quarter 2001 | ||||||||||||||||||||||
(Dollars in millions, except per share information; shares in thousands) | ||||||||||||||||||||||||||||
Supplemental Financial Data | ||||||||||||||||||||||||||||
Performance Metrics—Excludes nonrecurring charges (2) | ||||||||||||||||||||||||||||
| Return on average assets | 1.36 | % | 1.23 | % | 1.33 | % | 1.38 | % | 1.39 | % | 1.25 | % | 1.29 | % | ||||||||||||||
| Return on average common shareholders’ equity | 18.71 | 16.48 | 19.02 | 18.47 | 18.64 | 16.70 | 16.87 | |||||||||||||||||||||
| Efficiency ratio (taxable-equivalent basis) | 52.09 | 53.99 | 53.19 | 51.34 | 51.74 | 59.80 | 52.82 | |||||||||||||||||||||
| Shareholder value added | $ | 2,546 | $ | 2,293 | $ | 880 | $ | 834 | $ | 832 | $ | 793 | $ | 824 | ||||||||||||||
Taxable-equivalent basis data | ||||||||||||||||||||||||||||
| Net interest income | $ | 15,974 | $ | 15,128 | $ | 5,465 | $ | 5,262 | $ | 5,247 | $ | 5,505 | $ | 5,290 | ||||||||||||||
| Total Revenue | 26,115 | 26,078 | 8,685 | 8,743 | 8,687 | 8,903 | 8,719 | |||||||||||||||||||||
| Net interest yield | 3.78 | % | 3.59 | % | 3.75 | % | 3.75 | % | 3.85 | % | 3.95 | % | 3.78 | % | ||||||||||||||
| (2) | Excludes nonrecurring charges for provision for credit losses of $395 million and noninterest expense of $1.3 billion, both of which are related to the exit of certain consumer finance businesses in the third quarter of 2001. Noninterest expense charges consisted of goodwill write-offs, auto lease residual charges, real estate servicing asset charges and other transaction costs. The impact of business exit charges on net income for the three months ended September 30, 2001 was $1.25 billion or $0.77 per share (diluted). The impact of business exit charges on net income for the nine months ended September 30, 2001 was $1.25 billion or $0.76 per share (diluted). Nonrecurring charges are charges associated with a one time event that is not reasonably expected to recur in the foreseeable future. The Corporation believes that the exclusion of nonrecurring charges provides a meaningful comparison to results in prior periods and reflects the results of its core operations. |
Certain prior period amounts have been reclassified to conform to current period classifications.
Bank of America Corporation
Consolidated Statement of Income
Year-to - Date 2002 | Year-to - Date 2001 | Third Quarter 2002 | Second Quarter 2002 | First Quarter 2002 | Fourth Quarter 2001 | Third Quarter 2001 | |||||||||||||||||||
(Dollars in millions, except per share information; shares in thousands) | |||||||||||||||||||||||||
Interest income | |||||||||||||||||||||||||
| Interest and fees on loan and leases | $ | 16,528 | $ | 21,455 | $ | 5,553 | $ | 5,530 | $ | 5,445 | $ | 5,824 | $ | 6,543 | |||||||||||
| Interest and dividends on securities | 2,974 | 2,631 | 1,104 | 924 | 946 | 1,075 | 892 | ||||||||||||||||||
| Federal funds sold and securities purchased under agreements to resell | 662 | 1,161 | 177 | 270 | 215 | 254 | 321 | ||||||||||||||||||
| Trading account assets | 2,832 | 2,712 | 1,006 | 948 | 878 | 912 | 930 | ||||||||||||||||||
| Other interest income | 1,044 | 1,529 | 345 | 312 | 387 | 740 | 636 | ||||||||||||||||||
| Total interest income | 24,040 | 29,488 | 8,185 | 7,984 | 7,871 | 8,805 | 9,322 | ||||||||||||||||||
Interest expense | |||||||||||||||||||||||||
| Deposits | 4,142 | 7,173 | 1,414 | 1,384 | 1,344 | 1,713 | 2,097 | ||||||||||||||||||
| Short-term borrowings | 1,532 | 3,467 | 526 | 529 | 477 | 700 | 869 | ||||||||||||||||||
| Trading account liabilities | 971 | 887 | 342 | 344 | 285 | 268 | 285 | ||||||||||||||||||
| Long-term debt | 1,846 | 3,088 | 601 | 633 | 612 | 707 | 867 | ||||||||||||||||||
| Total interest expense | 8,491 | 14,615 | 2,883 | 2,890 | 2,718 | 3,388 | 4,118 | ||||||||||||||||||
Net interest income | 15,549 | 14,873 | 5,302 | 5,094 | 5,153 | 5,417 | 5,204 | ||||||||||||||||||
Noninterest income | |||||||||||||||||||||||||
| Consumer service charges | 2,189 | 2,120 | 763 | 734 | 692 | 746 | 712 | ||||||||||||||||||
| Corporate service charges | 1,717 | 1,538 | 585 | 565 | 567 | 540 | 528 | ||||||||||||||||||
| Total service charges | 3,906 | 3,658 | 1,348 | 1,299 | 1,259 | 1,286 | 1,240 | ||||||||||||||||||
| Consumer investment and brokerage services | 1,174 | 1,164 | 373 | 420 | 381 | 382 | 386 | ||||||||||||||||||
| Corporate investment and brokerage services | 522 | 415 | 174 | 178 | 170 | 151 | 142 | ||||||||||||||||||
| Total investment and brokerage services | 1,696 | 1,579 | 547 | 598 | 551 | 533 | 528 | ||||||||||||||||||
| Mortgage banking income | 545 | 426 | 218 | 135 | 192 | 167 | 109 | ||||||||||||||||||
| Investment banking income | 1,123 | 1,106 | 318 | 464 | 341 | 473 | 305 | ||||||||||||||||||
| Equity investment gains/(losses) | (226 | ) | 340 | (216 | ) | (36 | ) | 26 | (49 | ) | 22 | ||||||||||||||
| Card income | 1,881 | 1,792 | 685 | 620 | 576 | 629 | 618 | ||||||||||||||||||
| Trading account profits (1) | 679 | 1,508 | 71 | 263 | 345 | 334 | 433 | ||||||||||||||||||
| Other income | 537 | 541 | 249 | 138 | 150 | 25 | 174 | ||||||||||||||||||
Total noninterest income | 10,141 | 10,950 | 3,220 | 3,481 | 3,440 | 3,398 | 3,429 | ||||||||||||||||||
Total revenue | 25,690 | 25,823 | 8,522 | 8,575 | 8,593 | 8,815 | 8,633 | ||||||||||||||||||
Provision for credit losses (2) | 2,532 | 2,886 | 804 | 888 | 840 | 1,401 | 1,251 | ||||||||||||||||||
Gains on sales of securities | 326 | 82 | 189 | 93 | 44 | 393 | 97 | ||||||||||||||||||
Noninterest expense | |||||||||||||||||||||||||
| Personnel | 7,200 | 7,239 | 2,368 | 2,386 | 2,446 | 2,590 | 2,304 | ||||||||||||||||||
| Occupancy | 1,330 | 1,309 | 457 | 441 | 432 | 465 | 448 | ||||||||||||||||||
| Equipment | 832 | 835 | 291 | 279 | 262 | 280 | 273 | ||||||||||||||||||
| Marketing | 550 | 516 | 210 | 170 | 170 | 166 | 165 | ||||||||||||||||||
| Professional fees | 339 | 411 | 126 | 122 | 91 | 153 | 144 | ||||||||||||||||||
| Amortization of intangibles | 164 | 665 | 54 | 55 | 55 | 213 | 219 | ||||||||||||||||||
| Data processing | 726 | 552 | 295 | 226 | 205 | 224 | 175 | ||||||||||||||||||
| Telecommunications | 361 | 368 | 119 | 123 | 119 | 116 | 121 | ||||||||||||||||||
| Business exit costs (2) | — | 1,305 | — | — | — | — | 1,305 | ||||||||||||||||||
| Other general operating | 2,102 | 2,186 | 700 | 688 | 714 | 1,117 | 757 | ||||||||||||||||||
Total noninterest expense | 13,604 | 15,386 | 4,620 | 4,490 | 4,494 | 5,324 | 5,911 | ||||||||||||||||||
Income before income taxes | 9,880 | 7,633 | 3,287 | 3,290 | 3,303 | 2,483 | 1,568 | ||||||||||||||||||
Income tax expense | 3,245 | 2,899 | 1,052 | 1,069 | 1,124 | 426 | 727 | ||||||||||||||||||
Net income | $ | 6,635 | $ | 4,734 | $ | 2,235 | $ | 2,221 | $ | 2,179 | $ | 2,057 | $ | 841 | |||||||||||
Income available to common shareholders | 6,631 | 4,730 | 2,233 | 2,220 | 2,178 | 2,056 | 839 | ||||||||||||||||||
Per common share information | |||||||||||||||||||||||||
| Earnings | 4.34 | 2.95 | 1.49 | 1.45 | 1.41 | 1.31 | 0.52 | ||||||||||||||||||
| Diluted earnings(3) | 4.22 | 2.90 | 1.45 | 1.40 | 1.38 | 1.28 | 0.51 | ||||||||||||||||||
| Dividends | 1.80 | 1.68 | 0.60 | 0.60 | 0.60 | 0.60 | 0.56 | ||||||||||||||||||
Average common shares issued and outstanding | 1,526,946 | 1,603,340 | 1,504,017 | 1,533,783 | 1,543,471 | 1,570,083 | 1,599,692 | ||||||||||||||||||
Average diluted common shares issued and outstanding | 1,573,203 | 1,632,928 | 1,546,347 | 1,592,250 | 1,581,848 | 1,602,886 | 1,634,063 | ||||||||||||||||||
| (1) | Trading account profits for year-to-date 2001 included the $83 million transition adjustment loss resulting from adoption of Statement of Financial Accounting Standards No.133, “Accounting for Derivative Instruments and Hedging Activities,” on January 1, 2001. |
| (2) | Results include provision for credit losses of $395 million and noninterest expense of $1.3 billion, both of which are related to the exit of certain consumer finance businesses in the third quarter of 2001. |
| (3) | Includes goodwill amortization of $.29 per share in year-to-date 2001 and $.09 per share in the fourth and third quarters of 2001. |
Certain prior period amounts have been reclassified to conform to current period presentation.
Bank of America Corporation
Consolidated Balance Sheet
September 30 2002 | June 30 2002 | September 30 2001 | ||||||||||
(Dollars in millions) | ||||||||||||
Assets | ||||||||||||
| Cash and cash equivalents | $ | 24,469 | $ | 21,309 | $ | 23,280 | ||||||
| Time deposits placed and other short-term investments | 6,397 | 6,307 | 4,629 | |||||||||
| Federal funds sold and securities purchased under agreements to resell | 40,371 | 35,449 | 26,450 | |||||||||
| Trading account assets | 56,907 | 63,466 | 53,471 | |||||||||
| Derivative assets | 32,838 | 24,809 | 23,816 | |||||||||
| Securities: | ||||||||||||
| Available-for-sale | 88,571 | 82,143 | 74,815 | |||||||||
| Held-to-maturity | 1,010 | 1,020 | 1,149 | |||||||||
| Total securities | 89,581 | 83,163 | 75,964 | |||||||||
| Loans and leases | 341,091 | 340,394 | 339,018 | |||||||||
| Allowance for credit losses | (6,861 | ) | (6,873 | ) | (6,665 | ) | ||||||
| Loans and leases, net of allowance for credit losses | 334,230 | 333,521 | 332,353 | |||||||||
| Premises and equipment, net | 6,758 | 6,755 | 6,372 | |||||||||
| Mortgage banking assets | 2,129 | 3,404 | 3,477 | |||||||||
| Goodwill | 11,389 | 10,950 | 11,028 | |||||||||
| Core deposits and other intangibles | 1,127 | 1,184 | 1,330 | |||||||||
| Other assets | 53,812 | 48,131 | 77,935 | |||||||||
Total assets | $ | 660,008 | $ | 638,448 | $ | 640,105 | ||||||
Liabilities | ||||||||||||
| Deposits in domestic offices: | ||||||||||||
| Noninterest-bearing | $ | 116,847 | $ | 101,163 | $ | 98,881 | ||||||
| Interest-bearing | 228,174 | 224,582 | 215,569 | |||||||||
| Deposits in foreign offices: | ||||||||||||
| Noninterest-bearing | 1,928 | 1,750 | 1,854 | |||||||||
| Interest-bearing | 30,466 | 33,274 | 43,566 | |||||||||
| Total deposits | 377,415 | 360,769 | 359,870 | |||||||||
| Federal funds purchased and securities sold under agreements to repurchase | 61,823 | 56,678 | 59,839 | |||||||||
| Trading account liabilities | 26,031 | 25,751 | 22,575 | |||||||||
| Derivative liabilities | 23,701 | 17,800 | 18,193 | |||||||||
| Commercial paper | 149 | 1,946 | 2,544 | |||||||||
| Other short-term borrowings | 34,272 | 31,027 | 20,396 | |||||||||
| Accrued expenses and other liabilities | 22,393 | 32,002 | 40,369 | |||||||||
| Long-term debt | 59,954 | 59,181 | 61,213 | |||||||||
| Trust preferred securities | 6,031 | 5,530 | 4,955 | |||||||||
Total liabilities | 611,769 | 590,684 | 589,954 | |||||||||
Shareholders’ equity | ||||||||||||
| Preferred stock, $0.01 par value; authorized—100,000,000 shares; issued and outstanding 1,391,749, 1,411,750 and 1,556,979 shares | 60 | 60 | 67 | |||||||||
| Common stock, $0.01 par value; authorized—5,000,000,000 shares; issued and outstanding 1,502,161,891, 1,515,667,160 and 1,582,129,416 shares | 674 | 1,499 | 6,491 | |||||||||
| Retained earnings | 46,870 | 45,546 | 41,857 | |||||||||
| Accumulated other comprehensive income/(loss) | 613 | 660 | 1,731 | |||||||||
| Other | 22 | (1 | ) | 5 | ||||||||
Total shareholders’ equity | 48,239 | 47,764 | 50,151 | |||||||||
Total liabilities and shareholders’ equity | $ | 660,008 | $ | 638,448 | $ | 640,105 | ||||||
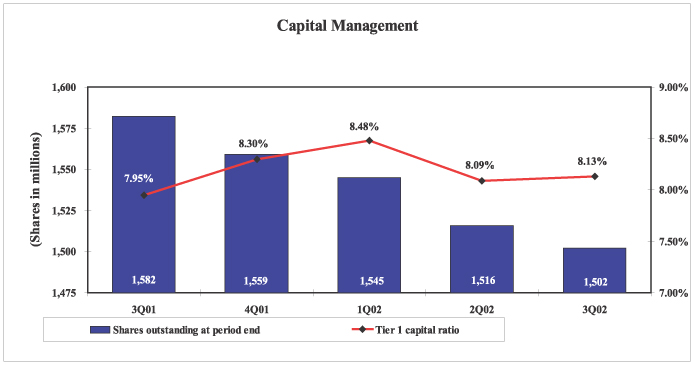
Bank of America Corporation
Capital Management
3Q01 | 4Q01 | 1Q02 | 2Q02 | 3Q02* | ||||||||||||||||
(Dollars in millions) | ||||||||||||||||||||
| Tier 1 capital | $ | 41,517 | $ | 41,979 | $ | 42,078 | $ | 41,097 | $ | 41,732 | ||||||||||
| Total capital | 63,311 | 64,124 | 64,158 | 63,108 | 63,505 | |||||||||||||||
| Net risk-weighted assets | 522,291 | 506,020 | 496,227 | 508,008 | 513,085 | |||||||||||||||
| Tier 1 capital ratio | 7.95 | % | 8.30 | % | 8.48 | % | 8.09 | % | 8.13 | % | ||||||||||
| Total capital ratio | 12.12 | 12.67 | 12.93 | 12.42 | 12.38 | |||||||||||||||
| Ending equity / ending assets | 7.83 | 7.80 | 7.77 | 7.48 | 7.31 | |||||||||||||||
| Ending capital / ending assets | 8.61 | 8.69 | 8.66 | 8.35 | 8.22 | |||||||||||||||
| Average equity / average assets | 7.66 | 7.50 | 7.44 | 7.47 | 6.97 | |||||||||||||||
| * | Preliminary |
Share Repurchase Program
99 million common shares were repurchased in the first nine months of 2002 as a part of ongoing share repurchase programs. 17 million common shares were repurchased during the third quarter of 2002.
33 million shares remain outstanding under current authorized program.
42 million shares were issued in the first three quarters of 2002 with 3 million shares issued during the third quarter, as part of stock option plans.
Bank of America Corporation
Average Balances and Interest Rates—Taxable-Equivalent Basis
Third Quarter 2002 | Second Quarter 2002 | Third Quarter 2001 | |||||||||||||||||||||||||
Average Balance | Interest Income/ Expense | Yield/ Rate | Average Balance | Interest Income/ Expense | Yield/ Rate | Average Balance | Interest Income/ Expense | Yield/ Rate | |||||||||||||||||||
(Dollars in millions) | |||||||||||||||||||||||||||
Earning assets | |||||||||||||||||||||||||||
| Time deposits placed and other short-term investments | $ | 10,396 | $ | 63 | 2.41 | % | $ | 10,673 | $ | 63 | 2.37 | % | $ | 5,881 | $ | 71 | 4.84 | % | |||||||||
| Federal funds sold and securities purchased under agreements to resell | 40,294 | 178 | 1.76 | 48,426 | 270 | 2.23 | 36,133 | 321 | 3.54 | ||||||||||||||||||
| Trading account assets | 85,129 | 1,017 | 4.76 | 78,113 | 961 | 4.93 | 68,258 | 937 | 5.46 | ||||||||||||||||||
| Total securities(1) | 76,484 | 1,120 | 5.85 | 67,291 | 939 | 5.59 | 58,930 | 902 | 6.12 | ||||||||||||||||||
| Loans and leases(2) | |||||||||||||||||||||||||||
| Commercial—domestic | 106,039 | 1,728 | 6.47 | 111,522 | 1,887 | 6.78 | 129,673 | 2,343 | 7.17 | ||||||||||||||||||
| Commercial—foreign | 21,256 | 206 | 3.85 | 21,454 | 212 | 3.97 | 25,267 | 353 | 5.54 | ||||||||||||||||||
| Commercial real estate—domestic | 20,576 | 265 | 5.10 | 21,486 | 258 | 4.83 | 24,132 | 395 | 6.50 | ||||||||||||||||||
| Commercial real estate—foreign | 425 | 4 | 3.92 | 393 | 5 | 5.14 | 366 | 5 | 5.78 | ||||||||||||||||||
| Total commercial | 148,296 | 2,203 | 5.90 | 154,855 | 2,362 | 6.12 | 179,438 | 3,096 | 6.85 | ||||||||||||||||||
| Residential mortgage | 104,590 | 1,733 | 6.61 | 94,726 | 1,602 | 6.77 | 80,526 | 1,457 | 7.22 | ||||||||||||||||||
| Home equity lines | 23,275 | 314 | 5.35 | 22,579 | 305 | 5.41 | 22,115 | 394 | 7.06 | ||||||||||||||||||
| Direct/Indirect consumer | 30,029 | 530 | 7.01 | 30,021 | 542 | 7.25 | 30,670 | 607 | 7.85 | ||||||||||||||||||
| Consumer finance | 10,043 | 201 | 7.97 | 11,053 | 226 | 8.20 | 25,169 | 505 | 8.00 | ||||||||||||||||||
| Bankcard | 22,263 | 583 | 10.38 | 20,402 | 510 | 10.01 | 17,632 | 493 | 11.11 | ||||||||||||||||||
| Foreign consumer | 1,988 | 19 | 3.83 | 2,048 | 19 | 3.71 | 2,176 | 28 | 5.28 | ||||||||||||||||||
| Total consumer | 192,188 | 3,380 | 7.00 | 180,829 | 3,204 | 7.10 | 178,288 | 3,484 | 7.78 | ||||||||||||||||||
| Total loans and leases | 340,484 | 5,583 | 6.52 | 335,684 | 5,566 | 6.65 | 357,726 | 6,580 | 7.31 | ||||||||||||||||||
| Other earning assets | 27,461 | 387 | 5.61 | 22,005 | 353 | 6.42 | �� | 30,180 | 597 | 7.89 | |||||||||||||||||
| Total earning assets(3) | 580,248 | 8,348 | 5.73 | 562,192 | 8,152 | 5.81 | 557,108 | 9,408 | 6.72 | ||||||||||||||||||
| Cash and cash equivalents | 20,202 | 21,200 | 20,753 | ||||||||||||||||||||||||
| Other assets, less allowance for credit losses | 68,699 | 63,207 | 64,323 | ||||||||||||||||||||||||
Total assets | $ | 669,149 | $ | 646,599 | $ | 642,184 | |||||||||||||||||||||
Interest-bearing liabilities | |||||||||||||||||||||||||||
| Domestic interest-bearing deposits: | |||||||||||||||||||||||||||
| Savings | $ | 22,047 | 36 | 0.64 | $ | 21,841 | 34 | 0.64 | $ | 20,076 | 53 | 1.04 | |||||||||||||||
| NOW and money market deposit accounts | 132,939 | 362 | 1.08 | 129,856 | 346 | 1.07 | 116,638 | 588 | 2.00 | ||||||||||||||||||
| Consumer CDs and IRAs | 67,179 | 746 | 4.40 | 68,015 | 764 | 4.51 | 73,465 | 918 | 4.95 | ||||||||||||||||||
| Negotiable CDs, public funds and other time deposits | 4,254 | 51 | 4.73 | 4,635 | 30 | 2.43 | 5,085 | 57 | 4.44 | ||||||||||||||||||
| Total domestic interest-bearing deposits | 226,419 | 1,195 | 2.09 | 224,347 | 1,174 | 2.10 | 215,264 | 1,616 | 2.98 | ||||||||||||||||||
| Foreign interest-bearing deposits(4) | |||||||||||||||||||||||||||
| Banks located in foreign countries | 17,044 | 123 | 2.85 | 14,048 | 108 | 3.10 | 24,097 | 257 | 4.22 | ||||||||||||||||||
| Governments and official institutions | 2,188 | 10 | 1.85 | 2,449 | 12 | 1.89 | 3,533 | 35 | 3.90 | ||||||||||||||||||
| Time, savings, and other | 18,686 | 86 | 1.83 | 18,860 | 90 | 1.91 | 23,847 | 189 | 3.16 | ||||||||||||||||||
| Total foreign interest-bearing deposits | 37,918 | 219 | 2.29 | 35,357 | 210 | 2.38 | 51,477 | 481 | 3.71 | ||||||||||||||||||
| Total interest-bearing deposits | 264,337 | 1,414 | 2.12 | 259,704 | 1,384 | 2.14 | 266,741 | 2,097 | 3.12 | ||||||||||||||||||
| Federal funds purchased, securities sold under agreements to repurchase and other short-term borrowings | 108,281 | 526 | 1.93 | 97,579 | 529 | 2.17 | 89,042 | 869 | 3.87 | ||||||||||||||||||
| Trading account liabilities | 33,038 | 342 | 4.11 | 31,841 | 344 | 4.34 | 30,913 | 285 | 3.66 | ||||||||||||||||||
| Long-term debt and trust preferred securities | 64,880 | 601 | 3.71 | 65,940 | 633 | 3.84 | 67,267 | 867 | 5.15 | ||||||||||||||||||
| Total interest-bearing liabilities(3) | 470,536 | 2,883 | 2.44 | 455,064 | 2,890 | 2.55 | 453,963 | 4,118 | 3.61 | ||||||||||||||||||
| Noninterest-bearing sources: | |||||||||||||||||||||||||||
| Noninterest-bearing deposits | 109,596 | 106,282 | 96,587 | ||||||||||||||||||||||||
| Other liabilities | 42,365 | 36,979 | 42,432 | ||||||||||||||||||||||||
| Shareholders’ equity | 46,652 | 48,274 | 49,202 | ||||||||||||||||||||||||
Total liabilities and shareholders’ equity | $ | 669,149 | $ | 646,599 | $ | 642,184 | |||||||||||||||||||||
| Net interest spread | 3.29 | 3.26 | 3.11 | ||||||||||||||||||||||||
| Impact of noninterest-bearing sources | 0.46 | 0.49 | 0.67 | ||||||||||||||||||||||||
Net interest income/yield on earning assets(4) | $ | 5,465 | 3.75 | % | $ | 5,262 | 3.75 | % | $ | 5,290 | 3.78 | % | |||||||||||||||
| (1) | The average balance and yield on securities are based on the average of historical amortized cost balances. |
| (2) | Nonperforming loans are included in the respective average loan balances. Income on such nonperforming loans is recognized on a cash basis. |
| (3) | Interest income includes the impact of interest rate risk management contracts, which increased interest income by $397 million and $509 million in the third and second quarters of 2002 and $284 million in the third quarter of 2001, respectively. These amounts were substantially offset by corresponding decreases in the income earned on the underlying assets. Interest expense includes the impact of interest rate risk management contracts, which (increased) decreased interest expense by $(69) million and $(65) million in the third and second quarters of 2002 and $31 million in the third quarter of 2001, respectively. These amounts were substantially offset by corresponding decreases (increases) in the interest paid on the underlying liabilities. |
| (4) | Primarily consists of time deposits in denominations of $100,000 or more. |
Bank of America Corporation
Average Balances and Interest Rates—Taxable-Equivalent Basis
Year-to-Date 2002 | Year-to-Date 2001 | |||||||||||||||||
Average Balance | Interest Income/ Expense | Yield/ Rate | Average Balance | Interest Income/ Expense | Yield/ Rate | |||||||||||||
(Dollars in millions) | ||||||||||||||||||
Earning assets | ||||||||||||||||||
| Time deposits placed and other short-term investments | $ | 10,437 | $ | 187 | 2.40 | % | $ | 6,544 | $ | 254 | 5.20 | % | ||||||
| Federal funds sold and securities purchased under agreements to resell | 44,451 | 662 | 1.99 | 33,980 | 1,161 | 4.56 | ||||||||||||
| Trading account assets | 78,005 | 2,866 | 4.91 | 66,041 | 2,733 | 5.52 | ||||||||||||
| Total securities(1) | 72,450 | 3,022 | 5.56 | 56,637 | 2,671 | 6.29 | ||||||||||||
| Loans and leases(2) | ||||||||||||||||||
| Commercial—domestic | 111,204 | 5,592 | 6.72 | 137,670 | 7,741 | 7.52 | ||||||||||||
| Commercial—foreign | 21,540 | 644 | 3.99 | 27,403 | 1,287 | 6.28 | ||||||||||||
| Commercial real estate—domestic | 21,431 | 798 | 4.98 | 25,131 | 1,384 | 7.36 | ||||||||||||
| Commercial real estate—foreign | 402 | 13 | 4.34 | 339 | 17 | 6.67 | ||||||||||||
| Total commercial | 154,577 | 7,047 | 6.09 | 190,543 | 10,429 | 7.32 | ||||||||||||
| Residential mortgage | 93,559 | 4,724 | 6.74 | 82,519 | 4,535 | 7.33 | ||||||||||||
| Home equity lines | 22,626 | 913 | 5.40 | 21,940 | 1,285 | 7.83 | ||||||||||||
| Direct/Indirect consumer | 30,136 | 1,623 | 7.20 | 30,377 | 1,883 | 8.29 | ||||||||||||
| Consumer finance | 11,069 | 682 | 8.22 | 32,654 | 1,945 | 7.94 | ||||||||||||
| Bankcard | 20,693 | 1,582 | 10.22 | 15,962 | 1,381 | 11.57 | ||||||||||||
| Foreign consumer | 2,043 | 57 | 3.75 | 2,266 | 108 | 6.36 | ||||||||||||
| Total consumer | 180,126 | 9,581 | 7.10 | 185,718 | 11,137 | 8.01 | ||||||||||||
| Total loans and leases | 334,703 | 16,628 | 6.64 | 376,261 | 21,566 | 7.66 | ||||||||||||
| Other earning assets | 23,918 | 1,100 | 6.14 | 22,575 | 1,358 | 8.04 | ||||||||||||
| Total earning assets(3) | 563,964 | 24,465 | 5.79 | 562,038 | 29,743 | 7.07 | ||||||||||||
| Cash and cash equivalents | 21,140 | 22,327 | ||||||||||||||||
| Other assets, less allowance for credit losses | 66,153 | 64,424 | ||||||||||||||||
Total assets | $ | 651,257 | $ | 648,789 | ||||||||||||||
Interest-bearing liabilities | ||||||||||||||||||
| Domestic interest-bearing deposits: | ||||||||||||||||||
| Savings | $ | 21,539 | 103 | 0.64 | $ | 20,233 | 171 | 1.13 | ||||||||||
| NOW and money market deposit accounts | 130,025 | 1,044 | 1.07 | 112,263 | 2,072 | 2.47 | ||||||||||||
| Consumer CDs and IRAs | 68,176 | 2,240 | 4.39 | 75,322 | 2,955 | 5.24 | ||||||||||||
| Negotiable CDs, public funds and other time deposits | 4,520 | 112 | 3.29 | 6,068 | 246 | 5.42 | ||||||||||||
| Total domestic interest-bearing deposits | 224,260 | 3,499 | 2.09 | 213,886 | 5,444 | 3.40 | ||||||||||||
| Foreign interest-bearing deposits(4) | ||||||||||||||||||
| Banks located in foreign countries | 15,525 | 338 | 2.91 | 24,283 | 882 | 4.86 | ||||||||||||
| Governments and official institutions | 2,511 | 36 | 1.90 | 3,835 | 132 | 4.59 | ||||||||||||
| Time, savings, and other | 19,051 | 269 | 1.89 | 23,304 | 715 | 4.11 | ||||||||||||
| Total foreign interest-bearing deposits | 37,087 | 643 | 2.32 | 51,422 | 1,729 | 4.50 | ||||||||||||
| Total interest-bearing deposits | 261,347 | 4,142 | 2.12 | 265,308 | 7,173 | 3.61 | ||||||||||||
| Federal funds purchased, securities sold under agreements to repurchase and other short-term borrowings | 97,655 | 1,532 | 2.10 | 94,223 | 3,467 | 4.92 | ||||||||||||
| Trading account liabilities | 31,989 | 971 | 4.06 | 30,019 | 887 | 3.95 | ||||||||||||
| Long-term debt and trust preferred securities | 66,161 | 1,846 | 3.72 | 70,121 | 3,088 | 5. 87 | ||||||||||||
| Total interest-bearing liabilities(3) | 457,152 | 8,491 | 2.48 | 459,671 | 14,615 | 4.25 | ||||||||||||
| Noninterest-bearing sources: | ||||||||||||||||||
| Noninterest-bearing deposits | 106,795 | 95,485 | ||||||||||||||||
| Other liabilities | 39,853 | 45,036 | ||||||||||||||||
| Shareholders’ equity | 47,457 | 48,597 | ||||||||||||||||
Total liabilities and shareholders’ equity | $ | 651,257 | $ | 648,789 | ||||||||||||||
| Net interest spread | 3.31 | 2.82 | ||||||||||||||||
| Impact of noninterest-bearing sources | 0.47 | 0.77 | ||||||||||||||||
Net interest income/yield on earning assets(4) | $ | 15,974 | 3.78 | % | $ | 15,128 | 3.59 | % | ||||||||||
| (1) | The average balance and yield on securities are based on the average of historical amortized cost balances. |
| (2) | Nonperforming loans are included in the respective average loan balances. Income on such nonperforming loans is recognized on a cash basis. |
| (3) | Interest income includes the impact of interest rate risk management contracts, which increased interest income by $1.5 billion and $505 million in 2002 and 2001, respectively. These amounts were substantially offset by corresponding decreases in the income earned on the underlying assets. Interest expense includes the impact of interest rate risk management contracts, which (increased) decreased interest expense by $(79) million and $103 million in 2002 and 2001, respectively. These amounts were substantially offset by corresponding decreases (increases) in the interest paid on the underlying liabilities. |
| (4) | Primarily consists of time deposits in denominations of $100,000 or more. |
Bank of America Corporation
Customer Segment View
Net Income
Year-to-date
2002 | 2001 | % Increase (Decrease) | |||||||||
(Dollars in millions) | |||||||||||
Customer Segments: | |||||||||||
| Consumer | $ | 2,383 | $ | 1,962 | 21.5 | % | |||||
| Premier | 396 | 321 | 23.4 | ||||||||
| Private | 197 | 324 | (39.2 | ) | |||||||
| Small Business | 731 | 632 | 15.7 | ||||||||
| Commercial | 1,018 | 846 | 20.3 | ||||||||
| Corporate | 1,494 | 1,521 | (1.8 | )% | |||||||
| Equity Investments | (249 | ) | (17 | ) | n/m | ||||||
| Corporate Other (1) | 665 | (855 | ) | n/m | |||||||
Total Net Income | $ | 6,635 | $ | 4,734 | (1) | ||||||
| (1) | Includes provision for credit losses of $395 million and noninterest expense of $1.3 billion, both of which are related to the exit of certain consumer finance businesses in the third quarter of 2001. The impact of these charges on net income was $1.25 billion. |
Bank of America Corporation
Consumer and Commercial Banking Segment Results
Year-to-Date | Quarterly | |||||||||||||||||||||||||||
2002 | 2001 | 3 Qtr 02 | 2 Qtr 02 | 1 Qtr 02 | 4 Qtr 01 | 3 Qtr 01 | ||||||||||||||||||||||
(Dollars in millions) | ||||||||||||||||||||||||||||
Key Measures | ||||||||||||||||||||||||||||
| Total Revenue* | $ | 16,910 | $ | 15,509 | $ | 5,902 | $ | 5,531 | $ | 5,477 | $ | 5,549 | $ | 5,311 | ||||||||||||||
| Provision for Credit Losses | 1,296 | 1,046 | 420 | 449 | 427 | 536 | 389 | |||||||||||||||||||||
| Net Income(1) | 4,440 | 3,695 | 1,580 | 1,444 | 1,416 | 1,257 | 1,287 | |||||||||||||||||||||
| Shareholder Value Added | 2,920 | 2,447 | 1,075 | 937 | 908 | 840 | 867 | |||||||||||||||||||||
| Return on Average Equity | 32.3 | % | 25.7 | % | 34.6 | % | 31.5 | % | 30.8 | % | 26.2 | % | 26.7 | % | ||||||||||||||
| Efficiency Ratio | 50.9 | 54.3 | 51.0 | 50.4 | 51.1 | 54.2 | 53.0 | |||||||||||||||||||||
Selected Average Balance | ||||||||||||||||||||||||||||
Sheet Components | ||||||||||||||||||||||||||||
| Total Loans and Leases | $ | 182,715 | $ | 177,633 | $ | 183,035 | $ | 182,863 | $ | 182,238 | $ | 179,548 | $ | 179,194 | ||||||||||||||
| Total Deposits | 280,227 | 263,602 | 283,772 | 280,169 | 276,663 | 273,256 | 266,339 | |||||||||||||||||||||
| Total Earning Assets | 279,296 | 261,955 | 285,267 | 278,199 | 274,297 | 270,678 | 265,232 | |||||||||||||||||||||
Period end (in billions) | ||||||||||||||||||||||||||||
| Mortgage Servicing Portfolio | $ | 278.7 | $ | 313.4 | $ | 278.7 | $ | 287.8 | $ | 289.9 | $ | 299.1 | $ | 313.4 | ||||||||||||||
| Mortgage Originations | ||||||||||||||||||||||||||||
| Retail | 37.8 | 29.5 | 15.3 | 9.5 | 13.0 | 16.8 | 9.8 | |||||||||||||||||||||
| Wholesale | 18.3 | 13.8 | 8.6 | 4.9 | 4.8 | 6.0 | 4.5 | |||||||||||||||||||||
| Correspondent | — | 10.4 | — | — | — | 0.1 | 1.7 | |||||||||||||||||||||
Consumer and Commercial Banking Sub-Segment Results | ||||||||||||||||||||||||||||
Year-to-Date | Quarterly | |||||||||||||||||||||||||||
2002 | 2001 | 3 Qtr 02 | 2 Qtr 02 | 1 Qtr 02 | 4 Qtr 01 | 3 Qtr 01 | ||||||||||||||||||||||
(Dollars in millions) | ||||||||||||||||||||||||||||
Key Measures | ||||||||||||||||||||||||||||
Banking Regions | ||||||||||||||||||||||||||||
| Total Revenue* | $ | 9,893 | $ | 9,200 | $ | 3,427 | $ | 3,289 | $ | 3,177 | $ | 3,203 | $ | 3,156 | ||||||||||||||
| Net Income(2) | 2,398 | 1,961 | 838 | 815 | 745 | 654 | 702 | |||||||||||||||||||||
| Shareholder Value Added | 1,509 | 1,334 | 537 | 517 | 455 | 440 | 490 | |||||||||||||||||||||
| Efficiency Ratio | 59.4 | % | 62.3 | % | 59.7 | % | 57.6 | % | 60.7 | % | 63.0 | % | 60.9 | % | ||||||||||||||
Consumer Products | ||||||||||||||||||||||||||||
| Total Revenue* | $ | 4,425 | $ | 3,700 | $ | 1,590 | $ | 1,396 | $ | 1,439 | $ | 1,432 | $ | 1,266 | ||||||||||||||
| Net Income(3) | 1,184 | 949 | 437 | 350 | 397 | 368 | 316 | |||||||||||||||||||||
| Shareholder Value Added | 923 | 712 | 350 | 263 | 310 | 286 | 234 | |||||||||||||||||||||
| Efficiency Ratio | 38.3 | % | 42.2 | % | 38.0 | % | 40.5 | % | 36.5 | % | 38.4 | % | 41.4 | % | ||||||||||||||
Commercial Banking | ||||||||||||||||||||||||||||
| Total Revenue* | $ | 2,592 | $ | 2,609 | $ | 885 | $ | 846 | $ | 861 | $ | 914 | $ | 889 | ||||||||||||||
| Net Income(4) | 858 | 785 | 305 | 279 | 274 | 235 | 269 | |||||||||||||||||||||
| Shareholder Value Added | 488 | 401 | 188 | 157 | 143 | 114 | 143 | |||||||||||||||||||||
| Efficiency Ratio | 39.9 | % | 42.4 | % | 40.6 | % | 39.0 | % | 39.9 | % | 48.3 | % | 41.4 | % | ||||||||||||||
| * | Taxable-equivalent basis |
| (1) | Includes goodwill amortization of $316 million in year-to-date 2001; $105 million in both the fourth and third quarters of 2001. |
| (2) | Includes goodwill amortization of $261 million in year-to-date 2001; $87 million in both the fourth and third quarters of 2001. |
| (3) | Includes goodwill amortization of $21 million in year-to-date 2001; $7 million in both the fourth and third quarters of 2001. |
| (4) | Includes goodwill amortization of $34 million in year-to-date 2001; $11 million in both the fourth and third quarters of 2001. |
Certain prior period amounts have been reclassified between segments to conform to the current period presentation.
Bank of America Corporation
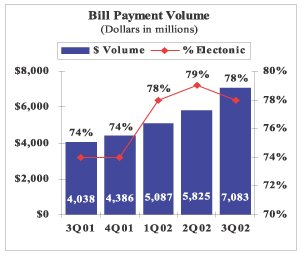
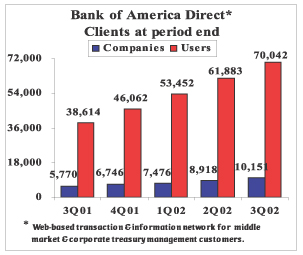
E-Commerce & BankofAmerica.com
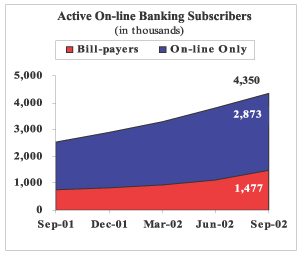
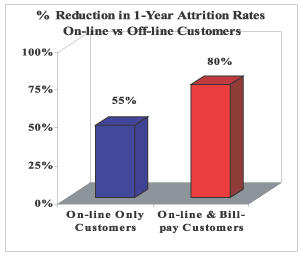
Bank of America has the largest active online banking customer base with over 4.3 million subscribers. This represents an active customer penetration rate of 30%.
Bank of America uses a strict Active User standard—customers must have used our online services within the last 90 days.
1.5 millionactive bill pay users paid over $7 billion worth of bills this quarter. The number of active bill pay users has increased 74% since the beginning of the year, driven by Bank of America's free bill pay promotion.
Currently, nearly 200 companies are presenting over 1.6 million e-bills per quarter.
Bank of America Corporation
Consumer Credit Card Results
Included within Consumer Products
Year-to-Date | Quarterly | |||||||||||||||||||||||||||
2002 | 2001 | 3 Qtr 02 | 2 Qtr 02 | 1 Qtr 02 | 4 Qtr 01 | 3 Qtr 01 | ||||||||||||||||||||||
(Dollars in millions) | ||||||||||||||||||||||||||||
Key Measures | ||||||||||||||||||||||||||||
Outstandings: | ||||||||||||||||||||||||||||
| Held (Period-End) | $ | 23,062 | $ | 18,052 | $ | 23,062 | $ | 21,155 | $ | 19,535 | $ | 19,884 | $ | 18,052 | ||||||||||||||
| Managed (Period-End) | 28,057 | 25,513 | 28,057 | 27,089 | 26,558 | 27,185 | 25,513 | |||||||||||||||||||||
| Held (Average) | 20,693 | 15,962 | 22,263 | 20,402 | 19,383 | 18,656 | 17,632 | |||||||||||||||||||||
| Managed (Average) | 26,997 | 24,165 | 27,540 | 26,902 | 26,539 | 26,040 | 25,310 | |||||||||||||||||||||
Managed Income Statement: | ||||||||||||||||||||||||||||
| Total Revenue | $ | 2,591 | $ | 2,244 | $ | 925 | $ | 821 | $ | 845 | $ | 835 | $ | 794 | ||||||||||||||
| Provision Expense | 1,156 | 1,030 | 392 | 393 | 371 | 350 | 357 | |||||||||||||||||||||
| Noninterest Expense | 717 | 636 | 244 | 239 | 234 | 228 | 216 | |||||||||||||||||||||
| Net Income Before Taxes | 718 | 578 | 289 | 189 | 240 | 257 | 221 | |||||||||||||||||||||
Shareholder Value Added (SVA) | $ | 320 | $ | 233 | $ | 138 | $ | 75 | $ | 107 | $ | 109 | $ | 94 | ||||||||||||||
Credit Quality: | ||||||||||||||||||||||||||||
Charge-off $: | ||||||||||||||||||||||||||||
| Held | $ | 795 | $ | 464 | $ | 285 | $ | 269 | $ | 241 | $ | 208 | $ | 181 | ||||||||||||||
| Managed | 1,086 | 852 | 356 | 375 | 355 | 322 | 307 | |||||||||||||||||||||
Charge-off %: | ||||||||||||||||||||||||||||
| Held | 5.14 | % | 3.89 | % | 5.09 | % | 5.28 | % | 5.05 | % | 4.43 | % | 4.08 | % | ||||||||||||||
| Managed | 5.38 | 4.71 | 5.13 | 5.59 | 5.43 | 4.90 | 4.81 | |||||||||||||||||||||
Managed Delinquency %: | ||||||||||||||||||||||||||||
| 30+ | 3.63 | % | 3.95 | % | 3.63 | % | 3.78 | % | 4.16 | % | 4.12 | % | 3.95 | % | ||||||||||||||
| 90+ | 1.66 | 1.68 | 1.66 | 1.76 | 1.95 | 1.75 | 1.68 | |||||||||||||||||||||
Bank of America Corporation
Global Corporate and Investment Banking Segment Results
Year-to-Date | Quarterly | ||||||||||||||||||||||||||||
2002 | 2001 | 3 Qtr 02 | 2 Qtr 02 | 1 Qtr 02 | 4 Qtr 01 | 3 Qtr 01 | |||||||||||||||||||||||
(Dollars in millions) | |||||||||||||||||||||||||||||
Key Measures | |||||||||||||||||||||||||||||
| Total Revenue* | $ | 6,740 | $ | 7,195 | $ | 2,039 | $ | 2,362 | $ | 2,339 | $ | 2,390 | $ | 2,286 | |||||||||||||||
| Provision for Credit Losses | 683 | 794 | 203 | 216 | 264 | 498 | 292 | ||||||||||||||||||||||
| Net Income(1) | 1,494 | 1,521 | 428 | 562 | 504 | 435 | 491 | ||||||||||||||||||||||
| Shareholder Value Added | 515 | 416 | 107 | 237 | 171 | 102 | 136 | ||||||||||||||||||||||
| Return on Average Equity | 17.9 | % | 15.1 | % | 15.6 | % | 20.3 | % | 17.7 | % | 14.2 | % | 15.1 | % | |||||||||||||||
| Efficiency Ratio | 55.5 | 55.8 | 58.3 | 53.9 | 54.8 | 56.6 | 53.9 | ||||||||||||||||||||||
Selected Average Balance | |||||||||||||||||||||||||||||
Sheet Components | |||||||||||||||||||||||||||||
| Total Loans and Leases | $ | 63,841 | $ | 85,897 | $ | 60,821 | $ | 63,926 | $ | 66,840 | $ | 71,711 | $ | 78,219 | |||||||||||||||
| Total Deposits | 64,393 | 67,288 | 66,166 | 63,770 | 63,212 | 66,076 | 68,472 | ||||||||||||||||||||||
| Total Earning Assets | 199,017 | 195,398 | 203,326 | 201,213 | 192,392 | 186,445 | 191,763 | ||||||||||||||||||||||
Global Corporate and Investment Banking Sub-Segment Results | |||||||||||||||||||||||||||||
Year-to-Date | Quarterly | ||||||||||||||||||||||||||||
2002 | 2001 | 3 Qtr 02 | 2 Qtr 02 | 1 Qtr 02 | 4 Qtr 01 | 3 Qtr 01 | |||||||||||||||||||||||
(Dollars in millions) | |||||||||||||||||||||||||||||
Key Measures | |||||||||||||||||||||||||||||
Global Investment Banking | |||||||||||||||||||||||||||||
| Total Revenue* | $ | 3,514 | $ | 4,128 | $ | 915 | $ | 1,256 | $ | 1,343 | $ | 1,259 | $ | 1,190 | |||||||||||||||
| Net Income(2) | 598 | 838 | 100 | 224 | 274 | 192 | 230 | ||||||||||||||||||||||
| Shareholder Value Added | 285 | 508 | (8 | ) | 118 | 175 | 93 | 123 | |||||||||||||||||||||
| Efficiency Ratio | 72.9 | % | 67.7 | % | 86.4 | % | 70.6 | % | 65.9 | % | 74.9 | % | 69.4 | % | |||||||||||||||
Global Credit Products | |||||||||||||||||||||||||||||
| Total Revenue* | $ | 1,935 | $ | 1,958 | $ | 716 | $ | 658 | $ | 561 | $ | 726 | $ | 702 | |||||||||||||||
| Net Income(3) | 573 | 472 | 242 | 209 | 122 | 154 | 172 | ||||||||||||||||||||||
| Shareholder Value Added | (52 | ) | (266 | ) | 43 | 3 | (98 | ) | (67 | ) | (64 | ) | |||||||||||||||||
| Efficiency Ratio | 20.3 | % | 22.9 | % | 17.7 | % | 20.5 | % | 23.5 | % | 19.4 | % | 21.2 | % | |||||||||||||||
Global Treasury Services | |||||||||||||||||||||||||||||
| Total Revenue* | $ | 1,291 | $ | 1,109 | $ | 408 | $ | 448 | $ | 435 | $ | 405 | $ | 394 | |||||||||||||||
| Net Income(4) | 323 | 211 | 86 | 129 | 108 | 89 | 89 | ||||||||||||||||||||||
| Shareholder Value Added | 282 | 174 | 72 | 116 | 94 | 76 | 77 | ||||||||||||||||||||||
| Efficiency Ratio | 61.0 | % | 69.9 | % | 66.5 | % | 56.0 | % | 61.0 | % | 66.1 | % | 65.2 | % | |||||||||||||||
| * | Taxable-equivalent basis |
| (1) | Includes goodwill amortization of $81 million in year-to-date 2001; $27 million in both the fourth and third quarters of 2001. |
| (2) | Includes goodwill amortization of $42 million in year-to-date 2001; $14 million in both the fourth and third quarters of 2001. |
| (3) | Includes goodwill amortization of $32 million in year-to-date 2001; $11 million in both the fourth and third quarters of 2001. |
| (4) | Includes goodwill amortization of $7 million in year-to-date 2001; $2 million in both the fourth and third quarters of 2001. |
Certain prior period amounts have been reclassified between segments to conform to the current period presentation.
Bank of America Corporation
Asset Management Segment Results
Year-to-Date | Quarterly | |||||||||||||||||||||||||||
2002 | 2001 | 3 Qtr 02 | 2 Qtr 02 | 1 Qtr 02 | 4 Qtr 01 | 3 Qtr 01 | ||||||||||||||||||||||
(Dollars in millions) | ||||||||||||||||||||||||||||
Key Measures | ||||||||||||||||||||||||||||
| Total Revenue* | $ | 1,799 | $ | 1,850 | $ | 581 | $ | 620 | $ | 598 | $ | 625 | $ | 610 | ||||||||||||||
| Provision for Credit Losses | 287 | 87 | 118 | 143 | 26 | 34 | 16 | |||||||||||||||||||||
| Net Income(1) | 285 | 390 | 72 | 71 | 142 | 133 | 148 | |||||||||||||||||||||
| Shareholder Value Added | 74 | 233 | (4 | ) | 3 | 75 | 80 | 95 | ||||||||||||||||||||
| Return on Average Equity | 15.9 | % | 23.4 | % | 11.3 | % | 12.2 | % | 24.9 | % | 23.7 | % | 26.4 | % | ||||||||||||||
| Efficiency Ratio | 60.2 | 62.2 | 61.8 | 60.2 | 58.8 | 61.7 | 59.5 | |||||||||||||||||||||
Selected Average Balance | ||||||||||||||||||||||||||||
Sheet Components | ||||||||||||||||||||||||||||
| Total Loans and Leases | $ | 23,596 | $ | 24,328 | $ | 22,964 | $ | 23,666 | $ | 24,171 | $ | 24,537 | $ | 24,631 | ||||||||||||||
| Total Deposits | 11,860 | 11,883 | 11,967 | 11,776 | 11,837 | 11,936 | 11,837 | |||||||||||||||||||||
| Total Earning Assets | 24,213 | 25,515 | 23,566 | 24,266 | 24,822 | 25,285 | 25,820 | |||||||||||||||||||||
Period end(in billions) | ||||||||||||||||||||||||||||
| Assets under Management | $ | 271.9 | $ | 281.8 | $ | 271.9 | $ | 295.2 | $ | 314.9 | $ | 314.2 | $ | 281.8 | ||||||||||||||
| Client Brokerage Assets | 87.1 | 93.6 | 87.1 | 90.5 | 96.6 | 99.4 | 93.6 | |||||||||||||||||||||
| Assets in Custody | 42.1 | 43.1 | 42.1 | 41.0 | 46.0 | 46.9 | 43.1 | |||||||||||||||||||||
| Total Client Assets | $ | 401.1 | $ | 418.5 | $ | 401.1 | $ | 426.7 | $ | 457.5 | $ | 460.5 | $ | 418.5 | ||||||||||||||
| * | Taxable-equivalent basis |
| (1) | Includes goodwill amortization of $35 million in year-to-date 2001; $12 million in both the fourth and third quarters of 2001. |
Certain prior period amounts have been reclassified between segments to conform to the current period presentation.
Bank of America Corporation
Equity Investments Segment Results
Year-to-Date | Quarterly | |||||||||||||||||||||||||||
2002 | 2001 | 3 Qtr 02 | 2 Qtr 02 | 1 Qtr 02 | 4 Qtr 01 | 3 Qtr 01 | ||||||||||||||||||||||
(Dollars in millions) | ||||||||||||||||||||||||||||
Key Measures | ||||||||||||||||||||||||||||
| Total Revenue* | ($ | 338 | ) | $ | 119 | ($ | 230 | ) | ($ | 82 | ) | ($ | 26 | ) | ($ | 90 | ) | ($ | 60 | ) | ||||||||
| Provision for Credit Losses | — | — | — | — | — | 9 | — | |||||||||||||||||||||
| Net Income(1) | (249 | ) | (17 | ) | (160 | ) | (56 | ) | (33 | ) | (98 | ) | (85 | ) | ||||||||||||||
| Shareholder Value Added | (438 | ) | (224 | ) | (222 | ) | (121 | ) | (95 | ) | (165 | ) | (156 | ) | ||||||||||||||
| Return on Average Equity | (15.6 | )% | (0.9 | )% | (30.5 | )% | (10.3 | )% | (6.4 | )% | (17.1 | )% | (13.7 | )% | ||||||||||||||
| Efficiency Ratio | (19.4 | ) | 127.6 | (12.0 | ) | (11.7 | ) | (109.2 | ) | (69.9 | ) | (131.1 | ) | |||||||||||||||
Selected Average Balance | ||||||||||||||||||||||||||||
Sheet Components | ||||||||||||||||||||||||||||
| Total Loans and Leases | $ | 440 | $ | 487 | $ | 446 | $ | 448 | $ | 427 | $ | 444 | $ | 468 | ||||||||||||||
| Total Deposits | — | 17 | — | — | — | — | — | |||||||||||||||||||||
| Total Earning Assets | 443 | 502 | 446 | 448 | 433 | 453 | 489 | |||||||||||||||||||||
Period end | ||||||||||||||||||||||||||||
| Investment Balances for Principal Investing | $ | 5,429 | $ | 5,568 | $ | 5,429 | $ | 5,429 | $ | 5,513 | $ | 5,463 | $ | 5,568 | ||||||||||||||
| * | Taxable-equivalent basis |
| (1) | Includes goodwill amortization of $6 million in year-to-date 2001; $2 million in both the fourth and third quarters of 2001. |
Certain prior period amounts have been reclassified between segments to conform to the current period presentation.
Bank of America Corporation
Corporate Other Results(1,2)
Year-to-Date | Quarterly | |||||||||||||||||||||||||||
2002 | 2001 | 3 Qtr 02 | 2 Qtr 02 | 1 Qtr 02 | 4 Qtr 01 | 3 Qtr 01 | ||||||||||||||||||||||
(Dollars in millions) | ||||||||||||||||||||||||||||
Key Measures | ||||||||||||||||||||||||||||
| Total Revenue* | $ | 1,004 | $ | 1,405 | $ | 393 | $ | 312 | $ | 299 | $ | 429 | $ | 572 | ||||||||||||||
| Provision for Credit Losses | 266 | 959 | 63 | 80 | 123 | 324 | 554 | |||||||||||||||||||||
| Net Income(3) | 665 | (855 | ) | 315 | 200 | 150 | 330 | (1,000 | ) | |||||||||||||||||||
| Shareholder Value Added | (525 | ) | (579 | ) | (76 | ) | (222 | ) | (227 | ) | (64 | ) | (118 | ) | ||||||||||||||
Selected Average Balance | ||||||||||||||||||||||||||||
Sheet Components | ||||||||||||||||||||||||||||
| Total Loans and Leases | $ | 64,111 | $ | 87,916 | $ | 73,218 | $ | 64,781 | $ | 54,125 | $ | 57,115 | $ | 75,214 | ||||||||||||||
| Total Deposits | 11,662 | 18,003 | 12,028 | 10,271 | 12,691 | 16,903 | 16,680 | |||||||||||||||||||||
| Total Earning Assets | 143,103 | 143,815 | 158,036 | 138,750 | 132,241 | 145,361 | 141,847 | |||||||||||||||||||||
| * | Taxable-equivalent basis |
| (1) | Corporate Other consists primarily of gains and losses associated with managing the balance sheet of the Corporation, certain consumer finance and commercial lending businesses being liquidated, and certain residential mortgages originated by the mortgage group or otherwise acquired and held for asset/liability management purposes. |
| (2) | Results include provision for credit losses of $395 million and noninterest expense of $1.3 billion, both of which are related to the exit of certain consumer finance businesses in the third quarter of 2001. |
| (3) | Includes goodwill amortization of $29 million in year-to-date 2001; $3 million and $7 million in the fourth and third quarters of 2001, respectively. |
Certain prior period amounts have been reclassified between segments to conform to the current period presentation.
Bank of America Corporation
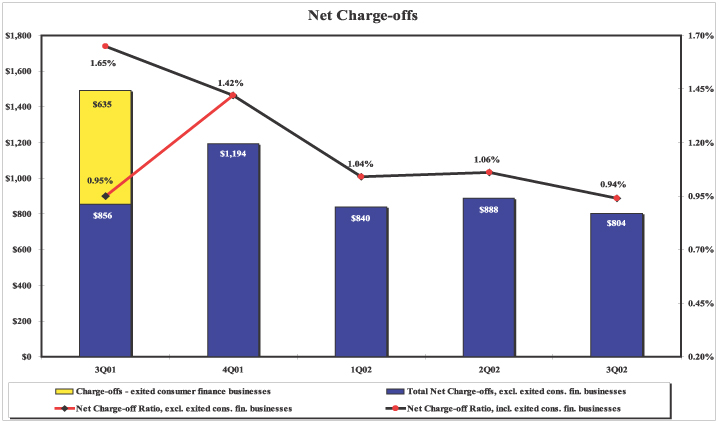
Net Charge-offs and Net Charge-off Ratios
3Q01 | 4Q01 | 1Q02 | 2Q02 | 3Q02 | ||||||||||||||||||||||||||
Amt. | Ratio | Amt. | Ratio | Amt. | Ratio | Amt. | Ratio | Amt. | Ratio | |||||||||||||||||||||
(Dollars in millions) | ||||||||||||||||||||||||||||||
| Commercial—domestic (1) | $ | 412 | 1.26 | % | $ | 714 | 2.33 | % | $ | 370 | 1.29 | % | $ | 383 | 1.38 | % | $ | 240 | 0.90 | % | ||||||||||
| Commercial—foreign | 57 | 0.89 | 60 | 1.00 | 49 | 0.90 | 119 | 2.23 | 148 | 2.77 | ||||||||||||||||||||
| Commercial real estate—domestic | 4 | 0.07 | 17 | 0.29 | 14 | 0.25 | 8 | 0.14 | 6 | 0.12 | ||||||||||||||||||||
Total Commercial | 473 | 1.05 | 791 | 1.86 | 433 | 1.09 | 510 | 1.32 | 394 | 1.05 | ||||||||||||||||||||
| Residential mortgage | 7 | 0.04 | 6 | 0.03 | 11 | 0.05 | 8 | 0.03 | 5 | 0.02 | ||||||||||||||||||||
| Home equity lines | 4 | 0.07 | 5 | 0.10 | 8 | 0.15 | 7 | 0.12 | 5 | 0.08 | ||||||||||||||||||||
| Direct/indirect consumer | 68 | 0.87 | 83 | 1.08 | 64 | 0.86 | 38 | 0.50 | 48 | 0.63 | ||||||||||||||||||||
| Consumer finance (2) | 746 | 11.75 | 81 | 2.46 | 75 | 2.49 | 49 | 1.77 | 54 | 2.13 | ||||||||||||||||||||
| Bankcard | 181 | 4.08 | 208 | 4.43 | 241 | 5.05 | 269 | 5.28 | 285 | 5.09 | ||||||||||||||||||||
| Other consumer domestic | 11 | n/m | 18 | n/m | 7 | n/m | 7 | n/m | 11 | n/m | ||||||||||||||||||||
| Foreign consumer | 1 | 0.21 | 2 | 0.25 | 1 | 0.16 | — | — | 2 | 0.32 | ||||||||||||||||||||
Total Consumer (2) | 1,018 | 2.27 | 403 | 0.97 | 407 | 0.99 | 378 | 0.84 | 410 | 0.85 | ||||||||||||||||||||
Total Net Charge-offs (2) | $ | 1,491 | 1.65 | $ | 1,194 | 1.42 | $ | 840 | 1.04 | $ | 888 | 1.06 | $ | 804 | 0.94 | |||||||||||||||
By Business Segment: | ||||||||||||||||||||||||||||||
| Consumer & Commercial Banking | $ | 389 | 0.86 | % | $ | 536 | 1.18 | % | $ | 427 | 0.94 | % | $ | 449 | 0.99 | % | $ | 420 | 0.91 | % | ||||||||||
| Global Corporate & Investment Banking (1) | 292 | 1.48 | 498 | 2.76 | 264 | 1.60 | 216 | 1.35 | 203 | 1.32 | ||||||||||||||||||||
| Asset Management | 16 | 0.26 | 34 | 0.55 | 26 | 0.44 | 143 | 2.43 | 118 | 2.04 | ||||||||||||||||||||
| Equity Investments | — | — | 9 | 7.76 | — | — | — | — | — | — | ||||||||||||||||||||
| Corporate Other (2) | 794 | 4.19 | 117 | 0.81 | 123 | 0.92 | 80 | 0.50 | 63 | 0.34 | ||||||||||||||||||||
Total Net Charge-offs | $ | 1,491 | 1.65 | $ | 1,194 | 1.42 | $ | 840 | 1.04 | $ | 888 | 1.06 | $ | 804 | 0.94 | |||||||||||||||
Loans are classified as domestic or foreign based upon the domicile of the borrower.
| (1) | Fourth quarter 2001 includes $210 million related to Enron. |
| (2) | Third quarter 2001 includes $635 million related to the exit of certain consumer finance businesses. Excluding these net charge- offs, the ratios would be 1.75% for Consumer Finance, 0.85% for Total Consumer, and 0.95% for Total Net Charge-offs. |
Bank of America Corporation
Nonperforming Assets
3Q01 | 4Q01 | 1Q02 | 2Q02 | 3Q02 | ||||||||||||||||
(Dollars in millions) | ||||||||||||||||||||
| Commercial—domestic | $ | 2,705 | $ | 3,123 | $ | 3,207 | $ | 2,847 | $ | 3,132 | ||||||||||
| Commercial—foreign | 566 | 461 | 583 | 980 | 854 | |||||||||||||||
| Commercial real estate—domestic | 257 | 240 | 216 | 202 | 172 | |||||||||||||||
| Commercial real estate—foreign | 2 | 3 | 2 | 3 | 3 | |||||||||||||||
Total Commercial | 3,530 | 3,827 | 4,008 | 4,032 | 4,161 | |||||||||||||||
| Residential mortgage | 491 | 556 | 477 | 503 | 585 | |||||||||||||||
| Home equity lines | 61 | 80 | 73 | 64 | 57 | |||||||||||||||
| Direct/Indirect consumer | 20 | 27 | 26 | 27 | 31 | |||||||||||||||
| Consumer finance | 9 | 9 | 8 | 8 | 8 | |||||||||||||||
| Foreign consumer | 8 | 7 | 9 | 8 | 7 | |||||||||||||||
Total Consumer | 589 | 679 | 593 | 610 | 688 | |||||||||||||||
Total Nonperforming Loans | 4,119 | 4,506 | 4,601 | 4,642 | 4,849 | |||||||||||||||
Foreclosed properties | 404 | 402 | 391 | 297 | 282 | |||||||||||||||
Total Nonperforming Assets(1) | $ | 4,523 | $ | 4,908 | $ | 4,992 | $ | 4,939 | $ | 5,131 | ||||||||||
| Loans past due 90 days or more and still accruing | $ | 691 | $ | 680 | $ | 662 | $ | 605 | $ | 726 | ||||||||||
| Nonperforming Assets/ Total Assets | 0.71 | % | 0.79 | % | 0.81 | % | 0.77 | % | 0.78 | % | ||||||||||
| Nonperforming Assets/ Total Loans, Leases and Foreclosed Properties | 1.33 | 1.49 | 1.51 | 1.45 | 1.50 | |||||||||||||||
| Nonperforming Loans/Total Loans and Leases | 1.22 | 1.37 | 1.39 | 1.36 | 1.42 | |||||||||||||||
| Allowance for Loan Losses | $ | 6,665 | $ | 6,875 | $ | 6,869 | $ | 6,873 | $ | 6,861 | ||||||||||
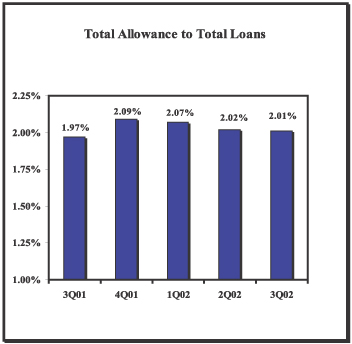
| Allowance / Total Loans | 1.97 | % | 2.09 | % | 2.07 | % | 2.02 | % | 2.01 | % | ||||||||||
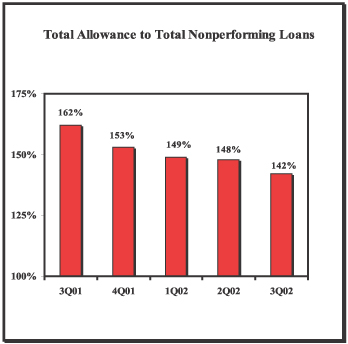
| Allowance / Total Nonperforming Loans | 162 | 153 | 149 | 148 | 142 | |||||||||||||||
Loans are classified as domestic or foreign based upon the domicile of the borrower.
| (1) | Balances do not include $184 million, $221 million, $304 million, $1.0 billion and $1.3 billion of nonperforming assets included in other assets at September 30, 2002, June 30, 2002, March 31, 2002, December 31, 2001 and September 30, 2001 respectively. In the third quarter of 2001, $1.2 billion of nonperforming subprime real estate loans were transferred to loans held for sale as a result of the exit of certain consumer finance businesses. |
 |  |