Exhibit 99.2

Supplemental Information
First Quarter 2003
April 14, 2003
This information is preliminary and based on company data available at the time of the presentation. It speaks only as of the particular date or dates included in the accompanying pages. Bank of America does not undertake an obligation to, and disclaims any duty to, correct or update any of the information provided. Any forward-looking statements in this information are subject to the forward-looking language contained in Bank of America's reports filed with the SEC pursuant to the Securities Exchange Act of 1934, which are available at the SEC's website (www.sec.gov) or at Bank of America's website (www.bankofamerica.com). Bank of America's future financial performance is subject to risks and uncertainties as described in its SEC filings.
Bank of America Corporation
Results Overview
| l | Diluted EPS of $1.59, up 15% over same period last year, down 6% from prior quarter. Net income in fourth quarter 2002 included $.32 per share in tax benefits related to the settlement of federal income tax returns through 1999. |
| l | Diversity of businesses produced fee-based revenue growth across all businesses of 7% versus prior quarter and first quarter a year ago. |
| l | Net interest income was up 1% over first quarter 2002 but down 3% from the fourth quarter, as expected, due to the rate environment. |
| l | Net charge-offs declined $332 million from the prior quarter. |
| l | Nonperforming asset levels declined 4% below year-end 2002 levels. |
| l | Growth in consumer loans of 21% and deposit levels of 8% over the first quarter 2002 continues to benefit from improved quality and productivity initiatives. |
| l | Net new checking account growth of 243,000 in first quarter doubled the level of prior year quarter. |
| l | Banking center product sales have grown more than 20% in the most recent quarter. |
| l | Banc of America Securities continues to gain important product market share gains in investment banking. |
1
Bank of America Corporation
Consolidated Financial Highlights
(Dollars in millions, except per share information; shares in thousands)
First Quarter 2003 | Fourth Quarter 2002 | Third Quarter 2002 | Second Quarter 2002 | First Quarter 2002 | ||||||||||||||||
Income statement | ||||||||||||||||||||
Total revenue | $ | 8,894 |
| $ | 8,804 |
| $ | 8,522 |
| $ | 8,575 |
| $ | 8,593 |
| |||||
Provision for credit losses |
| 833 |
|
| 1,165 |
|
| 804 |
|
| 888 |
|
| 840 |
| |||||
Gains on sales of securities |
| 273 |
|
| 304 |
|
| 189 |
|
| 93 |
|
| 44 |
| |||||
Noninterest expense |
| 4,717 |
|
| 4,832 |
|
| 4,620 |
|
| 4,490 |
|
| 4,494 |
| |||||
Income tax expense |
| 1,193 |
|
| 497 |
|
| 1,052 |
|
| 1,069 |
|
| 1,124 |
| |||||
Net income |
| 2,424 |
|
| 2,614 |
|
| 2,235 |
|
| 2,221 |
|
| 2,179 |
| |||||
Diluted earnings per common share |
| 1.59 |
|
| 1.69 |
|
| 1.45 |
|
| 1.40 |
|
| 1.38 |
| |||||
Average diluted common shares outstanding |
| 1,526,288 |
|
| 1,542,482 |
|
| 1,546,347 |
|
| 1,592,250 |
|
| 1,581,848 |
| |||||
Cash dividends paid per common share | $ | 0.64 |
| $ | 0.64 |
| $ | 0.60 |
| $ | 0.60 |
| $ | 0.60 |
| |||||
Performance ratios | ||||||||||||||||||||
Return on average assets |
| 1.38 | % |
| 1.49 | % |
| 1.33 | % |
| 1.38 | % |
| 1.39 | % | |||||
Return on average common shareholders’ equity |
| 19.92 |
|
| 21.58 |
|
| 19.02 |
|
| 18.47 |
|
| 18.64 |
| |||||
Book value per share of common stock | $ | 33.38 |
| $ | 33.49 |
| $ | 32.07 |
| $ | 31.47 |
| $ | 31.15 |
| |||||
Market price per share of common stock: | ||||||||||||||||||||
High for the period | $ | 72.50 |
| $ | 71.99 |
| $ | 71.94 |
| $ | 77.08 |
| $ | 69.61 |
| |||||
Low for the period |
| 64.26 |
|
| 53.98 |
|
| 57.90 |
|
| 66.82 |
|
| 57.51 |
| |||||
Closing price |
| 66.84 |
|
| 69.57 |
|
| 63.80 |
|
| 70.36 |
|
| 68.02 |
| |||||
Market capitalization |
| 100,095 |
|
| 104,403 |
|
| 95,838 |
|
| 106,642 |
|
| 105,058 |
| |||||
Number of banking centers |
| 4,202 |
|
| 4,208 |
|
| 4,226 |
|
| 4,232 |
|
| 4,246 |
| |||||
Number of ATM’s |
| 13,266 |
|
| 13,013 |
|
| 12,489 |
|
| 12,827 |
|
| 13,161 |
| |||||
Full-time equivalent employees |
| 132,583 |
|
| 133,944 |
|
| 134,135 |
|
| 135,489 |
|
| 137,240 |
| |||||
Certain prior period amounts have been reclassified to conform to current period presentation.
2
Bank of America Corporation
Supplemental Financial Data and Reconciliations to GAAP Financial Measures
(Dollars in millions)
Certain non-GAAP (generally accepted accounting principles) performance measures and ratios, including shareholder value added and taxable-equivalent net interest income, net interest yield and operating efficiency calculated on a taxable-equivalent basis are used in managing the business. Management believes that these measures provide users of this financial information a more accurate picture of the interest margin for comparative purposes. Other companies may define or calculate supplemental financial data differently. See the Table below for supplemental financial data and corresponding reconciliations to GAAP financial measures for the three months ended March 31, 2003, December 31, 2002, September 30, 2002, June 30, 2002, and March 31, 2002.
Management reviews net interest income on a taxable-equivalent basis. In this non-GAAP presentation, net interest income is adjusted to reflect tax-exempt interest income on an equivalent before-tax basis. This measure ensures comparability of net interest income arising from both taxable and tax-exempt sources. Net interest income on a taxable-equivalent basis is also used in the calculation of the efficiency ratio and the net interest yield. The efficiency ratio, which is calculated by dividing noninterest expense by total revenue, measures how much it costs to produce one dollar of revenue. Net interest income on a taxable-equivalent basis is also used in business segment reporting.
First Quarter 2003 | Fourth Quarter 2002 | Third Quarter 2002 | Second Quarter 2002 | First Quarter 2002 | ||||||||||||||||
Net interest income | ||||||||||||||||||||
Taxable-equivalent basis data | ||||||||||||||||||||
Net interest income | $ | 5,361 |
| $ | 5,537 |
| $ | 5,465 |
| $ | 5,262 |
| $ | 5,247 |
| |||||
Total revenue |
| 9,046 |
|
| 8,967 |
|
| 8,685 |
|
| 8,743 |
|
| 8,687 |
| |||||
Net interest yield |
| 3.52 | % |
| 3.66 | % |
| 3.75 | % |
| 3.75 | % |
| 3.85 | % | |||||
Net interest yield without taxable-equivalent income |
| 3.45 |
|
| 3.54 |
|
| 3.63 |
|
| 3.63 |
|
| 3.81 |
| |||||
Efficiency ratio |
| 52.14 |
|
| 53.90 |
|
| 53.19 |
|
| 51.34 |
|
| 51.74 |
| |||||
Efficiency ratio without taxable-equivalent income |
| 53.03 |
|
| 54.90 |
|
| 54.21 |
|
| 52.35 |
|
| 52.30 |
| |||||
Reconciliation of net income to | ||||||||||||||||||||
Net income |
| 2,424 |
| $ | 2,614 |
| $ | 2,235 |
| $ | 2,221 |
| $ | 2,179 |
| |||||
Amortization expense |
| 54 |
|
| 54 |
|
| 54 |
|
| 55 |
|
| 55 |
| |||||
Capital charge |
| (1,338 | ) |
| (1,454 | ) |
| (1,409 | ) |
| (1,442 | ) |
| (1,402 | ) | |||||
Shareholder value added |
| 1,140 |
|
| 1,214 |
|
| 880 |
|
| 834 |
|
| 832 |
| |||||
Certain prior period amounts have been reclassified to conform to current period presentation.
3
Bank of America Corporation
Consolidated Statement of Income
(Dollars in millions, except per share information; shares in thousands)
First 2003 | Fourth Quarter 2002 | Third Quarter 2002 | Second Quarter 2002 | First Quarter 2002 | |||||||||||||||
Interest income | |||||||||||||||||||
Interest and fees on loan and leases | $ | 5,348 |
| $ | 5,502 |
| $ | 5,553 |
| $ | 5,530 |
| $ | 5,445 | |||||
Interest and dividends on securities |
| 778 |
|
| 1,061 |
|
| 1,104 |
|
| 924 |
|
| 946 | |||||
Federal funds sold and securities purchased under agreements to resell |
| 194 |
|
| 208 |
|
| 177 |
|
| 270 |
|
| 215 | |||||
Trading account assets |
| 1,042 |
|
| 979 |
|
| 1,006 |
|
| 948 |
|
| 878 | |||||
Other interest income |
| 363 |
|
| 371 |
|
| 345 |
|
| 312 |
|
| 387 | |||||
Total interest income |
| 7,725 |
|
| 8,121 |
|
| 8,185 |
|
| 7,984 |
|
| 7,871 | |||||
Interest expense | |||||||||||||||||||
Deposits |
| 1,183 |
|
| 1,292 |
|
| 1,414 |
|
| 1,384 |
|
| 1,344 | |||||
Short-term borrowings |
| 453 |
|
| 557 |
|
| 526 |
|
| 529 |
|
| 477 | |||||
Trading account liabilities |
| 308 |
|
| 289 |
|
| 342 |
|
| 344 |
|
| 285 | |||||
Long-term debt |
| 572 |
|
| 609 |
|
| 601 |
|
| 633 |
|
| 612 | |||||
Total interest expense |
| 2,516 |
|
| 2,747 |
|
| 2,883 |
|
| 2,890 |
|
| 2,718 | |||||
Net interest income |
| 5,209 |
|
| 5,374 |
|
| 5,302 |
|
| 5,094 |
|
| 5,153 | |||||
Noninterest income | |||||||||||||||||||
Consumer service charges |
| 777 |
|
| 802 |
|
| 761 |
|
| 732 |
|
| 691 | |||||
Corporate service charges |
| 577 |
|
| 571 |
|
| 586 |
|
| 566 |
|
| 567 | |||||
Total service charges |
| 1,354 |
|
| 1,373 |
|
| 1,347 |
|
| 1,298 |
|
| 1,258 | |||||
Consumer investment and brokerage services |
| 378 |
|
| 370 |
|
| 373 |
|
| 420 |
|
| 381 | |||||
Corporate investment and brokerage services |
| 165 |
|
| 171 |
|
| 174 |
|
| 178 |
|
| 170 | |||||
Total investment and brokerage services |
| 543 |
|
| 541 |
|
| 547 |
|
| 598 |
|
| 551 | |||||
Mortgage banking income |
| 405 |
|
| 209 |
|
| 220 |
|
| 138 |
|
| 195 | |||||
Investment banking income |
| 378 |
|
| 422 |
|
| 318 |
|
| 464 |
|
| 341 | |||||
Equity investment gains (losses) |
| (68 | ) |
| (54 | ) |
| (216 | ) |
| (36 | ) |
| 26 | |||||
Card income |
| 681 |
|
| 736 |
|
| 686 |
|
| 621 |
|
| 577 | |||||
Trading account profits |
| 114 |
|
| 99 |
|
| 71 |
|
| 263 |
|
| 345 | |||||
Other income |
| 278 |
|
| 104 |
|
| 247 |
|
| 135 |
|
| 147 | |||||
Total noninterest income |
| 3,685 |
|
| 3,430 |
|
| 3,220 |
|
| 3,481 |
|
| 3,440 | |||||
Total revenue |
| 8,894 |
|
| 8,804 |
|
| 8,522 |
|
| 8,575 |
|
| 8,593 | |||||
Provision for credit losses |
| 833 |
|
| 1,165 |
|
| 804 |
|
| 888 |
|
| 840 | |||||
Gains on sales of securities |
| 273 |
|
| 304 |
|
| 189 |
|
| 93 |
|
| 44 | |||||
Noninterest expense | |||||||||||||||||||
Personnel |
| 2,459 |
|
| 2,482 |
|
| 2,368 |
|
| 2,386 |
|
| 2,446 | |||||
Occupancy |
| 472 |
|
| 450 |
|
| 457 |
|
| 441 |
|
| 432 | |||||
Equipment |
| 284 |
|
| 292 |
|
| 291 |
|
| 279 |
|
| 262 | |||||
Marketing |
| 230 |
|
| 203 |
|
| 210 |
|
| 170 |
|
| 170 | |||||
Professional fees |
| 125 |
|
| 186 |
|
| 126 |
|
| 122 |
|
| 91 | |||||
Amortization of intangibles |
| 54 |
|
| 54 |
|
| 54 |
|
| 55 |
|
| 55 | |||||
Data processing |
| 266 |
|
| 291 |
|
| 295 |
|
| 226 |
|
| 205 | |||||
Telecommunications |
| 124 |
|
| 120 |
|
| 119 |
|
| 123 |
|
| 119 | |||||
Other general operating |
| 703 |
|
| 754 |
|
| 700 |
|
| 688 |
|
| 714 | |||||
Total noninterest expense |
| 4,717 |
|
| 4,832 |
|
| 4,620 |
|
| 4,490 |
|
| 4,494 | |||||
Income before income taxes |
| 3,617 |
|
| 3,111 |
|
| 3,287 |
|
| 3,290 |
|
| 3,303 | |||||
Income tax expense |
| 1,193 |
|
| 497 |
|
| 1,052 |
|
| 1,069 |
|
| 1,124 | |||||
Net income | $ | 2,424 |
| $ | 2,614 |
| $ | 2,235 |
| $ | 2,221 |
| $ | 2,179 | |||||
Net income available to common shareholders | $ | 2,423 |
| $ | 2,613 |
| $ | 2,233 |
| $ | 2,220 |
| $ | 2,178 | |||||
Per common share information | |||||||||||||||||||
Earnings | $ | 1.62 |
| $ | 1.74 |
| $ | 1.49 |
| $ | 1.45 |
| $ | 1.41 | |||||
Diluted earnings | $ | 1.59 |
| $ | 1.69 |
| $ | 1.45 |
| $ | 1.40 |
| $ | 1.38 | |||||
Dividends | $ | 0.64 |
| $ | 0.64 |
| $ | 0.60 |
| $ | 0.60 |
| $ | 0.60 | |||||
Average common shares issued and outstanding |
| 1,499,405 |
|
| 1,499,557 |
|
| 1,504,017 |
|
| 1,533,783 |
|
| 1,543,471 | |||||
Average diluted common shares issued and outstanding |
| 1,526,288 |
|
| 1,542,482 |
|
| 1,546,347 |
|
| 1,592,250 |
|
| 1,581,848 | |||||
Certain prior period amounts have been reclassified to conform to current period presentation.
4
Bank of America Corporation
Consolidated Balance Sheet
(Dollars in millions)
March 31 2003 | December 31 2002 | March 31 2002 | ||||||||||
Assets | ||||||||||||
Cash and cash equivalents | $ | 25,069 |
| $ | 24,973 |
| $ | 22,444 |
| |||
Time deposits placed and other short-term investments |
| 5,523 |
|
| 6,813 |
|
| 7,056 |
| |||
Federal funds sold and securities purchased under agreements to resell |
| 49,809 |
|
| 44,878 |
|
| 40,771 |
| |||
Trading account assets |
| 65,733 |
|
| 63,996 |
|
| 58,569 |
| |||
Derivative assets |
| 35,409 |
|
| 34,310 |
|
| 19,116 |
| |||
Securities: | ||||||||||||
Available-for-sale |
| 75,511 |
|
| 68,122 |
|
| 74,306 |
| |||
Held-to-maturity |
| 927 |
|
| 1,026 |
|
| 1,037 |
| |||
Total securities |
| 76,438 |
|
| 69,148 |
|
| 75,343 |
| |||
Loans and leases |
| 343,412 |
|
| 342,755 |
|
| 331,210 |
| |||
Allowance for credit losses |
| (6,853 | ) |
| (6,851 | ) |
| (6,869 | ) | |||
Loans and leases, net of allowance for credit losses |
| 336,559 |
|
| 335,904 |
|
| 324,341 |
| |||
Premises and equipment, net |
| 6,643 |
|
| 6,717 |
|
| 6,748 |
| |||
Mortgage banking assets |
| 1,995 |
|
| 2,110 |
|
| 4,104 |
| |||
Goodwill |
| 11,396 |
|
| 11,389 |
|
| 10,950 |
| |||
Core deposit intangibles and other intangibles |
| 1,065 |
|
| 1,095 |
|
| 1,256 |
| |||
Other assets |
| 64,126 |
|
| 59,125 |
|
| 49,223 |
| |||
Total assets | $ | 679,765 |
| $ | 660,458 |
| $ | 619,921 |
| |||
Liabilities | ||||||||||||
Deposits in domestic offices: | ||||||||||||
Noninterest-bearing | $ | 121,127 |
| $ | 122,686 |
| $ | 108,409 |
| |||
Interest-bearing |
| 242,287 |
|
| 232,320 |
|
| 224,630 |
| |||
Deposits in foreign offices: | ||||||||||||
Noninterest-bearing |
| 2,331 |
|
| 1,673 |
|
| 1,677 |
| |||
Interest-bearing |
| 29,431 |
|
| 29,779 |
|
| 32,484 |
| |||
Total deposits |
| 395,176 |
|
| 386,458 |
|
| 367,200 |
| |||
Federal funds purchased and securities sold under agreements to repurchase |
| 72,976 |
|
| 65,079 |
|
| 48,545 |
| |||
Trading account liabilities |
| 23,578 |
|
| 25,574 |
|
| 25,258 |
| |||
Derivative liabilities |
| 22,876 |
|
| 23,566 |
|
| 12,053 |
| |||
Commercial paper and other short-term borrowings |
| 29,729 |
|
| 25,234 |
|
| 21,992 |
| |||
Accrued expenses and other liabilities |
| 15,905 |
|
| 17,052 |
|
| 31,138 |
| |||
Long-term debt |
| 63,442 |
|
| 61,145 |
|
| 60,036 |
| |||
Trust preferred securities |
| 6,031 |
|
| 6,031 |
|
| 5,530 |
| |||
Total liabilities |
| 629,713 |
|
| 610,139 |
|
| 571,752 |
| |||
Shareholders’ equity | ||||||||||||
Preferred stock, $0.01 par value; authorized—100,000,000 shares; issued and outstanding 1,336,200; 1,356,749; and 1,452,249 shares |
| 57 |
|
| 58 |
|
| 62 |
| |||
Common stock, $0.01 par value; authorized—5,000,000,000 shares; issued and outstanding 1,497,530,740; 1,500,691,103; and 1,544,521,073 shares |
| 127 |
|
| 496 |
|
| 3,949 |
| |||
Retained earnings |
| 49,978 |
|
| 48,517 |
|
| 44,245 |
| |||
Accumulated other comprehensive income/(loss) |
| 74 |
|
| 1,232 |
|
| (72 | ) | |||
Other |
| (184 | ) |
| 16 |
|
| (15 | ) | |||
Total shareholders’ equity |
| 50,052 |
|
| 50,319 |
|
| 48,169 |
| |||
Total liabilities and shareholders’ equity | $ | 679,765 |
| $ | 660,458 |
| $ | 619,921 |
| |||
5
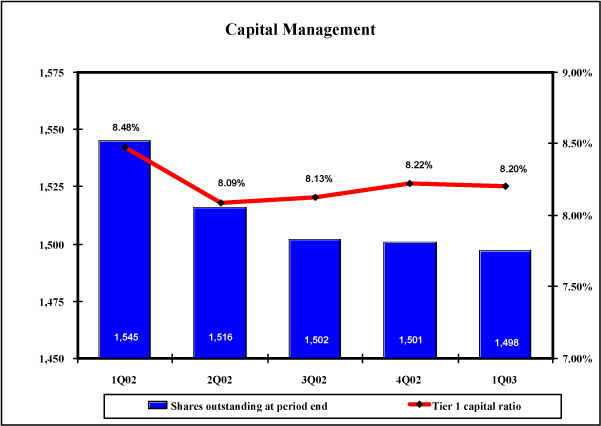
Bank of America Corporation
Capital Management
(Dollars in millions)
1Q02 | 2Q02 | 3Q02 | 4Q02 | 1Q03* | ||||||||||||||||
Tier 1 capital | $ | 42,078 |
| $ | 41,097 |
| $ | 41,732 |
| $ | 43,105 |
| $ | 43,821 |
| |||||
Total capital |
| 64,158 |
|
| 63,108 |
|
| 63,505 |
|
| 65,169 |
|
| 65,695 |
| |||||
Net risk-weighted assets |
| 496,227 |
|
| 508,008 |
|
| 513,085 |
|
| 524,175 |
|
| 534,722 |
| |||||
Tier 1 capital ratio |
| 8.48 | % |
| 8.09 | % |
| 8.13 | % |
| 8.22 | % |
| 8.20 | % | |||||
Total capital ratio |
| 12.93 |
|
| 12.42 |
|
| 12.38 |
|
| 12.43 |
|
| 12.29 |
| |||||
Ending equity / ending assets |
| 7.77 |
|
| 7.48 |
|
| 7.31 |
|
| 7.62 |
|
| 7.36 |
| |||||
Ending capital / ending assets |
| 8.66 |
|
| 8.35 |
|
| 8.22 |
|
| 8.53 |
|
| 8.25 |
| |||||
Average equity / average assets |
| 7.44 |
|
| 7.47 |
|
| 6.97 |
|
| 6.91 |
|
| 6.92 |
| |||||
*Preliminary
Share Repurchase Program
18 million common shares were repurchased in the first quarter of 2003 as a part of ongoing share repurchase programs.
135 million shares remain outstanding under the current authorized program (133 million net of outstanding put options).
15 million shares were issued in the first quarter of 2003, mostly due to stock incentive plans.
6
Bank of America Corporation
Average Balances and Interest Rates—Taxable-Equivalent Basis
(Dollars in millions)
First Quarter 2003 | Fourth Quarter 2002 | First Quarter 2002 | |||||||||||||||||||||||||
Average Balance | Interest Income/ Expense | Yield/ Rate | Average Balance | Interest Income/ Expense | Yield/ Rate | Average Balance | Interest Income/ Expense | Yield/ Rate | |||||||||||||||||||
Earning assets | |||||||||||||||||||||||||||
Time deposits placed and other short-term investments | $ | 6,987 | $ | 43 | 2.49 | % | $ | 8,853 | $ | 56 | 2.49 | % | $ | 10,242 | $ | 61 | 2.43 | % | |||||||||
Federal funds sold and securities purchased under agreements to resell |
| 57,873 |
| 194 | 1.35 |
|
| 49,169 |
| 208 | 1.68 |
|
| 44,682 |
| 215 | 1.94 |
| |||||||||
Trading account assets |
| 99,085 |
| 1,053 | 4.27 |
|
| 84,181 |
| 994 | 4.71 |
|
| 70,613 |
| 888 | 5.06 |
| |||||||||
Securities(1) |
| 67,784 |
| 793 | 4.69 |
|
| 83,751 |
| 1,078 | 5.15 |
|
| 73,542 |
| 963 | 5.24 |
| |||||||||
Loans and leases(2): | |||||||||||||||||||||||||||
Commercial—domestic |
| 103,663 |
| 1,836 | 7.18 |
|
| 105,333 |
| 1,777 | 6.70 |
|
| 116,160 |
| 1,978 | 6.90 |
| |||||||||
Commercial—foreign |
| 18,876 |
| 156 | 3.35 |
|
| 20,538 |
| 180 | 3.48 |
|
| 21,917 |
| 226 | 4.17 |
| |||||||||
Commercial real estate—domestic |
| 19,955 |
| 215 | 4.37 |
|
| 20,359 |
| 245 | 4.77 |
|
| 22,251 |
| 275 | 5.01 |
| |||||||||
Commercial real estate—foreign |
| 301 |
| 3 | 3.88 |
|
| 426 |
| 4 | 3.93 |
|
| 389 |
| 4 | 4.00 |
| |||||||||
Total commercial |
| 142,795 |
| 2,210 | 6.27 |
|
| 146,656 |
| 2,206 | 5.97 |
|
| 160,717 |
| 2,483 | 6.26 |
| |||||||||
Residential mortgage |
| 113,695 |
| 1,582 | 5.59 |
|
| 108,019 |
| 1,699 | 6.28 |
|
| 81,104 |
| 1,389 | 6.88 |
| |||||||||
Home equity lines |
| 23,054 |
| 267 | 4.70 |
|
| 23,347 |
| 300 | 5.10 |
|
| 22,010 |
| 294 | 5.42 |
| |||||||||
Direct/Indirect consumer |
| 31,393 |
| 503 | 6.49 |
|
| 30,643 |
| 523 | 6.76 |
|
| 30,360 |
| 550 | 7.34 |
| |||||||||
Consumer finance |
| 8,012 |
| 154 | 7.76 |
|
| 8,943 |
| 174 | 7.75 |
|
| 12,134 |
| 255 | 8.46 |
| |||||||||
Credit card |
| 24,684 |
| 644 | 10.57 |
|
| 23,535 |
| 613 | 10.33 |
|
| 19,383 |
| 490 | 10.26 |
| |||||||||
Foreign consumer |
| 2,029 |
| 17 | 3.45 |
|
| 1,956 |
| 17 | 3.48 |
|
| 2,093 |
| 19 | 3.71 |
| |||||||||
Total consumer |
| 202,867 |
| 3,167 | 6.30 |
|
| 196,443 |
| 3,326 | 6.74 |
|
| 167,084 |
| 2,997 | 7.24 |
| |||||||||
Total loans and leases |
| 345,662 |
| 5,377 | 6.29 |
|
| 343,099 |
| 5,532 | 6.41 |
|
| 327,801 |
| 5,480 | 6.76 |
| |||||||||
Other earning assets |
| 35,701 |
| 417 | 4.71 |
|
| 32,828 |
| 417 | 5.07 |
|
| 22,231 |
| 358 | 6.52 |
| |||||||||
Total earning assets(3) |
| 613,092 |
| 7,877 | 5.18 |
|
| 601,881 |
| 8,285 | 5.48 |
|
| 549,111 |
| 7,965 | 5.86 |
| |||||||||
Cash and cash equivalents |
| 21,699 |
| 21,242 |
| 22,037 | |||||||||||||||||||||
Other assets, less allowance for credit losses |
| 78,508 |
| 72,345 |
| 66,530 | |||||||||||||||||||||
Total assets | $ | 713,299 | $ | 695,468 | $ | 637,678 | |||||||||||||||||||||
Interest-bearing liabilities | |||||||||||||||||||||||||||
Domestic interest-bearing deposits: | |||||||||||||||||||||||||||
Savings | $ | 22,916 | $ | 34 | 0.59 | % | $ | 22,142 | $ | 35 | 0.63 | % | $ | 20,716 | $ | 33 | 0.64 | % | |||||||||
NOW and money market deposit accounts |
| 142,338 |
| 291 | 0.83 |
|
| 137,229 |
| 325 | 0.94 |
|
| 127,218 |
| 335 | 1.07 |
| |||||||||
Consumer CDs and IRAs |
| 66,937 |
| 695 | 4.21 |
|
| 66,266 |
| 728 | 4.36 |
|
| 69,359 |
| 730 | 4.27 |
| |||||||||
Negotiable CDs, public funds and other time deposits |
| 3,598 |
| 16 | 1.78 |
|
| 3,400 |
| 17 | 1.97 |
|
| 4,671 |
| 32 | 2.82 |
| |||||||||
Total domestic interest-bearing deposits |
| 235,789 |
| 1,036 | 1.78 |
|
| 229,037 |
| 1,105 | 1.91 |
|
| 221,964 |
| 1,130 | 2.06 |
| |||||||||
Foreign interest-bearing deposits(4) | |||||||||||||||||||||||||||
Banks located in foreign countries |
| 14,218 |
| 80 | 2.27 |
|
| 15,286 |
| 104 | 2.70 |
|
| 15,464 |
| 107 | 2.79 |
| |||||||||
Governments and official institutions |
| 1,785 |
| 6 | 1.31 |
|
| 1,737 |
| 7 | 1.68 |
|
| 2,904 |
| 14 | 1.96 |
| |||||||||
Time, savings, and other |
| 18,071 |
| 61 | 1.38 |
|
| 17,929 |
| 76 | 1.68 |
|
| 19,620 |
| 93 | 1.93 |
| |||||||||
Total foreign interest-bearing deposits |
| 34,074 |
| 147 | 1.75 |
|
| 34,952 |
| 187 | 2.12 |
|
| 37,988 |
| 214 | 2.29 |
| |||||||||
Total interest-bearing deposits |
| 269,863 |
| 1,183 | 1.78 |
|
| 263,989 |
| 1,292 | 1.94 |
|
| 259,952 |
| 1,344 | 2.10 |
| |||||||||
Federal funds purchased, securities sold under agreements to repurchase and other short-term borrowings |
| 123,041 |
| 453 | 1.49 |
|
| 123,434 |
| 558 | 1.79 |
|
| 86,870 |
| 477 | 2.23 |
| |||||||||
Trading account liabilities |
| 34,858 |
| 308 | 3.58 |
|
| 30,445 |
| 289 | 3.77 |
|
| 31,066 |
| 285 | 3.72 |
| |||||||||
Long-term debt and trust preferred securities |
| 67,399 |
| 572 | 3.40 |
|
| 65,702 |
| 609 | 3.71 |
|
| 67,694 |
| 612 | 3.62 |
| |||||||||
Total interest-bearing liabilities(3) |
| 495,161 |
| 2,516 | 2.05 |
|
| 483,570 |
| 2,748 | 2.26 |
|
| 445,582 |
| 2,718 | 2.47 |
| |||||||||
Noninterest-bearing sources: | |||||||||||||||||||||||||||
Noninterest-bearing deposits |
| 115,897 |
| 117,392 |
| 104,451 | |||||||||||||||||||||
Other liabilities |
| 52,841 |
| 46,432 |
| 40,189 | |||||||||||||||||||||
Shareholders’ equity |
| 49,400 |
| 48,074 |
| 47,456 | |||||||||||||||||||||
Total liabilities and shareholders’ equity | $ | 713,299 | $ | 695,468 | $ | 637,678 | |||||||||||||||||||||
Net interest spread | 3.13 |
| 3.22 |
| 3.39 |
| |||||||||||||||||||||
Impact of noninterest-bearing sources | 0.39 |
| 0.44 |
| .46 |
| |||||||||||||||||||||
Net interest income/yield on earning assets | $ | 5,361 | 3.52 | % | $ | 5,537 | 3.66 | % | $ | 5,247 | 3.85 | % | |||||||||||||||
| (1) | The average balance and yield on securities are based on the average of historical amortized cost balances. |
| (2) | Nonperforming loans are included in the respective average loan balances. Income on such nonperforming loans is recognized on a cash basis. |
| (3) | Interest income includes the impact of interest rate risk management contracts, which increased interest income on the underlying assets $563 in the first quarter of 2003 and $517 and $560 in the fourth and first quarters of 2002, respectively. These amounts were substantially offset by corresponding decreases in the income earned on the underlying assets. Interest expense includes the impact of interest rate risk management contracts, which (increased) decreased interest expense on the underlying liabilities $(46) in the first quarter of 2003 and $(62) and $55 in the fourth and first quarters of 2002, respectively. These amounts were substantially offset by corresponding decreases or increases in the interest paid on the underlying liabilities. |
| (4) | Primarily consists of time deposits in denominations of $100,000 or more. |
7
8
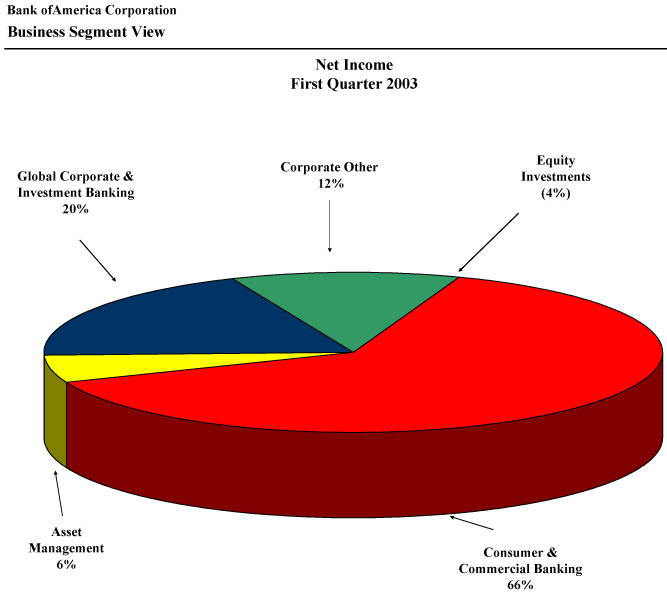
Bank of America Corporation
Consumer and Commercial Banking Segment Results
(Dollars in millions)
Quarterly | ||||||||||||||||||||
1 Qtr 03 | 4 Qtr 02 | 3 Qtr 02 | 2 Qtr 02 | 1 Qtr 02 | ||||||||||||||||
Key Measures | ||||||||||||||||||||
Total revenue* | $ | 6,033 |
| $ | 6,192 |
| $ | 6,051 |
| $ | 5,723 |
| $ | 5,650 |
| |||||
Provision for credit losses |
| 488 |
|
| 510 |
|
| 420 |
|
| 449 |
|
| 427 |
| |||||
Net income |
| 1,591 |
|
| 1,721 |
|
| 1,679 |
|
| 1,587 |
|
| 1,556 |
| |||||
Shareholder value added |
| 1,099 |
|
| 1,169 |
|
| 1,145 |
|
| 1,056 |
|
| 1,024 |
| |||||
Return on average equity |
| 32.6 | % |
| 34.7 | % |
| 34.9 | % |
| 33.1 | % |
| 32.4 | % | |||||
Efficiency ratio* |
| 50.0 |
|
| 47.5 |
|
| 49.4 |
|
| 48.3 |
|
| 49.1 |
| |||||
Selected Average Balance | ||||||||||||||||||||
Sheet Components | ||||||||||||||||||||
Total loans and leases | $ | 185,779 |
| $ | 184,161 |
| $ | 182,083 |
| $ | 181,955 |
| $ | 181,415 |
| |||||
Total deposits |
| 295,654 |
|
| 292,259 |
|
| 283,769 |
|
| 280,161 |
|
| 276,655 |
| |||||
Total earning assets |
| 321,945 |
|
| 314,604 |
|
| 286,248 |
|
| 279,025 |
|
| 275,108 |
| |||||
Period End(in billions) | ||||||||||||||||||||
Mortgage servicing portfolio | $ | 257.2 |
| $ | 264.5 |
| $ | 278.7 |
| $ | 287.8 |
| $ | 289.9 |
| |||||
Mortgage originations | ||||||||||||||||||||
Retail |
| 21.8 |
|
| 22.2 |
|
| 15.3 |
|
| 9.5 |
|
| 13.0 |
| |||||
Wholesale |
| 10.8 |
|
| 9.7 |
|
| 8.6 |
|
| 4.9 |
|
| 4.9 |
| |||||
| * | Taxable-equivalent basis |
Certain prior period amounts have been reclassified between segments to conform to the current period presentation.
9
Bank of America Corporation
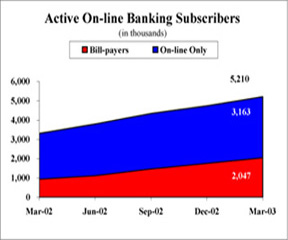
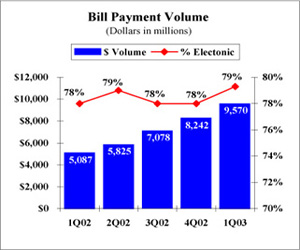
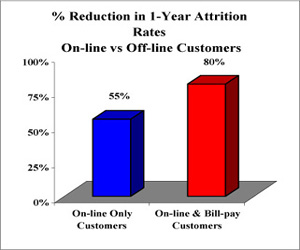
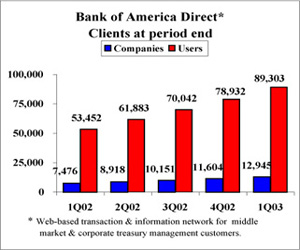
E-Commerce & BankofAmerica.com
| Bank of America has the largest active online banking customer base with over 5.2 million subscribers. This represents an active customer penetration rate of 35%.
Bank of America uses a strict Active User standard—customers must have used our online services within the last 90 days.
2.0 million active bill pay users paid over $9.5 billion worth of bills this quarter. The number of customers who sign up and use Bank of America Bill Pay Service continues to far surpass that of any other financial institution.
Currently, 225 companies are presenting nearly 3.0 million e-bills per quarter. | |
|
| |
|
|

10
Bank of America Corporation
Consumer Credit Card Results
Included within Consumer Products
(Dollars in millions)
Quarterly | ||||||||||||||||||||
1 Qtr 03 | 4 Qtr 02 | 3 Qtr 02 | 2 Qtr 02 | 1 Qtr 02 | ||||||||||||||||
Key Measures | ||||||||||||||||||||
Outstandings: | ||||||||||||||||||||
Held (Period-End) | $ | 24,819 |
| $ | 24,729 |
| $ | 23,062 |
| $ | 21,155 |
| $ | 19,535 |
| |||||
Managed (Period-End) |
| 29,064 |
|
| 29,461 |
|
| 28,057 |
|
| 27,089 |
|
| 26,558 |
| |||||
Held (Average) |
| 24,684 |
|
| 23,535 |
|
| 22,263 |
|
| 20,402 |
|
| 19,383 |
| |||||
Managed (Average) |
| 29,161 |
|
| 28,406 |
|
| 27,540 |
|
| 26,902 |
|
| 26,539 |
| |||||
Managed Income Statement: | ||||||||||||||||||||
Total revenue | $ | 965 |
| $ | 943 |
| $ | 895 |
| $ | 806 |
| $ | 826 |
| |||||
Provision for credit losses |
| 409 |
|
| 386 |
|
| 392 |
|
| 393 |
|
| 371 |
| |||||
Noninterest expense |
| 275 |
|
| 244 |
|
| 254 |
|
| 249 |
|
| 244 |
| |||||
Income before income taxes |
| 281 |
|
| 313 |
|
| 249 |
|
| 164 |
|
| 211 |
| |||||
Shareholder Value Added | $ | 128 |
| $ | 152 |
| $ | 114 |
| $ | 62 |
| $ | 92 |
| |||||
Credit Quality: | ||||||||||||||||||||
Held: | ||||||||||||||||||||
Charge-off $ | $ | 323 |
| $ | 299 |
| $ | 285 |
| $ | 269 |
| $ | 241 |
| |||||
Charge-off % |
| 5.31 | % |
| 5.03 | % |
| 5.09 | % |
| 5.28 | % |
| 5.05 | % | |||||
Managed: | ||||||||||||||||||||
Losses $ | $ | 378 |
| $ | 357 |
| $ | 356 |
| $ | 375 |
| $ | 355 |
| |||||
Losses % |
| 5.25 | % |
| 4.99 | % |
| 5.13 | % |
| 5.59 | % |
| 5.43 | % | |||||
Managed Delinquency %: | ||||||||||||||||||||
30+ |
| 4.18 | % |
| 3.94 | % |
| 3.63 | % |
| 3.78 | % |
| 4.16 | % | |||||
90+ |
| 1.91 |
|
| 1.71 |
|
| 1.66 |
|
| 1.76 |
|
| 1.95 |
| |||||
11
Bank of America Corporation
Global Corporate and Investment Banking Segment Results
(Dollars in millions)
Quarterly | ||||||||||||||||||||
Key Measures | 1 Qtr 03 | 4 Qtr 02 | 3 Qtr 02 | 2 Qtr 02 | 1 Qtr 02 | |||||||||||||||
Total revenue* | $ | 2,343 |
| $ | 2,085 |
| $ | 2,001 |
| $ | 2,306 |
| $ | 2,285 |
| |||||
Provision for credit losses |
| 272 |
|
| 524 |
|
| 203 |
|
| 216 |
|
| 264 |
| |||||
Net income |
| 481 |
|
| 206 |
|
| 385 |
|
| 509 |
|
| 457 |
| |||||
Shareholder value added |
| 203 |
|
| (120 | ) |
| 62 |
|
| 183 |
|
| 123 |
| |||||
Return on average equity |
| 18.6 | % |
| 7.4 | % |
| 14.0 | % |
| 18.3 | % |
| 16.0 | % | |||||
Efficiency ratio* |
| 56.5 |
|
| 60.4 |
|
| 60.5 |
|
| 56.2 |
|
| 57.1 |
| |||||
Selected Average Balance | ||||||||||||||||||||
Sheet Components | ||||||||||||||||||||
Total loans and leases | $ | 56,521 |
| $ | 60,558 |
| $ | 61,091 |
| $ | 64,172 |
| $ | 67,018 |
| |||||
Total deposits |
| 67,315 |
|
| 65,879 |
|
| 66,163 |
|
| 63,770 |
|
| 63,212 |
| |||||
Total earning assets |
| 226,122 |
|
| 207,850 |
|
| 203,596 |
|
| 201,458 |
|
| 192,570 |
| |||||
| * | Taxable-equivalent basis |
Certain prior period amounts have been reclassified between segments to conform to the current period presentation.
12
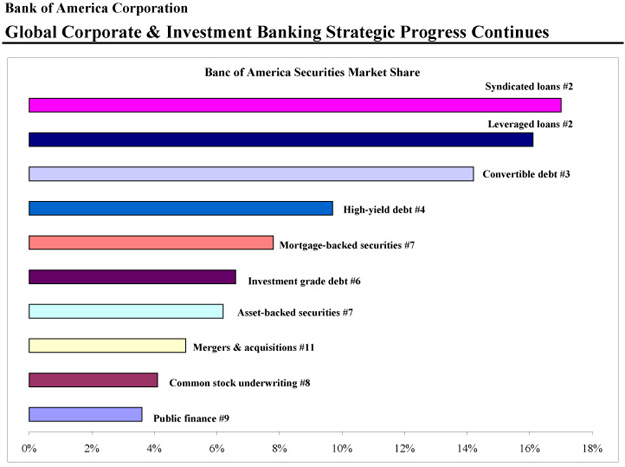
Source: Thomson Financial
Significant US market share gains
Largest market share gain of the quarter was dollar-denominated convertible debt where market share quadrupled from 3.3% and an eighth place rank in the first quarter 2002 to 14.2% and a third place rank.
Mortgage-backed securities market share doubled from one year ago to finish with a 7.8% share and a seventh place rank.
Banc of America Securities maintained its second place market share ranking for both syndicated and leveraged lending while continuing its dominance in number of deals.
Common stock issuance market share moved form 2.3% to 4.1% while the ranking moved from 10th to 8th.
13
Bank of America Corporation
Asset Management Segment Results
(Dollars in millions)
Quarterly | ||||||||||||||||||||
Key Measures | 1 Qtr 03 | 4 Qtr 02 | 3 Qtr 02 | 2 Qtr 02 | 1 Qtr 02 | |||||||||||||||
Total revenue* | $ | 578 |
| $ | 588 |
| $ | 571 |
| $ | 622 |
| $ | 598 |
| |||||
Provision for credit losses |
| (4 | ) |
| 30 |
|
| 118 |
|
| 143 |
|
| 26 |
| |||||
Net income |
| 140 |
|
| 108 |
|
| 63 |
|
| 66 |
|
| 137 |
| |||||
Shareholder value added |
| 66 |
|
| 26 |
|
| (14 | ) |
| (2 | ) |
| 70 |
| |||||
Return on average equity |
| 20.3 | % |
| 15.5 | % |
| 9.6 | % |
| 11.4 | % |
| 23.9 | % | |||||
Efficiency ratio* |
| 63.3 |
|
| 67.3 |
|
| 63.8 |
|
| 61.0 |
|
| 59.9 |
| |||||
Selected Average Balance | ||||||||||||||||||||
Sheet Components | ||||||||||||||||||||
Total loans and leases | $ | 22,683 |
| $ | 22,950 |
| $ | 23,637 |
| $ | 24,308 |
| $ | 24,794 |
| |||||
Total deposits |
| 12,859 |
|
| 12,531 |
|
| 11,967 |
|
| 11,776 |
|
| 11,837 |
| |||||
Total earning assets |
| 23,415 |
|
| 23,693 |
|
| 24,238 |
|
| 24,907 |
|
| 25,445 |
| |||||
Period End (in billions) | ||||||||||||||||||||
Assets under management | $ | 297.0 |
| $ | 310.4 |
| $ | 271.9 |
| $ | 295.2 |
| $ | 314.9 |
| |||||
Client brokerage assets |
| 90.8 |
|
| 90.8 |
|
| 87.1 |
|
| 90.5 |
|
| 96.6 |
| |||||
Assets in custody |
| 45.1 |
|
| 46.6 |
|
| 42.1 |
|
| 41.0 |
|
| 46.0 |
| |||||
Total client assets | $ | 432.9 |
| $ | 447.8 |
| $ | 401.1 |
| $ | 426.7 |
| $ | 457.5 |
| |||||
| * | Taxable-equivalent basis |
Certain prior period amounts have been reclassified between segments to conform to the current period presentation.
14
Bank of America Corporation
Equity Investments Segment Results
(Dollars in millions)
Quarterly | ||||||||||||||||||||
Key Measures | 1 Qtr 03 | 4 Qtr 02 | 3 Qtr 02 | 2 Qtr 02 | 1 Qtr 02 | |||||||||||||||
Total revenue* | ($ | 107 | ) | ($ | 100 | ) | ($ | 233 | ) | ($ | 84 | ) | ($ | 28 | ) | |||||
Provision for credit losses |
| 1 |
|
| 7 |
|
| — |
|
| — |
|
| — |
| |||||
Net income |
| (86 | ) |
| (83 | ) |
| (161 | ) |
| (55 | ) |
| (32 | ) | |||||
Shareholder value added |
| (141 | ) |
| (146 | ) |
| (223 | ) |
| (120 | ) |
| (94 | ) | |||||
Return on average equity |
| (16.7 | )% |
| (15.6 | )% |
| (30.7 | )% |
| (10.1 | )% |
| (6.2 | )% | |||||
Efficiency ratio* |
| (24.2 | ) |
| (27.5 | ) |
| (11.6 | ) |
| (10.5 | ) |
| (98.4 | ) | |||||
Selected Average Balance | ||||||||||||||||||||
Sheet Components | ||||||||||||||||||||
Total loans and leases | $ | 434 |
| $ | 438 |
| $ | 446 |
| $ | 448 |
| $ | 427 |
| |||||
Total deposits |
| — |
|
| — |
|
| — |
|
| — |
|
| — |
| |||||
Total earning assets |
| 434 |
|
| 438 |
|
| 446 |
|
| 448 |
|
| 433 |
| |||||
Period End | ||||||||||||||||||||
Investment balances for principal investing | $ | 5,435 |
| $ | 5,395 |
| $ | 5,429 |
| $ | 5,429 |
| $ | 5,520 |
| |||||
| * | Taxable-equivalent basis |
Certain prior period amounts have been reclassified between segments to conform to the current period presentation.
15
Bank of America Corporation
Corporate Other Results(1)
(Dollars in millions)
Quarterly | |||||||||||||||||||
Key Measures | 1 Qtr 03 | 4 Qtr 02 | 3 Qtr 02 | 2 Qtr 02 | 1 Qtr 02 | ||||||||||||||
Total revenue* | $ | 199 |
| $ | 202 | $ | 295 |
| $ | 176 |
| $ | 182 |
| |||||
Provision for credit losses |
| 76 |
|
| 94 |
| 63 |
|
| 80 |
|
| 123 |
| |||||
Net income(2) |
| 298 |
|
| 662 |
| 269 |
|
| 114 |
|
| 61 |
| |||||
Shareholder value added |
| (87 | ) |
| 285 |
| (90 | ) |
| (283 | ) |
| (291 | ) | |||||
Selected Average Balance | |||||||||||||||||||
Sheet Components | |||||||||||||||||||
Total loans and leases | $ | 80,245 |
| $ | 74,992 | $ | 73,228 |
| $ | 64,802 |
| $ | 54,147 |
| |||||
Total deposits |
| 9,932 |
|
| 10,713 |
| 12,034 |
|
| 10,279 |
|
| 12,699 |
| |||||
Total earning assets |
| 161,018 |
|
| 171,269 |
| 158,047 |
|
| 138,771 |
|
| 132,263 |
| |||||
| * | Taxable-equivalent basis |
| (1) | Corporate Other consists primarily of gains and losses associated with managing the balance sheet of the Corporation, certain consumer finance and commercial lending businesses being liquidated, and certain residential mortgages originated by the mortgage group or otherwise acquired and held for asset/liability management purposes. |
| (2) | Includes $488 tax benefit in the fourth quarter of 2002 related to the settlement of federal income tax returns through 1999. |
Certain prior period amounts have been reclassified between segments to conform to the current period presentation.
16
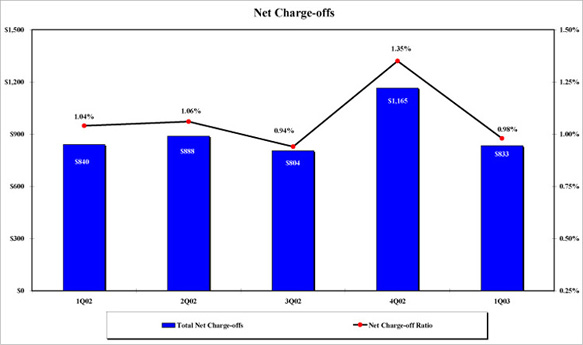
Bank of America Corporation
Net Charge-offs and Net Charge-off Ratios
(Dollars in millions)
1Q02 | 2Q02 | 3Q02 | 4Q02 | 1Q03 | |||||||||||||||||||||||||||
Amt. | Ratio | Amt. | Ratio | Amt. | Ratio | Amt. | Ratio | Amt. | Ratio | ||||||||||||||||||||||
Commercial—domestic | $ | 370 | 1.29 | % | $ | 383 | 1.38 | % | $ | 240 | 0.90 | % | $ | 478 | 1.80 | % | $ | 239 |
| 0.94 | % | ||||||||||
Commercial—foreign |
| 49 | 0.90 |
|
| 119 | 2.23 |
|
| 148 | 2.77 |
|
| 205 | 3.95 |
|
| 120 |
| 2.57 |
| ||||||||||
Commercial real estate—domestic |
| 14 | 0.25 |
|
| 8 | 0.14 |
|
| 6 | 0.12 |
|
| 9 | 0.20 |
|
| 9 |
| 0.18 |
| ||||||||||
Total commercial |
| 433 | 1.09 |
|
| 510 | 1.32 |
|
| 394 | 1.05 |
|
| 692 | 1.87 |
|
| 368 |
| 1.04 |
| ||||||||||
Residential mortgage |
| 11 | 0.05 |
|
| 8 | 0.03 |
|
| 5 | 0.02 |
|
| 18 | 0.07 |
|
| 2 |
| 0.01 |
| ||||||||||
Home equity lines |
| 8 | 0.15 |
|
| 7 | 0.12 |
|
| 5 | 0.08 |
|
| 6 | 0.10 |
|
| 6 |
| 0.11 |
| ||||||||||
Direct/indirect consumer |
| 64 | 0.86 |
|
| 38 | 0.50 |
|
| 48 | 0.63 |
|
| 60 | 0.78 |
|
| 56 |
| 0.72 |
| ||||||||||
Consumer finance |
| 75 | 2.49 |
|
| 49 | 1.77 |
|
| 54 | 2.13 |
|
| 77 | 3.44 |
|
| 68 |
| 3.42 |
| ||||||||||
Credit card |
| 241 | 5.05 |
|
| 269 | 5.28 |
|
| 285 | 5.09 |
|
| 299 | 5.03 |
|
| 323 |
| 5.31 |
| ||||||||||
Other consumer domestic |
| 7 | n/m |
|
| 7 | n/m |
|
| 11 | n/m |
|
| 11 | n/m |
|
| 9 |
| n/m |
| ||||||||||
Foreign consumer |
| 1 | 0.16 |
|
| — | — |
|
| 2 | 0.32 |
|
| 2 | 0.38 |
|
| 1 |
| 0.20 |
| ||||||||||
Total consumer |
| 407 | 0.99 |
|
| 378 | 0.84 |
|
| 410 | 0.85 |
|
| 473 | 0.95 |
|
| 465 |
| 0.93 |
| ||||||||||
Total net charge-offs | $ | 840 | 1.04 |
| $ | 888 | 1.06 |
| $ | 804 | 0.94 |
| $ | 1,165 | 1.35 |
| $ | 833 |
| 0.98 |
| ||||||||||
By Business Segment: | |||||||||||||||||||||||||||||||
Consumer & commercial banking | $ | 427 | 0.95 | % | $ | 449 | 0.99 | % | $ | 420 | 0.92 | % | $ | 509 | 1.10 | % | $ | 488 |
| 1.06 | % | ||||||||||
Global corporate & investment banking |
| 264 | 1.60 |
|
| 216 | 1.35 |
|
| 203 | 1.32 |
|
| 526 | 3.44 |
|
| 272 |
| 1.96 |
| ||||||||||
Asset management |
| 26 | 0.44 |
|
| 143 | 2.37 |
|
| 118 | 1.99 |
|
| 30 | 0.52 |
|
| (4 | ) | (0.06 | ) | ||||||||||
Equity investments |
| — | — |
|
| — | — |
|
| — | — |
|
| 7 | 6.26 |
|
| 1 |
| 0.72 |
| ||||||||||
Corporate other |
| 123 | 0.92 |
|
| 80 | 0.50 |
|
| 63 | 0.34 |
|
| 93 | 0.50 |
|
| 76 |
| 0.38 |
| ||||||||||
Total net charge-offs | $ | 840 | 1.04 |
| $ | 888 | 1.06 |
| $ | 804 | 0.94 |
| $ | 1,165 | 1.35 |
| $ | 833 |
| 0.98 |
| ||||||||||
Loans are classified as domestic or foreign based upon the domicile of the borrower.
17
Bank of America Corporation
Nonperforming Assets
(Dollars in millions)
1Q02 | 2Q02 | 3Q02 | 4Q02 | 1Q03 | ||||||||||||||||
Commercial—domestic | $ | 3,207 |
| $ | 2,847 |
| $ | 3,132 |
| $ | 2,781 |
| $ | 2,605 |
| |||||
Commercial—foreign |
| 583 |
|
| 980 |
|
| 854 |
|
| 1,359 |
|
| 1,279 |
| |||||
Commercial real estate—domestic |
| 216 |
|
| 202 |
|
| 172 |
|
| 161 |
|
| 173 |
| |||||
Commercial real estate—foreign |
| 2 |
|
| 3 |
|
| 3 |
|
| 3 |
|
| 3 |
| |||||
Total commercial |
| 4,008 |
|
| 4,032 |
|
| 4,161 |
|
| 4,304 |
|
| 4,060 |
| |||||
Residential mortgage |
| 477 |
|
| 503 |
|
| 585 |
|
| 612 |
|
| 628 |
| |||||
Home equity lines |
| 73 |
|
| 64 |
|
| 57 |
|
| 66 |
|
| 63 |
| |||||
Direct/Indirect consumer |
| 26 |
|
| 27 |
|
| 31 |
|
| 30 |
|
| 28 |
| |||||
Consumer finance |
| 8 |
|
| 8 |
|
| 8 |
|
| 19 |
|
| 18 |
| |||||
Foreign consumer |
| 9 |
|
| 8 |
|
| 7 |
|
| 6 |
|
| 9 |
| |||||
Total consumer |
| 593 |
|
| 610 |
|
| 688 |
|
| 733 |
|
| 746 |
| |||||
Total nonperforming loans |
| 4,601 |
|
| 4,642 |
|
| 4,849 |
|
| 5,037 |
|
| 4,806 |
| |||||
Foreclosed properties |
| 391 |
|
| 297 |
|
| 282 |
|
| 225 |
|
| 227 |
| |||||
Total nonperforming assets(1) | $ | 4,992 |
| $ | 4,939 |
| $ | 5,131 |
|
| 5,262 |
|
| 5,033 |
| |||||
Loans past due 90 days or more and still accruing | $ | 662 |
| $ | 605 |
| $ | 726 |
| $ | 764 |
| $ | 808 |
| |||||
Nonperforming Assets / Total Assets |
| 0.81 | % |
| 0.77 | % |
| 0.78 | % |
| 0.80 | % |
| 0.74 | % | |||||
Nonperforming Assets / Total Loans, Leases and Foreclosed Properties |
| 1.51 |
|
| 1.45 |
|
| 1.50 |
|
| 1.53 |
|
| 1.46 |
| |||||
Nonperforming Loans / Total Loans and Leases |
| 1.39 |
|
| 1.36 |
|
| 1.42 |
|
| 1.47 |
|
| 1.40 |
| |||||
Allowance for Loan Losses | $ | 6,869 |
| $ | 6,873 |
| $ | 6,861 |
| $ | 6,851 |
| $ | 6,853 |
| |||||
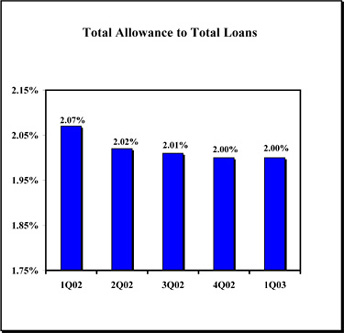
Allowance / Total Loans |
| 2.07 | % |
| 2.02 | % |
| 2.01 | % |
| 2.00 | % |
| 2.00 | % | |||||
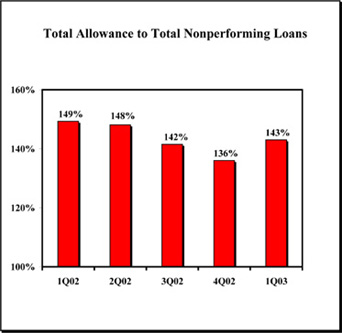
Allowance / Total Nonperforming Loans |
| 149 |
|
| 148 |
|
| 142 |
|
| 136 |
|
| 143 |
| |||||
| Loans | are classified as domestic or foreign based upon the domicile of the borrower. |
| (1) | Balances do not include $174, $120, $184, $221, and $304 of nonperforming assets included in other assets at March 31, 2003, December 31, 2002, September 30, 2002, June 30, 2002, and March 31, 2002, respectively. |
|
|
18
Bank of America Corporation
Significant Industry Non-Real Estate Outstanding Commercial Loans and Leases
(Dollars in millions)
March 31, 2003 | December 31, 2002 | Increase/(Decrease) from 12/31/02 | |||||||
Retailing | $ | 10,710 | $ | 10,165 | 5 | % | |||
Transportation |
| 8,189 |
| 8,030 | 2 |
| |||
Leisure and sports, hotels and restaurants |
| 7,986 |
| 8,139 | (2 | ) | |||
Materials |
| 7,820 |
| 7,972 | (2 | ) | |||
Food, beverage and tobacco |
| 7,563 |
| 7,335 | 3 |
| |||
Diversified financials |
| 7,507 |
| 8,344 | (10 | ) | |||
Capital goods |
| 7,098 |
| 7,088 | 0 |
| |||
Commercial services and supplies |
| 6,216 |
| 6,449 | (4 | ) | |||
Education and government |
| 5,565 |
| 5,206 | 7 |
| |||
Utilities |
| 4,938 |
| 5,590 | (12 | ) | |||
Media |
| 4,883 |
| 5,911 | (17 | ) | |||
Health care equipment and services |
| 3,987 |
| 3,912 | 2 |
| |||
Energy |
| 3,003 |
| 3,076 | (2 | ) | |||
Telecommunications services |
| 2,796 |
| 3,105 | (10 | ) | |||
Consumer durables and apparel |
| 2,545 |
| 2,591 | (2 | ) | |||
Religious and social organizations |
| 2,512 |
| 2,426 | 4 |
| |||
Banks |
| 1,602 |
| 1,881 | (15 | ) | |||
Insurance |
| 1,409 |
| 1,616 | (13 | ) | |||
Technology hardware and equipment |
| 1,305 |
| 1,368 | (5 | ) | |||
Food and drug retailing |
| 1,232 |
| 1,344 | (8 | ) | |||
Other(1) |
| 22,591 |
| 23,417 | (4 | ) | |||
Total | $ | 121,457 | $ | 124,965 | (3 | )% | |||
| (1) | At March 31, 2003 and December 31, 2002, Other includes $9,403 and $9,090, respectively, of loans outstanding to individuals and trusts, representing 2.7% of total outstanding loans and leases for both period ends. The remaining balance in Other includes loans to industries which primarily include automobiles and components, software and services, pharmaceuticals and biotechnology, and household and personal products. |
19
Bank of America Corporation
Selected Emerging Markets
(Dollars in Millions)
Loans and Loan Commitments | Other Financing(1) | Derivative Assets | Securities/ Other Investments(2) | Total Cross- border Exposure(3) | Gross Local Country Exposure(4) | Total Foreign Exposure March 31, 2003 | Increase/ (Decrease) from December 31, 2002 | ||||||||||||||||||
Region/Country | |||||||||||||||||||||||||
Asia | |||||||||||||||||||||||||
China | $ | 59 | $ | 9 | $ | 40 | $ | 27 | $ | 135 | $ | 62 | $ | 197 | $ | (47 | ) | ||||||||
Hong Kong(5) |
| 294 |
| 57 |
| 88 |
| 137 |
| 576 |
| 3,395 |
| 3,971 |
| 167 |
| ||||||||
India |
| 392 |
| 59 |
| 73 |
| 32 |
| 556 |
| 899 |
| 1,455 |
| 82 |
| ||||||||
Indonesia |
| 58 |
| — |
| 16 |
| 30 |
| 104 |
| 2 |
| 106 |
| (14 | ) | ||||||||
Korea (South) |
| 227 |
| 346 |
| 34 |
| 23 |
| 630 |
| 902 |
| 1,532 |
| 296 |
| ||||||||
Malaysia |
| 8 |
| 3 |
| — |
| 2 |
| 13 |
| 170 |
| 183 |
| (57 | ) | ||||||||
Pakistan |
| 6 |
| — |
| — |
| — |
| 6 |
| — |
| 6 |
| (1 | ) | ||||||||
Philippines |
| 28 |
| 19 |
| 3 |
| 20 |
| 70 |
| 58 |
| 128 |
| (28 | ) | ||||||||
Singapore |
| 118 |
| 15 |
| 189 |
| 3 |
| 325 |
| 1,464 |
| 1,789 |
| 121 |
| ||||||||
Taiwan |
| 321 |
| 201 |
| 32 |
| 7 |
| 561 |
| 556 |
| 1,117 |
| 28 |
| ||||||||
Thailand |
| 36 |
| 9 |
| 16 |
| 26 |
| 87 |
| 258 |
| 345 |
| 82 |
| ||||||||
Other |
| 3 |
| 17 |
| 1 |
| — |
| 21 |
| 80 |
| 101 |
| 5 |
| ||||||||
Total | $ | 1,550 | $ | 735 | $ | 492 | $ | 307 | $ | 3,084 | $ | 7,846 | $ | 10,930 | $ | 634 |
| ||||||||
Central and Eastern Europe | |||||||||||||||||||||||||
Russian Federation | $ | — | $ | — | $ | — | $ | — | $ | — | $ | — | $ | — | $ | (5 | ) | ||||||||
Turkey |
| 29 |
| 5 | | — |
| 19 |
| 53 |
| — |
| 53 |
| (5 | ) | ||||||||
Other |
| 24 |
| 32 |
| 32 |
| 46 |
| 134 |
| — |
| 134 |
| (167 | ) | ||||||||
Total | $ | 53 | $ | 37 | $ | 32 | $ | 65 | $ | 187 | $ | — | $ | 187 | $ | (177 | ) | ||||||||
Latin America | |||||||||||||||||||||||||
Argentina | $ | 210 | $ | 45 | $ | 2 | $ | 88 | $ | 345 | $ | 93 | $ | 438 | $ | (27 | ) | ||||||||
Brazil |
| 289 |
| 226 |
| 42 |
| 87 |
| 644 |
| 428 |
| 1,072 |
| (103 | ) | ||||||||
Chile |
| 111 |
| 24 |
| 7 |
| 10 |
| 152 |
| — |
| 152 |
| 11 |
| ||||||||
Colombia |
| 80 |
| 7 |
| 5 |
| 4 |
| 96 |
| — |
| 96 |
| 8 |
| ||||||||
Mexico |
| 852 |
| 154 |
| 125 |
| 497 |
| 1,628 |
| 312 |
| 1,940 |
| 351 |
| ||||||||
Venezuela |
| 112 |
| 2 |
| — |
| 102 |
| 216 |
| — |
| 216 |
| (16 | ) | ||||||||
Other |
| 108 |
| 91 |
| — |
| 40 |
| 239 |
| — |
| 239 |
| 14 |
| ||||||||
Total | $ | 1,762 | $ | 549 | $ | 181 | $ | 828 | $ | 3,320 | $ | 833 | $ | 4,153 | $ | 238 |
| ||||||||
Total | $ | 3,365 | $ | 1,321 | $ | 705 | $ | 1,200 | $ | 6,591 | $ | 8,679 | $ | 15,270 | $ | 695 |
| ||||||||
| (1) | Includes acceptances, standby letters of credit, commercial letters of credit and formal guarantees. |
| (2) | Amounts outstanding in the table above for Philippines, Argentina, Mexico, Venezuela and Latin America Other have been reduced by $12, $85, $332, $137 and $38, respectively, at March 31, 2003, and $12, $90, $505, $131 and $37, respectively, at December 31, 2002. Such amounts represent the fair value of U.S. Treasury securities held as collateral outside the country of exposure. |
| (3) | Cross-border exposure includes amounts payable to the Corporation by residents of countries other than the one in which the credit is booked, regardless of the currency in which the claim is denominated, consistent with FFIEC reporting rules. |
| (4) | Gross local country exposure includes amounts payable to the Corporation by residents of countries in which the credit is booked, regardless of the currency in which the claim is denominated. Management does not net local funding or liabilities against local exposures as allowed by the FFIEC. |
| (5) | Gross local country exposure to Hong Kong consisted of $1,811 of consumer loans and $1,584 of commercial exposure at March 31, 2003. The consumer loans were collateralized primarily by residential real estate. The commercial exposure was primarily to local clients and was diversified across many industries. |
20