Exhibit 99.2

Supplemental Information
First Quarter 2009
This information is preliminary and based on company data available at the time of the presentation. It speaks only as of the particular date or dates included in the accompanying pages. Bank of America does not undertake an obligation to, and disclaims any duty to, update any of the information provided. Any forward-looking statements in this information are subject to the forward-looking language contained in Bank of America’s reports filed with the SEC pursuant to the Securities Exchange Act of 1934, which are available at the SEC’s website (www.sec.gov) or at Bank of America’s website (www.bankofamerica.com). Bank of America’s future financial performance is subject to risks and uncertainties as described in its SEC filings.
Bank of America Corporation and Subsidiaries
Table of Contents | Page | |
Consolidated Financial Highlights | 2 | |
Supplemental Financial Data | 3 | |
Consolidated Statement of Income | 4 | |
Consolidated Balance Sheet | 5 | |
Capital Management | 6 | |
Core Net Interest Income - Managed Basis | 7 | |
Quarterly Average Balances and Interest Rates | 8 | |
Quarterly Average Balances and Interest Rates - Isolating Hedge Income/Expense | 9 | |
Debt Securities and Available-for-Sale Marketable Equity Securities | 10 | |
Deposits | ||
Total Segment Results | 11 | |
Key Indicators | 12 | |
Global Card Services | ||
Total Segment Results | 13 | |
Key Indicators | 14 | |
Home Loans & Insurance | ||
Total Segment Results | 15 | |
Key Indicators | 16 | |
Global Banking | ||
Total Segment Results | 17 | |
Key Indicators | 18 | |
Global and U.S. Market Share and Product Ranking Graph | 19 | |
Global Markets | ||
Total Segment Results | 20 | |
Key Indicators | 21 | |
Off-Balance Sheet (Unconsolidated) Special Purpose Entities Liquidity Exposure | 22 | |
Super Senior Collateralized Debt Obligation Exposure | 23 | |
Subprime Super Senior Collateralized Debt Obligation Carrying Values | 24 | |
Global Wealth Management | ||
Total Segment Results | 25 | |
Quarter-to-Date Business Results | 26 | |
Key Indicators | 27 | |
All Other | ||
Total Segment Results | 28 | |
Equity Investments | 29 | |
Outstanding Loans and Leases | 30 | |
Quarterly Average Loans and Leases by Business Segment | 31 | |
Commercial Credit Exposure by Industry | 32 | |
Net Credit Default Protection by Maturity Profile and Credit Exposure Debt Rating | 33 | |
Selected Emerging Markets | 34 | |
Nonperforming Assets | 35 | |
Quarterly Net Charge-offs/Losses and Net Charge-off/Loss Ratios | 36 | |
Allocation of the Allowance for Credit Losses by Product Type | 37 | |
Exhibit A: Non-GAAP Reconciliations | 38 | |
Appendix: Selected Slides from the First Quarter 2009 Earnings Release Presentation | 40 | |
| 1 |
Bank of America Corporation and Subsidiaries
Consolidated Financial Highlights
(Dollars in millions, except per share information; shares in thousands)
| First Quarter 2009 | Fourth Quarter 2008(1) | Third Quarter 2008 | Second Quarter 2008 | First Quarter 2008 | ||||||||||||||||||||||
Income statement | ||||||||||||||||||||||||||
Net interest income | $ | 12,497 | $ | 13,106 | $ | 11,642 | $ | 10,621 | $ | 9,991 | ||||||||||||||||
Noninterest income | 23,261 | 2,574 | 7,979 | 9,789 | 7,080 | |||||||||||||||||||||
Total revenue, net of interest expense | 35,758 | 15,680 | 19,621 | 20,410 | 17,071 | |||||||||||||||||||||
Provision for credit losses | 13,380 | 8,535 | 6,450 | 5,830 | 6,010 | |||||||||||||||||||||
Noninterest expense, before merger and restructuring charges | 16,237 | 10,641 | 11,413 | 9,447 | 9,093 | |||||||||||||||||||||
Merger and restructuring charges | 765 | 306 | 247 | 212 | 170 | |||||||||||||||||||||
Income tax expense (benefit) | 1,129 | (2,013 | ) | 334 | 1,511 | 588 | ||||||||||||||||||||
Net income (loss) | 4,247 | (1,789 | ) | 1,177 | 3,410 | 1,210 | ||||||||||||||||||||
Preferred stock dividends | 1,433 | 603 | 473 | 186 | 190 | |||||||||||||||||||||
Net income (loss) applicable to common shareholders | 2,814 | (2,392 | ) | 704 | 3,224 | 1,020 | ||||||||||||||||||||
Diluted earnings (loss) per common share | 0.44 | (0.48 | ) | 0.15 | 0.72 | 0.23 | ||||||||||||||||||||
Average diluted common shares issued and outstanding | 6,431,027 | 4,957,049 | 4,563,508 | 4,457,193 | 4,461,201 | |||||||||||||||||||||
Dividends paid per common share | $ | 0.01 | $ | 0.32 | $ | 0.64 | $ | 0.64 | $ | 0.64 | ||||||||||||||||
Performance ratios | ||||||||||||||||||||||||||
Return on average assets | 0.68 | % | (0.37 | ) | % | 0.25 | % | 0.78 | % | 0.28 | % | |||||||||||||||
Return on average common shareholders’ equity | 7.10 | (6.68 | ) | 1.97 | 9.25 | 2.90 | ||||||||||||||||||||
Return on average tangible shareholders’ equity(2) | 12.41 | (8.10 | ) | 6.11 | 18.12 | 7.06 | ||||||||||||||||||||
At period end | ||||||||||||||||||||||||||
Book value per share of common stock | $ | 25.98 | $ | 27.77 | $ | 30.01 | $ | 31.11 | $ | 31.22 | ||||||||||||||||
Tangible book value per share of common stock(2) | 10.88 | 10.11 | 10.50 | 11.87 | 11.90 | |||||||||||||||||||||
Market price per share of common stock: | ||||||||||||||||||||||||||
Closing price | $ | 6.82 | $ | 14.08 | $ | 35.00 | $ | 23.87 | $ | 37.91 | ||||||||||||||||
High closing price for the period | 14.33 | 38.13 | 37.48 | 40.86 | 45.03 | |||||||||||||||||||||
Low closing price for the period | 3.14 | 11.25 | 18.52 | 23.87 | 35.31 | |||||||||||||||||||||
Market capitalization | 43,654 | 70,645 | 159,672 | 106,292 | 168,806 | |||||||||||||||||||||
Number of banking centers - domestic | 6,145 | 6,139 | 6,139 | 6,131 | 6,148 | |||||||||||||||||||||
Number of branded ATMs - domestic | 18,532 | 18,685 | 18,584 | 18,531 | 18,491 | |||||||||||||||||||||
Full-time equivalent employees | 284,802 | 240,202 | 247,024 | 206,587 | 209,096 | |||||||||||||||||||||
| (1) | Due to a net loss for the three months ended December 31, 2008, the impact of antidilutive equity instruments were excluded from diluted earnings per share and average diluted common shares. |
| (2) | Return on average tangible shareholders’ equity and tangible book value per share of common stock are non-GAAP measures. For corresponding reconciliations of average tangible shareholders’ equity and common tangible shareholders’ equity to GAAP financial measures, see Supplemental Financial Data on page 3. We believe the use of these non-GAAP measures provide additional clarity in assessing the results of the Corporation. |
Certain prior period amounts have been reclassified to conform to current period presentation.
Information for periods beginning July 1, 2008 include the Countrywide acquisition. Information for the period beginning January 1, 2009 includes the
Merrill Lynch acquisition. Prior periods have not been restated.
| This information is preliminary and based on company data available at the time of the presentation. | 2 |
Bank of America Corporation and Subsidiaries
Supplemental Financial Data
(Dollars in millions)
Fully taxable-equivalent basis data
| First Quarter 2009 | Fourth Quarter 2008 | Third Quarter 2008 | Second Quarter 2008 | First Quarter 2008 | ||||||||||||||||||||||||||
Net interest income | $ | 12,819 | $ | 13,406 | $ | 11,920 | $ | 10,937 | $ | 10,291 | ||||||||||||||||||||
Total revenue, net of interest expense | 36,080 | 15,980 | 19,899 | 20,726 | 17,371 | |||||||||||||||||||||||||
Net interest yield | 2.70 | % | 3.31 | % | 2.93 | % | 2.92 | % | 2.73 | % | ||||||||||||||||||||
Efficiency ratio | 47.12 | 68.51 | 58.60 | 46.60 | 53.32 | |||||||||||||||||||||||||
Reconciliation to GAAP financial measures
Return on average tangible shareholders’ equity utilizes non-GAAP allocation methodologies. Return on average tangible shareholders’ equity measures the earnings contribution of the Corporation as a percentage of shareholders’ equity reduced by goodwill and intangible assets (excluding mortgage servicing rights), net of related deferred tax liabilities. This measure is used to evaluate our use of equity (i.e., capital) at the individual unit level and are integral components in the analytics for resource allocation. The efficiency ratio measures the costs expended to generate a dollar of revenue. We believe the use of these non-GAAP measures provides additional clarity in assessing the results of the Corporation.
Other companies may define or calculate supplemental financial data differently. See the tables below for supplemental financial data and corresponding reconciliations to GAAP financial measures for the three months ended March 31, 2009, December 31, 2008, September 30, 2008, June 30, 2008 and March 31, 2008.
Reconciliation of average shareholders’ equity to average tangible shareholders’ equity
| ||||||||||||||||||||||||||||||
Average shareholders’ equity | $ | 228,766 | $ | 176,566 | $ | 166,454 | $ | 161,428 | $ | 154,728 | ||||||||||||||||||||
Average goodwill | (84,448 | ) | (81,841 | ) | (81,977 | ) | (77,815 | ) | (77,628 | ) | ||||||||||||||||||||
Intangible assets | (9,439 | ) | (8,818 | ) | (9,547 | ) | (9,618 | ) | (10,030 | ) | ||||||||||||||||||||
Related deferred tax liabilities | 3,977 | 1,913 | 1,683 | 1,687 | 1,846 | |||||||||||||||||||||||||
Average tangible shareholders’ equity | $ | 138,856 | $ | 87,820 | $ | 76,613 | $ | 75,682 | $ | 68,916 | ||||||||||||||||||||
Reconciliation of ending common shareholders’ equity to ending common tangible shareholders’ equity
| ||||||||||||||||||||||||||||||
Ending common shareholders’ equity | $ | 166,272 | $ | 139,351 | $ | 136,888 | $ | 138,540 | $ | 139,003 | ||||||||||||||||||||
Ending goodwill | (86,910 | ) | (81,934 | ) | (81,756 | ) | (77,760 | ) | (77,872 | ) | ||||||||||||||||||||
Intangible assets | (13,703 | ) | (8,535 | ) | (9,167 | ) | (9,603 | ) | (9,821 | ) | ||||||||||||||||||||
Related deferred tax liabilities | 3,958 | 1,854 | 1,914 | 1,679 | 1,687 | |||||||||||||||||||||||||
Ending common tangible shareholders’ equity | $ | 69,617 | $ | 50,736 | $ | 47,879 | $ | 52,856 | $ | 52,997 | ||||||||||||||||||||
| Certain prior period amounts have been reclassified to conform to current period presentation. |
Information for periods beginning July 1, 2008 include the Countrywide acquisition. Information for the period beginning January 1, 2009 includes the
Merrill Lynch acquisition. Prior periods have not been restated.
| This information is preliminary and based on company data available at the time of the presentation. | 3 |
Bank of America Corporation and Subsidiaries
Consolidated Statement of Income
(Dollars in millions, except per share information; shares in thousands)
| First Quarter 2009 | Fourth Quarter 2008(1) | Third Quarter 2008 | Second Quarter 2008 | First Quarter 2008 | |||||||||||||||
Interest income | |||||||||||||||||||
Interest and fees on loans and leases | $ | 13,349 | $ | 14,220 | $ | 14,261 | $ | 13,121 | $ | 14,415 | |||||||||
Interest on debt securities | 3,830 | 3,851 | 3,621 | 2,900 | 2,774 | ||||||||||||||
Federal funds sold and securities borrowed or purchased under agreements to resell | 1,155 | 393 | 912 | 800 | 1,208 | ||||||||||||||
Trading account assets | 2,428 | 2,120 | 2,344 | 2,229 | 2,364 | ||||||||||||||
Other interest income | 1,394 | 1,018 | 1,058 | 977 | 1,098 | ||||||||||||||
Total interest income | 22,156 | 21,602 | 22,196 | 20,027 | 21,859 | ||||||||||||||
Interest expense | |||||||||||||||||||
Deposits | 2,543 | 3,296 | 3,846 | 3,520 | 4,588 | ||||||||||||||
Short-term borrowings | 2,221 | 1,910 | 3,223 | 3,087 | 4,142 | ||||||||||||||
Trading account liabilities | 579 | 524 | 661 | 749 | 840 | ||||||||||||||
Long-term debt | 4,316 | 2,766 | 2,824 | 2,050 | 2,298 | ||||||||||||||
Total interest expense | 9,659 | 8,496 | 10,554 | 9,406 | 11,868 | ||||||||||||||
Net interest income | 12,497 | 13,106 | 11,642 | 10,621 | 9,991 | ||||||||||||||
Noninterest income | |||||||||||||||||||
Card income | 2,865 | 3,102 | 3,122 | 3,451 | 3,639 | ||||||||||||||
Service charges | 2,533 | 2,559 | 2,722 | 2,638 | 2,397 | ||||||||||||||
Investment and brokerage services | 2,963 | 1,072 | 1,238 | 1,322 | 1,340 | ||||||||||||||
Investment banking income | 1,055 | 618 | 474 | 695 | 476 | ||||||||||||||
Equity investment income (loss) | 1,202 | (791 | ) | (316 | ) | 592 | 1,054 | ||||||||||||
Trading account profits (losses) | 5,201 | (4,101 | ) | (384 | ) | 357 | (1,783 | ) | |||||||||||
Mortgage banking income | 3,314 | 1,523 | 1,674 | 439 | 451 | ||||||||||||||
Insurance income | 688 | 741 | 678 | 217 | 197 | ||||||||||||||
Gains on sales of debt securities | 1,498 | 762 | 10 | 127 | 225 | ||||||||||||||
Other income (loss) | 1,942 | (2,911 | ) | (1,239 | ) | (49 | ) | (916 | ) | ||||||||||
Total noninterest income | 23,261 | 2,574 | 7,979 | 9,789 | 7,080 | ||||||||||||||
Total revenue, net of interest expense | 35,758 | 15,680 | 19,621 | 20,410 | 17,071 | ||||||||||||||
Provision for credit losses | 13,380 | 8,535 | 6,450 | 5,830 | 6,010 | ||||||||||||||
Noninterest expense | |||||||||||||||||||
Personnel | 8,768 | 4,027 | 5,198 | 4,420 | 4,726 | ||||||||||||||
Occupancy | 1,128 | 1,003 | 926 | 848 | 849 | ||||||||||||||
Equipment | 622 | 447 | 440 | 372 | 396 | ||||||||||||||
Marketing | 521 | 555 | 605 | 571 | 637 | ||||||||||||||
Professional fees | 405 | 521 | 424 | 362 | 285 | ||||||||||||||
Amortization of intangibles | 520 | 477 | 464 | 447 | 446 | ||||||||||||||
Data processing | 648 | 641 | 755 | 587 | 563 | ||||||||||||||
Telecommunications | 327 | 292 | 288 | 266 | 260 | ||||||||||||||
Other general operating | 3,298 | 2,678 | 2,313 | 1,574 | 931 | ||||||||||||||
Merger and restructuring charges | 765 | 306 | 247 | 212 | 170 | ||||||||||||||
Total noninterest expense | 17,002 | 10,947 | 11,660 | 9,659 | 9,263 | ||||||||||||||
Income (loss) before income taxes | 5,376 | (3,802 | ) | 1,511 | 4,921 | 1,798 | |||||||||||||
Income tax expense (benefit) | 1,129 | (2,013 | ) | 334 | 1,511 | 588 | |||||||||||||
Net income (loss) | $ | 4,247 | $ | (1,789 | ) | $ | 1,177 | $ | 3,410 | $ | 1,210 | ||||||||
Preferred stock dividends | 1,433 | 603 | 473 | 186 | 190 | ||||||||||||||
Net income (loss) applicable to common shareholders | $ | 2,814 | $ | (2,392 | ) | $ | 704 | $ | 3,224 | $ | 1,020 | ||||||||
Per common share information | |||||||||||||||||||
Earnings (loss) | $ | 0.44 | $ | (0.48 | ) | $ | 0.15 | $ | 0.72 | $ | 0.23 | ||||||||
Diluted earnings (loss) | 0.44 | (0.48 | ) | 0.15 | 0.72 | 0.23 | |||||||||||||
Dividends paid | 0.01 | 0.32 | 0.64 | 0.64 | 0.64 | ||||||||||||||
Average common shares issued and outstanding | 6,370,815 | 4,957,049 | 4,543,963 | 4,435,719 | 4,427,823 | ||||||||||||||
Average diluted common shares issued and outstanding | 6,431,027 | 4,957,049 | 4,563,508 | 4,457,193 | 4,461,201 | ||||||||||||||
| (1) | Due to a net loss for the three months ended December 31, 2008, the impact of antidilutive equity instruments were excluded from diluted earnings per shareand average diluted common shares. |
Certain prior period amounts have been reclassified to conform to current period presentation.
Information for periods beginning July 1, 2008 include the Countrywide acquisition. Information for the period beginning January 1, 2009 includes the
Merrill Lynch acquisition. Prior periods have not been restated.
| This information is preliminary and based on company data available at the time of the presentation. | 4 |
Bank of America Corporation and Subsidiaries
Consolidated Balance Sheet
(Dollars in millions)
| March 31 2009 | December 31 2008 | March 31 2008 | ||||||||||
Assets | ||||||||||||
Cash and cash equivalents | $ | 173,460 | $ | 32,857 | $ | 40,512 | ||||||
Time deposits placed and other short-term investments | 23,947 | 9,570 | 8,807 | |||||||||
Federal funds sold and securities borrowed or purchased under agreements to resell | 153,230 | 82,478 | 120,289 | |||||||||
Trading account assets | 203,131 | 159,522 | 165,693 | |||||||||
Derivative assets | 137,311 | 62,252 | 50,925 | |||||||||
Debt securities | 262,638 | 277,589 | 223,000 | |||||||||
Loans and leases, net of allowance: | ||||||||||||
Loans and leases | 977,008 | 931,446 | 873,870 | |||||||||
Allowance for loan and lease losses | (29,048 | ) | (23,071 | ) | (14,891 | ) | ||||||
Total loans and leases, net of allowance | 947,960 | 908,375 | 858,979 | |||||||||
Premises and equipment, net | 15,549 | 13,161 | 11,297 | |||||||||
Mortgage servicing rights (includes$14,096, $12,733 and $3,163 measured at fair value) | 14,425 | 13,056 | 3,470 | |||||||||
Goodwill | 86,910 | 81,934 | 77,872 | |||||||||
Intangible assets | 13,703 | 8,535 | 9,821 | |||||||||
Loans held-for-sale | 40,214 | 31,454 | 33,364 | |||||||||
Other assets | 249,485 | 137,160 | 132,473 | |||||||||
Total assets | $ | 2,321,963 | $ | 1,817,943 | $ | 1,736,502 | ||||||
Liabilities | ||||||||||||
Deposits in domestic offices: | ||||||||||||
Noninterest-bearing | $ | 233,902 | $ | 213,994 | $ | 193,789 | ||||||
Interest-bearing | 639,616 | 576,938 | 506,062 | |||||||||
Deposits in foreign offices: | ||||||||||||
Noninterest-bearing | 4,133 | 4,004 | 3,333 | |||||||||
Interest-bearing | 75,857 | 88,061 | 93,885 | |||||||||
Total deposits | 953,508 | 882,997 | 797,069 | |||||||||
Federal funds purchased and securities loaned or sold under agreements to repurchase | 246,734 | 206,598 | 219,738 | |||||||||
Trading account liabilities | 52,993 | 57,287 | 76,032 | |||||||||
Derivative liabilities | 76,582 | 30,709 | 29,170 | |||||||||
Commercial paper and other short-term borrowings | 185,816 | 158,056 | 190,856 | |||||||||
Accrued expenses and other liabilities (includes$1,357, $421 and $507 of reserve for unfunded lending commitments) | 126,030 | 36,952 | 64,528 | |||||||||
Long-term debt | 440,751 | 268,292 | 202,800 | |||||||||
Total liabilities | 2,082,414 | 1,640,891 | 1,580,193 | |||||||||
Shareholders’ equity | ||||||||||||
Preferred stock, $0.01 par value; authorized - 100,000,000 shares; issued and outstanding - 9,778,142, 8,202,042 and 7,325,067 shares | 73,277 | 37,701 | 17,306 | |||||||||
Common stock and additional paid-in capital, $0.01 par value; authorized - 10,000,000,000, 10,000,000,000, and 7,500,000,000 shares; issued and outstanding - 6,400,949,995, 5,017,435,592 and 4,452,810,412 shares | 100,864 | 76,766 | 61,080 | |||||||||
Retained earnings | 76,877 | 73,823 | 79,554 | |||||||||
Accumulated other comprehensive income (loss) | (11,164 | ) | (10,825 | ) | (884 | ) | ||||||
Other | (305 | ) | (413 | ) | (747 | ) | ||||||
Total shareholders’ equity | 239,549 | 177,052 | 156,309 | |||||||||
Total liabilities and shareholders’ equity | $ | 2,321,963 | $ | 1,817,943 | $ | 1,736,502 | ||||||
Certain prior period amounts have been reclassified to conform to current period presentation.
Information for periods beginning July 1, 2008 include the Countrywide acquisition. Information for the period beginning January 1, 2009 includes the
Merrill Lynch acquisition. Prior periods have not been restated.
| This information is preliminary and based on company data available at the time of the presentation. | 5 |
Bank of America Corporation and Subsidiaries
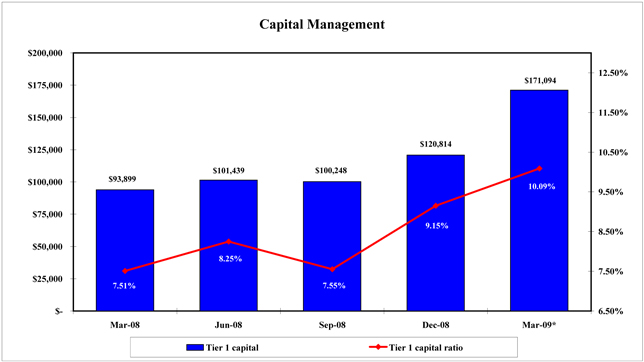
Capital Management
(Dollars in millions)
| First Quarter 2009(1) | Fourth Quarter 2008 | Third Quarter 2008 | Second Quarter 2008 | First Quarter 2008 | |||||||||||||||||||||
Risk-based capital: | |||||||||||||||||||||||||
Tier 1 capital | $ | 171,094 | $ | 120,814 | $ | 100,248 | $ | 101,439 | $ | 93,899 | |||||||||||||||
Total capital | 237,936 | 171,661 | 153,318 | 154,983 | 146,531 | ||||||||||||||||||||
Risk-weighted assets | 1,695,844 | 1,320,824 | 1,328,084 | 1,230,307 | 1,250,942 | ||||||||||||||||||||
Tier 1 capital ratio | 10.09 | % | 9.15 | % | 7.55 | % | 8.25 | % | 7.51 | % | |||||||||||||||
Total capital ratio | 14.03 | 13.00 | 11.54 | 12.60 | 11.71 | ||||||||||||||||||||
Tangible equity ratio(2) | 6.42 | 5.11 | 4.13 | 4.72 | 4.26 | ||||||||||||||||||||
Tangible common equity ratio(3) | 3.13 | 2.93 | 2.75 | 3.24 | 3.21 | ||||||||||||||||||||
Tier 1 leverage ratio | 7.07 | 6.44 | 5.51 | 6.07 | 5.59 | ||||||||||||||||||||
| (1) | Preliminary data on risk-based capital |
| (2) | Tangible equity ratio equals shareholders’ equity less goodwill and intangible assets (excluding mortgage servicing rights), net of related deferred tax liabilities divided by total assets less goodwill and intangible assets (excluding mortgage servicing rights), net of related deferred tax liabilities. |
| (3) | Tangible common equity ratio equals common shareholders’ equity less goodwill and intangible assets (excluding mortgage servicing rights), net of related deferred tax liabilities divided by total assets less goodwill and intangible assets (excluding mortgage servicing rights), net of related deferred tax liabilities. |
* | Preliminary data on risk-based capital |
Outstanding Common Stock
No common shares were repurchased in the first quarter of 2009.
| 75.0 | million shares remain outstanding under the 2008 authorized program. |
8.0 million shares were issued in the first quarter of 2009 under employee stock plans. In addition, approximately 1.38 billion shares were issued as a result of the acquisition of Merrill Lynch.
Certain prior period amounts have been reclassified to conform to current period presentation.
Information for periods beginning July 1, 2008 include the Countrywide acquisition. Information for the period beginning January 1, 2009 includes the
Merrill Lynch acquisition. Prior periods have not been restated.
| This information is preliminary and based on company data available at the time of the presentation. | 6 |
Bank of America Corporation and Subsidiaries
Core Net Interest Income - Managed Basis
(Dollars in millions)
| First Quarter 2009 | Fourth Quarter 2008 | Third Quarter 2008 | Second Quarter 2008 | First Quarter 2008 | ||||||||||||||||||||||||||
Net interest income(1) | ||||||||||||||||||||||||||||||
As reported | $ | 12,819 | $ | 13,406 | $ | 11,920 | $ | 10,937 | $ | 10,291 | ||||||||||||||||||||
Impact of market-based net interest income(2) | (1,895 | ) | (1,566 | ) | (1,323 | ) | (1,238 | ) | (1,167 | ) | ||||||||||||||||||||
Core net interest income | 10,924 | 11,840 | 10,597 | 9,699 | 9,124 | |||||||||||||||||||||||||
Impact of securitizations(3) | 2,749 | 2,257 | 2,310 | 2,254 | 2,090 | |||||||||||||||||||||||||
Core net interest income - managed basis | $ | 13,673 | $ | 14,097 | $ | 12,907 | $ | 11,953 | $ | 11,214 | ||||||||||||||||||||
Average earning assets | ||||||||||||||||||||||||||||||
As reported | $ | 1,912,483 | $ | 1,616,673 | $ | 1,622,466 | $ | 1,500,234 | $ | 1,510,295 | ||||||||||||||||||||
Impact of market-based earning assets(2) | (488,411 | ) | (311,777 | ) | (370,140 | ) | (367,188 | ) | (394,838 | ) | ||||||||||||||||||||
Core average earning assets | 1,424,072 | 1,304,896 | 1,252,326 | 1,133,046 | 1,115,457 | |||||||||||||||||||||||||
Impact of securitizations(4) | 91,567 | 93,189 | 101,743 | 103,131 | 102,577 | |||||||||||||||||||||||||
Core average earning assets - managed basis | $ | 1,515,639 | $ | 1,398,085 | $ | 1,354,069 | $ | 1,236,177 | $ | 1,218,034 | ||||||||||||||||||||
Net interest yield contribution(1, 5) | ||||||||||||||||||||||||||||||
As reported | 2.70 | % | 3.31 | % | 2.93 | % | 2.92 | % | 2.73 | % | ||||||||||||||||||||
Impact of market-based activities(2) | 0.39 | 0.31 | 0.44 | 0.51 | 0.55 | |||||||||||||||||||||||||
Core net interest yield on earning assets | 3.09 | 3.62 | 3.37 | 3.43 | 3.28 | |||||||||||||||||||||||||
Impact of securitizations | 0.54 | 0.40 | 0.43 | 0.45 | 0.41 | |||||||||||||||||||||||||
Core net interest yield on earning assets - managed basis | 3.63 | % | 4.02 | % | 3.80 | % | 3.88 | % | 3.69 | % | ||||||||||||||||||||
| (1) | Fully taxable-equivalent basis |
| (2) | Represents the impact of market-based income in Global Markets and certain market-based income amounts in Global Banking from sharing arrangements with Global Markets. |
| (3) | Represents the impact of securitizations utilizing actual bond costs. This is different from the segment view which utilizes funds transfer pricing methodologies. |
| (4) | Represents average securitized loans less accrued interest receivable and certain securitized bonds retained. |
| (5) | Calculated on an annualized basis. |
Certain prior period amounts have been reclassified to conform to current period presentation.
Information for periods beginning July 1, 2008 include the Countrywide acquisition. Information for the period beginning January 1, 2009 includes the
Merrill Lynch acquisition. Prior periods have not been restated.
| This information is preliminary and based on company data available at the time of the presentation. | 7 |
Bank of America Corporation and Subsidiaries
Quarterly Average Balances and Interest Rates - Fully Taxable-equivalent Basis
(Dollars in millions)
| First Quarter 2009 | Fourth Quarter 2008 | First Quarter 2008 | ||||||||||||||||||||||||||||
| Average Balance | Interest Income/ Expense | Yield/ Rate | Average Balance | Interest Income/ Expense | Yield/ Rate | Average Balance | Interest Income/ Expense | Yield/ Rate | ||||||||||||||||||||||
Earning assets | ||||||||||||||||||||||||||||||
Time deposits placed and other short-term investments | $ | 26,158 | $ | 191 | 2.96 | % | $ | 10,511 | $ | 158 | 5.97 | % | $ | 10,596 | $ | 94 | 3.56 | % | ||||||||||||
Federal funds sold and securities borrowed or purchased under agreements to resell | 244,280 | 1,155 | 1.90 | 104,843 | 393 | 1.50 | 145,043 | 1,208 | 3.34 | |||||||||||||||||||||
Trading account assets | 259,322 | 2,499 | 3.89 | 205,698 | 2,170 | 4.21 | 192,410 | 2,417 | 5.04 | |||||||||||||||||||||
Debt securities(1) | 286,249 | 3,902 | 5.47 | 280,942 | 3,913 | 5.57 | 219,377 | 2,835 | 5.17 | |||||||||||||||||||||
Loans and leases(2): | ||||||||||||||||||||||||||||||
Residential mortgage | 265,121 | 3,680 | 5.57 | 253,560 | 3,596 | 5.67 | 270,541 | 3,837 | 5.68 | |||||||||||||||||||||
Home equity | 158,575 | 1,787 | 4.55 | 151,943 | 1,954 | 5.12 | 116,562 | 1,872 | 6.46 | |||||||||||||||||||||
Discontinued real estate | 19,386 | 386 | 7.97 | 21,324 | 459 | 8.60 | n/a | n/a | n/a | |||||||||||||||||||||
Credit card - domestic | 58,960 | 1,606 | 11.05 | 64,906 | 1,784 | 10.94 | 63,277 | 1,774 | 11.28 | |||||||||||||||||||||
Credit card - foreign | 16,858 | 449 | 10.81 | 17,211 | 521 | 12.05 | 15,241 | 474 | 12.51 | |||||||||||||||||||||
Direct/Indirect consumer (3) | 100,741 | 1,684 | 6.78 | 83,331 | 1,714 | 8.18 | 78,705 | 1,699 | 8.68 | |||||||||||||||||||||
Other consumer(4) | 3,408 | 64 | 7.50 | 3,544 | 70 | 7.83 | 4,049 | 87 | 8.61 | |||||||||||||||||||||
Total consumer | 623,049 | 9,656 | 6.25 | 595,819 | 10,098 | 6.76 | 548,375 | 9,743 | 7.13 | |||||||||||||||||||||
Commercial - domestic | 240,683 | 2,485 | 4.18 | 226,095 | 2,890 | 5.09 | 212,394 | 3,198 | 6.06 | |||||||||||||||||||||
Commercial real estate(5) | 72,206 | 550 | 3.09 | 64,586 | 706 | 4.35 | 62,202 | 887 | 5.74 | |||||||||||||||||||||
Commercial lease financing | 22,056 | 279 | 5.05 | 22,069 | 242 | 4.40 | 22,227 | 261 | 4.69 | |||||||||||||||||||||
Commercial - foreign | 36,127 | 462 | 5.18 | 32,994 | 373 | 4.49 | 30,463 | 387 | 5.11 | |||||||||||||||||||||
Total commercial | 371,072 | 3,776 | 4.12 | 345,744 | 4,211 | 4.85 | 327,286 | 4,733 | 5.81 | |||||||||||||||||||||
Total loans and leases | 994,121 | 13,432 | 5.46 | 941,563 | 14,309 | 6.06 | 875,661 | 14,476 | 6.64 | |||||||||||||||||||||
Other earning assets | 102,353 | 1,299 | 5.12 | 73,116 | 959 | 5.22 | 67,208 | 1,129 | 6.75 | |||||||||||||||||||||
Total earning assets(6) | 1,912,483 | 22,478 | 4.74 | 1,616,673 | 21,902 | 5.40 | 1,510,295 | 22,159 | 5.89 | |||||||||||||||||||||
Cash and cash equivalents | 153,007 | 77,388 | 33,949 | |||||||||||||||||||||||||||
Other assets, less allowance for loan and lease losses | 453,644 | 254,793 | 220,683 | |||||||||||||||||||||||||||
Total assets | $ | 2,519,134 | $ | 1,948,854 | $ | 1,764,927 | ||||||||||||||||||||||||
Interest-bearing liabilities | ||||||||||||||||||||||||||||||
Domestic interest-bearing deposits: | ||||||||||||||||||||||||||||||
Savings | $ | 32,378 | $ | 58 | 0.72 | % | $ | 31,561 | $ | 58 | 0.73 | % | $ | 31,798 | $ | 50 | 0.63 | % | ||||||||||||
NOW and money market deposit accounts | 343,215 | 435 | 0.51 | 285,410 | 813 | 1.13 | 248,949 | 1,139 | 1.84 | |||||||||||||||||||||
Consumer CDs and IRAs | 235,787 | 1,715 | 2.95 | 229,410 | 1,835 | 3.18 | 188,005 | 2,071 | 4.43 | |||||||||||||||||||||
Negotiable CDs, public funds and other time deposits | 31,188 | 149 | 1.94 | 36,510 | 270 | 2.94 | 32,201 | 320 | 4.00 | |||||||||||||||||||||
Total domestic interest-bearing deposits | 642,568 | 2,357 | 1.49 | 582,891 | 2,976 | 2.03 | 500,953 | 3,580 | 2.87 | |||||||||||||||||||||
Foreign interest-bearing deposits: | ||||||||||||||||||||||||||||||
Banks located in foreign countries | 26,052 | 48 | 0.75 | 41,398 | 125 | 1.20 | 39,196 | 400 | 4.10 | |||||||||||||||||||||
Governments and official institutions | 9,849 | 6 | 0.25 | 13,738 | 30 | 0.87 | 14,650 | 132 | 3.62 | |||||||||||||||||||||
Time, savings and other | 58,380 | 132 | 0.92 | 48,836 | 165 | 1.34 | 53,064 | 476 | 3.61 | |||||||||||||||||||||
Total foreign interest-bearing deposits | 94,281 | 186 | 0.80 | 103,972 | 320 | 1.22 | 106,910 | 1,008 | 3.79 | |||||||||||||||||||||
Total interest-bearing deposits | 736,849 | 2,543 | 1.40 | 686,863 | 3,296 | 1.91 | 607,863 | 4,588 | 3.04 | |||||||||||||||||||||
Federal funds purchased and securities loaned or sold under agreements to repurchase and other short-term borrowings | 591,928 | 2,222 | 1.52 | 459,743 | 1,910 | 1.65 | 452,854 | 4,142 | 3.68 | |||||||||||||||||||||
Trading account liabilities | 70,799 | 579 | 3.32 | 70,859 | 524 | 2.94 | 82,432 | 840 | 4.10 | |||||||||||||||||||||
Long-term debt | 446,975 | 4,315 | 3.89 | 255,709 | 2,766 | 4.32 | 198,463 | 2,298 | 4.63 | |||||||||||||||||||||
Total interest-bearing liabilities(6) | 1,846,551 | 9,659 | 2.11 | 1,473,174 | 8,496 | 2.30 | 1,341,612 | 11,868 | 3.55 | |||||||||||||||||||||
Noninterest-bearing sources: | ||||||||||||||||||||||||||||||
Noninterest-bearing deposits | 227,232 | 205,278 | 179,760 | |||||||||||||||||||||||||||
Other liabilities | 216,585 | 93,836 | 88,827 | |||||||||||||||||||||||||||
Shareholders’ equity | 228,766 | 176,566 | 154,728 | |||||||||||||||||||||||||||
Total liabilities and shareholders’ equity | $ | 2,519,134 | $ | 1,948,854 | $ | 1,764,927 | ||||||||||||||||||||||||
Net interest spread | 2.63 | % | 3.10 | % | 2.34 | % | ||||||||||||||||||||||||
Impact of noninterest-bearing sources | 0.07 | 0.21 | 0.39 | |||||||||||||||||||||||||||
Net interest income/yield on earning assets | $ | 12,819 | 2.70 | % | $ | 13,406 | 3.31 | % | $ | 10,291 | 2.73 | % | ||||||||||||||||||
| (1) | Yields on AFS debt securities are calculated based on fair value rather than historical cost balances. The use of fair value does not have a material impact on netinterest yield. |
| (2) | Nonperforming loans are included in the respective average loan balances. Income on these nonperforming loans is recognized on a cash basis. We account foracquired impaired loans in accordance with SOP 03-3. Loans accounted for in accordance with SOP 03-3 were written down to fair value upon acquisition andacrete interest income over the remaining life of the loan. |
| (3) | Includes foreign consumer loans of $1.7 billion in the first quarter of 2009, and $2.0 billion and $3.3 billion in the fourth and first quarters of 2008. |
| (4) | Includes consumer finance loans of $2.6 billion in the first quarter of 2009, and $2.7 billion and $3.0 billion in the fourth and first quarters of 2008; and otherforeign consumer loans of $596 million in the first quarter of 2009, and $654 million and $857 million in the fourth and first quarters of 2008. |
| (5) | Includes domestic commercial real estate loans of $70.9 billion in the first quarter of 2009, and $63.6 billion and $61.0 billion in the fourth and first quarters of 2008. |
| (6) | Interest income includes the impact of interest rate risk management contracts, which decreased interest income on the underlying assets $61 million in the firstquarter of 2009, and $41 million and $103 million in the fourth and first quarters of 2008. Interest expense includes the impact of interest rate risk managementcontracts, which increased (decreased) interest expense on the underlying liabilities $(512) million in the first quarter of 2009, and $237 million and $49 million inthe fourth and first quarters of 2008. |
n/a = not applicable
Certain prior period amounts have been reclassified to conform to current period presentation.
Information for periods beginning July 1, 2008 include the Countrywide acquisition. Information for the period beginning January 1, 2009 includes the
Merrill Lynch acquisition. Prior periods have not been restated.
| This information is preliminary and based on company data available at the time of the presentation. | 8 |
Bank of America Corporation and Subsidiaries
Quarterly Average Balances and Interest Rates - Fully Taxable-equivalent Basis - Isolating Hedge Income/Expense (1)
(Dollars in millions)
| First Quarter 2009 | Fourth Quarter 2008 | First Quarter 2008 | |||||||||||||||||||||||||||||||||
| Average Balance | Interest Income/ Expense | Yield/ Rate | Average Balance | Interest Income/ Expense | Yield/ Rate | Average Balance | Interest Income/ Expense | Yield/ Rate | |||||||||||||||||||||||||||
Earning assets | |||||||||||||||||||||||||||||||||||
Time deposits placed and other short-term investments(2) | $ | 26,158 | $ | 191 | 2.96 | % | $ | 10,511 | $ | 162 | 6.13 | % | $ | 10,596 | $ | 98 | 3.71 | % | |||||||||||||||||
Federal funds sold and securities borrowed or purchased under agreements to resell (2) | 244,280 | 1,158 | 1.90 | 104,843 | 414 | 1.57 | 145,043 | 1,278 | 3.53 | ||||||||||||||||||||||||||
Trading account assets | 259,322 | 2,499 | 3.89 | 205,698 | 2,170 | 4.21 | 192,410 | 2,417 | 5.04 | ||||||||||||||||||||||||||
Debt securities(2) | 286,249 | 3,930 | 5.51 | 280,942 | 3,928 | 5.59 | 219,377 | 2,836 | 5.17 | ||||||||||||||||||||||||||
Loans and leases: | |||||||||||||||||||||||||||||||||||
Residential mortgage | 265,121 | 3,680 | 5.57 | 253,560 | 3,596 | 5.67 | 270,541 | 3,837 | 5.68 | ||||||||||||||||||||||||||
Home equity | 158,575 | 1,787 | 4.55 | 151,943 | 1,954 | 5.12 | 116,562 | 1,872 | 6.46 | ||||||||||||||||||||||||||
Discontinued real estate | 19,386 | 386 | 7.97 | 21,324 | 459 | 8.60 | n/a | n/a | n/a | ||||||||||||||||||||||||||
Credit card - domestic | 58,960 | 1,606 | 11.05 | 64,906 | 1,784 | 10.94 | 63,277 | 1,774 | 11.28 | ||||||||||||||||||||||||||
Credit card - foreign | 16,858 | 449 | 10.81 | 17,211 | 521 | 12.05 | 15,241 | 474 | �� | 12.51 | |||||||||||||||||||||||||
Direct/Indirect consumer | 100,741 | 1,684 | 6.78 | 83,331 | 1,714 | 8.18 | 78,705 | 1,699 | 8.68 | ||||||||||||||||||||||||||
Other consumer | 3,408 | 64 | 7.50 | 3,544 | 70 | 7.83 | 4,049 | 87 | 8.61 | ||||||||||||||||||||||||||
Total consumer | 623,049 | 9,656 | 6.25 | 595,819 | 10,098 | 6.76 | 548,375 | 9,743 | 7.13 | ||||||||||||||||||||||||||
Commercial - domestic (2) | 240,683 | 2,515 | 4.24 | 226,095 | 2,893 | 5.09 | 212,394 | 3,225 | 6.11 | ||||||||||||||||||||||||||
Commercial real estate | 72,206 | 550 | 3.09 | 64,586 | 706 | 4.35 | 62,202 | 887 | 5.74 | ||||||||||||||||||||||||||
Commercial lease financing | 22,056 | 279 | 5.05 | 22,069 | 242 | 4.40 | 22,227 | 261 | 4.69 | ||||||||||||||||||||||||||
Commercial - foreign | 36,127 | 462 | 5.18 | 32,994 | 373 | 4.49 | 30,463 | 387 | 5.11 | ||||||||||||||||||||||||||
Total commercial | 371,072 | 3,806 | 4.15 | 345,744 | 4,214 | 4.85 | 327,286 | 4,760 | 5.85 | ||||||||||||||||||||||||||
Total loans and leases | 994,121 | 13,462 | 5.47 | 941,563 | 14,312 | 6.06 | 875,661 | 14,503 | 6.65 | ||||||||||||||||||||||||||
Other earning assets (2) | 102,353 | 1,299 | 5.12 | 73,116 | 957 | 5.22 | 67,208 | 1,130 | 6.75 | ||||||||||||||||||||||||||
Total earning assets - excluding hedge impact | 1,912,483 | 22,539 | 4.75 | 1,616,673 | 21,943 | 5.41 | 1,510,295 | 22,262 | 5.92 | ||||||||||||||||||||||||||
Net hedge income (expense) on assets | (61 | ) | (41 | ) | (103 | ) | |||||||||||||||||||||||||||||
Total earning assets - including hedge impact | 1,912,483 | 22,478 | 4.74 | 1,616,673 | 21,902 | 5.40 | 1,510,295 | 22,159 | 5.89 | ||||||||||||||||||||||||||
Cash and cash equivalents | 153,007 | 77,388 | 33,949 | ||||||||||||||||||||||||||||||||
Other assets, less allowance for loan and lease losses | 453,644 | 254,793 | 220,683 | ||||||||||||||||||||||||||||||||
Total assets | $ | 2,519,134 | $ | 1,948,854 | $ | 1,764,927 | |||||||||||||||||||||||||||||
Interest-bearing liabilities | |||||||||||||||||||||||||||||||||||
Domestic interest-bearing deposits: | |||||||||||||||||||||||||||||||||||
Savings | $ | 32,378 | $ | 58 | 0.72 | % | $ | 31,561 | $ | 58 | 0.73 | % | $ | 31,798 | $ | 50 | 0.63 | % | |||||||||||||||||
NOW and money market deposit accounts (2) | 343,215 | 436 | 0.51 | 285,410 | 813 | 1.13 | 248,949 | 1,134 | 1.83 | ||||||||||||||||||||||||||
Consumer CDs and IRAs (2) | 235,787 | 1,651 | 2.84 | 229,410 | 1,765 | 3.06 | 188,005 | 1,950 | 4.17 | ||||||||||||||||||||||||||
Negotiable CDs, public funds and other time deposits (2) | 31,188 | 146 | 1.89 | 36,510 | 267 | 2.90 | 32,201 | 318 | 3.97 | ||||||||||||||||||||||||||
Total domestic interest-bearing deposits | 642,568 | 2,291 | 1.44 | 582,891 | 2,903 | 1.98 | 500,953 | 3,452 | 2.77 | ||||||||||||||||||||||||||
Foreign interest-bearing deposits: | |||||||||||||||||||||||||||||||||||
Banks located in foreign | 26,052 | 41 | 0.64 | 41,398 | 119 | 1.14 | 39,196 | 398 | 4.08 | ||||||||||||||||||||||||||
Governments and official institutions | 9,849 | 6 | 0.25 | 13,738 | 30 | 0.87 | 14,650 | 132 | 3.62 | ||||||||||||||||||||||||||
Time, savings and other | 58,380 | 132 | 0.92 | 48,836 | 165 | 1.34 | 53,064 | 476 | 3.61 | ||||||||||||||||||||||||||
Total foreign interest-bearing deposits | 94,281 | 179 | 0.77 | 103,972 | 314 | 1.20 | 106,910 | 1,006 | 3.79 | ||||||||||||||||||||||||||
Total interest-bearing deposits | 736,849 | 2,470 | 1.36 | 686,863 | 3,217 | 1.86 | 607,863 | 4,458 | 2.95 | ||||||||||||||||||||||||||
Federal funds purchased, and securities loaned or sold under agreements to repurchase and other short-term borrowings(2) | 591,928 | 1,915 | 1.31 | 459,743 | 1,549 | 1.34 | 452,854 | 4,134 | 3.67 | ||||||||||||||||||||||||||
Trading account liabilities | 70,799 | 579 | 3.32 | 70,859 | 524 | 2.94 | 82,432 | 840 | 4.10 | ||||||||||||||||||||||||||
Long-term debt (2) | 446,975 | 5,207 | 4.69 | 255,709 | 2,969 | 4.64 | 198,463 | 2,387 | 4.81 | ||||||||||||||||||||||||||
Total interest-bearing liabilities - excluding hedge impact | 1,846,551 | 10,171 | 2.23 | 1,473,174 | 8,259 | 2.23 | 1,341,612 | 11,819 | 3.54 | ||||||||||||||||||||||||||
Net hedge (income) expense on liabilities | (512 | ) | 237 | 49 | |||||||||||||||||||||||||||||||
Total interest-bearing liabilities - including hedge impact | 1,846,551 | 9,659 | 2.11 | 1,473,174 | 8,496 | 2.30 | 1,341,612 | 11,868 | 3.55 | ||||||||||||||||||||||||||
Noninterest-bearing sources: | |||||||||||||||||||||||||||||||||||
Noninterest-bearing deposits | 227,232 | 205,278 | 179,760 | ||||||||||||||||||||||||||||||||
Other liabilities | 216,585 | 93,836 | 88,827 | ||||||||||||||||||||||||||||||||
Shareholders’ equity | 228,766 | 176,566 | 154,728 | ||||||||||||||||||||||||||||||||
Total liabilities and shareholders’ equity | $ | 2,519,134 | $ | 1,948,854 | $ | 1,764,927 | |||||||||||||||||||||||||||||
Net interest spread | 2.52 | 3.18 | 2.38 | ||||||||||||||||||||||||||||||||
Impact of noninterest-bearing sources | 0.07 | 0.21 | 0.39 | ||||||||||||||||||||||||||||||||
Net interest income/yield on earning assets - excluding hedge impact | $ | 12,368 | 2.59 | % | $ | 13,684 | 3.39 | % | $ | 10,443 | 2.77 | % | |||||||||||||||||||||||
Net impact of hedge income (expense) | 451 | 0.11 | (278 | ) | (0.08 | ) | (152 | ) | (0.04 | ) | |||||||||||||||||||||||||
Net interest income/yield on earning assets | $ | 12,819 | 2.70 | % | $ | 13,406 | 3.31 | % | $ | 10,291 | 2.73 | % | |||||||||||||||||||||||
(1) �� This table presents a non-GAAP financial measure. The impact of interest rate risk management derivatives is shown separately. Interest income and interest expense amounts, and the yields and rates have been adjusted. Management believes this presentation is useful to investors because it adjusts for the impact of our hedging decisions and provides a better understanding of our hedging activities. The impact of interest rate risk management derivatives is not material to the average balances presented above. (2) The following presents the impact of interest rate risk management derivatives on interest income and interest expense.
Interest income excludes the impact of interest rate risk management contracts, which increased (decreased) interest income on:
| |||||||||||||||||||||||||||||||||||
| First Quarter 2009 | Fourth Quarter 2008 | First Quarter 2008 | |||||||||||||||||||||||||||||||||
Time deposits placed and other short-term investments | $ | — | $ | (4 | ) | $ | (4 | ) | |||||||||||||||||||||||||||
Federal funds sold and securities borrowed or purchased under agreements to resell | (3 | ) | (21 | ) | (70 | ) | |||||||||||||||||||||||||||||
Debt securities | (28 | ) | (15 | ) | (1 | ) | |||||||||||||||||||||||||||||
Commercial - domestic | (30 | ) | (3 | ) | (27 | ) | |||||||||||||||||||||||||||||
Other earning assets | — | 2 | (1 | ) | |||||||||||||||||||||||||||||||
Net hedge income (expense) on assets | $ | (61 | ) | $ | (41 | ) | $ | (103 | ) | ||||||||||||||||||||||||||
Interest expense excludes the impact of interest rate risk management contracts, which increased (decreased) interest expense on: | |||||||||||||||||||||||||||||||||||
NOW and money market deposit accounts | $ | (1 | ) | $ | — | $ | 5 | ||||||||||||||||||||||||||||
Consumer CDs and IRAs | 64 | 70 | 121 | ||||||||||||||||||||||||||||||||
Negotiable CDs, public funds and other time deposits | 3 | 3 | 2 | ||||||||||||||||||||||||||||||||
Banks located in foreign countries | 7 | 6 | 2 | ||||||||||||||||||||||||||||||||
Federal funds purchased, and securities loaned or sold under agreements to repurchaseand other short-term borrowings | 307 | 361 | 8 | ||||||||||||||||||||||||||||||||
Long-term debt | (892 | ) | (203 | ) | (89 | ) | |||||||||||||||||||||||||||||
Net hedge (income) expense on liabilities | $ | (512 | ) | $ | 237 | $ | 49 | ||||||||||||||||||||||||||||
Certain prior period amounts have been reclassified to conform to current period presentation.
Information for periods beginning July 1, 2008 include the Countrywide acquisition. Information for the period beginning January 1, 2009 includes the
Merrill Lynch acquisition. Prior periods have not been restated.
| This information is preliminary and based on company data available at the time of the presentation. | 9 |
Bank of America Corporation and Subsidiaries
Debt Securities and Available-for-Sale Marketable Equity Securities
(Dollars in millions)
| March 31, 2009 | |||||||||
| Amortized Cost | Gross Unrealized Gains | Gross Unrealized Losses | Fair Value | ||||||
Available-for-sale debt securities | |||||||||
U.S Treasury securities and agency debentures | $ 4,353 | $ 249 | $ (9 | ) | $ 4,593 | ||||
Mortgage-backed securities: | |||||||||
Agency MBSs | 136,194 | 3,116 | (130 | ) | 139,180 | ||||
Agency collateralized mortgage obligations | 20,842 | 365 | (51 | ) | 21,156 | ||||
Non-agency MBSs | 58,129 | 1,649 | (10,941 | ) | 48,837 | ||||
Foreign securities | 5,363 | 5 | (940 | ) | 4,428 | ||||
Corporate/Agency bonds | 5,588 | 37 | (1,142 | ) | 4,483 | ||||
Other taxable securities(1) | 22,539 | 61 | (653 | ) | 21,947 | ||||
Total taxable securities | 253,008 | 5,482 | (13,866 | ) | 244,624 | ||||
Tax-exempt securities | 10,142 | 83 | (655 | ) | 9,570 | ||||
Total available-for-sale debt securities | $263,150 | $5,565 | $(14,521 | ) | $254,194 | ||||
Held-to-maturity debt securities(2) | 8,444 | — | — | 8,444 | |||||
Total debt securities | $271,594 | $5,565 | $(14,521 | ) | $262,638 | ||||
Available-for-sale marketable equity securities(3) | $ 17,456 | $5,705 | $ (1,340 | ) | $ 21,821 | ||||
| December 31, 2008 | |||||||||
| Amortized Cost | Gross Unrealized Gains | Gross Unrealized Losses | Fair Value | ||||||
Available-for-sale debt securities | |||||||||
U.S Treasury securities and agency debentures | $ 4,540 | $ 121 | $ (14 | ) | $ 4,647 | ||||
Mortgage-backed securities: | |||||||||
Agency MBSs | 191,913 | 3,064 | (146 | ) | 194,831 | ||||
Non-agency MBSs | 43,224 | 860 | (9,337 | ) | 34,747 | ||||
Foreign securities | 5,675 | 6 | (678 | ) | 5,003 | ||||
Corporate/Agency bonds | 5,560 | 31 | (1,022 | ) | 4,569 | ||||
Other taxable securities(1) | 24,832 | 11 | (1,300 | ) | 23,543 | ||||
Total taxable securities | 275,744 | 4,093 | (12,497 | ) | 267,340 | ||||
Tax-exempt securities | 10,501 | 44 | (981 | ) | 9,564 | ||||
Total available-for-sale debt securities | $286,245 | $4,137 | $(13,478 | ) | $276,904 | ||||
Held-to-maturity debt securities | 685 | — | — | 685 | |||||
Total debt securities | $286,930 | $4,137 | $(13,478 | ) | $277,589 | ||||
Available-for-sale marketable equity securities(3) | $ 18,892 | $7,717 | $ (1,537 | ) | $ 25,072 | ||||
| (1) | Includes asset-backed securities |
| (2) | Includes held-to maturity debt securities of $7.8 billion issued by the credit card securitization trust and retained by the Corporation. |
| (3) | Represents those available-for-sale marketable equity securities that are recorded in the other assets on the Consolidated Balance Sheet. |
Certain prior period amounts have been reclassified among the segments to conform to the current period presentation.
Information for periods beginning July 1, 2008 include the Countrywide acquisition. Information for the period beginning January 1, 2009 includes the
Merrill Lynch acquisition. Prior periods have not been restated.
| This information is preliminary and based on company data available at the time of the presentation. | 10 |
Bank of America Corporation and Subsidiaries
Deposits Segment Results(1)
(Dollars in millions)
| First Quarter 2009 | Fourth Quarter 2008 | Third Quarter 2008 | Second Quarter 2008 | First Quarter 2008 | ||||||||||||||||||||||
Net interest income(2) | $ | 1,962 | $ | 3,049 | $ | 2,966 | $ | 2,687 | $ | 2,572 | ||||||||||||||||
Noninterest income: | ||||||||||||||||||||||||||
Service charges | 1,503 | 1,676 | 1,821 | 1,742 | 1,564 | |||||||||||||||||||||
All other income | (1 | ) | 10 | 11 | 33 | 14 | ||||||||||||||||||||
Total noninterest income | 1,502 | 1,686 | 1,832 | 1,775 | 1,578 | |||||||||||||||||||||
Total revenue, net of interest expense | 3,464 | 4,735 | 4,798 | 4,462 | 4,150 | |||||||||||||||||||||
Provision for credit losses | 311 | 235 | 232 | 276 | 246 | |||||||||||||||||||||
Noninterest expense | 2,363 | 2,253 | 2,134 | 2,339 | 2,216 | |||||||||||||||||||||
Income before income taxes | 790 | 2,247 | 2,432 | 1,847 | 1,688 | |||||||||||||||||||||
Income tax expense(2) | 297 | 739 | 918 | 697 | 628 | |||||||||||||||||||||
Net income | $ | 493 | $ | 1,508 | $ | 1,514 | $ | 1,150 | $ | 1,060 | ||||||||||||||||
Net interest yield(2) | 2.11 | % | 3.29 | % | 3.19 | % | 3.25 | % | 3.08 | % | ||||||||||||||||
Return on average equity | 8.41 | 24.11 | 24.60 | 18.52 | 16.99 | |||||||||||||||||||||
Efficiency ratio(2) | 68.20 | 47.60 | 44.49 | 52.42 | 53.37 | |||||||||||||||||||||
Balance sheet | ||||||||||||||||||||||||||
Average | ||||||||||||||||||||||||||
Total earning assets(3) | $ | 377,198 | $ | 368,435 | $ | 369,924 | $ | 332,707 | $ | 336,187 | ||||||||||||||||
Total assets(3) | 403,173 | 394,814 | 395,112 | 364,889 | 367,596 | |||||||||||||||||||||
Total deposits | 377,575 | 378,951 | 379,071 | 337,253 | 339,464 | |||||||||||||||||||||
Allocated equity | 23,783 | 24,880 | 24,482 | 24,965 | 25,125 | |||||||||||||||||||||
Period end | ||||||||||||||||||||||||||
Total earning assets(3) | $ | 391,603 | $ | 365,344 | $ | 372,628 | $ | 335,548 | $ | 342,116 | ||||||||||||||||
Total assets(3) | 417,410 | 392,036 | 399,328 | 363,764 | 374,173 | |||||||||||||||||||||
Total deposits | 391,604 | 376,974 | 383,078 | 336,136 | 345,990 | |||||||||||||||||||||
| (1) | Deposit balances of qualifying affluent customers are migrated to (from) GWM. After migration, the associated net interest income, service charges and noninterest expense are recorded in the appropriate segment. |
| (2) | Fully taxable-equivalent basis |
| (3) | Total earning assets and total assets include asset allocations to match liabilities (i.e., deposits). |
Certain prior period amounts have been reclassified among the segments to conform to the current period presentation.
Information for periods beginning July 1, 2008 include the Countrywide acquisition. Information for the period beginning January 1, 2009 includes the
Merrill Lynch acquisition. Prior periods have not been restated.
| This information is preliminary and based on company data available at the time of the presentation. | 11 |
Bank of America Corporation and Subsidiaries
Deposits Key Indicators
(Dollars in millions, except as noted)
| First Quarter 2009 | Fourth Quarter 2008 | Third Quarter 2008 | Second Quarter 2008 | First Quarter 2008 | ||||||||||||||||||||||
Average deposit balances | ||||||||||||||||||||||||||
Checking | $ | 126,101 | $ | 124,625 | $ | 125,844 | $ | 128,240 | $ | 125,855 | ||||||||||||||||
Savings | 29,564 | 28,687 | 29,392 | 30,092 | 28,828 | |||||||||||||||||||||
MMS | 78,441 | 80,677 | 80,364 | 69,772 | 66,361 | |||||||||||||||||||||
CDs and IRAs | 140,123 | 141,895 | 139,628 | 106,153 | 115,753 | |||||||||||||||||||||
Foreign and other | 3,346 | 3,067 | 3,843 | 2,996 | 2,667 | |||||||||||||||||||||
Total average deposit balances | $ | 377,575 | $ | 378,951 | $ | 379,071 | $ | 337,253 | $ | 339,464 | ||||||||||||||||
Total balances migrated to (from)GWIM | $ | (6,140 | ) | $ | 4,542 | $ | 3,272 | $ | 5,631 | $ | 7,031 | |||||||||||||||
Deposit spreads (excludes noninterest costs) | ||||||||||||||||||||||||||
Checking | 4.18 | % | 4.25 | % | 4.23 | % | 4.15 | % | 4.28 | % | ||||||||||||||||
Savings | 3.89 | 3.82 | 3.80 | 3.70 | 3.89 | |||||||||||||||||||||
MMS | (0.14 | ) | 0.91 | 1.15 | 1.30 | 1.54 | ||||||||||||||||||||
CDs and IRAs | 0.09 | 0.26 | 0.14 | 0.40 | 0.53 | |||||||||||||||||||||
Foreign and other | 3.54 | 3.76 | 3.72 | 3.62 | 3.49 | |||||||||||||||||||||
Total deposit spreads | 1.71 | 1.99 | 2.01 | 2.31 | 2.40 | |||||||||||||||||||||
Net new retail checking (units in thousands) | 218 | 130 | 823 | 674 | 557 | |||||||||||||||||||||
Online banking (end of period) | ||||||||||||||||||||||||||
Active accounts (units in thousands) | 29,515 | 28,854 | 28,636 | 25,299 | 24,949 | |||||||||||||||||||||
Active billpay accounts (units in thousands) | 16,031 | 15,861 | 15,732 | 13,269 | 13,081 | |||||||||||||||||||||
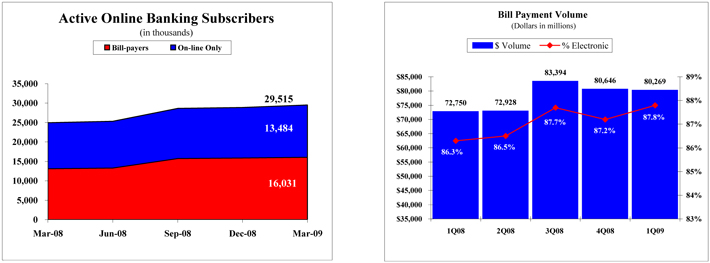
Bank of America has the largest active online banking customer base with 29.5 million subscribers.
Bank of America uses a strict Active User standard - customers must have used our online services within the last 90 days.
16.0 millionactivebill pay users paid $80.3 billion worth of bills this quarter. The number of customers who sign up and use Bank of America’s Bill Pay Service continues to far surpass that of any other financial institution.
Currently, approximately 340 companies are presenting 39.0 million e-bills per quarter.
Certain prior period amounts have been reclassified to conform to the current period presentation.
Information for periods beginning July 1, 2008 include the Countrywide acquisition. Information for the period beginning January 1, 2009 includes the
Merrill Lynch acquisition. Prior periods have not been restated.
| This information is preliminary and based on company data available at the time of the presentation. | 12 |
Bank of America Corporation and Subsidiaries
Global Card Services Segment Results(1)
(Dollars in millions)
| First Quarter 2009 | Fourth Quarter 2008 | Third Quarter 2008 | Second Quarter 2008 | First Quarter 2008 | |||||||||||||||||||||||
Net interest income(2) | $ | 5,207 | $ | 5,237 | $ | 4,861 | $ | 4,680 | $ | 4,527 | |||||||||||||||||
Noninterest income: | |||||||||||||||||||||||||||
Card income | 2,115 | 2,469 | 2,290 | 2,554 | 2,720 | ||||||||||||||||||||||
All other income | 135 | 239 | 534 | 204 | 621 | ||||||||||||||||||||||
Total noninterest income | 2,250 | 2,708 | 2,824 | 2,758 | 3,341 | ||||||||||||||||||||||
Total revenue, net of interest expense | 7,457 | 7,945 | 7,685 | 7,438 | 7,868 | ||||||||||||||||||||||
Provision for credit losses(3) | 8,221 | 5,723 | 5,468 | 4,071 | 4,312 | ||||||||||||||||||||||
Noninterest expense | 2,075 | 2,178 | 2,406 | 2,378 | 2,199 | ||||||||||||||||||||||
Income (loss) before income taxes | (2,839 | ) | 44 | (189 | ) | 989 | 1,357 | ||||||||||||||||||||
Income tax expense (benefit)(2) | (1,070 | ) | 18 | (63 | ) | 330 | 490 | ||||||||||||||||||||
Net income (loss) | $ | (1,769 | ) | $ | 26 | $ | (126 | ) | $ | 659 | $ | 867 | |||||||||||||||
Net interest yield(2) | 9.41 | % | 9.11 | % | 8.22 | % | 8.04 | % | 7.93 | % | |||||||||||||||||
Return on average equity | (17.90 | ) | 0.26 | (1.30 | ) | 6.88 | 9.18 | ||||||||||||||||||||
Efficiency ratio(2) | 27.83 | 27.42 | 31.31 | 31.97 | 27.95 | ||||||||||||||||||||||
| Balance sheet | |||||||||||||||||||||||||||
Average | |||||||||||||||||||||||||||
Total loans and leases | $ | 224,406 | $ | 228,519 | $ | 234,814 | $ | 233,593 | $ | 229,147 | |||||||||||||||||
Total earning assets | 224,406 | 228,605 | 235,161 | 234,088 | 229,465 | ||||||||||||||||||||||
Total assets | 242,974 | 248,962 | 257,070 | 256,506 | 253,034 | ||||||||||||||||||||||
Allocated equity | 40,070 | 39,907 | 38,614 | 38,559 | 38,001 | ||||||||||||||||||||||
Period end | |||||||||||||||||||||||||||
Total loans and leases | $ | 218,031 | $ | 228,573 | $ | 231,146 | $ | 235,625 | $ | 229,974 | |||||||||||||||||
Total earning assets | 217,841 | 228,628 | 231,305 | 236,002 | 230,361 | ||||||||||||||||||||||
Total assets | 234,990 | 248,664 | 252,501 | 258,698 | 253,363 | ||||||||||||||||||||||
| (1) | Presented on a managed basis. (See Exhibit A: Non-GAAP Reconciliations - Global Card Services - Reconciliation on page 38). |
| (2) | Fully taxable-equivalent basis |
| (3) | Represents provision for credit losses on held loans combined with realized credit losses associated with the securitized loan portfolio. |
Certain prior period amounts have been reclassified among the segments to conform to the current period presentation.
Information for periods beginning July 1, 2008 include the Countrywide acquisition. Information for the period beginning January 1, 2009 includes the
Merrill Lynch acquisition. Prior periods have not been restated.
| This information is preliminary and based on company data available at the time of the presentation. | 13 |
Bank of America Corporation and Subsidiaries
Global Card Services Key Indicators
(Dollars in millions)
| First Quarter 2009 | Fourth Quarter 2008 | Third Quarter 2008 | Second Quarter 2008 | First Quarter 2008 | ||||||||||||||||||||||
Credit Card Data(1) | ||||||||||||||||||||||||||
Loans | ||||||||||||||||||||||||||
Period end | ||||||||||||||||||||||||||
Held credit card outstandings | $ | 67,960 | $ | 81,274 | $ | 81,350 | $ | 78,642 | $ | 75,911 | ||||||||||||||||
Securitization impact | 105,392 | 100,960 | 102,048 | 108,520 | 107,847 | |||||||||||||||||||||
Managed credit card outstandings | $ | 173,352 | $ | 182,234 | $ | 183,398 | $ | 187,162 | $ | 183,758 | ||||||||||||||||
Average | ||||||||||||||||||||||||||
Held credit card outstandings | $ | 75,818 | $ | 82,117 | $ | 80,489 | $ | 78,221 | $ | 78,518 | ||||||||||||||||
Securitization impact | 102,672 | 99,116 | 105,919 | 107,438 | 105,176 | |||||||||||||||||||||
Managed credit card outstandings | $ | 178,490 | $ | 181,233 | $ | 186,408 | $ | 185,659 | $ | 183,694 | ||||||||||||||||
Credit Quality | ||||||||||||||||||||||||||
Charge-offs $ | ||||||||||||||||||||||||||
Held net charge-offs | $ | 1,612 | $ | 1,406 | $ | 1,242 | $ | 1,108 | $ | 956 | ||||||||||||||||
Securitization impact | 2,182 | 1,857 | 1,754 | 1,643 | 1,416 | |||||||||||||||||||||
Managed credit card net losses | $ | 3,794 | $ | 3,263 | $ | 2,996 | $ | 2,751 | $ | 2,372 | ||||||||||||||||
Charge-offs % | ||||||||||||||||||||||||||
Held net charge-offs | 8.62 | % | 6.82 | % | 6.14 | % | 5.69 | % | 4.90 | % | ||||||||||||||||
Securitization impact | — | 0.34 | 0.26 | 0.27 | 0.29 | |||||||||||||||||||||
Managed credit card net losses | 8.62 | % | 7.16 | % | 6.40 | % | 5.96 | % | 5.19 | % | ||||||||||||||||
30+ Delinquency $ | ||||||||||||||||||||||||||
Held delinquency | $ | 5,365 | $ | 5,324 | $ | 4,675 | $ | 4,121 | $ | 4,017 | ||||||||||||||||
Securitization impact | 8,246 | 6,844 | 6,126 | 6,226 | 6,288 | |||||||||||||||||||||
Managed delinquency | $ | 13,611 | $ | 12,168 | $ | 10,801 | $ | 10,347 | $ | 10,305 | ||||||||||||||||
30+ Delinquency % | ||||||||||||||||||||||||||
Held delinquency | 7.90 | % | 6.55 | % | 5.75 | % | 5.24 | % | 5.29 | % | ||||||||||||||||
Securitization impact | (0.05 | ) | 0.13 | 0.14 | 0.29 | 0.32 | ||||||||||||||||||||
Managed delinquency | 7.85 | % | 6.68 | % | 5.89 | % | 5.53 | % | 5.61 | % | ||||||||||||||||
90+ Delinquency $ | ||||||||||||||||||||||||||
Held delinquency | $ | 2,816 | $ | 2,565 | $ | 2,330 | $ | 2,109 | $ | 2,055 | ||||||||||||||||
Securitization impact | 4,106 | 3,185 | 2,958 | 3,169 | 3,137 | |||||||||||||||||||||
Managed delinquency | $ | 6,922 | $ | 5,750 | $ | 5,288 | $ | 5,278 | $ | 5,192 | ||||||||||||||||
90+ Delinquency % | ||||||||||||||||||||||||||
Held delinquency | 4.14 | % | 3.16 | % | 2.87 | % | 2.68 | % | 2.71 | % | ||||||||||||||||
Securitization impact | (0.15 | ) | — | 0.01 | 0.14 | 0.12 | ||||||||||||||||||||
Managed delinquency | 3.99 | % | 3.16 | % | 2.88 | % | 2.82 | % | 2.83 | % | ||||||||||||||||
Other Global Card Services Key Indicators | ||||||||||||||||||||||||||
Managed credit card data | ||||||||||||||||||||||||||
Gross interest yield | 11.68 | % | 11.87 | % | 11.52 | % | 11.44 | % | 11.94 | % | ||||||||||||||||
Risk adjusted margin | 4.65 | 6.47 | 6.75 | 6.39 | 6.92 | |||||||||||||||||||||
New account growth (in thousands) | 1,226 | 1,432 | 1,765 | 2,665 | 2,614 | |||||||||||||||||||||
Purchase volumes | $ | 48,056 | $ | 56,585 | $ | 62,662 | $ | 64,457 | $ | 59,821 | ||||||||||||||||
Debit Card Data | ||||||||||||||||||||||||||
Debit purchase volumes | $ | 51,133 | $ | 52,925 | $ | 53,252 | $ | 54,268 | $ | 50,061 | ||||||||||||||||
| (1) | Credit Card includes U.S consumer, Europe and Canada credit card. Does not include business card, debit card and consumer lending. |
Certain prior period amounts have been reclassified to conform to the current period presentation.
Information for periods beginning July 1, 2008 include the Countrywide acquisition. Information for the period beginning January 1, 2009 includes the
Merrill Lynch acquisition. Prior periods have not been restated.
| This information is preliminary and based on company data available at the time of the presentation. | 14 |
Bank of America Corporation and Subsidiaries
Home Loans & Insurance Segment Results
(Dollars in millions; except as noted)
| First Quarter 2009 | Fourth Quarter 2008 | Third Quarter 2008 | Second Quarter 2008 | First Quarter 2008 | ||||||||||||||||||||||||||
Net interest income(1) | $ | 1,180 | $ | 1,019 | $ | 1,161 | $ | 660 | $ | 599 | ||||||||||||||||||||
Noninterest income: | ||||||||||||||||||||||||||||||
Mortgage banking income | 3,403 | 1,603 | 1,755 | 409 | 656 | |||||||||||||||||||||||||
Insurance income | 581 | 646 | 569 | 113 | 88 | |||||||||||||||||||||||||
All other income | 60 | (2 | ) | 15 | 119 | 29 | ||||||||||||||||||||||||
Total noninterest income | 4,044 | 2,247 | 2,339 | 641 | 773 | |||||||||||||||||||||||||
Total revenue, net of interest expense | 5,224 | 3,266 | 3,500 | 1,301 | 1,372 | |||||||||||||||||||||||||
Provision for credit losses | 3,372 | 1,623 | 818 | 2,035 | 1,812 | |||||||||||||||||||||||||
Noninterest expense | 2,650 | 2,734 | 2,725 | 715 | 722 | |||||||||||||||||||||||||
Income (loss) before income taxes | (798 | ) | (1,091 | ) | (43 | ) | (1,449 | ) | (1,162 | ) | ||||||||||||||||||||
Income tax expense (benefit)(1) | (300 | ) | (404 | ) | (16 | ) | (536 | ) | (430 | ) | ||||||||||||||||||||
Net income (loss) | $ | (498 | ) | $ | (687 | ) | $ | (27 | ) | $ | (913 | ) | $ | (732 | ) | |||||||||||||||
Net interest yield(1) | 2.60 | % | 2.34 | % | 3.12 | % | 2.62 | % | 2.52 | % | ||||||||||||||||||||
Return on average equity | (13.90 | ) | (17.53 | ) | (0.65 | ) | (104.86 | ) | (96.85 | ) | ||||||||||||||||||||
Efficiency ratio(1) | 50.73 | 83.72 | 77.83 | 55.01 | 52.66 | |||||||||||||||||||||||||
| Balance sheet | ||||||||||||||||||||||||||||||
| Average | ||||||||||||||||||||||||||||||
Total loans and leases | $ | 126,696 | $ | 122,074 | $ | 122,043 | $ | 91,206 | $ | 87,238 | ||||||||||||||||||||
Total earning assets | 184,066 | 173,169 | 148,218 | 101,116 | 95,545 | |||||||||||||||||||||||||
Total assets | 220,072 | 204,899 | 180,007 | 104,546 | 99,894 | |||||||||||||||||||||||||
Allocated equity | 14,526 | 15,603 | 16,387 | 3,502 | 3,040 | |||||||||||||||||||||||||
| Period end | ||||||||||||||||||||||||||||||
Total loans and leases | $ | 131,343 | $ | 122,956 | $ | 122,983 | $ | 92,073 | $ | 88,321 | ||||||||||||||||||||
Total earning assets | 184,147 | 175,618 | 167,346 | 100,919 | 97,881 | |||||||||||||||||||||||||
Total assets | 221,559 | 205,055 | 178,964 | 103,774 | 102,115 | |||||||||||||||||||||||||
Period end (in billions) | ||||||||||||||||||||||||||||||
Mortgage servicing portfolio(2) | $ | 2,112.8 | $ | 2,057.3 | $ | 2,026.2 | $ | 540.8 | $ | 529.7 | ||||||||||||||||||||
| (1) | Fully taxable-equivalent basis |
| (2) | Servicing of residential mortgage loans, home equity lines of credit, home equity loans and discontinued real estate mortgage loans. |
Certain prior period amounts have been reclassified among the segments to conform to the current period presentation.
Information for periods beginning July 1, 2008 include the Countrywide acquisition. Information for the period beginning January 1, 2009 includes the
Merrill Lynch acquisition. Prior periods have not been restated.
| This information is preliminary and based on company data available at the time of the presentation. | 15 |
Bank of America Corporation and Subsidiaries
Home Loans & Insurance Key Indicators
(Dollars in millions, except as noted)
| First Quarter 2009 | Fourth Quarter 2008 | Third Quarter 2008 | Second Quarter 2008 | First Quarter 2008 | ||||||||||||||||||||||||||
Mortgage servicing rights at fair value rollforward: | ||||||||||||||||||||||||||||||
Beginning balance | $ | 12,733 | $ | 20,811 | $ | 4,250 | $ | 3,163 | $ | 3,053 | ||||||||||||||||||||
Countrywide balance, July 1, 2008 | — | — | 17,188 | — | — | |||||||||||||||||||||||||
Merrill Lynch balance, January 1, 2009 | 209 | — | — | — | — | |||||||||||||||||||||||||
Additions | 1,249 | 677 | 875 | 669 | 366 | |||||||||||||||||||||||||
Impact of customer payments | (1,185 | ) | (1,458 | ) | (1,425 | ) | (233 | ) | (197 | ) | ||||||||||||||||||||
Other changes in MSR | 1,090 | (7,297 | ) | (77 | ) | 651 | (59 | ) | ||||||||||||||||||||||
Ending balance | $ | 14,096 | $ | 12,733 | $ | 20,811 | $ | 4,250 | $ | 3,163 | ||||||||||||||||||||
Capitalized mortgage servicing rights | ||||||||||||||||||||||||||||||
(% of loans serviced) | 83 | bps | 77 | bps | 126 | bps | 145 | bps | 118 | bps | ||||||||||||||||||||
Mortgage loans serviced for investors (in billions) | $ | 1,699 | $ | 1,654 | $ | 1,654 | $ | 292 | $ | 268 | ||||||||||||||||||||
Home Loans & Insurance | ||||||||||||||||||||||||||||||
Mortgage production | $ | 79,072 | $ | 42,761 | $ | 49,625 | $ | 18,515 | $ | 18,044 | ||||||||||||||||||||
Home equity production | 2,923 | 3,920 | 5,260 | 8,997 | 13,821 | |||||||||||||||||||||||||
Total Corporation | ||||||||||||||||||||||||||||||
Mortgage production | 85,218 | 44,611 | 51,539 | 22,438 | 21,922 | |||||||||||||||||||||||||
Home equity production | 4,038 | 5,326 | 7,023 | 11,500 | 16,641 | |||||||||||||||||||||||||
Mortgage banking income | ||||||||||||||||||||||||||||||
Production income | $ | 1,637 | $ | 691 | $ | 749 | $ | 283 | $ | 396 | ||||||||||||||||||||
Servicing income: | ||||||||||||||||||||||||||||||
Servicing fees and ancillary income | 1,517 | 1,487 | 1,526 | 266 | 250 | |||||||||||||||||||||||||
Impact of customer payments | (1,185 | ) | (1,458 | ) | (1,425 | ) | (233 | ) | (197 | ) | ||||||||||||||||||||
Fair value changes of MSRs, net of economic hedge results | 1,301 | 783 | 823 | 93 | 207 | |||||||||||||||||||||||||
Other servicing-related revenue | 133 | 100 | 82 | — | — | |||||||||||||||||||||||||
Total net servicing income | 1,766 | 912 | 1,006 | 126 | 260 | |||||||||||||||||||||||||
Total Home Loans & Insurance mortgage banking income | 3,403 | 1,603 | 1,755 | 409 | 656 | |||||||||||||||||||||||||
Other business segment mortgage banking income (loss) | (89 | ) | (80 | ) | (81 | ) | 30 | (205 | ) | |||||||||||||||||||||
Total consolidated mortgage banking income | $ | 3,314 | $ | 1,523 | $ | 1,674 | $ | 439 | $ | 451 | ||||||||||||||||||||
Certain prior period amounts have been reclassified among the segments to conform to the current period presentation.
Information for periods beginning July 1, 2008 include the Countrywide acquisition. Information for the period beginning January 1, 2009 includes the
Merrill Lynch acquisition. Prior periods have not been restated.
| This information is preliminary and based on company data available at the time of the presentation. | 16 |
Bank of America Corporation and Subsidiaries
Global Banking Segment Results
(Dollars in millions)
| First Quarter 2009 | Fourth Quarter 2008 | Third Quarter 2008 | Second Quarter 2008 | First Quarter 2008 | ||||||||||||||||||||
Net interest income(1) | $2,810 | $3,089 | $2,710 | $2,480 | $2,298 | |||||||||||||||||||
Noninterest income: | ||||||||||||||||||||||||
Service charges | 942 | 809 | 820 | 824 | 756 | |||||||||||||||||||
Investment banking income | 643 | 446 | 263 | 392 | 358 | |||||||||||||||||||
All other income (loss) | 246 | (334 | ) | 429 | 728 | 444 | ||||||||||||||||||
Total noninterest income | 1,831 | 921 | 1,512 | 1,944 | 1,558 | |||||||||||||||||||
Total revenue, net of interest expense | 4,641 | 4,010 | 4,222 | 4,424 | 3,856 | |||||||||||||||||||
Provision for credit losses | 1,848 | 1,402 | 802 | 400 | 526 | |||||||||||||||||||
Noninterest expense | 2,511 | 1,116 | 1,770 | 1,751 | 1,740 | |||||||||||||||||||
Income before income taxes | 282 | 1,492 | 1,650 | 2,273 | 1,590 | |||||||||||||||||||
Income tax expense(1) | 107 | 451 | 616 | 862 | 590 | |||||||||||||||||||
Net income | $175 | $1,041 | $1,034 | $1,411 | $1,000 | |||||||||||||||||||
Net interest yield(1) | 3.33 | % | 3.60 | % | 3.29 | % | 3.10 | % | 2.96 | % | ||||||||||||||
Return on average equity | 1.25 | 8.05 | 8.55 | 12.04 | 8.73 | |||||||||||||||||||
Efficiency ratio(1) | 54.11 | 27.85 | 41.92 | 39.58 | 45.13 | |||||||||||||||||||
Balance sheet | ||||||||||||||||||||||||
Average | ||||||||||||||||||||||||
Total loans and leases | $330,972 | $331,115 | $320,813 | $315,282 | $305,924 | |||||||||||||||||||
Total earning assets (2) | 341,725 | 341,453 | 327,517 | 321,385 | 312,497 | |||||||||||||||||||
Total assets(2) | 397,985 | 394,906 | 382,413 | 376,733 | 366,256 | |||||||||||||||||||
Total deposits | 196,061 | 198,246 | 176,570 | 169,738 | 160,726 | |||||||||||||||||||
Allocated equity | 56,576 | 51,440 | 48,142 | 47,136 | 46,065 | |||||||||||||||||||
Period end | ||||||||||||||||||||||||
Total loans and leases | $325,263 | $328,574 | $326,970 | $322,675 | $311,557 | |||||||||||||||||||
Total earning assets(2) | 335,081 | 338,913 | 338,405 | 329,265 | 318,153 | |||||||||||||||||||
Total assets(2) | 389,076 | 391,930 | 394,948 | 385,025 | 369,216 | |||||||||||||||||||
Total deposits | 194,864 | 214,755 | 194,462 | 173,576 | 168,129 | |||||||||||||||||||
| ||||||||||||||||||||||||
(1) Fully taxable-equivalent basis |
| |||||||||||||||||||||||
(2) Total earning assets and total assets include asset allocations to match liabilities (i.e., deposits). | ||||||||||||||||||||||||
| Components of Investment Banking Income | ||||||||||||||||||||||||
| ||||||||||||||||||||||||
| (Dollars in millions) | ||||||||||||||||||||||||
Investment banking income | ||||||||||||||||||||||||
Debt underwriting | $ 644 | $429 | $352 | $574 | $ 330 | |||||||||||||||||||
Equity underwriting | 167 | 224 | 50 | 110 | 240 | |||||||||||||||||||
Advisory fees | 290 | 107 | 63 | 51 | 66 | |||||||||||||||||||
Total Global Markets and Investment Banking(1) | 1,101 | 760 | 465 | 735 | 636 | |||||||||||||||||||
Other(2) | (46 | ) | (142 | ) | 9 | (40 | ) | (160 | ) | |||||||||||||||
Total investment banking income | $1,055 | $618 | $474 | $695 | $ 476 | |||||||||||||||||||
| (1) | Represents investment banking income that is recorded in Global Markets and Investment Banking (which resides in Global Banking). |
| (2) | Investment banking income earned from activity that is not part of the primary investment banking platform as well as the offset to fees paid on the Corporation’s own issuances. |
Certain prior period amounts have been reclassified among the segments to conform to the current period presentation.
Information for periods beginning July 1, 2008 include the Countrywide acquisition. Information for the period beginning January 1, 2009 includes the
Merrill Lynch acquisition. Prior periods have not been restated.
| This information is preliminary and based on company data available at the time of the presentation. | 17 |
Bank of America Corporation and Subsidiaries
Global Banking Key Indicators
(Dollars in millions)
| First Quarter 2009 | Fourth Quarter 2008 | Third Quarter 2008 | Second Quarter 2008 | First Quarter 2008 | ||||||||||||||||||||||||||
Global Banking revenue, net of interest expense | ||||||||||||||||||||||||||||||
Corporate banking | $ | 1,418 | $ | 1,471 | $ | 1,231 | $ | 1,205 | $ | 1,088 | ||||||||||||||||||||
Commercial banking | 2,790 | 2,864 | 2,869 | 2,925 | 2,717 | |||||||||||||||||||||||||
Investment banking | 433 | (325 | ) | 122 | 294 | 51 | ||||||||||||||||||||||||
Total revenue, net of interest expense(1) | $ | 4,641 | $ | 4,010 | $ | 4,222 | $ | 4,424 | $ | 3,856 | ||||||||||||||||||||
Global Banking average deposit balances | ||||||||||||||||||||||||||||||
Corporate banking | $ | 76,208 | $ | 79,831 | $ | 69,428 | $ | 61,794 | $ | 60,588 | ||||||||||||||||||||
Commercial banking | 119,853 | 118,415 | 107,142 | 107,944 | 100,138 | |||||||||||||||||||||||||
Total | $ | 196,061 | $ | 198,246 | $ | 176,570 | $ | 169,738 | $ | 160,726 | ||||||||||||||||||||
Interest-bearing | $ | 86,527 | $ | 100,259 | $ | 89,217 | $ | 88,130 | $ | 84,782 | ||||||||||||||||||||
Noninterest-bearing | 109,534 | 97,987 | 87,353 | 81,608 | 75,944 | |||||||||||||||||||||||||
Total | $ | 196,061 | $ | 198,246 | $ | 176,570 | $ | 169,738 | $ | 160,726 | ||||||||||||||||||||
Global Banking loan spreads | ||||||||||||||||||||||||||||||
Corporate banking | 1.64 | % | 1.17 | % | 0.72 | % | 0.64 | % | 0.65 | % | ||||||||||||||||||||
Commercial banking | 1.83 | 1.85 | 1.74 | 1.71 | 1.78 | |||||||||||||||||||||||||
Provision for credit losses | ||||||||||||||||||||||||||||||
Corporate banking | $ | 291 | $ | 365 | $ | 131 | $ | (49 | ) | $ | 34 | |||||||||||||||||||
Commercial banking | 1,557 | 1,037 | 671 | 449 | 492 | |||||||||||||||||||||||||
Total provision for credit losses | $ | 1,848 | $ | 1,402 | $ | 802 | $ | 400 | $ | 526 | ||||||||||||||||||||
| Credit quality(2, 3) | ||||||||||||||||||||||||||||||
Reservable utilized criticized exposure | ||||||||||||||||||||||||||||||
Corporate banking | $ | 9,995 | $ | 7,292 | $ | 5,782 | $ | 4,426 | $ | 3,023 | ||||||||||||||||||||
| 8.33 | % | 5.91 | % | 4.63 | % | 3.69 | % | 2.78 | % | |||||||||||||||||||||
Commercial banking | $ | 33,465 | $ | 27,225 | $ | 23,020 | $ | 19,907 | $ | 16,462 | ||||||||||||||||||||
| 14.36 | % | 11.64 | % | 9.92 | % | 8.76 | % | 7.50 | % | |||||||||||||||||||||
Total reservable utilized criticized exposure | $ | 43,460 | $ | 34,517 | $ | 28,802 | $ | 24,333 | $ | 19,485 | ||||||||||||||||||||
| 12.31 | % | 9.66 | % | 8.07 | % | 7.01 | % | 5.93 | % | |||||||||||||||||||||
Nonperforming assets | ||||||||||||||||||||||||||||||
Corporate banking | $ | 879 | $ | 736 | $ | 444 | $ | 191 | $ | 202 | ||||||||||||||||||||
| 0.87 | % | 0.71 | % | 0.43 | % | 0.20 | % | 0.23 | % | |||||||||||||||||||||
Commercial banking | $ | 8,077 | $ | 5,643 | $ | 4,335 | $ | 3,639 | $ | 2,550 | �� | |||||||||||||||||||
| 3.60 | % | 2.50 | % | 1.93 | % | 1.61 | % | 1.14 | % | |||||||||||||||||||||
Total nonperforming assets | $ | 8,956 | $ | 6,379 | $ | 4,779 | $ | 3,830 | $ | 2,752 | ||||||||||||||||||||
| 2.75 | % | 1.94 | % | 1.46 | % | 1.19 | % | 0.88 | % | |||||||||||||||||||||
Average loans and leases by product | ||||||||||||||||||||||||||||||
Commercial - domestic | $ | 174,732 | $ | 175,260 | $ | 163,886 | $ | 161,013 | $ | 156,009 | ||||||||||||||||||||
Commercial real estate | 62,532 | 61,395 | 60,196 | 59,909 | 59,292 | |||||||||||||||||||||||||
Commercial lease financing | 24,316 | 24,324 | 24,574 | 24,287 | 24,264 | |||||||||||||||||||||||||
Commercial - foreign | 26,655 | 28,546 | 28,429 | 27,895 | 25,702 | |||||||||||||||||||||||||
Direct/Indirect consumer | 41,201 | 40,144 | 42,205 | 40,344 | 38,764 | |||||||||||||||||||||||||
Other | 1,536 | 1,446 | 1,523 | 1,834 | 1,893 | |||||||||||||||||||||||||
Total average loans and leases | $ | 330,972 | $ | 331,115 | $ | 320,813 | $ | 315,282 | $ | 305,924 | ||||||||||||||||||||
(1) Total Global Banking revenue, net of interest expense | $ | 4,641 | $ | 4,010 | $ | 4,222 | $ | 4,424 | $ | 3,856 | ||||||||||||||||||||
Less: Fair value option revenue share | (138 | ) | (291 | ) | (13 | ) | 61 | (56 | ) | |||||||||||||||||||||
Less: Impact of credit mitigation | 1 | 221 | 24 | (5 | ) | 69 | ||||||||||||||||||||||||
Global banking revenues, net of interest expense excluding fair value option revenue share and credit mitigation | $ | 4,778 | $ | 4,080 | $ | 4,211 | $ | 4,368 | $ | 3,843 | ||||||||||||||||||||
| (2) | Criticized exposure corresponds to the Special Mention, Substandard and Doubtful asset categories defined by regulatory authorities. The reservable criticized exposure is on an end-of-period basis and is also shown as a percentage of total reservable commercial utilized credit exposure, including loans and leases, standby letters of credit, financial guarantees, commercial letters of credit and bankers’ acceptances. |
| (3) | Nonperforming assets are on an end-of-period basis and defined as nonperforming loans and leases plus foreclosed properties. The nonperforming ratio is nonperforming assets divided by commercialloans and leases plus commercial foreclosed properties. |
Certain prior period amounts have been reclassified among the segments to conform to the current period presentation.
Information for periods beginning July 1, 2008 include the Countrywide acquisition. Information for the period beginning January 1, 2009 includes the
Merrill Lynch acquisition. Prior periods have not been restated.
| This information is preliminary and based on company data available at the time of the presentation. | 18 |
Bank of America Corporation and Subsidiaries
Global and U.S. Banking Strategic Progress
Global and U.S. Market Share and Product Ranking
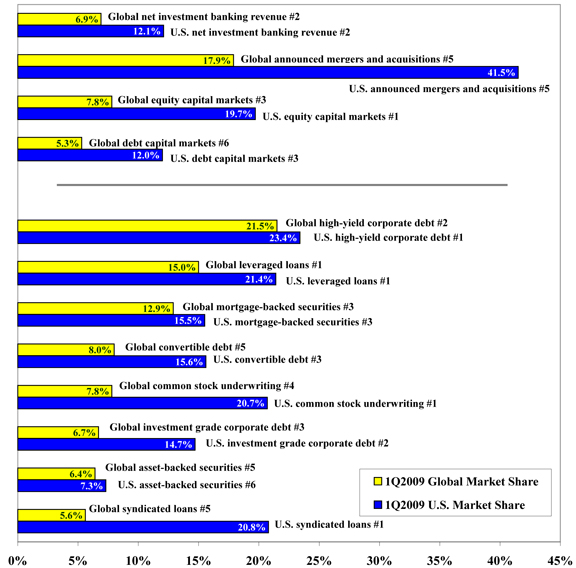
Source: Dealogic data. Rankings based on deal volumes except for investment banking revenue rankings which reflect fees. Merger and acquisition fees included in investment banking revenues reflect 10 percent fee credit at announcement and 90 percent fee credit at completion as per Dealogic . Mergers and acquisitions volume rankings are for announced transactions and provide credit only to the investment bank advising the parent company that is domiciled within that region. Each advisor receives full credit for the deal amount unless advising a minority stakeholder.
Highlights
Global top 3 rankings in:
Equity capital markets | Mortgage-backed securities | |||
| High-yield corporate debt | Investment grade corporate debt | |||
Leveraged loans |
U.S. top 3 rankings in:
Equity capital markets | Leveraged loans | Common stock underwriting | ||
Debt capital markets | Mortgage-backed securities | Investment grade corporate debt | ||
| High-yield corporate debt | Convertible debt | Syndicated loans |
1Q2009 global and U.S. investment grade corporate debt results include self-funded transactions. Excluding these deals, global investment grade corporate debt market share was 6.3 percent and U.S. investment grade corporate debt market share was 15.6 percent.
Information for the period beginning January 1, 2009 includes the Merrill Lynch acquisition.
| This information is preliminary and based on company data available at the time of the presentation. | 19 |
Bank of America Corporation and Subsidiaries
Global Markets Segment Results
(Dollars in millions)
| First Quarter 2009 | Fourth Quarter 2008 | Third Quarter 2008 | Second Quarter 2008 | First Quarter 2008 | ||||||||||||||||||||||||||
Net interest income(1) | $ | 1,787 | $ | 1,528 | $ | 1,285 | $ | 1,195 | $ | 1,133 | ||||||||||||||||||||
Noninterest income: | ||||||||||||||||||||||||||||||
Investment and brokerage services | 459 | 151 | 195 | 186 | 220 | |||||||||||||||||||||||||
Investment banking income | 486 | 340 | 229 | 374 | 306 | |||||||||||||||||||||||||
Trading account profits (losses) | 4,919 | (3,891 | ) | (499 | ) | 183 | (1,602 | ) | ||||||||||||||||||||||
All other income (loss) | (860 | ) | (2,711 | ) | (1,073 | ) | (568 | ) | (905 | ) | ||||||||||||||||||||
Total noninterest income (loss) | 5,004 | (6,111 | ) | (1,148 | ) | 175 | (1,981 | ) | ||||||||||||||||||||||
Total revenue, net of interest expense | 6,791 | (4,583 | ) | 137 | 1,370 | (848 | ) | |||||||||||||||||||||||
Provision for credit losses | 51 | 13 | (24 | ) | (38 | ) | (1 | ) | ||||||||||||||||||||||
Noninterest expense | 3,059 | 1,103 | 1,115 | 947 | 726 | |||||||||||||||||||||||||
Income (loss) before income taxes | 3,681 | (5,699 | ) | (954 | ) | 461 | (1,573 | ) | ||||||||||||||||||||||
Income tax expense (benefit)(1) | 1,316 | (2,030 | ) | (354 | ) | 166 | (582 | ) | ||||||||||||||||||||||
Net income (loss) | $ | 2,365 | $ | (3,669 | ) | $ | (600 | ) | $ | 295 | $ | (991 | ) | |||||||||||||||||
Return on average equity | 33.81 | % | (87.65 | ) | % | (17.63 | ) | % | 8.83 | % | (31.14 | ) | % | |||||||||||||||||
Efficiency ratio(1) | 45.04 | n/m | n/m | 69.11 | n/m | |||||||||||||||||||||||||
Balance sheet | ||||||||||||||||||||||||||||||
Average | ||||||||||||||||||||||||||||||
Total trading-related assets(2) | 536,977 | 315,125 | 347,088 | 332,748 | 357,488 | |||||||||||||||||||||||||
Total market-based earning assets | 488,411 | 311,777 | 370,140 | 367,188 | 394,838 | |||||||||||||||||||||||||
Total earning assets | 501,915 | 317,636 | 375,009 | 372,510 | 400,062 | |||||||||||||||||||||||||
Total assets | 702,159 | 391,774 | 432,039 | 431,354 | 462,148 | |||||||||||||||||||||||||
Allocated equity | 28,366 | 16,656 | 13,537 | 13,446 | 12,793 | |||||||||||||||||||||||||
Period end | ||||||||||||||||||||||||||||||
Total trading-related assets(2) | 440,839 | 244,174 | 275,703 | 299,828 | 313,795 | |||||||||||||||||||||||||
Total market-based earning assets | 380,118 | 237,613 | 282,470 | 329,389 | 341,481 | |||||||||||||||||||||||||
Total earning assets | 391,361 | 243,275 | 288,107 | 334,700 | 347,042 | |||||||||||||||||||||||||
Total assets | 574,088 | 308,193 | 351,826 | 389,951 | 418,632 | |||||||||||||||||||||||||
| (1) | Fully taxable-equivalent basis |
| (2) | Includes assets which are not considered earning assets (i.e. derivative assets). |
n/m = not meaningful
Certain prior period amounts have been reclassified among the segments to conform to the current period presentation.
Information for periods beginning July 1, 2008 include the Countrywide acquisition. Information for the period beginning January 1, 2009 includes the
Merrill Lynch acquisition. Prior periods have not been restated.
| This information is preliminary and based on company data available at the time of the presentation. | 20 |
Bank of America Corporation and Subsidiaries
Global Markets Key Indicators
(Dollars in millions)
| First Quarter 2009 | Fourth Quarter 2008 | Third Quarter 2008 | Second Quarter 2008 | First Quarter 2008 | ||||||||||||||||
Sales and trading revenue | ||||||||||||||||||||
Fixed income: | ||||||||||||||||||||
Rates and currencies | $ | 3,555 | $ | 181 | $ | 832 | $ | 797 | $ | 717 | ||||||||||
Commodities | 536 | 46 | (7 | ) | 85 | 10 | ||||||||||||||
Credit products | 890 | (2,189 | ) | (130 | ) | 655 | (859 | ) | ||||||||||||
Structured products | (400 | ) | (3,853 | ) | (1,340 | ) | (879 | ) | (1,669 | ) | ||||||||||
Total fixed income | 4,581 | (5,815 | ) | (645 | ) | 658 | (1,801 | ) | ||||||||||||
Equity income | 1,402 | (18 | ) | 398 | 275 | 308 | ||||||||||||||
Total sales and trading revenue(1) | $ | 5,983 | $ | (5,833 | ) | $ | (247 | ) | $ | 933 | $ | (1,493 | ) | |||||||
Balance sheet (average) | ||||||||||||||||||||
Trading account securities | $ | 217,437 | $ | 167,463 | $ | 186,455 | $ | 180,540 | $ | 188,240 | ||||||||||
Reverse repurchases | 136,192 | 53,193 | 62,767 | 51,256 | 55,552 | |||||||||||||||
Securities borrowed | 67,749 | 42,580 | 62,982 | 65,742 | 78,839 | |||||||||||||||
Derivative assets | 115,599 | 51,889 | 34,884 | 35,210 | 34,857 | |||||||||||||||
Total trading-related assets | $ | 536,977 | $ | 315,125 | $ | 347,088 | $ | 332,748 | $ | 357,488 | ||||||||||
Sales credits from secondary trading | ||||||||||||||||||||
Rates and currencies | 843 | 679 | 537 | 474 | 512 | |||||||||||||||
Commodities | 66 | 13 | 11 | 5 | 10 | |||||||||||||||
Credit products | 686 | 388 | 376 | 384 | 354 | |||||||||||||||
Structured products | 223 | 190 | 192 | 202 | 166 | |||||||||||||||
Equities | 769 | 212 | 192 | 259 | 282 | |||||||||||||||
Total sales credits | 2,587 | 1,482 | 1,308 | 1,324 | 1,324 | |||||||||||||||
Volatility of product revenues - 1 std dev | ||||||||||||||||||||
Rates and currencies | $ | 114.7 | $ | 93.6 | $ | 47.9 | $ | 32.0 | $ | 38.6 | ||||||||||
Commodities | 21.3 | 2.0 | 2.7 | 4.2 | 3.6 | |||||||||||||||
Credit products | 53.3 | 36.1 | 49.0 | 9.0 | 27.1 | |||||||||||||||
Structured products | 88.4 | 94.9 | 34.7 | 38.5 | 66.2 | |||||||||||||||
Equities | 24.1 | 13.1 | 10.6 | 8.7 | 10.1 | |||||||||||||||
Total volatility | 161.3 | 111.3 | 82.4 | 42.2 | 64.4 | |||||||||||||||
(1) Sales and trading revenue represents total Global Markets revenue, net of interest expense as adjusted by the following items: |
| |||||||||||||||||||
Total Global Markets revenue, net of interest expense | $ | 6,791 | $ | (4,583 | ) | $ | 137 | $ | 1,370 | $ | (848 | ) | ||||||||
Investment banking income | (486 | ) | (340 | ) | (229 | ) | (374 | ) | (306 | ) | ||||||||||
Fair value option net interest income | (58 | ) | (36 | ) | (25 | ) | (25 | ) | (27 | ) | ||||||||||
Revenue shared | (264 | ) | (874 | ) | (130 | ) | (38 | ) | (312 | ) | ||||||||||
Global markets revenues, net of interest expense - sales and trading | $ | 5,983 | $ | (5,833 | ) | $ | (247 | ) | $ | 933 | $ | (1,493 | ) | |||||||
Certain prior period amounts have been reclassified among the segments to conform to the current period presentation.
Information for periods beginning July 1, 2008 include the Countrywide acquisition. Information for the period beginning January 1, 2009 includes the
Merrill Lynch acquisition. Prior periods have not been restated.
| This information is preliminary and based on company data available at the time of the presentation. | 21 |
Bank of America Corporation and Subsidiaries
Off-Balance Sheet (Unconsolidated) Special Purpose Entities Liquidity Exposure
(Dollars in millions)
| March 31, 2009 | ||||||||||||
| VIEs (1) | QSPEs (2) | Total | ||||||||||
Commercial paper conduits: | ||||||||||||
Multi-seller conduits | $39,919 | $ — | $39,919 | |||||||||
Asset acquisition conduits | 1,312 | — | 1,312 | |||||||||
Other corporate conduits | — | 1,233 | 1,233 | |||||||||
Municipal bond trusts | 3,591 | 8,904 | 12,495 | |||||||||
Home equity securitizations | — | 12,791 | 12,791 | |||||||||
Collateralized debt obligation vehicles | 8,112 | — | 8,112 | |||||||||
Credit-linked note and other vehicles | 2,946 | — | 2,946 | |||||||||
Customer conduits | 1,482 | — | 1,482 | |||||||||
Credit card securitizations | — | 946 | 946 | |||||||||
Total liquidity exposure(3) | $57,362 | $23,874 | $81,236 | |||||||||
| December 31, 2008 | ||||||||||||
| VIEs (1) | QSPEs (2) | Total | ||||||||||
Commercial paper conduits: | ||||||||||||
Multi-seller conduits | $41,635 | $ — | $41,635 | |||||||||
Asset acquisition conduits | 2,622 | — | 2,622 | |||||||||
Other corporate conduits | — | 1,578 | 1,578 | |||||||||
Municipal bond trusts | 3,872 | 2,921 | 6,793 | |||||||||
Home equity securitizations | — | 13,064 | 13,064 | |||||||||
Collateralized debt obligation vehicles | 542 | — | 542 | |||||||||
Customer conduits | 980 | — | 980 | |||||||||
Credit card securitizations | — | 946 | 946 | |||||||||
Total liquidity exposure | $49,651 | $18,509 | $68,160 | |||||||||
| (1) | Variable interest entities (VIEs) are special purpose entities (SPEs) which lack sufficient equity at risk or whose equity investors do not have a controlling financial interest. In accordance with Financial Accounting Standards Board (FASB) Interpretation No. 46 (Revised December 2003), “Consolidation of Variable Interest Entities, an interpretation of ARB No. 51” (FIN 46R), a VIE is consolidated by the party known as the primary beneficiary that will absorb the majority of the expected losses or expected residual returns of the VIEs or both. For example, an entity that holds a majority of the subordinated debt or equity securities issued by a VIE, or protects other investors from loss through a guarantee or similar arrangement, may have to consolidate the VIE. The assets and liabilities of consolidated VIEs are recorded on the Corporation’s balance sheet. |
| (2) | Qualifying special purposes entities (QSPEs) are SPEs whose activities are strictly limited to holding and servicing financial assets and meet the requirements set forth in SFAS No. 140, “Accounting for Transfers and Servicing of Financial Assets and Extinguishments of Liabilities – a replacement of FASB Statement No. 125” (SFAS 140). QSPEs are generally not required to be consolidated by any party. This table includes only those QSPEs to which we have liquidity exposure. |
| (3) | Merrill Lynch related exposures as of March 31, 2009 were: $8.1 billion collateralized debt obligation vehicles, $6.6 billion municipal bond trusts, $2.9 billion in credit-linked note and other vehicles and $570 million in customer conduits. |
Certain prior period amounts have been reclassified to conform to current period presentation.
Information for periods beginning July 1, 2008 include the Countrywide acquisition. Information for the period beginning January 1, 2009 includes the
Merrill Lynch acquisition. Prior periods have not been restated.
| This information is preliminary and based on company data available at the time of the presentation. | 22 |
Bank of America Corporation and Subsidiaries
Super Senior Collateralized Debt Obligation Exposure Rollforward
(Dollars in millions)
| December 31, 2008 Net Exposure | Merrill Lynch Acquisition | Reclassifications (1) | First Quarter 2009 Net Writedowns (2) | Paydowns /Liquidations / Other | March 31, 2009 Net Exposure | |||||||||||
Super senior liquidity commitments | ||||||||||||||||
High grade | $ 476 | $ — | $(255 | ) | $— | $(221 | ) | $ — | ||||||||
Mezzanine | — | 626 | — | (36 | ) | (78 | ) | 512 | ||||||||
CDO-squared | — | — | — | — | — | — | ||||||||||
Total super senior liquidity commitments | 476 | 626 | (255 | ) | (36 | ) | (299 | ) | 512 | |||||||
Other super senior exposure | ||||||||||||||||
High grade(3) | 2,507 | (89 | ) | 255 | (228 | ) | (5 | ) | 2,440 | |||||||
Mezzanine | 297 | 126 | — | (56 | ) | (22 | ) | 345 | ||||||||
CDO-squared | — | 45 | — | (31 | ) | — | 14 | |||||||||
Total other super senior | 2,804 | 82 | 255 | (315 | ) | (27 | ) | 2,799 | ||||||||
Total super senior | $3,280 | $708 | $ — | $(351 | ) | $(326 | ) | $3,311 | ||||||||
Purchased securities from liquidated CDOs | 2,030 | — | — | (124 | ) | (82 | ) | 1,824 | ||||||||
Total | $5,310 | $708 | $ — | $(475 | ) | $(408 | ) | $5,135 | ||||||||
| (1) | Represents CDO exposure that was reclassified from super senior liquidity commitments to other super senior exposure as the Corporation is no longer providing liquidity. |
| (2) | Net of insurance and includes $159 million (pre-tax) of unrealized losses recorded in accumulated OCI. |
| (3) | High grade other super senior exposure acquired from Merrill Lynch is presented net of hedge amounts. |
Super Senior Collateralized Debt Obligation Exposure
(Dollars in millions)
| Total CDO Exposure at March 31, 2009 | Total CDO | |||||||||||||||||||||||||||||||||||||||
| Subprime Exposure(1) | Non-Subprime Exposure(2) | Net Exposure | ||||||||||||||||||||||||||||||||||||||
| Gross | Insured (3) | Net of Insured Amount | Cumulative Writedowns (4,5) | Net Exposure | Gross | Insured (3) | Net of Insured Amount | Cumulative Writedowns (4,5) | Net Exposure | March 31 2009 | December 31 2008 | |||||||||||||||||||||||||||||
Super senior liquidity commitments | ||||||||||||||||||||||||||||||||||||||||
High grade | $ | 1,698 | $ | (1,573 | ) | $ | 125 | $ | (125 | ) | $ | — | $ | — | $ | — | $ | — | $ | — | $ | — | $ | — | $ | 476 | ||||||||||||||
Mezzanine | 3,005 | (515 | ) | 2,490 | (1,978 | ) | 512 | — | — | — | — | — | 512 | — | ||||||||||||||||||||||||||
CDO-squared | — | — | — | — | — | — | — | — | — | — | — | — | ||||||||||||||||||||||||||||
Total super senior liquidity commitments | 4,703 | (2,088 | ) | 2,615 | (2,103 | ) | 512 | — | — | — | — | — | 512 | 476 | ||||||||||||||||||||||||||
Other super senior exposure | ||||||||||||||||||||||||||||||||||||||||
High grade | 6,843 | (5,634 | ) | 1,209 | (719 | ) | 490 | 3,726 | (712 | ) | 3,014 | (1,064 | ) | 1,950 | 2,440 | 2,507 | ||||||||||||||||||||||||
Mezzanine | 2,462 | — | 2,462 | (2,117 | ) | 345 | — | — | — | — | — | 345 | 297 | |||||||||||||||||||||||||||
CDO-squared | 409 | — | 409 | (395 | ) | 14 | 336 | (336 | ) | — | — | — | 14 | — | ||||||||||||||||||||||||||
Total other super senior | 9,714 | (5,634 | ) | 4,080 | (3,231 | ) | 849 | 4,062 | (1,048 | ) | 3,014 | (1,064 | ) | 1,950 | 2,799 | 2,804 | ||||||||||||||||||||||||
Total super senior | $ | 14,417 | $ | (7,722 | ) | $ | 6,695 | $ | (5,334 | ) | $ | 1,361 | $ | 4,062 | $ | (1,048 | ) | $ | 3,014 | $ | (1,064 | ) | $ | 1,950 | $ | 3,311 | $ | 3,280 | ||||||||||||
Purchased securities from liquidated CDOs | 2,656 | — | 2,656 | (832 | ) | 1,824 | — | — | — | — | — | 1,824 | 2,030 | |||||||||||||||||||||||||||
Total | $ | 17,073 | $ | (7,722 | ) | $ | 9,351 | $ | (6,166 | ) | $ | 3,185 | $ | 4,062 | $ | (1,048 | ) | $ | 3,014 | $ | (1,064 | ) | $ | 1,950 | $ | 5,135 | $ | 5,310 | ||||||||||||
| (1) | Classified as subprime when subprime consumer real estate loans make up at least 35 percent of the ultimate underlying collateral’s original net exposure value. |
| (2) | Includes highly-rated collateralized loan obligations and commercial mortgage-backed securities super senior exposure. |
| (3) | Insured exposures are presented prior to $6.7 billion of cumulative writedowns. |
| (4) | Net of insurance and excludes losses taken on liquidated CDOs. |
| (5) | Cumulative writedowns on subprime and non-subprime exposures include unrealized losses of $198 million and $382 million recorded in OCI . |
| Certain | prior period amounts have been reclassified to conform to current period presentation. |
Information for periods beginning July 1, 2008 include the Countrywide acquisition. Information for the period beginning January 1, 2009 includes the
Merrill Lynch acquisition. Prior periods have not been restated.
| This information is preliminary and based on company data available at the time of the presentation. | 23 |
Bank of America Corporation and Subsidiaries
Subprime Super Senior Collateralized Debt Obligation Carrying Values(1)
(Dollars in millions)
| March 31, 2009 | ||||||||||||||||||
| Subprime Net Exposure | Carrying Value as a Percent of Original Net Exposure | Subprime Content of Collateral (2) | Vintage of Subprime Collateral | |||||||||||||||
| Percent in 2006/2007 Vintages | Percent in 2005/Prior Vintages | |||||||||||||||||
| Super senior liquidity commitments | ||||||||||||||||||
Mezzanine | $ 512 | 22 | % | 100 | % | 98 | % | 2 | % | |||||||||
CDO-squared | — | — | — | — | — | |||||||||||||
Total super senior liquidity commitments | 512 | 22 | 100 | 98 | 2 | |||||||||||||
| Other super senior exposure | ||||||||||||||||||
High grade | 490 | 24 | 60 | 14 | 86 | |||||||||||||
Mezzanine | 345 | 14 | 51 | 42 | 58 | |||||||||||||
CDO-squared | 14 | 3 | 100 | 100 | — | |||||||||||||
Total other super senior | 849 | |||||||||||||||||
Total super senior | 1,361 | 20 | ||||||||||||||||
| Purchased securities from liquidated CDOs | 1,824 | 31 | 29 | 6 | 94 | |||||||||||||
Total | $3,185 | 25 | ||||||||||||||||
| (1) | Classified as subprime when subprime consumer real estate loans make up at least 35 percent of the ultimate underlying collateral’s original net exposure value. |
| (2) | Based on current net exposure value. |
Certain prior period amounts have been reclassified to conform to current period presentation.
Information for periods beginning July 1, 2008 include the Countrywide acquisition. Information for the period beginning January 1, 2009 includes the
Merrill Lynch acquisition. Prior periods have not been restated.
| This information is preliminary and based on company data available at the time of the presentation. | 24 |
Bank of America Corporation and Subsidiaries
Global Wealth Management Segment Results(1)
(Dollars in millions, except as noted)
| First Quarter 2009 | Fourth Quarter 2008 | Third Quarter 2008 | Second Quarter 2008 | First Quarter 2008 | |||||||||||||||||||||
Net interest income(2) | $ 1,653 | $ 1,343 | $ 1,265 | $ 1,149 | $ 1,018 | ||||||||||||||||||||
Noninterest income: | |||||||||||||||||||||||||
Investment and brokerage services | 2,444 | 880 | 1,002 | 1,095 | 1,081 | ||||||||||||||||||||
All other income (loss) | 264 | (238 | ) | (703 | ) | 50 | (157 | ) | |||||||||||||||||
Total noninterest income | 2,708 | 642 | 299 | 1,145 | 924 | ||||||||||||||||||||
Total revenue, net of interest expense | 4,361 | 1,985 | 1,564 | 2,294 | 1,942 | ||||||||||||||||||||
Provision for credit losses | 254 | 152 | 150 | 119 | 243 | ||||||||||||||||||||
Noninterest expense | 3,288 | 1,073 | 1,290 | 1,246 | 1,314 | ||||||||||||||||||||
Income before income taxes | 819 | 760 | 124 | 929 | 385 | ||||||||||||||||||||
Income tax expense(2) | 309 | 251 | 50 | 350 | 143 | ||||||||||||||||||||
Net income | $ 510 | $ 509 | $ 74 | $ 579 | $ 242 | ||||||||||||||||||||
Net interest yield(2) | 2.77 | % | 3.03 | % | 3.09 | % | 2.96 | % | 2.79 | % | |||||||||||||||
Return on average equity | 11.21 | 17.22 | 2.54 | 19.78 | 8.40 | ||||||||||||||||||||
Efficiency ratio(2) | 75.41 | 54.01 | 82.43 | 54.34 | 67.71 | ||||||||||||||||||||
| Balance sheet | |||||||||||||||||||||||||
| Average | |||||||||||||||||||||||||
Total loans and leases | $ 110,533 | $ 88,875 | $ 88,254 | $ 87,574 | $ 85,644 | ||||||||||||||||||||
Total earning assets(3) | 241,743 | 176,209 | 162,859 | 156,231 | 146,537 | ||||||||||||||||||||
Total assets(3) | 276,769 | 184,649 | 172,313 | 165,682 | 156,350 | ||||||||||||||||||||
Total deposits | 249,350 | 171,340 | 160,999 | 157,113 | 148,503 | ||||||||||||||||||||
Allocated equity | 18,450 | 11,767 | 11,677 | 11,774 | 11,570 | ||||||||||||||||||||
| Period end | |||||||||||||||||||||||||
Total loans and leases | $ 102,764 | $ 89,400 | $ 89,004 | $ 88,172 | $ 87,309 | ||||||||||||||||||||
Total earning assets(3) | 236,810 | 178,240 | 169,582 | 157,334 | 153,175 | ||||||||||||||||||||
Total assets(3) | 267,189 | 187,995 | 179,347 | 167,197 | 162,450 | ||||||||||||||||||||
Total deposits | 240,498 | 175,107 | 166,273 | 158,228 | 154,175 | ||||||||||||||||||||
| Client assets | |||||||||||||||||||||||||
Assets under management | $ 697,371 | $523,159 | $564,438 | $589,459 | $607,521 | ||||||||||||||||||||
Client brokerage assets(4) | 1,102,633 | 172,106 | 196,566 | 210,701 | 213,743 | ||||||||||||||||||||
Assets in custody | 234,361 | 133,726 | 150,575 | 156,530 | 158,486 | ||||||||||||||||||||
Less: Client brokerage assets and assets in custody included in assets under management | (279,130 | ) | (78,487 | ) | (82,921 | ) | (89,234 | ) | (88,755 | ) | |||||||||||||||
Total net client assets | $1,755,235 | $750,504 | $828,658 | $867,456 | $890,995 | ||||||||||||||||||||
| (1) | Global Wealth Management services clients through three primary businesses: U.S. Trust, Bank of America Private Wealth Management (U.S. Trust),ColumbiaManagement and Global Wealth Advisors. |
| (2) | Fully taxable-equivalent basis |
| (3) | Total earning assets and total assets include asset allocations to match liabilities (i.e., deposits). |
| (4) | Client brokerage assets include non-discretionary brokerage and fee-based assets. |
Certain prior period amounts have been reclassified among the segments to conform to the current period presentation.
Information for periods beginning July 1, 2008 include the Countrywide acquisition. Information for the period beginning January 1, 2009 includes the
Merrill Lynch acquisition. Prior periods have not been restated.
| This information is preliminary and based on company data available at the time of the presentation. | 25 |
Bank of America Corporation and Subsidiaries
Global Wealth Management Business Results
(Dollars in millions)
| Three Months Ended March 31, 2009 | ||||||||||||||||||||||
| Total | U.S. Trust | Columbia Management | Global Wealth Advisors (1) | Other | ||||||||||||||||||
Net interest income(2) | $ 1,653 | $ 360 | $ 17 | $ 1,398 | $(122 | ) | ||||||||||||||||
Noninterest income: | ||||||||||||||||||||||
Investment and brokerage services | 2,444 | 317 | 260 | 1,668 | 199 | |||||||||||||||||
All other income (loss) | 264 | 15 | (122 | ) | 282 | 89 | ||||||||||||||||
Total noninterest income | 2,708 | 332 | 138 | 1,950 | 288 | |||||||||||||||||
Total revenue, net of interest expense | 4,361 | 692 | 155 | 3,348 | 166 | |||||||||||||||||
Provision for credit losses | 254 | 31 | — | 223 | — | |||||||||||||||||
Noninterest expense | 3,288 | 510 | 234 | 2,228 | 316 | |||||||||||||||||
Income (loss) before income taxes | 819 | 151 | (79 | ) | 897 | (150 | ) | |||||||||||||||
Income tax expense (benefit) (2) | 309 | 56 | (29 | ) | 332 | (50 | ) | |||||||||||||||
Net income (loss) | $ 510 | $ 95 | $ (50 | ) | $ 565 | $(100 | ) | |||||||||||||||
Net interest yield(2) | 2.77 | % | 2.75 | % | n/m | 2.69 | % | n/m | ||||||||||||||
Return on average equity | 11.21 | 7.28 | (17.19 | ) | % | 26.96 | n/m | |||||||||||||||
Efficiency ratio(2) | 75.41 | 73.78 | n/m | 66.58 | n/m | |||||||||||||||||
Average - total loans and leases | $110,533 | $52,835 | n/m | $ 57,687 | n/m | |||||||||||||||||
Average - total deposits | 249,350 | 38,319 | n/m | 211,007 | n/m | |||||||||||||||||
Period end - total assets(3) | 267,189 | 56,493 | $2,642 | 214,376 | n/m | |||||||||||||||||
| Three Months Ended December 31, 2008 | ||||||||||||||||||||||
| Total | U.S. Trust | Columbia Management | Global Wealth Advisors(1) | Other | ||||||||||||||||||
Net interest income(2) | $ 1,343 | $ 446 | $ 14 | $ 869 | $ 14 | |||||||||||||||||
Noninterest income: | ||||||||||||||||||||||
Investment and brokerage services | 880 | 304 | 301 | 238 | 37 | |||||||||||||||||
All other income (loss) | (238 | ) | (5 | ) | (228 | ) | 1 | (6 | ) | |||||||||||||
Total noninterest income | 642 | 299 | 73 | 239 | 31 | |||||||||||||||||
Total revenue, net of interest expense | 1,985 | 745 | 87 | 1,108 | 45 | |||||||||||||||||
Provision for credit losses | 152 | 79 | — | 73 | — | |||||||||||||||||
Noninterest expense | 1,073 | 372 | 192 | 406 | 103 | |||||||||||||||||
Income (loss) before income taxes | 760 | 294 | (105 | ) | 629 | (58 | ) | |||||||||||||||
Income tax expense (benefit) (2) | 251 | 109 | (39 | ) | 233 | (52 | ) | |||||||||||||||
Net income (loss) | $ 509 | $ 185 | $ (66 | ) | $ 396 | $ (6 | ) | |||||||||||||||
Net interest yield(2) | 3.03 | % | 3.32 | % | n/m | 2.63 | % | n/m | ||||||||||||||
Return on average equity | 17.22 | 15.43 | (33.70 | ) | % | 83.18 | n/m | |||||||||||||||
Efficiency ratio(2) | 54.01 | 49.97 | n/m | 36.57 | n/m | |||||||||||||||||
Average - total loans and leases | $ 88,875 | $ 53,360 | n/m | $ 35,515 | n/m | |||||||||||||||||
Average - total deposits | 171,340 | 41,244 | n/m | 130,092 | n/m | |||||||||||||||||
Period end - total assets(3) | 187,995 | 57,167 | $2,923 | 136,105 | n/m | |||||||||||||||||
| Three Months Ended March 31, 2008 | ||||||||||||||||||||||
| Total | U.S. Trust | Columbia Management | Global Wealth Advisors (1) | Other | ||||||||||||||||||
Net interest income(2) | $ 1,018 | $ 321 | $ 2 | $ 677 | $ 18 | |||||||||||||||||
Noninterest income: | ||||||||||||||||||||||
Investment and brokerage services | 1,081 | 380 | 398 | 258 | 45 | |||||||||||||||||
All other income (loss) | (157 | ) | 18 | (221 | ) | 48 | (2 | ) | ||||||||||||||
Total noninterest income | 924 | 398 | 177 | 306 | 43 | |||||||||||||||||
Total revenue, net of interest expense | 1,942 | 719 | 179 | 983 | 61 | |||||||||||||||||
Provision for credit losses | 243 | 3 | — | 240 | — | |||||||||||||||||
Noninterest expense | 1,314 | 506 | 309 | 464 | 35 | |||||||||||||||||
Income (loss) before income taxes | 385 | 210 | (130 | ) | 279 | 26 | ||||||||||||||||
Income tax expense (benefit) (2) | 143 | 78 | (48 | ) | 103 | 10 | ||||||||||||||||
Net income (loss) | $ 242 | $ 132 | $ (82 | ) | $ 176 | $ 16 | ||||||||||||||||
Net interest yield(2) | 2.79 | % | 2.69 | % | n/m | 2.40 | % | n/m | ||||||||||||||
Return on average equity | 8.40 | 12.02 | (45.93 | ) | % | 36.06 | n/m | |||||||||||||||
Efficiency ratio(2) | 67.71 | 70.42 | n/m | 47.13 | n/m | |||||||||||||||||
Average - total loans and leases | $ 85,644 | $ 47,930 | n/m | $ 37,679 | n/m | |||||||||||||||||
Average - total deposits | 148,503 | 34,638 | n/m | 113,367 | n/m | |||||||||||||||||
Period end - total assets(3) | 162,450 | 52,731 | $ 2,989 | 120,956 | n/m | |||||||||||||||||
| (1) | For the three months ended March 31, 2009, December 31, 2008 and March 31, 2008, a total of $(6.1) billion, $4.5 billion and $7.0 billion of deposits were migrated to (from) Global Wealth Management from (to) Deposits. |
| (2) | Fully taxable-equivalent basis |
| (3) | Total assets include asset allocations to match liabilities (i.e., deposits). |
n/m = not meaningful
Certain prior period amounts have been reclassified among the segments to conform to the current period presentation.
Information for periods beginning July 1, 2008 include the Countrywide acquisition. Information for the period beginning January 1, 2009 includes the
Merrill Lynch acquisition. Prior periods have not been restated.
| This information is preliminary and based on company data available at the time of the presentation. | 26 |
Bank of America Corporation and Subsidiaries
Global Wealth Management - Key Indicators
(Dollars in millions, except as noted)
| First Quarter 2009 | Fourth Quarter 2008 | Third Quarter 2008 | Second Quarter 2008 | First Quarter 2008 | ||||||||||||||||||||||||||
Investment and Brokerage Services | ||||||||||||||||||||||||||||||
U.S. Trust | ||||||||||||||||||||||||||||||
Asset management fees | $ | 307 | $ | 292 | $ | 317 | $ | 375 | $ | 368 | ||||||||||||||||||||
Brokerage income | 10 | 12 | 11 | 13 | 12 | |||||||||||||||||||||||||
Total | $ | 317 | $ | 304 | $ | 328 | $ | 388 | $ | 380 | ||||||||||||||||||||
Columbia Management | ||||||||||||||||||||||||||||||
Asset management fees | $ | 260 | $ | 301 | $ | 394 | $ | 402 | $ | 397 | ||||||||||||||||||||
Brokerage income | — | — | — | 1 | 1 | |||||||||||||||||||||||||
Total | $ | 260 | $ | 301 | $ | 394 | $ | 403 | $ | 398 | ||||||||||||||||||||
Global Wealth Advisors | ||||||||||||||||||||||||||||||
Asset management fees | $ | 785 | $ | 75 | $ | 84 | $ | 84 | $ | 88 | ||||||||||||||||||||
Brokerage income | 883 | 163 | 157 | 179 | 170 | |||||||||||||||||||||||||
| �� | ||||||||||||||||||||||||||||||
Total | $ | 1,668 | $ | 238 | $ | 241 | $ | 263 | $ | 258 | ||||||||||||||||||||
Other | ||||||||||||||||||||||||||||||
Asset management fees | $ | 119 | $ | 37 | $ | 39 | $ | 41 | $ | 45 | ||||||||||||||||||||
Brokerage income | 80 | — | — | — | — | |||||||||||||||||||||||||
Total | $ | 199 | $ | 37 | $ | 39 | $ | 41 | $ | 45 | ||||||||||||||||||||
Total Global Wealth Management | ||||||||||||||||||||||||||||||
Asset management fees | $ | 1,471 | $ | 705 | $ | 834 | $ | 902 | $ | 898 | ||||||||||||||||||||
Brokerage income | 973 | 175 | 168 | 193 | 183 | |||||||||||||||||||||||||
Total investment and brokerage services | $ | 2,444 | $ | 880 | $ | 1,002 | $ | 1,095 | $ | 1,081 | ||||||||||||||||||||
Assets Under Management | ||||||||||||||||||||||||||||||
Assets under management by business: | ||||||||||||||||||||||||||||||
U.S. Trust | $ | 179,142 | $ | 178,657 | $ | 199,682 | $ | 210,969 | $ | 214,526 | ||||||||||||||||||||
Columbia Management | 340,692 | 386,473 | 407,345 | 422,827 | 409,064 | |||||||||||||||||||||||||
Institutional Retirement and Philanthropy | 45,304 | 33,498 | 39,547 | 45,907 | 48,655 | |||||||||||||||||||||||||
Global Wealth Advisors | 219,658 | 16,682 | 20,246 | 22,404 | 21,600 | |||||||||||||||||||||||||
Eliminations(1) | (87,550 | ) | (92,298 | ) | (102,621 | ) | (113,001 | ) | (86,760 | ) | ||||||||||||||||||||
International Wealth Management | 125 | 147 | 239 | 353 | 436 | |||||||||||||||||||||||||
Total assets under management | $ | 697,371 | $ | 523,159 | $ | 564,438 | $ | 589,459 | $ | 607,521 | ||||||||||||||||||||
Assets under management rollforward: | ||||||||||||||||||||||||||||||
Beginning balance | $ | 523,159 | $ | 564,438 | $ | 589,459 | $ | 607,521 | $ | 643,531 | ||||||||||||||||||||
Merrill Lynch balance, January 1, 2009 | 246,292 | — | — | — | — | |||||||||||||||||||||||||
Net flows | (43,235 | ) | 12,596 | 7,477 | (12,611 | ) | (6,265 | ) | ||||||||||||||||||||||
Market valuation/other | (28,845 | ) | (53,875 | ) | (32,498 | ) | (5,451 | ) | (29,745 | ) | ||||||||||||||||||||
Ending balance | $ | 697,371 | $ | 523,159 | $ | 564,438 | $ | 589,459 | $ | 607,521 | ||||||||||||||||||||
Assets under management mix: | ||||||||||||||||||||||||||||||
Money market/other | $ | 244,577 | $ | 253,310 | $ | 238,075 | $ | 225,887 | $ | 242,956 | ||||||||||||||||||||
Fixed income | 198,177 | 102,747 | 102,596 | 107,687 | 107,365 | |||||||||||||||||||||||||
Equity | 254,617 | 167,102 | 223,767 | 255,885 | 257,200 | |||||||||||||||||||||||||
Total assets under management | $ | 697,371 | $ | 523,159 | $ | 564,438 | $ | 589,459 | $ | 607,521 | ||||||||||||||||||||
Assets under management - domestic and foreign: | ||||||||||||||||||||||||||||||
Domestic | $ | 679,927 | $ | 523,012 | $ | 564,199 | $ | 589,106 | $ | 607,085 | ||||||||||||||||||||
Foreign | 17,444 | 147 | 239 | 353 | 436 | |||||||||||||||||||||||||
Total assets under management | $ | 697,371 | $ | 523,159 | $ | 564,438 | $ | 589,459 | $ | 607,521 | ||||||||||||||||||||
Client Brokerage Assets(2) | $ | 1,102,633 | $ | 172,106 | $ | 196,566 | $ | 210,701 | $ | 213,743 | ||||||||||||||||||||
Global Wealth Advisors Metrics | ||||||||||||||||||||||||||||||
Number of financial advisors | 15,822 | 2,007 | 1,964 | 1,974 | 1,952 | |||||||||||||||||||||||||
Financial Advisor Productivity(3) (in thousands) | $ | 808 | $ | 1,548 | $ | 1,464 | $ | 1,752 | $ | 1,724 | ||||||||||||||||||||
Total client balances(4) | $ | 1,292,965 | $ | 290,661 | $ | 301,093 | $ | 308,174 | $ | 309,687 | ||||||||||||||||||||
U.S. Trust Metrics | ||||||||||||||||||||||||||||||
Client facing associates | 3,954 | 3,733 | 3,751 | 3,882 | 3,922 | |||||||||||||||||||||||||
Total client balances(4) | $ | 301,151 | $ | 308,366 | $ | 344,004 | $ | 357,575 | $ | 362,425 | ||||||||||||||||||||
Columbia Management Performance Metrics | ||||||||||||||||||||||||||||||
# of 4 or 5 Star Funds by Morningstar | 49 | 53 | 53 | 50 | 50 | |||||||||||||||||||||||||
% of Assets Under Management in 4 or 5 Star Rated Funds(5) | 49 | % | 62 | % | 64 | % | 64 | % | 69 | % | ||||||||||||||||||||
| (1) | The elimination of assets under management that are managed by two lines of business. |
| (2) | The January 1, 2009 acquisition of Merrill Lynch contributed $1.0 trillion to client brokerage assets. |
| (3) | Financial advisor productivity is defined as annualized total revenue (excluding residual net interest income) divided by the total number of financial advisors. |
The decline in Financial Advisor productivity in the first quarter 2009 compared to previous quarters results from the inclusion of Merrill Lynch financial advisors. Legacy Bank of America financial advisors historically have had higher amounts of credit and banking activity in their portfolios.
| (4) | Client balances are defined as deposits, assets under management, client brokerage assets and other assets in custody. |
| (5) | Results shown are defined by Columbia Management’s calculation using Morningstar’s Overall Rating criteria for 4 & 5 star rating. The assets under management of the Columbia Funds that had a 4 & 5 star rating were totaled then divided by the assets under management of all the funds in the ranking. |
Certain prior period amounts have been reclassified among the segments to conform to the current period presentation.
Information for periods beginning July 1, 2008 include the Countrywide acquisition. Information for the period beginning January 1, 2009 includes the
Merrill Lynch acquisition. Prior periods have not been restated.
| This information is preliminary and based on company data available at the time of the presentation. | 27 |
Bank of America Corporation and Subsidiaries
All Other Results(1, 2)
(Dollars in millions)
| First Quarter 2009 | Fourth Quarter 2008 | Third Quarter 2008 | Second Quarter 2008 | First Quarter 2008 | ||||||||||||||||
Net interest income(3) | $ | (1,780 | ) | $ | (1,859 | ) | $ | (2,328 | ) | $ | (1,914 | ) | $ | (1,856 | ) | |||||
Noninterest income: | ||||||||||||||||||||
Card income | 534 | 368 | 538 | 596 | 663 | |||||||||||||||
Equity investment income (loss) | 1,326 | (387 | ) | (326 | ) | 710 | 268 | |||||||||||||
Gains (losses) on sales of debt securities | 1,471 | 783 | (3 | ) | 131 | 220 | ||||||||||||||
All other income (loss) | 2,591 | (283 | ) | 112 | (86 | ) | (264 | ) | ||||||||||||
Total noninterest income | 5,922 | 481 | 321 | 1,351 | 887 | |||||||||||||||
Total revenue, net of interest expense | 4,142 | (1,378 | ) | (2,007 | ) | (563 | ) | (969 | ) | |||||||||||
Provision for credit losses(4) | (677 | ) | (613 | ) | (996 | ) | (1,033 | ) | (1,128 | ) | ||||||||||
Merger and restructuring charges | 765 | 306 | 247 | 212 | 170 | |||||||||||||||
All other noninterest expense | 291 | 184 | (27 | ) | 71 | 176 | ||||||||||||||
Income (loss) before income taxes | 3,763 | (1,255 | ) | (1,231 | ) | 187 | (187 | ) | ||||||||||||
Income tax expense (benefit)(3) | 792 | (738 | ) | (539 | ) | (42 | ) | 49 | ||||||||||||
Net income (loss) | $ | 2,971 | $ | (517 | ) | $ | (692 | ) | $ | 229 | $ | (236 | ) | |||||||
Balance sheet | ||||||||||||||||||||
Average | ||||||||||||||||||||
Total loans and leases | $ | 168,450 | $ | 145,237 | $ | 146,303 | $ | 117,503 | $ | 133,883 | ||||||||||
Total deposits | 109,890 | 111,822 | 105,369 | 96,999 | 113,219 | |||||||||||||||
Period end | ||||||||||||||||||||
Total loans and leases | $ | 164,638 | $ | 136,160 | $ | 146,364 | $ | 95,825 | $ | 127,185 | ||||||||||
Total deposits | 94,708 | 87,520 | 99,914 | 93,418 | 101,486 | |||||||||||||||
| (1) | All Other consists of equity investment activities including Global Principal Investments, Corporate Investments and Strategic Investments, the residential mortgage portfolio associated with ALM activities, the residual impact of cost allocation processes, merger and restructuring charges, intersegment eliminations and the results of certain businesses that are expected to be or have been sold or are in the process of being liquidated. All Other also includes certain amounts associated with ALM activities, including the residual impact of funds transfer pricing allocation methodologies, amounts associated with the change in the value of derivatives used as economic hedges of interest rate and foreign exchange rate fluctuations that do not qualify for SFAS No. 133 “Accounting for Derivative instruments and Hedging Activities, as amended” hedge accounting treatment, foreign exchange rate fluctuations related to SFAS No. 52, “Foreign Currency Translation” revaluation of foreign-denominated debt issuances, certain gains (losses) on sales of whole mortgage loans, and gains (losses) on sales of debt securities. All Other also includes adjustments to noninterest income and income tax expense to remove the FTE impact of items (primarily low-income housing tax credits) that have been grossed up within noninterest income to a FTE amount in the business segments. In addition, All Other includes the offsetting securitization impact to present Global Card Services on a managed basis. (See Exhibit A: Non-GAAP Reconciliations - All Other - Reconciliation on page 39). |
| (2) | Effective January 1, 2009, as part of the Merrill Lynch acquisition, All Other includes the results of First Republic Bank as well as fair value adjustments related to certain Merrill Lynch structured notes. |
| (3) | Fully taxable-equivalent basis |
| (4) | Provision for credit losses represents provision for credit losses in All Other combined with the Global Card Services securitization offset. |
Certain prior period amounts have been reclassified among the segments to conform to the current period presentation.
Information for periods beginning July 1, 2008 include the Countrywide acquisition. Information for the period beginning January 1, 2009 includes the
Merrill Lynch acquisition. Prior periods have not been restated.
| This information is preliminary and based on company data available at the time of the presentation. | 28 |
Bank of America Corporation and Subsidiaries
Equity Investments
(Dollars in millions)
| Global Principal Investments Exposures | Equity Investment Gains / (Losses) | ||||||||||
| March 31, 2009 | December 31, 2008 | ||||||||||
| Book Value | Unfunded Commitments | Total | Total | First Quarter 2009 | |||||||
Global Principal Investments: | |||||||||||
Legacy BAC Global Principal Investments | |||||||||||
Direct Investments | $ 1,875 | $ 89 | $ 1,964 | $2,029 | $ (50 | ) | |||||
Funds Investments | 1,817 | 1,440 | 3,257 | 3,362 | (66 | ) | |||||
Total Legacy BAC | 3,692 | 1,529 | 5,221 | 5,391 | (116 | ) | |||||
Legacy ML Global Principal Investments | |||||||||||
Global Private Equity | 3,051 | 488 | 3,539 | n/a | (341 | ) | |||||
Global Real Estate | 2,397 | 388 | 2,785 | n/a | (33 | ) | |||||
Alternative Investments | 1,331 | 124 | 1,455 | n/a | 19 | ||||||
Other GPI | 640 | 289 | 929 | n/a | 5 | ||||||
Total Legacy ML | 7,419 | 1,289 | 8,708 | n/a | (350 | ) | |||||
Total Global Principal Investments | $11,111 | $2,818 | $13,929 | $5,391 | $ (466 | ) | |||||
n/a = not applicable
Components of Equity Investment Income (Loss)
(Dollars in millions)
| First Quarter 2009 | Fourth Quarter 2008 | Third Quarter 2008 | Second Quarter 2008 | First Quarter 2008 | ||||||||||
Global Principal Investments | $ (466 | ) | $(363 | ) | $ (29 | ) | $296 | $ 12 | ||||||
Corporate Investments | (272 | ) | (295 | ) | (369 | ) | 112 | 32 | ||||||
Strategic and other investments(1) | 2,064 | 271 | 72 | 302 | 224 | |||||||||
Total equity investment income (loss) included in All Other | 1,326 | (387 | ) | (326 | ) | 710 | 268 | |||||||
Total equity investment income (loss) included in the business segments | (124 | ) | (404 | ) | 10 | (118 | ) | 786 | ||||||
Total consolidated equity investment income (loss) | $1,202 | $(791 | ) | $(316) | $592 | $1,054 | ||||||||
| (1) | First quarter 2009 includes a $1.9 billion pre-tax gain on the sale of shares of China Construction Bank. |
Certain prior period amounts have been reclassified among the segments to conform to the current period presentation.
Information for periods beginning July 1, 2008 include the Countrywide acquisition. Information for the period beginning January 1, 2009 includes the
Merrill Lynch acquisition. Prior periods have not been restated.
| This information is preliminary and based on company data available at the time of the presentation. | 29 |
Bank of America Corporation and Subsidiaries
Outstanding Loans and Leases
(Dollars in millions)
| March 31 2009 | December 31 2008 | Increase (Decrease) | |||||
Consumer | |||||||
Residential mortgage | $261,583 | $248,063 | $13,520 | ||||
Home equity | 157,645 | 152,483 | 5,162 | ||||
Discontinued real estate(1) | 19,000 | 19,981 | (981 | ) | |||
Credit card - domestic | 51,309 | 64,128 | (12,819 | ) | |||
Credit card - foreign | 16,651 | 17,146 | (495 | ) | |||
Direct/Indirect consumer (2) | 99,696 | 83,436 | 16,260 | ||||
Other consumer(3) | 3,297 | 3,442 | (145 | ) | |||
Total consumer | 609,181 | 588,679 | 20,502 | ||||
Commercial | |||||||
Commercial - domestic(4) | 229,779 | 219,233 | 10,546 | ||||
Commercial real estate(5) | 75,269 | 64,701 | 10,568 | ||||
Commercial lease financing | 22,017 | 22,400 | (383 | ) | |||
Commercial - foreign | 33,407 | 31,020 | 2,387 | ||||
Total commercial loans | 360,472 | 337,354 | 23,118 | ||||
Commercial loans measured at fair value(6) | 7,355 | 5,413 | 1,942 | ||||
Total commercial | 367,827 | 342,767 | 25,060 | ||||
Total loans and leases | $977,008 | $931,446 | $45,562 | ||||
| (1) | At March 31, 2009 and December 31, 2008, includes $17.3 billion and $18.2 billion of pay option loans, and $1.7 billion and $1.8 billion of subprime loans obtained as part of the acquisition of Countrywide. The Corporation no longer originates these products. |
| (2) | Includes foreign consumer loans of $1.6 billion and $1.8 billion at March 31, 2009 and December 31, 2008. |
| (3) | Includes consumer finance loans of $2.5 billion and $2.6 billion, and other foreign consumer loans of $618 million and $618 million at March 31, 2009 and December 31, 2008. |
| (4) | Includes small business commercial - domestic loans, primarily card related, of $18.8 billion and $19.1 billion at March 31, 2009 and December 31, 2008. |
| (5) | Includes domestic commercial real estate loans of $73.0 billion and $63.7 billion, and foreign commercial real estate loans of $2.2 billion and $979 million at March 31, 2009 and December 31, 2008. |
| (6) | Certain commercial loans are measured at fair value in accordance with SFAS 159 and include commercial - domestic loans of $4.8 billion and $3.5 billion, commercial - foreign loans of $2.5 billion and $1.7 billion, and commercial real estate loans of $89 million and $203 million at March 31, 2009 and December 31, 2008. |
Certain prior period amounts have been reclassified to conform to current period presentation.
Information for periods beginning July 1, 2008 include the Countrywide acquisition. Information for the period beginning January 1, 2009 includes the
Merrill Lynch acquisition. Prior periods have not been restated.
| This information is preliminary and based on company data available at the time of the presentation. | 30 |
Bank of America Corporation and Subsidiaries
Quarterly Average Loans and Leases by Business Segment
(Dollars in millions)
| First Quarter 2009 | |||||||||||||||||||
| Total Corporation | Deposits | Global Card Services (1) | Home Loans & Insurance | Global Markets | Global Banking | Global Wealth Management | All Other (1) | ||||||||||||
Consumer | |||||||||||||||||||
Residential mortgage | $ 265,121 | $ — | $ — | $ 485 | $ 546 | $ 455 | $ 38,780 | $ 224,855 | |||||||||||
Home equity | 158,575 | — | — | 123,999 | — | 1,061 | 26,581 | 6,934 | |||||||||||
Discontinued real estate | 19,386 | — | — | — | — | — | — | 19,386 | |||||||||||
Credit card - domestic | 58,960 | — | 150,820 | — | — | — | — | (91,860 | ) | ||||||||||
Credit card - foreign | 16,858 | — | 27,670 | — | — | — | — | (10,812 | ) | ||||||||||
Direct/Indirect consumer | 100,741 | 9,718 | 29,272 | 104 | 130 | 41,201 | 20,359 | (43 | ) | ||||||||||
Other consumer | 3,408 | 356 | 578 | 579 | 2 | 20 | 55 | 1,818 | |||||||||||
Total consumer | 623,049 | 10,074 | 208,340 | 125,167 | 678 | 42,737 | 85,775 | 150,278 | |||||||||||
Commercial | |||||||||||||||||||
Commercial - domestic | 240,683 | 4,300 | 14,720 | 1,517 | 10,031 | 174,732 | 22,547 | 12,836 | |||||||||||
Commercial real estate | 72,206 | 80 | 125 | 12 | 1,050 | 62,532 | 2,144 | 6,263 | |||||||||||
Commercial lease financing | 22,056 | — | — | — | — | 24,316 | — | (2,260 | ) | ||||||||||
Commercial - foreign | 36,127 | — | 1,221 | — | 6,851 | 26,655 | 67 | 1,333 | |||||||||||
Total commercial | 371,072 | 4,380 | 16,066 | 1,529 | 17,932 | 288,235 | 24,758 | 18,172 | |||||||||||
Total loans and leases | $994,121 | $14,454 | $224,406 | $126,696 | $18,610 | $330,972 | $110,533 | $168,450 | |||||||||||
| Fourth Quarter 2008 | |||||||||||||||||||
| Total Corporation | Deposits | Global Card Services (1) | Home Loans & Insurance | Global Markets | Global Banking | Global Wealth Management | All Other (1) | ||||||||||||
Consumer | |||||||||||||||||||
Residential mortgage | $ 253,560 | $ — | $ — | $ 116 | $ — | $ 519 | $ 35,278 | $ 217,647 | |||||||||||
Home equity | 151,943 | — | — | 121,033 | — | 919 | 24,621 | 5,370 | |||||||||||
Discontinued real estate | 21,324 | — | — | — | — | — | — | 21,324 | |||||||||||
Credit card - domestic | 64,906 | — | 152,175 | — | — | — | — | (87,269 | ) | ||||||||||
Credit card - foreign | 17,211 | — | 29,058 | — | — | — | — | (11,847 | ) | ||||||||||
Direct/Indirect consumer | 83,331 | 8,368 | 30,642 | 106 | — | 40,144 | 4,647 | (576 | ) | ||||||||||
Other consumer | 3,544 | 227 | 647 | 70 | 2 | 8 | 17 | 2,573 | |||||||||||
Total consumer | 595,819 | 8,595 | 212,522 | 121,325 | 2 | 41,590 | 64,563 | 147,222 | |||||||||||
Commercial | |||||||||||||||||||
Commercial - domestic | 226,095 | 4,797 | 14,519 | 731 | 8,254 | 175,260 | 22,371 | 163 | |||||||||||
Commercial real estate | 64,586 | 129 | 112 | 18 | 1,016 | 61,395 | 1,873 | 43 | |||||||||||
Commercial lease financing | 22,069 | — | — | — | — | 24,324 | — | (2,255 | ) | ||||||||||
Commercial - foreign | 32,994 | — | 1,366 | — | 2,950 | 28,546 | 68 | 64 | |||||||||||
Total commercial | 345,744 | 4,926 | 15,997 | 749 | 12,220 | 289,525 | 24,312 | (1,985 | ) | ||||||||||
Total loans and leases | $941,563 | $13,521 | $228,519 | $122,074 | $12,222 | $331,115 | $88,875 | $145,237 | |||||||||||
| First Quarter 2008 | |||||||||||||||||||
| Total Corporation | Deposits | Global Card Services (1) | Home Loans & Insurance | Global Markets | Global Banking | Global Wealth Management | All Other (1) | ||||||||||||
Consumer | |||||||||||||||||||
Residential mortgage | $ 270,541 | $ — | $ — | $ — | $ — | $ 981 | $ 34,338 | $ 235,222 | |||||||||||
Home equity | 116,562 | — | — | 86,853 | — | 898 | 24,126 | 4,685 | |||||||||||
Discontinued real estate | n/a | n/a | n/a | n/a | n/a | n/a | n/a | n/a | |||||||||||
Credit card - domestic | 63,277 | — | 151,829 | — | — | — | — | (88,552 | ) | ||||||||||
Credit card - foreign | 15,241 | — | 31,865 | — | — | — | — | (16,624 | ) | ||||||||||
Direct/Indirect consumer | 78,705 | 7,103 | 28,722 | 174 | — | 38,764 | 5,235 | (1,293 | ) | ||||||||||
Other consumer | 4,049 | 218 | 842 | 2 | 3 | 14 | 25 | 2,945 | |||||||||||
Total consumer | 548,375 | 7,321 | 213,258 | 87,029 | 3 | 40,657 | 63,724 | 136,383 | |||||||||||
Commercial | |||||||||||||||||||
Commercial - domestic | 212,394 | 5,344 | 14,339 | 5 | 16,828 | 156,009 | 20,442 | (573 | ) | ||||||||||
Commercial real estate | 62,202 | 233 | 70 | 204 | 1,042 | 59,292 | 1,397 | (36 | ) | ||||||||||
Commercial lease financing | 22,227 | — | — | — | 87 | 24,264 | — | (2,124 | ) | ||||||||||
Commercial - foreign | 30,463 | — | 1,480 | — | 2,967 | 25,702 | 81 | 233 | |||||||||||
Total commercial | 327,286 | 5,577 | 15,889 | 209 | 20,924 | 265,267 | 21,920 | (2,500 | ) | ||||||||||
Total loans and leases | $875,661 | $12,898 | $229,147 | $87,238 | $20,927 | $305,924 | $85,644 | $133,883 | |||||||||||
| (1) | Global Card Services is presented on a managed basis with a corresponding offset recorded in All Other. |
n/a = not applicable
Certain prior period amounts have been reclassified among the segments to conform to the current period presentation.
Information for periods beginning July 1, 2008 include the Countrywide acquisition. Information for the period beginning January 1, 2009 includes the
Merrill Lynch acquisition. Prior periods have not been restated.
| This information is preliminary and based on company data available at the time of the presentation. | 31 |
Bank of America Corporation and Subsidiaries
Commercial Credit Exposure by Industry(1, 2, 3, 4)
(Dollars in millions)
| Commercial Utilized | Total Commercial Committed | |||||||||||||
| March 31 2009 | December 31 2008 | Increase (Decrease) | March 31 2009 | December 31 2008 | Increase (Decrease) | |||||||||
Diversified financials | $ 88,675 | $ 50,327 | $ 38,348 | $ 142,112 | $103,306 | $ 38,806 | ||||||||
Real estate (5) | 86,365 | 79,766 | 6,599 | 108,562 | 103,889 | 4,673 | ||||||||
Government and public education | 46,149 | 39,386 | 6,763 | 65,806 | 58,608 | 7,198 | ||||||||
Capital goods | 29,795 | 27,588 | 2,207 | 55,935 | 52,522 | 3,413 | ||||||||
Healthcare equipment and services | 33,575 | 31,280 | 2,295 | 49,540 | 46,785 | 2,755 | ||||||||
Retailing | 28,506 | 30,736 | (2,230 | ) | 47,429 | 50,102 | (2,673 | ) | ||||||
Consumer services | 29,576 | 28,715 | 861 | 44,679 | 43,948 | 731 | ||||||||
Materials | 23,515 | 22,825 | 690 | 40,113 | 38,105 | 2,008 | ||||||||
Insurance | 32,385 | 11,223 | 21,162 | 40,032 | 17,855 | 22,177 | ||||||||
Commercial services and supplies | 27,058 | 24,095 | 2,963 | 38,655 | 34,867 | 3,788 | ||||||||
Banks | 32,408 | 22,134 | 10,274 | 36,277 | 26,493 | 9,784 | ||||||||
Individuals and trusts | 24,921 | 22,752 | 2,169 | 33,861 | 33,045 | 816 | ||||||||
Food, beverage and tobacco | 16,902 | 17,257 | (355 | ) | 29,789 | 28,521 | 1,268 | |||||||
Utilities | 12,117 | 8,230 | 3,887 | 27,898 | 19,272 | 8,626 | ||||||||
Energy | 14,006 | 11,885 | 2,121 | 26,504 | 22,732 | 3,772 | ||||||||
Transportation | 14,283 | 13,050 | 1,233 | 20,681 | 18,561 | 2,120 | ||||||||
Media | 9,196 | 8,939 | 257 | 20,125 | 19,301 | 824 | ||||||||
Telecommunication services | 9,047 | 3,681 | 5,366 | 15,410 | 8,036 | 7,374 | ||||||||
Religious and social organizations | 9,844 | 9,539 | 305 | 12,932 | 12,576 | 356 | ||||||||
Pharmaceuticals and biotechnology | 3,402 | 3,721 | (319 | ) | 11,264 | 10,111 | 1,153 | |||||||
Technology hardware and equipment | 3,770 | 3,971 | (201 | ) | 10,684 | 10,371 | 313 | |||||||
Consumer durables and apparel | 6,135 | 6,219 | (84 | ) | 10,661 | 10,862 | (201 | ) | ||||||
Software and services | 4,429 | 4,093 | 336 | 10,144 | 9,590 | 554 | ||||||||
Food and staples retailing | 4,361 | 4,282 | 79 | 7,380 | 7,012 | 368 | ||||||||
Automobiles and components | 3,314 | 3,093 | 221 | 6,235 | 6,081 | 154 | ||||||||
Household and personal products | 1,022 | 1,137 | (115 | ) | 3,898 | 2,817 | 1,081 | |||||||
Semiconductors and semiconductor equipment | 1,019 | 1,105 | (86 | ) | 1,718 | 1,822 | (104 | ) | ||||||
Other | 4,030 | 7,720 | (3,690 | ) | 6,538 | 8,142 | (1,604 | ) | ||||||
Total commercial credit exposure by industry | $599,805 | $498,749 | $101,056 | $ 924,862 | $805,332 | $119,530 | ||||||||
Net credit default protection purchased on total commitments(6) | $(22,674) | $ (9,654) | ||||||||||||
| (1) | Includes loans and leases, standby letters of credit and financial guarantees, derivative assets, assets held-for-sale, commercial letters of credit, bankers’ acceptances, securitized assets, foreclosed properties and other collateral acquired. Derivative assets are reported on a mark-to-market basis and have been reduced by the amount of cash collateral applied of $72.8 billion and $34.8 billion at March 31, 2009 and December 31, 2008. In addition to cash collateral, derivative assets are also collateralized by $12.9 billion and $7.7 billion of primarily other marketable securities at March 31, 2009 and December 31, 2008 for which the credit risk has not been reduced. |
| (2) | Total commercial utilized and total commercial committed exposure includes loans and letters of credit measured at fair value in accordance with SFAS 159 and are comprised of loans outstanding of $7.4 billion and $5.4 billion at March 31, 2009 and December 31, 2008 and issued letters of credit at notional value of $2.2 billion and $1.4 billion for the same periods. In addition, total commercial committed exposure includes unfunded loan commitments at notional value of $25.2 billion and $15.5 billion at March 31, 2009 and December 31, 2008. |
| (3) | Includes small business commercial - domestic exposure. |
| (4) | At March 31, 2009, total commercial utilized and total commercial committed exposure include $128.0 billion and $165.1 billion of exposure related to Merrill Lynch which included $48.3 billion and $56.0 billion in Diversified Financials and $21.7 billion and $23.2 billion in Insurance with the remaining exposure spread across various industries. |
| (5) | Industries are viewed from a variety of perspectives to best isolate the perceived risks. For purposes of this table, the real estate industry is defined based upon the borrowers’ or counterparties’ primary business activity using operating cash flow and primary source of repayment as key factors. |
| (6) | Represents net notional credit protection purchased. At March 31, 2009, includes $(12.9) billion in single name credit default swaps that were acquired as part of the Merrill Lynch acquisition. |
Certain prior period amounts have been reclassified to conform to current period presentation.
Information for periods beginning July 1, 2008 include the Countrywide acquisition. Information for the period beginning January 1, 2009 includes the
Merrill Lynch acquisition. Prior periods have not been restated.
| This information is preliminary and based on company data available at the time of the presentation. | 32 |
Bank of America Corporation and Subsidiaries
Net Credit Default Protection by Maturity Profile (1)
| March 31 2009 | December 31 2008 | |||||||
Less than or equal to one year | 10 | % | 1 | % | ||||
Greater than one year and less than or equal to five years | 90 | 92 | ||||||
Greater than five years | — | 7 | ||||||
Total net credit default protection | 100 | % | 100 | % |
| (1) | In order to mitigate the cost of purchasing credit protection, credit exposure can be added by selling credit protection. The distribution of maturities for net credit default protection purchased is shown above. |
Net Credit Default Protection by Credit Exposure Debt Rating(1)
(Dollars in millions)
| March 31, 2009 | December 31, 2008 | |||||||||||||||
| Ratings(2) | Net Notional | Percent | Net Notional | Percent | ||||||||||||
AAA | $ 30 | (0.1 | ) | % | $ 30 | (0.3 | ) | % | ||||||||
AA | (1,498 | ) | 6.6 | (103 | ) | 1.1 | ||||||||||
A | (6,871 | ) | 30.3 | (2,800 | ) | 29.0 | ||||||||||
BBB | (11,211 | ) | 49.3 | (4,856 | ) | 50.2 | ||||||||||
BB | (2,826 | ) | 12.5 | (1,948 | ) | 20.2 | ||||||||||
B | (968 | ) | 4.3 | (579 | ) | 6.0 | ||||||||||
CCC and below | (1,805 | ) | 8.0 | (278 | ) | 2.9 | ||||||||||
NR(3) | 2,475 | (10.9 | ) | 880 | (9.1 | ) | ||||||||||
Total net credit default protection(4) | $(22,674 | ) | 100.0 | % | $(9,654 | ) | 100.0 | % | ||||||||
| (1) | In order to mitigate the cost of purchasing credit protection, credit exposure can be added by selling credit protection. The distribution of debt rating for net notional credit default protection purchased is shown as a negative and the net notional credit protection sold is shown as a positive amount. |
| (2) | The Corporation considers ratings of BBB- or higher to meet the definition of investment grade. |
| (3) | In addition to unrated names, “NR” includes $2.6 billion and $948 million in net credit default swap index positions at March 31, 2009 and at December 31, 2008. While index positions are principally investment grade, credit default swaps indices include names in and across each of the ratings categories. |
| (4) | At March 31, 2009, includes $(12.9) billion in single name credit default swaps that were acquired as part of the Merrill Lynch acquisition. |
Certain prior period amounts have been reclassified to conform to current period presentation.
Information for periods beginning July 1, 2008 include the Countrywide acquisition. Information for the period beginning January 1, 2009 includes the
Merrill Lynch acquisition. Prior periods have not been restated.
| This information is preliminary and based on company data available at the time of the presentation. | 33 |
Bank of America Corporation and Subsidiaries
Selected Emerging Markets(1)
(Dollars in millions)
| Loans and Leases, and Loan Commitments | Other Financing (2) | Derivative Assets(3) | Securities/ Other Investments (4) | Total Cross-border Exposure (5) | Local Country Exposure Net of Local Liabilities(6) | Total Emerging Markets Exposure March 31, 2009 | Increase (Decrease) from December 31, 2008 | ||||||||||
Region/Country | |||||||||||||||||
Asia Pacific | |||||||||||||||||
China(7) | $ 534 | $ 182 | $ 884 | $18,080 | $19,680 | $ — | $19,680 | $ (1,025 | ) | ||||||||
South Korea | 495 | 1,229 | 3,217 | 2,466 | 7,407 | 106 | 7,513 | 2,837 | |||||||||
India | 1,411 | 595 | 1,193 | 2,275 | 5,474 | 443 | 5,917 | 1,483 | |||||||||
Singapore | 645 | 271 | 628 | 367 | 1,911 | — | 1,911 | 342 | |||||||||
Hong Kong | 540 | 410 | 235 | 347 | 1,532 | — | 1,532 | 851 | |||||||||
Taiwan | 258 | 19 | 127 | 202 | 606 | 335 | 941 | 99 | |||||||||
Other Asia Pacific (8) | 282 | 84 | 79 | 908 | 1,353 | 37 | 1,390 | 785 | |||||||||
Total Asia Pacific | 4,165 | 2,790 | 6,363 | 24,645 | 37,963 | 921 | 38,884 | 5,372 | |||||||||
Latin America | |||||||||||||||||
Brazil(9) | 617 | 819 | 400 | 3,853 | 5,689 | 493 | 6,182 | 2,313 | |||||||||
Mexico(10) | 2,381 | 423 | 359 | 2,446 | 5,609 | — | 5,609 | 1,452 | |||||||||
Chile | 184 | 325 | 594 | 61 | 1,164 | 3 | 1,167 | 588 | |||||||||
Other Latin America (8) | 82 | 342 | 514 | 624 | 1,562 | 133 | 1,695 | 1,048 | |||||||||
Total Latin America | 3,264 | 1,909 | 1,867 | 6,984 | 14,024 | 629 | 14,653 | 5,401 | |||||||||
Middle East and Africa | |||||||||||||||||
South Africa | 356 | 7 | 67 | 745 | 1,175 | — | 1,175 | 848 | |||||||||
United Arab Emirates | 433 | 76 | 187 | 119 | 815 | — | 815 | 405 | |||||||||
Other Middle East and | 895 | 108 | 332 | 353 | 1,688 | 5 | 1,693 | (25 | ) | ||||||||
Total Middle East and Africa | 1,684 | 191 | 586 | 1,217 | 3,678 | 5 | 3,683 | 1,228 | |||||||||
Central and Eastern Europe | |||||||||||||||||
Russian Federation | 270 | — | 192 | 378 | 840 | — | 840 | 748 | |||||||||
Other Central and Eastern Europe(8) | 921 | 149 | 288 | 410 | 1,768 | 9 | 1,777 | 1,240 | |||||||||
Total Central and Eastern Europe | 1,191 | 149 | 480 | 788 | 2,608 | 9 | 2,617 | 1,988 | |||||||||
Total emerging market exposure | $10,304 | $5,039 | $9,296 | $33,634 | $58,273 | $1,564 | $59,837 | $13,989 |
| (1) | There is no generally accepted definition of emerging markets. The definition that we use includes all countries in Asia Pacific excluding Japan, Australia and New Zealand; all countries in Latin America excluding Cayman Islands and Bermuda; all countries in Middle East and Africa; and all countries in Central and Eastern Europe excluding Greece. There was no emerging market exposure included in the portfolio measured at fair value in accordance with SFAS 159 at March 31, 2009 and December 31, 2008. |
| (2) | Includes acceptances, standby letters of credit, commercial letters of credit and formal guarantees. |
| (3) | Derivative assets are reported on a mark-to-market basis and have been reduced by the amount of cash collateral applied of $635 million and $152 million at March 31, 2009 and December 31, 2008. At March 31, 2009 and December 31, 2008, there were $1.1 billion and $531 million of other marketable securities collateralizing derivative assets for which credit risk has not been reduced. |
| (4) | Generally, cross-border resale agreements are presented based on the domicile of the counterparty, consistent with Federal Financial Institutions Examination Council (FFIEC) reporting rules. Cross-border resale agreements where the underlying securities are U.S. Treasury securities, in which case the domicile is the U.S., are excluded from this presentation. |
| (5) | Cross-border exposure includes amounts payable to the Corporation by borrowers or counterparties with a country of residence other than the one in which the credit is booked, regardless of the currency in which the claim is denominated, consistent with FFIEC reporting requirements. |
| (6) | Local country exposure includes amounts payable to the Corporation by borrowers with a country of residence in which the credit is booked, regardless of the currency in which the claim is denominated. Local funding or liabilities are subtracted from local exposures consistent with FFIEC reporting requirements. Total amount of available local liabilities funding local country exposure at March 31, 2009 was $17.6 billion compared to $12.6 billion at December 31, 2008. Local liabilities at March 31, 2009 in Asia Pacific and Latin America were $16.9 billion and $693 million, of which $8.5 billion were in Singapore, $2.7 billion in Hong Kong, $2.3 billion in South Korea, $1.3 billion in India, $943 million in China, and $639 million in Mexico. There were no other countries with available local liabilities funding local country exposure greater than $500 million. |
| (7) | Securities/Other Investments include an investment of $16.8 billion in China Construction Bank (CCB). |
| (8) | No country included in Other Asia Pacific, Other Latin America, Other Middle East and Africa, or Other Central and Eastern Europe had total foreign exposure of more than $500 million. |
| (9) | Securities/Other Investments include an investment of $2.5 billion in Banco Itau Holding Financeira S.A. |
| (10) | Securities/Other Investments include an investment of $2.2 billion in Grupo Financiero Santander, S.A. |
Certain prior period amounts have been reclassified to conform to current period presentation.
Information for periods beginning July 1, 2008 include the Countrywide acquisition. Information for the period beginning January 1, 2009 includes the
Merrill Lynch acquisition. Prior periods have not been restated.
| This information is preliminary and based on company data available at the time of the presentation. | 34 |
Bank of America Corporation and Subsidiaries
Nonperforming Assets
(Dollars in millions)
| March 31 2009 | December 31 2008 | September 30 2008 | June 30 2008 | March 31 2008 | ||||||||||||||||
Residential mortgage | $10,807 | $ 7,044 | $ 4,638 | $ 3,269 | $ 2,576 | |||||||||||||||
Home equity | 3,598 | 2,670 | 2,049 | 1,851 | 1,786 | |||||||||||||||
Discontinued real estate | 178 | 77 | 33 | n/a | n/a | |||||||||||||||
Direct/Indirect consumer | 29 | 26 | 13 | 11 | 6 | |||||||||||||||
Other consumer | 91 | 91 | 89 | 89 | 91 | |||||||||||||||
Total consumer | 14,703 | 9,908 | 6,822 | 5,220 | 4,459 | |||||||||||||||
Commercial - domestic(1) | 3,022 | 2,040 | 1,566 | 1,079 | 980 | |||||||||||||||
Commercial real estate | 5,662 | 3,906 | 3,090 | 2,616 | 1,627 | |||||||||||||||
Commercial lease financing | 104 | 56 | 35 | 40 | 44 | |||||||||||||||
Commercial - foreign | 300 | 290 | 48 | 48 | 54 | |||||||||||||||
| 9,088 | 6,292 | 4,739 | 3,783 | 2,705 | ||||||||||||||||
Small business commercial - domestic | 224 | 205 | 183 | 153 | 169 | |||||||||||||||
Total commercial | 9,312 | 6,497 | 4,922 | 3,936 | 2,874 | |||||||||||||||
Total nonperforming loans and leases | 24,015 | 16,405 | 11,744 | 9,156 | 7,333 | |||||||||||||||
Foreclosed properties | 1,728 | 1,827 | 1,832 | 593 | 494 | |||||||||||||||
Total nonperforming assets(2, 3, 4) | $25,743 | $18,232 | $13,576 | $ 9,749 | $ 7,827 | |||||||||||||||
Loans past due 90 days or more and still accruing(2, 4, 5) | $ 6,344 | $ 5,414 | $ 4,819 | $ 4,548 | $ 4,160 | |||||||||||||||
Nonperforming assets/Total assets(6) | 1.11 | % | 1.01 | % | 0.74 | % | 0.57 | % | 0.45 | % | ||||||||||
Nonperforming assets/Total loans, leases and foreclosed properties (6) | 2.65 | 1.96 | 1.45 | 1.13 | 0.90 | |||||||||||||||
Nonperforming loans and leases/Total loans and leases outstanding (6) | 2.48 | 1.77 | 1.25 | 1.06 | 0.84 | |||||||||||||||
Allowance for credit losses: | ||||||||||||||||||||
Allowance for loan and lease losses | $29,048 | $23,071 | $20,346 | $17,130 | $14,891 | |||||||||||||||
Reserve for unfunded lending commitments (7) | 1,357 | 421 | 427 | 507 | 507 | |||||||||||||||
Total allowance for credit losses | $30,405 | $23,492 | $20,773 | $17,637 | $15,398 | |||||||||||||||
Allowance for loan and lease losses/Total loans and leases outstanding(6) | 3.00 | % | 2.49 | % | 2.17 | % | 1.98 | % | 1.71 | % | ||||||||||
Allowance for loan and lease losses/Total nonperforming loans and leases (6) | 121 | 141 | 173 | 187 | 203 | |||||||||||||||
Reservable commercial utilized criticized exposure(8) | $48,660 | $36,937 | $31,009 | $25,998 | $21,157 | |||||||||||||||
Reservable commercial utilized criticized exposure/Commercial utilized exposure(8) | 11.13 | % | 8.90 | % | 7.45 | % | 6.23 | % | 5.43 | % | ||||||||||
| (1) | Excludes small business commercial - domestic loans. |
| (2) | Balances do not include loans accounted for in accordance with SOP 03-3 even though the customer may be contractually past due. Loans accounted for in accordance with SOP 03-3 were written down to fair value upon acquisition and accrete interest income over the remaining life of the loan. |
| (3) | Balances do not include nonperforming loans held-for-sale included in other assets of $2.5 billion, $1.3 billion, $848 million, $388 million and $327 million at March 31, 2009, December 31, 2008, September 30, 2008, June 30, 2008 and March 31, 2008, respectively. |
| (4) | Balances do not include loans measured at fair value in accordance with SFAS 159. At March 31, 2009, December 31, 2008, September 30, 2008, June 30, 2008 and March 31, 2008, there were no nonperforming loans measured at fair value in accordance with SFAS 159. At June 30, 2008, there were $81 million of loans past due 90 days or more and still accruing interest measured at fair value in accordance with SFAS 159. At March 31, 2009, December 31, 2008, September 30, 2008 and March 31, 2008, there were no loans past due 90 days or more and still accruing interest measured at fair value in accordance with SFAS 159. |
| (5) | Balances do not include loans held-for-sale past due 90 days or more and still accruing interest included in other assets of $18 million, $31 million, $138 million, $32 million and $69 million at March 31, 2009, December 31, 2008, September 30, 2008, June 30, 2008 and March 31, 2008, respectively. |
| (6) | Ratios do not include loans measured at fair value in accordance with SFAS 159 of $7.4 billion, $5.4 billion, $5.4 billion, $5.0 billion and $5.1 billion at March 31, 2009, December 31, 2008, September 30, 2008, June 30, 2008 and March 31, 2008, respectively. |
| (7) | The majority of the increase from December 31, 2008 relates to the fair value of the acquired Merrill Lynch unfunded lending commitments, excluding commitments accounted for under SFAS 159. |
| (8) | Criticized exposure and ratios exclude assets held-for-sale, exposure measured at fair value in accordance with SFAS 159 and other nonreservable exposure. Including assets held-for-sale, other nonreservable exposure and commercial loans measured at fair value, the ratios would have been 12.63 percent, 9.45 percent, 7.94 percent, 6.62 percent and 6.12 percent at March 31, 2009, December 31, 2008, September 30, 2008, June 30, 2008 and March 31, 2008, respectively. |
n/a = not applicable
Loans are classified as domestic or foreign based upon the domicile of the borrower.
Certain prior period amounts have been reclassified to conform to current period presentation.
Information for periods beginning July 1, 2008 include the Countrywide acquisition. Information for the period beginning January 1, 2009 includes the
Merrill Lynch acquisition. Prior periods have not been restated.
| This information is preliminary and based on company data available at the time of the presentation. | 35 |
Bank of America Corporation and Subsidiaries
Quarterly Net Charge-offs/Losses and Net Charge-off/Loss Ratios(1)
(Dollars in millions)
| First Quarter 2009 | Fourth Quarter 2008 | Third Quarter 2008 | Second Quarter 2008 | First Quarter 2008 | ||||||||||||||||||||||||||
| Held Basis | Amount | Percent | Amount | Percent | Amount | Percent | Amount | Percent | Amount | Percent | ||||||||||||||||||||
Residential mortgage | $ 785 | 1.20 | % | $ 466 | 0.73 | % | $ 242 | 0.37 | % | $ 151 | 0.24 | % | $ 66 | 0.10 | % | |||||||||||||||
Home equity | 1,681 | 4.30 | 1,113 | 2.92 | 964 | 2.53 | 923 | 3.09 | 496 | 1.71 | ||||||||||||||||||||
Discontinued real estate | 15 | 0.31 | 19 | 0.36 | (3 | ) | (0.05 | ) | n/a | n/a | n/a | n/a | ||||||||||||||||||
Credit card - domestic | 1,426 | 9.81 | 1,244 | 7.63 | 1,094 | 6.86 | 976 | 6.36 | 847 | 5.39 | ||||||||||||||||||||
Credit card - foreign | 186 | 4.48 | 162 | 3.75 | 148 | 3.46 | 132 | 3.21 | 109 | 2.87 | ||||||||||||||||||||
Direct/Indirect consumer | 1,249 | 5.03 | 1,054 | 5.03 | 845 | 3.94 | 660 | 3.22 | 555 | 2.84 | ||||||||||||||||||||
Other consumer | 97 | 11.67 | 124 | 13.79 | 106 | 11.36 | 83 | 8.47 | 86 | 8.61 | ||||||||||||||||||||
Total consumer | 5,439 | 3.54 | 4,182 | 2.79 | 3,396 | 2.24 | 2,925 | 2.17 | 2,159 | 1.58 | ||||||||||||||||||||
Commercial - domestic(2) | 244 | 0.46 | 255 | 0.50 | 117 | 0.23 | 70 | 0.14 | 77 | 0.16 | ||||||||||||||||||||
Commercial real estate | 455 | 2.56 | 382 | 2.36 | 262 | 1.65 | 136 | 0.88 | 107 | 0.70 | ||||||||||||||||||||
Commercial lease financing | 67 | 1.22 | 31 | 0.57 | 8 | 0.13 | 6 | 0.11 | 15 | 0.27 | ||||||||||||||||||||
Commercial - foreign | 104 | 1.25 | 129 | 1.63 | 46 | 0.56 | 5 | 0.06 | (7 | ) | (0.10 | ) | ||||||||||||||||||
| 870 | 1.02 | 797 | 0.99 | 433 | 0.54 | 217 | 0.28 | 192 | 0.25 | |||||||||||||||||||||
Small business commercial - domestic | 633 | 13.47 | 562 | 11.55 | 527 | 10.64 | 477 | 9.59 | 364 | 7.44 | ||||||||||||||||||||
Total commercial | 1,503 | 1.68 | 1,359 | 1.59 | 960 | 1.13 | 694 | 0.84 | 556 | 0.69 | ||||||||||||||||||||
Total net charge-offs | $ 6,942 | 2.85 | $ 5,541 | 2.36 | $ 4,356 | 1.84 | $ 3,619 | 1.67 | $ 2,715 | 1.25 | ||||||||||||||||||||
By Business Segment | ||||||||||||||||||||||||||||||
Deposits | $ 218 | 6.11 | % | $ 212 | 6.23 | % | $ 202 | 6.19 | % | $ 179 | 5.73 | % | $ 159 | 4.97 | % | |||||||||||||||
Global Card Services(3) | 5,276 | 9.54 | 4,517 | 7.86 | 4,078 | 6.91 | 3,667 | 6.31 | 3,073 | 5.39 | ||||||||||||||||||||
Home Loans & Insurance Services | 1,492 | 4.77 | 976 | 3.18 | 844 | 2.75 | 841 | 3.71 | 443 | 2.04 | ||||||||||||||||||||
Global Markets | 5 | 0.17 | 15 | 0.87 | 16 | 0.36 | — | — | — | — | ||||||||||||||||||||
Global Banking | 1,122 | 1.37 | 992 | 1.19 | 588 | 0.73 | 318 | 0.41 | 328 | 0.43 | ||||||||||||||||||||
Global Wealth Management | 162 | 0.60 | 145 | 0.65 | 108 | 0.49 | 92 | 0.42 | 52 | 0.24 | ||||||||||||||||||||
All Other(3) | (1,333 | ) | (3.21 | ) | (1,316 | ) | (3.60 | ) | (1,480 | ) | (4.03 | ) | (1,478 | ) | (5.06 | ) | (1,340 | ) | (4.03 | ) | ||||||||||
Total net charge-offs | $ 6,942 | 2.85 | $ 5,541 | 2.36 | $ 4,356 | 1.84 | $ 3,619 | 1.67 | $ 2,715 | 1.25 | ||||||||||||||||||||
Supplemental managed basis data | ||||||||||||||||||||||||||||||
Credit card - domestic | $ 3,421 | 9.20 | % | $ 2,929 | 7.66 | % | $ 2,643 | 6.87 | % | $ 2,414 | 6.36 | % | $ 2,068 | 5.48 | % | |||||||||||||||
Credit card - foreign | 373 | 5.47 | 334 | 4.57 | 353 | 4.21 | 337 | 4.11 | 304 | 3.84 | ||||||||||||||||||||
Total credit card managed net losses | $ 3,794 | 8.62 | $ 3,263 | 7.16 | $ 2,996 | 6.40 | $ 2,751 | 5.96 | $ 2,372 | 5.19 | ||||||||||||||||||||
| (1) | Net charge-off/loss ratios are calculated as annualized held net charge-offs or managed net losses divided by average outstanding held or managed loans and leases excluding loans measured at fair value in accordance with SFAS 159 during the period for each loan and lease category. |
| (2) | Excludes small business commercial - domestic loans. |
| (3) | Global Card Services is presented on a managed basis. The securitization offset is included within All Other. |
n/a = not applicable
Loans are classified as domestic or foreign based upon the domicile of the borrower.
Certain prior period amounts have been reclassified to conform to current period presentation.
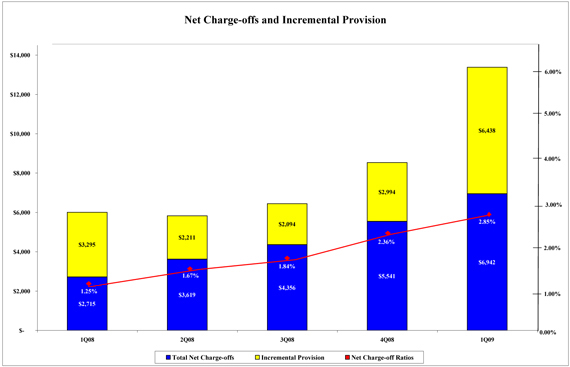
Information for periods beginning July 1, 2008 include the Countrywide acquisition. Information for the period beginning January 1, 2009 includes the
Merrill Lynch acquisition. Prior periods have not been restated.
| This information is preliminary and based on company data available at the time of the presentation. | 36 |
Bank of America Corporation and Subsidiaries
Allocation of the Allowance for Credit Losses by Product Type
(Dollars in millions)
| March 31, 2009 | December 31, 2008 | March 31, 2008 | |||||||||||||||||
| Allowance for loan and lease losses | Amount | Percent of loans and leases outstanding(1) | Amount | Percent of loans and leases outstanding(1) | Amount | Percent of loans and leases outstanding(1) | |||||||||||||
Residential mortgage | $ 2,856 | 1.09 | % | $ | 1,382 | 0.56 | % | $ 394 | 0.15 | % | |||||||||
Home equity | 7,457 | 4.73 | 5,385 | 3.53 | 2,549 | 2.15 | |||||||||||||
Discontinued real estate | 67 | 0.35 | 658 | 3.29 | n/a | n/a | |||||||||||||
Credit card - domestic | 4,597 | 8.96 | 3,947 | 6.16 | 3,182 | 5.27 | |||||||||||||
Credit card - foreign | 866 | 5.20 | 742 | 4.33 | 472 | 3.04 | |||||||||||||
Direct/Indirect consumer | 5,381 | 5.40 | 4,341 | 5.20 | 2,485 | 3.10 | |||||||||||||
Other consumer | 202 | 6.11 | 203 | 5.87 | 162 | 4.06 | |||||||||||||
Total consumer | 21,426 | 3.52 | 16,658 | 2.83 | 9,244 | 1.70 | |||||||||||||
Commercial - domestic(2) | 5,264 | 2.29 | 4,339 | 1.98 | 3,878 | 1.86 | |||||||||||||
Commercial real estate | 1,756 | 2.33 | 1,465 | 2.26 | 1,206 | 1.92 | |||||||||||||
Commercial lease financing | 238 | 1.08 | 223 | 1.00 | 227 | 1.03 | |||||||||||||
Commercial - foreign | 364 | 1.09 | 386 | 1.25 | 336 | 1.08 | |||||||||||||
Total commercial(3) | 7,622 | 2.11 | 6,413 | 1.90 | 5,647 | 1.74 | |||||||||||||
| �� | |||||||||||||||||||
Allowance for loan and lease losses | 29,048 | 3.00 | 23,071 | 2.49 | 14,891 | 1.71 | |||||||||||||
Reserve for unfunded lending commitments(4) | 1,357 | 421 | 507 | ||||||||||||||||
Allowance for credit losses | $30,405 | $ | 23,492 | $15,398 | |||||||||||||||
| (1) | Ratios are calculated as allowance for loan and lease losses as a percentage of loans and leases outstanding excluding loans measured in accordance with SFAS 159 for each loan and lease category. Loans measured at fair value include commercial - domestic loans of $4.8 billion, $3.5 billion and $3.9 billion, commercial - foreign loans of $2.5 billion, $1.7 billion and $949 million, and commercial real estate loans of $89 million, $203 million and $240 million at March 31, 2009, December 31, 2008 and March 31, 2008. |
| (2) | Includes allowance for small business commercial - domestic loans of $3.1 billion, $2.4 billion and $2.0 billion at March 31, 2009, December 31, 2008 and March 31, 2008. |
| (3) | Includes allowance for loan and lease losses for impaired commercial loans of $1.1 billion, $691 million and $242 million at March 31, 2009, December 31, 2008 and March 31, 2008. |
| (4) | The majority of the increase from December 31, 2008 relates to the fair value of the acquired Merrill Lynch unfunded lending commitments, excluding commitments accounted for under SFAS 159. |
n/a = not applicable
Certain prior period amounts have been reclassified to conform to current period presentation.
Information for periods beginning July 1, 2008 include the Countrywide acquisition. Information for the period beginning January 1, 2009 includes the
Merrill Lynch acquisition. Prior periods have not been restated.
| This information is preliminary and based on company data available at the time of the presentation. | 37 |
Exhibit A: Non-GAAP Reconciliations
Bank of America Corporation and Subsidiaries
Global Card Services - Reconciliation
(Dollars in millions)
| First Quarter 2009 | Fourth Quarter 2008 | Third Quarter 2008 | |||||||||||||||||||||||
| Managed Basis (1) | Securitization Impact (2) | Held Basis | Managed Basis (1) | Securitization Impact (2) | Held Basis | Managed Basis (1) | Securitization Impact (2) | Held Basis | |||||||||||||||||
Net interest income(3) | $ 5,207 | $ (2,391 | ) | $ 2,816 | $ 5,237 | $ (2,299 | ) | $ 2,938 | $ 4,861 | $ (2,207 | ) | $ 2,654 | |||||||||||||
Noninterest income: | |||||||||||||||||||||||||
Card income | 2,115 | 244 | 2,359 | 2,469 | 482 | 2,951 | 2,290 | 507 | 2,797 | ||||||||||||||||
All other income | 135 | (35 | ) | 100 | 239 | (40 | ) | 199 | 534 | (54 | ) | 480 | |||||||||||||
Total noninterest income | 2,250 | 209 | 2,459 | 2,708 | 442 | 3,150 | 2,824 | 453 | 3,277 | ||||||||||||||||
Total revenue, net of interest expense | 7,457 | (2,182 | ) | 5,275 | 7,945 | (1,857 | ) | 6,088 | 7,685 | (1,754 | ) | 5,931 | |||||||||||||
Provision for credit losses | 8,221 | (2,182 | ) | 6,039 | 5,723 | (1,857 | ) | 3,866 | 5,468 | (1,754 | ) | 3,714 | |||||||||||||
Noninterest expense | 2,075 | — | 2,075 | 2,178 | — | 2,178 | 2,406 | — | 2,406 | ||||||||||||||||
Income (loss) before income taxes | (2,839 | ) | — | (2,839 | ) | 44 | — | 44 | (189 | ) | — | (189 | ) | ||||||||||||
Income tax expense (benefit) (3) | (1,070 | ) | — | (1,070 | ) | 18 | — | 18 | (63 | ) | — | (63 | ) | ||||||||||||
Net income (loss) | $ (1,769 | ) | $ — | $ (1,769 | ) | $ 26 | $ — | $ 26 | $ (126) | $ — | $ (126 | ) | |||||||||||||
Balance sheet | |||||||||||||||||||||||||
Average - total loans and leases | $224,406 | $(102,672 | ) | $121,734 | $228,519 | $ (99,116 | ) | $129,403 | $234,814 | $(105,919 | ) | $128,895 | |||||||||||||
Period end - total loans and leases | 218,031 | (105,392 | ) | 112,639 | 228,573 | (100,960 | ) | 127,613 | 231,146 | (102,048 | ) | 129,098 | |||||||||||||
| Second Quarter 2008 | First Quarter 2008 | ||||||||||||||||||||||||
| Managed Basis (1) | Securitization Impact (2) | Held Basis | Managed Basis (1) | Securitization Impact (2) | Held Basis | ||||||||||||||||||||
Net interest income(3) | $ 4,680 | $ (2,140) | $ 2,540 | $ 4,527 | $ (2,055 | ) | $ 2,472 | ||||||||||||||||||
Noninterest income: | |||||||||||||||||||||||||
Card income | 2,554 | 557 | 3,111 | 2,720 | 704 | 3,424 | |||||||||||||||||||
All other income | 204 | (60 | ) | 144 | 621 | (65 | ) | 556 | |||||||||||||||||
Total noninterest income | 2,758 | 497 | 3,255 | 3,341 | 639 | 3,980 | |||||||||||||||||||
Total revenue, net of interest expense | 7,438 | (1,643 | ) | 5,795 | 7,868 | (1,416 | ) | 6,452 | |||||||||||||||||
Provision for credit losses | 4,071 | (1,643 | ) | 2,428 | 4,312 | (1,416 | ) | 2,896 | |||||||||||||||||
Noninterest expense | 2,378 | — | 2,378 | 2,199 | — | 2,199 | |||||||||||||||||||
Income before income taxes | 989 | — | 989 | 1,357 | — | 1,357 | |||||||||||||||||||
Income tax expense (3) | 330 | — | 330 | 490 | — | 490 | |||||||||||||||||||
Net income | $ 659 | $ — | $ 659 | $ 867 | $ — | $ 867 | |||||||||||||||||||
Balance sheet | |||||||||||||||||||||||||
Average - total loans and leases | $233,593 | $(107,438 | ) | $126,155 | $229,147 | $(105,176 | ) | $123,971 | |||||||||||||||||
Period end - total loans and leases | 235,625 | (108,520 | ) | 127,105 | $229,974 | (107,847 | ) | 122,127 | |||||||||||||||||
| (1) | Provision for credit losses represents provision for credit losses on held loans combined with realized credit losses associated with the securitized loan portfolio. |
| (2) | The securitization impact on net interest income is on a funds transfer pricing methodology consistent with the way funding costs are allocated to the businesses. |
| (3) | Fully taxable-equivalent basis |
Certain prior period amounts have been reclassified among the segments to conform to the current period presentation.
The Corporation reportsGlobal Card Serviceson a managed basis. Reporting on a managed basis is consistent with the way that management evaluates the results ofGlobal Card Services. Managed basis assumes that securitized loans were not sold and presents earnings on these loans in a manner similar to the way loans that have not been sold (i.e., held loans) are presented. Loan securitization is an alternative funding process that is used by the Corporation to diversify funding sources. Loan securitization removes loans from the Consolidated Balance Sheet through the sale of loans to an off-balance sheet qualified special purpose entity which is excluded from the Corporation’s Consolidated Financial Statements in accordance with accounting principles generally accepted in the United States (GAAP).
The performance of the managed portfolio is important in understandingGlobal Card Services’ results as it demonstrates the results of the entire portfolio serviced by the business. Securitized loans continue to be serviced by the business and are subject to the same underwriting standards and ongoing monitoring as held loans. In addition, retained excess servicing income is exposed to similar credit risk and repricing of interest rates as held loans.Global Card Services’managed income statement line items differ from a held basis reported as follows:
| • | Managed net interest income includesGlobal Card Services’ net interest income on held loans and interest income on the securitized loans less the internal funds transfer pricing allocation related to securitized loans. |
| • | Managed noninterest income includesGlobal Card Services’ noninterest income on a held basis less the reclassification of certain components of card income (e.g., excess servicing income) to record managed net interest income and provision for credit losses. Noninterest income, both on a held and managed basis, also includes the impact of adjustments to the interest-only strip that are recorded in card income as management continues to manage this impact withinGlobal Card Services. |
| • | Provision for credit losses represents the provision for credit losses on held loans combined with realized credit losses associated with the securitized loan portfolio. |
Information for periods beginning July 1, 2008 include the Countrywide acquisition. Information for the period beginning January 1, 2009 includes the
Merrill Lynch acquisition. Prior periods have not been restated.
| This information is preliminary and based on company data available at the time of the presentation. | 38 |
Exhibit A: Non-GAAP Reconciliations - continued
Bank of America Corporation and Subsidiaries
All Other - Reconciliation
(Dollars in millions)
| First Quarter 2009 | Fourth Quarter 2008 | Third Quarter 2008 | |||||||||||||||||||||||||
| Reported Basis (1) | Securitization Offset (2) | As Adjusted | Reported Basis (1) | Securitization Offset (2) | As Adjusted | Reported Basis (1) | Securitization Offset (2) | As Adjusted | |||||||||||||||||||
Net interest income(3) | $ (1,780 | ) | $ 2,391 | $ 611 | $ (1,859 | ) | $ 2,299 | $ 440 | $ (2,328 | ) | $ 2,207 | $ (121) | |||||||||||||||
Noninterest income: | |||||||||||||||||||||||||||
Card income (loss) | 534 | (244 | ) | 290 | 368 | (482 | ) | (114 | ) | 538 | (507 | ) | 31 | ||||||||||||||
Equity investment income (loss) | 1,326 | — | 1,326 | (387 | ) | — | (387 | ) | (326 | ) | — | (326 | ) | ||||||||||||||
Gains (losses) on sales of debt securities | 1,471 | — | 1,471 | 783 | — | 783 | (3 | ) | — | (3 | ) | ||||||||||||||||
All other income (loss) | 2,591 | 35 | 2,626 | (283 | ) | 40 | (243 | ) | 112 | 54 | 166 | ||||||||||||||||
Total noninterest income | 5,922 | (209 | ) | 5,713 | 481 | (442 | ) | 39 | 321 | (453 | ) | (132 | ) | ||||||||||||||
Total revenue, net of interest expense | 4,142 | 2,182 | 6,324 | (1,378 | ) | 1,857 | 479 | (2,007 | ) | 1,754 | (253 | ) | |||||||||||||||
Provision for credit losses | (677 | ) | 2,182 | 1,505 | (613 | ) | 1,857 | 1,244 | (996 | ) | 1,754 | 758 | |||||||||||||||
Merger and restructuring charges | 765 | — | 765 | 306 | — | 306 | 247 | — | 247 | ||||||||||||||||||
All other noninterest expense | 291 | — | 291 | 184 | — | 184 | (27 | ) | — | (27 | ) | ||||||||||||||||
Income (loss) before income taxes | 3,763 | — | 3,763 | (1,255 | ) | — | (1,255 | ) | (1,231 | ) | — | (1,231 | ) | ||||||||||||||
Income tax expense (benefit) (3) | 792 | — | 792 | (738 | ) | — | (738 | ) | (539 | ) | — | (539 | ) | ||||||||||||||
Net income (loss) | $ 2,971 | $ — | $ 2,971 | $ (517 | ) | $ — | $ (517 | ) | $ (692 | ) | $ — | $ (692 | ) | ||||||||||||||
| Balance sheet | |||||||||||||||||||||||||||
Average - total loans and leases | $168,450 | $102,672 | $271,122 | $145,237 | $ 99,116 | $244,353 | $146,303 | $105,919 | $252,222 | ||||||||||||||||||
Period end - total loans and leases | 164,638 | 105,392 | 270,030 | 136,160 | 100,960 | 237,120 | 146,364 | 102,048 | 248,412 | ||||||||||||||||||
| Second Quarter 2008 | First Quarter 2008 | ||||||||||||||||||||||||||
| Reported Basis (1) | Securitization Offset (2) | As Adjusted | Reported Basis (1) | Securitization Offset (2) | As Adjusted | ||||||||||||||||||||||
Net interest income(3) | $ (1,914 | ) | $ 2,140 | $ 226 | $ (1,856 | ) | $ 2,055 | $ 199 | |||||||||||||||||||
Noninterest income: | |||||||||||||||||||||||||||
Card income (loss) | 596 | (557 | ) | 39 | 663 | (704 | ) | (41 | ) | ||||||||||||||||||
Equity investment income | 710 | — | 710 | 268 | — | 268 | |||||||||||||||||||||
Gains on sales of debt securities | 131 | — | 131 | 220 | — | 220 | |||||||||||||||||||||
All other income (loss) | (86 | ) | 60 | (26 | ) | (264 | ) | 65 | (199 | ) | |||||||||||||||||
Total noninterest income | 1,351 | (497 | ) | 854 | 887 | (639 | ) | 248 | |||||||||||||||||||
Total revenue, net of interest expense | (563 | ) | 1,643 | 1,080 | (969 | ) | 1,416 | 447 | |||||||||||||||||||
Provision for credit losses | (1,033 | ) | 1,643 | 610 | (1,128 | ) | 1,416 | 288 | |||||||||||||||||||
Merger and restructuring charges | 212 | — | 212 | 170 | — | 170 | |||||||||||||||||||||
All other noninterest expense | 71 | — | 71 | 176 | — | 176 | |||||||||||||||||||||
Income (loss) before income taxes | 187 | — | 187 | (187 | ) | — | (187 | ) | |||||||||||||||||||
Income tax expense (benefit) (3) | (42 | ) | — | (42 | ) | 49 | — | 49 | |||||||||||||||||||
Net income (loss) | $229 | $ — | $ 229 | $ (236 | ) | $ — | $ (236 | ) | |||||||||||||||||||
| Balance sheet | |||||||||||||||||||||||||||
Average - total loans and leases | $117,503 | $107,438 | $224,941 | $133,883 | $105,176 | $239,059 | |||||||||||||||||||||
Period end - total loans and leases | 95,825 | 108,520 | 204,345 | 127,185 | 107,847 | 235,032 | |||||||||||||||||||||
| (1) | Provision for credit losses represents provision for credit losses in All Other combined with the Global Card Services’ securitization offset. |
| (2) | The securitization offset on net interest income is on a funds transfer pricing methodology consistent with the way funding costs are allocated to the businesses. |
| (3) | Fully taxable-equivalent basis |
Certain prior period amounts have been reclassified among the segments to conform to the current period presentation.
Information for periods beginning July 1, 2008 include the Countrywide acquisition. Information for the period beginning January 1, 2009 includes the
Merrill Lynch acquisition. Prior periods have not been restated.
| This information is preliminary and based on company data available at the time of the presentation. | 39 |
Appendix: Selected Slides from the
First Quarter 2009 Earnings Release Presentation
Information for periods beginning July 1, 2008 include the Countrywide acquisition. Information for the period beginning January 1, 2009 includes the
Merrill Lynch acquisition. Prior periods have not been restated.
| This information is preliminary and based on company data available at the time of the presentation. | 40 |
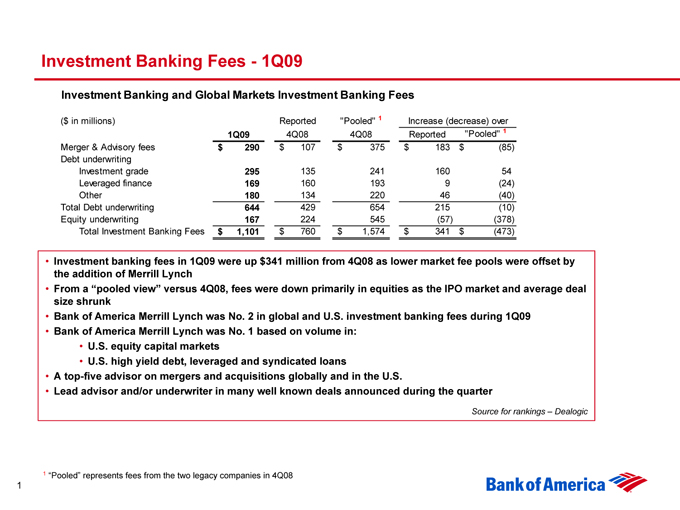
Investment Banking Fees - 1Q09
Investment Banking and Global Markets Investment Banking Fees
($ in millions) Reported “Pooled” 1 Increase (decrease) over
1Q09 4Q08 4Q08 Reported “Pooled” 1
Merger & Advisory fees $ 290 $ 107 $ 375 $ 183 $(85)
Debt underwriting
Investment grade 295 135 241 160 54
Leveraged finance 169 160 193 9 (24)
Other 180 134 220 46 (40)
Total Debt underwriting 644 429 654 215 (10)
Equity underwriting 167 224 545 (57) (378)
Total Investment Banking Fees $ 1,101 $ 760 $ 1,574 $ 341 $ (473)
• Investment banking fees in 1Q09 were up $341 million from 4Q08 as lower market fee pools were offset by the addition of Merrill Lynch
• From a “pooled view” versus 4Q08, fees were down primarily in equities as the IPO market and average deal size shrunk
• Bank of America Merrill Lynch was No. 2 in global and U.S. investment banking fees during 1Q09
• Bank of America Merrill Lynch was No. 1 based on volume in:
• U.S. equity capital markets
• U.S. high yield debt, leveraged and syndicated loans
• A top-five advisor on mergers and acquisitions globally and in the U.S.
• Lead advisor and/or underwriter in many well known deals announced during the quarter
Source for rankings – Dealogic
1 “Pooled” represents fees from the two legacy companies in 4Q08 1
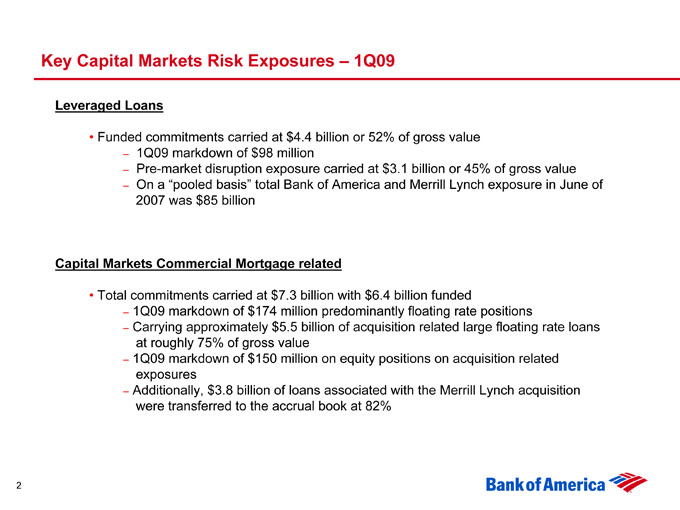
Key Capital Markets Risk Exposures - 1Q09
Leveraged Loans
o Funded commitments carried at $4.4 billion or 52% of gross value
- 1Q09 markdown of $98 million
- Pre-market disruption exposure carried at $3.1 billion or 45% of gross value
- On a “pooled basis” total Bank of America and Merrill Lynch exposure in June of 2007 was $85 billion
Capital Markets Commercial Mortgage related
o Total commitments carried at $7.3 billion with $6.4 billion funded
- 1Q09 markdown of $174 million predominantly floating rate positions
- Carrying approximately $5.5 billion of acquisition related large floating rate loans at roughly 75% of gross value
- 1Q09 markdown of $150 million on equity positions on acquisition related exposures
- Additionally, $3.8 billion of loans associated with the Merrill Lynch acquisition were transferred to the accrual book at 82%
2
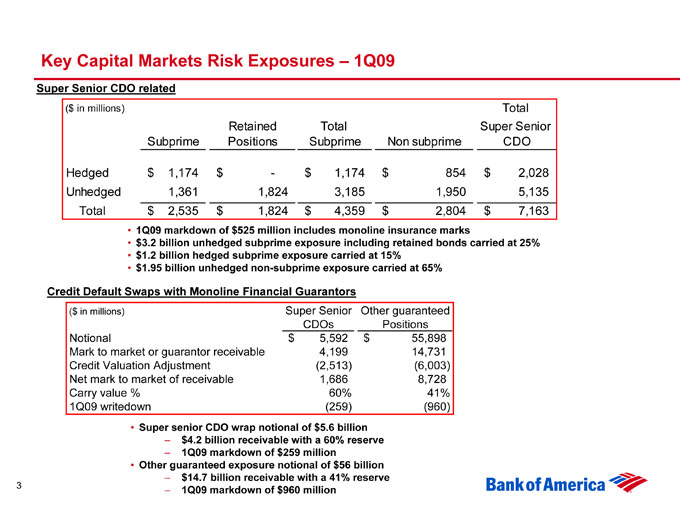
Key Capital Markets Risk Exposures - 1Q09
Super Senior CDO related
($ in millions) Total
Retained Total Super Senior
Subprime Positions Subprime Non subprime CDO
Hedged $ 1,174 $ - $ 1,174 $ 854 $ 2,028
Unhedged 1,361 1,824 3,185 1,950 5,135
Total $ 2,535 $ 1,824 $ 4,359 $ 2,804 $ 7,163
o 1Q09 markdown of $525 million includes monoline insurance marks
o $3.2 billion unhedged subprime exposure including retained bonds carried at 25%
o $1.2 billion hedged subprime exposure carried at 15%
o $1.95 billion unhedged non-subprime exposure carried at 65% Credit Default Swaps with Monoline Financial Guarantors
($ in millions) Super Senior Other guaranteed
CDOs Positions
Notional $ 5,592 $ 55,898
Mark to market or guarantor receivable 4,199 14,731
Credit Valuation Adjustment (2,513) (6,003)
Net mark to market of receivable 1,686 8,728
Carry value % 60% 41%
1Q09 writedown (259) (960)
o Super senior CDO wrap notional of $5.6 billion
- $4.2 billion receivable with a 60% reserve
- 1Q09 markdown of $259 million
o Other guaranteed exposure notional of $56 billion
- $14.7 billion receivable with a 41% reserve
3 - 1Q09 markdown of $960 million
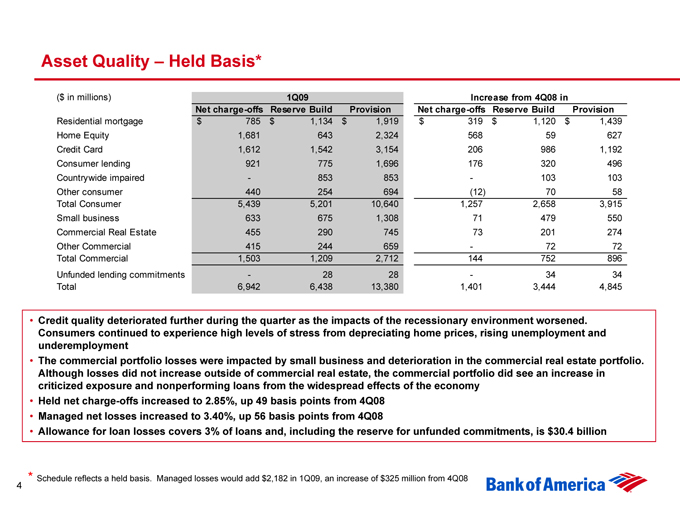
Asset Quality – Held Basis*
($ in millions) 1Q09 Increase from 4Q08 in
Net charge-offs Reserve Build Provision Net charge-offs Reserve Build Provision
Residential mortgage $ 785 $ 1,134 $ 1,919 $ 319 $ 1,120 $ 1,439
Home Equity 1,681 643 2,324 568 59 627
Credit Card 1,612 1,542 3,154 206 986 1,192
Consumer lending 921 775 1,696 176 320 496
Countrywide impaired - 853 853 - 103 103
Other consumer 440 254 694(12) 70 58
Total Consumer 5,439 5,201 10,640 1,257 2,658 3,915
Small business 633 675 1,308 71 479 550
Commercial Real Estate 455 290 745 73 201 274
Other Commercial 415 244 659 - 72 72
Total Commercial 1,503 1,209 2,712 144 752 896
Unfunded lending commitments - 28 28 - 34 34
Total 6,942 6,438 13,380 1,401 3,444 4,845
• Credit quality deteriorated further during the quarter as the impacts of the recessionary environment worsened. Consumers continued to experience high levels of stress from depreciating home prices, rising unemployment and underemployment
• The commercial portfolio losses were impacted by small business and deterioration in the commercial real estate portfolio. Although losses did not increase outside of commercial real estate, the commercial portfolio did see an increase in criticized exposure and nonperforming loans from the widespread effects of the economy
• Held net charge-offs increased to 2.85%, up 49 basis points from 4Q08
• Managed net losses increased to 3.40%, up 56 basis points from 4Q08
• Allowance for loan losses covers 3% of loans and, including the reserve for unfunded commitments, is $30.4 billion
* Schedule reflects a held basis. Managed losses would add $2,182 in 1Q09, an increase of $325 million from 4Q08 4
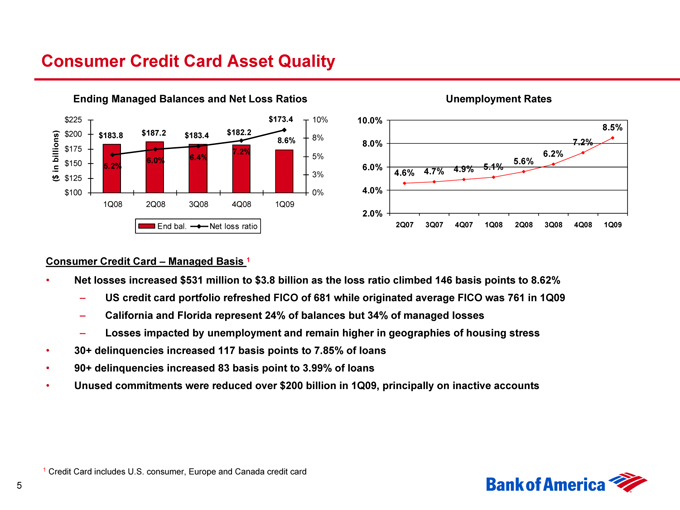
Consumer Credit Card Asset Quality
Ending Managed Balances and Net Loss Ratios
$225 $173.4 10%
$200 $183.8 $187.2 $183.4 $182.2 8.6% 8%
$175 7.2%
($ in billions) 6.0% 6.4% 5%
$150 5.2%
$125 3%
$100 0%
1Q08 2Q08 3Q08 4Q08 1Q09
End bal. Net loss ratio
Unemployment Rates
10.0%
8.5%
8.0% 7.2%
6.2%
5.6%
6.0% 4.6% 4.7% 4.9% 5.1%
4.0%
2.0%
2Q07 3Q07 4Q07 1Q08 2Q08 3Q08 4Q08 1Q09
Consumer Credit Card – Managed Basis 1
• Net losses increased $531 million to $3.8 billion as the loss ratio climbed 146 basis points to 8.62%
– US credit card portfolio refreshed FICO of 681 while originated average FICO was 761 in 1Q09
– California and Florida represent 24% of balances but 34% of managed losses
– Losses impacted by unemployment and remain higher in geographies of housing stress
• 30+ delinquencies increased 117 basis points to 7.85% of loans
• 90+ delinquencies increased 83 basis point to 3.99% of loans
• Unused commitments were reduced over $200 billion in 1Q09, principally on inactive accounts
1 Credit Card includes U.S. consumer, Europe and Canada credit card 5
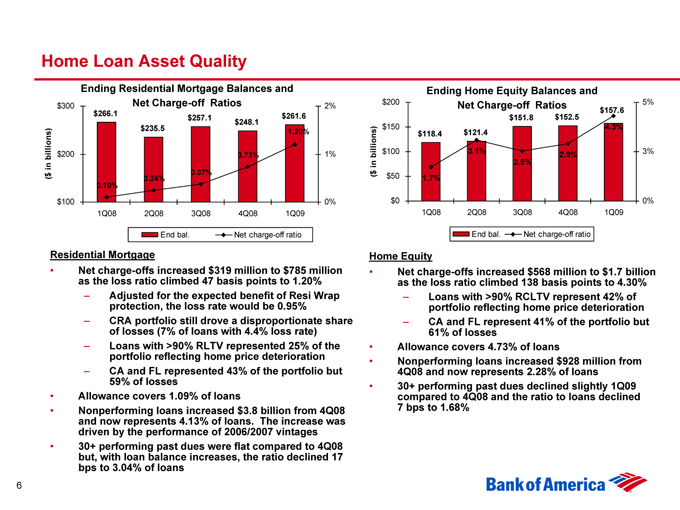
Home Loan Asset Quality
Ending Residential Mortgage Balances and
$300 Net Charge-off Ratios 2%
$266.1 $257.1 $261.6
$248.1
$235.5 1.20%
($ in billions) $200 0.73% 1%
$ 0.37%
0.24%
0.10%
$100 0%
1Q08 2Q08 3Q08 4Q08 1Q09
End bal. Net charge-off ratio
Residential Mortgage
• Net charge-offs increased $319 million to $785 million as the loss ratio climbed 47 basis points to 1.20%
– Adjusted for the expected benefit of Resi Wrap protection, the loss rate would be 0.95%
– CRA portfolio still drove a disproportionate share of losses (7% of loans with 4.4% loss rate)
– Loans with >90% RLTV represented 25% of the portfolio reflecting home price deterioration
– CA and FL represented 43% of the portfolio but 59% of losses
• Allowance covers 1.09% of loans
• Nonperforming loans increased $3.8 billion from 4Q08 and now represents 4.13% of loans. The increase was driven by the performance of 2006/2007 vintages
• 30+ performing past dues were flat compared to 4Q08 but, with loan balance increases, the ratio declined 17 bps to 3.04% of loans
Ending Home Equity Balances and
$200 Net Charge-off Ratios 5%
$157.6
$151.8 $152.5
$150 4.3%
$118.4 $121.4
($ in billions) $100 3.1% 2.9% 3%
2.5%
$50 1.7%
$0 0%
1Q08 2Q08 3Q08 4Q08 1Q09
End bal. Net charge-off ratio
Home Equity
• Net charge-offs increased $568 million to $1.7 billion as the loss ratio climbed 138 basis points to 4.30%
– Loans with >90% RCLTV represent 42% of portfolio reflecting home price deterioration
– CA and FL represent 41% of the portfolio but 61% of losses
• Allowance covers 4.73% of loans
• Nonperforming loans increased $928 million from 4Q08 and now represents 2.28% of loans
• 30+ performing past dues declined slightly 1Q09 compared to 4Q08 and the ratio to loans declined 7 bps to 1.68%
6
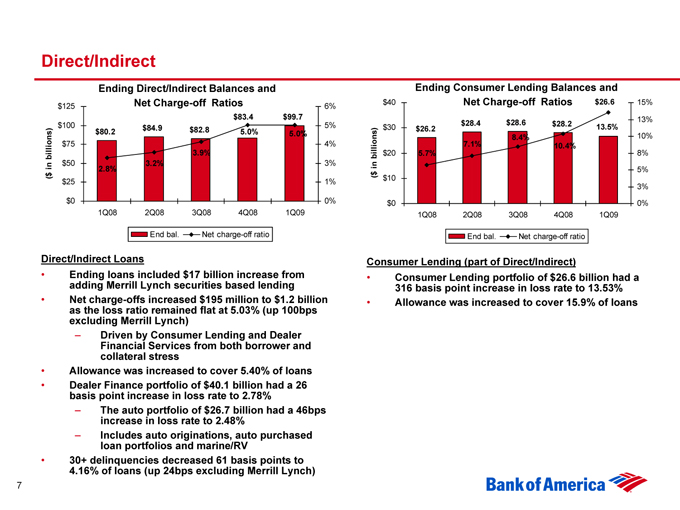
Direct/Indirect
Direct/Indirect Loans
• Ending loans included $17 billion increase from adding Merrill Lynch securities based lending
• Net charge-offs increased $195 million to $1.2 billion as the loss ratio remained flat at 5.03% (up 100bps excluding Merrill Lynch)
– Driven by Consumer Lending and Dealer Financial Services from both borrower and collateral stress
• Allowance was increased to cover 5.40% of loans
• Dealer Finance portfolio of $40.1 billion had a 26 basis point increase in loss rate to 2.78%
– The auto portfolio of $26.7 billion had a 46bps increase in loss rate to 2.48%
– Includes auto originations, auto purchased loan portfolios and marine/RV
• 30+ delinquencies decreased 61 basis points to 4.16% of loans (up 24bps excluding Merrill Lynch)
Ending Consumer Lending Balances and
$40 Net Charge-off Ratios $26.6 15%
$28.4 $28.6 $28.2 13%
$30 $26.2 13.5%
8.4% 10%
7.1% 10.4%
($ in billions) $20 5.7% 8%
5%
$10
3%
$0 0%
1Q08 2Q08 3Q08 4Q08 1Q09
End bal. Net charge-off ratio
Consumer Lending (part of Direct/Indirect)
• Consumer Lending portfolio of $26.6 billion had a 316 basis point increase in loss rate to 13.53%
• Allowance was increased to cover 15.9% of loans
Ending Direct/Indirect Balances and
$125 Net Charge-off Ratios 6%
$83.4 $99.7
$100 $84.9 5%
$80.2 $82.8 5.0% 5.0%
$75 4%
($ in billions) 3.9%
$50 3.2% 3%
2.8%
$25 1%
$0 0%
1Q08 2Q08 3Q08 4Q08 1Q09
End bal. Net charge-off ratio
7
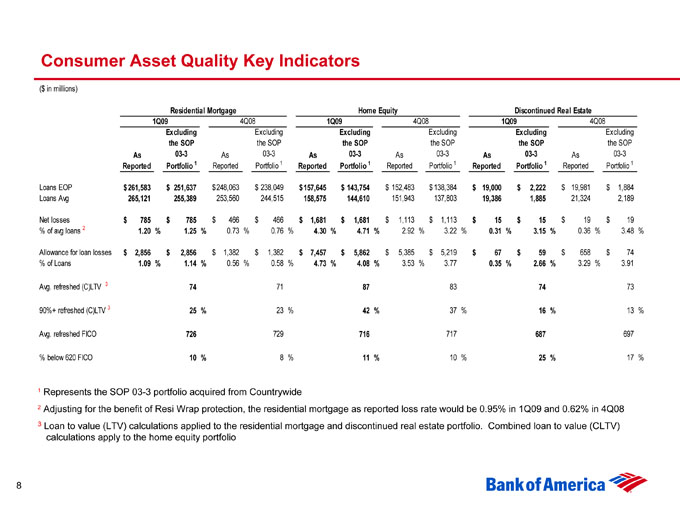
Consumer Asset Quality Key Indicators
($ in millions)
Residential Mortgage Home Equity Discontinued Real Estate
1Q09 4Q08 1Q09 4Q08 1Q09 4Q08
Excluding Excluding Excluding Excluding Excluding Excluding
the SOP the SOP the SOP the SOP the SOP the SOP
As 03-3 As 03-3 As 03-3 As 03-3 As 03-3 As 03-3
Reported Portfolio 1 Reported Portfolio 1 Reported Portfolio 1 Reported Portfolio 1 Reported Portfolio 1 Reported Portfolio 1
Loans EOP $ 261,583 $ 251,637 $ 248,063 $ 238,049 $ 157,645 $ 143,754 $ 152,483 $ 138,384 $ 19,000 $ 2,222 $ 19,981 $ 1,884
Loans Avg 265,121 255,389 253,560 244,515 158,575 144,610 151,943 137,803 19,386 1,885 21,324 2,189
Net losses $ 785 $ 785 $ 466 $ 466 $ 1,681 $ 1,681 $ 1,113 $ 1,113 $ 15 $ 15 $ 19 $ 19
% of avg loans 2 1.202 % 1.25 % 0.73 % 0.76 % 4.30 % 4.71 % 2.92 % 3.22 % 0.31 % 3.15 % 0.36 % 3.48 %
Allowance for loan losses $ 2,856 $ 2,856 $ 1,382 $ 1,382 $ 7,457 $ 5,862 $ 5,385 $ 5,219 $ 67 $ 59 $ 658 $ 74
% of Loans 1.09 % 1.14 % 0.56 % 0.58 % 4.73 % 4.08 % 3.53 % 3.77 0.35 % 2.66 % 3.29 % 3.91
Avg. refreshed (C)LTV 3 74 71 87 83 74 73
90%+ refreshed (C)LTV 3 25 % 23 % 42 % 37 % 16 % 13 %
Avg. refreshed FICO 726 729 716 717 687 697
% below 620 FICO 10 % 8 % 11 % 10 % 25 % 17 %
1 Represents the SOP 03-3 portfolio acquired from Countrywide
2 Adjusting for the benefit of Resi Wrap protection, the residential mortgage as reported loss rate would be 0.95% in 1Q09 and 0.62% in 4Q08
3 Loan to value (LTV) calculations applied to the residential mortgage and discontinued real estate portfolio. Combined loan to value (CLTV) calculations apply to the home equity portfolio
8
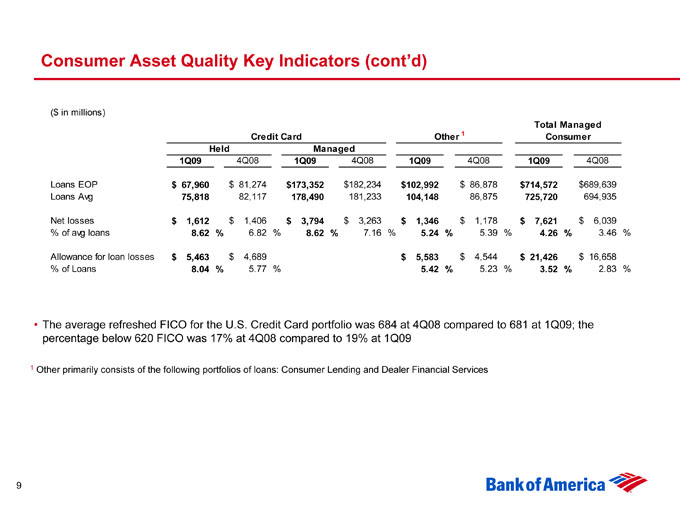
Consumer Asset Quality Key Indicators (cont’d)
($ in millions)
Total Managed
Credit Card Other 1 Consumer
Held Managed
1Q09 4Q08 1Q09 4Q08 1Q09 4Q08 1Q09 4Q08
Loans EOP $ 67,960 $ 81,274 $173,352 $182,234 $102,992 $ 86,878 $714,572 $689,639
Loans Avg 75,818 82,117 178,490 181,233 104,148 86,875 725,720 694,935
Net losses $ 1,612 $ 1,406 $ 3,794 $ 3,263 $ 1,346 $ 1,178 $ 7,621 $ 6,039
% of avg loans 8.62 % 6.82 % 8.62 % 7.16 % 5.24 % 5.39 % 4.26 % 3.46 %
Allowance for loan losses $ 5,463 $ 4,689 $ 5,583 $ 4,544 $ 21,426 $ 16,658
% of Loans 8.04 % 5.77 % 5.42 % 5.23 % 3.52 % 2.83 %
o The average refreshed FICO for the U.S. Credit Card portfolio was 684 at 4Q08 compared to 681 at 1Q09; the percentage below 620 FICO was 17% at 4Q08 compared to 19% at 1Q09
1 Other primarily consists of the following portfolios of loans: Consumer Lending and Dealer Financial Services
9
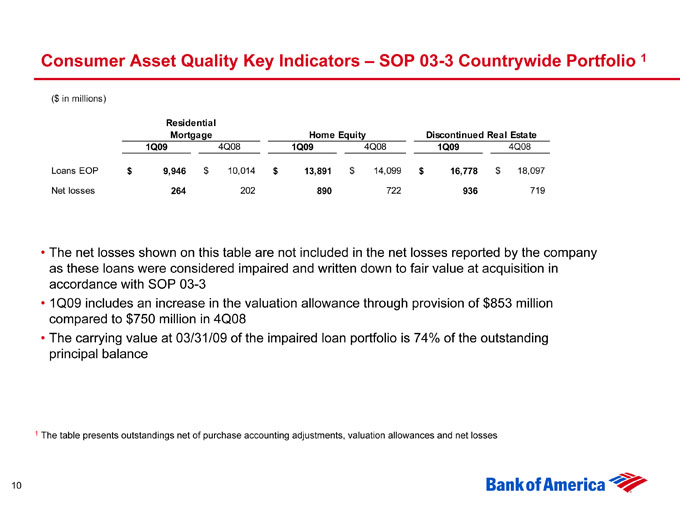
Consumer Asset Quality Key Indicators - SOP 03-3 Countrywide Portfolio 1
($ in millions)
Residential
Mortgage Home Equity Discontinued Real Estate
1Q09 4Q08 1Q09 4Q08 1Q09 4Q08
Loans EOP $ 9,946 $ 10,014 $ 13,891 $ 14,099 $ 16,778 $ 18,097
Net losses 264 202 890 722 936 719
o The net losses shown on this table are not included in the net losses reported by the company as these loans were considered impaired and written down to fair value at acquisition in accordance with SOP 03-3
o 1Q09 includes an increase in the valuation allowance through provision of $853 million compared to $750 million in 4Q08
o The carrying value at 03/31/09 of the impaired loan portfolio is 74% of the outstanding principal balance
1 The table presents outstandings net of purchase accounting adjustments, valuation allowances and net losses
10
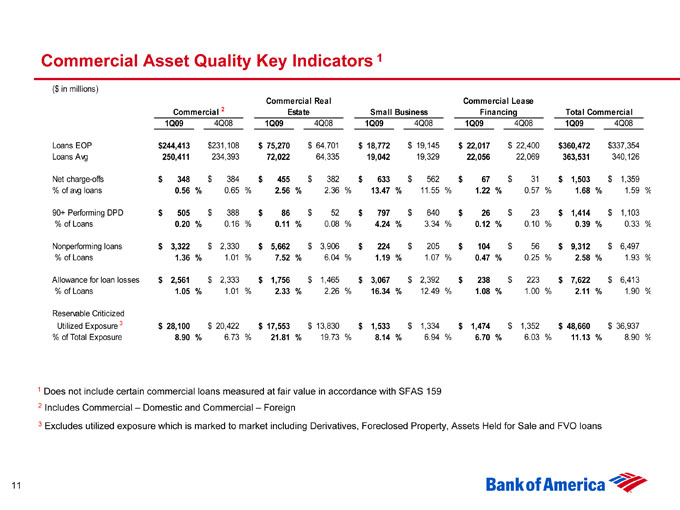
Commercial Asset Quality Key Indicators 1
($ in millions)
Commercial Real Commercial Lease
Commercial 2 Estate Small Business Financing Total Commercial
1Q09 4Q08 1Q09 4Q08 1Q09 4Q08 1Q09 4Q08 1Q09 4Q08
Loans EOP $244,413 $231,108 $ 75,270 $ 64,701 $ 18,772 $ 19,145 $ 22,017 $ 22,400 $360,472 $337,354
Loans Avg 250,411 234,393 72,022 64,335 19,042 19,329 22,056 22,069 363,531 340,126
Net charge-offs $ 348 $ 384 $ 455 $ 382 $ 633 $ 562 $ 67 $ 31 $ 1,503 $ 1,359
% of avg loans 0.56 % 0.65 % 2.56 % 2.36 % 13.47 % 11.55 % 1.22 % 0.57 % 1.68 % 1.59 %
90+ Performing DPD $ 505 $ 388 $ 86 $ 52 $ 797 $ 640 $ 26 $ 23 $ 1,414 $ 1,103
% of Loans 0.20 % 0.16 % 0.11 % 0.08 % 4.24 % 3.34 % 0.12 % 0.10 % 0.39 % 0.33 %
Nonperforming loans $ 3,322 $ 2,330 $ 5,662 $ 3,906 $ 224 $ 205 $ 104 $ 56 $ 9,312 $ 6,497
% of Loans 1.36 % 1.01 % 7.52 % 6.04 % 1.19 % 1.07 % 0.47 % 0.25 % 2.58 % 1.93 %
Allowance for loan losses $ 2,561 $ 2,333 $ 1,756 $ 1,465 $ 3,067 $ 2,392 $ 238 $ 223 $ 7,622 $ 6,413
% of Loans 1.05 % 1.01 % 2.33 % 2.26 % 16.34 % 12.49 % 1.08 % 1.00 % 2.11 % 1.90 %
Reservable Criticized
Utilized Exposure 3 $ 28,100 $ 20,422 $ 17,553 $ 13,830 $ 1,533 $ 1,334 $ 1,474 $ 1,352 $ 48,660 $ 36,937
% of Total Exposure 8.90 % 6.73 % 21.81 % 19.73 % 8.14 % 6.94 % 6.70 % 6.03 % 11.13 % 8.90 %
1 Does not include certain commercial loans measured at fair value in accordance with SFAS 159
2 Includes Commercial - Domestic and Commercial - Foreign
3 Excludes utilized exposure which is marked to market including Derivatives, Foreclosed Property, Assets Held for Sale and FVO loans
11

Commercial Real Estate
Homebuilders
• Homebuilder utilized balances at 1Q09, included in commercial real estate, decreased $294 million to $11.4 billion compared to 4Q08. These utilized balances are included in total exposure of $15.2 billion
– Reservable criticized utilized exposure increased $103 million to $7.7 billion (44% of reservable criticized utilized commercial real estate exposure)
– NPAs rose $687 million to $3.7 billion (62% of commercial real estate NPAs)
– 1Q09 charge-offs were $301 million compared to $355 million in 4Q08
• Homebuilder construction and land development utilized balances at 1Q09 decreased $512 million to $8.8 billion compared to 4Q08
– Reservable criticized utilized exposure increased $251 million to $6.9 billion
– NPAs rose $615 million to $3.2 billion
12
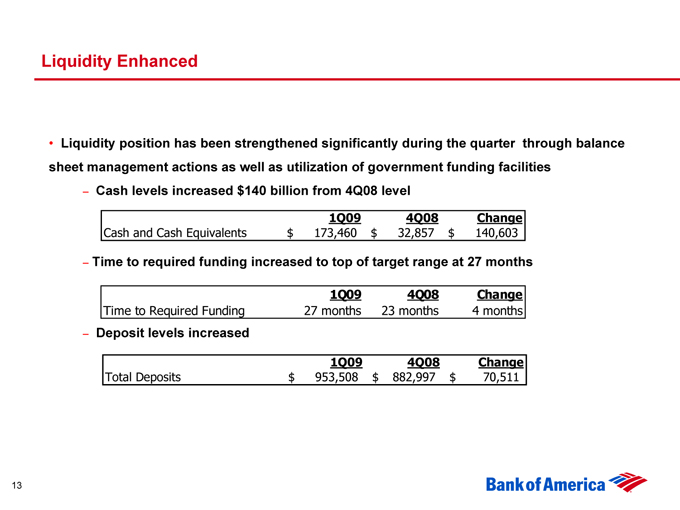
Liquidity Enhanced
• Liquidity position has been strengthened significantly during the quarter through balance sheet management actions as well as utilization of government funding facilities
– Cash levels increased $140 billion from 4Q08 level
1Q09 4Q08 Change
Cash and Cash Equivalents $ 173,460 $ 32,857 $ 140,603
– Time to required funding increased to top of target range at 27 months
1Q09 4Q08 Change
Time to Required Funding 27 months 23 months 4 months
– Deposit levels increased
1Q09 4Q08 Change
Total Deposits $ 953,508 $ 882,997 $ 70,511
13