Exhibit 99.2

Supplemental Information
Second Quarter 2009
This information is preliminary and based on company data available at the time of the presentation. It speaks only as of the particular date or dates included in the accompanying pages. Bank of America does not undertake an obligation to, and disclaims any duty to, update any of the information provided. Any forward-looking statements in this information are subject to the forward-looking language contained in Bank of America’s reports filed with the SEC pursuant to the Securities Exchange Act of 1934, which are available at the SEC’s website (www.sec.gov) or at Bank of America’s website (www.bankofamerica.com). Bank of America’s future financial performance is subject to risks and uncertainties as described in its SEC filings.
| | |
| Bank of America Corporation and Subsidiaries | | |
| Table of Contents | | Page |
| |
Consolidated Financial Highlights | | 2 |
Supplemental Financial Data | | 3 |
Consolidated Statement of Income | | 4 |
Consolidated Balance Sheet | | 5 |
Capital Management | | 6 |
Preferred Stock Issued Excluding Issuances to the U.S. Government | | 7 |
Core Net Interest Income - Managed Basis | | 8 |
Quarterly Average Balances and Interest Rates | | 9 |
Quarterly Average Balances and Interest Rates - Isolating Hedge Income/Expense | | 10 |
Year-to-Date Average Balances and Interest Rates | | 11 |
Year-to-Date Average Balances and Interest Rates - Isolating Hedge Income/Expense | | 12 |
Debt Securities and Available-for-Sale Marketable Equity Securities | | 13 |
Quarterly Results by Business Segment | | 14 |
Year-to-Date Results by Business Segment | | 15 |
Deposits | | |
Total Segment Results | | 16 |
Key Indicators | | 17 |
Global Card Services | | |
Total Segment Results | | 18 |
Key Indicators | | 19 |
Home Loans & Insurance | | |
Total Segment Results | | 20 |
Key Indicators | | 21 |
Global Banking | | |
Total Segment Results | | 22 |
Key Indicators | | 23 |
Investment Banking Product Rankings | | 24 |
Global Markets | | |
Total Segment Results | | 25 |
Off-Balance Sheet Special Purpose Entities Liquidity Exposure | | 26 |
Super Senior Collateralized Debt Obligation Exposure | | 27 |
Unhedged Subprime Super Senior Collateralized Debt Obligation Carrying Values | | 28 |
Global Wealth & Investment Management | | |
Total Segment Results | | 29 |
Quarter-to-Date Business Results | | 30 |
Year-to-Date Business Results | | 31 |
Key Indicators | | 32 |
All Other | | |
Total Segment Results | | 33 |
Equity Investments | | 34 |
Outstanding Loans and Leases | | 35 |
Quarterly Average Loans and Leases by Business Segment | | 36 |
Commercial Credit Exposure by Industry | | 37 |
Net Credit Default Protection by Maturity Profile and Credit Exposure Debt Rating | | 38 |
Selected Emerging Markets | | 39 |
Nonperforming Assets | | 40 |
Nonperforming Asset Activity | | 41 |
Quarterly Net Charge-offs/Losses and Net Charge-off/Loss Ratios | | 42 |
YTD Net Charge-offs/Losses and Net Charge-off/Loss Ratios | | 43 |
Allocation of the Allowance for Credit Losses by Product Type | | 44 |
| |
Exhibit A: Non-GAAP Reconciliations | | 45 |
| |
Appendix: Selected Slides from the Second Quarter 2009 Earnings Release Presentation | | 47 |
1
Bank of America Corporation and Subsidiaries
Consolidated Financial Highlights
(Dollars in millions, except per share information; shares in thousands)
| | | | | | | | | | | | | | | | | | | | | | | | | | | | | | | | | | | | | |
| | | Six Months Ended
June 30 | | | | Second
Quarter
2009 | | | | | First
Quarter
2009 | | | | Fourth
Quarter
2008 (1) | | | | | Third
Quarter
2008 | | | | Second
Quarter
2008 | | |
| | | 2009 | | | | 2008 | | | | | | | | | | | | |
Income statement | | | | | | | | | | | | | | | | | | | | | | | | | | | | | | | | | | | | | |
Net interest income | | $ | 24,127 | | | | $ | 20,612 | | | | $ | 11,630 | | | | | $ | 12,497 | | | | $ | 13,106 | | | | | $ | 11,642 | | | | $ | 10,621 | | |
Noninterest income | | | 44,405 | | | | | 16,869 | | | | | 21,144 | | | | | | 23,261 | | | | | 2,574 | | | | | | 7,979 | | | | | 9,789 | | |
Total revenue, net of interest expense | | | 68,532 | | | | | 37,481 | | | | | 32,774 | | | | | | 35,758 | | | | | 15,680 | | | | | | 19,621 | | | | | 20,410 | | |
Provision for credit losses | | | 26,755 | | | | | 11,840 | | | | | 13,375 | | | | | | 13,380 | | | | | 8,535 | | | | | | 6,450 | | | | | 5,830 | | |
Noninterest expense, before merger and restructuring charges | | | 32,428 | | | | | 18,540 | | | | | 16,191 | | | | | | 16,237 | | | | | 10,641 | | | | | | 11,413 | | | | | 9,447 | | |
Merger and restructuring charges | | | 1,594 | | | | | 382 | | | | | 829 | | | | | | 765 | | | | | 306 | | | | | | 247 | | | | | 212 | | |
Income tax expense (benefit) | | | 284 | | | | | 2,099 | | | | | (845 | ) | | | | | 1,129 | | | | | (2,013 | ) | | | | | 334 | | | | | 1,511 | | |
Net income (loss) | | | 7,471 | | | | | 4,620 | | | | | 3,224 | | | | | | 4,247 | | | | | (1,789 | ) | | | | | 1,177 | | | | | 3,410 | | |
Preferred stock dividends | | | 2,238 | | | | | 376 | | | | | 805 | | | | | | 1,433 | | | | | 603 | | | | | | 473 | | | | | 186 | | |
Net income (loss) applicable to common shareholders | | | 5,233 | | | | | 4,244 | | | | | 2,419 | | | | | | 2,814 | | | | | (2,392 | ) | | | | | 704 | | | | | 3,224 | | |
Diluted earnings (loss) per common share | | | 0.75 | | | | | 0.95 | | | | | 0.33 | | | | | | 0.44 | | | | | (0.48 | ) | | | | | 0.15 | | | | | 0.72 | | |
Average diluted common shares issued and outstanding | | | 6,836,972 | | | | | 4,445,428 | | | | | 7,269,518 | | | | | | 6,431,027 | | | | | 4,957,049 | | | | | | 4,547,578 | | | | | 4,444,098 | | |
Dividends paid per common share | | $ | 0.02 | | | | $ | 1.28 | | | | $ | 0.01 | | | | | $ | 0.01 | | | | $ | 0.32 | | | | | $ | 0.64 | | | | $ | 0.64 | | |
| | | | | | | | | | | | | | |
Performance ratios | | | | | | | | | | | | | | | | | | | | | | | | | | | | | | | | | | | | | |
Return on average assets | | | 0.61 | | % | | | 0.53 | | % | | | 0.53 | | | % | | | 0.68 | | % | | | n/m | | | % | | | 0.25 | | % | | | 0.78 | | % |
Return on average common shareholders’ equity | | | 6.31 | | | | | 6.06 | | | | | 5.59 | | | | | | 7.10 | | | | | n/m | | | | | | 1.97 | | | | | 9.25 | | |
Return on average tangible common shareholders’ equity (2) | | | 20.47 | | | | | 16.87 | | | | | 16.90 | | | | | | 24.37 | | | | | n/m | | | | | | 8.92 | | | | | 25.17 | | |
Return on average tangible shareholders’ equity(2) | | | 10.59 | | | | | 12.85 | | | | | 8.86 | | | | | | 12.42 | | | | | n/m | | | | | | 6.11 | | | | | 18.12 | | |
At period end | | | | | | | | | | | | | | | | | | | | | | | | | | | | | | | | | | | | | |
Book value per share of common stock | | $ | 22.71 | | | | $ | 31.11 | | | | $ | 22.71 | | | | | $ | 25.98 | | | | $ | 27.77 | | | | | $ | 30.01 | | | | $ | 31.11 | | |
Tangible book value per share of common stock(2) | | | 11.66 | | | | | 11.87 | | | | | 11.66 | | | | | | 10.88 | | | | | 10.11 | | | | | | 10.50 | | | | | 11.87 | | |
Market price per share of common stock: | | | | | | | | | | | | | | | | | | | | | | | | | | | | | | | | | | | | | |
Closing price | | $ | 13.20 | | | | $ | 23.87 | | | | $ | 13.20 | | | | | $ | 6.82 | | | | $ | 14.08 | | | | | $ | 35.00 | | | | $ | 23.87 | | |
High closing price for the period | | | 14.33 | | | | | 45.03 | | | | | 14.17 | | | | | | 14.33 | | | | | 38.13 | | | | | | 37.48 | | | | | 40.86 | | |
Low closing price for the period | | | 3.14 | | | | | 23.87 | | | | | 7.05 | | | | | | 3.14 | | | | | 11.25 | | | | | | 18.52 | | | | | 23.87 | | |
Market capitalization | | | 114,199 | | | | | 106,292 | | | | | 114,199 | | | | | | 43,654 | | | | | 70,645 | | | | | | 159,672 | | | | | 106,292 | | |
| | | | | | | | | | | | | | |
Number of banking centers - domestic | | | 6,109 | | | | | 6,131 | | | | | 6,109 | | | | | | 6,145 | | | | | 6,139 | | | | | | 6,139 | | | | | 6,131 | | |
Number of branded ATMs - domestic | | | 18,426 | | | | | 18,531 | | | | | 18,426 | | | | | | 18,532 | | | | | 18,685 | | | | | | 18,584 | | | | | 18,531 | | |
Full-time equivalent employees | | | 282,408 | | | | | 206,587 | | | | | 282,408 | | | | | | 286,625 | | | | | 240,202 | | | | | | 247,024 | | | | | 206,587 | | |
| (1) | Due to a net loss for the three months ended December 31, 2008, the impact of antidilutive equity instruments were excluded from diluted earnings per share and average diluted common shares. |
| (2) | Tangible equity ratios and tangible book value per share of common stock are non-GAAP measures. For corresponding reconciliations of average tangible common shareholders’ equity and tangible shareholders’ equity to GAAP financial measures, see Supplemental Financial Data on page 3. We believe the use of these non-GAAP measures provide additional clarity in assessing the results of the Corporation. |
n/m = not meaningful
Certain prior period amounts have been reclassified to conform to current period presentation.
Information for periods beginning July 1, 2008 includes the Countrywide acquisition. Information for periods beginning January 1, 2009 includes the
Merrill Lynch acquisition. Prior periods have not been restated.
| | |
| This information is preliminary and based on company data available at the time of the presentation. | | 2 |
Bank of America Corporation and Subsidiaries
Supplemental Financial Data
(Dollars in millions)
Fully taxable-equivalent basis data
| | | | | | | | | | | | | | | | | | | | | | | | | | | | | | | | | | | | | | | | | | | | |
| | | Six Months Ended
June 30 | | | | | | | Second
Quarter | | | | | First
Quarter | | | | | Fourth
Quarter | | | | | Third
Quarter | | | | | Second
Quarter | | | |
| | | 2009 | | | | | 2008 | | | | | | 2009 | | | | 2009 | | | | 2008 | | | | 2008 | | | | 2008 | | |
Net interest income | | $ | 24,761 | | | | | $ | 21,228 | | | | | | | $ | 11,942 | | | | | $ | 12,819 | | | | | $ | 13,406 | | | | | $ | 11,920 | | | | | $ | 10,937 | | | |
Total revenue, net of interest expense | | | 69,166 | | | | | | 38,097 | | | | | | | | 33,086 | | | | | | 36,080 | | | | | | 15,980 | | | | | | 19,899 | | | | | | 20,726 | | | |
Net interest yield | | | 2.67 | | | % | | | 2.83 | | | % | | | | | 2.64 | | | % | | | 2.70 | | | % | | | 3.31 | | | % | | | 2.93 | | | % | | | 2.92 | | | % |
Efficiency ratio | | | 49.19 | | | | | | 49.67 | | | | | | | | 51.44 | | | | | | 47.12 | | | | | | 68.51 | | | | | | 58.60 | | | | | | 46.60 | | | |
Reconciliation to GAAP financial measures The Corporation evaluates its business based upon ratios that utilize tangible equity which is a non-GAAP measure. Return on average tangible shareholders’ equity measures the Corporation’s earnings contribution as a percentage of shareholders’ equity reduced by goodwill and intangible assets (excluding mortgage servicing rights), net of related deferred tax liabilities. The tangible equity ratio and the tangible common equity ratio represent shareholders’ equity, common or total as applicable, less goodwill and intangible assets (excluding mortgage servicing rights), net of related deferred tax liabilities divided by total assets less goodwill and intangible assets (excluding mortgage servicing rights), net of related deferred tax liabilities. These measures are used to evaluate the Corporation’s use of equity (i.e., capital). In addition, profitability, relationship, and investment models all use return on average tangible shareholders’ equity as key measures to support our overall growth goals. Also, the efficiency ratio measures the costs expended to generate a dollar of revenue. We believe the use of these non-GAAP measures provides additional clarity in assessing the results of the Corporation. Other companies may define or calculate supplemental financial data differently. See the tables below for supplemental financial data and corresponding reconciliations to GAAP financial measures for the three months ended June 30, 2009, March 31, 2009, December 31, 2008, September 30, 2008 and June 30, 2008, and the six months ended June 30, 2009 and 2008. Reconciliation of average shareholders’ equity to average tangible shareholders’ equity |
Shareholders’ equity | | $ | 235,855 | | | | | $ | 158,078 | | | | | | | $ | 242,867 | | | | | $ | 228,766 | | | | | $ | 176,566 | | | | | $ | 166,454 | | | | | $ | 161,428 | | | |
Goodwill | | | (85,956 | ) | | | | | (77,721 | ) | | | | | | | (87,314 | ) | | | | | (84,584 | ) | | | | | (81,841 | ) | | | | | (81,977 | ) | | | | | (77,815 | ) | | |
Intangible assets (excluding MSRs) | | | (11,539 | ) | | | | | (9,824 | ) | | | | | | | (13,595 | ) | | | | | (9,461 | ) | | | | | (8,818 | ) | | | | | (9,547 | ) | | | | | (9,618 | ) | | |
Related deferred tax liabilities | | | 3,946 | | | | | | 1,766 | | | | | | | | 3,916 | | | | | | 3,977 | | | | | | 1,913 | | | | | | 1,683 | | | | | | 1,687 | | | |
| | | | | | | | | | | | | | | | | | | | | | | | | | | | | | | | | | | | | | | | | | | | |
Tangible shareholders’ equity | | $ | 142,306 | | | | | $ | 72,299 | | | | | | | $ | 145,874 | | | | | $ | 138,698 | | | | | $ | 87,820 | | | | | $ | 76,613 | | | | | $ | 75,682 | | | |
| | | | | | | | | | | | | | | | | | | | | | | | | | | | | | | | | | | | | | | | | | | | |
Reconciliation of average common shareholders’ equity to average tangible common shareholders’ equity |
Common shareholders’ equity | | $ | 167,153 | | | | | $ | 140,849 | | | | | | | $ | 173,497 | | | | | $ | 160,739 | | | | | $ | 142,535 | | | | | $ | 142,303 | | | | | $ | 140,243 | | | |
Goodwill | | | (85,956 | ) | | | | | (77,721 | ) | | | | | | | (87,314 | ) | | | | | (84,584 | ) | | | | | (81,841 | ) | | | | | (81,977 | ) | | | | | (77,815 | ) | | |
Intangible assets (excluding MSRs) | | | (11,539 | ) | | | | | (9,824 | ) | | | | | | | (13,595 | ) | | | | | (9,461 | ) | | | | | (8,818 | ) | | | | | (9,547 | ) | | | | | (9,618 | ) | | |
Related deferred tax liabilities | | | 3,946 | | | | | | 1,766 | | | | | | | | 3,916 | | | | | | 3,977 | | | | | | 1,913 | | | | | | 1,683 | | | | | | 1,687 | | | |
| | | | | | | | | | | | | | | | | | | | | | | | | | | | | | | | | | | | | | | | | | | | |
Tangible common shareholders’ equity | | $ | 73,604 | | | | | $ | 55,070 | | | | | | | $ | 76,504 | | | | | $ | 70,671 | | | | | $ | 53,789 | | | | | $ | 52,462 | | | | | $ | 54,497 | | | |
| | | | | | | | | | | | | | | | | | | | | | | | | | | | | | | | | | | | | | | | | | | | |
Reconciliation of period end shareholders’ equity to period end tangible shareholders’ equity |
Shareholders’ equity | | $ | 255,152 | | | | | $ | 162,691 | | | | | | | $ | 255,152 | | | | | $ | 239,549 | | | | | $ | 177,052 | | | | | $ | 161,039 | | | | | $ | 162,691 | | | |
Goodwill | | | (86,246 | ) | | | | | (77,760 | ) | | | | | | | (86,246 | ) | | | | | (86,910 | ) | | | | | (81,934 | ) | | | | | (81,756 | ) | | | | | (77,760 | ) | | |
Intangible assets (excluding MSRs) | | | (13,245 | ) | | | | | (9,603 | ) | | | | | | | (13,245 | ) | | | | | (13,703 | ) | | | | | (8,535 | ) | | | | | (9,167 | ) | | | | | (9,603 | ) | | |
Related deferred tax liabilities | | | 3,843 | | | | | | 1,679 | | | | | | | | 3,843 | | | | | | 3,958 | | | | | | 1,854 | | | | | | 1,914 | | | | | | 1,679 | | | |
| | | | | | | | | | | | | | | | | | | | | | | | | | | | | | | | | | | | | | | | | | | | |
Tangible shareholders’ equity | | $ | 159,504 | | | | | $ | 77,007 | | | | | | | $ | 159,504 | | | | | $ | 142,894 | | | | | $ | 88,437 | | | | | $ | 72,030 | | | | | $ | 77,007 | | | |
| | | | | | | | | | | | | | | | | | | | | | | | | | | | | | | | | | | | | | | | | | | | |
Reconciliation of period end common shareholders’ equity to period end tangible common shareholders’ equity |
Common shareholders’ equity | | $ | 196,492 | | | | | $ | 138,540 | | | | | | | $ | 196,492 | | | | | $ | 166,272 | | | | | $ | 139,351 | | | | | $ | 136,888 | | | | | $ | 138,540 | | | |
Goodwill | | | (86,246 | ) | | | | | (77,760 | ) | | | | | | | (86,246 | ) | | | | | (86,910 | ) | | | | | (81,934 | ) | | | | | (81,756 | ) | | | | | (77,760 | ) | | |
Intangible assets (excluding MSRs) | | | (13,245 | ) | | | | | (9,603 | ) | | | | | | | (13,245 | ) | | | | | (13,703 | ) | | | | | (8,535 | ) | | | | | (9,167 | ) | | | | | (9,603 | ) | | |
Related deferred tax liabilities | | | 3,843 | | | | | | 1,679 | | | | | | | | 3,843 | | | | | | 3,958 | | | | | | 1,854 | | | | | | 1,914 | | | | | | 1,679 | | | |
| | | | | | | | | | | | | | | | | | | | | | | | | | | | | | | | | | | | | | | | | | | | |
Tangible common shareholders’ equity | | $ | 100,844 | | | | | $ | 52,856 | | | | | | | $ | 100,844 | | | | | $ | 69,617 | | | | | $ | 50,736 | | | | | $ | 47,879 | | | | | $ | 52,856 | | | |
| | | | | | | | | | | | | | | | | | | | | | | | | | | | | | | | | | | | | | | | | | | | |
Reconciliation of period end assets to period end tangible assets |
Assets | | $ | 2,254,394 | | | | | $ | 1,716,875 | | | | | | | $ | 2,254,394 | | | | | $ | 2,321,963 | | | | | $ | 1,817,943 | | | | | $ | 1,831,177 | | | | | $ | 1,716,875 | | | |
Goodwill | | | (86,246 | ) | | | | | (77,760 | ) | | | | | | | (86,246 | ) | | | | | (86,910 | ) | | | | | (81,934 | ) | | | | | (81,756 | ) | | | | | (77,760 | ) | | |
Intangible assets (excluding MSRs) | | | (13,245 | ) | | | | | (9,603 | ) | | | | | | | (13,245 | ) | | | | | (13,703 | ) | | | | | (8,535 | ) | | | | | (9,167 | ) | | | | | (9,603 | ) | | |
Related deferred tax liabilities | | | 3,843 | | | | | | 1,679 | | | | | | | | 3,843 | | | | | | 3,958 | | | | | | 1,854 | | | | | | 1,914 | | | | | | 1,679 | | | |
| | | | | | | | | | | | | | | | | | | | | | | | | | | | | | | | | | | | | | | | | | | | |
Tangible assets | | $ | 2,158,746 | | | | | $ | 1,631,191 | | | | | | | $ | 2,158,746 | | | | | $ | 2,225,308 | | | | | $ | 1,729,328 | | | | | $ | 1,742,168 | | | | | $ | 1,631,191 | | | |
| | | | | | | | | | | | | | | | | | | | | | | | | | | | | | | | | | | | | | | | | | | | |
Certain prior period amounts have been reclassified to conform to current period presentation.
Information for periods beginning July 1, 2008 includes the Countrywide acquisition. Information for periods beginning January 1, 2009 includes the
Merrill Lynch acquisition. Prior periods have not been restated.
| | |
| This information is preliminary and based on company data available at the time of the presentation. | | 3 |
Bank of America Corporation and Subsidiaries
Consolidated Statement of Income
(Dollars in millions, except per share information; shares in thousands)
| | | | | | | | | | | | | | | | | | | | | | | | | | | | |
| | | Six Months Ended
June 30 | | | | | Second
Quarter
2009 | | | First
Quarter
2009 | | Fourth
Quarter
2008(1) | | | Third
Quarter
2008 | | | Second
Quarter
2008 | |
| | | 2009 | | 2008 | | | | | | | | |
Interest income | | | | | | | | | | | | | | | | | | | | | | | | | | | | |
Interest and fees on loans and leases | | $ | 25,678 | | $ | 27,536 | | | | | $ | 12,329 | | | $ | 13,349 | | $ | 14,220 | | | $ | 14,261 | | | $ | 13,121 | |
Interest on debt securities | | | 7,113 | | | 5,674 | | | | | | 3,283 | | | | 3,830 | | | 3,851 | | | | 3,621 | | | | 2,900 | |
Federal funds sold and securities borrowed or purchased under agreements to resell | | | 1,845 | | | 2,008 | | | | | | 690 | | | | 1,155 | | | 393 | | | | 912 | | | | 800 | |
Trading account assets | | | 4,380 | | | 4,593 | | | | | | 1,952 | | | | 2,428 | | | 2,120 | | | | 2,344 | | | | 2,229 | |
Other interest income | | | 2,732 | | | 2,075 | | | | | | 1,338 | | | | 1,394 | | | 1,018 | | | | 1,058 | | | | 977 | |
| | | | | | | | | | | | | | | | | | | | | | | | | | | | |
Total interest income | | | 41,748 | | | 41,886 | | | | | | 19,592 | | | | 22,156 | | | 21,602 | | | | 22,196 | | | | 20,027 | |
| | | | | | | | | | | | | | | | | | | | | | | | | | | | |
Interest expense | | | | | | | | | | | | | | | | | | | | | | | | | | | | |
Deposits | | | 4,625 | | | 8,108 | | | | | | 2,082 | | | | 2,543 | | | 3,296 | | | | 3,846 | | | | 3,520 | |
Short-term borrowings | | | 3,617 | | | 7,229 | | | | | | 1,396 | | | | 2,221 | | | 1,910 | | | | 3,223 | | | | 3,087 | |
Trading account liabilities | | | 1,029 | | | 1,589 | | | | | | 450 | | | | 579 | | | 524 | | | | 661 | | | | 749 | |
Long-term debt | | | 8,350 | | | 4,348 | | | | | | 4,034 | | | | 4,316 | | | 2,766 | | | | 2,824 | | | | 2,050 | |
| | | | | | | | | | | | | | | | | | | | | | | | | | | | |
Total interest expense | | | 17,621 | | | 21,274 | | | | | | 7,962 | | | | 9,659 | | | 8,496 | | | | 10,554 | | | | 9,406 | |
| | | | | | | | | | | | | | | | | | | | | | | | | | | | |
Net interest income | | | 24,127 | | | 20,612 | | | | | | 11,630 | | | | 12,497 | | | 13,106 | | | | 11,642 | | | | 10,621 | |
| | | | | | | | |
Noninterest income | | | | | | | | | | | | | | | | | | | | | | | | | | | | |
Card income | | | 5,014 | | | 7,090 | | | | | | 2,149 | | | | 2,865 | | | 3,102 | | | | 3,122 | | | | 3,451 | |
Service charges | | | 5,262 | | | 5,035 | | | | | | 2,729 | | | | 2,533 | | | 2,559 | | | | 2,722 | | | | 2,638 | |
Investment and brokerage services | | | 5,957 | | | 2,662 | | | | | | 2,994 | | | | 2,963 | | | 1,072 | | | | 1,238 | | | | 1,322 | |
Investment banking income | | | 2,701 | | | 1,171 | | | | | | 1,646 | | | | 1,055 | | | 618 | | | | 474 | | | | 695 | |
Equity investment income (loss) | | | 7,145 | | | 1,646 | | | | | | 5,943 | | | | 1,202 | | | (791 | ) | | | (316 | ) | | | 592 | |
Trading account profits (losses) | | | 7,365 | | | (1,426 | ) | | | | | 2,164 | | | | 5,201 | | | (4,101 | ) | | | (384 | ) | | | 357 | |
Mortgage banking income | | | 5,841 | | | 890 | | | | | | 2,527 | | | | 3,314 | | | 1,523 | | | | 1,674 | | | | 439 | |
Insurance income | | | 1,350 | | | 414 | | | | | | 662 | | | | 688 | | | 741 | | | | 678 | | | | 217 | |
Gains on sales of debt securities | | | 2,130 | | | 352 | | | | | | 632 | | | | 1,498 | | | 762 | | | | 10 | | | | 127 | |
Other income (loss) | | | 1,640 | | | (965 | ) | | | | | (302 | ) | | | 1,942 | | | (2,911 | ) | | | (1,239 | ) | | | (49 | ) |
| | | | | | | | | | | | | | | | | | | | | | | | | | | | |
Total noninterest income | | | 44,405 | | | 16,869 | | | | | | 21,144 | | | | 23,261 | | | 2,574 | | | | 7,979 | | | | 9,789 | |
| | | | | | | | | | | | | | | | | | | | | | | | | | | | |
Total revenue, net of interest expense | | | 68,532 | | | 37,481 | | | | | | 32,774 | | | | 35,758 | | | 15,680 | | | | 19,621 | | | | 20,410 | |
| | | | | | | | |
Provision for credit losses | | | 26,755 | | | 11,840 | | | | | | 13,375 | | | | 13,380 | | | 8,535 | | | | 6,450 | | | | 5,830 | |
| | | | | | | | |
Noninterest expense | | | | | | | | | | | | | | | | | | | | | | | | | | | | |
Personnel | | | 16,558 | | | 9,146 | | | | | | 7,790 | | | | 8,768 | | | 4,027 | | | | 5,198 | | | | 4,420 | |
Occupancy | | | 2,347 | | | 1,697 | | | | | | 1,219 | | | | 1,128 | | | 1,003 | | | | 926 | | | | 848 | |
Equipment | | | 1,238 | | | 768 | | | | | | 616 | | | | 622 | | | 447 | | | | 440 | | | | 372 | |
Marketing | | | 1,020 | | | 1,208 | | | | | | 499 | | | | 521 | | | 555 | | | | 605 | | | | 571 | |
Professional fees | | | 949 | | | 647 | | | | | | 544 | | | | 405 | | | 521 | | | | 424 | | | | 362 | |
Amortization of intangibles | | | 1,036 | | | 893 | | | | | | 516 | | | | 520 | | | 477 | | | | 464 | | | | 447 | |
Data processing | | | 1,269 | | | 1,150 | | | | | | 621 | | | | 648 | | | 641 | | | | 755 | | | | 587 | |
Telecommunications | | | 672 | | | 526 | | | | | | 345 | | | | 327 | | | 292 | | | | 288 | | | | 266 | |
Other general operating | | | 7,339 | | | 2,505 | | | | | | 4,041 | | | | 3,298 | | | 2,678 | | | | 2,313 | | | | 1,574 | |
Merger and restructuring charges | | | 1,594 | | | 382 | | | | | | 829 | | | | 765 | | | 306 | | | | 247 | | | | 212 | |
| | | | | | | | | | | | | | | | | | | | | | | | | | | | |
Total noninterest expense | | | 34,022 | | | 18,922 | | | | | | 17,020 | | | | 17,002 | | | 10,947 | | | | 11,660 | | | | 9,659 | |
| | | | | | | | | | | | | | | | | | | | | | | | | | | | |
Income (loss) before income taxes | | | 7,755 | | | 6,719 | | | | | | 2,379 | | | | 5,376 | | | (3,802 | ) | | | 1,511 | | | | 4,921 | |
Income tax expense (benefit) | | | 284 | | | 2,099 | | | | | | (845 | ) | | | 1,129 | | | (2,013 | ) | | | 334 | | | | 1,511 | |
| | | | | | | | | | | | | | | | | | | | | | | | | | | | |
Net income (loss) | | $ | 7,471 | | $ | 4,620 | | | | | $ | 3,224 | | | $ | 4,247 | | $ | (1,789 | ) | | $ | 1,177 | | | $ | 3,410 | |
| | | | | | | | | | | | | | | | | | | | | | | | | | | | |
Preferred stock dividends | | | 2,238 | | | 376 | | | | | | 805 | | | | 1,433 | | | 603 | | | | 473 | | | | 186 | |
| | | | | | | | | | | | | | | | | | | | | | | | | | | | |
Net income (loss) applicable to common shareholders | | $ | 5,233 | | $ | 4,244 | | | | | $ | 2,419 | | | $ | 2,814 | | $ | (2,392 | ) | | $ | 704 | | | $ | 3,224 | |
| | | | | | | | | | | | | | | | | | | | | | | | | | | | |
| | | | | | | | |
Per common share information | | | | | | | | | | | | | | | | | | | | | | | | | | | | |
Earnings (loss) | | $ | 0.75 | | $ | 0.95 | | | | | $ | 0.33 | | | $ | 0.44 | | $ | (0.48 | ) | | $ | 0.15 | | | $ | 0.72 | |
Diluted earnings (loss) | | | 0.75 | | | 0.95 | | | | | | 0.33 | | | | 0.44 | | | (0.48 | ) | | | 0.15 | | | | 0.72 | |
Dividends paid | | | 0.02 | | | 1.28 | | | | | | 0.01 | | | | 0.01 | | | 0.32 | | | | 0.64 | | | | 0.64 | |
| | | | | | | | | | | | | | | | | | | | | | | | | | | | |
Average common shares issued and outstanding | | | 6,808,262 | | | 4,431,870 | | | | | | 7,241,515 | | | | 6,370,815 | | | 4,957,049 | | | | 4,543,963 | | | | 4,435,719 | |
| | | | | | | | | | | | | | | | | | | | | | | | | | | | |
Average diluted common shares issued and outstanding | | | 6,836,972 | | | 4,445,428 | | | | | | 7,269,518 | | | | 6,431,027 | | | 4,957,049 | | | | 4,547,578 | | | | 4,444,098 | |
| | | | | | | | | | | | | | | | | | | | | | | | | | | | |
| (1) | Due to a net loss for the three months ended December 31, 2008, the impact of antidilutive equity instruments were excluded from diluted earnings per share and average diluted common shares. |
Certain prior period amounts have been reclassified to conform to current period presentation.
Information for periods beginning July 1, 2008 includes the Countrywide acquisition. Information for periods beginning January 1, 2009 includes the
Merrill Lynch acquisition. Prior periods have not been restated.
| | |
| This information is preliminary and based on company data available at the time of the presentation. | | 4 |
Bank of America Corporation and Subsidiaries
Consolidated Balance Sheet
(Dollars in millions)
| | | | | | | | | | | | |
| | | June 30
2009 | | | March 31
2009 | | | June 30
2008 | |
Assets | | | | | | | | | | | | |
Cash and cash equivalents | | $ | 140,366 | | | $ | 173,460 | | | $ | 39,127 | |
Time deposits placed and other short-term investments | | | 25,710 | | | | 23,947 | | | | 7,649 | |
Federal funds sold and securities borrowed or purchased under agreements to resell | | | 184,685 | | | | 153,230 | | | | 107,070 | |
Trading account assets | | | 199,471 | | | | 203,131 | | | | 167,837 | |
Derivative assets | | | 101,707 | | | | 137,311 | | | | 42,039 | |
Debt securities: | | | | | | | | | | | | |
Available-for-sale | | | 257,519 | | | | 254,194 | | | | 248,591 | |
Held-to-maturity, at cost | | | 9,719 | | | | 8,444 | | | | 1,268 | |
Total debt securities | | | 267,238 | | | | 262,638 | | | | 249,859 | |
Loans and leases, net of allowance: | | | | | | | | | | | | |
Loans and leases | | | 942,248 | | | | 977,008 | | | | 870,464 | |
Allowance for loan and lease losses | | | (33,785 | ) | | | (29,048 | ) | | | (17,130 | ) |
Total loans and leases, net of allowance | | | 908,463 | | | | 947,960 | | | | 853,334 | |
Premises and equipment, net | | | 15,667 | | | | 15,549 | | | | 11,627 | |
Mortgage servicing rights (includes$18,535, $14,096 and $4,250 measured at fair value) | | | 18,857 | | | | 14,425 | | | | 4,577 | |
Goodwill | | | 86,246 | | | | 86,910 | | | | 77,760 | |
Intangible assets | | | 13,245 | | | | 13,703 | | | | 9,603 | |
Loans held-for-sale | | | 50,994 | | | | 40,214 | | | | 23,630 | |
Other assets | | | 241,745 | | | | 249,485 | | | | 122,763 | |
Total assets | | $ | 2,254,394 | | | $ | 2,321,963 | | | $ | 1,716,875 | |
| | | |
Liabilities | | | | | | | | | | | | |
Deposits in domestic offices: | | | | | | | | | | | | |
Noninterest-bearing | | $ | 248,757 | | | $ | 233,902 | | | $ | 199,587 | |
Interest-bearing | | | 650,725 | | | | 639,616 | | | | 497,631 | |
Deposits in foreign offices: | | | | | | | | | | | | |
Noninterest-bearing | | | 4,560 | | | | 4,133 | | | | 3,432 | |
Interest-bearing | | | 66,700 | | | | 75,857 | | | | 84,114 | |
Total deposits | | | 970,742 | | | | 953,508 | | | | 784,764 | |
Federal funds purchased and securities loaned or sold under agreements to repurchase | | | 263,639 | | | | 246,734 | | | | 238,123 | |
Trading account liabilities | | | 53,384 | | | | 52,993 | | | | 70,806 | |
Derivative liabilities | | | 51,300 | | | | 76,582 | | | | 21,095 | |
Commercial paper and other short-term borrowings | | | 96,236 | | | | 185,816 | | | | 177,753 | |
Accrued expenses and other liabilities (includes$1,992, $2,102 and $507 of reserve for unfunded lending commitments) | | | 116,754 | | | | 126,030 | | | | 55,038 | |
Long-term debt | | | 447,187 | | | | 440,751 | | | | 206,605 | |
Total liabilities | | | 1,999,242 | | | | 2,082,414 | | | | 1,554,184 | |
Shareholders’ equity | | | | | | | | | | | | |
Preferred stock, $0.01 par value; authorized - 100,000,000 shares; issued and outstanding -5,760,731, 9,778,142 and 7,602,067 shares | | | 58,660 | | | | 73,277 | | | | 24,151 | |
Common stock and additional paid-in capital, $0.01 par value; authorized -10,000,000,000, 10,000,000,000, and 7,500,000,000 shares; issued and outstanding -8,651,459,122, 6,400,949,995 and 4,452,947,217 shares | | | 128,717 | | | | 100,864 | | | | 61,109 | |
Retained earnings | �� | | 79,210 | | | | 76,877 | | | | 79,920 | |
Accumulated other comprehensive income (loss) | | | (11,227 | ) | | | (11,164 | ) | | | (1,864 | ) |
Other | | | (208 | ) | | | (305 | ) | | | (625 | ) |
Total shareholders’ equity | | | 255,152 | | | | 239,549 | | | | 162,691 | |
Total liabilities and shareholders’ equity | | $ | 2,254,394 | | | $ | 2,321,963 | | | $ | 1,716,875 | |
Certain prior period amounts have been reclassified to conform to current period presentation.
Information for periods beginning July 1, 2008 includes the Countrywide acquisition. Information for periods beginning January 1, 2009 includes the
Merrill Lynch acquisition. Prior periods have not been restated.
| | |
| This information is preliminary and based on company data available at the time of the presentation. | | 5 |
Bank of America Corporation and Subsidiaries
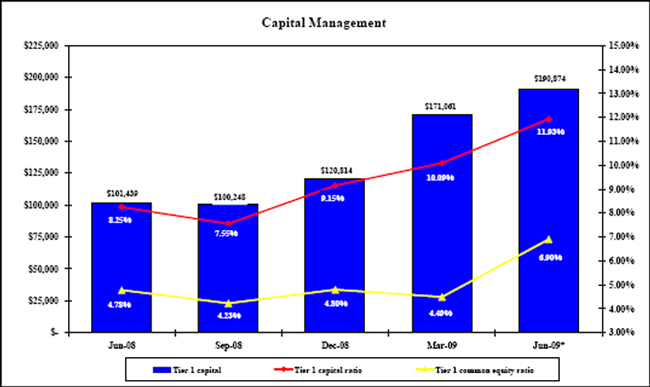
Capital Management
(Dollars in millions)
| | | | | | | | | | | | | | | | | | | | | | | | | |
| | | Second
Quarter
2009 (1) | | | | First
Quarter
2009 | | | | Fourth
Quarter
2008 | | | | Third
Quarter
2008 | | | | Second
Quarter
2008 | | |
Risk-based capital: | | | | | | | | | | | | | | | | | | | | | | | | | |
Tier 1 capital | | $ | 190,874 | | | | $ | 171,061 | | | | $ | 120,814 | | | | $ | 100,248 | | | | $ | 101,439 | | |
Tier 1 common | | | 110,383 | | | | | 76,145 | | | | | 63,339 | | | | | 56,139 | | | | | 58,853 | | |
Total capital | | | 255,701 | | | | | 237,905 | | | | | 171,661 | | | | | 153,318 | | | | | 154,983 | | |
Risk-weighted assets | | | 1,599,569 | | | | | 1,695,192 | | | | | 1,320,824 | | | | | 1,328,084 | | | | | 1,230,307 | | |
Tier 1 capital ratio | | | 11.93 | | % | | | 10.09 | | % | | | 9.15 | | % | | | 7.55 | | % | | | 8.25 | | % |
Tier 1 common equity ratio(2) | | | 6.90 | | | | | 4.49 | | | | | 4.80 | | | | | 4.23 | | | | | 4.78 | | |
Total capital ratio | | | 15.99 | | | | | 14.03 | | | | | 13.00 | | | | | 11.54 | | | | | 12.60 | | |
Tier 1 leverage ratio | | | 8.21 | | | | | 7.07 | | | | | 6.44 | | | | | 5.51 | | | | | 6.07 | | |
Tangible equity ratio(3) | | | 7.39 | | | | | 6.42 | | | | | 5.11 | | | | | 4.13 | | | | | 4.72 | | |
Tangible common equity ratio(3) | | | 4.67 | | | | | 3.13 | | | | | 2.93 | | | | | 2.75 | | | | | 3.24 | | |
| (1) | Preliminary data on risk-based capital |
| (2) | Tier 1 common equity ratio equals Tier 1 capital excluding preferred stock, trust preferred securities, hybrid securities and minority interest divided by risk-weighted assets. |
| (3) | Tangible equity ratio equals period end tangible shareholders’ equity divided by period end tangible assets. Tangible common equity equals period end tangible common shareholders’ equity divided by period end tangible assets. Tangible shareholders’ equity and tangible assets are non-GAAP measures. For corresponding reconciliations of tangible shareholders’ equity and tangible assets to GAAP financial measures, see Supplemental Financial Data on page 3. We believe the use of these non-GAAP measures provide additional clarity in assessing the results of the Corporation. |
| | * | Preliminary data on risk-based capital |
Outstanding Common Stock
No common shares were repurchased in the second quarter of 2009.
75.0 million shares remain outstanding under the 2008 authorized program.
574 thousand shares were issued in the second quarter of 2009 under employee stock plans. In addition, approximately 2.25 billion shares were issued to raise capital in the second quarter of 2009, including 1.00 billion shares that were exchanged for preferred stock. The remaining 1.25 billion shares were raised through an at-the-market offering completed during the second quarter of 2009. Combined, these actions benefited the Tier 1 common equity ratio by approximately 185 bps.
Certain prior period amounts have been reclassified to conform to current period presentation.
Information for periods beginning July 1, 2008 includes the Countrywide acquisition. Information for periods beginning January 1, 2009 includes the
Merrill Lynch acquisition. Prior periods have not been restated.
| | |
| This information is preliminary and based on company data available at the time of the presentation. | | 6 |
Bank of America Corporation and Subsidiaries
Preferred Stock Issued Excluding Issuances to the U.S. Government
(Dollars in millions)
| | | | | | | | | |
| | | Notional Amount (1) | | Third Quarter
2009
Dividends(2) |
Preferred Stock | | June 30
2009 | | March 31
2009 | |
Series B | | $ | 1 | | $ | 1 | | $ | — |
Series D | | | 661 | | | 825 | | | 10 |
Series E | | | 487 | | | 2,025 | | | 5 |
Series H | | | 2,862 | | | 2,925 | | | 59 |
Series I | | | 365 | | | 550 | | | 6 |
Series J | | | 978 | | | 1,035 | | | 18 |
Series K(3) | | | 1,667 | | | 6,000 | | | 67 |
Series L | | | 3,349 | | | 6,900 | | | 61 |
Series M (3) | | | 1,434 | | | 4,000 | | | — |
Merrill Lynch Series 2 (MC)(4) | | | 1,200 | | | 1,200 | | | 27 |
Merrill Lynch Series 3 (MC)(4) | | | 500 | | | 500 | | | 11 |
Merrill Lynch Series 1 | | | 146 | | | 630 | | | 1 |
Merrill Lynch Series 2 | | | 526 | | | 1,110 | | | 4 |
Merrill Lynch Series 3 | | | 670 | | | 810 | | | 11 |
Merrill Lynch Series 4 | | | 389 | | | 600 | | | 4 |
Merrill Lynch Series 5 | | | 606 | | | 1,500 | | | 6 |
Merrill Lynch Series 6 | | | 65 | | | 65 | | | 1 |
Merrill Lynch Series 7 | | | 17 | | | 50 | | | — |
Merrill Lynch Series 8 | | | 2,673 | | | 2,673 | | | 58 |
| | | | | | | | | |
Total preferred stock excluding issuances to the U.S. government | | $ | 18,596 | | $ | 33,399 | | $ | 349 |
| | | | | | | | | |
| (1) | Excludes third party issuance costs of $103 million and $110 million, and other Merrill Lynch related adjustments of $529 million at both June 30, 2009 and March 31, 2009. |
| (2) | An estimate of third quarter 2009 potential cash dividends on various series of preferred stock, subject to the Board of Directors’ future declaration and assuming no conversion of convertible shares. |
| (3) | Pays dividends semi-annually. |
| (4) | Represents Mandatory Convertible Preferred Stock shares outstanding of Merrill Lynch which will be converted on October 15, 2010 but are optionally convertible prior to that date. |
Information for periods beginning July 1, 2008 includes the Countrywide acquisition. Information for periods beginning January 1, 2009 includes the
Merrill Lynch acquisition. Prior periods have not been restated.
| | |
| This information is preliminary and based on company data available at the time of the presentation. | | 7 |
Bank of America Corporation and Subsidiaries
Core Net Interest Income - Managed Basis
(Dollars in millions)
| | | | | | | | | | | | | | | | | | | | | | | | | | | | | | | | | | | | | | | | | | |
| | | Six Months Ended
June 30 | | | | | Second
Quarter
2009 | | | | | First
Quarter
2009 | | | | | Fourth
Quarter
2008 | | | | | Third
Quarter
2008 | | | | | Second
Quarter
2008 | | | |
| | | 2009 | | | | | 2008 | | | | | | | | | | | | | | | | | | |
Net interest income(1) | | | | | | | | | | | | | | | | | | | | | | | | | | | | | | | | | | | | | | | | | | |
As reported | | $ | 24,761 | | | | | $ | 21,228 | | | | | $ | 11,942 | | | | | $ | 12,819 | | | | | $ | 13,406 | �� | | | | $ | 11,920 | | | | | $ | 10,937 | | | |
Impact of market-based net interest income(2) | | | (3,275 | ) | | | | | (2,246 | ) | | | | | (1,455 | ) | | | | | (1,820 | ) | | | | | (1,461 | ) | | | | | (1,235 | ) | | | | | (1,157 | ) | | |
| | | | | | | | | | | | | | | | | | | | | | | | | | | | | | | | | | | | | | | | | | |
Core net interest income | | | 21,486 | | | | | | 18,982 | | | | | | 10,487 | | | | | | 10,999 | | | | | | 11,945 | | | | | | 10,685 | | | | | | 9,780 | | | |
Impact of securitizations(3) | | | 5,483 | | | | | | 4,344 | | | | | | 2,734 | | | | | | 2,749 | | | | | | 2,257 | | | | | | 2,310 | | | | | | 2,254 | | | |
| | | | | | | | | | | | | | | | | | | | | | | | | | | | | | | | | | | | | | | | | | |
Core net interest income - managed basis | | $ | 26,969 | | | | | $ | 23,326 | | | | | $ | 13,221 | | | | | $ | 13,748 | | | | | $ | 14,202 | | | | | $ | 12,995 | | | | | $ | 12,034 | | | |
| | | | | | | | | | | | | | | | | | | | | | | | | | | | | | | | | | | | | | | | | | |
| | | | | | | | | | | | | | |
Average earning assets | | | | | | | | | | | | | | | | | | | | | | | | | | | | | | | | | | | | | | | | | | |
As reported | | $ | 1,861,954 | | | | | $ | 1,505,265 | | | | | $ | 1,811,981 | | | | | $ | 1,912,483 | | | | | $ | 1,616,646 | | | | | $ | 1,622,466 | | | | | $ | 1,500,234 | | | |
Impact of market-based earning assets(2) | | | (482,356 | ) | | | | | (381,048 | ) | | | | | (475,761 | ) | | | | | (489,024 | ) | | | | | (311,782 | ) | | | | | (370,146 | ) | | | | | (367,193 | ) | | |
| | | | | | | | | | | | | | | | | | | | | | | | | | | | | | | | | | | | | | | | | | |
Core average earning assets | | | 1,379,598 | | | | | | 1,124,217 | | | | | | 1,336,220 | | | | | | 1,423,459 | | | | | | 1,304,864 | | | | | | 1,252,320 | | | | | | 1,133,041 | | | |
Impact of securitizations(4) | | | 88,846 | | | | | | 102,854 | | | | | | 86,154 | | | | | | 91,567 | | | | | | 93,189 | | | | | | 101,743 | | | | | | 103,131 | | | |
| | | | | | | | | | | | | | | | | | | | | | | | | | | | | | | | | | | | | | | | | | |
Core average earning assets - managed basis | | $ | 1,468,444 | | | | | $ | 1,227,071 | | | | | $ | 1,422,374 | | | | | $ | 1,515,026 | | | | | $ | 1,398,053 | | | | | $ | 1,354,063 | | | | | $ | 1,236,172 | | | |
| | | | | | | | | | | | | | | | | | | | | | | | | | | | | | | | | | | | | | | | | | |
| | | | | | | | | | | | | | |
Net interest yield contribution(1, 5) | | | | | | | | | | | | | | | | | | | | | | | | | | | | | | | | | | | | | | | | | | |
As reported | | | 2.67 | | | % | | | 2.83 | | | % | | | 2.64 | | | % | | | 2.70 | | | % | | | 3.31 | | | % | | | 2.93 | | | % | | | 2.92 | | | % |
Impact of market-based activities(2) | | | 0.46 | | | | | | 0.56 | | | | | | 0.50 | | | | | | 0.41 | | | | | | 0.34 | | | | | | 0.47 | | | | | | 0.54 | | | |
| | | | | | | | | | | | | | | | | | | | | | | | | | | | | | | | | | | | | | | | | | |
Core net interest yield on earning assets | | | 3.13 | | | | | | 3.39 | | | | | | 3.14 | | | | | | 3.11 | | | | | | 3.65 | | | | | | 3.40 | | | | | | 3.46 | | | |
Impact of securitizations | | | 0.56 | | | | | | 0.42 | | | | | | 0.58 | | | | | | 0.54 | | | | | | 0.40 | | | | | | 0.43 | | | | | | 0.44 | | | |
| | | | | | | | | | | | | | | | | | | | | | | | | | | | | | | | | | | | | | | | | | |
Core net interest yield on earning assets - managed basis | | | 3.69 | | | % | | | 3.81 | | | % | | | 3.72 | | | % | | | 3.65 | | | % | | | 4.05 | | | % | | | 3.83 | | | % | | | 3.90 | | | % |
| | | | | | | | | | | | | | | | | | | | | | | | | | | | | | | | | | | | | | | | | | |
| (1) | Fully taxable-equivalent basis |
| (2) | Represents the impact of market-based amounts included in Global Markets. |
| (3) | Represents the impact of securitizations utilizing actual bond costs. This is different from the business segment view which utilizes funds transfer pricing methodologies. |
| (4) | Represents average securitized loans less accrued interest receivable and certain securitized bonds retained. |
| (5) | Calculated on an annualized basis. |
Certain prior period amounts have been reclassified to conform to current period presentation.
Information for periods beginning July 1, 2008 includes the Countrywide acquisition. Information for periods beginning January 1, 2009 includes the
Merrill Lynch acquisition. Prior periods have not been restated.
| | |
| This information is preliminary and based on company data available at the time of the presentation. | | 8 |
Bank of America Corporation and Subsidiaries
Quarterly Average Balances and Interest Rates - Fully Taxable-equivalent Basis
(Dollars in millions)
| | | | | | | | | | | | | | | | | | | | | | | | | | | | | | |
| | | Second Quarter 2009 | | | | First Quarter 2009 | | | | Second Quarter 2008 | | |
| | | Average
Balance | | Interest
Income/
Expense | | Yield/
Rate | | | | Average
Balance | | Interest
Income/
Expense | | Yield/
Rate | | | | Average
Balance | | Interest
Income/
Expense | | Yield/
Rate | | |
Earning assets | | | | | | | | | | | | | | | | | | | | | | | | | | | | | | |
Time deposits placed and other short-term investments | | $ | 25,604 | | $ | 169 | | 2.64 | | % | | $ | 26,158 | | $ | 191 | | 2.96 | | % | | $ | 10,310 | | $ | 87 | | 3.40 | | % |
Federal funds sold and securities borrowed or purchased under agreements to resell | | | 230,955 | | | 690 | | 1.20 | | | | | 244,280 | | | 1,155 | | 1.90 | | | | | 126,169 | | | 800 | | 2.54 | | |
Trading account assets | | | 223,102 | | | 2,028 | | 3.64 | | | | | 259,322 | | | 2,499 | | 3.89 | | | | | 184,547 | | | 2,282 | | 4.95 | | |
Debt securities(1) | | | 255,159 | | | 3,353 | | 5.26 | | | | | 286,249 | | | 3,902 | | 5.47 | | | | | 235,369 | | | 2,963 | | 5.04 | | |
Loans and leases(2): | | | | | | | | | | | | | | | | | | | | | | | | | | | | | | |
Residential mortgage(3) | | | 253,803 | | | 3,489 | | 5.50 | | | | | 265,121 | | | 3,680 | | 5.57 | | | | | 256,164 | | | 3,541 | | 5.54 | | |
Home equity | | | 156,599 | | | 1,722 | | 4.41 | | | | | 158,575 | | | 1,787 | | 4.55 | | | | | 120,265 | | | 1,627 | | 5.44 | | |
Discontinued real estate | | | 18,309 | | | 303 | | 6.61 | | | | | 19,386 | | | 386 | | 7.97 | | | | | n/a | | | n/a | | n/a | | |
Credit card - domestic | | | 51,721 | | | 1,375 | | 10.66 | | | | | 58,960 | | | 1,606 | | 11.05 | | | | | 61,655 | | | 1,603 | | 10.45 | | |
Credit card - foreign | | | 18,825 | | | 506 | | 10.77 | | | | | 16,858 | | | 449 | | 10.81 | | | | | 16,566 | | | 512 | | 12.43 | | |
Direct/Indirect consumer (4) | | | 100,302 | | | 1,532 | | 6.12 | | | | | 100,741 | | | 1,684 | | 6.78 | | | | | 82,593 | | | 1,731 | | 8.43 | | |
Other consumer(5) | | | 3,298 | | | 63 | | 7.77 | | | | | 3,408 | | | 64 | | 7.50 | | | | | 3,953 | | | 84 | | 8.36 | | |
Total consumer | | | 602,857 | | | 8,990 | | 5.97 | | | | | 623,049 | | | 9,656 | | 6.25 | | | | | 541,196 | | | 9,098 | | 6.75 | | |
Commercial - domestic | | | 231,639 | | | 2,176 | | 3.77 | | | | | 240,683 | | | 2,485 | | 4.18 | | | | | 219,537 | | | 2,762 | | 5.06 | | |
Commercial real estate(6) | | | 75,559 | | | 627 | | 3.33 | | | | | 72,206 | | | 550 | | 3.09 | | | | | 62,810 | | | 737 | | 4.72 | | |
Commercial lease financing | | | 22,026 | | | 260 | | 4.72 | | | | | 22,056 | | | 279 | | 5.05 | | | | | 22,276 | | | 243 | | 4.37 | | |
Commercial - foreign | | | 34,024 | | | 360 | | 4.24 | | | | | 36,127 | | | 462 | | 5.18 | | | | | 32,820 | | | 366 | | 4.48 | | |
Total commercial | | | 363,248 | | | 3,423 | | 3.78 | | | | | 371,072 | | | 3,776 | | 4.12 | | | | | 337,443 | | | 4,108 | | 4.89 | | |
Total loans and leases | | | 966,105 | | | 12,413 | | 5.15 | | | | | 994,121 | | | 13,432 | | 5.46 | | | | | 878,639 | | | 13,206 | | 6.04 | | |
Other earning assets | | | 111,056 | | | 1,251 | | 4.52 | | | | | 102,353 | | | 1,299 | | 5.12 | | | | | 65,200 | | | 1,005 | | 6.19 | | |
Total earning assets(7) | | | 1,811,981 | | | 19,904 | | 4.40 | | | | | 1,912,483 | | | 22,478 | | 4.74 | | | | | 1,500,234 | | | 20,343 | | 5.44 | | |
Cash and cash equivalents | | | 204,354 | | | | | | | | | | 153,007 | | | | | | | | | | 33,799 | | | | | | | |
Other assets, less allowance for loan and lease losses | | | 403,982 | | | | | | | | | | 453,644 | | | | | | | | | | 220,580 | | | | | | | |
Total assets | | $ | 2,420,317 | | | | | | | | | $ | 2,519,134 | | | | | | | | | $ | 1,754,613 | | | | | | | |
| | | | | | | | | | | | |
Interest-bearing liabilities | | | | | | | | | | | | | | | | | | | | | | | | | | | | | | |
Domestic interest-bearing deposits: | | | | | | | | | | | | | | | | | | | | | | | | | | | | | | |
Savings | | $ | 34,367 | | $ | 54 | | 0.63 | | % | | $ | 32,378 | | $ | 58 | | 0.72 | | % | | $ | 33,164 | | $ | 64 | | 0.77 | | % |
NOW and money market deposit accounts | | | 342,570 | | | 376 | | 0.44 | | | | | 343,215 | | | 435 | | 0.51 | | | | | 258,104 | | | 856 | | 1.33 | | |
Consumer CDs and IRAs | | | 229,392 | | | 1,409 | | 2.46 | | | | | 235,787 | | | 1,715 | | 2.95 | | | | | 178,828 | | | 1,646 | | 3.70 | | |
Negotiable CDs, public funds and other time deposits | | | 39,100 | | | 124 | | 1.28 | | | | | 31,188 | | | 149 | | 1.94 | | | | | 24,216 | | | 195 | | 3.25 | | |
Total domestic interest-bearing deposits | | | 645,429 | | | 1,963 | | 1.22 | | | | | 642,568 | | | 2,357 | | 1.49 | | | | | 494,312 | | | 2,761 | | 2.25 | | |
Foreign interest-bearing deposits: | | | | | | | | | | | | | | | | | | | | | | | | | | | | | | |
Banks located in foreign countries | | | 19,261 | | | 37 | | 0.76 | | | | | 26,052 | | | 48 | | 0.75 | | | | | 33,777 | | | 272 | | 3.25 | | |
Governments and official institutions | | | 7,379 | | | 4 | | 0.22 | | | | | 9,849 | | | 6 | | 0.25 | | | | | 11,789 | | | 77 | | 2.62 | | |
Time, savings and other | | | 54,307 | | | 78 | | 0.58 | | | | | 58,380 | | | 132 | | 0.92 | | | | | 55,403 | | | 410 | | 2.97 | | |
Total foreign interest-bearing deposits | | | 80,947 | | | 119 | | 0.59 | | | | | 94,281 | | | 186 | | 0.80 | | | | | 100,969 | | | 759 | | 3.02 | | |
Total interest-bearing deposits | | | 726,376 | | | 2,082 | | 1.15 | | | | | 736,849 | | | 2,543 | | 1.40 | | | | | 595,281 | | | 3,520 | | 2.38 | | |
Federal funds purchased and securities loaned or sold under agreements to repurchase and other short-term borrowings | | | 503,451 | | | 1,396 | | 1.11 | | | | | 591,928 | | | 2221 | | 1.52 | | | | | 444,578 | | | 3,087 | | 2.79 | | |
Trading account liabilities | | | 63,551 | | | 450 | | 2.84 | | | | | 70,799 | | | 579 | | 3.32 | | | | | 70,546 | | | 749 | | 4.27 | | |
Long-term debt | | | 444,131 | | | 4,034 | | 3.64 | | | | | 446,975 | | | 4316 | | 3.89 | | | | | 205,194 | | | 2,050 | | 4.00 | | |
Total interest-bearing liabilities(7) | | | 1,737,509 | | | 7,962 | | 1.84 | | | | | 1,846,551 | | | 9,659 | | 2.11 | | | | | 1,315,599 | | | 9,406 | | 2.87 | | |
Noninterest-bearing sources: | | | | | | | | | | | | | | | | | | | | | | | | | | | | | | |
Noninterest-bearing deposits | | | 248,516 | | | | | | | | | | 227,232 | | | | | | | | | | 190,721 | | | | | | | |
Other liabilities | | | 191,425 | | | | | | | | | | 216,585 | | | | | | | | | | 86,865 | | | | | | | |
Shareholders' equity | | | 242,867 | | | | | | | | | | 228,766 | | | | | | | | | | 161,428 | | | | | | | |
Total liabilities and shareholders' equity | | $ | 2,420,317 | | | | | | | | | $ | 2,519,134 | | | | | | | | | $ | 1,754,613 | | | | | | | |
Net interest spread | | | | | | | | 2.56 | | % | | | | | | | | 2.63 | | % | | | | | | | | 2.57 | | % |
Impact of noninterest-bearing sources | | | | | | | | 0.08 | | | | | | | | | | 0.07 | | | | | | | | | | 0.35 | | |
Net interest income/yield on earning assets | | | | | $ | 11,942 | | 2.64 | | % | | | | | $ | 12,819 | | 2.70 | | % | | | | | $ | 10,937 | | 2.92 | | % |
| (1) | Yields on AFS debt securities are calculated based on fair value rather than historical cost balances. The use of fair value does not have a material impact on netinterest yield. |
| (2) | Nonperforming loans are included in the respective average loan balances. Income on these nonperforming loans is recognized on a cash basis. We account foracquired impaired loans in accordance with SOP 03-3. Loans accounted for in accordance with SOP 03-3 were written down to fair value upon acquisition andaccrete interest income over the remaining life of the loan. |
| (3) | Includes foreign residential mortgages of $675 million and $627 million for the second and first quarters of 2009. |
| (4) | Includes foreign consumer loans of $8.0 billion and $7.1 billion in the second and first quarters of 2009, and $3.0 billion in the second quarter of 2008. |
| (5) | Includes consumer finance loans of $2.5 and $2.6 billion in the second and first quarters of 2009, and $2.8 billion in the second quarter of 2008; and other foreignconsumer loans of $640 million and $596 million in the second and first quarters of 2009, and $862 million in the second quarter of 2008. |
| (6) | Includes domestic commercial real estate loans of $72.8 billion and $70.9 billion in the second and first quarters of 2009, and $61.6 billion in the second quarter of 2008,and foreign commercial real estate loans of $2.8 billion and $1.3 billion in the second and first quarters of 2009, and $1.3 billion in the second quarter of 2008. |
| (7) | Interest income includes the impact of interest rate risk management contracts, which decreased interest income on the underlying assets $11 million and $61 millionin the second and first quarters of 2009, and $104 million in the second quarter of 2008. Interest expense includes the impact of interest rate risk management contracts,which increased (decreased) interest expense on the underlying liabilities $(550) million and $(512) million in the second and first quarters of 2009, and $37 million in thesecond quarter of 2008. |
n/a = not applicable
Certain prior period amounts have been reclassified to conform to current period presentation.
Information for periods beginning July 1, 2008 includes the Countrywide acquisition. Information for periods beginning January 1, 2009 includes the
Merrill Lynch acquisition. Prior periods have not been restated.
| | |
| This information is preliminary and based on company data available at the time of the presentation. | | 9 |
Bank of America Corporation and Subsidiaries
Quarterly Average Balances and Interest Rates - Fully Taxable-equivalent Basis - Isolating Hedge Income/Expense(1)
(Dollars in millions)
| | | | | | | | | | | | | | | | | | | | | | | | | | | | | | | | | | |
| | | Second Quarter 2009 | | | | First Quarter 2009 | | | | Second Quarter 2008 | | | |
| | | Average
Balance | | Interest
Income/
Expense | | | Yield/
Rate | | | | Average
Balance | | Interest
Income/
Expense | | | Yield/
Rate | | | | Average
Balance | | Interest
Income/
Expense | | | Yield/
Rate | | | |
Earning assets | | | | | | | | | | | | | | | | | | | | | | | | | | | | | | | | | | |
Time deposits placed and other short-term investments(2) | | $ | 25,604 | | $ | 172 | | | 2.69 | | % | | $ | 26,158 | | $ | 191 | | | 2.96 | | % | | $ | 10,310 | | $ | 91 | | | 3.56 | | | % |
Federal funds sold and securities borrowed or purchased under agreements to resell (2) | | | 230,955 | | | 628 | | | 1.09 | | | | | 244,280 | | | 1,158 | | | 1.90 | | | | | 126,169 | | | 867 | | | 2.75 | | | |
Trading account assets | | | 223,102 | | | 2,028 | | | 3.64 | | | | | 259,322 | | | 2,499 | | | 3.89 | | | | | 184,547 | | | 2,282 | | | 4.95 | | | |
Debt securities(2) | | | 255,159 | | | 3,387 | | | 5.31 | | | | | 286,249 | | | 3,930 | | | 5.51 | | | | | 235,369 | | | 2,963 | | | 5.04 | | | |
Loans and leases: | | | | | | | | | | | | | | | | | | | | | | | | | | | | | | | | | | |
Residential mortgage | | | 253,803 | | | 3,489 | | | 5.50 | | | | | 265,121 | | | 3,680 | | | 5.57 | | | | | 256,164 | | | 3,541 | | | 5.54 | | | |
Home equity | | | 156,599 | | | 1,722 | | | 4.41 | | | | | 158,575 | | | 1,787 | | | 4.55 | | | | | 120,265 | | | 1,627 | | | 5.44 | | | |
Discontinued real estate | | | 18,309 | | | 303 | | | 6.61 | | | | | 19,386 | | | 386 | | | 7.97 | | | | | n/a | | | n/a | | | n/a | | | |
Credit card - domestic | | | 51,721 | | | 1,375 | | | 10.66 | | | | | 58,960 | | | 1,606 | | | 11.05 | | | | | 61,655 | | | 1,603 | | | 10.45 | | | |
Credit card - foreign | | | 18,825 | | | 506 | | | 10.77 | | | | | 16,858 | | | 449 | | | 10.81 | | | | | 16,566 | | | 512 | | | 12.43 | | | |
Direct/Indirect consumer | | | 100,302 | | | 1,532 | | | 6.12 | | | | | 100,741 | | | 1,684 | | | 6.78 | | | | | 82,593 | | | 1,731 | | | 8.43 | | | |
Other consumer | | | 3,298 | | | 63 | | | 7.77 | | | | | 3,408 | | | 64 | | | 7.50 | | | | | 3,953 | | | 84 | | | 8.36 | | | |
Total consumer | | | 602,857 | | | 8,990 | | | 5.97 | | | | | 623,049 | | | 9,656 | | | 6.25 | | | | | 541,196 | | | 9,098 | | | 6.75 | | | |
Commercial - domestic (2) | | | 231,639 | | | 2,212 | | | 3.83 | | | | | 240,683 | | | 2,515 | | | 4.24 | | | | | 219,537 | | | 2,795 | | | 5.12 | | | |
Commercial real estate | | | 75,559 | | | 627 | | | 3.33 | | | | | 72,206 | | | 550 | | | 3.09 | | | | | 62,810 | | | 737 | | | 4.72 | | | |
Commercial lease financing | | | 22,026 | | | 260 | | | 4.72 | | | | | 22,056 | | | 279 | | | 5.05 | | | | | 22,276 | | | 243 | | | 4.37 | | | |
Commercial - foreign | | | 34,024 | | | 360 | | | 4.24 | | | | | 36,127 | | | 462 | | | 5.18 | | | | | 32,820 | | | 366 | | | 4.48 | | | |
Total commercial | | | 363,248 | | | 3,459 | | | 3.82 | | | | | 371,072 | | | 3,806 | | | 4.15 | | | | | 337,443 | | | 4,141 | | | 4.93 | | | |
Total loans and leases | | | 966,105 | | | 12,449 | | | 5.16 | | | | | 994,121 | | | 13,462 | | | 5.47 | | | | | 878,639 | | | 13,239 | | | 6.05 | | | |
Other earning assets | | | 111,056 | | | 1,251 | | | 4.52 | | | | | 102,353 | | | 1,299 | | | 5.12 | | | | | 65,200 | | | 1,005 | | | 6.19 | | | |
Total earning assets - excluding hedge impact | | | 1,811,981 | | | 19,915 | | | 4.40 | | | | | 1,912,483 | | | 22,539 | | | 4.75 | | | | | 1,500,234 | | | 20,447 | | | 5.47 | | | |
Net hedge income (expense) on assets | | | | | | (11 | ) | | | | | | | | | | (61 | ) | | | | | | | | | | (104 | ) | | | | | |
Total earning assets - including hedge impact | | | 1,811,981 | | | 19,904 | | | 4.40 | | | | | 1,912,483 | | | 22,478 | | | 4.74 | | | | | 1,500,234 | | | 20,343 | | | 5.44 | | | |
Cash and cash equivalents | | | 204,354 | | | | | | | | | | | 153,007 | | | | | | | | | | | 33,799 | | | | | | | | | |
Other assets, less allowance for loan and lease losses | | | 403,982 | | | | | | | | | | | 453,644 | | | | | | | | | | | 220,580 | | | | | | | | | |
Total assets | | $ | 2,420,317 | | | | | | | | | | $ | 2,519,134 | | | | | | | | | | $ | 1,754,613 | | | | | | | | | |
| | | | | | | | | | | | |
Interest-bearing liabilities | | | | | | | | | | | | | | | | | | | | | | | | | | | | | | | | | | |
Domestic interest-bearing deposits: | | | | | | | | | | | | | | | | | | | | | | | | | | | | | | | | | | |
Savings | | $ | 34,367 | | $ | 54 | | | 0.63 | | % | | $ | 32,378 | | $ | 58 | | | 0.72 | | % | | $ | 33,164 | | $ | 64 | | | 0.77 | | | % |
NOW and money market deposit accounts (2) | | | 342,570 | | | 376 | | | 0.44 | | | | | 343,215 | | | 436 | | | 0.51 | | | | | 258,104 | | | 851 | | | 1.33 | | | |
Consumer CDs and IRAs (2) | | | 229,392 | | | 1,350 | | | 2.36 | | | | | 235,787 | | | 1,651 | | | 2.84 | | | | | 178,828 | | | 1,535 | | | 3.45 | | | |
Negotiable CDs, public funds and other time deposits (2) | | | 39,100 | | | 119 | | | 1.24 | | | | | 31,188 | | | 146 | | | 1.89 | | | | | 24,216 | | | 193 | | | 3.21 | | | |
Total domestic interest-bearing deposits | | | 645,429 | | | 1,899 | | | 1.18 | | | | | 642,568 | | | 2,291 | | | 1.44 | | | | | 494,312 | | | 2,643 | | | 2.15 | | | |
Foreign interest-bearing deposits: | | | | | | | | | | | | | | | | | | | | | | | | | | | | | | | | | | |
Banks located in foreign countries (2) | | | 19,261 | | | 24 | | | 0.48 | | | | | 26,052 | | | 41 | | | 0.64 | | | | | 33,777 | | | 272 | | | 3.25 | | | |
Governments and official institutions | | | 7,379 | | | 4 | | | 0.22 | | | | | 9,849 | | | 6 | | | 0.25 | | | | | 11,789 | | | 77 | | | 2.62 | | | |
Time, savings and other | | | 54,307 | | | 78 | | | 0.58 | | | | | 58,380 | | | 132 | | | 0.92 | | | | | 55,403 | | | 410 | | | 2.97 | | | |
Total foreign interest-bearing deposits | | | 80,947 | | | 106 | | | 0.52 | | | | | 94,281 | | | 179 | | | 0.77 | | | | | 100,969 | | | 759 | | | 3.02 | | | |
Total interest-bearing deposits | | | 726,376 | | | 2,005 | | | 1.11 | | | | | 736,849 | | | 2,470 | | | 1.36 | | | | | 595,281 | | | 3,402 | | | 2.30 | | | |
Federal funds purchased and securities loaned or sold under agreements to repurchase and other short-term borrowings(2) | | | 503,451 | | | 1,157 | | | 0.92 | | | | | 591,928 | | | 1,915 | | | 1.31 | | | | | 444,578 | | | 2,980 | | | 2.70 | | | |
Trading account liabilities | | | 63,551 | | | 450 | | | 2.84 | | | | | 70,799 | | | 579 | | | 3.32 | | | | | 70,546 | | | 749 | | | 4.27 | | | |
Long-term debt (2) | | | 444,131 | | | 4,900 | | | 4.42 | | | | | 446,975 | | | 5,207 | | | 4.69 | | | | | 205,194 | | | 2,238 | | | 4.36 | | | |
Total interest-bearing liabilities - excluding hedge impact | | | 1,737,509 | | | 8,512 | | | 1.96 | | | | | 1,846,551 | | | 10,171 | | | 2.23 | | | | | 1,315,599 | | | 9,369 | | | 2.86 | | | |
Net hedge (income) expense on liabilities | | | | | | (550 | ) | | | | | | | | | | (512 | ) | | | | | | | | | | 37 | | | | | | |
Total interest-bearing liabilities - including hedge impact | | | 1,737,509 | | | 7,962 | | | 1.84 | | | | | 1,846,551 | | | 9,659 | | | 2.11 | | | | | 1,315,599 | | | 9,406 | | | 2.87 | | | |
Noninterest-bearing sources: | | | | | | | | | | | | | | | | | | | | | | | | | | | | | | | | | | |
Noninterest-bearing deposits | | | 248,516 | | | | | | | | | | | 227,232 | | | | | | | | | | | 190,721 | | | | | | | | | |
Other liabilities | | | 191,425 | | | | | | | | | | | 216,585 | | | | | | | | | | | 86,865 | | | | | | | | | |
Shareholders’ equity | | | 242,867 | | | | | | | | | | | 228,766 | | | | | | | | | | | 161,428 | | | | | | | | | |
Total liabilities and shareholders’ equity | | $ | 2,420,317 | | | | | | | | | | $ | 2,519,134 | | | | | | | | | | $ | 1,754,613 | | | | | | | | | |
Net interest spread | | | | | | | | | 2.44 | | | | | | | | | | | 2.52 | | | | | | | | | | | 2.61 | | | |
Impact of noninterest-bearing sources | | | | | | | | | 0.08 | | | | | | | | | | | 0.07 | | | | | | | | | | | 0.35 | | | |
Net interest income/yield on earning assets - excluding hedge impact | | | | | $ | 11,403 | | | 2.52 | | % | | | | | $ | 12,368 | | | 2.59 | | % | | | | | $ | 11,078 | | | 2.96 | | | % |
Net impact of hedge income (expense) | | | | | | 539 | | | 0.12 | | | | | | | | 451 | | | 0.11 | | | | | | | | (141 | ) | | (0.04 | ) | | |
Net interest income/yield on earning assets | | | | | $ | 11,942 | | | 2.64 | | % | | | | | $ | 12,819 | | | 2.70 | | % | | | | | $ | 10,937 | | | 2.92 | | | % |
(1) This table presents a non-GAAP financial measure. The impact of interest rate risk management derivatives is shown separately. Interest income and interest expense amounts, and the yields and rates have been adjusted. Management believes this presentation is useful to investors because it adjusts for the impact of our hedging decisions and provides a better understanding of our hedging activities. The impact of interest rate risk management derivatives is not material to the average balances presented above. (2) The impact of interest rate risk management derivatives on interest income and interest expense is presented below. Interest income excludes the impact of interest rate risk management contracts, which increased (decreased) interest income on: |
| | | | | Second
Quarter 2009 | | | | | | | | | First
Quarter 2009 | | | | | | | | | Second
Quarter 2008 | | | | | | |
Time deposits placed and other short-term investments | | | | | $ | (3 | ) | | | | | | | | | $ | — | | | | | | | | | | $ | (4 | ) | | | | | |
Federal funds sold and securities borrowed or purchased under agreements to resell | | | | | | 62 | | | | | | | | | | | (3 | ) | | | | | | | | | | (67 | ) | | | | | |
Debt securities | | | | | | (34 | ) | | | | | | | | | | (28 | ) | | | | | | | | | | (33 | ) | | | | | |
Commercial - domestic | | | | | | (36 | ) | | | | | | | | | | (30 | ) | | | | | | | | | | — | | | | | | |
| | | | | | | | | | | | | | | | | | | | | | | | | | | | | | | | | | |
Net hedge income (expense) on assets | | | | | $ | (11 | ) | | | | | | | | | $ | (61 | ) | | | | | | | | | $ | (104 | ) | | | | | |
| | | | | | | | | | | | | | | | | | | | | | | | | | | | | | | | | | |
|
Interest expense excludes the impact of interest rate risk management contracts, which increased (decreased) interest expense on: |
| | | | | | | | | | | | |
NOW and money market deposit accounts | | | | | $ | — | | | | | | | | | | $ | (1 | ) | | | | | | | | | $ | 5 | | | | | | |
Consumer CDs and IRAs | | | | | | 59 | | | | | | | | | | | 64 | | | | | | | | | | | 111 | | | | | | |
Negotiable CDs, public funds and other time deposits | | | | | | 5 | | | | | | | | | | | 3 | | | | | | | | | | | 2 | | | | | | |
Banks located in foreign countries | | | | | | 13 | | | | | | | | | | | 7 | | | | | | | | | | | — | | | | | | |
Federal funds purchased and securities loaned or sold under agreements to repurchase and other short-term borrowings | | | | | | 239 | | | | | | | | | | | 306 | | | | | | | | | | | 107 | | | | | | |
Long-term debt | | | | | | (866 | ) | | | | | | | | | | (891 | ) | | | | | | | | | | (188 | ) | | | | | |
| | | | | | | | | | | | | | | | | | | | | | | | | | | | | | | | | | |
Net hedge (income) expense on liabilities | | | | | $ | (550 | ) | | | | | | | | | $ | (512 | ) | | | | | | | | | $ | 37 | | | | | | |
| | | | | | | | | | | | | | | | | | | | | | | | | | | | | | | | | | |
n/a = not applicable
Certain prior period amounts have been reclassified to conform to current period presentation.
Information for periods beginning July 1, 2008 includes the Countrywide acquisition. Information for periods beginning January 1, 2009 includes the
Merrill Lynch acquisition. Prior periods have not been restated.
| | |
| This information is preliminary and based on company data available at the time of the presentation. | | 10 |
Bank of America Corporation and Subsidiaries
Year-to-Date Average Balances and Interest Rates - Fully Taxable-equivalent Basis
(Dollars in millions)
| | | | | | | | | | | | | | | | | | | | |
| | | Six Months Ended June 30 | | |
| | | 2009 | | | | 2008 | | |
| | | Average
Balance | | Interest
Income/
Expense | | Yield/
Rate | | | | Average
Balance | | Interest
Income/
Expense | | Yield/
Rate | | |
Earning assets | | | | | | | | | | | | | | | | | | | | |
Time deposits placed and other short-term investments | | $ | 25,879 | | $ | 360 | | 2.80 | | % | | $ | 10,453 | | $ | 181 | | 3.48 | | % |
Federal funds sold and securities borrowed or purchased under agreements to resell | | | 237,581 | | | 1,845 | | 1.56 | | | | | 135,606 | | | 2,008 | | 2.97 | | |
Trading account assets | | | 241,112 | | | 4,527 | | 3.77 | | | | | 188,478 | | | 4,699 | | 5.00 | | |
Debt securities(1) | | | 270,618 | | | 7,255 | | 5.37 | | | | | 227,373 | | | 5,798 | | 5.10 | | |
Loans and leases(2): | | | | | | | | | | | | | | | | | | | | |
Residential mortgage (3) | | | 259,431 | | | 7,169 | | 5.53 | | | | | 263,352 | | | 7,378 | | 5.61 | | |
Home equity | | | 157,582 | | | 3,509 | | 4.48 | | | | | 118,413 | | | 3,499 | | 5.94 | | |
Discontinued real estate | | | 18,845 | | | 689 | | 7.31 | | | | | n/a | | | n/a | | n/a | | |
Credit card - domestic | | | 55,320 | | | 2,981 | | 10.87 | | | | | 62,466 | | | 3,377 | | 10.87 | | |
Credit card - foreign | | | 17,847 | | | 955 | | 10.79 | | | | | 15,904 | | | 986 | | 12.47 | | |
Direct/Indirect consumer (4) | | | 100,521 | | | 3,216 | | 6.45 | | | | | 80,649 | | | 3,430 | | 8.55 | | |
Other consumer(5) | | | 3,351 | | | 127 | | 7.63 | | | | | 4,001 | | | 171 | | 8.49 | | |
Total consumer | | | 612,897 | | | 18,646 | | 6.11 | | | | | 544,785 | | | 18,841 | | 6.94 | | |
Commercial - domestic | | | 236,135 | | | 4,661 | | 3.98 | | | | | 215,965 | �� | | 5,960 | | 5.55 | | |
Commercial real estate(6) | | | 73,892 | | | 1,177 | | 3.21 | | | | | 62,506 | | | 1,624 | | 5.22 | | |
Commercial lease financing | | | 22,041 | | | 539 | | 4.89 | | | | | 22,252 | | | 504 | | 4.53 | | |
Commercial - foreign | | | 35,070 | | | 822 | | 4.73 | | | | | 31,642 | | | 753 | | 4.78 | | |
Total commercial | | | 367,138 | | | 7,199 | | 3.95 | | | | | 332,365 | | | 8,841 | | 5.35 | | |
Total loans and leases | | | 980,035 | | | 25,845 | | 5.30 | | | | | 877,150 | | | 27,682 | | 6.34 | | |
Other earning assets | | | 106,729 | | | 2,550 | | 4.81 | | | | | 66,205 | | | 2,134 | | 6.47 | | |
Total earning assets(7) | | | 1,861,954 | | | 42,382 | | 4.57 | | | | | 1,505,265 | | | 42,502 | | 5.67 | | |
Cash and cash equivalents | | | 178,822 | | | | | | | | | | 33,874 | | | | | | | |
Other assets, less allowance for loan and lease losses | | | 428,676 | | | | | | | | | | 220,631 | | | | | | | |
Total assets | | $ | 2,469,452 | | | | | | | | | $ | 1,759,770 | | | | | | | |
| | | | | | | | |
Interest-bearing liabilities | | | | | | | | | | | | | | | | | | | | |
Domestic interest-bearing deposits: | | | | | | | | | | | | | | | | | | | | |
Savings | | $ | 33,378 | | $ | 112 | | 0.68 | | % | | $ | 32,481 | | $ | 114 | | 0.70 | | % |
NOW and money market deposit accounts | | | 342,890 | | | 811 | | 0.48 | | | | | 253,526 | | | 1,995 | | 1.58 | | |
Consumer CDs and IRAs | | | 232,792 | | | 3,124 | | 2.70 | | | | | 183,417 | | | 3,717 | | 4.08 | | |
Negotiable CDs, public funds and other time deposits | | | 34,946 | | | 273 | | 1.57 | | | | | 28,208 | | | 515 | | 3.68 | | |
Total domestic interest-bearing deposits | | | 644,006 | | | 4,320 | | 1.35 | | | | | 497,632 | | | 6,341 | | 2.56 | | |
Foreign interest-bearing deposits: | | | | | | | | | | | | | | | | | | | | |
Banks located in foreign countries | | | 22,638 | | | 85 | | 0.75 | | | | | 36,487 | | | 672 | | 3.71 | | |
Governments and official institutions | | | 8,607 | | | 10 | | 0.23 | | | | | 13,219 | | | 209 | | 3.17 | | |
Time, savings and other | | | 56,332 | | | 210 | | 0.76 | | | | | 54,234 | | | 886 | | 3.28 | | |
Total foreign interest-bearing deposits | | | 87,577 | | | 305 | | 0.70 | | | | | 103,940 | | | 1,767 | | 3.42 | | |
Total interest-bearing deposits | | | 731,583 | | | 4,625 | | 1.27 | �� | | | | 601,572 | | | 8,108 | | 2.71 | | |
Federal funds purchased and securities loaned or sold under agreements to repurchase and other short-term borrowings | | | 547,446 | | | 3,617 | | 1.33 | | | | | 448,717 | | | 7,229 | | 3.24 | | |
Trading account liabilities | | | 67,155 | | | 1,029 | | 3.09 | | | | | 76,489 | | | 1,589 | | 4.18 | | |
Long-term debt | | | 445,545 | | | 8,350 | | 3.76 | | | | | 201,828 | | | 4,348 | | 4.31 | | |
Total interest-bearing liabilities(7) | | | 1,791,729 | | | 17,621 | | 1.98 | | | | | 1,328,606 | | | 21,274 | | 3.22 | | |
Noninterest-bearing sources: | | | | | | | | | | | | | | | | | | | | |
Noninterest-bearing deposits | | | 237,933 | | | | | | | | | | 185,241 | | | | | | | |
Other liabilities | | | 203,935 | | | | | | | | | | 87,845 | | | | | | | |
Shareholders’ equity | | | 235,855 | | | | | | | | | | 158,078 | | | | | | | |
Total liabilities and shareholders’ equity | | $ | 2,469,452 | | | | | | | | | $ | 1,759,770 | | | | | | | |
Net interest spread | | | | | | | | 2.59 | | % | | | | | | | | 2.45 | | % |
Impact of noninterest-bearing sources | | | | | | | | 0.08 | | | | | | | | | | 0.38 | | |
Net interest income/yield on earning assets | | | | | $ | 24,761 | | 2.67 | | % | | | | | $ | 21,228 | | 2.83 | | % |
| (1) | Yields on AFS debt securities are calculated based on fair value rather than historical cost balances. The use of fair value does not have a material impact on net interest yield. |
| (2) | Nonperforming loans are included in the respective average loan balances. Income on these nonperforming loans is recognized on a cash basis. We account for acquired impaired loans in accordance with SOP 03-3. Loans accounted for in accordance with SOP 03-3 were written down to fair value upon acquisition and accrete interest income over the remaining life of the loan. |
| (3) | Includes foreign residential mortgages of $651 million for the six months ended June 30, 2009. |
| (4) | Includes foreign consumer loans of $7.6 billion and $3.1 billion for the six months ended June 30, 2009 and 2008. |
| (5) | Includes consumer finance loans of $2.5 billion and $2.9 billion, and other foreign consumer loans of $618 million and $859 million for the six months ended June 30, 2009 and 2008. |
| (6) | Includes domestic commercial real estate loans of $71.9 billion and $61.3 billion, and foreign commercial real estate loans of $2.0 billion and $1.2 billion for the six months ended June 30, 2009 and 2008. |
| (7) | Interest income includes the impact of interest rate risk management contracts, which decreased interest income on the underlying assets $72 million and $207 million for the six months ended June 30, 2009 and 2008. Interest expense includes the impact of interest rate risk management contracts, which increased (decreased) interest expense on the underlying liabilities $(1.1) billion and $86 million for the six months ended June 30, 2009 and 2008. |
n/a = not applicable
Certain prior period amounts have been reclassified to conform to current period presentation.
Information for periods beginning July 1, 2008 includes the Countrywide acquisition. Information for periods beginning January 1, 2009 includes the
Merrill Lynch acquisition. Prior periods have not been restated.
| | |
| This information is preliminary and based on company data available at the time of the presentation. | | 11 |
Bank of America Corporation and Subsidiaries
Year-to-Date Average Balances and Interest Rates - Fully Taxable-equivalent Basis - Isolating Hedge Income/Expense(1)
(Dollars in millions)
| | | | | | | | | | | | | | | | | | | | | | | |
| | | Six Months Ended June 30 | | | |
| | | 2009 | | | | 2008 | | | |
| | | Average
Balance | | Interest
Income/
Expense | | | Yield/
Rate | | | | Average
Balance | | Interest
Income/
Expense | | | Yield/
Rate | | | |
Earning assets | | | | | | | | | | | | | | | | | | | | | | | |
Time deposits placed and other short-term investments (2) | | $ | 25,879 | | $ | 363 | | | 2.82 | | % | | $ | 10,453 | | $ | 189 | | | 3.64 | | | % |
Federal funds sold and securities borrowed or purchased under agreements to resell (2) | | | 237,581 | | | 1,786 | | | 1.51 | | | | | 135,606 | | | 2,145 | | | 3.17 | | | |
Trading account assets | | | 241,112 | | | 4,527 | | | 3.77 | | | | | 188,478 | | | 4,699 | | | 5.00 | | | |
Debt securities(2) | | | 270,618 | | | 7,317 | | | 5.42 | | | | | 227,373 | | | 5,799 | | | 5.10 | | | |
Loans and leases: | | | | | | | | | | | | | | | | | | | | | | | |
Residential mortgage | | | 259,431 | | | 7,169 | | | 5.53 | | | | | 263,352 | | | 7,378 | | | 5.61 | | | |
Home equity | | | 157,582 | | | 3,509 | | | 4.48 | | | | | 118,413 | | | 3,499 | | | 5.94 | | | |
Discontinued real estate | | | 18,845 | | | 689 | | | 7.31 | | | | | n/a | | | n/a | | | n/a | | | |
Credit card - domestic | | | 55,320 | | | 2,981 | | | 10.87 | | | | | 62,466 | | | 3,377 | | | 10.87 | | | |
Credit card - foreign | | | 17,847 | | | 955 | | | 10.79 | | | | | 15,904 | | | 986 | | | 12.47 | | | |
Direct/Indirect consumer | | | 100,521 | | | 3,216 | | | 6.45 | | | | | 80,649 | | | 3,430 | | | 8.55 | | | |
Other consumer | | | 3,351 | | | 127 | | | 7.63 | | | | | 4,001 | | | 171 | | | 8.49 | | | |
Total consumer | | | 612,897 | | | 18,646 | | | 6.11 | | | | | 544,785 | | | 18,841 | | | 6.94 | | | |
Commercial - domestic (2) | | | 236,135 | | | 4,727 | | | 4.04 | | | | | 215,965 | | | 6,020 | | | 5.60 | | | |
Commercial real estate | | | 73,892 | | | 1,177 | | | 3.21 | | | | | 62,506 | | | 1,624 | | | 5.22 | | | |
Commercial lease financing | | | 22,041 | | | 539 | | | 4.89 | | | | | 22,252 | | | 504 | | | 4.53 | | | |
Commercial - foreign | | | 35,070 | | | 822 | | | 4.73 | | | | | 31,642 | | | 753 | | | 4.78 | | | |
Total commercial | | | 367,138 | | | 7,265 | | | 3.99 | | | | | 332,365 | | | 8,901 | | | 5.38 | | | |
Total loans and leases | | | 980,035 | | | 25,911 | | | 5.32 | | | | | 877,150 | | | 27,742 | | | 6.35 | | | |
Other earning assets (2) | | | 106,729 | | | 2,550 | | | 4.81 | | | | | 66,205 | | | 2,135 | | | 6.47 | | | |
Total earning assets - excluding hedge impact | | | 1,861,954 | | | 42,454 | | | 4.58 | | | | | 1,505,265 | | | 42,709 | | | 5.69 | | | |
Net hedge income (expense) on assets | | | | | | (72 | ) | | | | | | | | | | (207 | ) | | | | | |
Total earning assets - including hedge impact | | | 1,861,954 | | | 42,382 | | | 4.57 | | | | | 1,505,265 | | | 42,502 | | | 5.67 | | | |
Cash and cash equivalents | | | 178,822 | | | | | | | | | | | 33,874 | | | | | | | | | |
Other assets, less allowance for loan and lease losses | | | 428,676 | | | | | | | | | | | 220,631 | | | | | | | | | |
Total assets | | $ | 2,469,452 | | | | | | | | | | $ | 1,759,770 | | | | | | | | | |
| | | | | | | | |
Interest-bearing liabilities | | | | | | | | | | | | | | | | | | | | | | | |
Domestic interest-bearing deposits: | | | | | | | | | | | | | | | | | | | | | | | |
Savings | | $ | 33,378 | | $ | 112 | | | 0.68 | | % | | $ | 32,481 | | $ | 114 | | | 0.70 | | | % |
NOW and money market deposit accounts (2) | | | 342,890 | | | 812 | | | 0.48 | | | | | 253,526 | | | 1,985 | | | 1.57 | | | |
Consumer CDs and IRAs (2) | | | 232,792 | | | 3,001 | | | 2.60 | | | | | 183,417 | | | 3,485 | | | 3.82 | | | |
Negotiable CDs, public funds and other time deposits (2) | | | 34,946 | | | 265 | | | 1.53 | | | | | 28,208 | | | 511 | | | 3.65 | | | |
Total domestic interest-bearing deposits | | | 644,006 | | | 4,190 | | | 1.31 | | | | | 497,632 | | | 6,095 | | | 2.46 | | | |
Foreign interest-bearing deposits: | | | | | | | | | | | | | | | | | | | | | | | |
Banks located in foreign countries (2) | | | 22,638 | | | 65 | | | 0.57 | | | | | 36,487 | | | 670 | | | 3.69 | | | |
Governments and official institutions | | | 8,607 | | | 10 | | | 0.23 | | | | | 13,219 | | | 209 | | | 3.17 | | | |
Time, savings and other | | | 56,332 | | | 210 | | | 0.76 | | | | | 54,234 | | | 886 | | | 3.28 | | | |
Total foreign interest-bearing deposits | | | 87,577 | | | 285 | | | 0.66 | | | | | 103,940 | | | 1,765 | | | 3.41 | | | |
Total interest-bearing deposits | | | 731,583 | | | 4,475 | | | 1.23 | | | | | 601,572 | | | 7,860 | | | 2.63 | | | |
Federal funds purchased and securities loaned or sold under agreements to repurchase and other short-term borrowings(2) | | | 547,446 | | | 3,072 | | | 1.13 | | | | | 448,717 | | | 7,114 | | | 3.19 | | | |
Trading account liabilities | | | 67,155 | | | 1,029 | | | 3.09 | | | | | 76,489 | | | 1,589 | | | 4.18 | | | |
Long-term debt (2) | | | 445,545 | | | 10,107 | | | 4.56 | | | | | 201,828 | | | 4,625 | | | 4.58 | | | |
Total interest-bearing liabilities - excluding hedge impact | | | 1,791,729 | | | 18,683 | | | 2.10 | | | | | 1,328,606 | | | 21,188 | | | 3.20 | | | |
Net hedge (income) expense on liabilities | | | | | | (1,062 | ) | | | | | | | | | | 86 | | | | | | |
Total interest-bearing liabilities - including hedge impact | | | 1,791,729 | | | 17,621 | | | 1.98 | | | | | 1,328,606 | | | 21,274 | | | 3.22 | | | |
Noninterest-bearing sources: | | | | | | | | | | | | | | | | | | | | | | | |
Noninterest-bearing deposits | | | 237,933 | | | | | | | | | | | 185,241 | | | | | | | | | |
Other liabilities | | | 203,935 | | | | | | | | | | | 87,845 | | | | | | | | | |
Shareholders’ equity | | | 235,855 | | | | | | | | | | | 158,078 | | | | | | | | | |
Total liabilities and shareholders’ equity | | $ | 2,469,452 | | | | | | | | | | $ | 1,759,770 | | | | | | | | | |
Net interest spread | | | | | | | | | 2.48 | | | | | | | | | | | 2.49 | | | |
Impact of noninterest-bearing sources | | | | | | | | | 0.08 | | | | | | | | | | | 0.38 | | | |
Net interest income/yield on earning assets - excluding hedge impact | | | | | $ | 23,771 | | | 2.56 | | % | | | | | $ | 21,521 | | | 2.87 | | | % |
Net impact of hedge income (expense) | | | | | | 990 | | | 0.11 | | | | | | | | (293 | ) | | (0.04 | ) | | |
Net interest income/yield on earning assets | | | | | $ | 24,761 | | | 2.67 | | % | | | | | $ | 21,228 | | | 2.83 | | | % |
|
(1) This table presents a non-GAAP financial measure. The impact of interest rate risk management derivatives is shown separately. Interest income and interest expense amounts, and the yields and rates have been adjusted. Management believes this presentation is useful to investors because it adjusts for the impact of our hedging decisions and provides a better understanding of our hedging activities. The impact of interest rate risk management derivatives is not material to the average balances presented above. (2) The impact of interest rate risk management derivatives on interest income and interest expense is presented below. Interest income excludes the impact of interest rate risk management contracts, which increased (decreased) interest income on: |
| | | | | Six Months Ended June 30 | | | | | | |
| | | | | 2009 | | | | | | | | | 2008 | | | | | | |
Time deposits placed and other short-term investments | | | | | $ | (3 | ) | | | | | | | | | $ | (8 | ) | | | | | |
Federal funds sold and securities borrowed or purchased under agreements to resell | | | | | | 59 | | | | | | | | | | | (137 | ) | | | | | |
Debt securities | | | | | | (62 | ) | | | | | | | | | | (1 | ) | | | | | |
Commercial - domestic | | | | | | (66 | ) | | | | | | | | | | (60 | ) | | | | | |
Other earning assets | | | | | | — | | | | | | | | | | | (1 | ) | | | | | |
Net hedge income (expense) on assets | | | | | $ | (72 | ) | | | | | | | | | $ | (207 | ) | | | | | |
|
Interest expense excludes the impact of interest rate risk management contracts, which increased (decreased) interest expense on: |
| | | | | | | | |
NOW and money market deposit accounts | | | | | $ | (1 | ) | | | | | | | | | $ | 10 | | | | | | |
Consumer CDs and IRAs | | | | | | 123 | | | | | | | | | | | 232 | | | | | | |
Negotiable CDs, public funds and other time deposits | | | | | | 8 | | | | | | | | | | | 4 | | | | | | |
Banks located in foreign countries | | | | | | 20 | | | | | | | | | | | 2 | | | | | | |
Federal funds purchased and securities loaned or sold under agreements to repurchase and other short-term borrowings | | | | | | 545 | | | | | | | | | | | 115 | | | | | | |
Long-term debt | | | | | | (1,757 | ) | | | | | | | | | | (277 | ) | | | | | |
Net hedge (income) expense on liabilities | | | | | $ | (1,062 | ) | | | | | | | | | $ | 86 | | | | | | |
n/a = not applicable
Certain prior period amounts have been reclassified to conform to current period presentation.
Information for periods beginning July 1, 2008 includes the Countrywide acquisition. Information for periods beginning January 1, 2009 includes the
Merrill Lynch acquisition. Prior periods have not been restated.
| | |
| This information is preliminary and based on company data available at the time of the presentation. | | 12 |
Bank of America Corporation and Subsidiaries
Debt Securities and Available-for-Sale Marketable Equity Securities
(Dollars in millions)
| | | | | | | | | | | | | |
| | | June 30, 2009 |
| | | Amortized
Cost | | Gross
Unrealized
Gains | | Gross
Unrealized
Losses | | | Fair
Value |
Available-for-sale debt securities | | | | | | | | | | | | | |
U.S Treasury securities and agency debentures | | $ | 14,545 | | $ | 383 | | $ | (12 | ) | | $ | 14,916 |
Mortgage-backed securities: | | | | | | | | | | | | | |
Agency MBSs | | | 135,348 | | | 2,330 | | | (210 | ) | | | 137,468 |
Agency collateralized mortgage obligations | | | 17,573 | | | 401 | | | (112 | ) | | | 17,862 |
Non-agency MBSs | | | 48,222 | | | 2,179 | | | (7,945 | ) | | | 42,456 |
Foreign securities | | | 5,405 | | | 24 | | | (1,204 | ) | | | 4,225 |
Corporate/Agency bonds | | | 5,794 | | | 101 | | | (412 | ) | | | 5,483 |
Other taxable securities(1) | | | 23,198 | | | 150 | | | (749 | ) | | | 22,599 |
| | | | | | | | | | | | | |
Total taxable securities | | | 250,085 | | | 5,568 | | | (10,644 | ) | | | 245,009 |
Tax-exempt securities | | | 13,032 | | | 85 | | | (607 | ) | | | 12,510 |
| | | | | | | | | | | | | |
Total available-for-sale debt securities | | $ | 263,117 | | $ | 5,653 | | $ | (11,251 | ) | | $ | 257,519 |
| | | | | | | | | | | | | |
Held-to-maturity debt securities(2) | | | 9,719 | | | — | | | 1,875 | | | | 7,844 |
| | | | | | | | | | | | | |
Total debt securities | | $ | 272,836 | | $ | 5,653 | | $ | (13,126 | ) | | $ | 265,363 |
| | | | | | | | | | | | | |
Available-for-sale marketable equity securities(3) | | $ | 6,427 | | $ | 1,495 | | $ | (947 | ) | | $ | 6,975 |
| | | | | | | | | | | | | |
| |
| | | March 31, 2009 |
| | | Amortized
Cost | | Gross
Unrealized
Gains | | Gross
Unrealized
Losses | | | Fair
Value |
Available-for-sale debt securities | | | | | | | | | | | | | |
U.S Treasury securities and agency debentures | | $ | 4,353 | | $ | 249 | | $ | (9 | ) | | $ | 4,593 |
Mortgage-backed securities: | | | | | | | | | | | | | |
Agency MBSs | | | 136,194 | | | 3,116 | | | (130 | ) | | | 139,180 |
Agency collateralized mortgage obligations | | | 20,842 | | | 365 | | | (51 | ) | | | 21,156 |
Non-agency MBSs | | | 58,129 | | | 1,649 | | | (10,941 | ) | | | 48,837 |
Foreign securities | | | 5,363 | | | 5 | | | (940 | ) | | | 4,428 |
Corporate/Agency bonds | | | 5,588 | | | 37 | | | (1,142 | ) | | | 4,483 |
Other taxable securities(1) | | | 22,539 | | | 61 | | | (653 | ) | | | 21,947 |
| | | | | | | | | | | | | |
Total taxable securities | | | 253,008 | | | 5,482 | | | (13,866 | ) | | | 244,624 |
Tax-exempt securities | | | 10,142 | | | 83 | | | (655 | ) | | | 9,570 |
| | | | | | | | | | | | | |
Total available-for-sale debt securities | | $ | 263,150 | | $ | 5,565 | | $ | (14,521 | ) | | $ | 254,194 |
| | | | | | | | | | | | | |
Held-to-maturity debt securities(2) | | | 8,444 | | | — | | | (1,881 | ) | | | 6,563 |
| | | | | | | | | | | | | |
Total debt securities | | $ | 271,594 | | $ | 5,565 | | $ | (16,402 | ) | | $ | 260,757 |
| | | | | | | | | | | | | |
Available-for-sale marketable equity securities(3) | | $ | 17,456 | | $ | 5,705 | | $ | (1,340 | ) | | $ | 21,821 |
| | | | | | | | | | | | | |
| (1) | Includes asset-backed securities. |
| (2) | Includes asset-backed securities that were issued by the Corporation’s credit card securitization trust and retained by the corporation with an amortized cost of $7.4 billion and a fair value of $5.5 billion at June 30, 2009 and $7.8 billion and $5.9 billion at March 31, 2009. |
| (3) | Represents those available-for-sale marketable equity securities that are recorded in other assets on the Consolidated Balance Sheet. |
Certain prior period amounts have been reclassified among the segments to conform to the current period presentation.
Information for periods beginning July 1, 2008 includes the Countrywide acquisition. Information for periods beginning January 1, 2009 includes the
Merrill Lynch acquisition. Prior periods have not been restated.
| | |
| This information is preliminary and based on company data available at the time of the presentation. | | 13 |
Bank of America Corporation and Subsidiaries
Quarterly Results by Business Segment
(Dollars in millions)
| | | | | | | | | | | | | | | | | | | | | | | | | | | | | | | |
| | | Second Quarter 2009 | |
| | | Total
Corporation | | | | | Deposits | | Global
Card
Services (1) | | | Home
Loans &
Insurance | | | Global
Banking | | Global
Markets | | | GWIM | | All Other (1) | |
Net interest income(2) | | $ | 11,942 | | | | | $ | 1,748 | | $ | 5,049 | | | $ | 1,197 | | | $ | 2,738 | | $ | 1,507 | | | $ | 1,291 | | $ | (1,588 | ) |
Noninterest income | | | 21,144 | | | | | | 1,747 | | | 2,288 | | | | 3,264 | | | | 5,920 | | | 2,945 | | | | 2,905 | | | 2,075 | |
| | | | | | | | | | | | | | | | | | | | | | | | | | | | | | | |
Total revenue, net of interest expense | | | 33,086 | | | | | | 3,495 | | | 7,337 | | | | 4,461 | | | | 8,658 | | | 4,452 | | | | 4,196 | | | 487 | |
| | | | | | | | | |
Provision for credit losses | | | 13,375 | | | | | | 96 | | | 7,741 | | | | 2,726 | | | | 2,584 | | | (1 | ) | | | 238 | | | (9 | ) |
Noninterest expense | | | 17,020 | | | | | | 2,649 | | | 1,976 | | | | 2,829 | | | | 2,232 | | | 2,559 | | | | 3,304 | | | 1,471 | |
| | | | | | | | | | | | | | | | | | | | | | | | | | | | | | | |
Income (loss) before income taxes | | | 2,691 | | | | | | 750 | | | (2,380 | ) | | | (1,094 | ) | | | 3,842 | | | 1,894 | | | | 654 | | | (975 | ) |
Income tax expense (benefit)(2) | | | (533 | ) | | | | | 245 | | | (762 | ) | | | (369 | ) | | | 1,355 | | | 517 | | | | 213 | | | (1,732 | ) |
| | | | | | | | | | | | | | | | | | | | | | | | | | | | | | | |
Net income (loss) | | $ | 3,224 | | | | | $ | 505 | | $ | (1,618 | ) | | $ | (725 | ) | | $ | 2,487 | | $ | 1,377 | | | $ | 441 | | $ | 757 | |
| | | | | | | | | | | | | | | | | | | | | | | | | | | | | | | |
| | | | | | | | | |
Average | | | | | | | | | | | | | | | | | | | | | | | | | | | | | | | |
Total loans and leases | | $ | 966,105 | | | | | | n/m | | $ | 220,365 | | | $ | 131,509 | | | $ | 323,217 | | | n/m | | | $ | 101,748 | | $ | 159,142 | |
Total assets(3) | | | 2,420,317 | | | | | $ | 442,419 | | | 236,017 | | | | 232,194 | | | | 389,387 | | $ | 670,703 | | | | 238,609 | | | n/m | |
Total deposits | | | 974,892 | | | | | | 417,114 | | | n/m | | | | n/m | | | | 199,879 | | | n/m | | | | 214,111 | | | 108,079 | |
Allocated equity | | | 242,867 | | | | | | 23,576 | | | 42,118 | | | | 15,827 | | | | 60,455 | | | 31,022 | | | | 18,708 | | | 51,161 | |
| | | | | | | | | |
Period end | | | | | | | | | | | | | | | | | | | | | | | | | | | | | | | |
Total loans and leases | | $ | 942,248 | | | | | | n/m | | $ | 215,904 | | | $ | 131,120 | | | $ | 314,512 | | | n/m | | | $ | 100,878 | | $ | 153,008 | |
Total assets(3) | | | 2,254,394 | | | | | $ | 448,200 | | | 231,986 | | | | 234,388 | | | | 381,123 | | $ | 571,761 | | | | 232,913 | | | n/m | |
Total deposits | | | 970,742 | | | | | | 423,192 | | | n/m | | | | n/m | | | | 201,207 | | | n/m | | | | 206,296 | | | 106,127 | |
| |
| | | First Quarter 2009 | |
| | | Total
Corporation | | | | | Deposits | | Global
Card
Services(1) | | | Home
Loans &
Insurance | | | Global
Banking | | Global
Markets | | | GWIM | | All Other(1) | |
Net interest income(2) | | $ | 12,819 | | | | | $ | 1,911 | | $ | 5,259 | | | $ | 1,179 | | | $ | 2,815 | | $ | 1,889 | | | $ | 1,655 | | $ | (1,889 | ) |
Noninterest income | | | 23,261 | | | | | | 1,501 | | | 2,250 | | | | 4,044 | | | | 1,825 | | | 5,010 | | | | 2,708 | | | 5,923 | |
| | | | | | | | | | | | | | | | | | | | | | | | | | | | | | | |
Total revenue, net of interest expense | | | 36,080 | | | | | | 3,412 | | | 7,509 | | | | 5,223 | | | | 4,640 | | | 6,899 | | | | 4,363 | | | 4,034 | |
| | | | | | | | | |
Provision for credit losses | | | 13,380 | | | | | | 91 | | | 8,441 | | | | 3,372 | | | | 1,848 | | | 51 | | | | 254 | | | (677 | ) |
Noninterest expense | | | 17,002 | | | | | | 2,359 | | | 2,077 | | | | 2,650 | | | | 2,515 | | | 3,056 | | | | 3,290 | | | 1,055 | |
| | | | | | | | | | | | | | | | | | | | | | | | | | | | | | | |
Income (loss) before income taxes | | | 5,698 | | | | | | 962 | | | (3,009 | ) | | | (799 | ) | | | 277 | | | 3,792 | | | | 819 | | | 3,656 | |
Income tax expense (benefit)(2) | | | 1,451 | | | | | | 361 | | | (1,133 | ) | | | (301 | ) | | | 105 | | | 1,357 | | | | 309 | | | 753 | |
| | | | | | | | | | | | | | | | | | | | | | | | | | | | | | | |
Net income (loss) | | $ | 4,247 | | | | | $ | 601 | | $ | (1,876 | ) | | $ | (498 | ) | | $ | 172 | | $ | 2,435 | | | $ | 510 | | $ | 2,903 | |
| | | | | | | | | | | | | | | | | | | | | | | | | | | | | | | |
| | | | | | | | | |
Average | | | | | | | | | | | | | | | | | | | | | | | | | | | | | | | |
Total loans and leases | | $ | 994,121 | | | | | | n/m | | $ | 228,461 | | | $ | 126,685 | | | $ | 330,974 | | | n/m | | | $ | 110,535 | | $ | 168,450 | |
Total assets(3) | | | 2,519,134 | | | | | $ | 402,874 | | | 246,611 | | | | 220,061 | | | | 397,625 | | $ | 714,726 | | | | 278,130 | | | n/m | |
Total deposits | | | 964,081 | | | | | | 377,575 | | | n/m | | | | n/m | | | | 196,061 | | | n/m | | | | 249,792 | | | 109,447 | |
Allocated equity | | | 228,766 | | | | | | 23,484 | | | 40,370 | | | | 14,403 | | | | 56,503 | | | 27,235 | | | | 17,119 | | | 49,652 | |
| | | | | | | | | |
Period end | | | | | | | | | | | | | | | | | | | | | | | | | | | | | | | |
Total loans and leases | | $ | 977,008 | | | | | | n/m | | $ | 221,984 | | | $ | 131,332 | | | $ | 323,407 | | | n/m | | | $ | 102,766 | | $ | 165,534 | |
Total assets(3) | | | 2,321,963 | | | | | $ | 417,123 | | | 238,410 | | | | 221,547 | | | | 387,410 | | $ | 583,416 | | | | 268,133 | | | n/m | |
Total deposits | | | 953,508 | | | | | | 391,604 | | | n/m | | | | n/m | | | | 194,864 | | | n/m | | | | 241,504 | | | 93,702 | |
| |
| | | Second Quarter 2008 | |
| | | Total
Corporation | | | | | Deposits | | Global
Card
Services(1) | | | Home
Loans &
Insurance | | | Global
Banking | | Global
Markets | | | GWIM | | All Other(1) | |
Net interest income(2) | | $ | 10,937 | | | | | $ | 2,625 | | $ | 4,742 | | | $ | 620 | | | $ | 2,517 | | $ | 1,197 | | | $ | 1,149 | | $ | (1,913 | ) |
Noninterest income | | | 9,789 | | | | | | 1,775 | | | 2,758 | | | | 641 | | | | 1,938 | | | 181 | | | | 1,146 | | | 1,350 | |
| | | | | | | | | | | | | | | | | | | | | | | | | | | | | | | |
Total revenue, net of interest expense | | | 20,726 | | | | | | 4,400 | | | 7,500 | | | | 1,261 | | | | 4,455 | | | 1,378 | | | | 2,295 | | | (563 | ) |
| | | | | | | | | |
Provision for credit losses | | | 5,830 | | | | | | 89 | | | 4,259 | | | | 2,034 | | | | 400 | | | (38 | ) | | | 119 | | | (1,033 | ) |
Noninterest expense | | | 9,659 | | | | | | 2,324 | | | 2,375 | | | | 732 | | | | 1,747 | | | 951 | | | | 1,244 | | | 286 | |
| | | | | | | | | | | | | | | | | | | | | | | | | | | | | | | |
Income (loss) before income taxes | | | 5,237 | | | | | | 1,987 | | | 866 | | | | (1,505 | ) | | | 2,308 | | | 465 | | | | 932 | | | 184 | |
Income tax expense (benefit)(2) | | | 1,827 | | | | | | 749 | | | 284 | | | | (557 | ) | | | 875 | | | 167 | | | | 351 | | | (42 | ) |
| | | | | | | | | | | | | | | | | | | | | | | | | | | | | | | |
Net income (loss) | | $ | 3,410 | | | | | $ | 1,238 | | $ | 582 | | | $ | (948 | ) | | $ | 1,433 | | $ | 298 | | | $ | 581 | | $ | 226 | |
| | | | | | | | | | | | | | | | | | | | | | | | | | | | | | | |
| | | | | | | | | |
Average | | | | | | | | | | | | | | | | | | | | | | | | | | | | | | | |
Total loans and leases | | $ | 878,639 | | | | | | n/m | | $ | 238,918 | | | $ | 91,199 | | | $ | 315,282 | | | n/m | | | $ | 87,574 | | $ | 117,504 | |
Total assets(3) | | | 1,754,613 | | | | | $ | 364,444 | | | 261,456 | | | | 104,539 | | | | 378,233 | | $ | 429,854 | | | | 165,682 | | | n/m | |
Total deposits | | | 786,002 | | | | | | 337,253 | | | n/m | | | | n/m | | | | 169,738 | | | n/m | | | | 157,113 | | | 96,998 | |
Allocated equity | | | 161,428 | | | | | | 24,520 | | | 38,978 | | | | 3,342 | | | | 48,634 | | | 12,088 | | | | 11,775 | | | 22,091 | |
| | | | | | | | | |
Period end | | | | | | | | | | | | | | | | | | | | | | | | | | | | | | | |
Total loans and leases | | $ | 870,464 | | | | | | n/m | | $ | 240,617 | | | $ | 92,064 | | | $ | 322,675 | | | n/m | | | $ | 88,172 | | $ | 95,826 | |
Total assets(3) | | | 1,716,875 | | | | | $ | 363,326 | | | 263,253 | | | | 103,765 | | | | 386,525 | | $ | 388,451 | | | | 167,197 | | | n/m | |
Total deposits | | | 784,764 | | | | | | 336,136 | | | n/m | | | | n/m | | | | 173,576 | | | n/m | | | | 158,228 | | | 93,418 | |
| (1) | Global Card Services is presented on a managed basis with a corresponding offset recorded in All Other. |
| (2) | Fully taxable-equivalent basis |
| (3) | Total assets include asset allocations to match liabilities (i.e., deposits). |
n/m = not meaningful
Certain prior period amounts have been reclassified among the segments to conform to the current period presentation.
Information for periods beginning July 1, 2008 includes the Countrywide acquisition. Information for periods beginning January 1, 2009 includes the
Merrill Lynch acquisition. Prior periods have not been restated.
| | |
| This information is preliminary and based on company data available at the time of the presentation. | | 14 |
Bank of America Corporation and Subsidiaries
Year-to-Date Results by Business Segment
(Dollars in millions)
| | | | | | | | | | | | | | | | | | | | | | | | | | | | | | |
| | | Six Months Ended June 30, 2009 | |
| | | Total
Corporation | | | | Deposits | | Global
Card
Services (1) | | | Home
Loans &
Insurance | | | Global
Banking | | Global
Markets | | | GWIM | | All Other (1) | |
| | | | | | | | | |
Net interest income(2) | | $ | 24,761 | | | | $ | 3,659 | | $ | 10,308 | | | $ | 2,376 | | | $ | 5,553 | | $ | 3,396 | | | $ | 2,946 | | $ | (3,477 | ) |
Noninterest income | | | 44,405 | | | | | 3,248 | | | 4,538 | | | | 7,308 | | | | 7,745 | | | 7,955 | | | | 5,613 | | | 7,998 | |
| | | | | | | | | | | | | | | | | | | | | | | | | | | | | | |
Total revenue, net of interest expense | | | 69,166 | | | | | 6,907 | | | 14,846 | | | | 9,684 | | | | 13,298 | | | 11,351 | | | | 8,559 | | | 4,521 | |
| | | | | | | | | |
Provision for credit losses | | | 26,755 | | | | | 187 | | | 16,182 | | | | 6,098 | | | | 4,432 | | | 50 | | | | 492 | | | (686 | ) |
Noninterest expense | | | 34,022 | | | | | 5,008 | | | 4,053 | | | | 5,479 | | | | 4,747 | | | 5,615 | | | | 6,594 | | | 2,526 | |
| | | | | | | | | | | | | | | | | | | | | | | | | | | | | | |
Income (loss) before income taxes | | | 8,389 | | | | | 1,712 | | | (5,389 | ) | | | (1,893 | ) | | | 4,119 | | | 5,686 | | | | 1,473 | | | 2,681 | |
Income tax expense (benefit)(2) | | | 918 | | | | | 606 | | | (1,895 | ) | | | (670 | ) | | | 1,460 | | | 1,874 | | | | 522 | | | (979 | ) |
| | | | | | | | | | | | | | | | | | | | | | | | | | | | | | |
Net income (loss) | | $ | 7,471 | | | | $ | 1,106 | | $ | (3,494 | ) | | $ | (1,223 | ) | | $ | 2,659 | | $ | 3,812 | | | $ | 951 | | $ | 3,660 | |
| | | | | | | | | | | | | | | | | | | | | | | | | | | | | | |
| | | | | | | | | |
Average | | | | | | | | | | | | | | | | | | | | | | | | | | | | | | |
Total loans and leases | | $ | 980,035 | | | | | n/m | | $ | 224,391 | | | $ | 129,110 | | | $ | 327,074 | | | n/m | | | $ | 106,117 | | $ | 163,770 | |
Total assets(3) | | | 2,469,452 | | | | $ | 422,756 | | | 241,285 | | | | 226,161 | | | | 393,483 | | $ | 692,593 | | | | 258,260 | | | n/m | |
Total deposits | | | 969,516 | | | | | 397,454 | | | n/m | | | | n/m | | | | 197,981 | | | n/m | | | | 231,853 | | | 108,757 | |
Allocated equity | | | 235,855 | | | | | 23,530 | | | 41,249 | | | | 15,118 | | | | 58,490 | | | 29,139 | | | | 17,918 | | | 50,411 | |
| | | | | | | | | |
Period end | | | | | | | | | | | | | | | | | | | | | | | | | | | | | | |
Total loans and leases | | $ | 942,248 | | | | | n/m | | $ | 215,904 | | | $ | 131,120 | | | $ | 314,512 | | | n/m | | | $ | 100,878 | | $ | 153,008 | |
Total assets(3) | | | 2,254,394 | | | | $ | 448,200 | | | 231,986 | | | | 234,388 | | | | 381,123 | | $ | 571,761 | | | | 232,913 | | | n/m | |
Total deposits | | | 970,742 | | | | | 423,192 | | | n/m | | | | n/m | | | | 201,207 | | | n/m | | | | 206,296 | | | 106,127 | |
| |
| | | Six Months Ended June 30, 2008 | |
| | | Total
Corporation | | | | Deposits | | Global
Card
Services (1) | | | Home
Loans &
Insurance | | | Global
Banking | | Global
Markets | | | GWIM | | All Other (1) | |
| | | | | | | | | |
Net interest income(2) | | $ | 21,228 | | | | $ | 5,136 | | $ | 9,331 | | | $ | 1,170 | | | $ | 4,863 | | $ | 2,332 | | | $ | 2,167 | | $ | (3,771 | ) |
Noninterest income | | | 16,869 | | | | | 3,352 | | | 6,099 | | | | 1,414 | | | | 3,491 | | | (1,795 | ) | | | 2,070 | | | 2,238 | |
| | | | | | | | | | | | | | | | | | | | | | | | | | | | | | |
Total revenue, net of interest expense | | | 38,097 | | | | | 8,488 | | | 15,430 | | | | 2,584 | | | | 8,354 | | | 537 | | | | 4,237 | | | (1,533 | ) |
| | | | | | | | | |
Provision for credit losses | | | 11,840 | | | | | 195 | | | 8,711 | | | | 3,846 | | | | 926 | | | (39 | ) | | | 362 | | | (2,161 | ) |
Noninterest expense | | | 18,922 | | | | | 4,516 | | | 4,572 | | | | 1,470 | | | | 3,494 | | | 1,680 | | | | 2,555 | | | 635 | |
| | | | | | | | | | | | | | | | | | | | | | | | | | | | | | |
Income (loss) before income taxes | | | 7,335 | | | | | 3,777 | | | 2,147 | | | | (2,732 | ) | | | 3,934 | | | (1,104 | ) | | | 1,320 | | | (7 | ) |
Income tax expense (benefit)(2) | | | 2,715 | | | | | 1,414 | | | 746 | | | | (1,011 | ) | | | 1,478 | | | (413 | ) | | | 495 | | | 6 | |
| | | | | | | | | | | | | | | | | | | | | | | | | | | | | | |
Net income (loss) | | $ | 4,620 | | | | $ | 2,363 | | $ | 1,401 | | | $ | (1,721 | ) | | $ | 2,456 | | $ | (691 | ) | | $ | 825 | | $ | (13 | ) |
| | | | | | | | | | | | | | | | | | | | | | | | | | | | | | |
| | | | | | | | | |
Average | | | | | | | | | | | | | | | | | | | | | | | | | | | | | | |
Total loans and leases | | $ | 877,150 | | | | | n/m | | $ | 236,738 | | | $ | 89,218 | | | $ | 310,603 | | | n/m | | | $ | 86,609 | | $ | 125,695 | |
Total assets(3) | | | 1,759,770 | | | | $ | 365,798 | | | 259,807 | | | | 102,217 | | | | 372,994 | | $ | 445,251 | | | | 161,016 | | | n/m | |
Total deposits | | | 786,813 | | | | | 338,358 | | | n/m | | | | n/m | | | | 165,232 | | | n/m | | | | 152,808 | | | 105,109 | |
Allocated equity | | | 158,078 | | | | | 24,600 | | | 38,716 | | | | 3,106 | | | | 48,099 | | | 11,786 | | | | 11,673 | | | 20,098 | |
| | | | | | | | | |
Period end | | | | | | | | | | | | | | | | | | | | | | | | | | | | | | |
Total loans and leases | | $ | 870,464 | | | | | n/m | | $ | 240,617 | | | $ | 92,064 | | | $ | 322,675 | | | n/m | | | $ | 88,172 | | $ | 95,826 | |
Total assets(3) | | | 1,716,875 | | | | $ | 363,326 | | | 263,253 | | | | 103,765 | | | | 386,525 | | $ | 388,451 | | | | 167,197 | | | n/m | |
Total deposits | | | 784,764 | | | | | 336,136 | | | n/m | | | | n/m | | | | 173,576 | | | n/m | | | | 158,228 | | $ | 93,418 | |
| (1) | Global Card Services is presented on a managed basis with a corresponding offset recorded in All Other. |
| (2) | Fully taxable-equivalent basis |
| (3) | Total assets include asset allocations to match liabilities (i.e., deposits). |
n/m = not meaningful
Certain prior period amounts have been reclassified among the segments to conform to the current period presentation.
Information for periods beginning July 1, 2008 includes the Countrywide acquisition. Information for periods beginning January 1, 2009 includes the
Merrill Lynch acquisition. Prior periods have not been restated.
| | |
| This information is preliminary and based on company data available at the time of the presentation. | | 15 |
Bank of America Corporation and Subsidiaries
Deposits Segment Results(1)
(Dollars in millions)
| | | | | | | | | | | | | | | | | | | | | | | | | | | | | | | | | | | | | | | | | | |
| | | Six Months Ended
June 30 | | | | | | | | Second
Quarter
2009 | | | | | First
Quarter
2009 | | | | | Fourth
Quarter
2008 | | | | Third
Quarter
2008 | | | | Second
Quarter
2008 | | |
| | | | | | | | | | | | | | | |
| | | 2009 | | | | | 2008 | | | | | | | | | | | | | |
Net interest income(2) | | $ | 3,659 | | | | | $ | 5,136 | | | | | | | | $ | 1,748 | | | | | $ | 1,911 | | | | | $ | 2,984 | | | | $ | 2905 | | | | $ | 2,625 | | |
Noninterest income: | | | | | | | | | | | | | | | | | | | | | | | | | | | | | | | | | | | | | | | | | | |
Service charges | | | 3,252 | | | | | | 3,306 | | | | | | | | | 1,749 | | | | | | 1,503 | | | | | | 1,676 | | | | | 1,821 | | | | | 1,742 | | |
All other income (loss) | | | (4 | ) | | | | | 46 | | | | | | | | | (2 | ) | | | | | (2 | ) | | | | | 11 | | | | | 11 | | | | | 33 | | |
| | | | | | | | | | | | | | | | | | | | | | | | | | | | | | | | | | | | | | | | | | |
Total noninterest income | | | 3,248 | | | | | | 3,352 | | | | | | | | | 1,747 | | | | | | 1,501 | | | | | | 1,687 | | | | | 1,832 | | | | | 1,775 | | |
| | | | | | | | | | | | | | | | | | | | | | | | | | | | | | | | | | | | | | | | | | |
Total revenue, net of interest expense | | | 6,907 | | | | | | 8,488 | | | | | | | | | 3,495 | | | | | | 3,412 | | | | | | 4,671 | | | | | 4,737 | | | | | 4,400 | | |
| | | | | | | | | | | | | | | | |
Provision for credit losses | | | 187 | | | | | | 195 | | | | | | | | | 96 | | | | | | 91 | | | | | | 107 | | | | | 98 | | | | | 89 | | |
Noninterest expense | | | 5,008 | | | | | | 4,516 | | | | | | | | | 2,649 | | | | | | 2,359 | | | | | | 2,238 | | | | | 2,119 | | | | | 2,324 | | |
| | | | | | | | | | | | | | | | | | | | | | | | | | | | | | | | | | | | | | | | | | |
Income before income taxes | | | 1,712 | | | | | | 3,777 | | | | | | | | | 750 | | | | | | 962 | | | | | | 2,326 | | | | | 2,520 | | | | | 1,987 | | |
Income tax expense(2) | | | 606 | | | | | | 1,414 | | | | | | | | | 245 | | | | | | 361 | | | | | | 735 | | | | | 950 | | | | | 749 | | |
| | | | | | | | | | | | | | | | | | | | | | | | | | | | | | | | | | | | | | | | | | |
Net income | | $ | 1,106 | | | | | $ | 2,363 | | | | | | | | $ | 505 | | | | | $ | 601 | | | | | $ | 1,591 | | | | $ | 1,570 | | | | $ | 1,238 | | |
| | | | | | | | | | | | | | | | | | | | | | | | | | | | | | | | | | | | | | | | | | |
Net interest yield(2) | | | 1.86 | | | % | | | 3.10 | | % | | | | | | | 1.69 | | | % | | | 2.06 | | | % | | | 3.23 | | % | | | 3.13 | | % | | | 3.18 | | % |
Return on average equity | | | 9.47 | | | | | | 19.31 | | | | | | | | | 8.58 | | | | | | 10.39 | | | | | | 25.85 | | | | | 25.92 | | | | | 20.30 | | |
Efficiency ratio(2) | | | 72.50 | | | | | | 53.21 | | | | | | | | | 75.80 | | | | | | 69.12 | | | | | | 47.92 | | | | | 44.74 | | | | | 52.82 | | |
| | | | | | | | | | | | | | | | |
Balance sheet | | | | | | | | | | | | | | | | | | | | | | | | | | | | | | | | | | | | | | | | | | |
| | | | | | | | | | | | | | | | |
Average | | | | | | | | | | | | | | | | | | | | | | | | | | | | | | | | | | | | | | | | | | |
Total earning assets(3) | | $ | 396,248 | | | | | $ | 333,671 | | | | | | | | $ | 415,798 | | | | | $ | 376,481 | | | | | $ | 367,631 | | | | $ | 369,121 | | | | $ | 331,886 | | |
Total assets(3) | | | 422,756 | | | | | | 365,798 | | | | | | | | | 442,419 | | | | | | 402,874 | | | | | | 394,426 | | | | | 394,718 | | | | | 364,444 | | |
Total deposits | | | 397,454 | | | | | | 338,358 | | | | | | | | | 417,114 | | | | | | 377,575 | | | | | | 378,951 | | | | | 379,071 | | | | | 337,253 | | |
Allocated equity | | | 23,530 | | | | | | 24,600 | | | | | | | | | 23,576 | | | | | | 23,484 | | | | | | 24,493 | | | | | 24,088 | | | | | 24,520 | | |
| | | | | | | | | | | | | | | | |
Period end | | | | | | | | | | | | | | | | | | | | | | | | | | | | | | | | | | | | | | | | | | |
Total earning assets(3) | | $ | 421,996 | | | | | $ | 334,671 | | | | | | | | $ | 421,996 | | | | | $ | 390,782 | | | | | $ | 364,557 | | | | $ | 371,772 | | | | $ | 334,671 | | |
Total assets(3) | | | 448,200 | | | | | | 363,326 | | | | | | | | | 448,200 | | | | | | 417,123 | | | | | | 391,698 | | | | | 398,938 | | | | | 363,326 | | |
Total deposits | | | 423,192 | | | | | | 336,136 | | | | | | | | | 423,192 | | | | | | 391,604 | | | | | | 376,974 | | | | | 383,078 | | | | | 336,136 | | |
| (1) | Deposits includes the net impact of migrating customers and their related deposit balances between Global Wealth & Investment Management (GWIM) and Deposits. After migration, the associated net interest income, service charges and noninterest expense are recorded in the appropriate segment. |
| (2) | Fully taxable-equivalent basis |
| (3) | Total earning assets and total assets include asset allocations to match liabilities (i.e., deposits). |
Certain prior period amounts have been reclassified among the segments to conform to the current period presentation.
Information for periods beginning July 1, 2008 includes the Countrywide acquisition. Information for periods beginning January 1, 2009 includes the
Merrill Lynch acquisition. Prior periods have not been restated.
| | |
| This information is preliminary and based on company data available at the time of the presentation. | | 16 |
Bank of America Corporation and Subsidiaries
Deposits Key Indicators
(Dollars in millions, except as noted)
| | | | | | | | | | | | | | | | | | | | | | | | | | | | | | | | | | | | | | | | | | |
| | | Six Months Ended
June 30 | | | | | | Second
Quarter | | | | | First
Quarter | | | | | Fourth
Quarter | | | | Third
Quarter | | | | Second
Quarter | | |
| | | 2009 | | | | | 2008 | | | | | | | | 2009 | | | | | 2009 | | | | | 2008 | | | | 2008 | | | | 2008 | | |
Average deposit balances | | | | | | | | | | | | | | | | | | | | | | | | | | | | | | | | | | | | | | | | | | |
Checking | | $ | 130,996 | | | | | $ | 127,047 | | | | | | | | $ | 135,837 | | | | | $ | 126,101 | | | | | $ | 124,625 | | | | $ | 125,844 | | | | $ | 128,240 | | |
Savings | | | 31,034 | | | | | | 29,460 | | | | | | | | | 32,488 | | | | | | 29,564 | | | | | | 28,687 | | | | | 29,392 | | | | | 30,092 | | |
MMS | | | 85,025 | | | | | | 68,066 | | | | | | | | | 91,537 | | | | | | 78,441 | | | | | | 80,677 | | | | | 80,364 | | | | | 69,772 | | |
CDs and IRAs | | | 146,777 | | | | | | 110,953 | | | | | | | | | 153,358 | | | | | | 140,123 | | | | | | 141,895 | | | | | 139,628 | | | | | 106,153 | | |
Foreign and other | | | 3,622 | | | | | | 2,832 | | | | | | | | | 3,894 | | | | | | 3,346 | | | | | | 3,067 | | | | | 3,843 | | | | | 2,996 | | |
| | | | | | | | | | | | | | | | | | | | | | | | | | | | | | | | | | | | | | | | | | |
Total average deposit balances | | $ | 397,454 | | | | | $ | 338,358 | | | | | | | | $ | 417,114 | | | | | $ | 377,575 | | | | | $ | 378,951 | | | | $ | 379,071 | | | | $ | 337,253 | | |
| | | | | | | | | | | | | | | | | | | | | | | | | | | | | | | | | | | | | | | | | | |
| | | | | | | | | | | | | | | | |
Total balances migrated to (from)GWIM | | $ | (40,480 | ) | | | | $ | 12,662 | | | | | | | | $ | (34,340 | ) | | | | $ | (6,140 | ) | | | | $ | 4,542 | | | | $ | 3,272 | | | | $ | 5,631 | | |
| | | | | | | | | | | | | | | | |
Deposit spreads (excludes noninterest costs) | | | | | | | | | | | | | | | | | | | | | | | | | | | | | | | | | | | | | | | | | | |
Checking | | | 4.12 | | | % | | | 4.21 | | % | | | | | | | 4.07 | | | % | | | 4.18 | | | % | | | 4.25 | | % | | | 4.23 | | % | | | 4.15 | | % |
Savings | | | 3.88 | | | | | | 3.79 | | | | | | | | | 3.87 | | | | | | 3.89 | | | | | | 3.82 | | | | | 3.80 | | | | | 3.70 | | |
MMS | | | 0.23 | | | | | | 1.42 | | | | | | | | | 0.55 | | | | | | (0.14 | ) | | | | | 0.91 | | | | | 1.15 | | | | | 1.30 | | |
CDs and IRAs | | | 0.07 | | | | | | 0.47 | | | | | | | | | 0.05 | | | | | | 0.09 | | | | | | 0.26 | | | | | 0.14 | | | | | 0.40 | | |
Foreign and other | | | 3.44 | | | | | | 3.56 | | | | | | | | | 3.36 | | | | | | 3.54 | | | | | | 3.76 | | | | | 3.72 | | | | | 3.62 | | |
Total deposit spreads | | | 1.75 | | | | | | 2.36 | | | | | | | | | 1.78 | | | | | | 1.71 | | | | | | 1.99 | | | | | 2.01 | | | | | 2.31 | | |
| | | | | | | | | | | | | | | | |
Net new retail checking (units in thousands) | | | 394 | | | | | | 1,231 | | | | | | | | | 176 | | | | | | 218 | | | | | | 130 | | | | | 823 | | | | | 674 | | |
| | | | | | | | | | | | | | | | |
Online banking (end of period) | | | | | | | | | | | | | | | | | | | | | | | | | | | | | | | | | | | | | | | | | | |
Active accounts (units in thousands) | | | 29,196 | | | | | | 25,299 | | | | | | | | | 29,196 | | | | | | 29,515 | | | | | | 28,854 | | | | | 28,636 | | | | | 25,299 | | |
Active billpay accounts (units in thousands) | | | 16,000 | | | | | | 13,269 | | | | | | | | | 16,000 | | | | | | 16,031 | | | | | | 15,861 | | | | | 15,732 | | | | | 13,269 | | |
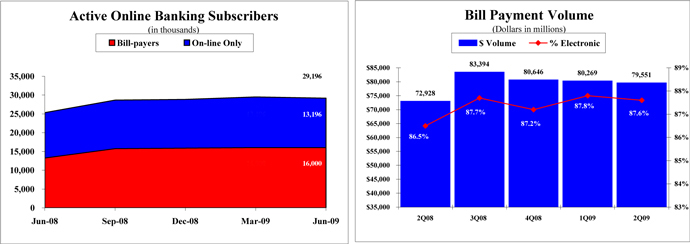
Bank of America has the largest active online banking customer base with 29.2 million subscribers.
Bank of America uses a strict Active User standard - customers must have used our online services within the last 90 days.
16.0 millionactivebill pay users paid $79.6 billion worth of bills this quarter. The number of customers who sign up and use Bank of America’s Bill Pay Service continues to surpass that of any other financial institution.
Currently, approximately 330 companies are presenting 39.1 million e-bills per quarter.
Certain prior period amounts have been reclassified to conform to the current period presentation.
Information for periods beginning July 1, 2008 includes the Countrywide acquisition. Information for periods beginning January 1, 2009 includes the
Merrill Lynch acquisition. Prior periods have not been restated.
| | |
| This information is preliminary and based on company data available at the time of the presentation. | | 17 |
Bank of America Corporation and Subsidiaries
Global Card Services Segment Results(1)
(Dollars in millions)
| | | | | | | | | | | | | | | | | | | | | | | | | | | | | | | | | | | | | | | | | | | | |
| | | Six Months Ended
June 30 | | | | | | Second
Quarter | | | | | First
Quarter | | | | | Fourth
Quarter | | | | | Third
Quarter | | | | | Second
Quarter | | |
| | | 2009 | | | | | 2008 | | | | | | | | 2009 | | | | | 2009 | | | | | 2008 | | | | | 2008 | | | | | 2008 | | |
Net interest income(2) | | $ | 10,308 | | | | | $ | 9,331 | | | | | | | | $ | 5,049 | | | | | $ | 5,259 | | | | | $ | 5,302 | | | | | $ | 4,922 | | | | | $ | 4,742 | | |
Noninterest income: | | | | | | | | | | | | | | | | | | | | | | | | | | | | | | | | | | | | | | | | | | | | |
Card income | | | 4,279 | | | | | | 5,275 | | | | | | | | | 2,164 | | | | | | 2,115 | | | | | | 2,469 | | | | | | 2,290 | | | | | | 2,554 | | |
All other income | | | 259 | | | | | | 824 | | | | | | | | | 124 | | | | | | 135 | | | | | | 239 | | | | | | 534 | | | | | | 204 | | |
| | | | | | | | | | | | | | | | | | | | | | | | | | | | | | | | | | | | | | | | | | | | |
Total noninterest income | | | 4,538 | | | | | | 6,099 | | | | | | | | | 2,288 | | | | | | 2,250 | | | | | | 2,708 | | | | | | 2,824 | | | | | | 2,758 | | |
| | | | | | | | | | | | | | | | | | | | | | | | | | | | | | | | | | | | | | | | | | | | |
Total revenue, net of interest expense | | | 14,846 | | | | | | 15,430 | | | | | | | | | 7,337 | | | | | | 7,509 | | | | | | 8,010 | | | | | | 7,746 | | | | | | 7,500 | | |
| | | | | | | | | | | | | | | | |
Provision for credit losses(3) | | | 16,182 | | | | | | 8,711 | | | | | | | | | 7,741 | | | | | | 8,441 | | | | | | 5,851 | | | | | | 5,602 | | | | | | 4,259 | | |
Noninterest expense | | | 4,053 | | | | | | 4,572 | | | | | | | | | 1,976 | | | | | | 2,077 | | | | | | 2,177 | | | | | | 2,404 | | | | | | 2,375 | | |
| | | | | | | | | | | | | | | | | | | | | | | | | | | | | | | | | | | | | | | | | | | | |
Income (loss) before income taxes | | | (5,389 | ) | | | | | 2,147 | | | | | | | | | (2,380 | ) | | | | | (3,009 | ) | | | | | (18 | ) | | | | | (260 | ) | | | | | 866 | | |
Income tax expense (benefit)(2) | | | (1,895 | ) | | | | | 746 | | | | | | | | | (762 | ) | | | | | (1,133 | ) | | | | | (61 | ) | | | | | (89 | ) | | | | | 284 | | |
| | | | | | | | | | | | | | | | | | | | | | | | | | | | | | | | | | | | | | | | | | | | |
Net income (loss) | | $ | (3,494 | ) | | | | $ | 1,401 | | | | | | | | $ | (1,618 | ) | | | | $ | (1,876 | ) | | | | $ | 43 | | | | | $ | (171 | ) | | | | $ | 582 | | |
| | | | | | | | | | | | | | | | | | | | | | | | | | | | | | | | | | | | | | | | | | | | |
| | | | | | | | | | | | | | | | |
Net interest yield(2) | | | 9.27 | | | % | | | 7.91 | | % | | | | | | | 9.20 | | | % | | | 9.34 | | | % | | | 9.03 | | | % | | | 8.15 | | | % | | | 7.97 | | % |
Return on average equity | | | n/m | | | | | | 7.28 | | | | | | | | | n/m | | | | | | n/m | | | | | | 0.42 | | | | | | n/m | | | | | | 6.01 | | |
Efficiency ratio(2) | | | 27.30 | | | | | | 29.63 | | | | | | | | | 26.93 | | | | | | 27.66 | | | | | | 27.19 | | | | | | 31.04 | | | | | | 31.67 | | |
| | | | | | | | | | | | | | | | |
| Balance sheet | | | | | | | | | | | | | | | | | | | | | | | | | | | | | | | | | | | | | | | | | | | | |
| | | | | | | | | | | | | | | | |
Average | | | | | | | | | | | | | | | | | | | | | | | | | | | | | | | | | | | | | | | | | | | | |
Total loans and leases | | $ | 224,391 | | | | | $ | 236,738 | | | | | | | | $ | 220,365 | | | | | $ | 228,461 | | | | | $ | 233,427 | | | | | $ | 239,951 | | | | | $ | 238,918 | | |
Total earning assets | | | 224,274 | | | | | | 237,145 | | | | | | | | | 220,133 | | | | | | 228,460 | | | | | | 233,513 | | | | | | 240,298 | | | | | | 239,413 | | |
Total assets | | | 241,285 | | | | | | 259,807 | | | | | | | | | 236,017 | | | | | | 246,611 | | | | | | 253,455 | | | | | | 261,798 | | | | | | 261,456 | | |
Allocated equity | | | 41,249 | | | | | | 38,716 | | | | | | | | | 42,118 | | | | | | 40,370 | | | | | | 40,295 | | | | | | 39,008 | | | | | | 38,978 | | |
| | | | | | | | | | | | | | | | |
Period end | | | | | | | | | | | | | | | | | | | | | | | | | | | | | | | | | | | | | | | | | | | | |
Total loans and leases | | $ | 215,904 | | | | | $ | 240,617 | | | | | | | | $ | 215,904 | | | | | $ | 221,984 | | | | | $ | 233,040 | | | | | $ | 235,998 | | | | | $ | 240,617 | | |
Total earning assets | | | 215,633 | | | | | | 240,994 | | | | | | | | | 215,633 | | | | | | 221,794 | | | | | | 233,094 | | | | | | 236,157 | | | | | | 240,994 | | |
Total assets | | | 231,986 | | | | | | 263,253 | | | | | | | | | 231,986 | | | | | | 238,410 | | | | | | 252,684 | | | | | | 256,885 | | | | | | 263,253 | | |
| (1) | Presented on a managed basis. (See Exhibit A: Non-GAAP Reconciliations - Global Card Services - Reconciliation on page 45). |
| (2) | Fully taxable-equivalent basis |
| (3) | Represents provision for credit losses on held loans combined with realized credit losses associated with the securitized loan portfolio. |
n/m = not meaningful
Certain prior period amounts have been reclassified among the segments to conform to the current period presentation.
Information for periods beginning July 1, 2008 includes the Countrywide acquisition. Information for periods beginning January 1, 2009 includes the
Merrill Lynch acquisition. Prior periods have not been restated.
| | |
| This information is preliminary and based on company data available at the time of the presentation. | | 18 |
Bank of America Corporation and Subsidiaries
Global Card Services Key Indicators
(Dollars in millions)
| | | | | | | | | | | | | | | | | | | | | | | | | | | | | | | | | | | | | | | | | |
| | | Six Months Ended
June 30 | | | | | | | | Second
Quarter | | | | | First
Quarter | | | | | Fourth
Quarter | | | | Third
Quarter | | | | Second
Quarter | | |
| | | 2009 | | | | 2008 | | | | | 2009 | | | | 2009 | | | | 2008 | | | 2008 | | | 2008 | | |
Credit Card Data(1) | | | | | | | | | | | | | | | | | | | | | | | | | | | | | | | | | | | | | | | | | |
| | | | | | | | | | | | | | | | |
Loans | | | | | | | | | | | | | | | | | | | | | | | | | | | | | | | | | | | | | | | | | |
Average | | | | | | | | | | | | | | | | | | | | | | | | | | | | | | | | | | | | | | | | | |
Held credit card outstandings | | $ | 73,167 | | | | $ | 78,370 | | | | | | | | $ | 70,546 | �� | | | | $ | 75,818 | | | | | $ | 82,117 | | | | $ | 80,489 | | | | $ | 78,221 | | |
Securitization impact | | | 102,357 | | | | | 106,306 | | | | | | | | | 102,046 | | | | | | 102,672 | | | | | | 99,116 | | | | | 105,919 | | | | | 107,438 | | |
| | | | | | | | | | | | | | | | | | | | | | | | | | | | | | | | | | | | | | | | | |
Managed credit card outstandings | | $ | 175,524 | | | | $ | 184,676 | | | | | | | | $ | 172,592 | | | | | $ | 178,490 | | | | | $ | 181,233 | | | | $ | 186,408 | | | | $ | 185,659 | | |
| | | | | | | | | | | | | | | | | | | | | | | | | | | | | | | | | | | | | | | | | |
Period end | | | | | | | | | | | | | | | | | | | | | | | | | | | | | | | | | | | | | | | | | |
Held credit card outstandings | | $ | 69,377 | | | | $ | 78,642 | | | | | | | | $ | 69,377 | | | | | $ | 67,960 | | | | | $ | 81,274 | | | | $ | 81,350 | | | | $ | 78,642 | | |
Securitization impact | | | 100,438 | | | | | 108,520 | | | | | | | | | 100,438 | | | | | | 105,392 | | | | | | 100,960 | | | | | 102,048 | | | | | 108,520 | | |
| | | | | | | | | | | | | | | | | | | | | | | | | | | | | | | | | | | | | | | | | |
Managed credit card outstandings | | $ | 169,815 | | | | $ | 187,162 | | | | | | | | $ | 169,815 | | | | | $ | 173,352 | | | | | $ | 182,234 | | | | $ | 183,398 | | | | $ | 187,162 | | |
| | | | | | | | | | | | | | | | | | | | | | | | | | | | | | | | | | | | | | | | | |
| | | | | | | | | | | | | | | | | | | | | | | | | | | | | | | | | | | | | | | | | |
Credit Quality | | | | | | | | | | | | | | | | | | | | | | | | | | | | | | | | | | | | | | | | | |
Charge-offs $ | | | | | | | | | | | | | | | | | | | | | | | | | | | | | | | | | | | | | | | | | |
Held net charge-offs | | $ | 3,676 | | | | $ | 2,064 | | | | | | | | $ | 2,064 | | | | | $ | 1,612 | | | | | $ | 1,406 | | | | $ | 1,242 | | | | $ | 1,108 | | |
Securitization impact | | | 5,165 | | | | | 3,059 | | | | | | | | | 2,983 | | | | | | 2,182 | | | | | | 1,857 | | | | | 1,754 | | | | | 1,643 | | |
| | | | | | | | | | | | | | | | | | | | | | | | | | | | | | | | | | | | | | | | | |
Managed credit card net losses | | $ | 8,841 | | | | $ | 5,123 | | | | | | | | $ | 5,047 | | | | | $ | 3,794 | | | | | $ | 3,263 | | | | $ | 2,996 | | | | $ | 2,751 | | |
| | | | | | | | | | | | | | | | | | | | | | | | | | | | | | | | | | | | | | | | | |
Charge-offs % | | | | | | | | | | | | | | | | | | | | | | | | | | | | | | | | | | | | | | | | | |
Held net charge-offs | | | 10.13 | | % | | | 5.29 | | % | | | | | | | 11.74 | | | % | | | 8.62 | | | % | | | 6.82 | | % | | | 6.14 | | % | | | 5.69 | | % |
Securitization impact | | | 0.03 | | | | | 0.29 | | | | | | | | | (0.01 | ) | | | | | — | | | | | | 0.34 | | | | | 0.26 | | | | | 0.27 | | |
| | | | | | | | | | | | | | | | | | | | | | | | | | | | | | | | | | | | | | | | | |
Managed credit card net losses | | | 10.16 | | % | | | 5.58 | | % | | | | | | | 11.73 | | | % | | | 8.62 | | | % | | | 7.16 | | % | | | 6.40 | | % | | | 5.96 | | % |
| | | | | | | | | | | | | | | | | | | | | | | | | | | | | | | | | | | | | | | | | |
30+ Delinquency $ | | | | | | | | | | | | | | | | | | | | | | | | | | | | | | | | | | | | | | | | | |
Held delinquency | | $ | 5,221 | | | | $ | 4,121 | | | | | | | | $ | 5,221 | | | | | $ | 5,365 | | | | | $ | 5,324 | | | | $ | 4,675 | | | | $ | 4,121 | | |
Securitization impact | | | 7,748 | | | | | 6,226 | | | | | | | | | 7,748 | | | | | | 8,246 | | | | | | 6,844 | | | | | 6,126 | | | | | 6,226 | | |
| | | | | | | | | | | | | | | | | | | | | | | | | | | | | | | | | | | | | | | | | |
Managed delinquency | | $ | 12,969 | | | | $ | 10,347 | | | | | | | | $ | 12,969 | | | | | $ | 13,611 | | | | | $ | 12,168 | | | | $ | 10,801 | | | | $ | 10,347 | | |
| | | | | | | | | | | | | | | | �� | | | | | | | | | | | | | | | | | | | | | | | | | |
30+ Delinquency % | | | | | | | | | | | | | | | | | | | | | | | | | | | | | | | | | | | | | | | | | |
Held delinquency | | | 7.53 | | % | | | 5.24 | | % | | | | | | | 7.53 | | | % | | | 7.90 | | | % | | | 6.55 | | % | | | 5.75 | | % | | | 5.24 | | % |
Securitization impact | | | 0.11 | | | | | 0.29 | | | | | | | | | 0.11 | | | | | | (0.05 | ) | | | | | 0.13 | | | | | 0.14 | | | | | 0.29 | | |
| | | | | | | | | | | | | | | | | | | | | | | | | | | | | | | | | | | | | | | | | |
Managed delinquency | | | 7.64 | | % | | | 5.53 | | % | | | | | | | 7.64 | | | % | | | 7.85 | | | % | | | 6.68 | | % | | | 5.89 | | % | | | 5.53 | | % |
| | | | | | | | | | | | | | | | | | | | | | | | | | | | | | | | | | | | | | | | | |
90+ Delinquency $ | | | | | | | | | | | | | | | | | | | | | | | | | | | | | | | | | | | | | | | | | |
Held delinquency | | $ | 2,894 | | | | $ | 2,109 | | | | | | | | $ | 2,894 | | | | | $ | 2,816 | | | | | $ | 2,565 | | | | $ | 2,330 | | | | $ | 2,109 | | |
Securitization impact | | | 4,263 | | | | | 3,169 | | | | | | | | | 4,263 | | | | | | 4,106 | | | | | | 3,185 | | | | | 2,958 | | | | | 3,169 | | |
| | | | | | | | | | | | | | | | | | | | | | | | | | | | | | | | | | | | | | | | | |
Managed delinquency | | $ | 7,157 | | | | $ | 5,278 | | | | | | | | $ | 7,157 | | | | | $ | 6,922 | | | | | $ | 5,750 | | | | $ | 5,288 | | | | $ | 5,278 | | |
| | | | | | | | | | | | | | | | | | | | | | | | | | | | | | | | | | | | | | | | | |
90+ Delinquency % | | | | | | | | | | | | | | | | | | | | | | | | | | | | | | | | | | | | | | | | | |
Held delinquency | | | 4.17 | | % | | | 2.68 | | % | | | | | | | 4.17 | | | % | | | 4.14 | | | % | | | 3.16 | | % | | | 2.87 | | % | | | 2.68 | | % |
Securitization impact | | | 0.04 | | | | | 0.14 | | | | | | | | | 0.04 | | | | | | (0.15 | ) | | | | | — | | | | | 0.01 | | | | | 0.14 | | |
| | | | | | | | | | | | | | | | | | | | | | | | | | | | | | | | | | | | | | | | | |
Managed delinquency | | | 4.21 | | % | | | 2.82 | | % | | | | | | | 4.21 | | | % | | | 3.99 | | | % | | | 3.16 | | % | | | 2.88 | | % | | | 2.82 | | % |
| | | | | | | | | | | | | | | | | | | | | | | | | | | | | | | | | | | | | | | | | |
| | | | | | | | | | | | | | | | |
Other Global Card Services Key Indicators | | | | | | | | | | | | | | | | | | | | | | | | | | | | | | | | | | | | | | | | | |
| | | | | | | | | | | | | | | | | | | | | | | | | | | | | | | | | | | | | | | | | |
Managed credit card data | | | | | | | | | | | | | | | | | | | | | | | | | | | | | | | | | | | | | | | | | |
Gross interest yield | | | 11.51 | | % | | | 11.68 | | % | | | | | | | 11.33 | | | % | | | 11.68 | | | % | | | 11.87 | | % | | | 11.52 | | % | | | 11.44 | | % |
Risk adjusted margin | | | 2.94 | | | | | 6.56 | | | | | | | | | 1.28 | | | | | | 4.56 | | | | | | 6.38 | | | | | 6.67 | | | | | 6.30 | | |
New account growth (in thousands) | | | 2,188 | | | | | 5,279 | | | | | | | | | 958 | | | | | | 1,230 | | | | | | 1,432 | | | | | 1,765 | | | | | 2,665 | | |
Purchase volumes | | $ | 100,000 | | | | $ | 124,278 | | | | | | | | $ | 51,944 | | | | | $ | 48,056 | | | | | $ | 56,585 | | | | $ | 62,662 | | | | $ | 64,457 | | |
| | | | | | | | | | | | | | | | |
Debit Card Data | | | | | | | | | | | | | | | | | | | | | | | | | | | | | | | | | | | | | | | | | |
Debit purchase volumes | | $ | 106,291 | | | | $ | 104,329 | | | | | | | | $ | 55,158 | | | | | $ | 51,133 | | | | | $ | 52,925 | | | | $ | 53,252 | | | | $ | 54,268 | | |
| (1) | Credit Card includes U.S, Europe and Canada consumer credit card. Does not include business card, debit card and consumer lending. |
Certain prior period amounts have been reclassified to conform to the current period presentation.
Information for periods beginning July 1, 2008 includes the Countrywide acquisition. Information for periods beginning January 1, 2009 includes the
Merrill Lynch acquisition. Prior periods have not been restated.
| | |
| This information is preliminary and based on company data available at the time of the presentation. | | 19 |
Bank of America Corporation and Subsidiaries
Home Loans & Insurance Segment Results
(Dollars in millions; except as noted)
| | | | | | | | | | | | | | | | | | | | | | | | | | | | | | | | | | | | | | | | | | | | | | |
| | | Six Months Ended
June 30 | | | | | | | | | Second
Quarter | | | | | First
Quarter | | | | | Fourth
Quarter | | | | | Third
Quarter | | | | | Second
Quarter | | | |
| | | 2009 | | | | | 2008 | | | | | | 2009 | | | | 2009 | | | | 2008 | | | | 2008 | | | | 2008 | | | |
Net interest income(1) | | $ | 2,376 | | | | | $ | 1,170 | | | | | | | | | $ | 1,197 | | | | | $ | 1,179 | | | | | $ | 1,006 | | | | | $ | 1,135 | | | | | $ | 620 | | | |
Noninterest income: | | | | | | | | | | | | | | | | | | | | | | | | | | | | | | | | | | | | | | | | | | | | | | |
Mortgage banking income | | | 6,040 | | | | | | 1,064 | | | | | | | | | | 2,637 | | | | | | 3,403 | | | | | | 1,603 | | | | | | 1,755 | | | | | | 409 | | | |
Insurance income | | | 1,134 | | | | | | 201 | | | | | | | | | | 553 | | | | | | 581 | | | | | | 646 | | | | | | 569 | | | | | | 113 | | | |
All other income | | | 134 | | | | | | 149 | | | | | | | | | | 74 | | | | | | 60 | | | | | | (2 | ) | | | | | 15 | | | | | | 119 | | | |
| | | | | | | | | | | | | | | | | | | | | | | | | | | | | | | | | | | | | | | | | | | | | | |
Total noninterest income | | | 7,308 | | | | | | 1,414 | | | | | | | | | | 3,264 | | | | | | 4,044 | | | | | | 2,247 | | | | | | 2,339 | | | | | | 641 | | | |
| | | | | | | | | | | | | | | | | | | | | | | | | | | | | | | | | | | | | | | | | | | | | | |
Total revenue, net of interest expense | | | 9,684 | | | | | | 2,584 | | | | | | | | | | 4,461 | | | | | | 5,223 | | | | | | 3,253 | | | | | | 3,474 | | | | | | 1,261 | | | |
| | | | | | | | | | | | | | | | |
Provision for credit losses | | | 6,098 | | | | | | 3,846 | | | | | | | | | | 2,726 | | | | | | 3,372 | | | | | | 1,623 | | | | | | 818 | | | | | | 2,034 | | | |
Noninterest expense | | | 5,479 | | | | | | 1,470 | | | | | | | | | | 2,829 | | | | | | 2,650 | | | | | | 2,752 | | | | | | 2,741 | | | | | | 732 | | | |
| | | | | | | | | | | | | | | | | | | | | | | | | | | | | | | | | | | | | | | | | | | | | | |
Loss before income taxes | | | (1,893 | ) | | | | | (2,732 | ) | | | | | | | | | (1,094 | ) | | | | | (799 | ) | | | | | (1,122 | ) | | | | | (85 | ) | | | | | (1,505 | ) | | |
Income tax benefit(1) | | | (670 | ) | | | | | (1,011 | ) | | | | | | | | | (369 | ) | | | | | (301 | ) | | | | | (438 | ) | | | | | (31 | ) | | | | | (557 | ) | | |
| | | | | | | | | | | | | | | | | | | | | | | | | | | | | | | | | | | | | | | | | | | | | | |
Net loss | | $ | (1,223 | ) | | | | $ | (1,721 | ) | | | | | | | | $ | (725 | ) | | | | $ | (498 | ) | | | | $ | (684 | ) | | | | $ | (54 | ) | | | | $ | (948 | ) | | |
| | | | | | | | | | | | | | | | | | | | | | | | | | | | | | | | | | | | | | | | | | | | | | |
Net interest yield(1) | | | 2.51 | | | % | | | 2.39 | | | % | | | | | | | 2.43 | | | % | | | 2.60 | | | % | | | 2.31 | | | % | | | 3.05 | | | % | | | 2.47 | | | % |
Efficiency ratio(1) | | | 56.58 | | | | | | 56.91 | | | | | | | | | | 63.41 | | | | | | 50.74 | | | | | | 84.59 | | | | | | 78.90 | | | | | | 58.02 | | | |
| | | | | | | | | | | | | | | | |
| Balance sheet | | | | | | | | | | | | | | | | | | | | | | | | | | | | | | | | | | | | | | | | | | | | | | |
| | | | | | | | | | | | | | | | |
| Average | | | | | | | | | | | | | | | | | | | | | | | | | | | | | | | | | | | | | | | | | | | | | | |
Total loans and leases | | $ | 129,110 | | | | | $ | 89,218 | | | | | | | | | $ | 131,509 | | | | | $ | 126,685 | | | | | $ | 122,065 | | | | | $ | 122,034 | | | | | $ | 91,199 | | | |
Total earning assets | | | 190,945 | | | | | | 98,327 | | | | | | | | | | 197,758 | | | | | | 184,056 | | | | | | 173,152 | | | | | | 148,209 | | | | | | 101,109 | | | |
Total assets | | | 226,161 | | | | | | 102,217 | | | | | | | | | | 232,194 | | | | | | 220,061 | | | | | | 204,826 | | | | | | 179,998 | | | | | | 104,539 | | | |
Allocated equity | | | 15,118 | | | | | | 3,106 | | | | | | | | | | 15,827 | | | | | | 14,403 | | | | | | 15,478 | | | | | | 16,236 | | | | | | 3,342 | | | |
| | | | | | | | | | | | | | | | |
| Period end | | | | | | | | | | | | | | | | | | | | | | | | | | | | | | | | | | | | | | | | | | | | | | |
Total loans and leases | | $ | 131,120 | | | | | $ | 92,064 | | | | | | | | | $ | 131,120 | | | | | $ | 131,332 | | | | | $ | 122,947 | | | | | $ | 122,975 | | | | | $ | 92,064 | | | |
Total earning assets | | | 197,528 | | | | | | 100,910 | | | | | | | | | | 197,528 | | | | | | 184,136 | | | | | | 175,609 | | | | | | 167,338 | | | | | | 100,910 | | | |
Total assets | | | 234,388 | | | | | | 103,765 | | | | | | | | | | 234,388 | | | | | | 221,547 | | | | | | 205,046 | | | | | | 178,956 | | | | | | 103,765 | | | |
| | | | | | | | | | | | | | | | |
Period end (in billions) | | | | | | | | | | | | | | | | | | | | | | | | | | | | | | | | | | | | | | | | | | | | | | |
Mortgage servicing portfolio(2) | | $ | 2,111.9 | | | | | $ | 540.8 | | | | | | | | | $ | 2,111.9 | | | | | $ | 2,112.8 | | | | | $ | 2,057.3 | | | | | $ | 2,026.2 | | | | | $ | 540.8 | | | |
| (1) | Fully taxable-equivalent basis |
| (2) | Servicing of residential mortgage loans, home equity lines of credit, home equity loans and discontinued real estate mortgage loans. |
Certain prior period amounts have been reclassified among the segments to conform to the current period presentation.
Information for periods beginning July 1, 2008 includes the Countrywide acquisition. Information for periods beginning January 1, 2009 includes the
Merrill Lynch acquisition. Prior periods have not been restated.
| | |
| This information is preliminary and based on company data available at the time of the presentation. | | 20 |
Bank of America Corporation and Subsidiaries
Home Loans & Insurance Key Indicators
(Dollars in millions, except as noted)
| | | | | | | | | | | | | | | | | | | | | | | | | | | | | | | | | | | | | | | | | | | | | | |
| | | Six Months Ended
June 30 | | | | | | | | | Second
Quarter | | | | | First
Quarter | | | | | Fourth
Quarter | | | | | Third
Quarter | | | | | Second
Quarter | | | |
| | | 2009 | | | | | 2008 | | | | | | 2009 | | | | 2009 | | | | 2008 | | | | 2008 | | | | 2008 | | | |
Mortgage servicing rights at fair value rollforward: | | | | | | | | | | | | | | | | | | | | | | | | | | | | | | | | | | | | | | | | | | | | | | |
Beginning balance | | $ | 12,733 | | | | | $ | 3,053 | | | | | | | | | $ | 14,096 | | | | | $ | 12,733 | | | | | $ | 20,811 | | | | | $ | 4,250 | | | | | $ | 3,163 | | | |
Countrywide balance, July 1, 2008 | | | — | | | | | | — | | | | | | | | | | — | | | | | | — | | | | | | — | | | | | | 17,188 | | | | | | — | | | |
Merrill Lynch balance, January 1, 2009 | | | 209 | | | | | | — | | | | | | | | | | — | | | | | | 209 | | | | | | — | | | | | | — | | | | | | — | | | |
Additions | | | 2,966 | | | | | | 1,035 | | | | | | | | | | 1,717 | | | | | | 1,249 | | | | | | 677 | | | | | | 875 | | | | | | 669 | | | |
Impact of customer payments | | | (1,988 | ) | | | | | (430 | ) | | | | | | | | | (803 | ) | | | | | (1,185 | ) | | | | | (1,458 | ) | | | | | (1,425 | ) | | | | | (233 | ) | | |
Other changes in MSR | | | 4,615 | | | | | | 592 | | | | | | | | | | 3,525 | | | | | | 1,090 | | | | | | (7,297 | ) | | | | | (77 | ) | | | | | 651 | | | |
| | | | | | | | | | | | | | | | | | | | | | | | | | | | | | | | | | | | | | | | | | | | | | |
Ending balance | | $ | 18,535 | | | | | $ | 4,250 | | | | | | | | | $ | 18,535 | | | | | $ | 14,096 | | | | | $ | 12,733 | | | | | $ | 20,811 | | | | | $ | 4,250 | | | |
| | | | | | | | | | | | | | | | | | | | | | | | | | | | | | | | | | | | | | | | | | | | | | |
Capitalized mortgage servicing rights | | | | | | | | | | | | | | | | | | | | | | | | | | | | | | | | | | | | | | | | | | | | | | |
(% of loans serviced) | | | 109 | | | bps | | | 145 | | | bps | | | | | | | 109 | | | bps | | | 83 | | | bps | | | 77 | | | bps | | | 126 | | | bps | | | 145 | | | bps |
Mortgage loans serviced for investors (in billions) | | $ | 1,703 | | | | | $ | 292 | | | | | | | | | $ | 1,703 | | | | | $ | 1,699 | | | | | $ | 1,654 | | | | | $ | 1,654 | | | | | $ | 292 | | | |
| | | | | | | | | | | | | | | | |
Loan production: | | | | | | | | | | | | | | | | | | | | | | | | | | | | | | | | | | | | | | | | | | | | | | |
Home Loans & Insurance | | | | | | | | | | | | | | | | | | | | | | | | | | | | | | | | | | | | | | | | | | | | | | |
First mortgage | | $ | 183,154 | | | | | $ | 36,559 | | | | | | | | | $ | 104,082 | | | | | $ | 79,072 | | | | | $ | 42,761 | | | | | $ | 49,625 | | | | | $ | 18,515 | | | |
Home equity | | | 5,843 | | | | | | 22,818 | | | | | | | | | | 2,920 | | | | | | 2,923 | | | | | | 3,920 | | | | | | 5,260 | | | | | | 8,997 | | | |
Total Corporation | | | | | | | | | | | | | | | | | | | | | | | | | | | | | | | | | | | | | | | | | | | | | | |
First mortgage | | | 195,863 | | | | | | 44,360 | | | | | | | | | $ | 110,645 | | | | | | 85,218 | | | | | | 44,611 | | | | | | 51,539 | | | | | | 22,438 | | | |
Home equity | | | 7,688 | | | | | | 28,141 | | | | | | | | | | 3,650 | | | | | | 4,038 | | | | | | 5,326 | | | | | | 7,023 | | | | | | 11,500 | | | |
| | | | | | | | | | | | | | | | |
Mortgage banking income | | | | | | | | | | | | | | | | | | | | | | | | | | | | | | | | | | | | | | | | | | | | | | |
Production income | | $ | 3,288 | | | | | $ | 679 | | | | | | | | | $ | 1,651 | | | | | $ | 1,637 | | | | | $ | 691 | | | | | $ | 749 | | | | | $ | 283 | | | |
Servicing income: | | | | | | | | | | | | | | | | | | | | | | | | | | | | | | | | | | | | | | | | | | | | | | |
Servicing fees and ancillary income | | | 3,032 | | | | | | 515 | | | | | | | | | | 1,515 | | | | | | 1,517 | | | | | | 1,487 | | | | | | 1,526 | | | | | | 266 | | | |
Impact of customer payments | | | (1,978 | ) | | | | | (430 | ) | | | | | | | | | (793 | ) | | | | | (1,185 | ) | | | | | (1,458 | ) | | | | | (1,425 | ) | | | | | (233 | ) | | |
Fair value changes of MSRs, net of economic hedge results | | | 1,439 | | | | | | 300 | | | | | | | | | | 138 | | | | | | 1,301 | | | | | | 783 | | | | | | 823 | | | | | | 93 | | | |
Other servicing-related revenue | | | 259 | | | | | | — | | | | | | | | | | 126 | | | | | | 133 | | | | | | 100 | | | | | | 82 | | | | | | — | | | |
| | | | | | | | | | | | | | | | | | | | | | | | | | | | | | | | | | | | | | | | | | | | | | |
Total net servicing income | | | 2,752 | | | | | | 385 | | | | | | | | | | 986 | | | | | | 1,766 | | | | | | 912 | | | | | | 1,006 | | | | | | 126 | | | |
| | | | | | | | | | | | | | | | | | | | | | | | | | | | | | | | | | | | | | | | | | | | | | |
Total Home Loans & Insurance mortgage banking income | | | 6,040 | | | | | | 1,064 | | | | | | | | | | 2,637 | | | | | | 3,403 | | | | | | 1,603 | | | | | | 1,755 | | | | | | 409 | | | |
Other business segment mortgage banking income (loss) | | | (199 | ) | | | | | (174 | ) | | | | | | | | | (110 | ) | | | | | (89 | ) | | | | | (80 | ) | | | | | (81 | ) | | | | | 30 | | | |
| | | | | | | | | | | | | | | | | | | | | | | | | | | | | | | | | | | | | | | | | | | | | | |
Total consolidated mortgage banking income | | $ | 5,841 | | | | | $ | 890 | | | | | | | | | $ | 2,527 | | | | | $ | 3,314 | | | | | $ | 1,523 | | | | | $ | 1,674 | | | | | $ | 439 | | | |
| | | | | | | | | | | | | | | | | | | | | | | | | | | | | | | | | | | | | | | | | | | | | | |
Certain prior period amounts have been reclassified among the segments to conform to the current period presentation.
Information for periods beginning July 1, 2008 includes the Countrywide acquisition. Information for periods beginning January 1, 2009 includes the
Merrill Lynch acquisition. Prior periods have not been restated.
| | |
| This information is preliminary and based on company data available at the time of the presentation. | | 21 |
Bank of America Corporation and Subsidiaries
Global Banking Segment Results
(Dollars in millions)
| | | | | | | | | | | | | | | | | | | | | | | | | | | | | | | | | | | | | | | | | | | | | | |
| | | Six Months Ended
June 30 | | | | | | | | | Second
Quarter | | | | | First
Quarter | | | | | Fourth
Quarter | | | | | Third
Quarter | | | | | Second
Quarter | | | |
| | | 2009 | | | | | 2008 | | | | | | | | 2009 | | | | 2009 | | | | 2008 | | | | 2008 | | | | 2008 | | |
Net interest income(1) | | $ | 5,553 | | | | | $ | 4,863 | | | | | | | | | $ | 2,738 | | | | | $ | 2,815 | | | | | $ | 3,100 | | | | | $ | 2,734 | | | | | $ | 2,517 | | | |
Noninterest income: | | | | | | | | | | | | | | | | | | | | | | | | | | | | | | | | | | | | | | | | | | | | | | |
Service charges | | | 1,851 | | | | | | 1,580 | | | | | | | | | | 909 | | | | | | 942 | | | | | | 809 | | | | | | 820 | | | | | | 824 | | | |
Investment banking income | | | 1,436 | | | | | | 740 | | | | | | | | | | 792 | | | | | | 644 | | | | | | 422 | | | | | | 252 | | | | | | 385 | | | |
All other income (loss) | | | 4,458 | | | | | | 1,171 | | | | | | | | | | 4,219 | | | | | | 239 | | | | | | (328 | ) | | | | | 428 | | | | | | 729 | | | |
| | | | | | | | | | | | | | | | | | | | | | | | | | | | | | | | | | | | | | | | | | | | | | |
Total noninterest income | | | 7,745 | | | | | | 3,491 | | | | | | | | | | 5,920 | | | | | | 1,825 | | | | | | 903 | | | | | | 1,500 | | | | | | 1,938 | | | |
| | | | | | | | | | | | | | | | | | | | | | | | | | | | | | | | | | | | | | | | | | | | | | |
Total revenue, net of interest expense | | | 13,298 | | | | | | 8,354 | | | | | | | | | | 8,658 | | | | | | 4,640 | | | | | | 4,003 | | | | | | 4,234 | | | | | | 4,455 | | | |
| | | | | | | | | | | | | | | | |
Provision for credit losses | | | 4,432 | | | | | | 926 | | | | | | | | | | 2,584 | | | | | | 1,848 | | | | | | 1,402 | | | | | | 802 | | | | | | 400 | | | |
Noninterest expense | | | 4,747 | | | | | | 3,494 | | | | | | | | | | 2,232 | | | | | | 2,515 | | | | | | 1,113 | | | | | | 1,767 | | | | | | 1,747 | | | |
| | | | | | | | | | | | | | | | | | | | | | | | | | | | | | | | | | | | | | | | | | | | | | |
Income before income taxes | | | 4,119 | | | | | | 3,934 | | | | | | | | | | 3,842 | | | | | | 277 | | | | | | 1,488 | | | | | | 1,665 | | | | | | 2,308 | | | |
Income tax expense(1) | | | 1,460 | | | | | | 1,478 | | | | | | | | | | 1,355 | | | | | | 105 | | | | | | 378 | | | | | | 621 | | | | | | 875 | | | |
| | | | | | | | | | | | | | | | | | | | | | | | | | | | | | | | | | | | | | | | | | | | | | |
Net income | | $ | 2,659 | | | | | $ | 2,456 | | | | | | | | | $ | 2,487 | | | | | $ | 172 | | | | | $ | 1,110 | | | | | $ | 1,044 | | | | | $ | 1,433 | | | |
| | | | | | | | | | | | | | | | | | | | | | | | | | | | | | | | | | | | | | | | | | | | | | |
Net interest yield(1) | | | 3.32 | | | % | | | 3.09 | | | % | | | | | | | 3.30 | | | % | | | 3.35 | | | % | | | 3.61 | | | % | | | 3.32 | | | % | | | 3.15 | | | % |
Return on average equity | | | 9.17 | | | | | | 10.27 | | | | | | | | | | 16.50 | | | | | | 1.23 | | | | | | 8.34 | | | | | | 8.36 | | | | | | 11.85 | | | |
Efficiency ratio(1) | | | 35.70 | | | | | | 41.82 | | | | | | | | | | 25.78 | | | | | | 54.21 | | | | | | 27.83 | | | | | | 41.73 | | | | | | 39.24 | | | |
| | | | | | | | | | | | | | | | |
Balance sheet | | | | | | | | | | | | | | | | | | | | | | | | | | | | | | | | | | | | | | | | | | | | | | |
| | | | | | | | | | | | | | | | |
Average | | | | | | | | | | | | | | | | | | | | | | | | | | | | | | | | | | | | | | | | | | | | | | |
Total loans and leases | | $ | 327,074 | | | | | $ | 310,603 | | | | | | | | | $ | 323,217 | | | | | $ | 330,974 | | | | | $ | 331,115 | | | | | $ | 320,813 | | | | | $ | 315,282 | | | |
Total earning assets | | | 336,832 | | | | | | 316,941 | | | | | | | | | | 332,589 | | | | | | 341,122 | | | | | | 341,453 | | | | | | 327,517 | | | | | | 321,385 | | | |
Total assets | | | 393,483 | | | | | | 372,994 | | | | | | | | | | 389,387 | | | | | | 397,625 | | | | | | 396,406 | | | | | | 383,913 | | | | | | 378,233 | | | |
Total deposits | | | 197,981 | | | | | | 165,232 | | | | | | | | | | 199,879 | | | | | | 196,061 | | | | | | 198,246 | | | | | | 176,570 | | | | | | 169,738 | | | |
Allocated equity | | | 58,490 | | | | | | 48,099 | | | | | | | | | | 60,455 | | | | | | 56,503 | | | | | | 52,941 | | | | | | 49,644 | | | | | | 48,634 | | | |
| | | | | | | | | | | | | | | | |
Period end | | | | | | | | | | | | | | | | | | | | | | | | | | | | | | | | | | | | | | | | | | | | | | |
Total loans and leases | | $ | 314,512 | | | | | $ | 322,675 | | | | | | | | | $ | 314,512 | | | | | $ | 323,407 | | | | | $ | 328,574 | | | | | $ | 326,970 | | | | | $ | 322,675 | | | |
Total earning assets | | | 323,743 | | | | | | 329,265 | | | | | | | | | | 323,743 | | | | | | 333,226 | | | | | | 338,913 | | | | | | 338,405 | | | | | | 329,265 | | | |
Total assets | | | 381,123 | | | | | | 386,525 | | | | | | | | | | 381,123 | | | | | | 387,410 | | | | | | 393,430 | | | | | | 396,448 | | | | | | 386,525 | | | |
Total deposits | | | 201,207 | | | | | | 173,576 | | | | | | | | | | 201,207 | | | | | | 194,864 | | | | | | 214,755 | | | | | | 194,462 | | | | | | 173,576 | | | |
| | | | | | | | | | | | | | | | | | |
(1) Fully taxable-equivalent basis |
|
Components of Investment Banking Income |
| (Dollars in millions) | | | | | | | | | | | | | | | | | | | | | | | | |
| | | Six Months Ended
June 30 | | | | | | | | | Second
Quarter | | | | | First
Quarter | | | | | Fourth
Quarter | | | | | Third
Quarter | | | | | Second
Quarter | | | |
| | | 2009 | | | | | 2008 | | | | | | | | | 2009 | | | | | 2009 | | | | | 2008 | | | | | 2008 | | | | | 2008 | | | |
Investment banking income | | | | | | | | | | | | | | | | | | | | | | | | | | | | | | | | | | | | | | | | | | | | | | |
Advisory(1) | | $ | 621 | | | | | $ | 253 | | | | | | | | | $ | 292 | | | | | $ | 329 | | | | | $ | 184 | | | | | $ | 109 | | | | | $ | 160 | | | |
Debt issuance | | | 1,599 | | | | | | 828 | | | | | | | | | | 944 | | | | | | 655 | | | | | | 379 | | | | | | 332 | | | | | | 496 | | | |
Equity issuance | | | 665 | | | | | | 350 | | | | | | | | | | 508 | | | | | | 157 | | | | | | 224 | | | | | | 50 | | | | | | 110 | | | |
| | | | | | | | | | | | | | | | | | | | | | | | | | | | | | | | | | | | | | | | | | | | | | |
Total Global Markets and Investment Banking | | | 2,885 | | | | | | 1,431 | | | | | | | | | | 1,744 | | | | | | 1,141 | | | | | | 787 | | | | | | 491 | | | | | | 766 | | | |
Other(2) | | | (184 | ) | | | | | (260 | ) | | | | | | | | | (98 | ) | | | | | (86 | ) | | | | | (169 | ) | | | | | (17 | ) | | | | | (71 | ) | | |
| | | | | | | | | | | | | | | | | | | | | | | | | | | | | | | | | | | | | | | | | | | | | | |
Total investment banking income | | $ | 2,701 | | | | | $ | 1,171 | | | | | | | | | $ | 1,646 | | | | | $ | 1,055 | | | | | $ | 618 | | | | | $ | 474 | | | | | $ | 695 | | | |
| | | | | | | | | | | | | | | | | | | | | | | | | | | | | | | | | | | | | | | | | | | | | | |
| (1) | Advisory includes fees on debt and equity advisory and merger and acquisitions. |
| (2) | Represents the offset to fees paid on the Corporation’s own issuances. |
Certain prior period amounts have been reclassified among the segments to conform to the current period presentation.
Information for periods beginning July 1, 2008 includes the Countrywide acquisition. Information for periods beginning January 1, 2009 includes the
Merrill Lynch acquisition. Prior periods have not been restated.
| | |
| This information is preliminary and based on company data available at the time of the presentation. | | 22 |
Bank of America Corporation and Subsidiaries
Global Banking Key Indicators
(Dollars in millions)
| | | | | | | | | | | | | | | | | | | | | | | | | | | | | | | | | | | | | | | | | | |
| | | Six Months Ended
June 30 | | | | | Second
Quarter
2009 | | | | | First
Quarter
2009 | | | | | Fourth
Quarter
2008 | | | | | Third
Quarter
2008 | | | | | Second
Quarter
2008 | | | |
| | | 2009 | | | | | 2008 | | | | | | | | | | | | | | | | | | |
Global Banking revenue, net of interest expense | | | | | | | | | | | | | | | | | | | | | | | | | | | | | | | | | | | | | | | | | | |
Global commercial banking | | $ | 9,480 | | | | | $ | 5,637 | | | | | $ | 6,692 | | | | | $ | 2,788 | | | | | $ | 2,861 | | | | | $ | 2,865 | | | | | $ | 2,923 | | | |
Global corporate and investment banking | | | 3,818 | | | | | | 2,717 | | | | | | 1,966 | | | | | | 1,852 | | | | | | 1,142 | | | | | | 1,369 | | | | | | 1,532 | | | |
| | | | | | | | | | | | | | | | | | | | | | | | | | | | | | | | | | | | | | | | | | |
Total revenue, net of interest expense(1) | | $ | 13,298 | | | | | $ | 8,354 | | | | | $ | 8,658 | | | | | $ | 4,640 | | | | | $ | 4,003 | | | | | $ | 4,234 | | | | | $ | 4,455 | | | |
| | | | | | | | | | | | | | | | | | | | | | | | | | | | | | | | | | | | | | | | | | |
Global Banking revenue, net of interest expense - by service segment | | | | | | | | | | | | | | | | | | | | | | | | | | | | | | | | | | | | | | | | | | |
Business lending | | $ | 4,748 | | | | | $ | 3,769 | | | | | $ | 2,317 | | | | | $ | 2,431 | | | | | $ | 2,191 | | | | | $ | 2,020 | | | | | $ | 2,155 | | | |
Treasury services | | | 7,278 | | | | | | 4,258 | | | | | | 5,505 | | | | | | 1,773 | | | | | | 2,152 | | | | | | 2,105 | | | | | | 2,018 | | | |
Investment banking related(2) | | | 1,272 | | | | | | 327 | | | | | | 836 | | | | | | 436 | | | | | | (340 | ) | | | | | 109 | | | | | | 282 | | | |
| | | | | | | | | | | | | | | | | | | | | | | | | | | | | | | | | | | | | | | | | | |
Total revenue, net of interest expense(1) | | $ | 13,298 | | | | | $ | 8,354 | | | | | $ | 8,658 | | | | | $ | 4,640 | | | | | $ | 4,003 | | | | | $ | 4,234 | | | | | $ | 4,455 | | | |
| | | | | | | | | | | | | | | | | | | | | | | | | | | | | | | | | | | | | | | | | | |
Global Banking average deposit balances | | | | | | | | | | | | | | | | | | | | | | | | | | | | | | | | | | | | | | | | | | |
Global commercial banking | | $ | 123,514 | | | | | $ | 104,041 | | | | | $ | 127,133 | | | | | $ | 119,853 | | | | | $ | 118,415 | | | | | $ | 107,142 | | | | | $ | 107,944 | | | |
Global corporate and investment banking | | | 74,467 | | | | | | 61,191 | | | | | | 72,746 | | | | | | 76,208 | | | | | | 79,831 | | | | | | 69,428 | | | | | | 61,794 | | | |
| | | | | | | | | | | | | | | | | | | | | | | | | | | | | | | | | | | | | | | | | | |
Total | | $ | 197,981 | | | | | $ | 165,232 | | | | | $ | 199,879 | | | | | $ | 196,061 | | | | | $ | 198,246 | | | | | $ | 176,570 | | | | | $ | 169,738 | | | |
| | | | | | | | | | | | | | | | | | | | | | | | | | | | | | | | | | | | | | | | | | |
Interest-bearing | | $ | 82,773 | | | | | $ | 86,456 | | | | | $ | 79,060 | | | | | $ | 86,527 | | | | | $ | 100,259 | | | | | $ | 89,217 | | | | | $ | 88,130 | | | |
Noninterest-bearing | | | 115,208 | | | | | | 78,776 | | | | | | 120,819 | | | | | | 109,534 | | | | | | 97,987 | | | | | | 87,353 | | | | | | 81,608 | | | |
| | | | | | | | | | | | | | | | | | | | | | | | | | | | | | | | | | | | | | | | | | |
Total | | $ | 197,981 | | | | | $ | 165,232 | | | | | $ | 199,879 | | | | | $ | 196,061 | | | | | $ | 198,246 | | | | | $ | 176,570 | | | | | $ | 169,738 | | | |
| | | | | | | | | | | | | | | | | | | | | | | | | | | | | | | | | | | | | | | | | | |
Global Banking loan spreads | | | | | | | | | | | | | | | | | | | | | | | | | | | | | | | | | | | | | | | | | | |
Global commercial banking | | | 1.90 | | | % | | | 1.75 | | | % | | | 1.96 | | | % | | | 1.83 | | | % | | | 1.85 | | | % | | | 1.74 | | | % | | | 1.71 | | | % |
Global corporate and investment banking | | | 1.54 | | | | | | 0.65 | | | | | | 1.56 | | | | | | 1.54 | | | | | | 1.17 | | | | | | 0.72 | | | | | | 0.64 | | | |
Provision for credit losses | | | | | | | | | | | | | | | | | | | | | | | | | | | | | | | | | | | | | | | | | | |
Global commercial banking | | $ | 3,549 | | | | | $ | 941 | | | | | $ | 1,992 | | | | | $ | 1,557 | | | | | $ | 1,037 | | | | | $ | 671 | | | | | $ | 449 | | | |
Global corporate and investment banking | | | 883 | | | | | | (15 | ) | | | | | 592 | | | | | | 291 | | | | | | 365 | | | | | | 131 | | | | | | (49 | ) | | |
| | | | | | | | | | | | | | | | | | | | | | | | | | | | | | | | | | | | | | | | | | |
Total provision for credit losses | | $ | 4,432 | | | | | $ | 926 | | | | | $ | 2,584 | | | | | $ | 1,848 | | | | | $ | 1,402 | | | | | $ | 802 | | | | | $ | 400 | | | |
| | | | | | | | | | | | | | | | | | | | | | | | | | | | | | | | | | | | | | | | | | |
Credit quality(3, 4) | | | | | | | | | | | | | | | | | | | | | | | | | | | | | | | | | | | | | | | | | | |
Reservable utilized criticized exposure | | | | | | | | | | | | | | | | | | | | | | | | | | | | | | | | | | | | | | | | | | |
Global commercial banking | | $ | 38,648 | | | | | $ | 19,907 | | | | | $ | 38,648 | | | | | $ | 33,465 | | | | | $ | 27,225 | | | | | $ | 23,020 | | | | | $ | 19,907 | | | |
| | | 16.88 | | | % | | | 8.76 | | | % | | | 16.88 | | | % | | | 14.36 | | | % | | | 11.63 | | | % | | | 9.93 | | | % | | | 8.76 | | | % |
Global corporate and investment banking | | $ | 12,034 | | | | | $ | 4,426 | | | | | $ | 12,034 | | | | | $ | 9,995 | | | | | $ | 7,292 | | | | | $ | 5,782 | | | | | $ | 4,426 | | | |
| | | 10.59 | | | % | | | 3.69 | | | % | | | 10.59 | | | % | | | 8.45 | | | % | | | 5.91 | | | % | | | 4.63 | | | % | | | 3.69 | | | % |
| | | | | | | | | | | | | | | | | | | | | | | | | | | | | | | | | | | | | | | | | | |
Total reservable utilized criticized exposure | | $ | 50,682 | | | | | $ | 24,333 | | | | | $ | 50,682 | | | | | $ | 43,460 | | | | | $ | 34,517 | | | | | $ | 28,802 | | | | | $ | 24,333 | | | |
| | | 14.79 | | | % | | | 7.01 | | | % | | | 14.79 | | | % | | | 12.37 | | | % | | | 9.66 | | | % | | | 8.07 | | | % | | | 7.01 | | | % |
Nonperforming assets | | | | | | | | | | | | | | | | | | | | | | | | | | | | | | | | | | | | | | | | | | |
Global commercial banking | | $ | 9,357 | | | | | $ | 3,639 | | | | | $ | 9,357 | | | | | $ | 8,077 | | | | | $ | 5,643 | | | | | $ | 4,335 | | | | | $ | 3,639 | | | |
| | | 4.24 | | | % | | | 1.61 | | | % | | | 4.24 | | | % | | | 3.60 | | | % | | | 2.50 | | | % | | | 1.93 | | | % | | | 1.61 | | | % |
Global corporate and investment banking | | $ | 1,346 | | | | | $ | 191 | | | | | $ | 1,346 | | | | | $ | 879 | | | | | $ | 736 | | | | | $ | 444 | | | | | $ | 191 | | | |
| | | 1.43 | | | % | | | 0.20 | | | % | | | 1.43 | | | % | | | 0.88 | | | % | | | 0.71 | | | % | | | 0.43 | | | % | | | 0.20 | | | % |
| | | | | | | | | | | | | | | | | | | | | | | | | | | | | | | | | | | | | | | | | | |
Total nonperforming assets | | $ | 10,703 | | | | | $ | 3,830 | | | | | $ | 10,703 | | | | | $ | 8,956 | | | | | $ | 6,379 | | | | | $ | 4,779 | | | | | $ | 3,830 | | | |
| | | 3.40 | | | % | | | 1.19 | | | % | | | 3.40 | | | % | | | 2.77 | | | % | | | 1.94 | | | % | | | 1.46 | | | % | | | 1.19 | | | % |
Average loans and leases by product | | | | | | | | | | | | | | | | | | | | | | | | | | | | | | | | | | | | | | | | | | |
Commercial - domestic | | $ | 169,583 | | | | | $ | 158,511 | | | | | $ | 164,673 | | | | | $ | 174,548 | | | | | $ | 175,260 | | | | | $ | 163,886 | | | | | $ | 161,013 | | | |
Commercial real estate | | | 63,576 | | | | | | 59,601 | | | | | | 64,609 | | | | | | 62,532 | | | | | | 61,395 | | | | | | 60,196 | | | | | | 59,909 | | | |
Commercial lease financing | | | 24,262 | | | | | | 24,276 | | | | | | 24,208 | | | | | | 24,316 | | | | | | 24,324 | | | | | | 24,574 | | | | | | 24,287 | | | |
Commercial - foreign | | | 26,946 | | | | | | 26,799 | | | | | | 27,051 | | | | | | 26,840 | | | | | | 28,546 | | | | | | 28,429 | | | | | | 27,895 | | | |
Direct/Indirect consumer | | | 41,217 | | | | | | 39,554 | | | | | | 41,233 | | | | | | 41,201 | | | | | | 40,144 | | | | | | 42,205 | | | | | | 40,344 | | | |
Other | | | 1,490 | | | | | | 1,864 | | | | | | 1,443 | | | | | | 1,537 | | | | | | 1,446 | | | | | | 1,523 | | | | | | 1,834 | | | |
| | | | | | | | | | | | | | | | | | | | | | | | | | | | | | | | | | | | | | | | | | |
Total average loans and leases | | $ | 327,074 | | | | | $ | 310,603 | | | | | $ | 323,217 | | | | | $ | 330,974 | | | | | $ | 331,115 | | | | | $ | 320,813 | | | | | $ | 315,282 | | | |
| | | | | | | | | | | | | | | | | | | | | | | | | | | | | | | | | | | | | | | | | | |
| | | | | | | | | | | | | | | | | | | | | | | | | | | | | | | | | | | | | | | | | | | |
| | | | | | | | | | | | | | | | | | | | | | | | | | | | | | | | | | | | | | | | | | |
(1) Total Global Banking revenue, net of interest expense | | $ | 13,298 | | | | | $ | 8,354 | | | | | $ | 8,658 | | | | | $ | 4,640 | | | | | $ | 4,003 | | | | | $ | 4,234 | | | | | $ | 4,455 | | | |
Less: Fair value option revenue share | | | 104 | | | | | | 5 | | | | | | 242 | | | | | | (138 | ) | | | | | (291 | ) | | | | | (13 | ) | | | | | 61 | | | |
Less: Impact of credit mitigation | | | (121 | ) | | | | | 64 | | | | | | (121 | ) | | | | | — | | | | | | 221 | | | | | | 24 | | | | | | (5 | ) | | |
| | | | | | | | | | | | | | | | | | | | | | | | | | | | | | | | | | | | | | | | | | |
Global banking revenues, net of interest expense excluding fair value option revenue share and credit mitigation | | $ | 13,315 | | | | | $ | 8,285 | | | | | $ | 8,537 | | | | | $ | 4,778 | | | | | $ | 4,073 | | | | | $ | 4,223 | | | | | $ | 4,399 | | | |
| | | | | | | | | | | | | | | | | | | | | | | | | | | | | | | | | | | | | | | | | | |
| (2) | Includes revenue and loss sharing with Global Markets for certain activities and positions. |
| (3) | Criticized exposure corresponds to the Special Mention, Substandard and Doubtful asset categories defined by regulatory authorities. The reservable criticized exposure is on an end-of-period basis and is also shown as a percentage of total reservable commercial utilized credit exposure, including loans and leases, standby letters of credit, financial guarantees, commercial letters of credit and bankers’ acceptances. |
| (4) | Nonperforming assets are on an end-of-period basis and defined as nonperforming loans and leases plus foreclosed properties. The nonperforming ratio is nonperforming assets divided by commercial loans and leases plus commercial foreclosed properties. |
Certain prior period amounts have been reclassified among the segments to conform to the current period presentation.
Information for periods beginning July 1, 2008 include the Countrywide acquisition. Information for periods beginning January 1, 2009 includes the
Merrill Lynch acquisition. Prior periods have not been restated.
| | |
| This information is preliminary and based on company data available at the time of the presentation. | | 23 |
Bank of America Corporation and Subsidiaries
Investment Banking Product Rankings
| | | | | | | | | | | | |
| | | Six months ended June 30, 2009 | | |
| | | Global | | | | U.S. | | |
| | | Product
Ranking | | Market
Share | | | | Product
Ranking | | Market
Share | | |
High-yield corporate debt | | 1 | | 16 | | % | | 1 | | 20 | | % |
Leveraged loans | | 1 | | 14 | | | | 1 | | 19 | | |
Mortgage-backed securities | | 1 | | 20 | | | | 1 | | 23 | | |
Asset-backed securities | | 2 | | 11 | | | | 3 | | 13 | | |
Convertible debt | | 5 | | 8 | | | | 3 | | 14 | | |
Common stock underwriting | | 5 | | 6 | | | | 4 | | 12 | | |
Investment grade corporate debt | | 4 | | 6 | | | | 3 | | 14 | | |
Syndicated loans | | 5 | | 6 | | | | 2 | | 20 | | |
Net investment banking revenue | | 3 | | 7 | | | | 2 | | 12 | | |
Announced mergers and acquisitions | | 5 | | 18 | | | | 5 | | 37 | | |
Equity capital markets | | 4 | | 7 | | | | 4 | | 12 | | |
Debt capital markets | | 3 | | 6 | | | | 2 | | 14 | | |
Source: Dealogic data. Rankings based on deal volumes except for investment banking revenue rankings which reflect fees. Mergers and acquisition fees included in investment banking revenues reflect 10 percent fee credit at announcement and 90 percent fee credit at completion as per Dealogic . Mergers and acquisitions volume rankings are for announced transactions and provide credit only to the investment bank advising the parent company that is domiciled within that region. Each advisor receives full credit for the deal amount unless advising a minority stakeholder.
Highlights
Global top 3 rankings in:
| | | | |
| High-yield corporate debt | | Asset-backed securities | | |
| Leveraged loans | | Debt capital markets | | |
| Mortgage-backed securities | | | | |
U.S. top 3 rankings in:
| | | | |
| High-yield corporate debt | | Convertible debt | | |
| Leveraged loans | | Investment grade corporate debt | | |
Mortgage-backed securities | | Syndicated loans | | |
Asset-backed securities | | Debt capital markets | | |
Figures above include self-led transactions. Excluding self-led deals, global and U.S. asset-backed securities rankings were #1, U.S. investment grade corporate debt ranking was #2, global net investment banking revenue ranking was #2, and U.S. announced mergers and acquisitions ranking was #4, according to Dealogic data.
Information for periods beginning January 1, 2009 includes the Merrill Lynch acquisition.
| | |
| This information is preliminary and based on company data available at the time of the presentation. | | 24 |
Bank of America Corporation and Subsidiaries
Global Markets Segment Results
(Dollars in millions)
| | | | | | | | | | | | | | | | | | | | | | | | | | | | | | | | | | | | | | | | | | |
| | | Six Months Ended
June 30 | | | | | Second
Quarter
2009 | | | | | First
Quarter
2009 | | | | | Fourth
Quarter
2008 | | | | | Third
Quarter
2008 | | | | | Second
Quarter
2008 | | | |
| | | 2009 | | | | | 2008 | | | | | | | | | | | | | | | | | | |
Net interest income(1) | | $ | 3,396 | | | | | $ | 2,332 | | | | | $ | 1,507 | | | | | $ | 1,889 | | | | | $ | 1,528 | | | | | $ | 1,285 | | | | | $ | 1,197 | | | |
Noninterest income: | | | | | | | | | | | | | | | | | | | | | | | | | | | | | | | | | | | | | | | | | | |
Investment and brokerage services | | | 1,415 | | | | | | 406 | | | | | | 831 | | | | | | 584 | | | | | | 150 | | | | | | 195 | | | | | | 186 | | | |
Investment banking income | | | 1,306 | | | | | | 690 | | | | | | 821 | | | | | | 485 | | | | | | 365 | | | | | | 240 | | | | | | 380 | | | |
Trading account profits (losses) | | | 6,935 | | | | | | (1,419 | ) | | | | | 2,014 | | | | | | 4,921 | | | | | | (3,891 | ) | | | | | (499 | ) | | | | | 183 | | | |
All other income (loss) | | | (1,701 | ) | | | | | (1,472 | ) | | | | | (721 | ) | | | | | (980 | ) | | | | | (2,717 | ) | | | | | (1,072 | ) | | | | | (568 | ) | | |
| | | | | | | | | | | | | | | | | | | | | | | | | | | | | | | | | | | | | | | | | | |
Total noninterest income (loss) | | | 7,955 | | | | | | (1,795 | ) | | | | | 2,945 | | | | | | 5,010 | | | | | | (6,093 | ) | | | | | (1,136 | ) | | | | | 181 | | | |
| | | | | | | | | | | | | | | | | | | | | | | | | | | | | | | | | | | | | | | | | | |
Total revenue, net of interest expense | | | 11,351 | | | | | | 537 | | | | | | 4,452 | | | | | | 6,899 | | | | | | (4,565 | ) | | | | | 149 | | | | | | 1,378 | | | |
Provision for credit losses | | | 50 | | | | | | (39 | ) | | | | | (1 | ) | | | | | 51 | | | | | | 13 | | | | | | (24 | ) | | | | | (38 | ) | | |
Noninterest expense | | | 5,615 | | | | | | 1,680 | | | | | | 2,559 | | | | | | 3,056 | | | | | | 1,105 | | | | | | 1,120 | | | | | | 951 | | | |
| | | | | | | | | | | | | | | | | | | | | | | | | | | | | | | | | | | | | | | | | | |
Income (loss) before income taxes | | | 5,686 | | | | | | (1,104 | ) | | | | | 1,894 | | | | | | 3,792 | | | | | | (5,683 | ) | | | | | (947 | ) | | | | | 465 | | | |
Income tax expense (benefit)(1) | | | �� 1,874 | | | | | | (413 | ) | | | | | 517 | | | | | | 1,357 | | | | | | (2,043 | ) | | | | | (352 | ) | | | | | 167 | | | |
| | | | | | | | | | | | | | | | | | | | | | | | | | | | | | | | | | | | | | | | | | |
Net income (loss) | | $ | 3,812 | | | | | $ | (691 | ) | | | | $ | 1,377 | | | | | $ | 2,435 | | | | | $ | (3,640 | ) | | | | $ | (595 | ) | | | | $ | 298 | | | |
| | | | | | | | | | | | | | | | | | | | | | | | | | | | | | | | | | | | | | | | | | |
Return on average equity | | | 26.38 | | | % | | | n/m | | | | | | 17.81 | | | % | | | 36.26 | | | % | | | n/m | | | | | | n/m | | | | | | 9.90 | | | % |
Efficiency ratio(1) | | | 49.46 | | | | | | n/m | | | | | | 57.46 | | | | | | 44.30 | | | | | | n/m | | | | | | n/m | | | | | | 69.04 | | | |
Sales and trading revenue | | | | | | | | | | | | | | | | | | | | | | | | | | | | | | | | | | | | | | | | | | |
Fixed income, currency and commodities | | $ | 7,488 | | | | | $ | (1,142 | ) | | | | $ | 2,685 | | | | | $ | 4,803 | | | | | $ | (5,825 | ) | | | | $ | (653 | ) | | | | $ | 661 | | | |
Equity income | | | 2,614 | | | | | | 583 | | | | | | 1,165 | | | | | | 1,449 | | | | | | (17 | ) | | | | | 176 | | | | | | 276 | | | |
| | | | | | | | | | | | | | | | | | | | | | | | | | | | | | | | | | | | | | | | | | |
Total sales and trading revenue(2) | | $ | 10,102 | | | | | $ | (559 | ) | | | | $ | 3,850 | | | | | $ | 6,252 | | | | | $ | (5,842 | ) | | | | $ | (477 | ) | | | | $ | 937 | | | |
| | | | | | | | | | | | | | | | | | | | | | | | | | | | | | | | | | | | | | | | | | |
Balance sheet | | | | | | | | | | | | | | | | | | | | | | | | | | | | | | | | | | | | | | | | | | |
Average | | | | | | | | | | | | | | | | | | | | | | | | | | | | | | | | | | | | | | | | | | |
Total trading-related assets (3) | | $ | 520,339 | | | | | $ | 345,118 | | | | | $ | 503,688 | | | | | $ | 537,176 | | | | | $ | 315,125 | | | | | $ | 347,088 | | | | | $ | 332,748 | | | |
Total market-based earning assets | | | 482,356 | | | | | | 381,048 | | | | | | 475,761 | | | | | | 489,024 | | | | | | 311,782 | | | | | | 370,146 | | | | | | 367,193 | | | |
Total earning assets | | | 493,789 | | | | | | 386,286 | | | | | | 485,151 | | | | | | 502,524 | | | | | | 317,636 | | | | | | 375,009 | | | | | | 372,510 | | | |
Total assets | | | 692,593 | | | | | | 445,251 | | | | | | 670,703 | | | | | | 714,726 | | | | | | 390,274 | | | | | | 430,539 | | | | | | 429,854 | | | |
Allocated equity | | | 29,139 | | | | | | 11,786 | | | | | | 31,022 | | | | | | 27,235 | | | | | | 15,156 | | | | | | 12,035 | | | | | | 12,088 | | | |
Period end | | | | | | | | | | | | | | | | | | | | | | | | | | | | | | | | | | | | | | | | | | |
Total trading-related assets (3) | | $ | 434,967 | | | | | $ | 299,828 | | | | | $ | 434,967 | | | | | $ | 440,839 | | | | | $ | 244,174 | | | | | $ | 275,703 | | | | | $ | 299,828 | | | |
Total market-based earning assets | | | 400,534 | | | | | | 329,394 | | | | | | 400,534 | | | | | | 381,087 | | | | | | 237,618 | | | | | | 282,475 | | | | | | 329,394 | | | |
Total earning assets | | | 408,942 | | | | | | 334,700 | | | | | | 408,942 | | | | | | 392,324 | | | | | | 243,275 | | | | | | 288,107 | | | | | | 334,700 | | | |
Total assets | | | 571,761 | | | | | | 388,451 | | | | | | 571,761 | | | | | | 583,416 | | | | | | 306,693 | | | | | | 350,326 | | | | | | 388,451 | | | |
Trading-related assets (average) | | | | | | | | | | | | | | | | | | | | | | | | | | | | | | | | | | | | | | | | | | |
Trading account securities | | $ | 204,005 | | | | | $ | 184,390 | | | | | $ | 190,524 | | | | | $ | 217,636 | | | | | $ | 167,463 | | | | | $ | 186,455 | | | | | $ | 180,540 | | | |
Reverse repurchases | | | 137,784 | | | | | | 53,405 | | | | | | 139,358 | | | | | | 136,192 | | | | | | 53,193 | | | | | | 62,767 | | | | | | 51,257 | | | |
Securities borrowed | | | 69,925 | | | | | | 72,290 | | | | | | 72,078 | | | | | | 67,749 | | | | | | 42,580 | | | | | | 62,982 | | | | | | 65,741 | | | |
Derivative assets | | | 108,625 | | | | | | 35,034 | | | | | | 101,728 | | | | | | 115,599 | | | | | | 51,889 | | | | | | 34,884 | | | | | | 35,210 | | | |
| | | | | | | | | | | | | | | | | | | | | | | | | | | | | | | | | | | | | | | | | | |
Total trading-related assets(3) | | $ | 520,339 | | | | | $ | 345,119 | | | | | $ | 503,688 | | | | | $ | 537,176 | | | | | $ | 315,125 | | | | | $ | 347,088 | | | | | $ | 332,748 | | | |
| | | | | | | | | | | | | | | | | | | | | | | | | | | | | | | | | | | | | | | | | | |
| | | | | | | | | | | | | | | | | | | | | | | | | | | | | | | | | | | | | | | | | | |
| | | | | | | | | | | | | | | | | | | | | | | | | | | | | | | | | | | | | | | | | | | |
(1) Fully taxable-equivalent basis |
(2) Sales and trading revenue represents total Global Markets revenue, net of interest expense as adjusted by the following items: |
Total Global Markets revenue, net of interest expense | | $ | 11,351 | | | | | $ | 537 | | | | | $ | 4,452 | | | | | $ | 6,899 | | | | | $ | (4,565 | ) | | | | $ | 149 | | | | | $ | 1,378 | | | |
Investment banking income | | | (1,306 | ) | | | | | (690 | ) | | | | | (821 | ) | | | | | (485 | ) | | | | | (365 | ) | | | | | (240 | ) | | | | | (380 | ) | | |
Fair value option net interest income | | | (135 | ) | | | | | (56 | ) | | | | | (70 | ) | | | | | (65 | ) | | | | | (43 | ) | | | | | (31 | ) | | | | | (25 | ) | | |
Revenue (loss) shared | | | 139 | | | | | | (350 | ) | | | | | 269 | | | | | | (130 | ) | | | | | (869 | ) | | | | | (131 | ) | | | | | (36 | ) | | |
(Gain) loss on sale of prime brokerage business | | | 53 | | | | | | — | | | | | | 20 | | | | | | 33 | | | | | | — | | | | | | (224 | ) | | | | | — | | | |
| | | | | | | | | | | | | | | | | | | | | | | | | | | | | | | | | | | | | | | | | | |
Total sales and trading revenue | | $ | 10,102 | | | | | $ | (559 | ) | | | | $ | 3,850 | | | | | $ | 6,252 | | | | | $ | (5,842 | ) | | | | $ | (477 | ) | | | | $ | 937 | | | |
| | | | | | | | | | | | | | | | | | | | | | | | | | | | | | | | | | | | | | | | | | |
(3) Includes assets which are not considered earning assets (i.e. derivative assets). |
| n/m = not meaningful |
Certain prior period amounts have been reclassified among the segments to conform to the current period presentation.
Information for periods beginning July 1, 2008 includes the Countrywide acquisition. Information for periods beginning January 1, 2009 includes the
Merrill Lynch acquisition. Prior periods have not been restated.
| | |
| This information is preliminary and based on company data available at the time of the presentation. | | 25 |
Bank of America Corporation and Subsidiaries
Off-Balance Sheet Special Purpose Entities Liquidity Exposure
(Dollars in millions)
| | | | | | | | | | | | | | | |
| | | June 30, 2009 | | |
| | | VIEs(1) | | | | QSPEs (2) | | | | Total | | |
Commercial paper conduits: | | | | | | | | | | | | | | | |
Multi-seller conduits | | $ | 34,825 | | | | $ | — | | | | $ | 34,825 | | |
Asset acquisition conduits | | | 1,391 | | | | | — | | | | | 1,391 | | |
Home equity securitizations | | | — | | | | | 13,377 | | | | | 13,377 | | |
Municipal bond trusts | | | 3,545 | | | | | 8,421 | | | | | 11,966 | | |
Collateralized debt obligation vehicles(3) | | | 4,749 | | | | | — | | | | | 4,749 | | |
Credit-linked note and other vehicles | | | 3,976 | | | | | — | | | | | 3,976 | | |
Customer conduits | | | 669 | | | | | — | | | | | 669 | | |
Credit card securitizations | | | — | | | | | 946 | | | | | 946 | | |
| | | | | | | | | | | | | | | |
Total liquidity exposure(4) | | $ | 49,155 | | | | $ | 22,744 | | | | $ | 71,899 | | |
| | | | | | | | | | | | | | | |
| | |
| | | March 31, 2009 | | |
| | | VIEs(1) | | | | QSPEs (2) | | | | Total | | |
Commercial paper conduits: | | | | | | | | | | | | | | | |
Multi-seller conduits | | $ | 39,919 | | | | $ | — | | | | $ | 39,919 | | |
Asset acquisition conduits | | | 1,312 | | | | | — | | | | | 1,312 | | |
Other corporate conduits (5) | | | — | | | | | 1,233 | | | | | 1,233 | | |
Home equity securitizations | | | — | | | | | 12,791 | | | | | 12,791 | | |
Municipal bond trusts | | | 3,591 | | | | | 8,904 | | | | | 12,495 | | |
Collateralized debt obligation vehicles(3) | | | 8,112 | | | | | — | | | | | 8,112 | | |
Credit-linked note and other vehicles | | | 2,946 | | | | | — | | | | | 2,946 | | |
Customer conduits | | | 1,482 | | | | | — | | | | | 1,482 | | |
Credit card securitizations | | | — | | | | | 946 | | | | | 946 | | |
| | | | | | | | | | | | | | | |
Total liquidity exposure(4) | | $ | 57,362 | | | | $ | 23,874 | | | | $ | 81,236 | | |
| | | | | | | | | | | | | | | |
| (1) | Variable interest entities (VIEs) are special purpose entities (SPEs) which lack sufficient equity at risk or whose equity investors do not have a controlling financial interest. In accordance with Financial Accounting Standards Board (FASB) Interpretation No. 46 (Revised December 2003), “Consolidation of Variable Interest Entities, an interpretation of ARB No. 51” (FIN 46R), a VIE is consolidated by the party known as the primary beneficiary that will absorb the majority of the expected losses or expected residual returns of the VIEs or both. For example, an entity that holds a majority of the subordinated debt or equity securities issued by a VIE, or protects other investors from loss through a guarantee or similar arrangement, may have to consolidate the VIE. The assets and liabilities of consolidated VIEs are recorded on the Corporation’s balance sheet. |
| (2) | Qualifying special purposes entities (QSPEs) are SPEs whose activities are strictly limited to holding and servicing financial assets and meet the requirements set forth in SFAS No. 140, “Accounting for Transfers and Servicing of Financial Assets and Extinguishments of Liabilities – a replacement of FASB Statement No. 125” (SFAS 140). QSPEs are generally not required to be consolidated by any party. This table includes only those QSPEs to which we have liquidity exposure. |
| (3) | Includes collateralized debt obligation exposure before writedowns or insurance. |
| (4) | Merrill Lynch related exposures as of June 30, 2009 were: $6.5 billion municipal bond trusts, $4.7 billion collateralized debt obligation vehicles, $4.0 billion in credit-linked note and other vehicles and $162 million in customer conduits. At March 31, 2009 these exposures were: $8.1 billion collateralized debt obligation vehicles, $6.6 billion municipal bond trusts, $2.9 billion in credit-linked note and other vehicles and $568 million in customer conduits. |
| (5) | The other corporate conduit exposure was liquidated during second quarter of 2009. |
Certain prior period amounts have been reclassified to conform to current period presentation.
Information for periods beginning July 1, 2008 includes the Countrywide acquisition. Information for periods beginning January 1, 2009 includes the
Merrill Lynch acquisition. Prior periods have not been restated.
| | |
| This information is preliminary and based on company data available at the time of the presentation. | | 26 |
Bank of America Corporation and Subsidiaries
Super Senior Collateralized Debt Obligation Exposure
(Dollars in millions)
| | | | | | | | | | | | | | | |
| | | June 30, 2009 |
| | | Subprime (1) | | Purchased
Securities | | Total
Subprime | | Non-
Subprime (2) | | Total |
Unhedged | | $ | 670 | | $ | 1,241 | | $ | 1,911 | | $ | 1,558 | | $ | 3,469 |
Hedged (3) | | | 1,044 | | | — | | | 1,044 | | | 768 | | | 1,812 |
| | | | | | | | | | | | | | | |
Total | | $ | 1,714 | | $ | 1,241 | | $ | 2,955 | | $ | 2,326 | | $ | 5,281 |
| | | | | | | | | | | | | | | |
| (1) | Classified as subprime when subprime consumer real estate loans make up at least 35 percent of the ultimate underlying collateral’s original net exposure value. |
| (2) | Includes highly rated collateralized loan obligations and commercial mortgage-backed securities super senior exposure. |
| (3) | Hedged amounts are presented at carrying value before consideration of the insurance. |
Credit Default Swaps with Monoline Financial Guarantors
(Dollars in millions)
| | | | | | | | | | | | | | | | | | |
| | | June 30, 2009 |
| | | Super
Senior
CDOs | | | | | Other
Guaranteed
Positions | | | | | Total | | | |
Notional | | $ | 5,573 | | | | | $ | 44,899 | | | | | $ | 50,472 | | | |
| | | | | | |
Mark-to-market or guarantor receivable | | $ | 4,168 | | | | | $ | 11,270 | | | | | $ | 15,438 | | | |
Credit valuation adjustment | | | (2,867 | ) | | | | | (5,729 | ) | | | | | (8,596 | ) | | |
| | | | | | | | | | | | | | | | | | |
Total | | $ | 1,301 | | | | | $ | 5,541 | | | | | $ | 6,842 | | | |
| | | | | | | | | | | | | | | | | | |
Credit valuation adjustment % | | | 69 | | | % | | | 51 | | | % | | | 56 | | | % |
| | | | | | |
(Writedowns) gains during the three months ended June 30, 2009 | | $ | (353 | ) | | | | $ | 223 | | | | | $ | (130 | ) | | |
| | | | | | |
Writedowns during the six months ended June 30, 2009 | | | (612 | ) | | | | | (737 | ) | | | | | (1,349 | ) | | |
Certain prior period amounts have been reclassified to conform to current period presentation.
| | |
Information for periods beginning July 1, 2008 includes the Countrywide acquisition. Information for periods beginning January 1, 2009 includes the Merrill Lynch acquisition. Prior periods have not been restated. | | |
| This information is preliminary and based on company data available at the time of the presentation. | | 27 |
Bank of America Corporation and Subsidiaries
Unhedged Subprime Super Senior Collateralized Debt Obligation Carrying Values(1)
(Dollars in millions)
| | | | | | | | | | | | | | | | | | | |
| | | June 30, 2009 |
| | | Subprime
Net Exposure | | Carrying Value
as a Percent of
Original Net
Exposure | | | | Subprime
Content of
Collateral (2) | | | | Vintage of Subprime Collateral |
| | | | | | | | Percent in
2006/2007
Vintages | | | | Percent in
2005/Prior
Vintages | | |
Mezzanine super senior liquidity commitments | | $ | 87 | | 4 | | % | | 100 | | % | | 86 | | % | | 14 | | % |
Other super senior exposure | | | | | | | | | | | | | | | | | | | |
High grade | | | 289 | | 26 | | | | 64 | | | | 11 | | | | 89 | | |
Mezzanine | | | 288 | | 17 | | | | 37 | | | | 79 | | | | 21 | | |
CDO-squared | | | 6 | | 1 | | | | 100 | | | | 100 | | | | — | | |
| | | | | | | | | | | | | | | | | | | |
Total other super senior | | | 583 | | | | | | | | | | | | | | | | |
| | | | | | | | | | | | | | | | | | | |
Total super senior | | $ | 670 | | 13 | | | | | | | | | | | | | | |
| | | | | | | | | | | | | | | | | | | |
| | | | | | | | | |
Purchased securities from liquidated CDOs | | | 1,241 | | 21 | | | | 35 | | | | 25 | | | | 75 | | |
| | | | | | | | | | | | | | | | | | | |
| | | | | | | | | |
Total | | $ | 1,911 | | 17 | | | | | | | | | | | | | | |
| | | | | | | | | | | | | | | | | | | |
| (1) | Classified as subprime when subprime consumer real estate loans make up at least 35 percent of the ultimate underlying collateral’s original net exposure value. |
| (2) | Based on current net exposure value. |
Certain prior period amounts have been reclassified to conform to current period presentation.
| | |
Information for periods beginning July 1, 2008 includes the Countrywide acquisition. Information for periods beginning January 1, 2009 includes the Merrill Lynch acquisition. Prior periods have not been restated. | | |
| This information is preliminary and based on company data available at the time of the presentation. | | 28 |
Bank of America Corporation and Subsidiaries
Global Wealth & Investment Management Segment Results(1)
(Dollars in millions, except as noted)
| | | | | | | | | | | | | | | | | | | | | | | | | | | | | | | | | | | | | | | | | | |
| | | Six Months Ended
June 30 | | | | | Second
Quarter
2009 | | | | | First
Quarter
2009 | | | | | Fourth
Quarter
2008 | | | | | Third
Quarter
2008 | | | | | Second
Quarter
2008 | | | |
| | | 2009 | | | | | 2008 | | | | | | | | | | | | | |
Net interest income(2) | | $ | 2,946 | | | | | $ | 2,167 | | | | | $ | 1,291 | | | | | $ | 1,655 | | | | | $ | 1,343 | | | | | $ | 1,265 | | | | | $ | 1,149 | | | |
Noninterest income: | | | | | | | | | | | | | | | | | | | | | | | | | | | | | | | | | | | | | | | | | | |
Investment and brokerage services | | | 4,540 | | | | | | 2,176 | | | | | | 2,230 | | | | | | 2,310 | | | | | | 880 | | | | | | 1,002 | | | | | | 1,095 | | | |
All other income (loss) | | | 1,073 | | | | | | (106 | ) | | | | | 675 | | | | | | 398 | | | | | | (238 | ) | | | | | (703 | ) | | | | | 51 | | | |
| | | | | | | | | | | | | | | | | | | | | | | | | | | | | | | | | | | | | | | | | | |
Total noninterest income | | | 5,613 | | | | | | 2,070 | | | | | | 2,905 | | | | | | 2,708 | | | | | | 642 | | | | | | 299 | | | | | | 1,146 | | | |
| | | | | | | | | | | | | | | | | | | | | | | | | | | | | | | | | | | | | | | | | | |
Total revenue, net of interest expense | | | 8,559 | | | | | | 4,237 | | | | | | 4,196 | | | | | | 4,363 | | | | | | 1,985 | | | | | | 1,564 | | | | | | 2,295 | | | |
Provision for credit losses | | | 492 | | | | | | 362 | | | | | | 238 | | | | | | 254 | | | | | | 152 | | | | | | 150 | | | | | | 119 | | | |
Noninterest expense | | | 6,594 | | | | | | 2,555 | | | | | | 3,304 | | | | | | 3,290 | | | | | | 1,069 | | | | | | 1,286 | | | | | | 1,244 | | | |
| | | | | | | | | | | | | | | | | | | | | | | | | | | | | | | | | | | | | | | | | | |
Income before income taxes | | | 1,473 | | | | | | 1,320 | | | | | | 654 | | | | | | 819 | | | | | | 764 | | | | | | 128 | | | | | | 932 | | | |
Income tax expense(2) | | | 522 | | | | | | 495 | | | | | | 213 | | | | | | 309 | | | | | | 236 | | | | | | 51 | | | | | | 351 | | | |
| | | | | | | | | | | | | | | | | | | | | | | | | | | | | | | | | | | | | | | | | | |
Net income | | $ | 951 | | | | | $ | 825 | | | | | $ | 441 | | | | | $ | 510 | | | | | $ | 528 | | | | | $ | 77 | | | | | $ | 581 | | | |
| | | | | | | | | | | | | | | | | | | | | | | | | | | | | | | | | | | | | | | | | | |
Net interest yield(2) | | | 2.67 | | | % | | | 2.88 | | | % | | | 2.54 | | | % | | | 2.77 | | | % | | | 3.03 | | | % | | | 3.09 | | | % | | | 2.96 | | | % |
Return on average equity | | | 10.70 | | | | | | 14.21 | | | | | | 9.45 | | | | | | 12.09 | | | | | | 17.84 | | | | | | 2.61 | | | | | | 19.84 | | | |
Efficiency ratio(2) | | | 77.04 | | | | | | 60.31 | | | | | | 78.74 | | | | | | 75.41 | | | | | | 53.85 | | | | | | 82.22 | | | | | | 54.21 | | | |
Balance sheet | | | | | | | | | | | | | | | | | | | | | | | | | | | | | | | | | | | | | | | | | | |
Average | | | | | | | | | | | | | | | | | | | | | | | | | | | | | | | | | | | | | | | | | | |
Total loans and leases | | $ | 106,117 | | | | | $ | 86,609 | | | | | $ | 101,748 | | | | | $ | 110,535 | | | | | $ | 88,876 | | | | | $ | 88,255 | | | | | $ | 87,574 | | | |
Total earning assets(3) | | | 222,775 | | | | | | 151,385 | | | | | | 203,528 | | | | | | 242,236 | | | | | | 176,208 | | | | | | 162,858 | | | | | | 156,232 | | | |
Total assets(3) | | | 258,260 | | | | | | 161,016 | | | | | | 238,609 | | | | | | 278,130 | | | | | | 184,649 | | | | | | 172,312 | | | | | | 165,682 | | | |
Total deposits | | | 231,853 | | | | | | 152,808 | | | | | | 214,111 | | | | | | 249,792 | | | | | | 171,340 | | | | | | 160,999 | | | | | | 157,113 | | | |
Allocated equity | | | 17,918 | | | | | | 11,673 | | | | | | 18,708 | | | | | | 17,119 | | | | | | 11,767 | | | | | | 11,677 | | | | | | 11,775 | | | |
Period end | | | | | | | | | | | | | | | | | | | | | | | | | | | | | | | | | | | | | | | | | | |
Total loans and leases | | $ | 100,878 | | | | | $ | 88,172 | | | | | $ | 100,878 | | | | | $ | 102,766 | | | | | $ | 89,401 | | | | | $ | 89,004 | | | | | $ | 88,172 | | | |
Total earning assets(3) | | | 202,287 | | | | | | 157,334 | | | | | | 202,287 | | | | | | 237,739 | | | | | | 178,240 | | | | | | 169,582 | | | | | | 157,334 | | | |
Total assets(3) | | | 232,913 | | | | | | 167,197 | | | | | | 232,913 | | | | | | 268,133 | | | | | | 187,994 | | | | | | 179,346 | | | | | | 167,197 | | | |
Total deposits | | | 206,296 | | | | | | 158,228 | | | | | | 206,296 | | | | | | 241,504 | | | | | | 175,107 | | | | | | 166,273 | | | | | | 158,228 | | | |
Client assets | | | | | | | | | | | | | | | | | | | | | | | | | | | | | | | | | | | | | | | | | | |
Assets under management | | $ | 705,216 | | | | | $ | 589,459 | | | | | $ | 705,216 | | | | | $ | 697,371 | | | | | $ | 523,159 | | | | | $ | 564,438 | | | | | $ | 589,459 | | | |
Client brokerage assets(4) | | | 1,164,171 | | | | | | 210,701 | | | | | | 1,164,171 | | | | | | 1,102,633 | | | | | | 172,106 | | | | | | 196,566 | | | | | | 210,701 | | | |
Assets in custody | | | 252,830 | | | | | | 156,530 | | | | | | 252,830 | | | | | | 234,361 | | | | | | 133,726 | | | | | | 150,575 | | | | | | 156,530 | | | |
Less: Client brokerage assets and assets in custody included in assets under management | | | (297,869 | ) | | | | | (89,234 | ) | | | | | (297,869 | ) | | | | | (279,130 | ) | | | | | (78,487 | ) | | | | | (82,921 | ) | | | | | (89,234 | ) | | |
| | | | | | | | | | | | | | | | | | | | | | | | | | | | | | | | | | | | | | | | | | |
Total net client assets | | $ | 1,824,348 | | | | | $ | 867,456 | | | | | $ | 1,824,348 | | | | | $ | 1,755,235 | | | | | $ | 750,504 | | | | | $ | 828,658 | | | | | $ | 867,456 | | | |
| | | | | | | | | | | | | | | | | | | | | | | | | | | | | | | | | | | | | | | | | | |
| (1) | GWIM services clients through three primary businesses: Merrill Lynch Global Wealth Management (MLGWM), U.S. Trust, Bank of America Private Wealth Management (U.S. Trust), andColumbia Management (Columbia). |
| (2) | Fully taxable-equivalent basis |
| (3) | Total earning assets and total assets include asset allocations to match liabilities (i.e., deposits). |
| (4) | Client brokerage assets include non-discretionary brokerage and fee-based assets. |
Certain prior period amounts have been reclassified among the segments to conform to the current period presentation.
Information for periods beginning July 1, 2008 includes the Countrywide acquisition. Information for periods beginning January 1, 2009 includes the
Merrill Lynch acquisition. Prior periods have not been restated.
| | |
| This information is preliminary and based on company data available at the time of the presentation. | | 29 |
Bank of America Corporation and Subsidiaries
Global Wealth & Investment Management Business Results
(Dollars in millions)
| | | | | | | | | | | | | | | | | | | | | | | | | |
| | | Three Months Ended June 30, 2009 | |
| | | Total | | | | Merrill Lynch
Global Wealth
Management(1, 2) | | | | U.S. Trust | | | | Columbia
Management | | | | | Other(3) | |
Net interest income(4) | | $ | 1,291 | | | | $ | 1,057 | | | | $ | 334 | | | | $ | 10 | | | | | $ | (110 | ) |
Noninterest income: | | | | | | | | | | | | | | | | | | | | | | | | | |
Investment and brokerage services | | | 2,230 | | | | | 1,429 | | | | | 331 | | | | | 271 | | | | | | 199 | |
All other income | | | 675 | | | | | 492 | | | | | 9 | | | | | 53 | | | | | | 121 | |
| | | | | | | | | | | | | | | | | | | | | | | | | |
Total noninterest income | | | 2,905 | | | | | 1,921 | | | | | 340 | | | | | 324 | | | | | | 320 | |
| | | | | | | | | | | | | | | | | | | | | | | | | |
Total revenue, net of interest expense | | | 4,196 | | | | | 2,978 | | | | | 674 | | | | | 334 | | | | | | 210 | |
| | | | | | | | | |
Provision for credit losses | | | 238 | | | | | 154 | | | | | 84 | | | | | — | | | | | | — | |
Noninterest expense | | | 3,304 | | | | | 2,374 | | | | | 483 | | | | | 220 | | | | | | 227 | |
| | | | | | | | | | | | | | | | | | | | | | | | | |
Income (loss) before income taxes | | | 654 | | | | | 450 | | | | | 107 | | | | | 114 | | | | | | (17 | ) |
Income tax expense (benefit)(4) | | | 213 | | | | | 167 | | | | | 40 | | | | | 42 | | | | | | (36 | ) |
| | | | | | | | | | | | | | | | | | | | | | | | | |
Net income | | $ | 441 | | | | $ | 283 | | | | $ | 67 | | | | $ | 72 | | | | | | 19 | |
| | | | | | | | | | | | | | | | | | | | | | | | | |
Net interest yield(4) | | | 2.54 | | % | | | 2.48 | | % | | | 2.52 | | % | | | n/m | | | | | | n/m | |
Return on average equity | | | 9.45 | | | | | 14.44 | | | | | 5.30 | | | | | 41.03 | | | % | | | n/m | |
Efficiency ratio(4) | | | 78.74 | | | | | 79.68 | | | | | 71.76 | | | | | n/m | | | | | | n/m | |
Average - total loans and leases | | $ | 101,748 | | | | $ | 48,830 | | | | $ | 52,901 | | | | | n/m | | | | | | n/m | |
Average - total deposits | | | 214,111 | | | | | 176,859 | | | | | 37,218 | | | | | n/m | | | | | | n/m | |
Period end - total assets(5) | | | 232,913 | | | | | 183,907 | | | | | 56,738 | | | | $ | 2,647 | | | | | | n/m | |
| |
| | | Three Months Ended March 31, 2009 | |
| | | Total | | | | Merrill Lynch
Global Wealth
Management (1, 2) | | | | U.S. Trust | | | | Columbia
Management | | | | | Other(3) | |
Net interest income(4) | | $ | 1,655 | | | | $ | 1,405 | | | | $ | 355 | | | | $ | 12 | | | | | $ | (117 | ) |
Noninterest income: | | | | | | | | | | | | | | | | | | | | | | | | | |
Investment and brokerage services | | | 2,310 | | | | | 1,539 | | | | | 317 | | | | | 260 | | | | | | 194 | |
All other income (loss) | | | 398 | | | | | 411 | | | | | 16 | | | | | (122 | ) | | | | | 93 | |
| | | | | | | | | | | | | | | | | | | | | | | | | |
Total noninterest income | | | 2,708 | | | | | 1,950 | | | | | 333 | | | | | 138 | | | | | | 287 | |
| | | | | | | | | | | | | | | | | | | | | | | | | |
Total revenue, net of interest expense | | | 4,363 | | | | | 3,355 | | | | | 688 | | | | | 150 | | | | | | 170 | |
| | | | | | | | | |
Provision for credit losses | | | 254 | | | | | 223 | | | | | 31 | | | | | — | | | | | | — | |
Noninterest expense | | | 3,290 | | | | | 2,374 | | | | | 511 | | | | | 234 | | | | | | 171 | |
| | | | | | | | | | | | | | | | | | | | | | | | | |
Income (loss) before income taxes | | | 819 | | | | | 758 | | | | | 146 | | | | | (84 | ) | | | | | (1 | ) |
Income tax expense (benefit)(4) | | | 309 | | | | | 280 | | | | | 54 | | | | | (31 | ) | | | | | 6 | |
| | | | | | | | | | | | | | | | | | | | | | | | | |
Net income (loss) | | $ | 510 | | | | $ | 478 | | | | $ | 92 | | | | $ | (53 | ) | | | | $ | (7 | ) |
| | | | | | | | | | | | | | | | | | | | | | | | | |
| | | | | | | | | |
Net interest yield(4) | | | 2.77 | | % | | | 2.74 | | % | | | 2.71 | | % | | | n/m | | | | | | n/m | |
Return on average equity | | | 12.09 | | | | | 28.54 | | | | | 7.64 | | | | | (28.79 | ) | | % | | | n/m | |
Efficiency ratio(4) | | | 75.41 | | | | | 70.77 | | | | | 74.24 | | | | | n/m | | | | | | n/m | |
Average - total loans and leases | | $ | 110,535 | | | | $ | 57,689 | | | | | 52,832 | | | | | n/m | | | | | | n/m | |
Average - total deposits | | | 249,792 | | | | | 211,445 | | | | | 38,323 | | | | | n/m | | | | | | n/m | |
Period end - total assets(5) | | | 268,133 | | | | | 217,930 | | | | | 56,493 | | | | $ | 2,642 | | | | | | n/m | |
| |
| | | Three Months Ended June 30, 2008 | |
| | | Total | | | | Merrill Lynch
Global Wealth
Management(1,2) | | | | U.S. Trust | | | | Columbia
Management | | | | | Other | |
Net interest income(4) | | $ | 1,149 | | | | $ | 778 | | | | $ | 373 | | | | $ | (6 | ) | | | | $ | 4 | |
Noninterest income: | | | | | | | | | | | | | | | | | | | | | | | | | |
Investment and brokerage services | | | 1,095 | | | | | 263 | | | | | 388 | | | | | 403 | | | | | | 41 | |
All other income (loss) | | | 51 | | | | | 66 | | | | | 15 | | | | | (34 | ) | | | | | 4 | |
| | | | | | | | | | | | | | | | | | | | | | | | | |
Total noninterest income | | | 1,146 | | | | | 329 | | | | | 403 | | | | | 369 | | | | | | 45 | |
| | | | | | | | | | | | | | | | | | | | | | | | | |
Total revenue, net of interest expense | | | 2,295 | | | | | 1,107 | | | | | 776 | | | | | 363 | | | | | | 49 | |
| | | | | | | | | |
Provision for credit losses | | | 119 | | | | | 112 | | | | | 7 | | | | | — | | | | | | — | |
Noninterest expense | | | 1,244 | | | | | 465 | | | | | 463 | | | | | 304 | | | | | | 12 | |
| | | | | | | | | | | | | | | | | | | | | | | | | |
Income before income taxes | | | 932 | | | | | 530 | | | | | 306 | | | | | 59 | | | | | | 37 | |
Income tax expense(4) | | | 351 | | | | | 196 | | | | | 113 | | | | | 22 | | | | | | 20 | |
| | | | | | | | | | | | | | | | | | | | | | | | | |
Net income | | $ | 581 | | | | $ | 334 | | | | | 193 | | | | $ | 37 | | | | | $ | 17 | |
| | | | | | | | | | | | | | | | | | | | | | | | | |
Net interest yield(4) | | | 2.96 | | % | | | 2.57 | | % | | | 2.94 | | % | | | n/m | | | | | | n/m | |
Return on average equity | | | 19.84 | | | | | 40.13 | | | | | 16.42 | | | | | 28.60 | | | % | | | n/m | |
Efficiency ratio(4) | | | 54.21 | | | | | 41.97 | | | | | 59.65 | | | | | n/m | | | | | | n/m | |
Average - total loans and leases | | $ | 87,574 | | | | $ | 36,507 | | | | $ | 51,052 | | | | | n/m | | | | | | n/m | |
Average - total deposits | | | 157,113 | | | | | 120,343 | | | | | 36,464 | | | | | n/m | | | | | | n/m | |
Period end - total assets(5) | | | 167,197 | | | | | 124,819 | | | | | 56,562 | | | | $ | 2,819 | | | | | | n/m | |
| (1) | MLGWM includes the net impact of migrating customers and their related deposit balances between MLGWM and Deposits. After migration, the associated net interest income, service charges and noninterest expense are recorded in the appropriate segment. During the three months ended June 30, 2009 and March 31, 2009, a total of $34.3 billion and $6.1 billion of deposits migrated to Deposits from MLGWM. During the three months ended June 30, 2008, a total of $ 5.6 billion of deposits were migrated from Deposits to MLGWM. |
| (2) | Effective January 1, 2009, as a result of the Merrill Lynch acquisition, we combined Merrill Lynch's wealth management business and our former Premier Banking & Investment business to form MLGWM. |
| (3) | Other includes the results of the Institutional Retirement, Philanthropy & Investments business, the Corporation’s approximately 50 percent economic ownership of BlackRock and other administrative items. |
| (4) | Fully taxable-equivalent basis |
| (5) | Total assets include asset allocations to match liabilities (i.e., deposits). |
n/m = not meaningful
Certain prior period amounts have been reclassified among the segments to conform to the current period presentation.
Information for periods beginning July 1, 2008 includes the Countrywide acquisition. Information for periods beginning January 1, 2009 includes the
Merrill Lynch acquisition. Prior periods have not been restated.
| | |
| This information is preliminary and based on company data available at the time of the presentation. | | 30 |
Bank of America Corporation and Subsidiaries
Global Wealth & Investment Management Business Results
(Dollars in millions)
| | | | | | | | | | | | | | | | | | | | | | | | | | |
| | | Six Months Ended June 30, 2009 | |
| | | Total | | | | | Merrill Lynch
Global Wealth
Management (1, 2) | | | | U.S. Trust | | | | Columbia
Management | | | | | Other (3) | |
Net interest income(4) | | $ | 2,946 | | | | | $ | 2,462 | | | | $ | 689 | | | | $ | 22 | | | | | $ | (227 | ) |
Noninterest income: | | | | | | | | | | | | | | | | | | | | | | | | | | |
Investment and brokerage services | | | 4,540 | | | | | | 2,968 | | | | | 648 | | | | | 531 | | | | | | 393 | |
All other income (loss) | | | 1,073 | | | | | | 903 | | | | | 25 | | | | | (69 | ) | | | | | 214 | |
| | | | | | | | | | | | | | | | | | | | | | | | | | |
Total noninterest income | | | 5,613 | | | | | | 3,871 | | | | | 673 | | | | | 462 | | | | | | 607 | |
| | | | | | | | | | | | | | | | | | | | | | | | | | |
Total revenue, net of interest expense | | | 8,559 | | | | | | 6,333 | | | | | 1,362 | | | | | 484 | | | | | | 380 | |
| | | | | | | | | |
Provision for credit losses | | | 492 | | | | | | 377 | | | | | 115 | | | | | — | | | | | | — | |
Noninterest expense | | | 6,594 | | | | | | 4,748 | | | | | 994 | | | | | 454 | | | | | | 398 | |
| | | | | | | | | | | | | | | | | | | | | | | | | | |
Income (loss) before income taxes | | | 1,473 | | | | | | 1,208 | | | | | 253 | | | | | 30 | | | | | | (18 | ) |
Income tax expense (benefit)(4) | | | 522 | | | | | | 447 | | | | | 94 | | | | | 11 | | | | | | (30 | ) |
| | | | | | | | | | | | | | | | | | | | | | | | | | |
Net income | | $ | 951 | | | | | $ | 761 | | | | $ | 159 | | | | $ | 19 | | | | | $ | 12 | |
| | | | | | | | | | | | | | | | | | | | | | | | | | |
Net interest yield(4) | | | 2.67 | | | % | | | 2.62 | | % | | | 2.62 | | % | | | n/m | | | | | | n/m | |
Return on average equity | | | 10.70 | | | | | | 20.93 | | | | | 6.44 | | | | | 5.17 | | | % | | | n/m | |
Efficiency ratio(4) | | | 77.04 | | | | | | 74.96 | | | | | 73.01 | | | | | n/m | | | | | | n/m | |
Average - total loans and leases | | $ | 106,117 | | | | | $ | 53,235 | | | | $ | 52,867 | | | | | n/m | | | | | | n/m | |
Average - total deposits | | | 231,853 | | | | | | 194,057 | | | | | 37,768 | | | | | n/m | | | | | | n/m | |
Period end - total assets(5) | | | 232,913 | | | | | | 183,907 | | | | | 56,738 | | | | $ | 2,647 | | | | | | n/m | |
| |
| | | Six Months Ended June 30, 2008 | |
| | | Total | | | | | Merrill Lynch
Global Wealth
Management (1, 2) | | | | U.S. Trust | | | | Columbia
Management | | | | | Other | |
Net interest income(4) | | $ | 2,167 | | | | | $ | 1,471 | | | | $ | 694 | | | | $ | (6 | ) | | | | $ | 8 | |
Noninterest income: | | | | | | | | | | | | | | | | | | | | | | | | | | |
Investment and brokerage services | | | 2,176 | | | | | | 521 | | | | | 767 | | | | | 801 | | | | | | 87 | |
All other income (loss) | | | (106 | ) | | | | | 114 | | | | | 34 | | | | | (255 | ) | | | | | 1 | |
| | | | | | | | | | | | | | | | | | | | | | | | | | |
Total noninterest income | | | 2,070 | | | | | | 635 | | | | | 801 | | | | | 546 | | | | | | 88 | |
| | | | | | | | | | | | | | | | | | | | | | | | | | |
Total revenue, net of interest expense | | | 4,237 | | | | | | 2,106 | | | | | 1,495 | | | | | 540 | | | | | | 96 | |
| | | | | | | | | |
Provision for credit losses | | | 362 | | | | | | 352 | | | | | 10 | | | | | — | | | | | | — | |
Noninterest expense | | | 2,555 | | | | | | 919 | | | | | 968 | | | | | 611 | | | | | | 57 | |
| | | | | | | | | | | | | | | | | | | | | | | | | | |
Income (loss) before income taxes | | | 1,320 | | | | | | 835 | | | | | 517 | | | | | (71 | ) | | | | | 39 | |
Income tax expense (benefit)(4) | | | 495 | | | | | | 309 | | | | | 191 | | | | | (26 | ) | | | | | 21 | |
| | | | | | | | | | | | | | | | | | | | | | | | | | |
Net income (loss) | | $ | 825 | | | | | $ | 526 | | | | $ | 326 | | | | $ | (45 | ) | | | | $ | 18 | |
| | | | | | | | | | | | | | | | | | | | | | | | | | |
Net interest yield(4) | | | 2.88 | | | % | | | 2.50 | | % | | | 2.82 | | % | | | n/m | | | | | | n/m | |
Return on average equity | | | 14.21 | | | | | | 31.39 | | | | | 14.23 | | | | | (17.08 | ) | | % | | | n/m | |
Efficiency ratio(4) | | | 60.31 | | | | | | 43.61 | | | | | 64.81 | | | | | n/m | | | | | | n/m | |
Average - total loans and leases | | $ | 86,609 | | | | | $ | 37,093 | | | | $ | 49,491 | | | | | n/m | | | | | | n/m | |
Average - total deposits | | | 152,808 | | | | | | 116,849 | | | | | 35,557 | | | | | n/m | | | | | | n/m | |
Period end - total assets(5) | | | 167,197 | | | | | | 124,819 | | | | | 56,562 | | | | $ | 2,819 | | | | | | n/m | |
| (1) | MLGWM includes the net impact of migrating customers and their related deposit balances between MLGWM and Deposits. After migration, the associated net interest income, servicecharges and noninterest expense are recorded in the appropriate segment. During the six months ended June 30, 2009, a total of $40.5 billion of deposits migrated to Deposits from MLGWM.During the six months ended June 30, 2008, a total of $12.7 billion of deposits migrated from Deposits to MLGWM. |
| (2) | Effective January 1, 2009, as a result of the Merrill Lynch acquisition, we combined Merrill Lynch’s wealth management business and our former Premier Banking & Investment business to form MLGWM. |
| (3) | Other includes the results of the Institutional Retirement, Philanthropy & Investments business, the Corporation’s approximately 50 percent economic ownership of BlackRock and other administrative items. |
| (4) | Fully taxable-equivalent basis |
| (5) | Total assets include asset allocations to match liabilities (i.e., deposits). |
n/m = not meaningful
Certain prior period amounts have been reclassified among the segments to conform to the current period presentation.
Information for periods beginning July 1, 2008 includes the Countrywide acquisition. Information for periods beginning January 1, 2009 includes the
Merrill Lynch acquisition. Prior periods have not been restated.
| | |
| This information is preliminary and based on company data available at the time of the presentation. | | 31 |
Bank of America Corporation and Subsidiaries
Global Wealth & Investment Management - Key Indicators
(Dollars in millions, except as noted)
| | | | | | | | | | | | | | | | | | | | | | | | | | | | | | | | | | | | | | | | | | |
| | | Six Months Ended
June 30 | | | | | Second
Quarter
2009 | | | | | First
Quarter
2009 | | | | | Fourth
Quarter
2008 | | | | | Third
Quarter
2008 | | | | | Second
Quarter
2008 | | | |
| | | 2009 | | | | | 2008 | | | | | | | | | | | | | | | | | | |
Investment and Brokerage Services | | | | | | | | | | | | | | | | | | | | | | | | | | | | | | | | | | | | | | | | | | |
Merrill Lynch Global Wealth Management | | | | | | | | | | | | | | | | | | | | | | | | | | | | | | | | | | | | | | | | | | |
Asset management fees | | $ | 1,499 | | | | | $ | 172 | | | | | $ | 713 | | | | | $ | 786 | | | | | $ | 75 | | | | | $ | 84 | | | | | $ | 84 | | | |
Brokerage income | | | 1,469 | | | | | | 349 | | | | | | 716 | | | | | | 753 | | | | | | 163 | | | | | | 157 | | | | | | 179 | | | |
| | | | | | | | | | | | | | | | | | | | | | | | | | | | | | | | | | | | | | | | | | |
Total | | $ | 2,968 | | | | | $ | 521 | | | | | $ | 1,429 | | | | | $ | 1,539 | | | | | $ | 238 | | | | | $ | 241 | | | | | $ | 263 | | | |
| | | | | | | | | | | | | | | | | | | | | | | | | | | | | | | | | | | | | | | | | | |
| | | | | | | | | | | | | | |
U.S. Trust | | | | | | | | | | | | | | | | | | | | | | | | | | | | | | | | | | | | | | | | | | |
Asset management fees | | $ | 632 | | | | | $ | 742 | | | | | $ | 325 | | | | | $ | 307 | | | | | $ | 292 | | | | | $ | 317 | | | | | $ | 375 | | | |
Brokerage income | | | 16 | | | | | | 25 | | | | | | 6 | | | | | | 10 | | | | | | 12 | | | | | | 11 | | | | | | 13 | | | |
| | | | | | | | | | | | | | | | | | | | | | | | | | | | | | | | | | | | | | | | | | |
Total | | $ | 648 | | | | | $ | 767 | | | | | $ | 331 | | | | | $ | 317 | | | | | $ | 304 | | | | | $ | 328 | | | | | $ | 388 | | | |
| | | | | | | | | | | | | | | | | | | | | | | | | | | | | | | | | | | | | | | | | | |
| | | | | | | | | | | | | | |
Columbia Management | | | | | | | | | | | | | | | | | | | | | | | | | | | | | | | | | | | | | | | | | | |
Asset management fees | | $ | 530 | | | | | $ | 799 | | | | | $ | 270 | | | | | $ | 260 | | | | | $ | 301 | | | | | $ | 394 | | | | | $ | 402 | | | |
Brokerage income | | | 1 | | | | | | 2 | | | | | | 1 | | | | | | — | | | | | | — | | | | | | — | | | | | | 1 | | | |
| | | | | | | | | | | | | | | | | | | | | | | | | | | | | | | | | | | | | | | | | | |
Total | | $ | 531 | | | | | $ | 801 | | | | | $ | 271 | | | | | $ | 260 | | | | | $ | 301 | | | | | $ | 394 | | | | | $ | 403 | | | |
| | | | | | | | | | | | | | | | | | | | | | | | | | | | | | | | | | | | | | | | | | |
| | | | | | | | | | | | | | |
Other | | | | | | | | | | | | | | | | | | | | | | | | | | | | | | | | | | | | | | | | | | |
Asset management fees | | $ | 235 | | | | | $ | 87 | | | | | $ | 116 | | | | | $ | 119 | | | | | $ | 37 | | | | | $ | 39 | | | | | $ | 41 | | | |
Brokerage income | | | 158 | | | | | | — | | | | | | 83 | | | | | | 75 | | | | | | — | | | | | | — | | | | | | — | | | |
| | | | | | | | | | | | | | | | | | | | | | | | | | | | | | | | | | | | | | | | | | |
Total | | $ | 393 | | | | | $ | 87 | | | | | $ | 199 | | | | | $ | 194 | | | | | $ | 37 | | | | | $ | 39 | | | | | $ | 41 | | | |
| | | | | | | | | | | | | | | | | | | | | | | | | | | | | | | | | | | | | | | | | | |
| | | | | | | | | | | | | | |
Total Global Wealth & Investment Management | | | | | | | | | | | | | | | | | | | | | | | | | | | | | | | | | | | | | | | | | | |
Asset management fees | | $ | 2,896 | | | | | $ | 1,800 | | | | | $ | 1,424 | | | | | $ | 1,472 | | | | | $ | 705 | | | | | $ | 834 | | | | | $ | 902 | | | |
Brokerage income | | | 1,644 | | | | | | 376 | | | | | | 806 | | | | | | 838 | | | | | | 175 | | | | | | 168 | | | | | | 193 | | | |
| | | | | | | | | | | | | | | | | | | | | | | | | | | | | | | | | | | | | | | | | | |
Total investment and brokerage services | | $ | 4,540 | | | | | $ | 2,176 | | | | | $ | 2,230 | | | | | $ | 2,310 | | | | | $ | 880 | | | | | $ | 1,002 | | | | | $ | 1,095 | | | |
| | | | | | | | | | | | | | | | | | | | | | | | | | | | | | | | | | | | | | | | | | |
| | | | | | | | | | | | | | |
Assets Under Management | | | | | | | | | | | | | | | | | | | | | | | | | | | | | | | | | | | | | | | | | | |
Assets under management by business: | | | | | | | | | | | | | | | | | | | | | | | | | | | | | | | | | | | | | | | | | | |
Merrill Lynch Global Wealth Management | | $ | 239,888 | | | | | $ | 22,404 | | | | | $ | 239,888 | | | | | $ | 219,658 | | | | | $ | 16,682 | | | | | $ | 20,246 | | | | | $ | 22,404 | | | |
U.S. Trust | | | 180,902 | | | | | | 210,969 | | | | | | 180,902 | | | | | | 179,142 | | | | | | 178,657 | | | | | | 199,682 | | | | | | 210,969 | | | |
Columbia Management | | | 331,810 | | | | | | 422,827 | | | | | | 331,810 | | | | | | 340,692 | | | | | | 386,473 | | | | | | 407,345 | | | | | | 422,827 | | | |
Institutional Retirement, Philanthropy & Investments | | | 39,298 | | | | | | 45,907 | | | | | | 39,298 | | | | | | 45,304 | | | | | | 33,498 | | | | | | 39,547 | | | | | | 45,907 | | | |
Eliminations (1) | | | (86,811 | ) | | | | | (113,001 | ) | | | | | (86,811 | ) | | | | | (87,550 | ) | | | | | (92,298 | ) | | | | | (102,621 | ) | | | | | (113,001 | ) | | |
International Wealth Management | | | 129 | | | | | | 353 | | | | | | 129 | | | | | | 125 | | | | | | 147 | | | | | | 239 | | | | | | 353 | | | |
| | | | | | | | | | | | | | | | | | | | | | | | | | | | | | | | | | | | | | | | | | |
Total assets under management | | $ | 705,216 | | | | | $ | 589,459 | | | | | $ | 705,216 | | | | | $ | 697,371 | | | | | $ | 523,159 | | | | | $ | 564,438 | | | | | $ | 589,459 | | | |
| | | | | | | | | | | | | | | | | | | | | | | | | | | | | | | | | | | | | | | | | | |
| | | | | | | | | | | | | | |
Assets under management rollforward: | | | | | | | | | | | | | | | | | | | | | | | | | | | | | | | | | | | | | | | | | | |
Beginning balance | | $ | 523,159 | | | | | $ | 643,531 | | | | | $ | 697,371 | | | | | $ | 523,159 | | | | | $ | 564,438 | | | | | $ | 589,459 | | | | | $ | 607,521 | | | |
Merrill Lynch balance, January 1, 2009 | | | 246,292 | | | | | | — | | | | | | — | | | | | | 246,292 | | | | | | — | | | | | | — | | | | | | — | | | |
Net flows | | | (70,306 | ) | | | | | (18,876 | ) | | | | | (27,071 | ) | | | | | (43,235 | ) | | | | | 12,596 | | | | | | 7,477 | | | | | | (12,611 | ) | | |
Market valuation/other | | | 6,071 | | | | | | (35,196 | ) | | | | | 34,916 | | | | | | (28,845 | ) | | | | | (53,875 | ) | | | | | (32,498 | ) | | | | | (5,451 | ) | | |
| | | | | | | | | | | | | | | | | | | | | | | | | | | | | | | | | | | | | | | | | | |
Ending balance | | $ | 705,216 | | | | | $ | 589,459 | | | | | $ | 705,216 | | | | | $ | 697,371 | | | | | $ | 523,159 | | | | | $ | 564,438 | | | | | $ | 589,459 | | | |
| | | | | | | | | | | | | | | | | | | | | | | | | | | | | | | | | | | | | | | | | | |
| | | | | | | | | | | | | | |
Assets under management mix: | | | | | | | | | | | | | | | | | | | | | | | | | | | | | | | | | | | | | | | | | | |
Money market/other | | $ | 215,637 | | | | | $ | 225,887 | | | | | $ | 215,637 | | | | | $ | 244,577 | | | | | $ | 253,310 | | | | | $ | 238,075 | | | | | $ | 225,887 | | | |
Fixed income | | | 204,974 | | | | | | 107,687 | | | | | | 204,974 | | | | | | 198,177 | | | | | | 102,747 | | | | | | 102,596 | | | | | | 107,687 | | | |
Equity | | | 284,605 | | | | | | 255,885 | | | | | | 284,605 | | | | | | 254,617 | | | | | | 167,102 | | | | | | 223,767 | | | | | | 255,885 | | | |
| | | | | | | | | | | | | | | | | | | | | | | | | | | | | | | | | | | | | | | | | | |
Total assets under management | | $ | 705,216 | | | | | $ | 589,459 | | | | | $ | 705,216 | | | | | $ | 697,371 | | | | | $ | 523,159 | | | | | $ | 564,438 | | | | | $ | 589,459 | | | |
| | | | | | | | | | | | | | | | | | | | | | | | | | | | | | | | | | | | | | | | | | |
| | | | | | | | | | | | | | |
Assets under management - domestic and foreign: | | | | | | | | | | | | | | | | | | | | | | | | | | | | | | | | | | | | | | | | | | |
Domestic | | $ | 685,492 | | | | | $ | 589,106 | | | | | $ | 685,492 | | | | | $ | 679,927 | | | | | $ | 523,012 | | | | | $ | 564,199 | | | | | $ | 589,106 | | | |
Foreign | | | 19,724 | | | | | | 353 | | | | | | 19,724 | | | | | | 17,444 | | | | | | 147 | | | | | | 239 | | | | | | 353 | | | |
| | | | | | | | | | | | | | | | | | | | | | | | | | | | | | | | | | | | | | | | | | |
Total assets under management | | $ | 705,216 | | | | | $ | 589,459 | | | | | $ | 705,216 | | | | | $ | 697,371 | | | | | $ | 523,159 | | | | | $ | 564,438 | | | | | $ | 589,459 | | | |
| | | | | | | | | | | | | | | | | | | | | | | | | | | | | | | | | | | | | | | | | | |
| | | | | | | | | | | | | | |
Client Brokerage Assets(2) | | $ | 1,164,171 | | | | | $ | 210,701 | | | | | $ | 1,164,171 | | | | | $ | 1,102,633 | | | | | $ | 172,106 | | | | | $ | 196,566 | | | | | $ | 210,701 | | | |
| | | | | | | | | | | | | | |
Merrill Lynch Global Wealth Management Metrics | | | | | | | | | | | | | | | | | | | | | | | | | | | | | | | | | | | | | | | | | | |
| | | | | | | | | | | | | | |
Number of financial advisors | | | 15,008 | | | | | | 1,974 | | | | | | 15,008 | | | | | | 15,822 | | | | | | 2,007 | | | | | | 1,964 | | | | | | 1,974 | | | |
| | | | | | | | | | | | | | |
Financial Advisor Productivity (3)(in thousands) | | $ | 813 | | | | | $ | 1,777 | | | | | $ | 816 | | | | | $ | 811 | | | | | $ | 1,576 | | | | | $ | 1,496 | | | | | $ | 1,793 | | | |
| | | | | | | | | | | | | | |
Total client balances (4) | | $ | 1,321,502 | | | | | $ | 308,174 | | | | | $ | 1,321,502 | | | | | $ | 1,292,965 | | | | | $ | 290,661 | | | | | $ | 301,093 | | | | | $ | 308,174 | | | |
| | | | | | | | | | | | | | |
U.S. Trust Metrics | | | | | | | | | | | | | | | | | | | | | | | | | | | | | | | | | | | | | | | | | | |
| | | | | | | | | | | | | | |
Client facing associates | | | 3,968 | | | | | | 4,608 | | | | | | 3,968 | | | | | | 4,015 | | | | | | 4,473 | | | | | | 4,467 | | | | | | 4,608 | | | |
| | | | | | | | | | | | | | |
Total client balances (4) | | $ | 301,512 | | | | | $ | 357,575 | | | | | $ | 301,512 | | | | | $ | 301,151 | | | | | $ | 308,366 | | | | | $ | 344,004 | | | | | $ | 357,575 | | | |
| | | | | | | | | | | | | | |
Columbia Management Performance Metrics | | | | | | | | | | | | | | | | | | | | | | | | | | | | | | | | | | | | | | | | | | |
| | | | | | | | | | | | | | |
# of 4 or 5 Star Funds by Morningstar | | | 47 | | | | | | 50 | | | | | | 47 | | | | | | 49 | | | | | | 53 | | | | | | 53 | | | | | | 50 | | | |
| | | | | | | | | | | | | | |
% of Assets Under Management in 4 or 5 Star Rated Funds (5) | | | 46 | | | % | | | 64 | | | % | | | 46 | | | % | | | 49 | | | % | | | 62 | | | % | | | 64 | | | % | | | 64 | | | % |
| (1) | The elimination of assets under management that are managed by two lines of business. |
| (2) | The January 1, 2009 acquisition of Merrill Lynch contributed $1.0 trillion to client brokerage assets. |
| (3) | Financial advisor productivity is defined as annualized total revenue (excluding residual net interest income) divided by the total number of financial advisors. The decline in Financial Advisor productivity in the first quarter 2009 compared to previous quarters results from the inclusion of Merrill Lynch financial advisors. Legacy Bank of America financial advisors historically have had higher amounts of credit and banking activity in their portfolios. |
| (4) | Client balances are defined as deposits, assets under management, client brokerage assets and other assets in custody. |
| (5) | Results shown are defined by Columbia Management’s calculation using Morningstar’s Overall Rating criteria for 4 & 5 star rating. The assets under management of the Columbia Funds that had a 4 & 5 star rating were totaled then divided by the assets under management of all the funds in the ranking. |
Certain prior period amounts have been reclassified among the segments to conform to the current period presentation.
Information for periods beginning July 1, 2008 includes the Countrywide acquisition. Information for periods beginning January 1, 2009 includes the
Merrill Lynch acquisition. Prior periods have not been restated.
| | |
| This information is preliminary and based on company data available at the time of the presentation. | | 32 |
Bank of America Corporation and Subsidiaries
All Other Results(1, 2)
(Dollars in millions)
| | | | | | | | | | | | | | | | | | | | | | | | | | | | |
| | | Six Months Ended
June 30 | | | Second
Quarter
2009 | | | First
Quarter
2009 | | | Fourth
Quarter
2008 | | | Third
Quarter
2008 | | | Second
Quarter
2008 | |
| | | 2009 | | | 2008 | | | | | | |
Net interest income(3) | | $ | (3,477 | ) | | $ | (3,771 | ) | | $ | (1,588 | ) | | $ | (1,889 | ) | | $ | (1,857 | ) | | $ | (2,326 | ) | | $ | (1,913 | ) |
Noninterest income: | | | | | | | | | | | | | | | | | | | | | | | | | | | | |
Card income | | | 256 | | | | 1,259 | | | | (278 | ) | | | 534 | | | | 368 | | | | 539 | | | | 596 | |
Equity investment income (loss) | | | 7,305 | | | | 977 | | | | 5,979 | | | | 1,326 | | | | (388 | ) | | | (327 | ) | | | 710 | |
Gains (losses) on sales of debt securities | | | 2,143 | | | | 351 | | | | 672 | | | | 1,471 | | | | 783 | | | | (3 | ) | | | 131 | |
All other income (loss) | | | (1,706 | ) | | | (349 | ) | | | (4,298 | ) | | | 2,592 | | | | (283 | ) | | | 112 | | | | (87 | ) |
| | �� | | | | | | | | | | | | | | | | | | | | | | | | | | |
Total noninterest income | | | 7,998 | | | | 2,238 | | | | 2,075 | | | | 5,923 | | | | 480 | | | | 321 | | | | 1,350 | |
| | | | | | | | | | | | | | | | | | | | | | | | | | | | |
Total revenue, net of interest expense | | | 4,521 | | | | (1,533 | ) | | | 487 | | | | 4,034 | | | | (1,377 | ) | | | (2,005 | ) | | | (563 | ) |
| | | | | | | |
Provision for credit losses(4) | | | (686 | ) | | | (2,161 | ) | | | (9 | ) | | | (677 | ) | | | (613 | ) | | | (996 | ) | | | (1,033 | ) |
Merger and restructuring charges | | | 1,594 | | | | 382 | | | | 829 | | | | 765 | | | | 306 | | | | 247 | | | | 212 | |
All other noninterest expense | | | 932 | | | | 253 | | | | 642 | | | | 290 | | | | 187 | | | | (24 | ) | | | 74 | |
| | | | | | | | | | | | | | | | | | | | | | | | | | | | |
Income (loss) before income taxes | | | 2,681 | | | | (7 | ) | | | (975 | ) | | | 3,656 | | | | (1,257 | ) | | | (1,232 | ) | | | 184 | |
Income tax expense (benefit)(3) | | | (979 | ) | | | 6 | | | | (1,732 | ) | | | 753 | | | | (520 | ) | | | (538 | ) | | | (42 | ) |
| | | | | | | | | | | | | | | | | | | | | | | | | | | | |
Net income (loss) | | $ | 3,660 | | | $ | (13 | ) | | $ | 757 | | | $ | 2,903 | | | $ | (737 | ) | | $ | (694 | ) | | $ | 226 | |
| | | | | | | | | | | | | | | | | | | | | | | | | | | | |
| | | | | | | |
Balance sheet | | | | | | | | | | | | | | | | | | | | | |
| | | | | | | |
Average | | | | | | | | | | | | | | | | | | | | | | | | | | | | |
Total loans and leases | | $ | 163,770 | | | $ | 125,695 | | | $ | 159,142 | | | $ | 168,450 | | | $ | 145,238 | | | $ | 146,303 | | | $ | 117,504 | |
Total deposits | | | 108,757 | | | $ | 105,109 | | | | 108,079 | | | | 109,447 | | | | 111,821 | | | | 105,368 | | | | 96,998 | |
| | | | | | | |
Period end | | | | | | | | | | | | | | | | | | | | | | | | | | | | |
Total loans and leases | | $ | 153,008 | | | $ | 95,826 | | | $ | 153,008 | | | $ | 165,534 | | | $ | 136,160 | | | $ | 146,363 | | | $ | 95,826 | |
Total deposits | | | 106,127 | | | | 93,418 | | | | 106,127 | | | | 93,702 | | | | 87,520 | | | | 99,913 | | | | 93,418 | |
| (1) | All Other consists of equity investment activities including Global Principal Investments, Corporate Investments and Strategic Investments, the residential mortgage portfolio associated with ALM activities, the residual impact of cost allocation processes, merger and restructuring charges, intersegment eliminations and the results of certain businesses that are expected to be or have been sold or are in the process of being liquidated. All Other also includes certain amounts associated with ALM activities, including the residual impact of funds transfer pricing allocation methodologies, amounts associated with the change in the value of derivatives used as economic hedges of interest rate and foreign exchange rate fluctuations that do not qualify for SFAS No. 133 “Accounting for Derivative instruments and Hedging Activities, as amended” hedge accounting treatment, foreign exchange rate fluctuations related to SFAS No. 52, “Foreign Currency Translation” revaluation of foreign-denominated debt issuances, certain gains (losses) on sales of whole mortgage loans, and gains (losses) on sales of debt securities. All Other also includes adjustments to noninterest income and income tax expense to remove the FTE impact of items (primarily low-income housing tax credits) that have been grossed up within noninterest income to a FTE amount in the business segments. In addition, All Other includes the offsetting securitization impact to present Global Card Services on a managed basis. (See Exhibit A: Non-GAAP Reconciliations - All Other - Reconciliation on page 46). |
| (2) | Effective January 1, 2009, as part of the Merrill Lynch acquisition, All Other includes the results of First Republic Bank as well as fair value adjustments related to certain Merrill Lynch structured notes. |
| (3) | Fully taxable-equivalent basis |
| (4) | Provision for credit losses represents provision for credit losses in All Other combined with the Global Card Services securitization offset. |
Certain prior period amounts have been reclassified among the segments to conform to the current period presentation.
Information for periods beginning July 1, 2008 includes the Countrywide acquisition. Information for periods beginning January 1, 2009 includes the
Merrill Lynch acquisition. Prior periods have not been restated.
| | |
| This information is preliminary and based on company data available at the time of the presentation. | | 33 |
Bank of America Corporation and Subsidiaries
Equity Investments
(Dollars in millions)
| | | | | | | | | | | | | | | | | | | | |
| | | Global Principal Investments Exposures | | Equity
Investment
Income
(Loss) | |
| | | June 30, 2009 | | March 31,
2009 | | June 30, 2009 | |
| | | Book
Value | | Unfunded
Commitments | | Total | | Total | | Three months
ended | | | Six months
ended | |
Global Principal Investments: | | | | | | | | | | | | | | | | | | | | |
Global Private Equity | | $ | 4,289 | | $ | 232 | | $ | 4,521 | | $ | 3,777 | | $ | 399 | | | $ | 44 | |
Global Real Estate | | | 2,486 | | | 460 | | | 2,946 | | | 2,785 | | | (52 | ) | | | (85 | ) |
Global Strategic Capital | | | 4,360 | | | 2,052 | | | 6,412 | | | 6,515 | | | (41 | ) | | | (93 | ) |
Legacy/Other Investments | | | 751 | | | 65 | | | 816 | | | 852 | | | (2 | ) | | | (28 | ) |
| | | | | | | | | | | | | | | | | | | | |
Total Global Principal Investments | | $ | 11,886 | | $ | 2,809 | | $ | 14,695 | | $ | 13,929 | | $ | 304 | | | $ | (162 | ) |
| | | | | | | | | | | | | | | | | | | | |
Components of Equity Investment Income (Loss)
(Dollars in millions)
| | | | | | | | | | | | | | | | | | | | | | | | | | | | |
| | | Six Months Ended
June 30 | | | Second
Quarter
2009 (1) | | | First
Quarter
2009 (1) | | | Fourth
Quarter
2008 | | | Third
Quarter
2008 | | | Second
Quarter
2008 | |
| | | 2009 | | | 2008 | | | | | | |
Global Principal Investments | | $ | (162 | ) | | $ | 308 | | | $ | 304 | | | $ | (466 | ) | | $ | (363 | ) | | $ | (29 | ) | | $ | 296 | |
Corporate Investments | | | (262 | ) | | | 144 | | | | 10 | | | | (272 | ) | | | (295 | ) | | | (369 | ) | | | 112 | |
Strategic and other investments(1) | | | 7,729 | | | | 525 | | | | 5,665 | | | | 2,064 | | | | 270 | | | | 71 | | | | 302 | |
| | | | | | | | | | | | | | | | | | | | | | | | | | | | |
Total equity investment income (loss) included in All Other | | | 7,305 | | | | 977 | | | | 5,979 | | | | 1,326 | | | | (388 | ) | | | (327 | ) | | | 710 | |
Total equity investment income (loss) included in the business segments | | | (160 | ) | | | 669 | | | | (36 | ) | | | (124 | ) | | | (403 | ) | | | 11 | | | | (118 | ) |
| | | | | | | | | | | | | | | | | | | | | | | | | | | | |
Total consolidated equity investment income (loss) | | $ | 7,145 | | | $ | 1,646 | | | $ | 5,943 | | | $ | 1,202 | | | $ | (791 | ) | | $ | (316 | ) | | $ | 592 | |
| | | | | | | | | | | | | | | | | | | | | | | | | | | | |
| (1) | Strategic and other investments includes a $5.3 billion and $1.9 billion pre-tax gain on sales of shares of China Construction Bank for the three months ending June 30, 2009 and March 31, 2009, respectively. |
Certain prior period amounts have been reclassified among the segments to conform to the current period presentation.
Information for periods beginning July 1, 2008 includes the Countrywide acquisition. Information for period beginning January 1, 2009 includes the
Merrill Lynch acquisition. Prior periods have not been restated.
| | |
| This information is preliminary and based on company data available at the time of the presentation. | | 34 |
Bank of America Corporation and Subsidiaries
Outstanding Loans and Leases
(Dollars in millions)
| | | | | | | | | | |
| | | June 30
2009 | | March 31
2009 | | Increase
(Decrease) | |
Consumer | | | | | | | | | | |
Residential mortgage(1) | | $ | 245,967 | | $ | 261,583 | | $ | (15,616 | ) |
Home equity | | | 155,058 | | | 157,645 | | | (2,587 | ) |
Discontinued real estate(2) | | | 17,490 | | | 19,000 | | | (1,510 | ) |
Credit card - domestic | | | 48,948 | | | 51,309 | | | (2,361 | ) |
Credit card - foreign | | | 20,429 | | | 16,651 | | | 3,778 | |
Direct/Indirect consumer (3) | | | 99,154 | | | 99,696 | | | (542 | ) |
Other consumer(4) | | | 3,390 | | | 3,297 | | | 93 | |
| | | | | | | | | | |
Total consumer | | | 590,436 | | | 609,181 | | | (18,745 | ) |
| | | | | | | | | | |
| | | |
Commercial | | | | | | | | | | |
Commercial - domestic(5) | | | 217,571 | | | 229,779 | | | (12,208 | ) |
Commercial real estate(6) | | | 75,081 | | | 75,269 | | | (188 | ) |
Commercial lease financing | | | 22,387 | | | 22,017 | | | 370 | |
Commercial - foreign | | | 29,811 | | | 33,407 | | | (3,596 | ) |
| | | | | | | | | | |
Total commercial loans | | | 344,850 | | | 360,472 | | | (15,622 | ) |
Commercial loans measured at fair value(7) | | | 6,962 | | | 7,355 | | | (393 | ) |
| | | | | | | | | | |
Total commercial | | | 351,812 | | | 367,827 | | | (16,015 | ) |
| | | | | | | | | | |
Total loans and leases | | $ | 942,248 | | $ | 977,008 | | $ | (34,760 | ) |
| | | | | | | | | | |
| (1) | Includes foreign residential mortgages of $710 million and $651 million at June 30, 2009 and March 31, 2009. |
| (2) | At June 30, 2009 and March 31, 2009, includes $15.9 billion and $17.3 billion of pay option loans, and $1.6 billion and $1.7 billion of subprime loans obtained as part of the acquisition of Countrywide. The Corporation no longer originates these products. |
| (3) | Includes dealer financial services of $40.9 billion and $40.1 billion, consumer lending of $24.2 billion and $26.6 billion, and securities based lending margin loans of $11.0 billion and $10.4 billion at June 30, 2009 and March 31, 2009. In addition, includes foreign consumer loans of $7.7 billion and $7.5 billion at June 30, 2009 and March 31, 2009. |
| (4) | Includes consumer finance loans of $2.4 billion and $2.5 billion, and other foreign consumer loans of $721 million and $618 million at June 30, 2009 and March 31, 2009. |
| (5) | Includes small business commercial - domestic loans, primarily card related, of $18.1 billion and $18.8 billion at June 30, 2009 and March 31, 2009. |
| (6) | Includes domestic commercial real estate loans of $71.6 billion and $73.0 billion, and foreign commercial real estate loans of $3.5 billion and $2.2 billion at June 30, 2009 and March 31, 2009. |
| (7) | Certain commercial loans are measured at fair value in accordance with SFAS 159 and include commercial - domestic loans of $4.4 billion and $4.8 billion, commercial - foreign loans of $2.5 billion and $2.5 billion, and commercial real estate loans of $123 million and $89 million at June 30, 2009 and March 31, 2009. |
Certain prior period amounts have been reclassified to conform to current period presentation.
Information for periods beginning July 1, 2008 includes the Countrywide acquisition. Information for periods beginning January 1, 2009 includes the
Merrill Lynch acquisition. Prior periods have not been restated.
| | |
| This information is preliminary and based on company data available at the time of the presentation. | | 35 |
Bank of America Corporation and Subsidiaries
Quarterly Average Loans and Leases by Business Segment
(Dollars in millions)
| | | | | | | | | | | | | | | | | | | | | | | | | | | | | |
| | | Second Quarter 2009 | |
| | | Total
Corporation | | | | Deposits | | | Global
Card
Services (1) | | Home
Loans &
Insurance | | Global
Banking | | Global
Markets | | | GWIM | | All Other (1) | |
Consumer | | | | | | | | | | | | | | | | | | | | | | | | | | | | | |
Residential mortgage | | $ | 253,803 | | | | $ | — | | | $ | — | | $ | — | | $ | 382 | | $ | 650 | | | $ | 36,214 | | $ | 216,557 | |
Home equity | | | 156,599 | | | | | — | | | | — | | | 129,420 | | | 1,052 | | | — | | | | 19,556 | | | 6,571 | |
Discontinued real estate | | | 18,309 | | | | | — | | | | — | | | — | | | — | | | — | | | | — | | | 18,309 | |
Credit card - domestic | | | 51,721 | | | | | — | | | | 143,209 | | | — | | | — | | | — | | | | — | | | (91,488 | ) |
Credit card - foreign | | | 18,825 | | | | | — | | | | 29,383 | | | — | | | — | | | — | | | | — | | | (10,558 | ) |
Direct/Indirect consumer | | | 100,302 | | | | | 10,376 | | | | 27,172 | | | 69 | | | 41,233 | | | 5 | | | | 21,293 | | | 154 | |
Other consumer | | | 3,298 | | | | | 245 | | | | 655 | | | 18 | | | 9 | | | 2 | | | | 14 | | | 2,355 | |
| | | | | | | | | | | | | | | | | | | | | | | | | | | | | |
Total consumer | | | 602,857 | | | | | 10,621 | | | | 200,419 | | | 129,507 | | | 42,676 | | | 657 | | | | 77,077 | | | 141,900 | |
| | | | | | | | | |
Commercial | | | | | | | | | | | | | | | | | | | | | | | | | | | | | |
Commercial - domestic | | | 231,639 | | | | | 202 | | | | 18,381 | | | 1,990 | | | 164,673 | | | 11,817 | | | | 22,357 | | | 12,219 | |
Commercial real estate | | | 75,559 | | | | | 22 | | | | 196 | | | 12 | | | 64,609 | | | 1,888 | | | | 2,243 | | | 6,589 | |
Commercial lease financing | | | 22,026 | | | | | — | | | | — | | | — | | | 24,208 | | | 2 | | | | — | | | (2,184 | ) |
Commercial - foreign | | | 34,024 | | | | | — | | | | 1,369 | | | — | | | 27,051 | | | 4,915 | | | | 71 | | | 618 | |
| | | | | | | | | | | | | | | | | | | | | | | | | | | | | |
Total commercial | | | 363,248 | | | | | 224 | | | | 19,946 | | | 2,002 | | | 280,541 | | | 18,622 | | | | 24,671 | | | 17,242 | |
| | | | | | | | | | | | | | | | | | | | | | | | | | | | | |
Total loans and leases | | $ | 966,105 | | | | $ | 10,845 | | | $ | 220,365 | | $ | 131,509 | | $ | 323,217 | | $ | 19,279 | | | $ | 101,748 | | $ | 159,142 | |
| | | | | | | | | | | | | | | | | | | | | | | | | | | | | |
| |
| | | First Quarter 2009 | |
| | | Total
Corporation | | | | Deposits | | | Global
Card
Services(1) | | Home
Loans &
Insurance | | Global
Banking | | Global
Markets | | | GWIM | | All Other (1) | |
Consumer | | | | | | | | | | | | | | | | | | | | | | | | | | | | | |
Residential mortgage | | $ | 265,121 | | | | $ | — | | | $ | — | | $ | 485 | | $ | 455 | | $ | 546 | | | $ | 38,780 | | $ | 224,855 | |
Home equity | | | 158,575 | | | | | — | | | | — | | | 123,998 | | | 1,061 | | | — | | | | 26,582 | | | 6,934 | |
Discontinued real estate | | | 19,386 | | | | | — | | | | — | | | — | | | — | | | — | | | | — | | | 19,386 | |
Credit card - domestic | | | 58,960 | | | | | — | | | | 150,820 | | | — | | | — | | | — | | | | — | | | (91,860 | ) |
Credit card - foreign | | | 16,858 | | | | | — | | | | 27,670 | | | — | | | — | | | — | | | | — | | | (10,812 | ) |
Direct/Indirect consumer | | | 100,741 | | | | | 9,718 | | | | 29,279 | | | 96 | | | 41,201 | | | 130 | | | | 20,359 | | | (42 | ) |
Other consumer | | | 3,408 | | | | | 354 | | | | 580 | | | 579 | | | 21 | | | 2 | | | | 55 | | | 1,817 | |
| | | | | | | | | | | | | | | | | | | | | | | | | | | | | |
Total consumer | | | 623,049 | | | | | 10,072 | | | | 208,349 | | | 125,158 | | | 42,738 | | | 678 | | | | 85,776 | | | 150,278 | |
| | | | | | | | | |
Commercial | | | | | | | | | | | | | | | | | | | | | | | | | | | | | |
Commercial - domestic | | | 240,683 | | | | | 298 | | | | 18,725 | | | 1,515 | | | 174,548 | | | 10,213 | | | | 22,547 | | | 12,837 | |
Commercial real estate | | | 72,206 | | | | | 39 | | | | 166 | | | 12 | | | 62,532 | | | 1,050 | | | | 2,144 | | | 6,263 | |
Commercial lease financing | | | 22,056 | | | | | — | | | | — | | | — | | | 24,316 | | | — | | | | — | | | (2,260 | ) |
Commercial - foreign | | | 36,127 | | | | | — | | | | 1,221 | | | — | | | 26,840 | | | 6,666 | | | | 68 | | | 1,332 | |
| | | | | | | | | | | | | | | | | | | | | | | | | | | | | |
Total commercial | | | 371,072 | | | | | 337 | | | | 20,112 | | | 1,527 | | | 288,236 | | | 17,929 | | | | 24,759 | | | 18,172 | |
| | | | | | | | | | | | | | | | | | | | | | | | | | | | | |
Total loans and leases | | $ | 994,121 | | | | $ | 10,409 | | | $ | 228,461 | | $ | 126,685 | | $ | 330,974 | | $ | 18,607 | | | $ | 110,535 | | $ | 168,450 | |
| | | | | | | | | | | | | | | | | | | | | | | | | | | | | |
| |
| | | Second Quarter 2008 | |
| | | Total
Corporation | | | | Deposits | | | Global
Card
Services(1) | | Home
Loans &
Insurance | | Global
Banking | | Global
Markets | | | GWIM | | All Other (1) | |
Consumer | | | | | | | | | | | | | | | | | | | | | | | | | | | | | |
Residential mortgage | | $ | 256,164 | | | | $ | — | | | $ | — | | $ | — | | $ | 921 | | $ | (301 | ) | | $ | 35,469 | | $ | 220,075 | |
Home equity | | | 120,265 | | | | | — | | | | — | | | 90,882 | | | 891 | | | — | | | | 23,251 | | | 5,241 | |
Discontinued real estate | | | n/a | | | | | n/a | | | | n/a | | | n/a | | | n/a | | | n/a | | | | n/a | | | n/a | |
Credit card - domestic | | | 61,655 | | | | | — | | | | 152,614 | | | — | | | — | | | — | | | | — | | | (90,959 | ) |
Credit card - foreign | | | 16,566 | | | | | — | | | | 33,045 | | | — | | | — | | | — | | | | — | | | (16,479 | ) |
Direct/Indirect consumer | | | 82,593 | | | | | 6,999 | | | | 30,686 | | | 127 | | | 40,344 | | | — | | | | 5,255 | | | (818 | ) |
Other consumer | | | 3,953 | | | | | 116 | | | | 843 | | | 3 | | | 21 | | | 3 | | | | 28 | | | 2,939 | |
| | | | | | | | | | | | | | | | | | | | | | | | | | | | | |
Total consumer | | | 541,196 | | | | | 7,115 | | | | 217,188 | | | 91,012 | | | 42,177 | | | (298 | ) | | | 64,003 | | | 119,999 | |
| | | | | | | | | |
Commercial | | | | | | | | | | | | | | | | | | | | | | | | | | | | | |
Commercial - domestic | | | 219,537 | | | | | 182 | | | | 19,837 | | | 7 | | | 161,013 | | | 17,005 | | | | 21,924 | | | (431 | ) |
Commercial real estate | | | 62,810 | | | | | (11 | ) | | | 293 | | | 180 | | | 59,910 | | | 902 | | | | 1,564 | | | (28 | ) |
Commercial lease financing | | | 22,276 | | | | | — | | | | — | | | — | | | 24,287 | | | 81 | | | | — | | | (2,092 | ) |
Commercial - foreign | | | 32,820 | | | | | — | | | | 1,600 | | | — | | | 27,895 | | | 3,186 | | | | 83 | | | 56 | |
| | | | | | | | | | | | | | | | | | | | | | | | | | | | | |
Total commercial | | | 337,443 | | | | | 171 | | | | 21,730 | | | 187 | | | 273,105 | | | 21,174 | | | | 23,571 | | | (2,495 | ) |
| | | | | | | | | | | | | | | | | | | | | | | | | | | | | |
Total loans and leases | | $ | 878,639 | | | | $ | 7,286 | | | $ | 238,918 | | $ | 91,199 | | $ | 315,282 | | $ | 20,876 | | | $ | 87,574 | | $ | 117,504 | |
| | | | | | | | | | | | | | | | | | | | | | | | | | | | | |
| (1) | Global Card Services is presented on a managed basis with a corresponding offset recorded in All Other. |
n/a = not applicable
Certain prior period amounts have been reclassified among the segments to conform to the current period presentation.
Information for periods beginning July 1, 2008 includes the Countrywide acquisition. Information for periods beginning January 1, 2009 includes the
Merrill Lynch acquisition. Prior periods have not been restated.
| | |
| This information is preliminary and based on company data available at the time of the presentation. | | 36 |
Bank of America Corporation and Subsidiaries
Commercial Credit Exposure by Industry(1, 2, 3)
(Dollars in millions)
| | | | | | | | | | | | | | | | | | | | | | |
| | | Commercial Utilized | | | Total Commercial Committed | |
| | | June 30
2009 | | March 31
2009 | | Increase
(Decrease) | | | June 30
2009 | | | March 31
2009 | | | Increase
(Decrease) | |
| | | | | | |
Diversified financials | | $ | 74,089 | | $ | 88,675 | | $ | (14,586 | ) | | $ | 121,600 | | | $ | 142,112 | | | $ | (20,512 | ) |
Real estate(4) | | | 83,426 | | | 86,365 | | | (2,939 | ) | | | 103,560 | | | | 108,562 | | | | (5,002 | ) |
Government and public education | | | 44,432 | | | 46,149 | | | (1,717 | ) | | | 62,987 | | | | 65,806 | | | | (2,819 | ) |
Capital goods | | | 28,385 | | | 29,795 | | | (1,410 | ) | | | 53,870 | | | | 55,935 | | | | (2,065 | ) |
Healthcare equipment and services | | | 31,635 | | | 33,575 | | | (1,940 | ) | | | 47,382 | | | | 49,540 | | | | (2,158 | ) |
Retailing | | | 27,062 | | | 28,506 | | | (1,444 | ) | | | 45,729 | | | | 47,429 | | | | (1,700 | ) |
Consumer services | | | 28,688 | | | 29,576 | | | (888 | ) | | | 43,999 | | | | 44,679 | | | | (680 | ) |
Commercial services and supplies | | | 26,973 | | | 27,058 | | | (85 | ) | | | 38,755 | | | | 38,655 | | | | 100 | |
Materials | | | 20,278 | | | 23,515 | | | (3,237 | ) | | | 36,068 | | | | 40,113 | | | | (4,045 | ) |
Individuals and trusts | | | 26,648 | | | 24,921 | | | 1,727 | | | | 35,290 | | | | 33,861 | | | | 1,429 | |
Insurance | | | 26,077 | | | 32,385 | | | (6,308 | ) | | | 33,404 | | | | 40,032 | | | | (6,628 | ) |
Food, beverage and tobacco | | | 15,859 | | | 16,902 | | | (1,043 | ) | | | 28,843 | | | | 29,789 | | | | (946 | ) |
Utilities | | | 10,484 | | | 12,117 | | | (1,633 | ) | | | 26,860 | | | | 27,898 | | | | (1,038 | ) |
Banks | | | 21,416 | | | 32,408 | | | (10,992 | ) | | | 24,831 | | | | 36,277 | | | | (11,446 | ) |
Energy | | | 12,208 | | | 14,006 | | | (1,798 | ) | | | 24,776 | | | | 26,504 | | | | (1,728 | ) |
Media | | | 12,435 | | | 13,349 | | | (914 | ) | | | 23,539 | | | | 24,278 | | | | (739 | ) |
Transportation | | | 13,421 | | | 14,283 | | | (862 | ) | | | 19,554 | | | | 20,681 | | | | (1,127 | ) |
Religious and social organizations | | | 9,688 | | | 9,844 | | | (156 | ) | | | 12,530 | | | | 12,932 | | | | (402 | ) |
Consumer durables and apparel | | | 5,383 | | | 6,135 | | | (752 | ) | | | 10,198 | | | | 10,661 | | | | (463 | ) |
Telecommunication services | | | 3,892 | | | 4,894 | | | (1,002 | ) | | | 10,123 | | | | 11,257 | | | | (1,134 | ) |
Software and services | | | 3,880 | | | 4,429 | | | (549 | ) | | | 10,006 | | | | 10,144 | | | | (138 | ) |
Pharmaceuticals and biotechnology | | | 3,574 | | | 3,402 | | | 172 | | | | 9,913 | | | | 11,264 | | | | (1,351 | ) |
Technology hardware and equipment | | | 3,446 | | | 3,770 | | | (324 | ) | | | 9,902 | | | | 10,684 | | | | (782 | ) |
Food and staples retailing | | | 4,356 | | | 4,361 | | | (5 | ) | | | 7,367 | | | | 7,380 | | | | (13 | ) |
Automobiles and components | | | 3,269 | | | 3,314 | | | (45 | ) | | | 6,243 | | | | 6,235 | | | | 8 | |
Other | | | 6,049 | | | 6,071 | | | (22 | ) | | | 10,883 | | | | 12,154 | | | | (1,271 | ) |
Total commercial credit exposure by industry | | $ | 547,053 | | $ | 599,805 | | $ | (52,752 | ) | | $ | 858,212 | | | $ | 924,862 | | | $ | (66,650 | ) |
| | | | | | |
Net credit default protection purchased on total commitments(5) | | | | | | | | | | | | $ | (25,980 | ) | | $ | (22,674 | ) | | | | |
| (1) | Includes loans and leases, standby letters of credit and financial guarantees, derivative assets, assets held-for-sale, commercial letters of credit, bankers’ acceptances, securitized assets, foreclosed properties and other collateral acquired. Derivative assets are reported on a mark-to-market basis and have been reduced by the amount of cash collateral applied of $63.3 billion and $72.8 billion at June 30, 2009 and March 31, 2009. Not reflected in utilized and committed exposure is additional derivative collateral held of $11.5 billion and $16.9 billion which consists primarily of other marketable securities at June 30, 2009 and March 31, 2009. |
| (2) | Total commercial utilized and total commercial committed exposure includes loans and letters of credit measured at fair value in accordance with SFAS 159 and are comprised of loans outstanding of $7.0 billion and $7.4 billion and issued letters of credit at notional value of $2.1 billion and $2.2 billion at June 30, 2009 and March 31, 2009. In addition, total commercial committed exposure includes unfunded loan commitments at notional value of $24.7 billion and $25.4 billion at June 30, 2009 and March 31, 2009. |
| (3) | Includes small business commercial - domestic exposure. |
| (4) | Industries are viewed from a variety of perspectives to best isolate the perceived risks. For purposes of this table, the real estate industry is defined based upon the borrowers’ or counterparties’ primary business activity using operating cash flow and primary source of repayment as key factors. |
| (5) | Represents net notional credit protection purchased. |
Certain prior period amounts have been reclassified to conform to current period presentation.
Information for periods beginning July 1, 2008 include the Countrywide acquisition. Information for the period beginning January 1, 2009 includes the
Merrill Lynch acquisition. Prior periods have not been restated.
| | |
| This information is preliminary and based on company data available at the time of the presentation. | | 37 |
Bank of America Corporation and Subsidiaries
Net Credit Default Protection by Maturity Profile(1)
| | | | | | | | |
| | | June 30
2009 | | | | March 31
2009 | | |
Less than or equal to one year | | 9 | | % | | 10 | | % |
Greater than one year and less than or equal to five years | | 85 | | | | 90 | | |
Greater than five years | | 6 | | | | — | | |
Total net credit default protection | | 100 | | % | | 100 | | % |
| (1) | In order to mitigate the cost of purchasing credit protection, credit exposure can be added by selling credit protection. The distribution of maturities for net credit default protection purchased is shown above. |
Net Credit Default Protection by Credit Exposure Debt Rating(1)
(Dollars in millions)
| | | | | | | | | | | | | | | | | | |
| | | June 30, 2009 | | | | | March 31, 2009 | | | |
| Ratings(2) | | Net Notional | | | Percent | | | | | Net Notional | | | Percent | | | |
AAA | | $ | 35 | | | (0.1 | ) | | % | | $ | 30 | | | (0.1 | ) | | % |
AA | | | (1,180 | ) | | 4.5 | | | | | | (1,498 | ) | | 6.6 | | | |
A | | | (7,198 | ) | | 27.7 | | | | | | (6,871 | ) | | 30.3 | | | |
BBB | | | (11,786 | ) | | 45.4 | | | | | | (11,211 | ) | | 49.3 | | | |
BB | | | (3,057 | ) | | 11.8 | | | | | | (2,826 | ) | | 12.5 | | | |
B | | | (891 | ) | | 3.4 | | | | | | (968 | ) | | 4.3 | | | |
CCC and below | | | (1,921 | ) | | 7.4 | | | | | | (1,805 | ) | | 8 | | | |
NR(3) | | | 18 | | | (0.1 | ) | | | | | 2,475 | | | (10.9 | ) | | |
Total net credit default protection(4) | | $ | (25,980 | ) | | 100.0 | | | % | | $ | (22,674 | ) | | 100.0 | | | % |
| (1) | In order to mitigate the cost of purchasing credit protection, credit exposure can be added by selling credit protection. The distribution of debt rating for net notional credit default protection purchased is shown as a negative and the net notional credit protection sold is shown as a positive amount. |
| (2) | The Corporation considers ratings of BBB- or higher to meet the definition of investment grade. |
| (3) | In addition to names which have not been rated, “NR” includes $157 million and $2.6 billion in net credit default swap index positions at June 30, 2009 and March 31, 2009. While index positions are principally investment grade, credit default swaps indices include names in and across each of the ratings categories. |
| (4) | At June 30, 2009 and March 31, 2009, included net notional credit default protection purchased of $12.1 billion and $12.9 billion in single name credit default swaps that were acquired as part of the Merrill Lynch acquisition. |
Certain prior period amounts have been reclassified to conform to current period presentation.
Information for periods beginning July 1, 2008 includes the Countrywide acquisition. Information for periods beginning January 1, 2009 includes the
Merrill Lynch acquisition. Prior periods have not been restated.
| | |
| This information is preliminary and based on company data available at the time of the presentation. | | 38 |
Bank of America Corporation and Subsidiaries
Selected Emerging Markets(1)
(Dollars in millions)
| | | | | | | | | | | | | | | | | | | | | | | | | |
| | | Loans and Leases,
and Loan
Commitments | | Other
Financing (2) | | Derivative
Assets(3) | | Securities /
Other
Investments (4) | | Total
Cross-border
Exposure (5) | | Local Country
Exposure Net of
Local
Liabilities(6) | | Total Emerging
Markets Exposure
June 30,
2009 | | Increase
(Decrease) from
March 31,
2009 | |
Region/Country | | | | | | | | | | | | | | | | | | | | | | | | | |
Asia Pacific | | | | | | | | | | | | | | | | | | | | | | | | | |
China(7) | | $ | 492 | | $ | 218 | | $ | 777 | | $ | 10,679 | | $ | 12,166 | | $ | — | | $ | 12,166 | | $ | (7,514 | ) |
South Korea | | | 339 | | | 1,169 | | | 2,297 | | | 2,337 | | | 6,142 | | | 191 | | | 6,333 | | | (1,180 | ) |
India | | | 1,404 | | | 511 | | | 902 | | | 1,874 | | | 4,691 | | | 1,247 | | | 5,938 | | | 21 | |
Singapore | | | 637 | | | 165 | | | 336 | | | 1,072 | | | 2,210 | | | — | | | 2,210 | | | 299 | |
Hong Kong | | | 561 | | | 137 | | | 431 | | | 329 | | | 1,458 | | | — | | | 1,458 | | | (74 | ) |
Philippines | | | 24 | | | 28 | | | 51 | | | 474 | | | 577 | | | 1 | | | 578 | | | 157 | |
Taiwan | | | 259 | | | 20 | | | 90 | | | 114 | | | 483 | | | 87 | | | 570 | | | (371 | ) |
Other Asia Pacific(8) | | | 164 | | | 43 | | | 200 | | | 509 | | | 916 | | | 46 | | | 962 | | | (7 | ) |
Total Asia Pacific | | | 3,880 | | | 2,291 | | | 5,084 | | | 17,388 | | | 28,643 | | | 1,572 | | | 30,215 | | | (8,669 | ) |
Latin America | | | | | | | | | | | | | | | | | | | | | | | | | |
Brazil(9) | | | 480 | | | 831 | | | 380 | | | 5,109 | | | 6,800 | | | 375 | | | 7,175 | | | 993 | |
Mexico(10) | | | 2,124 | | | 246 | | | 395 | | | 2,866 | | | 5,631 | | | 106 | | | 5,737 | | | 128 | |
Chile | | | 230 | | | 476 | | | 421 | | | 66 | | | 1,193 | | | 3 | | | 1,196 | | | 29 | |
Other Latin America(8) | | | 126 | | | 264 | | | 471 | | | 520 | | | 1,381 | | | 144 | | | 1,525 | | | (170 | ) |
Total Latin America | | | 2,960 | | | 1,817 | | | 1,667 | | | 8,561 | | | 15,005 | | | 628 | | | 15,633 | | | 980 | |
Middle East and Africa | | | | | | | | | | | | | | | | | | | | | | | | | |
South Africa | | | 181 | | | 11 | | | 54 | | | 902 | | | 1,148 | | | — | | | 1,148 | | | (27 | ) |
United Arab Emirates | | | 387 | | | 36 | | | 163 | | | 73 | | | 659 | | | — | | | 659 | | | (156 | ) |
Other Middle East and Africa(8) | | | 537 | | | 65 | | | 223 | | | 553 | | | 1,378 | | | — | | | 1,378 | | | (315 | ) |
Total Middle East and Africa | | | 1,105 | | | 112 | | | 440 | | | 1,528 | | | 3,185 | | | — | | | 3,185 | | | (498 | ) |
Central and Eastern Europe | | | | | | | | | | | | | | | | | | | | | | | | | |
Russian Federation | | | 256 | | | — | | | 171 | | | 304 | | | 731 | | | — | | | 731 | | | (109 | ) |
Other Central and Eastern Europe(8) | | | 675 | | | 165 | | | 372 | | | 527 | | | 1,739 | | | — | | | 1,739 | | | (38 | ) |
Total Central and Eastern Europe | | | 931 | | | 165 | | | 543 | | | 831 | | | 2,470 | | | — | | | 2,470 | | | (147 | ) |
Total emerging market exposure | | $ | 8,876 | | $ | 4,385 | | $ | 7,734 | | $ | 28,308 | | $ | 49,303 | | $ | 2,200 | | $ | 51,503 | | $ | (8,334 | ) |
| (1) | There is no generally accepted definition of emerging markets. The definition that we use includes all countries in Asia Pacific excluding Japan, Australia and New Zealand; all countries in Latin America excluding Cayman Islands and Bermuda; all countries in Middle East and Africa; and all countries in Central and Eastern Europe excluding Greece. There was no emerging market exposure included in the portfolio measured at fair value in accordance with SFAS 159 at June 30, 2009 and March 31, 2009. |
| (2) | Includes acceptances, standby letters of credit, commercial letters of credit and formal guarantees. |
| (3) | Derivative assets are reported on a mark-to-market basis and have been reduced by the amount of cash collateral applied of $774 million and $635 million at June 30, 2009 and March 31, 2009. At June 30, 2009 and March 31, 2009, there were $863 million and $1.1 billion of other marketable securities collateralizing derivative assets for which credit risk has not been reduced. |
| (4) | Generally, cross-border resale agreements are presented based on the domicile of the counterparty, consistent with Federal Financial Institutions Examination Council (FFIEC) reporting requirements. Cross-border resale agreements where the underlying securities are U.S. Treasury securities, in which case the domicile is the U.S., are excluded from this presentation. |
| (5) | Cross-border exposure includes amounts payable to the Corporation by borrowers or counterparties with a country of residence other than the one in which the credit is booked, regardless of the currency in which the claim is denominated, consistent with FFIEC reporting requirements. |
| (6) | Local country exposure includes amounts payable to the Corporation by borrowers with a country of residence in which the credit is booked, regardless of the currency in which the claim is denominated. Local funding or liabilities are subtracted from local exposures consistent with FFIEC reporting requirements. Total amount of available local liabilities funding local country exposure at June 30, 2009 was $15.3 billion compared to $17.6 billion at March 31, 2009. Local liabilities at June 30, 2009 in Asia Pacific and Latin America were $14.8 billion and $451 million, of which $7.6 billion were in Singapore, $2.0 billion in Hong Kong, $1.4 billion in India, $1.3 billion in South Korea, $1.3 billion in China, and $521 million in Taiwan. There were no other countries with available local liabilities funding local country exposure greater than $500 million. |
| (7) | Securities/Other Investments include an investment of $9.2 billion in China Construction Bank (CCB). |
| (8) | No country included in Other Asia Pacific, Other Latin America, Other Middle East and Africa, or Other Central and Eastern Europe had total foreign exposure of more than $500 million. |
| (9) | Securities/Other Investments include an investment of $3.5 billion in Banco Itaú Holding Financeira S.A. |
| (10) | Securities/Other Investments include an investment of $2.4 billion in Grupo Financiero Santander, S.A. |
Certain prior period amounts have been reclassified to conform to current period presentation.
Information for periods beginning July 1, 2008 includes the Countrywide acquisition. Information for periods beginning January 1, 2009 includes the
Merrill Lynch acquisition. Prior periods have not been restated.
| | |
| This information is preliminary and based on company data available at the time of the presentation. | | 39 |
Bank of America Corporation and Subsidiaries
Nonperforming Assets
(Dollars in millions)
| | | | | | | | | | | | | | | | | | | | | | | | | |
| | | June 30,
2009 | | | | March 31,
2009 | | | | December 31,
2008 | | | | September 30,
2008 | | | | June 30,
2008 | | |
Residential mortgage | | $ | 13,615 | | | | $ | 10,846 | | | | $ | 7,057 | | | | $ | 4,638 | | | | $ | 3,269 | | |
Home equity | | | 3,826 | | | | | 3,497 | | | | | 2,637 | | | | | 2,049 | | | | | 1,851 | | |
Discontinued real estate | | | 181 | | | | | 129 | | | | | 77 | | | | | 33 | | | | | n/a | | |
Direct/Indirect consumer | | | 57 | | | | | 29 | | | | | 26 | | | | | 13 | | | | | 11 | | |
Other consumer | | | 93 | | | | | 91 | | | | | 91 | | | | | 89 | | | | | 89 | | |
| | | | | | | | | | | | | | | | | | | | | | | | | |
Total consumer | | | 17,772 | | | | | 14,592 | | | | | 9,888 | | | | | 6,822 | | | | | 5,220 | | |
| | | | | | | | | | | | | | | | | | | | | | | | | |
| | | | | | | | | | |
Commercial - domestic(1) | | | 4,204 | | | | | 3,022 | | | | | 2,040 | | | | | 1,566 | | | | | 1,079 | | |
Commercial real estate | | | 6,651 | | | | | 5,662 | | | | | 3,906 | | | | | 3,090 | | | | | 2,616 | | |
Commercial lease financing | | | 104 | | | | | 104 | | | | | 56 | | | | | 35 | | | | | 40 | | |
Commercial - foreign | | | 250 | | | | | 300 | | | | | 290 | | | | | 48 | | | | | 48 | | |
| | | | | | | | | | | | | | | | | | | | | | | | | |
| | | 11,209 | | | | | 9,088 | | | | | 6,292 | | | | | 4,739 | | | | | 3,783 | | |
Small business commercial-domestic | | | 200 | | | | | 224 | | | | | 205 | | | | | 183 | | | | | 153 | | |
| | | | | | | | | | | | | | | | | | | | | | | | | |
Total commercial | | | 11,409 | | | | | 9,312 | | | | | 6,497 | | | | | 4,922 | | | | | 3,936 | | |
| | | | | | | | | | | | | | | | | | | | | | | | | |
Total nonperforming loans and leases | | | 29,181 | | | | | 23,904 | | | | | 16,385 | | | | | 11,744 | | | | | 9,156 | | |
Foreclosed properties | | | 1,801 | | | | | 1,728 | | | | | 1,827 | | | | | 1,832 | | | | | 593 | | |
| | | | | | | | | | | | | | | | | | | | | | | | | |
Total nonperforming assets(2, 3, 4) | | $ | 30,982 | | | | $ | 25,632 | | | | $ | 18,212 | | | | $ | 13,576 | | | | $ | 9,749 | | |
| | | | | | | | | | | | | | | | | | | | | | | | | |
| | | | | | | | | | |
Loans past due 90 days or more and still accruing(2, 4, 5) | | $ | 6,403 | | | | $ | 6,344 | | | | $ | 5,414 | | | | $ | 4,819 | | | | $ | 4,548 | | |
| | | | | | | | | | |
Nonperforming assets/Total assets(6) | | | 1.38 | | % | | | 1.11 | | % | | | 1.00 | | % | | | 0.74 | | % | | | 0.57 | | % |
| | | | | | | | | | |
Nonperforming assets/Total loans, leases and foreclosed properties (6) | | | 3.31 | | | | | 2.64 | | | | | 1.96 | | | | | 1.45 | | | | | 1.13 | | |
| | | | | | | | | | |
Nonperforming loans and leases/Total loans and leases outstanding (6) | | | 3.12 | | | | | 2.47 | | | | | 1.77 | | | | | 1.25 | | | | | 1.06 | | |
| | | | | | | | | | |
Allowance for credit losses: | | | | | | | | | | | | | | | | | | | | | | | | | |
Allowance for loan and lease losses | | $ | 33,785 | | | | $ | 29,048 | | | | $ | 23,071 | | | | $ | 20,346 | | | | $ | 17,130 | | |
Reserve for unfunded lending commitments(7) | | | 1,992 | | | | | 2,102 | | | | | 421 | | | | | 427 | | | | | 507 | | |
| | | | | | | | | | | | | | | | | | | | | | | | | |
Total allowance for credit losses | | $ | 35,777 | | | | $ | 31,150 | | | | $ | 23,492 | | | | $ | 20,773 | | | | $ | 17,637 | | |
| | | | | | | | | | | | | | | | | | | | | | | | | |
| | | | | | | | | | |
Allowance for loan and lease losses/Total loans and leases outstanding(6, 8) | | | 3.61 | | % | | | 3.00 | | % | | | 2.49 | | % | | | 2.17 | | % | | | 1.98 | | % |
| | | | | | | | | | |
Allowance for loan and lease losses/Total nonperforming loans and leases (6, 8) | | | 116 | | | | | 122 | | | | | 141 | | | | | 173 | | | | | 187 | | |
| | | | | | | | | | |
Commercial utilized reservable criticized exposure(9) | | $ | 57,180 | | | | $ | 48,660 | | | | $ | 36,937 | | | | $ | 31,009 | | | | $ | 25,998 | | |
| | | | | | | | | | |
Commercial utilized reservable criticized exposure/Commercial utilized exposure(9) | | | 13.53 | | % | | | 11.13 | | % | | | 8.90 | | % | | | 7.45 | | % | | | 6.23 | | % |
| (1) | Excludes small business commercial - domestic loans. |
| (2) | Balances do not include loans accounted for in accordance with SOP 03-3 even though the customer may be contractually past due. Loans accounted for in accordance with SOP 03-3 were written down to fair value upon acquisition and accrete interest income over the remaining life of the loan. |
| (3) | Balances do not include nonperforming loans held-for-sale of $2.6 billion, $2.5 billion, $1.3 billion, $848 million and $388 million at June 30, 2009, March 31, 2009, December 31, 2008, September 30, 2008 and June 30, 2008, respectively. |
| (4) | Balances do not include loans measured at fair value in accordance with SFAS 159. At June 30, 2009, March 31, 2009, December 31, 2008, September 30, 2008 and June 30, 2008, there were no nonperforming loans measured at fair value in accordance with SFAS 159. At June 30, 2008, there were $81 million of loans past due 90 days or more and still accruing interest measured at fair value in accordance with SFAS 159. At June 30, 2009, March 31, 2009, December 31, 2008 and September 30, 2008, there were no loans past due 90 days or more and still accruing interest measured at fair value in accordance with SFAS 159. |
| (5) | Balances do not include loans held-for-sale past due 90 days or more and still accruing interest included in other assets of $0, $18 million, $31 million, $138 million and $32 million at June 30, 2009, March 31, 2009, December 31, 2008, September 30, 2008 and June 30, 2008, respectively. |
| (6) | Ratios do not include loans measured at fair value in accordance with SFAS 159 of $7.0 billion, $7.4 billion, $5.4 billion, $5.4 billion and $5.0 billion at June 30, 2009, March 31, 2009, December 31, 2008, September 30, 2008 and June 30, 2008, respectively. |
| (7) | The majority of the increase from December 31, 2008 relates to the fair value of the acquired Merrill Lynch unfunded lending commitments, excluding commitments accounted for under SFAS 159. |
| (8) | The Corporation accounts for acquired impaired loans in accordance with SOP 03-3. |
| (9) | Criticized exposure and ratios exclude assets held-for-sale, exposure measured at fair value in accordance with SFAS 159 and other nonreservable exposure. Including assets held-for-sale, other nonreservable exposure and commercial loans measured at fair value, the ratios would have been 14.93 percent, 12.63 percent, 9.45 percent, 7.94 percent and 6.62 percent at June 30, 2009, March 31, 2009, December 31, 2008, September 30, 2008 and June 30, 2008, respectively. |
n/a = not applicable
Loans are classified as domestic or foreign based upon the domicile of the borrower.
Certain prior period amounts have been reclassified to conform to current period presentation.
Information for periods beginning July 1, 2008 includes the Countrywide acquisition. Information for periods beginning January 1, 2009 includes the
Merrill Lynch acquisition. Prior periods have not been restated.
| | |
| This information is preliminary and based on company data available at the time of the presentation. | | 40 |
Bank of America Corporation and Subsidiaries
Nonperforming Asset Activity
(Dollars in millions)
| | | | | | | | | | | | | | | | | | | | |
| | | Second
Quarter
2009 | | | First
Quarter
2009 | | | Fourth
Quarter
2008 | | | Third
Quarter
2008 | | | Second
Quarter
2008 | |
Nonperforming Consumer Loans and Leases: | | | | | | | | | | | | | | | | | | | | |
Balance, beginning of period | | $ | 14,592 | | | $ | 9,888 | | | $ | 6,822 | | | $ | 5,220 | | | $ | 4,459 | |
Additions(1) | | | 6,807 | | | | 8,218 | | | | 5,444 | | | | 3,518 | | | | 2,540 | |
Paydowns and payoffs | | | (172 | ) | | | (268 | ) | | | (167 | ) | | | (294 | ) | | | (125 | ) |
Return to performing status(2) | | | (730 | ) | | | (796 | ) | | | (443 | ) | | | (301 | ) | | | (398 | ) |
Charge-offs (3) | | | (2,517 | ) | | | (2,069 | ) | | | (1,436 | ) | | | (1,092 | ) | | | (999 | ) |
Other | | | (208 | ) | | | (381 | ) | | | (332 | ) | | | (229 | ) | | | (257 | ) |
| | | | | | | | | | | | | | | | | | | | |
Total nonperforming consumer loans and leases, end of period | | | 17,772 | | | | 14,592 | | | | 9,888 | | | | 6,822 | | | | 5,220 | |
Foreclosed properties | | | 1,330 | | | | 1,356 | | | | 1,506 | | | | 1,656 | | | | 475 | |
| | | | | | | | | | | | | | | | | | | | |
Total nonperforming consumer assets | | $ | 19,102 | | | $ | 15,948 | | | $ | 11,394 | | | $ | 8,478 | | | $ | 5,695 | |
| | | | | | | | | | | | | | | | | | | | |
Nonperforming Commercial Loans and Leases(4): | | | | | | | | | | | | | | | | | | | | |
Balance, beginning of period | | $ | 9,312 | | | $ | 6,497 | | | $ | 4,922 | | | $ | 3,936 | | | $ | 2,874 | |
Additions(1) | | | 4,416 | | | | 4,434 | | | | 3,095 | | | | 1,997 | | | | 1,752 | |
Paydowns and payoffs | | | (593 | ) | | | (490 | ) | | | (368 | ) | | | (371 | ) | | | (345 | ) |
Return to performing status(2) | | | (92 | ) | | | (55 | ) | | | (35 | ) | | | (29 | ) | | | (32 | ) |
Charge-offs(5) | | | (1,429 | ) | | | (976 | ) | | | (896 | ) | | | (495 | ) | | | (248 | ) |
Other | | | (205 | ) | | | (98 | ) | | | (221 | ) | | | (116 | ) | | | (65 | ) |
| | | | | | | | | | | | | | | | | | | | |
Total nonperforming commercial loans and leases, end of period | | | 11,409 | | | | 9,312 | | | | 6,497 | | | | 4,922 | | | | 3,936 | |
Foreclosed properties | | | 471 | | | | 372 | | | | 321 | | | | 176 | | | | 118 | |
| | | | | | | | | | | | | | | | | | | | |
Total nonperforming commercial assets | | $ | 11,880 | | | $ | 9,684 | | | $ | 6,818 | | | $ | 5,098 | | | $ | 4,054 | |
| | | | | | | | | | | | | | | | | | | | |
| (1) | The three months ended March 31, 2009 includes $465 million of nonperforming consumer loans and leases and $402 million of nonperforming commercial loans and leases acquired from Merrill Lynch. |
| (2) | Loans and leases may be restored to performing status when all principal and interest is current and full repayment of the remaining contractual principal and interest is expected, or when the loan otherwise becomes well-secured and is in the process of collection. Troubled debt restructurings are generally classified as performing after six consecutive, on-time payments. |
| (3) | Our policy is not to classify consumer credit card and consumer non-real estate loans and leases as nonperforming; therefore, the charge-offs on these loans have no impact on nonperforming activity. |
| (4) | Includes small business commercial – domestic activity. |
| (5) | Certain loan and lease products, including business card, are not classified as nonperforming; therefore, the charge-offs on these loans have no impact on nonperforming activity. |
Certain prior period amounts have been reclassified to conform to current period presentation.
Information for periods beginning July 1, 2008 includes the Countrywide acquisition. Information for periods beginning January 1, 2009 includes the
Merrill Lynch acquisition. Prior periods have not been restated.
| | |
| This information is preliminary and based on company data available at the time of the presentation. | | 41 |
Bank of America Corporation and Subsidiaries
Quarterly Net Charge-offs/Losses and Net Charge-off/Loss Ratios(1)
(Dollars in millions)
| | | | | | | | | | | | | | | | | | | | | | | | | | | | | | | | | | | |
| | | Second
Quarter
2009 | | | First
Quarter
2009 | | | Fourth
Quarter
2008 | | | Third
Quarter
2008 | | | Second
Quarter
2008 | |
| Held Basis | | Amount | | | Percent | | | Amount | | | Percent | | | Amount | | | Percent | | | Amount | | | Percent | | | Amount | | | Percent | |
Residential mortgage | | $ | 1,085 | | | 1.72 | % | | $ | 785 | | | 1.20 | % | | $ | 466 | | | 0.73 | % | | $ | 242 | | | 0.37 | % | | $ | 151 | | | 0.24 | % |
Home equity | | | 1,839 | | | 4.71 | | | | 1,681 | | | 4.30 | | | | 1,113 | | | 2.92 | | | | 964 | | | 2.53 | | | | 923 | | | 3.09 | |
Discontinued real estate | | | 35 | | | 0.76 | | | | 15 | | | 0.31 | | | | 19 | | | 0.36 | | | | (3 | ) | | (0.05 | ) | | | n/a | | | n/a | |
Credit card - domestic | | | 1,788 | | | 13.87 | | | | 1,426 | | | 9.81 | | | | 1,244 | | | 7.63 | | | | 1,094 | | | 6.86 | | | | 976 | | | 6.36 | |
Credit card - foreign | | | 276 | | | 5.88 | | | | 186 | | | 4.48 | | | | 162 | | | 3.75 | | | | 148 | | | 3.46 | | | | 132 | | | 3.21 | |
Direct/Indirect consumer | | | 1,475 | | | 5.90 | | | | 1,249 | | | 5.03 | | | | 1,054 | | | 5.03 | | | | 845 | | | 3.94 | | | | 660 | | | 3.22 | |
Other consumer | | | 99 | | | 11.93 | | | | 97 | | | 11.67 | | | | 124 | | | 13.79 | | | | 106 | | | 11.36 | | | | 83 | | | 8.47 | |
| | | | | | | | | | | | | | | | | | | | | | | | | | | | | | | | | | | |
Total consumer | | | 6,597 | | | 4.39 | | | | 5,439 | | | 3.54 | | | | 4,182 | | | 2.79 | | | | 3,396 | | | 2.24 | | | | 2,925 | | | 2.17 | |
| | | | | | | | | | | | | | | | | | | | | | | | | | | | | | | | | | | |
Commercial - domestic(2) | | | 536 | | | 1.03 | | | | 244 | | | 0.46 | | | | 255 | | | 0.50 | | | | 117 | | | 0.23 | | | | 70 | | | 0.14 | |
Commercial real estate | | | 629 | | | 3.34 | | | | 455 | | | 2.56 | | | | 382 | | | 2.36 | | | | 262 | | | 1.65 | | | | 136 | | | 0.88 | |
Commercial lease financing | | | 44 | | | 0.81 | | | | 67 | | | 1.22 | | | | 31 | | | 0.57 | | | | 8 | | | 0.13 | | | | 6 | | | 0.11 | |
Commercial - foreign | | | 122 | | | 1.54 | | | | 104 | | | 1.25 | | | | 129 | | | 1.63 | | | | 46 | | | 0.56 | | | | 5 | | | 0.06 | |
| | | | | | | | | | | | | | | | | | | | | | | | | | | | | | | | | | | |
| | | 1,331 | | | 1.58 | | | | 870 | | | 1.02 | | | | 797 | | | 0.99 | | | | 433 | | | 0.54 | | | | 217 | | | 0.28 | |
Small business commercial - domestic | | | 773 | | | 16.69 | | | | 633 | | | 13.47 | | | | 562 | | | 11.55 | | | | 527 | | | 10.64 | | | | 477 | | | 9.59 | |
| | | | | | | | | | | | | | | | | | | | | | | | | | | | | | | | | | | |
Total commercial | | | 2,104 | | | 2.37 | | | | 1,503 | | | 1.68 | | | | 1,359 | | | 1.59 | | | | 960 | | | 1.13 | | | | 694 | | | 0.84 | |
| | | | | | | | | | | | | | | | | | | | | | | | | | | | | | | | | | | |
Total net charge-offs | | $ | 8,701 | | | 3.64 | | | $ | 6,942 | | | 2.85 | | | $ | 5,541 | | | 2.36 | | | $ | 4,356 | | | 1.84 | | | $ | 3,619 | | | 1.67 | |
| | | | | | | | | | | | | | | | | | | | | | | | | | | | | | | | | | | |
| | | | | | | | | | |
By Business Segment | | | | | | | | | | | | | | | | | | | | | | | | | | | | | | | | | | | |
Deposits | | $ | 88 | | | 3.26 | % | | $ | 88 | | | 3.42 | % | | $ | 106 | | | 4.89 | % | | $ | 96 | | | 4.85 | % | | $ | 78 | | | 4.33 | % |
Global Card Services(3) | | | 7,096 | | | 12.91 | | | | 5,406 | | | 9.60 | | | | 4,623 | | | 7.88 | | | | 4,185 | | | 6.94 | | | | 3,768 | | | 6.34 | |
Home Loans & Insurance | | | 1,598 | | | 4.88 | | | | 1,492 | | | 4.77 | | | | 976 | | | 3.18 | | | | 844 | | | 2.75 | | | | 841 | | | 3.71 | |
Global Markets | | | 29 | | | 1.00 | | | | 5 | | | 0.17 | | | | 15 | | | 0.87 | | | | 16 | | | 0.36 | | | | — | | | — | |
Global Banking | | | 1,477 | | | 1.83 | | | | 1,122 | | | 1.37 | | | | 992 | | | 1.19 | | | | 588 | | | 0.73 | | | | 318 | | | 0.41 | |
Global Wealth & Investment Management | | | 172 | | | 0.68 | | | | 162 | | | 0.60 | | | | 145 | | | 0.65 | | | | 108 | | | 0.49 | | | | 92 | | | 0.42 | |
All Other(3) | | | (1,759 | ) | | (4.43 | ) | | | (1,333 | ) | | (3.21 | ) | | | (1,316 | ) | | (3.60 | ) | | | (1,481 | ) | | (4.03 | ) | | | (1,478 | ) | | (5.06 | ) |
| | | | | | | | | | | | | | | | | | | | | | | | | | | | | | | | | | | |
Total net charge-offs | | $ | 8,701 | | | 3.64 | | | $ | 6,942 | | | 2.85 | | | $ | 5,541 | | | 2.36 | | | $ | 4,356 | | | 1.84 | | | $ | 3,619 | | | 1.67 | |
| | | | | | | | | | | | | | | | | | | | | | | | | | | | | | | | | | | |
| | | | | | | | | | |
Supplemental managed basis data | | | | | | | | | | | | | | | | | | | | | | | | | | | | | | | | | | | |
Credit card - domestic | | $ | 4,530 | | | 12.69 | % | | $ | 3,421 | | | 9.20 | % | | $ | 2,929 | | | 7.66 | % | | $ | 2,643 | | | 6.87 | % | | $ | 2,414 | | | 6.36 | % |
Credit card - foreign | | | 517 | | | 7.06 | | | | 373 | | | 5.47 | | | | 334 | | | 4.57 | | | | 353 | | | 4.21 | | | | 337 | | | 4.11 | |
| | | | | | | | | | | | | | | | | | | | | | | | | | | | | | | | | | | |
Total credit card managed net losses | | $ | 5,047 | | | 11.73 | | | $ | 3,794 | | | 8.62 | | | $ | 3,263 | | | 7.16 | | | $ | 2,996 | | | 6.40 | | | $ | 2,751 | | | 5.96 | |
| | | | | | | | | | | | | | | | | | | | | | | | | | | | | | | | | | | |
| (1) | Net charge-off/loss ratios are calculated as annualized held net charge-offs or managed net losses divided by average outstanding held or managed loans and leases excluding loans measured at fair value in accordance with SFAS 159 during the period for each loan and lease category. |
| (2) | Excludes small business commercial - domestic loans. |
| (3) | Global Card Services is presented on a managed basis. The securitization offset is included within All Other. |
n/a = not applicable
Loans are classified as domestic or foreign based upon the domicile of the borrower.
Certain prior period amounts have been reclassified to conform to current period presentation.
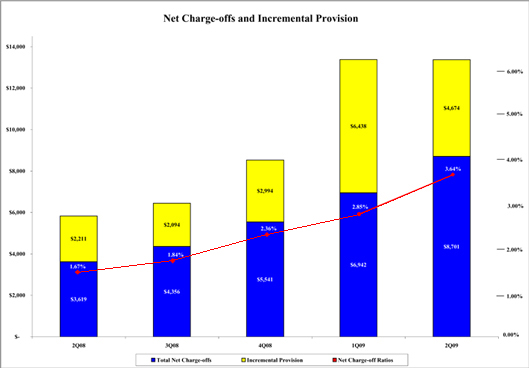
Information for periods beginning July 1, 2008 includes the Countrywide acquisition. Information for periods beginning January 1, 2009 includes the
Merrill Lynch acquisition. Prior periods have not been restated.
| | |
| This information is preliminary and based on company data available at the time of the presentation. | | 42 |
Bank of America Corporation and Subsidiaries
Year-to-Date Net Charge-offs/Losses and Net Charge-off/Loss Ratios (1)
(Dollars in millions)
| | | | | | | | | | | | | | | | | | |
| | | Six Months Ended June 30 | | | |
| | | 2009 | | | | | 2008 | | | |
| Held Basis | | Amount | | | Percent | | | | | Amount | | | Percent | | | |
Residential mortgage | | $ | 1,870 | | | 1.45 | | | % | | $ | 217 | | | 0.17 | | | % |
Home equity | | | 3,520 | | | 4.50 | | | | | | 1,419 | | | 2.41 | | | |
Discontinued real estate | | | 50 | | | 0.53 | | | | | | n/a | | | n/a | | | |
Credit card - domestic | | | 3,214 | | | 11.72 | | | | | | 1,823 | | | 5.87 | | | |
Credit card - foreign | | | 462 | | | 5.22 | | | | | | 241 | | | 3.05 | | | |
Direct/Indirect consumer | | | 2,724 | | | 5.46 | | | | | | 1,215 | | | 3.03 | | | |
Other consumer | | | 196 | | | 11.80 | | | | | | 169 | | | 8.54 | | | |
| | | | | | | | | | | | | | | | | | |
Total consumer | | | 12,036 | | | 3.96 | | | | | | 5,084 | | | 1.88 | | | |
| | | | | | | | | | | | | | | | | | |
Commercial - domestic(2) | | | 780 | | | 0.74 | | | | | | 147 | | | 0.15 | | | |
Commercial real estate | | | 1,084 | | | 2.96 | | | | | | 243 | | | 0.79 | | | |
Commercial lease financing | | | 111 | | | 1.02 | | | | | | 21 | | | 0.19 | | | |
Commercial - foreign | | | 226 | | | 1.39 | | | | | | (2 | ) | | (0.02 | ) | | |
| | | | | | | | | | | | | | | | | | |
| | | 2,201 | | | 1.30 | | | | | | 409 | | | 0.27 | | | |
Small business commercial - domestic | | | 1,406 | | | 15.07 | | | | | | 841 | | | 8.52 | | | |
| | | | | | | | | | | | | | | | | | |
Total commercial | | | 3,607 | | | 2.02 | | | | | | 1,250 | | | 0.77 | | | |
| | | | | | | | | | | | | | | | | | |
Total net charge-offs | | $ | 15,643 | | | 3.24 | | | | | $ | 6,334 | | | 1.46 | | | |
| | | | | | | | | | | | | | | | | | |
By Business Segment | | | | | | | | | | | | | | | | | | |
Deposits | | $ | 176 | | | 3.34 | | | % | | $ | 164 | | | 4.46 | | | % |
Global Card Services(3) | | | 12,502 | | | 11.24 | | | | | | 6,915 | | | 5.87 | | | |
Home Loans & Insurance | | | 3,090 | | | 4.83 | | | | | | 1,284 | | | 2.89 | | | |
Global Markets | | | 34 | | | 0.60 | | | | | | 1 | | | 0.01 | | | |
Global Banking | | | 2,599 | | | 1.60 | | | | | | 646 | | | 0.42 | | | |
Global Wealth & Investment Management | | | 334 | | | 0.64 | | | | | | 144 | | | 0.33 | | | |
All Other(3) | | | (3,092 | ) | | (3.81 | ) | | | | | (2,820 | ) | | (4.51 | ) | | |
| | | | | | | | | | | | | | | | | | |
Total net charge-offs | | $ | 15,643 | | | 3.24 | | | | | $ | 6,334 | | | 1.46 | | | |
| | | | | | | | | | | | | | | | | | |
| | | | | | |
Supplemental managed basis data | | | | | | | | | | | | | | | | | | |
Credit card - domestic | | $ | 7,951 | | | 10.91 | | | % | | $ | 4,482 | | | 5.92 | | | % |
Credit card - foreign | | | 890 | | | 6.29 | | | | | | 641 | | | 3.97 | | | |
| | | | | | | | | | | | | | | | | | |
Total credit card managed net losses | | $ | 8,841 | | | 10.16 | | | | | $ | 5,123 | | | 5.58 | | | |
| | | | | | | | | | | | | | | | | | |
| (1) | Net charge-off/loss ratios are calculated as annualized held net charge-offs or managed net losses divided by average outstanding held or managed loans and leases excluding loans measured at fair value in accordance with SFAS 159 during the period for each loan and lease category. |
| (2) | Excludes small business commercial - domestic loans. |
| (3) | Global Card Services is presented on a managed basis. The securitization offset is included within All Other. |
n/a = not applicable
Loans are classified as domestic or foreign based upon the domicile of the borrower.
Certain prior period amounts have been reclassified to conform to current period presentation.
Information for periods beginning July 1, 2008 includes the Countrywide acquisition. Information for periods beginning January 1, 2009 includes the
Merrill Lynch acquisition. Prior periods have not been restated.
| | |
| This information is preliminary and based on company data available at the time of the presentation. | | 43 |
Bank of America Corporation and Subsidiaries
Allocation of the Allowance for Credit Losses by Product Type(1)
(Dollars in millions)
| | | | | | | | | | | | | | | | | | | | | | | | | | | | | | | | | |
| | | June 30, 2009 | | March 31, 2009 | | June 30, 2008 | | |
| Allowance for loan and lease losses | | Amount | | Percent of
Total | | | | Percent of Loans
and Leases
Outstanding (2) | | | | Amount | | Percent of
Total | | | | Percent of Loans
and Leases
Outstanding (2) | | | | Amount | | Percent of
Total | | | | Percent of Loans
and Leases
Outstanding (2) | | |
Residential mortgage | | $ | 4,119 | | 12.19 | | % | | 1.67 | | % | | $ | 2,856 | | 9.83 | | % | | 1.09 | | % | | $ | 792 | | 4.62 | | % | | 0.34 | | % |
Home equity | | | 8,664 | | 25.64 | | | | 5.59 | | | | | 7,457 | | 25.67 | | | | 4.73 | | | | | 3,812 | | 22.25 | | | | 3.14 | | |
Discontinued real estate | | | 398 | | 1.18 | | | | 2.28 | | | | | 67 | | 0.23 | | | | 0.35 | | | | | n/a | | n/a | | | | n/a | | |
Credit card - domestic | | | 5,153 | | 15.25 | | | | 10.53 | | | | | 4,597 | | 15.83 | | | | 8.96 | | | | | 3,210 | | 18.74 | | | | 5.17 | | |
Credit card - foreign | | | 1,320 | | 3.91 | | | | 6.46 | | | | | 866 | | 2.98 | | | | 5.20 | | | | | 474 | | 2.77 | | | | 2.86 | | |
Direct/Indirect consumer | | | 5,369 | | 15.89 | | | | 5.41 | | | | | 5,381 | | 18.52 | | | | 5.40 | | | | | 2,964 | | 17.30 | | | | 3.49 | | |
Other consumer | | | 210 | | 0.63 | | | | 6.22 | | | | | 202 | | 0.70 | | | | 6.11 | | | | | 185 | | 1.09 | | | | 4.81 | | |
| | | | | | | | | | | | | | | | | | | | | | | | | | | | | | | | | |
Total consumer | | | 25,233 | | 74.69 | | | | 4.27 | | | | | 21,426 | | 73.76 | | | | 3.52 | | | | | 11,437 | | 66.77 | | | | 2.18 | | |
| | | | | | | | | | | | | | | | | | | | | | | | | | | | | | | | | |
Commercial - domestic(3) | | | 5,486 | | 16.24 | | | | 2.52 | | | | | 5,264 | | 18.12 | | | | 2.29 | | | | | 3,844 | | 22.44 | | | | 1.74 | | |
Commercial real estate | | | 2,396 | | 7.09 | | | | 3.19 | | | | | 1,756 | | 6.05 | | | | 2.33 | | | | | 1,333 | | 7.78 | | | | 2.12 | | |
Commercial lease financing | | | 255 | | 0.75 | | | | 1.14 | | | | | 238 | | 0.82 | | | | 1.08 | | | | | 199 | | 1.16 | | | | 0.87 | | |
Commercial - foreign | | | 415 | | 1.23 | | | | 1.39 | | | | | 364 | | 1.25 | | | | 1.09 | | | | | 317 | | 1.85 | | | | 0.91 | | |
| | | | | | | | | | | | | | | | | | | | | | | | | | | | | | | | | |
Total commercial(4) | | | 8,552 | | 25.31 | | | | 2.48 | | | | | 7,622 | | 26.24 | | | | 2.11 | | | | | 5,693 | | 33.23 | | | | 1.67 | | |
| | | | | | | | | | | | | | | | | | | | | | | | | | | | | | | | | |
Allowance for loan and lease losses | | | 33,785 | | 100.00 | | % | | 3.61 | | | | | 29,048 | | 100.00 | | % | | 3.00 | | | | | 17,130 | | 100.00 | | % | | 1.98 | | |
| | | | | | | | | | | | | | | | | | | | | | | | | | | | | | | | | |
Reserve for unfunded lending commitments (5) | | | 1,992 | | | | | | | | | | | 2,102 | | | | | | | | | | | 507 | | | | | | | | |
| | | | | | | | | | | | | | | | | | | | | | | | | | | | | | | | | |
Allowance for credit losses | | $ | 35,777 | | | | | | | | | | $ | 31,150 | | | | | | | | | | $ | 17,637 | | | | | | | | |
| | | | | | | | | | | | | | | | | | | | | | | | | | | | | | | | | |
| (1) | The Corporation accounts for acquired impaired loans in accordance with SOP 03-3. |
| (2) | Ratios are calculated as allowance for loan and lease losses as a percentage of loans and leases outstanding excluding loans measured in accordance with SFAS 159 for each loan and lease category. Loans measured at fair value include commercial - domestic loans of $4.4 billion, $4.8 billion and $3.5 billion, commercial - foreign loans of $2.5 billion, $2.5 billion and $1.3 billion, and commercial real estate loans of $123 million, $89 million and $176 million at June 30, 2009, March 31, 2009 and June 30, 2008. |
| (3) | Includes allowance for small business commercial - domestic loans of $2.8 billion, $3.1 billion and $2.1 billion at June 30, 2009, March 31, 2009 and June 30, 2008. |
| (4) | Includes allowance for loan and lease losses for impaired commercial loans of $1.6 billion, $1.1 billion and $417 million at June 30, 2009, March 31, 2009 and June 30, 2008. |
| (5) | Amounts for the periods beginning January 1, 2009 include the Merrill Lynch acquisition. The majority of the increase from June 30, 2008 relates to the fair value of the acquired Merrill Lynch unfunded lending commitments, excluding commitments accounted for under SFAS 159. |
n/a = not applicable
Certain prior period amounts have been reclassified to conform to current period presentation.
Information for periods beginning July 1, 2008 includes the Countrywide acquisition. Information for periods beginning January 1, 2009 includes the
Merrill Lynch acquisition. Prior periods have not been restated.
| | |
| This information is preliminary and based on company data available at the time of the presentation. | | 44 |
Exhibit A: Non-GAAP Reconciliations
Bank of America Corporation and Subsidiaries
Global Card Services - Reconciliation
(Dollars in millions)
| | | | | | | | | | | | | | | | | | | | | | | | | | | | | | | | | | | | |
| | | Six Months Ended June 30, 2009 | | | Six Months Ended June 30, 2008 | | | Second Quarter 2009 | |
| | | Managed
Basis (1) | | | Securitization
Impact (2) | | | Held
Basis | | | Managed
Basis (1) | | | Securitization
Impact (2) | | | Held
Basis | | | Managed
Basis (1) | | | Securitization
Impact (2) | | | Held
Basis | |
Net interest income(3) | | $ | 10,308 | | | $ | (4,749 | ) | | $ | 5,559 | | | $ | 9,331 | | | $ | (4,195 | ) | | $ | 5,136 | | | $ | 5,049 | | | $ | (2,358 | ) | | $ | 2,691 | |
Noninterest income: | | | | | | | | | | | | | | | | | | | | | | | | | | | | | | | | | | | | |
Card income | | | 4,279 | | | | (348 | ) | | | 3,931 | | | | 5,275 | | | | 1,261 | | | | 6,536 | | | | 2,164 | | | | (592 | ) | | | 1,572 | |
All other income | | | 259 | | | | (67 | ) | | | 192 | | | | 824 | | | | (125 | ) | | | 699 | | | | 124 | | | | (32 | ) | | | 92 | |
| | | | | | | | | | | | | | | | | | | | | | | | | | | | | | | | | | | | |
Total noninterest income | | | 4,538 | | | | (415 | ) | | | 4,123 | | | | 6,099 | | | | 1,136 | | | | 7,235 | | | | 2,288 | | | | (624 | ) | | | 1,664 | |
| | | | | | | | | | | | | | | | | | | | | | | | | | | | | | | | | | | | |
Total revenue, net of interest expense | | | 14,846 | | | | (5,164 | ) | | | 9,682 | | | | 15,430 | | | | (3,059 | ) | | | 12,371 | | | | 7,337 | | | | (2,982 | ) | | | 4,355 | |
| | | | | | | | | |
Provision for credit losses | | | 16,182 | | | | (5,164 | ) | | | 11,018 | | | | 8,711 | | | | (3,059 | ) | | | 5,652 | | | | 7,741 | | | | (2,982 | ) | | | 4,759 | |
Noninterest expense | | | 4,053 | | | | — | | | | 4,053 | | | | 4,572 | | | | — | | | | 4,572 | | | | 1,976 | | | | — | | | | 1,976 | |
| | | | | | | | | | | | | | | | | | | | | | | | | | | | | | | | | | | | |
Income (loss) before income taxes | | | (5,389 | ) | | | — | | | | (5,389 | ) | | | 2,147 | | | | — | | | | 2,147 | | | | (2,380 | ) | | | — | | | | (2,380 | ) |
Income tax expense (benefit) (3) | | | (1,895 | ) | | | — | | | | (1,895 | ) | | | 746 | | | | — | | | | 746 | | | | (762 | ) | | | — | | | | (762 | ) |
| | | | | | | | | | | | | | | | | | | | | | | | | | | | | | | | | | | | |
Net income (loss) | | $ | (3,494 | ) | | $ | — | | | $ | (3,494 | ) | | $ | 1,401 | | | $ | — | | | $ | 1,401 | | | $ | (1,618 | ) | | $ | — | | | $ | (1,618 | ) |
| | | | | | | | | | | | | | | | | | | | | | | | | | | | | | | | | | | | |
| | | | | | | | | |
Balance sheet | | | | | | | | | | | | | | | | | | | | | | | | | | | | | | | | | | | | |
Average - total loans and leases | | $ | 224,391 | | | $ | (102,357 | ) | | $ | 122,034 | | | $ | 236,738 | | | $ | (106,306 | ) | | $ | 130,432 | | | $ | 220,365 | | | $ | (102,046 | ) | | $ | 118,319 | |
Period end - total loans and leases | | | 215,904 | | | | (100,438 | ) | | | 115,466 | | | | 240,617 | | | | (108,520 | ) | | | 132,097 | | | | 215,904 | | | | (100,438 | ) | | | 115,466 | |
| | | |
| | | First Quarter 2009 | | | Fourth Quarter 2008 | | | Third Quarter 2008 | |
| | | Managed
Basis (1) | | | Securitization
Impact (2) | | | Held
Basis | | | Managed
Basis (1) | | | Securitization
Impact (2) | | | Held
Basis | | | Managed
Basis (1) | | | Securitization
Impact (2) | | | Held
Basis | |
Net interest income(3) | | $ | 5,259 | | | $ | (2,391 | ) | | $ | 2,868 | | | $ | 5,302 | | | $ | (2,299 | ) | | $ | 3,003 | | | $ | 4,922 | | | $ | (2,207 | ) | | $ | 2,715 | |
Noninterest income: | | | | | | | | | | | | | | | | | | | | | | | | | | | | | | | | | | | | |
Card income | | | 2,115 | | | | 244 | | | | 2,359 | | | | 2,469 | | | | 482 | | | | 2,951 | | | | 2,290 | | | | 507 | | | | 2,797 | |
All other income | | | 135 | | | | (35 | ) | | | 100 | | | | 239 | | | | (40 | ) | | | 199 | | | | 534 | | | | (54 | ) | | | 480 | |
| | | | | | | | | | | | | | | | | | | | | | | | | | | | | | | | | | | | |
Total noninterest income | | | 2,250 | | | | 209 | | | | 2,459 | | | | 2,708 | | | | 442 | | | | 3,150 | | | | 2,824 | | | | 453 | | | | 3,277 | |
| | | | | | | | | | | | | | | | | | | | | | | | | | | | | | | | | | | | |
Total revenue, net of interest expense | | | 7,509 | | | | (2,182 | ) | | | 5,327 | | | | 8,010 | | | | (1,857 | ) | | | 6,153 | | | | 7,746 | | | | (1,754 | ) | | | 5,992 | |
| | | | | | | | | |
Provision for credit losses | | | 8,441 | | | | (2,182 | ) | | | 6,259 | | | | 5,851 | | | | (1,857 | ) | | | 3,994 | | | | 5,602 | | | | (1,754 | ) | | | 3,848 | |
Noninterest expense | | | 2,077 | | | | — | | | | 2,077 | | | | 2,177 | | | | — | | | | 2,177 | | | | 2,404 | | | | — | | | | 2,404 | |
| | | | | | | | | | | | | | | | | | | | | | | | | | | | | | | | | | | | |
Income (loss) before income taxes | | | (3,009 | ) | | | — | | | | (3,009 | ) | | | (18 | ) | | | — | | | | (18 | ) | | | (260 | ) | | | — | | | | (260 | ) |
Income tax expense (benefit) (3) | | | (1,133 | ) | | | — | | | | (1,133 | ) | | | (61 | ) | | | — | | | | (61 | ) | | | (89 | ) | | | — | | | | (89 | ) |
| | | | | | | | | | | | | | | | | | | | | | | | | | | | | | | | | | | | |
Net income (loss) | | $ | (1,876 | ) | | $ | — | | | $ | (1,876 | ) | | $ | 43 | | | $ | — | | | $ | 43 | | | $ | (171 | ) | | $ | — | | | $ | (171 | ) |
| | | | | | | | | | | | | | | | | | | | | | | | | | | | | | | | | | | | |
| | | | | | | | | |
Balance sheet | | | | | | | | | | | | | | | | | | | | | | | | | | | | | | | | | | | | |
Average - total loans and leases | | $ | 228,461 | | | $ | (102,672 | ) | | $ | 125,789 | | | $ | 233,427 | | | $ | (99,116 | ) | | $ | 134,311 | | | $ | 239,951 | | | $ | (105,919 | ) | | $ | 134,032 | |
Period end - total loans and leases | | | 221,984 | | | | (105,392 | ) | | | 116,592 | | | | 233,040 | | | | (100,960 | ) | | | 132,080 | | | | 235,998 | | | | (102,048 | ) | | | 133,950 | |
| | | | | | | |
| | | Second Quarter 2008 | | | | | | | | | | | | | | | | | | | |
| | | Managed
Basis (1) | | | Securitization
Impact (2) | | | Held
Basis | | | | | | | | | | | | | | | | | | | |
Net interest income(3) | | $ | 4,742 | | | $ | (2,140 | ) | | $ | 2,602 | | | | | | | | | | | | | | | | | | | | | | | | | |
Noninterest income: | | | | | | | | | | | | | | | | | | | | | | | | | | | | | | | | | | | | |
Card income | | | 2,554 | | | | 557 | | | | 3,111 | | | | | | | | | | | | | | | | | | | | | | | | | |
All other income | | | 204 | | | | (60 | ) | | | 144 | | | | | | | | | | | | | | | | | | | | | | | | | |
| | | | | | | | | | | | | | | | | | | | | | | | | | | | | | | | | | | | |
Total noninterest income | | | 2,758 | | | | 497 | | | | 3,255 | | | | | | | | | | | | | | | | | | | | | | | | | |
| | | | | | | | | | | | | | | | | | | | | | | | | | | | | | | | | | | | |
Total revenue, net of interest expense | | | 7,500 | | | | (1,643 | ) | | | 5,857 | | | | | | | | | | | | | | | | | | | | | | | | | |
| | | | | | | | | |
Provision for credit losses | | | 4,259 | | | | (1,643 | ) | | | 2,616 | | | | | | | | | | | | | | | | | | | | | | | | | |
Noninterest expense | | | 2,375 | | | | — | | | | 2,375 | | | | | | | | | | | | | | | | | | | | | | | | | |
| | | | | | | | | | | | | | | | | | | | | | | | | | | | | | | | | | | | |
Income before income taxes | | | 866 | | | | — | | | | 866 | | | | | | | | | | | | | | | | | | | | | | | | | |
Income tax expense (3) | | | 284 | | | | — | | | | 284 | | | | | | | | | | | | | | | | | | | | | | | | | |
| | | | | | | | | | | | | | | | | | | | | | | | | | | | | | | | | | | | |
Net income | | $ | 582 | | | $ | — | | | $ | 582 | | | | | | | | | | | | | | | | | | | | | | | | | |
| | | | | | | | | | | | | | | | | | | | | | | | | | | | | | | | | | | | |
| | | | | | | | | |
Balance sheet | | | | | | | | | | | | | | | | | | | | | | | | | | | | | | | | | | | | |
Average - total loans and leases | | $ | 238,918 | | | $ | (107,438 | ) | | $ | 131,480 | | | | | | | | | | | | | | | | | | | | | | | | | |
Period end - total loans and leases | | | 240,617 | | | | (108,520 | ) | | | 132,097 | | | | | | | | | | | | | | | | | | | | | | | | | |
| (1) | Provision for credit losses represents provision for credit losses on held loans combined with realized credit losses associated with the securitized loan portfolio. |
| (2) | The securitization impact on net interest income is on a funds transfer pricing methodology consistent with the way funding costs are allocated to the businesses. |
| (3) | Fully taxable-equivalent basis |
Certain prior period amounts have been reclassified among the segments to conform to the current period presentation.
The Corporation reportsGlobal Card Serviceson a managed basis. Reporting on a managed basis is consistent with the way that management evaluates the results ofGlobal Card Services. Managed basis assumes that securitized loans were not sold and presents earnings on these loans in a manner similar to the way loans that have not been sold (i.e., held loans) are presented. Loan securitization is an alternative funding process that is used by the Corporation to diversify funding sources. Loan securitization removes loans from the Consolidated Balance Sheet through the sale of loans to an off-balance sheet qualified special purpose entity which is excluded from the Corporation’s Consolidated Financial Statements in accordance with accounting principles generally accepted in the United States (GAAP).
The performance of the managed portfolio is important in understandingGlobal Card Services’ results as it demonstrates the results of the entire portfolio serviced by the business. Securitized loans continue to be serviced by the business and are subject to the same underwriting standards and ongoing monitoring as held loans. In addition, retained excess servicing income is exposed to similar credit risk and repricing of interest rates as held loans.Global Card Services’managed income statement line items differ from a held basis reported as follows:
| • | | Managed net interest income includesGlobal Card Services’ net interest income on held loans and interest income on the securitized loans less the internal funds transfer pricing allocation related to securitized loans. |
| • | | Managed noninterest income includesGlobal Card Services’ noninterest income on a held basis less the reclassification of certain components of card income (e.g., excess servicing income) to record securitized net interest income and provision for credit losses. Noninterest income, both on a held and managed basis, also includes the impact of adjustments to the interest-only strip that are recorded in card income as management continues to manage this impact withinGlobal Card Services. |
| • | | Provision for credit losses represents the provision for credit losses on held loans combined with realized credit losses associated with the securitized loan portfolio. |
Information for periods beginning July 1, 2008 includes the Countrywide acquisition. Information for periods beginning January 1, 2009 includes the
Merrill Lynch acquisition. Prior periods have not been restated.
| | |
| This information is preliminary and based on company data available at the time of the presentation. | | 45 |
Exhibit A: Non-GAAP Reconciliations - continued
Bank of America Corporation and Subsidiaries
All Other - Reconciliation
(Dollars in millions)
| | | | | | | | | | | | | | | | | | | | | | | | | | | | | | | | | | | | |
| | | Six Months Ended June 30, 2009 | | | Six Months Ended June 30, 2008 | | | Second Quarter 2009 | |
| | | Reported
Basis (1) | | | Securitization
Offset (2) | | | As
Adjusted | | | Reported
Basis (1) | | | Securitization
Offset (2) | | | As
Adjusted | | | Reported
Basis (1) | | | Securitization
Offset (2) | | | As
Adjusted | |
Net interest income(3) | | $ | (3,477 | ) | | $ | 4,749 | | | $ | 1,272 | | | $ | (3,771 | ) | | $ | 4,195 | | | $ | 424 | | | $ | (1,588 | ) | | $ | 2,358 | | | $ | 770 | |
Noninterest income: | | | | | | | | | | | | | | | | | | | | | | | | | | | | | | | | | | | | |
Card income (loss) | | | 256 | | | | 348 | | | | 604 | | | | 1,259 | | | | (1,261 | ) | | | (2 | ) | | | (278 | ) | | | 592 | | | | 314 | |
Equity investment income | | | 7,305 | | | | — | | | | 7,305 | | | | 977 | | | | — | | | | 977 | | | | 5,979 | | | | — | | | | 5,979 | |
Gains on sales of debt securities | | | 2,143 | | | | — | | | | 2,143 | | | | 351 | | | | — | | | | 351 | | | | 672 | | | | — | | | | 672 | |
All other income (loss) | | | (1,706 | ) | | | 67 | | | | (1,639 | ) | | | (349 | ) | | | 125 | | | | (224 | ) | | | (4,298 | ) | | | 32 | | | | (4,266 | ) |
| | | | | | | | | | | | | | | | | | | | | | | | | | | | | | | | | | | | |
Total noninterest income | | | 7,998 | | | | 415 | | | | 8,413 | | | | 2,238 | | | | (1,136 | ) | | | 1,102 | | | | 2,075 | | | | 624 | | | | 2,699 | |
| | | | | | | | | | | | | | | | | | | | | | | | | | | | | | | | | | | | |
Total revenue, net of interest expense | | | 4,521 | | | | 5,164 | | | | 9,685 | | | | (1,533 | ) | | | 3,059 | | | | 1,526 | | | | 487 | | | | 2,982 | | | | 3,469 | |
| | | | | | | | | |
Provision for credit losses | | | (686 | ) | | | 5,164 | | | | 4,478 | | | | (2,161 | ) | | | 3,059 | | | | 898 | | | | (9 | ) | | | 2,982 | | | | 2,973 | |
Merger and restructuring charges | | | 1,594 | | | | — | | | | 1,594 | | | | 382 | | | | — | | | | 382 | | | | 829 | | | | — | | | | 829 | |
All other noninterest expense | | | 932 | | | | — | | | | 932 | | | | 253 | | | | — | | | | 253 | | | | 642 | | | | — | | | | 642 | |
| | | | | | | | | | | | | | | | | | | | | | | | | | | | | | | | | | | | |
Income (loss) before income taxes | | | 2,681 | | | | — | | | | 2,681 | | | | (7 | ) | | | — | | | | (7 | ) | | | (975 | ) | | | — | | | | (975 | ) |
Income tax expense (benefit) (3) | | | (979 | ) | | | — | | | | (979 | ) | | | 6 | | | | — | | | | 6 | | | | (1,732 | ) | | | — | | | | (1,732 | ) |
| | | | | | | | | | | | | | | | | | | | | | | | | | | | | | | | | | | | |
Net income (loss) | | $ | 3,660 | | | $ | — | | | $ | 3,660 | | | $ | (13 | ) | | $ | — | | | $ | (13 | ) | | $ | 757 | | | $ | — | | | $ | 757 | |
| | | | | | | | | | | | | | | | | | | | | | | | | | | | | | | | | | | | |
| | | | | | | | | |
Balance sheet | | | | | | | | | | | | | | | | | | | | | | | | | | | | | | | | | | | | |
Average - total loans and leases | | $ | 163,770 | | | $ | 102,357 | | | $ | 266,127 | | | $ | 125,695 | | | $ | 106,306 | | | $ | 232,001 | | | $ | 159,142 | | | $ | 102,046 | | | $ | 261,188 | |
Period end - total loans and leases | | | 153,008 | | | | 100,438 | | | | 253,446 | | | | 95,826 | | | | 108,520 | | | | 204,346 | | | | 153,008 | | | | 100,438 | | | | 253,446 | |
| | | |
| | | First Quarter 2009 | | | Fourth Quarter 2008 | | | Third Quarter 2008 | |
| | | Reported
Basis (1) | | | Securitization
Offset (2) | | | As
Adjusted | | | Reported
Basis (1) | | | Securitization
Offset (2) | | | As
Adjusted | | | Reported
Basis (1) | | | Securitization
Offset (2) | | | As
Adjusted | |
Net interest income(3) | | $ | (1,889 | ) | | $ | 2,391 | | | $ | 502 | | | $ | (1,857 | ) | | $ | 2,299 | | | $ | 442 | | | $ | (2,326 | ) | | $ | 2,207 | | | $ | (119 | ) |
Noninterest income: | | | | | | | | | | | | | | | | | | | | | | | | | | | | | | | | | | | | |
Card income (loss) | | | 534 | | | | (244 | ) | | | 290 | | | | 368 | | | | (482 | ) | | | (114 | ) | | | 539 | | | | (507 | ) | | | 32 | |
Equity investment income (loss) | | | 1,326 | | | | — | | | | 1,326 | | | | (388 | ) | | | — | | | | (388 | ) | | | (327 | ) | | | — | | | | (327 | ) |
Gains (losses) on sales of debt securities | | | 1,471 | | | | — | | | | 1,471 | | | | 783 | | | | — | | | | 783 | | | | (3 | ) | | | — | | | | (3 | ) |
All other income (loss) | | | 2,592 | | | | 35 | | | | 2,627 | | | | (283 | ) | | | 40 | | | | (243 | ) | | | 112 | | | | 54 | | | | 166 | |
| | | | | | | | | | | | | | | | | | | | | | | | | | | | | | | | | | | | |
Total noninterest income | | | 5,923 | | | | (209 | ) | | | 5,714 | | | | 480 | | | | (442 | ) | | | 38 | | | | 321 | | | | (453 | ) | | | (132 | ) |
| | | | | | | | | | | | | | | | | | | | | | | | | | | | | | | | | | | | |
Total revenue, net of interest expense | | | 4,034 | | | | 2,182 | | | | 6,216 | | | | (1,377 | ) | | | 1,857 | | | | 480 | | | | (2,005 | ) | | | 1,754 | | | | (251 | ) |
| | | | | | | | | |
Provision for credit losses | | | (677 | ) | | | 2,182 | | | | 1,505 | | | | (613 | ) | | | 1,857 | | | | 1,244 | | | | (996 | ) | | | 1,754 | | | | 758 | |
Merger and restructuring charges | | | 765 | | | | — | | | | 765 | | | | 306 | | | | — | | | | 306 | | | | 247 | | | | — | | | | 247 | |
All other noninterest expense | | | 290 | | | | — | | | | 290 | | | | 187 | | | | — | | | | 187 | | | | (24 | ) | | | — | | | | (24 | ) |
| | | | | | | | | | | | | | | | | | | | | | | | | | | | | | | | | | | | |
Income (loss) before income taxes | | | 3,656 | | | | — | | | | 3,656 | | | | (1,257 | ) | | | — | | | | (1,257 | ) | | | (1,232 | ) | | | — | | | | (1,232 | ) |
Income tax expense (benefit) (3) | | | 753 | | | | — | | | | 753 | | | | (520 | ) | | | — | | | | (520 | ) | | | (538 | ) | | | — | | | | (538 | ) |
| | | | | | | | | | | | | | | | | | | | | | | | | | | | | | | | | | | | |
Net income (loss) | | $ | 2,903 | | | $ | — | | | $ | 2,903 | | | $ | (737 | ) | | $ | — | | | $ | (737 | ) | | $ | (694 | ) | | $ | — | | | $ | (694 | ) |
| | | | | | | | | | | | | | | | | | | | | | | | | | | | | | | | | | | | |
| | | | | | | | | |
Balance sheet | | | | | | | | | | | | | | | | | | | | | | | | | | | | | | | | | | | | |
Average - total loans and leases | | $ | 168,450 | | | $ | 102,672 | | | $ | 271,122 | | | $ | 145,238 | | | $ | 99,116 | | | $ | 244,354 | | | $ | 146,303 | | | $ | 105,919 | | | $ | 252,222 | |
Period end - total loans and leases | | | 165,534 | | | | 105,392 | | | | 270,926 | | | | 136,160 | | | | 100,960 | | | | 237,120 | | | | 146,363 | | | | 102,048 | | | | 248,411 | |
| | | | | | | |
| | | Second Quarter 2008 | | | | | | | | | | | | | | | | | | | |
| | | Reported
Basis (1) | | | Securitization
Offset (2) | | | As
Adjusted | | | | | | | | | | | | | | | | | | | |
Net interest income(3) | | $ | (1,913 | ) | | $ | 2,140 | | | $ | 227 | | | | | | | | | | | | | | | | | | | | | | | | | |
Noninterest income: | | | | | | | | | | | | | | | | | | | | | | | | | | | | | | | | | | | | |
Card income | | | 596 | | | | (557 | ) | | | 39 | | | | | | | | | | | | | | | | | | | | | | | | | |
Equity investment income | | | 710 | | | | — | | | | 710 | | | | | | | | | | | | | | | | | | | | | | | | | |
Gains on sales of debt securities | | | 131 | | | | — | | | | 131 | | | | | | | | | | | | | | | | | | | | | | | | | |
All other income (loss) | | | (87 | ) | | | 60 | | | | (27 | ) | | | | | | | | | | | | | | | | | | | | | | | | |
| | | | | | | | | | | | | | | | | | | | | | | | | | | | | | | | | | | | |
Total noninterest income | | | 1,350 | | | | (497 | ) | | | 853 | | | | | | | | | | | | | | | | | | | | | | | | | |
| | | | | | | | | | | | | | | | | | | | | | | | | | | | | | | | | | | | |
Total revenue, net of interest expense | | | (563 | ) | | | 1,643 | | | | 1,080 | | | | | | | | | | | | | | | | | | | | | | | | | |
| | | | | | | | | |
Provision for credit losses | | | (1,033 | ) | | | 1,643 | | | | 610 | | | | | | | | | | | | | | | | | | | | | | | | | |
Merger and restructuring charges | | | 212 | | | | — | | | | 212 | | | | | | | | | | | | | | | | | | | | | | | | | |
All other noninterest expense | | | 74 | | | | — | | | | 74 | | | | | | | | | | | | | | | | | | | | | | | | | |
| | | | | | | | | | | | | | | | | | | | | | | | | | | | | | | | | | | | |
Income before income taxes | | | 184 | | | | — | | | | 184 | | | | | | | | | | | | | | | | | | | | | | | | | |
Income tax expense (benefit) (3) | | | (42 | ) | | | — | | | | (42 | ) | | | | | | | | | | | | | | | | | | | | | | | | |
| | | | | | | | | | | | | | | | | | | | | | | | | | | | | | | | | | | | |
Net income | | $ | 226 | | | $ | — | | | $ | 226 | | | | | | | | | | | | | | | | | | | | | | | | | |
| | | | | | | | | | | | | | | | | | | | | | | | | | | | | | | | | | | | |
| | | | | | | | | |
Balance sheet | | | | | | | | | | | | | | | | | | | | | | | | | | | | | | | | | | | | |
Average - total loans and leases | | $ | 117,504 | | | $ | 107,438 | | | $ | 224,942 | | | | | | | | | | | | | | | | | | | | | | | | | |
Period end - total loans and leases | | $ | 95,826 | | | | 108,520 | | | | 204,346 | | | | | | | | | | | | | | | | | | | | | | | | | |
| (1) | Provision for credit losses represents provision for credit losses in All Other combined with the Global Card Services securitization offset. |
| (2) | The securitization offset on net interest income is on a funds transfer pricing methodology consistent with the way funding costs are allocated to the businesses. |
| (3) | Fully taxable-equivalent basis |
Certain prior period amounts have been reclassified among the segments to conform to the current period presentation.
Information for periods beginning July 1, 2008 includes the Countrywide acquisition. Information for periods beginning January 1, 2009 includes the
Merrill Lynch acquisition. Prior periods have not been restated.
| | |
| This information is preliminary and based on company data available at the time of the presentation. | | 46 |
Appendix: Selected Slides from the
Second Quarter 2009 Earnings Release Presentation
Information for periods beginning July 1, 2008 includes the Countrywide acquisition. Information for periods beginning January 1, 2009 includes the
Merrill Lynch acquisition. Prior periods have not been restated.
| | |
| This information is preliminary and based on company data available at the time of the presentation. | | 47 |
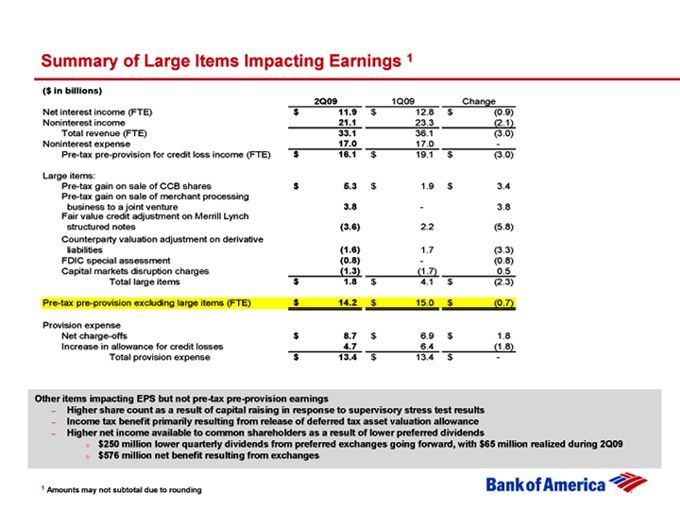
Summary of Large Items Impacting Earnings 1
($ in billions)
2Q09 1Q09 Change
Net interest income (FTE) $ 11.9 $ 12.8 $ (0.9)
Noninterest income 21.1 23.3 (2.1)
Total revenue (FTE) 33.1 36.1 (3.0)
Noninterest expense 17.0 17.0 -
Pre-tax pre-provision for credit loss income (FTE) $ 16.1 $ 19.1 $ (3.0)
Large items:
Pre-tax gain on sale of CCB shares $ 5.3 $ 1.9 $ 3.4
Pre-tax gain on sale of merchant processing
business to a joint venture 3.8 - 3.8
Fair value credit adjustment on Merrill Lynch
structured notes(3.6) 2.2 (5.8)
Counterparty valuation adjustment on derivative
liabilities(1.6) 1.7 (3.3)
FDIC special assessment(0.8) - (0.8)
Capital markets disruption charges(1.3) (1.7) 0.5
Total large items $ 1.8 $ 4.1 $ (2.3)
Pre-tax pre-provision excluding large items (FTE) $ 14.2 $ 15.0 $ (0.7)
Provision expense
Net charge-offs $ 8.7 $ 6.9 $ 1.8
Increase in allowance for credit losses 4.7 6.4 (1.8)
Total provision expense $ 13.4 $ 13.4 $ -
Other items impacting EPS but not pre-tax pre-provision earnings
– Higher share count as a result of capital raising in response to supervisory stress test results
– Income tax benefit primarily resulting from release of deferred tax asset valuation allowance
– Higher net income available to common shareholders as a result of lower preferred dividends o $250 million lower quarterly dividends from preferred exchanges going forward, with $65 million realized during 2Q09 o $576 million net benefit resulting from exchanges
1 Amounts may not subtotal due to rounding
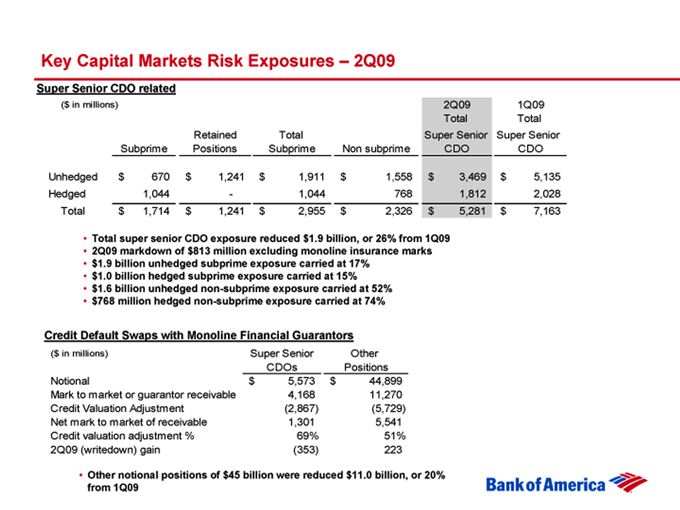
Key Capital Markets Risk Exposures – 2Q09
Super Senior CDO related
($ in millions) 2Q09 1Q09
Total Total
Retained Total Super Senior Super Senior
Subprime Positions Subprime Non subprime CDO CDO
Unhedged $ 670 $ 1,241 $ 1,911 $ 1,558 $ 3,469 $ 5,135
Hedged 1,044 - 1,044 768 1,812 2,028
Total $ 1,714 $ 1,241 $ 2,955 $ 2,326 $ 5,281 $ 7,163
• Total super senior CDO exposure reduced $1.9 billion, or 26% from 1Q09
• 2Q09 markdown of $813 million excluding monoline insurance marks
• $1.9 billion unhedged subprime exposure carried at 17%
• $1.0 billion hedged subprime exposure carried at 15%
• $1.6 billion unhedged non-subprime exposure carried at 52%
• $768 million hedged non-subprime exposure carried at 74%
Credit Default Swaps with Monoline Financial Guarantors
($ in millions) Super Senior Other
CDOs Positions
Notional $ 5,573 $ 44,899
Mark to market or guarantor receivable 4,168 11,270
Credit Valuation Adjustment (2,867) (5,729)
Net mark to market of receivable 1,301 5,541
Credit valuation adjustment % 69% 51%
2Q09 (writedown) gain (353) 233
• Other notional positions of $45 billion were reduced $11.0 billion, or 20% from 1Q09
Key Capital Markets Risk Exposures – 2Q09
Leveraged Loans
• Funded commitments carried at $3.0 billion or 44% of gross value
– Exposure reduced 32% from 1Q09
– 2Q09 markdown of $107 million
– Pre-market disruption exposure carried at $2.8 billion or 43% of gross value
– 90% of remaining funded commitments at book value are senior secured facilities
Capital Markets Commercial Mortgage related
• Total commitments carried at $6.9 billion with $6.6 billion funded
– Carrying $5.6 billion of acquisition related large floating rate loans at roughly 69% of gross value
– 2Q09 markdown of $458 million predominantly floating rate positions
– 2Q09 markdown of $113 million on equity positions from acquisition related exposures
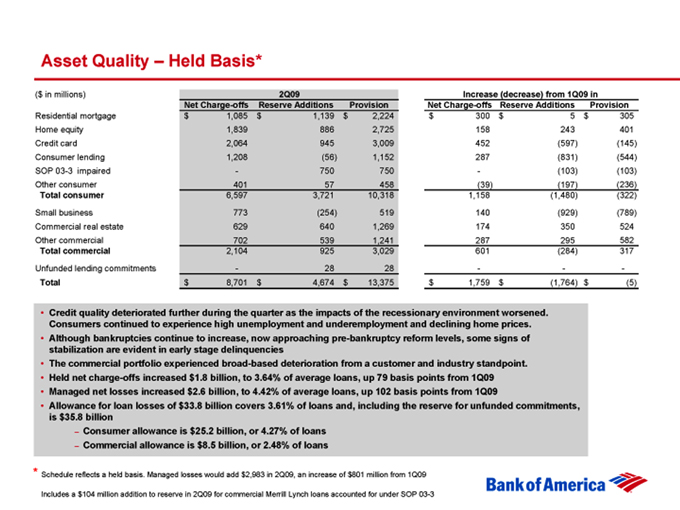
Asset Quality – Held Basis*
($ in millions) 2Q09 Increase from 1Q09 in
Net charge-offs Reserve Build Provision Net charge-offs Reserve Build Provision
Residential mortgage $ 1,085 $ 1,262 $ 2,347 $ 300 $ 128 $ 428
Home Equity 1,839 758 2,597 158 115 273
Credit Card 2,064 944 3,008 452(598)(146)
Consumer lending 1,208(55) 1,153 287(830)(543)
SOP 03-3 impaired 750 750 -(103)(103)
Other consumer 400 62 462(40)(192)(232)
Total Consumer 6,596 3,721 10,317 1,157(1,480)(323)
Small business 774(254) 520 141(929)(788)
Commercial Real Estate 629 641 1,270 174 351 525
Other Commercial 702 538 1,240 287 294 581
Total Commercial 1 2,105 925 3,030 602(284) 318
Unfunded lending commitments - 28 28 - -
Total 8,701 4,674 13,375 1,759(1,764)(5)
• Credit quality deteriorated further during the quarter as the impacts of the recessionary environment worsened. Consumers continued to experience high unemployment and underemployment and declining home prices.
• Although bankruptcies continue to increase, now approaching pre-bankruptcy reform levels, some signs of stabilization are evident in early stage delinquencies
• The commercial portfolio experienced broad-based deterioration from a customer and industry standpoint.
• Held net charge-offs increased $1.8 billion, to 3.64% of average loans, up 79 basis points from 1Q09
• Managed net losses increased $2.6 billion, to 4.42% of average loans, up 102 basis points from 1Q09
• Allowance for loan losses of $33.8 billion covers 3.61% of loans and, including the reserve for unfunded commitments, is $35.8 billion
– Consumer allowance is $25.2 billion, or 4.27% of loans
– Commercial allowance is $8.5 billion, or 2.48% of loans
* Schedule reflects a held basis. Managed losses would add $2,983 in 2Q09, an increase of $801 million from 1Q09 1 Includes $104 million reserve build in 2Q09 for commercial Merrill Lynch loans accounted for under SOP 03-03
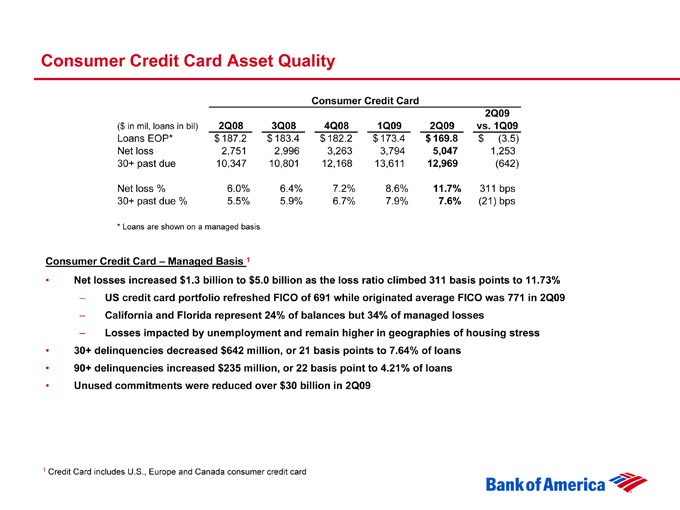
Consumer Credit Card Asset Quality
Consumer Credit Card
2Q09
($ in mil, loans in bil) 2Q08 3Q08 4Q08 1Q09 2Q09 vs. 1Q09
Loans EOP* $ 187.2 $ 183.4 $ 182.2 $ 173.4 $ 169.8 $ (3.5)
Net loss 2,751 2,996 3,263 3,794 5,047 1,253
30+ past due 10,347 10,801 12,168 13,611 12,969(642)
Net loss % 6.0% 6.4% 7.2% 8.6% 11.7% 311 bps
30+ past due % 5.5% 5.9% 6.7% 7.9% 7.6%(21) bps
* Loans are shown on a managed basis
Consumer Credit Card – Managed Basis 1
• Net losses increased $1.3 billion to $5.0 billion as the loss ratio climbed 311 basis points to 11.73%
– US credit card portfolio refreshed FICO of 691 while originated average FICO was 771 in 2Q09
– California and Florida represent 24% of balances but 34% of managed losses
– Losses impacted by unemployment and remain higher in geographies of housing stress
• 30+ delinquencies decreased $642 million, or 21 basis points to 7.64% of loans
• 90+ delinquencies increased $235 million, or 22 basis point to 4.21% of loans
• Unused commitments were reduced over $30 billion in 2Q09
1 Credit Card includes U.S., Europe and Canada consumer credit card
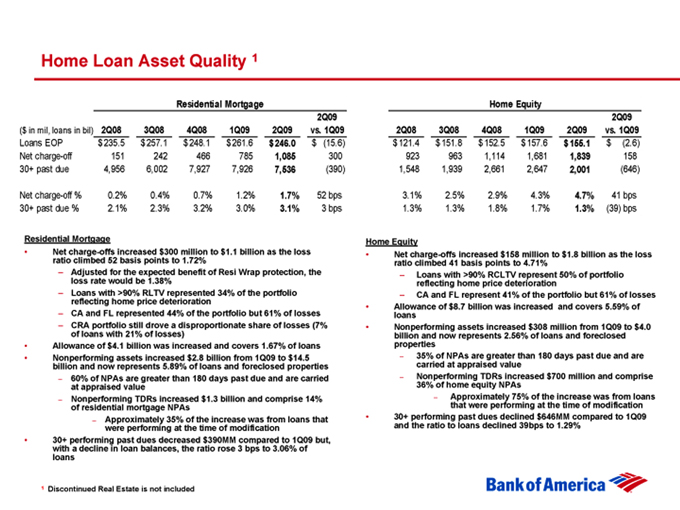
Home Loan Asset Quality 1
Residential Mortgage Home Equity
2Q09 2Q09
($ in mil, loans in bil) 2Q08 3Q08 4Q08 1Q09 2Q09 vs. 1Q09 2Q08 3Q08 4Q08 1Q09 2Q09 vs. 1Q09
Loans EOP $ 235.5 $ 257.1 $ 248.1 $ 261.6 $ 246.0 $ (15.6) $ 121.4 $ 151.8 $ 152.5 $ 157.6 $ 155.1 $ (2.6)
Net charge-off 151 242 466 785 1,085 300 923 964 1,113 1,681 1,839 158
30+ past due 4,956 6,002 7,927 7,926 7,533(393) 1,548 1,939 2,661 2,647 2,001(646)
Net charge-off % 0.2% 0.4% 0.7% 1.2% 1.7% 52 bps 3.1% 2.5% 2.9% 4.3% 4.7% 41 bps
30+ past due % 2.1% 2.3% 3.2% 3.0% 3.1% 3 bps 1.3% 1.3% 1.8% 1.7% 1.3%(39) bps
Residential Mortgage Home Equity
• Net charge-offs increased $300 million to $1.1 billion as the loss • Net charge-offs increased $158 million to $1.8 billion as the loss ratio climbed 52 basis points to 1.72% ratio climbed 41 basis points to 4.71%
– Adjusted for the expected benefit of Resi Wrap protection, the – Loans with >90% RCLTV represent 50% of portfolio loss rate would be 1.38% reflecting home price deterioration
– Loans with >90% RLTV represented 34% of the portfolio – CA and FL represent 41% of the portfolio but 61% of losses reflecting home price deterioration
• Allowance of $8.7 billion was increased and covers 5.59% of
– CA and FL represented 44% of the portfolio but 61% of losses loans
– CRA portfolio still drove a disproportionate share of losses (7% • Nonperforming assets increased $308 million from 1Q09 to $4.0 of loans with 21% of losses) billion and now represents 2.56% of loans
• Allowance of $4.1 billion was increased and covers 1.67% of loans – 35% of NPAs are greater than 180 days past due and are
• Nonperforming assets increased $2.8 billion from 1Q09 to $14.5 carried at appraised value billion and now represents 5.89% of loans and foreclosed properties – Nonperforming TDRs increased $700 million and comprise
– 60% of NPAs are greater than 180 days past due and are carried 36% of home equity NPAs at appraised value – Approximately 75% of the increase was from loans
– Nonperforming TDRs increased $1.3 billion and comprise 14% that were performing at the time of modification of residential mortgage NPAs • 30+ performing past dues declined $646MM compared to 1Q09
– Approximately 35% of the increase was from loans that and the ratio to loans declined 39bps to 1.29% were performing at the time of modification
• 30+ performing past dues decreased $390MM compared to 1Q09 but, with a decline in loan balances, the ratio rose 3 bps to 3.06% of loans
1 Discontinued Real Estate is not included

Direct/Indirect
Direct/Indirect Consumer Lending (Included in Direct/Indirect)
2Q09 2Q09
($ in mil, loans in bil) 2Q08 3Q08 4Q08 1Q09 2Q09 vs. 1Q09 2Q08 3Q08 4Q08 1Q09 2Q09 vs. 1Q09
Loans EOP $ 84.9 $ 82.8 $ 83.4 $ 99.7 $ 99.2 $ (0.5) $ 28.4 $ 28.7 $ 28.2 $ 26.6 $ 24.2 $ (2.4)
Net charge-off 660 845 1,054 1,249 1,475 226 486 608 746 921 1,208 287
30+ past due 2,706 3,211 3,980 4,145 4,019 (126) 1,621 1,982 2,449 2,687 2,405 (282)
Net charge-off % 3.2% 3.9% 5.0% 5.0% 5.9% 87 bps 7.1% 8.4% 10.4% 13.5% 18.9% 537 bps
30+ past due % 3.2% 3.9% 4.8% 4.2% 4.1% (11) bps 5.7% 6.9% 8.7% 10.1% 9.9% (17) bps
Direct/Indirect Loans Consumer Lending (part of Direct/Indirect)
• Net charge-offs increased $226 million to $1.5 billion • Consumer Lending portfolio of $24.2 billion had and the loss ratio rose 87 basis points to 5.90% increased losses of $287 million with a 2Q09 loss rate
– Driven by borrower stress within the of 18.90%
Consumer Lending portfolio • Allowance of $4.2 billion covers 17.24% of loans
• Allowance of $5.4 billion covers 5.41% of loans • 30+ delinquencies declined $282 million, or 17 basis
• Dealer Finance portfolio1of $40.9 billion had a decline points to 9.94% of loans of 82 basis point in loss rate to 1.96%, in part • 90+ delinquencies declined $75 million but the ratio seasonal increased 21 basis points to 5.50% with a decline in
– The auto portfolios of $27.8 billion had a 89 the balances basis points decrease in loss rate to 1.58%
• 30+ delinquencies decreased $126 million, or 10 basis points to 4.05% of loans
1 Includes auto originations, auto purchase loan portfolios and marine/recreational vehicle
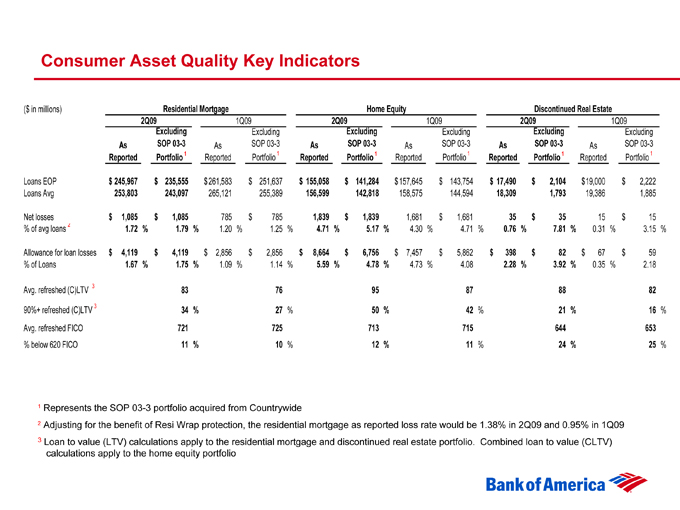
Consumer Asset Quality Key Indicators
($ in millions) Residential Mortgage Home Equity Discontinued Real Estate
2Q09 1Q09 2Q09 1Q09 2Q09 1Q09
Excluding Excluding Excluding Excluding Excluding Excluding
As SOP 03-3 As SOP 03-3 As SOP 03-3 As SOP 03-3 As SOP 03-3 As SOP 03-3
Reported Portfolio 1 Reported Portfolio 1 Reported Portfolio 1 Reported Portfolio 1 Reported Portfolio 1 Reported Portfolio 1
Loans EOP $ 245,967 $ 235,555 $ 261,583 $ 251,637 $ 155,058 $ 141,284 $ 157,645 $ 143,754 $ 17,490 $ 2,104 $ 19,000 $ 2,222
Loans Avg 253,803 243,097 265,121 255,389 156,599 142,818 158,575 144,594 18,309 1,793 19,386 1,885
Net losses $ 1,085 $ 1,085 785 $ 785 1,839 $ 1,839 1,681 $ 1,681 35 $ 35 15 $ 15
% of avg loans 2 1.72% 1.79% 1.20% 1.25% 4.71% 5.17% 4.30% 4.71% 0.76% 7.81% 0.31% 3.15%
Allowance for loan losses $ 4,119 $ 4,119 $ 2,856 $ 2,856 $ 8,664 $ 6,756 $ 7,457 $ 5,862 $ 398 $ 82 $ 67 $ 59
% of Loans 1.67% 1.75% 1.09% 1.14% 5.59% 4.78% 4.73% 4.08 2.28% 3.92% 0.35% 2.18
Avg. refreshed (C)LTV 3 83 76 95 87 88 82
90%+ refreshed (C)LTV 3 34% 27% 50% 42% 21% 16%
Avg. refreshed FICO 721 725 713 715 644 653
% below 620 FICO 11% 10% 12% 11% 24% 25%
1 Represents the SOP 03-3 portfolio acquired from Countrywide
2 Adjusting for the benefit of Resi Wrap protection, the residential mortgage as reported loss rate would be 1.38% in 2Q09 and 0.95% in 1Q09
3 Loan to value (LTV) calculations apply to the residential mortgage and discontinued real estate portfolio. Combined loan to value (CLTV) calculations apply to the home equity portfolio
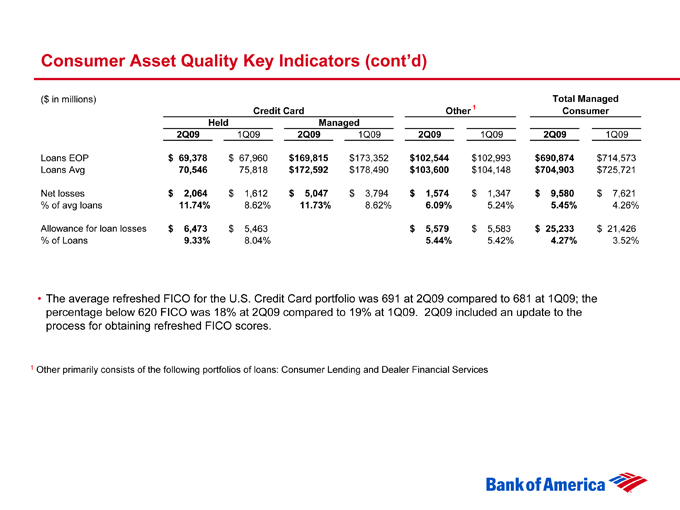
Consumer Asset Quality Key Indicators (cont’d)
($ in millions) Total Managed
Credit Card Other 1 Consumer
Held Managed
2Q09 1Q09 2Q09 1Q09 2Q09 1Q09 2Q09 1Q09
Loans EOP $ 69,378 $ 67,960 $169,815 $173,352 $102,544 $102,993 $690,874 $714,573
Loans Avg 70,546 75,818 $172,592 $178,490 $103,600 $104,148 $704,903 $725,721
Net losses $ 2,064 $ 1,612 $ 5,047 $ 3,794 $ 1,574 $ 1,347 $ 9,580 $ 7,621
% of avg loans 11.74% 8.62% 11.73% 8.62% 6.09% 5.24% 5.45% 4.26%
Allowance for loan losses $ 6,473 $ 5,463 $ 5,579 $ 5,583 $ 25,233 $ 21,426
% of Loans 9.33% 8.04% 5.44% 5.42% 4.27% 3.52%
• The average refreshed FICO for the U.S. Credit Card portfolio was 691 at 2Q09 compared to 681 at 1Q09; the percentage below 620 FICO was 18% at 2Q09 compared to 19% at 1Q09. 2Q09 included an update to the process for obtaining refreshed FICO scores.
1 Other primarily consists of the following portfolios of loans: Consumer Lending and Dealer Financial Services
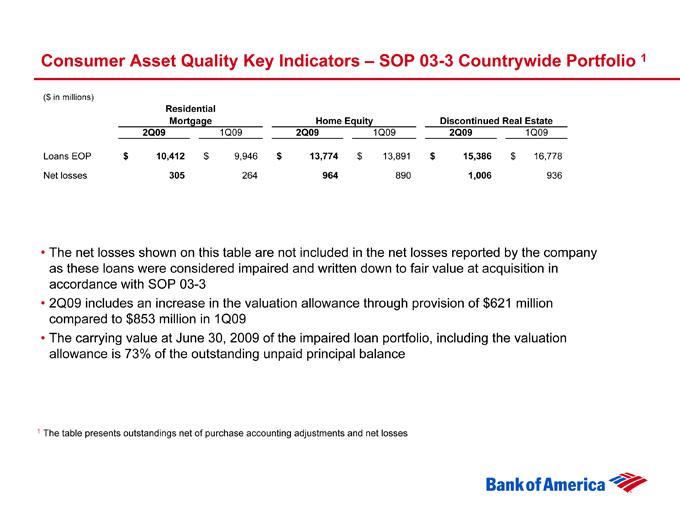
Consumer Asset Quality Key Indicators – SOP 03-3 Countrywide Portfolio 1
($ in millions)
Residential
Mortgage Home Equity Discontinued Real Estate
2Q09 1Q09 2Q09 1Q09 2Q09 1Q09
Loans EOP $ 10,412 $ 9,946 $ 13,774 $ 13,891 $ 15,386 $ 16,778
Net losses 305 264 964 890 1,006 936
• The net losses shown on this table are not included in the net losses reported by the company as these loans were considered impaired and written down to fair value at acquisition in accordance with SOP 03-3
• 2Q09 includes an increase in the valuation allowance through provision of $621 million compared to $853 million in 1Q09
• The carrying value at June 30, 2009 of the impaired loan portfolio, including the valuation allowance is 73% of the outstanding unpaid principal balance
1 The table presents outstandings net of purchase accounting adjustments and net losses
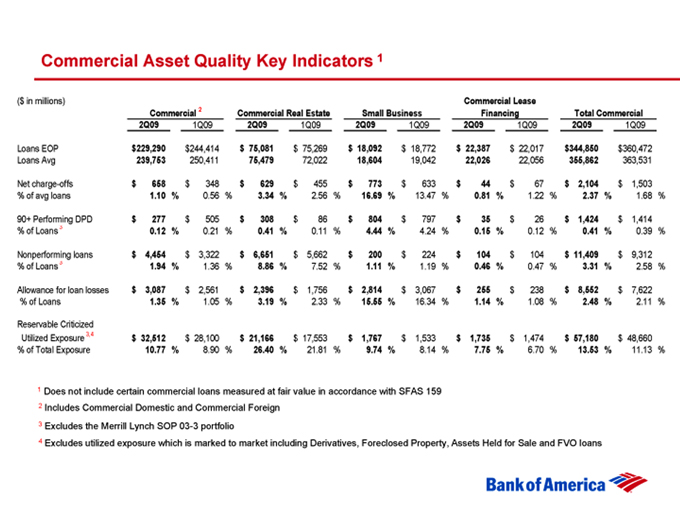
Commercial Asset Quality Key Indicators 1
($ in millions) Commercial Lease
Commercial 2 Commercial Real Estate Small Business Financing Total Commercial
2Q09 1Q09 2Q09 1Q09 2Q09 1Q09 2Q09 1Q09 2Q09 1Q09
Loans EOP $229,290 $244,414 $ 75,081 $ 75,269 $ 18,092 $ 18,772 $ 22,387 $ 22,017 $344,850 $360,472
Loans Avg 239,753 250,411 75,479 72,022 18,604 19,042 22,026 22,056 355,862 363,531
Net charge-offs $ 658 $ 348 $ 629 $ 455 $ 773 $ 633 $ 44 $ 67 $ 2,104 $ 1,503
% of avg loans 1.10% 0.56% 3.34% 2.56% 16.69% 13.47% 0.81% 1.22% 2.37% 1.68%
90+ Performing DPD $ 277 $ 505 $ 308 $ 86 $ 804 $ 797 $ 35 $ 26 $ 1,424 $ 1,414
% of Loans 0.12% 0.21% 0.41% 0.11% 4.44% 4.24% 0.15% 0.12% 0.41% 0.39%
Nonperforming loans $ 4,454 $ 3,322 $ 6,651 $ 5,662 $ 200 $ 224 $ 104 $ 104 $ 11,409 $ 9,312
% of Loans 1.94% 1.36% 8.86% 7.52% 1.11% 1.19% 0.46% 0.47% 3.31% 2.58%
Allowance for loan losses $ 3,087 $ 2,561 $ 2,396 $ 1,756 $ 2,814 $ 3,067 $ 255 $ 238 $ 8,552 $ 7,622
% of Loans 1.35% 1.05% 3.19% 2.33% 15.55% 16.34% 1.14% 1.08% 2.48% 2.11%
Reservable Criticized
Utilized Exposure 3,4 $ 32,512 $ 28,100 $ 21,166 $ 17,553 $ 1,767 $ 1,533 $ 1,735 $ 1,474 $ 57,180 $ 48,660
% of Total Exposure 10.77% 8.90% 26.40% 21.81% 9.74% 8.14% 7.75% 6.70% 13.53% 11.13%
1 Does not include certain commercial loans measured at fair value in accordance with SFAS 159
2 Includes Commercial Domestic and Commercial Foreign
3 Excludes the Merrill Lynch SOP 03-3 portfolio
4 Excludes utilized exposure which is marked to market including Derivatives, Foreclosed Property, Assets Held for Sale and FVO loans
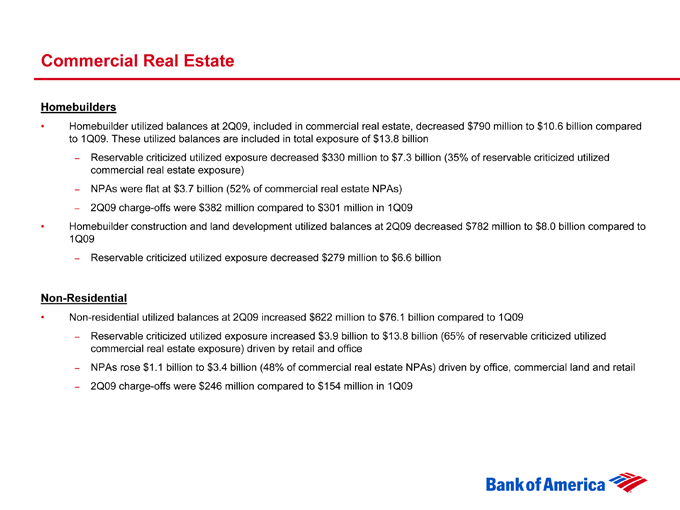
Commercial Real Estate
Homebuilders
• Homebuilder utilized balances at 2Q09, included in commercial real estate, decreased $790 million to $10.6 billion compared to 1Q09. These utilized balances are included in total exposure of $13.8 billion
– Reservable criticized utilized exposure decreased $330 million to $7.3 billion (35% of reservable criticized utilized commercial real estate exposure)
– NPAs were flat at $3.7 billion (52% of commercial real estate NPAs)
– 2Q09 charge-offs were $382 million compared to $301 million in 1Q09
• Homebuilder construction and land development utilized balances at 2Q09 decreased $782 million to $8.0 billion compared to 1Q09
– Reservable criticized utilized exposure decreased $279 million to $6.6 billion
• Non-residential utilized balances at 2Q09 increased $622 million to $76.1 billion compared to 1Q09
– Reservable criticized utilized exposure increased $3.9 billion to $13.8 billion (65% of reservable criticized utilized commercial real estate exposure) driven by retail and office
– NPAs rose $1.1 billion to $3.4 billion (48% of commercial real estate NPAs) driven by office, commercial land and retail
– 2Q09 charge-offs were $246 million compared to $154 million in 1Q09
Non-Residential
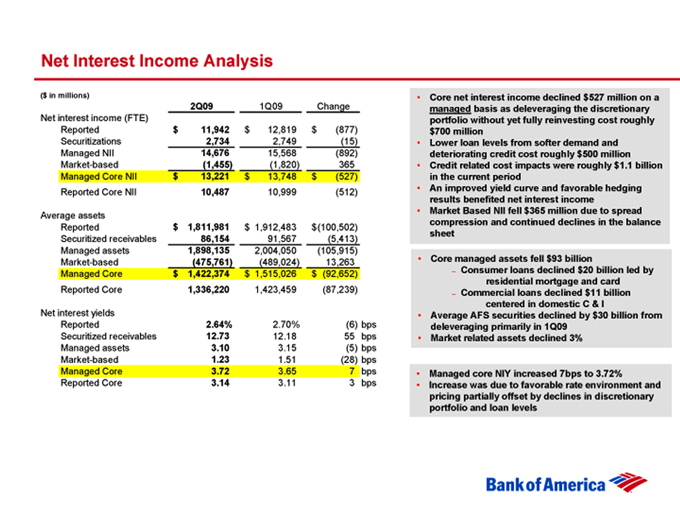
Net Interest Income Analysis
($ in millions)
2Q09 1Q09 Change
Net interest income (FTE)
Reported $ 11,942 $ 12,819 $(877)
Securitizations 2,734 2,749(15)
Managed NII 14,676 15,568(892)
Market-based(1,455)(1,820) 365
Managed Core NII $ 13,221 $ 13,748 $(527)
Reported Core NII 10,487 10,999(512)
Average assets
Reported $ 1,811,981 $ 1,912,483 $ (100,502)
Securitized receivables 86,154 91,567(5,413)
Managed assets 1,898,135 2,004,050(105,915)
Market-based(475,761)(489,024) 13,263
Managed Core $ 1,422,374 $ 1,515,026 $(92,652)
Reported Core 1,336,220 1,423,459(87,239)
Net interest yields
Reported 2.64% 2.70%(7) bps
Securitized receivables 12.73 12.04 69 bps
Managed assets 3.10 3.13(3) bps
Market-based 1.23 1.50(28) bps
Managed Core 3.72 3.65 7 bps
Reported Core 3.14 3.11 3 bps
• Core net interest income declined $527 million on a managed basis as deleveraging the discretionary portfolio without yet fully reinvesting cost roughly $700 million
• Lower loan levels from softer demand and deteriorating credit cost roughly $500 million
• Credit related cost impacts were roughly $1.1 billion in the current period
• An improved yield curve and favorable hedging results benefited net interest income
• Market Based NII fell $365 million due to spread compression and continued declines in the balance sheet
• Core managed assets fell $93 billion
– Consumer loans declined $20 billion led by residential mortgage and card
– Commercial loans declined $11 billion centered in domestic C & I
• Average AFS securities declined by $30 billion from deleveraging primarily in 1Q09
• Market related assets declined 3%
• Managed core NIY increased 7bps to 3.72%
• Increase was due to favorable rate environment and pricing partially offset by declines in discretionary portfolio and loan levels
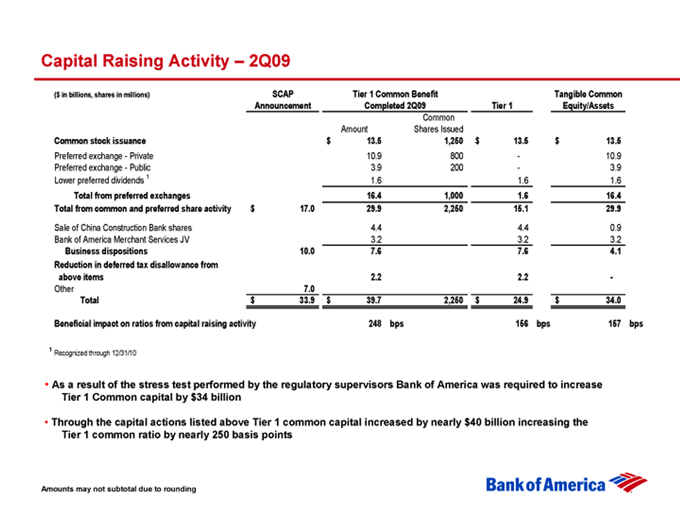
Capital Raising Activity – 2Q09
($ in billions, shares in millions) SCAP Tier 1 Common Benefit Tangible Common
Announcement Completed 2Q09 Tier 1 Equity/Assets
Common
Amount Shares Issued
Common stock issuance $ 13.5 1,250 $ 13.5 $ 13.5
Preferred exchange - Private 10.9 800 - 10.9
Preferred exchange - Public 3.9 200 - 3.9
Lower preferred dividends 1 1.6 1.6 1.6
Total from preferred exchanges 16.3 1,000 1.6 16.4
Total from common and preferred share activity $ 17.0 29.8 2,250 15.1 29.9
Sale of China Construction Bank shares 4.4 4.4 0.9
Bank of America Merchant Services JV 3.2 3.2 3.2
Business dispositions 10.0 7.6 7.6 4.1
Reduction in deferred tax disallowance from
above items 2.2 2.2 -
Other 7.0
Total $ 34.0 $ 39.7 2,250 $ 24.9 $ 34.0
Beneficial impact on ratios from capital raising activity 248 bps 156 bps 157 bps
1 Recognized through 12/31/10
• As a result of the stress test performed by the regulatory supervisors Bank of America was required to increase
Tier 1 Common capital by $34 billion
• Through the capital actions listed above Tier 1 common capital was increased by $40 billion increasing the Tier 1 common ratio by nearly 250 basis points
Amounts may not subtotal due to rounding
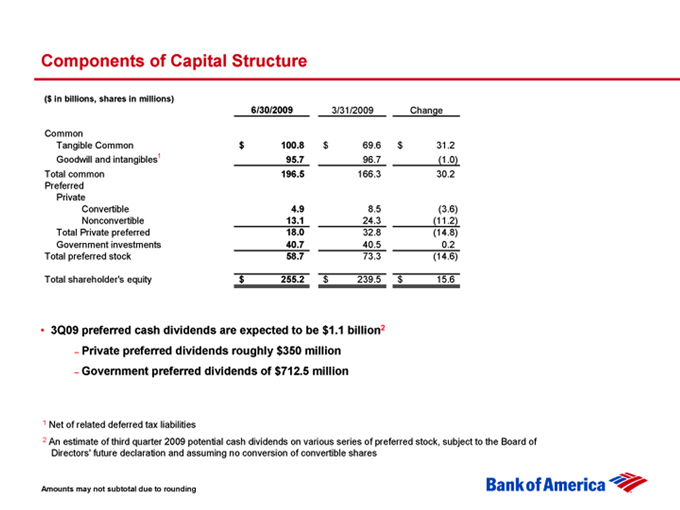
Components of Capital Structure
($ in billions, shares in millions)
6/30/2009 3/31/2009 Change
Common
Tangible Common $ 100.8 $ 69.6 $ 31.2
Goodwill and intangibles 95.7 96.7 (1.0)
Total common 196.5 166.3 30.2
Preferred
Private
Convertible 4.9 8.5 (3.6)
Nonconvertible 13.1 24.3 (11.2)
Total Private preferred 18.0 32.8 (14.8)
Government investments 40.7 40.5 0.2
Total preferred stock 58.7 73.3 (14.6)
Total shareholder’s equity $ 255.2 $ 239.5 $ 15.6
• 3Q09 preferred cash dividends are expected to be $1.1 billion1
– Private preferred dividends roughly $350 million
– Government preferred dividends of $712.5 million
1 An estimate of third quarter 2009 potential cash dividends on various series of preferred stock, subject to the Board of Directors’ future declaration and assuming no conversion of convertible shares
Amounts may not subtotal due to rounding