Exhibit 99.2

Supplemental Information
Third Quarter 2009
This information is preliminary and based on company data available at the time of the presentation. It speaks only as of the particular date or dates included in the accompanying pages. Bank of America does not undertake an obligation to, and disclaims any duty to, update any of the information provided. Any forward-looking statements in this information are subject to the forward-looking language contained in Bank of America’s reports filed with the SEC pursuant to the Securities Exchange Act of 1934, which are available at the SEC’s website (www.sec.gov) or at Bank of America’s website (www.bankofamerica.com). Bank of America’s future financial performance is subject to risks and uncertainties as described in its SEC filings.
| | |
| Bank of America Corporation and Subsidiaries | | |
| Table of Contents | | Page |
| |
Consolidated Financial Highlights | | 2 |
Supplemental Financial Data | | 3 |
Consolidated Statement of Income | | 4 |
Consolidated Balance Sheet | | 5 |
Capital Management | | 6 |
Core Net Interest Income - Managed Basis | | 7 |
Quarterly Average Balances and Interest Rates | | 8 |
Quarterly Average Balances and Interest Rates - Isolating Hedge Income/Expense | | 9 |
Year-to-Date Average Balances and Interest Rates | | 10 |
Year-to-Date Average Balances and Interest Rates - Isolating Hedge Income/Expense | | 11 |
Debt Securities and Available-for-Sale Marketable Equity Securities | | 12 |
Quarterly Results by Business Segment | | 13 |
Year-to-Date Results by Business Segment | | 14 |
Deposits | | |
Total Segment Results | | 15 |
Key Indicators | | 16 |
Global Card Services | | |
Total Segment Results | | 17 |
Key Indicators | | 18 |
Home Loans & Insurance | | |
Total Segment Results | | 19 |
Key Indicators | | 20 |
Global Banking | | |
Total Segment Results | | 21 |
Key Indicators | | 22 |
Investment Banking Product Rankings | | 23 |
Global Markets | | |
Total Segment Results | | 24 |
Off-Balance Sheet Special Purpose Entities Liquidity Exposure | | 25 |
Super Senior Collateralized Debt Obligation Exposure | | 26 |
Unhedged Subprime Super Senior Collateralized Debt Obligation Carrying Values | | 27 |
Global Wealth & Investment Management | | |
Total Segment Results | | 28 |
Quarter-to-Date Business Results | | 29 |
Year-to-Date Business Results | | 30 |
Key Indicators | | 31 |
All Other | | |
Total Segment Results | | 32 |
Equity Investments | | 33 |
Outstanding Loans and Leases | | 34 |
Quarterly Average Loans and Leases by Business Segment | | 35 |
Commercial Credit Exposure by Industry | | 36 |
Net Credit Default Protection by Maturity Profile and Credit Exposure Debt Rating | | 37 |
Selected Emerging Markets | | 38 |
Nonperforming Assets | | 39 |
Nonperforming Asset Activity | | 40 |
Quarterly Net Charge-offs/Losses and Net Charge-off/Loss Ratios | | 41 |
YTD Net Charge-offs/Losses and Net Charge-off/Loss Ratios | | 42 |
Allocation of the Allowance for Credit Losses by Product Type | | 43 |
| |
Exhibit A: Non-GAAP Reconciliations | | 44 |
| |
Appendix: Selected Slides from the Third Quarter 2009 Earnings Release Presentation | | 46 |
Bank of America Corporation and Subsidiaries
Consolidated Financial Highlights
(Dollars in millions, except per share information; shares in thousands)
| | | | | | | | | | | | | | | | | | | | | | | | | | | | | | | | | | | | | | | |
| | | Nine Months Ended
September 30 | | | | Third
Quarter
2009(1) | | | | | Second
Quarter
2009 | | | | | First
Quarter
2009 | | | | Fourth
Quarter
2008(1) | | | | | Third
Quarter
2008 | | |
| | | 2009 | | | | | 2008 | | | | | | | | | | | | |
Income statement | | | | | | | | | | | | | | | | | | | | | | | | | | | | | | | | | | | | | | | |
Net interest income | | $ | 35,550 | | | | | $ | 32,254 | | | | $ | 11,423 | | | | | $ | 11,630 | | | | | $ | 12,497 | | | | $ | 13,106 | | | | | $ | 11,642 | | |
Noninterest income | | | 59,017 | | | | | | 24,848 | | | | | 14,612 | | | | | | 21,144 | | | | | | 23,261 | | | | | 2,574 | | | | | | 7,979 | | |
Total revenue, net of interest expense | | | 94,567 | | | | | | 57,102 | | | | | 26,035 | | | | | | 32,774 | | | | | | 35,758 | | | | | 15,680 | | | | | | 19,621 | | |
Provision for credit losses | | | 38,460 | | | | | | 18,290 | | | | | 11,705 | | | | | | 13,375 | | | | | | 13,380 | | | | | 8,535 | | | | | | 6,450 | | |
Noninterest expense, before merger and restructuring charges | | | 48,140 | | | | | | 29,953 | | | | | 15,712 | | | | | | 16,191 | | | | | | 16,237 | | | | | 10,641 | | | | | | 11,413 | | |
Merger and restructuring charges | | | 2,188 | | | | | | 629 | | | | | 594 | | | | | | 829 | | | | | | 765 | | | | | 306 | | | | | | 247 | | |
Income tax expense (benefit) | | | (691 | ) | | | | | 2,433 | | | | | (975 | ) | | | | | (845 | ) | | | | | 1,129 | | | | | (2,013 | ) | | | | | 334 | | |
Net income (loss) | | | 6,470 | | | | | | 5,797 | | | | | (1,001 | ) | | | | | 3,224 | | | | | | 4,247 | | | | | (1,789 | ) | | | | | 1,177 | | |
Preferred stock dividends | | | 3,478 | | | | | | 849 | | | | | 1,240 | | | | | | 805 | | | | | | 1,433 | | | | | 603 | | | | | | 473 | | |
Net income (loss) applicable to common shareholders | | | 2,992 | | | | | | 4,948 | | | | | (2,241 | ) | | | | | 2,419 | | | | | | 2,814 | | | | | (2,392 | ) | | | | | 704 | | |
Diluted earnings (loss) per common share | | | 0.39 | | | | | | 1.09 | | | | | (0.26 | ) | | | | | 0.33 | | | | | | 0.44 | | | | | (0.48 | ) | | | | | 0.15 | | |
Average diluted common shares issued and outstanding | | | 7,449,911 | | | | | | 4,477,994 | | | | | 8,633,834 | | | | | | 7,269,518 | | | | | | 6,431,027 | | | | | 4,957,049 | | | | | | 4,547,578 | | |
Dividends paid per common share | | $ | 0.03 | | | | | $ | 1.92 | | | | $ | 0.01 | | | | | $ | 0.01 | | | | | $ | 0.01 | | | | $ | 0.32 | | | | | $ | 0.64 | | |
| | | | | | | | | | | | | | |
Performance ratios | | | | | | | | | | | | | | | | | | | | | | | | | | | | | | | | | | | | | | | |
Return on average assets | | | 0.35 | | | % | | | 0.43 | | % | | | n/m | | | % | | | 0.53 | | | % | | | 0.68 | | % | | | n/m | | | % | | | 0.25 | | % |
Return on average common shareholders’ equity | | | 2.26 | | | | | | 4.68 | | | | | n/m | | | | | | 5.59 | | | | | | 7.10 | | | | | n/m | | | | | | 1.97 | | |
Return on average tangible common shareholders’ equity(2) | | | 10.42 | | | | | | 14.29 | | | | | n/m | | | | | | 16.90 | | | | | | 24.37 | | | | | n/m | | | | | | 8.92 | | |
Return on average tangible shareholders’ equity(2) | | | 5.83 | | | | | | 10.50 | | | | | n/m | | | | | | 8.86 | | | | | | 12.42 | | | | | n/m | | | | | | 6.11 | | |
At period end | | | | | | | | | | | | | | | | | | | | | | | | | | | | | | | | | | | | | | | |
Book value per share of common stock | | $ | 22.99 | | | | | $ | 30.01 | | | | $ | 22.99 | | | | | $ | 22.71 | | | | | $ | 25.98 | | | | $ | 27.77 | | | | | $ | 30.01 | | |
Tangible book value per share of common stock(2) | | | 12.00 | | | | | | 10.50 | | | | | 12.00 | | | | | | 11.66 | | | | | | 10.88 | | | | | 10.11 | | | | | | 10.50 | | |
Market price per share of common stock: | | | | | | | | | | | | | | | | | | | | | | | | | | | | | | | | | | | | | | | |
Closing price | | $ | 16.92 | | | | | $ | 35.00 | | | | $ | 16.92 | | | | | $ | 13.20 | | | | | $ | 6.82 | | | | $ | 14.08 | | | | | $ | 35.00 | | |
High closing price for the period | | | 17.98 | | | | | | 45.03 | | | | | 17.98 | | | | | | 14.17 | | | | | | 14.33 | | | | | 38.13 | | | | | | 37.48 | | |
Low closing price for the period | | | 3.14 | | | | | | 18.52 | | | | | 11.84 | | | | | | 7.05 | | | | | | 3.14 | | | | | 11.25 | | | | | | 18.52 | | |
Market capitalization | | | 146,363 | | | | | | 159,672 | | | | | 146,363 | | | | | | 114,199 | | | | | | 43,654 | | | | | 70,645 | | | | | | 159,672 | | |
| | | | | | | | | | | | | | |
Number of banking centers - domestic | | | 6,008 | | | | | | 6,139 | | | | | 6,008 | | | | | | 6,109 | | | | | | 6,145 | | | | | 6,139 | | | | | | 6,139 | | |
Number of branded ATMs - domestic | | | 18,254 | | | | | | 18,584 | | | | | 18,254 | | | | | | 18,426 | | | | | | 18,532 | | | | | 18,685 | | | | | | 18,584 | | |
Full-time equivalent employees | | | 281,863 | | | | | | 247,024 | | | | | 281,863 | | | | | | 282,408 | | | | | | 286,625 | | | | | 240,202 | | | | | | 247,024 | | |
| (1) | Due to a net loss for the three months ended September 30, 2009 and December 31, 2008, the impact of antidilutive equity instruments were excluded from diluted earnings per share and average diluted common shares. |
| (2) | Tangible equity ratios and tangible book value per share of common stock are non-GAAP measures. For corresponding reconciliations of average tangible common shareholders’ equity and tangible shareholders’ equity to GAAP financial measures, see Supplemental Financial Data on page 3. We believe the use of these non-GAAP measures provides additional clarity in assessing the results of the Corporation. |
n/m = not meaningful
Certain prior period amounts have been reclassified to conform to current period presentation.
Information for periods beginning July 1, 2008 includes the Countrywide acquisition. Information for periods beginning January 1, 2009 includes the
Merrill Lynch acquisition. Prior periods have not been restated.
| | |
| This information is preliminary and based on company data available at the time of the presentation. | | 2 |
Bank of America Corporation and Subsidiaries
Supplemental Financial Data
(Dollars in millions)
Fully taxable-equivalent basis data
| | | | | | | | | | | | | | | | | | | | | | | | | | | | | | | | | | | | | | | | | | | | |
| | | Nine Months Ended
September 30 | | | | | | | Third
Quarter | | | | | Second
Quarter | | | | | First
Quarter | | | | | Fourth
Quarter | | | | | Third
Quarter | | | |
| | | 2009 | | | | | 2008 | | | | | | 2009 | | | | 2009 | | | | 2009 | | | | 2008 | | | | 2008 | | |
Net interest income | | $ | 36,514 | | | | | $ | 33,148 | | | | | | | $ | 11,753 | | | | | $ | 11,942 | | | | | $ | 12,819 | | | | | $ | 13,406 | | | | | $ | 11,920 | | | |
Total revenue, net of interest expense | | | 95,531 | | | | | | 57,996 | | | | | | | | 26,365 | | | | | $ | 33,086 | | | | | | 36,080 | | | | | | 15,980 | | | | | | 19,899 | | | |
Net interest yield | | | 2.65 | | | % | | | 2.86 | | | % | | | | | 2.61 | | | % | | | 2.64 | | | % | | | 2.70 | | | % | | | 3.31 | | | % | | | 2.93 | | | % |
Efficiency ratio | | | 52.68 | | | | | | 52.73 | | | | | | | | 61.84 | | | | | | 51.44 | | | | | | 47.12 | | | | | | 68.51 | | | | | | 58.60 | | | |
Reconciliation to GAAP financial measures The Corporation evaluates its business based upon ratios that utilize tangible equity which is a non-GAAP measure. Return on average tangible shareholders’ equity measures the Corporation’s earnings contribution as a percentage of shareholders’ equity reduced by goodwill and intangible assets (excluding mortgage servicing rights), net of related deferred tax liabilities. The tangible equity ratio and the tangible common equity ratio represent shareholders’ equity, common or total as applicable, less goodwill and intangible assets (excluding mortgage servicing rights), net of related deferred tax liabilities divided by total assets less goodwill and intangible assets (excluding mortgage servicing rights), net of related deferred tax liabilities. These measures are used to evaluate the Corporation’s use of equity (i.e., capital). In addition, profitability, relationship, and investment models all use return on average tangible shareholders’ equity as key measures to support our overall growth goals. Also, the efficiency ratio measures the costs expended to generate a dollar of revenue. We believe the use of these non-GAAP measures provides additional clarity in assessing the results of the Corporation. Other companies may define or calculate supplemental financial data differently. See the tables below for supplemental financial data and corresponding reconciliations to GAAP financial measures for the three months ended September 30, 2009, June 30, 2009, March 31, 2009, December 31, 2008 and September 30, 2008, and the nine months ended September 30, 2009 and 2008. Reconciliation of average shareholders’ equity to average tangible shareholders’ equity |
Shareholders’ equity | | $ | 242,638 | | | | | $ | 160,890 | | | | | | | $ | 255,983 | | | | | $ | 242,867 | | | | | $ | 228,766 | | | | | $ | 176,566 | | | | | $ | 166,454 | | | |
Goodwill | | | (86,028 | ) | | | | | (79,150 | ) | | | | | | | (86,170 | ) | | | | | (87,314 | ) | | | | | (84,584 | ) | | | | | (81,841 | ) | | | | | (81,977 | ) | | |
Intangible assets (excluding MSRs) | | | (12,107 | ) | | | | | (9,731 | ) | | | | | | | (13,223 | ) | | | | | (13,595 | ) | | | | | (9,461 | ) | | | | | (8,818 | ) | | | | | (9,547 | ) | | |
Related deferred tax liabilities | | | 3,873 | | | | | | 1,738 | | | | | | | | 3,725 | | | | | | 3,916 | | | | | | 3,977 | | | | | | 1,913 | | | | | | 1,683 | | | |
| | | | | | | | | | | | | | | | | | | | | | | | | | | | | | | | | | | | | | | | | | | | |
Tangible shareholders’ equity | | $ | 148,376 | | | | | $ | 73,747 | | | | | | | $ | 160,315 | | | | | $ | 145,874 | | | | | $ | 138,698 | | | | | $ | 87,820 | | | | | $ | 76,613 | | | |
| | | | | | | | | | | | | | | | | | | | | | | | | | | | | | | | | | | | | | | | | | | | |
Reconciliation of average common shareholders’ equity to average tangible common shareholders’ equity |
Common shareholders’ equity | | $ | 177,289 | | | | | $ | 141,337 | | | | | | | $ | 197,230 | | | | | $ | 173,497 | | | | | $ | 160,739 | | | | | $ | 142,535 | | | | | $ | 142,303 | | | |
Goodwill | | | (86,028 | ) | | | | | (79,150 | ) | | | | | | | (86,170 | ) | | | | | (87,314 | ) | | | | | (84,584 | ) | | | | | (81,841 | ) | | | | | (81,977 | ) | | |
Intangible assets (excluding MSRs) | | | (12,107 | ) | | | | | (9,731 | ) | | | | | | | (13,223 | ) | | | | | (13,595 | ) | | | | | (9,461 | ) | | | | | (8,818 | ) | | | | | (9,547 | ) | | |
Related deferred tax liabilities | | | 3,873 | | | | | | 1,738 | | | | | | | | 3,725 | | | | | | 3,916 | | | | | | 3,977 | | | | | | 1,913 | | | | | | 1,683 | | | |
| | | | | | | | | | | | | | | | | | | | | | | | | | | | | | | | | | | | | | | | | | | | |
Tangible common shareholders’ equity | | $ | 83,027 | | | | | $ | 54,194 | | | | | | | $ | 101,562 | | | | | $ | 76,504 | | | | | $ | 70,671 | | | | | $ | 53,789 | | | | | $ | 52,462 | | | |
| | | | | | | | | | | | | | | | | | | | | | | | | | | | | | | | | | | | | | | | | | | | |
Reconciliation of period end shareholders’ equity to period end tangible shareholders’ equity |
Shareholders’ equity | | $ | 257,683 | | | | | $ | 161,039 | | | | | | | $ | 257,683 | | | | | $ | 255,152 | | | | | $ | 239,549 | | | | | $ | 177,052 | | | | | $ | 161,039 | | | |
Goodwill | | | (86,009 | ) | | | | | (81,756 | ) | | | | | | | (86,009 | ) | | | | | (86,246 | ) | | | | | (86,910 | ) | | | | | (81,934 | ) | | | | | (81,756 | ) | | |
Intangible assets (excluding MSRs) | | | (12,715 | ) | | | | | (9,167 | ) | | | | | | | (12,715 | ) | | | | | (13,245 | ) | | | | | (13,703 | ) | | | | | (8,535 | ) | | | | | (9,167 | ) | | |
Related deferred tax liabilities | | | 3,714 | | | | | | 1,914 | | | | | | | | 3,714 | | | | | | 3,843 | | | | | | 3,958 | | | | | | 1,854 | | | | | | 1,914 | | | |
| | | | | | | | | | | | | | | | | | | | | | | | | | | | | | | | | | | | | | | | | | | | |
Tangible shareholders’ equity | | $ | 162,673 | | | | | $ | 72,030 | | | | | | | $ | 162,673 | | | | | $ | 159,504 | | | | | $ | 142,894 | | | | | $ | 88,437 | | | | | $ | 72,030 | | | |
| | | | | | | | | | | | | | | | | | | | | | | | | | | | | | | | | | | | | | | | | | | | |
Reconciliation of period end common shareholders’ equity to period end tangible common shareholders’ equity |
Common shareholders’ equity | | $ | 198,843 | | | | | $ | 136,888 | | | | | | | $ | 198,843 | | | | | $ | 196,492 | | | | | $ | 166,272 | | | | | $ | 139,351 | | | | | $ | 136,888 | | | |
Goodwill | | | (86,009 | ) | | | | | (81,756 | ) | | | | | | | (86,009 | ) | | | | | (86,246 | ) | | | | | (86,910 | ) | | | | | (81,934 | ) | | | | | (81,756 | ) | | |
Intangible assets (excluding MSRs) | | | (12,715 | ) | | | | | (9,167 | ) | | | | | | | (12,715 | ) | | | | | (13,245 | ) | | | | | (13,703 | ) | | | | | (8,535 | ) | | | | | (9,167 | ) | | |
Related deferred tax liabilities | | | 3,714 | | | | | | 1,914 | | | | | | | | 3,714 | | | | | | 3,843 | | | | | | 3,958 | | | | | | 1,854 | | | | | | 1,914 | | | |
| | | | | | | | | | | | | | | | | | | | | | | | | | | | | | | | | | | | | | | | | | | | |
Tangible common shareholders’ equity | | $ | 103,833 | | | | | $ | 47,879 | | | | | | | $ | 103,833 | | | | | $ | 100,844 | | | | | $ | 69,617 | | | | | $ | 50,736 | | | | | $ | 47,879 | | | |
| | | | | | | | | | | | | | | | | | | | | | | | | | | | | | | | | | | | | | | | | | | | |
Reconciliation of period end assets to period end tangible assets |
Assets | | $ | 2,251,043 | | | | | $ | 1,831,177 | | | | | | | $ | 2,251,043 | | | | | $ | 2,254,394 | | | | | $ | 2,321,963 | | | | | $ | 1,817,943 | | | | | $ | 1,831,177 | | | |
Goodwill | | | (86,009 | ) | | | | | (81,756 | ) | | | | | | | (86,009 | ) | | | | | (86,246 | ) | | | | | (86,910 | ) | | | | | (81,934 | ) | | | | | (81,756 | ) | | |
Intangible assets (excluding MSRs) | | | (12,715 | ) | | | | | (9,167 | ) | | | | | | | (12,715 | ) | | | | | (13,245 | ) | | | | | (13,703 | ) | | | | | (8,535 | ) | | | | | (9,167 | ) | | |
Related deferred tax liabilities | | | 3,714 | | | | | | 1,914 | | | | | | | | 3,714 | | | | | | 3,843 | | | | | | 3,958 | | | | | | 1,854 | | | | | | 1,914 | | | |
| | | | | | | | | | | | | | | | | | | | | | | | | | | | | | | | | | | | | | | | | | | | |
Tangible assets | | $ | 2,156,033 | | | | | $ | 1,742,168 | | | | | | | $ | 2,156,033 | | | | | $ | 2,158,746 | | | | | $ | 2,225,308 | | | | | $ | 1,729,328 | | | | | $ | 1,742,168 | | | |
| | | | | | | | | | | | | | | | | | | | | | | | | | | | | | | | | | | | | | | | | | | | |
Certain prior period amounts have been reclassified to conform to current period presentation.
Information for periods beginning July 1, 2008 includes the Countrywide acquisition. Information for periods beginning January 1, 2009 includes the
Merrill Lynch acquisition. Prior periods have not been restated.
| | |
| This information is preliminary and based on company data available at the time of the presentation. | | 3 |
Bank of America Corporation and Subsidiaries
Consolidated Statement of Income
(Dollars in millions, except per share information; shares in thousands)
| | | | | | | | | | | | | | | | | | | | | | | | | | | | | | |
| | | Nine Months Ended
September 30 | | | | | Third
Quarter
2009(1) | | | Second
Quarter
2009 | | | First
Quarter
2009 | | | Fourth
Quarter
2008(1) | | | Third
Quarter
2008 | |
| | | 2009 | | | 2008 | | | | | | | | |
Interest income | | | | | | | | | | | | | | | | | | | | | | | | | | | | | | |
Interest and fees on loans and leases | | $ | 37,298 | | | $ | 41,797 | | | | | $ | 11,620 | | | $ | 12,329 | | | $ | 13,349 | | | $ | 14,220 | | | $ | 14,261 | |
Interest on debt securities | | | 10,088 | | | | 9,295 | | | | | | 2,975 | | | | 3,283 | | | | 3,830 | | | | 3,851 | | | | 3,621 | |
Federal funds sold and securities borrowed or purchased under agreements to resell | | | 2,567 | | | | 2,920 | | | | | | 722 | | | | 690 | | | | 1,155 | | | | 393 | | | | 912 | |
Trading account assets | | | 6,223 | | | | 6,937 | | | | | | 1,843 | | | | 1,952 | | | | 2,428 | | | | 2,120 | | | | 2,344 | |
Other interest income | | | 4,095 | | | | 3,133 | | | | | | 1,363 | | | | 1,338 | | | | 1,394 | | | | 1,018 | | | | 1,058 | |
| | | | | | | | | | | | | | | | | | | | | | | | | | | | | | |
Total interest income | | | 60,271 | | | | 64,082 | | | | | | 18,523 | | | | 19,592 | | | | 22,156 | | | | 21,602 | | | | 22,196 | |
| | | | | | | | | | | | | | | | | | | | | | | | | | | | | | |
Interest expense | | | | | | | | | | | | | | | | | | | | | | | | | | | | | | |
Deposits | | | 6,335 | | | | 11,954 | | | | | | 1,710 | | | | 2,082 | | | | 2,543 | | | | 3,296 | | | | 3,846 | |
Short-term borrowings | | | 4,854 | | | | 10,452 | | | | | | 1,237 | | | | 1,396 | | | | 2,221 | | | | 1,910 | | | | 3,223 | |
Trading account liabilities | | | 1,484 | | | | 2,250 | | | | | | 455 | | | | 450 | | | | 579 | | | | 524 | | | | 661 | |
Long-term debt | | | 12,048 | | | | 7,172 | | | | | | 3,698 | | | | 4,034 | | | | 4,316 | | | | 2,766 | | | | 2,824 | |
| | | | | | | | | | | | | | | | | | | | | | | | | | | | | | |
Total interest expense | | | 24,721 | | | | 31,828 | | | | | | 7,100 | | | | 7,962 | | | | 9,659 | | | | 8,496 | | | | 10,554 | |
| | | | | | | | | | | | | | | | | | | | | | | | | | | | | | |
Net interest income | | | 35,550 | | | | 32,254 | | | | | | 11,423 | | | | 11,630 | | | | 12,497 | | | | 13,106 | | | | 11,642 | |
| | | | | | | | |
Noninterest income | | | | | | | | | | | | | | | | | | | | | | | | | | | | | | |
Card income | | | 6,571 | | | | 10,212 | | | | | | 1,557 | | | | 2,149 | | | | 2,865 | | | | 3,102 | | | | 3,122 | |
Service charges | | | 8,282 | | | | 7,757 | | | | | | 3,020 | | | | 2,729 | | | | 2,533 | | | | 2,559 | | | | 2,722 | |
Investment and brokerage services | | | 8,905 | | | | 3,900 | | | | | | 2,948 | | | | 2,994 | | | | 2,963 | | | | 1,072 | | | | 1,238 | |
Investment banking income | | | 3,955 | | | | 1,645 | | | | | | 1,254 | | | | 1,646 | | | | 1,055 | | | | 618 | | | | 474 | |
Equity investment income (loss) | | | 7,988 | | | | 1,330 | | | | | | 843 | | | | 5,943 | | | | 1,202 | | | | (791 | ) | | | (316 | ) |
Trading account profits (losses) | | | 10,760 | | | | (1,810 | ) | | | | | 3,395 | | | | 2,164 | | | | 5,201 | | | | (4,101 | ) | | | (384 | ) |
Mortgage banking income | | | 7,139 | | | | 2,564 | | | | | | 1,298 | | | | 2,527 | | | | 3,314 | | | | 1,523 | | | | 1,674 | |
Insurance income | | | 2,057 | | | | 1,092 | | | | | | 707 | | | | 662 | | | | 688 | | | | 741 | | | | 678 | |
Gains on sales of debt securities | | | 3,684 | | | | 362 | | | | | | 1,554 | | | | 632 | | | | 1,498 | | | | 762 | | | | 10 | |
Other income (loss) | | | 1,870 | | | | (206 | ) | | | | | (1,167 | ) | | | 724 | | | | 2,313 | | | | (1,448 | ) | | | (317 | ) |
Other-than-temporary impairment losses on AFS debt securities: | | | | | | | | | | | | | | | | | | | | | | | | | | | | | | |
Total other-than-temporary impairment losses on AFS debt securities | | | (2,671 | ) | | | (1,998 | ) | | | | | (847 | ) | | | (1,110 | ) | | | (714 | ) | | | (1,463 | ) | | | (922 | ) |
Portion of other-than-temporary impairment losses recognized in OCI on AFS debt securities | | | 477 | | | | — | | | | | | 50 | | | | 84 | | | | 343 | | | | — | | | | — | |
| | | | | | | | | | | | | | | | | | | | | | | | | | | | | | |
Net impairment losses recognized in earnings on AFS debt securities | | | (2,194 | ) | | | (1,998 | ) | | | | | (797 | ) | | | (1,026 | ) | | | (371 | ) | | | (1,463 | ) | | | (922 | ) |
| | | | | | | | | | | | | | | | | | | | | | | | | | | | | | |
Total noninterest income | | | 59,017 | | | | 24,848 | | | | | | 14,612 | | | | 21,144 | | | | 23,261 | | | | 2,574 | | | | 7,979 | |
| | | | | | | | | | | | | | | | | | | | | | | | | | | | | | |
Total revenue, net of interest expense | | | 94,567 | | | | 57,102 | | | | | | 26,035 | | | | 32,774 | | | | 35,758 | | | | 15,680 | | | | 19,621 | |
| | | | | | | | |
Provision for credit losses | | | 38,460 | | | | 18,290 | | | | | | 11,705 | | | | 13,375 | | | | 13,380 | | | | 8,535 | | | | 6,450 | |
| | | | | | | | |
Noninterest expense | | | | | | | | | | | | | | | | | | | | | | | | | | | | | | |
Personnel | | | 24,171 | | | | 14,344 | | | | | | 7,613 | | | | 7,790 | | | | 8,768 | | | | 4,027 | | | | 5,198 | |
Occupancy | | | 3,567 | | | | 2,623 | | | | | | 1,220 | | | | 1,219 | | | | 1,128 | | | | 1,003 | | | | 926 | |
Equipment | | | 1,855 | | | | 1,208 | | | | | | 617 | | | | 616 | | | | 622 | | | | 447 | | | | 440 | |
Marketing | | | 1,490 | | | | 1,813 | | | | | | 470 | | | | 499 | | | | 521 | | | | 555 | | | | 605 | |
Professional fees | | | 1,511 | | | | 1,071 | | | | | | 562 | | | | 544 | | | | 405 | | | | 521 | | | | 424 | |
Amortization of intangibles | | | 1,546 | | | | 1,357 | | | | | | 510 | | | | 516 | | | | 520 | | | | 477 | | | | 464 | |
Data processing | | | 1,861 | | | | 1,905 | | | | | | 592 | | | | 621 | | | | 648 | | | | 641 | | | | 755 | |
Telecommunications | | | 1,033 | | | | 814 | | | | | | 361 | | | | 345 | | | | 327 | | | | 292 | | | | 288 | |
Other general operating | | | 11,106 | | | | 4,818 | | | | | | 3,767 | | | | 4,041 | | | | 3,298 | | | | 2,678 | | | | 2,313 | |
Merger and restructuring charges | | | 2,188 | | | | 629 | | | | | | 594 | | | | 829 | | | | 765 | | | | 306 | | | | 247 | |
| | | | | | | | | | | | | | | | | | | | | | | | | | | | | | |
Total noninterest expense | | | 50,328 | | | | 30,582 | | | | | | 16,306 | | | | 17,020 | | | | 17,002 | | | | 10,947 | | | | 11,660 | |
| | | | | | | | | | | | | | | | | | | | | | | | | | | | | | |
Income (loss) before income taxes | | | 5,779 | | | | 8,230 | | | | | | (1,976 | ) | | | 2,379 | | | | 5,376 | | | | (3,802 | ) | | | 1,511 | |
Income tax expense (benefit) | | | (691 | ) | | | 2,433 | | | | | | (975 | ) | | | (845 | ) | | | 1,129 | | | | (2,013 | ) | | | 334 | |
| | | | | | | | | | | | | | | | | | | | | | | | | | | | | | |
Net income (loss) | | $ | 6,470 | | | $ | 5,797 | | | | | $ | (1,001 | ) | | $ | 3,224 | | | $ | 4,247 | | | $ | (1,789 | ) | | $ | 1,177 | |
| | | | | | | | | | | | | | | | | | | | | | | | | | | | | | |
Preferred stock dividends | | | 3,478 | | | | 849 | | | | | | 1,240 | | | | 805 | | | | 1,433 | | | | 603 | | | | 473 | |
| | | | | | | | | | | | | | | | | | | | | | | | | | | | | | |
Net income (loss) applicable to common shareholders | | $ | 2,992 | | | $ | 4,948 | | | | | $ | (2,241 | ) | | $ | 2,419 | | | $ | 2,814 | | | $ | (2,392 | ) | | $ | 704 | |
| | | | | | | | | | | | | | | | | | | | | | | | | | | | | | |
| | | | | | | | |
Per common share information | | | | | | | | | | | | | | | | | | | | | | | | | | | | | | |
Earnings (loss) | | $ | 0.39 | | | $ | 1.09 | | | | | $ | (0.26 | ) | | $ | 0.33 | | | $ | 0.44 | | | $ | (0.48 | ) | | $ | 0.15 | |
Diluted earnings (loss) | | | 0.39 | | | | 1.09 | | | | | | (0.26 | ) | | | 0.33 | | | | 0.44 | | | | (0.48 | ) | | | 0.15 | |
Dividends paid | | | 0.03 | | | | 1.92 | | | | | | 0.01 | | | | 0.01 | | | | 0.01 | | | | 0.32 | | | | 0.64 | |
| | | | | | | | | | | | | | | | | | | | | | | | | | | | | | |
Average common shares issued and outstanding | | | 7,423,341 | | | | 4,469,517 | | | | | | 8,633,834 | | | | 7,241,515 | | | | 6,370,815 | | | | 4,957,049 | | | | 4,543,963 | |
| | | | | | | | | | | | | | | | | | | | | | | | | | | | | | |
Average diluted common shares issued and outstanding | | | 7,449,911 | | | | 4,477,994 | | | | | | 8,633,834 | | | | 7,269,518 | | | | 6,431,027 | | | | 4,957,049 | | | | 4,547,578 | |
| | | | | | | | | | | | | | | | | | | | | | | | | | | | | | |
| (1) | Due to a net loss for the three months ended September 30, 2009 and December 31, 2008, the impact of antidilutive equity instruments were excluded from diluted earnings per share and average diluted common shares. |
Certain prior period amounts have been reclassified to conform to current period presentation.
Information for periods beginning July 1, 2008 includes the Countrywide acquisition. Information for periods beginning January 1, 2009 includes the
Merrill Lynch acquisition. Prior periods have not been restated.
| | |
| This information is preliminary and based on company data available at the time of the presentation. | | 4 |
Bank of America Corporation and Subsidiaries
Consolidated Balance Sheet
(Dollars in millions)
| | | | | | | | | | | | |
| | | September 30
2009 | | | June 30
2009 | | | September 30
2008 | |
Assets | | | | | | | | | | | | |
Cash and cash equivalents | | $ | 152,412 | | | $ | 140,366 | | | $ | 39,341 | |
Time deposits placed and other short-term investments | | | 22,992 | | | | 25,710 | | | | 11,709 | |
Federal funds sold and securities borrowed or purchased under agreements to resell | | | 187,761 | | | | 184,685 | | | | 87,038 | |
Trading account assets | | | 204,838 | | | | 175,934 | | | | 155,719 | |
Derivative assets | | | 94,855 | | | | 101,707 | | | | 45,792 | |
Debt securities: | | | | | | | | | | | | |
Available-for-sale | | | 247,200 | | | | 257,519 | | | | 257,427 | |
Held-to-maturity, at cost | | | 9,545 | | | | 9,719 | | | | 1,250 | |
Total debt securities | | | 256,745 | | | | 267,238 | | | | 258,677 | |
Loans and leases, net of allowance: | | | | | | | | | | | | |
Loans and leases | | | 914,266 | | | | 942,248 | | | | 942,676 | |
Allowance for loan and lease losses | | | (35,832 | ) | | | (33,785 | ) | | | (20,346 | ) |
Total loans and leases, net of allowance | | | 878,434 | | | | 908,463 | | | | 922,330 | |
Premises and equipment, net | | | 15,373 | | | | 15,667 | | | | 13,000 | |
Mortgage servicing rights (includes$17,539, $18,535 and $20,811 measured at fair value) | | | 17,850 | | | | 18,857 | | | | 21,131 | |
Goodwill | | | 86,009 | | | | 86,246 | | | | 81,756 | |
Intangible assets | | | 12,715 | | | | 13,245 | | | | 9,167 | |
Loans held-for-sale | | | 40,124 | | | | 50,994 | | | | 27,414 | |
Other assets | | | 280,935 | | | | 265,282 | | | | 158,103 | |
Total assets | | $ | 2,251,043 | | | $ | 2,254,394 | | | $ | 1,831,177 | |
| | | |
Liabilities | | | | | | | | | | | | |
Deposits in domestic offices: | | | | | | | | | | | | |
Noninterest-bearing | | $ | 246,729 | | | $ | 248,757 | | | $ | 201,025 | |
Interest-bearing | | | 652,730 | | | | 650,725 | | | | 577,503 | |
Deposits in foreign offices: | | | | | | | | | | | | |
Noninterest-bearing | | | 4,889 | | | | 4,560 | | | | 3,524 | |
Interest-bearing | | | 70,551 | | | | 66,700 | | | | 91,999 | |
Total deposits | | | 974,899 | | | | 970,742 | | | | 874,051 | |
Federal funds purchased and securities loaned or sold under agreements to repurchase | | | 249,578 | | | | 263,639 | | | | 225,729 | |
Trading account liabilities | | | 71,672 | | | | 50,000 | | | | 63,881 | |
Derivative liabilities | | | 52,624 | | | | 51,300 | | | | 26,466 | |
Commercial paper and other short-term borrowings | | | 62,280 | | | | 96,236 | | | | 145,812 | |
Accrued expenses and other liabilities (includes$1,567, $1,992 and $427 of reserve for unfunded lending commitments) | | | 126,019 | | | | 120,138 | | | | 76,489 | |
Long-term debt | | | 456,288 | | | | 447,187 | | | | 257,710 | |
Total liabilities | | | 1,993,360 | | | | 1,999,242 | | | | 1,670,138 | |
Shareholders’ equity | | | | | | | | | | | | |
Preferred stock, $0.01 par value; authorized - 100,000,000 shares; issued and outstanding - 5,760,660, 5,760,731 and 7,602,067 shares | | | 58,840 | | | | 58,660 | | | | 24,151 | |
Common stock and additional paid-in capital, $0.01 par value; authorized -10,000,000,000, 10,000,000,000, and 7,500,000,000 shares; issued and outstanding -8,650,314,133, 8,651,459,122 and 4,562,054,554 shares | | | 128,823 | | | | 128,717 | | | | 65,361 | |
Retained earnings | | | 76,881 | | | | 79,210 | | | | 77,695 | |
Accumulated other comprehensive income (loss) | | | (6,705 | ) | | | (11,227 | ) | | | (5,647 | ) |
Other | | | (156 | ) | | | (208 | ) | | | (521 | ) |
Total shareholders’ equity | | | 257,683 | | | | 255,152 | | | | 161,039 | |
Total liabilities and shareholders’ equity | | $ | 2,251,043 | | | $ | 2,254,394 | | | $ | 1,831,177 | |
Certain prior period amounts have been reclassified to conform to current period presentation.
Information for periods beginning July 1, 2008 includes the Countrywide acquisition. Information for periods beginning January 1, 2009 includes the
Merrill Lynch acquisition. Prior periods have not been restated.
| | |
| This information is preliminary and based on company data available at the time of the presentation. | | 5 |
Bank of America Corporation and Subsidiaries
Capital Management
(Dollars in millions)
| | | | | | | | | | | | | | | | | | | | | | | | | |
| | | Third
Quarter
2009(1) | | | | Second
Quarter
2009 | | | | First
Quarter
2009 | | | | Fourth
Quarter
2008 | | | | Third
Quarter
2008 | | |
Risk-based capital: | | | | | | | | | | | | | | | | | | | | | | | | | |
Tier 1 common | | $ | 112,357 | | | | $ | 110,383 | | | | $ | 76,145 | | | | $ | 63,339 | | | | $ | 56,139 | | |
Tier 1 capital | | | 193,073 | | | | | 190,874 | | | | | 171,061 | | | | | 120,814 | | | | | 100,248 | | |
Total capital | | | 258,568 | | | | | 255,701 | | | | | 237,905 | | | | | 171,661 | | | | | 153,318 | | |
Risk-weighted assets | | | 1,548,962 | | | | | 1,599,569 | | | | | 1,695,192 | | | | | 1,320,824 | | | | | 1,328,084 | | |
Tier 1 common equity ratio(2) | | | 7.25 | | % | | | 6.90 | | % | | | 4.49 | | % | | | 4.80 | | % | | | 4.23 | | % |
Tier 1 capital ratio | | | 12.46 | | | | | 11.93 | | | | | 10.09 | | | | | 9.15 | | | | | 7.55 | | |
Total capital ratio | | | 16.69 | | | | | 15.99 | | | | | 14.03 | | | | | 13.00 | | | | | 11.54 | | |
Tier 1 leverage ratio | | | 8.39 | | | | | 8.21 | | | | | 7.07 | | | | | 6.44 | | | | | 5.51 | | |
Tangible equity ratio(3) | | | 7.55 | | | | | 7.39 | | | | | 6.42 | | | | | 5.11 | | | | | 4.13 | | |
Tangible common equity ratio(3) | | | 4.82 | | | | | 4.67 | | | | | 3.13 | | | | | 2.93 | | | | | 2.75 | | |
| (1) | Preliminary data on risk-based capital |
| (2) | Tier 1 common equity ratio equals Tier 1 capital excluding preferred stock, trust preferred securities, hybrid securities and minority interest divided by risk-weighted assets. |
| (3) | Tangible equity ratio equals period end tangible shareholders’ equity divided by period end tangible assets. Tangible common equity equals period end tangible common shareholders’ equity divided by period end tangible assets. Tangible shareholders’ equity and tangible assets are non-GAAP measures. For corresponding reconciliations of tangible shareholders’ equity and tangible assets to GAAP financial measures, see Supplemental Financial Data on page 3. We believe the use of these non-GAAP measures provide additional clarity in assessing the results of the Corporation. |
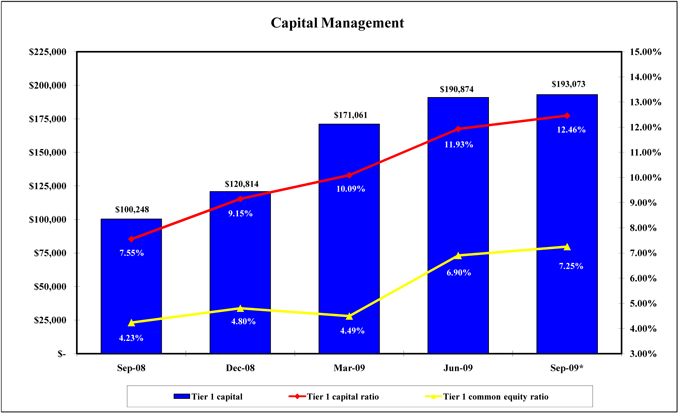
| | * | Preliminary data on risk-based capital |
Outstanding Common Stock
No common shares were repurchased in the third quarter of 2009.
75.0 million shares remain outstanding under the 2008 authorized share repurchase program.
Certain prior period amounts have been reclassified to conform to current period presentation.
Information for periods beginning July 1, 2008 includes the Countrywide acquisition. Information for periods beginning January 1, 2009 includes the
Merrill Lynch acquisition. Prior periods have not been restated.
| | |
| This information is preliminary and based on company data available at the time of the presentation. | | 6 |
Bank of America Corporation and Subsidiaries
Core Net Interest Income - Managed Basis
(Dollars in millions)
| | | | | | | | | | | | | | | | | | | | | | | | | | | | | | | | | | | | | | | | | | |
| | | Nine Months Ended
September 30 | | | | | Third
Quarter
2009 | | | | | Second
Quarter
2009 | | | | | First
Quarter
2009 | | | | | Fourth
Quarter
2008 | | | | | Third
Quarter
2008 | | | |
| | | 2009 | | | | | 2008 | | | | | | | | | | | | | | | | | | |
Net interest income(1) | | | | | | | | | | | | | | | | | | | | | | | | | | | | | | | | | | | | | | | | | | |
As reported | | $ | 36,514 | | | | | $ | 33,148 | | | | | $ | 11,753 | | | | | $ | 11,942 | | | | | $ | 12,819 | | | | | $ | 13,406 | | | | | $ | 11,920 | | | |
Impact of market-based net interest income(2) | | | (4,868 | ) | | | | | (3,477 | ) | | | | | (1,451 | ) | | | | | (1,524 | ) | | | | | (1,893 | ) | | | | | (1,462 | ) | | | | | (1,234 | ) | | |
| | | | | | | | | | | | | | | | | | | | | | | | | | | | | | | | | | | | | | | | | | |
Core net interest income | | | 31,646 | | | | | | 29,671 | | | | | | 10,302 | | | | | | 10,418 | | | | | | 10,926 | | | | | | 11,944 | | | | | | 10,686 | | | |
Impact of securitizations(3) | | | 8,050 | | | | | | 6,654 | | | | | | 2,567 | | | | | | 2,734 | | | | | | 2,749 | | | | | | 2,257 | | | | | | 2,310 | | | |
| | | | | | | | | | | | | | | | | | | | | | | | | | | | | | | | | | | | | | | | | | |
Core net interest income - managed basis | | $ | 39,696 | | | | | $ | 36,325 | | | | | $ | 12,869 | | | | | $ | 13,152 | | | | | $ | 13,675 | | | | | $ | 14,201 | | | | | $ | 12,996 | | | |
| | | | | | | | | | | | | | | | | | | | | | | | | | | | | | | | | | | | | | | | | | |
| | | | | | | | | | | | | | |
Average earning assets | | | | | | | | | | | | | | | | | | | | | | | | | | | | | | | | | | | | | | | | | | |
As reported | | $ | 1,837,706 | | | | | $ | 1,544,617 | | | | | $ | 1,790,000 | | | | | $ | 1,811,981 | | | | | $ | 1,912,483 | | | | | $ | 1,616,646 | | | | | $ | 1,622,466 | | | |
Impact of market-based earning assets(2) | | | (478,448 | ) | | | | | (377,148 | ) | | | | | (468,999 | ) | | | | | (476,598 | ) | | | | | (489,979 | ) | | | | | (311,582 | ) | | | | | (369,921 | ) | | |
| | | | | | | | | | | | | | | | | | | | | | | | | | | | | | | | | | | | | | | | | | |
Core average earning assets | | | 1,359,258 | | | | | | 1,167,469 | | | | | | 1,321,001 | | | | | | 1,335,383 | | | | | | 1,422,504 | | | | | | 1,305,064 | | | | | | 1,252,545 | | | |
Impact of securitizations(4) | | | 86,438 | | | | | | 102,481 | | | | | | 81,703 | | | | | | 86,154 | | | | | | 91,567 | | | | | | 93,189 | | | | | | 101,743 | | | |
| | | | | | | | | | | | | | | | | | | | | | | | | | | | | | | | | | | | | | | | | | |
Core average earning assets - managed basis | | $ | 1,445,696 | | | | | $ | 1,269,950 | | | | | $ | 1,402,704 | | | | | $ | 1,421,537 | | | | | $ | 1,514,071 | | | | | $ | 1,398,253 | | | | | $ | 1,354,288 | | | |
| | | | | | | | | | | | | | | | | | | | | | | | | | | | | | | | | | | | | | | | | | |
| | | | | | | | | | | | | | |
Net interest yield contribution(1, 5) | | | | | | | | | | | | | | | | | | | | | | | | | | | | | | | | | | | | | | | | | | |
As reported | | | 2.65 | | | % | | | 2.86 | | | % | | | 2.61 | | | % | | | 2.64 | | | % | | | 2.70 | | | % | | | 3.31 | | | % | | | 2.93 | | | % |
Impact of market-based activities(2) | | | 0.46 | | | | | | 0.53 | | | | | | 0.50 | | | | | | 0.49 | | | | | | 0.39 | | | | | | 0.34 | | | | | | 0.47 | | | |
| | | | | | | | | | | | | | | | | | | | | | | | | | | | | | | | | | | | | | | | | | |
Core net interest yield on earning assets | | | 3.11 | | | | | | 3.39 | | | | | | 3.11 | | | | | | 3.13 | | | | | | 3.09 | | | | | | 3.65 | | | | | | 3.40 | | | |
Impact of securitizations | | | 0.56 | | | | | | 0.43 | | | | | | 0.54 | | | | | | 0.58 | | | | | | 0.54 | | | | | | 0.40 | | | | | | 0.43 | | | |
| | | | | | | | | | | | | | | | | | | | | | | | | | | | | | | | | | | | | | | | | | |
Core net interest yield on earning assets - managed basis | | | 3.67 | | | % | | | 3.82 | | | % | | | 3.65 | | | % | | | 3.71 | | | % | | | 3.63 | | | % | | | 4.05 | | | % | | | 3.83 | | | % |
| | | | | | | | | | | | | | | | | | | | | | | | | | | | | | | | | | | | | | | | | | |
| (1) | Fully taxable-equivalent basis |
| (2) | Represents the impact of market-based amounts included in Global Markets. |
| (3) | Represents the impact of securitizations utilizing actual bond costs. This is different from the business segment view which utilizes funds transfer pricing methodologies. |
| (4) | Represents average securitized loans less accrued interest receivable and certain securitized bonds retained. |
| (5) | Calculated on an annualized basis. |
Certain prior period amounts have been reclassified to conform to current period presentation.
Information for periods beginning July 1, 2008 includes the Countrywide acquisition. Information for periods beginning January 1, 2009 includes the
Merrill Lynch acquisition. Prior periods have not been restated.
| | |
| This information is preliminary and based on company data available at the time of the presentation. | | 7 |
Bank of America Corporation and Subsidiaries
Quarterly Average Balances and Interest Rates - Fully Taxable-equivalent Basis
(Dollars in millions)
| | | | | | | | | | | | | | | | | | | | | | | | | | | | | | |
| | | Third Quarter 2009 | | Second Quarter 2009 | | Third Quarter 2008 | | |
| | | Average
Balance | | Interest
Income/
Expense | | Yield/
Rate | | | | Average
Balance | | Interest
Income/
Expense | | Yield/
Rate | | | | Average
Balance | | Interest
Income/
Expense | | Yield/
Rate | | |
Earning assets | | | | | | | | | | | | | | | | | | | | | | | | | | | | | | |
Time deposits placed and other short-term investments | | $ | 29,485 | | $ | 133 | | 1.79 | | % | | $ | 25,604 | | $ | 169 | | 2.64 | | % | | $ | 11,361 | | $ | 101 | | 3.54 | | % |
Federal funds sold and securities borrowed or purchased under agreements to resell | | | 223,039 | | | 722 | | 1.28 | | | | | 230,955 | | | 690 | | 1.20 | | | | | 136,322 | | | 912 | | 2.67 | | |
Trading account assets | | | 212,488 | | | 1,909 | | 3.58 | | | | | 199,820 | | | 2,028 | | 4.07 | | | | | 189,715 | | | 2,390 | | 5.03 | | |
Debt securities(1) | | | 263,712 | | | 3,048 | | 4.62 | | | | | 255,159 | | | 3,353 | | 5.26 | | | | | 266,013 | | | 3,672 | | 5.52 | | |
Loans and leases(2): | | | | | | | | | | | | | | | | | | | | | | | | | | | | | | |
Residential mortgage(3) | | | 241,924 | | | 3,258 | | 5.38 | | | | | 253,803 | | | 3,489 | | 5.50 | | | | | 260,779 | | | 3,683 | | 5.65 | | |
Home equity | | | 153,269 | | | 1,614 | | 4.19 | | | | | 156,599 | | | 1,722 | | 4.41 | | | | | 151,111 | | | 2,153 | | 5.67 | | |
Discontinued real estate | | | 16,570 | | | 219 | | 5.30 | | | | | 18,309 | | | 303 | | 6.61 | | | | | 22,031 | | | 399 | | 7.25 | | |
Credit card - domestic | | | 49,751 | | | 1,349 | | 10.76 | | | | | 51,721 | | | 1,380 | | 10.70 | | | | | 63,414 | | | 1,682 | | 10.55 | | |
Credit card - foreign | | | 21,189 | | | 562 | | 10.52 | | | | | 18,825 | | | 501 | | 10.66 | | | | | 17,075 | | | 535 | | 12.47 | | |
Direct/Indirect consumer (4) | | | 100,012 | | | 1,439 | | 5.71 | | | | | 100,302 | | | 1,532 | | 6.12 | | | | | 85,392 | | | 1,790 | | 8.34 | | |
Other consumer(5) | | | 3,331 | | | 60 | | 7.02 | | | | | 3,298 | | | 63 | | 7.77 | | | | | 3,723 | | | 80 | | 8.78 | | |
Total consumer | | | 586,046 | | | 8,501 | | 5.77 | | | | | 602,857 | | | 8,990 | | 5.97 | | | | | 603,525 | | | 10,322 | | 6.82 | | |
Commercial - domestic | | | 216,332 | | | 2,132 | | 3.91 | | | | | 231,639 | | | 2,176 | | 3.77 | | | | | 224,117 | | | 2,852 | | 5.06 | | |
Commercial real estate(6) | | | 74,276 | | | 600 | | 3.20 | | | | | 75,559 | | | 627 | | 3.33 | | | | | 63,220 | | | 727 | | 4.57 | | |
Commercial lease financing | | | 22,068 | | | 178 | | 3.22 | | | | | 22,026 | | | 260 | | 4.72 | | | | | 22,585 | | | 53 | | 0.93 | | |
Commercial - foreign | | | 31,533 | | | 297 | | 3.74 | | | | | 34,024 | | | 360 | | 4.24 | | | | | 33,467 | | | 377 | | 4.48 | | |
Total commercial | | | 344,209 | | | 3,207 | | 3.70 | | | | | 363,248 | | | 3,423 | | 3.78 | | | | | 343,389 | | | 4,009 | | 4.64 | | |
Total loans and leases | | | 930,255 | | | 11,708 | | 5.01 | | | | | 966,105 | | | 12,413 | | 5.15 | | | | | 946,914 | | | 14,331 | | 6.03 | | |
Other earning assets | | | 131,021 | | | 1,333 | | 4.05 | | | | | 134,338 | | | 1,251 | | 3.73 | | | | | 72,141 | | | 1,068 | | 5.90 | | |
Total earning assets(7) | | | 1,790,000 | | | 18,853 | | 4.19 | | | | | 1,811,981 | | | 19,904 | | 4.40 | | | | | 1,622,466 | | | 22,474 | | 5.52 | | |
Cash and cash equivalents | | | 196,116 | | | | | | | | | | 204,354 | | | | | | | | | | 36,030 | | | | | | | |
Other assets, less allowance for loan and lease losses | | | 404,559 | | | | | | | | | | 403,982 | | | | | | | | | | 247,195 | | | | | | | |
Total assets | | $ | 2,390,675 | | | | | | | | | $ | 2,420,317 | | | | | | | | | $ | 1,905,691 | | | | | | | |
| | | | | | | | | | | | |
Interest-bearing liabilities | | | | | | | | | | | | | | | | | | | | | | | | | | | | | | |
Domestic interest-bearing deposits: | | | | | | | | | | | | | | | | | | | | | | | | | | | | | | |
Savings | | $ | 34,170 | | $ | 49 | | 0.57 | | % | | $ | 34,367 | | $ | 54 | | 0.63 | | % | | $ | 32,297 | | $ | 58 | | 0.72 | | % |
NOW and money market deposit accounts | | | 356,873 | | | 353 | | 0.39 | | | | | 342,570 | | | 376 | | 0.44 | | | | | 278,552 | | | 973 | | 1.39 | | |
Consumer CDs and IRAs | | | 214,284 | | | 1,100 | | 2.04 | | | | | 229,392 | | | 1,409 | | 2.46 | | | | | 218,862 | | | 1,852 | | 3.37 | | |
Negotiable CDs, public funds and other time deposits | | | 48,905 | | | 118 | | 0.95 | | | | | 39,100 | | | 124 | | 1.28 | | | | | 36,039 | | | 291 | | 3.21 | | |
Total domestic interest-bearing deposits | | | 654,232 | | | 1,620 | | 0.98 | | | | | 645,429 | | | 1,963 | | 1.22 | | | | | 565,750 | | | 3,174 | | 2.23 | | |
Foreign interest-bearing deposits: | | | | | | | | | | | | | | | | | | | | | | | | | | | | | | |
Banks located in foreign countries | | | 15,941 | | | 29 | | 0.73 | | | | | 19,261 | | | 37 | | 0.76 | | | | | 36,230 | | | 266 | | 2.91 | | |
Governments and official institutions | | | 6,488 | | | 4 | | 0.23 | | | | | 7,379 | | | 4 | | 0.22 | | | | | 11,847 | | | 72 | | 2.43 | | |
Time, savings and other | | | 53,013 | | | 57 | | 0.42 | | | | | 54,307 | | | 78 | | 0.58 | | | | | 48,209 | | | 334 | | 2.76 | | |
Total foreign interest-bearing deposits | | | 75,442 | | | 90 | | 0.47 | | | | | 80,947 | | | 119 | | 0.59 | | | | | 96,286 | | | 672 | | 2.78 | | |
Total interest-bearing deposits | | | 729,674 | | | 1,710 | | 0.93 | | | | | 726,376 | | | 2,082 | | 1.15 | | | | | 662,036 | | | 3,846 | | 2.31 | | |
Federal funds purchased and securities loaned or sold under agreements to repurchase and other short-term borrowings | | | 411,063 | | | 1,237 | | 1.19 | | | | | 503,451 | | | 1,396 | | 1.11 | | | | | 465,511 | | | 3,223 | | 2.76 | | |
Trading account liabilities | | | 73,290 | | | 455 | | 2.46 | | | | | 62,778 | | | 450 | | 2.87 | | | | | 73,702 | | | 661 | | 3.57 | | |
Long-term debt | | | 449,974 | | | 3,698 | | 3.27 | | | | | 444,131 | | | 4,034 | | 3.64 | | | | | 264,934 | | | 2,824 | | 4.26 | | |
Total interest-bearing liabilities(7) | | | 1,664,001 | | | 7,100 | | 1.70 | | | | | 1,736,736 | | | 7,962 | | 1.84 | | | | | 1,466,183 | | | 10,554 | | 2.86 | | |
Noninterest-bearing sources: | | | | | | | | | | | | | | | | | | | | | | | | | | | | | | |
Noninterest-bearing deposits | | | 259,621 | | | | | | | | | | 248,516 | | | | | | | | | | 195,809 | | | | | | | |
Other liabilities | | | 211,070 | | | | | | | | | | 192,198 | | | | | | | | | | 77,245 | | | | | | | |
Shareholders’ equity | | | 255,983 | | | | | | | | | | 242,867 | | | | | | | | | | 166,454 | | | | | | | |
Total liabilities and shareholders’ equity | | $ | 2,390,675 | | | | | | | | | $ | 2,420,317 | | | | | | | | | $ | 1,905,691 | | | | | | | |
Net interest spread | | | | | | | | 2.49 | | % | | | | | | | | 2.56 | | % | | | | | | | | 2.66 | | % |
Impact of noninterest-bearing sources | | | | | | | | 0.12 | | | | | | | | | | 0.08 | | | | | | | | | | 0.27 | | |
Net interest income/yield on earning assets | | | | | $ | 11,753 | | 2.61 | | % | | | | | $ | 11,942 | | 2.64 | | % | | | | | $ | 11,920 | | 2.93 | | % |
| (1) | Yields on AFS debt securities are calculated based on fair value rather than historical cost balances. The use of fair value does not have a material impact on net interest yield. |
| (2) | Nonperforming loans are included in the respective average loan balances. Income on these nonperforming loans is recognized on a cash basis. Purchased impaired loans were written down to fair value upon acquisition and accrete interest income over the remaining life of the loan. |
| (3) | Includes foreign residential mortgages of $662 million and $650 million for the third and second quarters of 2009. |
| (4) | Includes foreign consumer loans of $8.4 billion and $8.0 billion in the third and second quarters of 2009, and $2.6 billion in the third quarter of 2008. |
| (5) | Includes consumer finance loans of $2.4 billion and $2.5 billion in the third and second quarters of 2009, and $2.7 billion in the third quarter of 2008; and other foreign consumer loans of $700 million and $640 million in the third and second quarters of 2009, and $725 million in the third quarter of 2008. |
| (6) | Includes domestic commercial real estate loans of $70.7 billion and $72.8 billion in the third and second quarters of 2009, and $62.2 billion in the third quarter of 2008, and foreign commercial real estate loans of $3.6 billion and $2.8 billion in the third and second quarters of 2009, and $1.0 billion in the third quarter of 2008. |
| (7) | Interest income includes the impact of interest rate risk management contracts, which decreased interest income on the underlying assets $136 million and $11 million in the third and second quarters of 2009, and $12 million in the third quarter of 2008. Interest expense includes the impact of interest rate risk management contracts, which increased (decreased) interest expense on the underlying liabilities $(873) million and $(550) million in the third and second quarters of 2009, and $86 million in the third quarter of 2008. |
Certain prior period amounts have been reclassified to conform to current period presentation.
Information for periods beginning July 1, 2008 includes the Countrywide acquisition. Information for periods beginning January 1, 2009 includes the
Merrill Lynch acquisition. Prior periods have not been restated.
| | |
| This information is preliminary and based on company data available at the time of the presentation. | | 8 |
Bank of America Corporation and Subsidiaries
Quarterly Average Balances and Interest Rates - Fully Taxable-equivalent Basis - Isolating Hedge Income/Expense(1)
(Dollars in millions)
| | | | | | | | | | | | | | | | | | | | | | | | | | | | | | | | | | |
| | | Third Quarter 2009 | | | | Second Quarter 2009 | | | | Third Quarter 2008 | | | |
| | | Average
Balance | | Interest
Income/
Expense | | | Yield/
Rate | | | | Average
Balance | | Interest
Income/
Expense | | | Yield/
Rate | | | | Average
Balance | | Interest
Income/
Expense | | | Yield/
Rate | | | |
Earning assets | | | | | | | | | | | | | | | | | | | | | | | | | | | | | | | | | | |
Time deposits placed and other short-term investments(2) | | $ | 29,485 | | $ | 133 | | | 1.79 | | % | | $ | 25,604 | | $ | 172 | | | 2.69 | | % | | $ | 11,361 | | $ | 105 | | | 3.68 | | | % |
Federal funds sold and securities borrowed or purchased under agreements to resell (2) | | | 223,039 | | | 627 | | | 1.11 | | | | | 230,955 | | | 628 | | | 1.09 | | | | | 136,322 | | | 948 | | | 2.78 | | | |
Trading account assets (2) | | | 212,488 | | | 1,915 | | | 3.59 | | | | | 199,820 | | | 2,028 | | | 4.07 | | | | | 189,715 | | | 2,390 | | | 5.03 | | | |
Debt securities(2) | | | 263,712 | | | 3,261 | | | 4.94 | | | | | 255,159 | | | 3,387 | | | 5.31 | | | | | 266,013 | | | 3,675 | | | 5.52 | | | |
Loans and leases: | | | | | | | | | | | | | | | | | | | | | | | | | | | | | | | | | | |
Residential mortgage | | | 241,924 | | | 3,258 | | | 5.38 | | | | | 253,803 | | | 3,489 | | | 5.50 | | | | | 260,779 | | | 3,683 | | | 5.65 | | | |
Home equity | | | 153,269 | | | 1,614 | | | 4.19 | | | | | 156,599 | | | 1,722 | | | 4.41 | | | | | 151,111 | | | 2,153 | | | 5.67 | | | |
Discontinued real estate | | | 16,570 | | | 219 | | | 5.30 | | | | | 18,309 | | | 303 | | | 6.61 | | | | | 22,031 | | | 399 | | | 7.25 | | | |
Credit card - domestic | | | 49,751 | | | 1,349 | | | 10.76 | | | | | 51,721 | | | 1,380 | | | 10.70 | | | | | 63,414 | | | 1,682 | | | 10.55 | | | |
Credit card - foreign | | | 21,189 | | | 562 | | | 10.52 | | | | | 18,825 | | | 501 | | | 10.66 | | | | | 17,075 | | | 535 | | | 12.47 | | | |
Direct/Indirect consumer | | | 100,012 | | | 1,439 | | | 5.71 | | | | | 100,302 | | | 1,532 | | | 6.12 | | | | | 85,392 | | | 1,790 | | | 8.34 | | | |
Other consumer | | | 3,331 | | | 60 | | | 7.02 | | | | | 3,298 | | | 63 | | | 7.77 | | | | | 3,723 | | | 80 | | | 8.78 | | | |
Total consumer | | | 586,046 | | | 8,501 | | | 5.77 | | | | | 602,857 | | | 8,990 | | | 5.97 | | | | | 603,525 | | | 10,322 | | | 6.82 | | | |
Commercial - domestic (2) | | | 216,332 | | | 2,144 | | | 3.93 | | | | | 231,639 | | | 2,212 | | | 3.83 | | | | | 224,117 | | | 2,820 | | | 5.01 | | | |
Commercial real estate | | | 74,276 | | | 600 | | | 3.20 | | | | | 75,559 | | | 627 | | | 3.33 | | | | | 63,220 | | | 727 | | | 4.57 | | | |
Commercial lease financing | | | 22,068 | | | 178 | | | 3.22 | | | | | 22,026 | | | 260 | | | 4.72 | | | | | 22,585 | | | 53 | | | 0.93 | | | |
Commercial - foreign | | | 31,533 | | | 297 | | | 3.74 | | | | | 34,024 | | | 360 | | | 4.24 | | | | | 33,467 | | | 377 | | | 4.48 | | | |
Total commercial | | | 344,209 | | | 3,219 | | | 3.71 | | | | | 363,248 | | | 3,459 | | | 3.82 | | | | | 343,389 | | | 3,977 | | | 4.61 | | | |
Total loans and leases | | | 930,255 | | | 11,720 | | | 5.01 | | | | | 966,105 | | | 12,449 | | | 5.16 | | | | | 946,914 | | | 14,299 | | | 6.02 | | | |
Other earning assets(2) | | | 131,021 | | | 1,333 | | | 4.05 | | | | | 134,338 | | | 1,251 | | | 3.73 | | | | | 72,141 | | | 1,069 | | | 5.90 | | | |
Total earning assets - excluding hedge impact | | | 1,790,000 | | | 18,989 | | | 4.22 | | | | | 1,811,981 | | | 19,915 | | | 4.40 | | | | | 1,622,466 | | | 22,486 | | | 5.53 | | | |
Net hedge income (expense) on assets | | | | | | (136 | ) | | | | | | | | | | (11 | ) | | | | | | | | | | (12 | ) | | | | | |
Total earning assets - including hedge impact | | | 1,790,000 | | | 18,853 | | | 4.19 | | | | | 1,811,981 | | | 19,904 | | | 4.40 | | | | | 1,622,466 | | | 22,474 | | | 5.52 | | | |
Cash and cash equivalents | | | 196,116 | | | | | | | | | | | 204,354 | | | | | | | | | | | 36,030 | | | | | | | | | |
Other assets, less allowance for loan and lease losses | | | 404,559 | | | | | | | | | | | 403,982 | | | | | | | | | | | 247,195 | | | | | | | | | |
Total assets | | $ | 2,390,675 | | | | | | | | | | $ | 2,420,317 | | | | | | | | | | $ | 1,905,691 | | | | | | | | | |
| | | | | | | | | | | | |
Interest-bearing liabilities | | | | | | | | | | | | | | | | | | | | | | | | | | | | | | | | | | |
Domestic interest-bearing deposits: | | | | | | | | | | | | | | | | | | | | | | | | | | | | | | | | | | |
Savings | | $ | 34,170 | | $ | 49 | | | 0.57 | | % | | $ | 34,367 | | $ | 54 | | | 0.63 | | % | | $ | 32,297 | | $ | 58 | | | 0.72 | | | % |
NOW and money market deposit accounts (2) | | | 356,873 | | | 353 | | | 0.39 | | | | | 342,570 | | | 376 | | | 0.44 | | | | | 278,552 | | | 973 | | | 1.39 | | | |
Consumer CDs and IRAs (2) | | | 214,284 | | | 1,054 | | | 1.95 | | | | | 229,392 | | | 1,350 | | | 2.36 | | | | | 218,862 | | | 1,765 | | | 3.21 | | | |
Negotiable CDs, public funds and other time deposits (2) | | | 48,905 | | | 114 | | | 0.92 | | | | | 39,100 | | | 119 | | | 1.24 | | | | | 36,039 | | | 288 | | | 3.18 | | | |
Total domestic interest-bearing deposits | | | 654,232 | | | 1,570 | | | 0.95 | | | | | 645,429 | | | 1,899 | | | 1.18 | | | | | 565,750 | | | 3,084 | | | 2.17 | | | |
Foreign interest-bearing deposits: | | | | | | | | | | | | | | | | | | | | | | | | | | | | | | | | | | |
Banks located in foreign countries (2) | | | 15,941 | | | 14 | | | 0.37 | | | | | 19,261 | | | 24 | | | 0.48 | | | | | 36,230 | | | 279 | | | 3.07 | | | |
Governments and official institutions | | | 6,488 | | | 4 | | | 0.23 | | | | | 7,379 | | | 4 | | | 0.22 | | | | | 11,847 | | | 72 | | | 2.43 | | | |
Time, savings and other | | | 53,013 | | | 57 | | | 0.42 | | | | | 54,307 | | | 78 | | | 0.58 | | | | | 48,209 | | | 334 | | | 2.76 | | | |
Total foreign interest-bearing deposits | | | 75,442 | | | 75 | | | 0.40 | | | | | 80,947 | | | 106 | | | 0.52 | | | | | 96,286 | | | 685 | | | 2.84 | | | |
Total interest-bearing deposits | | | 729,674 | | | 1,645 | | | 0.90 | | | | | 726,376 | | | 2,005 | | | 1.11 | | | | | 662,036 | | | 3,769 | | | 2.27 | | | |
Federal funds purchased and securities loaned or sold under agreements to repurchase and other short-term borrowings(2) | | | 411,063 | | | 1,059 | | | 1.02 | | | | | 503,451 | | | 1,157 | | | 0.92 | | | | | 465,511 | | | 2,938 | | | 2.51 | | | |
Trading account liabilities | | | 73,290 | | | 455 | | | 2.46 | | | | | 62,778 | | | 450 | | | 2.87 | | | | | 73,702 | | | 661 | | | 3.57 | | | |
Long-term debt (2) | | | 449,974 | | | 4,814 | | | 4.26 | | | | | 444,131 | | | 4,900 | | | 4.42 | | | | | 264,934 | | | 3,100 | | | 4.68 | | | |
Total interest-bearing liabilities - excluding hedge impact | | | 1,664,001 | | | 7,973 | | | 1.90 | | | | | 1,736,736 | | | 8,512 | | | 1.96 | | | | | 1,466,183 | | | 10,468 | | | 2.84 | | | |
Net hedge (income) expense on liabilities | | | | | | (873 | ) | | | | | | | | | | (550 | ) | | | | | | | | | | 86 | | | | | | |
Total interest-bearing liabilities - including hedge impact | | | 1,664,001 | | | 7,100 | | | 1.70 | | | | | 1,736,736 | | | 7,962 | | | 1.84 | | | | | 1,466,183 | | | 10,554 | | | 2.86 | | | |
Noninterest-bearing sources: | | | | | | | | | | | | | | | | | | | | | | | | | | | | | | | | | | |
Noninterest-bearing deposits | | | 259,621 | | | | | | | | | | | 248,516 | | | | | | | | | | | 195,809 | | | | | | | | | |
Other liabilities | | | 211,070 | | | | | | | | | | | 192,198 | | | | | | | | | | | 77,245 | | | | | | | | | |
Shareholders’ equity | | | 255,983 | | | | | | | | | | | 242,867 | | | | | | | | | | | 166,454 | | | | | | | | | |
Total liabilities and shareholders’ equity | | $ | 2,390,675 | | | | | | | | | | $ | 2,420,317 | | | | | | | | | | $ | 1,905,691 | | | | | | | | | |
Net interest spread | | | | | | | | | 2.32 | | | | | | | | | | | 2.44 | | | | | | | | | | | 2.69 | | | |
Impact of noninterest-bearing sources | | | | | | | | | 0.12 | | | | | | | | | | | 0.08 | | | | | | | | | | | 0.27 | | | |
Net interest income/yield on earning assets - excluding hedge impact | | | | | $ | 11,016 | | | 2.44 | | % | | | | | $ | 11,403 | | | 2.52 | | % | | | | | $ | 12,018 | | | 2.96 | | | % |
Net impact of hedge income (expense) | | | | | | 737 | | | 0.17 | | | | | | | | 539 | | | 0.12 | | | | | | | | (98 | ) | | (0.03 | ) | | |
Net interest income/yield on earning assets | | | | | $ | 11,753 | | | 2.61 | | % | | | | | $ | 11,942 | | | 2.64 | | % | | | | | $ | 11,920 | | | 2.93 | | | % |
(1) This table presents a non-GAAP financial measure. The impact of interest rate risk management derivatives is shown separately. Interest income and interest expense amounts, and the yields and rates have been adjusted. Management believes this presentation is useful to investors because it adjusts for the impact of our hedging decisions and provides a better understanding of our hedging activities. The impact of interest rate risk management derivatives is not material to the average balances presented above. (2) The impact of interest rate risk management derivatives on interest income and interest expense is presented below. Interest income excludes the impact of interest rate risk management contracts, which increased (decreased) interest income on: |
| | | | | Third
Quarter 2009 | | | | | | | | | Second
Quarter 2009 | | | | | | | | | Third
Quarter 2008 | | | | | | |
Time deposits placed and other short-term investments | | | | | $ | — | | | | | | | | | | $ | (3 | ) | | | | | | | | | $ | (4 | ) | | | | | |
Federal funds sold and securities borrowed or purchased under agreements to resell | | | | | | 95 | | | | | | | | | | | 62 | | | | | | | | | | | (36 | ) | | | | | |
Trading account assets | | | | | | (6 | ) | | | | | | | | | | — | | | | | | | | | | | — | | | | | | |
Debt securities | | | | | | (213 | ) | | | | | | | | | | (34 | ) | | | | | | | | | | (3 | ) | | | | | |
Commercial - domestic | | | | | | (12 | ) | | | | | | | | | | (36 | ) | | | | | | | | | | 32 | | | | | | |
Other earning assets | | | | | | 0 | | | | | | | | | | | — | | | | | | | | | | | (1 | ) | | | | | |
| | | | | | | | | | | | | | | | | | | | | | | | | | | | | | | | | | |
Net hedge income (expense) on assets | | | | | $ | (136 | ) | | | | | | | | | $ | (11 | ) | | | | | | | | | $ | (12 | ) | | | | | |
| | | | | | | | | | | | | | | | | | | | | | | | | | | | | | | | | | |
|
Interest expense excludes the impact of interest rate risk management contracts, which increased (decreased) interest expense on: |
| | | | | | | | | | | | |
NOW and money market deposit accounts | | | | | $ | — | | | | | | | | | | $ | — | | | | | | | | | | $ | — | | | | | | |
Consumer CDs and IRAs | | | | | | 46 | | | | | | | | | | | 59 | | | | | | | | | | | 87 | | | | | | |
Negotiable CDs, public funds and other time deposits | | | | | | 4 | | | | | | | | | | | 5 | | | | | | | | | | | 3 | | | | | | |
Banks located in foreign countries | | | | | | 15 | | | | | | | | | | | 13 | | | | | | | | | | | (13 | ) | | | | | |
Federal funds purchased and securities loaned or sold under agreements to repurchase and other short-term borrowings | | | | | | 178 | | | | | | | | | | | 239 | | | | | | | | | | | 285 | | | | | | |
Long-term debt | | | | | | (1,116 | ) | | | | | | | | | | (866 | ) | | | | | | | | | | (276 | ) | | | | | |
| | | | | | | | | | | | | | | | | | | | | | | | | | | | | | | | | | |
Net hedge (income) expense on liabilities | | | | | $ | (873 | ) | | | | | | | | | $ | (550 | ) | | | | | | | | | $ | 86 | | | | | | |
| | | | | | | | | | | | | | | | | | | | | | | | | | | | | | | | | | |
Certain prior period amounts have been reclassified to conform to current period presentation.
Information for periods beginning July 1, 2008 includes the Countrywide acquisition. Information for periods beginning January 1, 2009 includes the
Merrill Lynch acquisition. Prior periods have not been restated.
| | |
| This information is preliminary and based on company data available at the time of the presentation. | | 9 |
Bank of America Corporation and Subsidiaries
Year-to-Date Average Balances and Interest Rates - Fully Taxable-equivalent Basis
(Dollars in millions)
| | | | | | | | | | | | | | | | | | | | |
| | | Nine Months Ended September 30 | | |
| | | 2009 | | | | 2008 | | |
| | | Average
Balance | | Interest
Income/
Expense | | Yield/
Rate | | | | Average
Balance | | Interest
Income/
Expense | | Yield/
Rate | | |
Earning assets | | | | | | | | | | | | | | | | | | | | |
Time deposits placed and other short-term investments | | $ | 27,094 | | $ | 493 | | 2.43 | | % | | $ | 10,758 | | $ | 282 | | 3.50 | | % |
Federal funds sold and securities borrowed or purchased under agreements to resell | | | 232,680 | | | 2,567 | | 1.47 | | | | | 135,846 | | | 2,920 | | 2.87 | | |
Trading account assets | | | 216,462 | | | 6,436 | | 3.97 | | | | | 188,894 | | | 7,089 | | 5.01 | | |
Debt securities(1) | | | 268,291 | | | 10,303 | | 5.12 | | | | | 240,347 | | | 9,470 | | 5.25 | | |
Loans and leases(2): | | | | | | | | | | | | | | | | | | | | |
Residential mortgage (3) | | | 253,531 | | | 10,427 | | 5.49 | | | | | 262,488 | | | 11,061 | | 5.62 | | |
Home equity | | | 156,128 | | | 5,123 | | 4.38 | | | | | 129,392 | | | 5,652 | | 5.83 | | |
Discontinued real estate | | | 18,078 | | | 908 | | 6.70 | | | | | 7,397 | | | 399 | | 7.19 | | |
Credit card - domestic | | | 53,444 | | | 4,330 | | 10.83 | | | | | 62,784 | | | 5,059 | | 10.76 | | |
Credit card - foreign | | | 18,973 | | | 1,517 | | 10.69 | | | | | 16,297 | | | 1,521 | | 12.47 | | |
Direct/Indirect consumer (4) | | | 100,349 | | | 4,655 | | 6.20 | | | | | 82,242 | | | 5,220 | | 8.48 | | |
Other consumer(5) | | | 3,346 | | | 187 | | 7.43 | | | | | 3,908 | | | 251 | | 8.58 | | |
Total consumer | | | 603,849 | | | 27,147 | | 6.00 | | | | | 564,508 | | | 29,163 | | 6.90 | | |
Commercial - domestic | | | 229,462 | | | 6,793 | | 3.96 | | | | | 218,702 | | | 8,812 | | 5.38 | | |
Commercial real estate(6) | | | 74,021 | | | 1,777 | | 3.21 | | | | | 62,746 | | | 2,351 | | 5.00 | | |
Commercial lease financing | | | 22,050 | | | 717 | | 4.33 | | | | | 22,364 | | | 557 | | 3.32 | | |
Commercial - foreign | | | 33,878 | | | 1,119 | | 4.42 | | | | | 32,254 | | | 1,130 | | 4.68 | | |
Total commercial | | | 359,411 | | | 10,406 | | 3.87 | | | | | 336,066 | | | 12,850 | | 5.11 | | |
Total loans and leases | | | 963,260 | | | 37,553 | | 5.21 | | | | | 900,574 | | | 42,013 | | 6.23 | | |
Other earning assets | | | 129,919 | | | 3,883 | | 3.99 | | | | | 68,198 | | | 3,202 | | 6.27 | | |
Total earning assets(7) | | | 1,837,706 | | | 61,235 | | 4.45 | | | | | 1,544,617 | | | 64,976 | | 5.61 | | |
Cash and cash equivalents | | | 184,650 | | | | | | | | | | 34,598 | | | | | | | |
Other assets, less allowance for loan and lease losses | | | 420,549 | | | | | | | | | | 229,550 | | | | | | | |
Total assets | | $ | 2,442,905 | | | | | | | | | $ | 1,808,765 | | | | | | | |
| | | | | | | | |
Interest-bearing liabilities | | | | | | | | | | | | | | | | | | | | |
Domestic interest-bearing deposits: | | | | | | | | | | | | | | | | | | | | |
Savings | | $ | 33,645 | | $ | 161 | | 0.64 | | % | | $ | 32,419 | | $ | 172 | | 0.71 | | % |
NOW and money market deposit accounts | | | 347,603 | | | 1,169 | | 0.45 | | | | | 261,918 | | | 2,968 | | 1.51 | | |
Consumer CDs and IRAs | | | 226,555 | | | 4,219 | | 2.49 | | | | | 195,318 | | | 5,569 | | 3.81 | | |
Negotiable CDs, public funds and other time deposits | | | 39,649 | | | 391 | | 1.32 | | | | | 30,838 | | | 806 | | 3.49 | | |
Total domestic interest-bearing deposits | | | 647,452 | | | 5,940 | | 1.23 | | | | | 520,493 | | | 9,515 | | 2.44 | | |
Foreign interest-bearing deposits: | | | | | | | | | | | | | | | | | | | | |
Banks located in foreign countries | | | 20,381 | | | 114 | | 0.75 | | | | | 36,401 | | | 938 | | 3.44 | | |
Governments and official institutions | | | 7,893 | | | 14 | | 0.23 | | | | | 12,758 | | | 281 | | 2.94 | | |
Time, savings and other | | | 55,214 | | | 267 | | 0.65 | | | | | 52,211 | | | 1,220 | | 3.12 | | |
Total foreign interest-bearing deposits | | | 83,488 | | | 395 | | 0.63 | | | | | 101,370 | | | 2,439 | | 3.21 | | |
Total interest-bearing deposits | | | 730,940 | | | 6,335 | | 1.16 | | | | | 621,863 | | | 11,954 | | 2.57 | | |
Federal funds purchased and securities loaned or sold under agreements to repurchase and other short-term borrowings | | | 501,485 | | | 4,854 | | 1.29 | | | | | 454,355 | | | 10,452 | | 3.07 | | |
Trading account liabilities | | | 68,530 | | | 1,484 | | 2.90 | | | | | 75,553 | | | 2,250 | | 3.98 | | |
Long-term debt | | | 447,038 | | | 12,048 | | 3.60 | | | | | 223,017 | | | 7,172 | | 4.29 | | |
Total interest-bearing liabilities(7) | | | 1,747,993 | | | 24,721 | | 1.89 | | | | | 1,374,788 | | | 31,828 | | 3.09 | | |
Noninterest-bearing sources: | | | | | | | | | | | | | | | | | | | | |
Noninterest-bearing deposits | | | 245,242 | | | | | | | | | | 188,800 | | | | | | | |
Other liabilities | | | 207,032 | | | | | | | | | | 84,287 | | | | | | | |
Shareholders’ equity | | | 242,638 | | | | | | | | | | 160,890 | | | | | | | |
Total liabilities and shareholders’ equity | | $ | 2,442,905 | | | | | | | | | $ | 1,808,765 | | | | | | | |
Net interest spread | | | | | | | | 2.56 | | % | | | | | | | | 2.52 | | % |
Impact of noninterest-bearing sources | | | | | | | | 0.09 | | | | | | | | | | 0.34 | | |
Net interest income/yield on earning assets | | | | | $ | 36,514 | | 2.65 | | % | | | | | $ | 33,148 | | 2.86 | | % |
| (1) | Yields on AFS debt securities are calculated based on fair value rather than historical cost balances. The use of fair value does not have a material impact on net interest yield. |
| (2) | Nonperforming loans are included in the respective average loan balances. Income on these nonperforming loans is recognized on a cash basis. Purchased impaired loans were written down to fair value upon acquisition and accrete interest income over the remaining life of the loan. |
| (3) | Includes foreign residential mortgages of $647 million for the nine months ended September 30, 2009. |
| (4) | Includes foreign consumer loans of $7.8 billion and $3.0 billion for the nine months ended September 30, 2009 and 2008. |
| (5) | Includes consumer finance loans of $2.5 billion and $2.8 billion, and other foreign consumer loans of $646 million and $814 million for the nine months ended September 30, 2009 and 2008. |
| (6) | Includes domestic commercial real estate loans of $71.5 billion and $61.6 billion, and foreign commercial real estate loans of $2.5 billion and $1.1 billion for the nine months ended September 30, 2009 and 2008. |
| (7) | Interest income includes the impact of interest rate risk management contracts, which decreased interest income on the underlying assets $208 million and $219 million for the nine months ended September 30, 2009 and 2008. Interest expense includes the impact of interest rate risk management contracts, which increased (decreased) interest expense on the underlying liabilities $(1.9) billion and $172 million for the nine months ended September 30, 2009 and 2008. |
Certain prior period amounts have been reclassified to conform to current period presentation.
Information for periods beginning July 1, 2008 includes the Countrywide acquisition. Information for periods beginning January 1, 2009 includes the
Merrill Lynch acquisition. Prior periods have not been restated.
| | |
| This information is preliminary and based on company data available at the time of the presentation. | | 10 |
Bank of America Corporation and Subsidiaries
Year-to-Date Average Balances and Interest Rates - Fully Taxable-equivalent Basis - Isolating Hedge Income/Expense(1)
(Dollars in millions)
| | | | | | | | | | | | | | | | | | | | | | | |
| | | Nine Months Ended September 30 | | | |
| | | 2009 | | 2008 | | | |
| | | Average
Balance | | Interest
Income/
Expense | | | Yield/
Rate | | | | Average
Balance | | Interest
Income/
Expense | | | Yield/
Rate | | | |
Earning assets | | | | | | | | | | | | | | | | | | | | | | | |
Time deposits placed and other short-term investments (2) | | $ | 27,094 | | $ | 496 | | | 2.45 | | % | | $ | 10,758 | | $ | 294 | | | 3.65 | | | % |
Federal funds sold and securities borrowed or purchased under agreements to resell (2) | | | 232,680 | | | 2,413 | | | 1.39 | | | | | 135,846 | | | 3,093 | | | 3.04 | | | |
Trading account assets(2) | | | 216,462 | | | 6,442 | | | 3.97 | | | | | 188,894 | | | 7,089 | | | 5.01 | | | |
Debt securities(2) | | | 268,291 | | | 10,578 | | | 5.26 | | | | | 240,347 | | | 9,474 | | | 5.26 | | | |
Loans and leases: | | | | | | | | | | | | | | | | | | | | | | | |
Residential mortgage | | | 253,531 | | | 10,427 | | | 5.49 | | | | | 262,488 | | | 11,061 | | | 5.62 | | | |
Home equity | | | 156,128 | | | 5,123 | | | 4.38 | | | | | 129,392 | | | 5,652 | | | 5.83 | | | |
Discontinued real estate | | | 18,078 | | | 908 | | | 6.70 | | | | | 7,397 | | | 399 | | | 7.19 | | | |
Credit card - domestic | | | 53,444 | | | 4,330 | | | 10.83 | | | | | 62,784 | | | 5,059 | | | 10.76 | | | |
Credit card - foreign | | | 18,973 | | | 1,517 | | | 10.69 | | | | | 16,297 | | | 1,521 | | | 12.47 | | | |
Direct/Indirect consumer | | | 100,349 | | | 4,655 | | | 6.20 | | | | | 82,242 | | | 5,220 | | | 8.48 | | | |
Other consumer | | | 3,346 | | | 187 | | | 7.43 | | | | | 3,908 | | | 251 | | | 8.58 | | | |
Total consumer | | | 603,849 | | | 27,147 | | | 6.00 | | | | | 564,508 | | | 29,163 | | | 6.90 | | | |
Commercial - domestic (2) | | | 229,462 | | | 6,871 | | | 4.00 | | | | | 218,702 | | | 8,840 | | | 5.40 | | | |
Commercial real estate | | | 74,021 | | | 1,777 | | | 3.21 | | | | | 62,746 | | | 2,351 | | | 5.00 | | | |
Commercial lease financing | | | 22,050 | | | 717 | | | 4.33 | | | | | 22,364 | | | 557 | | | 3.32 | | | |
Commercial - foreign | | | 33,878 | | | 1,119 | | | 4.42 | | | | | 32,254 | | | 1,130 | | | 4.68 | | | |
Total commercial | | | 359,411 | | | 10,484 | | | 3.90 | | | | | 336,066 | | | 12,878 | | | 5.12 | | | |
Total loans and leases | | | 963,260 | | | 37,631 | | | 5.22 | | | | | 900,574 | | | 42,041 | | | 6.21 | | | |
Other earning assets (2) | | | 129,919 | | | 3,883 | | | 3.99 | | | | | 68,198 | | | 3,204 | | | 6.27 | | | |
Total earning assets - excluding hedge impact | | | 1,837,706 | | | 61,443 | | | 4.47 | | | | | 1,544,617 | | | 65,195 | | | 5.62 | | | |
Net hedge income (expense) on assets | | | | | | (208 | ) | | | | | | | | | | (219 | ) | | | | | |
Total earning assets - including hedge impact | | | 1,837,706 | | | 61,235 | | | 4.45 | | | | | 1,544,617 | | | 64,976 | | | 5.61 | | | |
Cash and cash equivalents | | | 184,650 | | | | | | | | | | | 34,598 | | | | | | | | | |
Other assets, less allowance for loan and lease losses | | | 420,549 | | | | | | | | | | | 229,550 | | | | | | | | | |
Total assets | | $ | 2,442,905 | | | | | | | | | | $ | 1,808,765 | | | | | | | | | |
| | | | | | | | |
Interest-bearing liabilities | | | | | | | | | | | | | | | | | | | | | | | |
Domestic interest-bearing deposits: | | | | | | | | | | | | | | | | | | | | | | | |
Savings | | $ | 33,645 | | $ | 161 | | | 0.64 | | % | | $ | 32,419 | | $ | 172 | | | 0.71 | | | % |
NOW and money market deposit accounts (2) | | | 347,603 | | | 1,170 | | | 0.45 | | | | | 261,918 | | | 2,958 | | | 1.51 | | | |
Consumer CDs and IRAs (2) | | | 226,555 | | | 4,050 | | | 2.39 | | | | | 195,318 | | | 5,250 | | | 3.59 | | | |
Negotiable CDs, public funds and other time deposits (2) | | | 39,649 | | | 379 | | | 1.28 | | | | | 30,838 | | | 799 | | | 3.46 | | | |
Total domestic interest-bearing deposits | | | 647,452 | | | 5,760 | | | 1.19 | | | | | 520,493 | | | 9,179 | | | 2.36 | | | |
Foreign interest-bearing deposits: | | | | | | | | | | | | | | | | | | | | | | | |
Banks located in foreign countries (2) | | | 20,381 | | | 79 | | | 0.52 | | | | | 36,401 | | | 949 | | | 3.48 | | | |
Governments and official institutions | | | 7,893 | | | 14 | | | 0.23 | | | | | 12,758 | | | 281 | | | 2.94 | | | |
Time, savings and other | | | 55,214 | | | 267 | | | 0.65 | | | | | 52,211 | | | 1,220 | | | 3.12 | | | |
Total foreign interest-bearing deposits | | | 83,488 | | | 360 | | | 0.58 | | | | | 101,370 | | | 2,450 | | | 3.23 | | | |
Total interest-bearing deposits | | | 730,940 | | | 6,120 | | | 1.12 | | | | | 621,863 | | | 11,629 | | | 2.50 | | | |
Federal funds purchased and securities loaned or sold under agreements to repurchase and other short-term borrowings(2) | | | 501,485 | | | 4,131 | | | 1.10 | | | | | 454,355 | | | 10,052 | | | 2.95 | | | |
Trading account liabilities | | | 68,530 | | | 1,484 | | | 2.90 | | | | | 75,553 | | | 2,250 | | | 3.98 | | | |
Long-term debt (2) | | | 447,038 | | | 14,921 | | | 4.46 | | | | | 223,017 | | | 7,725 | | | 4.62 | | | |
Total interest-bearing liabilities - excluding hedge impact | | | 1,747,993 | | | 26,656 | | | 2.04 | | | | | 1,374,788 | | | 31,656 | | | 3.07 | | | |
Net hedge (income) expense on liabilities | | | | | | (1,935 | ) | | | | | | | | | | 172 | | | | | | |
Total interest-bearing liabilities - including hedge impact | | | 1,747,993 | | | 24,721 | | | 1.89 | | | | | 1,374,788 | | | 31,828 | | | 3.09 | | | |
Noninterest-bearing sources: | | | | | | | | | | | | | | | | | | | | | | | |
Noninterest-bearing deposits | | | 245,242 | | | | | | | | | | | 188,800 | | | | | | | | | |
Other liabilities | | | 207,032 | | | | | | | | | | | 84,287 | | | | | | | | | |
Shareholders’ equity | | | 242,638 | | | | | | | | | | | 160,890 | | | | | | | | | |
Total liabilities and shareholders’ equity | | $ | 2,442,905 | | | | | | | | | | $ | 1,808,765 | | | | | | | | | |
Net interest spread | | | | | | | | | 2.43 | | | | | | | | | | | 2.55 | | | |
Impact of noninterest-bearing sources | | | | | | | | | 0.09 | | | | | | | | | | | 0.34 | | | |
Net interest income/yield on earning assets - excluding hedge impact | | | | | $ | 34,787 | | | 2.52 | | % | | | | | $ | 33,539 | | | 2.89 | | | % |
Net impact of hedge income (expense) | | | | | | 1,727 | | | 0.13 | | | | | | | | (391 | ) | | (0.03 | ) | | |
Net interest income/yield on earning assets | | | | | $ | 36,514 | | | 2.65 | | % | | | | | $ | 33,148 | | | 2.86 | | | % |
| (1) | This table presents a non-GAAP financial measure. The impact of interest rate risk management derivatives is shown separately. Interest income and interest expense amounts, and the yields and rates have been adjusted. Management believes this presentation is useful to investors because it adjusts for the impact of our hedging decisions and provides a better understanding of our hedging activities. The impact of interest rate risk management derivatives is not material to the average balances presented above. |
| (2) | The impact of interest rate risk management derivatives on interest income and interest expense is presented below. |
Interest income excludes the impact of interest rate risk management contracts, which increased (decreased) interest income on:
| | | | | | | | | | | | | | | | | | | | |
| | | | | Nine Months Ended September 30 | | | | | |
| | | | | 2009 | | | | | | | | | 2008 | | | | | |
Time deposits placed and other short-term investments | | | | $ | (3 | ) | | | | | | | | $ | (12 | ) | | | | |
Federal funds sold and securities borrowed or purchased under agreements to resell | | | | | 154 | | | | | | | | | | (173 | ) | | | | |
Trading account assets | | | | | (6 | ) | | | | | | | | | — | | | | | |
Debt securities | | | | | (275 | ) | | | | | | | | | (4 | ) | | | | |
Commercial - domestic | | | | | (78 | ) | | | | | | | | | (28 | ) | | | | |
Other earning assets | | | | | — | | | | | | | | | | (2 | ) | | | | |
Net hedge income (expense) on assets | | | | $ | (208 | ) | | | | | | | | $ | (219 | ) | | | | |
|
Interest expense excludes the impact of interest rate risk management contracts, which increased (decreased) interest expense on: |
| | | | | | | | |
NOW and money market deposit accounts | | | | $ | (1 | ) | | | | | | | | $ | 10 | | | | | |
Consumer CDs and IRAs | | | | | 169 | | | | | | | | | | 319 | | | | | |
Negotiable CDs, public funds and other time deposits | | | | | 12 | | | | | | | | | | 7 | | | | | |
Banks located in foreign countries | | | | | 35 | | | | | | | | | | (11 | ) | | | | |
Federal funds purchased and securities loaned or sold under agreements to repurchase and other short-term borrowings | | | | | 723 | | | | | | | | | | 400 | | | | | |
Long-term debt | | | | | (2,873 | ) | | | | | | | | | (553 | ) | | | | |
Net hedge (income) expense on liabilities | | | | $ | (1,935 | ) | | | | | | | | $ | 172 | | | | | |
Certain prior period amounts have been reclassified to conform to current period presentation.
Information for periods beginning July 1, 2008 includes the Countrywide acquisition. Information for periods beginning January 1, 2009 includes the
Merrill Lynch acquisition. Prior periods have not been restated.
| | |
| This information is preliminary and based on company data available at the time of the presentation. | | 11 |
Bank of America Corporation and Subsidiaries
Debt Securities and Available-for-Sale Marketable Equity Securities
(Dollars in millions)
| | | | | | | | | | | | | |
| | | September 30, 2009 |
| | | Amortized
Cost | | Gross
Unrealized
Gains | | Gross
Unrealized
Losses | | | Fair
Value |
Available-for-sale debt securities | | | | | | | | | | | | | |
U.S. Treasury securities and agency debentures | | $ | 26,562 | | $ | 439 | | $ | (32 | ) | | $ | 26,969 |
Mortgage-backed securities: | | | | | | | | | | | | | |
Agency MBSs | | | 120,653 | | | 3,007 | | | (165 | ) | | | 123,495 |
Agency collateralized mortgage obligations | | | 16,012 | | | 243 | | | (135 | ) | | | 16,120 |
Non-agency MBSs | | | 44,343 | | | 1,864 | | | (5,253 | ) | | | 40,954 |
Foreign securities | | | 5,017 | | | 40 | | | (897 | ) | | | 4,160 |
Corporate/Agency bonds | | | 5,853 | | | 156 | | | (122 | ) | | | 5,887 |
Other taxable securities(1) | | | 18,844 | | | 300 | | | (505 | ) | | | 18,639 |
| | | | | | | | | | | | | |
Total taxable securities | | | 237,284 | | | 6,049 | | | (7,109 | ) | | | 236,224 |
Tax-exempt securities | | | 10,939 | | | 209 | | | (172 | ) | | | 10,976 |
| | | | | | | | | | | | | |
Total available-for-sale debt securities | | $ | 248,223 | | $ | 6,258 | | $ | (7,281 | ) | | $ | 247,200 |
| | | | | | | | | | | | | |
Held-to-maturity debt securities(2) | | | 9,545 | | | — | | | (1,666 | ) | | | 7,879 |
| | | | | | | | | | | | | |
Total debt securities | | $ | 257,768 | | $ | 6,258 | | $ | (8,947 | ) | | $ | 255,079 |
| | | | | | | | | | | | | |
Available-for-sale marketable equity securities(3) | | $ | 6,189 | | $ | 3,172 | | $ | (612 | ) | | $ | 8,749 |
| | | | | | | | | | | | | |
| |
| | | June 30, 2009 |
| | | Amortized
Cost | | Gross
Unrealized
Gains | | Gross
Unrealized
Losses | | | Fair
Value |
Available-for-sale debt securities | | | | | | | | | | | | | |
U.S. Treasury securities and agency debentures | | $ | 14,545 | | $ | 383 | | $ | (12 | ) | | $ | 14,916 |
Mortgage-backed securities: | | | | | | | | | | | | | |
Agency MBSs | | | 135,348 | | | 2,330 | | | (210 | ) | | | 137,468 |
Agency collateralized mortgage obligations | | | 17,573 | | | 401 | | | (112 | ) | | | 17,862 |
Non-agency MBSs | | | 48,222 | | | 2,179 | | | (7,945 | ) | | | 42,456 |
Foreign securities | | | 5,405 | | | 24 | | | (1,204 | ) | | | 4,225 |
Corporate/Agency bonds | | | 5,794 | | | 101 | | | (412 | ) | | | 5,483 |
Other taxable securities(1) | | | 23,198 | | | 150 | | | (749 | ) | | | 22,599 |
| | | | | | | | | | | | | |
Total taxable securities | | | 250,085 | | | 5,568 | | | (10,644 | ) | | | 245,009 |
Tax-exempt securities | | | 13,032 | | | 85 | | | (607 | ) | | | 12,510 |
| | | | | | | | | | | | | |
Total available-for-sale debt securities | | $ | 263,117 | | $ | 5,653 | | $ | (11,251 | ) | | $ | 257,519 |
| | | | | | | | | | | | | |
Held-to-maturity debt securities(2) | | | 9,719 | | | — | | | (1,875 | ) | | | 7,844 |
| | | | | | | | | | | | | |
Total debt securities | | $ | 272,836 | | $ | 5,653 | | $ | (13,126 | ) | | $ | 265,363 |
| | | | | | | | | | | | | |
Available-for-sale marketable equity securities(3) | | $ | 6,427 | | $ | 1,495 | | $ | (947 | ) | | $ | 6,975 |
| | | | | | | | | | | | | |
| (1) | Includes asset-backed securities. |
| (2) | Includes asset-backed securities that were issued by the Corporation’s credit card securitization trust and retained by the corporation with an amortized cost of $6.9 billion and a fair value of $5.3 billion at September 30, 2009 and $7.4 billion and $5.5 billion at June 30, 2009. |
| (3) | Represents those available-for-sale marketable equity securities that are recorded in other assets on the Consolidated Balance Sheet. |
Certain prior period amounts have been reclassified among the segments to conform to the current period presentation.
Information for periods beginning July 1, 2008 includes the Countrywide acquisition. Information for periods beginning January 1, 2009 includes the
Merrill Lynch acquisition. Prior periods have not been restated.
| | |
| This information is preliminary and based on company data available at the time of the presentation. | | 12 |
Bank of America Corporation and Subsidiaries
Quarterly Results by Business Segment
(Dollars in millions)
| | | | | | | | | | | | | | | | | | | | | | | | | | | | | | | |
| | | Third Quarter 2009 | |
| | | Total
Corporation | | | | | Deposits | | Global
Card
Services (1) | | | Home
Loans &
Insurance | | | Global
Banking | | Global
Markets | | | GWIM | | All Other (1) | |
Net interest income(2) | | $ | 11,753 | | | | | $ | 1,740 | | $ | 4,995 | | | $ | 1,309 | | | $ | 2,784 | | $ | 1,462 | | | $ | 1,330 | | $ | (1,867 | ) |
Noninterest income | | | 14,612 | | | | | | 1,926 | | | 2,332 | | | | 2,102 | | | | 1,886 | | | 4,365 | | | | 2,765 | | | (764 | ) |
| | | | | | | | | | | | | | | | | | | | | | | | | | | | | | | |
Total revenue, net of interest expense | | | 26,365 | | | | | | 3,666 | | | 7,327 | | | | 3,411 | | | | 4,670 | | | 5,827 | | | | 4,095 | | | (2,631 | ) |
| | | | | | | | | |
Provision for credit losses | | | 11,705 | | | | | | 102 | | | 6,975 | | | | 2,897 | | | | 2,340 | | | 98 | | | | 515 | | | (1,222 | ) |
Noninterest expense | | | 16,306 | | | | | | 2,336 | | | 1,968 | | | | 3,041 | | | | 2,258 | | | 2,328 | | | | 3,169 | | | 1,206 | |
| | | | | | | | | | | | | | | | | | | | | | | | | | | | | | | |
Income (loss) before income taxes | | | (1,646 | ) | | | | | 1,228 | | | (1,616 | ) | | | (2,527 | ) | | | 72 | | | 3,401 | | | | 411 | | | (2,615 | ) |
Income tax expense (benefit)(2) | | | (645 | ) | | | | | 430 | | | (580 | ) | | | (895 | ) | | | 32 | | | 1,211 | | | | 140 | | | (983 | ) |
| | | | | | | | | | | | | | | | | | | | | | | | | | | | | | | |
Net income (loss) | | $ | (1,001 | ) | | | | $ | 798 | | $ | (1,036 | ) | | $ | (1,632 | ) | | $ | 40 | | $ | 2,190 | | | $ | 271 | | $ | (1,632 | ) |
| | | | | | | | | | | | | | | | | | | | | | | | | | | | | | | |
| | | | | | | | | |
Average | | | | | | | | | | | | | | | | | | | | | | | | | | | | | | | |
Total loans and leases | | $ | 930,255 | | | | | | n/m | | $ | 213,340 | | | $ | 132,599 | | | $ | 308,764 | | | n/m | | | $ | 101,181 | | $ | 147,666 | |
Total assets(3) | | | 2,390,675 | | | | | $ | 443,982 | | | 228,384 | | | | 236,200 | | | | 405,178 | | $ | 633,909 | | | | 239,113 | | | n/m | |
Total deposits | | | 989,295 | | | | | | 418,511 | | | n/m | | | | n/m | | | | 214,286 | | | n/m | | | | 214,994 | | | 108,244 | |
Allocated equity | | | 255,983 | | | | | | 23,874 | | | 41,037 | | | | 24,669 | | | | 61,327 | | | 43,739 | | | | 19,258 | | | 42,079 | |
| | | | | | | | | |
Period end | | | | | | | | | | | | | | | | | | | | | | | | | | | | | | | |
Total loans and leases | | $ | 914,266 | | | | | | n/m | | $ | 207,727 | | | $ | 134,255 | | | $ | 300,814 | | | n/m | | | $ | 99,307 | | $ | 145,856 | |
Total assets(3) | | | 2,251,043 | | | | | $ | 442,274 | | | 223,980 | | | | 234,842 | | | | 381,041 | | $ | 588,641 | | | | 249,110 | | | n/m | |
Total deposits | | | 974,899 | | | | | | 416,949 | | | n/m | | | | n/m | | | | 210,211 | | | n/m | | | | 220,482 | | | 94,573 | |
| |
| | | Second Quarter 2009 | |
| | | Total
Corporation | | | | | Deposits | | Global
Card
Services(1) | | | Home
Loans &
Insurance | | | Global
Banking | | Global
Markets | | | GWIM | | All Other(1) | |
Net interest income(2) | | $ | 11,942 | | | | | $ | 1,741 | | $ | 5,052 | | | $ | 1,196 | | | $ | 2,768 | | $ | 1,515 | | | $ | 1,292 | | $ | (1,622 | ) |
Noninterest income | | | 21,144 | | | | | | 1,749 | | | 2,287 | | | | 3,264 | | | | 5,960 | | | 2,968 | | | | 2,878 | | | 2,038 | |
| | | | | | | | | | | | | | | | | | | | | | | | | | | | | | | |
Total revenue, net of interest expense | | | 33,086 | | | | | | 3,490 | | | 7,339 | | | | 4,460 | | | | 8,728 | | | 4,483 | | | | 4,170 | | | 416 | |
| | | | | | | | | |
Provision for credit losses | | | 13,375 | | | | | | 96 | | | 7,741 | | | | 2,726 | | | | 2,584 | | | (1 | ) | | | 238 | | | (9 | ) |
Noninterest expense | | | 17,020 | | | | | | 2,637 | | | 1,977 | | | | 2,828 | | | | 2,292 | | | 2,570 | | | | 3,297 | | | 1,419 | |
| | | | | | | | | | | | | | | | | | | | | | | | | | | | | | | |
Income (loss) before income taxes | | | 2,691 | | | | | | 757 | | | (2,379 | ) | | | (1,094 | ) | | | 3,852 | | | 1,914 | | | | 635 | | | (994 | ) |
Income tax expense (benefit)(2) | | | (533 | ) | | | | | 248 | | | (762 | ) | | | (370 | ) | | | 1,358 | | | 524 | | | | 206 | | | (1,737 | ) |
| | | | | | | | | | | | | | | | | | | | | | | | | | | | | | | |
Net income (loss) | | $ | 3,224 | | | | | $ | 509 | | $ | (1,617 | ) | | $ | (724 | ) | | $ | 2,494 | | $ | 1,390 | | | $ | 429 | | $ | 743 | |
| | | | | | | | | | | | | | | | | | | | | | | | | | | | | | | |
| | | | | | | | | |
Average | | | | | | | | | | | | | | | | | | | | | | | | | | | | | | | |
Total loans and leases | | $ | 966,105 | | | | | | n/m | | $ | 220,365 | | | $ | 131,509 | | | $ | 323,217 | | | n/m | | | $ | 101,748 | | $ | 159,144 | |
Total assets(3) | | | 2,420,317 | | | | | $ | 440,804 | | | 236,016 | | | | 232,361 | | | | 389,496 | | $ | 656,331 | | | | 237,442 | | | n/m | |
Total deposits | | | 974,892 | | | | | | 415,501 | | | n/m | | | | n/m | | | | 203,917 | | | n/m | | | | 215,383 | | | 104,382 | |
Allocated equity | | | 242,867 | | | | | | 23,576 | | | 42,118 | | | | 15,827 | | | | 61,306 | | | 31,034 | | | | 18,702 | | | 50,304 | |
| | | | | | | | | |
Period end | | | | | | | | | | | | | | | | | | | | | | | | | | | | | | | |
Total loans and leases | | $ | 942,248 | | | | | | n/m | | $ | 215,904 | | | $ | 131,120 | | | $ | 314,512 | | | n/m | | | $ | 100,878 | | $ | 153,010 | |
Total assets(3) | | | 2,254,394 | | | | | $ | 446,650 | | | 231,987 | | | | 234,388 | | | | 382,594 | | $ | 572,702 | | | | 233,662 | | | n/m | |
Total deposits | | | 970,742 | | | | | | 421,648 | | | n/m | | | | n/m | | | | 208,098 | | | n/m | | | | 207,581 | | | 99,495 | |
| |
| | | Third Quarter 2008 | |
| | | Total
Corporation | | | | | Deposits | | Global
Card
Services(1) | | | Home
Loans &
Insurance | | | Global
Banking | | Global
Markets | | | GWIM | | All Other(1) | |
Net interest income(2) | | $ | 11,920 | | | | | $ | 2,892 | | $ | 4,930 | | | $ | 1,135 | | | $ | 2,748 | | $ | 1,286 | | | $ | 1,271 | | $ | (2,342 | ) |
Noninterest income | | | 7,979 | | | | | | 1,833 | | | 2,823 | | | | 2,339 | | | | 1,536 | | | (1,125 | ) | | | 299 | | | 274 | |
| | | | | | | | | | | | | | | | | | | | | | | | | | | | | | | |
Total revenue, net of interest expense | | | 19,899 | | | | | | 4,725 | | | 7,753 | | | | 3,474 | | | | 4,284 | | | 161 | | | | 1,570 | | | (2,068 | ) |
| | | | | | | | | |
Provision for credit losses | | | 6,450 | | | | | | 98 | | | 5,602 | | | | 818 | | | | 802 | | | (24 | ) | | | 150 | | | (996 | ) |
Noninterest expense | | | 11,660 | | | | | | 2,098 | | | 2,405 | | | | 2,741 | | | | 1,849 | | | 1,120 | | | | 1,286 | | | 161 | |
| | | | | | | | | | | | | | | | | | | | | | | | | | | | | | | |
Income (loss) before income taxes | | | 1,789 | | | | | | 2,529 | | | (254 | ) | | | (85 | ) | | | 1,633 | | | (935 | ) | | | 134 | | | (1,233 | ) |
Income tax expense (benefit)(2) | | | 612 | | | | | | 954 | | | (87 | ) | | | (31 | ) | | | 609 | | | (347 | ) | | | 54 | | | (540 | ) |
| | | | | | | | | | | | | | | | | | | | | | | | | | | | | | | |
Net income (loss) | | $ | 1,177 | | | | | $ | 1,575 | | $ | (167 | ) | | $ | (54 | ) | | $ | 1,024 | | $ | (588 | ) | | $ | 80 | | $ | (693 | ) |
| | | | | | | | | | | | | | | | | | | | | | | | | | | | | | | |
| | | | | | | | | |
Average | | | | | | | | | | | | | | | | | | | | | | | | | | | | | | | |
Total loans and leases | | $ | 946,914 | | | | | | n/m | | $ | 239,951 | | | $ | 122,034 | | | $ | 320,813 | | | n/m | | | $ | 88,255 | | $ | 146,305 | |
Total assets(3) | | | 1,905,691 | | | | | $ | 393,400 | | | 261,798 | | | | 179,998 | | | | 385,111 | | $ | 430,539 | | | | 173,505 | | | n/m | |
Total deposits | | | 857,845 | | | | | | 377,778 | | | n/m | | | | n/m | | | | 177,668 | | | n/m | | | | 162,192 | | | 104,370 | |
Allocated equity | | | 166,454 | | | | | | 24,088 | | | 39,008 | | | | 16,236 | | | | 50,558 | | | 12,127 | | | | 11,677 | | | 12,760 | |
| | | | | | | | | |
Period end | | | | | | | | | | | | | | | | | | | | | | | | | | | | | | | |
Total loans and leases | | $ | 942,676 | | | | | | n/m | | $ | 235,998 | | | $ | 122,975 | | | $ | 326,970 | | | n/m | | | $ | 89,004 | | $ | 146,365 | |
Total assets(3) | | | 1,831,177 | | | | | $ | 397,651 | | | 256,885 | | | | 178,956 | | | | 397,645 | | $ | 350,326 | | | | 180,499 | | | n/m | |
Total deposits | | | 874,051 | | | | | | 381,811 | | | n/m | | | | n/m | | | | 195,486 | | | n/m | | | | 167,426 | | | 99,003 | |
| (1) | Global Card Services is presented on a managed basis with a corresponding offset recorded in All Other. |
| (2) | Fully taxable-equivalent basis |
| (3) | Total assets include asset allocations to match liabilities (i.e., deposits). |
n/m = not meaningful
Certain prior period amounts have been reclassified among the segments to conform to the current period presentation.
Information for periods beginning July 1, 2008 includes the Countrywide acquisition. Information for periods beginning January 1, 2009 includes the
Merrill Lynch acquisition. Prior periods have not been restated.
| | |
| This information is preliminary and based on company data available at the time of the presentation. | | 13 |
Bank of America Corporation and Subsidiaries
Year-to-Date Results by Business Segment
(Dollars in millions)
| | | | | | | | | | | | | | | | | | | | | | | | | | | | | | |
| | | Nine Months Ended September 30, 2009 | |
| | | Total
Corporation | | | | Deposits | | Global
Card
Services (1) | | | Home
Loans &
Insurance | | | Global
Banking | | Global
Markets | | | GWIM | | All Other (1) | |
Net interest income(2) | | $ | 36,514 | | | | $ | 5,382 | | $ | 15,312 | | | $ | 3,691 | | | $ | 8,378 | | $ | 4,870 | | | $ | 4,280 | | $ | (5,399 | ) |
Noninterest income | | | 59,017 | | | | | 5,178 | | | 6,869 | | | | 9,410 | | | | 9,722 | | | 12,366 | | | | 8,326 | | | 7,146 | |
| | | | | | | | | | | | | | | | | | | | | | | | | | | | | | |
Total revenue, net of interest expense | | | 95,531 | | | | | 10,560 | | | 22,181 | | | | 13,101 | | | | 18,100 | | | 17,236 | | | | 12,606 | | | 1,747 | |
| | | | | | | | | |
Provision for credit losses | | | 38,460 | | | | | 289 | | | 23,157 | | | | 8,995 | | | | 6,772 | | | 148 | | | | 1,007 | | | (1,908 | ) |
Noninterest expense | | | 50,328 | | | | | 7,318 | | | 6,024 | | | | 8,519 | | | | 7,131 | | | 7,962 | | | | 9,747 | | | 3,627 | |
| | | | | | | | | | | | | | | | | | | | | | | | | | | | | | |
Income (loss) before income taxes | | | 6,743 | | | | | 2,953 | | | (7,000 | ) | | | (4,413 | ) | | | 4,197 | | | 9,126 | | | | 1,852 | | | 28 | |
Income tax expense (benefit)(2) | | | 273 | | | | | 1,041 | | | (2,473 | ) | | | (1,563 | ) | | | 1,494 | | | 3,099 | | | | 650 | | | (1,975 | ) |
| | | | | | | | | | | | | | | | | | | | | | | | | | | | | | |
Net income (loss) | | $ | 6,470 | | | | $ | 1,912 | | $ | (4,527 | ) | | $ | (2,850 | ) | | $ | 2,703 | | $ | 6,027 | | | $ | 1,202 | | $ | 2,003 | |
| | | | | | | | | | | | | | | | | | | | | | | | | | | | | | |
| | | | | | | | | |
Average | | | | | | | | | | | | | | | | | | | | | | | | | | | | | | |
Total loans and leases | | $ | 963,260 | | | | | n/m | | $ | 220,666 | | | $ | 129,910 | | | $ | 320,904 | | | n/m | | | $ | 104,454 | | $ | 158,721 | |
Total assets(3) | | | 2,442,905 | | | | $ | 428,945 | | | 236,937 | | | | 229,321 | | | | 387,725 | | $ | 664,690 | | | | 251,512 | | | n/m | |
Total deposits | | | 976,182 | | | | | 403,587 | | | n/m | | | | n/m | | | | 205,285 | | | n/m | | | | 226,967 | | | 106,944 | |
Allocated equity | | | 242,638 | | | | | 23,646 | | | 41,177 | | | | 18,337 | | | | 59,993 | | | 34,121 | | | | 18,368 | | | 46,996 | |
| | | | | | | | | |
Period end | | | | | | | | | | | | | | | | | | | | | | | | | | | | | | |
Total loans and leases | | $ | 914,266 | | | | | n/m | | $ | 207,727 | | | $ | 134,255 | | | $ | 300,814 | | | n/m | | | $ | 99,307 | | $ | 145,856 | |
Total assets(3) | | | 2,251,043 | | | | $ | 442,274 | | | 223,980 | | | | 234,842 | | | | 381,041 | | $ | 588,641 | | | | 249,110 | | | n/m | |
Total deposits | | | 974,899 | | | | | 416,949 | | | n/m | | | | n/m | | | | 210,211 | | | n/m | | | | 220,482 | | | 94,573 | |
| |
| | | Nine Months Ended September 30, 2008 | |
| | | Total
Corporation | | | | Deposits | | Global
Card
Services (1) | | | Home
Loans &
Insurance | | | Global
Banking | | Global
Markets | | | GWIM | | All Other(1) | |
Net interest income(2) | | $ | 33,148 | | | | $ | 7,999 | | $ | 14,279 | | | $ | 2,305 | | | $ | 7,641 | | $ | 3,618 | | | $ | 3,449 | | $ | (6,143 | ) |
Noninterest income | | | 24,848 | | | | | 5,183 | | | 8,923 | | | | 3,753 | | | | 5,096 | | | (2,894 | ) | | | 2,370 | | | 2,417 | |
| | | | | | | | | | | | | | | | | | | | | | | | | | | | | | |
Total revenue, net of interest expense | | | 57,996 | | | | | 13,182 | | | 23,202 | | | | 6,058 | | | | 12,737 | | | 724 | | | | 5,819 | | | (3,726 | ) |
| | | | | | | | | |
Provision for credit losses | | | 18,290 | | | | | 293 | | | 14,314 | | | | 4,664 | | | | 1,728 | | | (63 | ) | | | 512 | | | (3,158 | ) |
Noninterest expense | | | 30,582 | | | | | 6,566 | | | 6,980 | | | | 4,211 | | | | 5,505 | | | 2,802 | | | | 3,841 | | | 677 | |
| | | | | | | | | | | | | | | | | | | | | | | | | | | | | | |
Income (loss) before income taxes | | | 9,124 | | | | | 6,323 | | | 1,908 | | | | (2,817 | ) | | | 5,504 | | | (2,015 | ) | | | 1,466 | | | (1,245 | ) |
Income tax expense (benefit)(2) | | | 3,327 | | | | | 2,374 | | | 664 | | | | (1,042 | ) | | | 2,064 | | | (752 | ) | | | 553 | | | (534 | ) |
| | | | | | | | | | | | | | | | | | | | | | | | | | | | | | |
Net income (loss) | | $ | 5,797 | | | | $ | 3,949 | | $ | 1,244 | | | $ | (1,775 | ) | | $ | 3,440 | | $ | (1,263 | ) | | $ | 913 | | $ | (711 | ) |
| | | | | | | | | | | | | | | | | | | | | | | | | | | | | | |
| | | | | | | | | |
Average | | | | | | | | | | | | | | | | | | | | | | | | | | | | | | |
Total loans and leases | | $ | 900,574 | | | | | n/m | | $ | 237,817 | | | $ | 100,237 | | | $ | 314,031 | | | n/m | | | $ | 87,162 | | $ | 132,615 | |
Total assets(3) | | | 1,808,765 | | | | $ | 374,234 | | | 260,475 | | | | 128,333 | | | | 377,832 | | $ | 440,311 | | | | 166,013 | | | n/m | |
Total deposits | | | 810,663 | | | | | 350,765 | | | n/m | | | | n/m | | | | 170,162 | | | n/m | | | | 156,762 | | $ | 104,143 | |
Allocated equity | | | 160,890 | | | | | 24,429 | | | 38,814 | | | | 7,515 | | | | 49,547 | | | 11,937 | | | | 11,674 | | | 16,974 | |
| | | | | | | | | |
Period end | | | | | | | | | | | | | | | | | | | | | | | | | | | | | | |
Total loans and leases | | $ | 942,676 | | | | | n/m | | $ | 235,998 | | | $ | 122,975 | | | $ | 326,970 | | | n/m | | | $ | 89,004 | | $ | 146,365 | |
Total assets(3) | | | 1,831,177 | | | | $ | 397,651 | | | 256,885 | | | | 178,956 | | | | 397,645 | | $ | 350,326 | | | | 180,499 | | | n/m | |
Total deposits | | | 874,051 | | | | | 381,811 | | | n/m | | | | n/m | | | | 195,486 | | | n/m | | | | 167,426 | | | 99,003 | |
| (1) | Global Card Services is presented on a managed basis with a corresponding offset recorded in All Other. |
| (2) | Fully taxable-equivalent basis |
| (3) | Total assets include asset allocations to match liabilities (i.e., deposits). |
n/m = not meaningful
Certain prior period amounts have been reclassified among the segments to conform to the current period presentation.
Information for periods beginning July 1, 2008 includes the Countrywide acquisition. Information for periods beginning January 1, 2009 includes the
Merrill Lynch acquisition. Prior periods have not been restated.
| | |
| This information is preliminary and based on company data available at the time of the presentation. | | 14 |
Bank of America Corporation and Subsidiaries
Deposits Segment Results(1)
(Dollars in millions)
| | | | | | | | | | | | | | | | | | | | | | | | | | | | | | | | | | | | | | | |
| | | Nine Months Ended
September 30 | | | | | | | | Third
Quarter
2009 | | | | Second
Quarter
2009 | | | | First
Quarter
2009 | | | | Fourth
Quarter
2008 | | | | Third
Quarter
2008 | | |
| | | | | | | | | | | | | | | |
| | | 2009 | | | | 2008 | | | | | | | | | | | | | |
Net interest income(2) | | $ | 5,382 | | | | $ | 7,999 | | | | | | | | $ | 1,740 | | | | $ | 1,741 | | | | $ | 1,901 | | | | $ | 2,971 | | | | $ | 2,892 | | |
Noninterest income: | | | | | | | | | | | | | | | | | | | | | | | | | | | | | | | | | | | | | | | |
Service charges | | | 5,156 | | | | | 5,125 | | | | | | | | | 1,906 | | | | | 1,748 | | | | | 1,502 | | | | | 1,675 | | | | | 1,820 | | |
All other income | | | 22 | | | | | 58 | | | | | | | | | 20 | | | | | 1 | | | | | 1 | | | | | 11 | | | | | 13 | | |
| | | | | | | | | | | | | | | | | | | | | | | | | | | | | | | | | | | | | | | |
Total noninterest income | | | 5,178 | | | | | 5,183 | | | | | | | | | 1,926 | | | | | 1,749 | | | | | 1,503 | | | | | 1,686 | | | | | 1,833 | | |
| | | | | | | | | | | | | | | | | | | | | | | | | | | | | | | | | | | | | | | |
Total revenue, net of interest expense | | | 10,560 | | | | | 13,182 | | | | | | | | | 3,666 | | | | | 3,490 | | | | | 3,404 | | | | | 4,657 | | | | | 4,725 | | |
| | | | | | | | | | | | | | | | |
Provision for credit losses | | | 289 | | | | | 293 | | | | | | | | | 102 | | | | | 96 | | | | | 91 | | | | | 107 | | | | | 98 | | |
Noninterest expense | | | 7,318 | | | | | 6,566 | | | | | | | | | 2,336 | | | | | 2,637 | | | | | 2,345 | | | | | 2,215 | | | | | 2,098 | | |
| | | | | | | | | | | | | | | | | | | | | | | | | | | | | | | | | | | | | | | |
Income before income taxes | | | 2,953 | | | | | 6,323 | | | | | | | | | 1,228 | | | | | 757 | | | | | 968 | | | | | 2,335 | | | | | 2,529 | | |
Income tax expense(2) | | | 1,041 | | | | | 2,374 | | | | | | | | | 430 | | | | | 248 | | | | | 363 | | | | | 772 | | | | | 954 | | |
| | | | | | | | | | | | | | | | | | | | | | | | | | | | | | | | | | | | | | | |
Net income | | $ | 1,912 | | | | $ | 3,949 | | | | | | | | $ | 798 | | | | $ | 509 | | | | $ | 605 | | | | $ | 1,563 | | | | $ | 1,575 | | |
| | | | | | | | | | | | | | | | | | | | | | | | | | | | | | | | | | | | | | | |
Net interest yield(2) | | | 1.79 | | % | | | 3.10 | | % | | | | | | | 1.66 | | % | | | 1.69 | | % | | | 2.05 | | % | | | 3.22 | | % | | | 3.13 | | % |
Return on average equity | | | 10.81 | | | | | 21.59 | | | | | | | | | 13.26 | | | | | 8.66 | | | | | 10.44 | | | | | 25.39 | | | | | 26.01 | | |
Efficiency ratio(2) | | | 69.30 | | | | | 49.82 | | | | | | | | | 63.72 | | | | | 75.54 | | | | | 68.91 | | | | | 47.58 | | | | | 44.41 | | |
| | | | | | | | | | | | | | | | |
Balance sheet | | | | | | | | | | | | | | | | | | | | | | | | | | | | | | | | | | | | | | | |
| | | | | | | | | | | | | | | | |
Average | | | | | | | | | | | | | | | | | | | | | | | | | | | | | | | | | | | | | | | |
Total earning assets(3) | | $ | 402,318 | | | | $ | 344,312 | | | | | | | | $ | 417,095 | | | | $ | 414,200 | | | | $ | 375,199 | | | | $ | 366,661 | | | | $ | 367,824 | | |
Total assets(3) | | | 428,945 | | | | | 374,234 | | | | | | | | | 443,982 | | | | | 440,804 | | | | | 401,584 | | | | | 393,463 | | | | | 393,400 | | |
Total deposits | | | 403,587 | | | | | 350,765 | | | | | | | | | 418,511 | | | | | 415,501 | | | | | 376,285 | | | | | 377,987 | | | | | 377,778 | | |
Allocated equity | | | 23,646 | | | | | 24,429 | | | | | | | | | 23,874 | | | | | 23,576 | | | | | 23,484 | | | | | 24,493 | | | | | 24,088 | | |
| | | | | | | | | | | | | | | | |
Period end | | | | | | | | | | | | | | | | | | | | | | | | | | | | | | | | | | | | | | | |
Total earning assets(3) | | $ | 415,508 | | | | $ | 370,507 | | | | | | | | $ | 415,508 | | | | $ | 420,465 | | | | $ | 389,435 | | | | $ | 363,334 | | | | $ | 370,507 | | |
Total assets(3) | | | 442,274 | | | | | 397,651 | | | | | | | | | 442,274 | | | | | 446,650 | | | | | 415,765 | | | | | 390,487 | | | | | 397,651 | | |
Total deposits | | | 416,949 | | | | | 381,811 | | | | | | | | | 416,949 | | | | | 421,648 | | | | | 390,245 | | | | | 375,763 | | | | | 381,811 | | |
| (1) | Deposits includes the net impact of migrating customers and their related deposit balances between Global Wealth & Investment Management (GWIM) and Deposits. After migration, the associated net interest income, service charges and noninterest expense are recorded in the appropriate segment. |
| (2) | Fully taxable-equivalent basis |
| (3) | Total earning assets and total assets include asset allocations to match liabilities (i.e., deposits). |
Certain prior period amounts have been reclassified among the segments to conform to the current period presentation.
Information for periods beginning July 1, 2008 includes the Countrywide acquisition. Information for periods beginning January 1, 2009 includes the
Merrill Lynch acquisition. Prior periods have not been restated.
| | |
| This information is preliminary and based on company data available at the time of the presentation. | | 15 |
Bank of America Corporation and Subsidiaries
Deposits Key Indicators
(Dollars in millions, except as noted)
| | | | | | | | | | | | | | | | | | | | | | | | | | | | | | | | | | | | | | | | | | | |
| | | Nine Months Ended
September 30 | | | | | | | | Third
Quarter | | | | | Second
Quarter | | | | | First
Quarter | | | | | Fourth
Quarter | | | | Third
Quarter | | |
| | | 2009 | | | | | 2008 | | | | | | | | 2009 | | | | | 2009 | | | | | 2009 | | | | | 2008 | | | | 2008 | | |
Average deposit balances | | | | | | | | | | | | | | | | | | | | | | | | | | | | | | | | | | | | | | | | | | | |
Checking | | $ | 132,586 | | | | | $ | 126,208 | | | | | | | | $ | 136,603 | | | | | $ | 135,356 | | | | | $ | 125,679 | | | | | $ | 124,212 | | | | $ | 125,417 | | |
Savings | | | 31,485 | | | | | | 29,437 | | | | | | | | | 32,374 | | | | | | 32,488 | | | | | | 29,564 | | | | | | 28,687 | | | | | 29,392 | | |
MMS | | | 89,438 | | | | | | 71,870 | | | | | | | | | 98,659 | | | | | | 91,275 | | | | | | 78,154 | | | | | | 80,391 | | | | | 80,041 | | |
CDs and IRAs | | | 146,823 | | | | | | 120,138 | | | | | | | | | 147,844 | | | | | | 152,828 | | | | | | 139,708 | | | | | | 141,499 | | | | | 139,185 | | |
Foreign and other | | | 3,255 | | | | | | 3,112 | | | | | | | | | 3,031 | | | | | | 3,554 | | | | | | 3,180 | | | | | | 3,198 | | | | | 3,743 | | |
| | | | | | | | | | | | | | | | | | | | | | | | | | | | | | | | | | | | | | | | | | | |
Total average deposit balances | | $ | 403,587 | | | | | $ | 350,765 | | | | | | | | $ | 418,511 | | | | | $ | 415,501 | | | | | $ | 376,285 | | | | | $ | 377,987 | | | | $ | 377,778 | | |
| | | | | | | | | | | | | | | | | | | | | | | | | | | | | | | | | | | | | | | | | | | |
| | | | | | | | | | | | | | | | |
Total balances migrated to (from)GWIM | | $ | (43,400 | ) | | | | $ | 15,934 | | | | | | | | $ | (2,920 | ) | | | | $ | (34,340 | ) | | | | $ | (6,140 | ) | | | | $ | 4,542 | | | | $ | 3,272 | | |
| | | | | | | | | | | | | | | | |
Deposit spreads (excludes noninterest costs) | | | | | | | | | | | | | | | | | | | | | | | | | | | | | | | | | | | | | | | | | | | |
Checking | | | 4.06 | | | % | | | 4.22 | | % | | | | | | | 3.93 | | | % | | | 4.07 | | | % | | | 4.18 | | | % | | | 4.25 | | % | | | 4.23 | | % |
Savings | | | 3.86 | | | | | | 3.80 | | | | | | | | | 3.83 | | | | | | 3.87 | | | | | | 3.89 | | | | | | 3.82 | | | | | 3.80 | | |
MMS | | | 0.36 | | | | | | 1.32 | | | | | | | | | 0.58 | | | | | | 0.55 | | | | | | (0.14 | ) | | | | | 0.91 | | | | | 1.15 | | |
CDs and IRAs | | | 0.04 | | | | | | 0.34 | | | | | | | | | (0.01 | ) | | | | | 0.05 | | | | | | 0.09 | | | | | | 0.26 | | | | | 0.14 | | |
Foreign and other | | | 3.62 | | | | | | 3.69 | | | | | | | | | 3.46 | | | | | | 3.68 | | | | | | 3.72 | | | | | | 3.60 | | | | | 3.81 | | |
Total deposit spreads | | | 1.74 | | | | | | 2.23 | | | | | | | | | 1.72 | | | | | | 1.78 | | | | | | 1.71 | | | | | | 1.99 | | | | | 2.01 | | |
| | | | | | | | | | | | | | | | |
Net new retail checking (units in thousands) | | | 433 | | | | | | 2,054 | | | | | | | | | 39 | | | | | | 176 | | | | | | 218 | | | | | | 130 | | | | | 823 | | |
| | | | | | | | | | | | | | | | |
Online banking (end of period) | | | | | | | | | | | | | | | | | | | | | | | | | | | | | | | | | | | | | | | | | | | |
| | | | | | | | | | | | | | | | |
Active accounts (units in thousands) | | | 29,736 | | | | | | 28,636 | | | | | | | | | 29,736 | | | | | | 29,196 | | | | | | 29,515 | | | | | | 28,854 | | | | | 28,636 | | |
Active billpay accounts (units in thousands) | | | 15,998 | | | | | | 15,732 | | | | | | | | | 15,998 | | | | | | 16,000 | | | | | | 16,031 | | | | | | 15,861 | | | | | 15,732 | | |
Bank of America has the largest active online banking customer base with 29.7 million subscribers.
Bank of America uses a strict Active User standard - customers must have used our online services within the last 90 days.
16.0 millionactivebill pay users paid $79.6 billion worth of bills this quarter. The number of customers who sign up and use Bank of America’s Bill Pay Service continues to surpass that of any other financial institution.
Currently, approximately 330 companies are presenting 39.1 million e-bills per quarter.
Certain prior period amounts have been reclassified to conform to the current period presentation.
Information for periods beginning July 1, 2008 includes the Countrywide acquisition. Information for periods beginning January 1, 2009 includes the
Merrill Lynch acquisition. Prior periods have not been restated.
| | |
| This information is preliminary and based on company data available at the time of the presentation. | | 16 |
Bank of America Corporation and Subsidiaries
Global Card Services Segment Results(1)
(Dollars in millions)
| | | | | | | | | | | | | | | | | | | | | | | | | | | | | | | | | | | | | | | | | | | | | |
| | | Nine Months Ended
September 30 | | | | | | Third
Quarter | | | | | Second
Quarter | | | | | First
Quarter | | | | | Fourth
Quarter | | | | | Third
Quarter | | | |
| | | 2009 | | | | | 2008 | | | | | | | | 2009 | | | | | 2009 | | | | | 2009 | | | | | 2008 | | | | | 2008 | | | |
Net interest income(2) | | $ | 15,312 | | | | | $ | 14,279 | | | | | | | | $ | 4,995 | | | | | $ | 5,052 | | | | | $ | 5,265 | | | | | $ | 5,310 | | | | | $ | 4,930 | | | |
Noninterest income: | | | | | | | | | | | | | | | | | | | | | | | | | | | | | | | | | | | | | | | | | | | | | |
Card income | | | 6,462 | | | | | | 7,564 | | | | | | | | | 2,183 | | | | | | 2,164 | | | | | | 2,115 | | | | | | 2,469 | | | | | | 2,289 | | | |
All other income | | | 407 | | | | | | 1,359 | | | | | | | | | 149 | | | | | | 123 | | | | | | 135 | | | | | | 239 | | | | | | 534 | | | |
| | | | | | | | | | | | | | | | | | | | | | | | | | | | | | | | | | | | | | | | | | | | | |
Total noninterest income | | | 6,869 | | | | | | 8,923 | | | | | | | | | 2,332 | | | | | | 2,287 | | | | | | 2,250 | | | | | | 2,708 | | | | | | 2,823 | | | |
| | | | | | | | | | | | | | | | | | | | | | | | | | | | | | | | | | | | | | | | | | | | | |
Total revenue, net of interest expense | | | 22,181 | | | | | | 23,202 | | | | | | | | | 7,327 | | | | | | 7,339 | | | | | | 7,515 | | | | | | 8,018 | | | | | | 7,753 | | | |
| | | | | | | | | | | | | | | | |
Provision for credit losses(3) | | | 23,157 | | | | | | 14,314 | | | | | | | | | 6,975 | | | | | | 7,741 | | | | | | 8,441 | | | | | | 5,851 | | | | | | 5,602 | | | |
Noninterest expense | | | 6,024 | | | | | | 6,980 | | | | | | | | | 1,968 | | | | | | 1,977 | | | | | | 2,079 | | | | | | 2,179 | | | | | | 2,405 | | | |
| | | | | | | | | | | | | | | | | | | | | | | | | | | | | | | | | | | | | | | | | | | | | |
Income (loss) before income taxes | | | (7,000 | ) | | | | | 1,908 | | | | | | | | | (1,616 | ) | | | | | (2,379 | ) | | | | | (3,005 | ) | | | | | (12 | ) | | | | | (254 | ) | | |
Income tax expense (benefit)(2) | | | (2,473 | ) | | | | | 664 | | | | | | | | | (580 | ) | | | | | (762 | ) | | | | | (1,131 | ) | | | | | (3 | ) | | | | | (87 | ) | | |
| | | | | | | | | | | | | | | | | | | | | | | | | | | | | | | | | | | | | | | | | | | | | |
Net income (loss) | | $ | (4,527 | ) | | | | $ | 1,244 | | | | | | | | $ | (1,036 | ) | | | | $ | (1,617 | ) | | | | $ | (1,874 | ) | | | | $ | (9 | ) | | | | $ | (167 | ) | | |
| | | | | | | | | | | | | | | | | | | | | | | | | | | | | | | | | | | | | | | | | | | | | |
| | | | | | | | | | | | | | | | |
Net interest yield(2) | | | 9.29 | | | % | | | 8.01 | | % | | | | | | | 9.30 | | | % | | | 9.20 | | | % | | | 9.35 | | | % | | | 9.05 | | | % | | | 8.16 | | | % |
Return on average equity | | | n/m | | | | | | 4.28 | | | | | | | | | n/m | | | | | | n/m | | | | | | n/m | | | | | | n/m | | | | | | n/m | | | |
Efficiency ratio(2) | | | 27.16 | | | | | | 30.09 | | | | | | | | | 26.87 | | | | | | 26.94 | | | | | | 27.66 | | | | | | 27.18 | | | | | | 31.03 | | | |
| | | | | | | | | | | | | | | | |
| Balance sheet | | | | | | | | | | | | | | | | | | | | | | | | | | | | | | | | | | | | | | | | | | | | | |
| | | | | | | | | | | | | | | | |
Average | | | | | | | | | | | | | | | | | | | | | | | | | | | | | | | | | | | | | | | | | | | | | |
Total loans and leases | | $ | 220,666 | | | | | $ | 237,817 | | | | | | | | $ | 213,340 | | | | | $ | 220,365 | | | | | $ | 228,461 | | | | | $ | 233,427 | | | | | $ | 239,951 | | | |
Total earning assets | | | 220,466 | | | | | | 238,204 | | | | | | | | | 212,976 | | | | | | 220,133 | | | | | | 228,460 | | | | | | 233,513 | | | | | | 240,298 | | | |
Total assets | | | 236,937 | | | | | | 260,475 | | | | | | | | | 228,384 | | | | | | 236,016 | | | | | | 246,610 | | | | | | 253,455 | | | | | | 261,798 | | | |
Allocated equity | | | 41,177 | | | | | | 38,814 | | | | | | | | | 41,037 | | | | | | 42,118 | | | | | | 40,370 | | | | | | 40,294 | | | | | | 39,008 | | | |
| | | | | | | | | | | | | | | | |
Period end | | | | | | | | | | | | | | | | | | | | | | | | | | | | | | | | | | | | | | | | | | | | | |
Total loans and leases | | $ | 207,727 | | | | | $ | 235,998 | | | | | | | | $ | 207,727 | | | | | $ | 215,904 | | | | | $ | 221,984 | | | | | $ | 233,040 | | | | | $ | 235,998 | | | |
Total earning assets | | | 207,520 | | | | | | 236,157 | | | | | | | | | 207,520 | | | | | | 215,633 | | | | | | 221,794 | | | | | | 233,094 | | | | | | 236,157 | | | |
Total assets | | | 223,980 | | | | | | 256,885 | | | | | | | | | 223,980 | | | | | | 231,987 | | | | | | 238,410 | | | | | | 252,683 | | | | | | 256,885 | | | |
| (1) | Presented on a managed basis. (See Exhibit A: Non-GAAP Reconciliations - Global Card Services - Reconciliation on page 44). |
| (2) | Fully taxable-equivalent basis |
| (3) | Represents provision for credit losses on held loans combined with realized credit losses associated with the securitized loan portfolio. |
n/m = not meaningful
Certain prior period amounts have been reclassified among the segments to conform to the current period presentation.
Information for periods beginning July 1, 2008 includes the Countrywide acquisition. Information for periods beginning January 1, 2009 includes the
Merrill Lynch acquisition. Prior periods have not been restated.
| | |
| This information is preliminary and based on company data available at the time of the presentation. | | 17 |
Bank of America Corporation and Subsidiaries
Global Card Services Key Indicators
(Dollars in millions)
| | | | | | | | | | | | | | | | | | | | | | | | | | | | | | | | | | | | | | | | | |
| | | Nine Months Ended
September 30 | | | | | | | | Third
Quarter | | | | Second
Quarter | | | | | First
Quarter | | | | | Fourth
Quarter | | | | Third
Quarter | | |
| | | 2009 | | | | 2008 | | | | | 2009 | | | 2009 | | | | 2009 | | | | 2008 | | | 2008 | | |
Credit Card Data(1) | | | | | | | | | | | | | | | | | | | | | | | | | | | | | | | | | | | | | | | | | |
| | | | | | | | | | | | | | | | |
Loans | | | | | | | | | | | | | | | | | | | | | | | | | | | | | | | | | | | | | | | | | |
Average | | | | | | | | | | | | | | | | | | | | | | | | | | | | | | | | | | | | | | | | | |
Held credit card outstandings | | $ | 72,417 | | | | $ | 79,081 | | | | | | | | $ | 70,940 | | | | $ | 70,546 | | | | | $ | 75,818 | | | | | $ | 82,117 | | | | $ | 80,489 | | |
Securitization impact | | | 100,727 | | | | | 106,177 | | | | | | | | | 97,520 | | | | | 102,046 | | | | | | 102,672 | | | | | | 99,116 | | | | | 105,919 | | |
| | | | | | | | | | | | | | | | | | | | | | | | | | | | | | | | | | | | | | | | | |
Managed credit card outstandings | | $ | 173,144 | | | | $ | 185,258 | | | | | | | | $ | 168,460 | | | | $ | 172,592 | | | | | $ | 178,490 | | | | | $ | 181,233 | | | | $ | 186,408 | | |
| | | | | | | | | | | | | | | | | | | | | | | | | | | | | | | | | | | | | | | | | |
Period end | | | | | | | | | | | | | | | | | | | | | | | | | | | | | | | | | | | | | | | | | |
Held credit card outstandings | | $ | 70,206 | | | | $ | 81,350 | | | | | | | | $ | 70,206 | | | | $ | 69,377 | | | | | $ | 67,960 | | | | | $ | 81,274 | | | | $ | 81,350 | | |
Securitization impact | | | 94,328 | | | | | 102,048 | | | | | | | | | 94,328 | | | | | 100,438 | | | | | | 105,392 | | | | | | 100,960 | | | | | 102,048 | | |
| | | | | | | | | | | | | | | | | | | | | | | | | | | | | | | | | | | | | | | | | |
Managed credit card outstandings | | $ | 164,534 | | | | $ | 183,398 | | | | | | | | $ | 164,534 | | | | $ | 169,815 | | | | | $ | 173,352 | | | | | $ | 182,234 | | | | $ | 183,398 | | |
| | | | | | | | | | | | | | | | | | | | | | | | | | | | | | | | | | | | | | | | | |
| | | | | | | | | | | | | | | | | | | | | | | | | | | | | | | | | | | | | | | | | |
Credit Quality | | | | | | | | | | | | | | | | | | | | | | | | | | | | | | | | | | | | | | | | | |
Charge-offs $ | | | | | | | | | | | | | | | | | | | | | | | | | | | | | | | | | | | | | | | | | |
Held net charge-offs | | $ | 5,845 | | | | $ | 3,306 | | | | | | | | $ | 2,169 | | | | $ | 2,064 | | | | | $ | 1,612 | | | | | $ | 1,406 | | | | $ | 1,242 | | |
Securitization impact | | | 8,473 | | | | | 4,813 | | | | | | | | | 3,308 | | | | | 2,983 | | | | | | 2,182 | | | | | | 1,857 | | | | | 1,754 | | |
| | | | | | | | | | | | | | | | | | | | | | | | | | | | | | | | | | | | | | | | | |
Managed credit card net losses | | $ | 14,318 | | | | $ | 8,119 | | | | | | | | $ | 5,477 | | | | $ | 5,047 | | | | | $ | 3,794 | | | | | $ | 3,263 | | | | $ | 2,996 | | |
| | | | | | | | | | | | | | | | | | | | | | | | | | | | | | | | | | | | | | | | | |
Charge-offs % | | | | | | | | | | | | | | | | | | | | | | | | | | | | | | | | | | | | | | | | | |
Held net charge-offs | | | 10.79 | | % | | | 5.58 | | % | | | | | | | 12.13 | | % | | | 11.74 | | | % | | | 8.62 | | | % | | | 6.82 | | % | | | 6.14 | | % |
Securitization impact | | | 0.27 | | | | | 0.27 | | | | | | | | | 0.77 | | | | | (0.01 | ) | | | | | — | | | | | | 0.34 | | | | | 0.26 | | |
| | | | | | | | | | | | | | | | | | | | | | | | | | | | | | | | | | | | | | | | | |
Managed credit card net losses | | | 11.06 | | % | | | 5.85 | | % | | | | | | | 12.90 | | % | | | 11.73 | | | % | | | 8.62 | | | % | | | 7.16 | | % | | | 6.40 | | % |
| | | | | | | | | | | | | | | | | | | | | | | | | | | | | | | | | | | | | | | | | |
30+ Delinquency $ | | | | | | | | | | | | | | | | | | | | | | | | | | | | | | | | | | | | | | | | | |
Held delinquency | | $ | 5,054 | | | | $ | 4,675 | | | | | | | | $ | 5,054 | | | | $ | 5,221 | | | | | $ | 5,365 | | | | | $ | 5,324 | | | | $ | 4,675 | | |
Securitization impact | | | 7,047 | | | | | 6,126 | | | | | | | | | 7,047 | | | | | 7,748 | | | | | | 8,246 | | | | | | 6,844 | | | | | 6,126 | | |
| | | | | | | | | | | | | | | | | | | | | | | | | | | | | | | | | | | | | | | | | |
Managed delinquency | | $ | 12,101 | | | | $ | 10,801 | | | | | | | | $ | 12,101 | | | | $ | 12,969 | | | | | $ | 13,611 | | | | | $ | 12,168 | | | | $ | 10,801 | | |
| | | | | | | | | | | | | | | | | | | | | | | | | | | | | | | | | | | | | | | | | |
30+ Delinquency % | | | | | | | | | | | | | | | | | | | | | | | | | | | | | | | | | | | | | | | | | |
Held delinquency | | | 7.20 | | % | | | 5.75 | | % | | | | | | | 7.20 | | % | | | 7.53 | | | % | | | 7.90 | | | % | | | 6.55 | | % | | | 5.75 | | % |
Securitization impact | | | 0.15 | | | | | 0.14 | | | | | | | | | 0.15 | | | | | 0.11 | | | | | | (0.05 | ) | | | | | 0.13 | | | | | 0.14 | | |
| | | | | | | | | | | | | | | | | | | | | | | | | | | | | | | | | | | | | | | | | |
Managed delinquency | | | 7.35 | | % | | | 5.89 | | % | | | | | | | 7.35 | | % | | | 7.64 | | | % | | | 7.85 | | | % | | | 6.68 | | % | | | 5.89 | | % |
| | | | | | | | | | | | | | | | | | | | | | | | | | | | | | | | | | | | | | | | | |
90+ Delinquency $ | | | | | | | | | | | | | | | | | | | | | | | | | | | | | | | | | | | | | | | | | |
Held delinquency | | $ | 2,593 | | | | $ | 2,330 | | | | | | | | $ | 2,593 | | | | $ | 2,894 | | | | | $ | 2,816 | | | | | $ | 2,565 | | | | $ | 2,330 | | |
Securitization impact | | | 3,600 | | | | | 2,958 | | | | | | | | | 3,600 | | | | | 4,263 | | | | | | 4,106 | | | | | | 3,185 | | | | | 2,958 | | |
| | | | | | | | | | | | | | | | | | | | | | | | | | | | | | | | | | | | | | | | | |
Managed delinquency | | $ | 6,193 | | | | $ | 5,288 | | | | | | | | $ | 6,193 | | | | $ | 7,157 | | | | | $ | 6,922 | | | | | $ | 5,750 | | | | $ | 5,288 | | |
| | | | | | | | | | | | | | | | | | | | | | | | | | | | | | | | | | | | | | | | | |
90+ Delinquency % | | | | | | | | | | | | | | | | | | | | | | | | | | | | | | | | | | | | | | | | | |
Held delinquency | | | 3.69 | | % | | | 2.87 | | % | | | | | | | 3.69 | | % | | | 4.17 | | | % | | | 4.14 | | | % | | | 3.16 | | % | | | 2.87 | | % |
Securitization impact | | | 0.07 | | | | | 0.01 | | | | | | | | | 0.07 | | | | | 0.04 | | | | | | (0.15 | ) | | | | | — | | | | | 0.01 | | |
| | | | | | | | | | | | | | | | | | | | | | | | | | | | | | | | | | | | | | | | | |
Managed delinquency | | | 3.76 | | % | | | 2.88 | | % | | | | | | | 3.76 | | % | | | 4.21 | | | % | | | 3.99 | | | % | | | 3.16 | | % | | | 2.88 | | % |
| | | | | | | | | | | | | | | | | | | | | | | | | | | | | | | | | | | | | | | | | |
| | | | | | | | | | | | | | | | |
Other Global Card Services Key Indicators | | | | | | | | | | | | | | | | | | | | | | | | | | | | | | | | | | | | | | | | | |
| | | | | | | | | | | | | | | | | | | | | | | | | | | | | | | | | | | | | | | | | |
Managed credit card data | | | | | | | | | | | | | | | | | | | | | | | | | | | | | | | | | | | | | | | | | |
Gross interest yield | | | 11.40 | | % | | | 11.63 | | % | | | | | | | 11.18 | | % | | | 11.33 | | | % | | | 11.68 | | | % | | | 11.87 | | % | | | 11.52 | | % |
Risk adjusted margin | | | 2.06 | | | | | 6.60 | | | | | | | | | 0.26 | | | | | 1.28 | | | | | | 4.56 | | | | | | 6.38 | | | | | 6.67 | | |
New account growth (in thousands) | | | 3,201 | | | | | 7,044 | | | | | | | | | 1,014 | | | | | 957 | | | | | | 1,230 | | | | | | 1,432 | | | | | 1,765 | | |
Purchase volumes | | $ | 153,031 | | | | $ | 186,940 | | | | | | | | $ | 53,031 | | | | $ | 51,944 | | | | | $ | 48,056 | | | | | $ | 56,585 | | | | $ | 62,662 | | |
| | | | | | | | | | | | | | | | |
Debit Card Data | | | | | | | | | | | | | | | | | | | | | | | | | | | | | | | | | | | | | | | | | |
Debit purchase volumes | | $ | 161,055 | | | | $ | 157,581 | | | | | | | | $ | 54,764 | | | | $ | 55,158 | | | | | $ | 51,133 | | | | | $ | 52,925 | | | | $ | 53,252 | | |
| (1) | Credit Card includes U.S., Europe and Canada consumer credit card. Does not include business card, debit card and consumer lending. |
Certain prior period amounts have been reclassified to conform to the current period presentation.
Information for periods beginning July 1, 2008 includes the Countrywide acquisition. Information for periods beginning January 1, 2009 includes the
Merrill Lynch acquisition. Prior periods have not been restated.
| | |
| This information is preliminary and based on company data available at the time of the presentation. | | 18 |
Bank of America Corporation and Subsidiaries
Home Loans & Insurance Segment Results
(Dollars in millions; except as noted)
| | | | | | | | | | | | | | | | | | | | | | | | | | | | | | | | | | | | | | | | | | | | | | |
| | | Nine Months Ended
September 30 | | | | | | | | | Third
Quarter | | | | | Second
Quarter | | | | | First
Quarter | | | | | Fourth
Quarter | | | | | Third
Quarter | | | |
| | | 2009 | | | | | 2008 | | | | | | | | 2009 | | | | 2009 | | | | 2009 | | | | 2008 | | | | 2008 | | |
Net interest income(1) | | $ | 3,691 | | | | | $ | 2,305 | | | | | | | | | $ | 1,309 | | | | | $ | 1,196 | | | | | $ | 1,186 | | | | | $ | 1,006 | | | | | $ | 1,135 | | | |
Noninterest income: | | | | | | | | | | | | | | | | | | | | | | | | | | | | | | | | | | | | | | | | | | | | | | |
Mortgage banking income | | | 7,505 | | | | | | 2,819 | | | | | | | | | | 1,424 | | | | | | 2,661 | | | | | | 3,420 | | | | | | 1,603 | | | | | | 1,755 | | | |
Insurance income | | | 1,728 | | | | | | 770 | | | | | | | | | | 594 | | | | | | 553 | | | | | | 581 | | | | | | 646 | | | | | | 569 | | | |
All other income | | | 177 | | | | | | 164 | | | | | | | | | | 84 | | | | | | 50 | | | | | | 43 | | | | | | (2 | ) | | | | | 15 | | | |
| | | | | | | | | | | | | | | | | | | | | | | | | | | | | | | | | | | | | | | | | | | | | | |
Total noninterest income | | | 9,410 | | | | | | 3,753 | | | | | | | | | | 2,102 | | | | | | 3,264 | | | | | | 4,044 | | | | | | 2,247 | | | | | | 2,339 | | | |
| | | | | | | | | | | | | | | | | | | | | | | | | | | | | | | | | | | | | | | | | | | | | | |
Total revenue, net of interest expense | | | 13,101 | | | | | | 6,058 | | | | | | | | | | 3,411 | | | | | | 4,460 | | | | | | 5,230 | | | | | | 3,253 | | | | | | 3,474 | | | |
| | | | | | | | | | | | | | | | |
Provision for credit losses | | | 8,995 | | | | | | 4,664 | | | | | | | | | | 2,897 | | | | | | 2,726 | | | | | | 3,372 | | | | | | 1,623 | | | | | | 818 | | | |
Noninterest expense | | | 8,519 | | | | | | 4,211 | | | | | | | | | | 3,041 | | | | | | 2,828 | | | | | | 2,650 | | | | | | 2,752 | | | | | | 2,741 | | | |
| | | | | | | | | | | | | | | | | | | | | | | | | | | | | | | | | | | | | | | | | | | | | | |
Loss before income taxes | | | (4,413 | ) | | | | | (2,817 | ) | | | | | | | | | (2,527 | ) | | | | | (1,094 | ) | | | | | (792 | ) | | | | | (1,122 | ) | | | | | (85 | ) | | |
Income tax benefit(1) | | | (1,563 | ) | | | | | (1,042 | ) | | | | | | | | | (895 | ) | | | | | (370 | ) | | | | | (298 | ) | | | | | (415 | ) | | | | | (31 | ) | | |
| | | | | | | | | | | | | | | | | | | | | | | | | | | | | | | | | | | | | | | | | | | | | | |
Net loss | | $ | (2,850 | ) | | | | $ | (1,775 | ) | | | | | | | | $ | (1,632 | ) | | | | $ | (724 | ) | | | | $ | (494 | ) | | | | $ | (707 | ) | | | | $ | (54 | ) | | |
| | | | | | | | | | | | | | | | | | | | | | | | | | | | | | | | | | | | | | | | | | | | | | |
Net interest yield(1) | | | 2.55 | | | % | | | 2.68 | | | | | % | | | | | 2.59 | | | % | | | 2.43 | | | % | | | 2.63 | | | % | | | 2.31 | | | % | | | 3.05 | | | % |
Efficiency ratio(1) | | | 65.03 | | | | | | 69.51 | | | | | | | | | | 89.19 | | | | | | 63.38 | | | | | | 50.68 | | | | | | 84.58 | | | | | | 78.90 | | | |
| | | | | | | | | | | | | | | | |
| Balance sheet | | | | | | | | | | | | | | | | | | | | | | | | | | | | | | | | | | | | | | | | | | | | | | |
| | | | | | | | | | | | | | | | |
Average | | | | | | | | | | | | | | | | | | | | | | | | | | | | | | | | | | | | | | | | | | | | | | |
Total loans and leases | | $ | 129,910 | | | | | $ | 100,237 | | | | | | | | | $ | 132,599 | | | | | $ | 131,509 | | | | | $ | 125,544 | | | | | $ | 122,065 | | | | | $ | 122,034 | | | |
Total earning assets | | | 193,802 | | | | | | 115,076 | | | | | | | | | | 200,539 | | | | | | 197,758 | | | | | | 182,915 | | | | | | 173,152 | | | | | | 148,209 | | | |
Total assets | | | 229,321 | | | | | | 128,333 | | | | | | | | | | 236,200 | | | | | | 232,361 | | | | | | 219,215 | | | | | | 204,826 | | | | | | 179,998 | | | |
Allocated equity | | | 18,337 | | | | | | 7,515 | | | | | | | | | | 24,669 | | | | | | 15,827 | | | | | | 14,403 | | | | | | 15,477 | | | | | | 16,236 | | | |
| | | | | | | | | | | | | | | | |
Period end | | | | | | | | | | | | | | | | | | | | | | | | | | | | | | | | | | | | | | | | | | | | | | |
Total loans and leases | | $ | 134,255 | | | | | $ | 122,975 | | | | | | | | | $ | 134,255 | | | | | $ | 131,120 | | | | | $ | 131,332 | | | | | $ | 122,947 | | | | | $ | 122,975 | | | |
Total earning assets | | | 197,666 | | | | | | 167,338 | | | | | | | | | | 197,666 | | | | | | 197,528 | | | | | | 184,136 | | | | | | 175,609 | | | | | | 167,338 | | | |
Total assets | | | 234,842 | | | | | | 178,956 | | | | | | | | | | 234,842 | | | | | | 234,388 | | | | | | 221,547 | | | | | | 205,046 | | | | | | 178,956 | | | |
| | | | | | | | | | | | | | | | |
Period end (in billions) | | | | | | | | | | | | | | | | | | | | | | | | | | | | | | | | | | | | | | | | | | | | | | |
Mortgage servicing portfolio(2) | | $ | 2,148.3 | | | | | $ | 2,026.2 | | | | | | | | | $ | 2,148.3 | | | | | $ | 2,111.9 | | | | | $ | 2,112.8 | | | | | $ | 2,057.3 | | | | | $ | 2,026.2 | | | |
| (1) | Fully taxable-equivalent basis |
| (2) | Servicing of residential mortgage loans, home equity lines of credit, home equity loans and discontinued real estate mortgage loans. |
Certain prior period amounts have been reclassified among the segments to conform to the current period presentation.
Information for periods beginning July 1, 2008 includes the Countrywide acquisition. Information for periods beginning January 1, 2009 includes the
Merrill Lynch acquisition. Prior periods have not been restated.
| | |
| This information is preliminary and based on company data available at the time of the presentation. | | 19 |
Bank of America Corporation and Subsidiaries
Home Loans & Insurance Key Indicators
(Dollars in millions, except as noted)
| | | | | | | | | | | | | | | | | | | | | | | | | | | | | | | | | | | | | | | | | | | | | | |
| | | Nine Months Ended
September 30 | | | | | | | | | Third
Quarter | | | | | Second
Quarter | | | | | First
Quarter | | | | | Fourth
Quarter | | | | | Third
Quarter | | | |
| | | 2009 | | | | | 2008 | | | | | | 2009 | | | | 2009 | | | | 2009 | | | | 2008 | | | | 2008 | | | |
Mortgage servicing rights at fair value rollforward: | | | | | | | | | | | | | | | | | | | | | | | | | | | | | | | | | | | | | | | | | | | | | | |
Beginning balance | | $ | 12,733 | | | | | $ | 3,053 | | | | | | | | | $ | 18,535 | | | | | $ | 14,096 | | | | | $ | 12,733 | | | | | $ | 20,811 | | | | | $ | 4,250 | | | |
Countrywide balance, July 1, 2008 | | | — | | | | | | 17,188 | | | | | | | | | | — | | | | | | — | | | | | | — | | | | | | — | | | | | | 17,188 | | | |
Merrill Lynch balance, January 1, 2009 | | | 209 | | | | | | — | | | | | | | | | | — | | | | | | — | | | | | | 209 | | | | | | — | | | | | | — | | | |
Additions | | | 4,693 | | | | | | 1,910 | | | | | | | | | | 1,738 | | | | | | 1,706 | | | | | | 1,249 | | | | | | 677 | | | | | | 875 | | | |
Impact of customer payments | | | (2,888 | ) | | | | | (1,855 | ) | | | | | | | | | (906 | ) | | | | | (797 | ) | | | | | (1,185 | ) | | | | | (1,458 | ) | | | | | (1,425 | ) | | |
Other changes in MSR | | | 2,792 | | | | | | 515 | | | | | | | | | | (1,828 | ) | | | | | 3,530 | | | | | | 1,090 | | | | | | (7,297 | ) | | | | | (77 | ) | | |
| | | | | | | | | | | | | | | | | | | | | | | | | | | | | | | | | | | | | | | | | | | | | | |
Ending balance | | $ | 17,539 | | | | | $ | 20,811 | | | | | | | | | $ | 17,539 | | | | | $ | 18,535 | | | | | $ | 14,096 | | | | | $ | 12,733 | | | | | $ | 20,811 | | | |
| | | | | | | | | | | | | | | | | | | | | | | | | | | | | | | | | | | | | | | | | | | | | | |
Capitalized mortgage servicing rights | | | | | | | | | | | | | | | | | | | | | | | | | | | | | | | | | | | | | | | | | | | | | | |
(% of loans serviced) | | | 102 | | | bps | | | 126 | | | bps | | | | | | | 102 | | | bps | | | 109 | | | bps | | | 83 | | | bps | | | 77 | | | bps | | | 126 | | | bps |
Mortgage loans serviced for investors (in billions) | | $ | 1,726 | | | | | $ | 1,654 | | | | | | | | | $ | 1,726 | | | | | $ | 1,703 | | | | | $ | 1,699 | | | | | $ | 1,654 | | | | | $ | 1,654 | | | |
| | | | | | | | | | | | | | | | |
Loan production: | | | | | | | | | | | | | | | | | | | | | | | | | | | | | | | | | | | | | | | | | | | | | | |
Home Loans & Insurance | | | | | | | | | | | | | | | | | | | | | | | | | | | | | | | | | | | | | | | | | | | | | | |
First mortgage | | $ | 273,473 | | | | | $ | 86,184 | | | | | | | | | $ | 90,319 | | | | | $ | 104,082 | | | | | $ | 79,072 | | | | | $ | 42,761 | | | | | $ | 49,625 | | | |
Home equity | | | 8,130 | | | | | | 28,078 | | | | | | | | | | 2,287 | | | | | | 2,920 | | | | | | 2,923 | | | | | | 3,920 | | | | | | 5,260 | | | |
Total Corporation | | | | | | | | | | | | | | | | | | | | | | | | | | | | | | | | | | | | | | | | | | | | | | |
First mortgage | | | 291,517 | | | | | | 95,899 | | | | | | | | | | 95,654 | | | | | | 110,645 | | | | | | 85,218 | | | | | | 44,611 | | | | | | 51,539 | | | |
Home equity | | | 10,427 | | | | | | 35,163 | | | | | | | | | | 2,739 | | | | | | 3,650 | | | | | | 4,038 | | | | | | 5,326 | | | | | | 7,022 | | | |
| | | | | | | | | | | | | | | | |
Mortgage banking income | | | | | | | | | | | | | | | | | | | | | | | | | | | | | | | | | | | | | | | | | | | | | | |
Production income | | $ | 4,435 | | | | | $ | 1,428 | | | | | | | | | $ | 1,110 | | | | | $ | 1,675 | | | | | $ | 1,650 | | | | | $ | 691 | | | | | $ | 749 | | | |
Servicing income: | | | | | | | | | | | | | | | | | | | | | | | | | | | | | | | | | | | | | | | | | | | | | | |
Servicing fees and ancillary income | | | 4,635 | | | | | | 2,041 | | | | | | | | | | 1,600 | | | | | | 1,514 | | | | | | 1,521 | | | | | | 1,487 | | | | | | 1,526 | | | |
Impact of customer payments | | | (2,888 | ) | | | | | (1,855 | ) | | | | | | | | | (906 | ) | | | | | (797 | ) | | | | | (1,185 | ) | | | | | (1,458 | ) | | | | | (1,425 | ) | | |
Fair value changes of MSRs, net of economic hedge results | | | 925 | | | | | | 1,123 | | | | | | | | | | (519 | ) | | | | | 143 | | | | | | 1,301 | | | | | | 783 | | | | | | 823 | | | |
Other servicing-related revenue | | | 398 | | | | | | 82 | | | | | | | | | | 139 | | | | | | 126 | | | | | | 133 | | | | | | 100 | | | | | | 82 | | | |
| | | | | | | | | | | | | | | | | | | | | | | | | | | | | | | | | | | | | | | | | | | | | | |
Total net servicing income | | | 3,070 | | | | | | 1,391 | | | | | | | | | | 314 | | | | | | 986 | | | | | | 1,770 | | | | | | 912 | | | | | | 1,006 | | | |
| | | | | | | | | | | | | | | | | | | | | | | | | | | | | | | | | | | | | | | | | | | | | | |
Total Home Loans & Insurance mortgage banking income | | | 7,505 | | | | | | 2,819 | | | | | | | | | | 1,424 | | | | | | 2,661 | | | | | | 3,420 | | | | | | 1,603 | | | | | | 1,755 | | | |
Other business segment mortgage banking income (loss) | | | (366 | ) | | | | | (255 | ) | | | | | | | | | (126 | ) | | | | | (134 | ) | | | | | (106 | ) | | | | | (80 | ) | | | | | (81 | ) | | |
| | | | | | | | | | | | | | | | | | | | | | | | | | | | | | | | | | | | | | | | | | | | | | |
Total consolidated mortgage banking income | | $ | 7,139 | | | | | $ | 2,564 | | | | | | | | | $ | 1,298 | | | | | $ | 2,527 | | | | | $ | 3,314 | | | | | $ | 1,523 | | | | | $ | 1,674 | | | |
| | | | | | | | | | | | | | | | | | | | | | | | | | | | | | | | | | | | | | | | | | | | | | |
Certain prior period amounts have been reclassified among the segments to conform to the current period presentation.
Information for periods beginning July 1, 2008 includes the Countrywide acquisition. Information for periods beginning January 1, 2009 includes the
Merrill Lynch acquisition. Prior periods have not been restated.
| | |
| This information is preliminary and based on company data available at the time of the presentation. | | 20 |
Bank of America Corporation and Subsidiaries
Global Banking Segment Results
(Dollars in millions)
| | | | | | | | | | | | | | | | | | | | | | | | | | | | | | | | | | | | | | | | | | | | | | |
| | | Nine Months Ended
September 30 | | | | | | Third
Quarter | | | | | Second
Quarter | | | | | First
Quarter | | | | | Fourth
Quarter | | | | | Third
Quarter | | | |
| | | 2009 | | | | | 2008 | | | | | | | | | 2009 | | | | | 2009 | | | | | 2009 | | | | | 2008 | | | | | 2008 | | | |
Net interest income(1) | | $ | 8,378 | | | | | $ | 7,641 | | | | | | | | | $ | 2,784 | | | | | $ | 2,768 | | | | | $ | 2,826 | | | | | $ | 3,114 | | | | | $ | 2,748 | | | |
Noninterest income: | | | | | | | | | | | | | | | | | | | | | | | | | | | | | | | | | | | | | | | | | | | | | | |
Service charges | | | 2,913 | | | | | | 2,420 | | | | | | | | | | 1,050 | | | | | | 914 | | | | | | 949 | | | | | | 814 | | | | | | 826 | | | |
Investment banking income | | | 2,040 | | | | | | 956 | | | | | | | | | | 604 | | | | | | 793 | | | | | | 643 | | | | | | 415 | | | | | | 241 | | | |
All other income (loss) | | | 4,769 | | | | | | 1,720 | | | | | | | | | | 232 | | | | | | 4,253 | | | | | | 284 | | | | | | (284 | ) | | | | | 469 | | | |
| | | | | | | | | | | | | | | | | | | | | | | | | | | | | | | | | | | | | | | | | | | | | | |
Total noninterest income | | | 9,722 | | | | | | 5,096 | | | | | | | | | | 1,886 | | | | | | 5,960 | | | | | | 1,876 | | | | | | 945 | | | | | | 1,536 | | | |
| | | | | | | | | | | | | | | | | | | | | | | | | | | | | | | | | | | | | | | | | | | | | | |
Total revenue, net of interest expense | | | 18,100 | | | | | | 12,737 | | | | | | | | | | 4,670 | | | | | | 8,728 | | | | | | 4,702 | | | | | | 4,059 | | | | | | 4,284 | | | |
| | | | | | | | | | | | | | | | |
Provision for credit losses | | | 6,772 | | | | | | 1,728 | | | | | | | | | | 2,340 | | | | | | 2,584 | | | | | | 1,848 | | | | | | 1,402 | | | | | | 802 | | | |
Noninterest expense | | | 7,131 | | | | | | 5,505 | | | | | | | | | | 2,258 | | | | | | 2,292 | | | | | | 2,581 | | | | | | 1,179 | | | | | | 1,849 | | | |
| | | | | | | | | | | | | | | | | | | | | | | | | | | | | | | | | | | | | | | | | | | | | | |
Income before income taxes | | | 4,197 | | | | | | 5,504 | | | | | | | | | | 72 | | | | | | 3,852 | | | | | | 273 | | | | | | 1,478 | | | | | | 1,633 | | | |
Income tax expense(1) | | | 1,494 | | | | | | 2,064 | | | | | | | | | | 32 | | | | | | 1,358 | | | | | | 104 | | | | | | 446 | | | | | | 609 | | | |
| | | | | | | | | | | | | | | | | | | | | | | | | | | | | | | | | | | | | | | | | | | | | | |
Net income | | $ | 2,703 | | | | | $ | 3,440 | | | | | | | | | $ | 40 | | | | | $ | 2,494 | | | | | $ | 169 | | | | | $ | 1,032 | | | | | $ | 1,024 | | | |
| | | | | | | | | | | | | | | | | | | | | | | | | | | | | | | | | | | | | | | | | | | | | | |
Net interest yield(1) | | | 3.39 | | | % | | | 3.18 | | | % | | | | | | | 3.18 | | | % | | | 3.34 | | | % | | | 3.36 | | | % | | | 3.63 | | | % | | | 3.34 | | | % |
Return on average equity | | | 6.02 | | | | | | 9.27 | | | | | | | | | | 0.26 | | | | | | 16.32 | | | | | | 1.19 | | | | | | 7.65 | | | | | | 8.06 | | | |
Efficiency ratio(1) | | | 39.40 | | | | | | 43.22 | | | | | | | | | | 48.35 | | | | | | 26.25 | | | | | | 54.90 | | | | | | 29.05 | | | | | | 43.15 | | | |
| | | | | | | | | | | | | | | | |
| Balance sheet | | | | | | | | | | | | | | | | | | | | | | | | | | | | | | | | | | | | | | | | | | | | | | |
| | | | | | | | | | | | | | | | |
Average | | | | | | | | | | | | | | | | | | | | | | | | | | | | | | | | | | | | | | | | | | | | | | |
Total loans and leases | | $ | 320,904 | | | | | $ | 314,031 | | | | | | | | | $ | 308,764 | | | | | $ | 323,217 | | | | | $ | 330,974 | | | | | $ | 331,115 | | | | | $ | 320,813 | | | |
Total earning assets | | | 330,464 | | | | | | 320,495 | | | | | | | | | | 347,202 | | | | | | 332,591 | | | | | | 341,124 | | | | | | 341,456 | | | | | | 327,520 | | | |
Total assets | | | 387,725 | | | | | | 377,832 | | | | | | | | | | 405,178 | | | | | | 389,496 | | | | | | 398,014 | | | | | | 397,556 | | | | | | 385,111 | | | |
Total deposits | | | 205,285 | | | | | | 170,162 | | | | | | | | | | 214,286 | | | | | | 203,917 | | | | | | 197,468 | | | | | | 199,465 | | | | | | 177,668 | | | |
Allocated equity | | | 59,993 | | | | | | 49,547 | | | | | | | | | | 61,327 | | | | | | 61,306 | | | | | | 57,301 | | | | | | 53,667 | | | | | | 50,558 | | | |
| | | | | | | | | | | | | | | | |
Period end | | | | | | | | | | | | | | | | | | | | | | | | | | | | | | | | | | | | | | | | | | | | | | |
Total loans and leases | | $ | 300,814 | | | | | $ | 326,970 | | | | | | | | | $ | 300,814 | | | | | $ | 314,512 | | | | | $ | 323,407 | | | | | $ | 328,574 | | | | | $ | 326,970 | | | |
Total earning assets | | | 324,965 | | | | | | 338,408 | | | | | | | | | | 324,965 | | | | | | 323,745 | | | | | | 333,228 | | | | | | 338,915 | | | | | | 338,408 | | | |
Total assets | | | 381,041 | | | | | | 397,645 | | | | | | | | | | 381,041 | | | | | | 382,594 | | | | | | 388,534 | | | | | | 394,541 | | | | | | 397,645 | | | |
Total deposits | | | 210,211 | | | | | | 195,486 | | | | | | | | | | 210,211 | | | | | | 208,098 | | | | | | 196,359 | | | | | | 215,519 | | | | | | 195,486 | | | |
(1) Fully taxable-equivalent basis |
|
Components of Investment Banking Income |
| (Dollars in millions) | | | | | | | | | | | | | | | | | | | | | | | | |
| | | Nine Months Ended
September 30 | | | | | | | | | Third
Quarter | | | | | Second
Quarter | | | | | First
Quarter | | | | | Fourth
Quarter | | | | | Third
Quarter | | | |
| | | 2009 | | | | | 2008 | | | | | | | | | 2009 | | | | | 2009 | | | | | 2009 | | | | | 2008 | | | | | 2008 | | | |
Investment banking income | | | | | | | | | | | | | | | | | | | | | | | | | | | | | | | | | | | | | | | | | | | | | | |
Advisory(1) | | $ | 807 | | | | | $ | 362 | | | | | | | | | $ | 186 | | | | | $ | 292 | | | | | $ | 329 | | | | | $ | 184 | | | | | $ | 109 | | | |
Debt issuance | | | 2,319 | | | | | | 1,160 | | | | | | | | | | 720 | | | | | | 944 | | | | | | 655 | | | | | | 379 | | | | | | 332 | | | |
Equity issuance | | | 1,071 | | | | | | 400 | | | | | | | | | | 406 | | | | | | 508 | | | | | | 157 | | | | | | 224 | | | | | | 50 | | | |
| | | | | | | | | | | | | | | | | | | | | | | | | | | | | | | | | | | | | | | | | | | | | | |
Total Global Markets and Investment Banking | | | 4,197 | | | | | | 1,922 | | | | | | | | | | 1,312 | | | | | | 1,744 | | | | | | 1,141 | | | | | | 787 | | | | | | 491 | | | |
Other(2) | | | (242 | ) | | | | | (277 | ) | | | | | | | | | (58 | ) | | | | | (98 | ) | | | | | (86 | ) | | | | | (169 | ) | | | | | (17 | ) | | |
| | | | | | | | | | | | | | | | | | | | | | | | | | | | | | | | | | | | | | | | | | | | | | |
Total investment banking income | | $ | 3,955 | | | | | $ | 1,645 | | | | | | | | | $ | 1,254 | | | | | $ | 1,646 | | | | | $ | 1,055 | | | | | $ | 618 | | | | | $ | 474 | | | |
| | | | | | | | | | | | | | | | | | | | | | | | | | | | | | | | | | | | | | | | | | | | | | |
| (1) | Advisory includes fees on debt and equity advisory and merger and acquisitions. |
| (2) | Represents the offset to fees paid on the Corporation’s transactions. |
Certain prior period amounts have been reclassified among the segments to conform to the current period presentation.
Information for periods beginning July 1, 2008 includes the Countrywide acquisition. Information for periods beginning January 1, 2009 includes the
Merrill Lynch acquisition. Prior periods have not been restated.
| | |
| This information is preliminary and based on company data available at the time of the presentation. | | 21 |
Bank of America Corporation and Subsidiaries
Global Banking Key Indicators
(Dollars in millions)
| | | | | | | | | | | | | | | | | | | | | | | | | | | | | | | | | | | | | | | | | | |
| | | Nine Months Ended
September 30 | | | | | Third
Quarter | | | | | Second
Quarter | | | | | First
Quarter | | | | | Fourth
Quarter | | | | | Third
Quarter | | | |
| | | 2009 | | | | | 2008 | | | | | 2009 | | | | | 2009 | | | | | 2009 | | | | | 2008 | | | | | 2008 | | | |
Global Banking revenue, net of interest expense | | | | | | | | | | | | | | | | | | | | | | | | | | | | | | | | | | | | | | | | | | |
Global commercial banking | | $ | 12,382 | | | | | $ | 8,501 | | | | | $ | 2,905 | | | | | $ | 6,691 | | | | | $ | 2,786 | | | | | $ | 2,861 | | | | | $ | 2,864 | | | |
Global corporate and investment banking | | | 5,718 | | | | | | 4,236 | | | | | | 1,765 | | | | | | 2,037 | | | | | | 1,916 | | | | | | 1,198 | | | | | | 1,420 | | | |
| | | | | | | | | | | | | | | | | | | | | | | | | | | | | | | | | | | | | | | | | | |
Total revenue, net of interest expense(1) | | $ | 18,100 | | | | | $ | 12,737 | | | | | $ | 4,670 | | | | | $ | 8,728 | | | | | $ | 4,702 | | | | | $ | 4,059 | | | | | $ | 4,284 | | | |
| | | | | | | | | | | | | | | | | | | | | | | | | | | | | | | | | | | | | | | | | | |
Global Banking revenue, net of interest expense - by service segment | | | | | | | | | | | | | | | | | | | | | | | | | | | | | | | | | | | | | | | | | | |
Business lending | | $ | 7,091 | | | | | $ | 6,011 | | | | | $ | 2,303 | | | | | $ | 2,353 | | | | | $ | 2,435 | | | | | $ | 2,210 | | | | | $ | 2,024 | | | |
Treasury services | | | 9,171 | | | | | | 6,325 | | | | | | 1,798 | | | | | | 5,540 | | | | | | 1,833 | | | | | | 2,198 | | | | | | 2,162 | | | |
Investment banking related(2) | | | 1,838 | | | | | | 401 | | | | | | 569 | | | | | | 835 | | | | | | 434 | | | | | | (349 | ) | | | | | 98 | | | |
| | | | | | | | | | | | | | | | | | | | | | | | | | | | | | | | | | | | | | | | | | |
Total revenue, net of interest expense(1) | | $ | 18,100 | | | | | $ | 12,737 | | | | | $ | 4,670 | | | | | $ | 8,728 | | | | | $ | 4,702 | | | | | $ | 4,059 | | | | | $ | 4,284 | | | |
| | | | | | | | | | | | | | | | | | | | | | | | | | | | | | | | | | | | | | | | | | |
Global Banking average deposit balances | | | | | | | | | | | | | | | | | | | | | | | | | | | | | | | | | | | | | | | | | | |
Global commercial banking | | $ | 126,631 | | | | | $ | 105,082 | | | | | $ | 132,766 | | | | | $ | 127,133 | | | | | $ | 119,853 | | | | | $ | 118,415 | | | | | $ | 107,142 | | | |
Global corporate and investment banking | | | 78,654 | | | | | | 65,080 | | | | | | 81,520 | | | | | | 76,784 | | | | | | 77,615 | | | | | | 81,050 | | | | | | 70,526 | | | |
| | | | | | | | | | | | | | | | | | | | | | | | | | | | | | | | | | | | | | | | | | |
Total | | $ | 205,285 | | | | | $ | 170,162 | | | | | $ | 214,286 | | | | | $ | 203,917 | | | | | $ | 197,468 | | | | | $ | 199,465 | | | | | $ | 177,668 | | | |
| | | | | | | | | | | | | | | | | | | | | | | | | | | | | | | | | | | | | | | | | | |
Interest-bearing | | $ | 82,013 | | | | | $ | 87,384 | | | | | $ | 80,509 | | | | | $ | 79,059 | | | | | $ | 86,537 | | | | | $ | 100,259 | | | | | $ | 89,217 | | | |
Noninterest-bearing | | | 123,272 | | | | | | 82,778 | | | | | | 133,777 | | | | | | 124,858 | | | | | | 110,931 | | | | | | 99,206 | | | | | | 88,451 | | | |
| | | | | | | | | | | | | | | | | | | | | | | | | | | | | | | | | | | | | | | | | | |
Total | | $ | 205,285 | | | | | $ | 170,162 | | | | | $ | 214,286 | | | | | $ | 203,917 | | | | | $ | 197,468 | | | | | $ | 199,465 | | | | | $ | 177,668 | | | |
| | | | | | | | | | | | | | | | | | | | | | | | | | | | | | | | | | | | | | | | | | |
Global Banking loan spreads | | | | | | | | | | | | | | | | | | | | | | | | | | | | | | | | | | | | | | | | | | |
Global commercial banking | | | 1.95 | | | % | | | 1.74 | | | % | | | 2.06 | | | % | | | 1.96 | | | % | | | 1.83 | | | % | | | 1.85 | | | % | | | 1.74 | | | % |
Global corporate and investment banking | | | 1.57 | | | | | | 0.69 | | | | | | 1.62 | | | | | | 1.45 | | | | | | 1.64 | | | | | | 1.18 | | | | | | 0.73 | | | |
Provision for credit losses | | | | | | | | | | | | | | | | | | | | | | | | | | | | | | | | | | | | | | | | | | |
Global commercial banking | | $ | 5,443 | | | | | $ | 1,601 | | | | | $ | 1,899 | | | | | $ | 1,992 | | | | | $ | 1,552 | | | | | $ | 1,036 | | | | | $ | 671 | | | |
Global corporate and investment banking | | | 1,329 | | | | | | 127 | | | | | | 441 | | | | | | 592 | | | | | | 296 | | | | | | 366 | | | | | | 131 | | | |
| | | | | | | | | | | | | | | | | | | | | | | | | | | | | | | | | | | | | | | | | | |
Total provision for credit losses | | $ | 6,772 | | | | | $ | 1,728 | | | | | $ | 2,340 | | | | | $ | 2,584 | | | | | $ | 1,848 | | | | | $ | 1,402 | | | | | $ | 802 | | | |
| | | | | | | | | | | | | | | | | | | | | | | | | | | | | | | | | | | | | | | | | | |
Credit quality(3, 4) | | | | | | | | | | | | | | | | | | | | | | | | | | | | | | | | | | | | | | | | | | |
Reservable utilized criticized exposure | | | | | | | | | | | | | | | | | | | | | | | | | | | | | | | | | | | | | | | | | | |
Global commercial banking | | $ | 41,274 | | | | | $ | 23,020 | | | | | $ | 41,274 | | | | | $ | 38,513 | | | | | $ | 33,465 | | | | | $ | 27,225 | | | | | $ | 23,020 | | | |
| | | 18.81 | | | % | | | 9.93 | | | % | | | 18.81 | | | % | | | 16.82 | | | % | | | 14.36 | | | % | | | 11.63 | | | % | | | 9.93 | | | % |
Global corporate and investment banking | | $ | 12,138 | | | | | $ | 5,782 | | | | | $ | 12,138 | | | | | $ | 11,861 | | | | | $ | 9,995 | | | | | $ | 7,292 | | | | | $ | 5,782 | | | |
| | | 11.20 | | | % | | | 4.63 | | | % | | | 11.20 | | | % | | | 10.44 | | | % | | | 8.45 | | | % | | | 5.91 | | | % | | | 4.63 | | | % |
| | | | | | | | | | | | | | | | | | | | | | | | | | | | | | | | | | | | | | | | | | |
Total reservable utilized criticized exposure | | $ | 53,412 | | | | | $ | 28,802 | | | | | $ | 53,412 | | | | | $ | 50,374 | | | | | $ | 43,460 | | | | | $ | 34,517 | | | | | $ | 28,802 | | | |
| | | 16.29 | | | % | | | 8.07 | | | % | | | 16.29 | | | % | | | 14.70 | | | % | | | 12.37 | | | % | | | 9.66 | | | % | | | 8.07 | | | % |
Nonperforming assets | | | | | | | | | | | | | | | | | | | | | | | | | | | | | | | | | | | | | | | | | | |
Global commercial banking | | $ | 10,252 | | | | | $ | 4,335 | | | | | $ | 10,252 | | | | | $ | 9,510 | | | | | $ | 8,077 | | | | | $ | 5,643 | | | | | $ | 4,335 | | | |
| | | 4.84 | | | % | | | 1.93 | | | % | | | 4.84 | | | % | | | 4.31 | | | % | | | 3.60 | | | % | | | 2.50 | | | % | | | 1.93 | | | % |
Global corporate and investment banking | | $ | 1,388 | | | | | $ | 444 | | | | | $ | 1,388 | | | | | $ | 1,314 | | | | | $ | 879 | | | | | $ | 736 | | | | | $ | 444 | | | |
| | | 1.55 | | | % | | | 0.43 | | | % | | | 1.55 | | | % | | | 1.40 | | | % | | | 0.88 | | | % | | | 0.71 | | | % | | | 0.43 | | | % |
| | | | | | | | | | | | | | | | | | | | | | | | | | | | | | | | | | | | | | | | | | |
Total nonperforming assets | | $ | 11,640 | | | | | $ | 4,779 | | | | | $ | 11,640 | | | | | $ | 10,824 | | | | | $ | 8,956 | | | | | $ | 6,379 | | | | | $ | 4,779 | | | |
| | | 3.86 | | | % | | | 1.46 | | | % | | | 3.86 | | | % | | | 3.44 | | | % | | | 2.77 | | | % | | | 1.94 | | | % | | | 1.46 | | | % |
Average loans and leases by product | | | | | | | | | | | | | | | | | | | | | | | | | | | | | | | | | | | | | | | | | | |
Commercial - domestic | | $ | 164,161 | | | | | $ | 160,316 | | | | | $ | 153,493 | | | | | $ | 164,673 | | | | | $ | 174,548 | | | | | $ | 175,260 | | | | | $ | 163,886 | | | |
Commercial real estate | | | 63,343 | | | | | | 59,800 | | | | | | 62,883 | | | | | | 64,609 | | | | | | 62,532 | | | | | | 61,395 | | | | | | 60,196 | | | |
Commercial lease financing | | | 24,221 | | | | | | 24,376 | | | | | | 24,140 | | | | | | 24,208 | | | | | | 24,316 | | | | | | 24,324 | | | | | | 24,574 | | | |
Commercial - foreign | | | 26,253 | | | | | | 27,346 | | | | | | 24,890 | | | | | | 27,051 | | | | | | 26,840 | | | | | | 28,546 | | | | | | 28,429 | | | |
Direct/Indirect consumer | | | 41,488 | | | | | | 40,444 | | | | | | 42,022 | | | | | | 41,233 | | | | | | 41,201 | | | | | | 40,144 | | | | | | 42,205 | | | |
Other | | | 1,438 | | | | | | 1,749 | | | | | | 1,336 | | | | | | 1,443 | | | | | | 1,537 | | | | | | 1,446 | | | | | | 1,523 | | | |
| | | | | | | | | | | | | | | | | | | | | | | | | | | | | | | | | | | | | | | | | | |
Total average loans and leases | | $ | 320,904 | | | | | $ | 314,031 | | | | | $ | 308,764 | | | | | $ | 323,217 | | | | | $ | 330,974 | | | | | $ | 331,115 | | | | | $ | 320,813 | | | |
| | | | | | | | | | | | | | | | | | | | | | | | | | | | | | | | | | | | | | | | | | |
| | | | | | | | | | | | | | | | | | | | | | | | | | | | | | | | | | | | | | | | | | | |
| | | | | | | | | | | | | | | | | | | | | | | | | | | | | | | | | | | | | | | | | | |
(1) Total Global Banking revenue, net of interest expense | | $ | 18,100 | | | | | $ | 12,737 | | | | | $ | 4,670 | | | | | $ | 8,728 | | | | | $ | 4,702 | | | | | $ | 4,059 | | | | | $ | 4,284 | | | |
Less: Fair value option revenue share | | | 266 | | | | | | (8 | ) | | | | | 162 | | | | | | 242 | | | | | | (138 | ) | | | | | (291 | ) | | | | | (13 | ) | | |
Less: Impact of credit mitigation | | | (233 | ) | | | | | 88 | | | | | | (112 | ) | | | | | (121 | ) | | | | | — | | | | | | 221 | | | | | | 24 | | | |
| | | | | | | | | | | | | | | | | | | | | | | | | | | | | | | | | | | | | | | | | | |
Global banking revenues, net of interest expense excluding fair value option revenue share and credit mitigation | | $ | 18,067 | | | | | $ | 12,657 | | | | | $ | 4,620 | | | | | $ | 8,607 | | | | | $ | 4,840 | | | | | $ | 4,129 | | | | | $ | 4,273 | | | |
| | | | | | | | | | | | | | | | | | | | | | | | | | | | | | | | | | | | | | | | | | |
| (2) | Includes revenue and loss sharing with Global Markets for certain activities and positions. |
| (3) | Criticized exposure corresponds to the Special Mention, Substandard and Doubtful asset categories defined by regulatory authorities. The reservable criticized exposure is on an end-of-period basis and is also shown as a percentage of total reservable commercial utilized credit exposure, including loans and leases, standby letters of credit, financial guarantees, commercial letters of credit and bankers’ acceptances. |
| (4) | Nonperforming assets are on an end-of-period basis and defined as nonperforming loans and leases plus foreclosed properties. The nonperforming ratio is nonperforming assets divided by commercial loans and leases plus commercial foreclosed properties. |
Certain prior period amounts have been reclassified among the segments to conform to the current period presentation.
Information for periods beginning July 1, 2008 includes the Countrywide acquisition. Information for periods beginning January 1, 2009 includes the
Merrill Lynch acquisition. Prior periods have not been restated.
| | |
| This information is preliminary and based on company data available at the time of the presentation. | | 22 |
Bank of America Corporation and Subsidiaries
Investment Banking Product Rankings
| | | | | | | | | | | | |
| | | Nine months ended September 30, 2009 | | |
| | | Global | | | | U.S. | | |
| | | Product
Ranking | | Market
Share | | | | Product
Ranking | | Market
Share | | |
High-yield corporate debt | | 1 | | 15.0 | | % | | 1 | | 17.6 | | % |
Leveraged loans | | 1 | | 14.3 | | | | 1 | | 21.5 | | |
Mortgage-backed securities | | 1 | | 15.0 | | | | 1 | | 17.0 | | |
Asset-backed securities | | 2 | | 14.8 | | | | 2 | | 18.2 | | |
Convertible debt | | 6 | | 6.3 | | | | 2 | | 13.4 | | |
Common stock underwriting | | 5 | | 5.9 | | | | 4 | | 11.4 | | |
Investment grade corporate debt | | 4 | | 5.7 | | | | 3 | | 13.9 | | |
Syndicated loans | | 2 | | 7.3 | | | | 2 | | 21.0 | | |
Net investment banking revenue | | 3 | | 6.5 | | | | 2 | | 11.3 | | |
Announced mergers and acquisitions | | 6 | | 16.1 | | | | 5 | | 26.0 | | |
Equity capital markets | | 5 | | 6.0 | | | | 4 | | 11.8 | | |
Debt capital markets | | 4 | | 6.0 | | | | 2 | | 12.4 | | |
Source:Dealogic data. Rankings based on deal volumes except for investment banking revenue rankings which reflect fees. Mergers and acquisition fees included in investment banking revenues reflect 10 percent fee credit at announcement and 90 percent fee credit at completion as per Dealogic. Mergers and acquisitions volume rankings are for announced transactions and provide credit only to the investment bank advising the parent company that is domiciled within that region. Each advisor receives full credit for the deal amount unless advising a minority stakeholder.
Highlights
Global top 3 rankings in:
| | | | |
| High-yield corporate debt | | Asset-backed securities | | |
| Leveraged loans | | Syndicated loans | | |
| Mortgage-backed securities | | Net investment banking revenue | | |
U.S. top 3 rankings in:
| | | | |
| High-yield corporate debt | | Investment grade corporate debt | | |
| Leveraged loans | | Syndicated loans | | |
| Mortgage-backed securities | | Net investment banking revenue | | |
| Asset-backed securities | | Debt capital markets | | |
| Convertible debt | | | | |
Figures above include self-led transactions. Excluding self-led deals, global and U.S. asset-backed securities rankings were #1, U.S. investment grade corporate debt ranking was #2, global net investment banking revenue ranking was #3, and U.S. announced mergers and acquisitions ranking was #5, according to Dealogic data.
Information for periods beginning January 1, 2009 includes the Merrill Lynch acquisition.
| | |
| This information is preliminary and based on company data available at the time of the presentation. | | 23 |
Bank of America Corporation and Subsidiaries
Global Markets Segment Results
(Dollars in millions)
| | | | | | | | | | | | | | | | | | | | | | | | | | | | | | | | | | | | | | | | | | |
| | | Nine Months Ended
September 30 | | | | | Third
Quarter
2009 | | | | | Second
Quarter
2009 | | | | | First
Quarter
2009 | | | | | Fourth
Quarter
2008 | | | | | Third
Quarter
2008 | | | |
| | | 2009 | | | | | 2008 | | | | | | | | | | | | | | | | | | |
Net interest income(1) | | $ | 4,870 | | | | | $ | 3,618 | | | | | $ | 1,462 | | | | | $ | 1,515 | | | | | $ | 1,893 | | | | | $ | 1,532 | | | | | $ | 1,286 | | | |
Noninterest income: | | | | | | | | | | | | | | | | | | | | | | | | | | | | | | | | | | | | | | | | | | |
Investment and brokerage services | | | 1,978 | | | | | | 601 | | | | | | 562 | | | | | | 832 | | | | | | 584 | | | | | | 150 | | | | | | 195 | | | |
Investment banking income | | | 1,940 | | | | | | 966 | | | | | | 635 | | | | | | 820 | | | | | | 485 | | | | | | 371 | | | | | | 251 | | | |
Trading account profits (losses) | | | 10,314 | | | | | | (1,918 | ) | | | | | 3,380 | | | | | | 2,014 | | | | | | 4,920 | | | | | | (3,891 | ) | | | | | (499 | ) | | |
All other income (loss) | | | (1,866 | ) | | | | | (2,543 | ) | | | | | (212 | ) | | | | | (698 | ) | | | | | (956 | ) | | | | | (2,717 | ) | | | | | (1,072 | ) | | |
| | | | | | | | | | | | | | | | | | | | | | | | | | | | | | | | | | | | | | | | | | |
Total noninterest income (loss) | | | 12,366 | | | | | | (2,894 | ) | | | | | 4,365 | | | | | | 2,968 | | | | | | 5,033 | | | | | | (6,087 | ) | | | | | (1,125 | ) | | |
| | | | | | | | | | | | | | | | | | | | | | | | | | | | | | | | | | | | | | | | | | |
Total revenue, net of interest expense | | | 17,236 | | | | | | 724 | | | | | | 5,827 | | | | | | 4,483 | | | | | | 6,926 | | | | | | (4,555 | ) | | | | | 161 | | | |
Provision for credit losses | | | 148 | | | | | | (63 | ) | | | | | 98 | | | | | | (1 | ) | | | | | 51 | | | | | | 13 | | | | | | (24 | ) | | |
Noninterest expense | | | 7,962 | | | | | | 2,802 | | | | | | 2,328 | | | | | | 2,570 | | | | | | 3,064 | | | | | | 1,105 | | | | | | 1,120 | | | |
| | | | | | | | | | | | | | | | | | | | | | | | | | | | | | | | | | | | | | | | | | |
Income (loss) before income taxes | | | 9,126 | | | | | | (2,015 | ) | | | | | 3,401 | | | | | | 1,914 | | | | | | 3,811 | | | | | | (5,673 | ) | | | | | (935 | ) | | |
Income tax expense (benefit)(1) | | | 3,099 | | | | | | (752 | ) | | | | | 1,211 | | | | | | 524 | | | | | | 1,364 | | | | | | (2,020 | ) | | | | | (347 | ) | | |
| | | | | | | | | | | | | | | | | | | | | | | | | | | | | | | | | | | | | | | | | | |
Net income (loss) | | $ | 6,027 | | | | | $ | (1,263 | ) | | | | $ | 2,190 | | | | | $ | 1,390 | | | | | $ | 2,447 | | | | | $ | (3,653 | ) | | | | $ | (588 | ) | | |
| | | | | | | | | | | | | | | | | | | | | | | | | | | | | | | | | | | | | | | | | | |
Return on average equity | | | 23.62 | | | % | | | n/m | | | | | | 19.87 | | | % | | | 17.96 | | | % | | | 36.21 | | | % | | | n/m | | | | | | n/m | | | |
Efficiency ratio(1) | | | 46.20 | | | | | | n/m | | | | | | 39.96 | | | | | | 57.33 | | | | | | 44.23 | | | | | | n/m | | | | | | n/m | | | |
Sales and trading revenue | | | | | | | | | | | | | | | | | | | | | | | | | | | | | | | | | | | | | | | | | | |
Fixed income, currency and commodities | | $ | 11,511 | | | | | $ | (1,800 | ) | | | | $ | 4,041 | | | | | $ | 2,683 | | | | | $ | 4,787 | | | | | $ | (5,823 | ) | | | | $ | (654 | ) | | |
Equity income | | | 3,952 | | | | | | 760 | | | | | | 1,265 | | | | | | 1,198 | | | | | | 1,489 | | | | | | (17 | ) | | | | | 176 | | | |
| | | | | | | | | | | | | | | | | | | | | | | | | | | | | | | | | | | | | | | | | | |
Total sales and trading revenue(2) | | $ | 15,463 | | | | | $ | (1,040 | ) | | | | $ | 5,306 | | | | | $ | 3,881 | | | | | $ | 6,276 | | | | | $ | (5,840 | ) | | | | $ | (478 | ) | | |
| | | | | | | | | | | | | | | | | | | | | | | | | | | | | | | | | | | | | | | | | | |
Balance sheet | | | | | | | | | | | | | | | | | | | | | | | | | | | | | | | | | | | | | | | | | | |
Average | | | | | | | | | | | | | | | | | | | | | | | | | | | | | | | | | | | | | | | | | | |
Total trading-related assets (3) | | $ | 512,325 | | | | | $ | 345,779 | | | | | $ | 495,757 | | | | | $ | 504,126 | | | | | $ | 537,552 | | | | | $ | 315,125 | | | | | $ | 347,088 | | | |
Total market-based earning assets | | | 478,448 | | | | | | 377,148 | | | | | | 468,999 | | | | | | 476,598 | | | | | | 489,979 | | | | | | 311,582 | | | | | | 369,921 | | | |
Total earning assets | | | 488,603 | | | | | | 382,500 | | | | | | 476,450 | | | | | | 486,062 | | | | | | 503,595 | | | | | | 317,636 | | | | | | 375,009 | | | |
Total assets | | | 664,690 | | | | | | 440,311 | | | | | | 633,909 | | | | | | 656,331 | | | | | | 704,606 | | | | | | 390,274 | | | | | | 430,539 | | | |
Allocated equity | | | 34,121 | | | | | | 11,937 | | | | | | 43,739 | | | | | | 31,034 | | | | | | 27,409 | | | | | | 15,525 | | | | | | 12,127 | | | |
Period end | | | | | | | | | | | | | | | | | | | | | | | | | | | | | | | | | | | | | | | | | | |
Total trading-related assets (3) | | $ | 448,293 | | | | | $ | 275,703 | | | | | $ | 448,293 | | | | | $ | 435,396 | | | | | $ | 441,015 | | | | | $ | 244,174 | | | | | $ | 275,703 | | | |
Total market-based earning assets | | | 418,931 | | | | | | 282,260 | | | | | | 418,931 | | | | | | 401,334 | | | | | | 381,102 | | | | | | 237,452 | | | | | | 282,260 | | | |
Total earning assets | | | 425,402 | | | | | | 288,107 | | | | | | 425,402 | | | | | | 409,823 | | | | | | 392,425 | | | | | | 243,275 | | | | | | 288,107 | | | |
Total assets | | | 588,641 | | | | | | 350,326 | | | | | | 588,641 | | | | | | 572,702 | | | | | | 583,607 | | | | | | 306,693 | | | | | | 350,326 | | | |
Trading-related assets (average) | | | | | | | | | | | | | | | | | | | | | | | | | | | | | | | | | | | | | | | | | | |
Trading account securities | | $ | 202,096 | | | | | $ | 185,083 | | | | | $ | 198,336 | | | | | $ | 190,523 | | | | | $ | 217,640 | | | | | $ | 167,463 | | | | | $ | 186,455 | | | |
Reverse repurchases | | | 135,513 | | | | | | 56,548 | | | | | | 130,664 | | | | | | 139,566 | | | | �� | | 136,373 | | | | | | 53,193 | | | | | | 62,767 | | | |
Securities borrowed | | | 72,991 | | | | | | 69,164 | | | | | | 78,605 | | | | | | 72,309 | | | | | | 67,941 | | | | | | 42,580 | | | | | | 62,982 | | | |
Derivative assets | | | 101,725 | | | | | | 34,984 | | | | | | 88,152 | | | | | | 101,728 | | | | | | 115,598 | | | | | | 51,889 | | | | | | 34,884 | | | |
| | | | | | | | | | | | | | | | | | | | | | | | | | | | | | | | | | | | | | | | | | |
Total trading-related assets(3) | | $ | 512,325 | | | | | $ | 345,779 | | | | | $ | 495,757 | | | | | $ | 504,126 | | | | | $ | 537,552 | | | | | $ | 315,125 | | | | | $ | 347,088 | | | |
| | | | | | | | | | | | | | | | | | | | | | | | | | | | | | | | | | | | | | | | | | |
| | | | | | | | | | | | | | | | | | | | | | | | | | | | | | | | | | | | | | | | | | |
| |
(1) Fully taxable-equivalent basis |
(2) Sales and trading revenue represents total Global Markets revenue, net of interest expense as adjusted by the following items: |
Total Global Markets revenue, net of interest expense | | $ | 17,236 | | | | | $ | 724 | | | | | $ | 5,827 | | | | | $ | 4,483 | | | | | $ | 6,926 | | | | | $ | (4,555 | ) | | | | $ | 161 | | | |
Investment banking income | | | (1,940 | ) | | | | | (966 | ) | | | | | (635 | ) | | | | | (820 | ) | | | | | (485 | ) | | | | | (371 | ) | | | | | (251 | ) | | |
Fair value option net interest income | | | (204 | ) | | | | | (93 | ) | | | | | (65 | ) | | | | | (72 | ) | | | | | (67 | ) | | | | | (46 | ) | | | | | (33 | ) | | |
Revenue (loss) shared | | | 318 | | | | | | (481 | ) | | | | | 179 | | | | | | 269 | | | | | | (130 | ) | | | | | (868 | ) | | | | | (131 | ) | | |
(Gain) loss on sale of prime brokerage business | | | 53 | | | | | | (224 | ) | | | | | — | | | | | | 21 | | | | | | 32 | | | | | | — | | | | | | (224 | ) | | |
| | | | | | | | | | | | | | | | | | | | | | | | | | | | | | | | | | | | | | | | | | |
Total sales and trading revenue | | $ | 15,463 | | | | | $ | (1,040 | ) | | | | $ | 5,306 | | | | | $ | 3,881 | | | | | $ | 6,276 | | | | | $ | (5,840 | ) | | | | $ | (478 | ) | | |
| | | | | | | | | | | | | | | | | | | | | | | | | | | | | | | | | | | | | | | | | | |
(3) Includes assets which are not considered earning assets (i.e. derivative assets). |
| n/m = not meaningful |
Certain prior period amounts have been reclassified among the segments to conform to the current period presentation.
Information for periods beginning July 1, 2008 includes the Countrywide acquisition. Information for periods beginning January 1, 2009 includes the
Merrill Lynch acquisition. Prior periods have not been restated.
| | |
| This information is preliminary and based on company data available at the time of the presentation. | | 24 |
Bank of America Corporation and Subsidiaries
Off-Balance Sheet Special Purpose Entities Liquidity Exposure
(Dollars in millions)
| | | | | | | | | |
| | | September 30, 2009 |
| | | |
| | | VIEs(1) | | QSPEs (2) | | Total |
Commercial paper conduits: | | | | | | | | | |
Multi-seller conduits | | $ | 27,024 | | $ | — | | $ | 27,024 |
Asset acquisition conduits | | | 1,317 | | | — | | | 1,317 |
Home equity securitizations | | | — | | | 12,863 | | | 12,863 |
Municipal bond trusts | | | 3,122 | | | 6,746 | | | 9,868 |
| | | |
Collateralized debt obligation vehicles(3) | | | 3,744 | | | — | | | 3,744 |
Credit-linked note and other vehicles | | | 3,478 | | | — | | | 3,478 |
Customer conduits | | | 615 | | | — | | | 615 |
Credit card securitizations | | | — | | | 1,738 | | | 1,738 |
| | | | | | | | | |
| | | |
Total liquidity exposure(4) | | $ | 39,300 | | $ | 21,347 | | $ | 60,647 |
| | | | | | | | | |
| |
| | | June 30, 2009 |
| | | |
| | | VIEs(1) | | QSPEs (2) | | Total |
Commercial paper conduits: | | | | | | | | | |
Multi-seller conduits | | $ | 34,825 | | $ | — | | $ | 34,825 |
Asset acquisition conduits | | | 1,391 | | | — | | | 1,391 |
Home equity securitizations | | | — | | | 13,377 | | | 13,377 |
Municipal bond trusts | | | 3,545 | | | 8,421 | | | 11,966 |
| | | |
Collateralized debt obligation vehicles(3) | | | 4,749 | | | — | | | 4,749 |
Credit-linked note and other vehicles | | | 3,976 | | | — | | | 3,976 |
Customer conduits | | | 669 | | | — | | | 669 |
Credit card securitizations | | | — | | | 946 | | | 946 |
| | | | | | | | | |
| | | |
Total liquidity exposure(4) | | $ | 49,155 | | $ | 22,744 | | $ | 71,899 |
| | | | | | | | | |
| (1) | Variable interest entities (VIEs) are special purpose entities (SPEs) which lack sufficient equity at risk or whose equity investors do not have a controlling financial interest. A VIE is consolidated by the party known as the primary beneficiary that will absorb the majority of the expected losses or expected residual returns of the VIEs or both. For example, an entity that holds a majority of the subordinated debt or equity securities issued by a VIE, or protects other investors from loss through a guarantee or similar arrangement, may have to consolidate the VIE. The assets and liabilities of consolidated VIEs are recorded on the Corporation’s balance sheet. |
| (2) | Qualifying special purposes entities (QSPEs) are SPEs whose activities are strictly limited to holding and servicing financial assets. QSPEs are generally not required to be consolidated by any party. This table includes only those QSPEs to which we have liquidity exposure. |
| (3) | Represents super senior and non-super senior collateralized debt obligation exposure. |
| (4) | Merrill Lynch related exposures as of September 30, 2009 and June 30, 2009 includes: $4.9 billion and $6.5 billion in municipal bond trusts, $3.7 billion and $4.7 billion in collateralized debt obligation vehicles and $3.5 billion and $4.0 billion in credit-linked note and other vehicles. |
Certain prior period amounts have been reclassified to conform to current period presentation.
Information for periods beginning July 1, 2008 includes the Countrywide acquisition. Information for periods beginning January 1, 2009 includes the
Merrill Lynch acquisition. Prior periods have not been restated.
| | |
| This information is preliminary and based on company data available at the time of the presentation. | | 25 |
Bank of America Corporation and Subsidiaries
Super Senior Collateralized Debt Obligation Exposure
(Dollars in millions)
| | | | | | | | | | | | | | | |
| | | September 30, 2009 |
| | | Subprime (1) | | Purchased
Securities | | Total
Subprime | | Non-
Subprime (2) | | Total |
Unhedged | | $ | 994 | | $ | 968 | | $ | 1,962 | | $ | 1,608 | | $ | 3,570 |
Hedged (3) | | | 667 | | | — | | | 667 | | | 699 | | | 1,366 |
| | | | | | | | | | | | | | | |
Total | | $ | 1,661 | | $ | 968 | | $ | 2,629 | | $ | 2,307 | | $ | 4,936 |
| | | | | | | | | | | | | | | |
| (1) | Classified as subprime when subprime consumer real estate loans make up at least 35 percent of the ultimate underlying collateral’s original net exposure value. |
| (2) | Includes highly-rated collateralized loan obligations and commercial mortgage-backed securities super senior exposure. |
| (3) | Hedged amounts are presented at carrying value before consideration of the insurance. |
Credit Default Swaps with Monoline Financial Guarantors
(Dollars in millions)
| | | | | | | | | | | | | | | | | | |
| | | September 30, 2009 |
| | | Super
Senior
CDOs | | | | | Other
Guaranteed
Positions | | | | | Total | | | |
Notional | | $ | 3,785 | | | | | $ | 41,045 | | | | | $ | 44,830 | | | |
| | | | | | |
Mark-to-market or guarantor receivable | | $ | 2,813 | | | | | $ | 8,500 | | | | | $ | 11,313 | | | |
Credit valuation adjustment | | | (1,750 | ) | | | | | (4,140 | ) | | | | | (5,890 | ) | | |
| | | | | | | | | | | | | | | | | | |
Total | | $ | 1,063 | | | | | $ | 4,360 | | | | | $ | 5,423 | | | |
| | | | | | | | | | | | | | | | | | |
Credit valuation adjustment % | | | 62 | | | % | | | 49 | | | % | | | 52 | | | % |
| | | | | | |
(Writedowns) gains during the three months ended September 30, 2009 | | $ | (226 | ) | | | | $ | 795 | | | | | $ | 569 | | | |
| | | | | | |
(Writedowns) gains during the nine months ended September 30, 2009 | | | (838 | ) | | | | | 58 | | | | | | (780 | ) | | |
Certain prior period amounts have been reclassified to conform to current period presentation.
Information for periods beginning July 1, 2008 includes the Countrywide acquisition. Information for periods beginning January 1, 2009 includes the
Merrill Lynch acquisition. Prior periods have not been restated.
| | |
| This information is preliminary and based on company data available at the time of the presentation. | | 26 |
Bank of America Corporation and Subsidiaries
Unhedged Subprime Super Senior Collateralized Debt Obligation Carrying Values(1)
(Dollars in millions)
| | | | | | | | | | | | | | | | | | | | | | | |
| | | September 30, 2009 |
| | Subprime
Net Exposure | | Carrying Value
as a Percent of
Original Net
Exposure | | | | | Subprime
Content of
Collateral (2) | | | | | Vintage of Subprime Collateral |
| | | | | | | Percent in
2006/2007
Vintages | | | | | Percent in
2005/Prior
Vintages | | | |
Mezzanine super senior liquidity commitments | | $ | 67 | | 5 | | | % | | 100 | | | % | | 84 | | | % | | 16 | | | % |
Other super senior exposure | | | | | | | | | | | | | | | | | | | | | | | |
High grade | | | 622 | | 22 | | | | | 40 | | | | | 27 | | | | | 73 | | | |
Mezzanine | | | 303 | | 17 | | | | | 34 | | | | | 81 | | | | | 19 | | | |
CDO-squared | | | 2 | | 3 | | | | | 100 | | | | | 100 | | | | | — | | | |
| | | | | | | | | | | | | | | | | | | | | | | |
Total other super senior | | | 927 | | | | | | | | | | | | | | | | | | | | |
| | | | | | | | | | | | | | | | | | | | | | | |
Total super senior | | $ | 994 | | 16 | | | | | | | | | | | | | | | | | | |
| | | | | | | | | | | | | | | | | | | | | | | |
| | | | | | | | | |
Purchased securities from liquidated CDOs | | | 968 | | 19 | | | | | 34 | | | | | 27 | | | | | 73 | | | |
| | | | | | | | | | | | | | | | | | | | | | | |
| | | | | | | | | |
Total | | $ | 1,962 | | 17 | | | | | | | | | | | | | | | | | | |
| | | | | | | | | | | | | | | | | | | | | | | |
| (1) | Classified as subprime when subprime consumer real estate loans make up at least 35 percent of the ultimate underlying collateral’s original net exposure value. |
| (2) | Based on current net exposure value. |
Certain prior period amounts have been reclassified to conform to current period presentation.
Information for periods beginning July 1, 2008 includes the Countrywide acquisition. Information for periods beginning January 1, 2009 includes the
Merrill Lynch acquisition. Prior periods have not been restated.
| | |
| This information is preliminary and based on company data available at the time of the presentation. | | 27 |
Bank of America Corporation and Subsidiaries
Global Wealth & Investment Management Segment Results(1)
(Dollars in millions, except as noted)
| | | | | | | | | | | | | | | | | | | | | | | | | | | | | | | | | | | | | | | | | | | | |
| | | Nine Months��Ended
September 30 | | | | | | | Third
Quarter
2009 | | | | | Second
Quarter
2009 | | | | | First
Quarter
2009 | | | | | Fourth
Quarter
2008 | | | | | Third
Quarter
2008 | | | |
| | | 2009 | | | | | 2008 | | | | | | | | | | | | | | | | | | | |
Net interest income(2) | | $ | 4,280 | | | | | $ | 3,449 | | | | | | | $ | 1,330 | | | | | $ | 1,292 | | | | | $ | 1,658 | | | | | $ | 1,348 | | | | | $ | 1,271 | | | |
Noninterest income: | | | | | | | | | | | | | | | | | | | | | | | | | | | | | | | | | | | | | | | | | | | | |
Investment and brokerage services | | | 6,869 | | | | | | 3,178 | | | | | | | | 2,328 | | | | | | 2,231 | | | | | | 2,310 | | | | | | 880 | | | | | | 1,002 | | | |
All other income (loss) | | | 1,457 | | | | | | (808 | ) | | | | | | | 437 | | | | | | 647 | | | | | | 373 | | | | | | (237 | ) | | | | | (703 | ) | | |
| | | | | | | | | | | | | | | | | | | | | | | | | | | | | | | | | | | | | | | | | | | | |
Total noninterest income | | | 8,326 | | | | | | 2,370 | | | | | | | | 2,765 | | | | | | 2,878 | | | | | | 2,683 | | | | | | 643 | | | | | | 299 | | | |
| | | | | | | | | | | | | | | | | | | | | | | | | | | | | | | | | | | | | | | | | | | | |
Total revenue, net of interest expense | | | 12,606 | | | | | | 5,819 | | | | | | | | 4,095 | | | | | | 4,170 | | | | | | 4,341 | | | | | | 1,991 | | | | | | 1,570 | | | |
| | | | | | | | | | | | | | | |
Provision for credit losses | | | 1,007 | | | | | | 512 | | | | | | | | 515 | | | | | | 238 | | | | | | 254 | | | | | | 152 | | | | | | 150 | | | |
Noninterest expense | | | 9,747 | | | | | | 3,841 | | | | | | | | 3,169 | | | | | | 3,297 | | | | | | 3,281 | | | | | | 1,069 | | | | | | 1,286 | | | |
| | | | | | | | | | | | | | | | | | | | | | | | | | | | | | | | | | | | | | | | | | | | |
Income before income taxes | | | 1,852 | | | | | | 1,466 | | | | | | | | 411 | | | | | | 635 | | | | | | 806 | | | | | | 770 | | | | | | 134 | | | |
Income tax expense(2) | | | 650 | | | | | | 553 | | | | | | | | 140 | | | | | | 206 | | | | | | 304 | | | | | | 255 | | | | | | 54 | | | |
| | | | | | | | | | | | | | | | | | | | | | | | | | | | | | | | | | | | | | | | | | | | |
Net income | | $ | 1,202 | | | | | $ | 913 | | | | | | | $ | 271 | | | | | $ | 429 | | | | | $ | 502 | | | | | $ | 515 | | | | | $ | 80 | | | |
| | | | | | | | | | | | | | | | | | | | | | | | | | | | | | | | | | | | | | | | | | | | |
Net interest yield(2) | | | 2.62 | | | % | | | 2.94 | | | % | | | | | 2.54 | | | % | | | 2.53 | | | % | | | 2.75 | | | % | | | 3.03 | | | % | | | 3.08 | | | % |
Return on average equity | | | 8.75 | | | | | | 10.44 | | | | | | | | 5.61 | | | | | | 9.19 | | | | | | 11.88 | | | | | | 17.40 | | | | | | 2.74 | | | |
Efficiency ratio(2) | | | 77.32 | | | | | | 66.01 | | | | | | | | 77.38 | | | | | | 79.06 | | | | | | 75.60 | | | | | | 53.70 | | | | | | 81.90 | | | |
| | | | | | | | | | | | | | | |
Balance sheet | | | | | | | | | | | | | | | | | | | | | | | | | | | | | | | | | | | | | | | | | | | | |
| | | | | | | | | | | | | | | |
Average | | | | | | | | | | | | | | | | | | | | | | | | | | | | | | | | | | | | | | | | | | | | |
Total loans and leases | | $ | 104,454 | | | | | $ | 87,162 | | | | | | | $ | 101,181 | | | | | $ | 101,748 | | | | | $ | 110,535 | | | | | $ | 88,876 | | | | | $ | 88,255 | | | |
Total earning assets(3) | | | 218,767 | | | | | | 156,441 | | | | | | | | 207,870 | | | | | | 204,521 | | | | | | 244,310 | | | | | | 177,303 | | | | | | 164,051 | | | |
Total assets(3) | | | 251,512 | | | | | | 166,013 | | | | | | | | 239,113 | | | | | | 237,442 | | | | | | 278,413 | | | | | | 185,744 | | | | | | 173,505 | | | |
Total deposits | | | 226,967 | | | | | | 156,762 | | | | | | | | 214,994 | | | | | | 215,383 | | | | | | 250,914 | | | | | | 172,435 | | | | | | 162,192 | | | |
Allocated equity | | | 18,368 | | | | | | 11,674 | | | | | | | | 19,258 | | | | | | 18,702 | | | | | | 17,120 | | | | | | 11,767 | | | | | | 11,677 | | | |
| | | | | | | | | | | | | | | |
Period end | | | | | | | | | | | | | | | | | | | | | | | | | | | | | | | | | | | | | | | | | | | | |
Total loans and leases | | $ | 99,307 | | | | | $ | 89,004 | | | | | | | $ | 99,307 | | | | | $ | 100,878 | | | | | $ | 102,766 | | | | | $ | 89,401 | | | | | $ | 89,004 | | | |
Total earning assets(3) | | | 217,937 | | | | | | 170,735 | | | | | | | | 217,937 | | | | | | 203,110 | | | | | | 238,271 | | | | | | 179,319 | | | | | | 170,735 | | | |
Total assets(3) | | | 249,110 | | | | | | 180,499 | | | | | | | | 249,110 | | | | | | 233,662 | | | | | | 268,557 | | | | | | 189,073 | | | | | | 180,499 | | | |
Total deposits | | | 220,482 | | | | | | 167,426 | | | | | | | | 220,482 | | | | | | 207,581 | | | | | | 242,634 | | | | | | 176,186 | | | | | | 167,426 | | | |
| | | | | | | | | | | | | | | |
Client assets | | | | | | | | | | | | | | | | | | | | | | | | | | | | | | | | | | | | | | | | | | | | |
Assets under management | | $ | 739,831 | | | | | $ | 564,438 | | | | | | | $ | 739,831 | | | | | $ | 705,216 | | | | | $ | 697,371 | | | | | $ | 523,159 | | | | | $ | 564,438 | | | |
Client brokerage assets(4) | | | 1,235,483 | | | | | | 196,566 | | | | | | | | 1,235,483 | | | | | | 1,164,171 | | | | | | 1,102,633 | | | | | | 172,106 | | | | | | 196,566 | | | |
Assets in custody | | | 269,233 | | | | | | 150,575 | | | | | | | | 269,233 | | | | | | 252,830 | | | | | | 234,361 | | | | | | 133,726 | | | | | | 150,575 | | | |
Less: Client brokerage assets and assets in custody included in assets under management | | | (323,151 | ) | | | | | (82,921 | ) | | | | | | | (323,151 | ) | | | | | (297,869 | ) | | | | | (279,130 | ) | | | | | (78,487 | ) | | | | | (82,921 | ) | | |
| | | | | | | | | | | | | | | | | | | | | | | | | | | | | | | | | | | | | | | | | | | | |
Total net client assets | | $ | 1,921,396 | | | | | $ | 828,658 | | | | | | | $ | 1,921,396 | | | | | $ | 1,824,348 | | | | | $ | 1,755,235 | | | | | $ | 750,504 | | | | | $ | 828,658 | | | |
| | | | | | | | | | | | | | | | | | | | | | | | | | | | | | | | | | | | | | | | | | | | |
| (1) | GWIM services clients through three primary businesses: Merrill Lynch Global Wealth Management (MLGWM), U.S. Trust, Bank of America Private Wealth Management (U.S. Trust), and Columbia Management (Columbia). |
| (2) | Fully taxable-equivalent basis |
| (3) | Total earning assets and total assets include asset allocations to match liabilities (i.e., deposits). |
| (4) | Client brokerage assets include non-discretionary brokerage and fee-based assets. |
Certain prior period amounts have been reclassified among the segments to conform to the current period presentation.
Information for periods beginning July 1, 2008 includes the Countrywide acquisition. Information for periods beginning January 1, 2009 includes the
Merrill Lynch acquisition. Prior periods have not been restated.
| | |
| This information is preliminary and based on company data available at the time of the presentation. | | 28 |
Bank of America Corporation and Subsidiaries
Global Wealth & Investment Management Business Results
(Dollars in millions)
| | | | | | | | | | | | | | | | | | | | | | | | | | | | |
| | | Three Months Ended September 30, 2009 | |
| | | Total | | | | | Merrill Lynch
Global Wealth
Management (1, 2) | | | | | U.S. Trust | | | | | Columbia
Management | | | | | Other (3) | |
Net interest income(4) | | $ | 1,330 | | | | | $ | 1,088 | | | | | $ | 328 | | | | | $ | 9 | | | | | $ | (95 | ) |
Noninterest income: | | | | | | | | | | | | | | | | | | | | | | | | | | | | |
Investment and brokerage services | | | 2,328 | | | | | | 1,542 | | | | | | 310 | | | | | | 277 | | | | | | 199 | |
All other income (loss) | | | 437 | | | | | | 397 | | | | | | 11 | | | | | | (134 | ) | | | | | 163 | |
| | | | | | | | | | | | | | | | | | | | | | | | | | | | |
Total noninterest income | | | 2,765 | | | | | | 1,939 | | | | | | 321 | | | | | | 143 | | | | | | 362 | |
| | | | | | | | | | | | | | | | | | | | | | | | | | | | |
Total revenue, net of interest expense | | | 4,095 | | | | | | 3,027 | | | | | | 649 | | | | | | 152 | | | | | | 267 | |
Provision for credit losses | | | 515 | | | | | | 262 | | | | | | 253 | | | | | | — | | | | | | — | |
Noninterest expense | | | 3,169 | | | | | | 2,273 | | | | | | 478 | | | | | | 228 | | | | | | 190 | |
| | | | | | | | | | | | | | | | | | | | | | | | | | | | |
Income (loss) before income taxes | | | 411 | | | | | | 492 | | | | | | (82 | ) | | | | | (76 | ) | | | | | 77 | |
| | | | | | | | | |
Income tax expense (benefit) (4) | | | 140 | | | | | | 182 | | | | | | (30 | ) | | | | | (28 | ) | | | | | 16 | |
| | | | | | | | | | | | | | | | | | | | | | | | | | | | |
Net income (loss) | | $ | 271 | | | | | $ | 310 | | | | | $ | (52 | ) | | | | $ | (48 | ) | | | | $ | 61 | |
| | | | | | | | | | | | | | | | | | | | | | | | | | | | |
Net interest yield(4) | | | 2.54 | | | % | | | 2.52 | | | % | | | 2.48 | | | % | | | n/m | | | | | | n/m | |
Return on average equity | | | 5.61 | | | | | | 14.71 | | | | | | n/m | | | | | | n/m | | | | | | n/m | |
| | | | | | | | | |
Efficiency ratio(4) | | | 77.38 | | | | | | 75.15 | | | | | | 73.63 | | | % | | | n/m | | | | | | n/m | |
Average - total loans and leases | | $ | 101,181 | | | | | $ | 48,750 | | | | | $ | 52,431 | | | | | | n/m | | | | | | n/m | |
Average - total deposits | | | 214,994 | | | | | | 174,057 | | | | | | 39,334 | | | | | | n/m | | | | | | n/m | |
| | | | | | | | | |
Period end - total assets(5) | | | 249,110 | | | | | | 194,322 | | | | | | 55,574 | | | | | $ | 3,137 | | | | | | n/m | |
| |
| | | Three Months Ended June 30, 2009 | |
| | | Total | | | | | Merrill Lynch
Global Wealth
Management(1, 2) | | | | | U.S. Trust | | | | | Columbia
Management | | | | | Other(3) | |
Net interest income(4) | | $ | 1,292 | | | | | $ | 1,050 | | | | | $ | 339 | | | | | $ | 10 | | | | | $ | (107 | ) |
Noninterest income: | | | | | | | | | | | | | | | | | | | | | | | | | | | | |
Investment and brokerage services | | | 2,231 | | | | | | 1,436 | | | | | | 331 | | | | | | 270 | | | | | | 194 | |
All other income | | | 647 | | | | | | 468 | | | | | | 10 | | | | | | 54 | | | | | | 115 | |
| | | | | | | | | | | | | | | | | | | | | | | | | | | | |
Total noninterest income | | | 2,878 | | | | | | 1,904 | | | | | | 341 | | | | | | 324 | | | | | | 309 | |
| | | | | | | | | | | | | | | | | | | | | | | | | | | | |
Total revenue, net of interest expense | | | 4,170 | | | | | | 2,954 | | | | | | 680 | | | | | | 334 | | | | | | 202 | |
Provision for credit losses | | | 238 | | | | | | 154 | | | | | | 84 | | | | | | — | | | | | | — | |
Noninterest expense | | | 3,297 | | | | | | 2,408 | | | | | | 486 | | | | | | 220 | | | | | | 183 | |
| | | | | | | | | | | | | | | | | | | | | | | | | | | | |
Income before income taxes | | | 635 | | | | | | 392 | | | | | | 110 | | | | | | 114 | | | | | | 19 | |
| | | | | | | | | |
Income tax expense (benefit) (4) | | | 206 | | | | | | 145 | | | | | | 41 | | | | | | 42 | | | | | | (22 | ) |
| | | | | | | | | | | | | | | | | | | | | | | | | | | | |
Net income | | $ | 429 | | | | | $ | 247 | | | | | $ | 69 | | | | | $ | 72 | | | | | $ | 41 | |
| | | | | | | | | | | | | | | | | | | | | | | | | | | | |
| | | | | | | | | |
Net interest yield(4) | | | 2.53 | | | % | | | 2.47 | | | % | | | 2.56 | | | % | | | n/m | | | | | | n/m | |
Return on average equity | | | 9.19 | | | | | | 12.59 | | | | | | 5.49 | | | | | | 41.03 | | | % | | | n/m | |
| | | | | | | | | |
Efficiency ratio(4) | | | 79.06 | | | | | | 81.47 | | | | | | 71.45 | | | | | | n/m | | | | | | n/m | |
Average - total loans and leases | | $ | 101,748 | | | | | $ | 48,843 | | | | | $ | 52,901 | | | | | | n/m | | | | | | n/m | |
Average - total deposits | | | 215,383 | | | | | | 176,859 | | | | | | 38,490 | | | | | | n/m | | | | | | n/m | |
| | | | | | | | | |
Period end - total assets(5) | | | 233,662 | | | | | | 183,464 | | | | | | 56,738 | | | | | $ | 2,647 | | | | | | n/m | |
| |
| | | Three Months Ended September 30, 2008 | |
| | | Total | | | | | Merrill Lynch
Global Wealth
Management(1, 2) | | | | | U.S. Trust | | | | | Columbia
Management | | | | | Other | |
Net interest income(4) | | $ | 1,271 | | | | | $ | 857 | | | | | $ | 414 | | | | | $ | — | | | | | $ | — | |
Noninterest income: | | | | | | | | | | | | | | | | | | | | | | | | | | | | |
Investment and brokerage services | | | 1,002 | | | | | | 241 | | | | | | 328 | | | | | | 394 | | | | | | 39 | |
All other income (loss) | | | (703 | ) | | | | | (56 | ) | | | | | (13 | ) | | | | | (636 | ) | | | | | 2 | |
| | | | | | | | | | | | | | | | | | | | | | | | | | | | |
Total noninterest income | | | 299 | | | | | | 185 | | | | | | 315 | | | | | | (242 | ) | | | | | 41 | |
| | | | | | | | | | | | | | | | | | | | | | | | | | | | |
Total revenue, net of interest expense | | | 1,570 | | | | | | 1,042 | | | | | | 729 | | | | | | (242 | ) | | | | | 41 | |
Provision for credit losses | | | 150 | | | | | | 135 | | | | | | 15 | | | | | | — | | | | | | — | |
Noninterest expense | | | 1,286 | | | | | | 454 | | | | | | 488 | | | | | | 323 | | | | | | 21 | |
| | | | | | | | | | | | | | | | | | | | | | | | | | | | |
Income (loss) before income taxes | | | 134 | | | | | | 453 | | | | | | 226 | | | | | | (565 | ) | | | | | 20 | |
Income tax expense (benefit)(4) | | | 54 | | | | | | 168 | | | | | | 84 | | | | | | (209 | ) | | | | | 11 | |
| | | | | | | | | | | | | | | | | | | | | | | | | | | | |
Net income (loss) | | $ | 80 | | | | | $ | 285 | | | | | $ | 142 | | | | | $ | (356 | ) | | | | $ | 9 | |
| | | | | | | | | | | | | | | | | | | | | | | | | | | | |
Net interest yield(4) | | | 3.08 | | | % | | | 2.72 | | | % | | | 3.09 | | | % | | | n/m | | | | | | n/m | |
| | | | | | | | | |
Return on average equity | | | 2.74 | | | | | | 34.82 | | | | | | 11.95 | | | | | | n/m | | | | | | n/m | |
| | | | | | | | | |
Efficiency ratio(4) | | | 81.90 | | | | | | 43.61 | | | | | | 66.98 | | | | | | n/m | | | | | | n/m | |
Average - total loans and leases | | $ | 88,255 | | | | | $ | 35,077 | | | | | $ | 53,175 | | | | | | n/m | | | | | | n/m | |
Average - total deposits | | | 162,192 | | | | | | 123,528 | | | | | | 38,655 | | | | | | n/m | | | | | | n/m | |
Period end - total assets(5) | | | 180,499 | | | | | | 129,616 | | | | | | 57,627 | | | | | $ | 3,084 | | | | | | n/m | |
| (1) | MLGWM includes the net impact of migrating customers, and their related deposit and loan balances, to or from Deposits and Home Loans & Insurance. After migration, the associated net interest income, noninterest income and noninterest expense are recorded in the applicable segment. During the three months ended September 30, 2009 and June 30, 2009, total deposits of $2.9 billion and $34.3 billion were migrated to Deposits from MLGWM. During the three months ended September 30, 2008, total deposits of $3.3 billion were migrated from Deposits to MLGWM. In addition, during the three months ended September 30, 2009, June 30, 2009 and September 30, 2008, total loans of $2.4 billion, $3.5 billion and $148 million, respectively, were migrated to Home Loans & Insurance from MLGWM. |
| (2) | Effective January 1, 2009, as a result of the Merrill Lynch acquisition, we combined Merrill Lynch’s wealth management business and our former Premier Banking & Investment business to form MLGWM. |
| (3) | Other includes the results of the Institutional Retirement, Philanthropy & Investments business, the Corporation’s approximately 50 percent economic ownership of BlackRock and other miscellaneous items. |
| (4) | Fully taxable-equivalent basis |
| (5) | Total assets include asset allocations to match liabilities (i.e., deposits). |
n/m = not meaningful
Certain prior period amounts have been reclassified among the segments to conform to the current period presentation.
Information for periods beginning July 1, 2008 includes the Countrywide acquisition. Information for periods beginning January 1, 2009 includes the
Merrill Lynch acquisition. Prior periods have not been restated.
| | |
| This information is preliminary and based on company data available at the time of the presentation. | | 29 |
Bank of America Corporation and Subsidiaries
Global Wealth & Investment Management Business Results
(Dollars in millions)
| | | | | | | | | | | | | | | | | | | | | | | | |
| | | Nine Months Ended September 30, 2009 | |
| | | Total | | | | | Merrill Lynch
Global Wealth
Management (1, 2) | | | | U.S. Trust | | | | Columbia
Management | | | Other (3) | |
| | | | | | | | |
Net interest income(4) | | $ | 4,280 | | | | | $ | 3,533 | | | | $ | 1,026 | | | | $ | 31 | | | $ | (310 | ) |
Noninterest income: | | | | | | | | | | | | | | | | | | | | | | | | |
Investment and brokerage services | | | 6,869 | | | | | | 4,516 | | | | | 958 | | | | | 807 | | | | 588 | |
All other income (loss) | | | 1,457 | | | | | | 1,246 | | | | | 37 | | | | | (203 | ) | | | 377 | |
| | | | | | | | | | | | | | | | | | | | | | | | |
Total noninterest income | | | 8,326 | | | | | | 5,762 | | | | | 995 | | | | | 604 | | | | 965 | |
| | | | | | | | | | | | | | | | | | | | | | | | |
Total revenue, net of interest expense | | | 12,606 | | | | | | 9,295 | | | | | 2,021 | | | | | 635 | | | | 655 | |
Provision for credit losses | | | 1,007 | | | | | | 639 | | | | | 368 | | | | | — | | | | — | |
Noninterest expense | | | 9,747 | | | | | | 7,020 | | | | | 1,475 | | | | | 681 | | | | 571 | |
| | | | | | | | | | | | | | | | | | | | | | | | |
Income (loss) before income taxes | | | 1,852 | | | | | | 1,636 | | | | | 178 | | | | | (46 | ) | | | 84 | |
| | | | | | | | |
Income tax expense (benefit) (4) | | | 650 | | | | | | 605 | | | | | 66 | | | | | (17 | ) | | | (4 | ) |
| | | | | | | | | | | | | | | | | | | | | | | | |
Net income (loss) | | $ | 1,202 | | | | | $ | 1,031 | | | | $ | 112 | | | | $ | (29 | ) | | $ | 88 | |
| | | | | | | | | | | | | | | | | | | | | | | | |
| | | | | | | | |
Net interest yield(4) | | | 2.62 | | | % | | | 2.57 | | % | | | 2.59 | | % | | | n/m | | | | n/m | |
Return on average equity | | | 8.75 | | | | | | 17.93 | | | | | 2.96 | | | | | n/m | | | | n/m | |
| | | | | | | | |
Efficiency ratio(4) | | | 77.32 | | | | | | 75.53 | | | | | 72.96 | | | | | n/m | | | | n/m | |
Average - total loans and leases | | $ | 104,454 | | | | | $ | 51,731 | | | | $ | 52,720 | | | | | n/m | | | | n/m | |
Average - total deposits | | | 226,967 | | | | | | 187,317 | | | | | 39,089 | | | | | n/m | | | | n/m | |
| | | | | | | | |
Period end - total assets(5) | | | 249,110 | | | | | | 194,322 | | | | | 55,574 | | | | $ | 3,137 | | | | n/m | |
| |
| | | Nine Months Ended September 30, 2008 | |
| | | Total | | | | | Merrill Lynch
Global Wealth
Management(1, 2) | | | | U.S. Trust | | | | Columbia
Management | | | Other | |
Net interest income(4) | | $ | 3,449 | | | | | $ | 2,327 | | | | $ | 1,119 | | | | $ | (7 | ) | | $ | 10 | |
Noninterest income: | | | | | | | | | | | | | | | | | | | | | | | | |
Investment and brokerage services | | | 3,178 | | | | | | 763 | | | | | 1,095 | | | | | 1,195 | | | | 125 | |
All other income (loss) | | | (808 | ) | | | | | 58 | | | | | 23 | | | | | (890 | ) | | | 1 | |
| | | | | | | | | | | | | | | | | | | | | | | | |
Total noninterest income | | | 2,370 | | | | | | 821 | | | | | 1,118 | | | | | 305 | | | | 126 | |
| | | | | | | | | | | | | | | | | | | | | | | | |
Total revenue, net of interest expense | | | 5,819 | | | | | | 3,148 | | | | | 2,237 | | | | | 298 | | | | 136 | |
Provision for credit losses | | | 512 | | | | | | 487 | | | | | 25 | | | | | — | | | | — | |
Noninterest expense | | | 3,841 | | | | | | 1,386 | | | | | 1,458 | | | | | 935 | | | | 62 | |
| | | | | | | | | | | | | | | | | | | | | | | | |
Income (loss) before income taxes | | | 1,466 | | | | | | 1,275 | | | | | 754 | | | | | (637 | ) | | | 74 | |
| | | | | | | | |
Income tax expense (benefit)(4) | | | 553 | | | | | | 472 | | | | | 279 | | | | | (236 | ) | | | 38 | |
| | | | | | | | | | | | | | | | | | | | | | | | |
Net income (loss) | | $ | 913 | | | | | $ | 803 | | | | $ | 475 | | | | $ | (401 | ) | | $ | 36 | |
| | | | | | | | | | | | | | | | | | | | | | | | |
| | | | | | | | |
Net interest yield(4) | | | 2.94 | | | % | | | 2.58 | | % | | | 2.95 | | % | | | n/m | | | | n/m | |
Return on average equity | | | 10.44 | | | | | | 32.20 | | | | | 13.67 | | | | | n/m | | | | n/m | |
| | | | | | | | |
Efficiency ratio(4) | | | 66.01 | | | | | | 44.01 | | | | | 65.17 | | | | | n/m | | | | n/m | |
Average - total loans and leases | | $ | 87,162 | | | | | $ | 36,416 | | | | $ | 50,728 | | | | | n/m | | | | n/m | |
Average - total deposits | | | 156,762 | | | | | | 119,092 | | | | | 37,400 | | | | | n/m | | | | n/m | |
| | | | | | | | |
Period end - total assets(5) | | | 180,499 | | | | | | 129,616 | | | | | 57,627 | | | | $ | 3,084 | | | | n/m | |
| | | | | | | | | | | | | | | | | | | | | | | | |
| (1) | MLGWM includes the net impact of migrating customers, and their related deposit and loan balances, to or from Deposits and Home Loans & Insurance. After migration, the associated net interest income, noninterest income and noninterest expense are recorded in the applicable segment. During the nine months ended September 30, 2009, total deposits of $43.4 billion migrated to Deposits from MLGWM. During the nine months ended September 30, 2008, total deposits of $15.9 billion were migrated from Deposits to MLGWM. In addition, during the nine months ended September 30, 2009 and 2008, total loans of $16.1 billion and $2.1 billion were migrated to Home Loans & Insurance from MLGWM. |
| (2) | Effective January 1, 2009, as a result of the Merrill Lynch acquisition, we combined Merrill Lynch’s wealth management business and our former Premier Banking & Investment business to form MLGWM. |
| (3) | Other includes the results of the Institutional Retirement, Philanthropy & Investments business, the Corporation’s approximately 50 percent economic ownership of BlackRock and other miscellaneous items. |
| (4) | Fully taxable-equivalent basis |
| (5) | Total assets include asset allocations to match liabilities (i.e., deposits). |
n/m = not meaningful
Certain prior period amounts have been reclassified among the segments to conform to the current period presentation.
Information for periods beginning July 1, 2008 includes the Countrywide acquisition. Information for periods beginning January 1, 2009 includes the
Merrill Lynch acquisition. Prior periods have not been restated.
| | |
| This information is preliminary and based on company data available at the time of the presentation. | | 30 |
Bank of America Corporation and Subsidiaries
Global Wealth & Investment Management - Key Indicators
(Dollars in millions, except as noted)
| | | | | | | | | | | | | | | | | | | | | | | | | | | | | | | | | | | | | | | | | | | | |
| | | Nine Months Ended
September 30 | | | | | | | Third
Quarter
2009 | | | | | Second
Quarter
2009 | | | | | First
Quarter
2009 | | | | | Fourth
Quarter
2008 | | | | | Third
Quarter
2008 | | | |
| | | 2009 | | | | | 2008 | | | | | | | | | | | | | | | |
Investment and Brokerage Services | | | | | | | | | | | | | | | | | | | | | | | | | | | | | | | | | | | | | | | | | | | | |
Merrill Lynch Global Wealth Management | | | | | | | | | | | | | | | | | | | | | | | | | | | | | | | | | | | | | | | | | | | | |
Asset management fees | | $ | 2,267 | | | | | $ | 256 | | | | | | | $ | 762 | | | | | $ | 717 | | | | | $ | 788 | | | | | $ | 75 | | | | | $ | 84 | | | |
Brokerage income | | | 2,249 | | | | | | 507 | | | | | | | | 780 | | | | | | 719 | | | | | | 750 | | | | | | 163 | | | | | | 157 | | | |
| | | | | | | | | | | | | | | | | | | | | | | | | | | | | | | | | | | | | | | | | | | | |
Total | | $ | 4,516 | | | | | $ | 763 | | | | | | | $ | 1,542 | | | | | $ | 1,436 | | | | | $ | 1,538 | | | | | $ | 238 | | | | | $ | 241 | | | |
| | | | | | | | | | | | | | | | | | | | | | | | | | | | | | | | | | | | | | | | | | | | |
| | | | | | | | | | | | | | | |
U.S. Trust | | | | | | | | | | | | | | | | | | | | | | | | | | | | | | | | | | | | | | | | | | | | |
Asset management fees | | $ | 935 | | | | | $ | 1,059 | | | | | | | $ | 303 | | | | | $ | 325 | | | | | $ | 307 | | | | | $ | 292 | | | | | $ | 317 | | | |
Brokerage income | | | 23 | | | | | | 36 | | | | | | | | 7 | | | | | | 6 | | | | | | 10 | | | | | | 12 | | | | | | 11 | | | |
| | | | | | | | | | | | | | | | | | | | | | | | | | | | | | | | | | | | | | | | | | | | |
Total | | $ | 958 | | | | | $ | 1,095 | | | | | | | $ | 310 | | | | | $ | 331 | | | | | $ | 317 | | | | | $ | 304 | | | | | $ | 328 | | | |
| | | | | | | | | | | | | | | | | | | | | | | | | | | | | | | | | | | | | | | | | | | | |
| | | | | | | | | | | | | | | |
Columbia Management | | | | | | | | | | | | | | | | | | | | | | | | | | | | | | | | | | | | | | | | | | | | |
Asset management fees | | $ | 806 | | | | | $ | 1,193 | | | | | | | $ | 276 | | | | | $ | 270 | | | | | $ | 260 | | | | | $ | 301 | | | | | $ | 394 | | | |
Brokerage income | | | 1 | | | | | | 2 | | | | | | | | 1 | | | | | | — | | | | | | — | | | | | | — | | | | | | — | | | |
| | | | | | | | | | | | | | | | | | | | | | | | | | | | | | | | | | | | | | | | | | | | |
Total | | $ | 807 | | | | | $ | 1,195 | | | | | | | $ | 277 | | | | | $ | 270 | | | | | $ | 260 | | | | | $ | 301 | | | | | $ | 394 | | | |
| | | | | | | | | | | | | | | | | | | | | | | | | | | | | | | | | | | | | | | | | | | | |
| | | | | | | | | | | | | | | |
Other | | | | | | | | | | | | | | | | | | | | | | | | | | | | | | | | | | | | | | | | | | | | |
Asset management fees | | $ | 343 | | | | | $ | 125 | | | | | | | $ | 114 | | | | | $ | 113 | | | | | $ | 116 | | | | | $ | 37 | | | | | $ | 39 | | | |
Brokerage income | | | 245 | | | | | | — | | | | | | | | 85 | | | | | $ | 81 | | | | | | 79 | | | | | | — | | | | | | — | | | |
| | | | | | | | | | | | | | | | | | | | | | | | | | | | | | | | | | | | | | | | | | | | |
Total | | $ | 588 | | | | | $ | 125 | | | | | | | $ | 199 | | | | | $ | 194 | | | | | $ | 195 | | | | | $ | 37 | | | | | $ | 39 | | | |
| | | | | | | | | | | | | | | | | | | | | | | | | | | | | | | | | | | | | | | | | | | | |
| | | | | | | | | | | | | | | |
Total Global Wealth & Investment Management | | | | | | | | | | | | | | | | | | | | | | | | | | | | | | | | | | | | | | | | | | | | |
Asset management fees | | $ | 4,351 | | | | | $ | 2,633 | | | | | | | $ | 1,455 | | | | | $ | 1,425 | | | | | $ | 1,471 | | | | | $ | 705 | | | | | $ | 834 | | | |
Brokerage income | | | 2,518 | | | | | | 545 | | | | | | | | 873 | | | | | | 806 | | | | | | 839 | | | | | | 175 | | | | | | 168 | | | |
| | | | | | | | | | | | | | | | | | | | | | | | | | | | | | | | | | | | | | | | | | | | |
Total investment and brokerage services | | $ | 6,869 | | | | | $ | 3,178 | | | | | | | $ | 2,328 | | | | | $ | 2,231 | | | | | $ | 2,310 | | | | | $ | 880 | | | | | $ | 1,002 | | | |
| | | | | | | | | | | | | | | | | | | | | | | | | | | | | | | | | | | | | | | | | | | | |
| | | | | | | | | | | | | | | |
Assets Under Management | | | | | | | | | | | | | | | | | | | | | | | | | | | | | | | | | | | | | | | | | | | | |
Assets under management by business: | | | | | | | | | | | | | | | | | | | | | | | | | | | | | | | | | | | | | | | | | | | | |
Merrill Lynch Global Wealth Management | | $ | 268,107 | | | | | $ | 20,246 | | | | | | | $ | 268,107 | | | | | $ | 239,888 | | | | | $ | 219,658 | | | | | $ | 16,682 | | | | | $ | 20,246 | | | |
U.S. Trust | | | 187,964 | | | | | | 199,682 | | | | | | | | 187,964 | | | | | | 180,902 | | | | | | 179,142 | | | | | | 178,657 | | | | | | 199,682 | | | |
Columbia Management | | | 329,103 | | | | | | 407,345 | | | | | | | | 329,103 | | | | | | 331,810 | | | | | | 340,692 | | | | | | 386,473 | | | | | | 407,345 | | | |
Institutional Retirement, Philanthropy & Investments | | | 44,437 | | | | | | 39,547 | | | | | | | | 44,437 | | | | | | 39,298 | | | | | | 45,304 | | | | | | 33,498 | | | | | | 39,547 | | | |
Eliminations(1) | | | (89,915 | ) | | | | | (102,621 | ) | | | | | | | (89,915 | ) | | | | | (86,811 | ) | | | | | (87,550 | ) | | | | | (92,298 | ) | | | | | (102,621 | ) | | |
International Wealth Management | | | 135 | | | | | | 239 | | | | | | | | 135 | | | | | | 129 | | | | | | 125 | | | | | | 147 | | | | | | 239 | | | |
| | | | | | | | | | | | | | | | | | | | | | | | | | | | | | | | | | | | | | | | | | | | |
Total assets under management | | $ | 739,831 | | | | | $ | 564,438 | | | | | | | $ | 739,831 | | | | | $ | 705,216 | | | | | $ | 697,371 | | | | | $ | 523,159 | | | | | $ | 564,438 | | | |
| | | | | | | | | | | | | | | | | | | | | | | | | | | | | | | | | | | | | | | | | | | | |
| | | | | | | | | | | | | | | |
Assets under management rollforward: | | | | | | | | | | | | | | | | | | | | | | | | | | | | | | | | | | | | | | | | | | | | |
Beginning balance | | $ | 523,159 | | | | | $ | 643,531 | | | | | | | $ | 705,216 | | | | | $ | 697,371 | | | | | $ | 523,159 | | | | | $ | 564,438 | | | | | $ | 589,459 | | | |
Merrill Lynch balance, January 1, 2009 | | | 246,292 | | | | | | — | | | | | | | | — | | | | | | — | | | | | | 246,292 | | | | | | — | | | | | | — | | | |
Net flows | | | (88,063 | ) | | | | | (11,399 | ) | | | | | | | (17,757 | ) | | | | | (27,071 | ) | | | | | (43,235 | ) | | | | | 12,596 | | | | | | 7,477 | | | |
Market valuation/other | | | 58,443 | | | | | | (67,694 | ) | | | | | | | 52,372 | | | | | | 34,916 | | | | | | (28,845 | ) | | | | | (53,875 | ) | | | | | (32,498 | ) | | |
| | | | | | | | | | | | | | | | | | | | | | | | | | | | | | | | | | | | | | | | | | | | |
Ending balance | | $ | 739,831 | | | | | $ | 564,438 | | | | | | | $ | 739,831 | | | | | $ | 705,216 | | | | | $ | 697,371 | | | | | $ | 523,159 | | | | | $ | 564,438 | | | |
| | | | | | | | | | | | | | | | | | | | | | | | | | | | | | | | | | | | | | | | | | | | |
| | | | | | | | | | | | | | | |
Assets under management mix: | | | | | | | | | | | | | | | | | | | | | | | | | | | | | | | | | | | | | | | | | | | | |
Money market/other | | $ | 193,593 | | | | | $ | 238,075 | | | | | | | $ | 193,593 | | | | | $ | 215,637 | | | | | $ | 244,577 | | | | | $ | 253,310 | | | | | $ | 238,075 | | | |
Fixed income | | | 221,963 | | | | | | 102,596 | | | | | | | | 221,963 | | | | | | 204,974 | | | | | | 198,177 | | | | | | 102,747 | | | | | | 102,596 | | | |
Equity | | | 324,275 | | | | | | 223,767 | | | | | | | | 324,275 | | | | | | 284,605 | | | | | | 254,617 | | | | | | 167,102 | | | | | | 223,767 | | | |
| | | | | | | | | | | | | | | | | | | | | | | | | | | | | | | | | | | | | | | | | | | | |
Total assets under management | | $ | 739,831 | | | | | $ | 564,438 | | | | | | | $ | 739,831 | | | | | $ | 705,216 | | | | | $ | 697,371 | | | | | $ | 523,159 | | | | | $ | 564,438 | | | |
| | | | | | | | | | | | | | | | | | | | | | | | | | | | | | | | | | | | | | | | | | | | |
| | | | | | | | | | | | | | | |
Assets under management - domestic and foreign: | | | | | | | | | | | | | | | | | | | | | | | | | | | | | | | | | | | | | | | | | | | | |
Domestic | | $ | 717,289 | | | | | $ | 564,199 | | | | | | | $ | 717,289 | | | | | $ | 685,492 | | | | | $ | 679,927 | | | | | $ | 523,012 | | | | | $ | 564,199 | | | |
Foreign | | | 22,542 | | | | | | 239 | | | | | | | | 22,542 | | | | | | 19,724 | | | | | | 17,444 | | | | | | 147 | | | | | | 239 | | | |
| | | | | | | | | | | | | | | | | | | | | | | | | | | | | | | | | | | | | | | | | | | | |
Total assets under management | | $ | 739,831 | | | | | $ | 564,438 | | | | | | | $ | 739,831 | | | | | $ | 705,216 | | | | | $ | 697,371 | | | | | $ | 523,159 | | | | | $ | 564,438 | | | |
| | | | | | | | | | | | | | | | | | | | | | | | | | | | | | | | | | | | | | | | | | | | |
| | | | | | | | | | | | | | | |
Client Brokerage Assets(2) | | $ | 1,235,483 | | | | | $ | 196,566 | | | | | | | $ | 1,235,483 | | | | | $ | 1,164,171 | | | | | $ | 1,102,633 | | | | | $ | 172,106 | | | | | $ | 196,566 | | | |
| | | | | | | | | | | | | | | |
Merrill Lynch Global Wealth Management Metrics | | | | | | | | | | | | | | | | | | | | | | | | | | | | | | | | | | | | | | | | | | | | |
| | | | | | | | | | | | | | | |
Number of financial advisors | | | 14,979 | | | | | | 1,964 | | | | | | | | 14,979 | | | | | | 15,008 | | | | | | 15,822 | | | | | | 2,007 | | | | | | 1,964 | | | |
| | | | | | | | | | | | | | | |
Financial Advisor Productivity(3) (in thousands) | | $ | 812 | | | | | $ | 1,678 | | | | | | | $ | 824 | | | | | $ | 809 | | | | | $ | 803 | | | | | $ | 1,576 | | | | | $ | 1,496 | | | |
| | | | | | | | | | | | | | | |
Total client balances(4) | | $ | 1,400,438 | | | | | $ | 301,093 | | | | | | | $ | 1,400,438 | | | | | $ | 1,321,502 | | | | | $ | 1,292,965 | | | | | $ | 290,661 | | | | | $ | 301,093 | | | |
| | | | | | | | | | | | | | | |
U.S. Trust Metrics | | | | | | | | | | | | | | | | | | | | | | | | | | | | | | | | | | | | | | | | | | | | |
| | | | | | | | | | | | | | | |
Client facing associates | | | 3,944 | | | | | | 4,467 | | | | | | | | 3,944 | | | | | | 3,968 | | | | | | 4,015 | | | | | | 4,473 | | | | | | 4,467 | | | |
| | | | | | | | | | | | | | | |
Total client balances(4) | | $ | 314,937 | | | | | $ | 344,004 | | | | | | | $ | 314,937 | | | | | $ | 301,512 | | | | | $ | 301,151 | | | | | $ | 308,366 | | | | | $ | 344,004 | | | |
| | | | | | | | | | | | | | | |
Columbia Management Performance Metrics | | | | | | | | | | | | | | | | | | | | | | | | | | | | | | | | | | | | | | | | | | | | |
| | | | | | | | | | | | | | | |
# of 4 or 5 Star Funds by Morningstar | | | 39 | | | | | | 53 | | | | | | | | 39 | | | | | | 47 | | | | | | 49 | | | | | | 53 | | | | | | 53 | | | |
| | | | | | | | | | | | | | | |
% of Assets Under Management in 4 or 5 Star Rated Funds(5) | | | 51 | | | % | | | 64 | | | % | | | | | 51 | | | % | | | 46 | | | % | | | 49 | | | % | | | 62 | | | % | | | 64 | | | % |
| (1) | The elimination of assets under management that are managed by two lines of business. |
| (2) | The January 1, 2009 acquisition of Merrill Lynch contributed $1.0 trillion to client brokerage assets. |
| (3) | Financial advisor productivity is defined as annualized total revenue (excluding residual net interest income) divided by the total number of financial advisors. The decline in Financial Advisor Productivity in the first quarter 2009 compared to previous quarters results from the inclusion of Merrill Lynch financial advisors. Legacy Bank of America financial advisors historically have had higher amounts of credit and banking activity in their portfolios. |
| (4) | Client balances are defined as deposits, assets under management, client brokerage assets and other assets in custody. |
| (5) | Results shown are defined by Columbia Management’s calculation using Morningstar’s Overall Rating criteria for 4 & 5 star rating. The assets under management of the Columbia Funds that had a 4 & 5 star rating were totaled then divided by the assets under management of all the funds in the ranking. |
Certain prior period amounts have been reclassified among the segments to conform to the current period presentation.
Information for periods beginning July 1, 2008 includes the Countrywide acquisition. Information for periods beginning January 1, 2009 includes the
Merrill Lynch acquisition. Prior periods have not been restated.
| | |
| This information is preliminary and based on company data available at the time of the presentation. | | 31 |
Bank of America Corporation and Subsidiaries
All Other Results(1, 2)
(Dollars in millions)
| | | | | | | | | | | | | | | | | | | | | | | | | | | | | | |
| | | Nine Months Ended
September 30 | | | | | Third
Quarter
2009 | | | Second
Quarter
2009 | | | First
Quarter
2009 | | | Fourth
Quarter
2008 | | | Third
Quarter
2008 | |
| | | 2009 | | | 2008 | | | | | | | |
Net interest income(3) | | $ | (5,399 | ) | | $ | (6,143 | ) | | | | $ | (1,867 | ) | | $ | (1,622 | ) | | $ | (1,910 | ) | | $ | (1,875 | ) | | $ | (2,342 | ) |
Noninterest income: | | | | | | | | | | | | | | | | | | | | | | | | | | | | | | |
Card income | | | (464 | ) | | | 1,797 | | | | | | (720 | ) | | | (278 | ) | | | 534 | | | | 368 | | | | 538 | |
Equity investment income (loss) | | | 8,191 | | | | 651 | | | | | | 886 | | | | 5,979 | | | | 1,326 | | | | (388 | ) | | | (327 | ) |
Gains (losses) on sales of debt securities | | | 3,584 | | | | 349 | | | | | | 1,441 | | | | 672 | | | | 1,471 | | | | 783 | | | | (3 | ) |
All other income (loss) | | | (4,165 | ) | | | (380 | ) | | | | | (2,371 | ) | | | (4,335 | ) | | | 2,541 | | | | (331 | ) | | | 66 | |
| | | | | | | | | | | | | | | | | | | | | | | | | | | | | | |
Total noninterest income | | | 7,146 | | | | 2,417 | | | | | | (764 | ) | | | 2,038 | | | | 5,872 | | | | 432 | | | | 274 | |
| | | | | | | | | | | | | | | | | | | | | | | | | | | | | | |
Total revenue, net of interest expense | | | 1,747 | | | | (3,726 | ) | | | | | (2,631 | ) | | | 416 | | | | 3,962 | | | | (1,443 | ) | | | (2,068 | ) |
| | | | | | | | |
Provision for credit losses(4) | | | (1,908 | ) | | | (3,158 | ) | | | | | (1,222 | ) | | | (9 | ) | | | (677 | ) | | | (613 | ) | | | (996 | ) |
Merger and restructuring charges | | | 2,188 | | | | 629 | | | | | | 594 | | | | 829 | | | | 765 | | | | 306 | | | | 247 | |
All other noninterest expense | | | 1,439 | | | | 48 | | | | | | 612 | | | | 590 | | | | 237 | | | | 142 | | | | (86 | ) |
| | | | | | | | | | | | | | | | | | | | | | | | | | | | | | |
Income (loss) before income taxes | | | 28 | | | | (1,245 | ) | | | | | (2,615 | ) | | | (994 | ) | | | 3,637 | | | | (1,278 | ) | | | (1,233 | ) |
Income tax expense (benefit)(3) | | | (1,975 | ) | | | (534 | ) | | | | | (983 | ) | | | (1,737 | ) | | | 745 | | | | (748 | ) | | | (540 | ) |
| | | | | | | | | | | | | | | | | | | | | | | | | | | | | | |
Net income (loss) | | $ | 2,003 | | | $ | (711 | ) | | | | $ | (1,632 | ) | | $ | 743 | | | $ | 2,892 | | | $ | (530 | ) | | $ | (693 | ) |
| | | | | | | | | | | | | | | | | | | | | | | | | | | | | | |
| | | | | | | | |
Balance sheet | | | | | | | | | | | | | | | | | | | | | | | |
| | | | | | | | |
Average | | | | | | | | | | | | | | | | | | | | | | | | | | | | | | |
Total loans and leases | | $ | 158,721 | | | $ | 132,615 | | | | | $ | 147,666 | | | $ | 159,144 | | | $ | 169,593 | | | $ | 145,241 | | | $ | 146,305 | |
Total deposits | | | 106,944 | | | | 104,143 | | | | | | 108,244 | | | | 104,382 | | | | 108,208 | | | | 110,471 | | | | 104,370 | |
| | | | | | | | |
Period end | | | | | | | | | | | | | | | | | | | | | | | | | | | | | | |
Total loans and leases | | $ | 145,856 | | | $ | 146,365 | | | | | $ | 145,856 | | | $ | 153,010 | | | $ | 165,535 | | | $ | 136,163 | | | $ | 146,365 | |
Total deposits | | | 94,573 | | | | 99,003 | | | | | | 94,573 | | | | 99,495 | | | | 92,436 | | | | 86,888 | | | | 99,003 | |
| (1) | All Other consists of equity investment activities including Global Principal Investments, Corporate Investments and Strategic Investments, the residential mortgage portfolio associated with ALM activities, the residual impact of cost allocation processes, merger and restructuring charges, intersegment eliminations and the results of certain businesses that are expected to be or have been sold or are in the process of being liquidated. All Other also includes certain amounts associated with ALM activities, including the residual impact of funds transfer pricing allocation methodologies, amounts associated with the change in the value of derivatives used as economic hedges of interest rate and foreign exchange rate fluctuations that are not hedging instruments per GAAP, foreign exchange rate fluctuations related to revaluation of foreign-denominated debt issuances, certain gains (losses) on sales of whole mortgage loans, and gains (losses) on sales of debt securities. All Other also includes adjustments to noninterest income and income tax expense to remove the FTE impact of items (primarily low-income housing tax credits) that have been grossed up within noninterest income to a FTE amount in the business segments. All Other also includes a trust services business which is a client-focused business providing trustee services and fund administration to various financial services companies. In addition, All Other includes the offsetting securitization impact to present Global Card Services on a managed basis. (See Exhibit A: Non-GAAP Reconciliations - All Other - Reconciliation on page 45). |
| (2) | Effective January 1, 2009, as part of the Merrill Lynch acquisition, All Other includes the results of First Republic Bank as well as fair value adjustments related to certain Merrill Lynch structured notes. |
| (3) | Fully taxable-equivalent basis |
| (4) | Provision for credit losses represents provision for credit losses in All Other combined with the Global Card Services securitization offset. |
Certain prior period amounts have been reclassified among the segments to conform to the current period presentation.
Information for periods beginning July 1, 2008 includes the Countrywide acquisition. Information for periods beginning January 1, 2009 includes the
Merrill Lynch acquisition. Prior periods have not been restated.
| | | | |
| | This information is preliminary and based on company data available at the time of the presentation. | | 32 |
Bank of America Corporation and Subsidiaries
Equity Investments
(Dollars in millions)
| | | | | | | | | | | | | | | | | | | | |
| | | Global Principal Investments Exposures | | Equity
Investment
Income
(Loss) | |
| | | September 30, 2009 | | June 30,
2009 | | September 30, 2009 | |
| | | Book
Value | | Unfunded
Commitments | | Total | | Total | | Three months
ended | | | Nine months
ended | |
Global Principal Investments: | | | | | | | | | | | | | | | | | | | | |
Global Private Equity | | $ | 5,232 | | $ | 262 | | $ | 5,494 | | $ | 4,521 | | $ | 769 | | | $ | 813 | |
Global Real Estate | | | 2,416 | | | 392 | | | 2,808 | | | 2,946 | | | (178 | ) | | | (263 | ) |
Global Strategic Capital | | | 4,427 | | | 1,999 | | | 6,426 | | | 6,412 | | | 130 | | | | 37 | |
Legacy/Other Investments | | | 1,377 | | | 80 | | | 1,457 | | | 816 | | | (8 | ) | | | (36 | ) |
| | | | | | | | | | | | | | | | | | | | |
Total Global Principal Investments | | $ | 13,452 | | $ | 2,733 | | $ | 16,185 | | $ | 14,695 | | $ | 713 | | | $ | 551 | |
| | | | | | | | | | | | | | | | | | | | |
Components of Equity Investment Income (Loss)
(Dollars in millions)
| | | | | | | | | | | | | | | | | | | | | | | | | | | | | | |
| | | Nine Months Ended
September 30 | | | | | Third
Quarter
2009 | | | Second
Quarter
2009(1) | | | First
Quarter
2009(1) | | | Fourth
Quarter
2008 | | | Third
Quarter
2008 | |
| | | 2009 | | | 2008 | | | | | | | | |
Global Principal Investments | | $ | 551 | | | $ | 279 | | | | | $ | 713 | | | $ | 304 | | | $ | (466 | ) | | $ | (363 | ) | | $ | (29 | ) |
Corporate Investments | | | (153 | ) | | | (225 | ) | | | | | 109 | | | | 10 | | | | (272 | ) | | | (295 | ) | | | (369 | ) |
Strategic and other investments(1) | | | 7,793 | | | | 597 | | | | | | 64 | | | | 5,665 | | | | 2,064 | | | | 270 | | | | 71 | |
| | | | | | | | | | | | | | | | | | | | | | | | | | | | | | |
Total equity investment income (loss) included in All Other | | | 8,191 | | | | 651 | | | | | | 886 | | | | 5,979 | | | | 1,326 | | | | (388 | ) | | | (327 | ) |
Total equity investment income (loss) included in the business segments | | | (203 | ) | | | 679 | | | | | | (43 | ) | | | (36 | ) | | | (124 | ) | | | (403 | ) | | | 11 | |
| | | | | | | | | | | | | | | | | | | | | | | | | | | | | | |
Total consolidated equity investment income (loss) | | $ | 7,988 | | | $ | 1,330 | | | | | $ | 843 | | | $ | 5,943 | | | $ | 1,202 | | | $ | (791 | ) | | $ | (316 | ) |
| | | | | | | | | | | | | | | | | | | | | | | | | | | | | | |
| (1) | For the three months ended June 30, 2009 and March 31, 2009, strategic and other investments includes a $5.3 billion and $1.9 billion pre-tax gain due to sales of portions of the Corporation’s China Construction Bank investment. |
Certain prior period amounts have been reclassified among the segments to conform to the current period presentation.
Information for periods beginning July 1, 2008 includes the Countrywide acquisition. Information for periods beginning January 1, 2009 includes the
Merrill Lynch acquisition. Prior periods have not been restated.
| | |
| This information is preliminary and based on company data available at the time of the presentation. | | 33 |
Bank of America Corporation and Subsidiaries
Outstanding Loans and Leases
(Dollars in millions)
| | | | | | | | | | |
| | | September 30
2009 | | June 30
2009 | | Increase
(Decrease) | |
Consumer | | | | | | | | | | |
Residential mortgage(1) | | $ | 238,921 | | $ | 245,967 | | $ | (7,046 | ) |
Home equity | | | 152,039 | | | 155,058 | | | (3,019 | ) |
Discontinued real estate(2) | | | 15,460 | | | 17,490 | | | (2,030 | ) |
Credit card - domestic | | | 49,221 | | | 48,948 | | | 273 | |
Credit card - foreign | | | 20,985 | | | 20,429 | | | 556 | |
Direct/Indirect consumer (3) | | | 98,366 | | | 99,154 | | | (788 | ) |
Other consumer(4) | | | 3,264 | | | 3,390 | | | (126 | ) |
| | | | | | | | | | |
Total consumer | | | 578,256 | | | 590,436 | | | (12,180 | ) |
| | | | | | | | | | |
| | | |
Commercial | | | | | | | | | | |
Commercial - domestic(5) | | | 207,607 | | | 217,571 | | | (9,964 | ) |
Commercial real estate(6) | | | 72,662 | | | 75,081 | | | (2,419 | ) |
Commercial lease financing | | | 21,910 | | | 22,387 | | | (477 | ) |
Commercial - foreign | | | 27,634 | | | 29,811 | | | (2,177 | ) |
| | | | | | | | | | |
Total commercial loans | | | 329,813 | | | 344,850 | | | (15,037 | ) |
Commercial loans measured at fair value(7) | | | 6,197 | | | 6,962 | | | (765 | ) |
| | | | | | | | | | |
Total commercial | | | 336,010 | | | 351,812 | | | (15,802 | ) |
| | | | | | | | | | |
Total loans and leases | | $ | 914,266 | | $ | 942,248 | | $ | (27,982 | ) |
| | | | | | | | | | |
| (1) | Includes foreign residential mortgages of $533 million and $681 million at September 30, 2009 and June 30, 2009. |
| (2) | At September 30, 2009 and June 30, 2009, includes $13.9 billion and $15.9 billion of pay option loans, and $1.5 billion and $1.6 billion of subprime loans obtained as part of the acquisition of Countrywide. The Corporation no longer originates these products. |
| (3) | Includes dealer financial services of $41.4 billion and $40.9 billion, consumer lending of $21.9 billion and $24.2 billion, securities based lending margin loans of $11.7 billion and $11.0 billion, and foreign consumer loans of $7.9 billion and $7.7 billion at September 30, 2009 and June 30, 2009. |
| (4) | Includes consumer finance loans of $2.3 billion and $2.4 billion, and other foreign consumer loans of $683 million and $721 million at September 30, 2009 and June 30, 2009. |
| (5) | Includes small business commercial - domestic loans, primarily card related, of $17.9 billion and $18.1 billion at September 30, 2009 and June 30, 2009. |
| (6) | Includes domestic commercial real estate loans of $69.1 billion and $71.6 billion, and foreign commercial real estate loans of $3.5 billion at both September 30, 2009 and June 30, 2009. |
| (7) | Certain commercial loans are measured at fair value under the fair value option and include commercial - domestic loans of $4.0 billion and $4.4 billion, commercial - - foreign loans of $2.1 billion and $2.5 billion, and commercial real estate loans of $98 million and $123 million at September 30, 2009 and June 30, 2009. |
Certain prior period amounts have been reclassified to conform to current period presentation.
Information for periods beginning July 1, 2008 includes the Countrywide acquisition. Information for periods beginning January 1, 2009 includes the
Merrill Lynch acquisition. Prior periods have not been restated.
| | |
| This information is preliminary and based on company data available at the time of the presentation. | | 34 |
Bank of America Corporation and Subsidiaries
Quarterly Average Loans and Leases by Business Segment
(Dollars in millions)
| | | | | | | | | | | | | | | | | | | | | | | | | | | |
| | | Third Quarter 2009 | |
| | | Total
Corporation | | | | Deposits | | Global
Card
Services (1) | | Home
Loans &
Insurance | | Global
Banking | | Global
Markets | | GWIM | | All Other (1) | |
Consumer | | | | | | | | | | | | | | | | | | | | | | | | | | | |
Residential mortgage | | $ | 241,924 | | | | $ | — | | $ | — | | $ | — | | $ | 333 | | $ | 622 | | $ | 36,196 | | $ | 204,773 | |
Home equity | | | 153,269 | | | | | — | | | — | | | 130,751 | | | 995 | | | — | | | 18,380 | | | 3,143 | |
Discontinued real estate | | | 16,570 | | | | | — | | | — | | | — | | | — | | | — | | | — | | | 16,570 | |
Credit card - domestic | | | 49,751 | | | | | — | | | 137,312 | | | — | | | — | | | — | | | — | | | (87,561 | ) |
Credit card - foreign | | | 21,189 | | | | | — | | | 31,148 | | | — | | | — | | | — | | | — | | | (9,959 | ) |
Direct/Indirect consumer | | | 100,012 | | | | | 10,804 | | | 24,651 | | | 59 | | | 42,022 | | | 8 | | | 22,273 | | | 195 | |
Other consumer | | | 3,331 | | | | | 287 | | | 741 | | | 25 | | | 6 | | | 2 | | | 7 | | | 2,263 | |
| | | | | | | | | | | | | | | | | | | | | | | | | | | |
Total consumer | | | 586,046 | | | | | 11,091 | | | 193,852 | | | 130,835 | | | 43,356 | | | 632 | | | 76,856 | | | 129,424 | |
| | | | | | | | | |
Commercial | | | | | | | | | | | | | | | | | | | | | | | | | | | |
Commercial - domestic | | | 216,332 | | | | | 283 | | | 17,814 | | | 1,753 | | | 153,493 | | | 8,649 | | | 21,978 | | | 12,362 | |
Commercial real estate | | | 74,276 | | | | | 5 | | | 241 | | | 11 | | | 62,884 | | | 1,230 | | | 2,230 | | | 7,675 | |
Commercial lease financing | | | 22,068 | | | | | — | | | — | | | — | | | 24,140 | | | 2 | | | — | | | (2,074 | ) |
Commercial - foreign | | | 31,533 | | | | | — | | | 1,433 | | | — | | | 24,891 | | | 4,813 | | | 117 | | | 279 | |
| | | | | | | | | | | | | | | | | | | | | | | | | | | |
Total commercial | | | 344,209 | | | | | 288 | | | 19,488 | | | 1,764 | | | 265,408 | | | 14,694 | | | 24,325 | | | 18,242 | |
| | | | | | | | | | | | | | | | | | | | | | | | | | | |
Total loans and leases | | $ | 930,255 | | | | $ | 11,379 | | $ | 213,340 | | $ | 132,599 | | $ | 308,764 | | $ | 15,326 | | $ | 101,181 | | $ | 147,666 | |
| | | | | | | | | | | | | | | | | | | | | | | | | | | |
| |
| | | Second Quarter 2009 | |
| | | Total
Corporation | | | | Deposits | | Global
Card
Services(1) | | Home
Loans &
Insurance | | Global
Banking | | Global
Markets | | GWIM | | All Other(1) | |
Consumer | | | | | | | | | | | | | | | | | | | | | | | | | | | |
Residential mortgage | | $ | 253,803 | | | | $ | — | | $ | — | | $ | — | | $ | 382 | | $ | 650 | | $ | 36,214 | | $ | 216,557 | |
Home equity | | | 156,599 | | | | | — | | | — | | | 129,420 | | | 1,052 | | | — | | | 19,556 | | | 6,571 | |
Discontinued real estate | | | 18,309 | | | | | — | | | — | | | — | | | — | | | — | | | — | | | 18,309 | |
Credit card - domestic | | | 51,721 | | | | | — | | | 143,209 | | | — | | | — | | | — | | | — | | | (91,488 | ) |
Credit card - foreign | | | 18,825 | | | | | — | | | 29,383 | | | — | | | — | | | — | | | — | | | (10,558 | ) |
Direct/Indirect consumer | | | 100,302 | | | | | 10,376 | | | 27,172 | | | 69 | | | 41,233 | | | 5 | | | 21,293 | | | 154 | |
Other consumer | | | 3,298 | | | | | 245 | | | 655 | | | 18 | | | 9 | | | — | | | 14 | | | 2,357 | |
| | | | | | | | | | | | | | | | | | | | | | | | | | | |
Total consumer | | | 602,857 | | | | | 10,621 | | | 200,419 | | | 129,507 | | | 42,676 | | | 655 | | | 77,077 | | | 141,902 | |
| | | | | | | | | |
Commercial | | | | | | | | | | | | | | | | | | | | | | | | | | | |
Commercial - domestic | | | 231,639 | | | | | 202 | | | 18,381 | | | 1,990 | | | 164,673 | | | 11,817 | | | 22,357 | | | 12,219 | |
Commercial real estate | | | 75,559 | | | | | 22 | | | 196 | | | 12 | | | 64,609 | | | 1,888 | | | 2,243 | | | 6,589 | |
Commercial lease financing | | | 22,026 | | | | | — | | | — | | | — | | | 24,208 | | | 2 | | | — | | | (2,184 | ) |
Commercial - foreign | | | 34,024 | | | | | — | | | 1,369 | | | — | | | 27,051 | | | 4,915 | | | 71 | | | 618 | |
| | | | | | | | | | | | | | | | | | | | | | | | | | | |
Total commercial | | | 363,248 | | | | | 224 | | | 19,946 | | | 2,002 | | | 280,541 | | | 18,622 | | | 24,671 | | | 17,242 | |
| | | | | | | | | | | | | | | | | | | | | | | | | | | |
Total loans and leases | | $ | 966,105 | | | | $ | 10,845 | | $ | 220,365 | | $ | 131,509 | | $ | 323,217 | | $ | 19,277 | | $ | 101,748 | | $ | 159,144 | |
| | | | | | | | | | | | | | | | | | | | | | | | | | | |
| |
| | | Third Quarter 2008 | |
| | | Total
Corporation | | | | Deposits | | Global
Card
Services(1) | | Home
Loans &
Insurance | | Global
Banking | | Global
Markets | | GWIM | | All Other(1) | |
Consumer | | | | | | | | | | | | | | | | | | | | | | | | | | | |
Residential mortgage | | $ | 260,779 | | | | $ | — | | $ | — | | $ | — | | $ | 620 | | $ | — | | $ | 35,050 | | $ | 225,109 | |
Home equity | | | 151,111 | | | | | — | | | — | | | 121,041 | | | 887 | | | — | | | 23,645 | | | 5,538 | |
Discontinued real estate | | | 22,031 | | | | | — | | | — | | | — | | | — | | | — | | | — | | | 22,031 | |
Credit card - domestic | | | 63,414 | | | | | — | | | 153,036 | | | — | | | — | | | — | | | — | | | (89,622 | ) |
Credit card - foreign | | | 17,075 | | | | | — | | | 33,372 | | | — | | | — | | | — | | | — | | | (16,297 | ) |
Direct/Indirect consumer | | | 85,392 | | | | | 7,457 | | | 31,321 | | | 79 | | | 42,205 | | | — | | | 5,013 | | | (683 | ) |
Other consumer | | | 3,723 | | | | | 268 | | | 825 | | | 47 | | | 16 | | | — | | | 18 | | | 2,549 | |
| | | | | | | | | | | | | | | | | | | | | | | | | | | |
Total consumer | | | 603,525 | | | | | 7,725 | | | 218,554 | | | 121,167 | | | 43,728 | | | — | | | 63,726 | | | 148,625 | |
| | | | | | | | | |
Commercial | | | | | | | | | | | | | | | | | | | | | | | | | | | |
Commercial - domestic | | | 224,117 | | | | | 163 | | | 19,550 | | | 782 | | | 163,886 | | | 17,311 | | | 22,707 | | | (282 | ) |
Commercial real estate | | | 63,220 | | | | | — | | | 281 | | | 85 | | | 60,196 | | | 944 | | | 1,740 | | | (26 | ) |
Commercial lease financing | | | 22,585 | | | | | — | | | — | | | — | | | 24,574 | | | 34 | | | — | | | (2,023 | ) |
Commercial - foreign | | | 33,467 | | | | | — | | | 1,566 | | | — | | | 28,429 | | | 3,379 | | | 82 | | | 11 | |
| | | | | | | | | | | | | | | | | | | | | | | | | | | |
Total commercial | | | 343,389 | | | | | 163 | | | 21,397 | | | 867 | | | 277,085 | | | 21,668 | | | 24,529 | | | (2,320 | ) |
| | | | | | | | | | | | | | | | | | | | | | | | | | | |
Total loans and leases | | $ | 946,914 | | | | $ | 7,888 | | $ | 239,951 | | $ | 122,034 | | $ | 320,813 | | $ | 21,668 | | $ | 88,255 | | $ | 146,305 | |
| | | | | | | | | | | | | | | | | | | | | | | | | | | |
| (1) | Global Card Services is presented on a managed basis with a corresponding offset recorded in All Other. |
Certain prior period amounts have been reclassified among the segments to conform to the current period presentation.
Information for periods beginning July 1, 2008 includes the Countrywide acquisition. Information for periods beginning January 1, 2009 includes the
Merrill Lynch acquisition. Prior periods have not been restated.
| | |
| This information is preliminary and based on company data available at the time of the presentation. | | 35 |
Bank of America Corporation and Subsidiaries
Commercial Credit Exposure by Industry(1, 2, 3)
(Dollars in millions)
| | | | | | | | | | | | | | | | | | | | | | |
| | | Commercial Utilized | | | Total Commercial Committed | |
| | | September 30
2009 | | June 30
2009 | | Increase
(Decrease) | | | September 30
2009 | | | June 30
2009 | | | Increase
(Decrease) | |
Diversified financials | | $ | 75,650 | | $ | 74,089 | | $ | 1,561 | | | $ | 118,770 | | | $ | 121,600 | | | $ | (2,830 | ) |
Real estate (4) | | | 80,424 | | | 83,426 | | | (3,002 | ) | | | 98,857 | | | | 103,560 | | | | (4,703 | ) |
Government and public education | | | 44,802 | | | 44,432 | | | 370 | | | | 61,547 | | | | 62,987 | | | | (1,440 | ) |
Capital goods | | | 26,585 | | | 28,385 | | | (1,800 | ) | | | 51,653 | | | | 53,870 | | | | (2,217 | ) |
Healthcare equipment and services | | | 30,960 | | | 31,635 | | | (675 | ) | | | 47,640 | | | | 47,382 | | | | 258 | |
Retailing | | | 25,413 | | | 27,062 | | | (1,649 | ) | | | 44,611 | | | | 45,729 | | | | (1,118 | ) |
Consumer services | | | 29,068 | | | 28,688 | | | 380 | | | | 44,606 | | | | 43,999 | | | | 607 | |
Commercial services and supplies | | | 25,149 | | | 26,973 | | | (1,824 | ) | | | 37,500 | | | | 38,755 | | | | (1,255 | ) |
Materials | | | 18,431 | | | 20,278 | | | (1,847 | ) | | | 34,712 | | | | 36,068 | | | | (1,356 | ) |
Individuals and trusts | | | 24,448 | | | 26,648 | | | (2,200 | ) | | | 32,021 | | | | 35,290 | | | | (3,269 | ) |
Insurance | | | 21,945 | | | 26,077 | | | (4,132 | ) | | | 28,947 | | | | 33,404 | | | | (4,457 | ) |
Food, beverage and tobacco | | | 15,131 | | | 15,859 | | | (728 | ) | | | 28,180 | | | | 28,843 | | | | (663 | ) |
Utilities | | | 9,732 | | | 10,484 | | | (752 | ) | | | 26,639 | | | | 26,860 | | | | (221 | ) |
Energy | | | 10,641 | | | 12,208 | | | (1,567 | ) | | | 23,941 | | | | 24,776 | | | | (835 | ) |
Media | | | 12,131 | | | 12,435 | | | (304 | ) | | | 23,783 | | | | 23,539 | | | | 244 | |
Banks | | | 20,040 | | | 21,416 | | | (1,376 | ) | | | 23,156 | | | | 24,831 | | | | (1,675 | ) |
Transportation | | | 13,804 | | | 13,421 | | | 383 | | | | 19,558 | | | | 19,554 | | | | 4 | |
Religious and social organizations | | | 9,261 | | | 9,688 | | | (427 | ) | | | 11,891 | | | | 12,530 | | | | (639 | ) |
Consumer durables and apparel | | | 5,086 | | | 5,383 | | | (297 | ) | | | 10,159 | | | | 10,198 | | | | (39 | ) |
Telecommunication services | | | 3,746 | | | 3,892 | | | (146 | ) | | | 10,006 | | | | 10,123 | | | | (117 | ) |
Pharmaceuticals and biotechnology | | | 3,364 | | | 3,574 | | | (210 | ) | | | 9,812 | | | | 9,913 | | | | (101 | ) |
Software and services | | | 3,548 | | | 3,880 | | | (332 | ) | | | 9,707 | | | | 10,006 | | | | (299 | ) |
Technology hardware and equipment | | | 3,228 | | | 3,446 | | | (218 | ) | | | 9,557 | | | | 9,902 | | | | (345 | ) |
Food and staples retailing | | | 3,878 | | | 4,356 | | | (478 | ) | | | 6,776 | | | | 7,367 | | | | (591 | ) |
Automobiles and components | | | 2,615 | | | 3,269 | | | (654 | ) | | | 5,215 | | | | 6,243 | | | | (1,028 | ) |
Other | | | 5,748 | | | 6,049 | | | (301 | ) | | | 11,111 | | | | 10,883 | | | | 228 | |
Total commercial credit exposure by industry | | $ | 524,828 | | $ | 547,053 | | $ | (22,225 | ) | | $ | 830,355 | | | $ | 858,212 | | | $ | (27,857 | ) |
| | | | | | |
Net credit default protection purchased on total commitments(5) | | | | | | | | | | | | $ | (21,558 | ) | | $ | (25,980 | ) | | | | |
| (1) | Includes loans and leases, standby letters of credit and financial guarantees, derivative assets, assets held-for-sale, commercial letters of credit, bankers’ acceptances, securitized assets, foreclosed properties and other collateral acquired. Derivative assets are reported on a mark-to-market basis and have been reduced by the amount of cash collateral applied of $71.9 billion and $63.3 billion at September 30, 2009 and June 30, 2009. Not reflected in utilized and committed exposure is additional derivative collateral held of $14.7 billion and $11.5 billion which consists primarily of other marketable securities at September 30, 2009 and June 30, 2009. |
| (2) | Total commercial utilized and total commercial committed exposure includes loans and letters of credit measured at fair value under the fair value option and are comprised of loans outstanding of $6.2 billion and $7.0 billion and issued letters of credit at notional value of $1.9 billion and $2.1 billion at September 30, 2009 and June 30, 2009. In addition, total commercial committed exposure includes unfunded loan commitments at notional value of $26.7 billion and $24.7 billion at September 30, 2009 and June 30, 2009. |
| (3) | Includes small business commercial - domestic exposure. |
| (4) | Industries are viewed from a variety of perspectives to best isolate the perceived risks. For purposes of this table, the real estate industry is defined based upon the borrowers’ or counterparties’ primary business activity using operating cash flow and primary source of repayment as key factors. |
| (5) | Represents net notional credit protection purchased. |
Certain prior period amounts have been reclassified to conform to current period presentation.
Information for periods beginning July 1, 2008 include the Countrywide acquisition. Information for the period beginning January 1, 2009 includes the
Merrill Lynch acquisition. Prior periods have not been restated.
| | |
| This information is preliminary and based on company data available at the time of the presentation. | | 36 |
Bank of America Corporation and Subsidiaries
Net Credit Default Protection by Maturity Profile (1)
| | | | | | | | |
| | | September 30
2009 | | | | June 30
2009 | | |
Less than or equal to one year | | 13 | | % | | 9 | | % |
Greater than one year and less than or equal to five years | | 84 | | | | 85 | | |
Greater than five years | | 3 | | | | 6 | | |
Total net credit default protection | | 100 | | % | | 100 | | % |
| (1) | In order to mitigate the cost of purchasing credit protection, credit exposure can be added by selling credit protection. The distribution of maturities for net credit default protection purchased is shown above. |
Net Credit Default Protection by Credit Exposure Debt Rating(1, 2)
(Dollars in millions)
| | | | | | | | | | | | | | | | | | |
| | | September 30, 2009 | | | | | June 30, 2009 | | | |
| Ratings(3) | | Net Notional | | | Percent | | | | | Net Notional | | | Percent | | | |
AAA | | $ | 15 | | | (0.1 | ) | | % | | $ | 35 | | | (0.1 | ) | | % |
AA | | | (465 | ) | | 2.2 | | | | | | (1,180 | ) | | 4.5 | | | |
A | | | (6,239 | ) | | 28.9 | | | | | | (7,198 | ) | | 27.7 | | | |
BBB | | | (11,262 | ) | | 52.3 | | | | | | (11,786 | ) | | 45.4 | | | |
BB | | | (3,015 | ) | | 14.0 | | | | | | (3,057 | ) | | 11.8 | | | |
B | | | (974 | ) | | 4.5 | | | | | | (891 | ) | | 3.4 | | | |
CCC and below | | | (1,886 | ) | | 8.7 | | | | | | (1,921 | ) | | 7.4 | | | |
NR(4) | | | 2,268 | | | (10.5 | ) | | | | | 18 | | | (0.1 | ) | | |
Total net credit default protection | | $ | (21,558 | ) | | 100.0 | | | % | | $ | (25,980 | ) | | 100.0 | | | % |
| (1) | In order to mitigate the cost of purchasing credit protection, credit exposure can be added by selling credit protection. The distribution of debt rating for net notional credit default protection purchased is shown as a negative and the net notional credit protection sold is shown as a positive amount. |
| (2) | Ratings are refreshed on a quarterly basis. |
| (3) | The Corporation considers ratings of BBB- or higher to meet the definition of investment grade. |
| (4) | In addition to names which have not been rated, “NR” includes $2.4 billion and $157 million in net credit default swap index positions at September 30, 2009 and June 30, 2009. While index positions are principally investment grade, credit default swaps indices include names in and across each of the ratings categories. |
Certain prior period amounts have been reclassified to conform to current period presentation.
Information for periods beginning July 1, 2008 includes the Countrywide acquisition. Information for periods beginning January 1, 2009 includes the
Merrill Lynch acquisition. Prior periods have not been restated.
| | |
| This information is preliminary and based on company data available at the time of the presentation. | | 37 |
Bank of America Corporation and Subsidiaries
Selected Emerging Markets(1)
| | | | | | | | | | | | | | | | | | | | | | | | | |
| (Dollars in millions) | | Loans and Leases,
and Loan
Commitments | | Other
Financing (2) | | Derivative
Assets(3) | | Securities /
Other
Investments (4) | | Total
Cross-
border
Exposure (5) | | Local Country
Exposure Net of
Local
Liabilities (6) | | Total Emerging
Markets Exposure
September 30,
2009 | | Increase
(Decrease) from
June 30,
2009 | |
Region/Country | | | | | | | | | | | | | | | | | | | | | | | | | |
Asia Pacific | | | | | | | | | | | | | | | | | | | | | | | | | |
China(7) | | $ | 538 | | $ | 174 | | $ | 777 | | $ | 10,618 | | $ | 12,107 | | $ | — | | $ | 12,107 | | $ | (59 | ) |
South Korea | | | 274 | | | 608 | | | 1,518 | | | 3,178 | | | 5,578 | | | — | | | 5,578 | | | (755 | ) |
India | | | 1,300 | | | 914 | | | 824 | | | 1,767 | | | 4,805 | | | 9 | | | 4,814 | | | (1,124 | ) |
Hong Kong | | | 545 | | | 371 | | | 160 | | | 218 | | | 1,294 | | | — | | | 1,294 | | | (164 | ) |
Singapore | | | 306 | | | 41 | | | 285 | | | 253 | | | 885 | | | — | | | 885 | | | (1,325 | ) |
Taiwan | | | 321 | | | 20 | | | 123 | | | 129 | | | 593 | | | 227 | | | 820 | | | 250 | |
Other Asia Pacific(8) | | | 258 | | | 40 | | | 190 | | | 667 | | | 1,155 | | | 151 | | | 1,306 | | | (234 | ) |
Total Asia Pacific | | | 3,542 | | | 2,168 | | | 3,877 | | | 16,830 | | | 26,417 | | | 387 | | | 26,804 | | | (3,411 | ) |
Latin America | | | | | | | | | | | | | | | | | | | | | | | | | |
Brazil(9) | | | 377 | | | 688 | | | 220 | | | 4,708 | | | 5,993 | | | 2,097 | | | 8,090 | | | 915 | |
Mexico(10) | | | 1,720 | | | 208 | | | 525 | | | 2,696 | | | 5,149 | | | 355 | | | 5,504 | | | (233 | ) |
Chile | | | 466 | | | 393 | | | 320 | | | 30 | | | 1,209 | | | 2 | | | 1,211 | | | 15 | |
Argentina | | | 1 | | | — | | | 6 | | | 387 | | | 394 | | | 162 | | | 556 | | | 66 | |
Other Latin America(8) | | | 127 | | | 214 | | | 368 | | | 189 | | | 898 | | | — | | | 898 | | | (137 | ) |
Total Latin America | | | 2,691 | | | 1,503 | | | 1,439 | | | 8,010 | | | 13,643 | | | 2,616 | | | 16,259 | | | 626 | |
Middle East and Africa | | | | | | | | | | | | | | | | | | | | | | | | | |
South Africa | | | 153 | | | 8 | | | 56 | | | 1,020 | | | 1,237 | | | — | | | 1,237 | | | 89 | |
United Arab Emirates | | | 387 | | | 36 | | | 176 | | | 65 | | | 664 | | | — | | | 664 | | | 5 | |
Other Middle East and Africa(8) | | | 465 | | | 70 | | | 212 | | | 238 | | | 985 | | | 1 | | | 986 | | | (392 | ) |
Total Middle East and Africa | | | 1,005 | | | 114 | | | 444 | | | 1,323 | | | 2,886 | | | 1 | | | 2,887 | | | (298 | ) |
Total Central and Eastern Europe (8) | | | 603 | | | 226 | | | 468 | | | 608 | | | 1,905 | | | 30 | | | 1,935 | | | (535 | ) |
Total emerging market exposure | | $ | 7,841 | | $ | 4,011 | | $ | 6,228 | | $ | 26,771 | | $ | 44,851 | | $ | 3,034 | | $ | 47,885 | | $ | (3,618 | ) |
| (1) | There is no generally accepted definition of emerging markets. The definition that we use includes all countries in Asia Pacific excluding Japan, Australia and New Zealand; all countries in Latin America excluding Cayman Islands and Bermuda; all countries in Middle East and Africa; and all countries in Central and Eastern Europe excluding Greece. There was no emerging market exposure included in the portfolio measured at fair value under the fair value option at September 30, 2009 and June 30, 2009. |
| (2) | Includes acceptances, standby letters of credit, commercial letters of credit and formal guarantees. |
| (3) | Derivative assets are reported on a mark-to-market basis and have been reduced by the amount of cash collateral applied of $775 million and $774 million at September 30, 2009 and June 30, 2009. At September 30, 2009 and June 30, 2009, there were $605 million and $863 million of other marketable securities collateralizing derivative assets. |
| (4) | Generally, cross-border resale agreements are presented based on the domicile of the counterparty, consistent with Federal Financial Institutions Examination Council (FFIEC) reporting requirements. Cross-border resale agreements where the underlying securities are U.S. Treasury securities, in which case the domicile is the U.S., are excluded from this presentation. |
| (5) | Cross-border exposure includes amounts payable to the Corporation by borrowers or counterparties with a country of residence other than the one in which the credit is booked, regardless of the currency in which the claim is denominated, consistent with FFIEC reporting requirements. |
| (6) | Local country exposure includes amounts payable to the Corporation by borrowers with a country of residence in which the credit is booked, regardless of the currency in which the claim is denominated. Local funding or liabilities are subtracted from local exposures consistent with FFIEC reporting requirements. Total amount of available local liabilities funding local country exposure at September 30, 2009 was $18.0 billion compared to $15.3 billion at June 30, 2009. Local liabilities at September 30, 2009 in Asia Pacific, Latin America, and Middle East and Africa were $16.7 billion, $860 million, and $398 million, respectively, of which $8.2 billion were in Singapore, $2.1 billion in South Korea, $1.8 billion in both Hong Kong and India, $1.5 billion in China, $722 million in Mexico and $645 million in Taiwan. There were no other countries with available local liabilities funding local country exposure greater than $500 million. |
| (7) | Securities/Other Investments include an investment of $9.2 billion in China Construction Bank (CCB). |
| (8) | No country included in Other Asia Pacific, Other Latin America, Other Middle East and Africa, or Central and Eastern Europe had total foreign exposure of more than $500 million. |
| (9) | Securities/Other Investments include an investment of $3.9 billion in Banco Itaú Holding Financeira S.A. |
| (10) | Securities/Other Investments include an investment of $2.4 billion in Grupo Financiero Santander, S.A. |
Certain prior period amounts have been reclassified to conform to current period presentation.
Information for periods beginning July 1, 2008 includes the Countrywide acquisition. Information for periods beginning January 1, 2009 includes the
Merrill Lynch acquisition. Prior periods have not been restated.
| | |
| This information is preliminary and based on company data available at the time of the presentation. | | 38 |
Bank of America Corporation and Subsidiaries
Nonperforming Assets
| | | | | | | | | | | | | | | | | | | | | | | | | |
| (Dollars in millions) | | September 30
2009 | | | | June 30
2009 | | | | March 31
2009 | | | | December 31
2008 | | | | September 30
2008 | | |
Residential mortgage | | $ | 15,509 | | | | $ | 13,615 | | | | $ | 10,846 | | | | $ | 7,057 | | | | $ | 4,638 | | |
Home equity | | | 3,741 | | | | | 3,826 | | | | | 3,497 | | | | | 2,637 | | | | | 2,049 | | |
Discontinued real estate | | | 207 | | | | | 181 | | | | | 129 | | | | | 77 | | | | | 33 | | |
Direct/Indirect consumer | | | 92 | | | | | 57 | | | | | 29 | | | | | 26 | | | | | 13 | | |
Other consumer | | | 105 | | | | | 93 | | | | | 91 | | | | | 91 | | | | | 89 | | |
| | | | | | | | | | | | | | | | | | | | | | | | | |
Total consumer | | | 19,654 | | | | | 17,772 | | | | | 14,592 | | | | | 9,888 | | | | | 6,822 | | |
| | | | | | | | | | | | | | | | | | | | | | | | | |
| | | | | | | | | | |
Commercial - domestic(1) | | | 4,719 | | | | | 4,204 | | | | | 3,022 | | | | | 2,040 | | | | | 1,566 | | |
Commercial real estate | | | 6,943 | | | | | 6,651 | | | | | 5,662 | | | | | 3,906 | | | | | 3,090 | | |
Commercial lease financing | | | 170 | | | | | 104 | | | | | 104 | | | | | 56 | | | | | 35 | | |
Commercial - foreign | | | 261 | | | | | 250 | | | | | 300 | | | | | 290 | | | | | 48 | | |
| | | | | | | | | | | | | | | | | | | | | | | | | |
| | | 12,093 | | | | | 11,209 | | | | | 9,088 | | | | | 6,292 | | | | | 4,739 | | |
Small business commercial - domestic | | | 167 | | | | | 200 | | | | | 224 | | | | | 205 | | | | | 183 | | |
| | | | | | | | | | | | | | | | | | | | | | | | | |
Total commercial | | | 12,260 | | | | | 11,409 | | | | | 9,312 | | | | | 6,497 | | | | | 4,922 | | |
| | | | | | | | | | | | | | | | | | | | | | | | | |
Total nonperforming loans and leases | | | 31,914 | | | | | 29,181 | | | | | 23,904 | | | | | 16,385 | | | | | 11,744 | | |
Foreclosed properties | | | 1,911 | | | | | 1,801 | | | | | 1,728 | | | | | 1,827 | | | | | 1,832 | | |
| | | | | | | | | | | | | | | | | | | | | | | | | |
Total nonperforming assets(2, 3, 4) | | $ | 33,825 | | | | $ | 30,982 | | | | $ | 25,632 | | | | $ | 18,212 | | | | $ | 13,576 | | |
| | | | | | | | | | | | | | | | | | | | | | | | | |
| | | | | | | | | | |
Loans past due 90 days or more and still accruing(2, 4, 5) | | $ | 7,595 | | | | $ | 6,403 | | | | $ | 6,344 | | | | $ | 5,414 | | | | $ | 4,819 | | |
| | | | | | | | | | |
Nonperforming assets/Total assets(6) | | | 1.51 | | % | | | 1.38 | | % | | | 1.11 | | % | | | 1.00 | | % | | | 0.74 | | % |
| | | | | | | | | | |
Nonperforming assets/Total loans, leases and foreclosed properties (6) | | | 3.72 | | | | | 3.31 | | | | | 2.64 | | | | | 1.96 | | | | | 1.45 | | |
| | | | | | | | | | |
Nonperforming loans and leases/Total loans and leases outstanding (6) | | | 3.51 | | | | | 3.12 | | | | | 2.47 | | | | | 1.77 | | | | | 1.25 | | |
| | | | | | | | | | |
Allowance for credit losses: | | | | | | | | | | | | | | | | | | | | | | | | | |
Allowance for loan and lease losses | | $ | 35,832 | | | | $ | 33,785 | | | | $ | 29,048 | | | | $ | 23,071 | | | | $ | 20,346 | | |
Reserve for unfunded lending commitments(7) | | | 1,567 | | | | | 1,992 | | | | | 2,102 | | | | | 421 | | | | | 427 | | |
| | | | | | | | | | | | | | | | | | | | | | | | | |
Total allowance for credit losses | | $ | 37,399 | | | | $ | 35,777 | | | | $ | 31,150 | | | | $ | 23,492 | | | | $ | 20,773 | | |
| | | | | | | | | | | | | | | | | | | | | | | | | |
| | | | | | | | | | |
Allowance for loan and lease losses/Total loans and leases outstanding(6) | | | 3.95 | | % | | | 3.61 | | % | | | 3.00 | | % | | | 2.49 | | % | | | 2.17 | | % |
| | | | | | | | | | |
Allowance for loan and lease losses/Total nonperforming loans and leases (6) | | | 112 | | | | | 116 | | | | | 122 | | | | | 141 | | | | | 173 | | |
| | | | | | | | | | |
Commercial utilized reservable criticized exposure(8) | | $ | 60,059 | | | | $ | 57,180 | | | | $ | 48,660 | | | | $ | 36,937 | | | | $ | 31,009 | | |
| | | | | | | | | | |
Commercial utilized reservable criticized exposure/Commercial utilized exposure(8) | | | 14.78 | | % | | | 13.53 | | % | | | 11.13 | | % | | | 8.90 | | % | | | 7.45 | | % |
| (1) | Excludes small business commercial - domestic loans. |
| (2) | Balances do not include purchased impaired loans even though the customer may be contractually past due. Purchased impaired loans were written down to fair value upon acquisition and accrete interest income over the remaining life of the loan. |
| (3) | Balances do not include nonperforming loans held-for-sale of $6.2 billion, $5.9 billion, $5.0 billion, $4.1 billion and $3.9 billion at September 30, 2009, June 30, 2009, March 31, 2009, December 31, 2008 and September 30, 2008, respectively. |
| (4) | Balances do not include loans measured at fair value under the fair value option. At September 30, 2009, June 30, 2009, March 31, 2009, December 31, 2008 and September 30, 2008, there were no nonperforming loans measured at fair value under the fair value option. At September 30, 2009, there were $111 million of loans past due 90 days or more and still accruing interest at fair value under the fair value option. At June 30, 2009, March 31, 2009, December 31, 2008 and September 30, 2008, there were no loans past due 90 days or more and still accruing interest measured at fair value under the fair value option. |
| (5) | Balances do not include loans held-for-sale past due 90 days or more and still accruing interest included in other assets of $6 million, $0, $18 million, $31 million and $138 million at September 30, 2009, June 30, 2009, March 31, 2009, December 31, 2008 and September 30, 2008, respectively. |
| (6) | Ratios do not include loans measured at fair value under the fair value option of $6.2 billion, $7.0 billion, $7.4 billion, $5.4 billion and $5.4 billion at September 30, 2009, June 30, 2009, March 31, 2009, December 31, 2008 and September 30, 2008, respectively. |
| (7) | The majority of the increase from December 31, 2008 relates to the fair value of the acquired Merrill Lynch unfunded lending commitments, excluding commitments measured at fair value under the fair value option. |
| (8) | Criticized exposure and ratios exclude assets held-for-sale, exposure measured at fair value under the fair value option and other nonreservable exposure. Including assets held-for-sale, other nonreservable exposure and commercial loans measured at fair value, the ratios would have been 15.85 percent, 14.93 percent, 12.63 percent, 9.45 percent and 7.94 percent at September 30, 2009, June 30, 2009, March 31, 2009, December 31, 2008 and September 30, 2008, respectively. |
Loans are classified as domestic or foreign based upon the domicile of the borrower.
Certain prior period amounts have been reclassified to conform to current period presentation.
Information for periods beginning July 1, 2008 includes the Countrywide acquisition. Information for periods beginning January 1, 2009 includes the
Merrill Lynch acquisition. Prior periods have not been restated.
| | |
| This information is preliminary and based on company data available at the time of the presentation. | | 39 |
Bank of America Corporation and Subsidiaries
Nonperforming Asset Activity
(Dollars in millions)
| | | | | | | | | | | | | | | | | | | | |
| | | Third
Quarter
2009 | | | Second
Quarter
2009 | | | First
Quarter
2009 | | | Fourth
Quarter
2008 | | | Third
Quarter
2008 | |
Nonperforming Consumer Loans and Leases: | | | | | | | | | | | | | | | | | | | | |
Balance, beginning of period | | $ | 17,772 | | | $ | 14,592 | | | $ | 9,888 | | | $ | 6,822 | | | $ | 5,220 | |
Additions(1) | | | 6,696 | | | | 7,076 | | | | 7,718 | | | | 5,283 | | | | 3,435 | |
Paydowns and payoffs | | | (410 | ) | | | (382 | ) | | | (296 | ) | | | (146 | ) | | | (110 | ) |
Return to performing status(2) | | | (966 | ) | | | (804 | ) | | | (601 | ) | | | (501 | ) | | | (371 | ) |
Charge-offs (3) | | | (2,829 | ) | | | (2,478 | ) | | | (1,692 | ) | | | (1,233 | ) | | | (1,117 | ) |
Other | | | (609 | ) | | | (232 | ) | | | (425 | ) | | | (337 | ) | | | (235 | ) |
| | | | | | | | | | | | | | | | | | | | |
Total nonperforming consumer loans and leases, end of period | | | 19,654 | | | | 17,772 | | | | 14,592 | | | | 9,888 | | | | 6,822 | |
Foreclosed properties | | | 1,298 | | | | 1,330 | | | | 1,356 | | | | 1,506 | | | | 1,656 | |
| | | | | | | | | | | | | | | | | | | | |
Total nonperforming consumer assets | | $ | 20,952 | | | $ | 19,102 | | | $ | 15,948 | | | $ | 11,394 | | | $ | 8,478 | |
| | | | | | | | | | | | | | | | | | | | |
Nonperforming Commercial Loans and Leases(4): | | | | | | | | | | | | | | | | | | | | |
Balance, beginning of period | | $ | 11,409 | | | $ | 9,312 | | | $ | 6,497 | | | $ | 4,922 | | | $ | 3,936 | |
Additions(1) | | | 4,289 | | | | 4,416 | | | | 4,434 | | | | 3,095 | | | | 1,997 | |
Paydowns and payoffs | | | (944 | ) | | | (593 | ) | | | (490 | ) | | | (368 | ) | | | (371 | ) |
Return to performing status(2) | | | (94 | ) | | | (92 | ) | | | (55 | ) | | | (35 | ) | | | (29 | ) |
Charge-offs(5) | | | (1,773 | ) | | | (1,429 | ) | | | (976 | ) | | | (896 | ) | | | (495 | ) |
Other | | | (627 | ) | | | (205 | ) | | | (98 | ) | | | (221 | ) | | | (116 | ) |
| | | | | | | | | | | | | | | | | | | | |
Total nonperforming commercial loans and leases, end of period | | | 12,260 | | | | 11,409 | | | | 9,312 | | | | 6,497 | | | | 4,922 | |
Foreclosed properties | | | 613 | | | | 471 | | | | 372 | | | | 321 | | | | 176 | |
| | | | | | | | | | | | | | | | | | | | |
Total nonperforming commercial assets | | $ | 12,873 | | | $ | 11,880 | | | $ | 9,684 | | | $ | 6,818 | | | $ | 5,098 | |
| | | | | | | | | | | | | | | | | | | | |
| (1) | The three months ended March 31, 2009 includes $465 million of nonperforming consumer loans and leases and $402 million of nonperforming commercial loans and leases acquired from Merrill Lynch. |
| (2) | Loans and leases may be restored to performing status when all principal and interest is current and full repayment of the remaining contractual principal and interest is expected, or when the loan otherwise becomes well-secured and is in the process of collection. Troubled debt restructurings are generally classified as performing after six consecutive, on-time payments. |
| (3) | Our policy is not to classify consumer credit card and consumer non-real estate loans and leases as nonperforming; therefore, the charge-offs on these loans have no impact on nonperforming activity. |
| (4) | Includes small business commercial – domestic activity. |
| (5) | Business card loans are not classified as nonperforming; therefore, the charge-offs on these loans have no impact on nonperforming activity. |
Certain prior period amounts have been reclassified to conform to current period presentation.
Information for periods beginning July 1, 2008 includes the Countrywide acquisition. Information for periods beginning January 1, 2009 includes the
Merrill Lynch acquisition. Prior periods have not been restated.
| | |
| This information is preliminary and based on company data available at the time of the presentation. | | 40 |
Bank of America Corporation and Subsidiaries
Quarterly Net Charge-offs/Losses and Net Charge-off/Loss Ratios(1)
(Dollars in millions)
| | | | | | | | | | | | | | | | | | | | | | | | | | | | | | | | | | | |
| | | Third
Quarter
2009 | | | Second
Quarter
2009 | | | First
Quarter
2009 | | | Fourth
Quarter
2008 | | | Third
Quarter
2008 | |
| Held Basis | | Amount | | | Percent | | | Amount | | | Percent | | | Amount | | | Percent | | | Amount | | | Percent | | | Amount | | | Percent | |
Residential mortgage | | $ | 1,247 | | | 2.05 | % | | $ | 1,085 | | | 1.72 | % | | $ | 785 | | | 1.20 | % | | $ | 466 | | | 0.73 | % | | $ | 242 | | | 0.37 | % |
Home equity | | | 1,970 | | | 5.10 | | | | 1,839 | | | 4.71 | | | | 1,681 | | | 4.30 | | | | 1,113 | | | 2.92 | | | | 964 | | | 2.53 | |
Discontinued real estate | | | 37 | | | 0.89 | | | | 35 | | | 0.76 | | | | 15 | | | 0.31 | | | | 19 | | | 0.36 | | | | (3 | ) | | (0.05 | ) |
Credit card - domestic | | | 1,787 | | | 14.25 | | | | 1,788 | | | 13.87 | | | | 1,426 | | | 9.81 | | | | 1,244 | | | 7.63 | | | | 1,094 | | | 6.86 | |
Credit card - foreign | | | 382 | | | 7.14 | | | | 276 | | | 5.88 | | | | 186 | | | 4.48 | | | | 162 | | | 3.75 | | | | 148 | | | 3.46 | |
Direct/Indirect consumer | | | 1,451 | | | 5.76 | | | | 1,475 | | | 5.90 | | | | 1,249 | | | 5.03 | | | | 1,054 | | | 5.03 | | | | 845 | | | 3.94 | |
Other consumer | | | 118 | | | 14.00 | | | | 99 | | | 11.93 | | | | 97 | | | 11.67 | | | | 124 | | | 13.79 | | | | 106 | | | 11.36 | |
| | | | | | | | | | | | | | | | | | | | | | | | | | | | | | | | | | | |
Total consumer | | | 6,992 | | | 4.73 | | | | 6,597 | | | 4.39 | | | | 5,439 | | | 3.54 | | | | 4,182 | | | 2.79 | | | | 3,396 | | | 2.24 | |
| | | | | | | | | | | | | | | | | | | | | | | | | | | | | | | | | | | |
Commercial - domestic(2) | | | 773 | | | 1.58 | | | | 536 | | | 1.03 | | | | 244 | | | 0.46 | | | | 255 | | | 0.50 | | | | 117 | | | 0.23 | |
Commercial real estate | | | 873 | | | 4.67 | | | | 629 | | | 3.34 | | | | 455 | | | 2.56 | | | | 382 | | | 2.36 | | | | 262 | | | 1.65 | |
Commercial lease financing | | | 41 | | | 0.72 | | | | 44 | | | 0.81 | | | | 67 | | | 1.22 | | | | 31 | | | 0.57 | | | | 8 | | | 0.13 | |
Commercial - foreign | | | 149 | | | 2.05 | | | | 122 | | | 1.54 | | | | 104 | | | 1.25 | | | | 129 | | | 1.63 | | | | 46 | | | 0.56 | |
| | | | | | | | | | | | | | | | | | | | | | | | | | | | | | | | | | | |
| | | 1,836 | | | 2.28 | | | | 1,331 | | | 1.58 | | | | 870 | | | 1.02 | | | | 797 | | | 0.99 | | | | 433 | | | 0.54 | |
Small business commercial - domestic | | | 796 | | | 17.45 | | | | 773 | | | 16.69 | | | | 633 | | | 13.47 | | | | 562 | | | 11.55 | | | | 527 | | | 10.64 | |
| | | | | | | | | | | | | | | | | | | | | | | | | | | | | | | | | | | |
Total commercial | | | 2,632 | | | 3.09 | | | | 2,104 | | | 2.37 | | | | 1,503 | | | 1.68 | | | | 1,359 | | | 1.59 | | | | 960 | | | 1.13 | |
| | | | | | | | | | | | | | | | | | | | | | | | | | | | | | | | | | | |
Total net charge-offs | | $ | 9,624 | | | 4.13 | | | $ | 8,701 | | | 3.64 | | | $ | 6,942 | | | 2.85 | | | $ | 5,541 | | | 2.36 | | | $ | 4,356 | | | 1.84 | |
| | | | | | | | | | | | | | | | | | | | | | | | | | | | | | | | | | | |
| | | | | | | | | | |
By Business Segment | | | | | | | | | | | | | | | | | | | | | | | | | | | | | | | | | | | |
Deposits | | $ | 100 | | | 3.48 | % | | $ | 88 | | | 3.26 | % | | $ | 88 | | | 3.42 | % | | $ | 106 | | | 4.89 | % | | $ | 96 | | | 4.85 | % |
Global Card Services(3) | | | 7,536 | | | 14.02 | | | | 7,096 | | | 12.91 | | | | 5,406 | | | 9.60 | | | | 4,623 | | | 7.88 | | | | 4,185 | | | 6.94 | |
Home Loans & Insurance | | | 1,963 | | | 5.87 | | | | 1,598 | | | 4.88 | | | | 1,492 | | | 4.77 | | | | 976 | | | 3.18 | | | | 844 | | | 2.75 | |
Global Banking | | | 1,748 | | | 2.25 | | | | 1,477 | | | 1.83 | | | | 1,122 | | | 1.37 | | | | 992 | | | 1.19 | | | | 588 | | | 0.73 | |
Global Markets | | | 44 | | | 1.98 | | | | 29 | | | 1.00 | | | | 5 | | | 0.17 | | | | 15 | | | 0.87 | | | | 16 | | | 0.36 | |
Global Wealth & Investment Management | | | 285 | | | 1.12 | | | | 172 | | | 0.68 | | | | 162 | | | 0.60 | | | | 145 | | | 0.65 | | | | 108 | | | 0.49 | |
All Other(3) | | | (2,052 | ) | | (5.52 | ) | | | (1,759 | ) | | (4.43 | ) | | | (1,333 | ) | | (3.21 | ) | | | (1,316 | ) | | (3.60 | ) | | | (1,481 | ) | | (4.03 | ) |
| | | | | | | | | | | | | | | | | | | | | | | | | | | | | | | | | | | |
Total net charge-offs | | $ | 9,624 | | | 4.13 | | | $ | 8,701 | | | 3.64 | | | $ | 6,942 | | | 2.85 | | | $ | 5,541 | | | 2.36 | | | $ | 4,356 | | | 1.84 | |
| | | | | | | | | | | | | | | | | | | | | | | | | | | | | | | | | | | |
| | | | | | | | | | |
Supplemental managed basis data | | | | | | | | | | | | | | | | | | | | | | | | | | | | | | | | | | | |
Credit card - domestic | | $ | 4,816 | | | 13.92 | % | | $ | 4,530 | | | 12.69 | % | | $ | 3,421 | | | 9.20 | % | | $ | 2,929 | | | 7.66 | % | | $ | 2,643 | | | 6.87 | % |
Credit card - foreign | | | 661 | | | 8.41 | | | | 517 | | | 7.06 | | | | 373 | | | 5.47 | | | | 334 | | | 4.57 | | | | 353 | | | 4.21 | |
| | | | | | | | | | | | | | | | | | | | | | | | | | | | | | | | | | | |
Total credit card managed net losses | | $ | 5,477 | | | 12.90 | | | $ | 5,047 | | | 11.73 | | | $ | 3,794 | | | 8.62 | | | $ | 3,263 | | | 7.16 | | | $ | 2,996 | | | 6.40 | |
| | | | | | | | | | | | | | | | | | | | | | | | | | | | | | | | | | | |
| (1) | Net charge-off/loss ratios are calculated as annualized held net charge-offs or managed net losses divided by average outstanding held or managed loans and leases excluding loans measured at fair value under the fair value option during the period for each loan and lease category. |
| (2) | Excludes small business commercial - domestic loans. |
| (3) | Global Card Services is presented on a managed basis. The securitization offset is included within All Other. |
Loans are classified as domestic or foreign based upon the domicile of the borrower.
Certain prior period amounts have been reclassified to conform to current period presentation.
Information for periods beginning July 1, 2008 includes the Countrywide acquisition. Information for periods beginning January 1, 2009 includes the
Merrill Lynch acquisition. Prior periods have not been restated.
| | |
| This information is preliminary and based on company data available at the time of the presentation. | | 41 |
Bank of America Corporation and Subsidiaries
Year-to-Date Net Charge-offs/Losses and Net Charge-off/Loss Ratios (1)
(Dollars in millions)
| | | | | | | | | | | | | | | | | | |
| | | Nine Months Ended September 30 | | | |
| | | 2009 | | | | | 2008 | | | |
| Held Basis | | Amount | | | Percent | | | | | Amount | | | Percent | | | |
Residential mortgage | | $ | 3,117 | | | 1.64 | | | % | | $ | 459 | | | 0.23 | | | % |
Home equity | | | 5,490 | | | 4.70 | | | | | | 2,383 | | | 2.46 | | | |
Discontinued real estate | | | 87 | | | 0.64 | | | | | | (3 | ) | | (0.05 | ) | | |
Credit card - domestic | | | 5,001 | | | 12.51 | | | | | | 2,917 | | | 6.20 | | | |
Credit card - foreign | | | 844 | | | 5.95 | | | | | | 389 | | | 3.19 | | | |
Direct/Indirect consumer | | | 4,175 | | | 5.56 | | | | | | 2,060 | | | 3.35 | | | |
Other consumer | | | 314 | | | 12.54 | | | | | | 275 | | | 9.45 | | | |
| | | | | | | | | | | | | | | | | | |
Total consumer | | | 19,028 | | | 4.21 | | | | | | 8,480 | | | 2.01 | | | |
| | | | | | | | | | | | | | | | | | |
Commercial - domestic(2) | | | 1,553 | | | 1.01 | | | | | | 264 | | | 0.18 | | | |
Commercial real estate | | | 1,957 | | | 3.54 | | | | | | 505 | | | 1.08 | | | |
Commercial lease financing | | | 152 | | | 0.92 | | | | | | 29 | | | 0.17 | | | |
Commercial - foreign | | | 375 | | | 1.59 | | | | | | 44 | | | 0.18 | | | |
| | | | | | | | | | | | | | | | | | |
| | | 4,037 | | | 1.62 | | | | | | 842 | | | 0.36 | | | |
Small business commercial - domestic | | | 2,202 | | | 15.85 | | | | | | 1,368 | | | 9.23 | | | |
| | | | | | | | | | | | | | | | | | |
Total commercial | | | 6,239 | | | 2.37 | | | | | | 2,210 | | | 0.89 | | | |
| | | | | | | | | | | | | | | | | | |
Total net charge-offs | | $ | 25,267 | | | 3.53 | | | | | $ | 10,690 | | | 1.59 | | | |
| | | | | | | | | | | | | | | | | | |
By Business Segment | | | | | | | | | | | | | | | | | | |
Deposits | | $ | 276 | | | 3.39 | | | % | | $ | 260 | | | 4.60 | | | % |
Global Card Services(3) | | | 20,038 | | | 12.14 | | | | | | 11,100 | | | 6.23 | | | |
Home Loans & Insurance | | | 5,053 | | | 5.20 | | | | | | 2,128 | | | 2.84 | | | |
Global Banking | | | 4,347 | | | 1.81 | | | | | | 1,234 | | | 0.52 | | | |
Global Markets | | | 78 | | | 0.99 | | | | | | 17 | | | 0.13 | | | |
Global Wealth & Investment Management | | | 619 | | | 0.79 | | | | | | 252 | | | 0.39 | | | |
All Other(3) | | | (5,144 | ) | | (4.34 | ) | | | | | (4,301 | ) | | (4.33 | ) | | |
| | | | | | | | | | | | | | | | | | |
Total net charge-offs | | $ | 25,267 | | | 3.53 | | | | | $ | 10,690 | | | 1.59 | | | |
| | | | | | | | | | | | | | | | | | |
| | | | | | |
Supplemental managed basis data | | | | | | | | | | | | | | | | | | |
Credit card - domestic | | $ | 12,767 | | | 11.88 | | | % | | $ | 7,125 | | | 6.24 | | | % |
Credit card - foreign | | | 1,551 | | | 7.05 | | | | | | 994 | | | 4.06 | | | |
| | | | | | | | | | | | | | | | | | |
Total credit card managed net losses | | $ | 14,318 | | | 11.06 | | | | | $ | 8,119 | | | 5.85 | | | |
| | | | | | | | | | | | | | | | | | |
| (1) | Net charge-off/loss ratios are calculated as annualized held net charge-offs or managed net losses divided by average outstanding held or managed loans and leases excluding loans measured at fair value under the fair value option during the period for each loan and lease category. |
| (2) | Excludes small business commercial - domestic loans. |
| (3) | Global Card Services is presented on a managed basis. The securitization offset is included within All Other. |
Loans are classified as domestic or foreign based upon the domicile of the borrower.
Certain prior period amounts have been reclassified to conform to current period presentation.
Information for periods beginning July 1, 2008 includes the Countrywide acquisition. Information for periods beginning January 1, 2009 includes the
Merrill Lynch acquisition. Prior periods have not been restated.
| | |
| This information is preliminary and based on company data available at the time of the presentation. | | 42 |
Bank of America Corporation and Subsidiaries
Allocation of the Allowance for Credit Losses by Product Type
(Dollars in millions)
| | | | | | | | | | | | | | | | | | | | | | | | | | | | | | | | | |
| | | September 30, 2009 | | June 30, 2009 | | September 30, 2008 | | |
| Allowance for loan and lease losses | | Amount | | Percent of
Total | | | | Percent of Loans
and Leases
Outstanding(1) | | | | Amount | | Percent of
Total | | | | Percent of Loans
and Leases
Outstanding(1) | | | | Amount | | Percent of
Total | | | | Percent of Loans
and Leases
Outstanding(1) | | |
Residential mortgage | | $ | 4,461 | | 12.45 | | % | | 1.87 | | % | | $ | 4,119 | | 12.19 | | % | | 1.67 | | % | | $ | 1,376 | | 6.76 | | % | | 0.54 | | % |
Home equity | | | 9,719 | | 27.12 | | | | 6.39 | | | | | 8,664 | | 25.64 | | | | 5.59 | | | | | 4,744 | | 23.32 | | | | 3.12 | | |
Discontinued real estate | | | 1,016 | | 2.84 | | | | 6.57 | | | | | 398 | | 1.18 | | | | 2.28 | | | | | 82 | | 0.40 | | | | 0.37 | | |
Credit card - domestic | | | 5,182 | | 14.46 | | | | 10.53 | | | | | 5,153 | | 15.25 | | | | 10.53 | | | | | 3,624 | | 17.81 | | | | 5.75 | | |
Credit card - foreign | | | 1,328 | | 3.71 | | | | 6.33 | | | | | 1,320 | | 3.91 | | | | 6.46 | | | | | 633 | | 3.11 | | | | 3.45 | | |
Direct/Indirect consumer | | | 4,811 | | 13.43 | | | | 4.89 | | | | | 5,369 | | 15.89 | | | | 5.41 | | | | | 3,742 | | 18.39 | | | | 4.52 | | |
Other consumer | | | 205 | | 0.57 | | | | 6.27 | | | | | 210 | | 0.63 | | | | 6.22 | | | | | 184 | | 0.91 | | | | 5.02 | | |
| | | | | | | | | | | | | | | | | | | | | | | | | | | | | | | | | |
Total consumer | | | 26,722 | | 74.58 | | | | 4.62 | | | | | 25,233 | | 74.69 | | | | 4.27 | | | | | 14,385 | | 70.70 | | | | 2.40 | | |
| | | | | | | | | | | | | | | | | | | | | | | | | | | | | | | | | |
Commercial - domestic(2) | | | 5,385 | | 15.03 | | | | 2.59 | | | | | 5,486 | | 16.24 | | | | 2.52 | | | | | 4,072 | | 20.02 | | | | 1.86 | | |
Commercial real estate | | | 3,007 | | 8.39 | | | | 4.14 | | | | | 2,396 | | 7.09 | | | | 3.19 | | | | | 1,376 | | 6.76 | | | | 2.16 | | |
Commercial lease financing | | | 255 | | 0.71 | | | | 1.16 | | | | | 255 | | 0.75 | | | | 1.14 | | | | | 210 | | 1.03 | | | | 0.94 | | |
Commercial - foreign | | | 463 | | 1.29 | | | | 1.68 | | | | | 415 | | 1.23 | | | | 1.39 | | | | | 303 | | 1.49 | | | | 0.92 | | |
| | | | | | | | | | | | | | | | | | | | | | | | | | | | | | | | | |
Total commercial(3) | | | 9,110 | | 25.42 | | | | 2.76 | | | | | 8,552 | | 25.31 | | | | 2.48 | | | | | 5,961 | | 29.30 | | | | 1.76 | | |
| | | | | | | | | | | | | | | | | | | | | | | | | | | | | | | | | |
Allowance for loan and lease losses | | | 35,832 | | 100.00 | | % | | 3.95 | | | | | 33,785 | | 100.00 | | % | | 3.61 | | | | | 20,346 | | 100.00 | | % | | 2.17 | | |
| | | | | | | | | | | | | | | | | | | | | | | | | | | | | | | | | |
Reserve for unfunded lending commitments(4) | | | 1,567 | | | | | | | | | | | 1,992 | | | | | | | | | | | 427 | | | | | | | | |
| | | | | | | | | | | | | | | | | | | | | | | | | | | | | | | | | |
Allowance for credit losses | | $ | 37,399 | | | | | | | | | | $ | 35,777 | | | | | | | | | | $ | 20,773 | | | | | | | | |
| | | | | | | | | | | | | | | | | | | | | | | | | | | | | | | | | |
| (1) | Ratios are calculated as allowance for loan and lease losses as a percentage of loans and leases outstanding excluding loans measured at fair value under the fair value option for each loan and lease category. Loans measured at fair value include commercial - domestic loans of $4.0 billion, $4.4 billion and $4.0 billion, commercial - foreign loans of $2.1 billion, $2.5 billion and $1.2 billion, and commercial real estate loans of $98 million, $123 million and $213 million at September 30, 2009, June 30, 2009 and September 30, 2008. |
| (2) | Includes allowance for small business commercial - domestic loans of $2.7 billion, $2.8 billion and $2.2 billion at September 30, 2009, June 30, 2009 and September 30, 2008. |
| (3) | Includes allowance for loan and lease losses for impaired commercial loans of $1.3 billion, $1.6 billion and $561 million at September 30, 2009, June 30, 2009 and September 30, 2008. |
| (4) | Amounts for the periods beginning January 1, 2009 include the Merrill Lynch acquisition. The majority of the increase from September 30, 2008 relates to the fair value of the acquired Merrill Lynch unfunded lending commitments, excluding commitments accounted for under fair value option. |
Certain prior period amounts have been reclassified to conform to current period presentation.
Information for periods beginning July 1, 2008 includes the Countrywide acquisition. Information for periods beginning January 1, 2009 includes the
Merrill Lynch acquisition. Prior periods have not been restated.
| | |
| This information is preliminary and based on company data available at the time of the presentation. | | 43 |
Exhibit A: Non-GAAP Reconciliations
Bank of America Corporation and Subsidiaries
Global Card Services - Reconciliation
(Dollars in millions)
| | | | | | | | | | | | | | | | | | | | | | | | | | | | | | | | | | | | |
| | | Nine Months Ended September 30, 2009 | | | Nine Months Ended September 30, 2008 | | | Third Quarter 2009 | |
| | | Managed
Basis (1) | | | Securitization
Impact (2) | | | Held
Basis | | | Managed
Basis (1) | | | Securitization
Impact (2) | | | Held
Basis | | | Managed
Basis (1) | | | Securitization
Impact (2) | | | Held
Basis | |
Net interest income(3) | | $ | 15,312 | | | $ | (7,024 | ) | | $ | 8,288 | | | $ | 14,279 | | | $ | (6,402 | ) | | $ | 7,877 | | | $ | 4,995 | | | $ | (2,275 | ) | | $ | 2,720 | |
Noninterest income: | | | | | | | | | | | | | | | | | | | | | | | | | | | | | | | | | | | | |
Card income | | | 6,462 | | | | (1,355 | ) | | | 5,107 | | | | 7,564 | | | | 1,768 | | | | 9,332 | | | | 2,183 | | | | (1,007 | ) | | | 1,176 | |
All other income | | | 407 | | | | (94 | ) | | | 313 | | | | 1,359 | | | | (179 | ) | | | 1,180 | | | | 149 | | | | (26 | ) | | | 123 | |
| | | | | | | | | | | | | | | | | | | | | | | | | | | | | | | | | | | | |
Total noninterest income | | | 6,869 | | | | (1,449 | ) | | | 5,420 | | | | 8,923 | | | | 1,589 | | | | 10,512 | | | | 2,332 | | | | (1,033 | ) | | | 1,299 | |
| | | | | | | | | | | | | | | | | | | | | | | | | | | | | | | | | | | | |
Total revenue, net of interest expense | | | 22,181 | | | | (8,473 | ) | | | 13,708 | | | | 23,202 | | | | (4,813 | ) | | | 18,389 | | | | 7,327 | | | | (3,308 | ) | | | 4,019 | |
| | | | | | | | | |
Provision for credit losses | | | 23,157 | | | | (8,473 | ) | | | 14,684 | | | | 14,314 | | | | (4,813 | ) | | | 9,501 | | | | 6,975 | | | | (3,308 | ) | | | 3,667 | |
Noninterest expense | | | 6,024 | | | | — | | | | 6,024 | | | | 6,980 | | | | — | | | | 6,980 | | | | 1,968 | | | | — | | | | 1,968 | |
| | | | | | | | | | | | | | | | | | | | | | | | | | | | | | | | | | | | |
Income (loss) before income taxes | | | (7,000 | ) | | | — | | | | (7,000 | ) | | | 1,908 | | | | — | | | | 1,908 | | | | (1,616 | ) | | | — | | | | (1,616 | ) |
Income tax expense (benefit) (3) | | | (2,473 | ) | | | — | | | | (2,473 | ) | | | 664 | | | | — | | | | 664 | | | | (580 | ) | | | — | | | | (580 | ) |
| | | | | | | | | | | | | | | | | | | | | | | | | | | | | | | | | | | | |
Net income (loss) | | $ | (4,527 | ) | | $ | — | | | $ | (4,527 | ) | | $ | 1,244 | | | $ | — | | | $ | 1,244 | | | $ | (1,036 | ) | | $ | — | | | $ | (1,036 | ) |
| | | | | | | | | | | | | | | | | | | | | | | | | | | | | | | | | | | | |
| | | | | | | | | |
Balance sheet | | | | | | | | | | | | | | | | | | | | | | | | | | | | | | | | | | | | |
Average - total loans and leases | | $ | 220,666 | | | $ | (100,727 | ) | | $ | 119,939 | | | $ | 237,817 | | | $ | (106,177 | ) | | $ | 131,640 | | | $ | 213,340 | | | $ | (97,520 | ) | | $ | 115,820 | |
Period end - total loans and leases | | | 207,727 | | | | (94,328 | ) | | | 113,399 | | | | 235,998 | | | | (102,048 | ) | | | 133,950 | | | | 207,727 | | | | (94,328 | ) | | | 113,399 | |
| | | |
| | | Second Quarter 2009 | | | First Quarter 2009 | | | Fourth Quarter 2008 | |
| | | Managed
Basis (1) | | | Securitization
Impact (2) | | | Held
Basis | | | Managed
Basis (1) | | | Securitization
Impact (2) | | | Held
Basis | | | Managed
Basis (1) | | | Securitization
Impact (2) | | | Held
Basis | |
Net interest income(3) | | $ | 5,052 | | | $ | (2,358 | ) | | $ | 2,694 | | | $ | 5,265 | | | $ | (2,391 | ) | | $ | 2,874 | | | $ | 5,310 | | | $ | (2,299 | ) | | $ | 3,011 | |
Noninterest income: | | | | | | | | | | | | | | | | | | | | | | | | | | | | | | | | | | | | |
Card income | | | 2,164 | | | | (592 | ) | | | 1,572 | | | | 2,115 | | | | 244 | | | | 2,359 | | | | 2,469 | | | | 482 | | | | 2,951 | |
All other income | | | 123 | | | | (33 | ) | | | 90 | | | | 135 | | | | (35 | ) | | | 100 | | | | 239 | | | | (40 | ) | | | 199 | |
| | | | | | | | | | | | | | | | | | | | | | | | | | | | | | | | | | | | |
Total noninterest income | | | 2,287 | | | | (625 | ) | | | 1,662 | | | | 2,250 | | | | 209 | | | | 2,459 | | | | 2,708 | | | | 442 | | | | 3,150 | |
| | | | | | | | | | | | | | | | | | | | | | | | | | | | | | | | | | | | |
Total revenue, net of interest expense | | | 7,339 | | | | (2,983 | ) | | | 4,356 | | | | 7,515 | | | | (2,182 | ) | | | 5,333 | | | | 8,018 | | | | (1,857 | ) | | | 6,161 | |
| | | | | | | | | |
Provision for credit losses | | | 7,741 | | | | (2,983 | ) | | | 4,758 | | | | 8,441 | | | | (2,182 | ) | | | 6,259 | | | | 5,851 | | | | (1,857 | ) | | | 3,994 | |
Noninterest expense | | | 1,977 | | | | — | | | | 1,977 | | | | 2,079 | | | | — | | | | 2,079 | | | | 2,179 | | | | — | | | | 2,179 | |
| | | | | | | | | | | | | | | | | | | | | | | | | | | | | | | | | | | | |
Loss before income taxes | | | (2,379 | ) | | | — | | | | (2,379 | ) | | | (3,005 | ) | | | — | | | | (3,005 | ) | | | (12 | ) | | | — | | | | (12 | ) |
Income tax benefit (3) | | | (762 | ) | | | — | | | | (762 | ) | | | (1,131 | ) | | | — | | | | (1,131 | ) | | | (3 | ) | | | — | | | | (3 | ) |
| | | | | | | | | | | | | | | | | | | | | | | | | | | | | | | | | | | | |
Net loss | | $ | (1,617 | ) | | $ | — | | | $ | (1,617 | ) | | $ | (1,874 | ) | | $ | — | | | $ | (1,874 | ) | | $ | (9 | ) | | $ | — | | | $ | (9 | ) |
| | | | | | | | | | | | | | | | | | | | | | | | | | | | | | | | | | | | |
| | | | | | | | | |
Balance sheet | | | | | | | | | | | | | | | | | | | | | | | | | | | | | | | | | | | | |
Average - total loans and leases | | $ | 220,365 | | | $ | (102,046 | ) | | $ | 118,319 | | | $ | 228,461 | | | $ | (102,672 | ) | | $ | 125,789 | | | $ | 233,427 | | | $ | (99,116 | ) | | $ | 134,311 | |
Period end - total loans and leases | | | 215,904 | | | | (100,438 | ) | | | 115,466 | | | | 221,984 | | | | (105,392 | ) | | | 116,592 | | | | 233,040 | | | | (100,960 | ) | | | 132,080 | |
| | | | | | | |
| | | Third Quarter 2008 | | | | | | | | | | | | | | | | | | | |
| | | Managed
Basis (1) | | | Securitization
Impact (2) | | | Held
Basis | | | | | | | | | | | | | | | | | | | |
Net interest income(3) | | $ | 4,930 | | | $ | (2,207 | ) | | $ | 2,723 | | | | | | | | | | | | | | | | | | | | | | | | | |
Noninterest income: | | | | | | | | | | | | | | | | | | | | | | | | | | | | | | | | | | | | |
Card income | | | 2,289 | | | | 507 | | | | 2,796 | | | | | | | | | | | | | | | | | | | | | | | | | |
All other income | | | 534 | | | | (54 | ) | | | 480 | | | | | | | | | | | | | | | | | | | | | | | | | |
| | | | | | | | | | | | | | | | | | | | | | | | | | | | | | | | | | | | |
Total noninterest income | | | 2,823 | | | | 453 | | | | 3,276 | | | | | | | | | | | | | | | | | | | | | | | | | |
| | | | | | | | | | | | | | | | | | | | | | | | | | | | | | | | | | | | |
Total revenue, net of interest expense | | | 7,753 | | | | (1,754 | ) | | | 5,999 | | | | | | | | | | | | | | | | | | | | | | | | | |
| | | | | | | | | |
Provision for credit losses | | | 5,602 | | | | (1,754 | ) | | | 3,848 | | | | | | | | | | | | | | | | | | | | | | | | | |
Noninterest expense | | | 2,405 | | | | — | | | | 2,405 | | | | | | | | | | | | | | | | | | | | | | | | | |
| | | | | | | | | | | | | | | | | | | | | | | | | | | | | | | | | | | | |
Loss before income taxes | | | (254 | ) | | | — | | | | (254 | ) | | | | | | | | | | | | | | | | | | | | | | | | |
Income tax benefit (3) | | | (87 | ) | | | — | | | | (87 | ) | | | | | | | | | | | | | | | | | | | | | | | | |
| | | | | | | | | | | | | | | | | | | | | | | | | | | | | | | | | | | | |
Net loss | | $ | (167 | ) | | $ | — | | | $ | (167 | ) | | | | | | | | | | | | | | | | | | | | | | | | |
| | | | | | | | | | | | | | | | | | | | | | | | | | | | | | | | | | | | |
| | | | | | | | | |
Balance sheet | | | | | | | | | | | | | | | | | | | | | | | | | | | | | | | | | | | | |
Average - total loans and leases | | $ | 239,951 | | | $ | (105,919 | ) | | $ | 134,032 | | | | | | | | | | | | | | | | | | | | | | | | | |
Period end - total loans and leases | | | 235,998 | | | | (102,048 | ) | | | 133,950 | | | | | | | | | | | | | | | | | | | | | | | | | |
| (1) | Provision for credit losses represents provision for credit losses on held loans combined with realized credit losses associated with the securitized loan portfolio. |
| (2) | The securitization impact on net interest income is on a funds transfer pricing methodology consistent with the way funding costs are allocated to the businesses. |
| (3) | Fully taxable-equivalent basis |
Certain prior period amounts have been reclassified among the segments to conform to the current period presentation.
The Corporation reportsGlobal Card Services’results on a managed basis which is consistent with the way that management evaluates the results ofGlobal Card Services. Managed basis assumes that securitized loans were not sold and presents earnings on these loans in a manner similar to the way loans that have not been sold (i.e., held loans) are presented. Loan securitization is an alternative funding process that is used by the Corporation to diversify funding sources. Loan securitization removes loans from the Consolidated Balance Sheet through the sale of loans to an off-balance sheet qualified special purpose entity which is excluded from the Corporation’s Consolidated Financial Statements in accordance with accounting principles generally accepted in the United States (GAAP).
The performance of the managed portfolio is important in understandingGlobal Card Services’ results as it demonstrates the results of the entire portfolio serviced by the business. Securitized loans continue to be serviced by the business and are subject to the same underwriting standards and ongoing monitoring as held loans. In addition, excess servicing income is exposed to similar credit risk and repricing of interest rates as held loans.Global Card Services’ managed income statement line items differ from a held basis reported as follows:
| • | | Managed net interest income includesGlobal Card Services’ net interest income on held loans and interest income on the securitized loans less the internal funds transfer pricing allocation related to securitized loans. |
| • | | Managed noninterest income includesGlobal Card Services’ noninterest income on a held basis less the reclassification of certain components of card income (e.g., excess servicing income) to record securitized net interest income and provision for credit losses. Noninterest income, both on a held and managed basis, also includes the impact of adjustments to the interest-only strips that are recorded in card income as management continues to manage this impact withinGlobal Card Services. |
| • | | Provision for credit losses represents the provision for credit losses on held loans combined with realized credit losses associated with the securitized loan portfolio. |
Information for periods beginning July 1, 2008 includes the Countrywide acquisition. Information for periods beginning January 1, 2009 includes the
Merrill Lynch acquisition. Prior periods have not been restated.
| | |
| This information is preliminary and based on company data available at the time of the presentation. | | 44 |
Exhibit A: Non-GAAP Reconciliations - continued
Bank of America Corporation and Subsidiaries
All Other - Reconciliation
(Dollars in millions)
| | | | | | | | | | | | | | | | | | | | | | | | | | | | | | | | | | | | |
| | | Nine Months Ended September 30, 2009 | | | Nine Months Ended September 30, 2008 | | | Third Quarter 2009 | |
| | | Reported
Basis (1) | | | Securitization
Offset (2) | | | As
Adjusted | | | Reported
Basis (1) | | | Securitization
Offset (2) | | | As
Adjusted | | | Reported
Basis (1) | | | Securitization
Offset (2) | | | As
Adjusted | |
Net interest income(3) | | $ | (5,399 | ) | | $ | 7,024 | | | $ | 1,625 | | | $ | (6,143 | ) | | $ | 6,402 | | | $ | 259 | | | $ | (1,867 | ) | | $ | 2,275 | | | $ | 408 | |
Noninterest income: | | | | | | | | | | | | | | | | | | | | | | | | | | | | | | | | | | | | |
Card income (loss) | | | (464 | ) | | | 1,355 | | | | 891 | | | | 1,797 | | | | (1,768 | ) | | | 29 | | | | (720 | ) | | | 1,007 | | | | 287 | |
Equity investment income | | | 8,191 | | | | — | | | | 8,191 | | | | 651 | | | | — | | | | 651 | | | | 886 | | | | — | | | | 886 | |
Gains on sales of debt securities | | | 3,584 | | | | — | | | | 3,584 | | | | 349 | | | | — | | | | 349 | | | | 1,441 | | | | — | | | | 1,441 | |
All other income (loss) | | | (4,165 | ) | | | 94 | | | | (4,071 | ) | | | (380 | ) | | | 179 | | | | (201 | ) | | | (2,371 | ) | | | 26 | | | | (2,345 | ) |
| | | | | | | | | | | | | | | | | | | | | | | | | | | | | | | | | | | | |
Total noninterest income | | | 7,146 | | | | 1,449 | | | | 8,595 | | | | 2,417 | | | | (1,589 | ) | | | 828 | | | | (764 | ) | | | 1,033 | | | | 269 | |
| | | | | | | | | | | | | | | | | | | | | | | | | | | | | | | | | | | | |
Total revenue, net of interest expense | | | 1,747 | | | | 8,473 | | | | 10,220 | | | | (3,726 | ) | | | 4,813 | | | | 1,087 | | | | (2,631 | ) | | | 3,308 | | | | 677 | |
| | | | | | | | | |
Provision for credit losses | | | (1,908 | ) | | | 8,473 | | | | 6,565 | | | | (3,158 | ) | | | 4,813 | | | | 1,655 | | | | (1,222 | ) | | | 3,308 | | | | 2,086 | |
Merger and restructuring charges | | | 2,188 | | | | — | | | | 2,188 | | | | 629 | | | | — | | | | 629 | | | | 594 | | | | — | | | | 594 | |
All other noninterest expense | | | 1,439 | | | | — | | | | 1,439 | | | | 48 | | | | — | | | | 48 | | | | 612 | | | | — | | | | 612 | |
| | | | | | | | | | | | | | | | | | | | | | | | | | | | | | | | | | | | |
Income (loss) before income taxes | | | 28 | | | | — | | | | 28 | | | | (1,245 | ) | | | — | | | | (1,245 | ) | | | (2,615 | ) | | | — | | | | (2,615 | ) |
Income tax benefit (3) | | | (1,975 | ) | | | — | | | | (1,975 | ) | | | (534 | ) | | | — | | | | (534 | ) | | | (983 | ) | | | — | | | | (983 | ) |
| | | | | | | | | | | | | | | | | | | | | | | | | | | | | | | | | | | | |
Net income (loss) | | $ | 2,003 | | | $ | — | | | $ | 2,003 | | | $ | (711 | ) | | $ | — | | | $ | (711 | ) | | $ | (1,632 | ) | | $ | — | | | $ | (1,632 | ) |
| | | | | | | | | | | | | | | | | | | | | | | | | | | | | | | | | | | | |
| | | | | | | | | |
Balance sheet | | | | | | | | | | | | | | | | | | | | | | | | | | | | | | | | | | | | |
Average - total loans and leases | | $ | 158,721 | | | $ | 100,727 | | | $ | 259,448 | | | $ | 132,615 | | | $ | 106,177 | | | $ | 238,792 | | | $ | 147,666 | | | $ | 97,520 | | | $ | 245,186 | |
Period end - total loans and leases | | | 145,856 | | | | 94,328 | | | | 240,184 | | | | 146,365 | | | | 102,048 | | | | 248,413 | | | | 145,856 | | | | 94,328 | | | | 240,184 | |
| | | |
| | | Second Quarter 2009 | | | First Quarter 2009 | | | Fourth Quarter 2008 | |
| | | Reported
Basis (1) | | | Securitization
Offset (2) | | | As
Adjusted | | | Reported
Basis (1) | | | Securitization
Offset (2) | | | As
Adjusted | | | Reported
Basis (1) | | | Securitization
Offset (2) | | | As
Adjusted | |
Net interest income(3) | | $ | (1,622 | ) | | $ | 2,358 | | | $ | 736 | | | $ | (1,910 | ) | | $ | 2,391 | | | $ | 481 | | | $ | (1,875 | ) | | $ | 2,299 | | | $ | 424 | |
Noninterest income: | | | | | | | | | | | | | | | | | | | | | | | | | | | | | | | | | | | | |
Card income (loss) | | | (278 | ) | | | 592 | | | | 314 | | | | 534 | | | | (244 | ) | | | 290 | | | | 368 | | | | (482 | ) | | | (114 | ) |
Equity investment income (loss) | | | 5,979 | | | | — | | | | 5,979 | | | | 1,326 | | | | — | | | | 1,326 | | | | (388 | ) | | | — | | | | (388 | ) |
Gains on sales of debt securities | | | 672 | | | | — | | | | 672 | | | | 1,471 | | | | — | | | | 1,471 | | | | 783 | | | | — | | | | 783 | |
All other income (loss) | | | (4,335 | ) | | | 33 | | | | (4,302 | ) | | | 2,541 | | | | 35 | | | | 2,576 | | | | (331 | ) | | | 40 | | | | (291 | ) |
| | | | | | | | | | | | | | | | | | | | | | | | | | | | | | | | | | | | |
Total noninterest income | | | 2,038 | | | | 625 | | | | 2,663 | | | | 5,872 | | | | (209 | ) | | | 5,663 | | | | 432 | | | | (442 | ) | | | (10 | ) |
| | | | | | | | | | | | | | | | | | | | | | | | | | | | | | | | | | | | |
Total revenue, net of interest expense | | | 416 | | | | 2,983 | | | | 3,399 | | | | 3,962 | | | | 2,182 | | | | 6,144 | | | | (1,443 | ) | | | 1,857 | | | | 414 | |
| | | | | | | | | |
Provision for credit losses | | | (9 | ) | | | 2,983 | | | | 2,974 | | | | (677 | ) | | | 2,182 | | | | 1,505 | | | | (613 | ) | | | 1,857 | | | | 1,244 | |
Merger and restructuring charges | | | 829 | | | | — | | | | 829 | | | | 765 | | | | — | | | | 765 | | | | 306 | | | | — | | | | 306 | |
All other noninterest expense | | | 590 | | | | — | | | | 590 | | | | 237 | | | | — | | | | 237 | | | | 142 | | | | — | | | | 142 | |
| | | | | | | | | | | | | | | | | | | | | | | | | | | | | | | | | | | | |
Income (loss) before income taxes | | | (994 | ) | | | — | | | | (994 | ) | | | 3,637 | | | | — | | | | 3,637 | | | | (1,278 | ) | | | — | | | | (1,278 | ) |
Income tax expense (benefit) (3) | | | (1,737 | ) | | | — | | | | (1,737 | ) | | | 745 | | | | — | | | | 745 | | | | (748 | ) | | | — | | | | (748 | ) |
| | | | | | | | | | | | | | | | | | | | | | | | | | | | | | | | | | | | |
Net income (loss) | | $ | 743 | | | $ | — | | | $ | 743 | | | $ | 2,892 | | | $ | — | | | $ | 2,892 | | | $ | (530 | ) | | $ | — | | | $ | (530 | ) |
| | | | | | | | | | | | | | | | | | | | | | | | | | | | | | | | | | | | |
| | | | | | | | | |
Balance sheet | | | | | | | | | | | | | | | | | | | | | | | | | | | | | | | | | | | | |
Average - total loans and leases | | $ | 159,144 | | | $ | 102,046 | | | $ | 261,190 | | | $ | 169,593 | | | $ | 102,672 | | | $ | 272,265 | | | $ | 145,241 | | | $ | 99,116 | | | $ | 244,357 | |
Period end - total loans and leases | | | 153,010 | | | | 100,438 | | | | 253,448 | | | | 165,535 | | | | 105,392 | | | | 270,927 | | | | 136,163 | | | | 100,960 | | | | 237,123 | |
| | | |
| | | Third Quarter 2008 | | | | | | | |
| | | Reported
Basis (1) | | | Securitization
Offset (2) | | | As
Adjusted | | | | | | | | | | | | | | | | | | | |
Net interest income(3) | | $ | (2,342 | ) | | $ | 2,207 | | | $ | (135 | ) | | | | | | | | | | | | | | | | | | | | | | | | |
Noninterest income: | | | | | | | | | | | | | | | | | | | | | | | | | | | | | | | | | | | | |
Card income | | | 538 | | | | (507 | ) | | | 31 | | | | | | | | | | | | | | | | | | | | | | | | | |
Equity investment loss | | | (327 | ) | | | — | | | | (327 | ) | | | | | | | | | | | | | | | | | | | | | | | | |
Losses on sales of debt securities | | | (3 | ) | | | — | | | | (3 | ) | | | | | | | | | | | | | | | | | | | | | | | | |
All other income | | | 66 | | | | 54 | | | | 120 | | | | | | | | | | | | | | | | | | | | | | | | | |
| | | | | | | | | | | | | | | | | | | | | | | | | | | | | | | | | | | | |
Total noninterest income | | | 274 | | | | (453 | ) | | | (179 | ) | | | | | | | | | | | | | | | | | | | | | | | | |
| | | | | | | | | | | | | | | | | | | | | | | | | | | | | | | | | | | | |
Total revenue, net of interest expense | | | (2,068 | ) | | | 1,754 | | | | (314 | ) | | | | | | | | | | | | | | | | | | | | | | | | |
| | | | | | | | | |
Provision for credit losses | | | (996 | ) | | | 1,754 | | | | 758 | | | | | | | | | | | | | | | | | | | | | | | | | |
Merger and restructuring charges | | | 247 | | | | — | | | | 247 | | | | | | | | | | | | | | | | | | | | | | | | | |
All other noninterest expense | | | (86 | ) | | | — | | | | (86 | ) | | | | | | | | | | | | | | | | | | | | | | | | |
| | | | | | | | | | | | | | | | | | | | | | | | | | | | | | | | | | | | |
Loss before income taxes | | | (1,233 | ) | | | — | | | | (1,233 | ) | | | | | | | | | | | | | | | | | | | | | | | | |
Income tax benefit (3) | | | (540 | ) | | | — | | | | (540 | ) | | | | | | | | | | | | | | | | | | | | | | | | |
| | | | | | | | | | | | | | | | | | | | | | | | | | | | | | | | | | | | |
Net loss | | $ | (693 | ) | | $ | — | | | $ | (693 | ) | | | | | | | | | | | | | | | | | | | | | | | | |
| | | | | | | | | | | | | | | | | | | | | | | | | | | | | | | | | | | | |
| | | | | | | | | |
Balance sheet | | | | | | | | | | | | | | | | | | | | | | | | | | | | | | | | | | | | |
Average - total loans and leases | | $ | 146,305 | | | $ | 105,919 | | | $ | 252,224 | | | | | | | | | | | | | | | | | | | | | | | | | |
Period end - total loans and leases | | $ | 146,365 | | | | 102,048 | | | | 248,413 | | | | | | | | | | | | | | | | | | | | | | | | | |
| (1) | Provision for credit losses represents provision for credit losses in All Other combined with the Global Card Services securitization offset. |
| (2) | The securitization offset on net interest income is on a funds transfer pricing methodology consistent with the way funding costs are allocated to the businesses. |
| (3) | Fully taxable-equivalent basis |
Certain prior period amounts have been reclassified among the segments to conform to the current period presentation.
Information for periods beginning July 1, 2008 includes the Countrywide acquisition. Information for periods beginning January 1, 2009 includes the
Merrill Lynch acquisition. Prior periods have not been restated.
| | |
| This information is preliminary and based on company data available at the time of the presentation. | | 45 |
Appendix: Selected Slides from the
Third Quarter 2009 Earnings Release Presentation
Information for periods beginning July 1, 2008 includes the Countrywide acquisition. Information for periods beginning January 1, 2009 includes the
Merrill Lynch acquisition. Prior periods have not been restated.
| | |
| This information is preliminary and based on company data available at the time of the presentation. | | 46 |
Items Impacting Net Revenue
($ in billions)
3Q09 2Q09
Total revenue, net of interest expense (FTE) $ 26.4 $ 33.1
Fair value credit adjustment on Merrill Lynch structured notes (1.8) (3.6)
Counterparty valuation adjustment on derivative liabilities (0.7) (1.6)
Capital markets disruption charges 0.2 (1.3)
Pre-tax gain on sale of CCB shares - 5.3
Pre-tax gain on sale of merchant processing business to a JV - 3.8
Total revenue, adjusted for the above items $ 28.7 $ 30.5
Revenue, adjusted for the above items, down from 2Q09
– Mortgage banking income declined $1.2 billion on lower production volumes and weaker MSR hedge performance
– Still strong but seasonally lower capital markets revenue
– Card income on held basis includes the effect of higher losses on securitized loans
Offset by
– Higher gains on sales of debt securities
– Higher banking fees
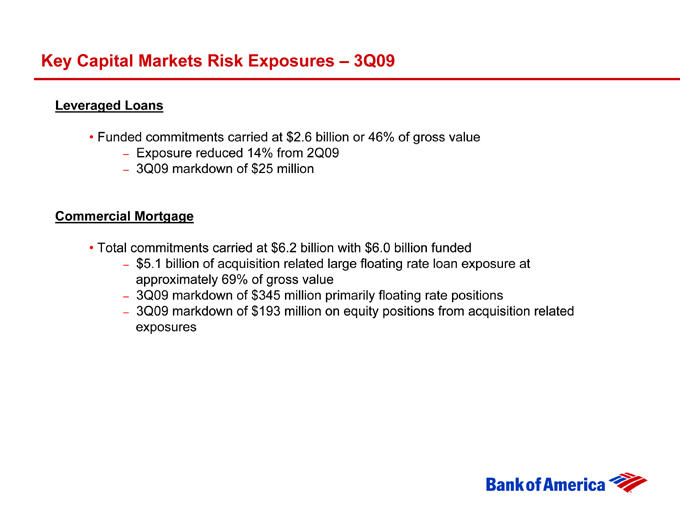
Key Capital Markets Risk Exposures – 3Q09
Leveraged Loans
Funded commitments carried at $2.6 billion or 46% of gross value
– Exposure reduced 14% from 2Q09
– 3Q09 markdown of $25 million
Commercial Mortgage
Total commitments carried at $6.2 billion with $6.0 billion funded
– $5.1 billion of acquisition related large floating rate loan exposure at approximately 69% of gross value
– 3Q09 markdown of $345 million primarily floating rate positions
– 3Q09 markdown of $193 million on equity positions from acquisition related exposures
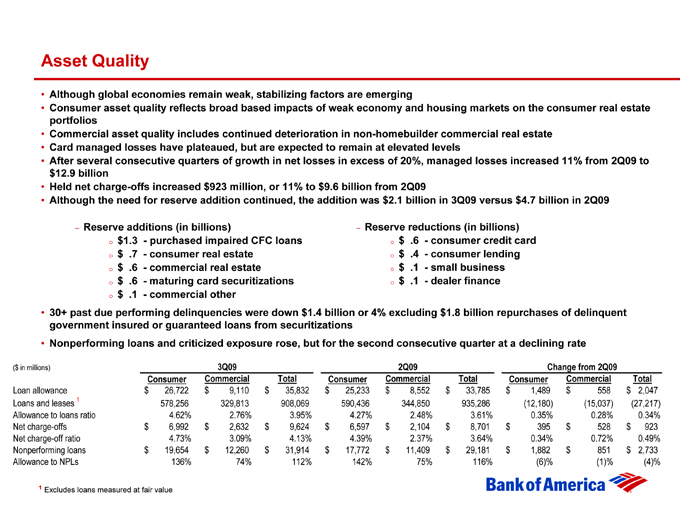
Asset Quality
o Although global economies remain weak, stabilizing factors are emerging
o Consumer asset quality reflects broad based impacts of weak economy and housing markets on the consumer real estate portfolios
o Commercial asset quality includes continued deterioration in non-homebuilder commercial real estate
o Card managed losses have plateaued, but are expected to remain at elevated levels
o After several consecutive quarters of growth in net losses in excess of 20%, managed losses increased 11% from 2Q09 to $12.9 billion
o Held net charge-offs increased $923 million, or 11% to $9.6 billion from 2Q09
o Although the need for reserve addition continued, the addition was $2.1 billion in 3Q09 versus $4.7 billion in 2Q09
- Reserve additions (in billions) o $1.3 - purchased impaired CFC loans o $ .7 - consumer real estate o $ .6 - commercial real estate o $ .6 - maturing card securitizations o $ .1 - commercial other
- Reserve reductions (in billions) o $ .6 - consumer credit card o $ .4 - consumer lending o $ .1 - small business o $ .1 - dealer finance
30+ past due performing delinquencies were down $1.4 billion or 4% excluding $1.8 billion repurchases of delinquent government insured or guaranteed loans from securitizations Nonperforming loans and criticized exposure rose, but for the second consecutive quarter at a declining rate
($ in millions) 3Q09 2Q09 Change from 2Q09
Consumer Commercial Total Consumer Commercial Total Consumer Commercial Total
Loan allowance $ 26,722 $ 9,110 $ 35,832 $ 25,233 $ 8,552 $ 33,785 $ 1,489 $ 558 $ 2,047
Loans and leases 1 578,256 329,813 908,069 590,436 344,850 935,286 (12,180) (15,037) (27,217)
Allowance to loans ratio 4.62% 2.76% 3.95% 4.27% 2.48% 3.61% 0.35% 0.28% 0.34%
Net charge-offs $ 6,992 $ 2,632 $ 9,624 $ 6,597 $ 2,104 $ 8,701 $ 395 $ 528 $ 923
Net charge-off ratio 4.73% 3.09% 4.13% 4.39% 2.37% 3.64% 0.34% 0.72% 0.49%
Nonperforming loans $ 19,654 $ 12,260 $ 31,914 $ 17,772 $ 11,409 $ 29,181 $ 1,882 $ 851 $ 2,733
Allowance to NPLs 136% 74% 112% 142% 75% 116% (6)% (1)% (4)%
1 Excludes loans measured at fair value
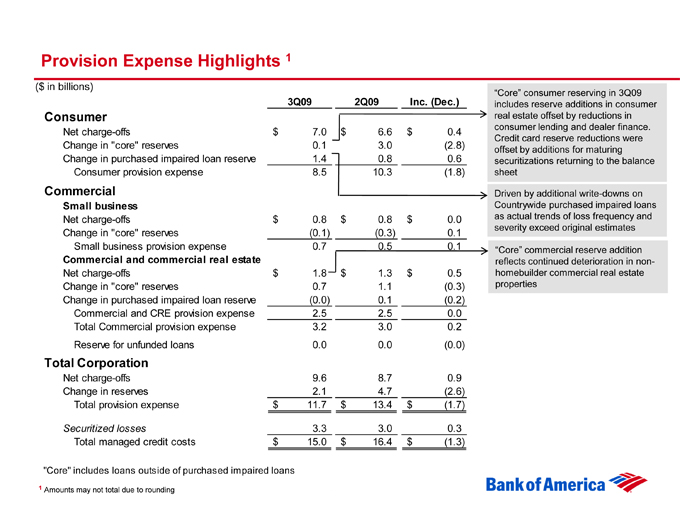
Provision Expense Highlights 1
($ in billions)
3Q09 2Q09 Inc. (Dec.)
Consumer
Net charge-offs $ 7.0 $ 6.6 $ 0.4
Change in “core” reserves 0.1 3.0 (2.8)
Change in purchased impaired loan reserve 1.4 0.8 0.6
Consumer provision expense 8.5 10.3 (1.8)
Commercial
Small business
Net charge-offs $ 0.8 $ 0.8 $ 0.0
Change in “core” reserves (0.1) (0.3) 0.1
Small business provision expense 0.7 0.5 0.1
Commercial and commercial real estate
Net charge-offs $ 1.8 $ 1.3 $ 0.5
Change in “core” reserves 0.7 1.1 (0.3)
Change in purchased impaired loan reserve (0.0) 0.1 (0.2)
Commercial and CRE provision expense 2.5 2.5 0.0
Total Commercial provision expense 3.2 3.0 0.2
Reserve for unfunded loans 0.0 0.0 (0.0)
Total Corporation
Net charge-offs 9.6 8.7 0.9
Change in reserves 2.1 4.7 (2.6)
Total provision expense $ 11.7 $ 13.4 $ (1.7)
Securitized losses 3.3 3.0 0.3
Total managed credit costs $ 15.0 $ 16.4 $ (1.3)
“Core” includes loans outside of purchased impaired loans
1 Amounts may not total due to rounding
“Core” consumer reserving in 3Q09 includes reserve additions in consumer real estate offset by reductions in consumer lending and dealer finance. Credit card reserve reductions were offset by additions for maturing securitizations returning to the balance sheet
Driven by additional write-downs on Countrywide purchased impaired loans as actual trends of loss frequency and severity exceed original estimates
“Core” commercial reserve addition reflects continued deterioration in non-homebuilder commercial real estate properties
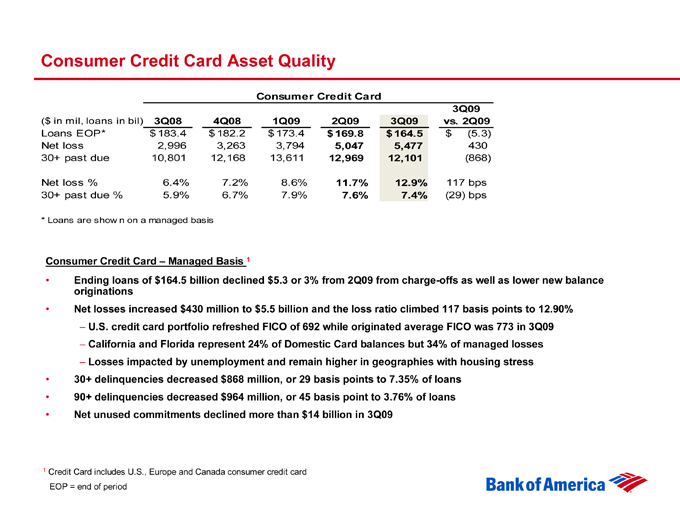
Consumer Credit Card Asset Quality
Consumer Credit Card
($ in mil, loans in bil) 3Q08 4Q08 1Q09 2Q09 3Q09 3Q09 vs. 2Q09
Loans EOP* $ 183.4 $ 182.2 $ 173.4 $ 169.8 $ 164.5 $ (5.3)
Net loss 2,996 3,263 3,794 5,047 5,477 430
30+ past due 10,801 12,168 13,611 12,969 12,101 (868)
Net loss % 6.4% 7.2% 8.6% 11.7% 12.9% 117 bps
30+ past due % 5.9% 6.7% 7.9% 7.6% 7.4% (29) bps
* Loans are shown on a managed basis
Consumer Credit Card – Managed Basis 1
• Ending loans of $164.5 billion declined $5.3 or 3% from 2Q09 from charge-offs as well as lower new balance
originations
• Net losses increased $430 million to $5.5 billion and the loss ratio climbed 117 basis points to 12.90%
– U.S. credit card portfolio refreshed FICO of 692 while originated average FICO was 773 in 3Q09
– California and Florida represent 24% of Domestic Card balances but 34% of managed losses
– Losses impacted by unemployment and remain higher in geographies with housing stress
• 30+ delinquencies decreased $868 million, or 29 basis points to 7.35% of loans
• 90+ delinquencies decreased $964 million, or 45 basis point to 3.76% of loans
• Net unused commitments declined more than $14 billion in 3Q09
1 Credit Card includes U.S., Europe and Canada consumer credit card
EOP = end of period
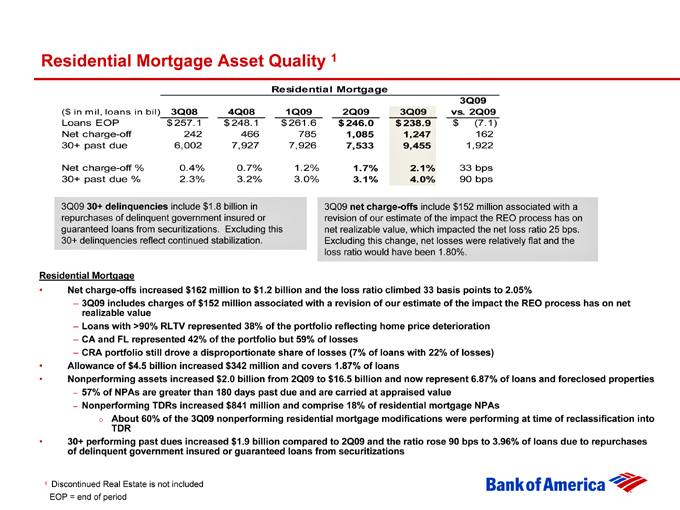
Residential Mortgage Asset Quality 1
Residential Mortgage
3Q09
($ in mil, loans in bil) 3Q08 4Q08 1Q09 2Q09 3Q09 vs. 2Q09
Loans EOP $ 257.1 $ 248.1 $ 261.6 $ 246.0 $ 238.9 $ (7.1)
Net charge-off 242 466 785 1,085 1,247 162
30+ past due 6,002 7,927 7,926 7,533 9,455 1,922
Net charge-off % 0.4% 0.7% 1.2% 1.7% 2.1% 33 bps
30+ past due % 2.3% 3.2% 3.0% 3.1% 4.0% 90 bps
3Q09 30+ delinquencies include $1.8 billion in repurchases of delinquent government insured or guaranteed loans from securitizations. Excluding this 30+ delinquencies reflect continued stabilization.
3Q09 net charge-offs include $152 million associated with a revision of our estimate of the impact the REO process has on net realizable value, which impacted the net loss ratio 25 bps. Excluding this change, net losses were relatively flat and the loss ratio would have been 1.80%.
Residential Mortgage
o Net charge-offs increased $162 million to $1.2 billion and the loss ratio climbed 33 basis points to 2.05%
- 3Q09 includes charges of $152 million associated with a revision of our estimate of the impact the REO process has on net realizable value
- Loans with >90% RLTV represented 38% of the portfolio reflecting home price deterioration
- CA and FL represented 42% of the portfolio but 59% of losses
- CRA portfolio still drove a disproportionate share of losses (7% of loans with 22% of losses)
o Allowance of $4.5 billion increased $342 million and covers 1.87% of loans
o Nonperforming assets increased $2.0 billion from 2Q09 to $16.5 billion and now represent 6.87% of loans and foreclosed properties
- 57% of NPAs are greater than 180 days past due and are carried at appraised value
- Nonperforming TDRs increased $841 million and comprise 18% of residential mortgage NPAs o About 60% of the 3Q09 nonperforming residential mortgage modifications were performing at time of reclassification into TDR
o 30+ performing past dues increased $1.9 billion compared to 2Q09 and the ratio rose 90 bps to 3.96% of loans due to repurchases of delinquent government insured or guaranteed loans from securitizations
1 Discontinued Real Estate is not included EOP = end of period
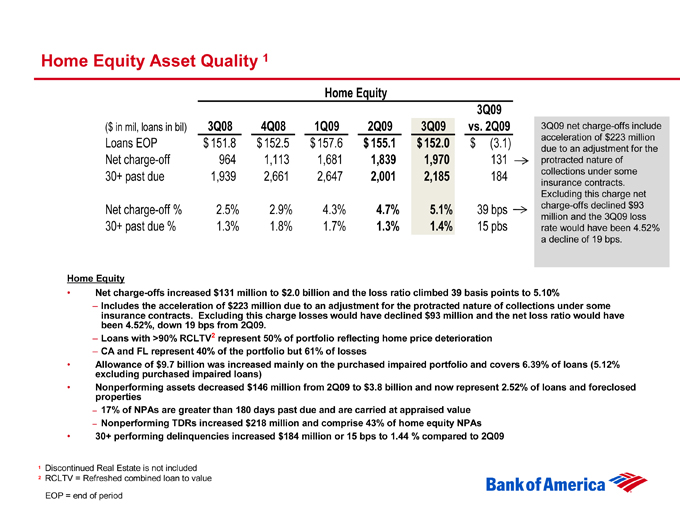
Home Equity Asset Quality 1
Home Equity
($ in mil, loans in bil) 3Q08 4Q08 1Q09 2Q09 3Q09 3Q09 vs. 2Q09
Loans EOP $ 151.8 $ 152.5 $ 157.6 $ 155.1 $ 152.0 $ (3.1)
Net charge-off 964 1,113 1,681 1,839 1,970 131
30+ past due 1,939 2,661 2,647 2,001 2,185 184
Net charge-off % 2.5% 2.9% 4.3% 4.7% 5.1% 39 bps
30+ past due % 1.3% 1.8% 1.7% 1.3% 1.4% 15 pbs
3Q09 net charge-offs include acceleration of $223 million due to an adjustment for the protracted nature of collections under some insurance contracts. Excluding this charge net charge-offs declined $93 million and the 3Q09 loss rate would have been 4.52% a decline of 19 bps.
Home Equity
• Net charge-offs increased $131 million to $2.0 billion and the loss ratio climbed 39 basis points to 5.10%
– Includes the acceleration of $223 million due to an adjustment for the protracted nature of collections under some
insurance contracts. Excluding this charge losses would have declined $93 million and the net loss ratio would have
been 4.52%, down 19 bps from 2Q09.
– Loans with >90% RCLTV2 represent 50% of portfolio reflecting home price deterioration
– CA and FL represent 40% of the portfolio but 61% of losses
• Allowance of $9.7 billion was increased mainly on the purchased impaired portfolio and covers 6.39% of loans (5.12%
excluding purchased impaired loans)
• Nonperforming assets decreased $146 million from 2Q09 to $3.8 billion and now represent 2.52% of loans and foreclosed properties
– 17% of NPAs are greater than 180 days past due and are carried at appraised value
– Nonperforming TDRs increased $218 million and comprise 43% of home equity NPAs
• 30+ performing delinquencies increased $184 million or 15 bps to 1.44 % compared to 2Q09
1 Discontinued Real Estate is not included
2 RCLTV = Refreshed combined loan to value
EOP = end of period
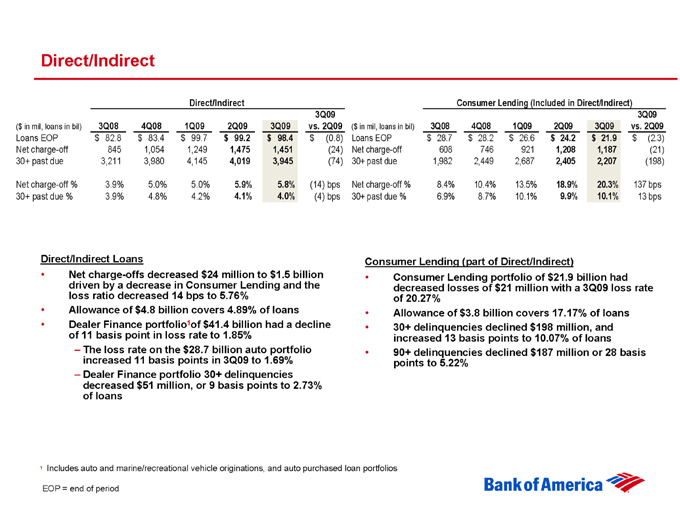
Direct/Indirect
Direct/Indirect
3Q09
($ in mil, loans in bil) 3Q08 4Q08 1Q09 2Q09 3Q09 vs. 2Q09
Loans EOP $ 82.8 $ 83.4 $ 99.7 $ 99.2 $ 98.4 $ (0.8)
Net charge-off 845 1,054 1,249 1,475 1,451 (24)
30+ past due 3,211 3,980 4,145 4,019 3,945 (74)
Net charge-off % 3.9% 5.0% 5.0% 5.9% 5.8% (14) bps
30+ past due % 3.9% 4.8% 4.2% 4.1% 4.0% (4) bps
Consumer Lending (Included in Direct/Indirect)
3Q09
($ in mil, loans in bil) 3Q08 4Q08 1Q09 2Q09 3Q09 vs. 2Q09
Loans EOP $ 28.7 $ 28.2 $ 26.6 $ 24.2 $ 21.9 $ (2.3)
Net charge-off 608 746 921 1,208 1,187 (21)
30+ past due 1,982 2,449 2,687 2,405 2,207 (198)
Net charge-off % 8.4% 10.4% 13.5% 18.9% 20.3% 137 bps
30+ past due % 6.9% 8.7% 10.1% 9.9% 10.1% 13 bps
Direct/Indirect Loans
o Net charge-offs decreased $24 million to $1.5 billion driven by a decrease in Consumer Lending and the loss ratio decreased 14 bps to 5.76%
o Allowance of $4.8 billion covers 4.89% of loans
o Dealer Finance portfolio1of $41.4 billion had a decline of 11 basis point in loss rate to 1.85%
- The loss rate on the $28.7 billion auto portfolio increased 11 basis points in 3Q09 to 1.69%
- Dealer Finance portfolio 30+ delinquencies decreased $51 million, or 9 basis points to 2.73% of loans
Consumer Lending (part of Direct/Indirect)
o Consumer Lending portfolio of $21.9 billion had decreased losses of $21 million with a 3Q09 loss rate of 20.27%
o Allowance of $3.8 billion covers 17.17% of loans
o 30+ delinquencies declined $198 million, and increased 13 basis points to 10.07% of loans
o 90+ delinquencies declined $187 million or 28 basis points to 5.22%
1 Includes auto and marine/recreational vehicle originations, and auto purchased loan portfolios EOP = end of period
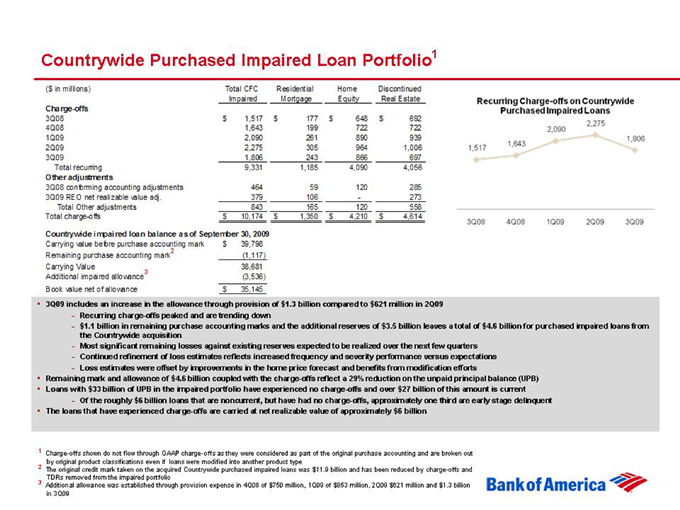
Countrywide Purchased Impaired Loan Portfolio1
($ in millions) Total CFC Residential Home Discontinued
Impaired Mortgage Equity Real Estate
Charge-offs
3Q08 $ 1,517 $ 177 $ 648 $ 692
4Q08 1,643 199 722 722
1Q09 2,090 261 890 939
2Q09 2,275 305 964 1,006
3Q09 1,806 243 866 697
Total recurring 9,331 1,185 4,090 4,056
Other adjustments
3Q08 conforming accounting adjustments 464 59 120 285
3Q09 REO net realizable value adj. 379 106 - 273
Total Other adjustments 843 165 120 558
Total charge-offs $ 10,174 $ 1,350 $ 4,210 $ 4,614
Countrywide impaired loan balance as of September 30, 2009
Carrying value before purchase accounting mark $ 39,798
Remaining purchase accounting mark2 (1,117)
Carrying Value 38,681
Additional impaired allowance3 (3,536)
Book value net of allowance $ 35,145
o 3Q09 includes an increase in the allowance through provision of $1.3 billion compared to $621 million in 2Q09
- Recurring charge-offs peaked and are trending down
- $1.1 billion in remaining purchase accounting marks and the additional reserves of $3.5 billion leaves a total of $4.6 billion for purchased impaired loans from the Countrywide acquisition
- Most significant remaining losses against existing reserves expected to be realized over the next few quarters
- Continued refinement of loss estimates reflects increased frequency and severity performance versus expectations
- Loss estimates were offset by improvements in the home price forecast and benefits from modification efforts
o Remaining mark and allowance of $4.6 billion coupled with the charge-offs reflect a 29% reduction on the unpaid principal balance (UPB)
o Loans with $33 billion of UPB in the impaired portfolio have experienced no charge-offs and over $27 billion of this amount is current
- Of the roughly $6 billion loans that are noncurrent, but have had no charge-offs, approximately one third are early stage delinquent
o The loans that have experienced charge-offs are carried at net realizable value of approximately $6 billion
1 Charge-offs shown do not flow through GAAP charge-offs as they were considered as part of the original purchase accounting and are broken out
2 by original product classifications even if loans were modified into another product type
The original credit mark taken on the acquired Countrywide purchased impaired loans was $11.9 billion and has been reduced by charge-offs and
3 TDRs removed from the impaired portfolio
Additional allowance was established through provision expense in 4Q08 of $750 million, 1Q09 of $853 million, 2Q09 $621 million and $1.3 billion in 3Q09
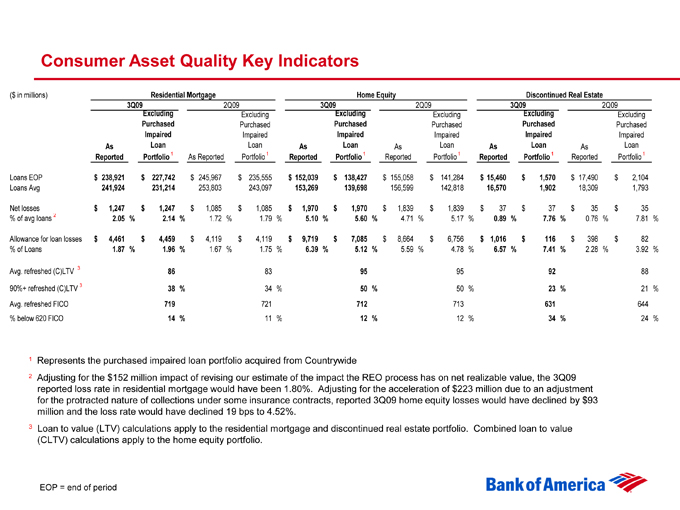
Consumer Asset Quality Key Indicators
($ in millions)
Residential Mortgage
Home Equity
Discontinued Real Estate
3Q09 2Q09 3Q09 2Q09 3Q09 2Q09
As Reported
Excluding Purchased Impaired Loan Portfolio 1
As Reported
Excluding Purchased Impaired Loan Portfolio 1
As Reported
Excluding Purchased Impaired Loan Portfolio 1
As Reported
Excluding Purchased Impaired Loan Portfolio 1
As Reported
Excluding Purchased Impaired Loan Portfolio 1
As Reported
Excluding Purchased Impaired Loan Portfolio 1
Loans EOP $ 238,921 $ 227,742 $ 245,967 $ 235,555 $ 152,039 $ 138,427 $ 155,058 $ 141,284 $ 15,460 $ 1,570 $ 17,490 $ 2,104
Loans Avg 241,924 231,214 253,803 243,097 153,269 139,698 156,599 142,818 16,570 1,902 18,309 1,793
Net losses $ 1,247 $ 1,247 $ 1,085 $ 1,085 $ 1,970 $ 1,970 $ 1,839 $ 1,839 $ 37 $ 37 $ 35 $ 35
% of avg loans 2 2.05 % 2.14 % 1.72 % 1.79 % 5.10 % 5.60 % 4.71 % 5.17 % 0.89 % 7.76 % 0.76 % 7.81 %
Allowance for loan losses $ 4,461 $ 4,459 $ 4,119 $ 4,119 $ 9,719 $ 7,085 $ 8,664 $ 6,756 $ 1,016 $ 116 $ 398 $ 82
% of Loans 1.87 % 1.96 % 1.67 % 1.75 % 6.39 % 5.12 % 5.59 % 4.78 % 6.57 % 7.41 % 2.28 % 3.92 %
Avg. refreshed (C)LTV 3 86 83 95 95 92 88
90%+ refreshed (C)LTV 3 38 % 34 % 50 % 50 % 23 % 21 %
Avg. refreshed FICO 719 721 712 713 631 644
% below 620 FICO 14 % 11 % 12 % 12 % 34 % 24 %
1 Represents the purchased impaired loan portfolio acquired from Countrywide
2 Adjusting for the $152 million impact of revising our estimate of the impact the REO process has on net realizable value, the 3Q09 reported loss rate in residential mortgage would have been 1.80%. Adjusting for the acceleration of $223 million due to an adjustment for the protracted nature of collections under some insurance contracts, reported 3Q09 home equity losses would have declined by $93 million and the loss rate would have declined 19 bps to 4.52%.
3 Loan to value (LTV) calculations apply to the residential mortgage and discontinued real estate portfolio. Combined loan to value
(CLTV) calculations apply to the home equity portfolio.
EOP = end of period
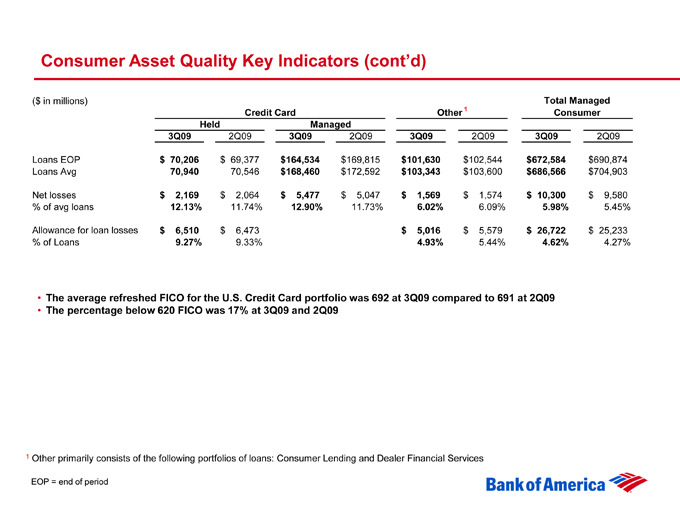
Consumer Asset Quality Key Indicators (cont’d)
($ in millions)
Credit Card
Other 1
Total Managed Consumer
Held Managed
3Q09 2Q09 3Q09 2Q09 3Q09 2Q09 3Q09 2Q09
Loans EOP $ 70,206 $ 69,377 $164,534 $ 169,815 $ 101,630 $ 102,544 $672,584 $ 690,874
Loans Avg 70,940 70,546 $168,460 $ 172,592 $ 103,343 $ 103,600 $686,566 $ 704,903
Net losses $ 2,169 $ 2,064 $ 5,477 $ 5,047 $ 1,569 $ 1,574 $ 10,300 $ 9,580
% of avg loans 12.13% 11.74% 12.90% 11.73% 6.02% 6.09% 5.98% 5.45%
Allowance for loan losses $ 6,510 $ 6,473 $ 5,016 $ 5,579 $ 26,722 $ 25,233
% of Loans 9.27% 9.33% 4.93% 5.44% 4.62% 4.27%
The average refreshed FICO for the U.S. Credit Card portfolio was 692 at 3Q09 compared to 691 at 2Q09
The percentage below 620 FICO was 17% at 3Q09 and 2Q09
1 Other primarily consists of the following portfolios of loans: Consumer Lending and Dealer Financial Services
EOP = end of period
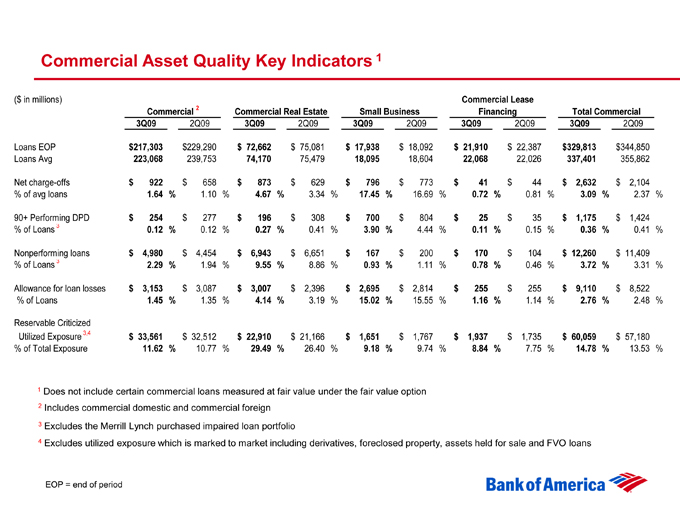
Commercial Asset Quality Key Indicators 1
($ in millions)
Commercial 2
Commercial Real Estate
Small Business
Commercial Lease
Financing Total Commercial
3Q09 2Q09 3Q09 2Q09 3Q09 2Q09 3Q09 2Q09 3Q09 2Q09
Loans EOP 217,30$ 3 $ 229,290 $ 72,662 $ 75,081 $ 17,938 $ 18,092 $ 21,910 $ 22,387 $329,813 $ 344,850
Loans Avg 223,068 239,753 74,170 75,479 18,095 18,604 22,068 22,026 337,401 355,862
Net charge-offs $ 922 $ 658 $ 873 $ 629 $ 796 $ 773 $ 41 $ 44 $ 2,632 $ 2,104
% of avg loans 1.64 % 1.10 % 4.67 % 3.34 % 17.45 % 16.69 % 0.72 % 0.81 % 3.09 % 2.37 %
90+ Performing DPD $ 254 $ 277 $ 196 $ 308 $ 700 $ 804 $ 25 $ 35 $ 1,175 $ 1,424
% of Loans 3 0.12 % 0.12 % 0.27 % 0.41 % 3.90 % 4.44 % 0.11 % 0.15 % 0.36 % 0.41 %
Nonperforming loans $ 4,980 $ 4,454 $ 6,943 $ 6,651 $ 167 $ 200 $ 170 $ 104 $ 12,260 $ 11,409
% of Loans 3 2.29 % 1.94 % 9.55 % 8.86 % 0.93 % 1.11 % 0.78 % 0.46 % 3.72 % 3.31 %
Allowance for loan losses $ 3,153 $ 3,087 $ 3,007 $ 2,396 $ 2,695 $ 2,814 $ 255 $ 255 $ 9,110 $ 8,522
% of Loans 1.45 % 1.35 % 4.14 % 3.19 % 15.02 % 15.55 % 1.16 % 1.14 % 2.76 % 2.48 %
Reservable Criticized
Utilized Exposure 3,4 $ 33,561 $ 32,512 $ 22,910 $ 21,166 $ 1,651 $ 1,767 $ 1,937 $ 1,735 $ 60,059 $ 57,180
% of Total Exposure 11.62 % 10.77 % 29.49 % 26.40 % 9.18 % 9.74 % 8.84 % 7.75 % 14.78 % 13.53 %
1 Does not include certain commercial loans measured at fair value under the fair value option
2 Includes commercial domestic and commercial foreign
3 Excludes the Merrill Lynch purchased impaired loan portfolio
4 Excludes utilized exposure which is marked to market including derivatives, foreclosed property, assets held for sale and FVO loans EOP = end of period
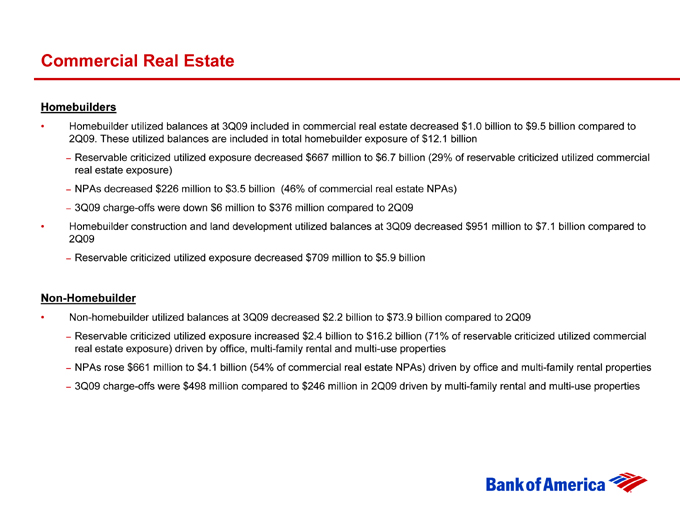
Commercial Real Estate
Homebuilders
Homebuilder utilized balances at 3Q09 included in commercial real estate decreased $1.0 billion to $9.5 billion compared to 2Q09. These utilized balances are included in total homebuilder exposure of $12.1 billion
– Reservable criticized utilized exposure decreased $667 million to $6.7 billion (29% of reservable criticized utilized commercial real estate exposure)
– NPAs decreased $226 million to $3.5 billion (46% of commercial real estate NPAs)
– 3Q09 charge-offs were down $6 million to $376 million compared to 2Q09
Homebuilder construction and land development utilized balances at 3Q09 decreased $951 million to $7.1 billion compared to 2Q09
– Reservable criticized utilized exposure decreased $709 million to $5.9 billion
Non-Homebuilder
Non-homebuilder utilized balances at 3Q09 decreased $2.2 billion to $73.9 billion compared to 2Q09
– Reservable criticized utilized exposure increased $2.4 billion to $16.2 billion (71% of reservable criticized utilized commercial real estate exposure) driven by office, multi-family rental and multi-use properties
– NPAs rose $661 million to $4.1 billion (54% of commercial real estate NPAs) driven by office and multi-family rental properties
– 3Q09 charge-offs were $498 million compared to $246 million in 2Q09 driven by multi-family rental and multi-use properties
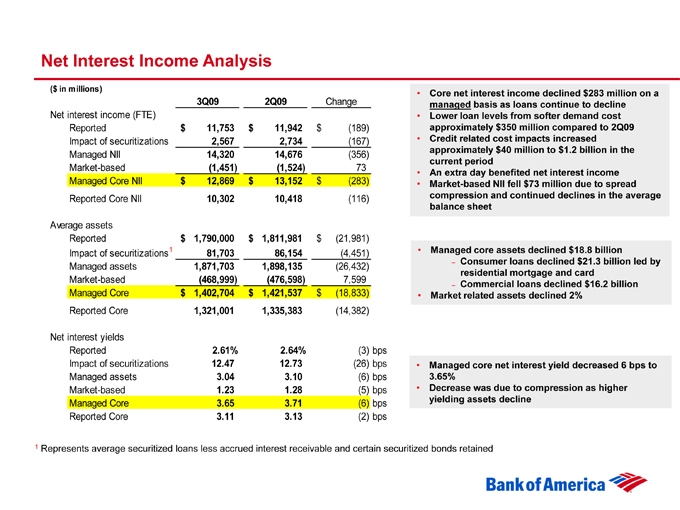
Net Interest Income Analysis
($ in millions)
3Q09 2Q09 Change
Net interest income (FTE)
Reported $11,753 $ 11,942 $ (189)
Impact of securitizations 2,567 2,734 (167)
Managed NII 14,320 14,676 (356)
Market-based (1,451) (1,524) 73
Managed Core NII $ 12,869 $ 13,152 $ (283)
Reported Core NII 10,302 10,418 (116)
Average assets
Reported $ 1,790,000 $ 1,811,981 $ (21,981)
Impact of securitizations1 81,703 86,154 (4,451)
Managed assets 1,871,703 1,898,135 (26,432)
Market-based (468,999) (476,598) 7,599
Managed Core $ 1,402,704 $ 1,421,537 $ (18,833)
Reported Core 1,321,001 1,335,383 (14,382)
Net interest yields
Reported 2.61% 2.64% (3) bps
Impact of securitizations 12.47 12.73 (26) bps
Managed assets 3.04 3.10 (6) bps
Market-based 1.23 1.28 (5) bps
Managed Core 3.65 3.71 (6) bps
Reported Core 3.11 3.13 (2) bps
1 Represents average securitized loans less accrued interest receivable and certain securitized bonds retained
• Core net interest income declined $283 million on a managed basis as loans continue to decline
• Lower loan levels from softer demand cost approximately $350 million compared to 2Q09
• Credit related cost impacts increased approximately $40 million to $1.2 billion in the current period
• An extra day benefited net interest income
• Market-based NII fell $73 million due to spread compression and continued declines in the average balance sheet
• Managed core assets declined $18.8 billion
– Consumer loans declined $21.3 billion led by residential mortgage and card
– Commercial loans declined $16.2 billion
• Market related assets declined 2%
• Managed core net interest yield decreased 6 bps to 3.65%
• Decrease was due to compression as higher yielding assets decline
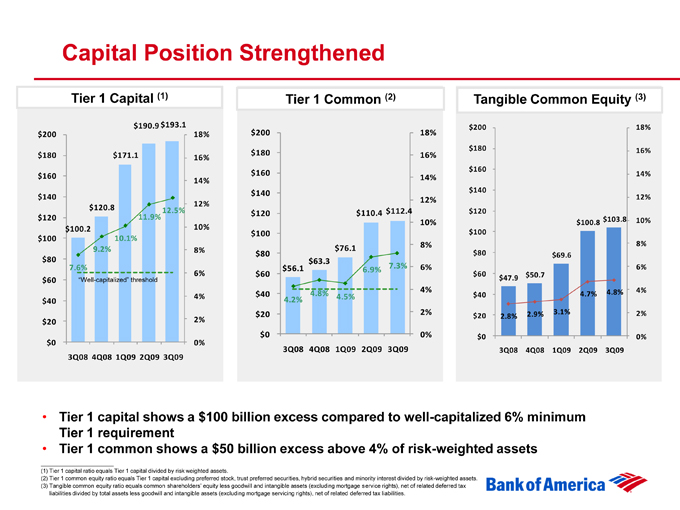
Capital Position Strengthened
Tier 1 Capital (1)
$0 $20 $40 $60 $80 $100 $120 $140 $160 $180 $200
$100.2 $120.8 $171.1 $190.9 $193.1 7.6% 9.2% 10.1% 11.9% 12.5%
“Well-capitalized” threshold
0% 2% 4% 6% 8% 10% 12% 14% 16% 18%
3Q08 4Q08 1Q09 2Q09 3Q09
Tier 1 Common (2)
$0 $20 $40 $60 $80 $100 $120 $140 $160 $180 $200
$56.1 $63.3 $76.1 $110.4 $112.4 4.2% 4.8% 4.5% 6.9% 7.3%
0% 2% 4% 6% 8% 10% 12% 14% 16% 18%
3Q08 4Q08 1Q09 2Q09 3Q09
Tangible Common Equity (3)
$0 $20 $40 $60 $80 $100 $120 $140 $160 $180 $200
$47.9 $50.7 $69.6 $100.8 $103.8 2.8% 2.9% 3.1% 4.7% 4.8%
0% 2% 4% 6% 8% 10% 12% 14% 16% 18%
3Q08 4Q08 1Q09 2Q09 3Q09
• Tier 1 capital shows a $100 billion excess compared to well-capitalized 6% minimum Tier 1 requirement
• Tier 1 common shows a $50 billion excess above 4% of risk-weighted assets
(1) Tier 1 capital ratio equals Tier 1 capital divided by risk weighted assets.
(2) Tier 1 common equity ratio equals Tier 1 capital excluding preferred stock, trust preferred securities, hybrid securities and minority interest divided by risk-weighted assets.
(3) Tangible common equity ratio equals common shareholders’ equity less goodwill and intangible assets (excluding mortgage service rights), net of related deferred tax liabilities divided by total assets less goodwill and intangible assets (excluding mortgage servicing rights), net of related deferred tax liabilities.
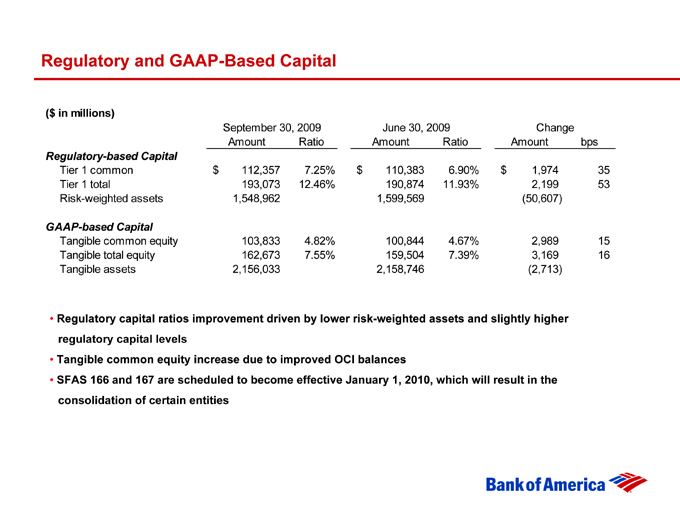
Regulatory and GAAP-Based Capital
($ in millions)
September 30, 2009 June 30, 2009 Change
Amount Ratio Amount Ratio Amount bps
Regulatory-based Capital
Tier 1 common $ 112,357 7.25% $ 110,383 6.90% $ 1,974 35
Tier 1 total 193,073 12.46% 190,874 11.93% 2,199 53
Risk-weighted assets 1,548,962 1,599,569 (50,607)
GAAP-based Capital
Tangible common equity 103,833 4.82% 100,844 4.67% 2,989 15
Tangible total equity 162,673 7.55% 159,504 7.39% 3,169 16
Tangible assets 2,156,033 2,158,746 (2,713)
o Regulatory capital ratios improvement driven by lower risk-weighted assets and slightly higher regulatory capital levels
o Tangible common equity increase due to improved OCI balances
o SFAS 166 and 167 are scheduled to become effective January 1, 2010, which will result in the consolidation of certain entities
Merger Integrations Tracking Well
Countrywide
Completed deposit system conversion 3Q09
Mortgage servicing platform conversion scheduled for 4Q09
Cost savings remain on track
All done while originating home loans of nearly $300 billion YTD, improving market share to more than 20%
Helping customers avoid foreclosure through more than 215,000 loan modifications YTD. In addition, approximately 98,000 Bank of America customers are already in a trial period modification under the government’s Making Home Affordable program at September 30
Merrill Lynch
3Q09 cost savings of $1 billion increasing YTD savings of $2.2 billion (well ahead of original ‘09 estimate)
Retained 94% of high-producing financial advisors
Received more than 1,400 referrals from FAs to the commercial bank
31% of FAs have sold a banking product to their customers
Launched the new sales and trading portal to more than 40,000 clients
Rolled out the Merrill Lynch brand to wealth management clients
Maintained position as the 3rd largest fee producer of global investment banking revenue