Exhibit 99.2
Foreclosure Review and Assessment
Currently conducting a voluntary internal review of foreclosure process across all 50 states
•Review has particular focus on the process and controls in place for completing affidavits and notarizations
•Review /assessment involves
–Review of all foreclosure processes, policies and procedures
–Assessment of the quality assurance and quality controls in place
–Independent review of completed affidavits to ensure quality and factual accuracy
–Interviews of associates involved in the process
•For the 23 judicial states, we are amending and re-filing 102,000 foreclosure affidavits Ongoing assessment supports conclusion that our past foreclosure decisions were accurate
•Controls are in place to prevent wrongful foreclosures
•Before filing foreclosure action and the day prior to foreclosure sale, additional checks are conducted for borrower status changes
•Post-foreclosure sale steps include customer appeals process Foreclosure sales are suspended until assessment is complete, but foreclosure process for delinquent borrowers continues
•Will not complete a foreclosure sale at this time
•Assessment expected to be completed in the next few weeks
•We anticipate that less than 30,000 foreclosure sales will be delayed as a result of our decision to suspend foreclosure sales
Goodwill Impairment Charge in
Global Card Services
•Recorded a goodwill impairment charge
–$10.4B non-cash charge that does not impact regulatory capital ratios or liquidity
–Charge is a result of recent legislation and expected impact on debit card business
–Debit card operating results are reported in Global Card Services along with other payment products
•Future debit card profitability diminished
–Some mitigation activities will benefit other business segments, mainly Deposits
–Continuing to identify mitigation opportunities
•Executing a relationship-focused retail strategy that is based on understanding customer segments, offering new and attractive solutions to customers based on that knowledge and offering customers straight-forward choices as to how they want to do business with us
•Continuing rollout of new initiatives to drive consumer revenue
–Image ATMs fully deployed
–E-banking accounts rolled out in July
–Customer availability of ATM emergency cash
–Pricing deposits and accounts differently
–Piloting new products
–Recognizing and encouraging other methods of payment from customers in lieu of fees
Net Interest Income 1, 2
Commentary vs. 2Q10
$10,359
$10,591
$12,884
$12,148$11,672
$14,320
$14,370
$14,070
$13,197$12,717
3.05%
3.04%
2.72%
2.61%
2.62%
2.93%
2.77%
2.72%
0.00%
0.50%1.00%
1.50%
2.00%
2.50%
3.00%3.50%
$0
$5,000
$10,000
$15,000
$20,000
$25,000
3Q09
4Q09
1Q10
2Q103Q10
$ in millions
Core NII
Market-based NII
NII on securitized card receivables
Managed net interest yield
Reported net interest yield
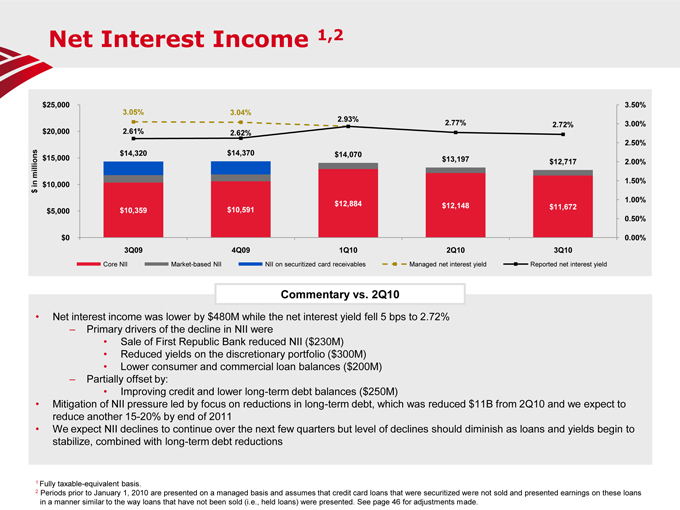
Net interest income was lower by $480M while the net interest yield fell 5 bps to 2.72%
–Primary drivers of the decline in NII were
Sale of First Republic Bank reduced NII ($230M)
Reduced yields on the discretionary portfolio ($300M)
Lower consumer and commercial loan balances ($200M)
–Partially offset by:
Improving credit and lower long-term debt balances ($250M)
Mitigation of NII pressure led by focus on reductions in long-term debt, which was reduced $11B from 2Q10 and we expect to reduce another 15-20% by end of 2011
We expect NII declines to continue over the next few quarters but level of declines should diminish as loans and yields begin to stabilize, combined with long-term debt reductions
1Fully taxable-equivalent basis.
2Periods prior to January 1, 2010 are presented on a managed basis and assumes that credit card loans that were securitized were not sold and presented earnings on these loans in a manner similar to the way loans that have not been sold (i.e., held loans) were presented. See page 46 for adjustments made.
Service Charges
$1,059
$1,050
$3,020 $2,756
$2,566
$2,576
$2,212
$0 $500
$1,000
$1,500
$2,000
$2,500
$3,000
$3,500
3Q09
4Q09
1Q10
2Q103Q10
$ in millions
Consumer service charges
Commercial service charges
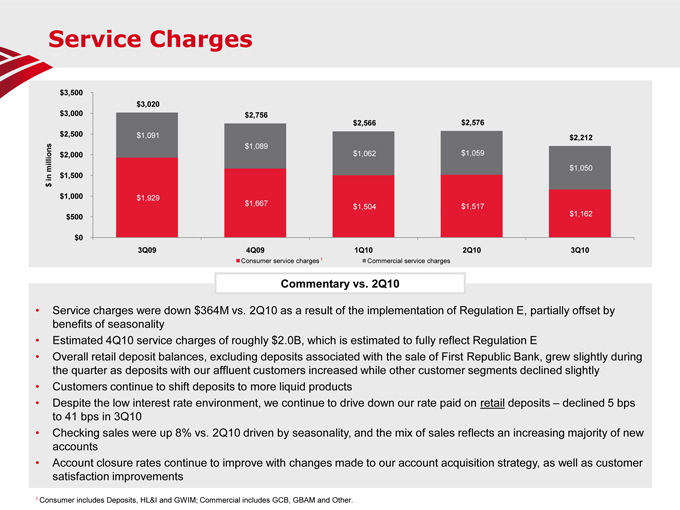
Service charges were down $364M vs. 2Q10 as a result of the implementation of Regulation E, partially offset by benefits of seasonality
Estimated 4Q10 service charges of roughly $2.0B, which is estimated to fully reflect Regulation E
Overall retail deposit balances, excluding deposits associated with the sale of First Republic Bank, grew slightly during the quarter as deposits with our affluent customers increased while other customer segments declined slightly
Customers continue to shift deposits to more liquid products
Despite the low interest rate environment, we continue to drive down our rate paid on retail deposits –declined 5 bps to 41 bps in 3Q10
Checking sales were up 8% vs. 2Q10 driven by seasonality, and the mix of sales reflects an increasing majority of new accounts
Account closure rates continue to improve with changes made to our account acquisition strategy, as well as customer satisfaction improvements
1 Consumer includes Deposits, HL&I and GWIM; Commercial includes GCB, GBAM and Other.

•77% of new claims over the past year were from 2006 & 2007 vintages
Representations and Warranties
•3Q10 reps and warranties provision of $872M is $376M lower than 2Q10, as the current quarter included an increase in expected repurchases from GSEs while 2Q10 included additional provision for monolines
•Deep experience with the GSEs related to reps and warranties facilitates our ability to forecast GSE liability requirements
–Actual and future loan defaults are considered
•Loan defaults are better forecasted using historical information and current economic conditions
–Repurchase claims and percentage of loans repurchased are based on our experience with the GSEs, adjusted where appropriate for emerging trends
•New claims and losses continue to be driven by GSEs and originations from the 2006 and 2007 vintages
Liability for Representations and Warranties
Outstanding Claims by Counterparty
Commentary
New Claim Trends($ in millions)3Q094Q091Q102Q103Q10GSEs$3,040$3,300$4,152$5,641$6,842Monoline2,9672,9363,1594,1034,217Other1,5161,4311,5241,4151,817Total$7,523$7,666$8,835$11,159$12,875($ in millions)3Q094Q091Q102Q103Q10MixPre 2004$74$41$132$119$1403%2005285 221 334 662 571 13%2006697 524 813 1,220 1,390 29%2007948 1,081 1,704 2,249 1,611 48%2008101 149 197 271 315 6%Post 200815 8 27 30 33 1%New Claims $2,120$2,024$3,207$4,550$4,060 % GSEs75%94%83%76%82%Rescinded Claims$555$625$912$1,398$1,369Approved Repurchases$717$1,256$1,126$829$975Outstanding Claims$7,523$7,666$8,835$11,159$12,875 % GSEs40%42%46%50%53%
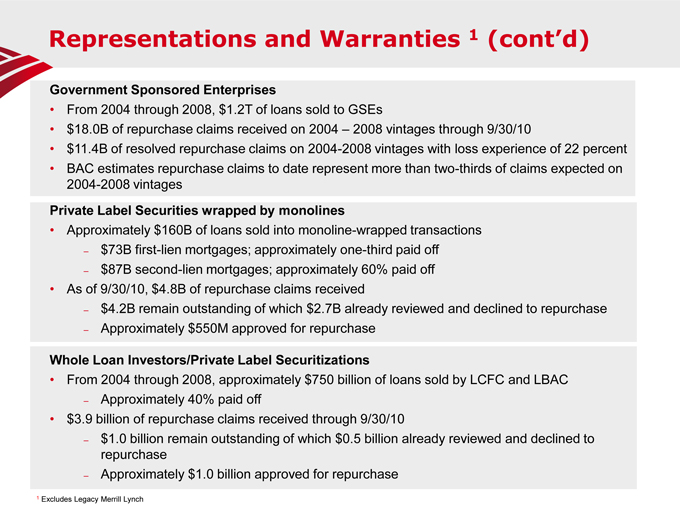
Representations and Warranties 1(cont’d)
Government Sponsored Enterprises
From 2004 through 2008, $1.2T of loans sold to GSEs
$18.0B of repurchase claims received on 2004 –2008 vintages through 9/30/10
$11.4B of resolved repurchase claims on 2004-2008 vintages with loss experience of 22 percent
BAC estimates repurchase claims to date represent more than two-thirds of claims expected on 2004-2008 vintages Private Label Securities wrapped by monolines
Approximately $160B of loans sold into monoline-wrapped transactions
–$73B first-lien mortgages; approximately one-third paid off
–$87B second-lien mortgages; approximately 60% paid off
As of 9/30/10, $4.8B of repurchase claims received
–$4.2B remain outstanding of which $2.7B already reviewed and declined to repurchase
–Approximately $550M approved for repurchase
Whole Loan Investors/Private Label Securitizations
From 2004 through 2008, approximately $750 billion of loans sold by LCFC and LBAC
–Approximately 40% paid off
$3.9 billion of repurchase claims received through 9/30/10
–$1.0 billion remain outstanding of which $0.5 billion already reviewed and declined to repurchase
–Approximately $1.0 billion approved for repurchase
1Excludes Legacy Merrill Lynch

Preliminary Capital Impacts
Have made significant progress on Tier 1 Common and risk-weighted assets (RWA) year-to-date
– Tier 1 common capital up $14B, RWA down $87B and ratio up 137bp –net of FAS 166/167 impacts
– Have been proactive in addressing Basel changes –re-remic transactions, sales of Itau and Santander–Mexico, reductions in private equity portfolio
– Risk-weighted asset reductions are consistent with customer-centric strategies we are pursuing
New rules being introduced –Basel II, Basel III, Market Risk Rules, Dodd-Frank
Began running Basel II parallel in 2Q10
Tier 1 common equity ratio estimated to remain above 8% through all periods assuming the following effective dates
– Basel II and Market Risk 100% effective 12/31/11
– Basel III 100% effective 12/31/12
– Assumes no Basel III phase-in effect when in fact there is one
Pre-mitigation aggregate RWA impact is estimated to increase approximately $600B, but post known mitigation efforts, the 4Q12 RWA estimated at $1.85T vs. $1.48T at 3Q10
– Loan/asset run-off and investment sales ($75B)
– Exit proprietary trading ($65B)
– Reduce low-rated assets in the trading book (e.g., low-rated RMBS) ($65B)
– Reduce counterparty and CVA RWA charges ($25B)
Basel III capital deductions are to be phased in over 2014 to 2018, but estimate full Basel III incremental deductions at 12/31/12 at approximately $12B
– DTA NOL is the primary deduction component and will continue to decline as we generate earnings
– 3Q10 OCI is positive $0.6B but assumed at $0 for this analysis
Trust Preferred Securities of $19.8B are to be phased out of Tier 1 Capital (remains in Tier 2) over 2013 to 2015 per Dodd-Frank BAC does not expect to issue common stock to meet new standards of Basel III
1
Foreclosure BackgroundHelping customers remain in their homes is a priority
•Before the foreclosure process begins, delinquent borrowers are considered for modifications and other foreclosure alternatives –including short sales and deeds in lieu of foreclosure
•Completed 700,000 permanent loan modifications since Jan. 2008 -leading the industry with nearly 80,000 HAMP modifications
•Since January 2009, we’ve invested significant resources to help delinquent borrowers, including:
–Expanded default management staffing by 93% to nearly 20,000 associates
–Implemented new outreach methods, including door knockers, face-to-face customer assistance centers
–Participated in more than 500 community outreach events in 31 states
–Developed innovative programs to meet customers needs including principal reductionDelinquency statistics for completed foreclosure sales in the third quarter
•80% of borrowers had not made a mortgage payment for more than one year
•Average of 560 days in delinquent status (approximately 18 months)
•33% of properties were vacant
•50% of borrowers were unemployed or had their income reduced