
1 Q4 2015 EARNINGS CONFERENCE CALL BILL NUTI, CHAIRMAN AND CEO BOB FISHMAN, CFO February 9, 2016
2 NOTES TO INVESTORS FORWARD-LOOKING STATEMENTS. Comments made during this conference call and in these materials contain forward- looking statements. Statements that describe or relate to NCR's plans, goals, intentions, strategies or financial outlook, and statements that do not relate to historical or current fact, are examples of forward-looking statements. The forward-looking statements in these materials include statements about key market developments in NCR’s operating segments, including NCR’s ability to benefit in Financial Services from expected industry consolidation, expectations for growth of NCR’s Retail ONE platform, and unified commerce, software and store transformation offerings, and expectations regarding global opportunities and sales pipeline in NCR’s Hospitality division; NCR's FY 2016 overall and Q1 2016 financial guidance and the expected type and magnitude of the non-operational adjustments included in any forward-looking non-GAAP measures; expected new product introductions and their benefits to NCR; the success and expected benefits of NCR’s sales and services transformation activities; and foreign currency fluctuations and their impact on NCR’s results. Forward-looking statements are based on our current beliefs, expectations and assumptions, which may not prove to be accurate, and involve a number of known and unknown risks and uncertainties, many of which are out of NCR's control. Forward-looking statements are not guarantees of future performance, and there are a number of important factors that could cause actual outcomes and results to differ materially from the results contemplated by such forward-looking statements, including those factors listed in Item 1a "Risk Factors" of NCR's Annual Report on Form 10-K and those factors detailed from time to time in NCR's other SEC reports. These materials are dated February 9, 2016, and NCR does not undertake any obligation to publicly update or revise any forward-looking statements, whether as a result of new information, future events or otherwise. NON-GAAP MEASURES. While NCR reports its results in accordance with generally accepted accounting principles in the United States (GAAP), comments made during this conference call and these materials will include the following "non-GAAP" measures: non- pension operating income (NPOI), non-GAAP diluted earnings per share (non-GAAP diluted EPS), free cash flow (FCF), operational gross margin, operational gross margin rate, expenses (non-GAAP), adjusted EBITDA, effective tax rate, non-GAAP net income and selected measures expressed on a constant currency basis. These measures are included to provide additional useful information regarding NCR's financial results, and are not a substitute for their comparable GAAP measures. Explanations of these non-GAAP measures (including changes to the treatment of ongoing pension expenses in the calculation of certain of these measures), and reconciliations of these non-GAAP measures to their directly comparable GAAP measures, are included in the accompanying "Supplementary Non-GAAP Materials" and are available on the Investor Relations page of NCR's website at www.ncr.com. Descriptions of many of these non-GAAP measures are also included in NCR's SEC reports. USE OF CERTAIN TERMS. As used in these materials, (i) the term "software-related revenue" includes software license, software maintenance, cloud, and professional services revenue associated with software delivery, (ii) the term "recurring revenue" means the sum of cloud, hardware maintenance and software maintenance revenue, (iii) the terms "cloud" and "cloud revenue" are used to describe NCR’s software-as-a-service offerings and the revenue associated therewith and (iv) the term "CC" means constant currency. These presentation materials and the associated remarks made during this conference call are integrally related and are intended to be presented and understood together.
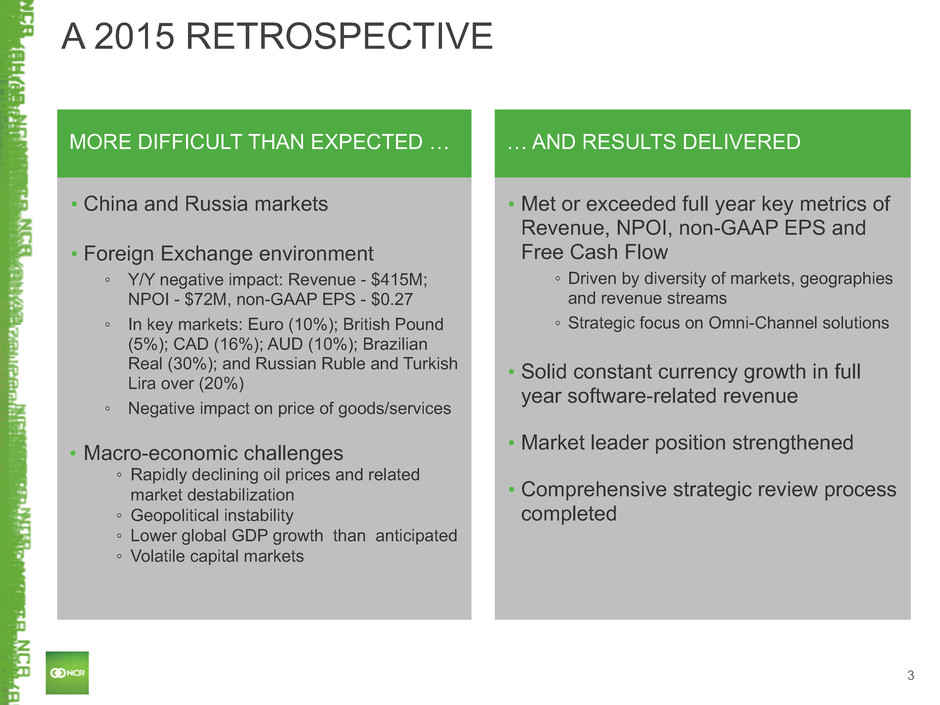
3 MORE DIFFICULT THAN EXPECTED … • China and Russia markets • Foreign Exchange environment ◦ Y/Y negative impact: Revenue - $415M; NPOI - $72M, non-GAAP EPS - $0.27 ◦ In key markets: Euro (10%); British Pound (5%); CAD (16%); AUD (10%); Brazilian Real (30%); and Russian Ruble and Turkish Lira over (20%) ◦ Negative impact on price of goods/services • Macro-economic challenges ◦ Rapidly declining oil prices and related market destabilization ◦ Geopolitical instability ◦ Lower global GDP growth than anticipated ◦ Volatile capital markets … AND RESULTS DELIVERED • Met or exceeded full year key metrics of Revenue, NPOI, non-GAAP EPS and Free Cash Flow ◦ Driven by diversity of markets, geographies and revenue streams ◦ Strategic focus on Omni-Channel solutions • Solid constant currency growth in full year software-related revenue • Market leader position strengthened • Comprehensive strategic review process completed A 2015 RETROSPECTIVE
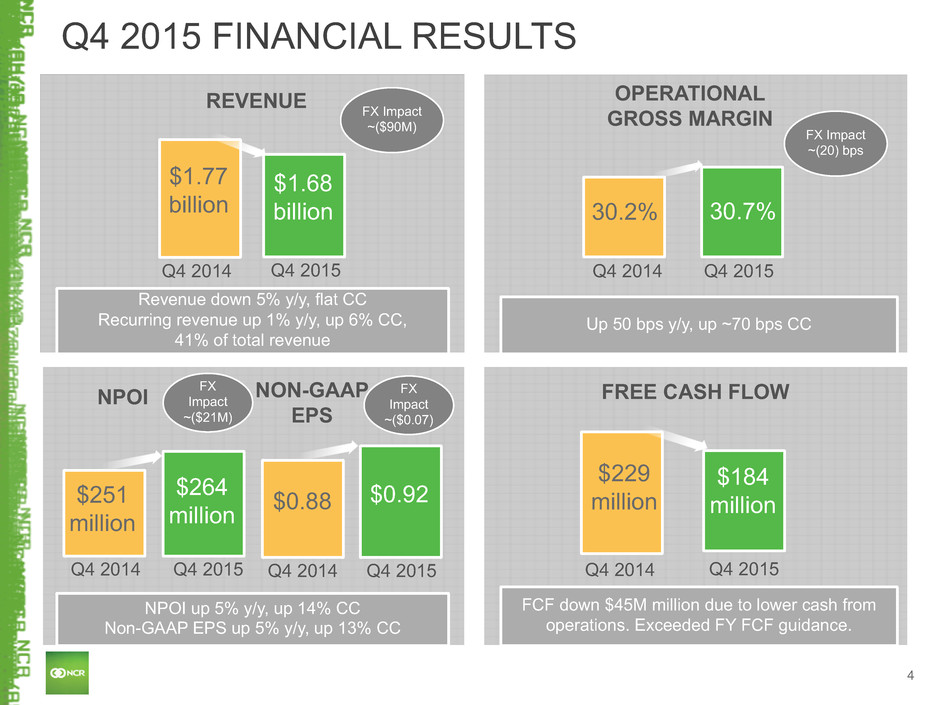
4 Q4 2015 FINANCIAL RESULTS REVENUE Q4 2014 Q4 2015 $1.77 billion Revenue down 5% y/y, flat CC Recurring revenue up 1% y/y, up 6% CC, 41% of total revenue OPERATIONAL GROSS MARGIN Q4 2014 Q4 2015 30.2% 30.7% Up 50 bps y/y, up ~70 bps CC NPOI NPOI up 5% y/y, up 14% CC Non-GAAP EPS up 5% y/y, up 13% CC FREE CASH FLOW FCF down $45M million due to lower cash from operations. Exceeded FY FCF guidance. Q4 2014 Q4 2015 $251 million $264 million Q4 2014 Q4 2015 $229 million $184 million $1.68 billion NON-GAAP EPS Q4 2014 Q4 2015 $0.92 $0.88 FX Impact ~($90M) FX Impact ~($0.07) FX Impact ~($21M) FX Impact ~(20) bps
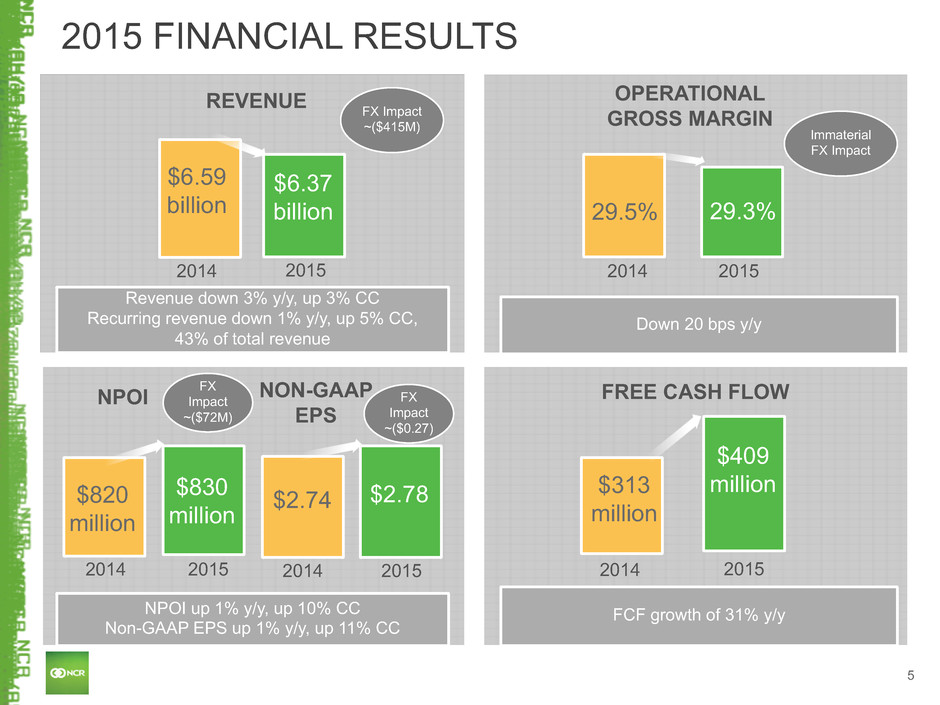
5 2015 FINANCIAL RESULTS REVENUE 2014 2015 $6.59 billion Revenue down 3% y/y, up 3% CC Recurring revenue down 1% y/y, up 5% CC, 43% of total revenue OPERATIONAL GROSS MARGIN 2014 2015 29.5% 29.3% Down 20 bps y/y NPOI NPOI up 1% y/y, up 10% CC Non-GAAP EPS up 1% y/y, up 11% CC FREE CASH FLOW FCF growth of 31% y/y 2014 2015 $820 million $830 million 2014 2015 $313 million $409 million $6.37 billion NON-GAAP EPS 2014 2015 $2.78 $2.74 FX Impact ~($415M) FX Impact ~($0.27) FX Impact ~($72M) Immaterial FX Impact
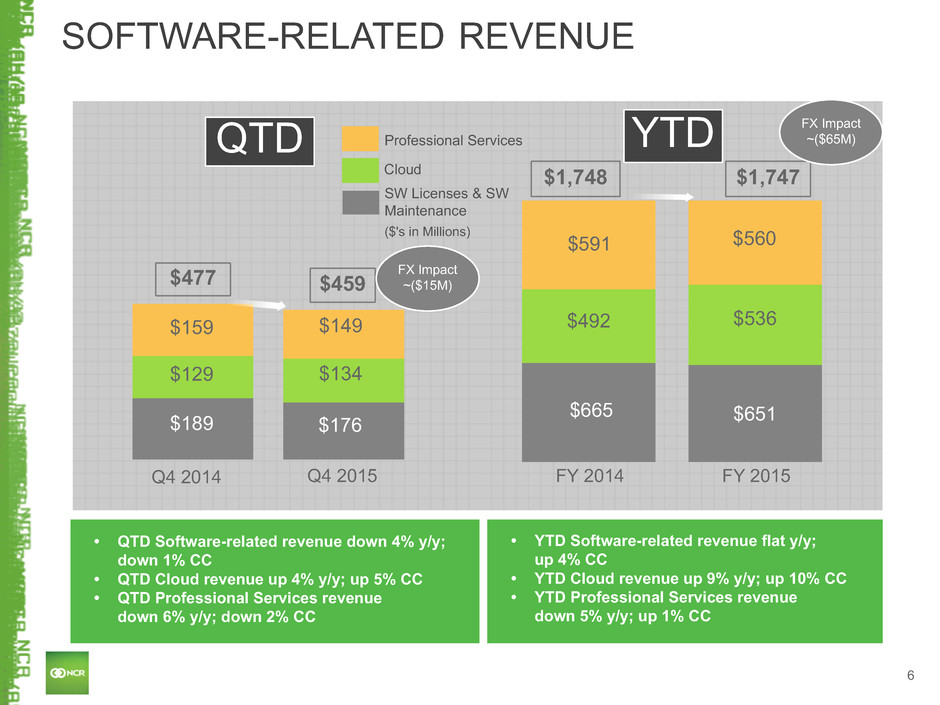
6 SOFTWARE-RELATED REVENUE Q4 2015 Q4 2014 $129 QTD • QTD Software-related revenue down 4% y/y; down 1% CC • QTD Cloud revenue up 4% y/y; up 5% CC • QTD Professional Services revenue down 6% y/y; down 2% CC $459 Cloud Professional Services SW Licenses & SW Maintenance $189 FY 2015 $1,747 FY 2014 ($'s in Millions) • YTD Software-related revenue flat y/y; up 4% CC • YTD Cloud revenue up 9% y/y; up 10% CC • YTD Professional Services revenue down 5% y/y; up 1% CC $159 $149 $134 $176 YTD $651 $536 $560 $665 $492 $591 $477 $1,748 FX Impact ~($15M) FX Impact ~($65M)
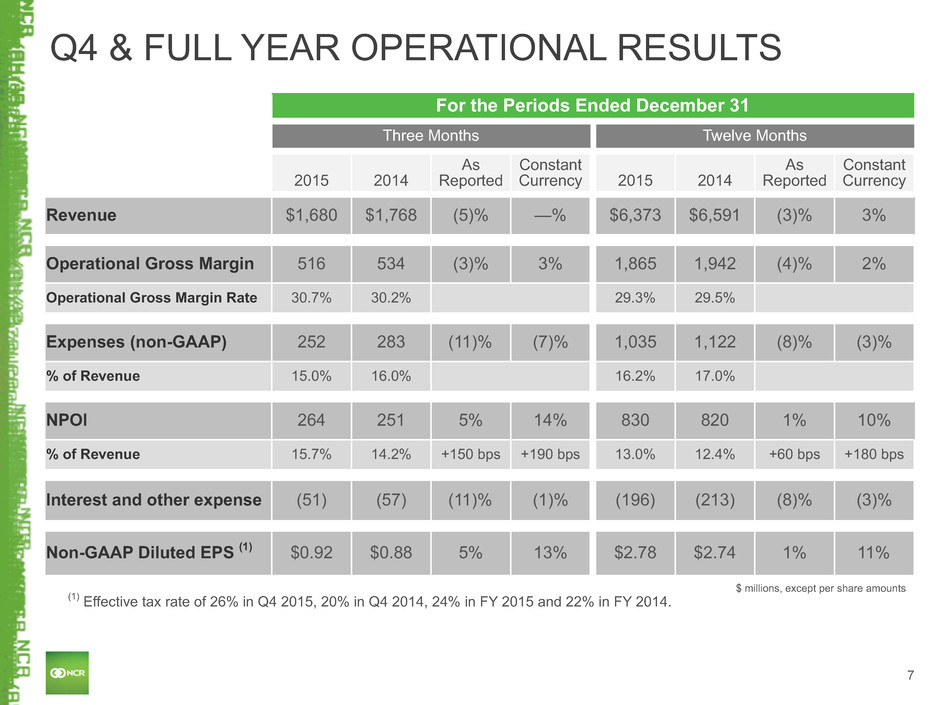
7 For the Periods Ended December 31 Three Months Twelve Months 2015 2014 As Reported Constant Currency 2015 2014 As Reported Constant Currency Revenue $1,680 $1,768 (5)% —% $6,373 $6,591 (3)% 3% Operational Gross Margin 516 534 (3)% 3% 1,865 1,942 (4)% 2% Operational Gross Margin Rate 30.7% 30.2% 29.3% 29.5% Expenses (non-GAAP) 252 283 (11)% (7)% 1,035 1,122 (8)% (3)% % of Revenue 15.0% 16.0% 16.2% 17.0% NPOI 264 251 5% 14% 830 820 1% 10% % of Revenue 15.7% 14.2% +150 bps +190 bps 13.0% 12.4% +60 bps +180 bps Interest and other expense (51) (57) (11)% (1)% (196) (213) (8)% (3)% Non-GAAP Diluted EPS (1) $0.92 $0.88 5% 13% $2.78 $2.74 1% 11% Q4 & FULL YEAR OPERATIONAL RESULTS (1) Effective tax rate of 26% in Q4 2015, 20% in Q4 2014, 24% in FY 2015 and 22% in FY 2014. $ millions, except per share amounts
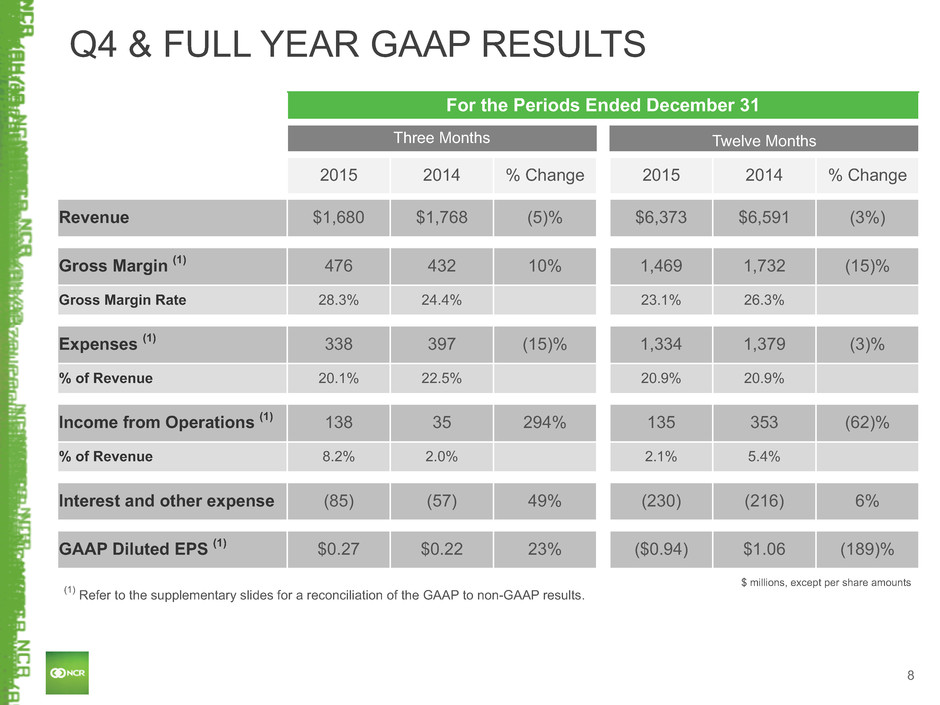
8 For the Periods Ended December 31 Three Months Twelve Months 2015 2014 % Change 2015 2014 % Change Revenue $1,680 $1,768 (5)% $6,373 $6,591 (3%) Gross Margin (1) 476 432 10% 1,469 1,732 (15)% Gross Margin Rate 28.3% 24.4% 23.1% 26.3% Expenses (1) 338 397 (15)% 1,334 1,379 (3)% % of Revenue 20.1% 22.5% 20.9% 20.9% Income from Operations (1) 138 35 294% 135 353 (62)% % of Revenue 8.2% 2.0% 2.1% 5.4% Interest and other expense (85) (57) 49% (230) (216) 6% GAAP Diluted EPS (1) $0.27 $0.22 23% ($0.94) $1.06 (189)% Q4 & FULL YEAR GAAP RESULTS $ millions, except per share amounts (1) Refer to the supplementary slides for a reconciliation of the GAAP to non-GAAP results.
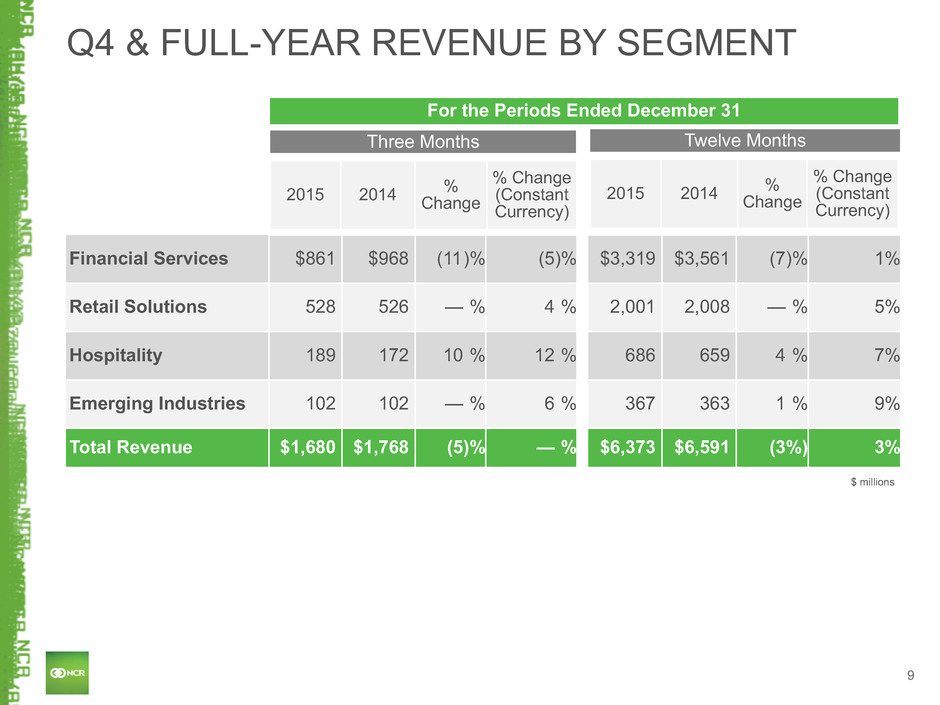
9 Q4 & FULL-YEAR REVENUE BY SEGMENT Financial Services $861 $968 (11)% (5)% $3,319 $3,561 (7)% 1% Retail Solutions 528 526 — % 4 % 2,001 2,008 — % 5% Hospitality 189 172 10 % 12 % 686 659 4 % 7% Emerging Industries 102 102 — % 6 % 367 363 1 % 9% Total Revenue $1,680 $1,768 (5)% — % $6,373 $6,591 (3%) 3% 2015 2014 %Change % Change (Constant Currency) $ millions For the Periods Ended December 31 2015 2014 %Change % Change (Constant Currency) Three Months Twelve Months
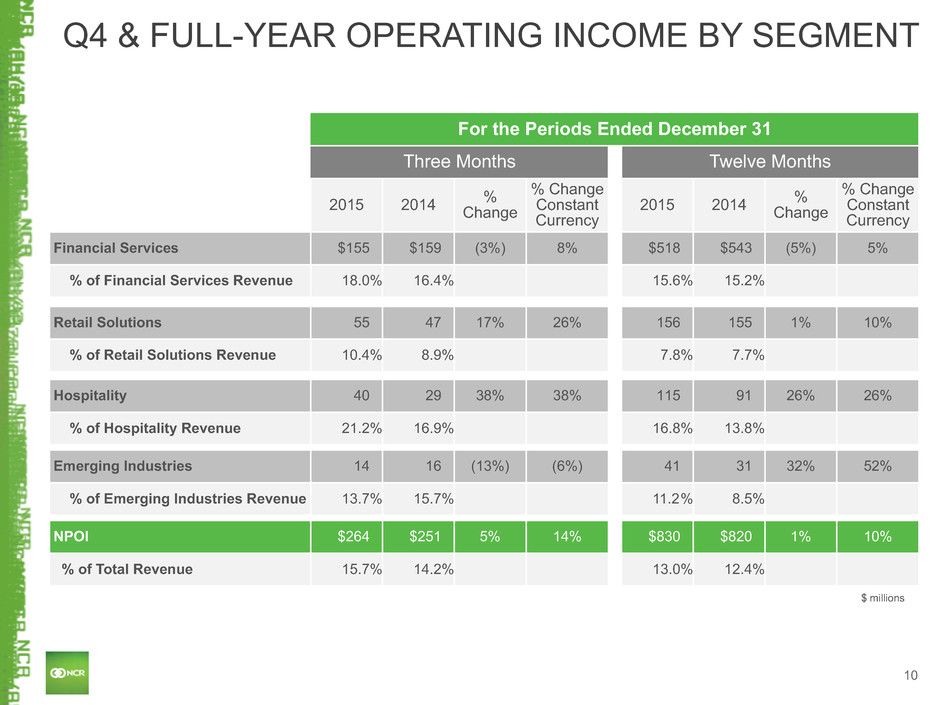
10 Q4 & FULL-YEAR OPERATING INCOME BY SEGMENT For the Periods Ended December 31 Three Months Twelve Months 2015 2014 %Change % Change Constant Currency 2015 2014 %Change % Change Constant Currency Financial Services $155 $159 (3%) 8% $518 $543 (5%) 5% % of Financial Services Revenue 18.0% 16.4% 15.6% 15.2% Retail Solutions 55 47 17% 26% 156 155 1% 10% % of Retail Solutions Revenue 10.4% 8.9% 7.8% 7.7% Hospitality 40 29 38% 38% 115 91 26% 26% % of Hospitality Revenue 21.2% 16.9% 16.8% 13.8% Emerging Industries 14 16 (13%) (6%) 41 31 32% 52% % of Emerging Industries Revenue 13.7% 15.7% 11.2% 8.5% NPOI $264 $251 5% 14% $830 $820 1% 10% % of Total Revenue 15.7% 14.2% 13.0% 12.4% $ millions
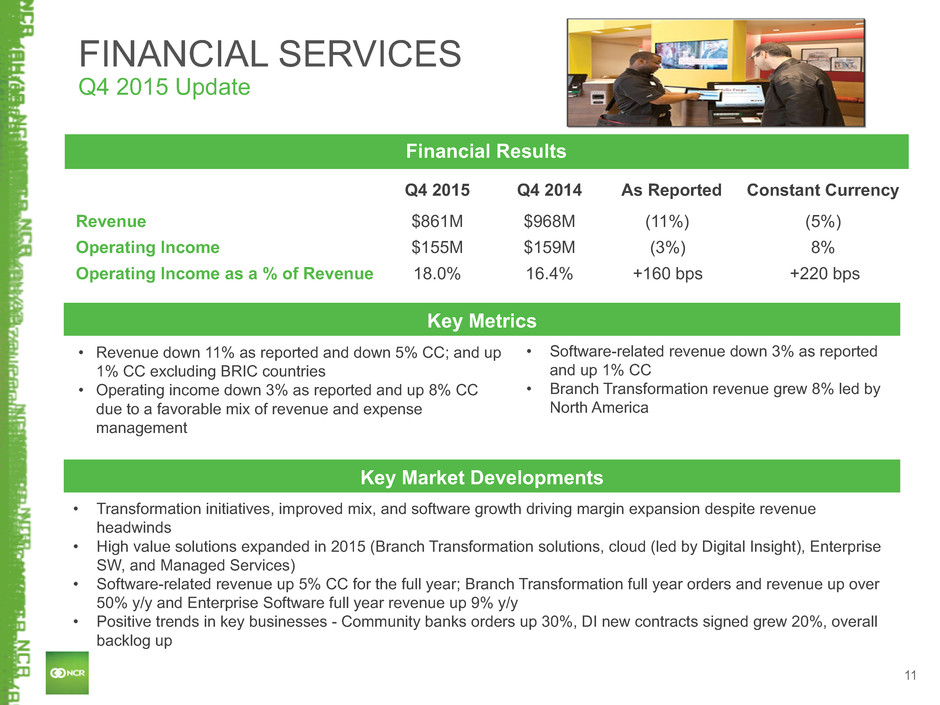
11 FINANCIAL SERVICES Q4 2015 Update • Revenue down 11% as reported and down 5% CC; and up 1% CC excluding BRIC countries • Operating income down 3% as reported and up 8% CC due to a favorable mix of revenue and expense management • Transformation initiatives, improved mix, and software growth driving margin expansion despite revenue headwinds • High value solutions expanded in 2015 (Branch Transformation solutions, cloud (led by Digital Insight), Enterprise SW, and Managed Services) • Software-related revenue up 5% CC for the full year; Branch Transformation full year orders and revenue up over 50% y/y and Enterprise Software full year revenue up 9% y/y • Positive trends in key businesses - Community banks orders up 30%, DI new contracts signed grew 20%, overall backlog up Key Market Developments Financial Results Q4 2015 Q4 2014 As Reported Constant Currency Revenue $861M $968M (11%) (5%) Operating Income $155M $159M (3%) 8% Operating Income as a % of Revenue 18.0% 16.4% +160 bps +220 bps • Software-related revenue down 3% as reported and up 1% CC • Branch Transformation revenue grew 8% led by North America Key Metrics
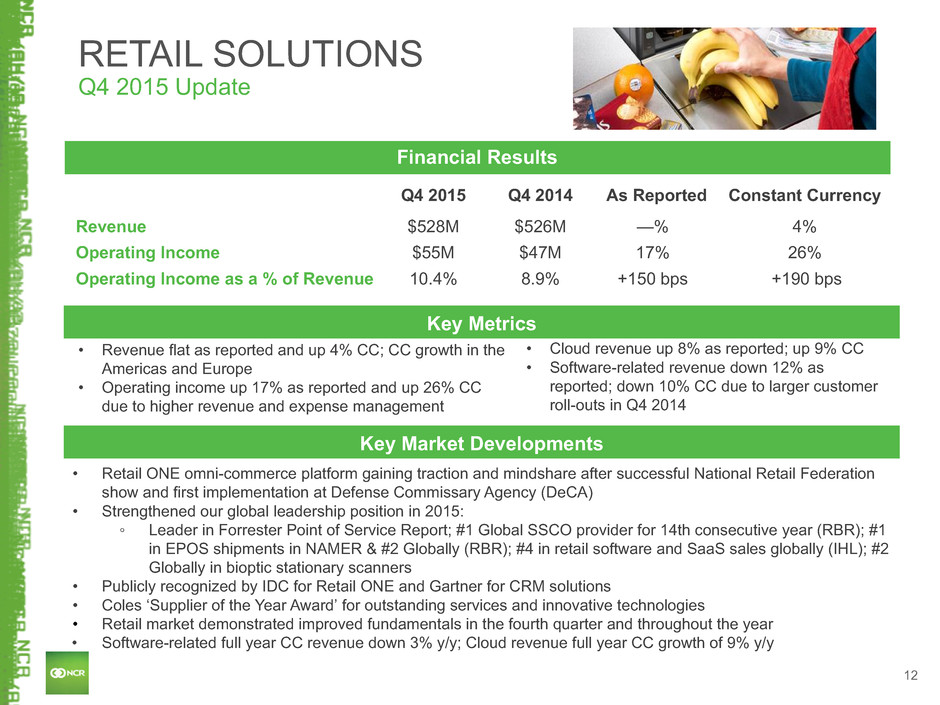
12 RETAIL SOLUTIONS Q4 2015 Update • Revenue flat as reported and up 4% CC; CC growth in the Americas and Europe • Operating income up 17% as reported and up 26% CC due to higher revenue and expense management • Retail ONE omni-commerce platform gaining traction and mindshare after successful National Retail Federation show and first implementation at Defense Commissary Agency (DeCA) • Strengthened our global leadership position in 2015: ◦ Leader in Forrester Point of Service Report; #1 Global SSCO provider for 14th consecutive year (RBR); #1 in EPOS shipments in NAMER & #2 Globally (RBR); #4 in retail software and SaaS sales globally (IHL); #2 Globally in bioptic stationary scanners • Publicly recognized by IDC for Retail ONE and Gartner for CRM solutions • Coles ‘Supplier of the Year Award’ for outstanding services and innovative technologies • Retail market demonstrated improved fundamentals in the fourth quarter and throughout the year • Software-related full year CC revenue down 3% y/y; Cloud revenue full year CC growth of 9% y/y Key Market Developments Financial Results Q4 2015 Q4 2014 As Reported Constant Currency Revenue $528M $526M —% 4% Operating Income $55M $47M 17% 26% Operating Income as a % of Revenue 10.4% 8.9% +150 bps +190 bps • Cloud revenue up 8% as reported; up 9% CC • Software-related revenue down 12% as reported; down 10% CC due to larger customer roll-outs in Q4 2014 Key Metrics
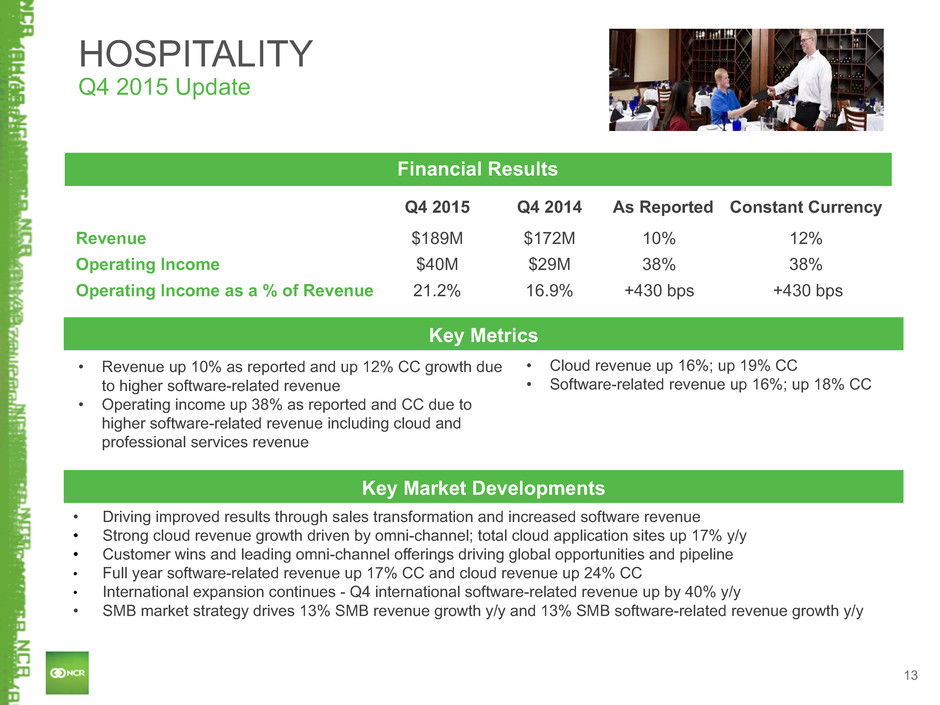
13 HOSPITALITY Q4 2015 Update • Revenue up 10% as reported and up 12% CC growth due to higher software-related revenue • Operating income up 38% as reported and CC due to higher software-related revenue including cloud and professional services revenue • Driving improved results through sales transformation and increased software revenue • Strong cloud revenue growth driven by omni-channel; total cloud application sites up 17% y/y • Customer wins and leading omni-channel offerings driving global opportunities and pipeline • Full year software-related revenue up 17% CC and cloud revenue up 24% CC • International expansion continues - Q4 international software-related revenue up by 40% y/y • SMB market strategy drives 13% SMB revenue growth y/y and 13% SMB software-related revenue growth y/y Key Market Developments Financial Results Q4 2015 Q4 2014 As Reported Constant Currency Revenue $189M $172M 10% 12% Operating Income $40M $29M 38% 38% Operating Income as a % of Revenue 21.2% 16.9% +430 bps +430 bps • Cloud revenue up 16%; up 19% CC • Software-related revenue up 16%; up 18% CC Key Metrics
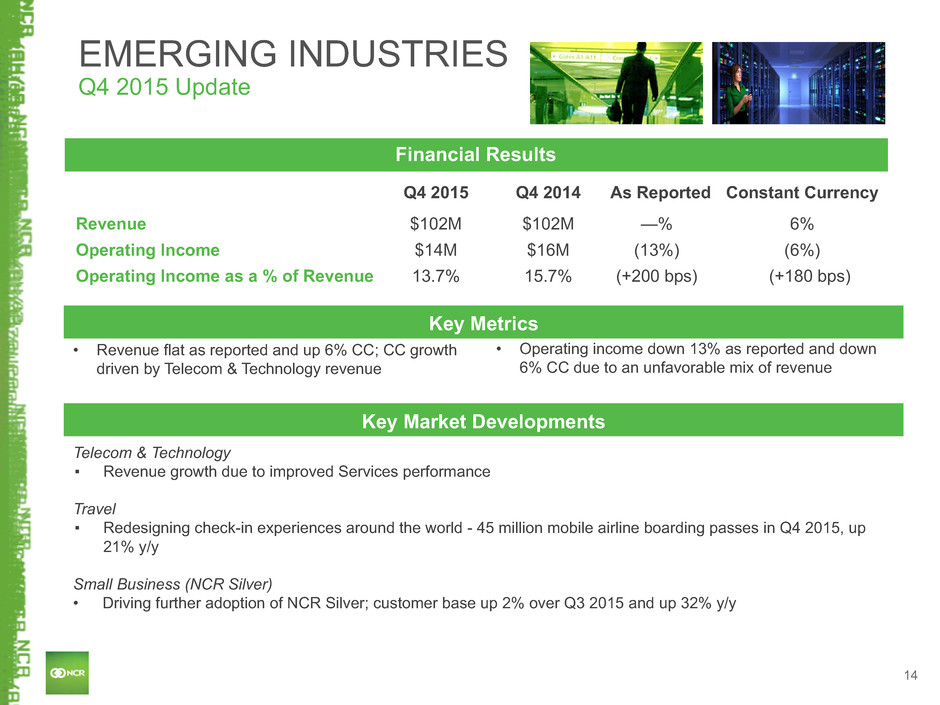
14 EMERGING INDUSTRIES Q4 2015 Update • Revenue flat as reported and up 6% CC; CC growth driven by Telecom & Technology revenue Telecom & Technology ▪ Revenue growth due to improved Services performance Travel ▪ Redesigning check-in experiences around the world - 45 million mobile airline boarding passes in Q4 2015, up 21% y/y Small Business (NCR Silver) • Driving further adoption of NCR Silver; customer base up 2% over Q3 2015 and up 32% y/y Key Market Developments Financial Results Q4 2015 Q4 2014 As Reported Constant Currency Revenue $102M $102M —% 6% Operating Income $14M $16M (13%) (6%) Operating Income as a % of Revenue 13.7% 15.7% (+200 bps) (+180 bps) Key Metrics • Operating income down 13% as reported and down 6% CC due to an unfavorable mix of revenue
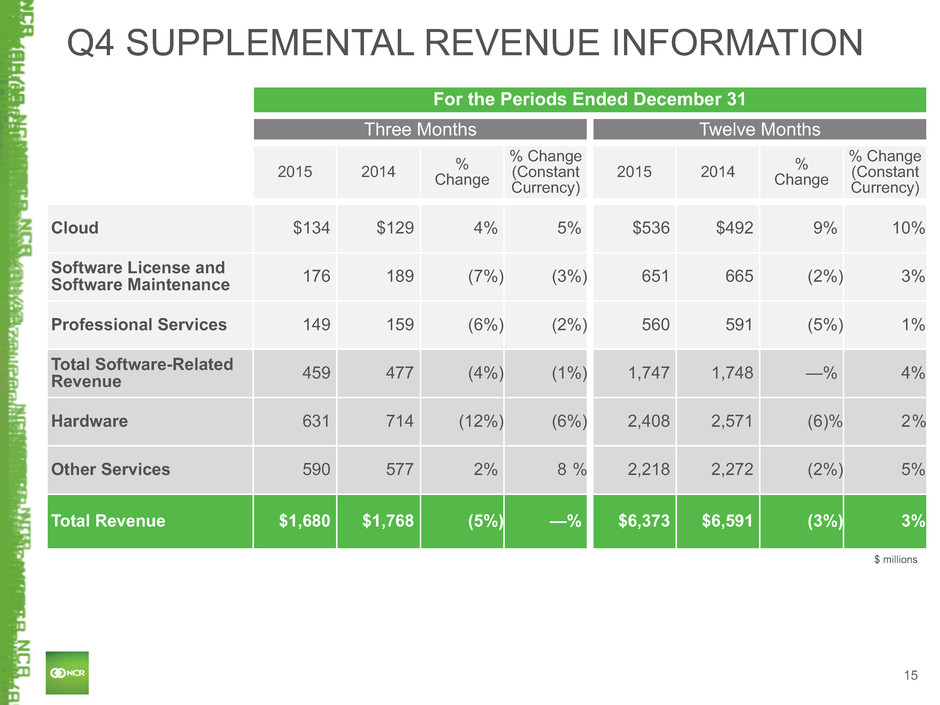
15 Q4 SUPPLEMENTAL REVENUE INFORMATION For the Periods Ended December 31 Three Months Twelve Months 2015 2014 % Change % Change (Constant Currency) 2015 2014 % Change % Change (Constant Currency) Cloud $134 $129 4% 5% $536 $492 9% 10% Software License and Software Maintenance 176 189 (7%) (3%) 651 665 (2%) 3% Professional Services 149 159 (6%) (2%) 560 591 (5%) 1% Total Software-Related Revenue 459 477 (4%) (1%) 1,747 1,748 —% 4% Hardware 631 714 (12%) (6%) 2,408 2,571 (6)% 2% Other Services 590 577 2% 8 % 2,218 2,272 (2%) 5% Total Revenue $1,680 $1,768 (5%) —% $6,373 $6,591 (3%) 3% $ millions
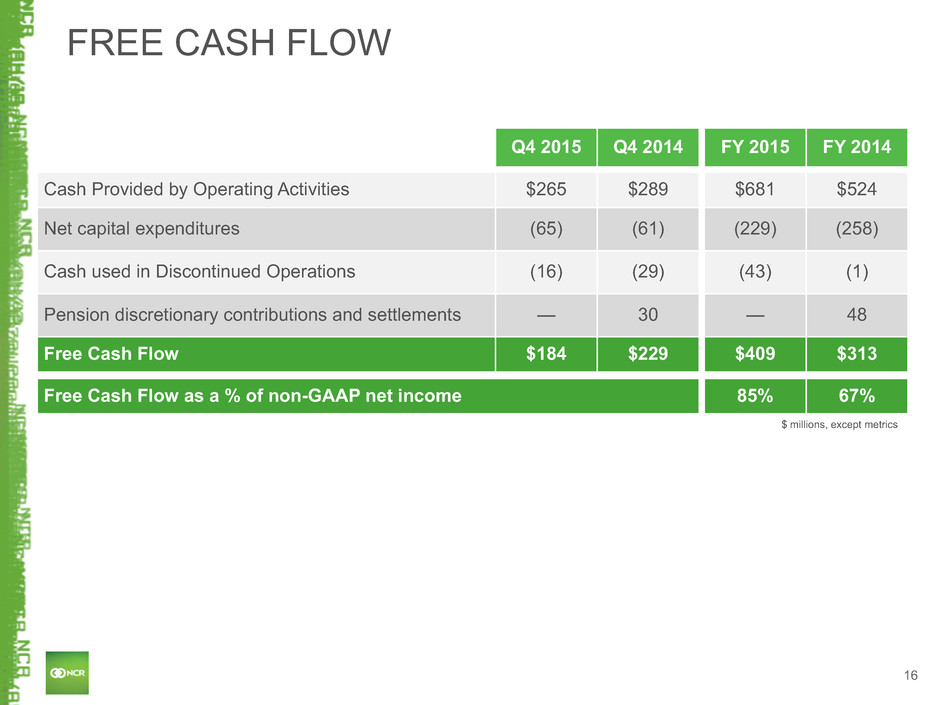
16 FREE CASH FLOW Q4 2015 Q4 2014 FY 2015 FY 2014 Cash Provided by Operating Activities $265 $289 $681 $524 Net capital expenditures (65) (61) (229) (258) Cash used in Discontinued Operations (16) (29) (43) (1) Pension discretionary contributions and settlements — 30 — 48 Free Cash Flow $184 $229 $409 $313 Free Cash Flow as a % of non-GAAP net income 85% 67% $ millions, except metrics
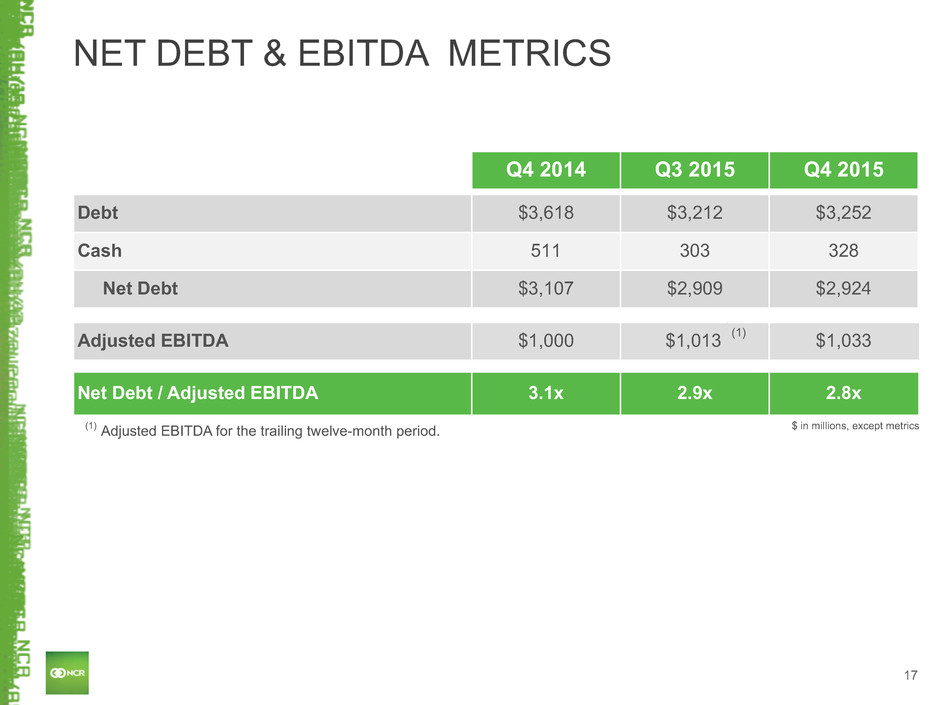
17 NET DEBT & EBITDA METRICS Q4 2014 Q3 2015 Q4 2015 Debt $3,618 $3,212 $3,252 Cash 511 303 328 Net Debt $3,107 $2,909 $2,924 Adjusted EBITDA $1,000 $1,013 (1) $1,033 Net Debt / Adjusted EBITDA 3.1x 2.9x 2.8x $ in millions, except metrics(1) Adjusted EBITDA for the trailing twelve-month period.
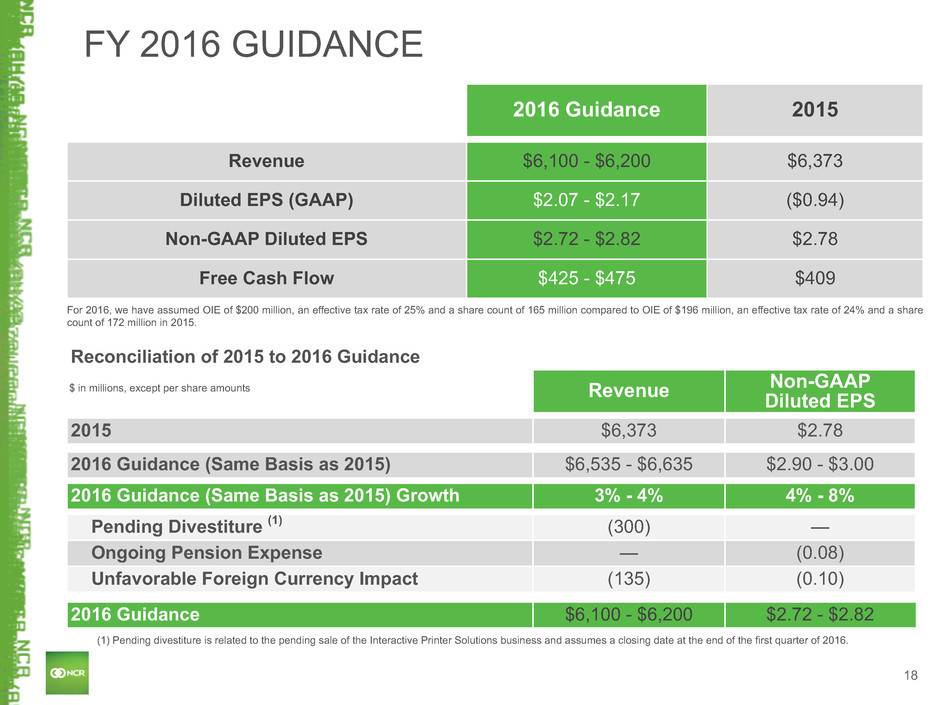
18 2016 Guidance 2015 Revenue $6,100 - $6,200 $6,373 Diluted EPS (GAAP) $2.07 - $2.17 ($0.94) Non-GAAP Diluted EPS $2.72 - $2.82 $2.78 Free Cash Flow $425 - $475 $409 FY 2016 GUIDANCE $ in millions, except per share amounts Reconciliation of 2015 to 2016 Guidance Revenue Non-GAAPDiluted EPS 2015 $6,373 $2.78 2016 Guidance (Same Basis as 2015) $6,535 - $6,635 $2.90 - $3.00 2016 Guidance (Same Basis as 2015) Growth 3% - 4% 4% - 8% Pending Divestiture (1) (300) — Ongoing Pension Expense — (0.08) Unfavorable Foreign Currency Impact (135) (0.10) 2016 Guidance $6,100 - $6,200 $2.72 - $2.82 For 2016, we have assumed OIE of $200 million, an effective tax rate of 25% and a share count of 165 million compared to OIE of $196 million, an effective tax rate of 24% and a share count of 172 million in 2015. (1) Pending divestiture is related to the pending sale of the Interactive Printer Solutions business and assumes a closing date at the end of the first quarter of 2016.
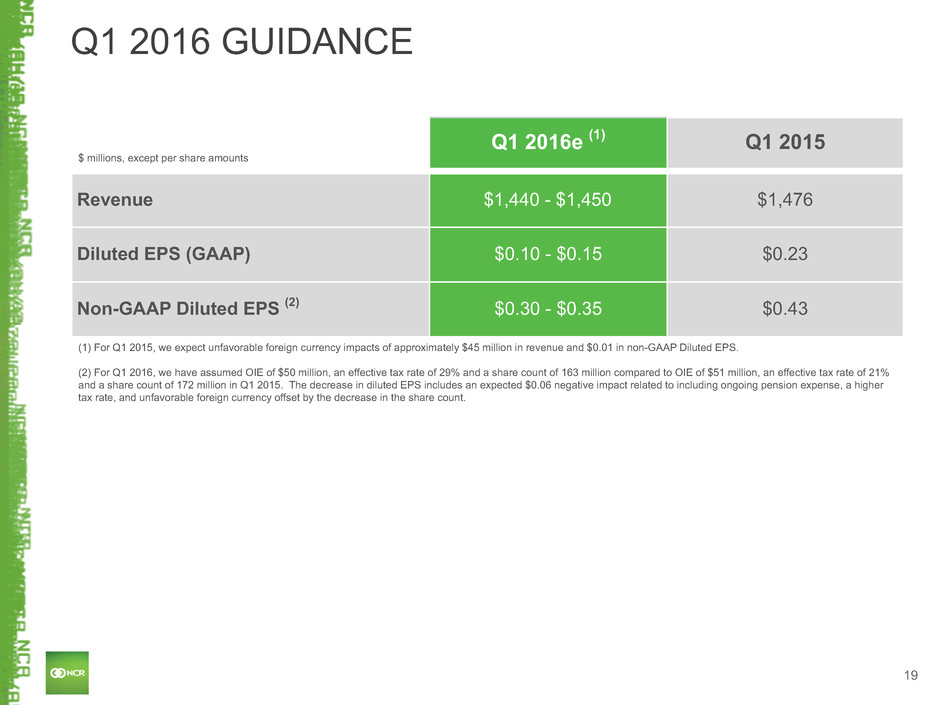
19 Q1 2016 GUIDANCE Q1 2016e (1) Q1 2015 Revenue $1,440 - $1,450 $1,476 Diluted EPS (GAAP) $0.10 - $0.15 $0.23 Non-GAAP Diluted EPS (2) $0.30 - $0.35 $0.43 $ millions, except per share amounts (1) For Q1 2015, we expect unfavorable foreign currency impacts of approximately $45 million in revenue and $0.01 in non-GAAP Diluted EPS. (2) For Q1 2016, we have assumed OIE of $50 million, an effective tax rate of 29% and a share count of 163 million compared to OIE of $51 million, an effective tax rate of 21% and a share count of 172 million in Q1 2015. The decrease in diluted EPS includes an expected $0.06 negative impact related to including ongoing pension expense, a higher tax rate, and unfavorable foreign currency offset by the decrease in the share count.
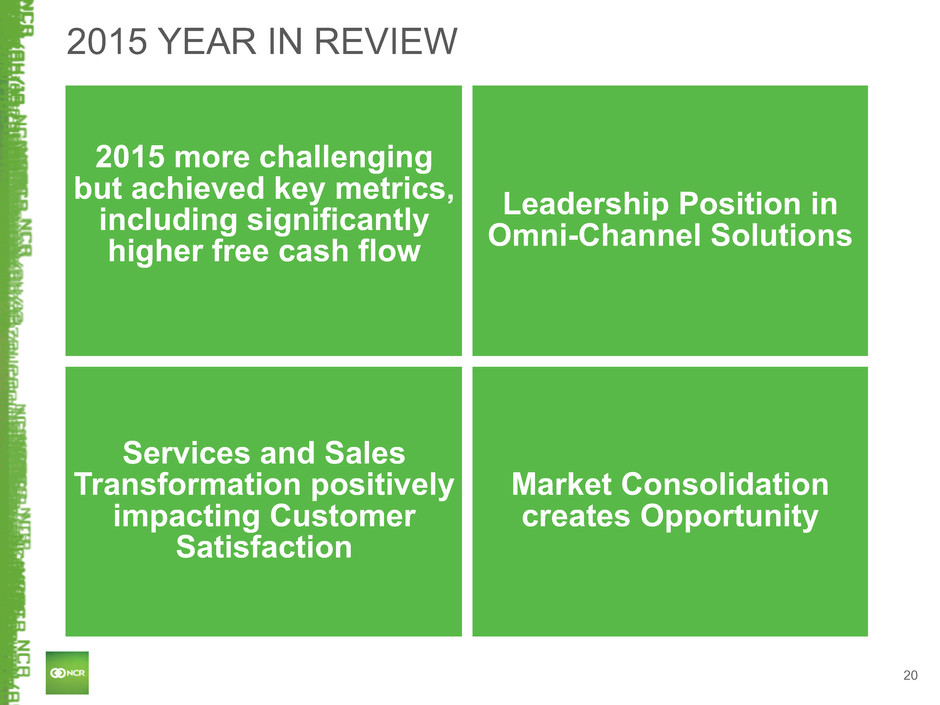
20 2015 YEAR IN REVIEW 2015 more challenging but achieved key metrics, including significantly higher free cash flow Leadership Position in Omni-Channel Solutions Services and Sales Transformation positively impacting Customer Satisfaction Market Consolidation creates Opportunity

SUPPLEMENTARY NON-GAAP MATERIALS
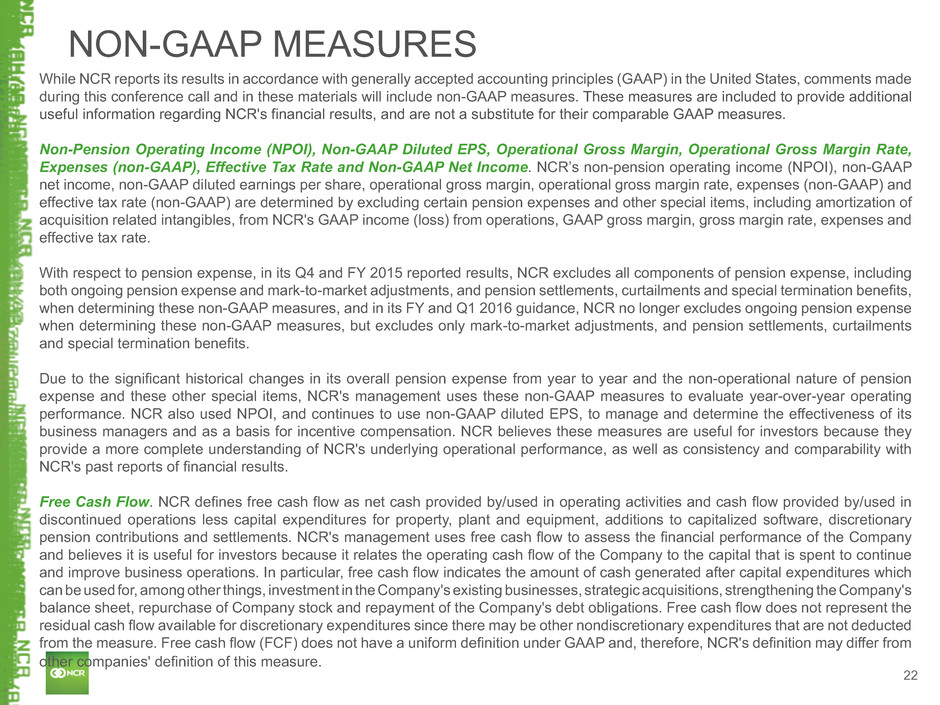
22 NON-GAAP MEASURES While NCR reports its results in accordance with generally accepted accounting principles (GAAP) in the United States, comments made during this conference call and in these materials will include non-GAAP measures. These measures are included to provide additional useful information regarding NCR's financial results, and are not a substitute for their comparable GAAP measures. Non-Pension Operating Income (NPOI), Non-GAAP Diluted EPS, Operational Gross Margin, Operational Gross Margin Rate, Expenses (non-GAAP), Effective Tax Rate and Non-GAAP Net Income. NCR’s non-pension operating income (NPOI), non-GAAP net income, non-GAAP diluted earnings per share, operational gross margin, operational gross margin rate, expenses (non-GAAP) and effective tax rate (non-GAAP) are determined by excluding certain pension expenses and other special items, including amortization of acquisition related intangibles, from NCR's GAAP income (loss) from operations, GAAP gross margin, gross margin rate, expenses and effective tax rate. With respect to pension expense, in its Q4 and FY 2015 reported results, NCR excludes all components of pension expense, including both ongoing pension expense and mark-to-market adjustments, and pension settlements, curtailments and special termination benefits, when determining these non-GAAP measures, and in its FY and Q1 2016 guidance, NCR no longer excludes ongoing pension expense when determining these non-GAAP measures, but excludes only mark-to-market adjustments, and pension settlements, curtailments and special termination benefits. Due to the significant historical changes in its overall pension expense from year to year and the non-operational nature of pension expense and these other special items, NCR's management uses these non-GAAP measures to evaluate year-over-year operating performance. NCR also used NPOI, and continues to use non-GAAP diluted EPS, to manage and determine the effectiveness of its business managers and as a basis for incentive compensation. NCR believes these measures are useful for investors because they provide a more complete understanding of NCR's underlying operational performance, as well as consistency and comparability with NCR's past reports of financial results. Free Cash Flow. NCR defines free cash flow as net cash provided by/used in operating activities and cash flow provided by/used in discontinued operations less capital expenditures for property, plant and equipment, additions to capitalized software, discretionary pension contributions and settlements. NCR's management uses free cash flow to assess the financial performance of the Company and believes it is useful for investors because it relates the operating cash flow of the Company to the capital that is spent to continue and improve business operations. In particular, free cash flow indicates the amount of cash generated after capital expenditures which can be used for, among other things, investment in the Company's existing businesses, strategic acquisitions, strengthening the Company's balance sheet, repurchase of Company stock and repayment of the Company's debt obligations. Free cash flow does not represent the residual cash flow available for discretionary expenditures since there may be other nondiscretionary expenditures that are not deducted from the measure. Free cash flow (FCF) does not have a uniform definition under GAAP and, therefore, NCR's definition may differ from other companies' definition of this measure.
23 NON-GAAP MEASURES Adjusted EBITDA. NCR believes that Adjusted EBITDA (adjusted earnings before interest, taxes, depreciation and amortization) provides useful information to investors because it is an indicator of the strength and performance of the Company's ongoing business operations, including its ability to fund discretionary spending such as capital expenditures, strategic acquisitions and other investments. NCR determines Adjusted EBITDA for a given period based on its GAAP income (loss) from continuing operations plus interest expense, net; plus income tax expense (benefit); plus depreciation and amortization; plus other income (expense); plus pension expense (benefit); and plus special items included in the definition of NPOI. NCR believes that its ratio of net debt to Adjusted EBITDA provides useful information to investors because it is an indicator of the company's ability to meet its future financial obligations. Constant Currency. NCR presents certain measures, such as period-over-period revenue growth, on a constant currency basis, which excludes the effects of foreign currency translation. Due to the continuing strengthening of the U.S. dollar against foreign currencies and the overall variability of foreign exchange rates from period to period, NCR's management uses these measures on a constant currency basis to evaluate period-over-period operating performance. Measures presented on a constant currency basis are calculated by translating current period results at prior period monthly average exchange rates. NCR management's definitions and calculations of these non-GAAP measures may differ from similarly-titled measures reported by other companies and cannot, therefore, be compared with similarly-titled measures of other companies. These non-GAAP measures should not be considered as substitutes for, or superior to, results determined in accordance with GAAP. These non-GAAP measures are reconciled to their corresponding GAAP measures in the following slides and elsewhere in these materials. These reconciliations and other information regarding these non-GAAP measures are also available on the Investor Relations page of NCR's website at www.ncr.com.
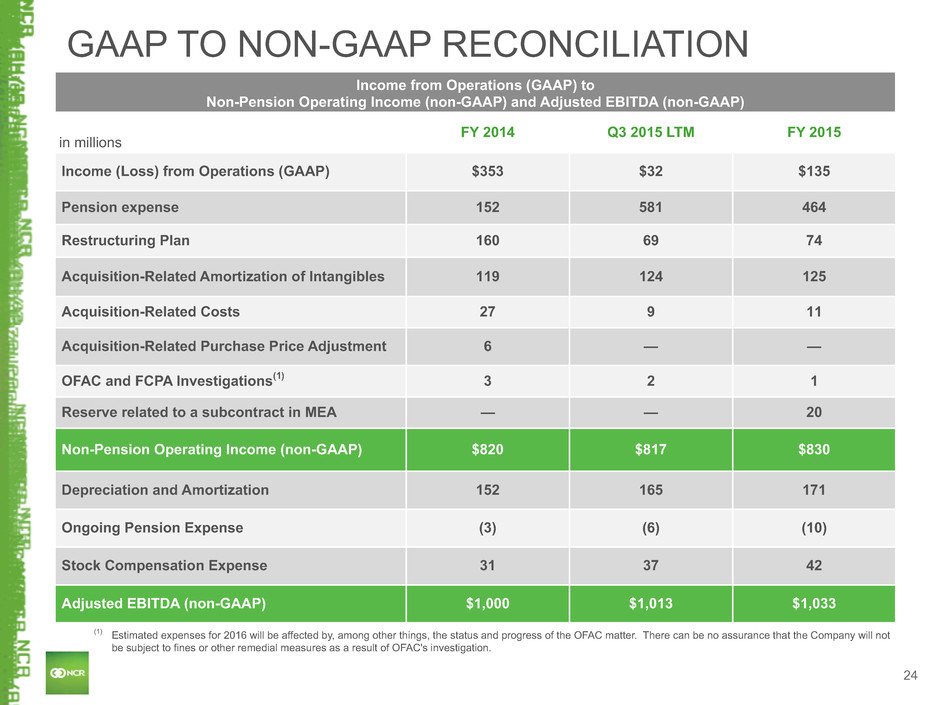
24 Income from Operations (GAAP) to Non-Pension Operating Income (non-GAAP) and Adjusted EBITDA (non-GAAP) in millions FY 2014 Q3 2015 LTM FY 2015 Income (Loss) from Operations (GAAP) $353 $32 $135 Pension expense 152 581 464 Restructuring Plan 160 69 74 Acquisition-Related Amortization of Intangibles 119 124 125 Acquisition-Related Costs 27 9 11 Acquisition-Related Purchase Price Adjustment 6 — — OFAC and FCPA Investigations(1) 3 2 1 Reserve related to a subcontract in MEA — — 20 Non-Pension Operating Income (non-GAAP) $820 $817 $830 Depreciation and Amortization 152 165 171 Ongoing Pension Expense (3) (6) (10) Stock Compensation Expense 31 37 42 Adjusted EBITDA (non-GAAP) $1,000 $1,013 $1,033 GAAP TO NON-GAAP RECONCILIATION (1) Estimated expenses for 2016 will be affected by, among other things, the status and progress of the OFAC matter. There can be no assurance that the Company will not be subject to fines or other remedial measures as a result of OFAC's investigation.
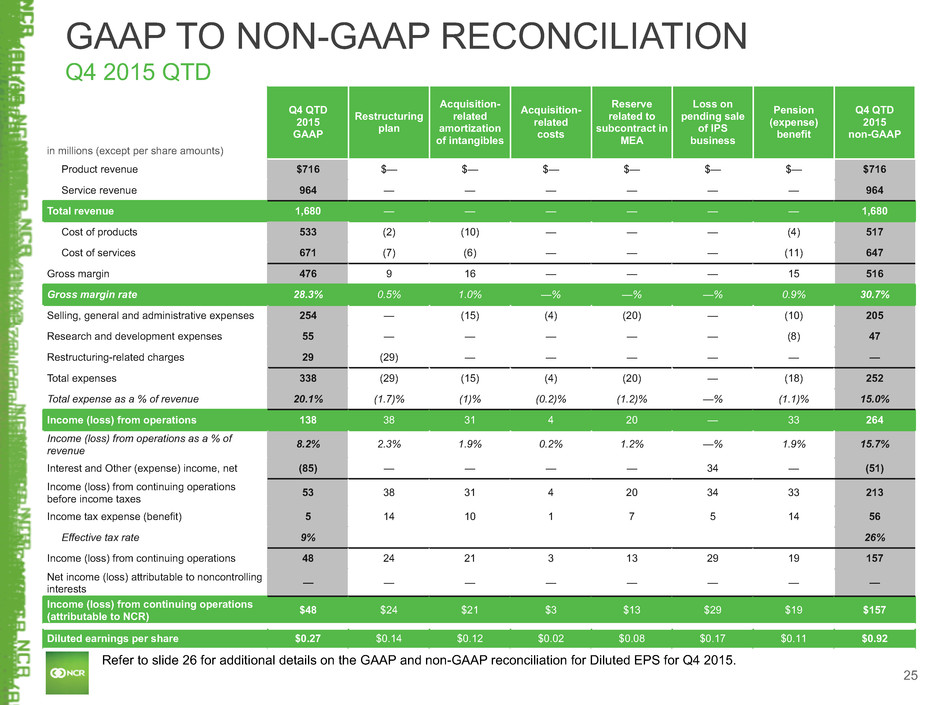
25 in millions (except per share amounts) Q4 QTD 2015 GAAP Restructuring plan Acquisition- related amortization of intangibles Acquisition- related costs Reserve related to subcontract in MEA Loss on pending sale of IPS business Pension (expense) benefit Q4 QTD 2015 non-GAAP Product revenue $716 $— $— $— $— $— $— $716 Service revenue 964 — — — — — — 964 Total revenue 1,680 — — — — — — 1,680 Cost of products 533 (2) (10) — — — (4) 517 Cost of services 671 (7) (6) — — — (11) 647 Gross margin 476 9 16 — — — 15 516 Gross margin rate 28.3% 0.5% 1.0% —% —% —% 0.9% 30.7% Selling, general and administrative expenses 254 — (15) (4) (20) — (10) 205 Research and development expenses 55 — — — — — (8) 47 Restructuring-related charges 29 (29) — — — — — — Total expenses 338 (29) (15) (4) (20) — (18) 252 Total expense as a % of revenue 20.1% (1.7)% (1)% (0.2)% (1.2)% —% (1.1)% 15.0% Income (loss) from operations 138 38 31 4 20 — 33 264 Income (loss) from operations as a % of revenue 8.2% 2.3% 1.9% 0.2% 1.2% —% 1.9% 15.7% Interest and Other (expense) income, net (85) — — — — 34 — (51) Income (loss) from continuing operations before income taxes 53 38 31 4 20 34 33 213 Income tax expense (benefit) 5 14 10 1 7 5 14 56 Effective tax rate 9% 26% Income (loss) from continuing operations 48 24 21 3 13 29 19 157 Net income (loss) attributable to noncontrolling interests — — — — — — — — Income (loss) from continuing operations (attributable to NCR) $48 $24 $21 $3 $13 $29 $19 $157 Diluted earnings per share $0.27 $0.14 $0.12 $0.02 $0.08 $0.17 $0.11 $0.92 GAAP TO NON-GAAP RECONCILIATION Q4 2015 QTD Refer to slide 26 for additional details on the GAAP and non-GAAP reconciliation for Diluted EPS for Q4 2015.
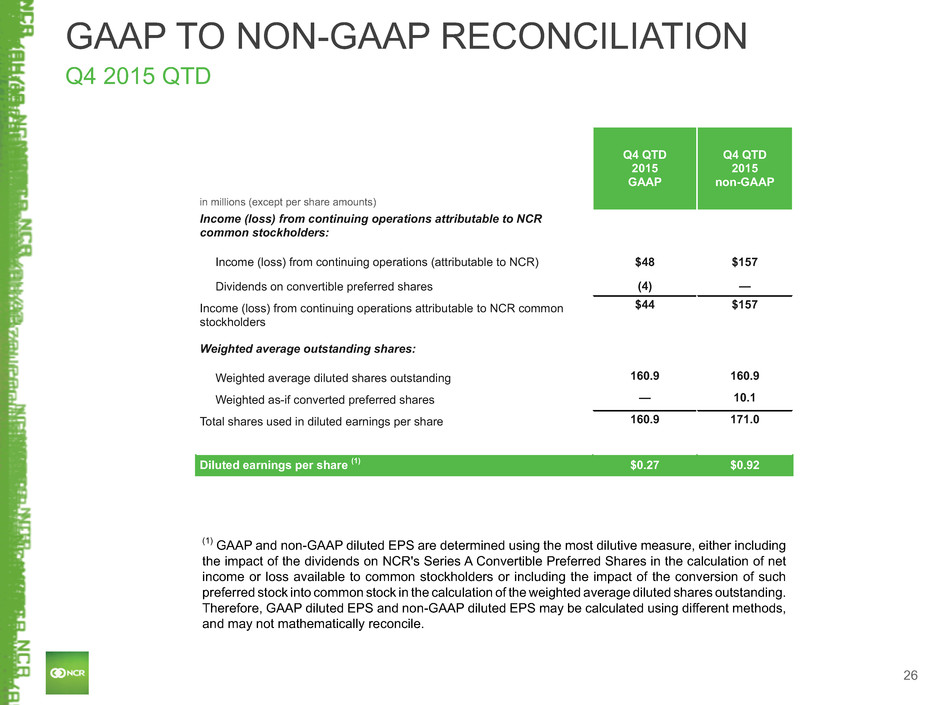
26 in millions (except per share amounts) Q4 QTD 2015 GAAP Q4 QTD 2015 non-GAAP Income (loss) from continuing operations attributable to NCR common stockholders: Income (loss) from continuing operations (attributable to NCR) $48 $157 Dividends on convertible preferred shares (4) — Income (loss) from continuing operations attributable to NCR common stockholders $44 $157 Weighted average outstanding shares: Weighted average diluted shares outstanding 160.9 160.9 Weighted as-if converted preferred shares — 10.1 Total shares used in diluted earnings per share 160.9 171.0 Diluted earnings per share (1) $0.27 $0.92 GAAP TO NON-GAAP RECONCILIATION Q4 2015 QTD (1) GAAP and non-GAAP diluted EPS are determined using the most dilutive measure, either including the impact of the dividends on NCR's Series A Convertible Preferred Shares in the calculation of net income or loss available to common stockholders or including the impact of the conversion of such preferred stock into common stock in the calculation of the weighted average diluted shares outstanding. Therefore, GAAP diluted EPS and non-GAAP diluted EPS may be calculated using different methods, and may not mathematically reconcile.
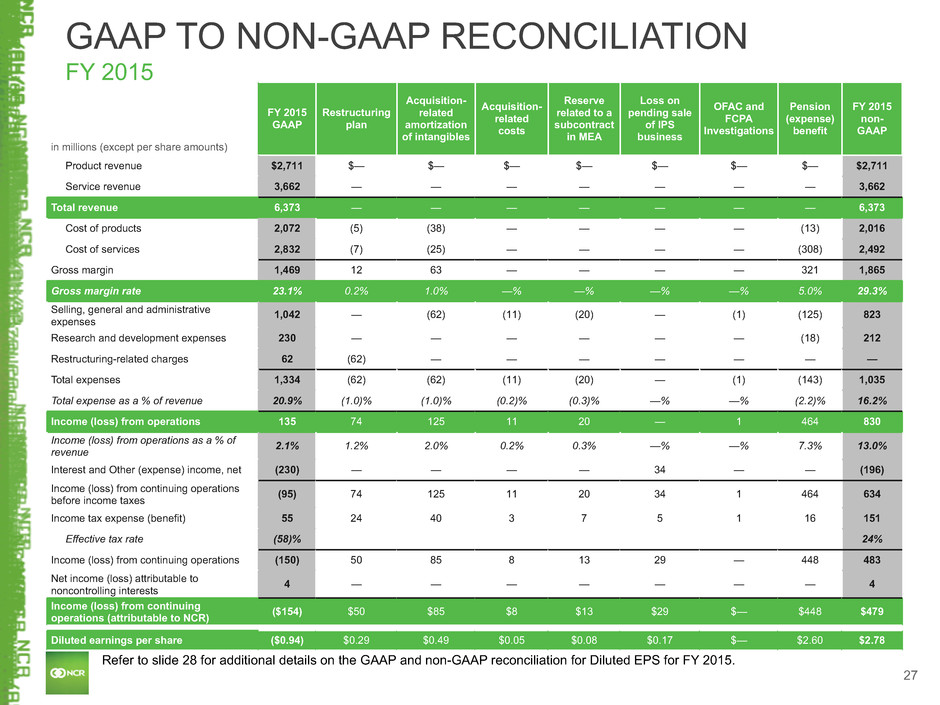
27 in millions (except per share amounts) FY 2015 GAAP Restructuring plan Acquisition- related amortization of intangibles Acquisition- related costs Reserve related to a subcontract in MEA Loss on pending sale of IPS business OFAC and FCPA Investigations Pension (expense) benefit FY 2015 non- GAAP Product revenue $2,711 $— $— $— $— $— $— $— $2,711 Service revenue 3,662 — — — — — — — 3,662 Total revenue 6,373 — — — — — — — 6,373 Cost of products 2,072 (5) (38) — — — — (13) 2,016 Cost of services 2,832 (7) (25) — — — — (308) 2,492 Gross margin 1,469 12 63 — — — — 321 1,865 Gross margin rate 23.1% 0.2% 1.0% —% —% —% —% 5.0% 29.3% Selling, general and administrative expenses 1,042 — (62) (11) (20) — (1) (125) 823 Research and development expenses 230 — — — — — — (18) 212 Restructuring-related charges 62 (62) — — — — — — — Total expenses 1,334 (62) (62) (11) (20) — (1) (143) 1,035 Total expense as a % of revenue 20.9% (1.0)% (1.0)% (0.2)% (0.3)% —% —% (2.2)% 16.2% Income (loss) from operations 135 74 125 11 20 — 1 464 830 Income (loss) from operations as a % of revenue 2.1% 1.2% 2.0% 0.2% 0.3% —% —% 7.3% 13.0% Interest and Other (expense) income, net (230) — — — — 34 — — (196) Income (loss) from continuing operations before income taxes (95) 74 125 11 20 34 1 464 634 Income tax expense (benefit) 55 24 40 3 7 5 1 16 151 Effective tax rate (58)% 24% Income (loss) from continuing operations (150) 50 85 8 13 29 — 448 483 Net income (loss) attributable to noncontrolling interests 4 — — — — — — — 4 Income (loss) from continuing operations (attributable to NCR) ($154) $50 $85 $8 $13 $29 $— $448 $479 Diluted earnings per share ($0.94) $0.29 $0.49 $0.05 $0.08 $0.17 $— $2.60 $2.78 GAAP TO NON-GAAP RECONCILIATION FY 2015 Refer to slide 28 for additional details on the GAAP and non-GAAP reconciliation for Diluted EPS for FY 2015.
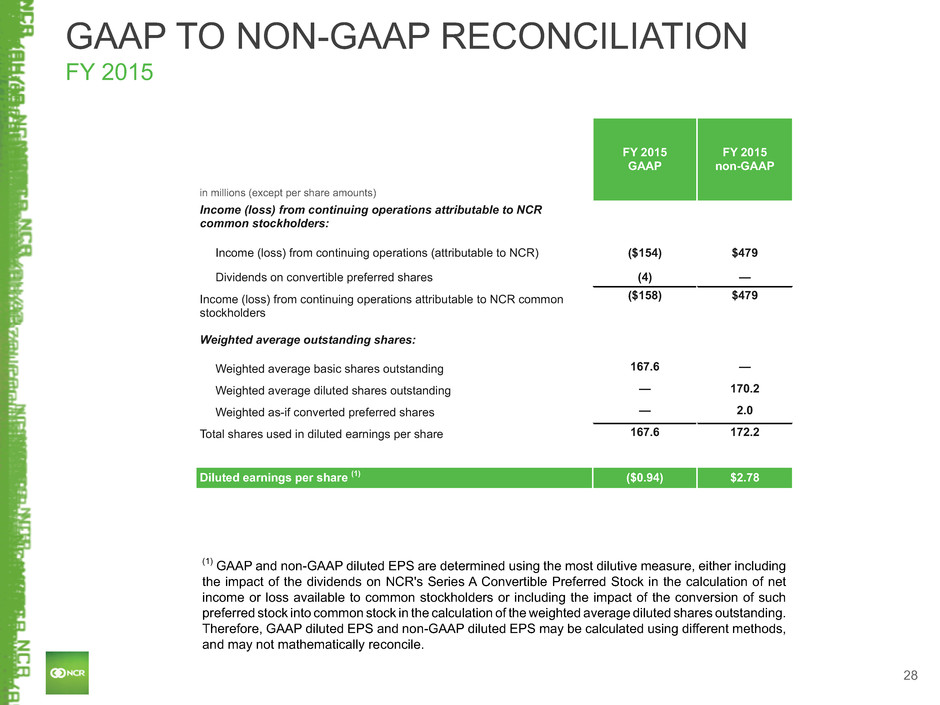
28 in millions (except per share amounts) FY 2015 GAAP FY 2015 non-GAAP Income (loss) from continuing operations attributable to NCR common stockholders: Income (loss) from continuing operations (attributable to NCR) ($154) $479 Dividends on convertible preferred shares (4) — Income (loss) from continuing operations attributable to NCR common stockholders ($158) $479 Weighted average outstanding shares: Weighted average basic shares outstanding 167.6 — Weighted average diluted shares outstanding — 170.2 Weighted as-if converted preferred shares — 2.0 Total shares used in diluted earnings per share 167.6 172.2 Diluted earnings per share (1) ($0.94) $2.78 GAAP TO NON-GAAP RECONCILIATION FY 2015 (1) GAAP and non-GAAP diluted EPS are determined using the most dilutive measure, either including the impact of the dividends on NCR's Series A Convertible Preferred Stock in the calculation of net income or loss available to common stockholders or including the impact of the conversion of such preferred stock into common stock in the calculation of the weighted average diluted shares outstanding. Therefore, GAAP diluted EPS and non-GAAP diluted EPS may be calculated using different methods, and may not mathematically reconcile.
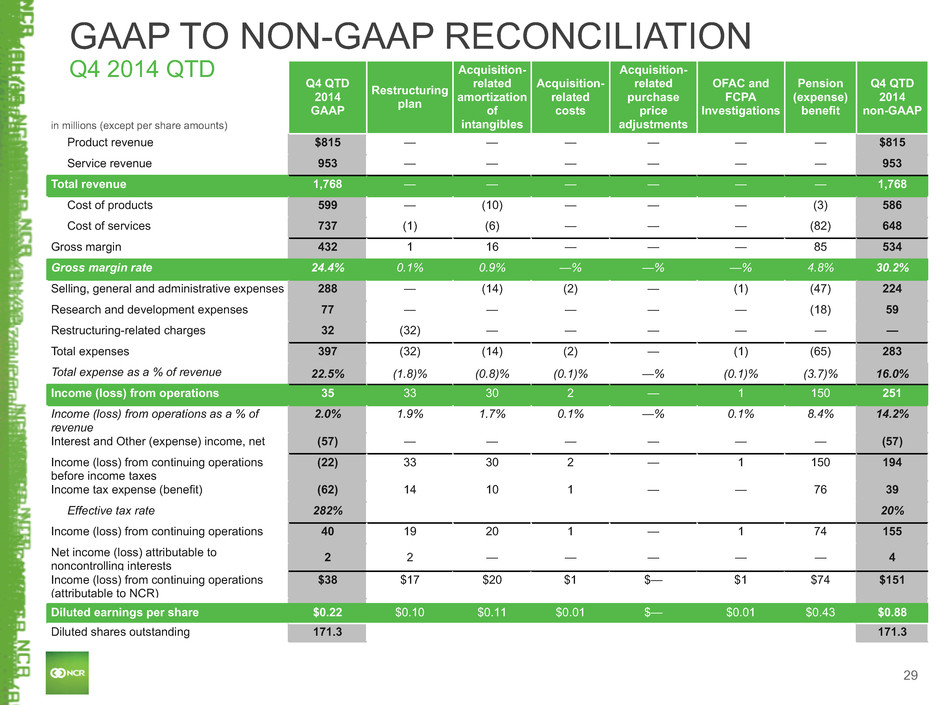
29 in millions (except per share amounts) Q4 QTD 2014 GAAP Restructuring plan Acquisition- related amortization of intangibles Acquisition- related costs Acquisition- related purchase price adjustments OFAC and FCPA Investigations Pension (expense) benefit Q4 QTD 2014 non-GAAP Product revenue $815 — — — — — — $815 Service revenue 953 — — — — — — 953 Total revenue 1,768 — — — — — — 1,768 Cost of products 599 — (10) — — — (3) 586 Cost of services 737 (1) (6) — — — (82) 648 Gross margin 432 1 16 — — — 85 534 Gross margin rate 24.4% 0.1% 0.9% —% —% —% 4.8% 30.2% Selling, general and administrative expenses 288 — (14) (2) — (1) (47) 224 Research and development expenses 77 — — — — — (18) 59 Restructuring-related charges 32 (32) — — — — — — Total expenses 397 (32) (14) (2) — (1) (65) 283 Total expense as a % of revenue 22.5% (1.8)% (0.8)% (0.1)% —% (0.1)% (3.7)% 16.0% Income (loss) from operations 35 33 30 2 — 1 150 251 Income (loss) from operations as a % of revenue 2.0% 1.9% 1.7% 0.1% —% 0.1% 8.4% 14.2% Interest and Other (expense) income, net (57) — — — — — — (57) Income (loss) from continuing operations before income taxes (22) 33 30 2 — 1 150 194 Income tax expense (benefit) (62) 14 10 1 — — 76 39 Effective tax rate 282% 20% Income (loss) from continuing operations 40 19 20 1 — 1 74 155 Net income (loss) attributable to noncontrolling interests 2 2 — — — — — 4 Income (loss) from continuing operations (attributable to NCR) $38 $17 $20 $1 $— $1 $74 $151 Diluted earnings per share $0.22 $0.10 $0.11 $0.01 $— $0.01 $0.43 $0.88 Diluted shares outstanding 171.3 171.3 GAAP TO NON-GAAP RECONCILIATION Q4 2014 QTD
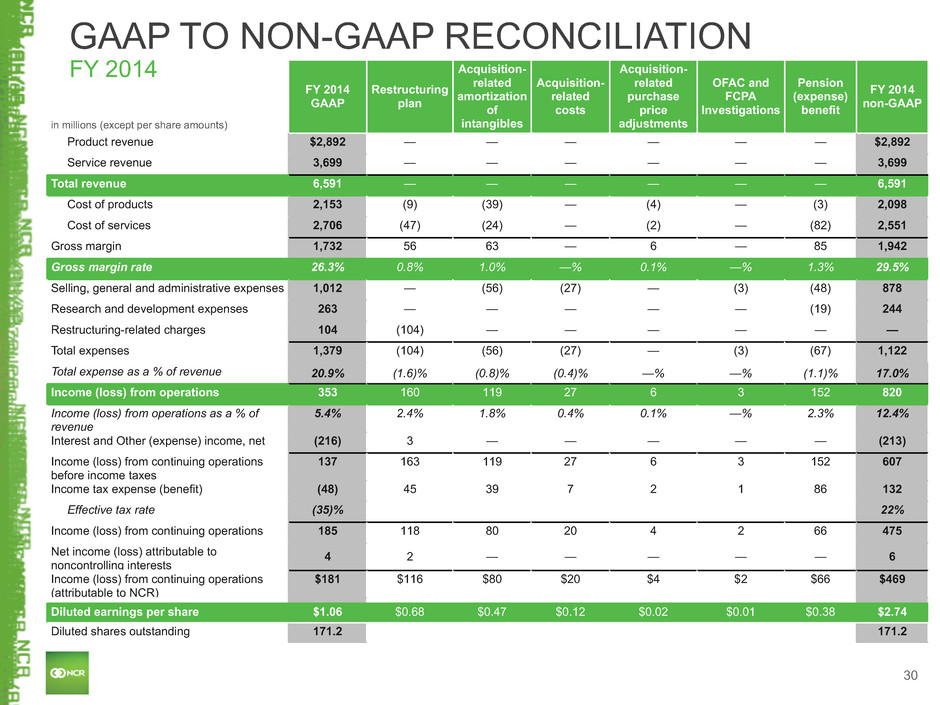
30 in millions (except per share amounts) FY 2014 GAAP Restructuring plan Acquisition- related amortization of intangibles Acquisition- related costs Acquisition- related purchase price adjustments OFAC and FCPA Investigations Pension (expense) benefit FY 2014 non-GAAP Product revenue $2,892 — — — — — — $2,892 Service revenue 3,699 — — — — — — 3,699 Total revenue 6,591 — — — — — — 6,591 Cost of products 2,153 (9) (39) — (4) — (3) 2,098 Cost of services 2,706 (47) (24) — (2) — (82) 2,551 Gross margin 1,732 56 63 — 6 — 85 1,942 Gross margin rate 26.3% 0.8% 1.0% —% 0.1% —% 1.3% 29.5% Selling, general and administrative expenses 1,012 — (56) (27) — (3) (48) 878 Research and development expenses 263 — — — — — (19) 244 Restructuring-related charges 104 (104) — — — — — — Total expenses 1,379 (104) (56) (27) — (3) (67) 1,122 Total expense as a % of revenue 20.9% (1.6)% (0.8)% (0.4)% —% —% (1.1)% 17.0% Income (loss) from operations 353 160 119 27 6 3 152 820 Income (loss) from operations as a % of revenue 5.4% 2.4% 1.8% 0.4% 0.1% —% 2.3% 12.4% Interest and Other (expense) income, net (216) 3 — — — — — (213) Income (loss) from continuing operations before income taxes 137 163 119 27 6 3 152 607 Income tax expense (benefit) (48) 45 39 7 2 1 86 132 Effective tax rate (35)% 22% Income (loss) from continuing operations 185 118 80 20 4 2 66 475 Net income (loss) attributable to noncontrolling interests 4 2 — — — — — 6 Income (loss) from continuing operations (attributable to NCR) $181 $116 $80 $20 $4 $2 $66 $469 Diluted earnings per share $1.06 $0.68 $0.47 $0.12 $0.02 $0.01 $0.38 $2.74 Diluted shares outstanding 171.2 171.2 GAAP TO NON-GAAP RECONCILIATION FY 2014
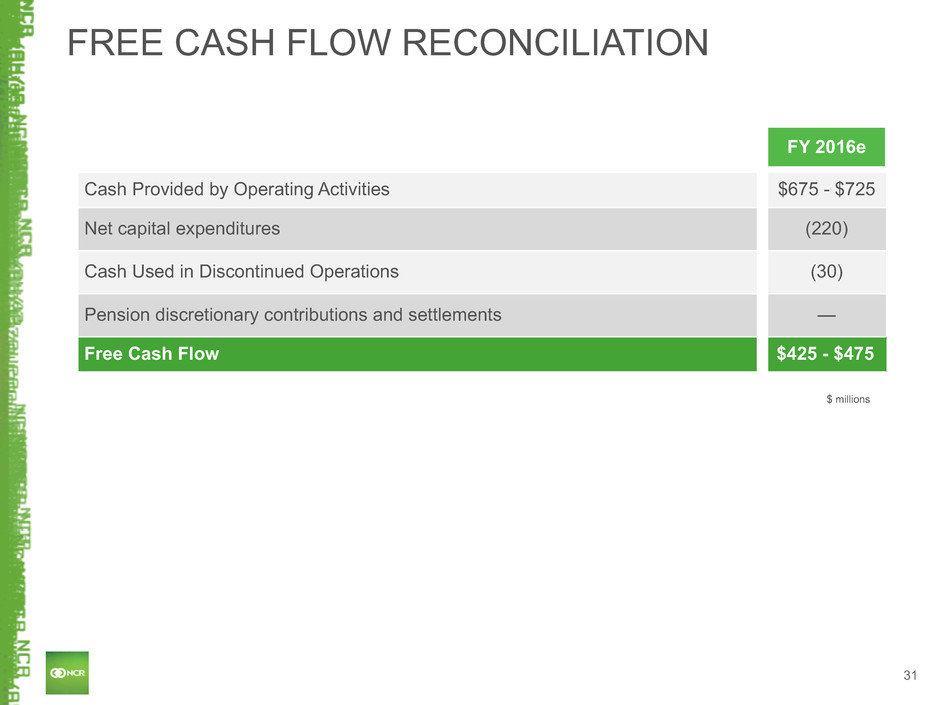
31 FREE CASH FLOW RECONCILIATION FY 2016e Cash Provided by Operating Activities $675 - $725 Net capital expenditures (220) Cash Used in Discontinued Operations (30) Pension discretionary contributions and settlements — Free Cash Flow $425 - $475 $ millions
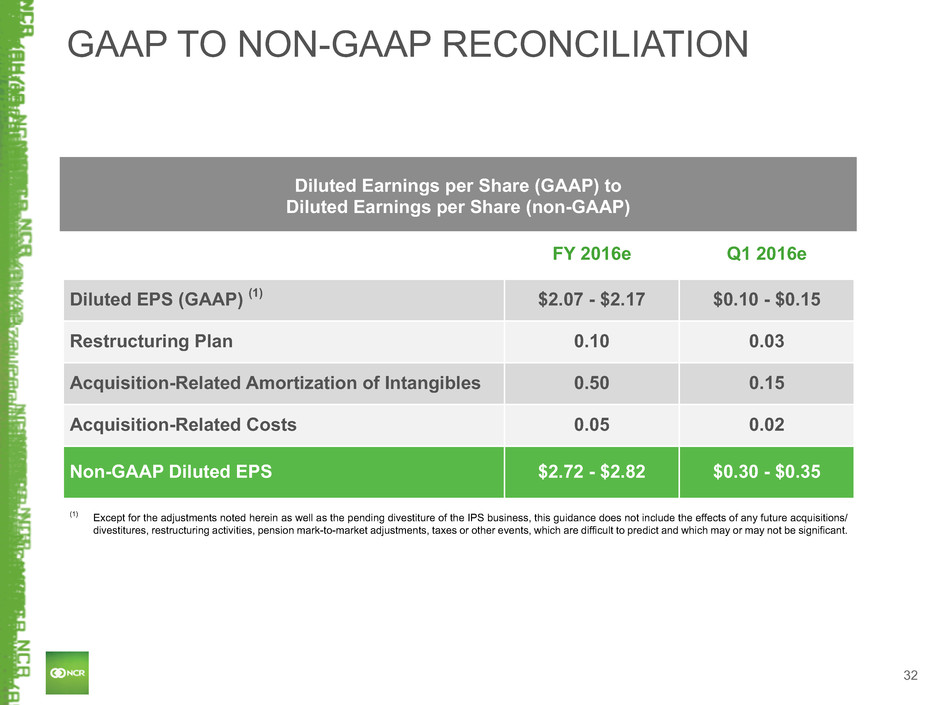
32 GAAP TO NON-GAAP RECONCILIATION FY 2016e Q1 2016e Diluted EPS (GAAP) (1) $2.07 - $2.17 $0.10 - $0.15 Restructuring Plan 0.10 0.03 Acquisition-Related Amortization of Intangibles 0.50 0.15 Acquisition-Related Costs 0.05 0.02 Non-GAAP Diluted EPS $2.72 - $2.82 $0.30 - $0.35 Diluted Earnings per Share (GAAP) to Diluted Earnings per Share (non-GAAP) (1) Except for the adjustments noted herein as well as the pending divestiture of the IPS business, this guidance does not include the effects of any future acquisitions/ divestitures, restructuring activities, pension mark-to-market adjustments, taxes or other events, which are difficult to predict and which may or may not be significant.
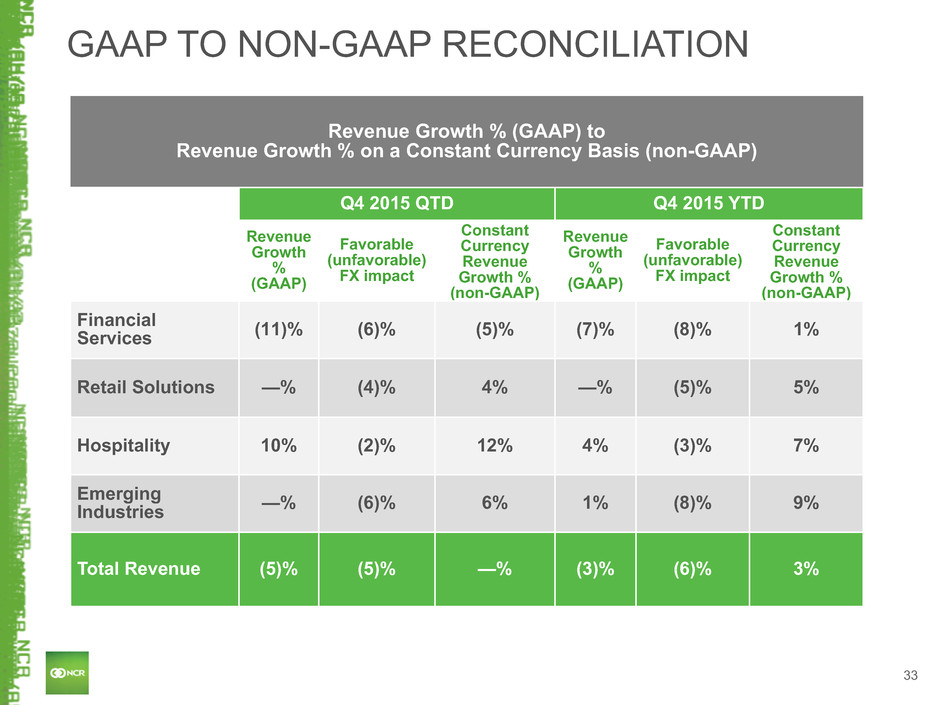
33 GAAP TO NON-GAAP RECONCILIATION Revenue Growth % (GAAP) to Revenue Growth % on a Constant Currency Basis (non-GAAP) Q4 2015 QTD Q4 2015 YTD Revenue Growth % (GAAP) Favorable (unfavorable) FX impact Constant Currency Revenue Growth % (non-GAAP) Revenue Growth % (GAAP) Favorable (unfavorable) FX impact Constant Currency Revenue Growth % (non-GAAP) Financial Services (11)% (6)% (5)% (7)% (8)% 1% Retail Solutions —% (4)% 4% —% (5)% 5% Hospitality 10% (2)% 12% 4% (3)% 7% Emerging Industries —% (6)% 6% 1% (8)% 9% Total Revenue (5)% (5)% —% (3)% (6)% 3%
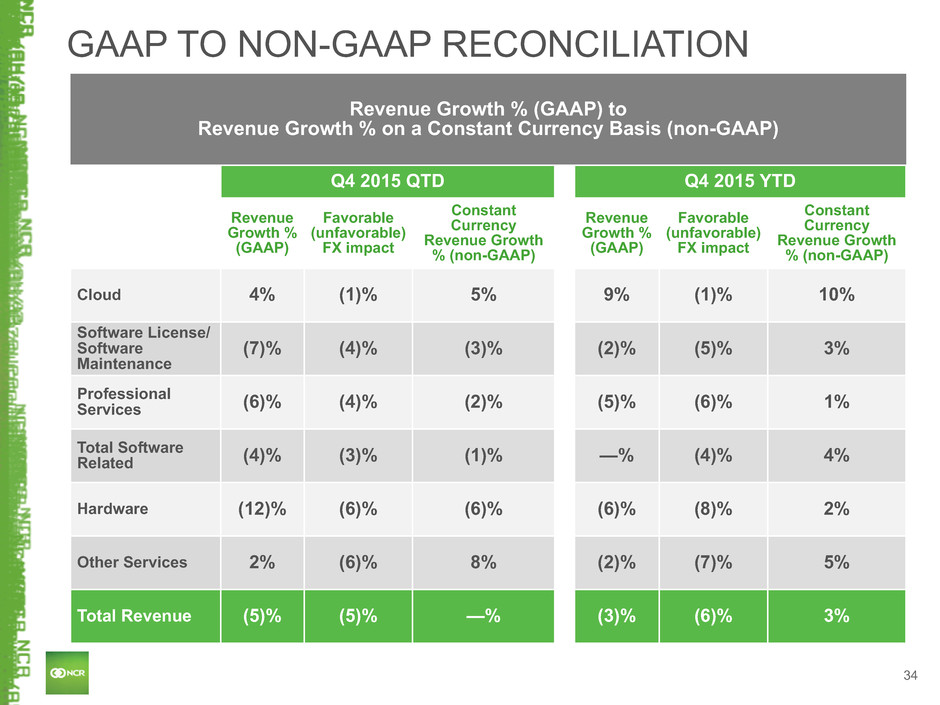
34 GAAP TO NON-GAAP RECONCILIATION Revenue Growth % (GAAP) to Revenue Growth % on a Constant Currency Basis (non-GAAP) Q4 2015 QTD Q4 2015 YTD Revenue Growth % (GAAP) Favorable (unfavorable) FX impact Constant Currency Revenue Growth % (non-GAAP) Revenue Growth % (GAAP) Favorable (unfavorable) FX impact Constant Currency Revenue Growth % (non-GAAP) Cloud 4% (1)% 5% 9% (1)% 10% Software License/ Software Maintenance (7)% (4)% (3)% (2)% (5)% 3% Professional Services (6)% (4)% (2)% (5)% (6)% 1% Total Software Related (4)% (3)% (1)% —% (4)% 4% Hardware (12)% (6)% (6)% (6)% (8)% 2% Other Services 2% (6)% 8% (2)% (7)% 5% Total Revenue (5)% (5)% —% (3)% (6)% 3%
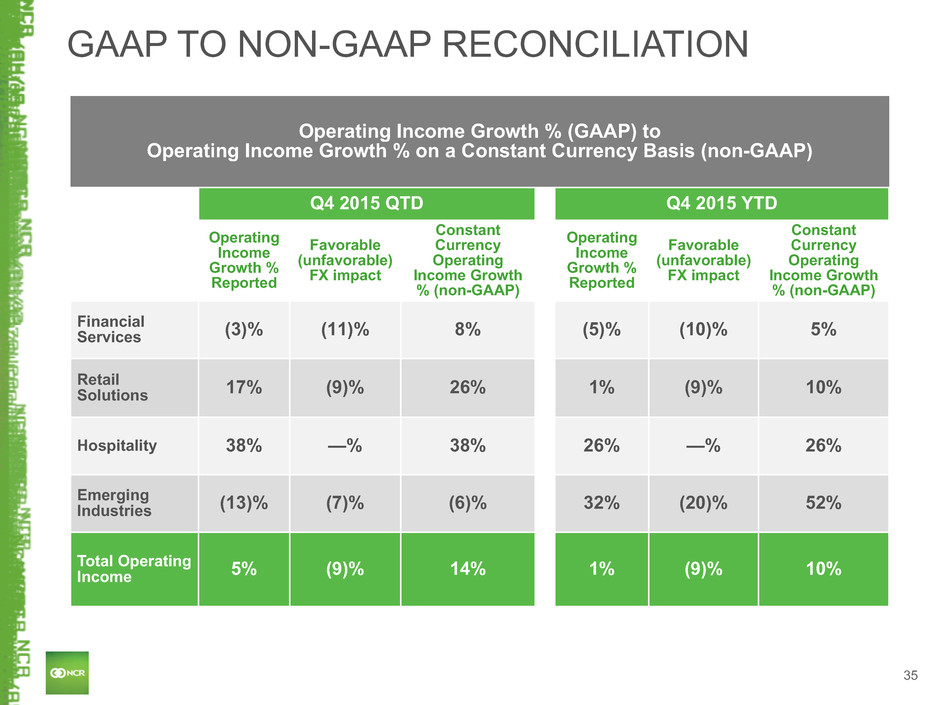
35 GAAP TO NON-GAAP RECONCILIATION Operating Income Growth % (GAAP) to Operating Income Growth % on a Constant Currency Basis (non-GAAP) Q4 2015 QTD Q4 2015 YTD Operating Income Growth % Reported Favorable (unfavorable) FX impact Constant Currency Operating Income Growth % (non-GAAP) Operating Income Growth % Reported Favorable (unfavorable) FX impact Constant Currency Operating Income Growth % (non-GAAP) Financial Services (3)% (11)% 8% (5)% (10)% 5% Retail Solutions 17% (9)% 26% 1% (9)% 10% Hospitality 38% —% 38% 26% —% 26% Emerging Industries (13)% (7)% (6)% 32% (20)% 52% Total Operating Income 5% (9)% 14% 1% (9)% 10%
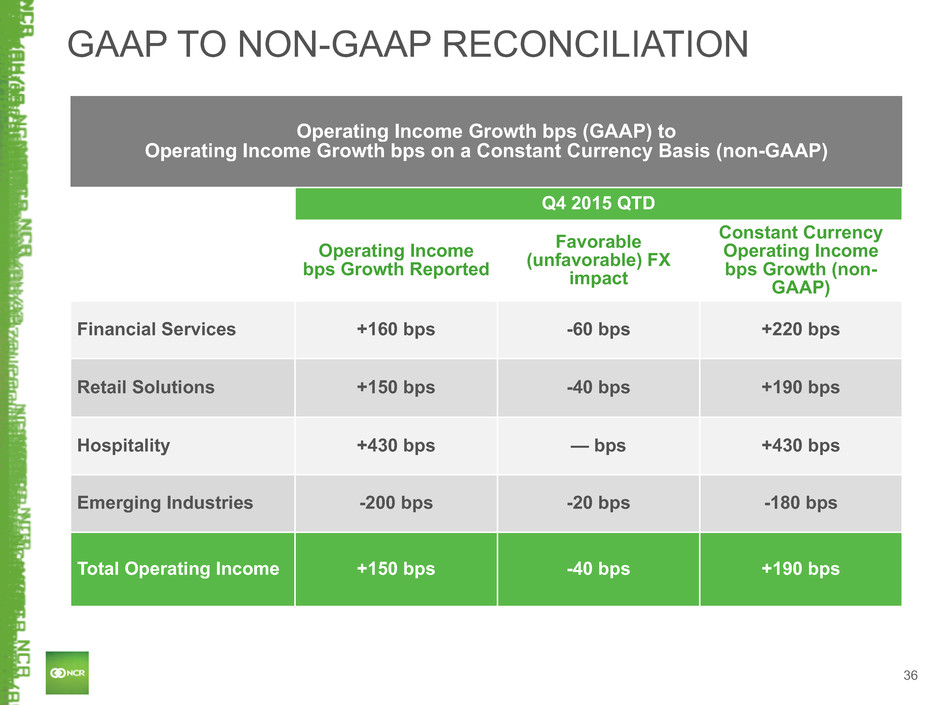
36 GAAP TO NON-GAAP RECONCILIATION Operating Income Growth bps (GAAP) to Operating Income Growth bps on a Constant Currency Basis (non-GAAP) Q4 2015 QTD Operating Income bps Growth Reported Favorable (unfavorable) FX impact Constant Currency Operating Income bps Growth (non- GAAP) Financial Services +160 bps -60 bps +220 bps Retail Solutions +150 bps -40 bps +190 bps Hospitality +430 bps — bps +430 bps Emerging Industries -200 bps -20 bps -180 bps Total Operating Income +150 bps -40 bps +190 bps

37


