
1 Q1 2016 EARNINGS CONFERENCE CALL BILL NUTI, PRESIDENT, CEO AND CHAIRMAN BOB FISHMAN, CFO April 26, 2016
2 NOTES TO INVESTORS FORWARD-LOOKING STATEMENTS. Comments made during this conference call and in these materials contain forward- looking statements. Statements that describe or relate to NCR's plans, goals, intentions, strategies or financial outlook, and statements that do not relate to historical or current fact, are examples of forward-looking statements. The forward-looking statements in these materials include statements about NCR’s momentum in selling its omni-channel solutions and the expected growth of its omni-channel solutions; expectations for the growth of revenue in future quarters in 2016; expectations for the growth of NCR’s strategic solutions, including its Branch, Store and Restaurant Transformation solutions and the revenue from those solutions; NCR’s Q2 2016, FY 2016 and 2016 segment revenue financial guidance and the expected type and magnitude of the non-operational adjustments included in any forward-looking non-GAAP measures; expectations for the timing of the consummation of the sale of NCR’s Interactive Printer Solutions business; NCR’s expected revenue, operating income and earnings per share trending for 2016; and foreign currency fluctuations and their impact on NCR’s results. Forward-looking statements are not guarantees of future performance, and there are a number of important factors that could cause actual outcomes and results to differ materially from the results contemplated by such forward-looking statements, including those factors listed in Item 1a "Risk Factors" of NCR's Annual Report on Form 10-K filed with the Securities and Exchange Commission (SEC) on February 26, 2016, and those factors detailed from time to time in NCR's other SEC reports. These materials are dated April 26, 2016, and NCR does not undertake any obligation to publicly update or revise any forward-looking statements, whether as a result of new information, future events or otherwise. NON-GAAP MEASURES. While NCR reports its results in accordance with generally accepted accounting principles in the United States (GAAP), comments made during this conference call and these materials will include the following "non-GAAP" measures: operating income (non-GAAP), non-GAAP diluted earnings per share (non-GAAP diluted EPS), free cash flow (FCF), gross margin (non- GAAP), gross margin rate (non-GAAP), expenses (non-GAAP), adjusted EBITDA, income tax expense (non-GAAP), net income (non- GAAP) and selected measures expressed on a constant currency basis. These measures are included to provide additional useful information regarding NCR's financial results, and are not a substitute for their comparable GAAP measures. Explanations of these non- GAAP measures (including changes to the treatment of ongoing pension expenses in the calculation of certain of these measures), and reconciliations of these non-GAAP measures to their directly comparable GAAP measures, are included in the accompanying "Supplementary Non-GAAP Materials" and are available on the Investor Relations page of NCR's website at www.ncr.com. Descriptions of many of these non-GAAP measures are also included in NCR's SEC reports. USE OF CERTAIN TERMS. As used in these materials, (i) the term "recurring revenue" means the sum of cloud, hardware maintenance and software maintenance revenue, (ii) the terms "cloud" and "cloud revenue" are used to describe NCR’s software-as-a- service offerings and the revenue associated therewith and (iii) the term "CC" means constant currency. These presentation materials and the associated remarks made during this conference call are integrally related and are intended to be presented and understood together.
3 Q1 UPDATE
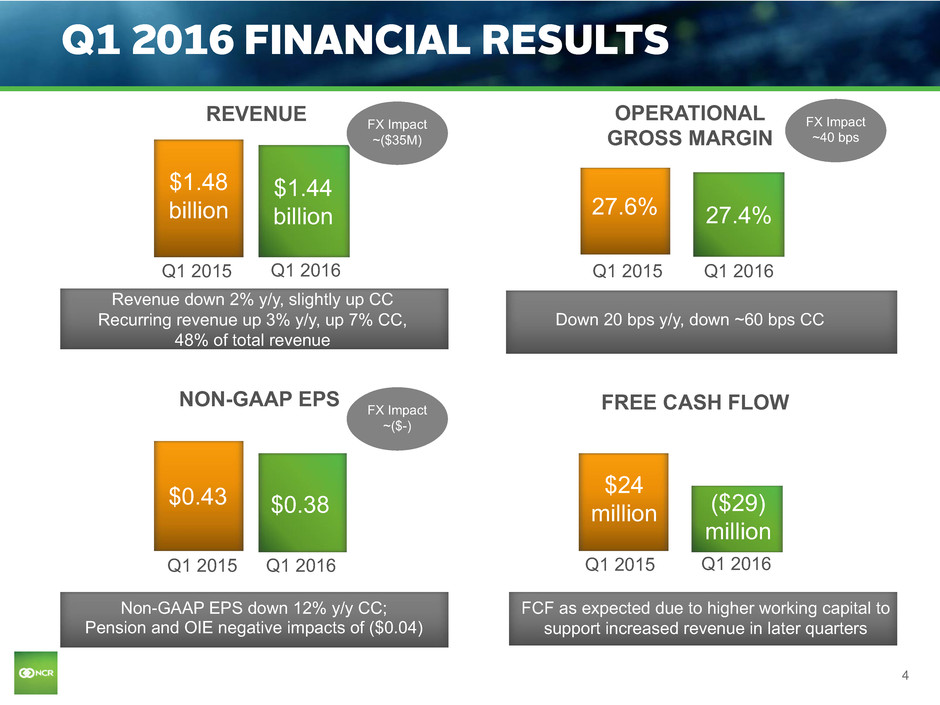
4 Q1 2016 FINANCIAL RESULTS REVENUE Q1 2015 Q1 2016 $1.48 billion Revenue down 2% y/y, slightly up CC Recurring revenue up 3% y/y, up 7% CC, 48% of total revenue OPERATIONAL GROSS MARGIN Q1 2015 Q1 2016 27.6% Down 20 bps y/y, down ~60 bps CC 27.4% Non-GAAP EPS down 12% y/y CC; Pension and OIE negative impacts of ($0.04) FREE CASH FLOW FCF as expected due to higher working capital to support increased revenue in later quarters Q1 2015 Q1 2016 $24 million ($29) million $1.44 billion NON-GAAP EPS Q1 2015 Q1 2016 $0.38 $0.43 FX Impact ~($35M) FX Impact ~40 bps FX Impact ~($-)
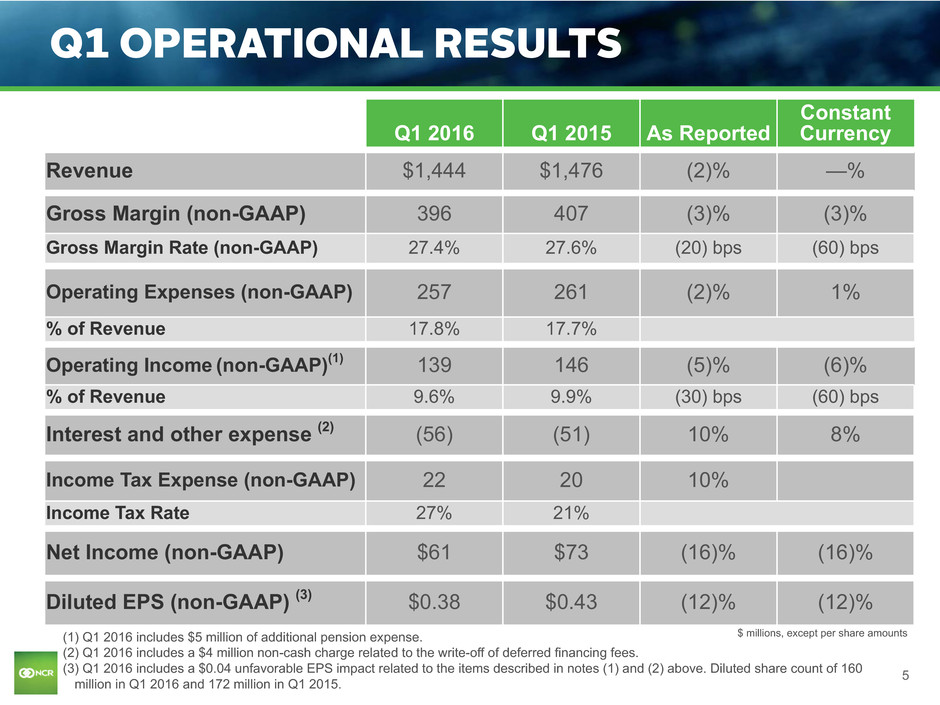
5 Q1 2016 Q1 2015 As Reported Constant Currency Revenue $1,444 $1,476 (2)% —% Gross Margin (non-GAAP) 396 407 (3)% (3)% Gross Margin Rate (non-GAAP) 27.4% 27.6% (20) bps (60) bps Operating Expenses (non-GAAP) 257 261 (2)% 1% % of Revenue 17.8% 17.7% Operating Income (non-GAAP)(1) 139 146 (5)% (6)% % of Revenue 9.6% 9.9% (30) bps (60) bps Interest and other expense (2) (56) (51) 10% 8% Income Tax Expense (non-GAAP) 22 20 10% Income Tax Rate 27% 21% Net Income (non-GAAP) $61 $73 (16)% (16)% Diluted EPS (non-GAAP) (3) $0.38 $0.43 (12)% (12)% Q1 OPERATIONAL RESULTS (1) Q1 2016 includes $5 million of additional pension expense. (2) Q1 2016 includes a $4 million non-cash charge related to the write-off of deferred financing fees. (3) Q1 2016 includes a $0.04 unfavorable EPS impact related to the items described in notes (1) and (2) above. Diluted share count of 160 million in Q1 2016 and 172 million in Q1 2015. $ millions, except per share amounts
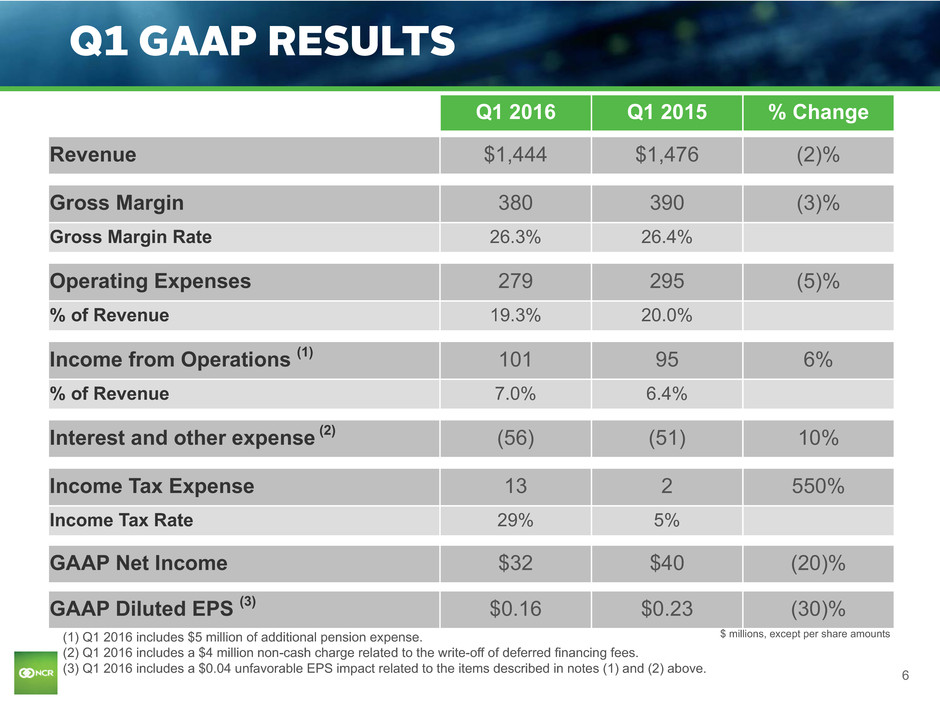
6 Q1 2016 Q1 2015 % Change Revenue $1,444 $1,476 (2)% Gross Margin 380 390 (3)% Gross Margin Rate 26.3% 26.4% Operating Expenses 279 295 (5)% % of Revenue 19.3% 20.0% Income from Operations (1) 101 95 6% % of Revenue 7.0% 6.4% Interest and other expense (2) (56) (51) 10% Income Tax Expense 13 2 550% Income Tax Rate 29% 5% GAAP Net Income $32 $40 (20)% GAAP Diluted EPS (3) $0.16 $0.23 (30)% Q1 GAAP RESULTS $ millions, except per share amounts(1) Q1 2016 includes $5 million of additional pension expense. (2) Q1 2016 includes a $4 million non-cash charge related to the write-off of deferred financing fees. (3) Q1 2016 includes a $0.04 unfavorable EPS impact related to the items described in notes (1) and (2) above.
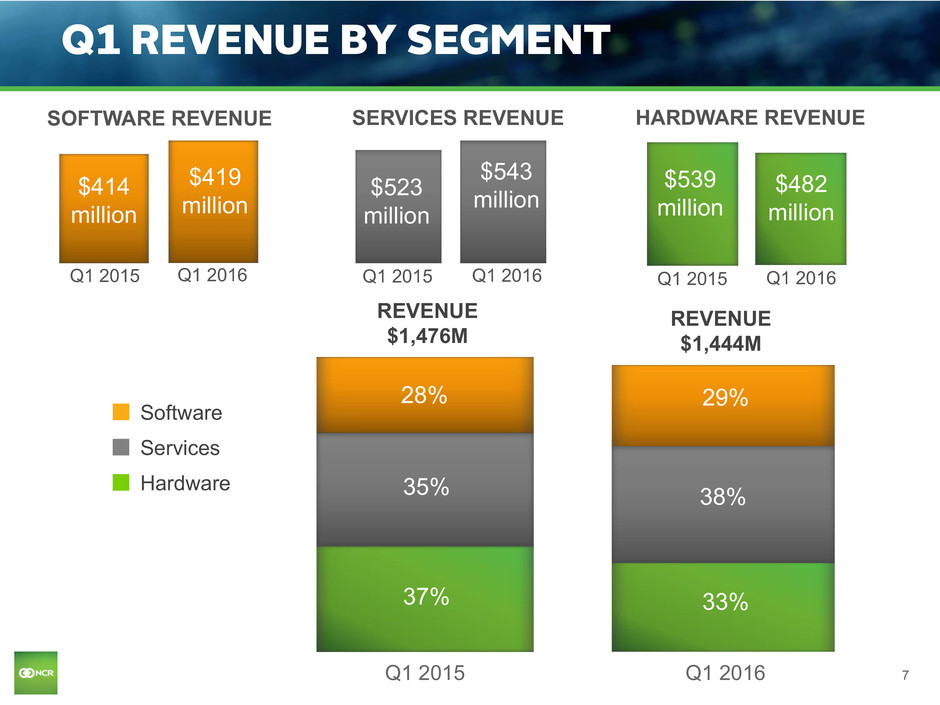
7 SOFTWARE REVENUE Q1 2015 Q1 2016 $414 million HARDWARE REVENUE Q1 2015 Q1 2016 $482 million Q1 2016 Q1 2015 SERVICES REVENUE Q1 2015 Q1 2016 n Software n Services n Hardware 29% 33% 38% 28% 35% 37% Q1 REVENUE BY SEGMENT REVENUE $1,476M REVENUE $1,444M $419 million $539 million $523 million $543 million
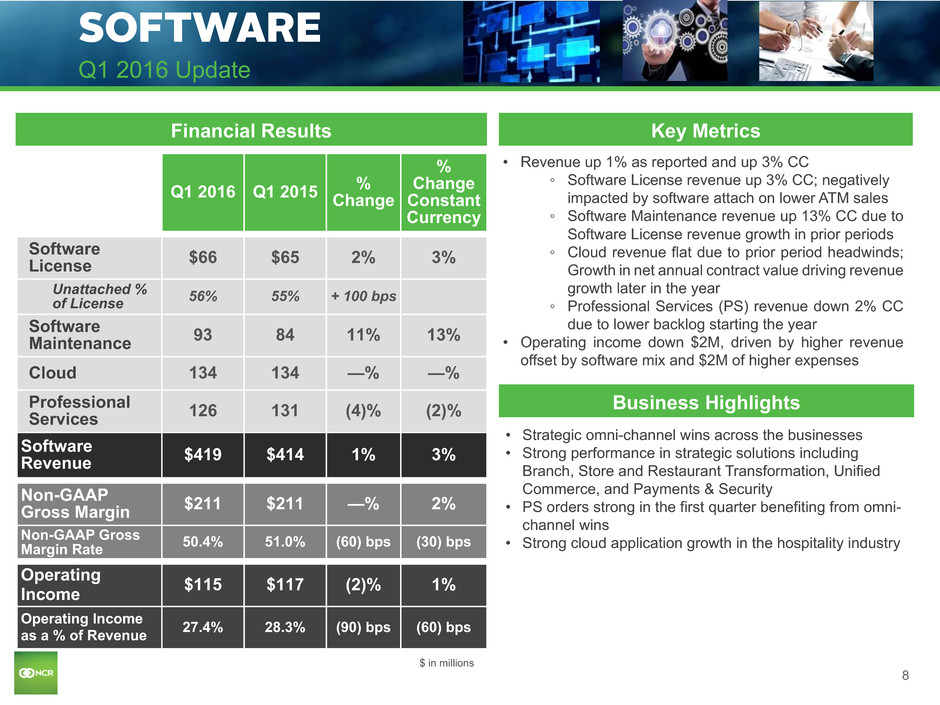
8 SOFTWARE Q1 2016 Update • Revenue up 1% as reported and up 3% CC ◦ Software License revenue up 3% CC; negatively impacted by software attach on lower ATM sales ◦ Software Maintenance revenue up 13% CC due to Software License revenue growth in prior periods ◦ Cloud revenue flat due to prior period headwinds; Growth in net annual contract value driving revenue growth later in the year ◦ Professional Services (PS) revenue down 2% CC due to lower backlog starting the year • Operating income down $2M, driven by higher revenue offset by software mix and $2M of higher expenses Key MetricsFinancial Results Q1 2016 Q1 2015 %Change % Change Constant Currency Software License $66 $65 2% 3% Unattached % of License 56% 55% + 100 bps Software Maintenance 93 84 11% 13% Cloud 134 134 —% —% Professional Services 126 131 (4)% (2)% Software Revenue $419 $414 1% 3% Non-GAAP Gross Margin $211 $211 —% 2% Non-GAAP Gross Margin Rate 50.4% 51.0% (60) bps (30) bps Operating Income $115 $117 (2)% 1% Operating Income as a % of Revenue 27.4% 28.3% (90) bps (60) bps Business Highlights • Strategic omni-channel wins across the businesses • Strong performance in strategic solutions including Branch, Store and Restaurant Transformation, Unified Commerce, and Payments & Security • PS orders strong in the first quarter benefiting from omni- channel wins • Strong cloud application growth in the hospitality industry $ in millions
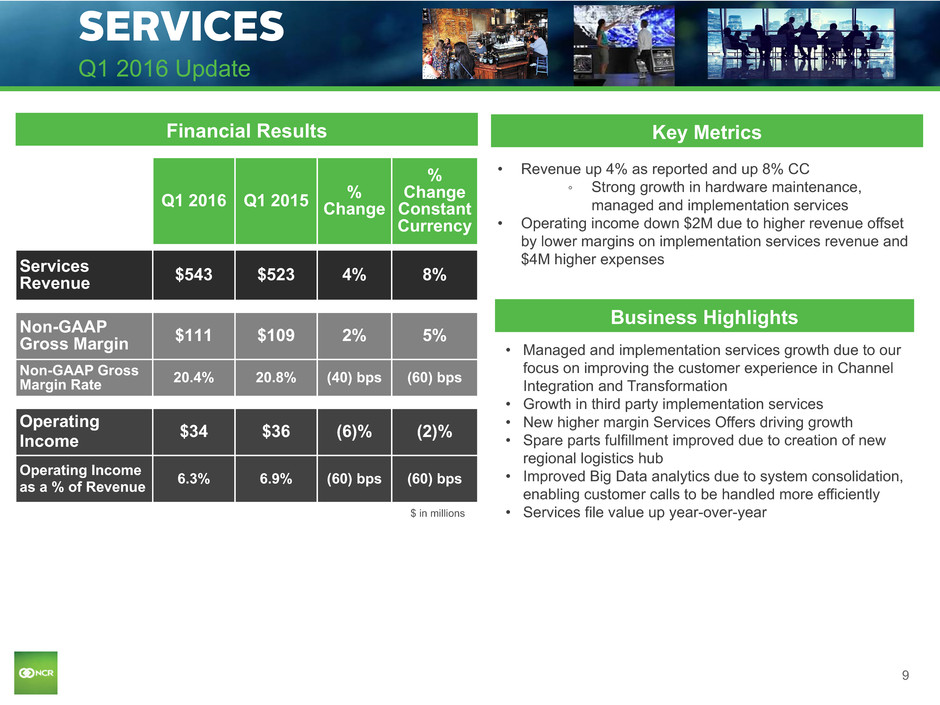
9 SERVICES Q1 2016 Update • Revenue up 4% as reported and up 8% CC ◦ Strong growth in hardware maintenance, managed and implementation services • Operating income down $2M due to higher revenue offset by lower margins on implementation services revenue and $4M higher expenses Key Metrics Q1 2016 Q1 2015 %Change % Change Constant Currency Services Revenue $543 $523 4% 8% Non-GAAP Gross Margin $111 $109 2% 5% Non-GAAP Gross Margin Rate 20.4% 20.8% (40) bps (60) bps Operating Income $34 $36 (6)% (2)% Operating Income as a % of Revenue 6.3% 6.9% (60) bps (60) bps Financial Results Business Highlights • Managed and implementation services growth due to our focus on improving the customer experience in Channel Integration and Transformation • Growth in third party implementation services • New higher margin Services Offers driving growth • Spare parts fulfillment improved due to creation of new regional logistics hub • Improved Big Data analytics due to system consolidation, enabling customer calls to be handled more efficiently • Services file value up year-over-year$ in millions
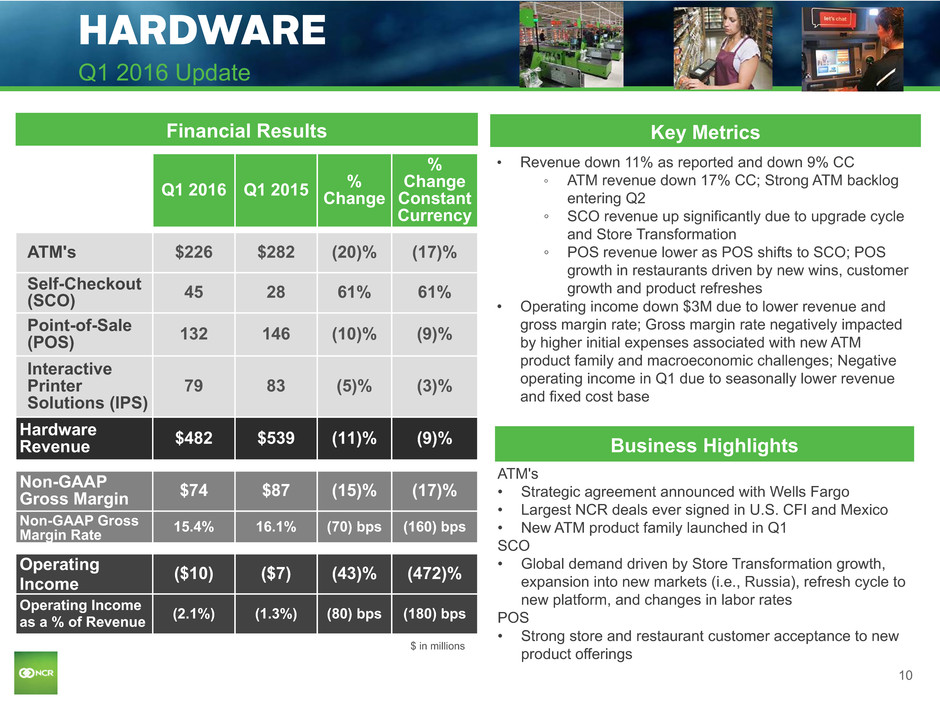
10 HARDWARE Q1 2016 Update • Revenue down 11% as reported and down 9% CC ◦ ATM revenue down 17% CC; Strong ATM backlog entering Q2 ◦ SCO revenue up significantly due to upgrade cycle and Store Transformation ◦ POS revenue lower as POS shifts to SCO; POS growth in restaurants driven by new wins, customer growth and product refreshes • Operating income down $3M due to lower revenue and gross margin rate; Gross margin rate negatively impacted by higher initial expenses associated with new ATM product family and macroeconomic challenges; Negative operating income in Q1 due to seasonally lower revenue and fixed cost base Key Metrics Q1 2016 Q1 2015 %Change % Change Constant Currency ATM's $226 $282 (20)% (17)% Self-Checkout (SCO) 45 28 61% 61% Point-of-Sale (POS) 132 146 (10)% (9)% Interactive Printer Solutions (IPS) 79 83 (5)% (3)% Hardware Revenue $482 $539 (11)% (9)% Non-GAAP Gross Margin $74 $87 (15)% (17)% Non-GAAP Gross Margin Rate 15.4% 16.1% (70) bps (160) bps Operating Income ($10) ($7) (43)% (472)% Operating Income as a % of Revenue (2.1%) (1.3%) (80) bps (180) bps Financial Results ATM's • Strategic agreement announced with Wells Fargo • Largest NCR deals ever signed in U.S. CFI and Mexico • New ATM product family launched in Q1 SCO • Global demand driven by Store Transformation growth, expansion into new markets (i.e., Russia), refresh cycle to new platform, and changes in labor rates POS • Strong store and restaurant customer acceptance to new product offerings Business Highlights $ in millions
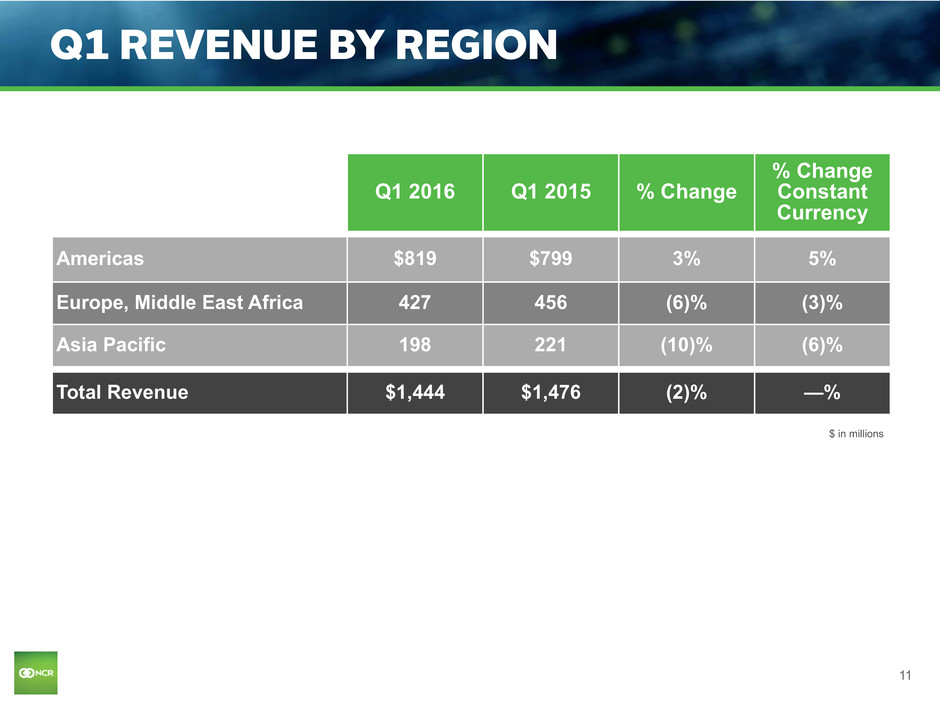
11 Q1 REVENUE BY REGION Q1 2016 Q1 2015 % Change % Change Constant Currency Americas $819 $799 3% 5% Europe, Middle East Africa 427 456 (6)% (3)% Asia Pacific 198 221 (10)% (6)% Total Revenue $1,444 $1,476 (2)% —% $ in millions
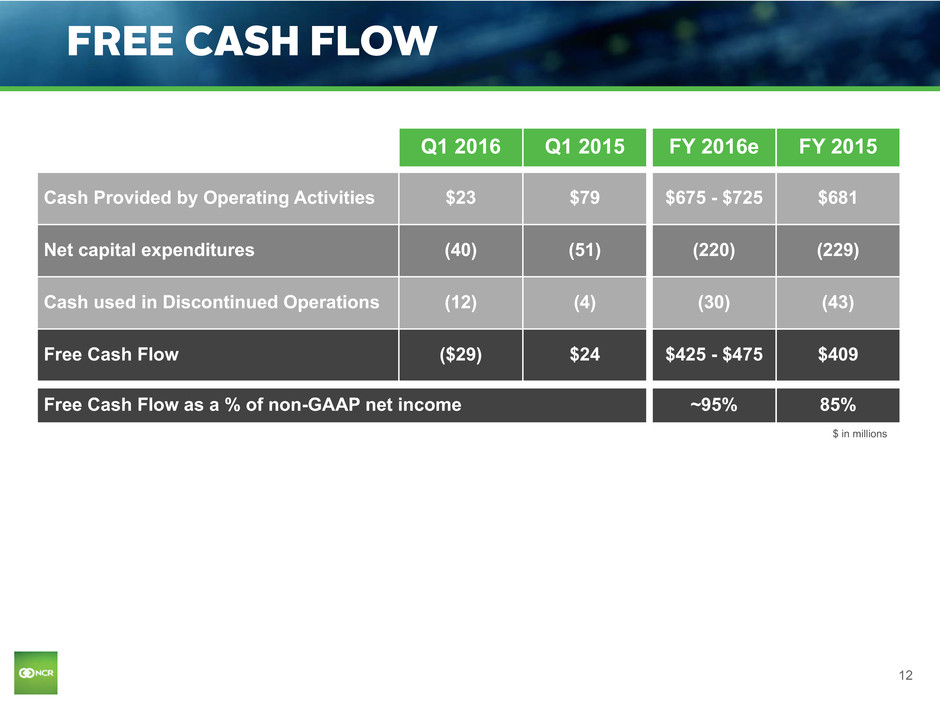
12 FREE CASH FLOW Q1 2016 Q1 2015 FY 2016e FY 2015 Cash Provided by Operating Activities $23 $79 $675 - $725 $681 Net capital expenditures (40) (51) (220) (229) Cash used in Discontinued Operations (12) (4) (30) (43) Free Cash Flow ($29) $24 $425 - $475 $409 Free Cash Flow as a % of non-GAAP net income ~95% 85% $ in millions
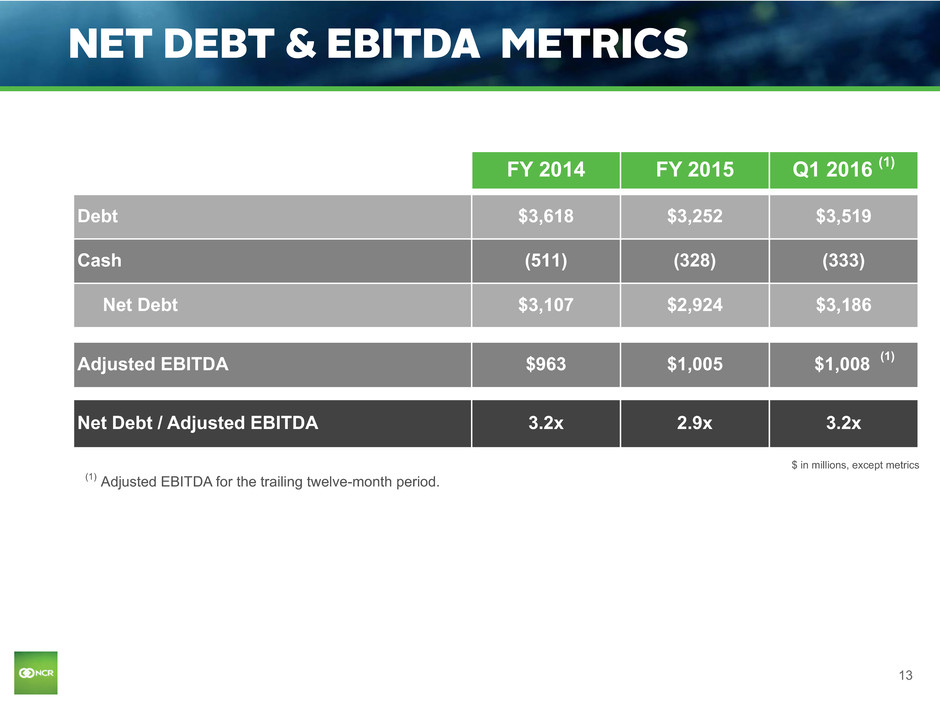
13 NET DEBT & EBITDA METRICS FY 2014 FY 2015 Q1 2016 (1) Debt $3,618 $3,252 $3,519 Cash (511) (328) (333) Net Debt $3,107 $2,924 $3,186 Adjusted EBITDA $963 $1,005 $1,008 (1) Net Debt / Adjusted EBITDA 3.2x 2.9x 3.2x $ in millions, except metrics (1) Adjusted EBITDA for the trailing twelve-month period.

14 Q2 2016 GUIDANCE Q2 2016e Q2 2015 Revenue (1) $1,560 - $1,580 $1,604 Diluted EPS (GAAP) $0.42 - $0.47 ($2.03) Diluted EPS (non-GAAP) (2) (3) $0.60 - $0.65 $0.66 $ millions, except per share amounts (1) Assuming the sale of Interactive Printer Solutions at end of May 2016, revenue growth is expected to be approximately flat as reported and up 2% constant currency. (2) For Q2 2016, we expect $0.02 of negative EPS impact from unfavorable foreign currency headwinds and higher pension expense. (3) For Q2 2016, we have assumed OIE of $50 million, an effective tax rate of 28% and a share count of 154 million compared to OIE of $45 million, an effective tax rate of 27% and a share count of 172 million in Q2 2015.
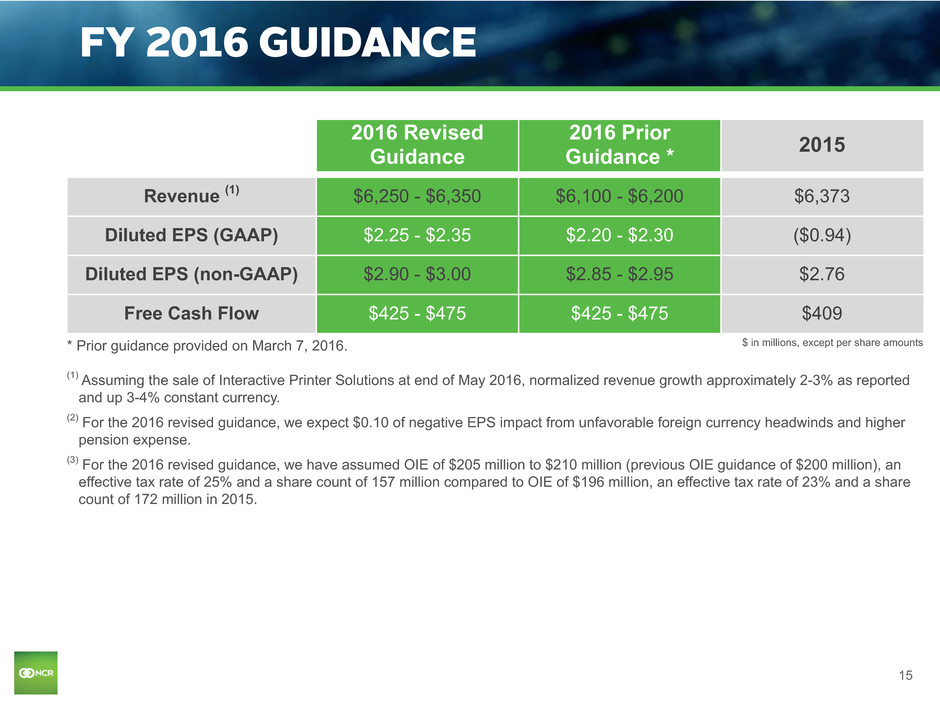
15 2016 Revised Guidance 2016 Prior Guidance * 2015 Revenue (1) $6,250 - $6,350 $6,100 - $6,200 $6,373 Diluted EPS (GAAP) $2.25 - $2.35 $2.20 - $2.30 ($0.94) Diluted EPS (non-GAAP) $2.90 - $3.00 $2.85 - $2.95 $2.76 Free Cash Flow $425 - $475 $425 - $475 $409 FY 2016 GUIDANCE $ in millions, except per share amounts* Prior guidance provided on March 7, 2016. (1) Assuming the sale of Interactive Printer Solutions at end of May 2016, normalized revenue growth approximately 2-3% as reported and up 3-4% constant currency. (2) For the 2016 revised guidance, we expect $0.10 of negative EPS impact from unfavorable foreign currency headwinds and higher pension expense. (3) For the 2016 revised guidance, we have assumed OIE of $205 million to $210 million (previous OIE guidance of $200 million), an effective tax rate of 25% and a share count of 157 million compared to OIE of $196 million, an effective tax rate of 23% and a share count of 172 million in 2015.
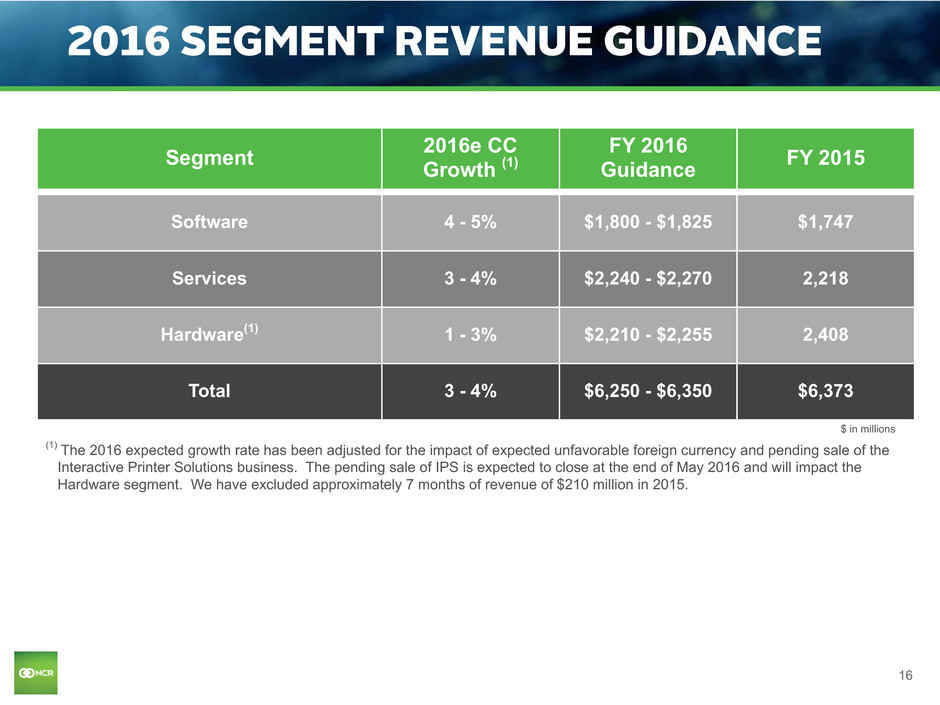
16 2016 SEGMENT REVENUE GUIDANCE Segment 2016e CCGrowth (1) FY 2016 Guidance FY 2015 Software 4 - 5% $1,800 - $1,825 $1,747 Services 3 - 4% $2,240 - $2,270 2,218 Hardware(1) 1 - 3% $2,210 - $2,255 2,408 Total 3 - 4% $6,250 - $6,350 $6,373 $ in millions (1) The 2016 expected growth rate has been adjusted for the impact of expected unfavorable foreign currency and pending sale of the Interactive Printer Solutions business. The pending sale of IPS is expected to close at the end of May 2016 and will impact the Hardware segment. We have excluded approximately 7 months of revenue of $210 million in 2015.
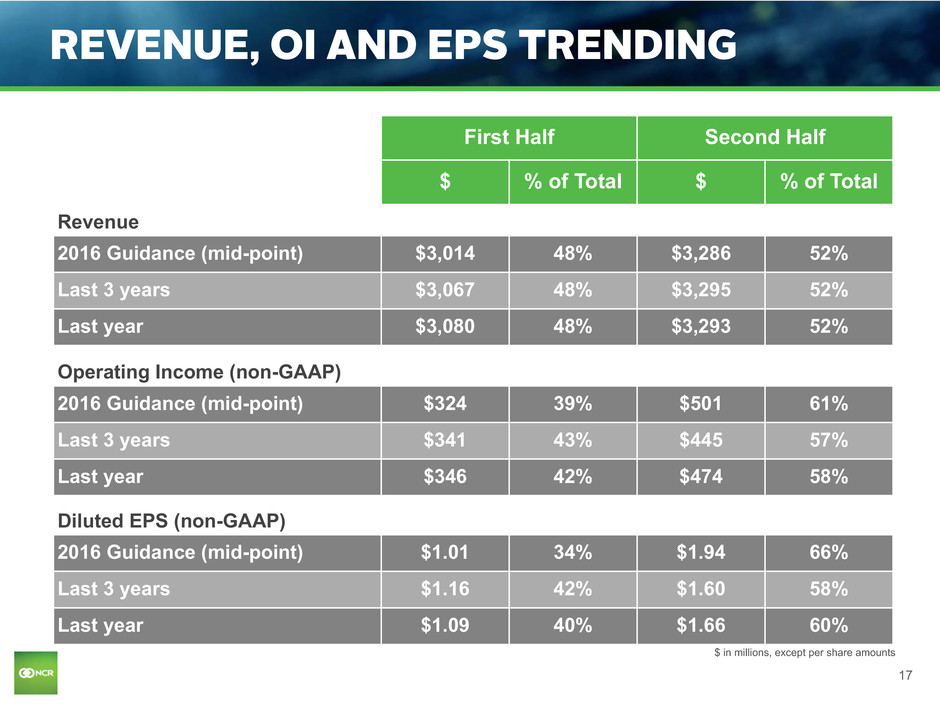
17 REVENUE, OI AND EPS TRENDING First Half Second Half $ % of Total $ % of Total Revenue 2016 Guidance (mid-point) $3,014 48% $3,286 52% Last 3 years $3,067 48% $3,295 52% Last year $3,080 48% $3,293 52% Operating Income (non-GAAP) 2016 Guidance (mid-point) $324 39% $501 61% Last 3 years $341 43% $445 57% Last year $346 42% $474 58% Diluted EPS (non-GAAP) 2016 Guidance (mid-point) $1.01 34% $1.94 66% Last 3 years $1.16 42% $1.60 58% Last year $1.09 40% $1.66 60% $ in millions, except per share amounts
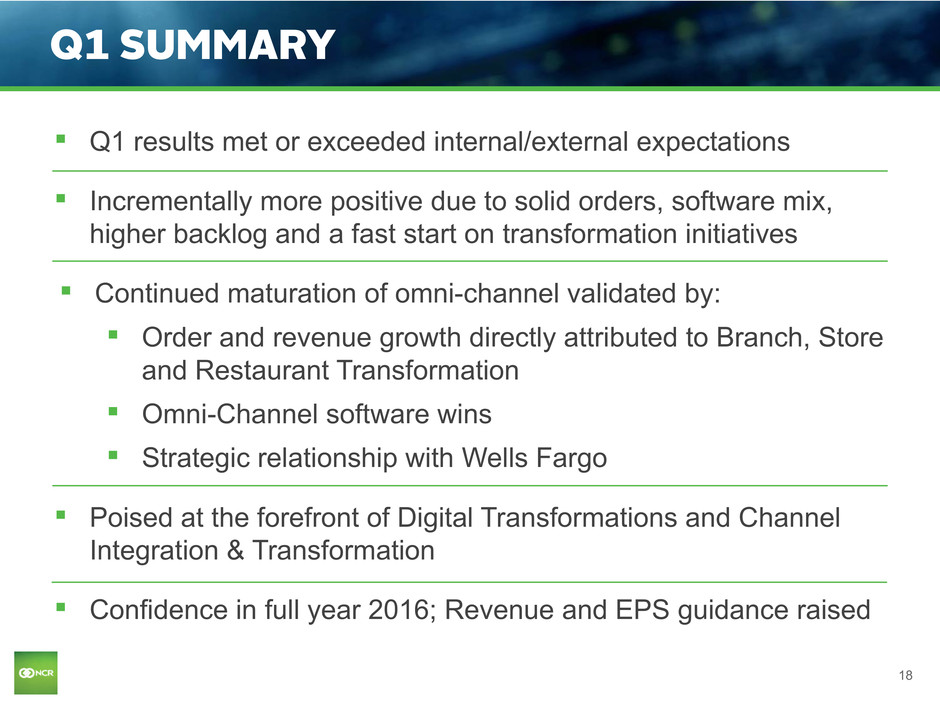
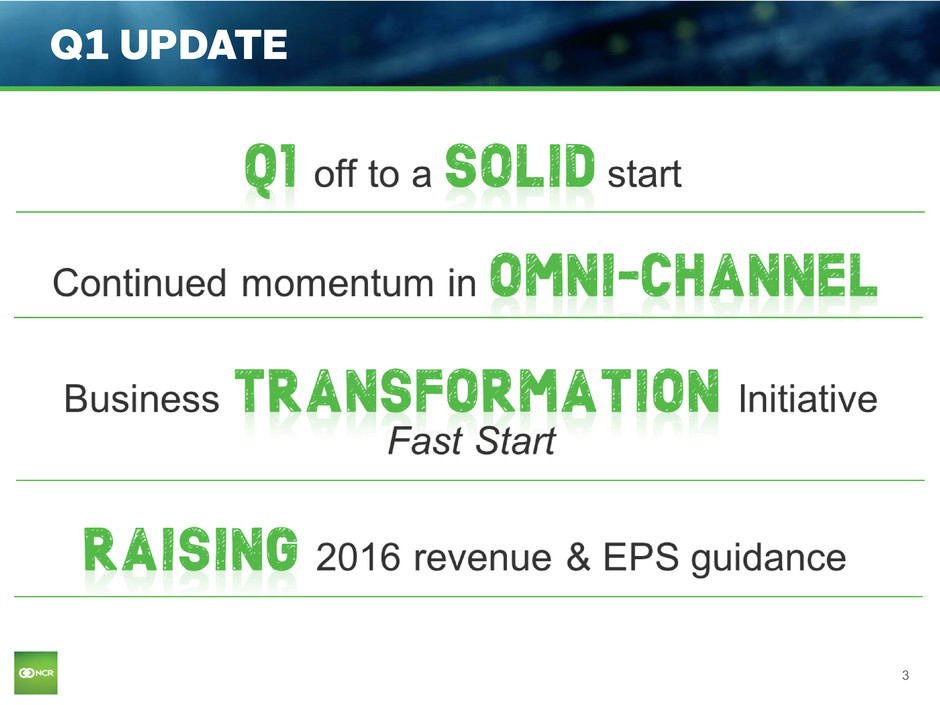
18 ▪ Q1 results met or exceeded internal/external expectations ▪ Incrementally more positive due to solid orders, software mix, higher backlog and a fast start on transformation initiatives ▪ Continued maturation of omni-channel validated by: ▪ Order and revenue growth directly attributed to Branch, Store and Restaurant Transformation ▪ Omni-Channel software wins ▪ Strategic relationship with Wells Fargo ▪ Poised at the forefront of Digital Transformations and Channel Integration & Transformation ▪ Confidence in full year 2016; Revenue and EPS guidance raised Q1 SUMMARY

SUPPLEMENTARY NON-GAAP MATERIALS
20 NON-GAAP MEASURES While NCR reports its results in accordance with generally accepted accounting principles (GAAP) in the United States, comments made during this conference call and in these materials will include non-GAAP measures. These measures are included to provide additional useful information regarding NCR's financial results, and are not a substitute for their comparable GAAP measures. Operating Income (non-GAAP), Diluted EPS (non-GAAP), Gross Margin (non-GAAP), Gross Margin Rate (non-GAAP), Operating Expenses (non-GAAP), Income Tax Expense (non-GAAP) and Net Income (non-GAAP). NCR’s operating income (non-GAAP), diluted earnings per share (non-GAAP), gross margin (non-GAAP), gross margin rate (non-GAAP), operating expenses (non-GAAP), income tax expense (non-GAAP) and net income (non-GAAP) are determined by excluding pension mark-to-market adjustments, pension settlements, pension curtailments and pension special termination benefits and other special items, including amortization of acquisition related intangibles, from NCR's GAAP income (loss) from operations, GAAP gross margin, gross margin rate, expenses and effective tax rate. Due to the non-operational nature of these other special items, NCR's management uses these non-GAAP measures to evaluate year-over- year operating performance. NCR uses operating income (non-GAAP) and non-GAAP diluted EPS, to manage and determine the effectiveness of its business managers and as a basis for incentive compensation. NCR believes these measures are useful for investors because they provide a more complete understanding of NCR's underlying operational performance, as well as consistency and comparability with NCR's past reports of financial results. Free Cash Flow. NCR defines free cash flow as net cash provided by/used in operating activities and cash flow provided by/used in discontinued operations less capital expenditures for property, plant and equipment, additions to capitalized software, discretionary pension contributions and settlements. NCR's management uses free cash flow to assess the financial performance of the Company and believes it is useful for investors because it relates the operating cash flow of the Company to the capital that is spent to continue and improve business operations. In particular, free cash flow indicates the amount of cash generated after capital expenditures which can be used for, among other things, investment in the Company's existing businesses, strategic acquisitions, strengthening the Company's balance sheet, repurchase of Company stock and repayment of the Company's debt obligations. Free cash flow does not represent the residual cash flow available for discretionary expenditures since there may be other nondiscretionary expenditures that are not deducted from the measure. Free cash flow (FCF) does not have a uniform definition under GAAP and, therefore, NCR's definition may differ from other companies' definition of this measure.
21 NON-GAAP MEASURES Adjusted EBITDA. NCR believes that Adjusted EBITDA (adjusted earnings before interest, taxes, depreciation and amortization) provides useful information to investors because it is an indicator of the strength and performance of the Company's ongoing business operations, including its ability to fund discretionary spending such as capital expenditures, strategic acquisitions and other investments. NCR determines Adjusted EBITDA for a given period based on its GAAP income (loss) from continuing operations plus interest expense, net; plus income tax expense (benefit); plus depreciation and amortization; plus other income (expense); plus pension expense (benefit); and plus special items included in the definition of NPOI. NCR believes that its ratio of net debt to Adjusted EBITDA provides useful information to investors because it is an indicator of the company's ability to meet its future financial obligations. Constant Currency. NCR presents certain measures, such as period-over-period revenue growth, on a constant currency basis, which excludes the effects of foreign currency translation. Due to the continuing strengthening of the U.S. dollar against foreign currencies and the overall variability of foreign exchange rates from period to period, NCR's management uses these measures on a constant currency basis to evaluate period-over-period operating performance. Measures presented on a constant currency basis are calculated by translating prior period results at current period monthly average exchange rates. NCR management's definitions and calculations of these non-GAAP measures may differ from similarly-titled measures reported by other companies and cannot, therefore, be compared with similarly-titled measures of other companies. These non-GAAP measures should not be considered as substitutes for, or superior to, results determined in accordance with GAAP. These non-GAAP measures are reconciled to their corresponding GAAP measures in the following slides and elsewhere in these materials. These reconciliations and other information regarding these non-GAAP measures are also available on the Investor Relations page of NCR's website at www.ncr.com.
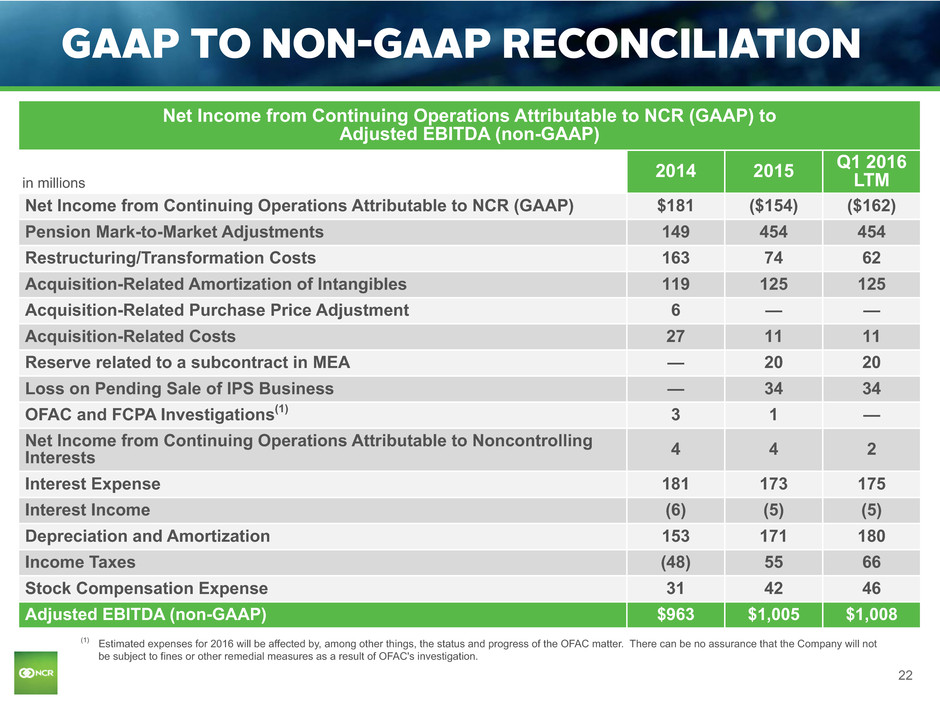
22 Net Income from Continuing Operations Attributable to NCR (GAAP) to Adjusted EBITDA (non-GAAP) in millions 2014 2015 Q1 2016LTM Net Income from Continuing Operations Attributable to NCR (GAAP) $181 ($154) ($162) Pension Mark-to-Market Adjustments 149 454 454 Restructuring/Transformation Costs 163 74 62 Acquisition-Related Amortization of Intangibles 119 125 125 Acquisition-Related Purchase Price Adjustment 6 — — Acquisition-Related Costs 27 11 11 Reserve related to a subcontract in MEA — 20 20 Loss on Pending Sale of IPS Business — 34 34 OFAC and FCPA Investigations(1) 3 1 — Net Income from Continuing Operations Attributable to Noncontrolling Interests 4 4 2 Interest Expense 181 173 175 Interest Income (6) (5) (5) Depreciation and Amortization 153 171 180 Income Taxes (48) 55 66 Stock Compensation Expense 31 42 46 Adjusted EBITDA (non-GAAP) $963 $1,005 $1,008 (1) Estimated expenses for 2016 will be affected by, among other things, the status and progress of the OFAC matter. There can be no assurance that the Company will not be subject to fines or other remedial measures as a result of OFAC's investigation. GAAP TO NON-GAAP RECONCILIATION
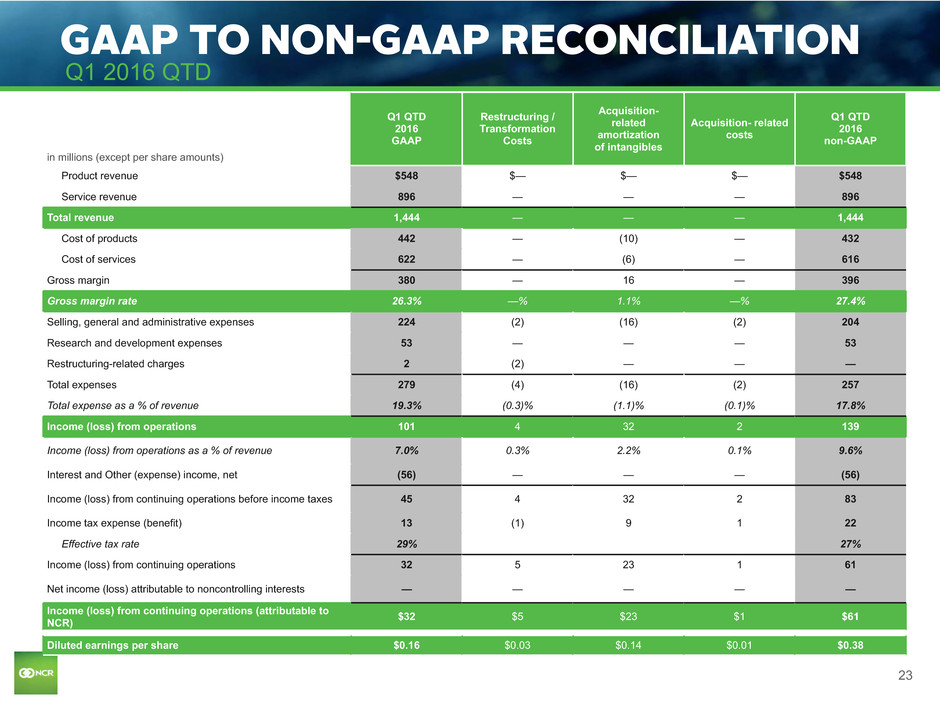
23 in millions (except per share amounts) Q1 QTD 2016 GAAP Restructuring / Transformation Costs Acquisition- related amortization of intangibles Acquisition- related costs Q1 QTD 2016 non-GAAP Product revenue $548 $— $— $— $548 Service revenue 896 — — — 896 Total revenue 1,444 — — — 1,444 Cost of products 442 — (10) — 432 Cost of services 622 — (6) — 616 Gross margin 380 — 16 — 396 Gross margin rate 26.3% —% 1.1% —% 27.4% Selling, general and administrative expenses 224 (2) (16) (2) 204 Research and development expenses 53 — — — 53 Restructuring-related charges 2 (2) — — — Total expenses 279 (4) (16) (2) 257 Total expense as a % of revenue 19.3% (0.3)% (1.1)% (0.1)% 17.8% Income (loss) from operations 101 4 32 2 139 Income (loss) from operations as a % of revenue 7.0% 0.3% 2.2% 0.1% 9.6% Interest and Other (expense) income, net (56) — — — (56) Income (loss) from continuing operations before income taxes 45 4 32 2 83 Income tax expense (benefit) 13 (1) 9 1 22 Effective tax rate 29% 27% Income (loss) from continuing operations 32 5 23 1 61 Net income (loss) attributable to noncontrolling interests — — — — — Income (loss) from continuing operations (attributable to NCR) $32 $5 $23 $1 $61 Diluted earnings per share $0.16 $0.03 $0.14 $0.01 $0.38 GAAP TO NON-GAAP RECONCILIATION Q1 2016 QTD

24 in millions (except per share amounts) Q1 QTD 2016 GAAP Q1 QTD 2016 non-GAAP Income (loss) from continuing operations attributable to NCR common stockholders: Income (loss) from continuing operations (attributable to NCR) $32 $61 Dividends on convertible preferred shares (11) — Income (loss) from continuing operations attributable to NCR common stockholders $21 $61 Weighted average outstanding shares: Weighted average diluted shares outstanding 132.7 132.7 Weighted as-if converted preferred shares — 27.7 Total shares used in diluted earnings per share 132.7 160.4 Diluted earnings per share (1) $0.16 $0.38 GAAP TO NON-GAAP RECONCILIATION Q1 2016 QTD (1) GAAP and non-GAAP diluted EPS are determined using the most dilutive measure, either including the impact of the dividends on NCR's Series A Convertible Preferred Shares in the calculation of net income or loss available to common stockholders or including the impact of the conversion of such preferred stock into common stock in the calculation of the weighted average diluted shares outstanding. Therefore, GAAP diluted EPS and non-GAAP diluted EPS may be calculated using different methods, and may not mathematically reconcile.
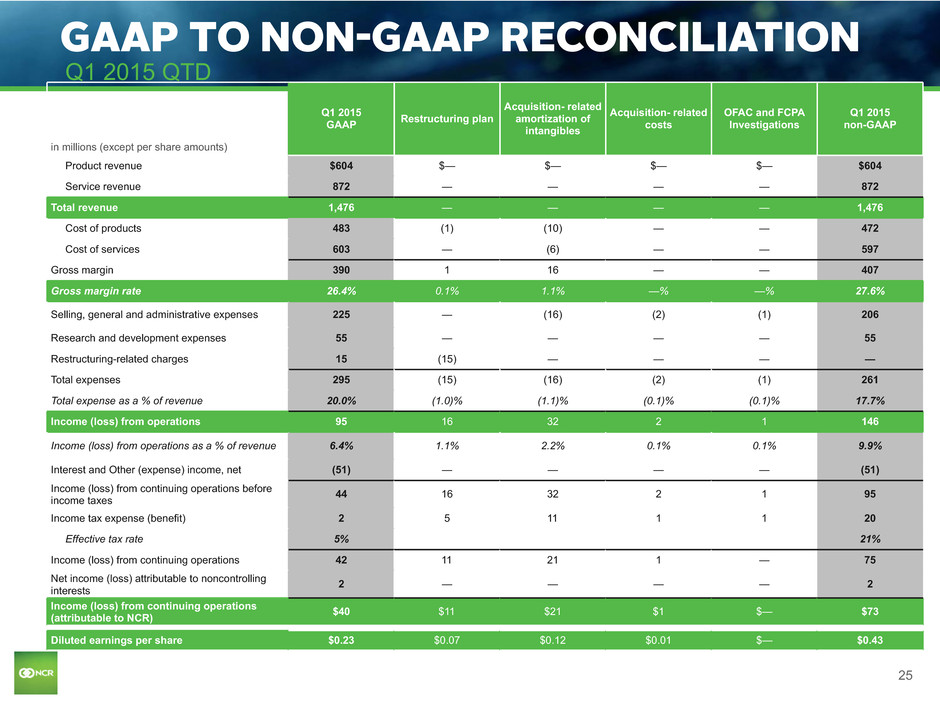
25 in millions (except per share amounts) Q1 2015 GAAP Restructuring plan Acquisition- related amortization of intangibles Acquisition- related costs OFAC and FCPA Investigations Q1 2015 non-GAAP Product revenue $604 $— $— $— $— $604 Service revenue 872 — — — — 872 Total revenue 1,476 — — — — 1,476 Cost of products 483 (1) (10) — — 472 Cost of services 603 — (6) — — 597 Gross margin 390 1 16 — — 407 Gross margin rate 26.4% 0.1% 1.1% —% —% 27.6% Selling, general and administrative expenses 225 — (16) (2) (1) 206 Research and development expenses 55 — — — — 55 Restructuring-related charges 15 (15) — — — — Total expenses 295 (15) (16) (2) (1) 261 Total expense as a % of revenue 20.0% (1.0)% (1.1)% (0.1)% (0.1)% 17.7% Income (loss) from operations 95 16 32 2 1 146 Income (loss) from operations as a % of revenue 6.4% 1.1% 2.2% 0.1% 0.1% 9.9% Interest and Other (expense) income, net (51) — — — — (51) Income (loss) from continuing operations before income taxes 44 16 32 2 1 95 Income tax expense (benefit) 2 5 11 1 1 20 Effective tax rate 5% 21% Income (loss) from continuing operations 42 11 21 1 — 75 Net income (loss) attributable to noncontrolling interests 2 — — — — 2 Income (loss) from continuing operations (attributable to NCR) $40 $11 $21 $1 $— $73 Diluted earnings per share $0.23 $0.07 $0.12 $0.01 $— $0.43 GAAP TO NON-GAAP RECONCILIATION Q1 2015 QTD
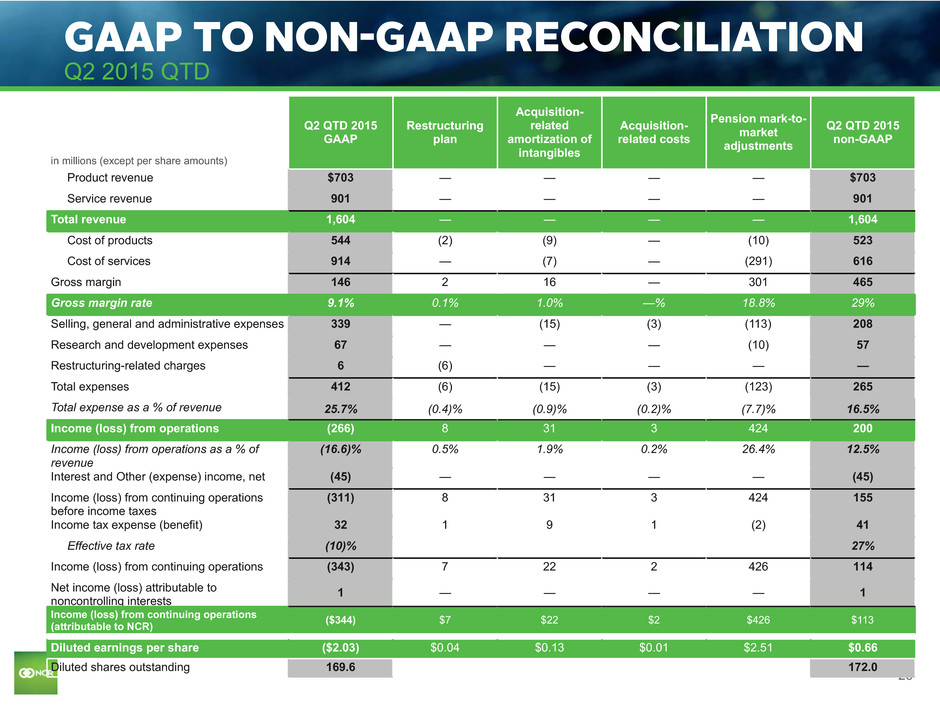
26 in millions (except per share amounts) Q2 QTD 2015 GAAP Restructuring plan Acquisition- related amortization of intangibles Acquisition- related costs Pension mark-to- market adjustments Q2 QTD 2015 non-GAAP Product revenue $703 — — — — $703 Service revenue 901 — — — — 901 Total revenue 1,604 — — — — 1,604 Cost of products 544 (2) (9) — (10) 523 Cost of services 914 — (7) — (291) 616 Gross margin 146 2 16 — 301 465 Gross margin rate 9.1% 0.1% 1.0% —% 18.8% 29% Selling, general and administrative expenses 339 — (15) (3) (113) 208 Research and development expenses 67 — — — (10) 57 Restructuring-related charges 6 (6) — — — — Total expenses 412 (6) (15) (3) (123) 265 Total expense as a % of revenue 25.7% (0.4)% (0.9)% (0.2)% (7.7)% 16.5% Income (loss) from operations (266) 8 31 3 424 200 Income (loss) from operations as a % of revenue (16.6)% 0.5% 1.9% 0.2% 26.4% 12.5% Interest and Other (expense) income, net (45) — — — — (45) Income (loss) from continuing operations before income taxes (311) 8 31 3 424 155 Income tax expense (benefit) 32 1 9 1 (2) 41 Effective tax rate (10)% 27% Income (loss) from continuing operations (343) 7 22 2 426 114 Net income (loss) attributable to noncontrolling interests 1 — — — — 1 Income (loss) from continuing operations (attributable to NCR) ($344) $7 $22 $2 $426 $113 Diluted earnings per share ($2.03) $0.04 $0.13 $0.01 $2.51 $0.66 Diluted shares outstanding 169.6 172.0 GAAP TO NON-GAAP RECONCILIATION Q2 2015 QTD
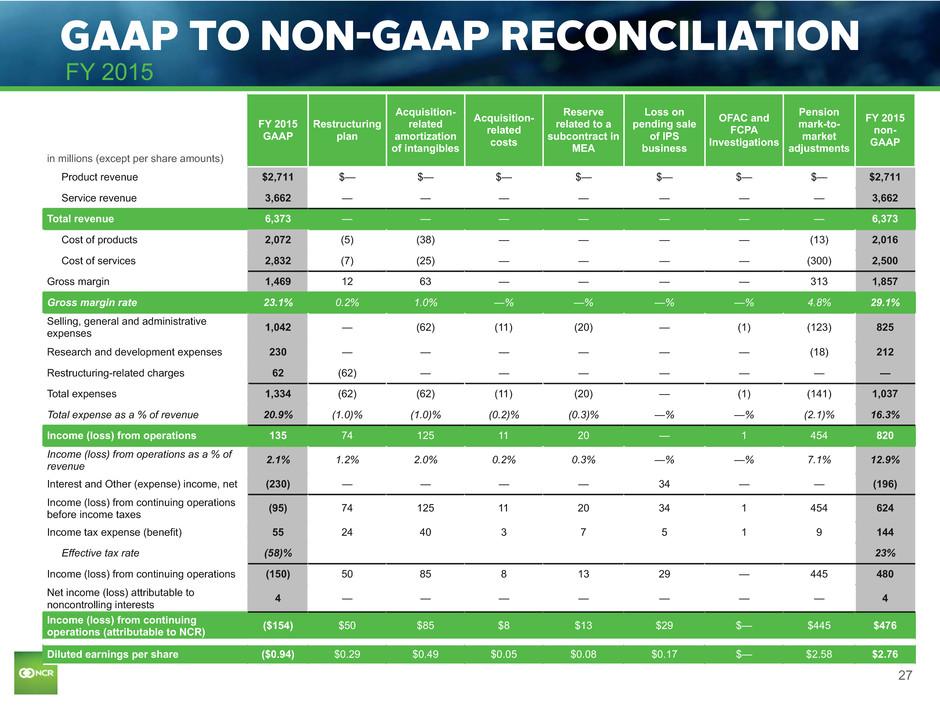
27 in millions (except per share amounts) FY 2015 GAAP Restructuring plan Acquisition- related amortization of intangibles Acquisition- related costs Reserve related to a subcontract in MEA Loss on pending sale of IPS business OFAC and FCPA Investigations Pension mark-to- market adjustments FY 2015 non- GAAP Product revenue $2,711 $— $— $— $— $— $— $— $2,711 Service revenue 3,662 — — — — — — — 3,662 Total revenue 6,373 — — — — — — — 6,373 Cost of products 2,072 (5) (38) — — — — (13) 2,016 Cost of services 2,832 (7) (25) — — — — (300) 2,500 Gross margin 1,469 12 63 — — — — 313 1,857 Gross margin rate 23.1% 0.2% 1.0% —% —% —% —% 4.8% 29.1% Selling, general and administrative expenses 1,042 — (62) (11) (20) — (1) (123) 825 Research and development expenses 230 — — — — — — (18) 212 Restructuring-related charges 62 (62) — — — — — — — Total expenses 1,334 (62) (62) (11) (20) — (1) (141) 1,037 Total expense as a % of revenue 20.9% (1.0)% (1.0)% (0.2)% (0.3)% —% —% (2.1)% 16.3% Income (loss) from operations 135 74 125 11 20 — 1 454 820 Income (loss) from operations as a % of revenue 2.1% 1.2% 2.0% 0.2% 0.3% —% —% 7.1% 12.9% Interest and Other (expense) income, net (230) — — — — 34 — — (196) Income (loss) from continuing operations before income taxes (95) 74 125 11 20 34 1 454 624 Income tax expense (benefit) 55 24 40 3 7 5 1 9 144 Effective tax rate (58)% 23% Income (loss) from continuing operations (150) 50 85 8 13 29 — 445 480 Net income (loss) attributable to noncontrolling interests 4 — — — — — — — 4 Income (loss) from continuing operations (attributable to NCR) ($154) $50 $85 $8 $13 $29 $— $445 $476 Diluted earnings per share ($0.94) $0.29 $0.49 $0.05 $0.08 $0.17 $— $2.58 $2.76 GAAP TO NON-GAAP RECONCILIATION FY 2015
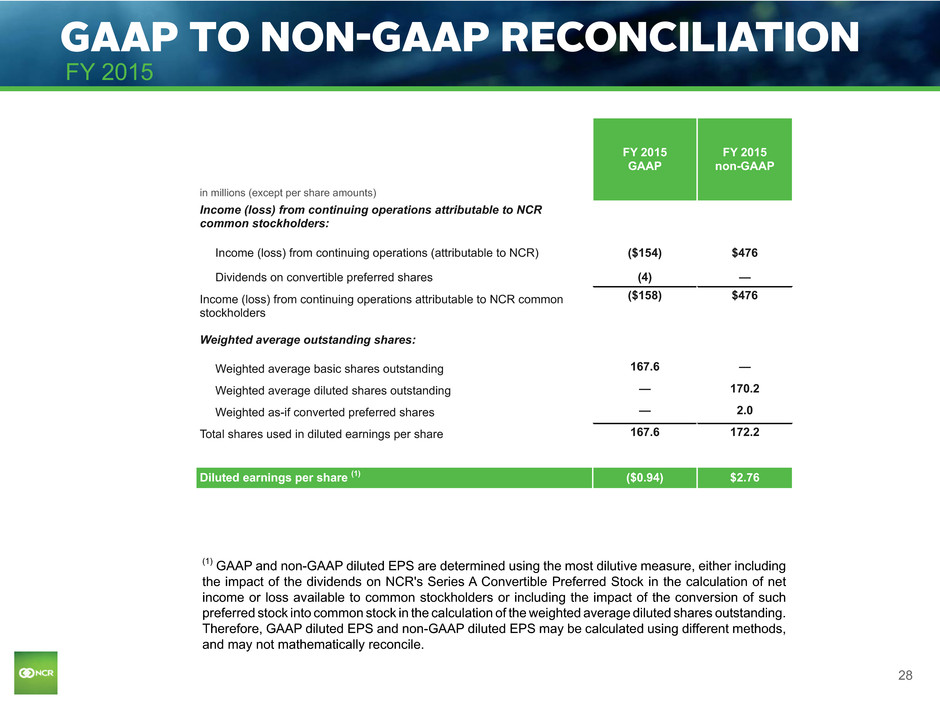
28 in millions (except per share amounts) FY 2015 GAAP FY 2015 non-GAAP Income (loss) from continuing operations attributable to NCR common stockholders: Income (loss) from continuing operations (attributable to NCR) ($154) $476 Dividends on convertible preferred shares (4) — Income (loss) from continuing operations attributable to NCR common stockholders ($158) $476 Weighted average outstanding shares: Weighted average basic shares outstanding 167.6 — Weighted average diluted shares outstanding — 170.2 Weighted as-if converted preferred shares — 2.0 Total shares used in diluted earnings per share 167.6 172.2 Diluted earnings per share (1) ($0.94) $2.76 GAAP TO NON-GAAP RECONCILIATION FY 2015 (1) GAAP and non-GAAP diluted EPS are determined using the most dilutive measure, either including the impact of the dividends on NCR's Series A Convertible Preferred Stock in the calculation of net income or loss available to common stockholders or including the impact of the conversion of such preferred stock into common stock in the calculation of the weighted average diluted shares outstanding. Therefore, GAAP diluted EPS and non-GAAP diluted EPS may be calculated using different methods, and may not mathematically reconcile.
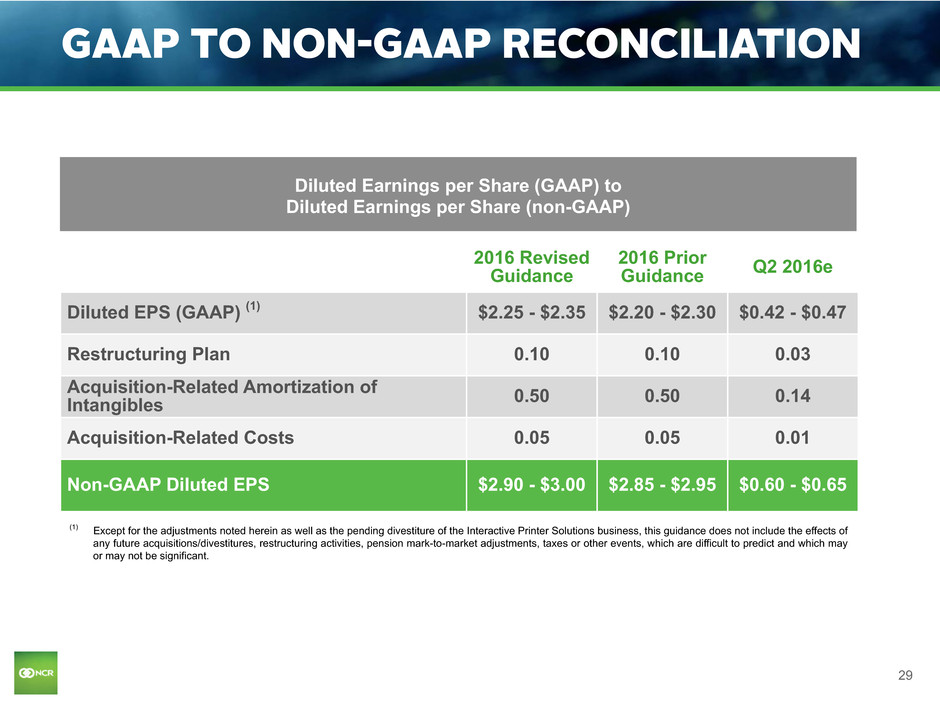
29 GAAP TO NON-GAAP RECONCILIATION 2016 Revised Guidance 2016 Prior Guidance Q2 2016e Diluted EPS (GAAP) (1) $2.25 - $2.35 $2.20 - $2.30 $0.42 - $0.47 Restructuring Plan 0.10 0.10 0.03 Acquisition-Related Amortization of Intangibles 0.50 0.50 0.14 Acquisition-Related Costs 0.05 0.05 0.01 Non-GAAP Diluted EPS $2.90 - $3.00 $2.85 - $2.95 $0.60 - $0.65 Diluted Earnings per Share (GAAP) to Diluted Earnings per Share (non-GAAP) (1) Except for the adjustments noted herein as well as the pending divestiture of the Interactive Printer Solutions business, this guidance does not include the effects of any future acquisitions/divestitures, restructuring activities, pension mark-to-market adjustments, taxes or other events, which are difficult to predict and which may or may not be significant.
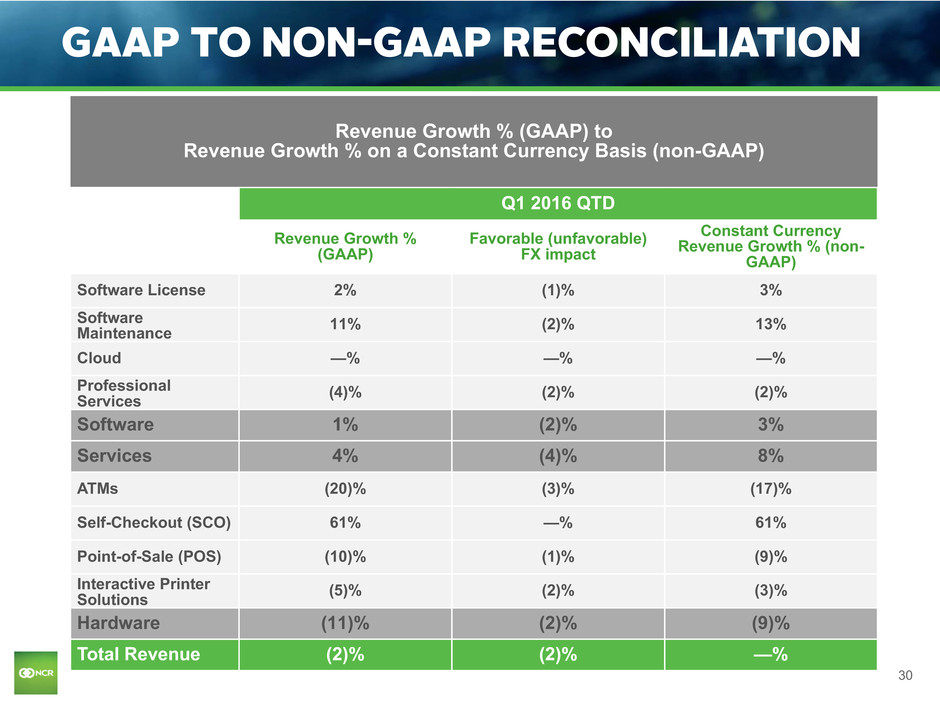
30 GAAP TO NON-GAAP RECONCILIATION Revenue Growth % (GAAP) to Revenue Growth % on a Constant Currency Basis (non-GAAP) Q1 2016 QTD Revenue Growth % (GAAP) Favorable (unfavorable) FX impact Constant Currency Revenue Growth % (non- GAAP) Software License 2% (1)% 3% Software Maintenance 11% (2)% 13% Cloud —% —% —% Professional Services (4)% (2)% (2)% Software 1% (2)% 3% Services 4% (4)% 8% ATMs (20)% (3)% (17)% Self-Checkout (SCO) 61% —% 61% Point-of-Sale (POS) (10)% (1)% (9)% Interactive Printer Solutions (5)% (2)% (3)% Hardware (11)% (2)% (9)% Total Revenue (2)% (2)% —%
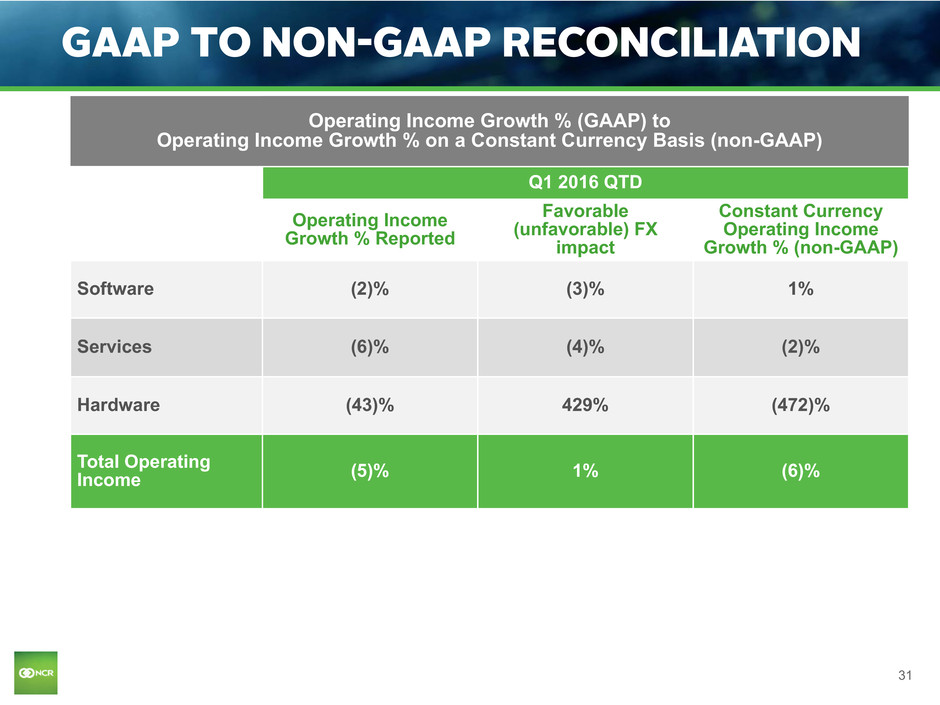
31 GAAP TO NON-GAAP RECONCILIATION Operating Income Growth % (GAAP) to Operating Income Growth % on a Constant Currency Basis (non-GAAP) Q1 2016 QTD Operating Income Growth % Reported Favorable (unfavorable) FX impact Constant Currency Operating Income Growth % (non-GAAP) Software (2)% (3)% 1% Services (6)% (4)% (2)% Hardware (43)% 429% (472)% Total Operating Income (5)% 1% (6)%
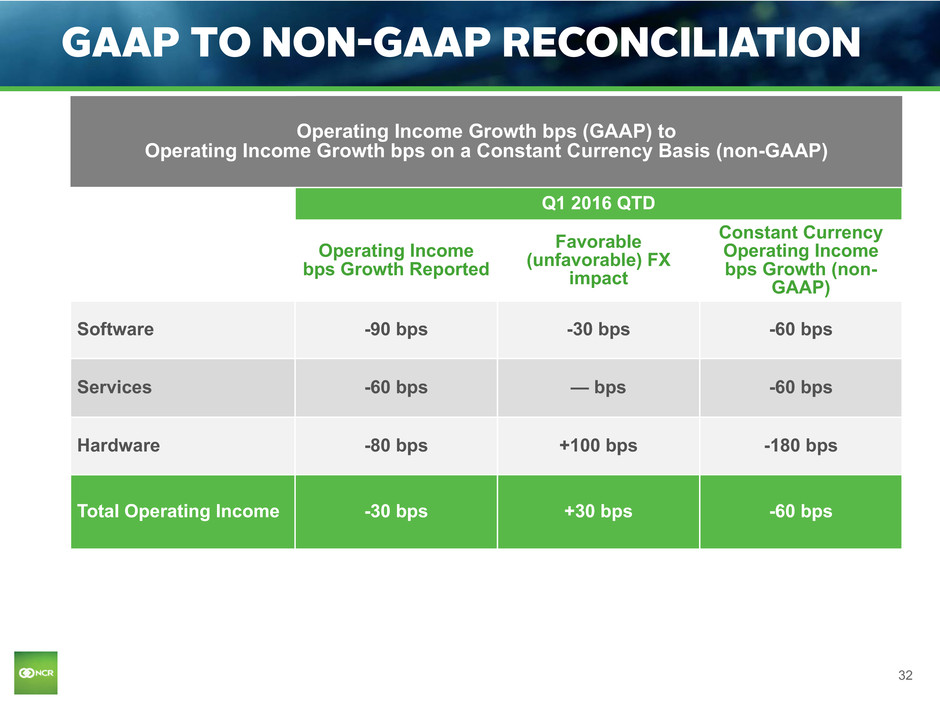
32 GAAP TO NON-GAAP RECONCILIATION Operating Income Growth bps (GAAP) to Operating Income Growth bps on a Constant Currency Basis (non-GAAP) Q1 2016 QTD Operating Income bps Growth Reported Favorable (unfavorable) FX impact Constant Currency Operating Income bps Growth (non- GAAP) Software -90 bps -30 bps -60 bps Services -60 bps — bps -60 bps Hardware -80 bps +100 bps -180 bps Total Operating Income -30 bps +30 bps -60 bps

33


