
May 1, 2018 MICHAEL HAYFORD, PRESIDENT & CEO BOB FISHMAN, CFO PAUL LANGENBAHN, COO Q1 2018 EARNINGS CONFERENCE CALL
2 FORWARD-LOOKING STATEMENTS. Comments made during this conference call and in these materials contain forward-looking statements. Statements that describe or relate to NCR's plans, goals, intentions, strategies, or financial outlook, and statements that do not relate to historical or current fact, are examples of forward-looking statements. The forward-looking statements in these materials include statements about NCR’s plans for further share repurchases in 2018; NCR’s full year 2018 financial guidance, and second quarter 2018 financial guidance, and the expected type and magnitude of the non-operational adjustments included in any forward-looking non-GAAP measures; NCR's initiatives to accelerate its transformation, including with respect to its manufacturing network redesign, and the expected timing, costs, results and benefits thereof; NCR's cloud revenue momentum; NCR's Mission One (M1) Services initiative and its expected benefits on NCR's services margin profile; expectations regarding the shift from software license revenue to cloud revenue; expectations regarding ATM order improvement and hardware margin rate improvement; NCR's expected areas of focus to drive momentum; expectations for accelerating cloud and recurring revenue; the status and momentum of NCR's Services and Hardware transformations; and NCR's expected free cash flow generation and capital allocation strategy. Forward-looking statements are not guarantees of future performance, and there are a number of important factors that could cause actual outcomes and results to differ materially from the results contemplated by such forward-looking statements, including those factors listed in Item 1a "Risk Factors" of NCR's Annual Report on Form 10-K filed with the Securities and Exchange Commission (SEC) on February 26, 2018, and those factors detailed from time to time in NCR's other SEC reports. These materials are dated May 1, 2018, and NCR does not undertake any obligation to publicly update or revise any forward-looking statements, whether as a result of new information, future events or otherwise. NON-GAAP MEASURES. While NCR reports its results in accordance with generally accepted accounting principles in the United States (GAAP), comments made during this conference call and in these materials will include or make reference to certain "non-GAAP" measures, including: selected measures, such as period-over-period revenue growth, expressed on a constant currency basis and adjusted constant currency basis, gross margin rate (non-GAAP), diluted earnings per share (non-GAAP), free cash flow (FCF), gross margin (non-GAAP), free cash flow as a percentage of non-GAAP net income (or free cash flow conversion rate), net debt, adjusted EBITDA, the ratio of net debt to adjusted EBITDA, operating expenses (non-GAAP), operating income (non-GAAP), interest and other expense (non-GAAP), income tax expense (non-GAAP), effective income tax rate (non-GAAP), and net income (non-GAAP). These measures are included to provide additional useful information regarding NCR's financial results, and are not a substitute for their comparable GAAP measures. Explanations of these non- GAAP measures, and reconciliations of these non-GAAP measures to their directly comparable GAAP measures, are included in the accompanying "Supplementary Materials" and are available on the Investor Relations page of NCR's website at www.ncr.com. Descriptions of many of these non-GAAP measures are also included in NCR's SEC reports. USE OF CERTAIN TERMS. As used in these materials, (i) the term "recurring revenue" means the sum of cloud, hardware maintenance and software maintenance revenue, (ii) the term “net annual contract value” or “net ACV” for any particular period means NCR’s net bookings for cloud revenue during the period, and is calculated as twelve months of expected subscription revenues under new cloud contracts during such period less twelve months of subscription revenues under cloud contracts that expired or were terminated during such period, adjusted for twelve months of expected pricing discounts or price increases from renewals of existing contracts, and (iii) the term "CC" means constant currency. These presentation materials and the associated remarks made during this conference call are integrally related and are intended to be presented and understood together. NOTES TO INVESTORS
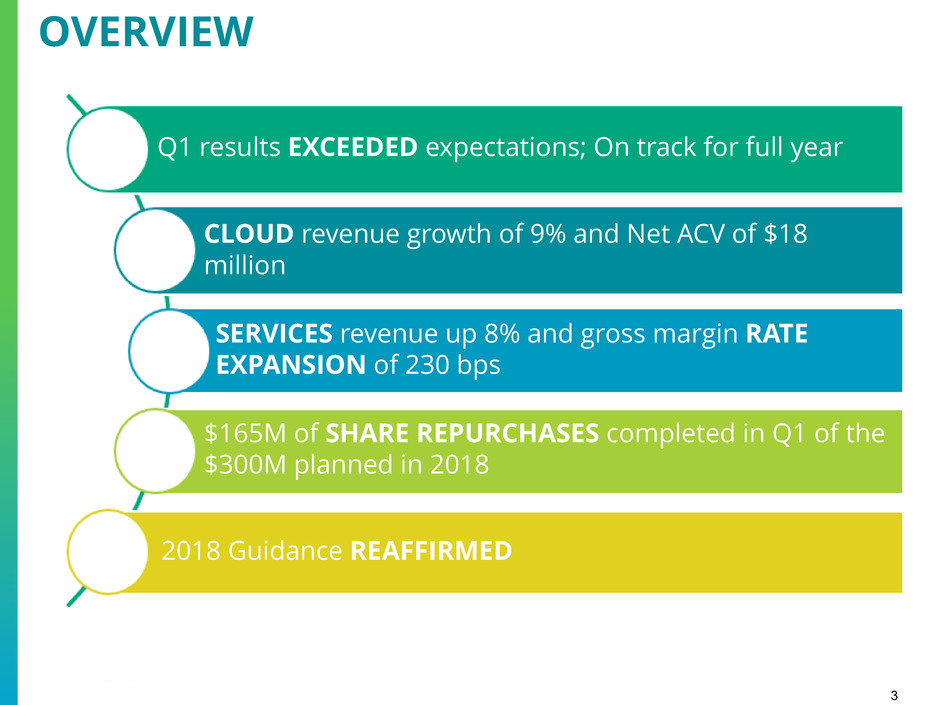
3 Q1 results EXCEEDED expectations; On track for full year CLOUD revenue growth of 9% and Net ACV of $18 million SERVICES revenue up 8% and gross margin RATE EXPANSION of 230 bps 2018 Guidance REAFFIRMED OVERVIEW $165M of SHARE REPURCHASES completed in Q1 of the $300M planned in 2018

4 Non-GAAP gross margin rate down 80 bps as reported and down 100 bps CC Non-GAAP Diluted EPS flat as reported and down 3% CC Free Cash Flow down due to timing of working capital FX Benefit 20 bps FX Benefit $0.02 $1.48 billion 29.2% 28.4% Q1 2017 Q1 2018 $0.56 Q1 2017 Q1 2018 ($16) million Q1 2017 ($99) million Q1 2018 Revenue Non-GAAP Gross Margin Rate Non-GAAP Diluted EPS Free Cash Flow Revenue up 3% as reported and flat CC; Recurring revenue up 5%, 48% of total revenue $1.52 billion Q1 2018 $0.56 FX Benefit $46 million Q1 2018 FINANCIAL RESULTS Q1 2017
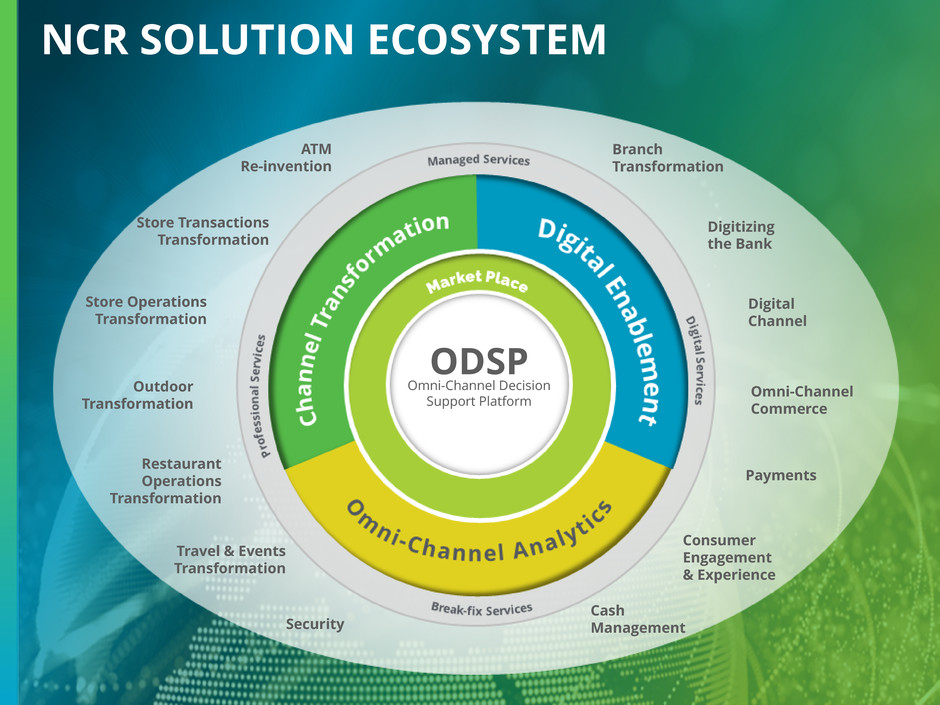
5 NCR SOLUTION ECOSYSTEM Branch Transformation Digitizing the Bank Digital Channel Omni-Channel Commerce Payments Consumer Engagement & Experience Travel & Events Transformation Security Restaurant Operations Transformation Outdoor Transformation Store Operations Transformation Store Transactions Transformation ATM Re-invention Cash Management ODSP Omni-Channel Decision Support Platform
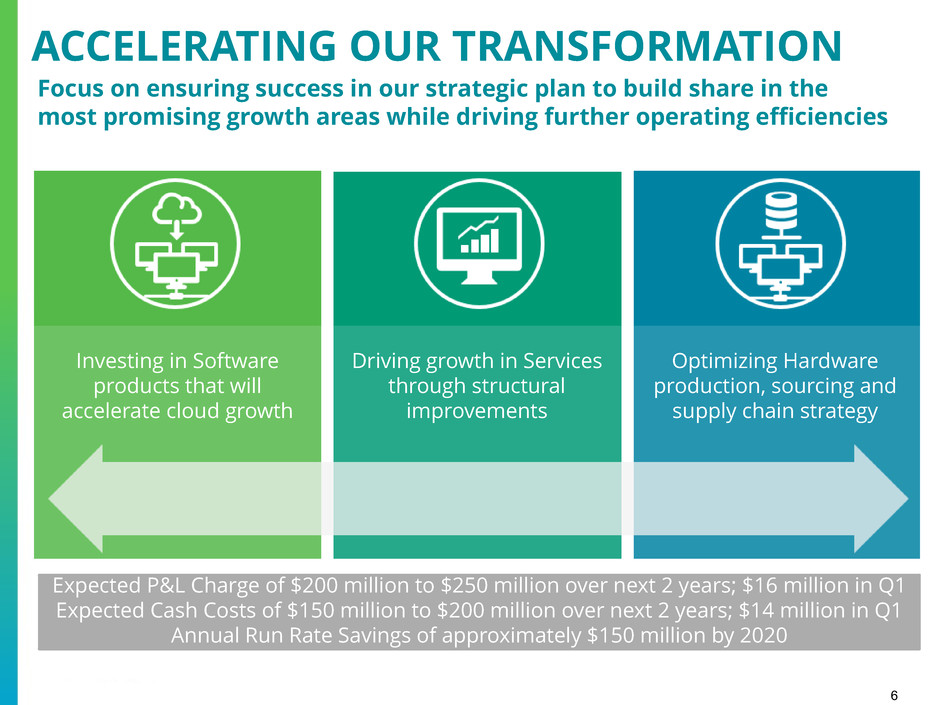
6 ACCELERATING OUR TRANSFORMATION Focus on ensuring success in our strategic plan to build share in the most promising growth areas while driving further operating efficiencies Expected P&L Charge of $200 million to $250 million over next 2 years; $16 million in Q1 Expected Cash Costs of $150 million to $200 million over next 2 years; $14 million in Q1 Annual Run Rate Savings of approximately $150 million by 2020 Investing in Software products that will accelerate cloud growth Driving growth in Services through structural improvements Optimizing Hardware production, sourcing and supply chain strategy

7 STRATEGY ▪ Executing a multi-year strategic initiative to strengthen our global competitive position and accelerate our transformation to a software and services-led, data driven business ACTIONS ▪ Announced the closure of three manufacturing plants ▪ Signed new agreement with contract manufacturing company EXPECTED RESULTS ▪ Shift cost from a largely fixed structure to a more variable cost structure ▪ Reduce our exposure to variable hardware demand cycles ▪ Increase global utilization rates and optimize supply chain network ▪ Improve working capital and margins MANUFACTURING NETWORK REDESIGN

8 Up 2% Up 8% Down 3% Down 350 bps Up 230 bps Down 190 bps 51.3% 47.8% 21.7% 24.0% Q1 2017 Q1 2018 Q1 2017 Q1 2018 Software Gross Margin Services Gross Margin 16.6% 14.7% Q1 2017 Q1 2018 Hardware Gross Margin $452 million $460 million Q1 2017 Q1 2018 $557 million $601 million Q1 2018Q1 2017 Software Revenue Services Revenue $469 million $456 million Hardware Revenue Q1 2018Q1 2017 Q1 2018 SEGMENT RESULTS

9 Q1 2018 Q1 2017 % Change % Change Constant Currency Software License $70 $85 (18)% (19)% Attached License 21 25 (16)% (22)% Unattached License 49 60 (18)% (18)% Software Maintenance 91 92 (1)% (3)% Cloud 155 142 9% 9% Professional Services 144 133 8% 4% Software Revenue $460 $452 2% —% Software Gross Margin $220 $232 (5)% (7)% Software Gross Margin Rate 47.8% 51.3% (350) bps (330) bps Operating Income $109 $124 (12)% (12)% Operating Income as a % of Revenue 23.7% 27.4% (370) bps (330) bps $ in millions SOFTWARE Q1 2018 Update KEY HIGHLIGHTS • Cloud revenue up 9%; Net ACV of $18M indicating continued strong momentum • Software License down 18% due to lower hardware revenue, the timing of large software transactions in the prior year, and the beginning of a shift from software license revenue to cloud revenue • Professional Services up 8% due to strength in channel transformation and digital enablement • Software Maintenance down due to lower Software License revenue in prior periods • Gross Margin Rate down driven by lower Software License revenue partially offset by margin expansion in Cloud

10 Q1 2018 Q1 2017 % Change % Change Constant Currency Services Revenue $601 $557 8% 4% Services Gross Margin $144 $121 19% 15% Services Gross Margin Rate 24.0% 21.7% +230 bps +230 bps Operating Income $62 $44 41% 40% Operating Income as a % of Revenue 10.3% 7.9% +240 bps +260 bps $ in millions SERVICES Q1 2018 Update KEY HIGHLIGHTS • Increase in revenue driven by hardware maintenance and implementation services as a result of continued momentum in managed service offerings and channel transformation trends. Backlog improving in the form of higher file value • Increased wallet share from the current install base driven by improved customer satisfaction • Gross margin rate increased due to sustainable improvements achieved through Mission One (M1) initiative • M1 initiative is a performance and profit improvement program focused on transforming NCR’s services margin profile through: 1) Productivity and efficiency improvements; 2) Remote diagnostics and repair; 3) Product life- cycle management; and 4) A higher mix of managed services
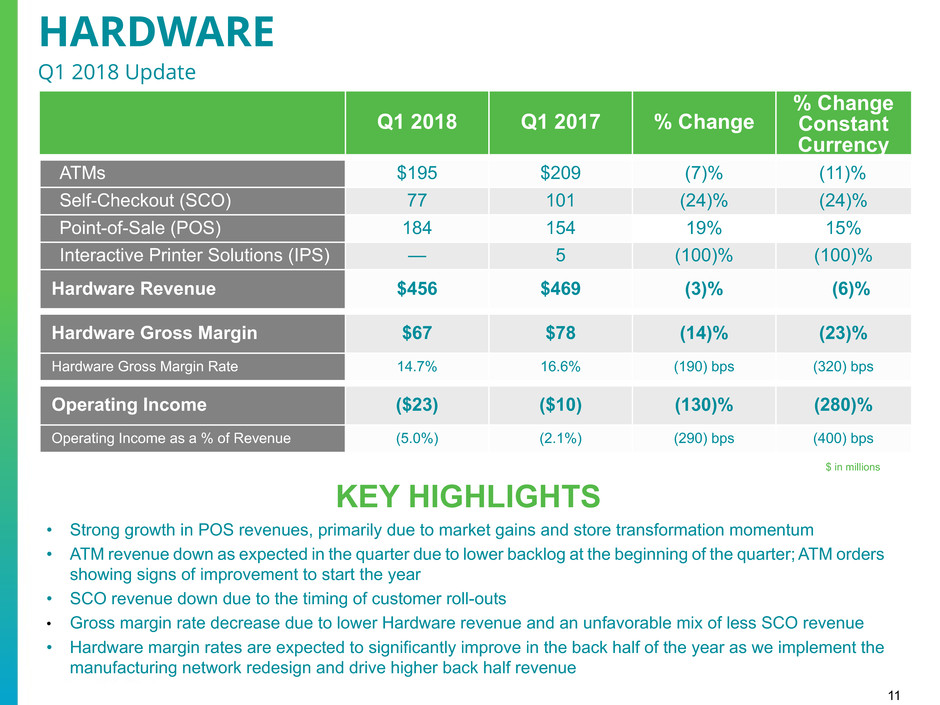
11 Q1 2018 Q1 2017 % Change % Change Constant Currency ATMs $195 $209 (7)% (11)% Self-Checkout (SCO) 77 101 (24)% (24)% Point-of-Sale (POS) 184 154 19% 15% Interactive Printer Solutions (IPS) — 5 (100)% (100)% Hardware Revenue $456 $469 (3)% (6)% Hardware Gross Margin $67 $78 (14)% (23)% Hardware Gross Margin Rate 14.7% 16.6% (190) bps (320) bps Operating Income ($23) ($10) (130)% (280)% Operating Income as a % of Revenue (5.0%) (2.1%) (290) bps (400) bps $ in millions HARDWARE Q1 2018 Update KEY HIGHLIGHTS • Strong growth in POS revenues, primarily due to market gains and store transformation momentum • ATM revenue down as expected in the quarter due to lower backlog at the beginning of the quarter; ATM orders showing signs of improvement to start the year • SCO revenue down due to the timing of customer roll-outs • Gross margin rate decrease due to lower Hardware revenue and an unfavorable mix of less SCO revenue • Hardware margin rates are expected to significantly improve in the back half of the year as we implement the manufacturing network redesign and drive higher back half revenue
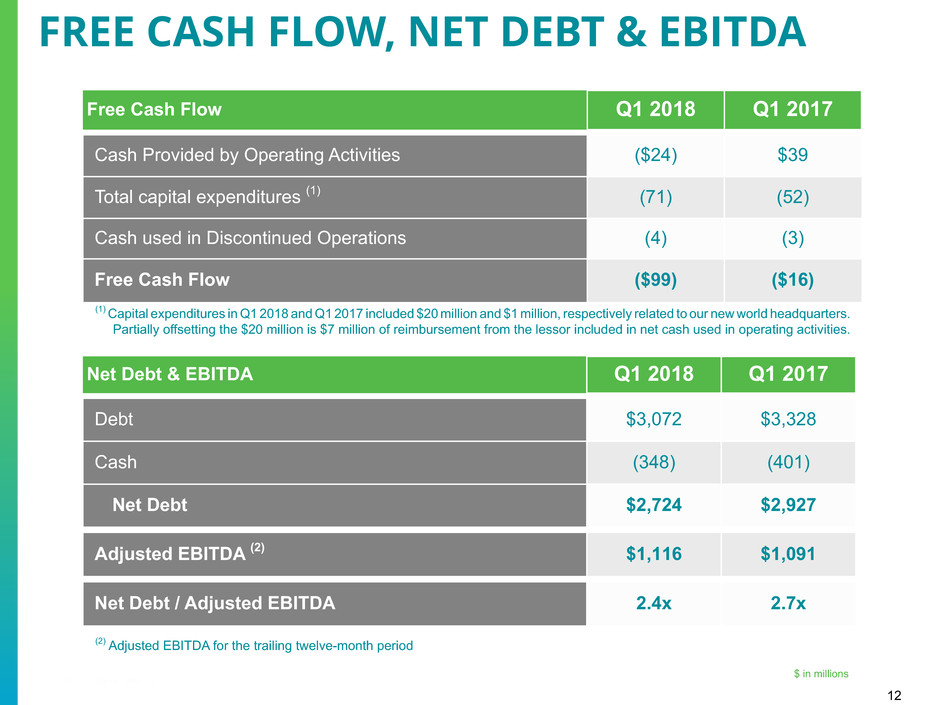
12 Free Cash Flow Q1 2018 Q1 2017 Cash Provided by Operating Activities ($24) $39 Total capital expenditures (1) (71) (52) Cash used in Discontinued Operations (4) (3) Free Cash Flow ($99) ($16) $ in millions (1) Capital expenditures in Q1 2018 and Q1 2017 included $20 million and $1 million, respectively related to our new world headquarters. Partially offsetting the $20 million is $7 million of reimbursement from the lessor included in net cash used in operating activities. FREE CASH FLOW, NET DEBT & EBITDA Net Debt & EBITDA Q1 2018 Q1 2017 Debt $3,072 $3,328 Cash (348) (401) Net Debt $2,724 $2,927 Adjusted EBITDA (2) $1,116 $1,091 Net Debt / Adjusted EBITDA 2.4x 2.7x (2) Adjusted EBITDA for the trailing twelve-month period

13 FY 2018 Guidance Revenue Growth 0% - 3% GAAP Diluted EPS $2.08 - $2.48 Non-GAAP Diluted EPS $3.30 - $3.45 Free Cash Flow ~90% Conversion Rate FY and Q2 2018 GUIDANCE Q2 2018 Guidance Revenue Growth (1)%- 1% GAAP Diluted EPS $0.12 - $0.30 Non-GAAP Diluted EPS $0.60 - $0.65
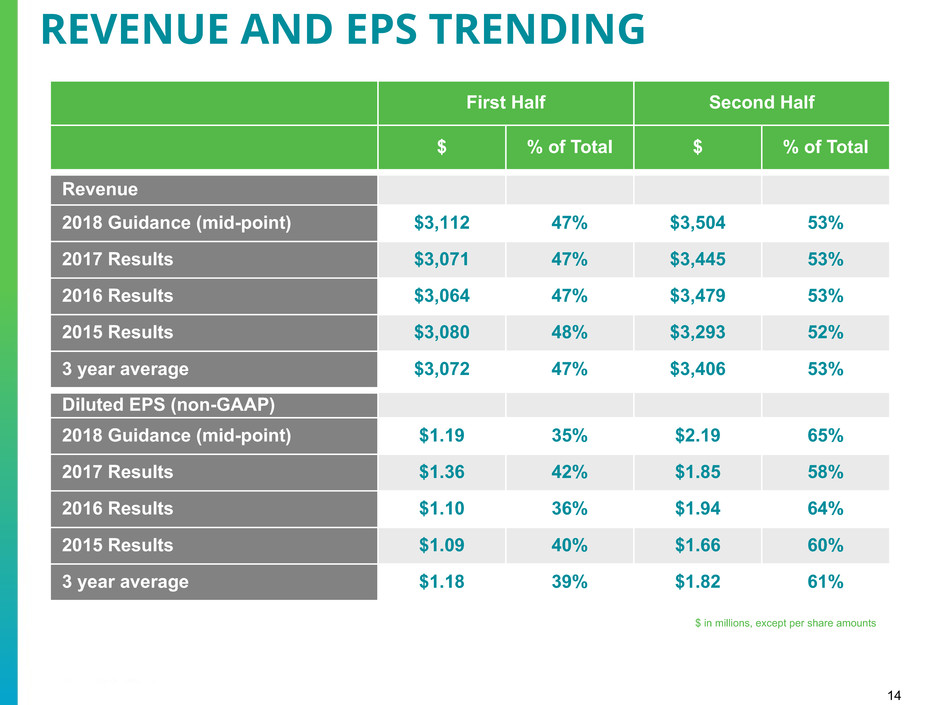
14 First Half Second Half $ % of Total $ % of Total Revenue 2018 Guidance (mid-point) $3,112 47% $3,504 53% 2017 Results $3,071 47% $3,445 53% 2016 Results $3,064 47% $3,479 53% 2015 Results $3,080 48% $3,293 52% 3 year average $3,072 47% $3,406 53% Diluted EPS (non-GAAP) 2018 Guidance (mid-point) $1.19 35% $2.19 65% 2017 Results $1.36 42% $1.85 58% 2016 Results $1.10 36% $1.94 64% 2015 Results $1.09 40% $1.66 60% 3 year average $1.18 39% $1.82 61% REVENUE AND EPS TRENDING $ in millions, except per share amounts
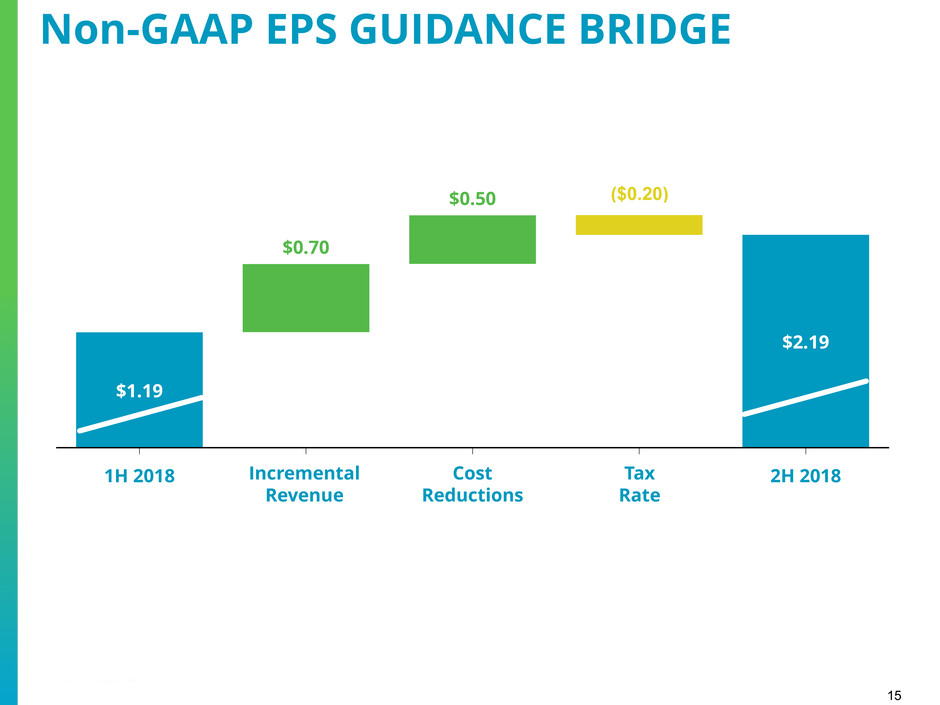
15 Non-GAAP EPS GUIDANCE BRIDGE 1H 2018 Revenue Expansion & Mix Cost Takeout Tax Rate 2H 2018 $1.19 $0.70 $0.50 $2.19 Incremental Revenue Cost Reductions Tax Rate ($0.20)

16 Focused on sales funnel, go to market offers, orders and Net ACV growth to drive momentum Accelerate recurring revenue; primarily cloud Accelerate transformation initiatives to generate targeted run-rate savings of $150 million by 2020 Services transformation well under way; Hardware transformation building momentum Free cash flow generation and balanced capital allocation strategy remain top priorities LOOKING FORWARD

17 SUPPLEMENTARY MATERIALS

18 Q1 2018 Q1 2017 % Change As Reported % Change Constant Currency Revenue $1,517 $1,478 3% —% (1) Gross Margin (non-GAAP) 431 431 —% (4)% Gross Margin Rate (non-GAAP) 28.4% 29.2% (80) bps (100) bps Operating Expenses (non-GAAP) 283 273 4% —% % of Revenue 18.7% 18.5% Operating Income (non-GAAP) 148 158 (6)% (10)% % of Revenue 9.8% 10.7% (90) bps (100) bps Interest and other expense (non-GAAP) (46) (44) 5% (1)% Income Tax Expense (non-GAAP) 16 27 (41)% Effective Income Tax Rate (non-GAAP) 15.7% 23.7% Net Income (non-GAAP) $85 $87 (2)% (5)% Diluted EPS (non-GAAP) (2) $0.56 $0.56 —% (3)% (1) The impact of foreign currency was $46 million favorable in Q1 2018. (2) Q1 2018 includes $0.02 of foreign currency benefit on EPS. Diluted share count of 151.5 million in Q1 2018 and 156.7 million in Q1 2017. in millions, except per share amounts Q1 2018 OPERATIONAL RESULTS
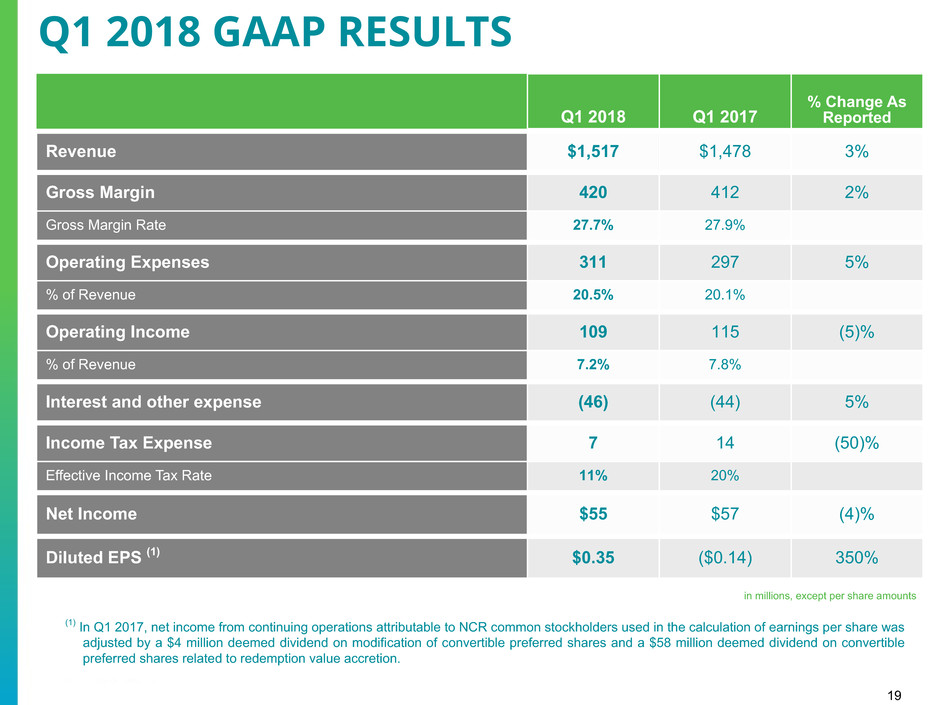
19 Q1 2018 Q1 2017 % Change As Reported Revenue $1,517 $1,478 3% Gross Margin 420 412 2% Gross Margin Rate 27.7% 27.9% Operating Expenses 311 297 5% % of Revenue 20.5% 20.1% Operating Income 109 115 (5)% % of Revenue 7.2% 7.8% Interest and other expense (46) (44) 5% Income Tax Expense 7 14 (50)% Effective Income Tax Rate 11% 20% Net Income $55 $57 (4)% Diluted EPS (1) $0.35 ($0.14) 350% in millions, except per share amounts Q1 2018 GAAP RESULTS (1) In Q1 2017, net income from continuing operations attributable to NCR common stockholders used in the calculation of earnings per share was adjusted by a $4 million deemed dividend on modification of convertible preferred shares and a $58 million deemed dividend on convertible preferred shares related to redemption value accretion.
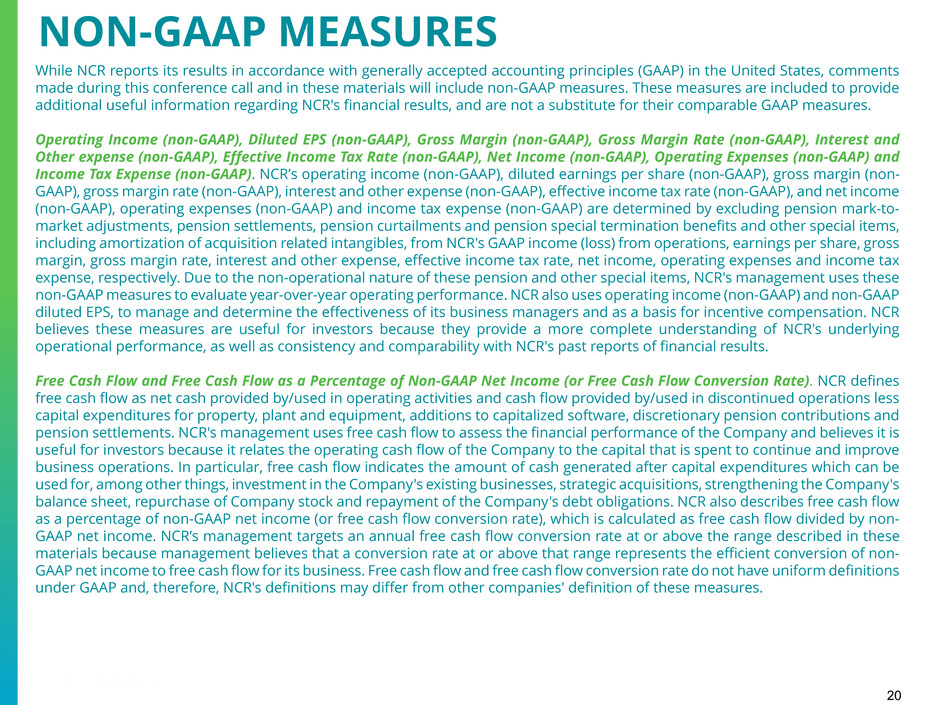
20 While NCR reports its results in accordance with generally accepted accounting principles (GAAP) in the United States, comments made during this conference call and in these materials will include non-GAAP measures. These measures are included to provide additional useful information regarding NCR's financial results, and are not a substitute for their comparable GAAP measures. Operating Income (non-GAAP), Diluted EPS (non-GAAP), Gross Margin (non-GAAP), Gross Margin Rate (non-GAAP), Interest and Other expense (non-GAAP), Effective Income Tax Rate (non-GAAP), Net Income (non-GAAP), Operating Expenses (non-GAAP) and Income Tax Expense (non-GAAP). NCR’s operating income (non-GAAP), diluted earnings per share (non-GAAP), gross margin (non- GAAP), gross margin rate (non-GAAP), interest and other expense (non-GAAP), effective income tax rate (non-GAAP), and net income (non-GAAP), operating expenses (non-GAAP) and income tax expense (non-GAAP) are determined by excluding pension mark-to- market adjustments, pension settlements, pension curtailments and pension special termination benefits and other special items, including amortization of acquisition related intangibles, from NCR's GAAP income (loss) from operations, earnings per share, gross margin, gross margin rate, interest and other expense, effective income tax rate, net income, operating expenses and income tax expense, respectively. Due to the non-operational nature of these pension and other special items, NCR's management uses these non-GAAP measures to evaluate year-over-year operating performance. NCR also uses operating income (non-GAAP) and non-GAAP diluted EPS, to manage and determine the effectiveness of its business managers and as a basis for incentive compensation. NCR believes these measures are useful for investors because they provide a more complete understanding of NCR's underlying operational performance, as well as consistency and comparability with NCR's past reports of financial results. Free Cash Flow and Free Cash Flow as a Percentage of Non-GAAP Net Income (or Free Cash Flow Conversion Rate). NCR defines free cash flow as net cash provided by/used in operating activities and cash flow provided by/used in discontinued operations less capital expenditures for property, plant and equipment, additions to capitalized software, discretionary pension contributions and pension settlements. NCR's management uses free cash flow to assess the financial performance of the Company and believes it is useful for investors because it relates the operating cash flow of the Company to the capital that is spent to continue and improve business operations. In particular, free cash flow indicates the amount of cash generated after capital expenditures which can be used for, among other things, investment in the Company's existing businesses, strategic acquisitions, strengthening the Company's balance sheet, repurchase of Company stock and repayment of the Company's debt obligations. NCR also describes free cash flow as a percentage of non-GAAP net income (or free cash flow conversion rate), which is calculated as free cash flow divided by non- GAAP net income. NCR’s management targets an annual free cash flow conversion rate at or above the range described in these materials because management believes that a conversion rate at or above that range represents the efficient conversion of non- GAAP net income to free cash flow for its business. Free cash flow and free cash flow conversion rate do not have uniform definitions under GAAP and, therefore, NCR's definitions may differ from other companies' definition of these measures. NON-GAAP MEASURES
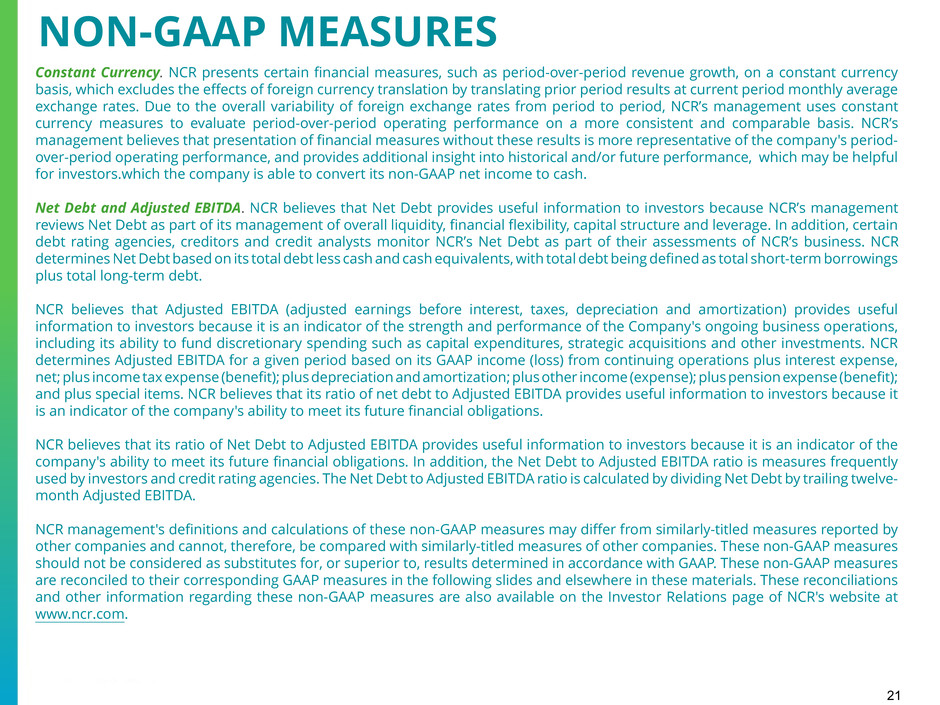
21 Constant Currency. NCR presents certain financial measures, such as period-over-period revenue growth, on a constant currency basis, which excludes the effects of foreign currency translation by translating prior period results at current period monthly average exchange rates. Due to the overall variability of foreign exchange rates from period to period, NCR’s management uses constant currency measures to evaluate period-over-period operating performance on a more consistent and comparable basis. NCR’s management believes that presentation of financial measures without these results is more representative of the company's period- over-period operating performance, and provides additional insight into historical and/or future performance, which may be helpful for investors.which the company is able to convert its non-GAAP net income to cash. Net Debt and Adjusted EBITDA. NCR believes that Net Debt provides useful information to investors because NCR’s management reviews Net Debt as part of its management of overall liquidity, financial flexibility, capital structure and leverage. In addition, certain debt rating agencies, creditors and credit analysts monitor NCR’s Net Debt as part of their assessments of NCR’s business. NCR determines Net Debt based on its total debt less cash and cash equivalents, with total debt being defined as total short-term borrowings plus total long-term debt. NCR believes that Adjusted EBITDA (adjusted earnings before interest, taxes, depreciation and amortization) provides useful information to investors because it is an indicator of the strength and performance of the Company's ongoing business operations, including its ability to fund discretionary spending such as capital expenditures, strategic acquisitions and other investments. NCR determines Adjusted EBITDA for a given period based on its GAAP income (loss) from continuing operations plus interest expense, net; plus income tax expense (benefit); plus depreciation and amortization; plus other income (expense); plus pension expense (benefit); and plus special items. NCR believes that its ratio of net debt to Adjusted EBITDA provides useful information to investors because it is an indicator of the company's ability to meet its future financial obligations. NCR believes that its ratio of Net Debt to Adjusted EBITDA provides useful information to investors because it is an indicator of the company's ability to meet its future financial obligations. In addition, the Net Debt to Adjusted EBITDA ratio is measures frequently used by investors and credit rating agencies. The Net Debt to Adjusted EBITDA ratio is calculated by dividing Net Debt by trailing twelve- month Adjusted EBITDA. NCR management's definitions and calculations of these non-GAAP measures may differ from similarly-titled measures reported by other companies and cannot, therefore, be compared with similarly-titled measures of other companies. These non-GAAP measures should not be considered as substitutes for, or superior to, results determined in accordance with GAAP. These non-GAAP measures are reconciled to their corresponding GAAP measures in the following slides and elsewhere in these materials. These reconciliations and other information regarding these non-GAAP measures are also available on the Investor Relations page of NCR's website at www.ncr.com. NON-GAAP MEASURES
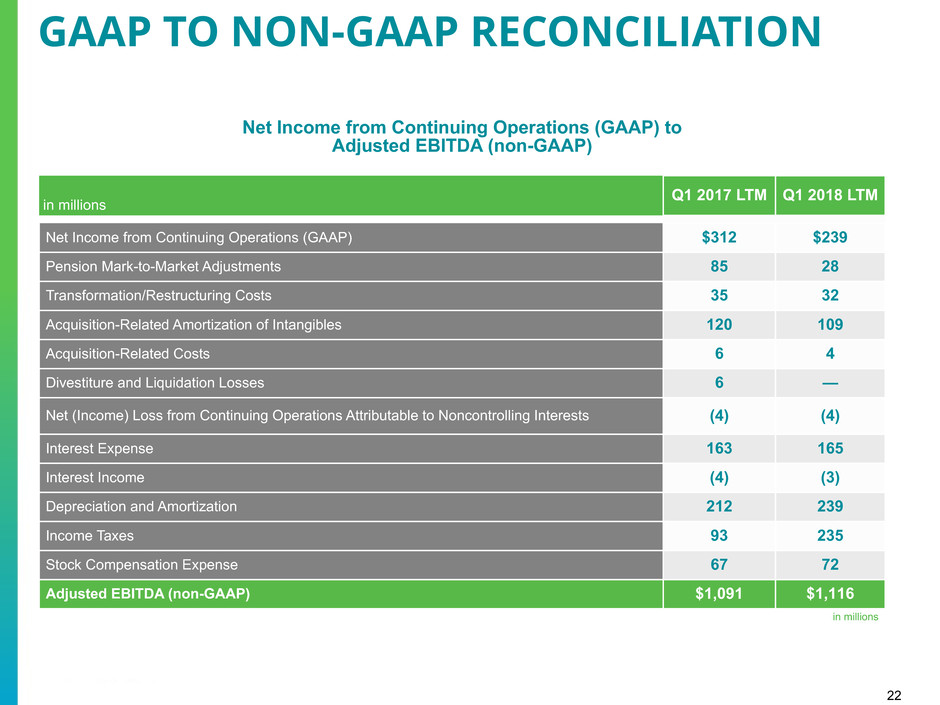
22 Net Income from Continuing Operations (GAAP) to Adjusted EBITDA (non-GAAP) in millions Q1 2017 LTM Q1 2018 LTM Net Income from Continuing Operations (GAAP) $312 $239 Pension Mark-to-Market Adjustments 85 28 Transformation/Restructuring Costs 35 32 Acquisition-Related Amortization of Intangibles 120 109 Acquisition-Related Costs 6 4 Divestiture and Liquidation Losses 6 — Net (Income) Loss from Continuing Operations Attributable to Noncontrolling Interests (4) (4) Interest Expense 163 165 Interest Income (4) (3) Depreciation and Amortization 212 239 Income Taxes 93 235 Stock Compensation Expense 67 72 Adjusted EBITDA (non-GAAP) $1,091 $1,116 in millions GAAP TO NON-GAAP RECONCILIATION

23 in millions (except per share amounts) Q1 QTD 2018 GAAP Transformation Costs Acquisition- related amortization of intangibles Q1 QTD 2018 non-GAAP Product revenue $526 $— $— $526 Service revenue 991 — — 991 Total revenue 1,517 — — 1,517 Cost of products 420 — (4) 416 Cost of services 677 (4) (3) 670 Gross margin 420 4 7 431 Gross margin rate 27.7% 0.2% 0.5% 28.4% Selling, general and administrative expenses 245 (10) (16) 219 Research and development expenses 66 (2) — 64 Total operating expenses 311 (12) (16) 283 Total operating expense as a % of revenue 20.5% (0.7)% (1.1)% 18.7% Income from operations 109 16 23 148 Income from operations as a % of revenue 7.2% 1.1% 1.5% 9.8% Interest and Other (expense) income, net (46) — — (46) Income from continuing operations before income taxes 63 16 23 102 Income tax expense 7 4 5 16 Effective income tax rate 11% 16% Income from continuing operations 56 12 18 86 Net income attributable to noncontrolling interests 1 — — 1 Income from continuing operations (attributable to NCR) $55 $12 $18 $85 Diluted earnings per share $0.35 $0.08 $0.12 $0.56 Diluted shares outstanding 123.8 151.5 GAAP TO NON-GAAP RECONCILIATION Q1 2018 QTD

24 in millions (except per share amounts) Q1 QTD 2018 GAAP Q1 QTD 2018 non-GAAP Income from continuing operations attributable to NCR common stockholders: Income from continuing operations (attributable to NCR) $55 $85 Dividends on convertible preferred shares (12) — Income from continuing operations attributable to NCR common stockholders $43 $85 Weighted average outstanding shares: Weighted average diluted shares outstanding 123.8 123.8 Weighted as-if converted preferred shares — 27.7 Total shares used in diluted earnings per share 123.8 151.5 Diluted earnings per share (1) $0.35 $0.56 (1) GAAP EPS is determined using the most dilutive measure, either including the impact of the dividends on NCR's Series A Convertible Preferred Shares in the calculation of net income or loss available to common stockholders or including the impact of the conversion of such preferred stock into common stock in the calculation of the weighted average diluted shares outstanding. Non-GAAP EPS is always determined using the as-if converted preferred shares and shares that would be issued for stock compensation awards. Therefore, GAAP diluted EPS and non-GAAP diluted EPS may be calculated using different methods, and may not mathematically reconcile. GAAP TO NON-GAAP RECONCILIATION Q1 2018 QTD
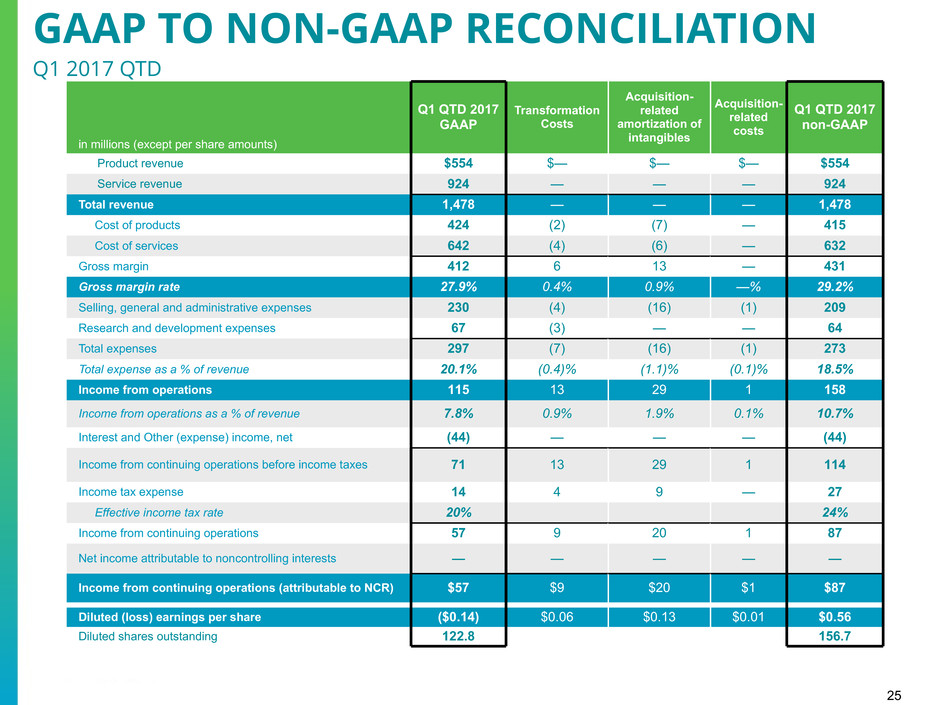
25 in millions (except per share amounts) Q1 QTD 2017 GAAP Transformation Costs Acquisition- related amortization of intangibles Acquisition- related costs Q1 QTD 2017 non-GAAP Product revenue $554 $— $— $— $554 Service revenue 924 — — — 924 Total revenue 1,478 — — — 1,478 Cost of products 424 (2) (7) — 415 Cost of services 642 (4) (6) — 632 Gross margin 412 6 13 — 431 Gross margin rate 27.9% 0.4% 0.9% —% 29.2% Selling, general and administrative expenses 230 (4) (16) (1) 209 Research and development expenses 67 (3) — — 64 Total expenses 297 (7) (16) (1) 273 Total expense as a % of revenue 20.1% (0.4)% (1.1)% (0.1)% 18.5% Income from operations 115 13 29 1 158 Income from operations as a % of revenue 7.8% 0.9% 1.9% 0.1% 10.7% Interest and Other (expense) income, net (44) — — — (44) Income from continuing operations before income taxes 71 13 29 1 114 Income tax expense 14 4 9 — 27 Effective income tax rate 20% 24% Income from continuing operations 57 9 20 1 87 Net income attributable to noncontrolling interests — — — — — Income from continuing operations (attributable to NCR) $57 $9 $20 $1 $87 Diluted (loss) earnings per share ($0.14) $0.06 $0.13 $0.01 $0.56 Diluted shares outstanding 122.8 156.7 GAAP TO NON-GAAP RECONCILIATION Q1 2017 QTD

26 in millions (except per share amounts) Q1 QTD 2017 GAAP Q1 QTD 2017 non-GAAP Income from continuing operations attributable to NCR common stockholders: Income from continuing operations (attributable to NCR) $57 $87 Dividends on convertible preferred shares (12) — Deemed dividend on modification of convertible preferred shares (4) — Deemed dividend on convertible preferred shares related to redemption value accretion (58) — (Loss) Income from continuing operations attributable to NCR common stockholders $(17) $87 Weighted average outstanding shares: Weighted average diluted shares outstanding 122.8 128.2 Weighted as-if converted preferred shares — 28.5 Total shares used in diluted earnings per share 122.8 156.7 Diluted (loss) earnings per share (1) ($0.14) $0.56 (1) GAAP EPS is determined using the most dilutive measure, either including the impact of the dividends on NCR's Series A Convertible Preferred Shares in the calculation of net income or loss available to common stockholders or including the impact of the conversion of such preferred stock into common stock in the calculation of the weighted average diluted shares outstanding. Non-GAAP EPS is always determined using the as-if converted preferred shares and shares that would be issued for stock compensation awards. Therefore, GAAP diluted EPS and non-GAAP diluted EPS may be calculated using different methods, and may not mathematically reconcile. GAAP TO NON-GAAP RECONCILIATION Q1 2017 QTD

27 in millions (except per share amounts) FY 2017 GAAP Transformation Costs Acquisition- related amortization of intangibles Acquisition- related costs Pension mark- to-market adjustments Impact of U.S. Tax Reform FY 2017 non-GAAP Product revenue $2,579 $— $— $— $— $— $2,579 Service revenue 3,937 — — — — — 3,937 Total revenue 6,516 — — — — — 6,516 Cost of products 2,021 (2) (25) — — — 1,994 Cost of services 2,640 (9) (25) — — — 2,606 Gross margin 1,855 11 50 — — — 1,916 Gross margin rate 28.5% 0.1% 0.8% —% —% —% 29.4% Selling, general and administrative expenses 923 (14) (65) (5) — — 839 Research and development expenses 241 (4) — — — — 237 Total expenses 1,164 (18) (65) (5) — — 1,076 Total expense as a % of revenue 17.9% (0.3)% (1.0)% (0.1)% (0.4)% —% 16.5% Income from operations 691 29 115 5 — — 840 Income from operations as a % of revenue 10.6% 0.4% 1.8% 0.1% 0.4% —% 12.9% Interest and Other (expense) income, net (209) — — — 28 — (181) Income from continuing operations before income taxes 482 29 115 5 28 — 659 Income tax expense (benefit) 242 9 36 2 3 (130) 162 Effective income tax rate 50% 25% Income from continuing operations 240 20 79 3 25 130 497 Net income attributable to noncontrolling interests 3 — — — — — 3 Income from continuing operations (attributable to NCR) $237 $20 $79 $3 $25 $130 $494 Diluted earnings per share $1.01 $0.13 $0.51 $0.02 $0.16 $0.84 $3.20 Diluted Shares outstanding 127.0 154.3 GAAP TO NON-GAAP RECONCILIATION FY 2017
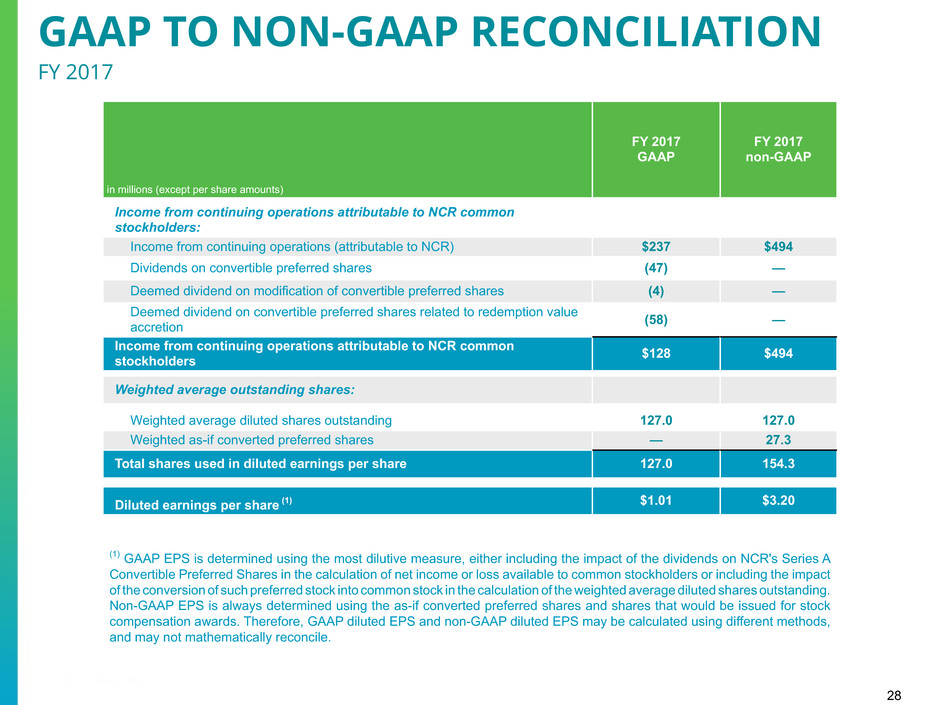
28 in millions (except per share amounts) FY 2017 GAAP FY 2017 non-GAAP Income from continuing operations attributable to NCR common stockholders: Income from continuing operations (attributable to NCR) $237 $494 Dividends on convertible preferred shares (47) — Deemed dividend on modification of convertible preferred shares (4) — Deemed dividend on convertible preferred shares related to redemption value accretion (58) — Income from continuing operations attributable to NCR common stockholders $128 $494 Weighted average outstanding shares: Weighted average diluted shares outstanding 127.0 127.0 Weighted as-if converted preferred shares — 27.3 Total shares used in diluted earnings per share 127.0 154.3 Diluted earnings per share (1) $1.01 $3.20 (1) GAAP EPS is determined using the most dilutive measure, either including the impact of the dividends on NCR's Series A Convertible Preferred Shares in the calculation of net income or loss available to common stockholders or including the impact of the conversion of such preferred stock into common stock in the calculation of the weighted average diluted shares outstanding. Non-GAAP EPS is always determined using the as-if converted preferred shares and shares that would be issued for stock compensation awards. Therefore, GAAP diluted EPS and non-GAAP diluted EPS may be calculated using different methods, and may not mathematically reconcile. GAAP TO NON-GAAP RECONCILIATION FY 2017
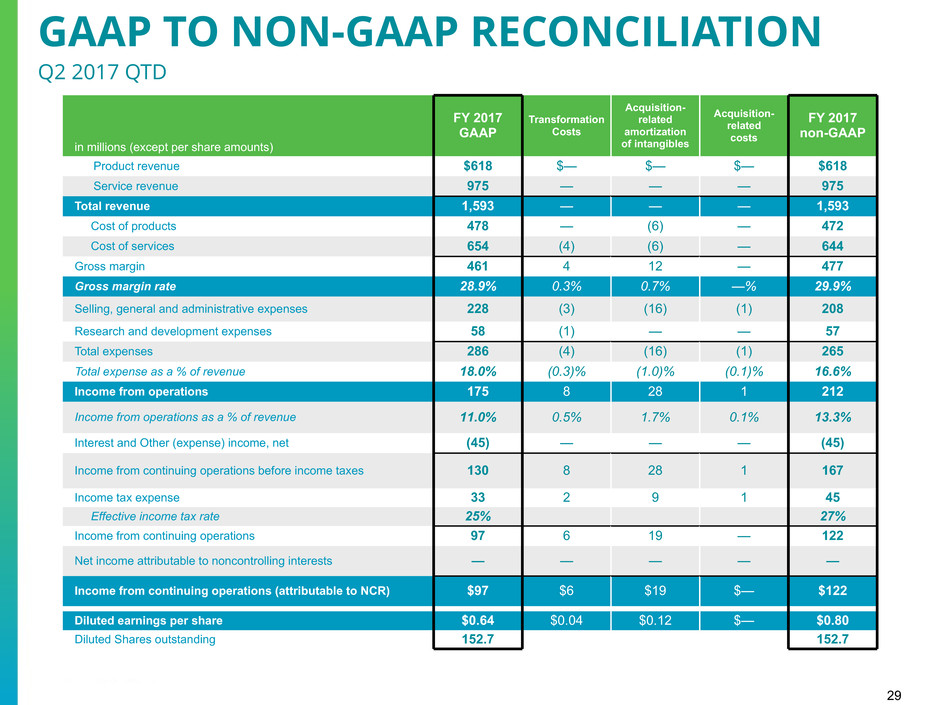
29 GAAP TO NON-GAAP RECONCILIATION Q2 2017 QTD in millions (except per share amounts) FY 2017 GAAP Transformation Costs Acquisition- related amortization of intangibles Acquisition- related costs FY 2017 non-GAAP Product revenue $618 $— $— $— $618 Service revenue 975 — — — 975 Total revenue 1,593 — — — 1,593 Cost of products 478 — (6) — 472 Cost of services 654 (4) (6) — 644 Gross margin 461 4 12 — 477 Gross margin rate 28.9% 0.3% 0.7% —% 29.9% Selling, general and administrative expenses 228 (3) (16) (1) 208 Research and development expenses 58 (1) — — 57 Total expenses 286 (4) (16) (1) 265 Total expense as a % of revenue 18.0% (0.3)% (1.0)% (0.1)% 16.6% Income from operations 175 8 28 1 212 Income from operations as a % of revenue 11.0% 0.5% 1.7% 0.1% 13.3% Interest and Other (expense) income, net (45) — — — (45) Income from continuing operations before income taxes 130 8 28 1 167 Income tax expense 33 2 9 1 45 Effective income tax rate 25% 27% Income from continuing operations 97 6 19 — 122 Net income attributable to noncontrolling interests — — — — — Income from continuing operations (attributable to NCR) $97 $6 $19 $— $122 Diluted earnings per share $0.64 $0.04 $0.12 $— $0.80 Diluted Shares outstanding 152.7 152.7
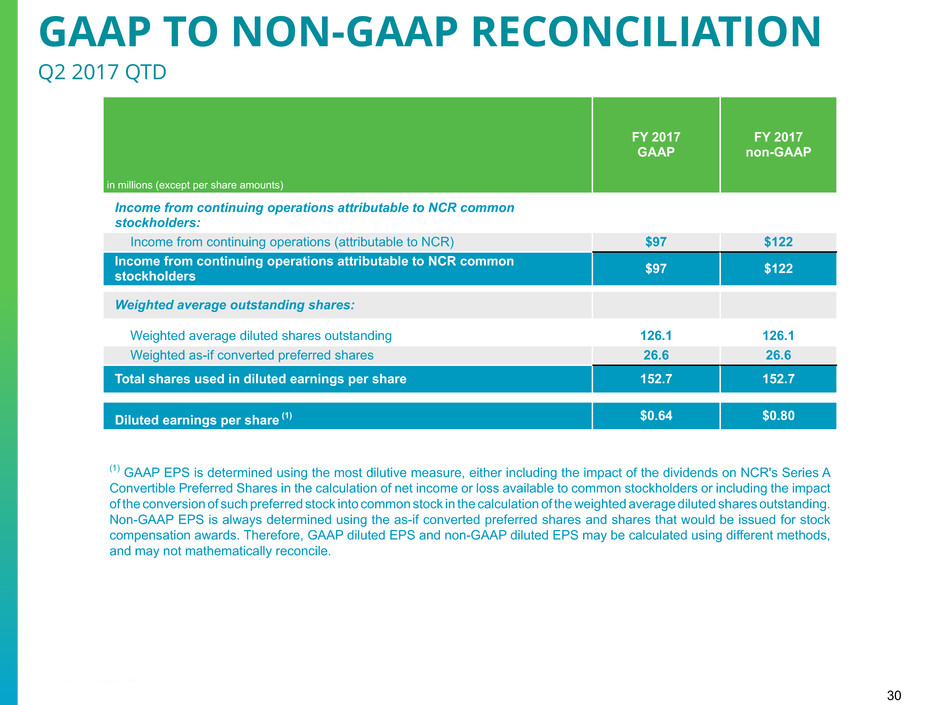
30 in millions (except per share amounts) FY 2017 GAAP FY 2017 non-GAAP Income from continuing operations attributable to NCR common stockholders: Income from continuing operations (attributable to NCR) $97 $122 Income from continuing operations attributable to NCR common stockholders $97 $122 Weighted average outstanding shares: Weighted average diluted shares outstanding 126.1 126.1 Weighted as-if converted preferred shares 26.6 26.6 Total shares used in diluted earnings per share 152.7 152.7 Diluted earnings per share (1) $0.64 $0.80 GAAP TO NON-GAAP RECONCILIATION Q2 2017 QTD (1) GAAP EPS is determined using the most dilutive measure, either including the impact of the dividends on NCR's Series A Convertible Preferred Shares in the calculation of net income or loss available to common stockholders or including the impact of the conversion of such preferred stock into common stock in the calculation of the weighted average diluted shares outstanding. Non-GAAP EPS is always determined using the as-if converted preferred shares and shares that would be issued for stock compensation awards. Therefore, GAAP diluted EPS and non-GAAP diluted EPS may be calculated using different methods, and may not mathematically reconcile.

31 Gross Margin and Gross Margin Rate (non-GAAP) to Gross Margin and Gross Margin Rate (GAAP) Q1 2018 QTD Gross Margin Gross MarginRate % Software 220 47.8% Services 144 24.0% Hardware 67 14.7% Total Gross Margin (non-GAAP) 431 28.4% Less: Transformation Costs 4 0.2% Acquisition-related amortization of intangibles 7 0.5% Total Gross Margin (GAAP) 420 27.7% GAAP TO NON-GAAP RECONCILIATION Q1 2018 QTD
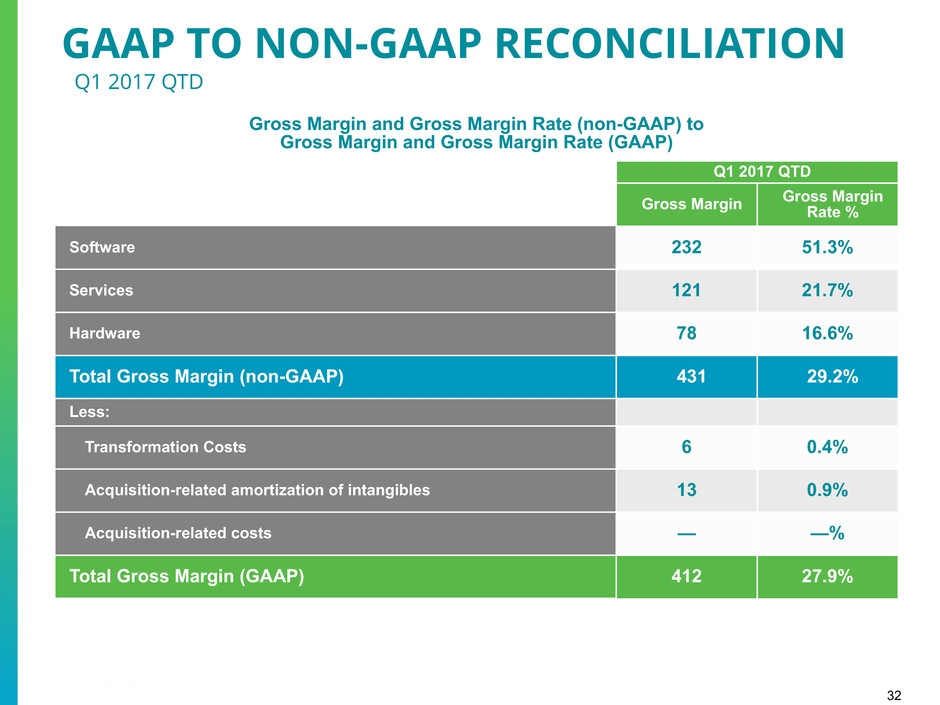
32 Gross Margin and Gross Margin Rate (non-GAAP) to Gross Margin and Gross Margin Rate (GAAP) Q1 2017 QTD Gross Margin Gross MarginRate % Software 232 51.3% Services 121 21.7% Hardware 78 16.6% Total Gross Margin (non-GAAP) 431 29.2% Less: Transformation Costs 6 0.4% Acquisition-related amortization of intangibles 13 0.9% Acquisition-related costs — —% Total Gross Margin (GAAP) 412 27.9% GAAP TO NON-GAAP RECONCILIATION Q1 2017 QTD

33 Operating Income and Operating Income Rate (non-GAAP) to Operating Income and Operating Income Rate (GAAP) Q1 2018 QTD Operating Income Operating Income Rate Software 109 23.7% Services 62 10.3% Hardware (23) (5.0)% Total Operating Income (non-GAAP) 148 9.8% Less: Transformation Costs 16 1.1% Acquisition-related amortization of intangibles 23 1.5% Total Operating Income (GAAP) 109 7.2% GAAP TO NON-GAAP RECONCILIATION Q1 2018 QTD
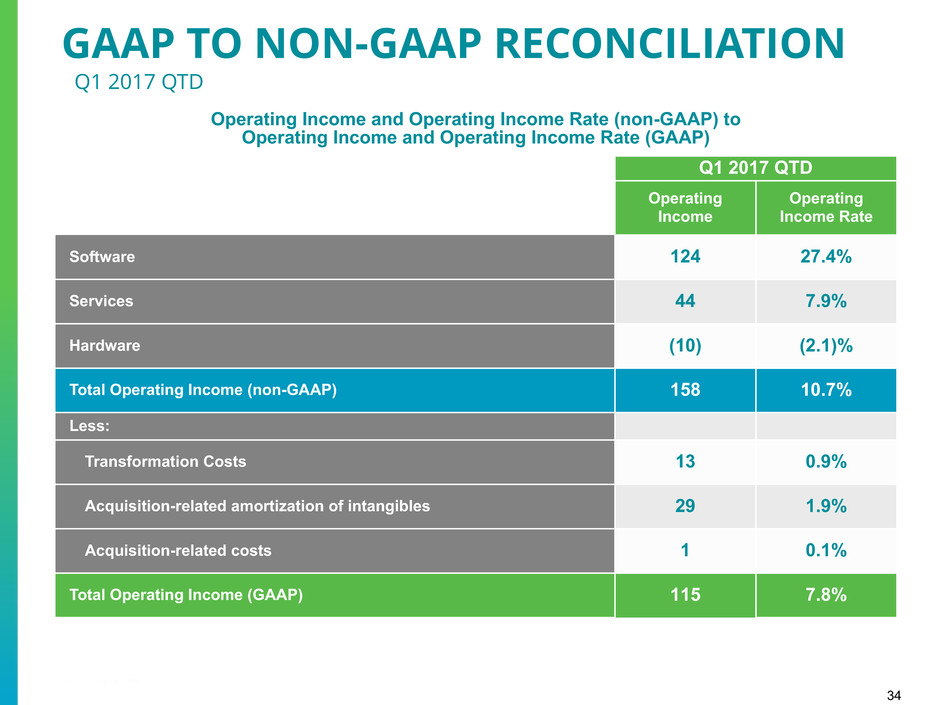
34 Operating Income and Operating Income Rate (non-GAAP) to Operating Income and Operating Income Rate (GAAP) Q1 2017 QTD Operating Income Operating Income Rate Software 124 27.4% Services 44 7.9% Hardware (10) (2.1)% Total Operating Income (non-GAAP) 158 10.7% Less: Transformation Costs 13 0.9% Acquisition-related amortization of intangibles 29 1.9% Acquisition-related costs 1 0.1% Total Operating Income (GAAP) 115 7.8% GAAP TO NON-GAAP RECONCILIATION Q1 2017 QTD
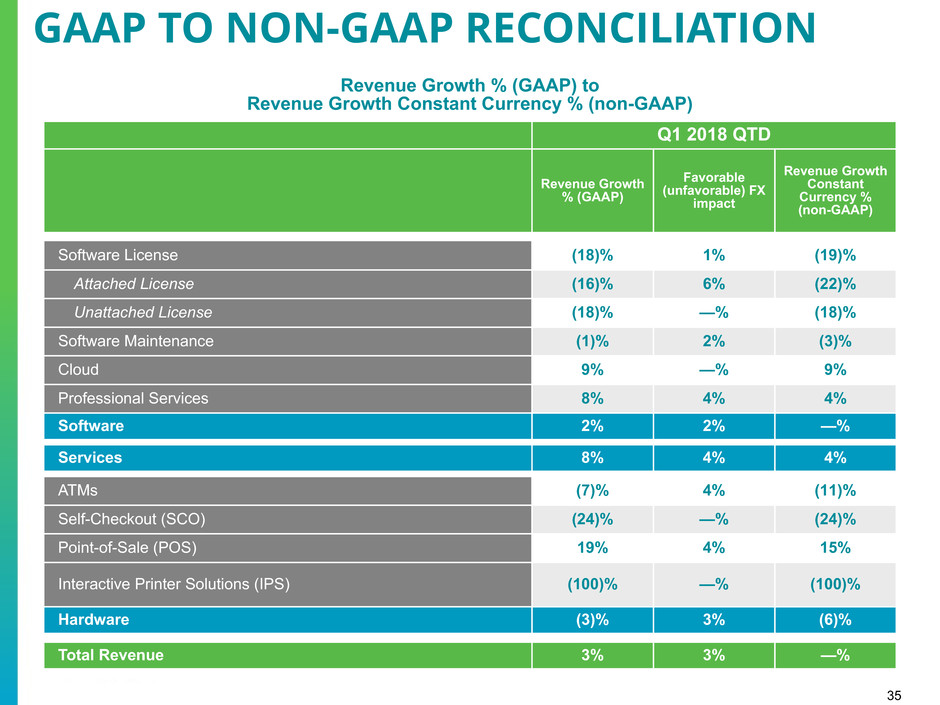
35 Revenue Growth % (GAAP) to Revenue Growth Constant Currency % (non-GAAP) Q1 2018 QTD Revenue Growth % (GAAP) Favorable (unfavorable) FX impact Revenue Growth Constant Currency % (non-GAAP) Software License (18)% 1% (19)% Attached License (16)% 6% (22)% Unattached License (18)% —% (18)% Software Maintenance (1)% 2% (3)% Cloud 9% —% 9% Professional Services 8% 4% 4% Software 2% 2% —% Services 8% 4% 4% ATMs (7)% 4% (11)% Self-Checkout (SCO) (24)% —% (24)% Point-of-Sale (POS) 19% 4% 15% Interactive Printer Solutions (IPS) (100)% —% (100)% Hardware (3)% 3% (6)% Total Revenue 3% 3% —% GAAP TO NON-GAAP RECONCILIATION

36 Gross Margin Growth % (GAAP) to Gross Margin Growth % on a Constant Currency Basis (non-GAAP) Q1 2018 QTD Gross Margin Growth % Reported Favorable (unfavorable) FX impact Constant Currency Gross Margin Growth % (non-GAAP) Software (5)% 2% (7)% Services 19% 4% 15% Hardware (14)% 9% (23)% Total Gross Margin —% 4% (4)% GAAP TO NON-GAAP RECONCILIATION
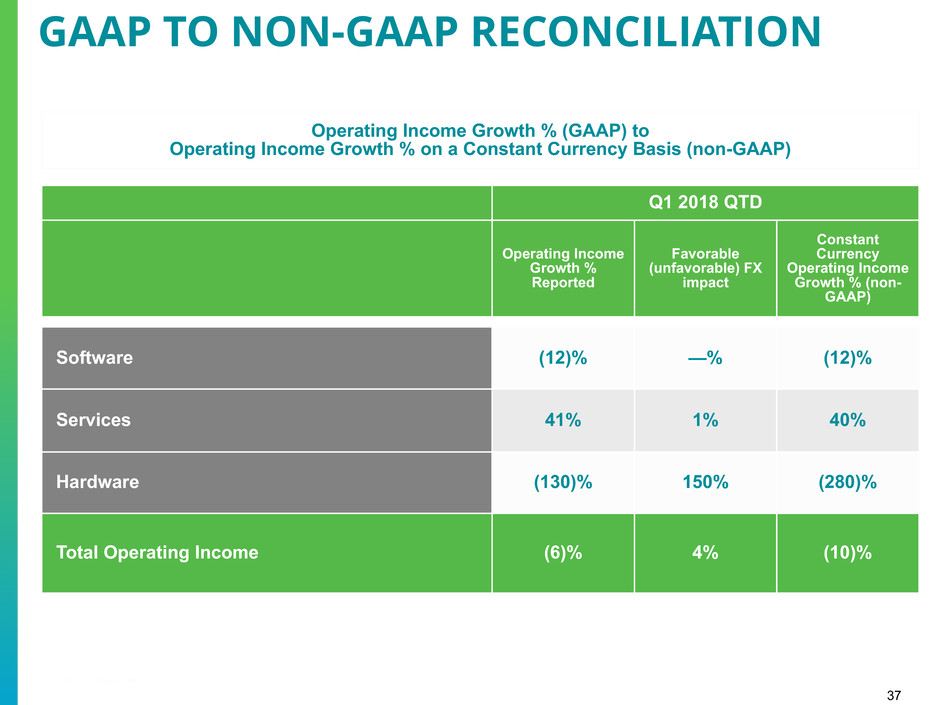
37 Operating Income Growth % (GAAP) to Operating Income Growth % on a Constant Currency Basis (non-GAAP) Q1 2018 QTD Operating Income Growth % Reported Favorable (unfavorable) FX impact Constant Currency Operating Income Growth % (non- GAAP) Software (12)% —% (12)% Services 41% 1% 40% Hardware (130)% 150% (280)% Total Operating Income (6)% 4% (10)% GAAP TO NON-GAAP RECONCILIATION

38 GAAP TO NON-GAAP RECONCILIATION Gross Margin Growth bps (GAAP) to Gross Margin Growth bps on a Constant Currency Basis (non-GAAP) Q1 2018 QTD Gross Margin bps Growth Reported Favorable (unfavorable) FX impact Constant Currency Gross Margin bps Growth (non- GAAP) Software (350) bps (20) bps (330) bps Services 230 bps — bps 230 bps Hardware (190) bps 130 bps (320) bps Total Gross Margin bps (80) bps 20 bps (100) bps
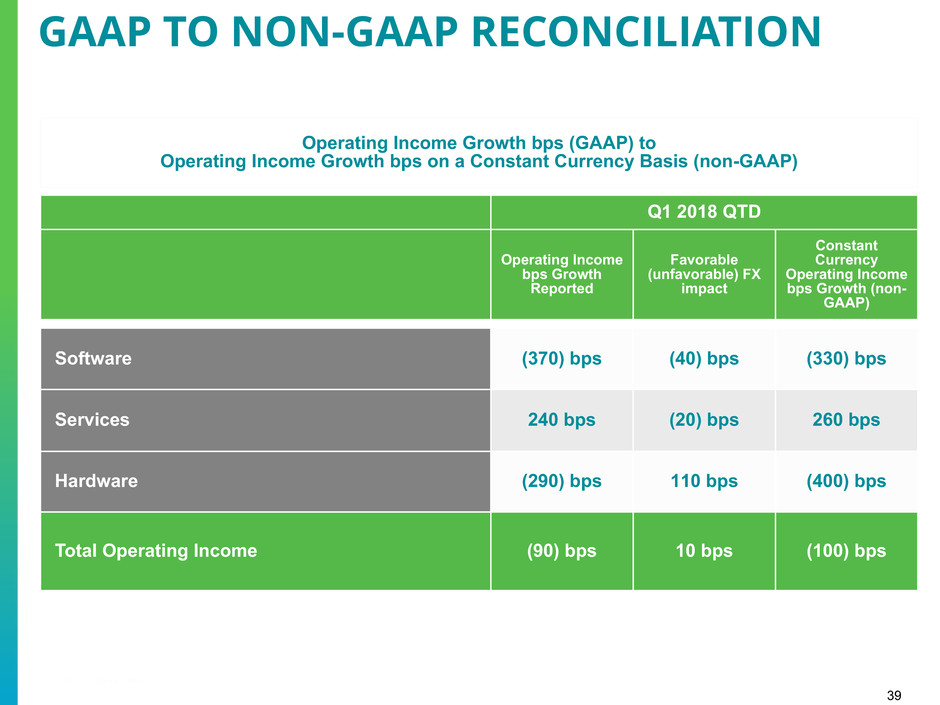
39 Operating Income Growth bps (GAAP) to Operating Income Growth bps on a Constant Currency Basis (non-GAAP) Q1 2018 QTD Operating Income bps Growth Reported Favorable (unfavorable) FX impact Constant Currency Operating Income bps Growth (non- GAAP) Software (370) bps (40) bps (330) bps Services 240 bps (20) bps 260 bps Hardware (290) bps 110 bps (400) bps Total Operating Income (90) bps 10 bps (100) bps GAAP TO NON-GAAP RECONCILIATION
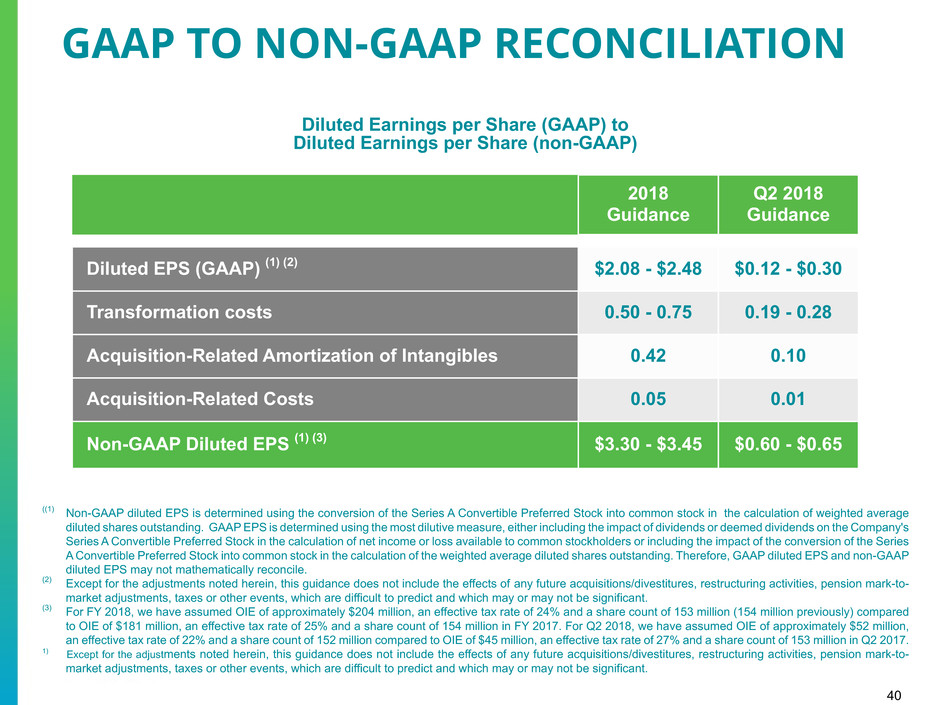
40 GAAP TO NON-GAAP RECONCILIATION Diluted Earnings per Share (GAAP) to Diluted Earnings per Share (non-GAAP) 2018 Guidance Q2 2018 Guidance Diluted EPS (GAAP) (1) (2) $2.08 - $2.48 $0.12 - $0.30 Transformation costs 0.50 - 0.75 0.19 - 0.28 Acquisition-Related Amortization of Intangibles 0.42 0.10 Acquisition-Related Costs 0.05 0.01 Non-GAAP Diluted EPS (1) (3) $3.30 - $3.45 $0.60 - $0.65 ((1) Non-GAAP diluted EPS is determined using the conversion of the Series A Convertible Preferred Stock into common stock in the calculation of weighted average diluted shares outstanding. GAAP EPS is determined using the most dilutive measure, either including the impact of dividends or deemed dividends on the Company's Series A Convertible Preferred Stock in the calculation of net income or loss available to common stockholders or including the impact of the conversion of the Series A Convertible Preferred Stock into common stock in the calculation of the weighted average diluted shares outstanding. Therefore, GAAP diluted EPS and non-GAAP diluted EPS may not mathematically reconcile. (2) Except for the adjustments noted herein, this guidance does not include the effects of any future acquisitions/divestitures, restructuring activities, pension mark-to- market adjustments, taxes or other events, which are difficult to predict and which may or may not be significant. (3) For FY 2018, we have assumed OIE of approximately $204 million, an effective tax rate of 24% and a share count of 153 million (154 million previously) compared to OIE of $181 million, an effective tax rate of 25% and a share count of 154 million in FY 2017. For Q2 2018, we have assumed OIE of approximately $52 million, an effective tax rate of 22% and a share count of 152 million compared to OIE of $45 million, an effective tax rate of 27% and a share count of 153 million in Q2 2017. 1) Except for the adjustments noted herein, this guidance does not include the effects of any future acquisitions/divestitures, restructuring activities, pension mark-to- market adjustments, taxes or other events, which are difficult to predict and which may or may not be significant.

41


