
Q3 2018 EARNINGS CONFERENCE CALL MICHAEL HAYFORD, PRESIDENT & CEO OWEN SULLIVAN, COO ANDRE FERNANDEZ, EVP & CFO October 30, 2018
NOTES TO INVESTORS FORWARD-LOOKING STATEMENTS. Comments made during this conference call and in these materials contain forward- looking statements. Statements that describe or relate to NCR's plans, goals, intentions, strategies, or financial outlook, and statements that do not relate to historical or current fact, are examples of forward-looking statements. The forward-looking statements in these materials include statements about NCR’s full year 2018 financial guidance and the expected type and magnitude of the non-operational adjustments included in any forward-looking non-GAAP measures; NCR's manufacturing network redesign, efforts to alleviate supply chain constraints and their expected benefits; NCR’s ATM production rates and their expected impact on revenue; NCR's cloud revenue momentum; NCR's Mission One (M1) Services initiative and its expected benefits on NCR's services margin profile; expectations regarding ATM orders driving revenue in the fourth quarter of 2018; NCR's expected areas of focus to drive growth and create long-term stockholder value; completed and targeted mergers and acquisitions and their expected benefits; expectations for accelerating recurring revenue and predictability; NCR's cost savings program and its expected benefits in 2019 and the fourth quarter of 2018; share repurchase for dilution; and NCR's expected free cash flow generation and capital allocation strategy. Forward-looking statements are not guarantees of future performance, and there are a number of important factors that could cause actual outcomes and results to differ materially from the results contemplated by such forward-looking statements, including those factors listed in Item 1a "Risk Factors" of NCR's Annual Report on Form 10-K filed with the Securities and Exchange Commission (SEC) on February 26, 2018, and those factors detailed from time to time in NCR's other SEC reports. These materials are dated October 30, 2018, and NCR does not undertake any obligation to publicly update or revise any forward-looking statements, whether as a result of new information, future events or otherwise. NON-GAAP MEASURES. While NCR reports its results in accordance with generally accepted accounting principles in the United States (GAAP), comments made during this conference call and in these materials will include or make reference to certain "non-GAAP" measures, including: selected measures, such as period-over-period revenue growth, expressed on a constant currency basis, gross margin rate (non-GAAP), diluted earnings per share (non-GAAP), free cash flow (FCF), gross margin (non-GAAP), free cash flow as a percentage of non-GAAP net income (or free cash flow conversion rate), net debt, adjusted EBITDA, the ratio of net debt to adjusted EBITDA, operating expenses (non-GAAP), operating income (non-GAAP), interest and other expense (non-GAAP), income tax expense (non-GAAP), effective income tax rate (non-GAAP), and net income (non-GAAP). These measures are included to provide additional useful information regarding NCR's financial results, and are not a substitute for their comparable GAAP measures. Explanations of these non- GAAP measures, and reconciliations of these non-GAAP measures to their directly comparable GAAP measures, are included in the accompanying "Supplementary Materials" and are available on the Investor Relations page of NCR's website at www.ncr.com. Descriptions of many of these non-GAAP measures are also included in NCR's SEC reports. USE OF CERTAIN TERMS. As used in these materials, (i) the term "recurring revenue" means the sum of cloud, hardware maintenance and software maintenance revenue, (ii) the term “net annual contract value” or “net ACV” for any particular period means NCR’s net bookings for cloud revenue during the period, and is calculated as twelve months of expected subscription revenues under new cloud contracts during such period less twelve months of subscription revenues under cloud contracts that expired or were terminated during such period, adjusted for twelve months of expected pricing discounts or price increases from renewals of existing contracts, and (iii) the term "CC" means constant currency. These presentation materials and the associated remarks made during this conference call are integrally related and are intended to be presented and understood together. 2

OVERVIEW RECURRING REVENUE up 2% including Cloud revenue up 6% Services continued MARGIN EXPANSION Executing TARGETED M&A strategy ALLEVIATING supply chain constraints Addressing EXECUTION challenges Announcing program to drive $100m of SAVINGS 3
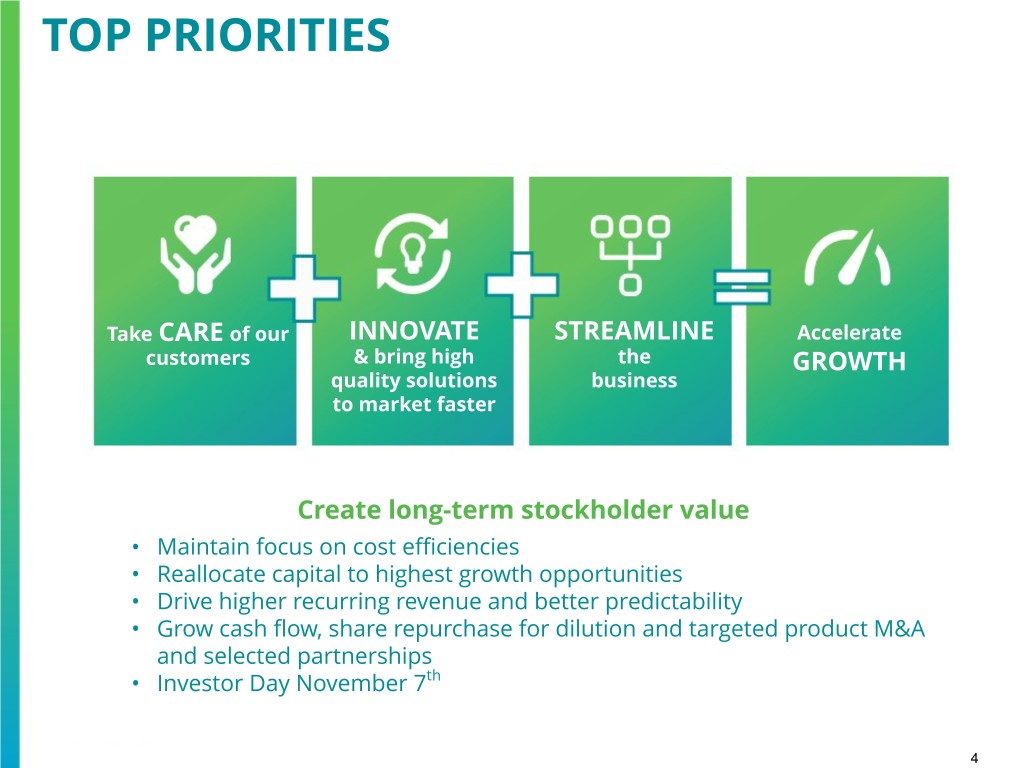
TOP PRIORITIES Take CARE of our INNOVATE STREAMLINE Accelerate customers & bring high the GROWTH quality solutions business to market faster Create long-term stockholder value • Maintain focus on cost efficiencies • Reallocate capital to highest growth opportunities • Drive higher recurring revenue and better predictability • Grow cash flow, share repurchase for dilution and targeted product M&A and selected partnerships • Investor Day November 7th 4
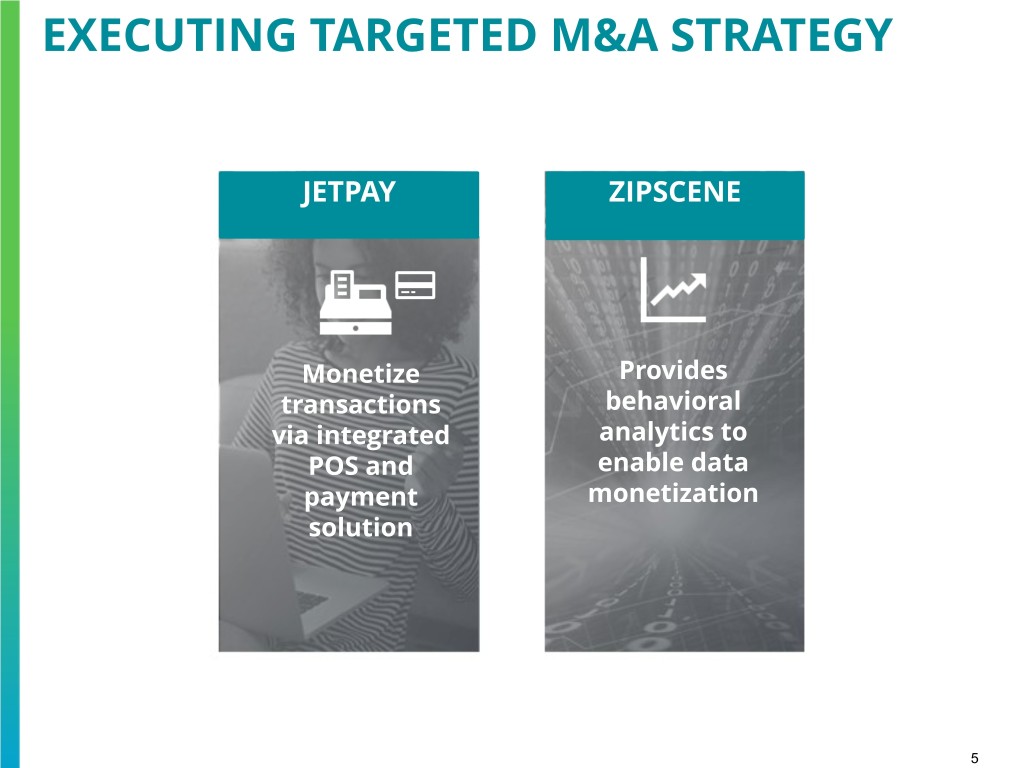
EXECUTING TARGETED M&A STRATEGY JETPAY ZIPSCENE Monetize Provides transactions behavioral via integrated analytics to POS and enable data payment monetization solution 5

MANUFACTURING NETWORK REDESIGN PROGRESS New centrally Contract Increasing Closed located manufacturing global manufacturing distribution production utilization plant in Beijing center to ramp rates and with two maximize optimizing additional supply chain supply chain facilities to logistics flow network close by year- end 6
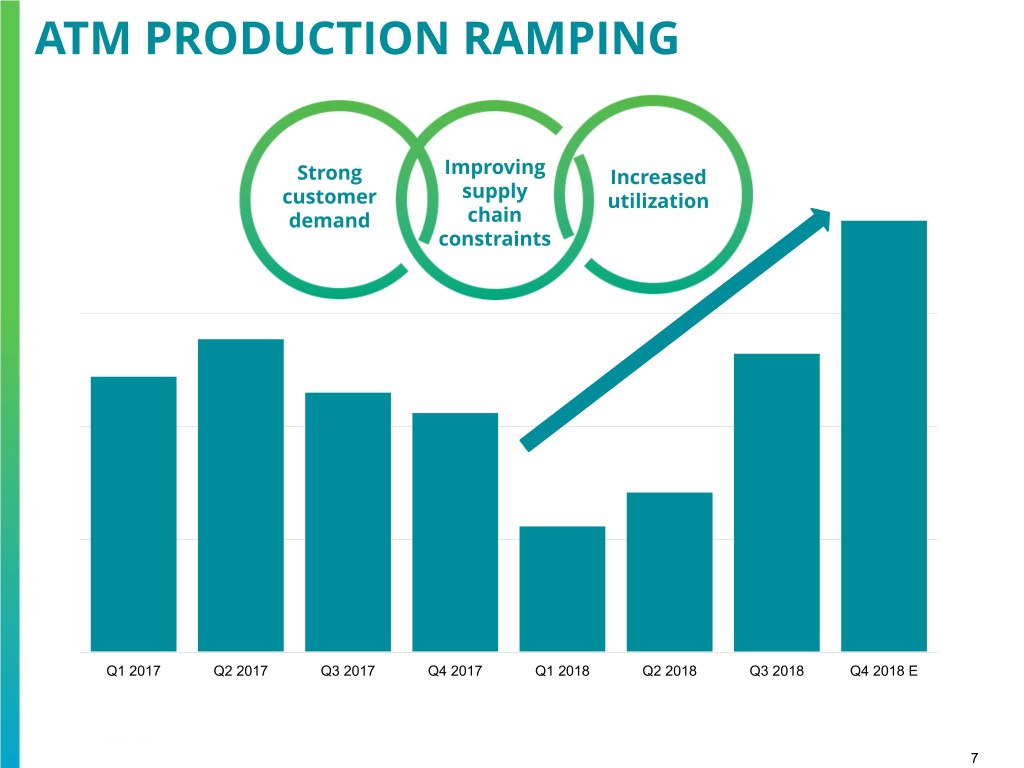
ATM PRODUCTION RAMPING Improving Strong Increased supply customer utilization demand chain constraints Q1 2017 Q2 2017 Q3 2017 Q4 2017 Q1 2018 Q2 2018 Q3 2018 Q4 2018 E 7
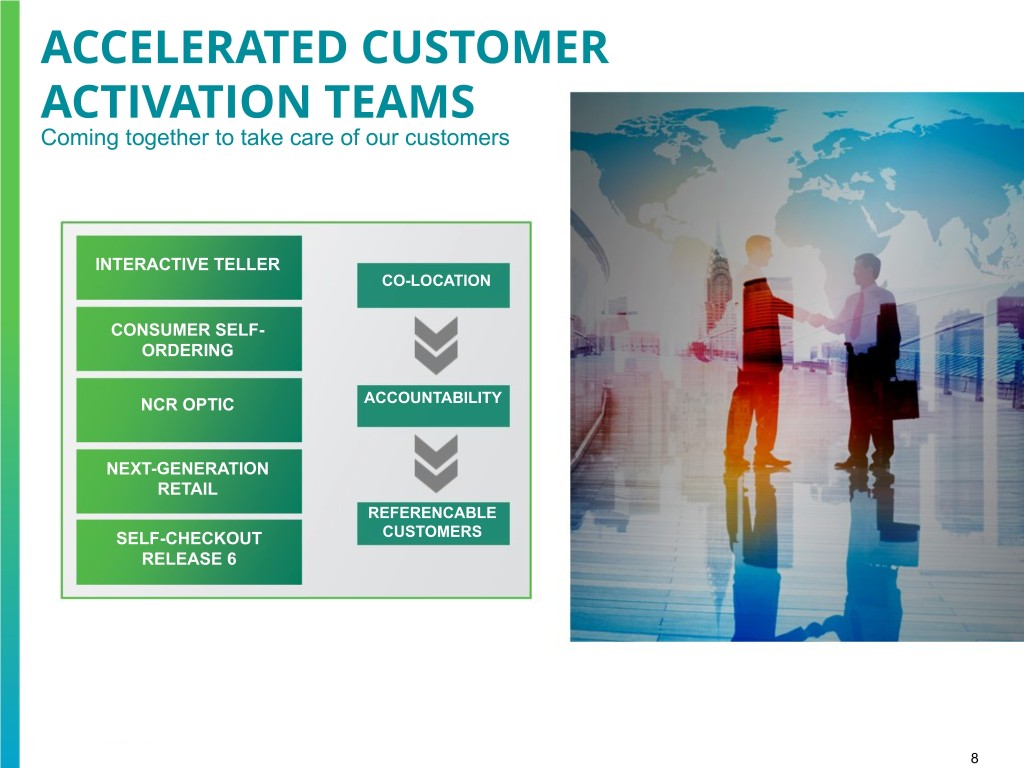
ACCELERATED CUSTOMER ACTIVATION TEAMS Coming together to take care of our customers INTERACTIVE TELLER CO-LOCATION CONSUMER SELF- ORDERING NCR OPTIC ACCOUNTABILITY NEXT-GENERATION RETAIL REFERENCABLE SELF-CHECKOUT CUSTOMERS RELEASE 6 8
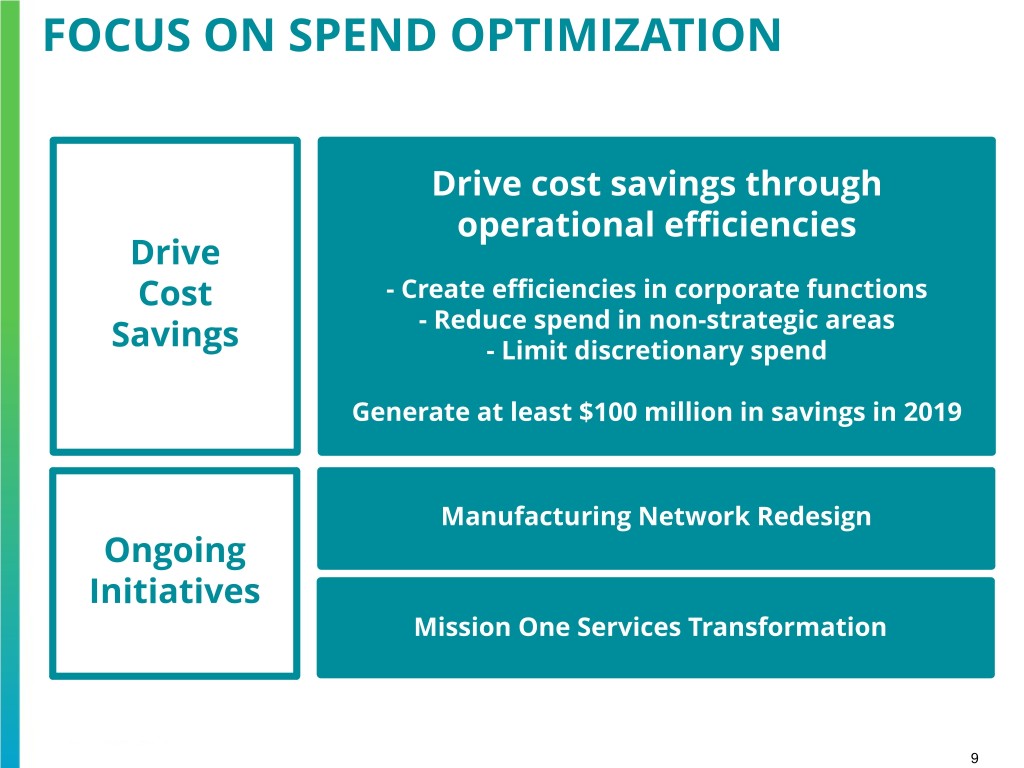
FOCUS ON SPEND OPTIMIZATION Drive cost savings through operational efficiencies Drive Cost - Create efficiencies in corporate functions - Reduce spend in non-strategic areas Savings - Limit discretionary spend Generate at least $100 million in savings in 2019 Manufacturing Network Redesign Ongoing Initiatives Mission One Services Transformation 9

Q3 2018 FINANCIAL RESULTS Non-GAAP Gross Revenue Margin Rate FX FX (10) ($32) million bps $1.66 $1.55 29.2% 27.4% billion billion Q3 2017 Q3 2018 Q3 2017 Q3 2018 Revenue down 7% as reported and down 5% CC; Non-GAAP gross margin rate down 180 bps as Recurring revenue up 2%, 48% of total revenue reported and down 170 bps CC Non-GAAP Diluted EPS Free Cash Flow FX ($0.03) $48 $0.93 ($22) $0.58 million million Q3 2017 Q3 2018 Q3 2017 Q3 2018 Non-GAAP Diluted EPS down 38% Free Cash Flow down due to lower earnings; as reported and down 36% CC Improvements expected in Q4 10
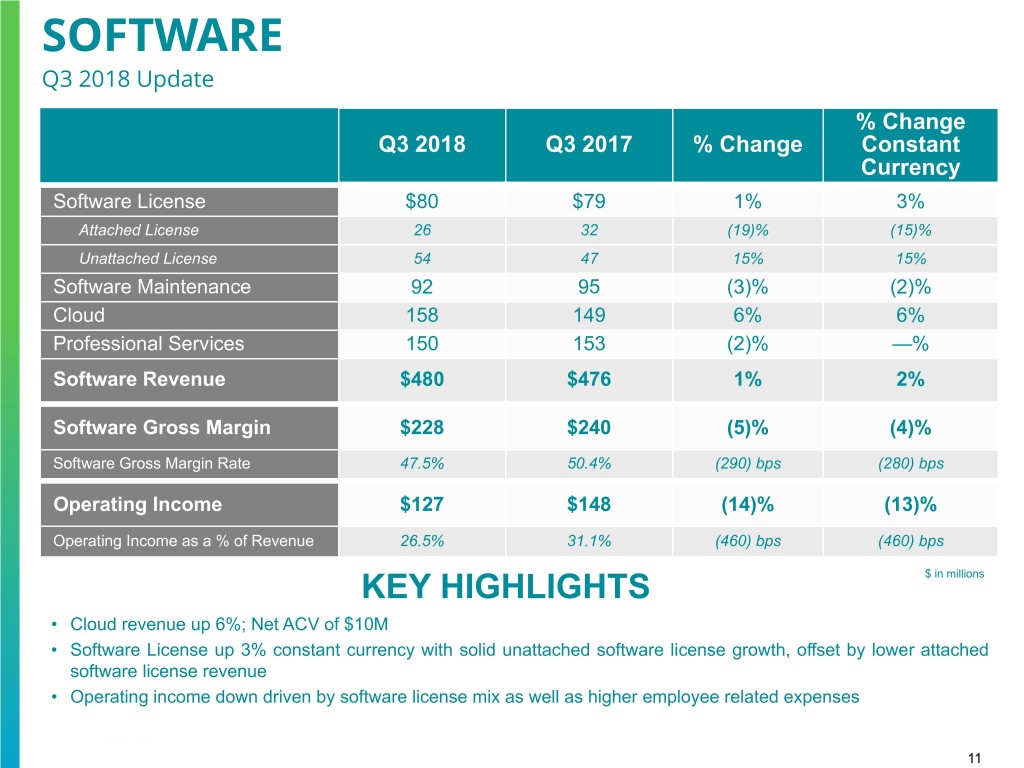
SOFTWARE Q3 2018 Update % Change Q3 2018 Q3 2017 % Change Constant Currency Software License $80 $79 1% 3% Attached License 26 32 (19)% (15)% Unattached License 54 47 15% 15% Software Maintenance 92 95 (3)% (2)% Cloud 158 149 6% 6% Professional Services 150 153 (2)% —% Software Revenue $480 $476 1% 2% Software Gross Margin $228 $240 (5)% (4)% Software Gross Margin Rate 47.5% 50.4% (290) bps (280) bps Operating Income $127 $148 (14)% (13)% Operating Income as a % of Revenue 26.5% 31.1% (460) bps (460) bps KEY HIGHLIGHTS $ in millions • Cloud revenue up 6%; Net ACV of $10M • Software License up 3% constant currency with solid unattached software license growth, offset by lower attached software license revenue • Operating income down driven by software license mix as well as higher employee related expenses 11
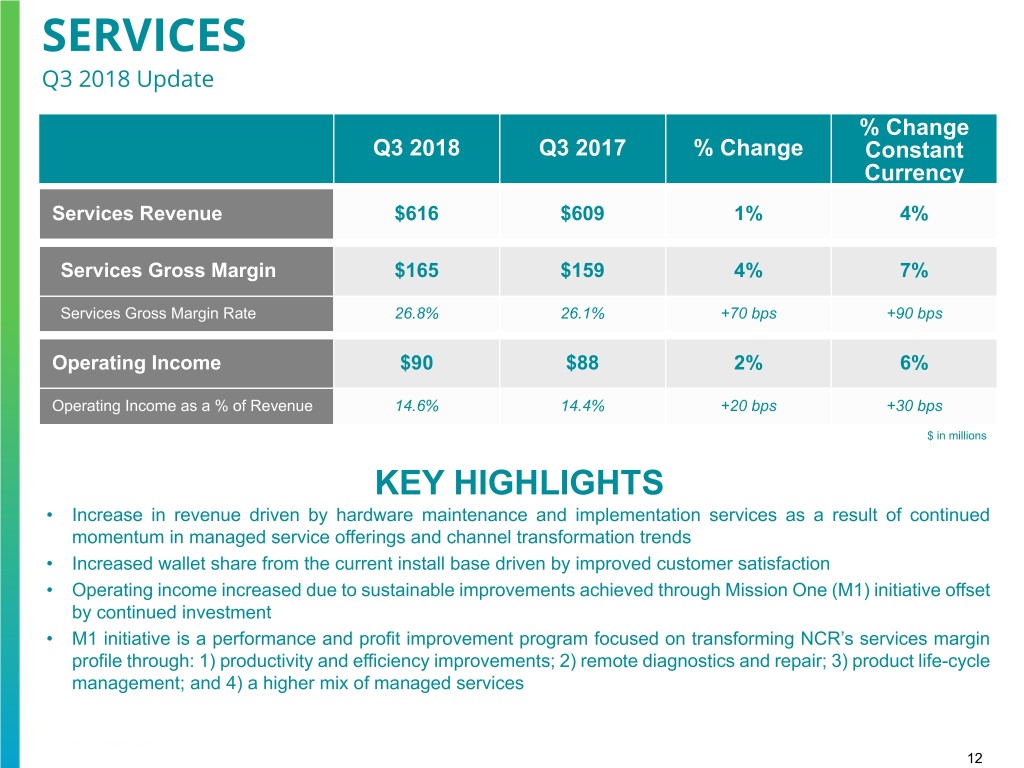
SERVICES Q3 2018 Update % Change Q3 2018 Q3 2017 % Change Constant Currency Services Revenue $616 $609 1% 4% Services Gross Margin $165 $159 4% 7% Services Gross Margin Rate 26.8% 26.1% +70 bps +90 bps Operating Income $90 $88 2% 6% Operating Income as a % of Revenue 14.6% 14.4% +20 bps +30 bps $ in millions KEY HIGHLIGHTS • Increase in revenue driven by hardware maintenance and implementation services as a result of continued momentum in managed service offerings and channel transformation trends • Increased wallet share from the current install base driven by improved customer satisfaction • Operating income increased due to sustainable improvements achieved through Mission One (M1) initiative offset by continued investment • M1 initiative is a performance and profit improvement program focused on transforming NCR’s services margin profile through: 1) productivity and efficiency improvements; 2) remote diagnostics and repair; 3) product life-cycle management; and 4) a higher mix of managed services 12
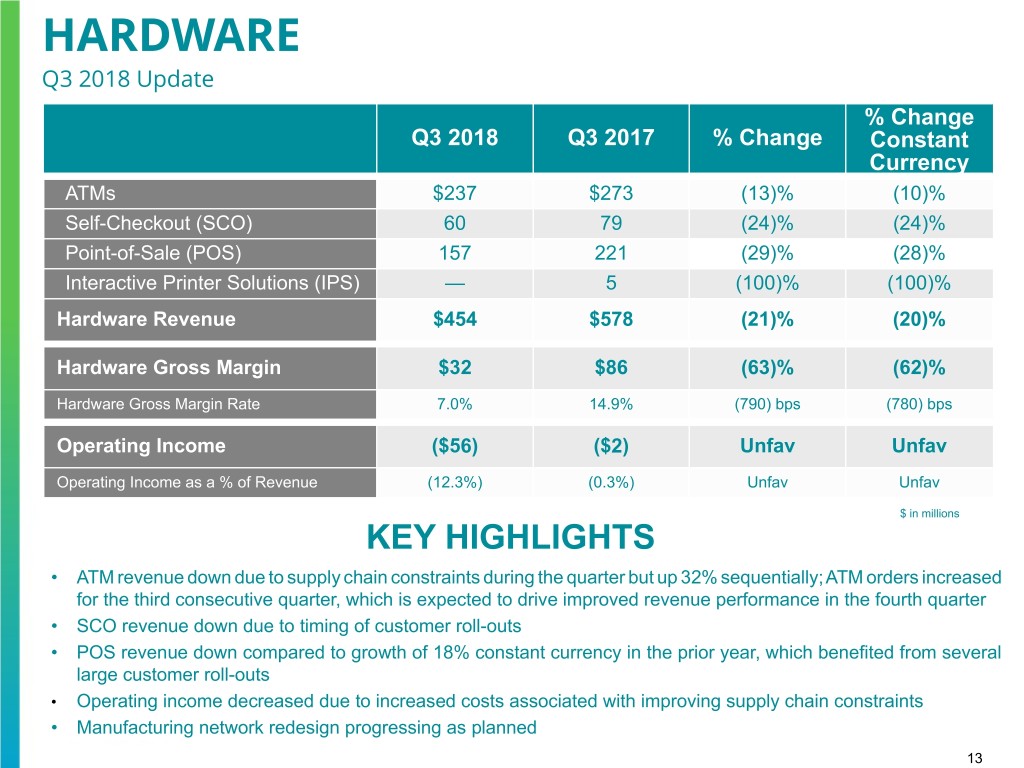
HARDWARE Q3 2018 Update % Change Q3 2018 Q3 2017 % Change Constant Currency ATMs $237 $273 (13)% (10)% Self-Checkout (SCO) 60 79 (24)% (24)% Point-of-Sale (POS) 157 221 (29)% (28)% Interactive Printer Solutions (IPS) — 5 (100)% (100)% Hardware Revenue $454 $578 (21)% (20)% Hardware Gross Margin $32 $86 (63)% (62)% Hardware Gross Margin Rate 7.0% 14.9% (790) bps (780) bps Operating Income ($56) ($2) Unfav Unfav Operating Income as a % of Revenue (12.3%) (0.3%) Unfav Unfav $ in millions KEY HIGHLIGHTS • ATM revenue down due to supply chain constraints during the quarter but up 32% sequentially; ATM orders increased for the third consecutive quarter, which is expected to drive improved revenue performance in the fourth quarter • SCO revenue down due to timing of customer roll-outs • POS revenue down compared to growth of 18% constant currency in the prior year, which benefited from several large customer roll-outs • Operating income decreased due to increased costs associated with improving supply chain constraints • Manufacturing network redesign progressing as planned 13
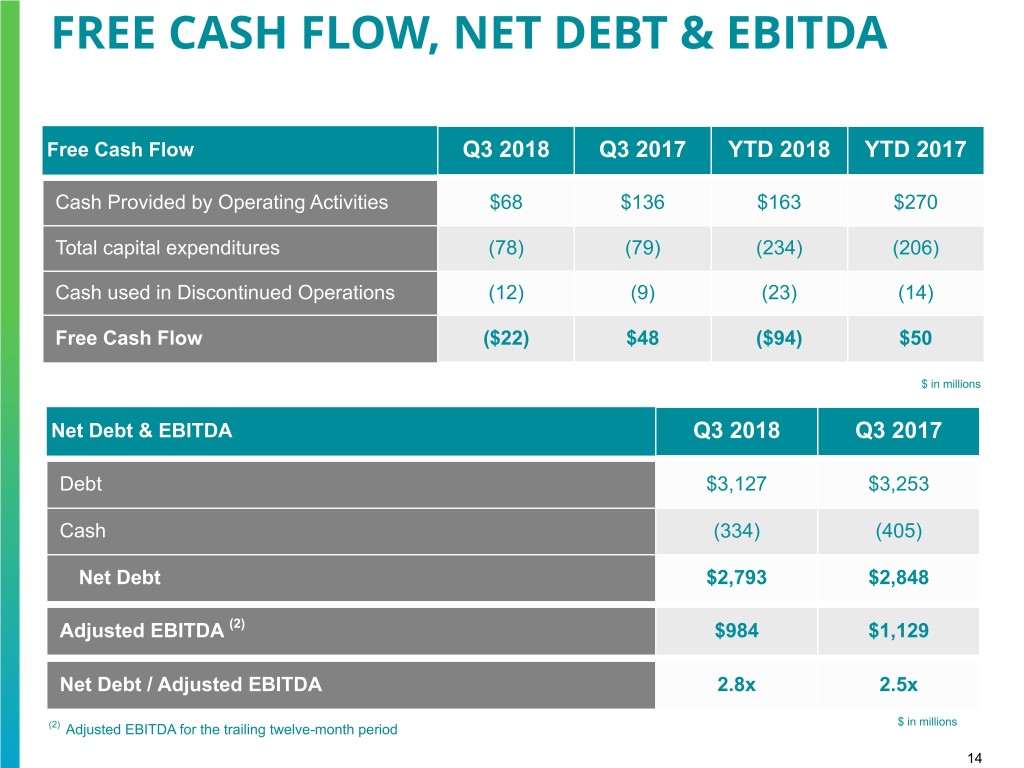
FREE CASH FLOW, NET DEBT & EBITDA Free Cash Flow Q3 2018 Q3 2017 YTD 2018 YTD 2017 Cash Provided by Operating Activities $68 $136 $163 $270 Total capital expenditures (78) (79) (234) (206) Cash used in Discontinued Operations (12) (9) (23) (14) Free Cash Flow ($22) $48 ($94) $50 $ in millions Net Debt & EBITDA Q3 2018 Q3 2017 Debt $3,127 $3,253 Cash (334) (405) Net Debt $2,793 $2,848 Adjusted EBITDA (2) $984 $1,129 Net Debt / Adjusted EBITDA 2.8x 2.5x $ in millions (2) Adjusted EBITDA for the trailing twelve-month period 14
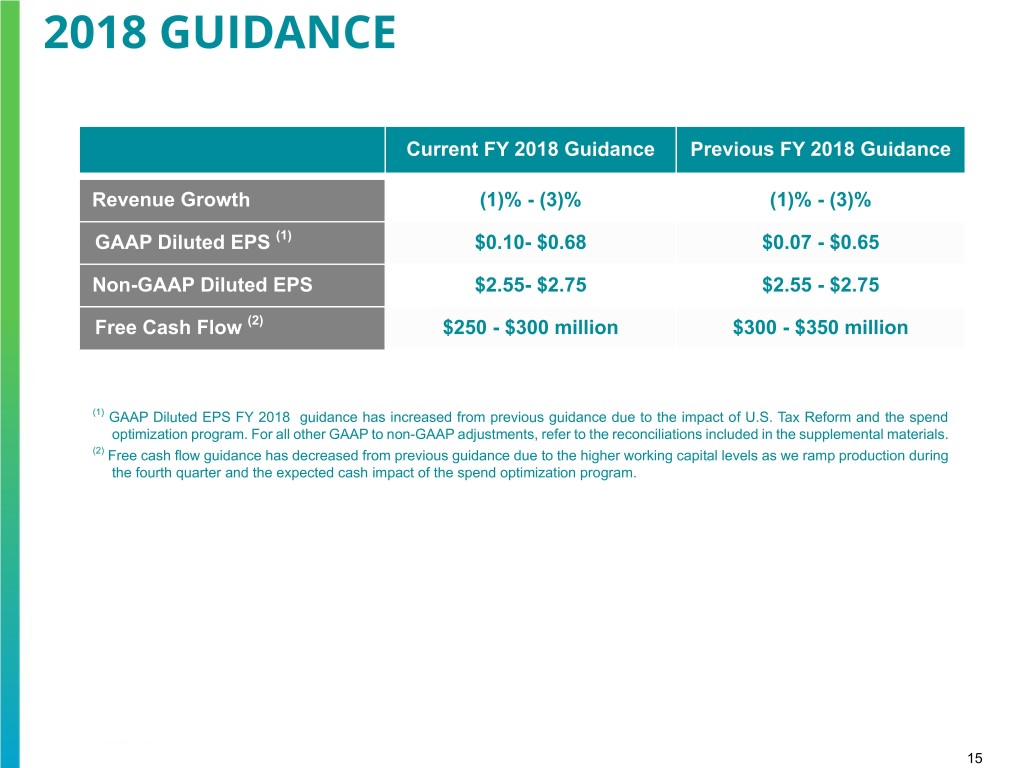
2018 GUIDANCE Current FY 2018 Guidance Previous FY 2018 Guidance Revenue Growth (1)% - (3)% (1)% - (3)% GAAP Diluted EPS (1) $0.10- $0.68 $0.07 - $0.65 Non-GAAP Diluted EPS $2.55- $2.75 $2.55 - $2.75 Free Cash Flow (2) $250 - $300 million $300 - $350 million (1) GAAP Diluted EPS FY 2018 guidance has increased from previous guidance due to the impact of U.S. Tax Reform and the spend optimization program. For all other GAAP to non-GAAP adjustments, refer to the reconciliations included in the supplemental materials. (2) Free cash flow guidance has decreased from previous guidance due to the higher working capital levels as we ramp production during the fourth quarter and the expected cash impact of the spend optimization program. 15
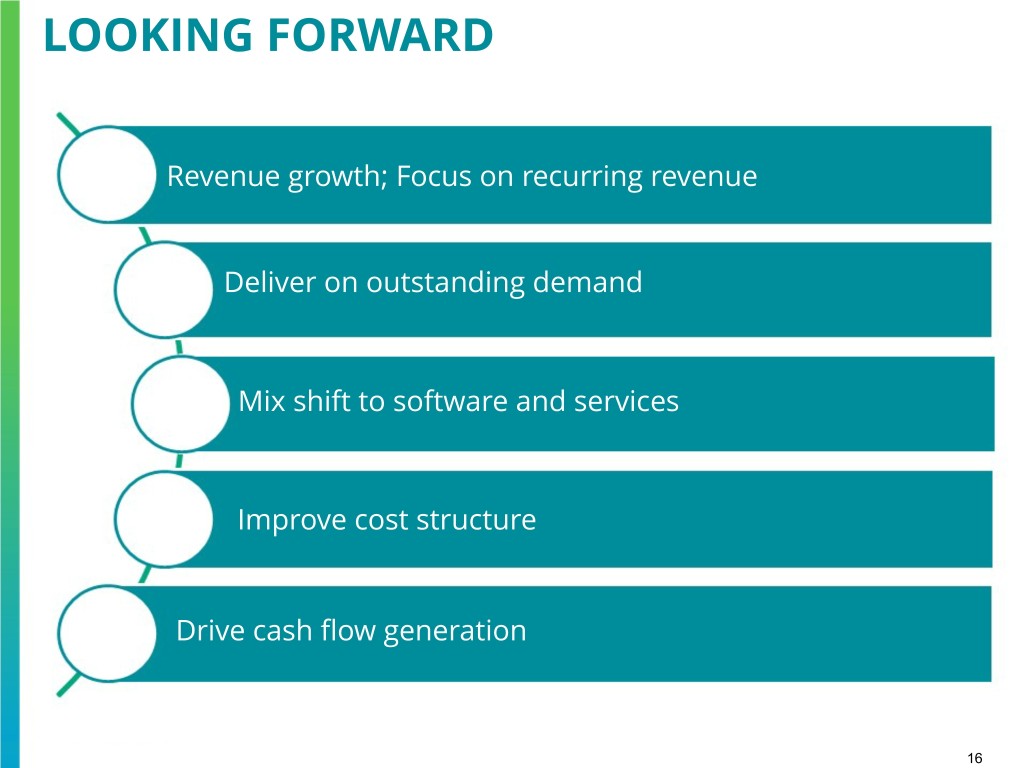
LOOKING FORWARD Revenue growth; Focus on recurring revenue Deliver on outstanding demand Mix shift to software and services Improve cost structure Drive cash flow generation 16

SUPPLEMENTARY MATERIALS 17
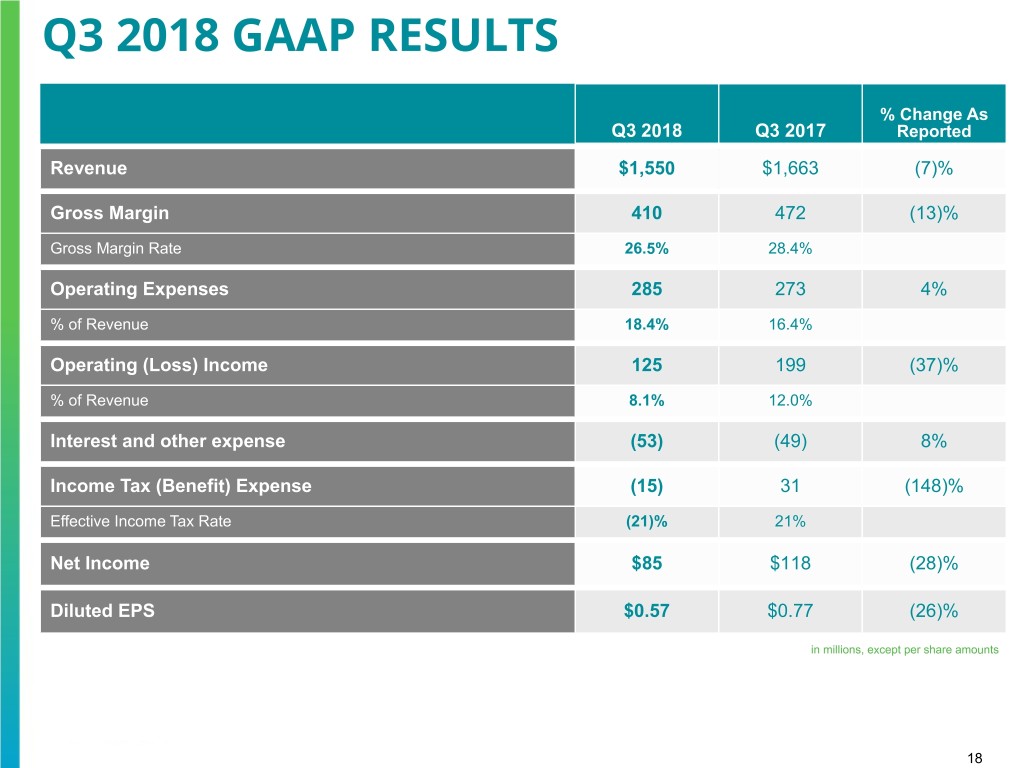
Q3 2018 GAAP RESULTS % Change As Q3 2018 Q3 2017 Reported Revenue $1,550 $1,663 (7)% Gross Margin 410 472 (13)% Gross Margin Rate 26.5% 28.4% Operating Expenses 285 273 4% % of Revenue 18.4% 16.4% Operating (Loss) Income 125 199 (37)% % of Revenue 8.1% 12.0% Interest and other expense (53) (49) 8% Income Tax (Benefit) Expense (15) 31 (148)% Effective Income Tax Rate (21)% 21% Net Income $85 $118 (28)% Diluted EPS $0.57 $0.77 (26)% in millions, except per share amounts 18

Q3 2018 OPERATIONAL RESULTS % Change % Change As Constant Q3 2018 Q3 2017 Reported Currency Revenue $1,550 $1,663 (7)% (5)%(1) Gross Margin (non-GAAP) 425 485 (12)% (10)% Gross Margin Rate (non-GAAP) 27.4% 29.2% (180) bps (170) bps Operating Expenses (non-GAAP) 264 251 5% 7% % of Revenue 17.0% 15.1% Operating Income (non-GAAP) 161 234 (31)% (30)% % of Revenue 10.4% 14.1% (370) bps (360) bps Interest and other expense (non-GAAP) (53) (49) 8% 7% Income Tax Expense (non-GAAP) 20 41 (51)% Effective Income Tax Rate (non-GAAP) 19% 22% Net Income (non-GAAP) $86 $143 (40)% (38)% Diluted EPS (non-GAAP) (2) $0.58 $0.93 (38)% (36)% in millions, except per share amounts (1) The impact of foreign currency was $32 million unfavorable in Q3 2018. (2) Q3 2018 includes $0.03 of foreign currency headwind on EPS. Diluted share count of 149.3 million in Q3 2018 and 153.1 million in Q3 2017. 19
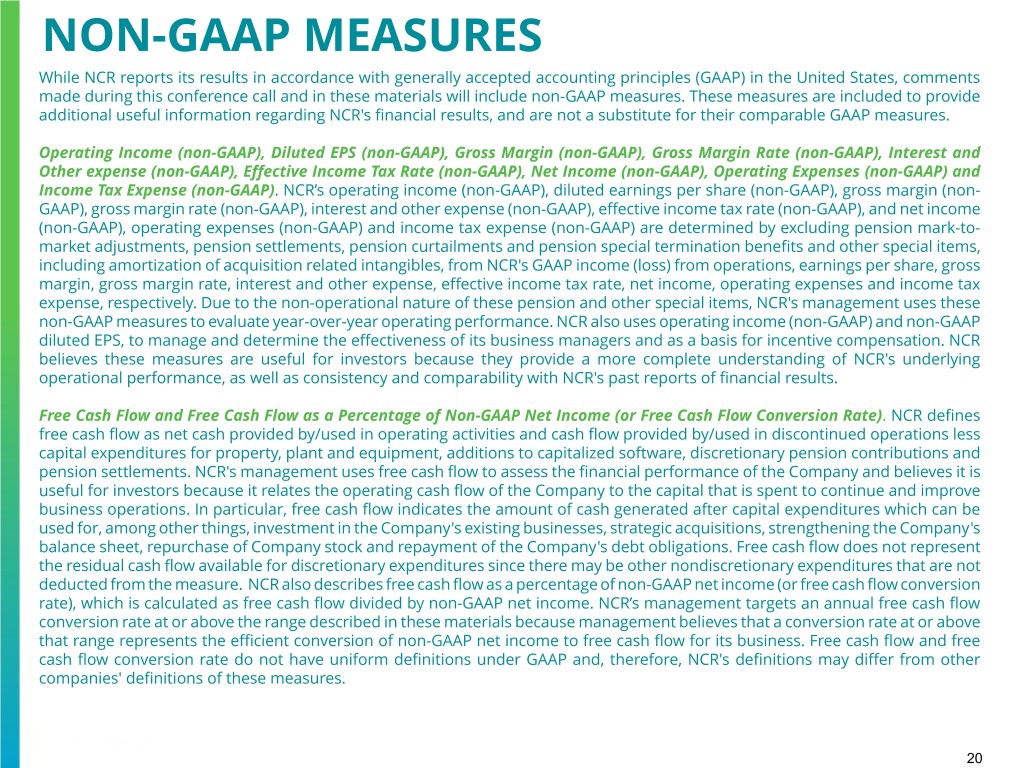
NON-GAAP MEASURES While NCR reports its results in accordance with generally accepted accounting principles (GAAP) in the United States, comments made during this conference call and in these materials will include non-GAAP measures. These measures are included to provide additional useful information regarding NCR's financial results, and are not a substitute for their comparable GAAP measures. Operating Income (non-GAAP), Diluted EPS (non-GAAP), Gross Margin (non-GAAP), Gross Margin Rate (non-GAAP), Interest and Other expense (non-GAAP), Effective Income Tax Rate (non-GAAP), Net Income (non-GAAP), Operating Expenses (non-GAAP) and Income Tax Expense (non-GAAP). NCR’s operating income (non-GAAP), diluted earnings per share (non-GAAP), gross margin (non- GAAP), gross margin rate (non-GAAP), interest and other expense (non-GAAP), effective income tax rate (non-GAAP), and net income (non-GAAP), operating expenses (non-GAAP) and income tax expense (non-GAAP) are determined by excluding pension mark-to- market adjustments, pension settlements, pension curtailments and pension special termination benefits and other special items, including amortization of acquisition related intangibles, from NCR's GAAP income (loss) from operations, earnings per share, gross margin, gross margin rate, interest and other expense, effective income tax rate, net income, operating expenses and income tax expense, respectively. Due to the non-operational nature of these pension and other special items, NCR's management uses these non-GAAP measures to evaluate year-over-year operating performance. NCR also uses operating income (non-GAAP) and non-GAAP diluted EPS, to manage and determine the effectiveness of its business managers and as a basis for incentive compensation. NCR believes these measures are useful for investors because they provide a more complete understanding of NCR's underlying operational performance, as well as consistency and comparability with NCR's past reports of financial results. Free Cash Flow and Free Cash Flow as a Percentage of Non-GAAP Net Income (or Free Cash Flow Conversion Rate). NCR defines free cash flow as net cash provided by/used in operating activities and cash flow provided by/used in discontinued operations less capital expenditures for property, plant and equipment, additions to capitalized software, discretionary pension contributions and pension settlements. NCR's management uses free cash flow to assess the financial performance of the Company and believes it is useful for investors because it relates the operating cash flow of the Company to the capital that is spent to continue and improve business operations. In particular, free cash flow indicates the amount of cash generated after capital expenditures which can be used for, among other things, investment in the Company's existing businesses, strategic acquisitions, strengthening the Company's balance sheet, repurchase of Company stock and repayment of the Company's debt obligations. Free cash flow does not represent the residual cash flow available for discretionary expenditures since there may be other nondiscretionary expenditures that are not deducted from the measure. NCR also describes free cash flow as a percentage of non-GAAP net income (or free cash flow conversion rate), which is calculated as free cash flow divided by non-GAAP net income. NCR’s management targets an annual free cash flow conversion rate at or above the range described in these materials because management believes that a conversion rate at or above that range represents the efficient conversion of non-GAAP net income to free cash flow for its business. Free cash flow and free cash flow conversion rate do not have uniform definitions under GAAP and, therefore, NCR's definitions may differ from other companies' definitions of these measures. 20
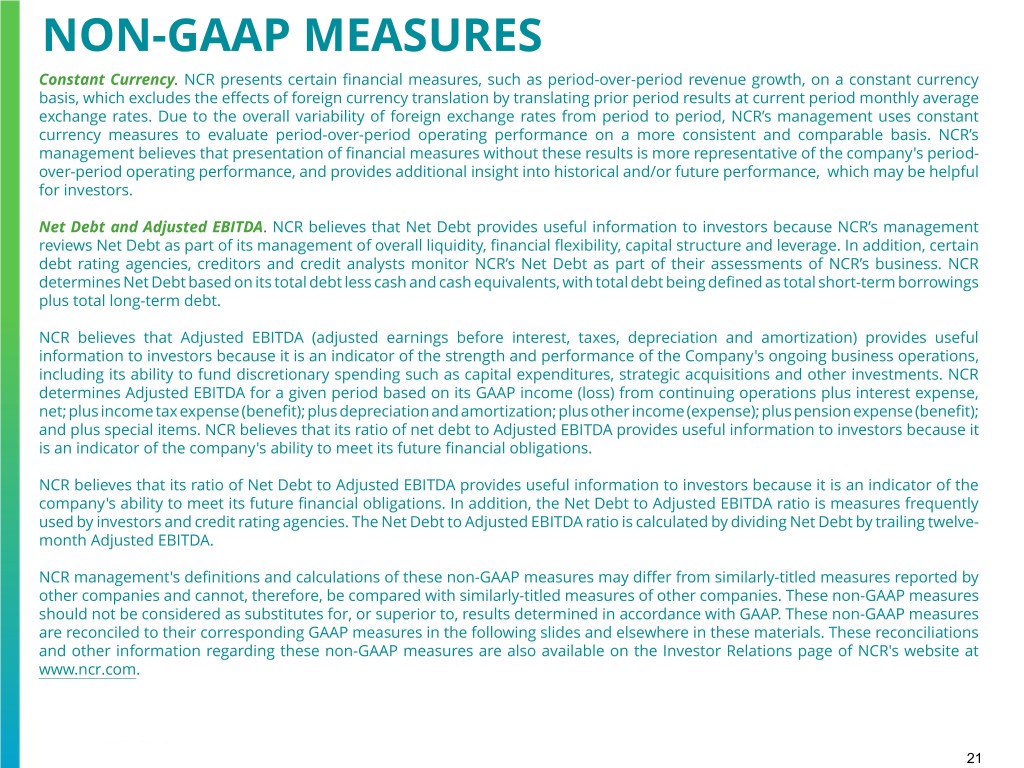
NON-GAAP MEASURES Constant Currency. NCR presents certain financial measures, such as period-over-period revenue growth, on a constant currency basis, which excludes the effects of foreign currency translation by translating prior period results at current period monthly average exchange rates. Due to the overall variability of foreign exchange rates from period to period, NCR’s management uses constant currency measures to evaluate period-over-period operating performance on a more consistent and comparable basis. NCR’s management believes that presentation of financial measures without these results is more representative of the company's period- over-period operating performance, and provides additional insight into historical and/or future performance, which may be helpful for investors. Net Debt and Adjusted EBITDA. NCR believes that Net Debt provides useful information to investors because NCR’s management reviews Net Debt as part of its management of overall liquidity, financial flexibility, capital structure and leverage. In addition, certain debt rating agencies, creditors and credit analysts monitor NCR’s Net Debt as part of their assessments of NCR’s business. NCR determines Net Debt based on its total debt less cash and cash equivalents, with total debt being defined as total short-term borrowings plus total long-term debt. NCR believes that Adjusted EBITDA (adjusted earnings before interest, taxes, depreciation and amortization) provides useful information to investors because it is an indicator of the strength and performance of the Company's ongoing business operations, including its ability to fund discretionary spending such as capital expenditures, strategic acquisitions and other investments. NCR determines Adjusted EBITDA for a given period based on its GAAP income (loss) from continuing operations plus interest expense, net; plus income tax expense (benefit); plus depreciation and amortization; plus other income (expense); plus pension expense (benefit); and plus special items. NCR believes that its ratio of net debt to Adjusted EBITDA provides useful information to investors because it is an indicator of the company's ability to meet its future financial obligations. NCR believes that its ratio of Net Debt to Adjusted EBITDA provides useful information to investors because it is an indicator of the company's ability to meet its future financial obligations. In addition, the Net Debt to Adjusted EBITDA ratio is measures frequently used by investors and credit rating agencies. The Net Debt to Adjusted EBITDA ratio is calculated by dividing Net Debt by trailing twelve- month Adjusted EBITDA. NCR management's definitions and calculations of these non-GAAP measures may differ from similarly-titled measures reported by other companies and cannot, therefore, be compared with similarly-titled measures of other companies. These non-GAAP measures should not be considered as substitutes for, or superior to, results determined in accordance with GAAP. These non-GAAP measures are reconciled to their corresponding GAAP measures in the following slides and elsewhere in these materials. These reconciliations and other information regarding these non-GAAP measures are also available on the Investor Relations page of NCR's website at www.ncr.com. 21
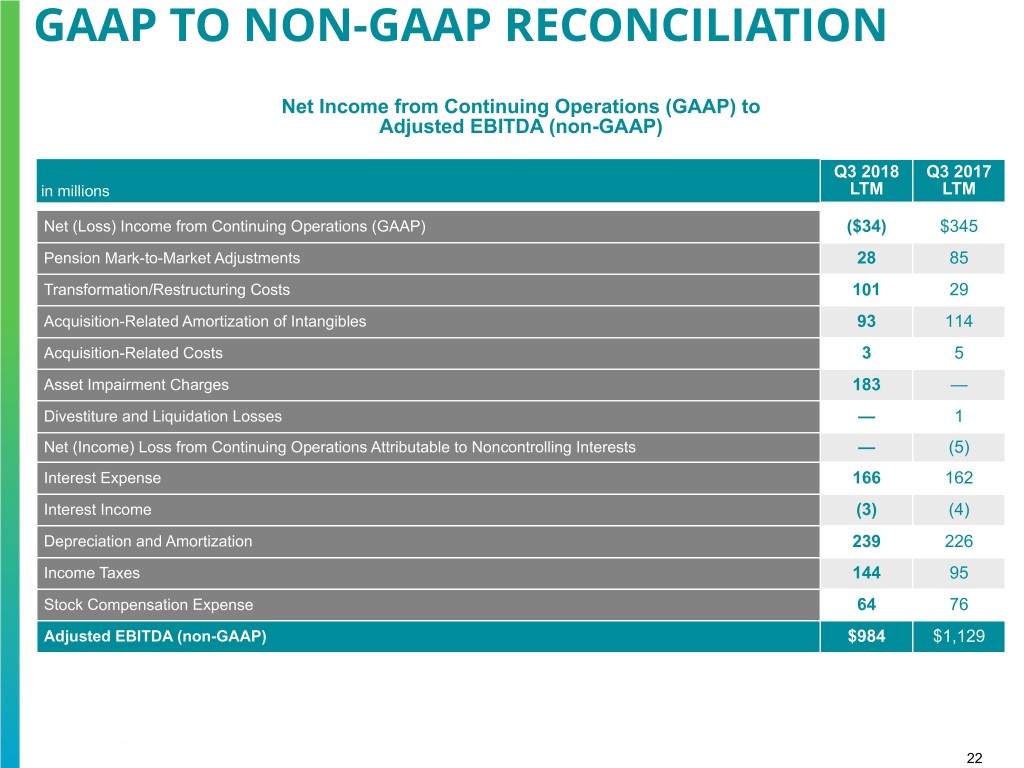
GAAP TO NON-GAAP RECONCILIATION Net Income from Continuing Operations (GAAP) to Adjusted EBITDA (non-GAAP) Q3 2018 Q3 2017 in millions LTM LTM Net (Loss) Income from Continuing Operations (GAAP) ($34) $345 Pension Mark-to-Market Adjustments 28 85 Transformation/Restructuring Costs 101 29 Acquisition-Related Amortization of Intangibles 93 114 Acquisition-Related Costs 3 5 Asset Impairment Charges 183 — Divestiture and Liquidation Losses — 1 Net (Income) Loss from Continuing Operations Attributable to Noncontrolling Interests — (5) Interest Expense 166 162 Interest Income (3) (4) Depreciation and Amortization 239 226 Income Taxes 144 95 Stock Compensation Expense 64 76 Adjusted EBITDA (non-GAAP) $984 $1,129 22
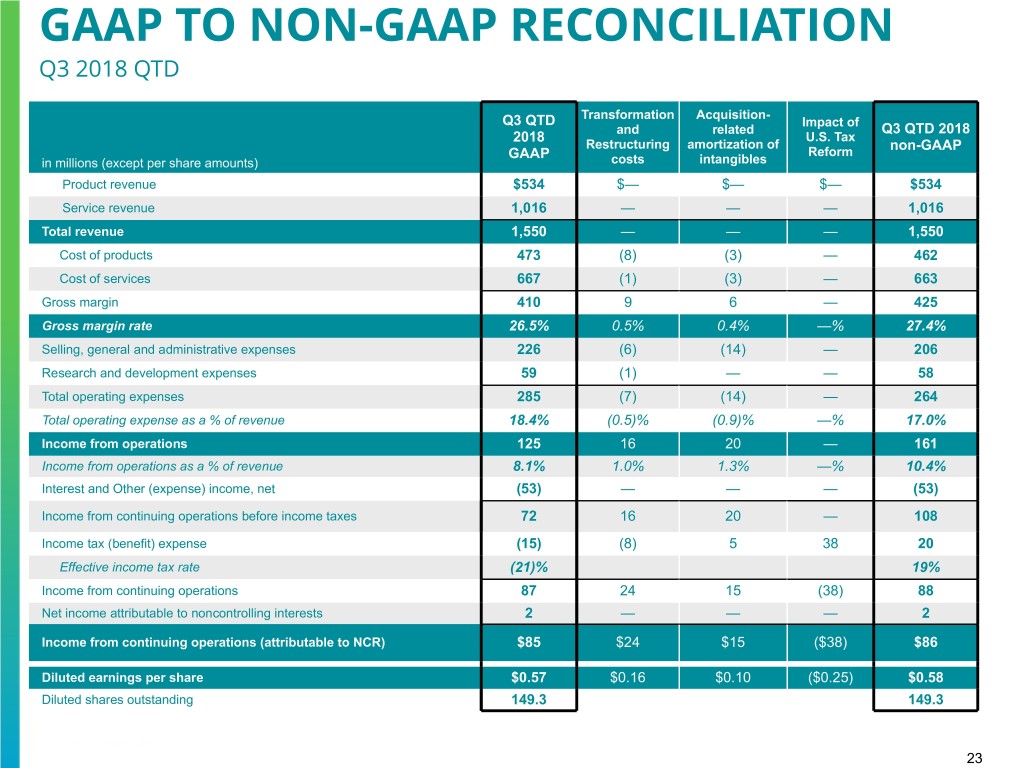
GAAP TO NON-GAAP RECONCILIATION Q3 2018 QTD Transformation Acquisition- Q3 QTD Impact of and related Q3 QTD 2018 2018 U.S. Tax Restructuring amortization of non-GAAP GAAP Reform in millions (except per share amounts) costs intangibles Product revenue $534 $— $— $— $534 Service revenue 1,016 — — — 1,016 Total revenue 1,550 — — — 1,550 Cost of products 473 (8) (3) — 462 Cost of services 667 (1) (3) — 663 Gross margin 410 9 6 — 425 Gross margin rate 26.5% 0.5% 0.4% —% 27.4% Selling, general and administrative expenses 226 (6) (14) — 206 Research and development expenses 59 (1) — — 58 Total operating expenses 285 (7) (14) — 264 Total operating expense as a % of revenue 18.4% (0.5)% (0.9)% —% 17.0% Income from operations 125 16 20 — 161 Income from operations as a % of revenue 8.1% 1.0% 1.3% —% 10.4% Interest and Other (expense) income, net (53) — — — (53) Income from continuing operations before income taxes 72 16 20 — 108 Income tax (benefit) expense (15) (8) 5 38 20 Effective income tax rate (21)% 19% Income from continuing operations 87 24 15 (38) 88 Net income attributable to noncontrolling interests 2 — — — 2 Income from continuing operations (attributable to NCR) $85 $24 $15 ($38) $86 Diluted earnings per share $0.57 $0.16 $0.10 ($0.25) $0.58 Diluted shares outstanding 149.3 149.3 23
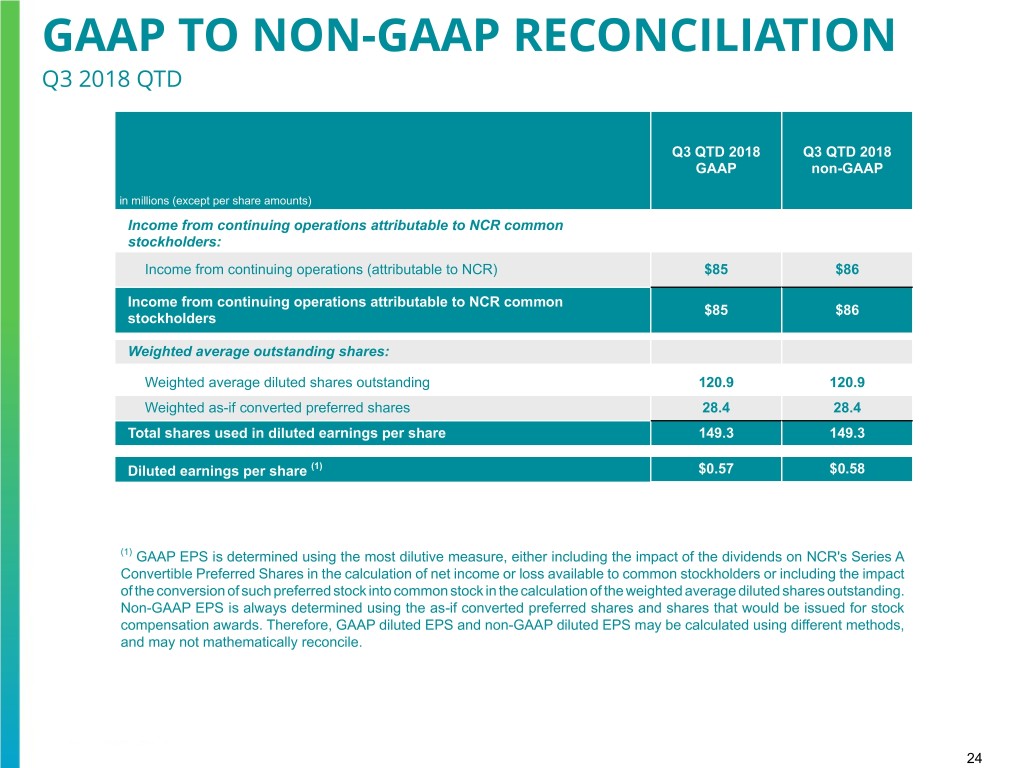
GAAP TO NON-GAAP RECONCILIATION Q3 2018 QTD Q3 QTD 2018 Q3 QTD 2018 GAAP non-GAAP in millions (except per share amounts) Income from continuing operations attributable to NCR common stockholders: Income from continuing operations (attributable to NCR) $85 $86 Income from continuing operations attributable to NCR common $85 $86 stockholders Weighted average outstanding shares: Weighted average diluted shares outstanding 120.9 120.9 Weighted as-if converted preferred shares 28.4 28.4 Total shares used in diluted earnings per share 149.3 149.3 Diluted earnings per share (1) $0.57 $0.58 (1) GAAP EPS is determined using the most dilutive measure, either including the impact of the dividends on NCR's Series A Convertible Preferred Shares in the calculation of net income or loss available to common stockholders or including the impact of the conversion of such preferred stock into common stock in the calculation of the weighted average diluted shares outstanding. Non-GAAP EPS is always determined using the as-if converted preferred shares and shares that would be issued for stock compensation awards. Therefore, GAAP diluted EPS and non-GAAP diluted EPS may be calculated using different methods, and may not mathematically reconcile. 24

GAAP TO NON-GAAP RECONCILIATION Q3 2017 QTD Acquisition- Acquisition- Q3 QTD 2017 Transformation related Q3 QTD 2017 related Costs amortization of GAAP costs non-GAAP intangibles in millions (except per share amounts) Product revenue $657 $— $— $— $657 Service revenue 1,006 — — — 1,006 Total revenue 1,663 — — — 1,663 Cost of products 528 — (6) — 522 Cost of services 663 (1) (6) — 656 Gross margin 472 1 12 — 485 Gross margin rate 28.4% 0.1% 0.7% —% 29.2% Selling, general and administrative expenses 220 (3) (17) (1) 199 Research and development expenses 53 (1) — — 52 Total expenses 273 (4) (17) (1) 251 Total expense as a % of revenue 16.4% (0.2)% (1.0)% (0.1)% 15.1% Income from operations 199 5 29 1 234 Income from operations as a % of revenue 12.0% 0.3% 1.7% 0.1% 14.1% Interest and Other (expense) income, net (49) — — — (49) Income from continuing operations before income taxes 150 5 29 1 185 Income tax expense 31 1 9 — 41 Effective income tax rate 21% 22% Income from continuing operations 119 4 20 1 144 Net income attributable to noncontrolling interests 1 — — — 1 Income from continuing operations (attributable to NCR) $118 $4 $20 $1 $143 Diluted (loss) earnings per share $0.77 $0.02 $0.13 $0.01 $0.93 Diluted shares outstanding 153.1 153.1 25
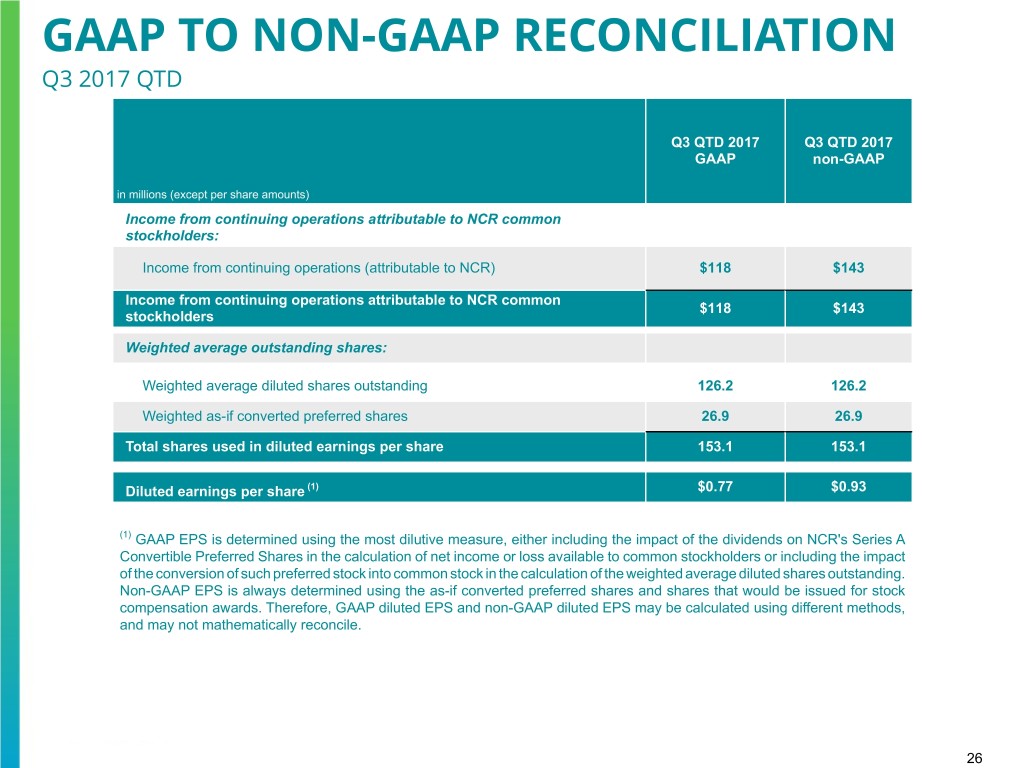
GAAP TO NON-GAAP RECONCILIATION Q3 2017 QTD Q3 QTD 2017 Q3 QTD 2017 GAAP non-GAAP in millions (except per share amounts) Income from continuing operations attributable to NCR common stockholders: Income from continuing operations (attributable to NCR) $118 $143 Income from continuing operations attributable to NCR common $118 $143 stockholders Weighted average outstanding shares: Weighted average diluted shares outstanding 126.2 126.2 Weighted as-if converted preferred shares 26.9 26.9 Total shares used in diluted earnings per share 153.1 153.1 Diluted earnings per share (1) $0.77 $0.93 (1) GAAP EPS is determined using the most dilutive measure, either including the impact of the dividends on NCR's Series A Convertible Preferred Shares in the calculation of net income or loss available to common stockholders or including the impact of the conversion of such preferred stock into common stock in the calculation of the weighted average diluted shares outstanding. Non-GAAP EPS is always determined using the as-if converted preferred shares and shares that would be issued for stock compensation awards. Therefore, GAAP diluted EPS and non-GAAP diluted EPS may be calculated using different methods, and may not mathematically reconcile. 26
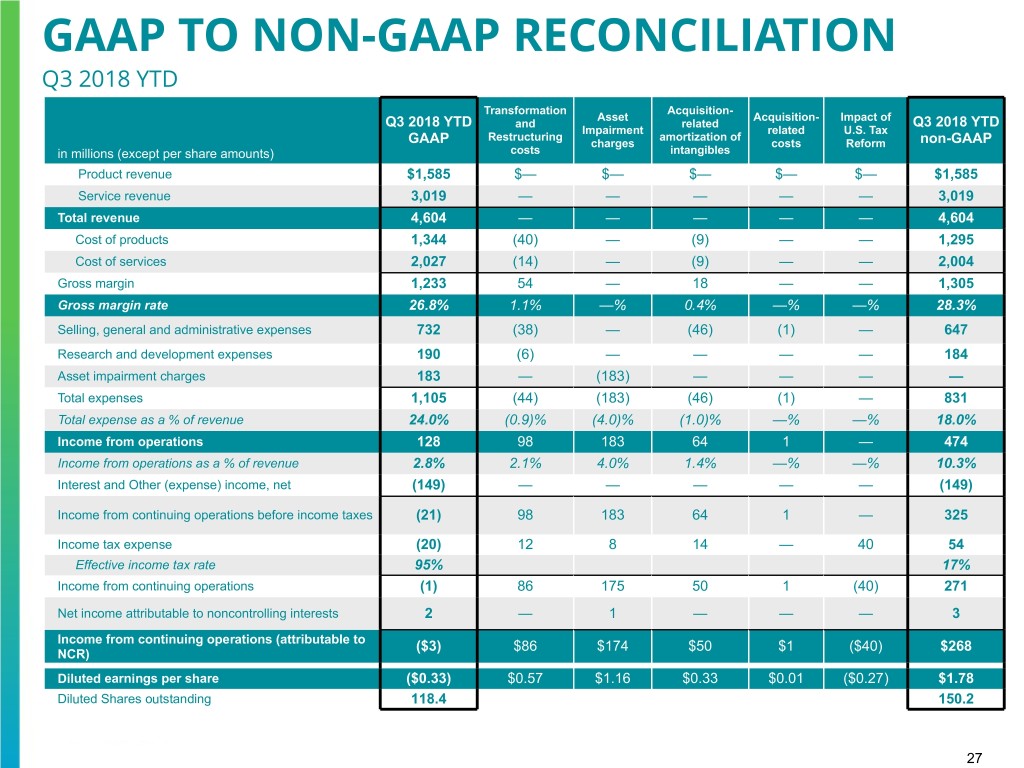
GAAP TO NON-GAAP RECONCILIATION Q3 2018 YTD Transformation Acquisition- Asset Acquisition- Impact of Q3 2018 YTD and related Q3 2018 YTD Impairment related U.S. Tax Restructuring amortization of GAAP charges costs Reform non-GAAP in millions (except per share amounts) costs intangibles Product revenue $1,585 $— $— $— $— $— $1,585 Service revenue 3,019 — — — — — 3,019 Total revenue 4,604 — — — — — 4,604 Cost of products 1,344 (40) — (9) — — 1,295 Cost of services 2,027 (14) — (9) — — 2,004 Gross margin 1,233 54 — 18 — — 1,305 Gross margin rate 26.8% 1.1% —% 0.4% —% —% 28.3% Selling, general and administrative expenses 732 (38) — (46) (1) — 647 Research and development expenses 190 (6) — — — — 184 Asset impairment charges 183 — (183) — — — — Total expenses 1,105 (44) (183) (46) (1) — 831 Total expense as a % of revenue 24.0% (0.9)% (4.0)% (1.0)% —% —% 18.0% Income from operations 128 98 183 64 1 — 474 Income from operations as a % of revenue 2.8% 2.1% 4.0% 1.4% —% —% 10.3% Interest and Other (expense) income, net (149) — — — — — (149) Income from continuing operations before income taxes (21) 98 183 64 1 — 325 Income tax expense (20) 12 8 14 — 40 54 Effective income tax rate 95% 17% Income from continuing operations (1) 86 175 50 1 (40) 271 Net income attributable to noncontrolling interests 2 — 1 — — — 3 Income from continuing operations (attributable to ($3) $86 $174 $50 $1 ($40) $268 NCR) Diluted earnings per share ($0.33) $0.57 $1.16 $0.33 $0.01 ($0.27) $1.78 Diluted Shares outstanding 118.4 150.2 27
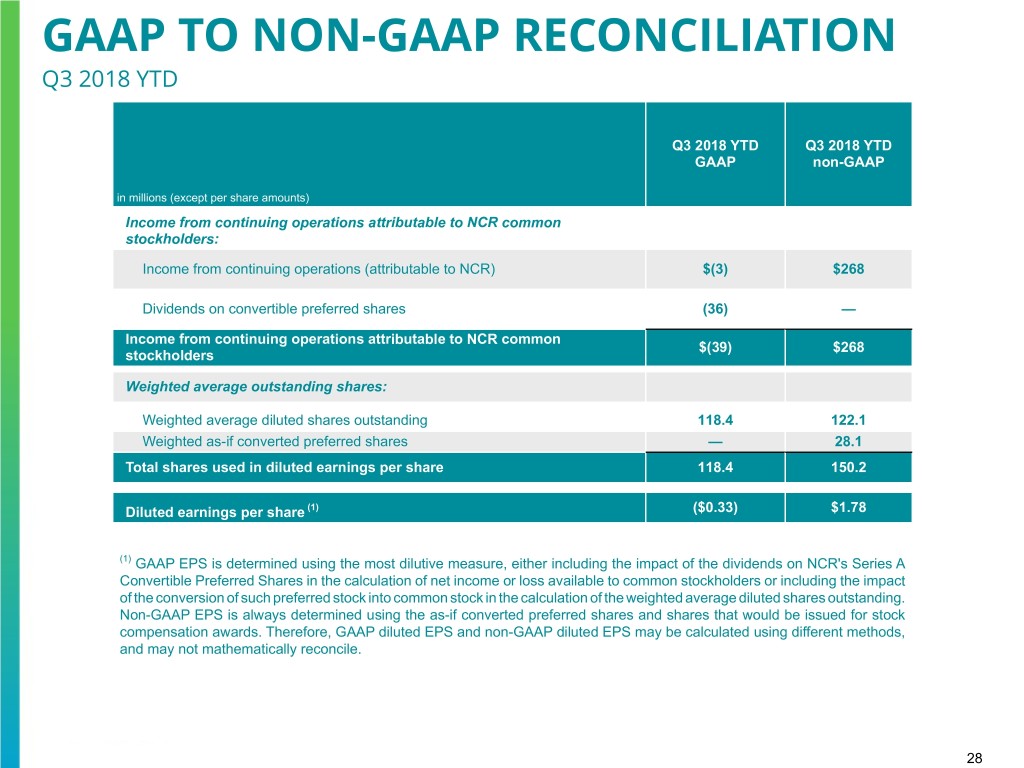
GAAP TO NON-GAAP RECONCILIATION Q3 2018 YTD Q3 2018 YTD Q3 2018 YTD GAAP non-GAAP in millions (except per share amounts) Income from continuing operations attributable to NCR common stockholders: Income from continuing operations (attributable to NCR) $(3) $268 Dividends on convertible preferred shares (36) — Income from continuing operations attributable to NCR common $(39) $268 stockholders Weighted average outstanding shares: Weighted average diluted shares outstanding 118.4 122.1 Weighted as-if converted preferred shares — 28.1 Total shares used in diluted earnings per share 118.4 150.2 Diluted earnings per share (1) ($0.33) $1.78 (1) GAAP EPS is determined using the most dilutive measure, either including the impact of the dividends on NCR's Series A Convertible Preferred Shares in the calculation of net income or loss available to common stockholders or including the impact of the conversion of such preferred stock into common stock in the calculation of the weighted average diluted shares outstanding. Non-GAAP EPS is always determined using the as-if converted preferred shares and shares that would be issued for stock compensation awards. Therefore, GAAP diluted EPS and non-GAAP diluted EPS may be calculated using different methods, and may not mathematically reconcile. 28

GAAP TO NON-GAAP RECONCILIATION Q3 2017 YTD Acquisition- Acquisition- Q3 2017 YTD Transformation related Q3 2017 YTD related costs amortization GAAP costs non-GAAP in millions (except per share amounts) of intangibles Product revenue $1,829 $— $— $— $1,829 Service revenue 2,905 — — — 2,905 Total revenue 4,734 — — — 4,734 Cost of products 1,430 (2) (19) — 1,409 Cost of services 1,959 (9) (18) — 1,932 Gross margin 1,345 11 37 — 1,393 Gross margin rate 28.4% 0.3% 0.8% —% 29.4% Selling, general and administrative expenses 678 (10) (49) (3) 616 Research and development expenses 178 (5) — — 173 Total expenses 856 (15) (49) (3) 789 Total expense as a % of revenue 18.1% (0.3)% (1.0)% (0.1)% 16.7% Income from operations 489 26 86 3 604 Income from operations as a % of revenue 10.3% 0.5% 1.8% 0.1% 12.8% Interest and Other (expense) income, net (138) — — — (138) Income from continuing operations before income taxes 351 26 86 3 466 Income tax expense 78 7 27 1 113 Effective income tax rate 22% 24% Income from continuing operations 273 19 59 2 353 Net income attributable to noncontrolling interests 1 — — — 1 Income from continuing operations (attributable to NCR) $272 $19 $59 $2 $352 Diluted earnings per share $1.37 $0.12 $0.38 $0.01 $2.28 Diluted Shares outstanding 126.9 154.2 29

GAAP TO NON-GAAP RECONCILIATION Q3 2017 YTD Q3 2017 YTD Q3 2017 YTD GAAP non-GAAP in millions (except per share amounts) Income from continuing operations attributable to NCR common stockholders: Income from continuing operations (attributable to NCR) $272 $352 Dividends on convertible preferred shares (36) — Deemed dividend on modification of convertible preferred shares (4) — Deemed dividend on convertible preferred shares related to redemption value (58) — accretion Income from continuing operations attributable to NCR common $174 $352 stockholders Weighted average outstanding shares: Weighted average diluted shares outstanding 126.9 126.9 Weighted as-if converted preferred shares — 27.3 Total shares used in diluted earnings per share 126.9 154.2 Diluted earnings per share (1) $1.37 $2.28 (1) GAAP EPS is determined using the most dilutive measure, either including the impact of the dividends on NCR's Series A Convertible Preferred Shares in the calculation of net income or loss available to common stockholders or including the impact of the conversion of such preferred stock into common stock in the calculation of the weighted average diluted shares outstanding. Non-GAAP EPS is always determined using the as-if converted preferred shares and shares that would be issued for stock compensation awards. Therefore, GAAP diluted EPS and non-GAAP diluted EPS may be calculated using different methods, and may not mathematically reconcile. 30

GAAP TO NON-GAAP RECONCILIATION FY 2017 Acquisition- Acquisition- Pension mark- FY 2017 Transformation related Impact of U.S. FY 2017 related to-market Costs amortization Tax Reform GAAP costs adjustments non-GAAP in millions (except per share amounts) of intangibles Product revenue $2,579 $— $— $— $— $— $2,579 Service revenue 3,937 — — — — — 3,937 Total revenue 6,516 — — — — — 6,516 Cost of products 2,021 (2) (25) — — 1,994 Cost of services 2,639 (9) (25) — — 2,605 Gross margin 1,856 11 50 — — — 1,917 Gross margin rate 28.5% 0.1% 0.8% —% —% —% 29.4% Selling, general and administrative expenses 923 (14) (65) (5) — — 839 Research and development expenses 242 (4) — — — — 238 Total expenses 1,165 (18) (65) (5) — — 1,077 Total expense as a % of revenue 17.9% (0.3)% (1.0)% (0.1)% —% —% 16.5% Income from operations 691 29 115 5 — — 840 Income from operations as a % of revenue 10.6% 0.4% 1.8% 0.1% —% —% 12.9% Interest and Other (expense) income, net (209) — — — 28 — (181) Income from continuing operations before 482 29 115 5 28 — 659 income taxes Income tax expense (benefit) 242 9 36 2 3 (130) 162 Effective income tax rate 50% 25% Income from continuing operations 240 20 79 3 25 130 497 Net income attributable to noncontrolling 3 — — — — — 3 interests Income from continuing operations $237 $20 $79 $3 $25 $130 $494 (attributable to NCR) Diluted earnings per share $1.01 $0.13 $0.51 $0.02 $0.16 $0.84 $3.20 Diluted Shares outstanding 127.0 154.3 31

GAAP TO NON-GAAP RECONCILIATION FY 2017 FY 2017 FY 2017 GAAP non-GAAP in millions (except per share amounts) Income from continuing operations attributable to NCR common stockholders: Income from continuing operations (attributable to NCR) $237 $494 Dividends on convertible preferred shares (47) — Deemed dividend on modification of convertible preferred shares (4) — Deemed dividend on convertible preferred shares related to redemption value (58) — accretion Income from continuing operations attributable to NCR common $128 $494 stockholders Weighted average outstanding shares: Weighted average diluted shares outstanding 127.0 127.0 Weighted as-if converted preferred shares — 27.3 Total shares used in diluted earnings per share 127.0 154.3 Diluted earnings per share (1) $1.01 $3.20 (1) GAAP EPS is determined using the most dilutive measure, either including the impact of the dividends on NCR's Series A Convertible Preferred Shares in the calculation of net income or loss available to common stockholders or including the impact of the conversion of such preferred stock into common stock in the calculation of the weighted average diluted shares outstanding. Non-GAAP EPS is always determined using the as-if converted preferred shares and shares that would be issued for stock compensation awards. Therefore, GAAP diluted EPS and non-GAAP diluted EPS may be calculated using different methods, and may not mathematically reconcile. 32

GAAP TO NON-GAAP RECONCILIATION Q3 2018 QTD Gross Margin and Gross Margin Rate (non-GAAP) to Gross Margin and Gross Margin Rate (GAAP) Q3 2018 QTD Gross Margin Gross Margin Rate % Software 228 47.5% Services 165 26.8% Hardware 32 7.0% Total Gross Margin (non-GAAP) 425 27.4% Less: Transformation Costs 9 0.5% Acquisition-related amortization of intangibles 6 0.4% Total Gross Margin (GAAP) 410 26.5% 33
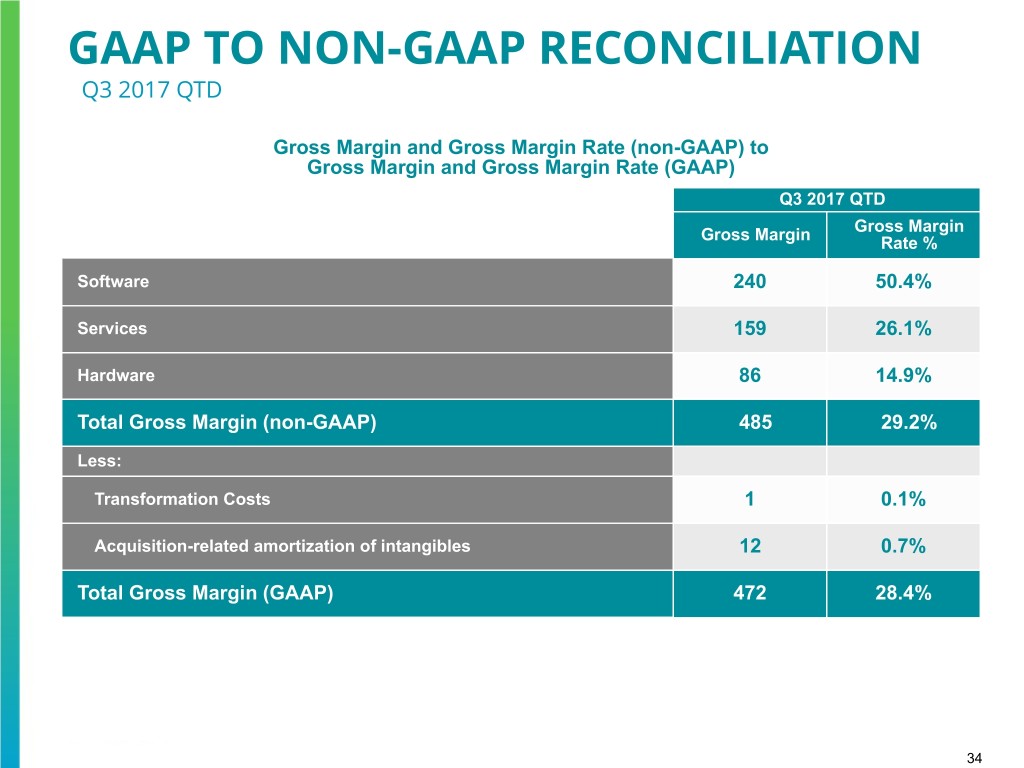
GAAP TO NON-GAAP RECONCILIATION Q3 2017 QTD Gross Margin and Gross Margin Rate (non-GAAP) to Gross Margin and Gross Margin Rate (GAAP) Q3 2017 QTD Gross Margin Gross Margin Rate % Software 240 50.4% Services 159 26.1% Hardware 86 14.9% Total Gross Margin (non-GAAP) 485 29.2% Less: Transformation Costs 1 0.1% Acquisition-related amortization of intangibles 12 0.7% Total Gross Margin (GAAP) 472 28.4% 34
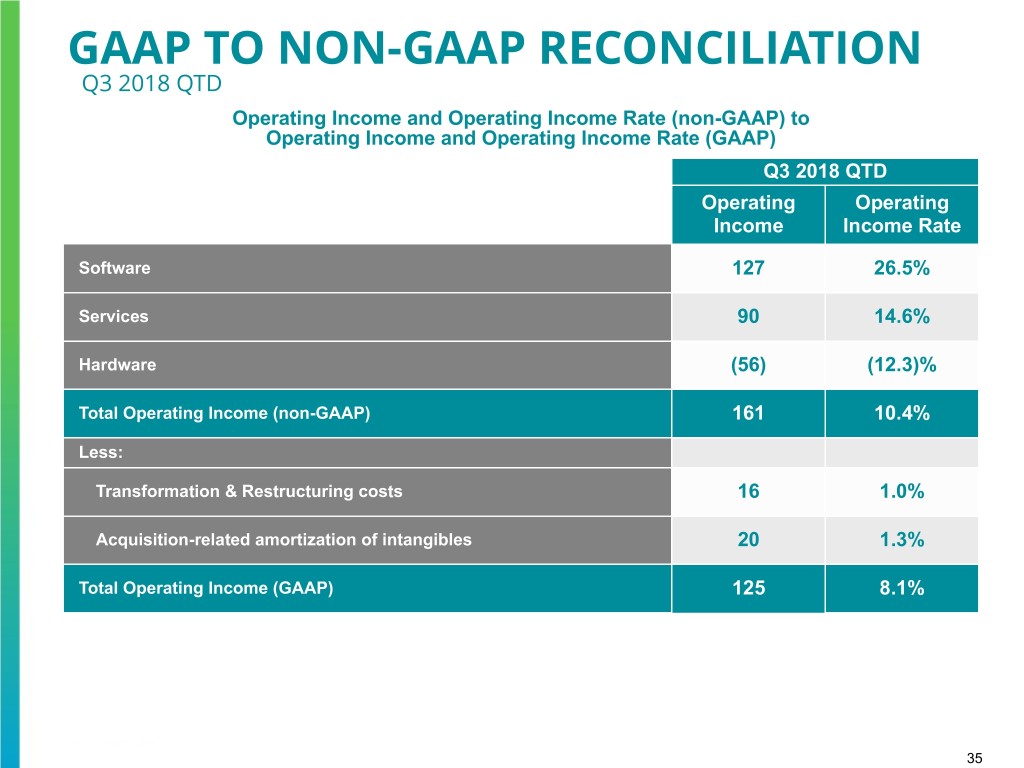
GAAP TO NON-GAAP RECONCILIATION Q3 2018 QTD Operating Income and Operating Income Rate (non-GAAP) to Operating Income and Operating Income Rate (GAAP) Q3 2018 QTD Operating Operating Income Income Rate Software 127 26.5% Services 90 14.6% Hardware (56) (12.3)% Total Operating Income (non-GAAP) 161 10.4% Less: Transformation & Restructuring costs 16 1.0% Acquisition-related amortization of intangibles 20 1.3% Total Operating Income (GAAP) 125 8.1% 35
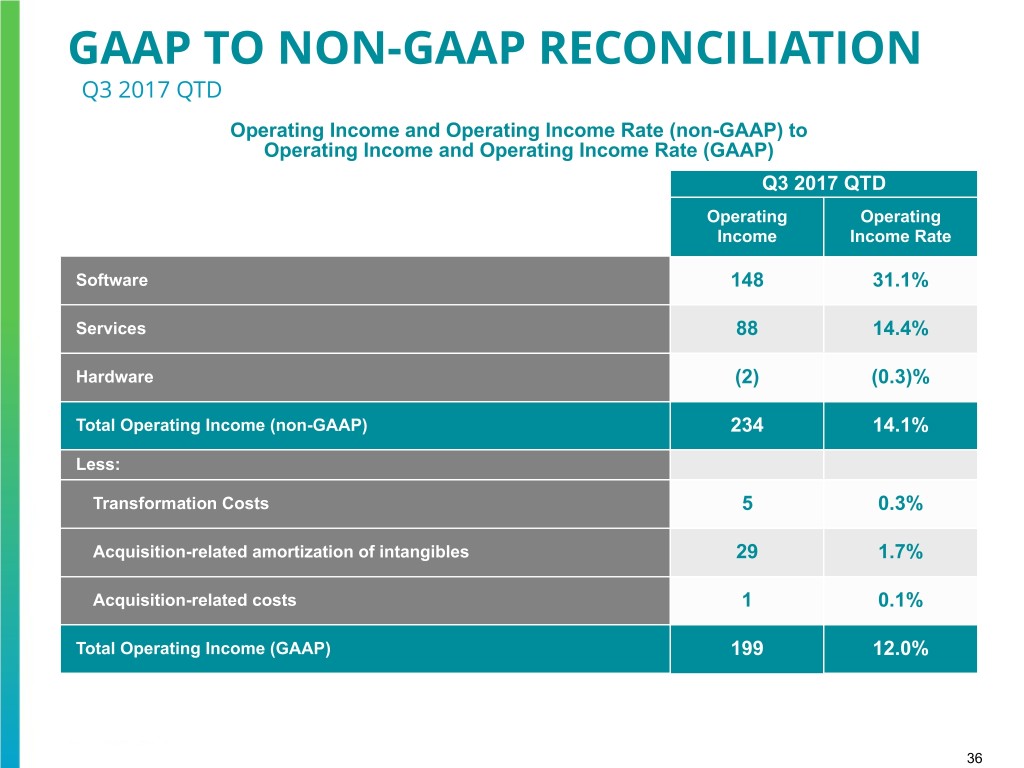
GAAP TO NON-GAAP RECONCILIATION Q3 2017 QTD Operating Income and Operating Income Rate (non-GAAP) to Operating Income and Operating Income Rate (GAAP) Q3 2017 QTD Operating Operating Income Income Rate Software 148 31.1% Services 88 14.4% Hardware (2) (0.3)% Total Operating Income (non-GAAP) 234 14.1% Less: Transformation Costs 5 0.3% Acquisition-related amortization of intangibles 29 1.7% Acquisition-related costs 1 0.1% Total Operating Income (GAAP) 199 12.0% 36

GAAP TO NON-GAAP RECONCILIATION Revenue Growth % (GAAP) to Revenue Growth Constant Currency % (non-GAAP) Q3 2018 QTD Revenue Growth Revenue Growth Favorable Constant % (GAAP) (unfavorable) FX Currency % impact (non-GAAP) Software License 1% (2)% 3% Attached License (19)% (4)% (15)% Unattached License 15% —% 15% Software Maintenance (3)% (1)% (2)% Cloud 6% —% 6% Professional Services (2)% (2)% —% Software 1% (1)% 2% Services 1% (3)% 4% ATMs (13)% (3)% (10)% Self-Checkout (SCO) (24)% —% (24)% Point-of-Sale (POS) (29)% (1)% (28)% Interactive Printer Solutions (IPS) (100)% —% (100)% Hardware (21)% (1)% (20)% Total Revenue (7)% (2)% (5)% 37

GAAP TO NON-GAAP RECONCILIATION Gross Margin Growth % (GAAP) to Gross Margin Growth % on a Constant Currency Basis (non-GAAP) Q3 2018 QTD Constant Gross Margin Favorable Currency Gross Growth % (unfavorable) FX Margin Growth % Reported impact (non-GAAP) Software (5)% (1)% (4)% Services 4% (3)% 7% Hardware (63)% (1)% (62)% Total Gross Margin (12)% (2)% (10)% 38
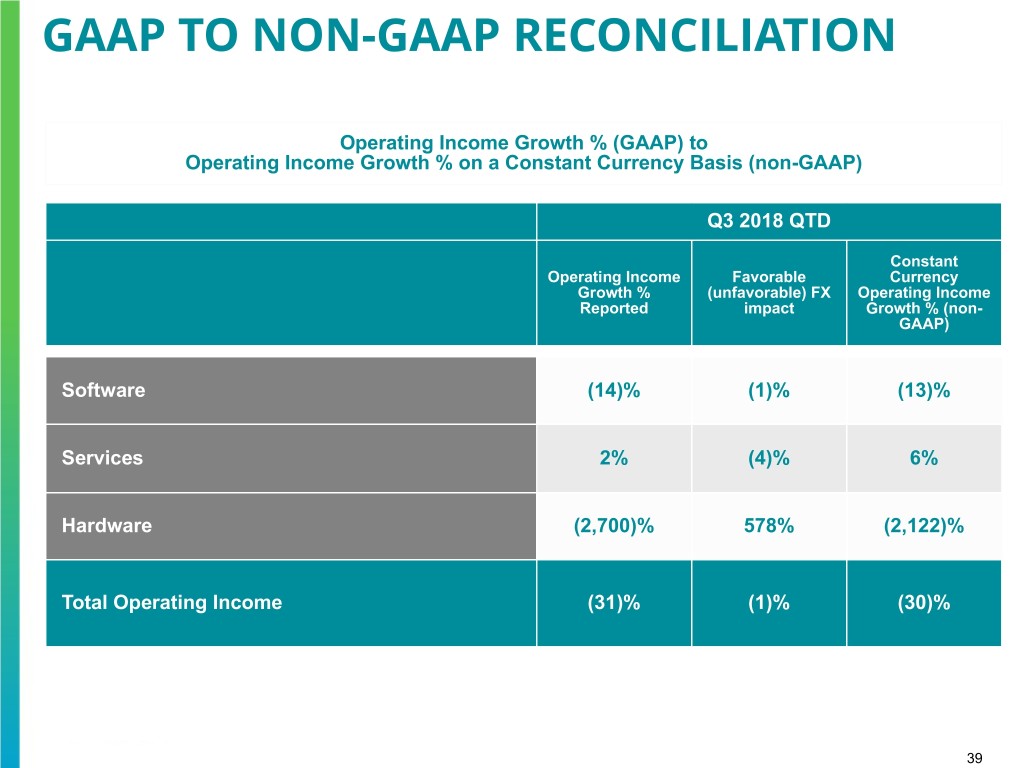
GAAP TO NON-GAAP RECONCILIATION Operating Income Growth % (GAAP) to Operating Income Growth % on a Constant Currency Basis (non-GAAP) Q3 2018 QTD Constant Operating Income Favorable Currency Growth % (unfavorable) FX Operating Income Reported impact Growth % (non- GAAP) Software (14)% (1)% (13)% Services 2% (4)% 6% Hardware (2,700)% 578% (2,122)% Total Operating Income (31)% (1)% (30)% 39

GAAP TO NON-GAAP RECONCILIATION Gross Margin Growth bps (GAAP) to Gross Margin Growth bps on a Constant Currency Basis (non-GAAP) Q3 2018 QTD Constant Favorable Currency Gross Gross Margin bps (unfavorable) FX Margin bps Growth Reported impact Growth (non- GAAP) Software (290) bps (10) bps (280) bps Services 70 bps (20) bps 90 bps Hardware (790) bps (10) bps (780) bps Total Gross Margin bps (180) bps (10) bps (170) bps 40

GAAP TO NON-GAAP RECONCILIATION Operating Income Growth bps (GAAP) to Operating Income Growth bps on a Constant Currency Basis (non-GAAP) Q3 2018 QTD Constant Operating Income Favorable Currency bps Growth (unfavorable) FX Operating Income Reported impact bps Growth (non- GAAP) Software (460) bps 0 bps (460) bps Services 20 bps (10) bps 30 bps Hardware (1,200) bps (10) bps (1,190) bps Total Operating Income (370) bps (10) bps (360) bps 41

GAAP TO NON-GAAP RECONCILIATION Diluted Earnings per Share Current 2018 Prior 2018 Guidance Guidance Diluted EPS (GAAP) (1) (2) $0.10- $0.68 $0.07 - $0.65 Transformation & Restructuring costs 0.75 - 1.00 0.50 - 0.75 Asset impairment charges 1.16 1.16 Impact of U.S. Tax Reform (0.27) — Acquisition-Related Amortization of Intangibles 0.42 0.42 Acquisition-Related Costs 0.05 0.05 Non-GAAP Diluted EPS (1) (3) $2.55- $2.75 $2.55 - $2.75 (1) Non-GAAP diluted EPS is determined using the conversion of the Series A Convertible Preferred Stock into common stock in the calculation of weighted average diluted shares outstanding. GAAP EPS is determined using the most dilutive measure, either including the impact of dividends or deemed dividends on the Company's Series A Convertible Preferred Stock in the calculation of net income or loss available to common stockholders or including the impact of the conversion of the Series A Convertible Preferred Stock into common stock in the calculation of the weighted average diluted shares outstanding. Therefore, GAAP diluted EPS and non-GAAP diluted EPS may not mathematically reconcile. (2) Except for the adjustments noted herein, this guidance does not include the effects of any future acquisitions/divestitures, pension mark-to-market adjustments, taxes or other events, which are difficult to predict and which may or may not be significant. We have increased our GAAP Diluted EPS FY 2018 guidance from previous guidance due to the impact of U.S. Tax Reform and the spend optimization program. (3) For FY 2018, we have assumed OIE of approximately $205 million, an effective tax rate of 21% and a share count of 151 million compared to OIE of $181 million, an effective tax rate of 25% and a share count of 154 million in FY 2017. 42
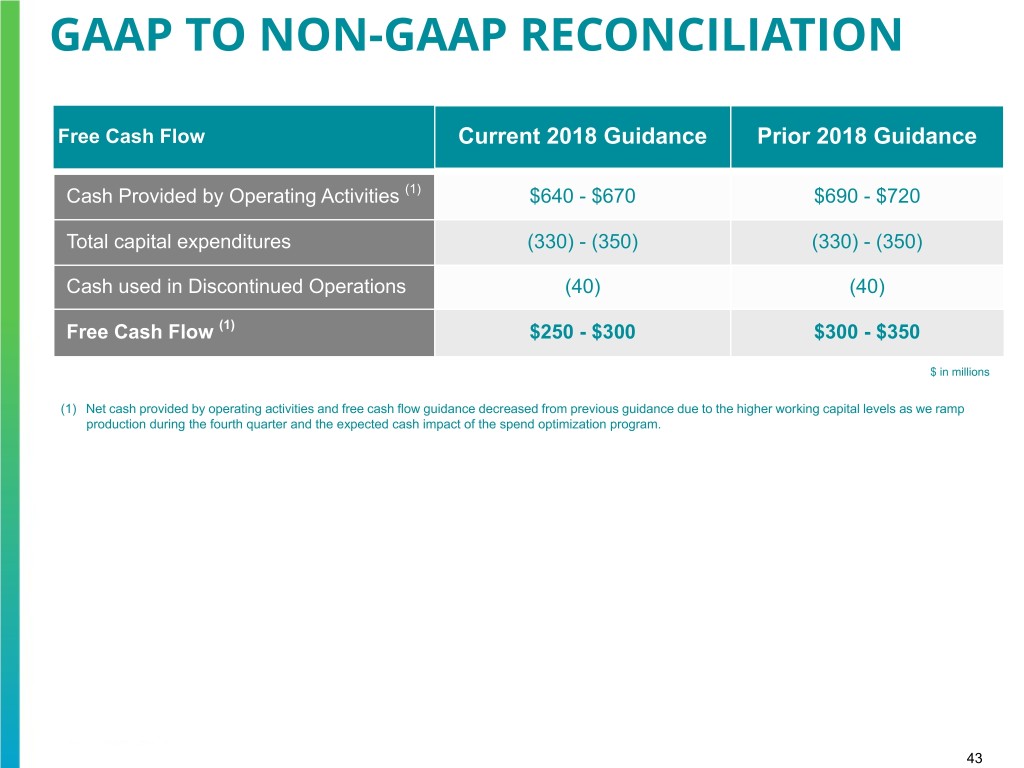
GAAP TO NON-GAAP RECONCILIATION Free Cash Flow Current 2018 Guidance Prior 2018 Guidance Cash Provided by Operating Activities (1) $640 - $670 $690 - $720 Total capital expenditures (330) - (350) (330) - (350) Cash used in Discontinued Operations (40) (40) Free Cash Flow (1) $250 - $300 $300 - $350 $ in millions (1) Net cash provided by operating activities and free cash flow guidance decreased from previous guidance due to the higher working capital levels as we ramp production during the fourth quarter and the expected cash impact of the spend optimization program. 43

44


