
Q4 2018 EARNINGS CONFERENCE CALL MICHAEL HAYFORD, PRESIDENT & CEO OWEN SULLIVAN, COO ANDRE FERNANDEZ, CFO February 7, 2019
NOTES TO INVESTORS FORWARD-LOOKING STATEMENTS. Comments made during this conference call and in these materials contain forward- looking statements. Statements that describe or relate to NCR's plans, goals, intentions, strategies, or financial outlook, and statements that do not relate to historical or current fact, are examples of forward-looking statements. The forward-looking statements in these materials include statements about NCR’s full year 2019 financial guidance and the expected type and magnitude of the non-operational adjustments included in any forward-looking non-GAAP measures; NCR's strategy and expected areas of focus to drive stockholder value creation including strategic growth platforms, revenue shift and spend optimization, and related expected investments and results; areas of focus to improve productivity; completed and targeted mergers and acquisitions and their expected benefits; expectations for future merger and acquisition activity; NCR's investment priorities, Services and Hardware Operations transformation activities and cost optimization initiatives, and their expected benefits in 2019; stock repurchases for dilution, capital expenditures and capital allocations in 2019; and NCR's expected free cash flow generation and capital allocation strategy. Forward-looking statements are not guarantees of future performance, and there are a number of important factors that could cause actual outcomes and results to differ materially from the results contemplated by such forward-looking statements, including those factors listed in Item 1a "Risk Factors" of NCR's Annual Report on Form 10-K filed with the Securities and Exchange Commission (SEC) on February 26, 2018, and those factors detailed from time to time in NCR's other SEC reports. These materials are dated February 7, 2019, and NCR does not undertake any obligation to publicly update or revise any forward-looking statements, whether as a result of new information, future events or otherwise. NON-GAAP MEASURES. While NCR reports its results in accordance with generally accepted accounting principles in the United States (GAAP), comments made during this conference call and in these materials will include or make reference to certain "non-GAAP" measures, including: selected measures, such as period-over-period revenue growth, expressed on a constant currency (CC) basis; gross margin rate (non-GAAP); diluted earnings per share (non-GAAP); free cash flow (FCF); gross margin (non-GAAP); net debt; adjusted EBITDA; the ratio of net debt to adjusted EBITDA; operating income (non-GAAP); interest and other expense (non-GAAP); income tax expense (non-GAAP); effective income tax rate (non-GAAP); and net income (non-GAAP). These measures are included to provide additional useful information regarding NCR's financial results, and are not a substitute for their comparable GAAP measures. Explanations of these non-GAAP measures, and reconciliations of these non-GAAP measures to their directly comparable GAAP measures, are included in the accompanying "Supplementary Materials" and are available on the Investor Relations page of NCR's website at www.ncr.com. Descriptions of many of these non-GAAP measures are also included in NCR's SEC reports. USE OF CERTAIN TERMS. As used in these materials: (i) the term "recurring revenue" means the sum of cloud, hardware maintenance and software maintenance revenue; (ii) the term “net annual contract value” or “net ACV” for any particular period means NCR’s net bookings for cloud revenue during the period, and is calculated as twelve months of expected subscription revenues under new cloud contracts during such period less twelve months of subscription revenues under cloud contracts that expired or were terminated during such period, adjusted for twelve months of expected pricing discounts or price increases from renewals of existing contracts; (iii) the term "CC" means constant currency; and (iv) the term "FCF" means free cash flow. These presentation materials and the associated remarks made during this conference call are integrally related and are intended to be presented and understood together. 2
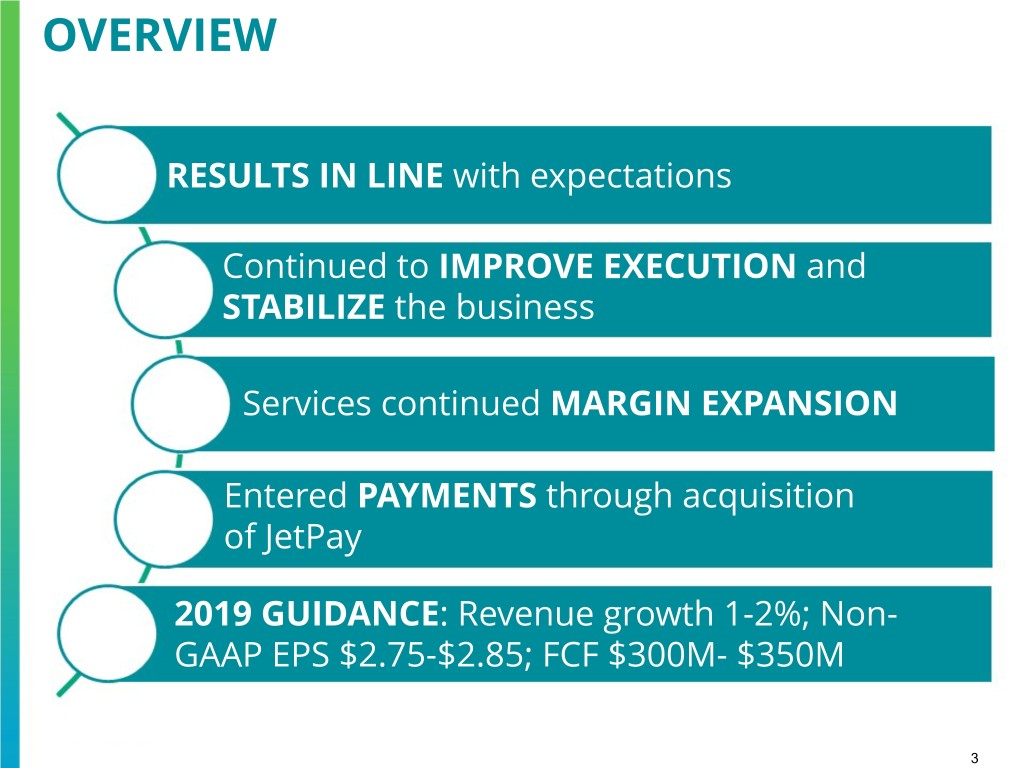
OVERVIEW RESULTS IN LINE with expectations Continued to IMPROVE EXECUTION and STABILIZE the business Services continued MARGIN EXPANSION Entered PAYMENTS through acquisition of JetPay 2019 GUIDANCE: Revenue growth 1-2%; Non- GAAP EPS $2.75-$2.85; FCF $300M- $350M 3

STRATEGIC THESIS NCR Shareholder Value Creation will be driven by: Top-Line Mix shift Spend Revenue Growth to Software Optimization & Services 4
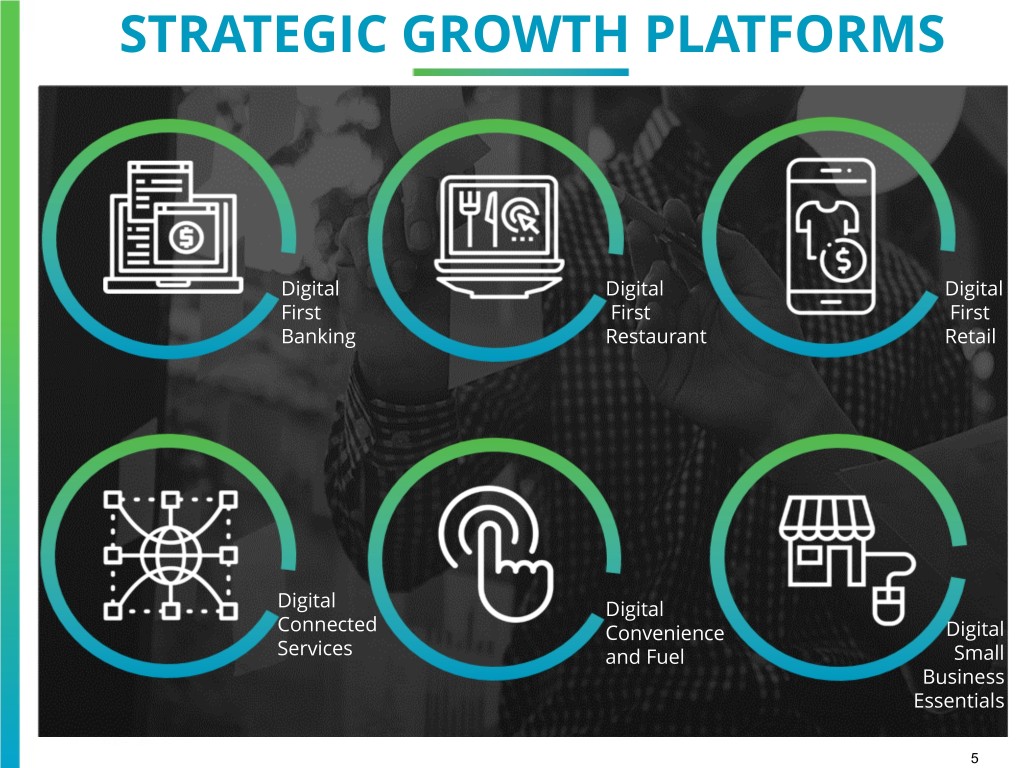
STRATEGIC GROWTH PLATFORMS Digital Digital Digital First First First Banking Restaurant Retail Digital Digital Connected Convenience Digital Services and Fuel Small Business Essentials 5
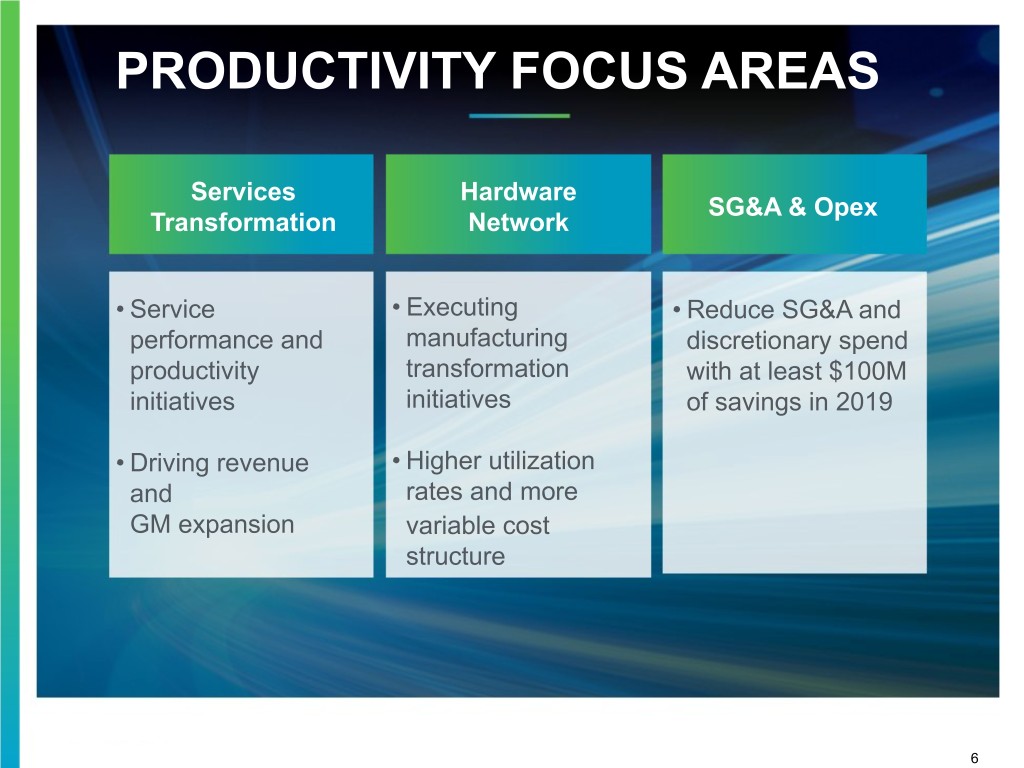
PRODUCTIVITY FOCUS AREAS Services Hardware SG&A & Opex Transformation Network • Service • Executing • Reduce SG&A and performance and manufacturing discretionary spend productivity transformation with at least $100M initiatives initiatives of savings in 2019 • Driving revenue • Higher utilization and rates and more GM expansion variable cost structure 6

Q4 2018 FINANCIAL RESULTS Non-GAAP Gross Revenue Margin Rate FX FX ($39) million (20) bps $1.80 29.3% $1.78 billion 27.5% billion Q4 2017 Q4 2018 Q4 2017 Q4 2018 Revenue up 1% as reported and up 3% CC; Non-GAAP gross margin rate down 180 bps as Recurring revenue up 1%, 42% of total revenue reported and down 200 bps CC Non-GAAP Diluted EPS Free Cash Flow FX $0.00 $400 $0.92 $317 $0.84 million million Q4 2017 Q4 2018 Q4 2017 Q4 2018 Free Cash Flow down due to lower earnings and Non-GAAP Diluted EPS down due to increased costs higher working capital 7
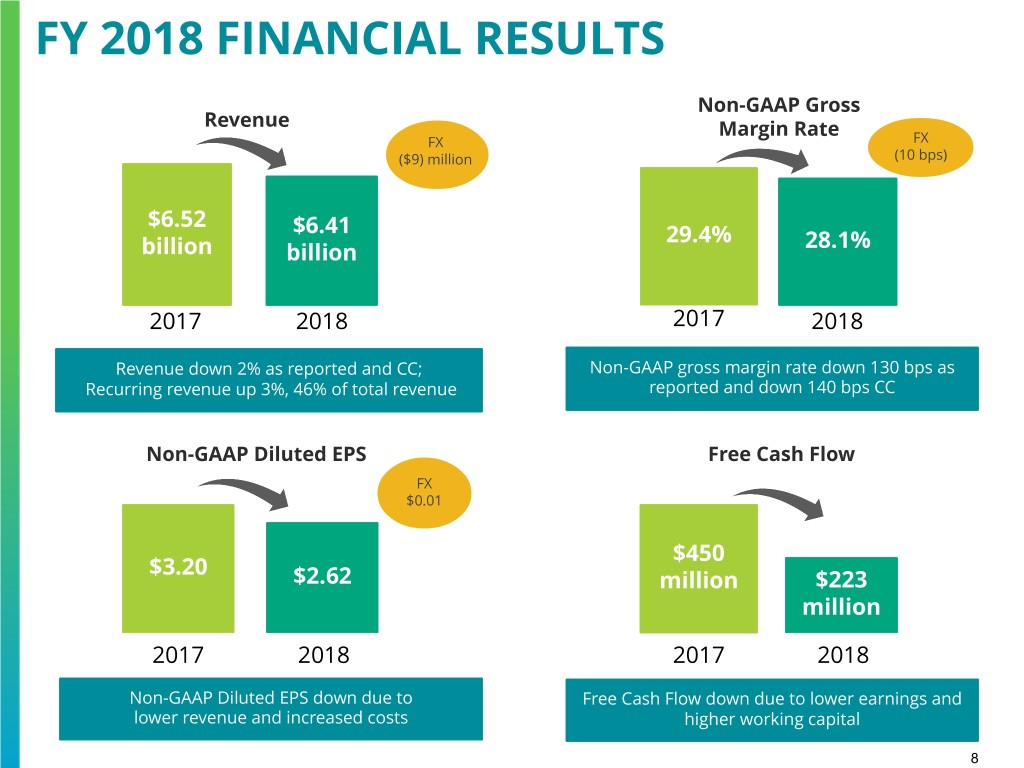
FY 2018 FINANCIAL RESULTS Non-GAAP Gross Revenue Margin Rate FX FX ($9) million (10 bps) $6.52 $6.41 29.4% 28.1% billion billion 2017 2018 2017 2018 Revenue down 2% as reported and CC; Non-GAAP gross margin rate down 130 bps as Recurring revenue up 3%, 46% of total revenue reported and down 140 bps CC Non-GAAP Diluted EPS Free Cash Flow FX $0.01 $450 $3.20 $2.62 million $223 million 2017 2018 2017 2018 Non-GAAP Diluted EPS down due to Free Cash Flow down due to lower earnings and lower revenue and increased costs higher working capital 8
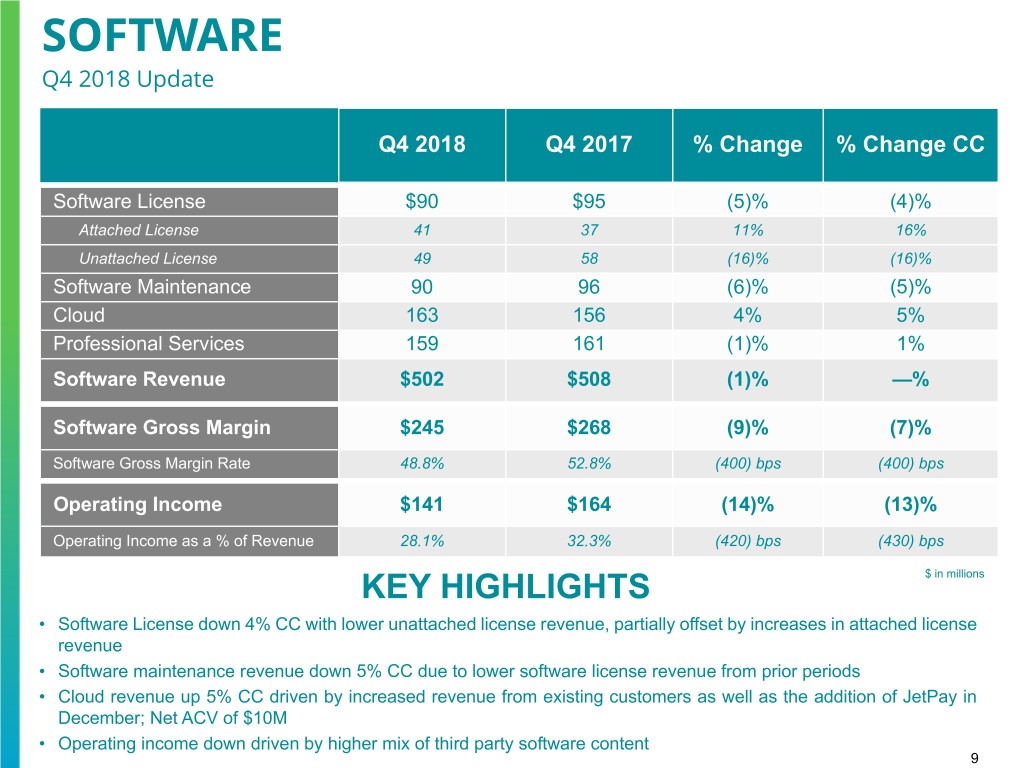
SOFTWARE Q4 2018 Update Q4 2018 Q4 2017 % Change % Change CC Software License $90 $95 (5)% (4)% Attached License 41 37 11% 16% Unattached License 49 58 (16)% (16)% Software Maintenance 90 96 (6)% (5)% Cloud 163 156 4% 5% Professional Services 159 161 (1)% 1% Software Revenue $502 $508 (1)% —% Software Gross Margin $245 $268 (9)% (7)% Software Gross Margin Rate 48.8% 52.8% (400) bps (400) bps Operating Income $141 $164 (14)% (13)% Operating Income as a % of Revenue 28.1% 32.3% (420) bps (430) bps KEY HIGHLIGHTS $ in millions • Software License down 4% CC with lower unattached license revenue, partially offset by increases in attached license revenue • Software maintenance revenue down 5% CC due to lower software license revenue from prior periods • Cloud revenue up 5% CC driven by increased revenue from existing customers as well as the addition of JetPay in December; Net ACV of $10M • Operating income down driven by higher mix of third party software content 9
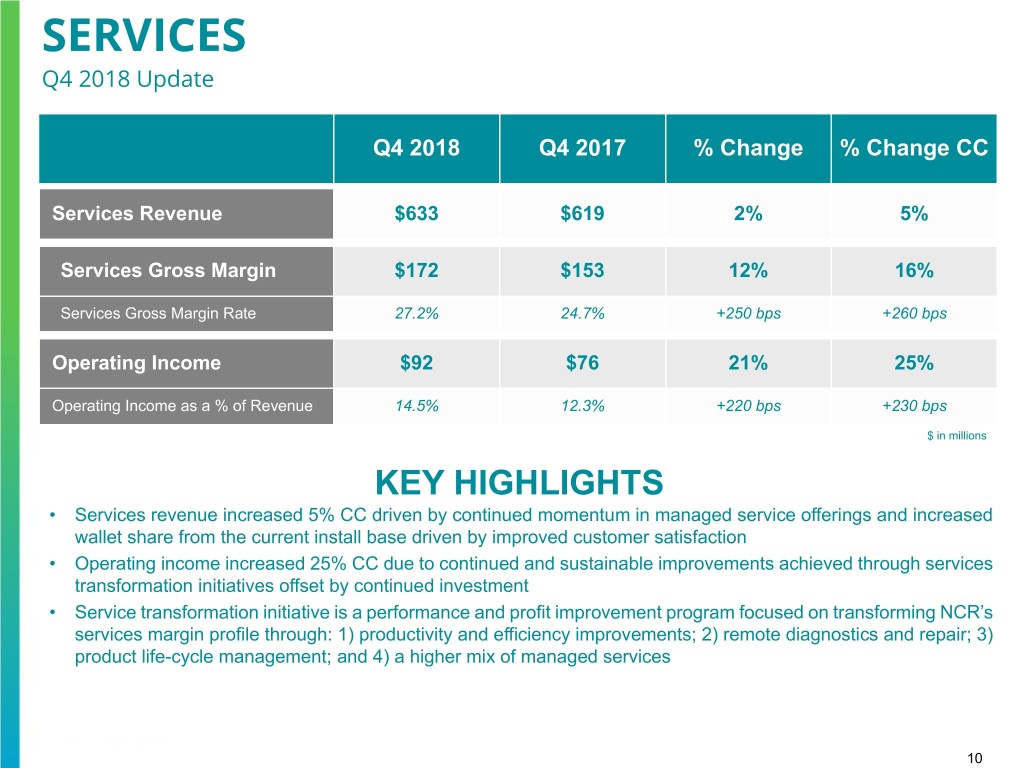
SERVICES Q4 2018 Update Q4 2018 Q4 2017 % Change % Change CC Services Revenue $633 $619 2% 5% Services Gross Margin $172 $153 12% 16% Services Gross Margin Rate 27.2% 24.7% +250 bps +260 bps Operating Income $92 $76 21% 25% Operating Income as a % of Revenue 14.5% 12.3% +220 bps +230 bps $ in millions KEY HIGHLIGHTS • Services revenue increased 5% CC driven by continued momentum in managed service offerings and increased wallet share from the current install base driven by improved customer satisfaction • Operating income increased 25% CC due to continued and sustainable improvements achieved through services transformation initiatives offset by continued investment • Service transformation initiative is a performance and profit improvement program focused on transforming NCR’s services margin profile through: 1) productivity and efficiency improvements; 2) remote diagnostics and repair; 3) product life-cycle management; and 4) a higher mix of managed services 10
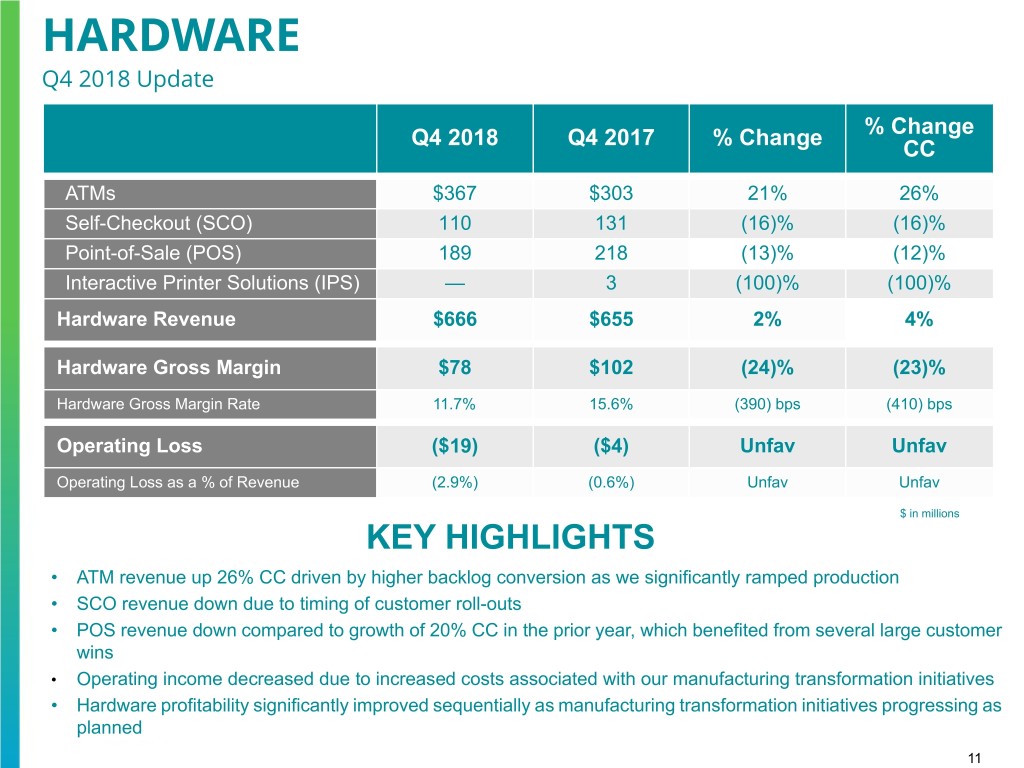
HARDWARE Q4 2018 Update % Change Q4 2018 Q4 2017 % Change CC ATMs $367 $303 21% 26% Self-Checkout (SCO) 110 131 (16)% (16)% Point-of-Sale (POS) 189 218 (13)% (12)% Interactive Printer Solutions (IPS) — 3 (100)% (100)% Hardware Revenue $666 $655 2% 4% Hardware Gross Margin $78 $102 (24)% (23)% Hardware Gross Margin Rate 11.7% 15.6% (390) bps (410) bps Operating Loss ($19) ($4) Unfav Unfav Operating Loss as a % of Revenue (2.9%) (0.6%) Unfav Unfav $ in millions KEY HIGHLIGHTS • ATM revenue up 26% CC driven by higher backlog conversion as we significantly ramped production • SCO revenue down due to timing of customer roll-outs • POS revenue down compared to growth of 20% CC in the prior year, which benefited from several large customer wins • Operating income decreased due to increased costs associated with our manufacturing transformation initiatives • Hardware profitability significantly improved sequentially as manufacturing transformation initiatives progressing as planned 11
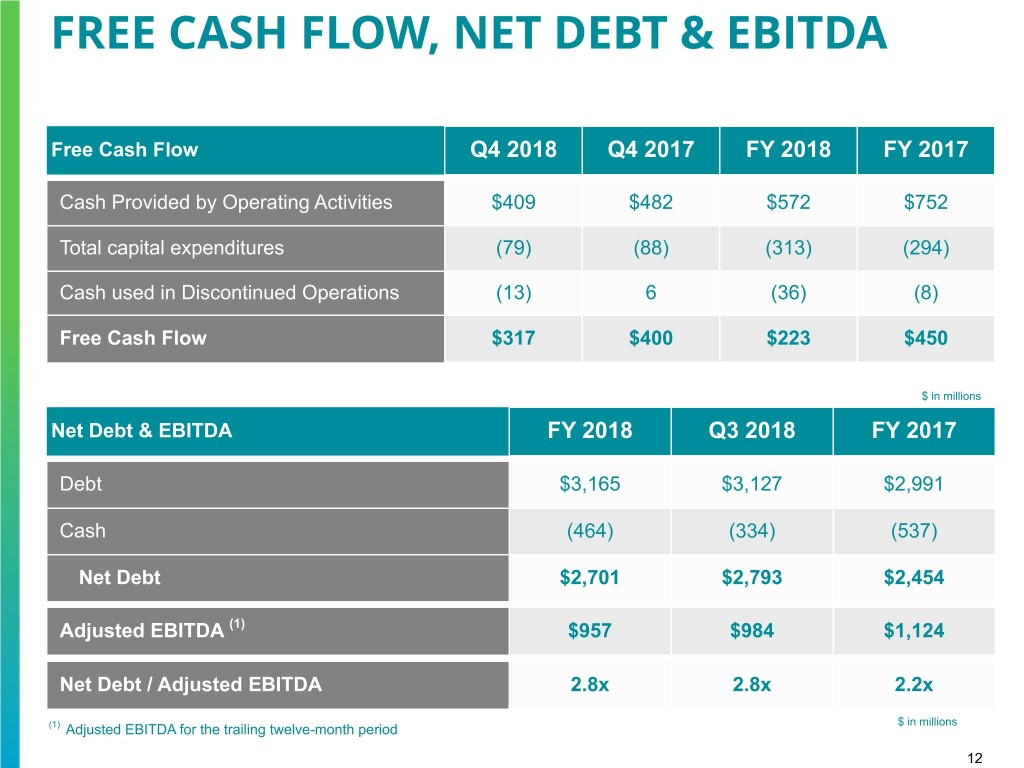
FREE CASH FLOW, NET DEBT & EBITDA Free Cash Flow Q4 2018 Q4 2017 FY 2018 FY 2017 Cash Provided by Operating Activities $409 $482 $572 $752 Total capital expenditures (79) (88) (313) (294) Cash used in Discontinued Operations (13) 6 (36) (8) Free Cash Flow $317 $400 $223 $450 $ in millions Net Debt & EBITDA FY 2018 Q3 2018 FY 2017 Debt $3,165 $3,127 $2,991 Cash (464) (334) (537) Net Debt $2,701 $2,793 $2,454 Adjusted EBITDA (1) $957 $984 $1,124 Net Debt / Adjusted EBITDA 2.8x 2.8x 2.2x $ in millions (1) Adjusted EBITDA for the trailing twelve-month period 12

2019 GUIDANCE FY 2019 Guidance Revenue Growth 1% - 2% Net Income Attributable to NCR $290 - $305 Adjusted EBITDA $1,040 - $1,080 GAAP Diluted EPS $1.91 - $2.01 Non-GAAP Diluted EPS $2.75 - $2.85 Cash Flow from Operations $705 - $730 Free Cash Flow $300 - $350 Capital Allocations 2018 2019 Stock repurchases $210 ~ $100 Capital expenditures $313 $350-$375 Mergers and acquisitions $206 $300-$400 $ in millions, except per share amounts 13

2019 EBITDA BRIDGE $1,040 - $1,080 $957 18 ix ost tate her th ion ion 19 20 ce/M le C Es Ot row ans mat nd 20 Pri eop eal ss G Exp sfor Spe on P R sine ces ran vity zati Bu rvi T ucti imi Se HW rod Opt & P $ in millions 14

LOOKING FORWARD Allocate capital to highest growth and return on investment opportunities Return to growth Mix shift to software, services and recurring revenue Improve cost structure Drive cash flow generation 15

SUPPLEMENTARY MATERIALS
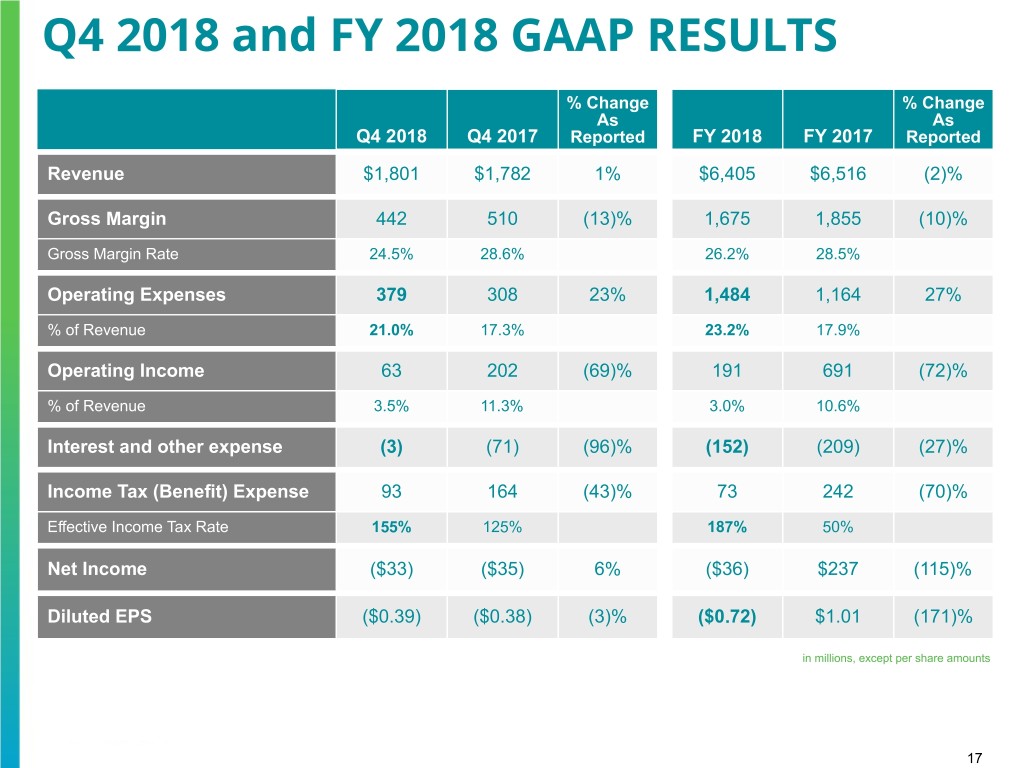
Q4 2018 and FY 2018 GAAP RESULTS % Change % Change As As Q4 2018 Q4 2017 Reported FY 2018 FY 2017 Reported Revenue $1,801 $1,782 1% $6,405 $6,516 (2)% Gross Margin 442 510 (13)% 1,675 1,855 (10)% Gross Margin Rate 24.5% 28.6% 26.2% 28.5% Operating Expenses 379 308 23% 1,484 1,164 27% % of Revenue 21.0% 17.3% 23.2% 17.9% Operating Income 63 202 (69)% 191 691 (72)% % of Revenue 3.5% 11.3% 3.0% 10.6% Interest and other expense (3) (71) (96)% (152) (209) (27)% Income Tax (Benefit) Expense 93 164 (43)% 73 242 (70)% Effective Income Tax Rate 155% 125% 187% 50% Net Income ($33) ($35) 6% ($36) $237 (115)% Diluted EPS ($0.39) ($0.38) (3)% ($0.72) $1.01 (171)% in millions, except per share amounts 17
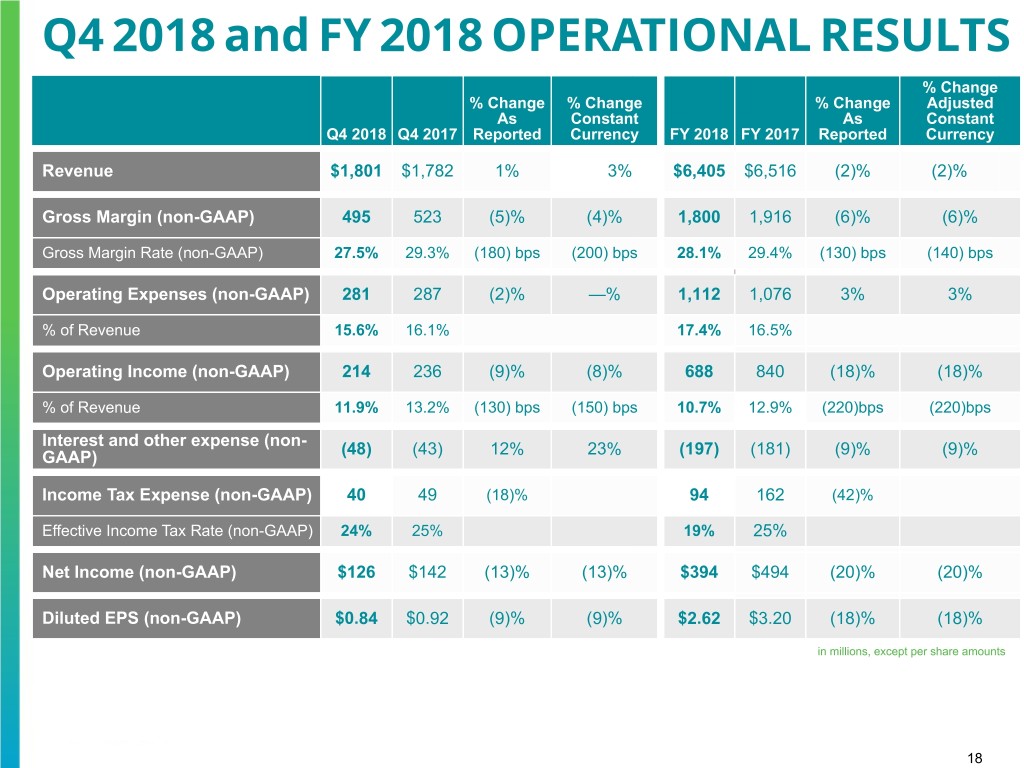
Q4 2018 and FY 2018 OPERATIONAL RESULTS % Change % Change % Change % Change Adjusted As Constant As Constant Q4 2018 Q4 2017 Reported Currency FY 2018 FY 2017 Reported Currency Revenue $1,801 $1,782 1% 3% $6,405 $6,516 (2)% (2)% Gross Margin (non-GAAP) 495 523 (5)% (4)% 1,800 1,916 (6)% (6)% Gross Margin Rate (non-GAAP) 27.5% 29.3% (180) bps (200) bps 28.1% 29.4% (130) bps (140) bps Operating Expenses (non-GAAP) 281 287 (2)% —% 1,112 1,076 3% 3% % of Revenue 15.6% 16.1% 17.4% 16.5% Operating Income (non-GAAP) 214 236 (9)% (8)% 688 840 (18)% (18)% % of Revenue 11.9% 13.2% (130) bps (150) bps 10.7% 12.9% (220)bps (220)bps Interest and other expense (non- GAAP) (48) (43) 12% 23% (197) (181) (9)% (9)% Income Tax Expense (non-GAAP) 40 49 (18)% 94 162 (42)% Effective Income Tax Rate (non-GAAP) 24% 25% 19% 25% Net Income (non-GAAP) $126 $142 (13)% (13)% $394 $494 (20)% (20)% Diluted EPS (non-GAAP) $0.84 $0.92 (9)% (9)% $2.62 $3.20 (18)% (18)% in millions, except per share amounts 18

SOFTWARE FY 2018 FY 2017 % Change % Change CC Software License $308 $336 (8)% (8)% Attached License 111 121 (8)% (8)% Unattached License 197 215 (8)% (8)% Software Maintenance 366 374 (2)% (2)% Cloud 631 592 7% 7% Professional Services 607 598 2% 1% Software Revenue $1,912 $1,900 1% 1% Software Gross Margin $916 $967 (5)% (5)% Software Gross Margin Rate 47.9% 50.9% (300) bps (290) bps Operating Income $492 $563 (13)% (12)% Operating Income as a % of Revenue 25.7% 29.6% (390) bps (380) bps $ in millions 19
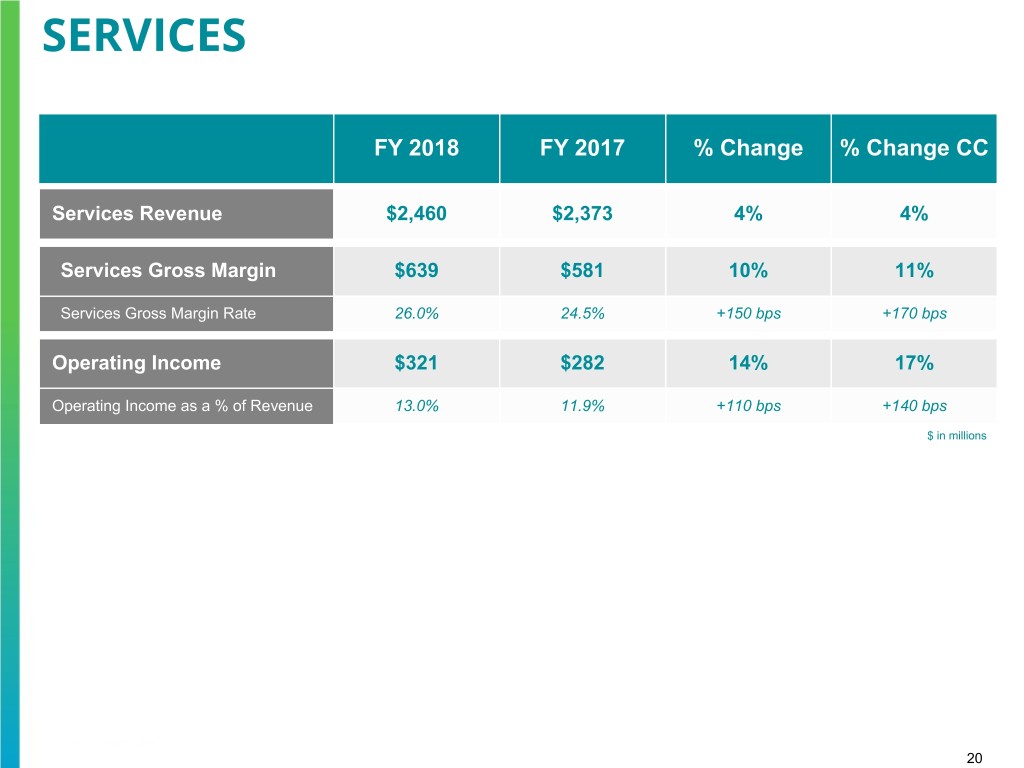
SERVICES FY 2018 FY 2017 % Change % Change CC Services Revenue $2,460 $2,373 4% 4% Services Gross Margin $639 $581 10% 11% Services Gross Margin Rate 26.0% 24.5% +150 bps +170 bps Operating Income $321 $282 14% 17% Operating Income as a % of Revenue 13.0% 11.9% +110 bps +140 bps $ in millions 20
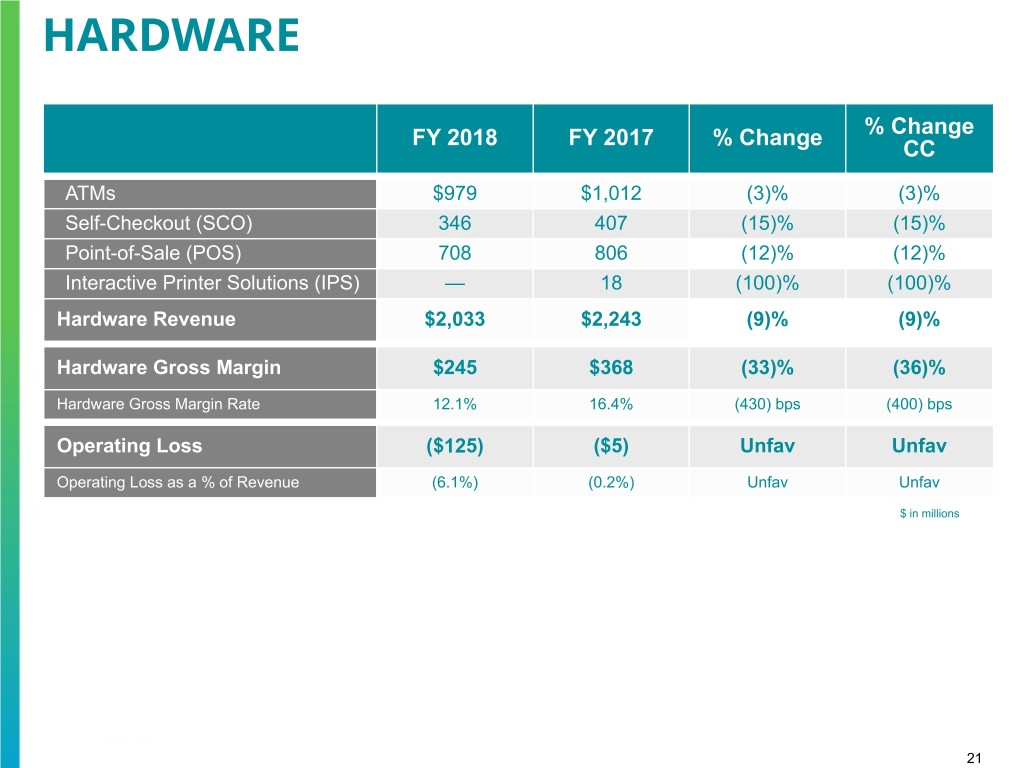
HARDWARE % Change FY 2018 FY 2017 % Change CC ATMs $979 $1,012 (3)% (3)% Self-Checkout (SCO) 346 407 (15)% (15)% Point-of-Sale (POS) 708 806 (12)% (12)% Interactive Printer Solutions (IPS) — 18 (100)% (100)% Hardware Revenue $2,033 $2,243 (9)% (9)% Hardware Gross Margin $245 $368 (33)% (36)% Hardware Gross Margin Rate 12.1% 16.4% (430) bps (400) bps Operating Loss ($125) ($5) Unfav Unfav Operating Loss as a % of Revenue (6.1%) (0.2%) Unfav Unfav $ in millions 21
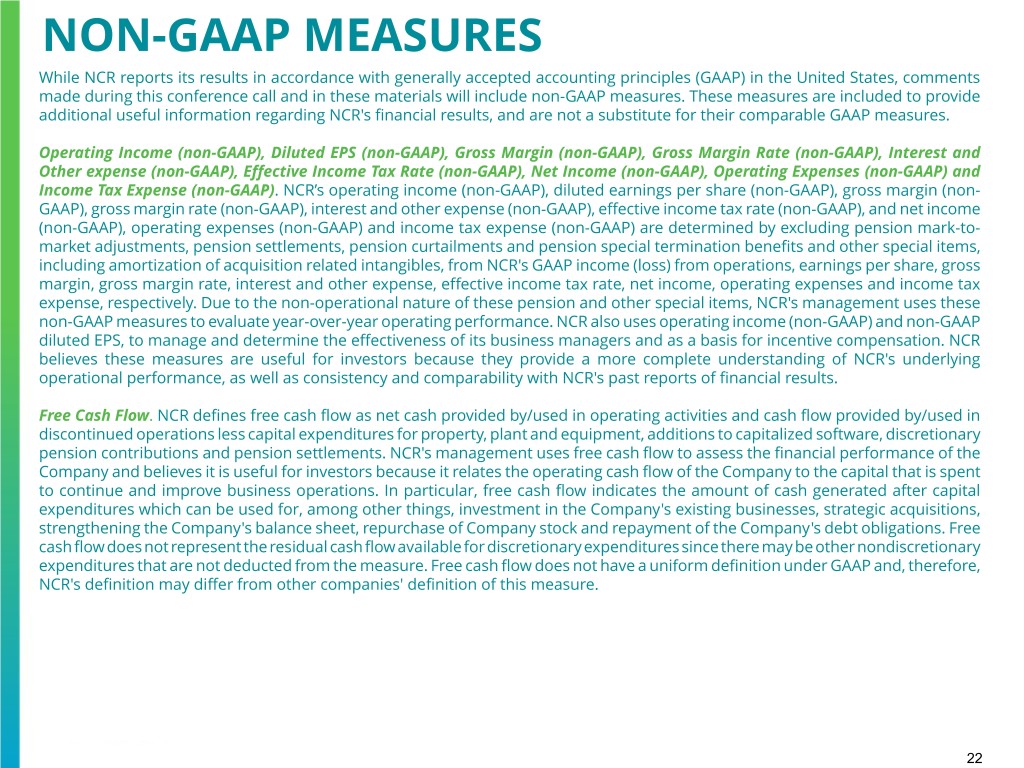
NON-GAAP MEASURES While NCR reports its results in accordance with generally accepted accounting principles (GAAP) in the United States, comments made during this conference call and in these materials will include non-GAAP measures. These measures are included to provide additional useful information regarding NCR's financial results, and are not a substitute for their comparable GAAP measures. Operating Income (non-GAAP), Diluted EPS (non-GAAP), Gross Margin (non-GAAP), Gross Margin Rate (non-GAAP), Interest and Other expense (non-GAAP), Effective Income Tax Rate (non-GAAP), Net Income (non-GAAP), Operating Expenses (non-GAAP) and Income Tax Expense (non-GAAP). NCR’s operating income (non-GAAP), diluted earnings per share (non-GAAP), gross margin (non- GAAP), gross margin rate (non-GAAP), interest and other expense (non-GAAP), effective income tax rate (non-GAAP), and net income (non-GAAP), operating expenses (non-GAAP) and income tax expense (non-GAAP) are determined by excluding pension mark-to- market adjustments, pension settlements, pension curtailments and pension special termination benefits and other special items, including amortization of acquisition related intangibles, from NCR's GAAP income (loss) from operations, earnings per share, gross margin, gross margin rate, interest and other expense, effective income tax rate, net income, operating expenses and income tax expense, respectively. Due to the non-operational nature of these pension and other special items, NCR's management uses these non-GAAP measures to evaluate year-over-year operating performance. NCR also uses operating income (non-GAAP) and non-GAAP diluted EPS, to manage and determine the effectiveness of its business managers and as a basis for incentive compensation. NCR believes these measures are useful for investors because they provide a more complete understanding of NCR's underlying operational performance, as well as consistency and comparability with NCR's past reports of financial results. Free Cash Flow. NCR defines free cash flow as net cash provided by/used in operating activities and cash flow provided by/used in discontinued operations less capital expenditures for property, plant and equipment, additions to capitalized software, discretionary pension contributions and pension settlements. NCR's management uses free cash flow to assess the financial performance of the Company and believes it is useful for investors because it relates the operating cash flow of the Company to the capital that is spent to continue and improve business operations. In particular, free cash flow indicates the amount of cash generated after capital expenditures which can be used for, among other things, investment in the Company's existing businesses, strategic acquisitions, strengthening the Company's balance sheet, repurchase of Company stock and repayment of the Company's debt obligations. Free cash flow does not represent the residual cash flow available for discretionary expenditures since there may be other nondiscretionary expenditures that are not deducted from the measure. Free cash flow does not have a uniform definition under GAAP and, therefore, NCR's definition may differ from other companies' definition of this measure. 22

NON-GAAP MEASURES Constant Currency. NCR presents certain financial measures, such as period-over-period revenue growth, on a constant currency basis, which excludes the effects of foreign currency translation by translating prior period results at current period monthly average exchange rates. Due to the overall variability of foreign exchange rates from period to period, NCR’s management uses constant currency measures to evaluate period-over-period operating performance on a more consistent and comparable basis. NCR’s management believes that presentation of financial measures without these results is more representative of the company's period- over-period operating performance, and provides additional insight into historical and/or future performance, which may be helpful for investors. Net Debt and Adjusted EBITDA. NCR believes that Net Debt provides useful information to investors because NCR’s management reviews Net Debt as part of its management of overall liquidity, financial flexibility, capital structure and leverage. In addition, certain debt rating agencies, creditors and credit analysts monitor NCR’s Net Debt as part of their assessments of NCR’s business. NCR determines Net Debt based on its total debt less cash and cash equivalents, with total debt being defined as total short-term borrowings plus total long-term debt. NCR believes that Adjusted EBITDA (adjusted earnings before interest, taxes, depreciation and amortization) provides useful information to investors because it is an indicator of the strength and performance of the Company's ongoing business operations, including its ability to fund discretionary spending such as capital expenditures, strategic acquisitions and other investments. NCR determines Adjusted EBITDA for a given period based on its GAAP net income attributable to NCR plus interest expense, net; plus income tax expense (benefit); plus depreciation and amortization; plus other income (expense); plus pension mark-to-market adjustments, pension settlements, pension curtailments and pension special termination benefits and other special items, including amortization of acquisition related intangibles. NCR believes that its ratio of net debt to Adjusted EBITDA provides useful information to investors because it is an indicator of the company's ability to meet its future financial obligations. NCR believes that its ratio of Net Debt to Adjusted EBITDA provides useful information to investors because it is an indicator of the company's ability to meet its future financial obligations. In addition, the Net Debt to Adjusted EBITDA ratio is measures frequently used by investors and credit rating agencies. The Net Debt to Adjusted EBITDA ratio is calculated by dividing Net Debt by trailing twelve- month Adjusted EBITDA. NCR management's definitions and calculations of these non-GAAP measures may differ from similarly-titled measures reported by other companies and cannot, therefore, be compared with similarly-titled measures of other companies. These non-GAAP measures should not be considered as substitutes for, or superior to, results determined in accordance with GAAP. These non-GAAP measures are reconciled to their corresponding GAAP measures in the following slides and elsewhere in these materials. These reconciliations and other information regarding these non-GAAP measures are also available on the Investor Relations page of NCR's website at www.ncr.com. 23
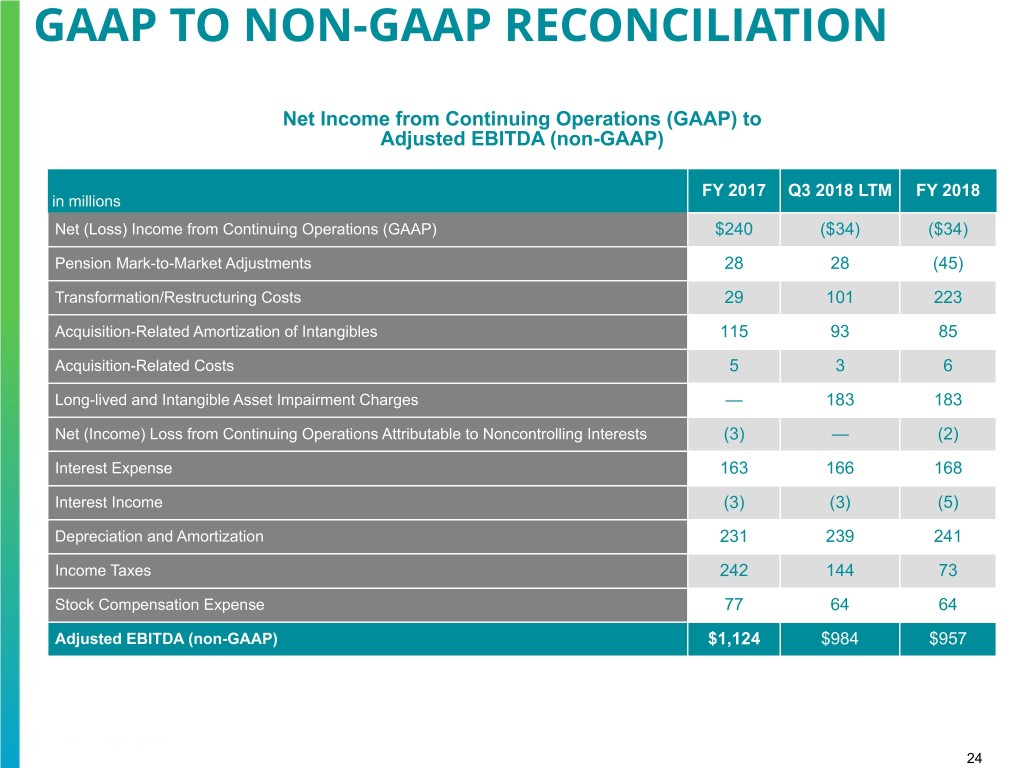
GAAP TO NON-GAAP RECONCILIATION Net Income from Continuing Operations (GAAP) to Adjusted EBITDA (non-GAAP) FY 2017 Q3 2018 LTM FY 2018 in millions Net (Loss) Income from Continuing Operations (GAAP) $240 ($34) ($34) Pension Mark-to-Market Adjustments 28 28 (45) Transformation/Restructuring Costs 29 101 223 Acquisition-Related Amortization of Intangibles 115 93 85 Acquisition-Related Costs 5 3 6 Long-lived and Intangible Asset Impairment Charges — 183 183 Net (Income) Loss from Continuing Operations Attributable to Noncontrolling Interests (3) — (2) Interest Expense 163 166 168 Interest Income (3) (3) (5) Depreciation and Amortization 231 239 241 Income Taxes 242 144 73 Stock Compensation Expense 77 64 64 Adjusted EBITDA (non-GAAP) $1,124 $984 $957 $1,124 24

GAAP TO NON-GAAP RECONCILIATION Q4 2018 QTD Transformation Acquisition- Pension Q4 QTD Acquisition- Impact of Q4 QTD and related mark-to- 2018 related U.S. Tax 2018 Restructuring amortization of market GAAP costs Reform non-GAAP in millions (except per share amounts) costs intangibles adjustments Product revenue $756 $— $— $— $— $— $756 Service revenue 1,045 — — — — — 1,045 Total revenue 1,801 — — — — — 1,801 Cost of products 644 (19) (1) — — — 624 Cost of services 715 (29) (4) — — — 682 Gross margin 442 48 5 — — — 495 Gross margin rate 24.5% 2.7% 0.3% —% —% —% 27.5% Selling, general and administrative expenses 273 (29) (16) (5) — — 223 Research and development expenses 62 (4) — — — — 58 Asset impairment charges 44 (44) — — — — — Total operating expenses 379 (77) (16) (5) — — 281 Total operating expense as a % of revenue 21.0% (4.2)% (0.9)% (0.3)% —% —% 15.6% Income from operations 63 125 21 5 — — 214 Income from operations as a % of revenue 3.5% 6.9% 1.2% 0.3% —% —% 11.9% Interest and Other (expense) income, net (3) — — — (45) — (48) Income from continuing operations before income 60 125 21 5 (45) — 166 taxes Income tax (benefit) expense 93 29 3 1 (1) (85) 40 Effective income tax rate 155% 24% Income from continuing operations (33) 96 18 4 (44) 85 126 Net income attributable to noncontrolling interests — — — — — — — Income from continuing operations (attributable to ($33) $96 $18 $4 ($44) $85 $126 NCR) Diluted earnings per share ($0.39) $0.64 $0.12 $0.03 ($0.29) $0.57 $0.84 Diluted shares outstanding 118.6 149.9 25
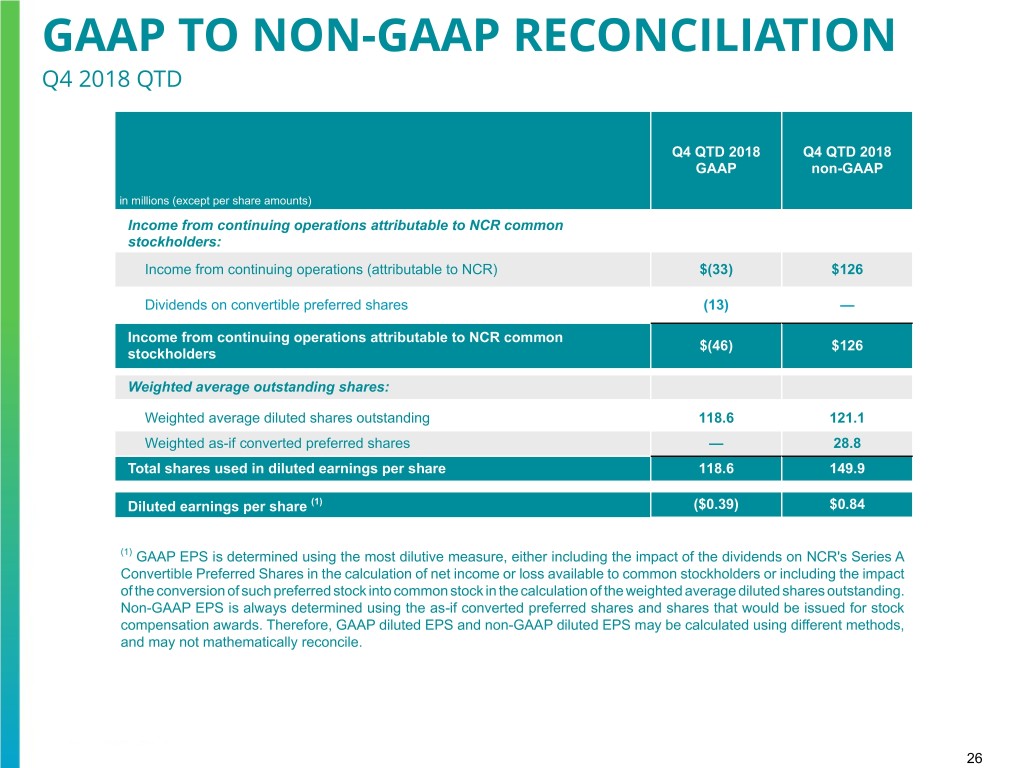
GAAP TO NON-GAAP RECONCILIATION Q4 2018 QTD Q4 QTD 2018 Q4 QTD 2018 GAAP non-GAAP in millions (except per share amounts) Income from continuing operations attributable to NCR common stockholders: Income from continuing operations (attributable to NCR) $(33) $126 Dividends on convertible preferred shares (13) — Income from continuing operations attributable to NCR common $(46) $126 stockholders Weighted average outstanding shares: Weighted average diluted shares outstanding 118.6 121.1 Weighted as-if converted preferred shares — 28.8 Total shares used in diluted earnings per share 118.6 149.9 Diluted earnings per share (1) ($0.39) $0.84 (1) GAAP EPS is determined using the most dilutive measure, either including the impact of the dividends on NCR's Series A Convertible Preferred Shares in the calculation of net income or loss available to common stockholders or including the impact of the conversion of such preferred stock into common stock in the calculation of the weighted average diluted shares outstanding. Non-GAAP EPS is always determined using the as-if converted preferred shares and shares that would be issued for stock compensation awards. Therefore, GAAP diluted EPS and non-GAAP diluted EPS may be calculated using different methods, and may not mathematically reconcile. 26
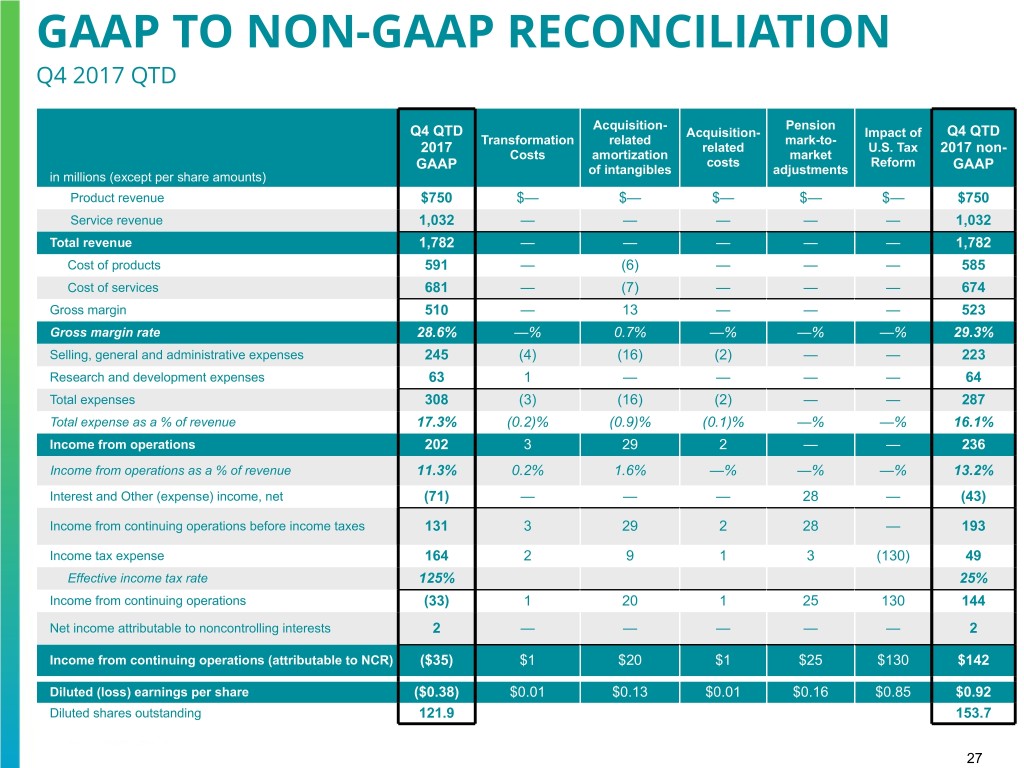
GAAP TO NON-GAAP RECONCILIATION Q4 2017 QTD Acquisition- Pension Q4 QTD Acquisition- Impact of Q4 QTD Transformation related mark-to- 2017 related U.S. Tax 2017 non- Costs amortization market costs Reform GAAP of intangibles adjustments GAAP in millions (except per share amounts) Product revenue $750 $— $— $— $— $— $750 Service revenue 1,032 — — — — — 1,032 Total revenue 1,782 — — — — — 1,782 Cost of products 591 — (6) — — — 585 Cost of services 681 — (7) — — — 674 Gross margin 510 — 13 — — — 523 Gross margin rate 28.6% —% 0.7% —% —% —% 29.3% Selling, general and administrative expenses 245 (4) (16) (2) — — 223 Research and development expenses 63 1 — — — — 64 Total expenses 308 (3) (16) (2) — — 287 Total expense as a % of revenue 17.3% (0.2)% (0.9)% (0.1)% —% —% 16.1% Income from operations 202 3 29 2 — — 236 Income from operations as a % of revenue 11.3% 0.2% 1.6% —% —% —% 13.2% Interest and Other (expense) income, net (71) — — — 28 — (43) Income from continuing operations before income taxes 131 3 29 2 28 — 193 Income tax expense 164 2 9 1 3 (130) 49 Effective income tax rate 125% 25% Income from continuing operations (33) 1 20 1 25 130 144 Net income attributable to noncontrolling interests 2 — — — — — 2 Income from continuing operations (attributable to NCR) ($35) $1 $20 $1 $25 $130 $142 Diluted (loss) earnings per share ($0.38) $0.01 $0.13 $0.01 $0.16 $0.85 $0.92 Diluted shares outstanding 121.9 153.7 27
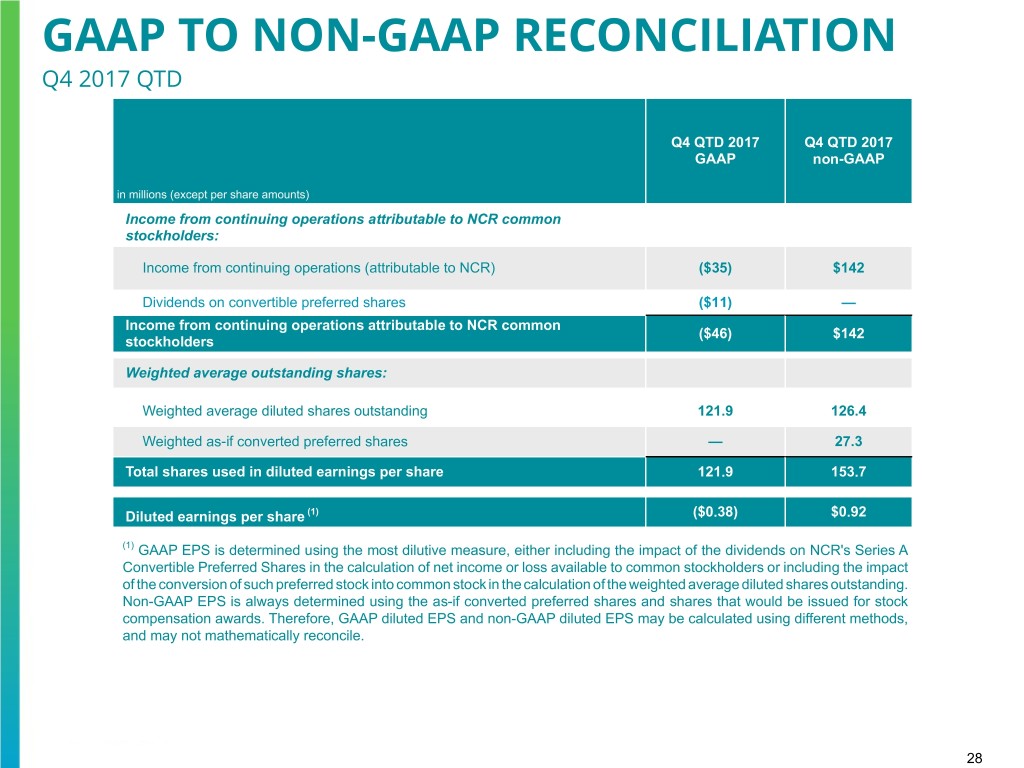
GAAP TO NON-GAAP RECONCILIATION Q4 2017 QTD Q4 QTD 2017 Q4 QTD 2017 GAAP non-GAAP in millions (except per share amounts) Income from continuing operations attributable to NCR common stockholders: Income from continuing operations (attributable to NCR) ($35) $142 Dividends on convertible preferred shares ($11) — Income from continuing operations attributable to NCR common ($46) $142 stockholders Weighted average outstanding shares: Weighted average diluted shares outstanding 121.9 126.4 Weighted as-if converted preferred shares — 27.3 Total shares used in diluted earnings per share 121.9 153.7 Diluted earnings per share (1) ($0.38) $0.92 (1) GAAP EPS is determined using the most dilutive measure, either including the impact of the dividends on NCR's Series A Convertible Preferred Shares in the calculation of net income or loss available to common stockholders or including the impact of the conversion of such preferred stock into common stock in the calculation of the weighted average diluted shares outstanding. Non-GAAP EPS is always determined using the as-if converted preferred shares and shares that would be issued for stock compensation awards. Therefore, GAAP diluted EPS and non-GAAP diluted EPS may be calculated using different methods, and may not mathematically reconcile. 28
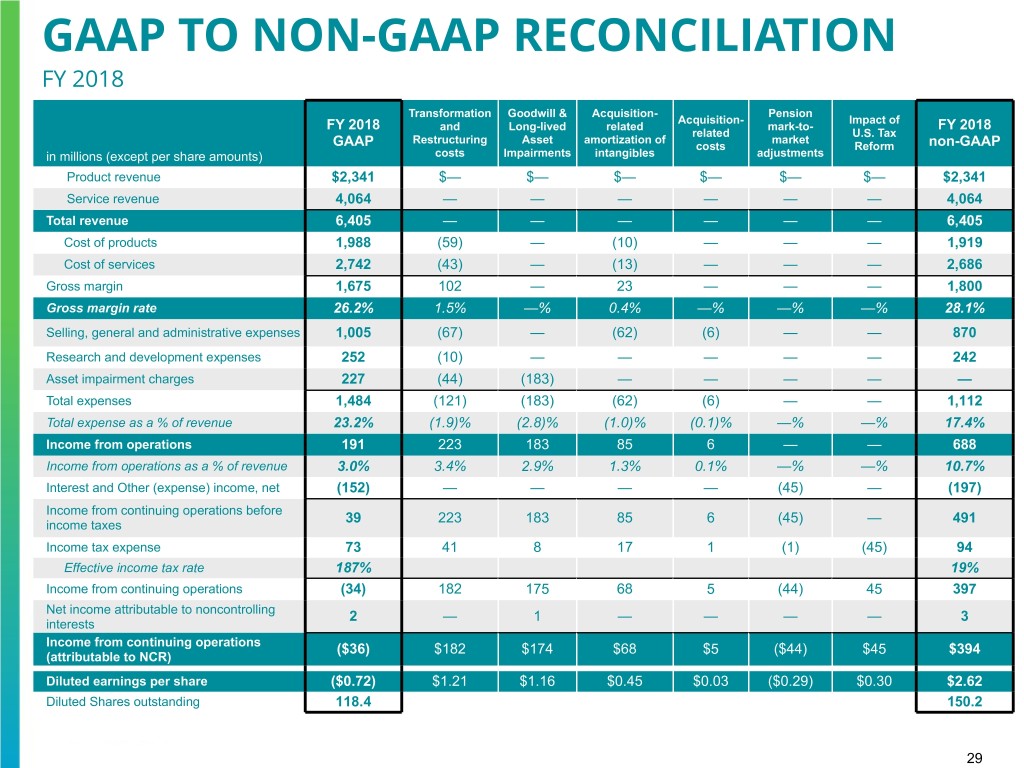
GAAP TO NON-GAAP RECONCILIATION FY 2018 Transformation Goodwill & Acquisition- Pension Acquisition- Impact of FY 2018 and Long-lived related mark-to- FY 2018 related U.S. Tax Restructuring Asset amortization of market GAAP costs Reform non-GAAP in millions (except per share amounts) costs Impairments intangibles adjustments Product revenue $2,341 $— $— $— $— $— $— $2,341 Service revenue 4,064 — — — — — — 4,064 Total revenue 6,405 — — — — — — 6,405 Cost of products 1,988 (59) — (10) — — — 1,919 Cost of services 2,742 (43) — (13) — — — 2,686 Gross margin 1,675 102 — 23 — — — 1,800 Gross margin rate 26.2% 1.5% —% 0.4% —% —% —% 28.1% Selling, general and administrative expenses 1,005 (67) — (62) (6) — — 870 Research and development expenses 252 (10) — — — — — 242 Asset impairment charges 227 (44) (183) — — — — — Total expenses 1,484 (121) (183) (62) (6) — — 1,112 Total expense as a % of revenue 23.2% (1.9)% (2.8)% (1.0)% (0.1)% —% —% 17.4% Income from operations 191 223 183 85 6 — — 688 Income from operations as a % of revenue 3.0% 3.4% 2.9% 1.3% 0.1% —% —% 10.7% Interest and Other (expense) income, net (152) — — — — (45) — (197) Income from continuing operations before 39 223 183 85 6 (45) — 491 income taxes Income tax expense 73 41 8 17 1 (1) (45) 94 Effective income tax rate 187% 19% Income from continuing operations (34) 182 175 68 5 (44) 45 397 Net income attributable to noncontrolling 2 — 1 — — — — 3 interests Income from continuing operations ($36) $182 $174 $68 $5 ($44) $45 $394 (attributable to NCR) Diluted earnings per share ($0.72) $1.21 $1.16 $0.45 $0.03 ($0.29) $0.30 $2.62 Diluted Shares outstanding 118.4 150.2 29

GAAP TO NON-GAAP RECONCILIATION FY 2018 FY 2018 FY 2018 GAAP non-GAAP in millions (except per share amounts) Income from continuing operations attributable to NCR common stockholders: Income from continuing operations (attributable to NCR) $(36) $394 Dividends on convertible preferred shares (49) — Income from continuing operations attributable to NCR common $(85) $394 stockholders Weighted average outstanding shares: Weighted average diluted shares outstanding 118.4 121.9 Weighted as-if converted preferred shares — 28.3 Total shares used in diluted earnings per share 118.4 150.2 Diluted earnings per share (1) ($0.72) $2.62 (1) GAAP EPS is determined using the most dilutive measure, either including the impact of the dividends on NCR's Series A Convertible Preferred Shares in the calculation of net income or loss available to common stockholders or including the impact of the conversion of such preferred stock into common stock in the calculation of the weighted average diluted shares outstanding. Non-GAAP EPS is always determined using the as-if converted preferred shares and shares that would be issued for stock compensation awards. Therefore, GAAP diluted EPS and non-GAAP diluted EPS may be calculated using different methods, and may not mathematically reconcile. 30
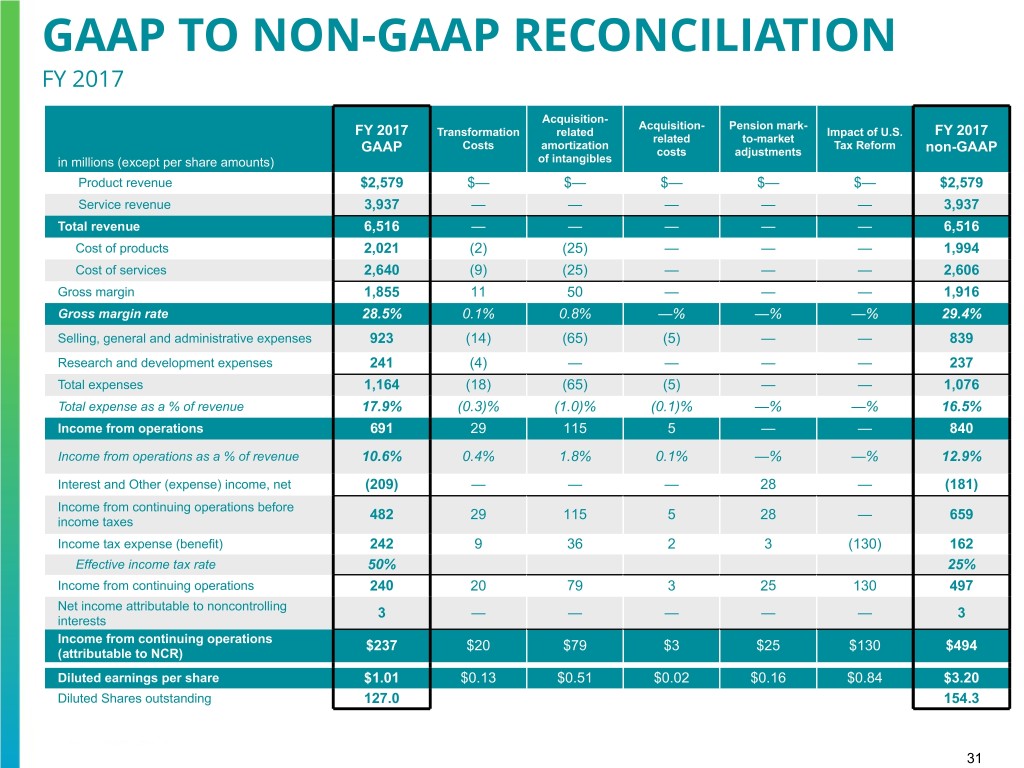
GAAP TO NON-GAAP RECONCILIATION FY 2017 Acquisition- Acquisition- Pension mark- FY 2017 Transformation related Impact of U.S. FY 2017 related to-market Costs amortization Tax Reform GAAP costs adjustments non-GAAP in millions (except per share amounts) of intangibles Product revenue $2,579 $— $— $— $— $— $2,579 Service revenue 3,937 — — — — — 3,937 Total revenue 6,516 — — — — — 6,516 Cost of products 2,021 (2) (25) — — — 1,994 Cost of services 2,640 (9) (25) — — — 2,606 Gross margin 1,855 11 50 — — — 1,916 Gross margin rate 28.5% 0.1% 0.8% —% —% —% 29.4% Selling, general and administrative expenses 923 (14) (65) (5) — — 839 Research and development expenses 241 (4) — — — — 237 Total expenses 1,164 (18) (65) (5) — — 1,076 Total expense as a % of revenue 17.9% (0.3)% (1.0)% (0.1)% —% —% 16.5% Income from operations 691 29 115 5 — — 840 Income from operations as a % of revenue 10.6% 0.4% 1.8% 0.1% —% —% 12.9% Interest and Other (expense) income, net (209) — — — 28 — (181) Income from continuing operations before 482 29 115 5 28 — 659 income taxes Income tax expense (benefit) 242 9 36 2 3 (130) 162 Effective income tax rate 50% 25% Income from continuing operations 240 20 79 3 25 130 497 Net income attributable to noncontrolling 3 — — — — — 3 interests Income from continuing operations $237 $20 $79 $3 $25 $130 $494 (attributable to NCR) Diluted earnings per share $1.01 $0.13 $0.51 $0.02 $0.16 $0.84 $3.20 Diluted Shares outstanding 127.0 154.3 31

GAAP TO NON-GAAP RECONCILIATION FY 2017 FY 2017 FY 2017 GAAP non-GAAP in millions (except per share amounts) Income from continuing operations attributable to NCR common stockholders: Income from continuing operations (attributable to NCR) $237 $494 Dividends on convertible preferred shares (47) — Deemed dividend on modification of convertible preferred shares (4) — Deemed dividend on convertible preferred shares related to redemption value (58) — accretion Income from continuing operations attributable to NCR common $128 $494 stockholders Weighted average outstanding shares: Weighted average diluted shares outstanding 127.0 127.0 Weighted as-if converted preferred shares — 27.3 Total shares used in diluted earnings per share 127.0 154.3 Diluted earnings per share (1) $1.01 $3.20 (1) GAAP EPS is determined using the most dilutive measure, either including the impact of the dividends on NCR's Series A Convertible Preferred Shares in the calculation of net income or loss available to common stockholders or including the impact of the conversion of such preferred stock into common stock in the calculation of the weighted average diluted shares outstanding. Non-GAAP EPS is always determined using the as-if converted preferred shares and shares that would be issued for stock compensation awards. Therefore, GAAP diluted EPS and non-GAAP diluted EPS may be calculated using different methods, and may not mathematically reconcile. 32

GAAP TO NON-GAAP RECONCILIATION Q4 2018 QTD & YTD Gross Margin and Gross Margin Rate (non-GAAP) to Gross Margin and Gross Margin Rate (GAAP) Q4 2018 QTD Q4 2018 YTD Gross Margin Gross Margin Gross Margin Rate % Gross Margin Rate % Software 245 48.8% 916 47.9% Services 172 27.2% 639 26.0% Hardware 78 11.7% 245 12.1% Total Gross Margin (non-GAAP) 495 27.5% 1,800 28.1% Less: Transformation Costs 48 2.7% 102 1.5% Acquisition-related amortization of intangibles 5 0.3% 23 0.4% Total Gross Margin (GAAP) 442 24.5% 1,675 26.2% 33
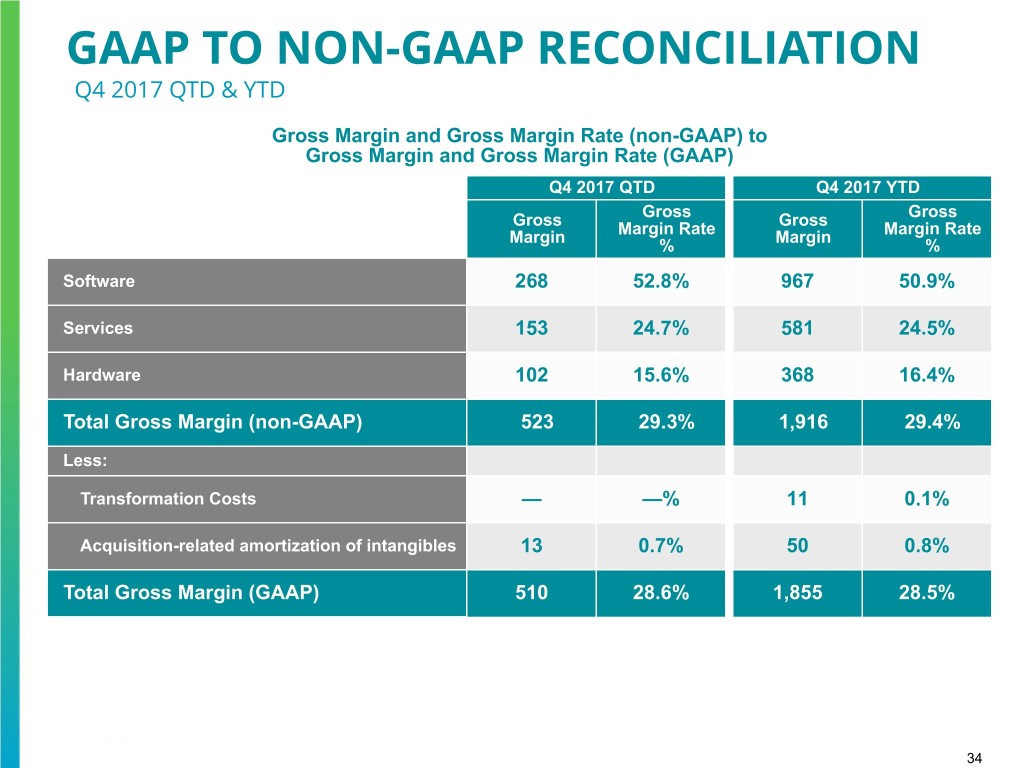
GAAP TO NON-GAAP RECONCILIATION Q4 2017 QTD & YTD Gross Margin and Gross Margin Rate (non-GAAP) to Gross Margin and Gross Margin Rate (GAAP) Q4 2017 QTD Q4 2017 YTD Gross Gross Gross Margin Rate Gross Margin Rate Margin % Margin % Software 268 52.8% 967 50.9% Services 153 24.7% 581 24.5% Hardware 102 15.6% 368 16.4% Total Gross Margin (non-GAAP) 523 29.3% 1,916 29.4% Less: Transformation Costs — —% 11 0.1% Acquisition-related amortization of intangibles 13 0.7% 50 0.8% Total Gross Margin (GAAP) 510 28.6% 1,855 28.5% 34
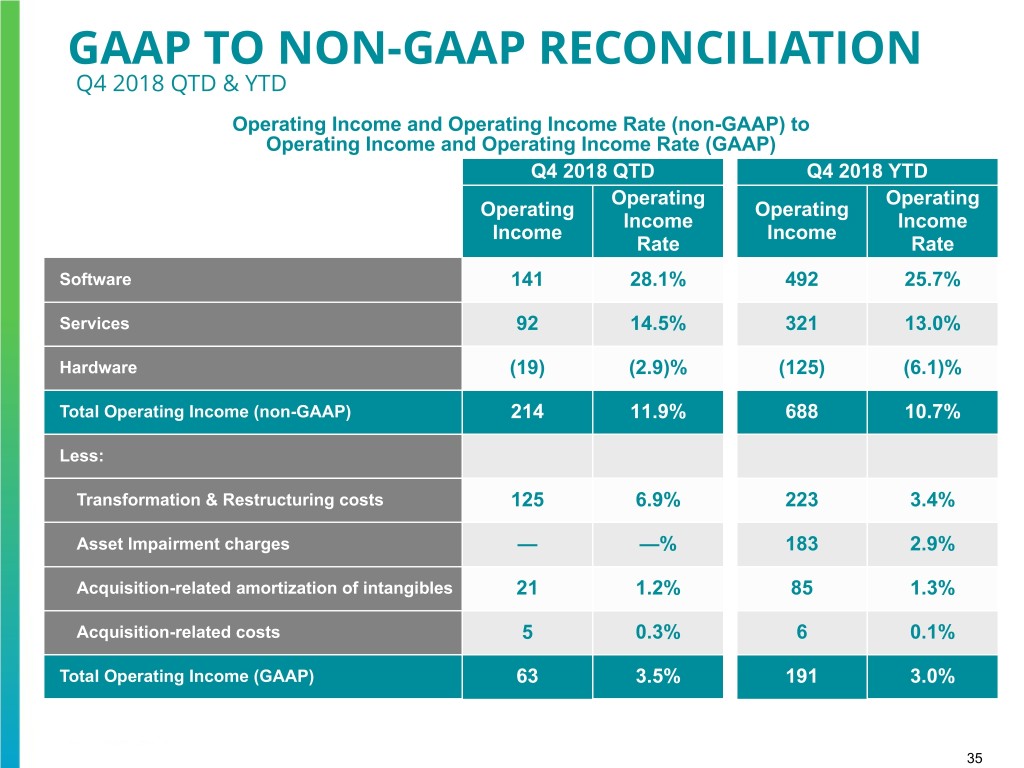
GAAP TO NON-GAAP RECONCILIATION Q4 2018 QTD & YTD Operating Income and Operating Income Rate (non-GAAP) to Operating Income and Operating Income Rate (GAAP) Q4 2018 QTD Q4 2018 YTD Operating Operating Operating Operating Income Income Income Income Rate Rate Software 141 28.1% 492 25.7% Services 92 14.5% 321 13.0% Hardware (19) (2.9)% (125) (6.1)% Total Operating Income (non-GAAP) 214 11.9% 688 10.7% Less: Transformation & Restructuring costs 125 6.9% 223 3.4% Asset Impairment charges — —% 183 2.9% Acquisition-related amortization of intangibles 21 1.2% 85 1.3% Acquisition-related costs 5 0.3% 6 0.1% Total Operating Income (GAAP) 63 3.5% 191 3.0% 35
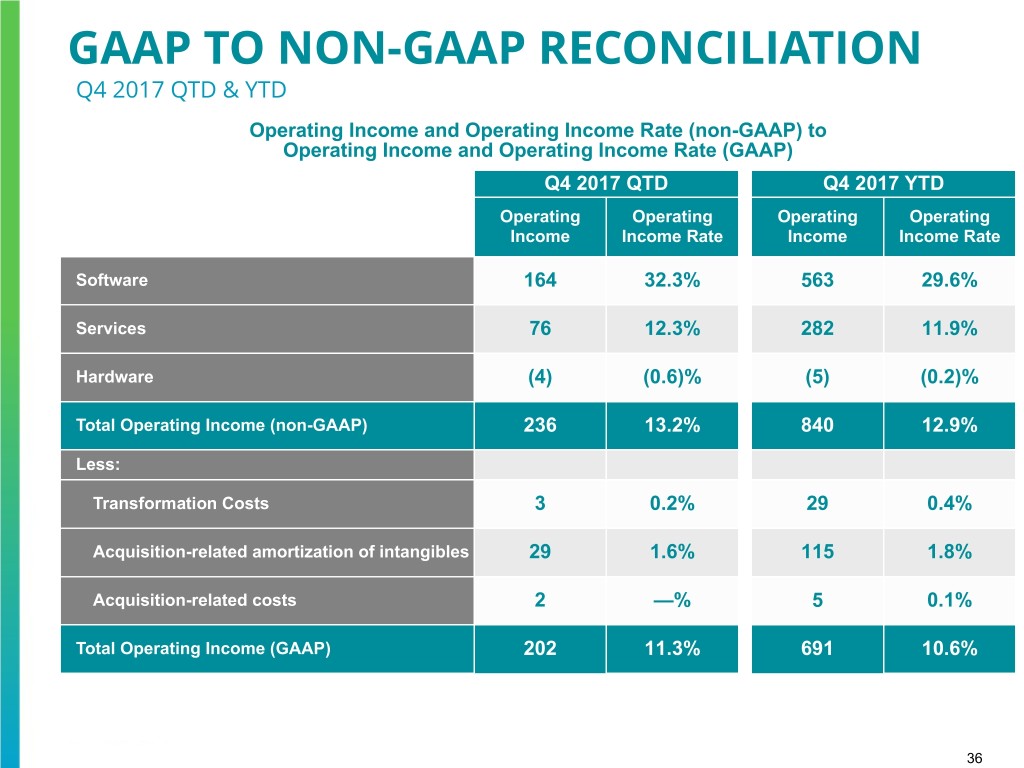
GAAP TO NON-GAAP RECONCILIATION Q4 2017 QTD & YTD Operating Income and Operating Income Rate (non-GAAP) to Operating Income and Operating Income Rate (GAAP) Q4 2017 QTD Q4 2017 YTD Operating Operating Operating Operating Income Income Rate Income Income Rate Software 164 32.3% 563 29.6% Services 76 12.3% 282 11.9% Hardware (4) (0.6)% (5) (0.2)% Total Operating Income (non-GAAP) 236 13.2% 840 12.9% Less: Transformation Costs 3 0.2% 29 0.4% Acquisition-related amortization of intangibles 29 1.6% 115 1.8% Acquisition-related costs 2 —% 5 0.1% Total Operating Income (GAAP) 202 11.3% 691 10.6% 36

GAAP TO NON-GAAP RECONCILIATION Revenue Growth % (GAAP) to Revenue Growth Constant Currency % (non-GAAP) Q4 2018 QTD Q4 2018 YTD Revenue Revenue Growth Revenue Favorable Growth Revenue Favorable Adjusted Growth % (unfavorable) Constant Growth % (unfavorable) Constant (GAAP) FX impact Currency % (GAAP) FX impact Currency % (non- (non- GAAP) GAAP) Software License (5)% (1)% (4)% (8)% —% (8)% Attached License 11% (5)% 16% (8)% —% (8)% Unattached License (16)% —% (16)% (8)% —% (8)% Software Maintenance (6)% (1)% (5)% (2)% —% (2)% Cloud 4% (1)% 5% 7% —% 7% Professional Services (1)% (2)% 1% 2% 1% 1% Software (1)% (1)% —% 1% —% 1% Services 2% (3)% 5% 4% —% 4% ATMs 21% (5)% 26% (3)% —% (3)% Self-Checkout (SCO) (16)% —% (16)% (15)% —% (15)% Point-of-Sale (POS) (13)% (1)% (12)% (12)% —% (12)% Interactive Printer Solutions (IPS) (100)% —% (100)% (100)% —% (100)% Hardware 2% (2)% 4% (9)% —% (9)% Total Revenue 1% (2)% 3% (2)% —% (2)% 37
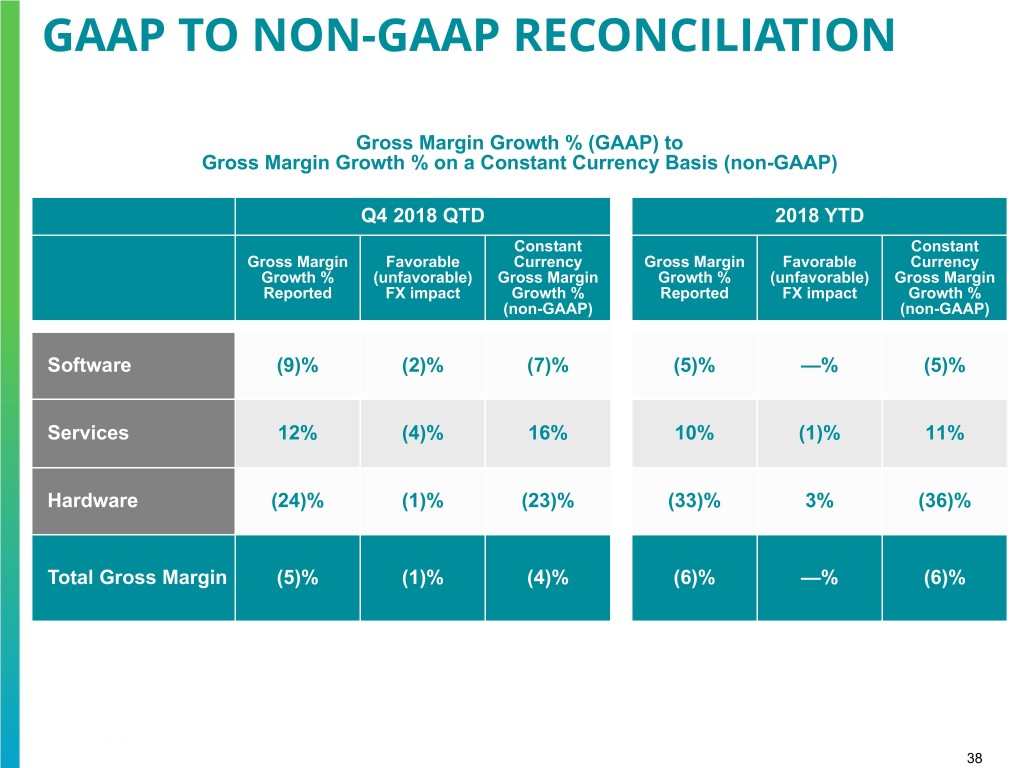
GAAP TO NON-GAAP RECONCILIATION Gross Margin Growth % (GAAP) to Gross Margin Growth % on a Constant Currency Basis (non-GAAP) Q4 2018 QTD 2018 YTD Constant Constant Gross Margin Favorable Currency Gross Margin Favorable Currency Growth % (unfavorable) Gross Margin Growth % (unfavorable) Gross Margin Reported FX impact Growth % Reported FX impact Growth % (non-GAAP) (non-GAAP) Software (9)% (2)% (7)% (5)% —% (5)% Services 12% (4)% 16% 10% (1)% 11% Hardware (24)% (1)% (23)% (33)% 3% (36)% Total Gross Margin (5)% (1)% (4)% (6)% —% (6)% 38
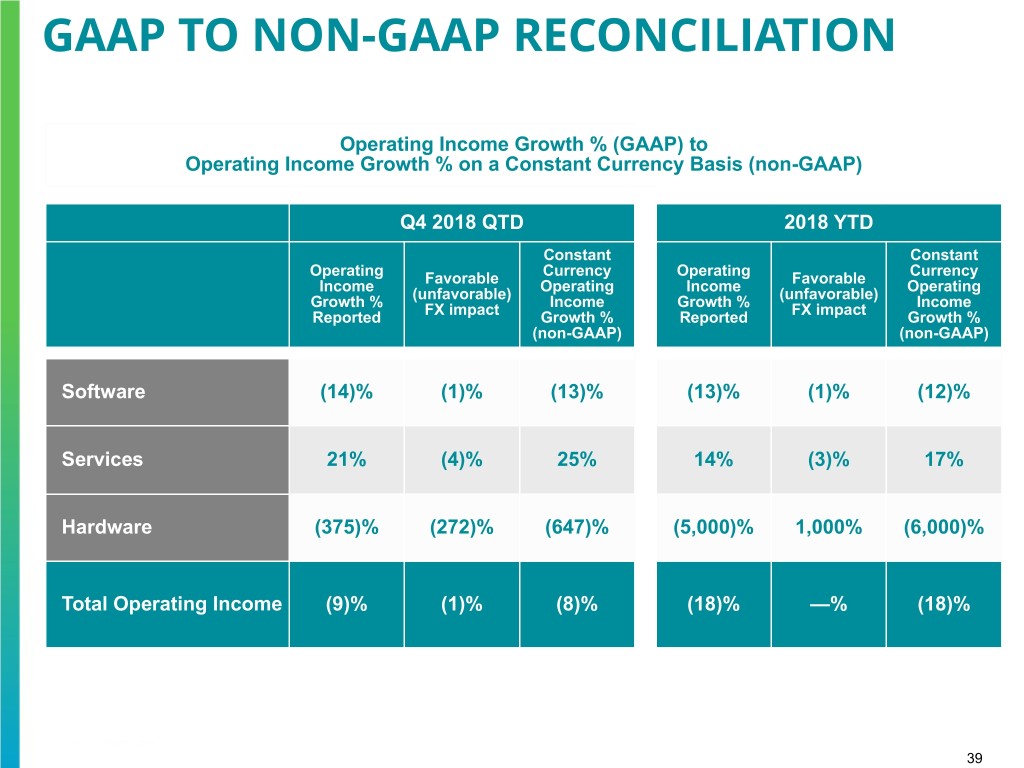
GAAP TO NON-GAAP RECONCILIATION Operating Income Growth % (GAAP) to Operating Income Growth % on a Constant Currency Basis (non-GAAP) Q4 2018 QTD 2018 YTD Constant Constant Operating Currency Operating Currency Income Favorable Operating Income Favorable Operating Growth % (unfavorable) Income Growth % (unfavorable) Income Reported FX impact Growth % Reported FX impact Growth % (non-GAAP) (non-GAAP) Software (14)% (1)% (13)% (13)% (1)% (12)% Services 21% (4)% 25% 14% (3)% 17% Hardware (375)% (272)% (647)% (5,000)% 1,000% (6,000)% Total Operating Income (9)% (1)% (8)% (18)% —% (18)% 39

GAAP TO NON-GAAP RECONCILIATION Gross Margin Growth bps (GAAP) to Gross Margin Growth bps on a Constant Currency Basis (non-GAAP) Q4 2018 QTD 2018 YTD Constant Constant Gross Margin Favorable Currency Gross Margin Favorable Currency bps Growth (unfavorable) Gross Margin bps Growth (unfavorable) Gross Margin Reported FX impact bps Growth Reported FX impact bps Growth (non-GAAP) (non-GAAP) Software (400) bps — bps (400) bps (300) bps 10 bps (290) bps Services 250 bps 10 bps 260 bps 150 bps 20 bps 170 bps Hardware (390) bps (20) bps (410) bps (430) bps 30 bps (400) bps Total Gross Margin bps (180) bps (20) bps (200) bps (130) bps (10) bps (140) bps 40

GAAP TO NON-GAAP RECONCILIATION Operating Income Growth bps (GAAP) to Operating Income Growth bps on a Constant Currency Basis (non-GAAP) Q4 2018 QTD 2018 YTD Constant Constant Operating Favorable Currency Operating Favorable Currency Income bps (unfavorable) Operating Income bps (unfavorable) Operating Growth FX impact Income bps Growth FX impact Income bps Reported Growth (non- Reported Growth (non- GAAP) GAAP) Software (420) bps (10) bps (430) bps (390) bps 10 bps (380) bps Services 220 bps 10 bps 230 bps 110 bps 30 bps 140 bps Hardware (230) bps (20) bps (250) bps (590) bps (50) bps (640) bps Total Operating Income (130) bps 20 bps (150) bps (220) bps — bps (220) bps 41

GAAP TO NON-GAAP RECONCILIATION Diluted Earnings Per Share 2019 Guidance Diluted EPS (GAAP) (1) (2) $1.91 - $2.01 Transformation & Restructuring costs 0.31 Acquisition-Related Amortization of Intangibles 0.48 Acquisition-Related Costs 0.05 Non-GAAP Diluted EPS (1) (3) $2.75 - $2.85 (1) Non-GAAP diluted EPS is determined using the conversion of the Series A Convertible Preferred Stock into common stock in the calculation of weighted average diluted shares outstanding. GAAP EPS is determined using the most dilutive measure, either including the impact of dividends or deemed dividends on the Company's Series A Convertible Preferred Stock in the calculation of net income or loss available to common stockholders or including the impact of the conversion of the Series A Convertible Preferred Stock into common stock in the calculation of the weighted average diluted shares outstanding. Therefore, GAAP diluted EPS and non-GAAP diluted EPS may not mathematically reconcile. (2) Except for the adjustments noted herein, this guidance does not include the effects of any future acquisitions/ divestitures, pension mark-to-market adjustments, taxes or other events, which are difficult to predict and which may or may not be significant. (3) For FY 2019, we have assumed an effective tax rate of 23% to 24% and a share count of 151 million compared to an effective tax rate of 19% and a share count of 150 million in FY 2018. 42
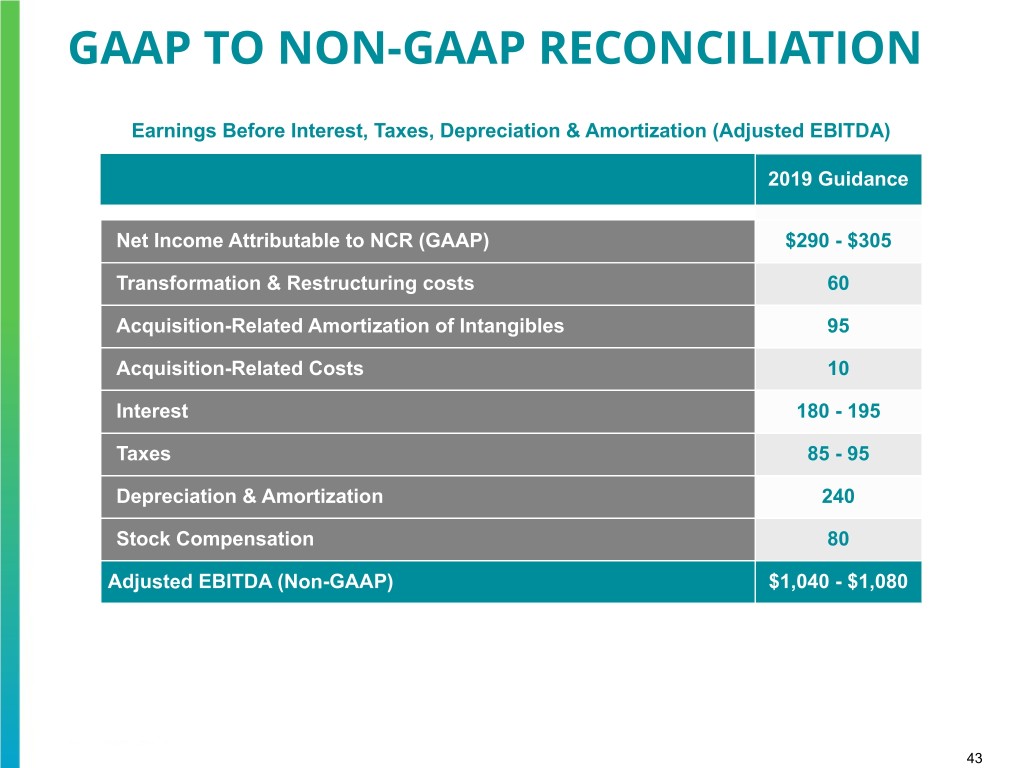
GAAP TO NON-GAAP RECONCILIATION Earnings Before Interest, Taxes, Depreciation & Amortization (Adjusted EBITDA) 2019 Guidance Net Income Attributable to NCR (GAAP) $290 - $305 Transformation & Restructuring costs 60 Acquisition-Related Amortization of Intangibles 95 Acquisition-Related Costs 10 Interest 180 - 195 Taxes 85 - 95 Depreciation & Amortization 240 Stock Compensation 80 Adjusted EBITDA (Non-GAAP) $1,040 - $1,080 43
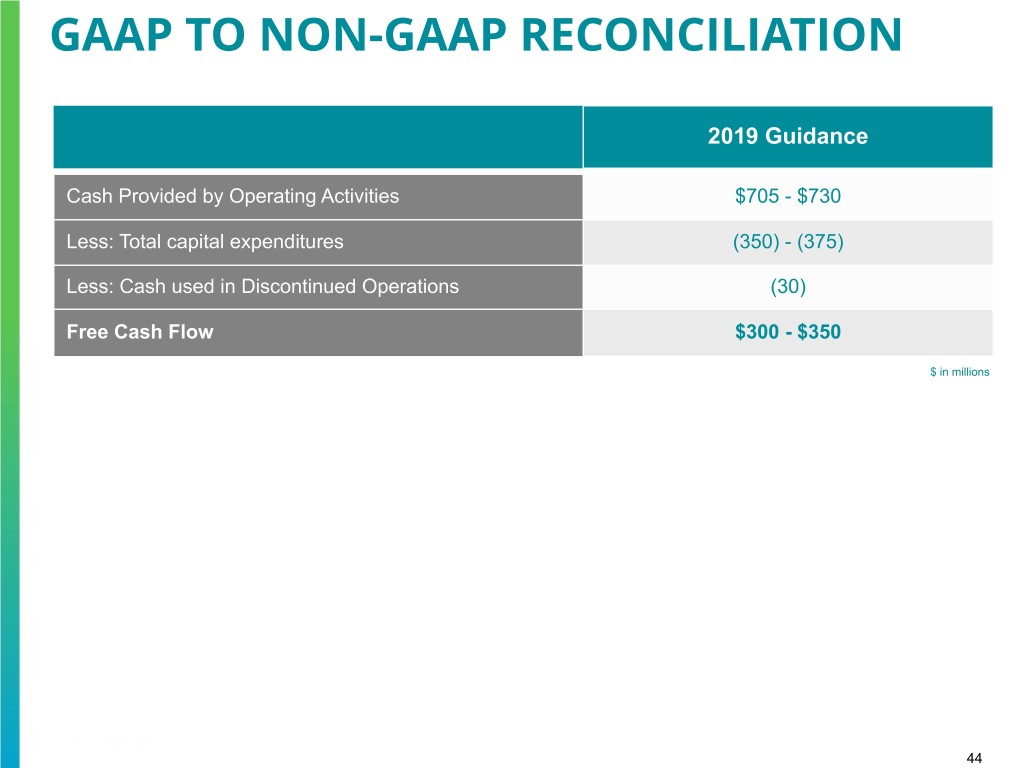
GAAP TO NON-GAAP RECONCILIATION 2019 Guidance Cash Provided by Operating Activities $705 - $730 Less: Total capital expenditures (350) - (375) Less: Cash used in Discontinued Operations (30) Free Cash Flow $300 - $350 $ in millions 44


