Exhibit 99.1
|
NCR Analyst Day
DECEMBER 6, 2007
NEW YORK STOCK EXCHANGE NEW YORK, NEW YORK
|
Agenda
Bill Nuti – NCR Business Strategy
Chairman & CEO
Q&A
Alan Chow – Product Development Strategy
SVP, Product Development & CTO
Peter Dorsman – Global Operations Strategy
SVP, Global Operations
Chris Wallace – Customer Services Strategy
SVP, Worldwide Customer Services
Bob Fishman – NCR Business Model
Interim CFO & Corporate Controller
Q&A
|
Note to Investors
Certain non-GAAP financial information regarding NCR’s operating results may be discussed during this presentation. Reconciliations of the differences between GAAP and non-GAAP measures are available on the Investor page of NCR’s website at www.ncr.com. Remarks and responses associated with this presentation include forward-looking statements that are based on current expectations. These forward-looking statements are subject to a number of risks and uncertainties that could cause actual results to vary materially.
These risk factors are detailed from time to time in NCR’s
SEC reports, including, but not limited to, Forms 10Q, 10K, 8K and the company’s annual report to shareholders.
|
NCR Business Strategy
Bill Nuti
Chairman & CEO
|
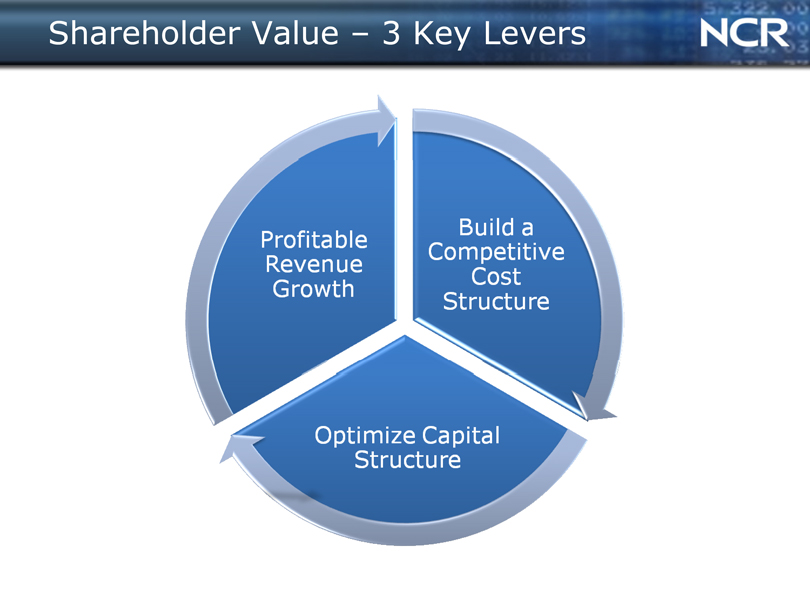
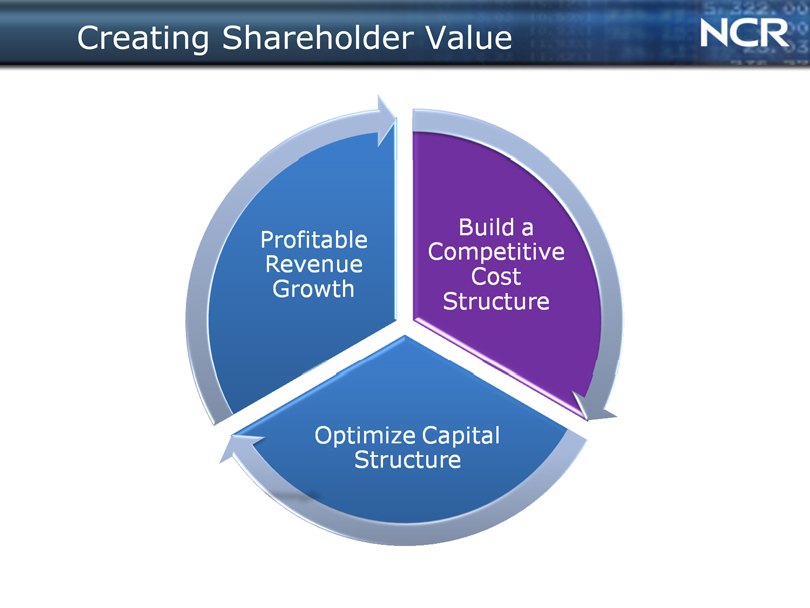
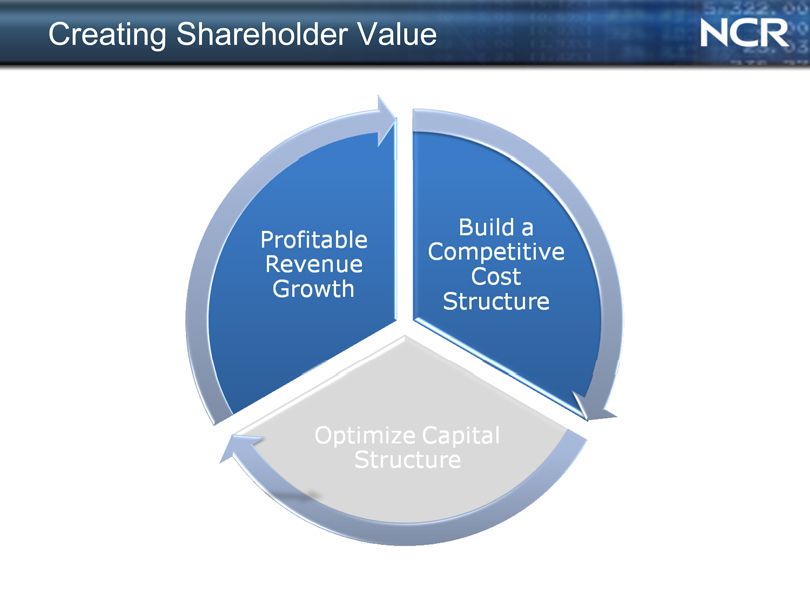
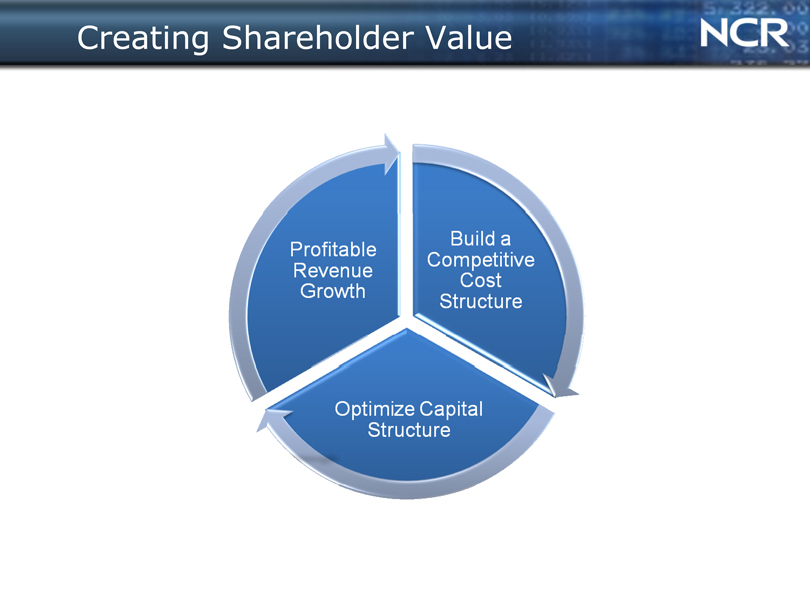
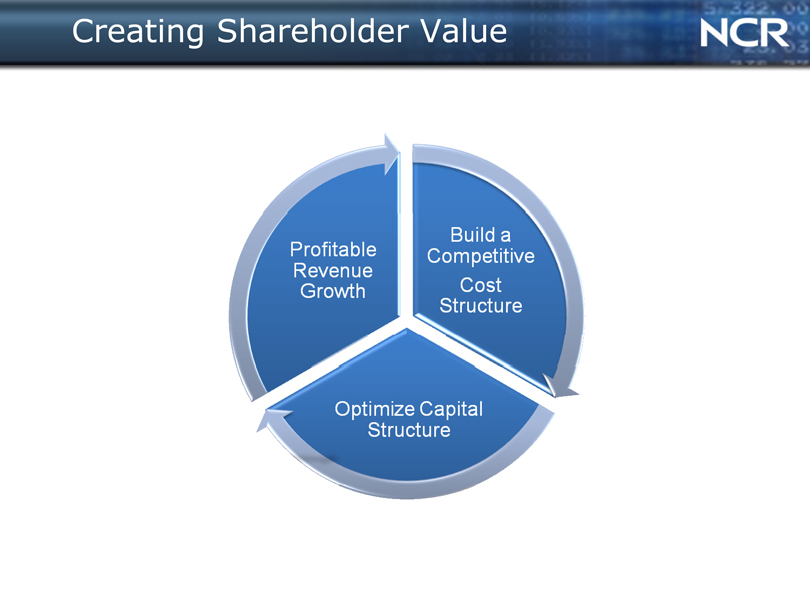
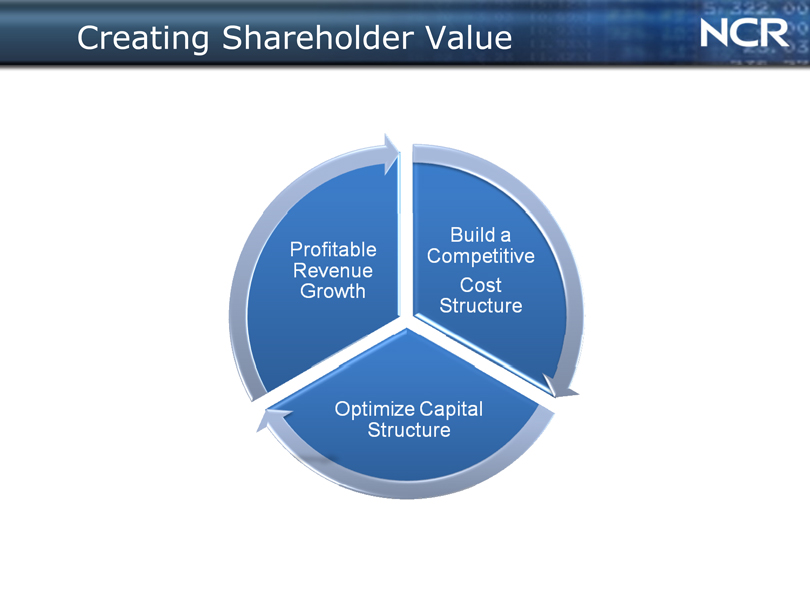
Shareholder Value – 3 Key Levers
Profitable Revenue Growth
Build a Competitive Cost Structure
Optimize Capital Structure
|
Key Take-Aways
Strong foundation
Consumer demand for self-service is fueling growth NCR is well positioned to be a global leader in self-service The addressable market for self-service is expanding Focused on improving execution Proven and experienced management team
|
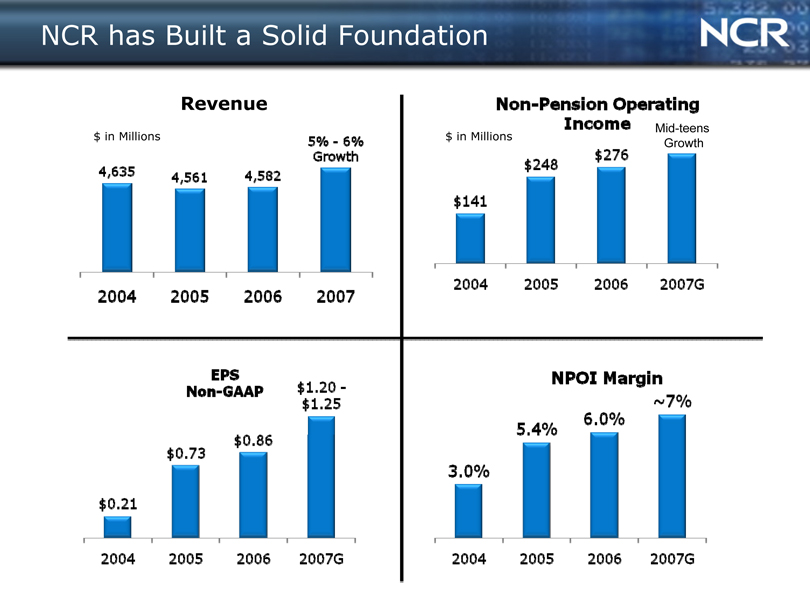
NCR has Built a Solid Foundation
Mid-teens Growth
4,582
$ in Millions
4,635
Revenue
4,561
5%—6% Growth
Non-Pension Operating
Income
$276
$ in Millions
$248
$141
2004 2005 2006 2007
2004 2005 2006 2007G
EPS Non-GAAP
$0.86
$0.73
$1.20-$1.25
3.0%
NPOI Margin
-7%
6.0%
5.4%
*— *
$0.21
2004 2005 2006 2007G
2004 2005 2006 2007G
|
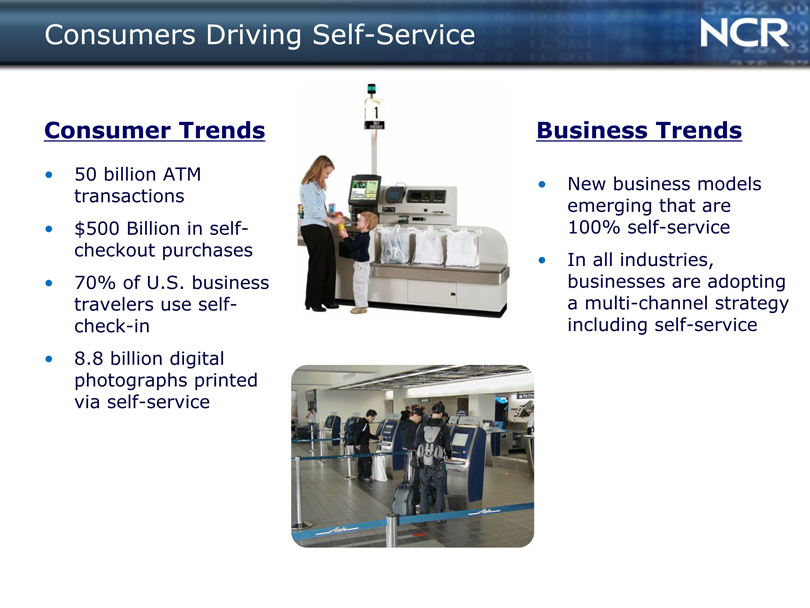
Consumers Driving Self-Service
Consumer Trends
50 billion ATM transactions
$ 500 Billion in self-checkout purchases
70% of U.S. business travelers use self-check-in
8.8 billion digital photographs printed via self-service
Business Trends
New business models emerging that are 100% self-service
In all industries, businesses are adopting a multi-channel strategy including self-service
|
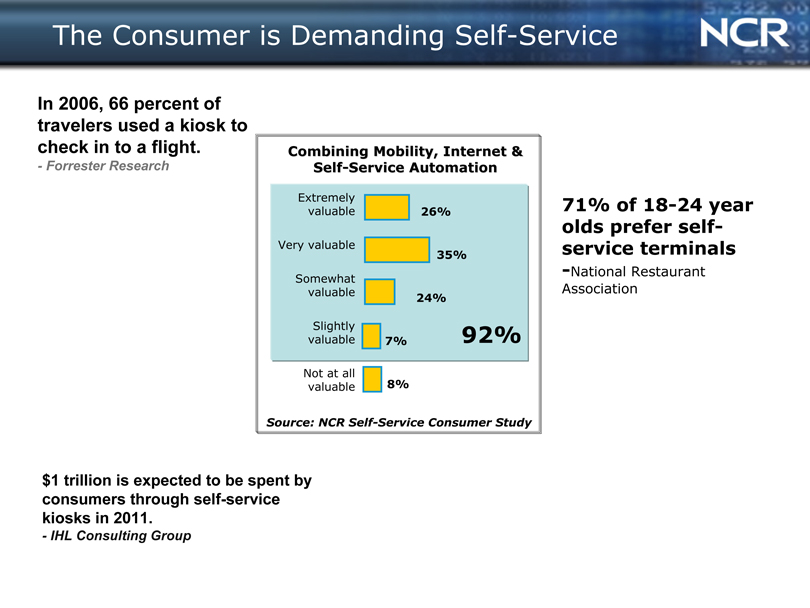
The Consumer is Demanding Self-Service
In 2006, 66 percent of travelers used a kiosk to check in to a flight.
- Forrester Research
Combining Mobility, Internet & Self-Service Automation
Extremely valuable 26%
Very valuable
35%
Somewhat valuable
24%
Slightly 92% valuable 7%
Not at all valuable 8%
Source: NCR Self-Service Consumer Study
71% of 18-24 year olds prefer self-service terminals
-National Restaurant Association $1 trillion is expected to be spent by consumers through self-service kiosks in 2011.
- IHL Consulting Group
|
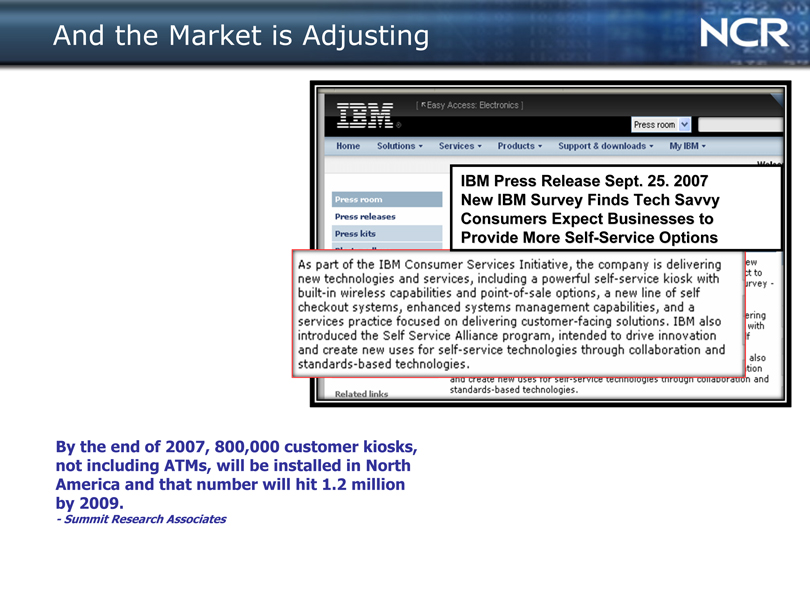
And the Market is Adjusting
IBM Press Release Sept. 25. 2007 New IBM Survey Finds Tech Savvy Consumers Expect Businesses to Provide More Self-Service Options
By the end of 2007, 800,000 customer kiosks, not including ATMs, will be installed in North America and that number will hit 1.2 million by 2009.
- Summit Research Associates
|
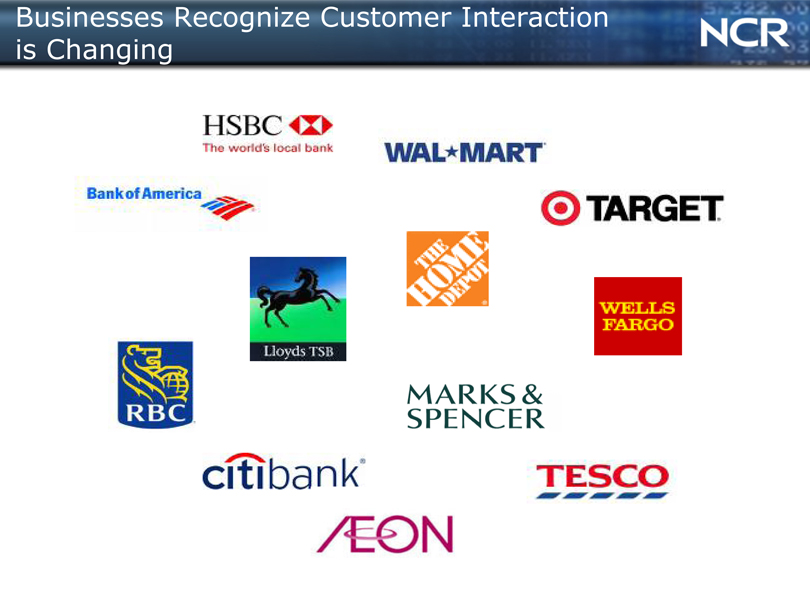
Businesses Recognize Customer Interaction is Changing
|
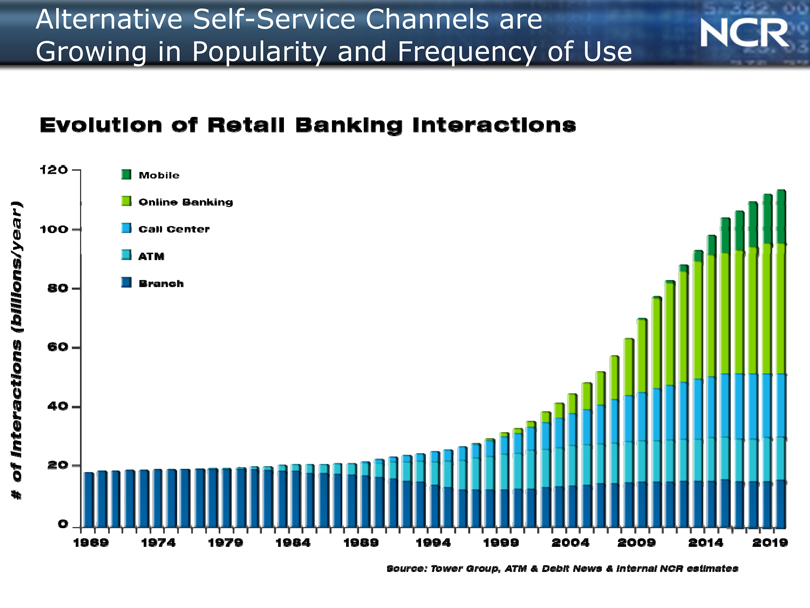
Alternative Self-Service Channels are Growing in Popularity and Frequency of Use
Evolution of Retail Banking Interactions
Mobile
Online Banking
Call Center
ATM
Branch
1969 1974 1979 1984 1989 1994 1999 2004 2009 2014 2019
source: Tower Group, ATM & Debit News & Internal NCR estimates
|
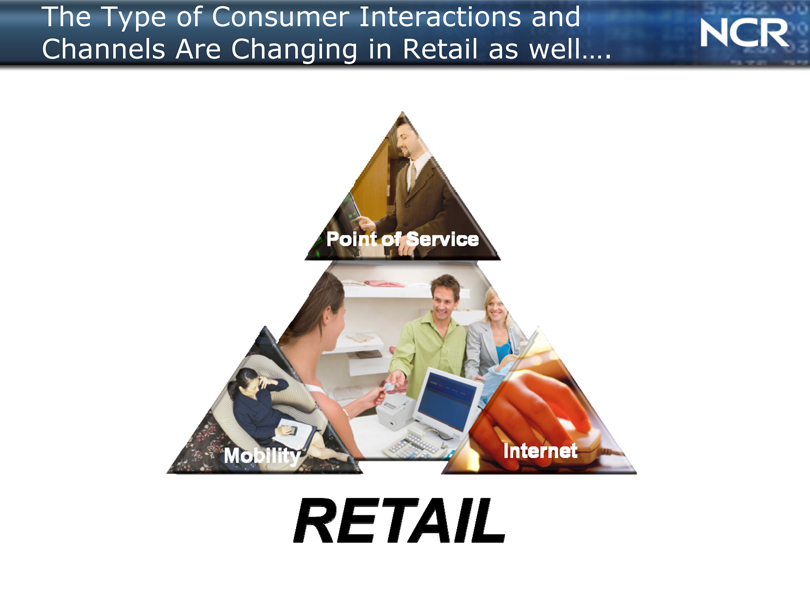
The Type of Consumer Interactions and Channels Are Changing in Retail as well….
POINT OF SERVICE
MOBILITY
INTERNET
|
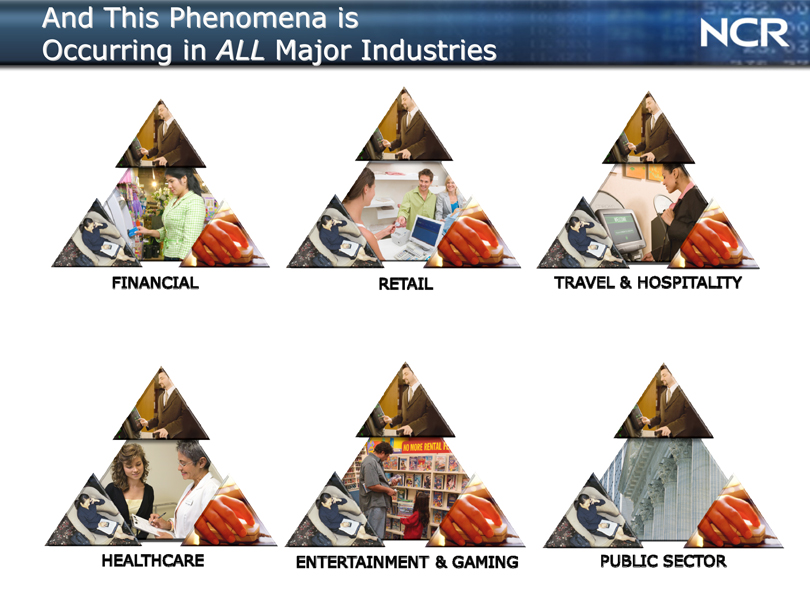
And This Phenomena is
Occurring in ALL Major Industries
FINANCIAL
RETAIL
TRAVEL & HOSPITALITY
HEALTHCARE
ENTERTAINMENT & GAMING
PUBLIC SECTOR
|
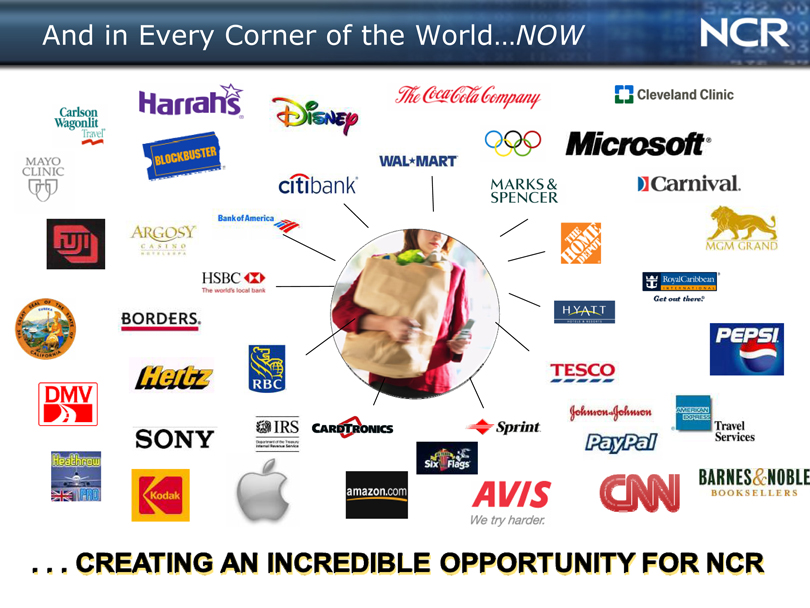
And in Every Corner of the World…NOW
. CREATING AN INCREDIBLE OPPORTUNITY FOR NCR
|
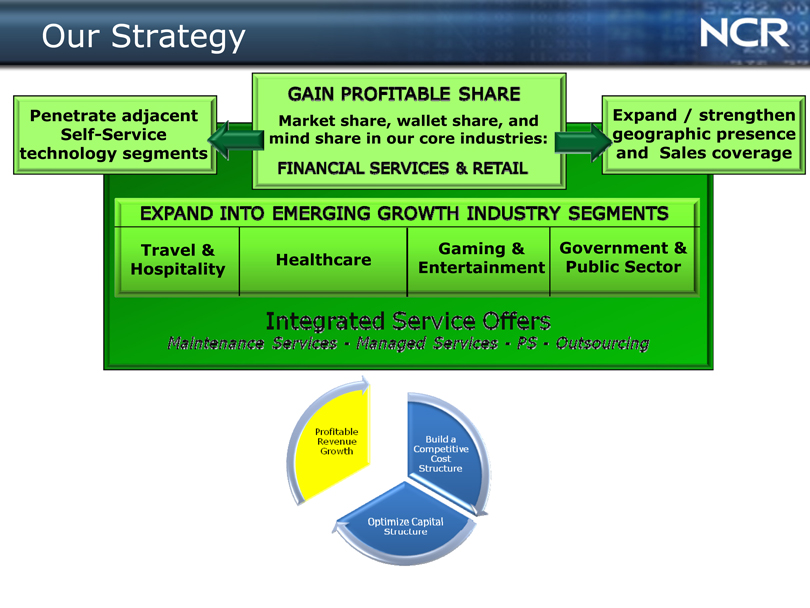
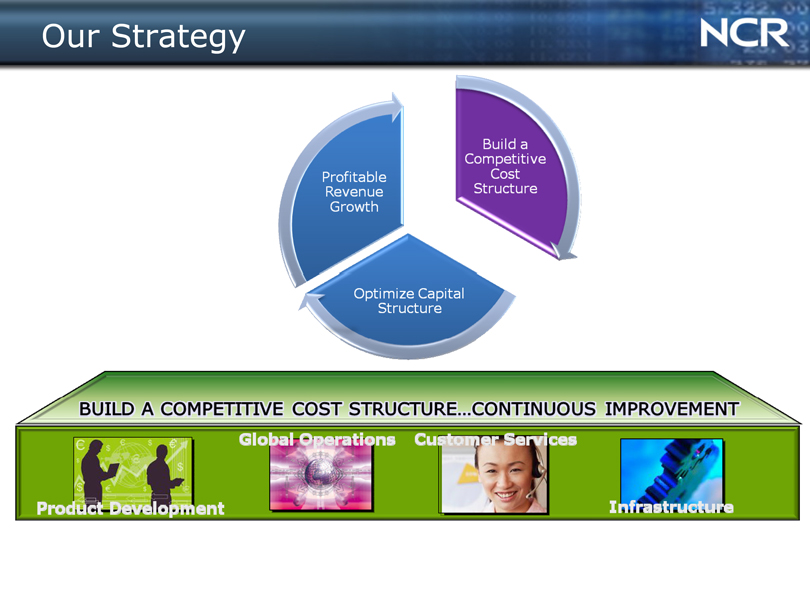
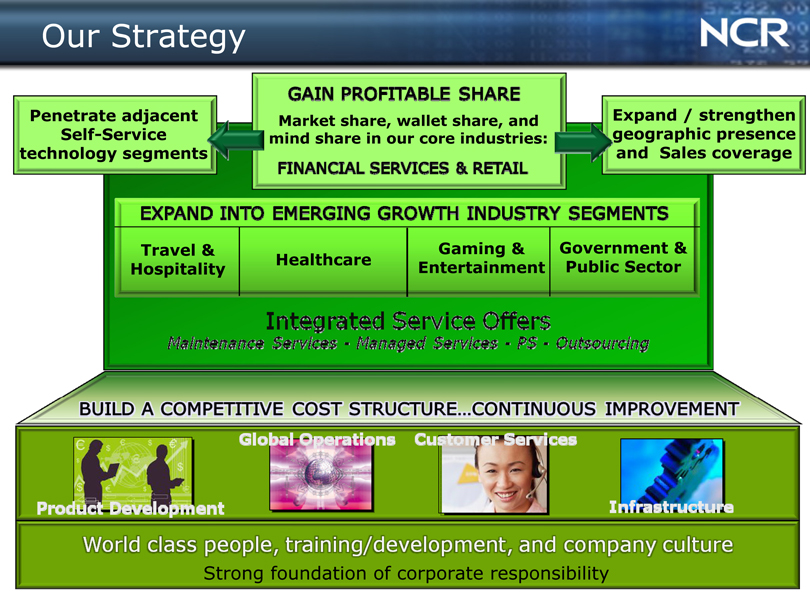
Our Strategy
Penetrate adjacent Self-Service technology segments
Market share, wallet share, and mind share in our core industries:
Expand / strengthen geographic presence and Sales coverage
Travel & Gaming & Government & Healthcare Entertainment Public Sector Hospitality
EXPAND INTO EMERGING GROWTH INDUSTRY SEGMENTS
Integrated Service Offers
Maintenance Services—Managed Services—PS—Outsourcing
Profitable Revenue Growth
Build a Competitive Cost Structure
Optimize Capital Structure
|
Our Strategy
Profitable Revenue Growth
Build a Competitive Cost Structure
Optimize Capital Structure
BUILD A COMPETITIVE COST STRUCTURE.CONTINUOUS IMPROVEMENT
PRODUCT DEVELOPMENT
GLOBAL OPERATIONS
CUSTOMER SERVICES
INFRASTRUCTURE
|
Our Strategy
Penetrate adjacent Self-Service technology segments
Market share, wallet share, and mind share in our core industries:
Expand / strengthen geographic presence and Sales coverage
Travel & Hospitality Healthcare Gaming & Entertainment Government & Public Sector
BUILD A COMPETITIVE COST STRUCTURE.CONTINUOUS IMPROVEMENT
PRODUCT DEVELOPMENT
GLOBAL OPERATIONS
CUSTOMER SERVICES
INFRASTRUCTURE
|
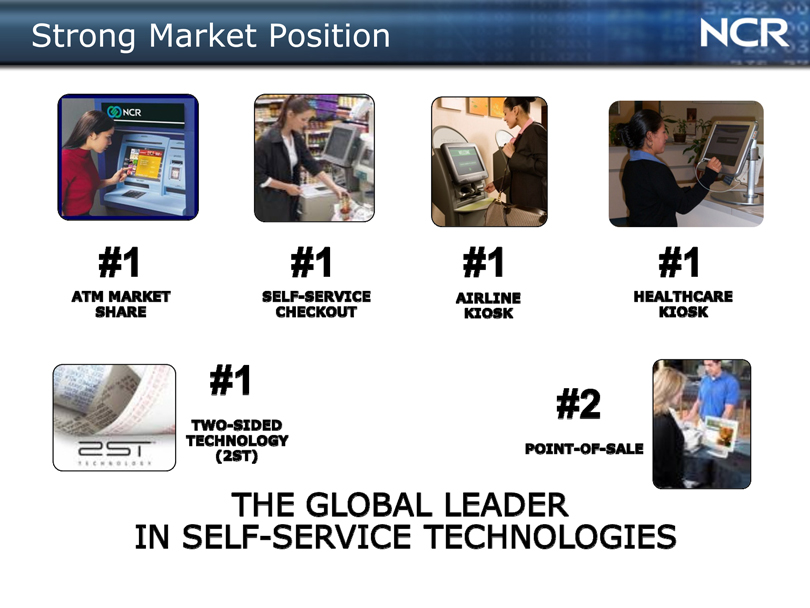
Strong Market Position
#1
ATM MARKET SHARE
#1
SELF-SERVICE CHECKOUT
#1
AIRLINE KIOSK
#1
HEALTHCARE KIOSK
#1
TWO-SIDED
TECHNOLOGY
(2ST)
#2
POINT-OF-SALE
THE GLOBAL LEADER IN SELF-SERVICE TECHNOLOGIES
|
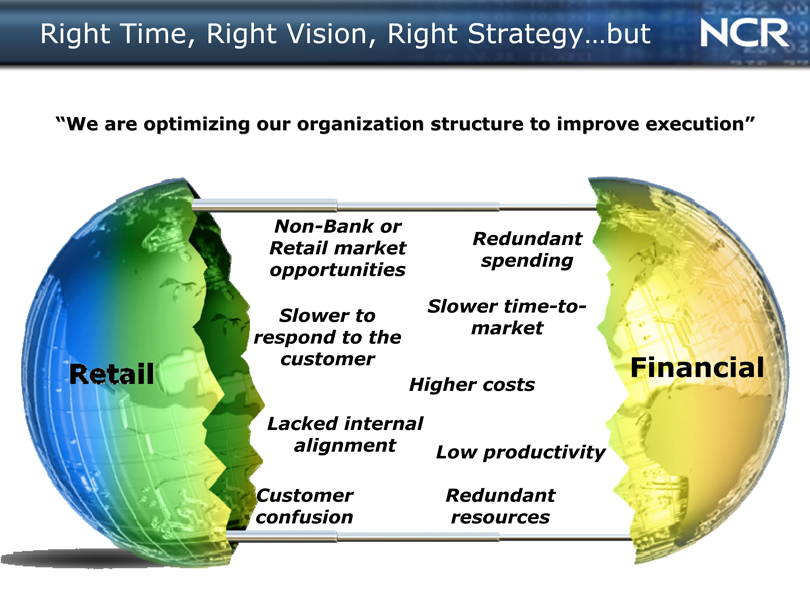
Right Time, Right Vision, Right Strategy…but
“We are optimizing our organization structure to improve execution”
Non-Bank or Retail market opportunities
Slower to respond to the customer
Lacked internal alignment
Customer confusion
Redundant spending
Slower time-to-market
Higher costs
Low productivity
Redundant resources
Financial
RETAIL
|
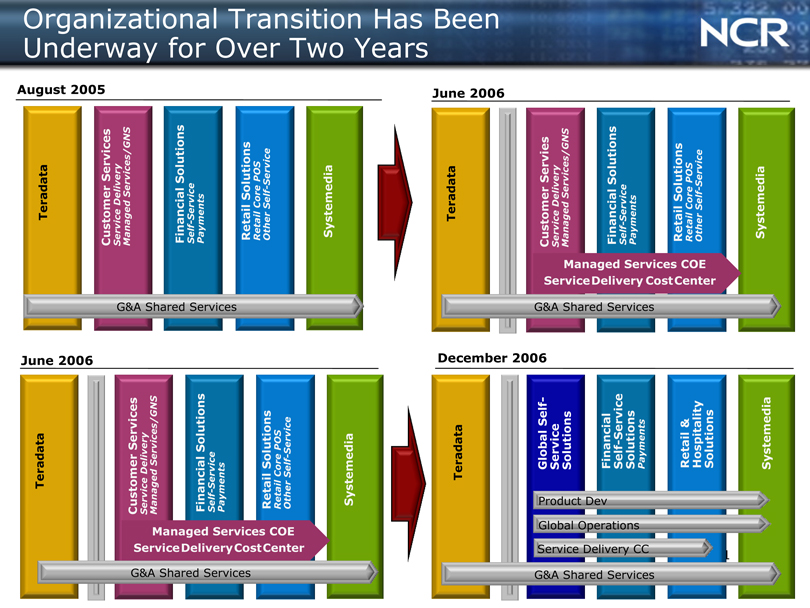
Organizational Transition Has Been Underway for Over Two Years
August 2005
G&A Shared Services
June 2006
Managed Services COE ServiceDeliveryCostCenter ServiceDeliveryCostCenter
G&A Shared Services G&A Shared Services
June 2006
Managed Services COE ServiceDelivery ServiceDeliveryCostCenter CostCenter
G&A Shared Services
December 2006
Product Dev Global Operations Service Delivery CC
G&A Shared Services
TERADATA
CUSTOMER SERVICES
SERVICE DELIVERY
MANAGED SERVICES/GNS
FINANANCIAL SOLUTIONS
Self-Service Payments
RETAIL SOLUTIONS
RETAIL CORE POS
OTHER SELF-SERVICES
SYSTEMEDIA
GLOBAL SELF-SERVICE SOLUTIONS
FINANANCIAL Self-Service SOLUTIONS
Payments
RETAIL & HOSPITALITY SOLUTIONS
|
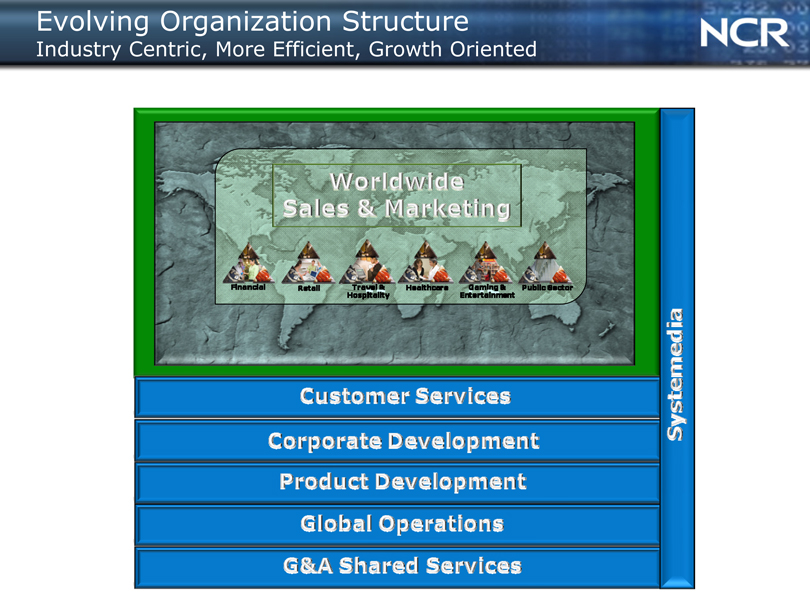
Evolving Organization Structure
Industry Centric, More Efficient, Growth Oriented
WORLDWIDE SALES & MARKETING
CUSTOMER SERVICES
CORPORATE DEVELOPMENT
PRODUCT DEVELOPMENT
GLOBAL OPERATIONS
G&A SHARED SERVICES
SYSTEMEDIA
|
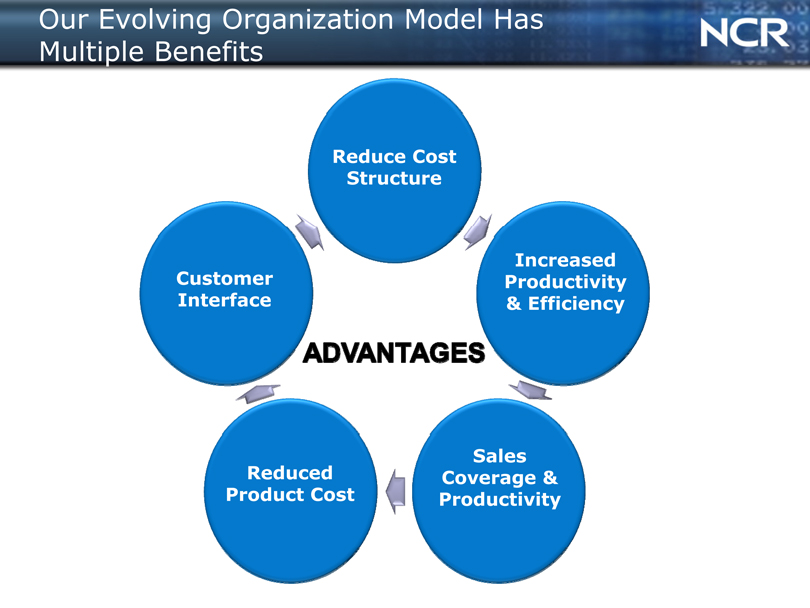
Our Evolving Organization Model Has Multiple Benefits
Reduce Cost Structure
Customer Interface
Reduced Product Cost
Sales Coverage & Productivity
Increased Productivity & Efficiency
ADVANTAGES
|
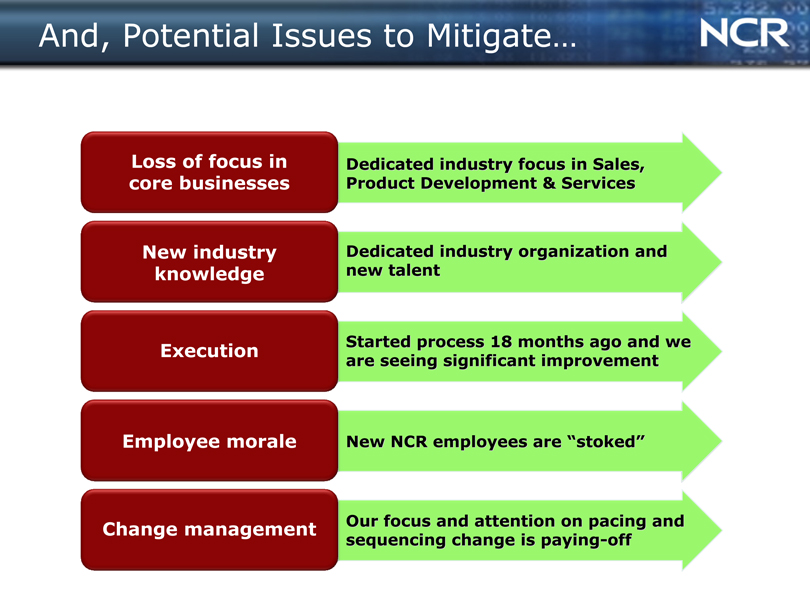
And, Potential Issues to Mitigate…
Loss of focus in core businesses Dedicated industry focus in Sales, Product Development & Services
New industry knowledge Dedicated industry organization and new talent
Execution Started process 18 months ago and we are seeing significant improvement
Employee morale New NCR employees are “stoked”
Change management Our focus and attention on pacing and sequencing change is paying-off
|
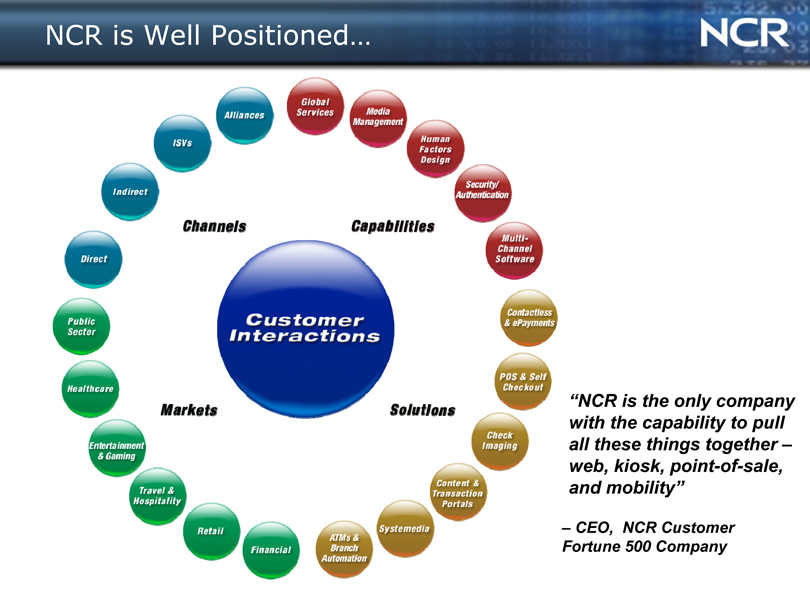
NCR is Well Positioned…
CHANNELS
CAPABILITIES
MARKETS
SOLUTIONS
“NCR is the only company with the capability to pull all these things together –web, kiosk, point-of-sale, and mobility”
– CEO, NCR Customer Fortune 500 Company
|
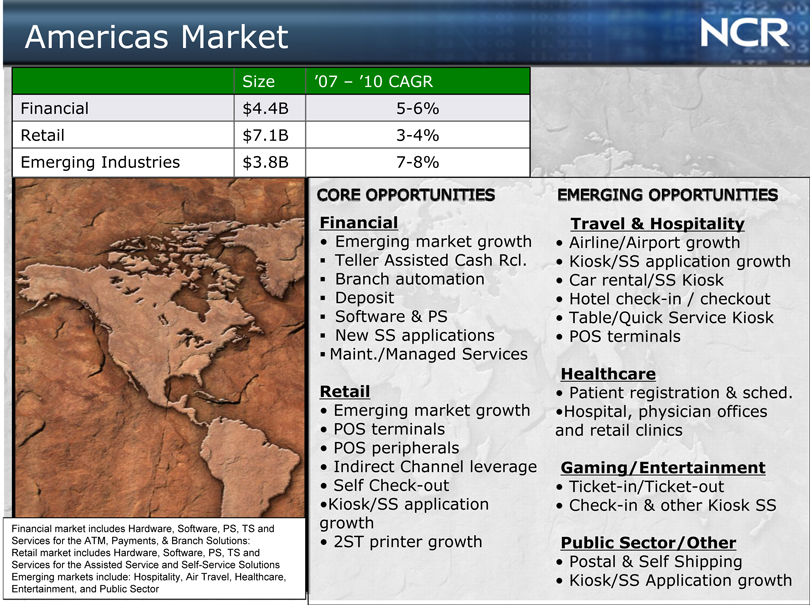
Americas Market
Size ‘07 – ‘10 CAGR Financial $4.4B 5-6% Retail
$7.1B 3-4% Emerging Industries $3.8B 7-8%
Financial market includes Hardware, Software, PS, TS and Services for the ATM, Payments, & Branch Solutions: Retail market includes Hardware, Software, PS, TS and Services for the Assisted Service and Self-Service Solutions Emerging markets include: Hospitality, Air Travel, Healthcare, Entertainment, and Public Sector
Core Opportunities
Financial
Emerging market growth ?Teller Assisted Cash Rcl. ?Branch automation ?Deposit ?Software & PS
?New SS applications ?Maint./Managed Services
Retail
Emerging market growth
POS terminals
POS peripherals
Indirect Channel leverage
Self Check-out Kiosk/SS application growth
2ST printer growth
Emerging Opportunities
Travel & Hospitality
Airline/Airport growth
Kiosk/SS application growth
Car rental/SS Kiosk
Hotel check-in / checkout
Table/Quick Service Kiosk
POS terminals
Healthcare
Patient registration & sched.
Hospital, physician offices and retail clinics
Gaming/Entertainment
Ticket-in/Ticket-out
Check-in & other Kiosk SS
Public Sector/Other
Postal & Self Shipping
Kiosk/SS Application growth
|
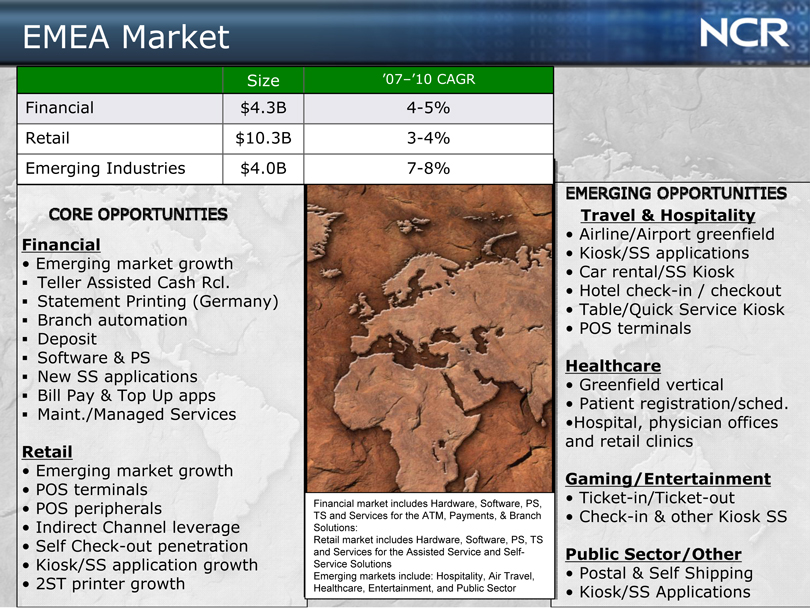
EMEA Market
Size ‘07–’10 CAGR
Financial $4.3B 4-5%
Retail $ 10.3B 3-4%
Emerging Industries $4.0B 7-8%
Core Opportunities
Financial
Emerging market growth ?Teller Assisted Cash Rcl. ?Statement Printing (Germany) ?Branch automation ?Deposit ?Software & PS
?New SS applications ?Bill Pay & Top Up apps ?Maint./Managed Services
Retail
Emerging market growth
POS terminals
POS peripherals
Indirect Channel leverage
Self Check-out penetration
Kiosk/SS application growth
2ST printer growth
Financial market includes Hardware, Software, PS, TS and Services for the ATM, Payments, & Branch Solutions: Retail market includes Hardware, Software, PS, TS and Services for the Assisted Service and Self-Service Solutions Emerging markets include: Hospitality, Air Travel, Healthcare, Entertainment, and Public Sector
Emerging Opportunities
Travel & Hospitality
Airline/Airport greenfield
Kiosk/SS applications
Car rental/SS Kiosk
Hotel check-in / checkout
Table/Quick Service Kiosk
POS terminals
Healthcare
Greenfield vertical
Patient registration/sched.
Hospital, physician offices and retail clinics
Gaming/Entertainment
Ticket-in/Ticket-out
Check-in & other Kiosk SS
Public Sector/Other
Postal & Self Shipping
Kiosk/SS Applications
|
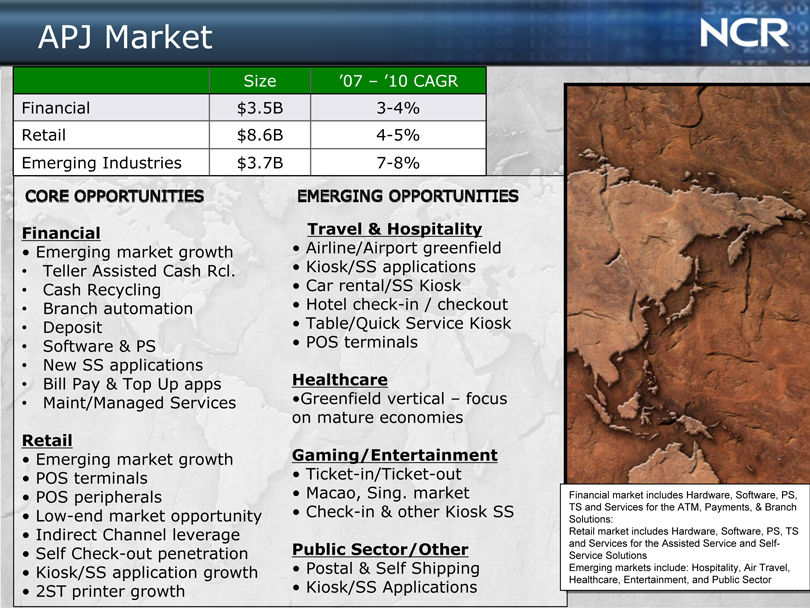
APJ Market
Size ‘07 – ‘10 CAGR
Financial $3.5B 3-4%
Retail $8.6B 4-5%
Emerging Industries $3.7B 7-8%
Core Opportunities
Financial
Emerging market growth
Teller Assisted Cash Rcl.
Cash Recycling
Branch automation
Deposit
Software & PS
New SS applications
Bill Pay & Top Up apps
Maint/Managed Services
Retail
Emerging market growth
POS terminals
POS peripherals
Low-end market opportunity
Indirect Channel leverage
Self Check-out penetration
Kiosk/SS application growth
2ST printer growth
Emerging Opportunities
Travel & Hospitality
Airline/Airport greenfield
Kiosk/SS applications
Car rental/SS Kiosk
Hotel check-in / checkout
Table/Quick Service Kiosk
POS terminals
Healthcare
Greenfield vertical – focus on mature economies
Gaming/Entertainment
Ticket-in/Ticket-out
Macao, Sing. market
Check-in & other Kiosk SS
Public Sector/Other
Postal & Self Shipping
Kiosk/SS Applications
Financial market includes Hardware, Software, PS, TS and Services for the ATM, Payments, & Branch Solutions: Retail market includes Hardware, Software, PS, TS and Services for the Assisted Service and Self-Service Solutions Emerging markets include: Hospitality, Air Travel, Healthcare, Entertainment, and Public Sector
|
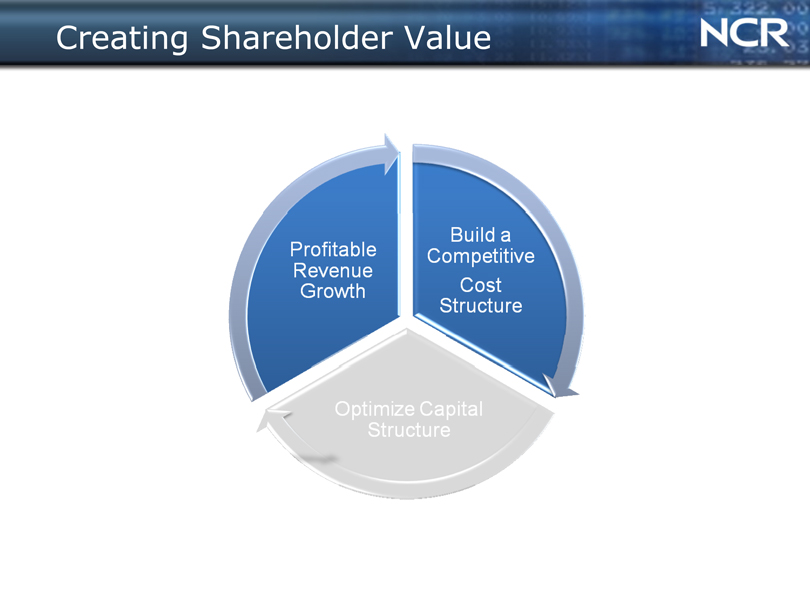
Creating Shareholder Value
|
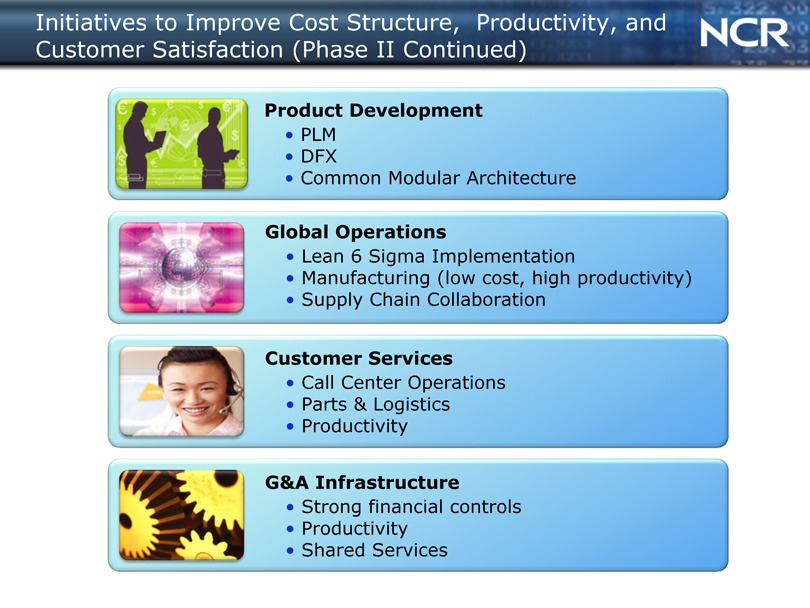
Initiatives to Improve Cost Structure, Productivity, and Customer Satisfaction (Phase II Continued)
Product Development
PLM DFX
Common Modular Architecture
Global Operations
Lean 6 Sigma Implementation
Manufacturing (low cost, high productivity)
Supply Chain Collaboration
Customer Services
Call Center Operations
Parts & Logistics
Productivity
G&A Infrastructure
Strong financial controls
Productivity
Shared Services
|
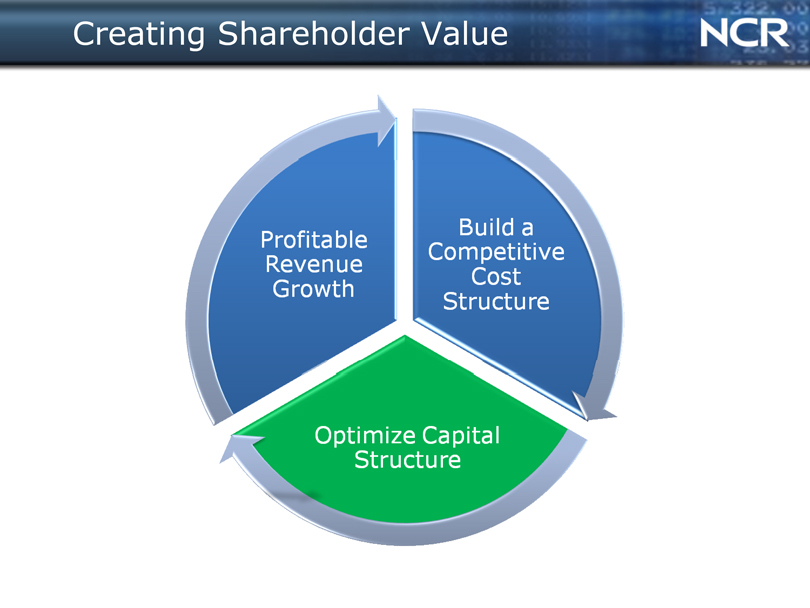
Creating Shareholder Value
Profitable Revenue Growth
Build a Competitive Cost Structure
Optimize Capital Structure
|
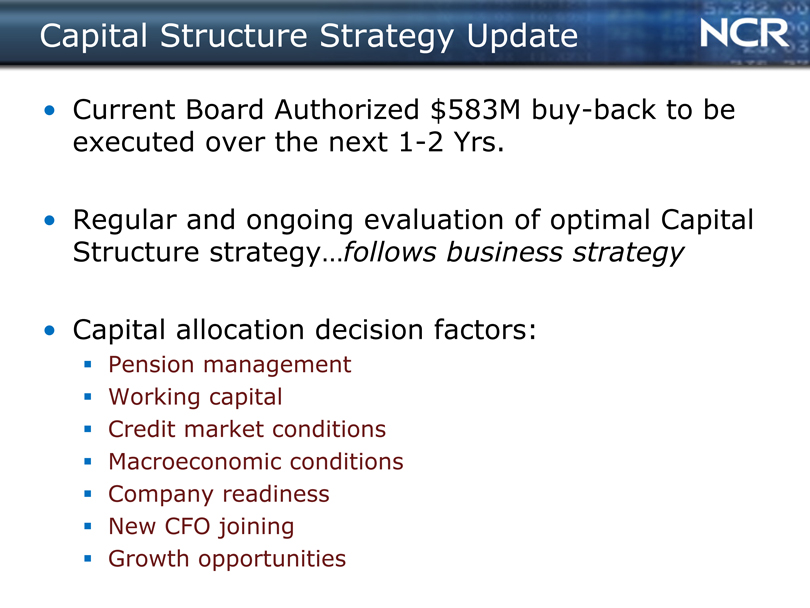
Capital Structure Strategy Update
Current Board Authorized $583M buy-back to be executed over the next 1-2 Yrs.
Regular and ongoing evaluation of optimal Capital Structure strategy…follows business strategy
Capital allocation decision factors:
?Pension management
?Working capital
?Credit market conditions
?Macroeconomic conditions
?Company readiness
?New CFO joining ?Growth opportunities
|
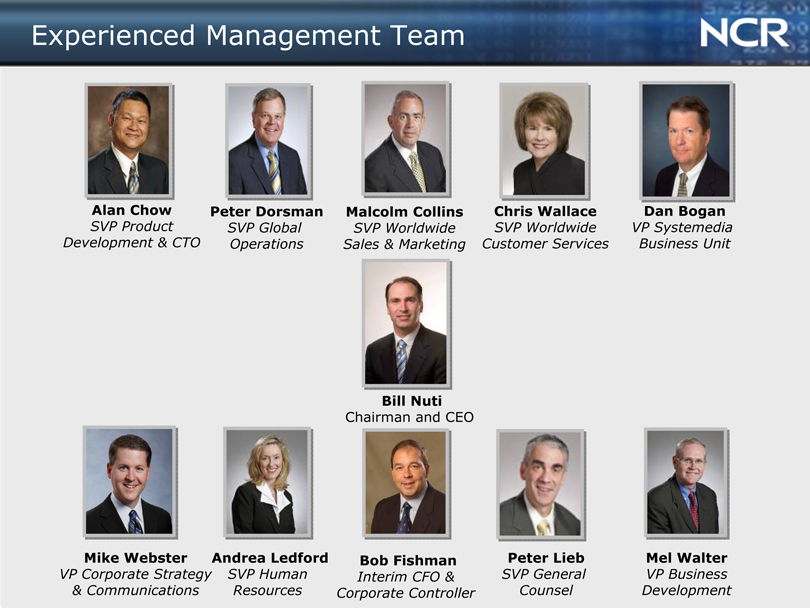
Experienced Management Team
Alan Chow Peter Dorsman Malcolm Collins Chris Wallace Dan Bogan
SVP Product SVP Global SVP Worldwide SVP Worldwide VP Systemedia Development & CTO Operations Sales & Marketing Customer Services Business Unit
Bill Nuti
Chairman and CEO
Mike Webster Andrea Ledford Bob Fishman Peter Lieb Mel Walter
VP Corporate Strategy SVP Human Interim CFO & SVP General VP Business & Communications Resources Corporate Controller Counsel Development
|
Speaker Biographies
Bill Nuti
Chairman & CEO
Alan Chow
SVP, Product Development & CTO
Peter Dorsman
SVP, Global Operations
Chris Wallace
SVP, Worldwide Customer Services
Bob Fishman
Interim CFO and Corporate Controller
|
Summary
Strong foundation
Consumer demand for self-service is fueling growth NCR is well positioned to be a global leader in self-service The addressable market for self-service is expanding Focused on improving execution Proven and experienced management team
|
Product Development Strategy
Alan Chow
SVP, Product Development & CTO
|
Creating Shareholder Value
Profitable Revenue Growth
Build a Competitive Cost Structure
Omtimize Capital Structure
|

Innovation Drives Profitable Revenue Growth
ADJACENT SOLUTIONS
CORE SOLUTIONS
NEW INDUSTRY EXTENSIONS
PROFITABLE REVENUE GROWTH
|
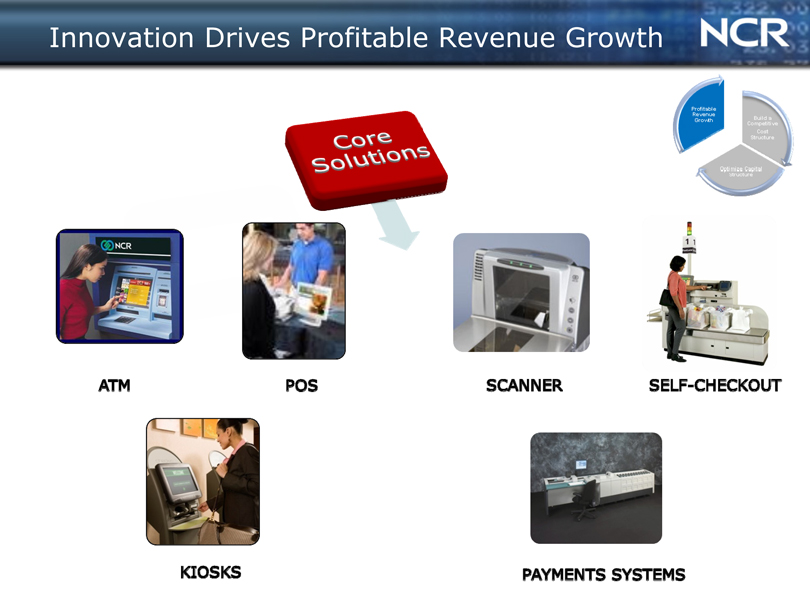
Innovation Drives Profitable Revenue Growth
CORE SOLUTIONS
ATM
POS
SCANNER
SELF-CHECKOUT
KIOSKS
PAYMENTS SYSTEMS
|
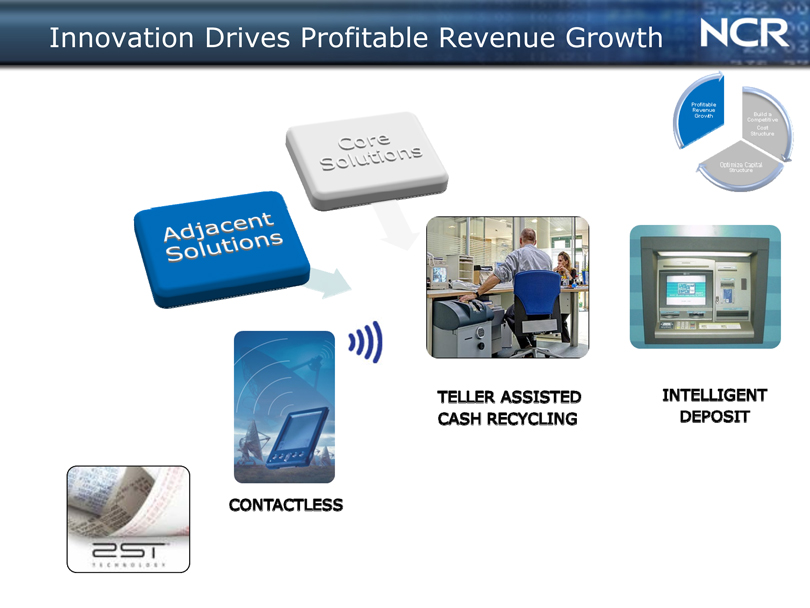
Innovation Drives Profitable Revenue Growth
CORE SOLUTIONS
ADJACENT SOLUTIONS
CONTACTLESS
TELLER ASSISTED RECYCLING
INTELLIGENT DEPOSIT
|
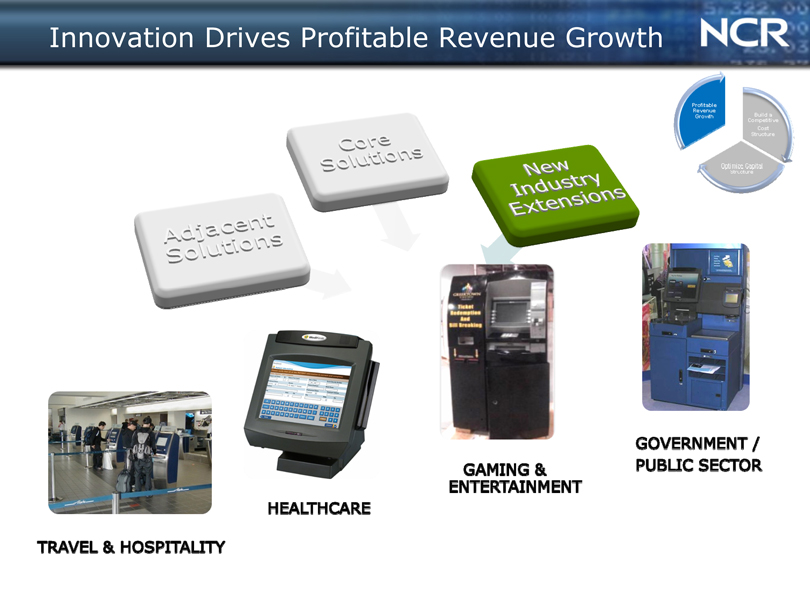
Innovation Drives Profitable Revenue Growth
ADJACENT SOLUTIONS
CORE SOLUTIONS
NEW INDUSTRY EXTENSIONS
TRAVEL & HOSPITALITY
HEALTHCARE
GAMING & ENTERTAINMENT
GOVERNMENT / PUBLIC SECTOR
|
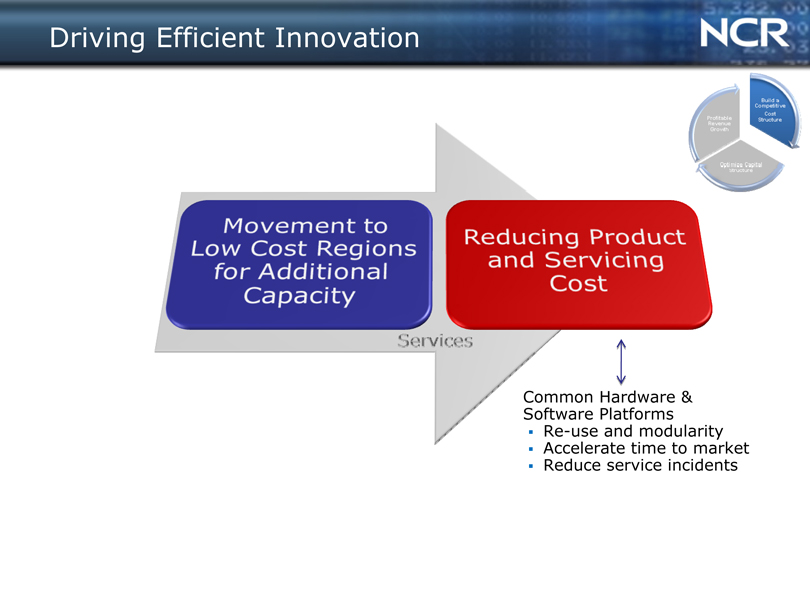
Driving Efficient Innovation
MOVEMENT TO LOW COST REGIONS FOR ADDITIONAL CAPACITY
REDUCING PRODUCT AND SERVICING COST
Common Hardware & Software Platforms ?Re-use and modularity ?Accelerate time to market ?Reduce service incidents
|
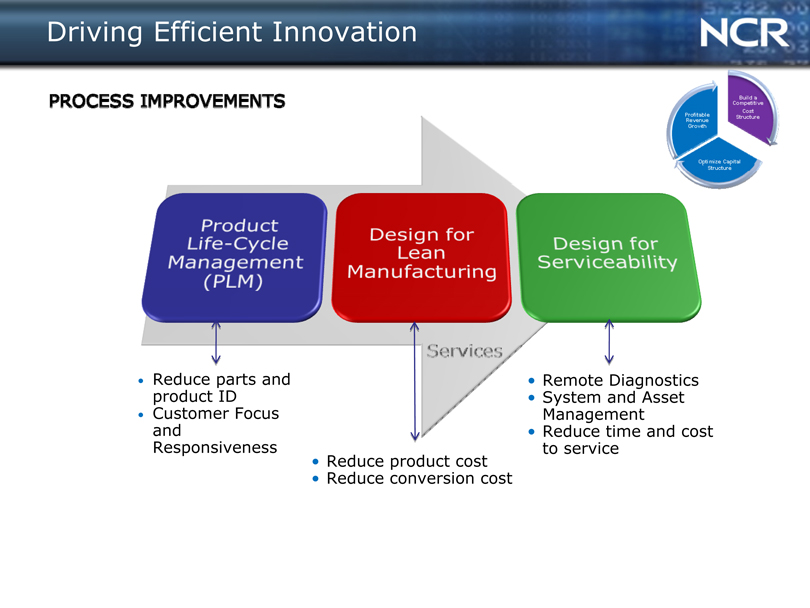
Driving Efficient Innovation
PRODUCT LIFE-CYCLE MANAGEMENT (PLM)
DESIGN FOR LEAN MANUFACTURING
DESIGN FOR SERVICEABILITY
SERVICES
Reduce parts and product ID
Customer Focus and Responsiveness
Reduce product cost Reduce conversion cost
Remote Diagnostics System and Asset Management Reduce time and cost to service
|
Global Operations Strategy
Peter Dorsman
SVP, Global Operations
|
Creating Shareholder Value
Profitable Revenue Growth
Build a Competitive Cost Srtucture
Omtimize Capital Structure
|
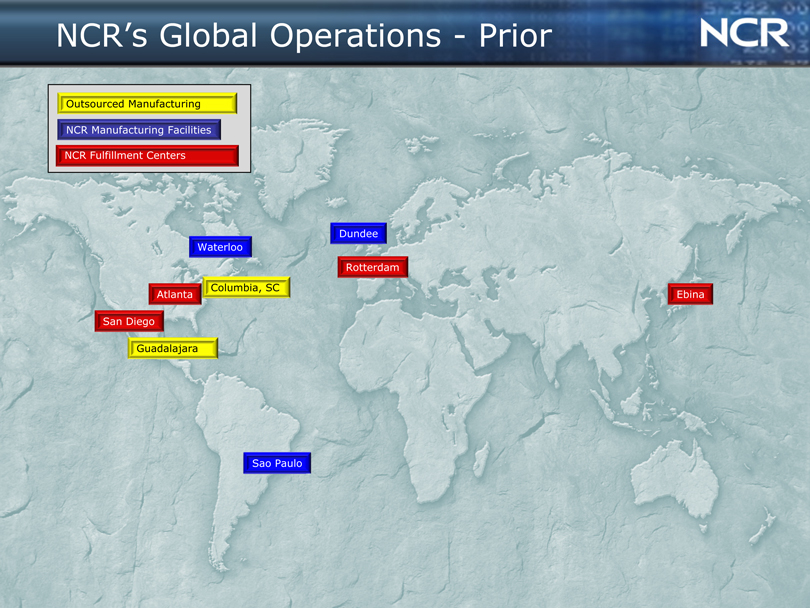
NCR’s Global Operations—Prior
Outsourced Manufacturing NCR Manufacturing Facilities NCR Fulfillment Centers
Dundee Waterloo Rotterdam Columbia, SC
Atlanta Ebina San Diego Guadalajara
Sao Paulo
|
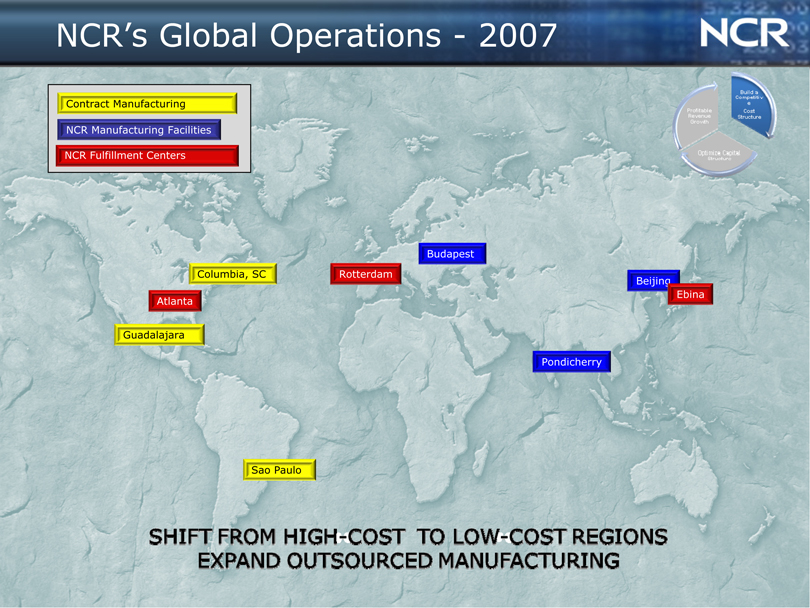
NCR’s Global Operations—2007
Contract Manufacturing NCR Manufacturing Facilities NCR Fulfillment Centers
Budapest Columbia, SC Rotterdam
Beijing Ebina Atlanta
Guadalajara
Pondicherry
Sao Paulo
SHIFT FROM HIGH-COST TO LOW-COST REGIONS
EXPAND OUTSOURCED MANUFACTURING
|
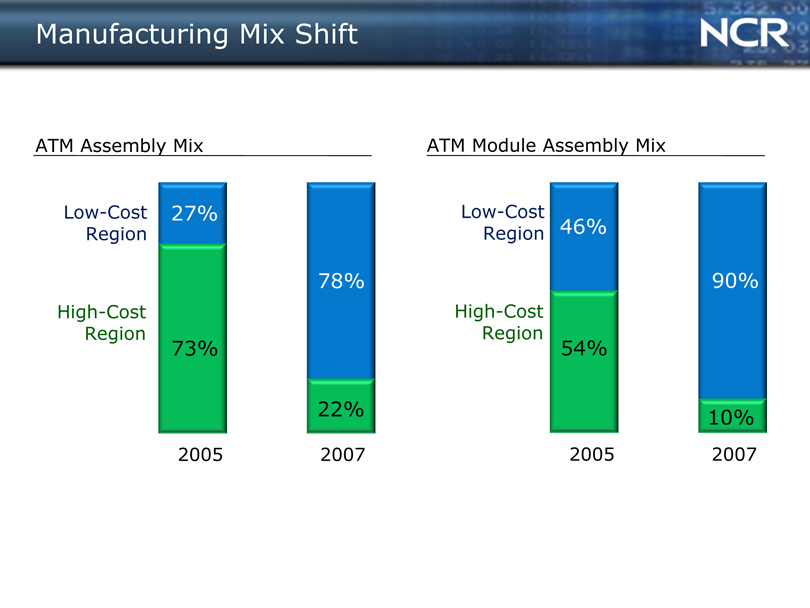
Manufacturing Mix Shift
ATM Assembly Mix
Low-Cost Region
High-Cost Region
27%
73%
2005
78%
22%
2007
ATM Module Assembly Mix
Low-Cost Region
High-Cost Region
46%
54%
2005
90%
10%
2007
|
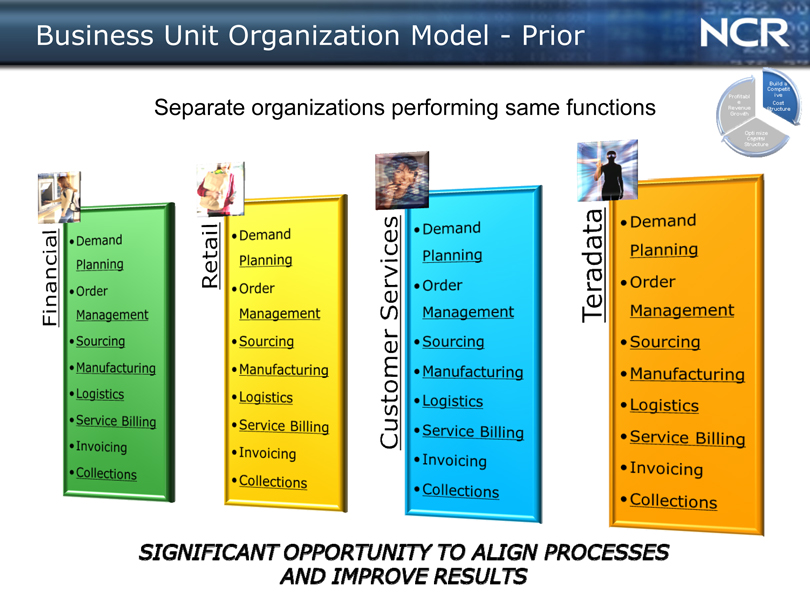
Business Unit Organization Model—Prior
Separate organizations performing same functions
FINANCIAL
DEMAND PLANNING
ORDER MANAGEMENT
SOURCING
MANUFACTURING
LOGISTICS
SERVICE BILLING
INVOICING
COLLECTIONS
RETAIL
CUSTOMER SERVICES
TERADATA
SIGNIFICANT OPPORTUNITY TO ALIGN PROCESSES AND INPROVE RESULTS
|
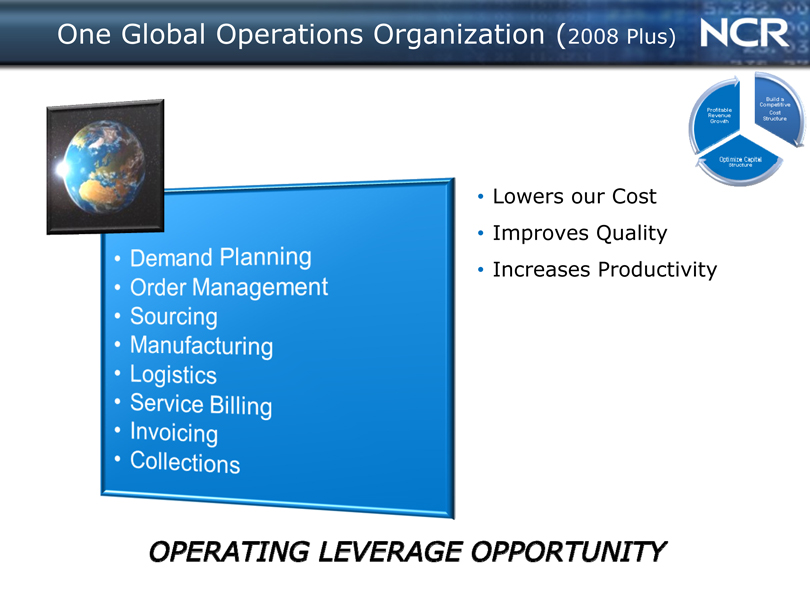
One Global Operations Organization (2008 Plus)
Lowers our Cost Improves Quality Increases Productivity
DEMAND PLANNING
ORDER MANAGEMENT
SOURCING
MANUFACTURING
LOGISTICS
SERVICE BILLING
INVOICING
COLLECTIONS
|
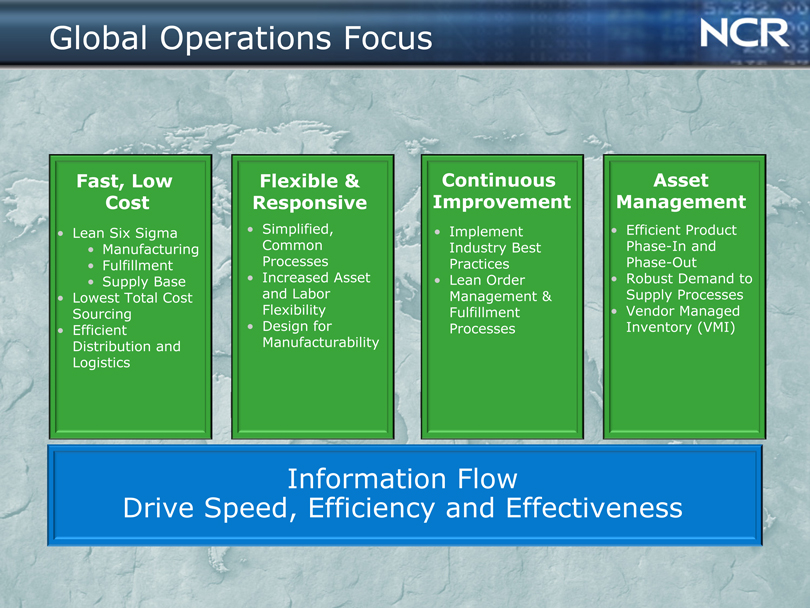
Global Operations Focus
Fast, Low Cost
Lean Six Sigma
Manufacturing
Fulfillment
Supply Base
Lowest Total Cost Sourcing
Efficient Distribution and Logistics
Flexible & Responsive
Simplified, Common Processes
Increased Asset and Labor Flexibility
Design for Manufacturability
Continuous Improvement
Implement Industry Best Practices
Lean Order Management & Fulfillment Processes
Asset Management
Efficient Product Phase-In and Phase-Out
Robust Demand to Supply Processes
Vendor Managed Inventory (VMI)
Information Flow
Drive Speed, Efficiency and Effectiveness
|

Operations: Enabling NCR’s Success
SALES
OPERATIONS
SERVICES
PRODUCT DEVELOPMENT
|

Customer Services Strategy
Chris Wallace
SVP, Customer Services
|
Creating Shareholder Value
Profitable Revenue Growth
Build a Competitive Cost Structure
Omtimize Capital Structure
|
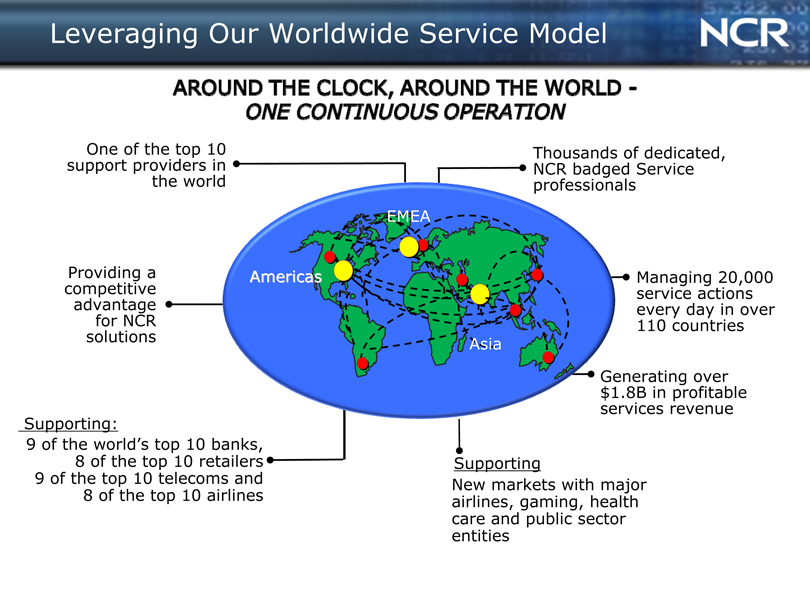
Leveraging Our Worldwide Service Model
One of the top 10 support providers in the world
Providing a competitive advantage for NCR solutions
Supporting:
9 of the world’s top 10 banks, 8 of the top 10 retailers 9 of the top 10 telecoms and 8 of the top 10 airlines
Thousands of dedicated, NCR badged Service professionals
Managing 20,000 service actions every day in over 110 countries
Generating over $1.8B in profitable services revenue
Supporting
New markets with major airlines, gaming, health care and public sector entities
EMEA
Americas
Asia
|
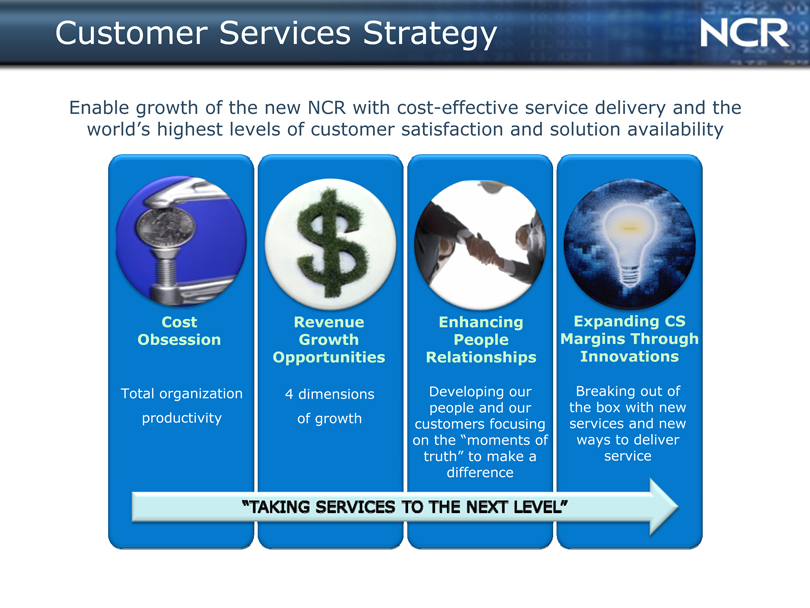
Customer Services Strategy
Enable growth of the new NCR with cost-effective service delivery and the world’s highest levels of customer satisfaction and solution availability
Cost Obsession
Total organization productivity
Growth Opportunities
4 |
| dimensions of growth |
Enhancing People Relationships
Developing our people and our customers focusing on the “moments of truth” to make a difference
Expanding CS Margins Through Innovations
Breaking out of the box with new services and new ways to deliver service
|
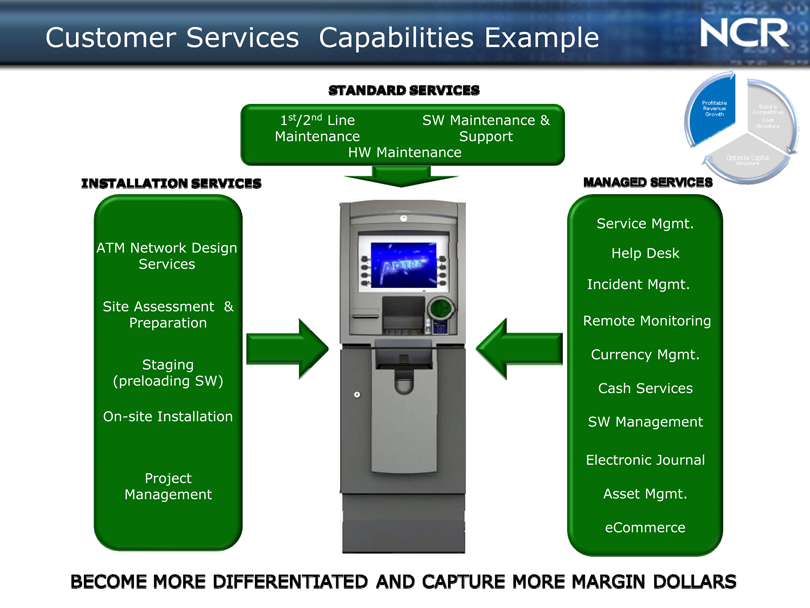
Customer Services Capabilities Example
STANDARD SERVICES
INSTALLATION SERVICES
MANAGED SERVICES
ATM Network Design Services
Site Assessment & Preparation
Staging (preloading SW)
On-site Installation
Project Management
Service Mgmt. ?
Help Desk I
Incident Mgmt. I
Remote Monitoring I
Currency Mgmt. I
Cash Services I
SW Management I
Electronic Journal I
Asset Mgmt. I
eCommerce I
BECOME MORE DIFFERENTIATED AND CAPTURE MORE MARGIN DOLLARS
|
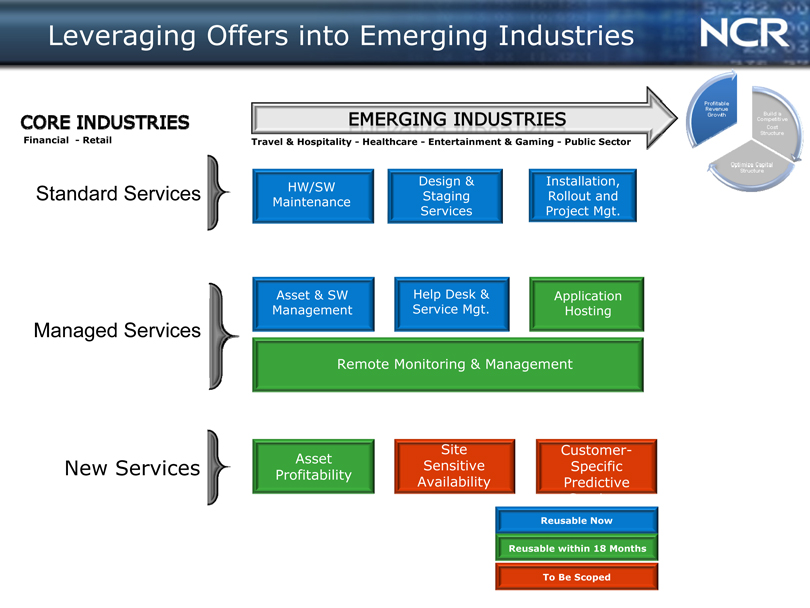
Leveraging Offers into Emerging Industries
CORE INDUSTRIES
Financial—Retail
EMERGING INDUSTRIES
Standard Services
HW/SW Maintenance
Design &
Staging
Services
Installation, Rollout and Project Mgt.
Managed Services
Asset & SW Management
Help Desk & Service Mgt.
I Application I Hosting
Remote Monitoring & Management
New Services
Asset Profitability
Site
Sensitive Availability
Customer- I
Specific I
Predictive I
|
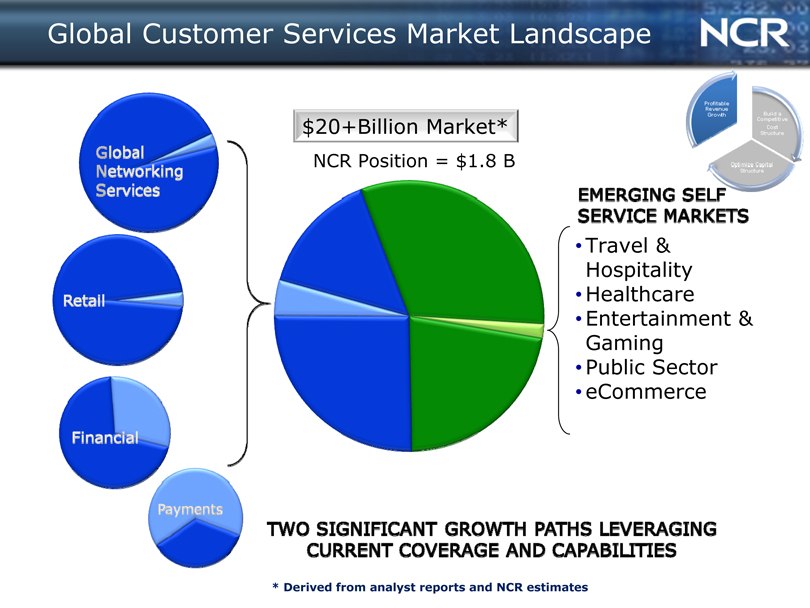
Global Customer Services Market Landscape
I Global^-^^ I Networking ^ Services
| $20+Billion Market* | NCR Position = $1.8 B
EMERGING SEL^555 SERVICE MARKETS
Retail
Travel &
Hospitality
Healthcare
Entertainment &
Gaming
Public Sector
eCommerce
I Financial
Payments 1
TWO SIGNIFICANT GROWTH PATHS LEVERAGING CURRENT COVERAGE AND CAPABILITIES
* |
| Derived from analyst reports and NCR estimates |
|
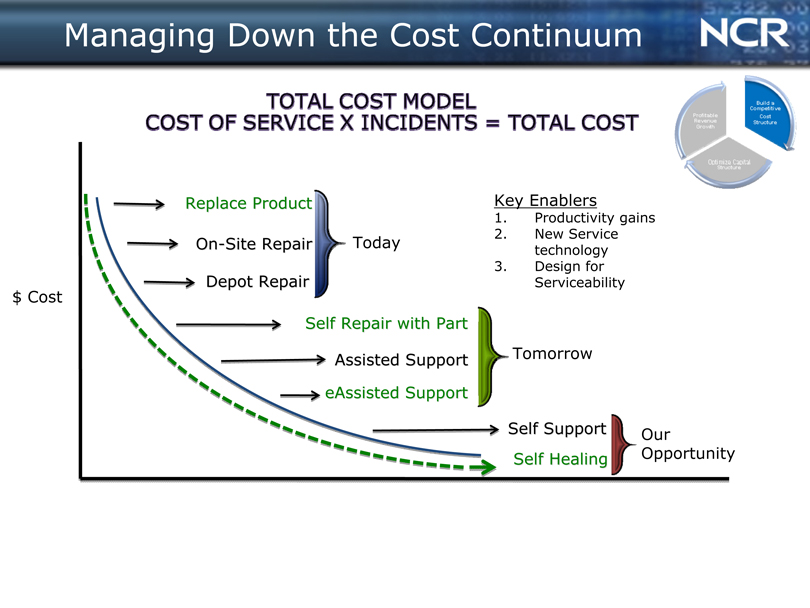
Managing Down the Cost Continuum
TOTAL COST MODEL COST OF SERVICE X INCIDENTS = TOTAL COST
|
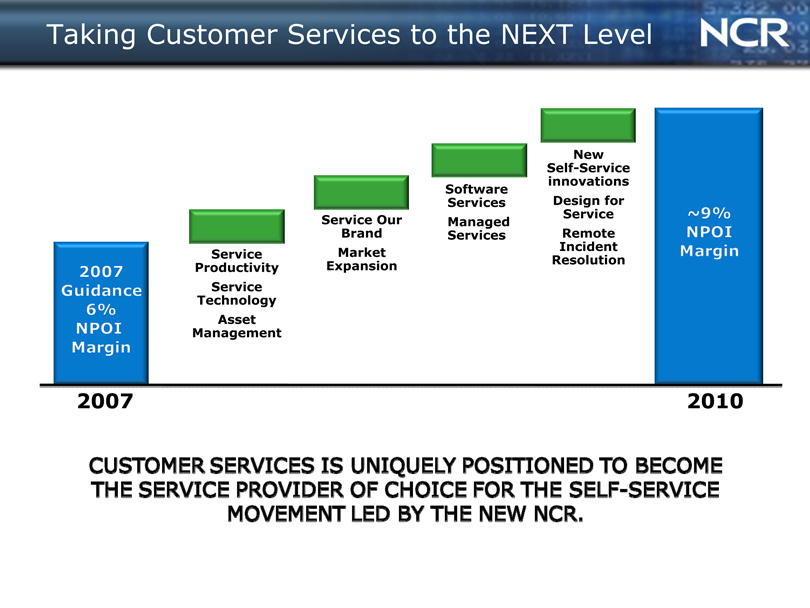
Taking Customer Services to the NEXT Level
I 2007 H Guidance H 6% H NPOI H Margin
Service Productivity
Service Technology
Asset Management
Service Our Brand
Market Expansion
Software Services
Managed Services
New
Self-Service innovations
Design for Service
Remote
Incident
Resolution
~9%
NPOI
Margin
2007
2010
CUSTOMER SERVICES IS UNIQUELY POSITIONED TO BECOME THE SERVICE PROVIDER OF CHOICE FOR THE SELF-SERVICE
MOVEMENT LED BY THE NEW NCR.
|
NCR Financial Strategy
Bob Fishman, CPA, CFA
Interim CFO and Corporate Controller
|
Creating Shareholder Value
|
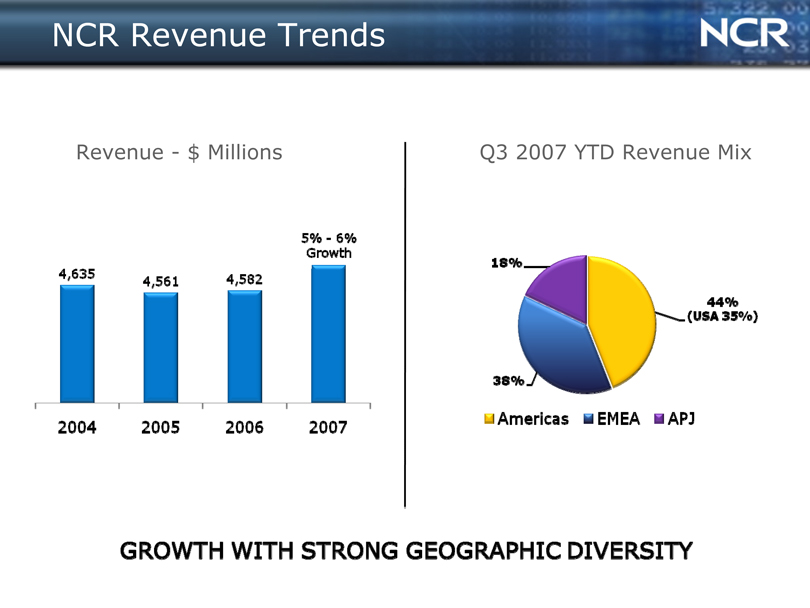
NCR Revenue Trends
Revenue—$ Millions
Q3 2007 YTD Revenue Mix
GROWTH WITH STRONG GEOGRAPHIC DIVERSITY
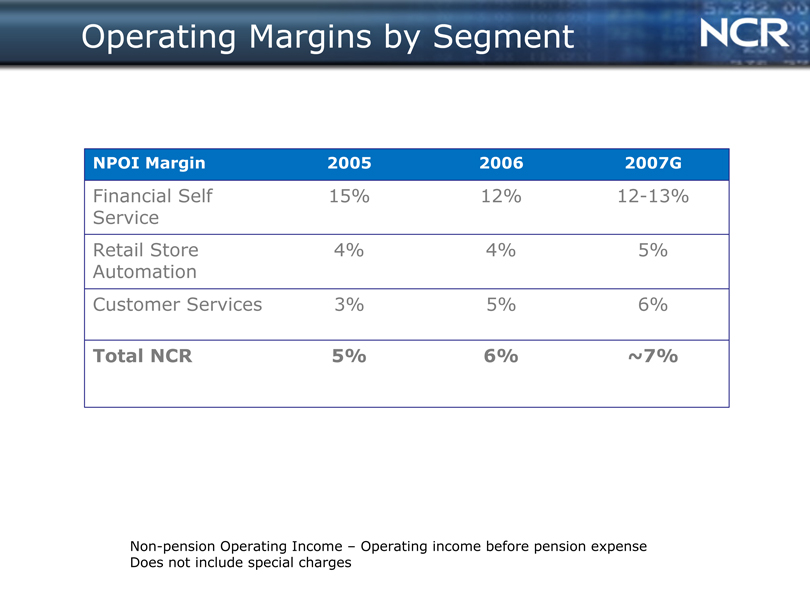
Operating Margins by Segment
F”-Ul”— “tH Hill ~m~
Financial Self 15% 12% 12-13% Service
Retail Store 4% 4% 5% Automation
Customer Services 3% 5% 6%
Total NCR 5% 6% ~7%
Non-pension Operating Income—Operating income before pension expense Does not include special charges
|
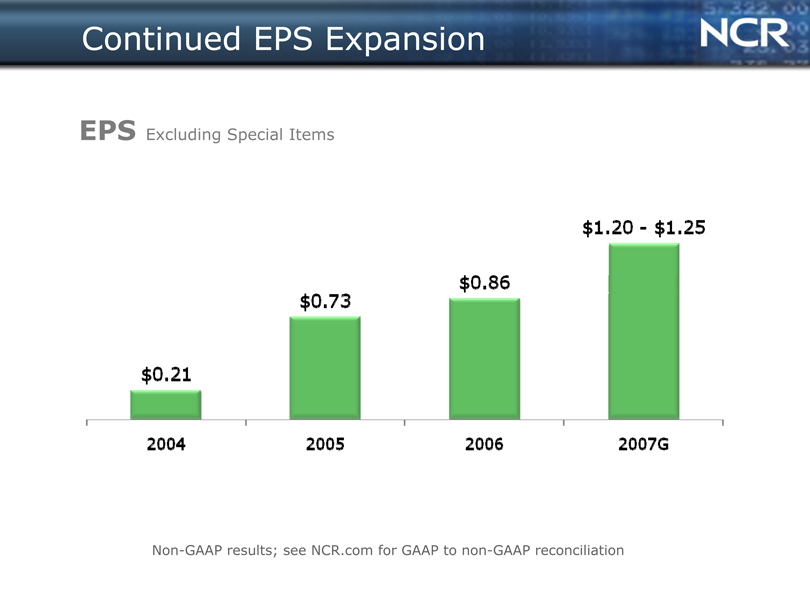
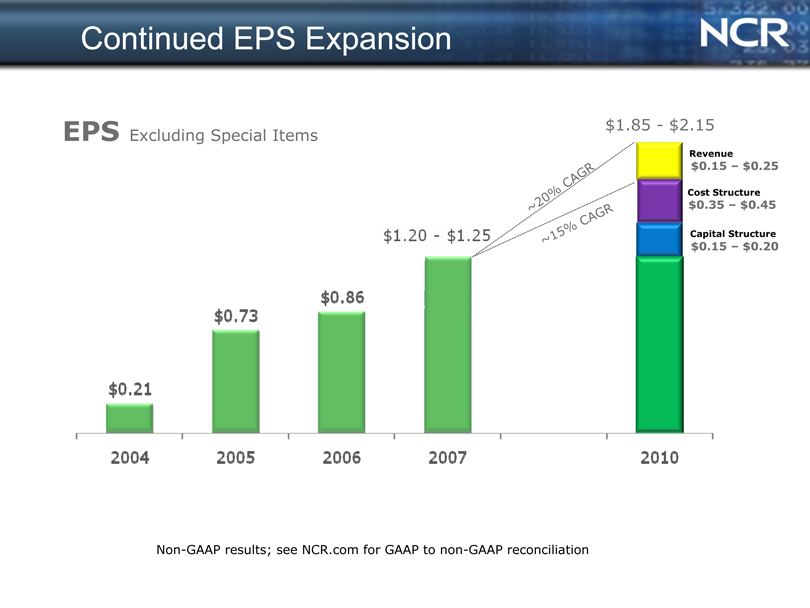
Continued EPS Expansion
EPS Excluding Special Items
Non-GAAP results; see NCR.com for GAAP to non-GAAP reconciliation
|
Creating Shareholder Value
|

Profitable Revenue Growth—2007 to 2010
|
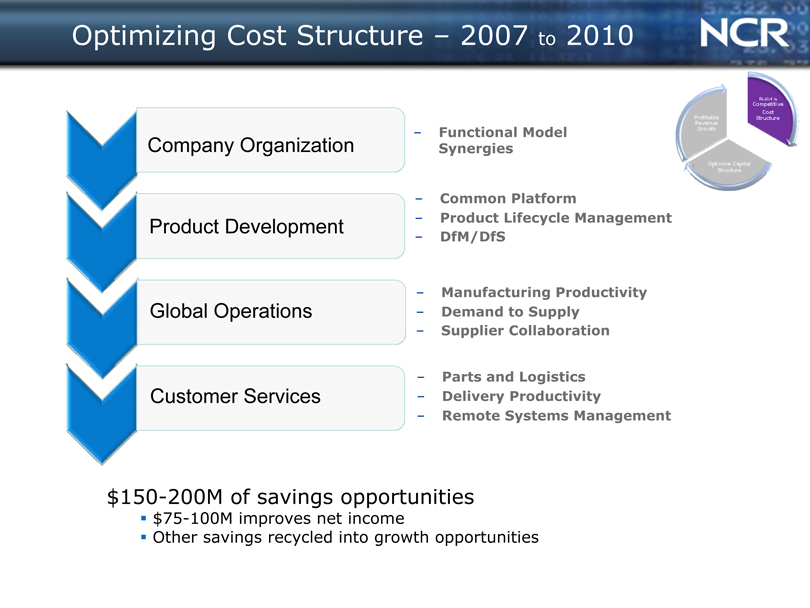
Optimizing Cost Structure—2007 to 2010
Company Organization Product Development Global Operations Customer Services
Functional Model Synergies
Common Platform
Product Lifecycle Management
DfM/DfS
Manufacturing Productivity Demand to Supply Supplier Collaboration
Parts and Logistics Delivery Productivity Remote Systems Management
$150-200M of savings opportunities
$75-100M improves net income
Other savings recycled into growth opportunities
|
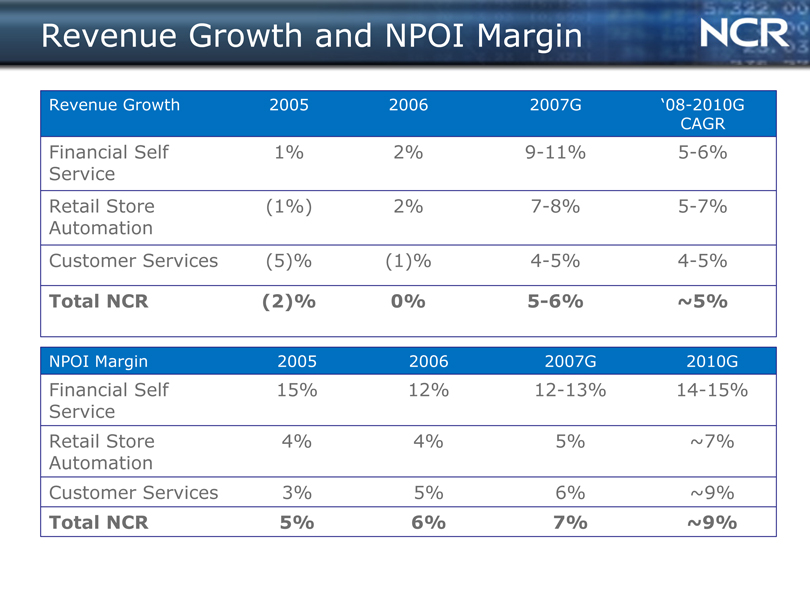
Revenue Growth and NPOI Margin
EJflBffRBPHil Efiffll EBBIM KiBflSI BIBSBBBCI
Service
Retail Store (1%) 2% 7-8% 5-7%
Automation
Customer Services (5)% (1)% 4-5% 4-5%
Total NCR (2)% 5-6% ~5%
Service
Retail Store 4% 4% 5% ~7%
Automation
Customer Services 3% 5% 6% ~9%
Total NCR 5% 6% 7% ~9%
|
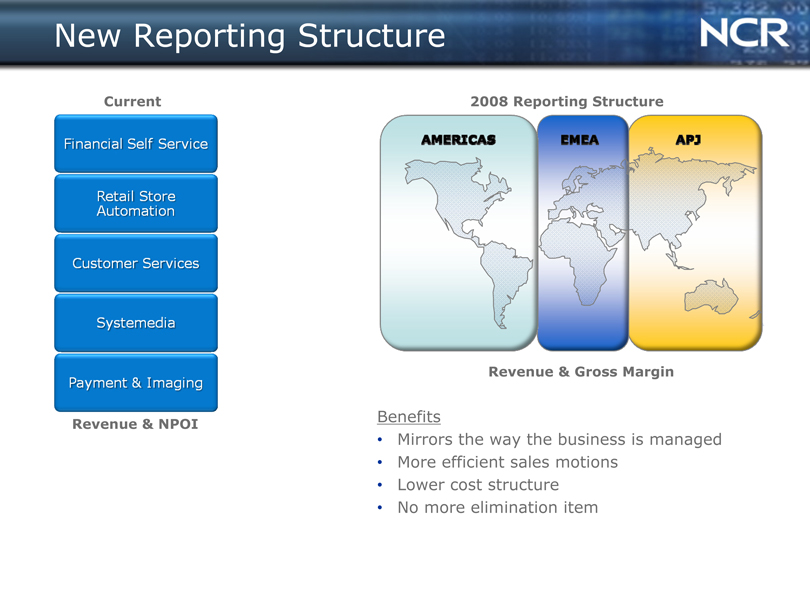
New Reporting Structure
Current
2008 Reporting Structure
Revenue & NPOI
Benefits
Mirrors the way the business is managed
More efficient sales motions
Lower cost structure
No more elimination item
|
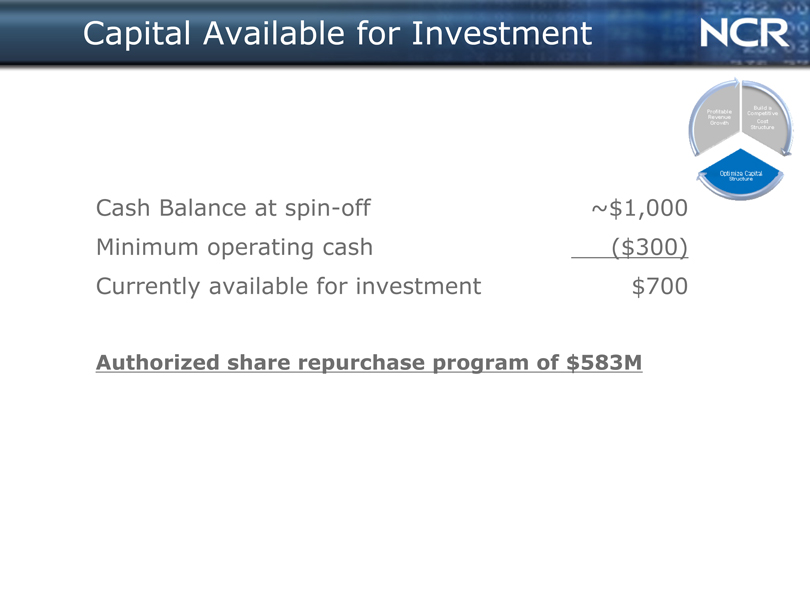
Capital Available for Investment
Cash Balance at spin-off ~$1,000
Minimum operating cash ($300)
Currently available for investment $700
Authorized share repurchase program of $583M
|
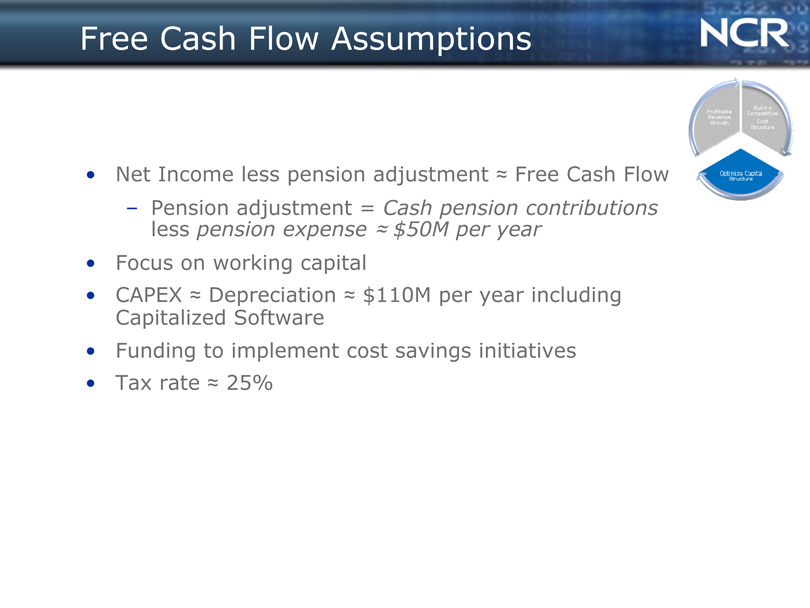
Free Cash Flow Assumptions
• Net Income less pension adjustment ~ Free Cash Flow
- Pension adjustment = Cash pension contributions less pension expense ? $50M per year
Focus on working capital
CAPEX ? Depreciation ? $110M per year including Capitalized Software
Funding to implement cost savings initiatives
Tax rate ? 25%
|
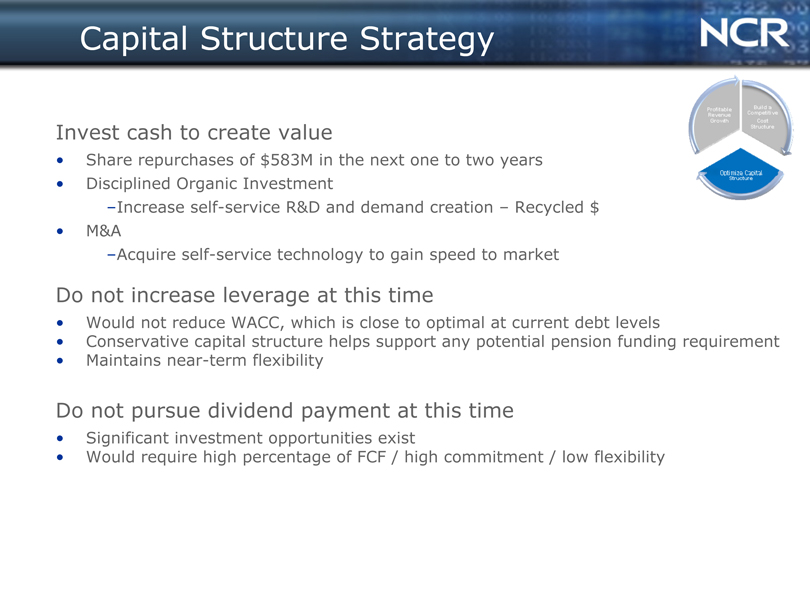
Capital Structure Strategy
Invest cash to create value
Share repurchases of $583M in the next one to two years
Disciplined Organic Investment
-Increase self-service R&D and demand creation—Recycled $
• M&A
-Acquire self-service technology to gain speed to market
Do not increase leverage at this time
Would not reduce WACC, which is close to optimal at current debt levels
Conservative capital structure helps support any potential pension funding requirement
Maintains near-term flexibility
Do not pursue dividend payment at this time
Significant investment opportunities exist
Would require high percentage of FCF / high commitment / low flexibility
|
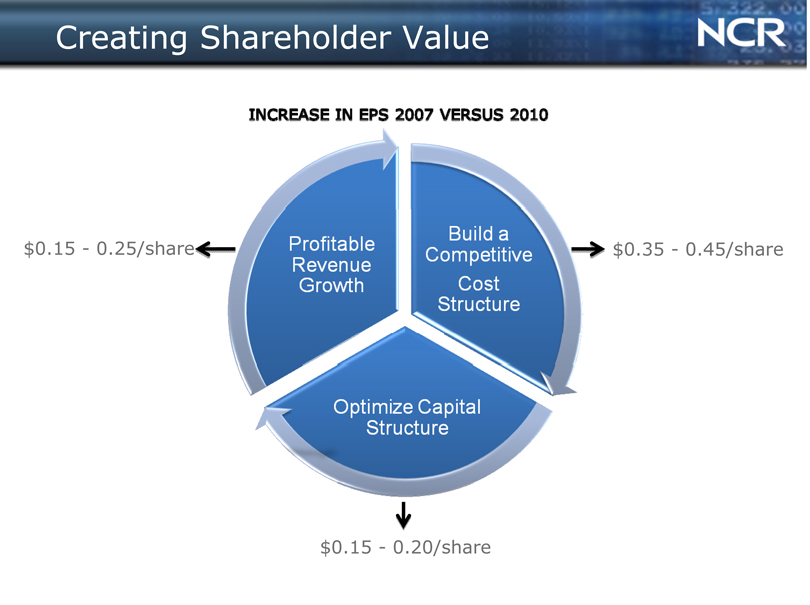
Creating Shareholder Value
INCREASE IN EPS 2007 VERSUS 2010
$0.15—0.25/share
$0.35—0.45/share
$0.15—0.20/share
|
Continued EPS Expansion
EPS Excluding Special Items
Non-GAAP results; see NCR.com for GAAP to non-GAAP reconciliation
|

Questions