NCR Investor Presentation May, 2010 Exhibit 99.1 |
2 NCR Confidential Note to Investors Certain non-GAAP financial information regarding NCR’s operating results may be discussed during this presentation. Reconciliation of the differences between GAAP and non-GAAP measures are included elsewhere in this presentation and are available on the Investor page of NCR’s website at www.ncr.com. NCR reports its results in accordance with Generally Accepted Accounting Principles in the United States, or GAAP. However, the Company believes that certain non-GAAP measures found in this presentation are useful for investors. NCR’s management evaluates the Company’s results excluding certain items, such as pension expense, to assess the financial performance of the Company and believes this information is useful for investors because it provides a more complete understanding of NCR’s underlying operational performance, as well as consistency and comparability with past reports of financial results. In addition, management uses earnings per share excluding these items to manage and determine effectiveness of its business managers and as a basis for incentive compensation. These non-GAAP measures should not be considered as substitutes for or superior to results determined in accordance with GAAP. A full description of these non-GAAP measures, including free cash flow, are included in NCR’s SEC reports. Remarks and responses associated with this presentation include forward-looking statements that are based on current expectations and assumptions. These forward-looking statements are subject to a number of risks and uncertainties that could cause actual results to vary materially. These risk factors are detailed from time to time in NCR’s SEC reports, including, but not limited to, Forms 10Q, 10K, 8K and NCR’s annual report to shareholders. NCR does not undertake any obligation to publicly update or revise any forward-looking statements, whether as a result of new information, future events or otherwise. These charts and the associated remarks are integrally related and are intended to be presented and understood together. |
3 NCR Confidential Vision and Mission Our Vision Our Vision Our Mission Our Mission Leading how the world Leading how the world connects, interacts, and connects, interacts, and transacts with business. transacts with business. “Provide our customers with the next generation of productivity gains and customer experience innovation through our deep knowledge of the changing global consumer and technology.” |
4 NCR Confidential The NCR Story NCR is a global leader in providing products and services that support customer transactions • Number 1 or 2 globally in key solutions • At forefront of self-service revolution • Top Services provider across end-markets Consumer demand for self-service technologies creates a global opportunity that NCR is positioned to capture • Consumers are driving demand for self-service across all industries • Self-service technologies grow revenues, lower costs and increase productivity • Entertainment market – a $1 billion+ opportunity over the next 5 years NCR is executing on a multi-year program for improving execution and efficiency • More than $600 million in cost takeout from 2003 to 2011 • New manufacturing facilities in Brazil and Columbus, Georgia NCR plans to optimize its capital structure and create value for shareholders • $577 million in stock repurchases in 2007 and 2008 • Pension strategy underway |
5 NCR Confidential Revenue up 2% to $1.03B Gross margin up 120 bps, inclusive of negative 70 bps effect from Entertainment NPOI (1) up 54% to $43M Non-GAAP EPS ex pension expense (1) $0.15; up 150% from $0.06 in Q1 2009 Improved backlog driven by 18% increase in orders; Double digit order growth balanced; Financial & Retail (1) See reconciliation of GAAP to non-GAAP measures in the appendix to this presentation and/or the Investor page of NCR’s website Q1 2010 vs. Q1 2009 Financial Highlights |
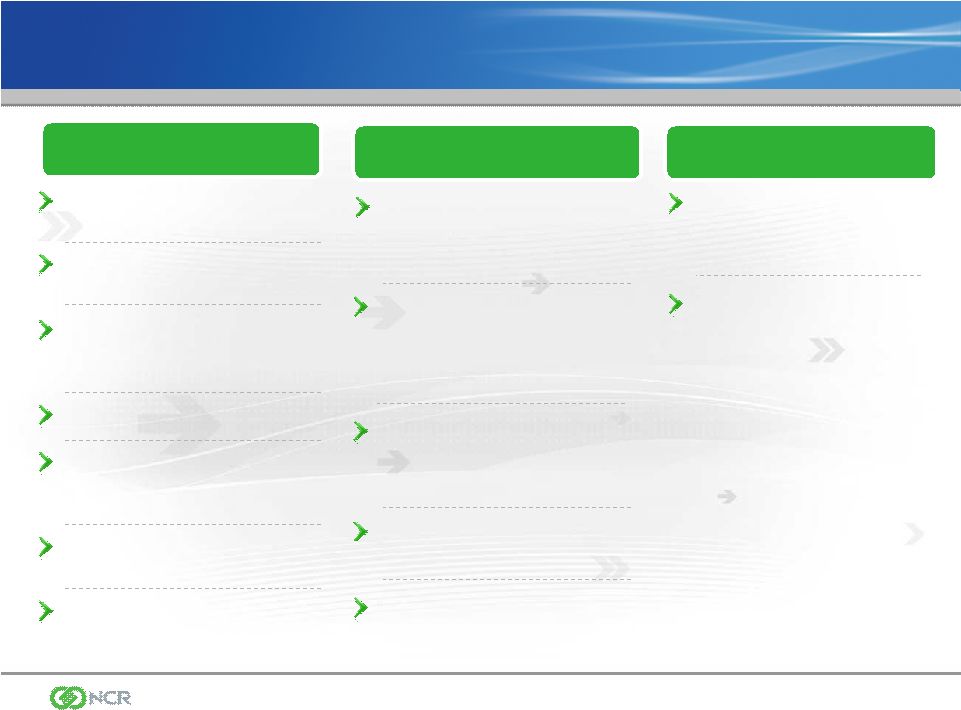
6 NCR Confidential NCR core vs. key competitors • Core produces more revenue • Core produces more profit • Core enterprise value is less than competitors Primary competitors • Trade at higher EBITDA and EPS multiples based on 2010 analyst consensus Grow revenue • Low-mid single digit market growth in core • Select strategic acquisitions to grow faster than the secular market • New markets and new geographies; adjacencies Continue to manage costs and increase productivity • Cost savings of $200-$250 million from 2008 through 2011 (50% re- invested) Financials • Expect 2010 revenue of $125- $150 million and approx. $30 million loss from operations • Goal to be breakeven (EBITDA) by Q4 2010; goal $25M-$35M positive EBITDA in 2011 • $1B+ revenue opportunity Largest competitor • Consensus $1B+ revenue in 2010 • EBITDA margin high-teens+ for DVD rental-only business Brand • License to use Blockbuster brand in the kiosk channel Grow revenue • Build out kiosk network - up to 10k units by year-end 2010 • Continued domestic and international build-out in 2011 Create new category; higher growth and margins than core • Only multi-channel, multi- segment offer in industry GAAP impacts • $1 billion underfunded status as of 2009 year end • $215 million expected expense in 2010 • Majority of pension expense is amortization of prior losses (non- cash) Cash impacts • Pre-tax net cash liability of ~$1 billion (~$750 million after-tax) as of 2009 year end • Expect cash contributions of ~$110 million in 2010 Eliminate current underfunded liability • Rebalance asset portfolio to fixed income by end of 2012 • Interest rate increases and asset price improvement would reduce the underfunded position Eliminate future volatility of plan expense and funded status • Match assets and liabilities Overview: Core Business Core Business Entertainment Entertainment Pension Pension Overview of NCR’s Business Strategy: |
7 NCR Confidential Financial Industry Growth Opportunities Ongoing roll-out of advanced ATM technologies at large banks • Intelligent deposit & remittance are top apps • Customers building competitive advantage • NCR the global leader in multi-vendor software for self- service¹ Other sectors of banking industry expected to narrow the technology gap over the next 12- 36 months Strong adoption rate of our Self-Serv line of ATM’s – most successful launch in company history Continued business strength in emerging markets • Extending ATM leadership in China • Continued progress in India – secured largest ATM order in country’s history *1 Source: RBR |
8 NCR Confidential Emerging Regions will Continue to Grow Caribbean & Latin America +58k Units Target ATM/100K ppl: 40 ATMs Current Penetration: ~ 22 ATMs Caribbean & Latin America +58k Units Target ATM/100K ppl: 40 ATMs Current Penetration: ~ 22 ATMs Middle East & Africa +278k Units Target per 100k ppl: 40 ATMs Current Penetration: ~ 6 ATMs Middle East & Africa +278k Units Target per 100k ppl: 40 ATMs Current Penetration: ~ 6 ATMs Eastern Europe +172k Units Target per 100k ppl: 80 ATMs Current penetration: ~ 40 ATMs Eastern Europe +172k Units Target per 100k ppl: 80 ATMs Current penetration: ~ 40 ATMs Northern Asia Pacific +374k Units Target ATM/100K ppl: 40 ATMs Current Penetration: ~ 12 ATMs Northern Asia Pacific +374k Units Target ATM/100K ppl: 40 ATMs Current Penetration: ~ 12 ATMs Southern Asia Pacific +587k Units Target ATM/100K ppl: 40 ATMs Current Penetration : ~ 5 ATMs Southern Asia Pacific +587k Units Target ATM/100K ppl: 40 ATMs Current Penetration : ~ 5 ATMs *Based on target ATM penetration threshold of at least 40 ATMs per hundred thousand population in all regions except Eastern Europe (80 ATMs per hundred thousand population) Source: Worldbank Database, Retail Banking Research, NCR Internal Analysis Fewer than 30 ATM markets globally have reached a “developed state” threshold . . . Still potential for another 1.4 million ATMs in emerging countries |
9 NCR Confidential Manufacturing Efficiencies – New Facilities Manaus, Brazil • Strengthen our position and capabilities in the world’s 3rd largest ATM market • Capitalize on self-service ATM demand in Brazil and surrounding regions • Well positioned for Intelligent Deposit • In-country R&D and manufacturing serves as key competitive advantage Columbus, Georgia • North American ATM manufacturing brought in-house to reduce costs and improve lead times • Engineering, services and operations co-located • Ability to improve products through integration of manufacturing, design and services Both facilities shipped product during Q1 2010 |
10 NCR Confidential Self-Service Has Become a Retail Imperative NCR SelfServ Checkout • Market-leading solution installed in 22 countries • > 65k units installed at > 150 global retailers; penetration rate in grocery channel of ~ 20% with potential to achieve 90% + over the next ten years • Strongest value proposition; density of placements improving from initial 4-unit installation • Launched Release 5.0 latest generation - Compact design for convenience, drug, and space constrained retailers - Note and Coin Recycling - 2ST - Usability enhancements - NCR APTRA Vision for systems management • Self-checkout now accounts for 20% of Tesco’s transactions in U.K., and 100% in US Fresh & Easy subsidiary • "The retailer (ASDA) is saving money with the shift to self-scan checkouts - with staff deployed elsewhere -…" * *Source: The Guardian |
11 NCR Confidential Retail Industry Growth Opportunities Offering leading edge solutions • NCR Advanced Marketing Solution in-store offer delivery platform in use at multiple Tier 1 U.S. Grocers (Marsh Supermarkets), Drug and C-stores • Broadest range of POS applications covering Food, GMS and Hospitality • Software solution more relevant; higher value-add Strong value proposition • Expertise in retail self-service channels. #1 in self- checkout in key customers such as Tesco, Sainsbury and SuperValu • Self-service offers economic advantages and ability to differentiate and improve customer service Expand advance product suite • NCR Netkey acquisition – deliver a growing range of multi-industry digital signage and self-service applications |
12 NCR Confidential Entertainment: NCR’s 3 rd Vertical Entertainment is a $1B growth opportunity currently available to NCR - “Third Vertical” that will validate multi-industry self-service strategy • Number 1 or 2 globally in key solutions • At forefront of self-service revolution • Top services provider across end markets Acquisition of TNR and DVD Play and partnership with Blockbuster gives NCR an installed base and customer relationships from which to ramp under ISO model. Working with movie studios – expect announcement over next several months. Consumption habits continue to change - NCR is well positioned Packaged media will continue to grow modestly, driven by consumer preference and migration to Blu-Ray DVD kiosk business is a proven model with near-term opportunity for competitive entry – share of video rental market could triple by end of 2010 NCR kiosks deployed are digital download ready Consumer shift to Kiosks driven by value and convenience; Kiosks potential to be 50% of ~ $8B DVD rental market within 3 years • • • • |
13 NCR Confidential Differentiated Entertainment Solutions NCR Application Capabilities • DVD Rental • Packaged Media Sell-Through • Capacity and Title Depth • Digital Download and Portability • Games • Buy, Sell, Trade • In-store and Outdoor Kiosk • Home |
14 NCR Confidential Execution Roadmap Expect to deploy up to 10,000 kiosks by year- end 2010 – capitalize on rapid transition of DVD rental share Customer wins underscore market demand • Growing customer base - deployments across high traffic areas (supermarkets, convenience food shops) $85 million investment in 2010 ($75M capex) • Expect revenue of $125M-$150M in 2010; goal to be EBITDA break-even in Q4 2010 Expect to generate positive EBITDA in the range of $25M-$35M in FY 2011 - Goal to be EBIT breakeven by Q4 2011 (based on 10K units installed) |
15 NCR Confidential Emerging Industry Profiles Travel & Lodging Healthcare & Public Sector Telecom & Technology • Patient Registration • Revenue Cycle Management • Lab Results • Patient Portal • Rx Management • Airline Check-in • Car Rental • Hotel/Resort Registration • Restaurant Order and Pay • Gaming • Multi-billion dollar market • Network design & implementation • Wireless implementation • Telco Bill Pay - No. 1 in Airline Check-in - 4 of the Top 10 QSR Operators - Most widely deployed CUSS platform - No. 1 in Healthcare Self-Service Patient Registration - Largest Global Postal Deployment - Preferred international services implementation provider for networking and telco solutions to global corporations |
16 NCR Confidential NCR the Largest Services Provider in Our Industry NCR the largest provider across our end markets • Powers over 2 million consumer points of service worldwide • Designed to grow/scale capability/leverage into new industries • Strategically aligned with Engineering and Operations NCR is also the largest managed service provider in our industry Poised to continue as a growth driver for the company • Opportunity for margin expansion through productivity and innovation • Global market leader-in managed services offers |
17 NCR Confidential Financial Summary Expecting improved performance in 2010 and progress towards long term goals 2010 Guidance • Revenue growth of 2-5%; NPOI (1) in range of $310-$330 million (includes estimated $30M loss from Entertainment business) • GAAP diluted EPS of $0.39-$0.49; non-GAAP diluted EPS excluding pension expense (1) of $1.35 - $1.45 (includes approx. $0.15 negative impact from Entertainment investment) • Breakeven free cash flow (includes $85M investment in Entertainment) Executing our multi-year operating plan calling for NPOI margin improvement driven by profitable revenue growth, cost structure and working capital improvements Self-service demand will be a secular driver of our revenue growth in core solutions and in new verticals like Entertainment NCR’s balance sheet and cash flow generation capability support an environment of growth, investment and enhanced returns to shareholders (1) See reconciliation of GAAP to non-GAAP measures in the Appendix to this presentation and/or the Investor page of NCR’s website. |
18 NCR Confidential Revenue Performance Revenue from Continuing Operations $4,000 $4,250 $4,500 $4,750 $5,000 $5,250 $5,500 $5,750 $6,000 2005 2006 2007 2008 2009 2010(e) $4,561m $4,582m $4,970m $5,315m $4,612m +1% +8% +7% -12% +2% to 5% |
19 NCR Confidential Managing for Margin Reducing our Cost Structure Key Initiatives • Value engineering • Product lifecycle management • Efx = Servicability, manufacturability and quality • Continuous improvement organization installed • Streamlined organization • Accelerating labor costs & expense reduction $200 million to $250 million savings for the period 2008-2011 (50% reinvested) |
20 NCR Confidential NPOI: Poised to Return to Growth NPOI: Non Pension Operating Income (1) $0 $400 2005 2006 2007 2008 2009 2010(e) $248m $276m $349m $400m $284m $310m - $330M +11% +26% +15% -29% +9% to 16% (1) See reconciliation of GAAP to non-GAAP measures in the Appendix to this presentation and/or on the Investor page of NCR’s website |
21 NCR Confidential Strong Balance Sheet Cash balance $451 Debt balance $ 15 Net cash position $436 12.31.09 12.31.09 Near Term Objectives • Liquidity • Financial Flexibility • Working Capital Improvements Long Term Objectives • Free Cash Flow generation ($ in Millions) |
22 NCR Confidential Pension Management Strategy • Global underfunded status of $1,048M at 12/31/09; improved to approximately $990M (A) underfunded status at 3/31/10 (see appendix #29) • Historically NCR has seen significant volatility (see appendix #33 and 34). Pension strategy is to reduce volatility and riskiness of plan assets over a three year period • Shift asset allocation of US Pension Plans to 100% fixed income by the end of 2012 – Target 60% by end of 2010, 80% by end of 2011, and 100% by end of 2012. Mostly high grade corporate bonds with an overall duration that approximates the duration of the liability – No cash contribution for U.S. qualified plan is expected to be required until 2012 (see appendix #29) – Pension legislation could provide significant relief (see appendix #32) – US underfunded position at $822M at 12/31/09. Significant upside if interest rates rise or asset returns improve (see sensitivity appendix on #35) • For International Pension Plans, work with local pension trustee boards to make similar changes in asset allocation – International underfunded position of $226M at 12/31/09 ($470M of underfunded plans offset by $244M overfunded plans (see appendix #29) – Funding of international plans expected to decline significantly after 2013, reaching an annual amount of $10-$20M (excluding the funding of future service cost) by 2015 as some underfunded plans reach fully funded status (see appendix #29) – Due to pension plan closures, service cost expected to gradually decline from ~$15M in 2010 to ~$10M per year (see appendix #34) Actions to Address Pension (A) Estimated based on data available at March 31,2010; for accounting purposes the pension plans are not marked-to-market on a quarterly basis |
23 NCR Confidential 3-Year Vision for NCR Leading Financial Solutions provider Leading Retail Solutions provider Leader in Hospitality, Travel, Gaming and Healthcare Solutions Multi-Channel leadership Leader in Managed Services; 50% recurring revenue stream Sustainable, industry leading cost structure Continued significant cash flow production #1 or #2 market share leader in DVD Kiosk Market (US & Intl) Physical DVD rental & sell- through; digital download leadership “Automated Retail” Market leader in multi- channel distribution of digital entertainment media High growth; Significant EBITDA; Positive cash flow Brand leadership Under-funded pension position significantly reduced Volatility and risk of current pension asset allocation eliminated Core Business Entertainment Pension |
24 NCR Confidential NCR Value Equation Strong NPOI, EBITDA and Operational EPS Core Markets (excluding Entertainment business) NPOI of $340-$360M in 2010 EBITDA pre Pension of $465- $485M in 2010 Operational EPS of $1.50 to $1.60 in 2010 PE and EBITDA multiples should increase to historical averages due to reduced pension volatility and leadership position in core markets Bulk of investing complete by 2010 y/e – $85M investment, $30M NPOI loss and approx. negative $0.15 EPS in 2010 + $25-$35M of EBITDA in 2011 Potential EBITDA multiple of 10X or $250 - $350M valuation benefit Less after tax underfunded position of ~$750M at 12/31/09 Less after tax present value of future service cost (not included in liability above) of ~$90M Less after tax present value of post retirement obligation of ~$80M at 12/31/09 Plus net cash on balance sheet of ~$436M at 12/31/09 Core Business Entertainment Pension + Other B/S Items |
25 NCR Confidential Why Invest in NCR? Positioned for success • Growth strategy • Expanding market leadership • Global share and balance • Marquee customers • Strong balance sheet • Compelling value propositions • World-class employees • Track record is one of execution • Growth initiatives • Cost structure initiatives |
26 NCR Confidential Appendix |
27 NCR Confidential Reconciliation of GAAP to non-GAAP Measures $ 284 $310 - $330 $ 28 $ 43 Non-Pension Operating Income (non-GAAP) 159 215 38 56 Pension Expense 6 5 - 5 Global Headquarters Relocation 22 - - - Impairment of Assets Related to Equity Investment $ 97 $90 - $110 $ (10) $ (18) Income (Loss) from Operations (GAAP) FY 2009 FY 2010 2009 2010 Actual Guidance Q1 Q1 $ 1.27 $1.35 - $1.45 $ 0.06 $ 0.15 Diluted Earnings Per Share (non-GAAP) (0.67) (0.94) (0.15) (0.25) Pension Expense (0.03) - - - Litigation Charge (0.03) (0.02) - (0.02) Global Headquarters Relocation (0.18) - (0.03) - Impairment of Equity Investment and Related Assets (0.57) - 0.03 - Fox River Environmental Matter, Net $ (0.21) $0.39 - $0.49 $ (0.09) $ (0.12) Diluted Earnings (Loss) Per Share (GAAP) FY 2009 FY 2010 2009 2010 Actual Guidance Q1 Q1 $ 50 $ - Free Cash Flow (non-GAAP) (173) (215) Net Capital Expenditures $ 223 $ 215 Cash Provided by Operating Activities (GAAP) FY 2009 FY 2010 Actual Guidance Income (Loss) from Operations (GAAP) to Non-Pension Operating Income (non-GAAP) Diluted Earnings (Loss) Per Share (GAAP) to Diluted Earnings Per Share (non-GAAP) Cash Provided by Operating Activities (GAAP) to Free Cash Flow (non-GAAP) |
28 NCR Confidential NCR trades at a material discount to the market and its peers, largely due to the current pension situation Pension assets invested in equities are not only volatile, but correlated with NCR’s operating businesses A significant portion of NCR’s capital is allocated to its “pension- management” business • This allocation has limited NCR’s ability to invest in our core operating businesses and to provide immediate shareholder returns • Under-utilization of NCR balance sheet To fix the valuation gap, NCR plans to: • Reduce risk and volatility by re-allocating our domestic pension portfolio to fixed- income securities by year-end 2012 • Direct freed-up risk-taking capacity to the highest value-added investment alternatives: organic investments, strategic acquisitions • Fund the pension plan according to regulatory requirements (i.e., do not pre-fund) Addressing NCR’s Valuation Gap |
29 NCR Confidential NCR Pension Update – Q1 2010 Cash Funding for Pension Plans 2008 2009 2010E 2011E 2012E 2013E US Qualified Plan** 0 0 0 0 125 175 US Non-qualified Plan 9 9 10 10 10 10 International Plans*** 74 74 100 115 115 115 Total 83 83 110 125 250 300 Pension Metrics & Funded Status Asset Return Discount rate Funded Status 3/31/10 YTD (A) 12/31/09 3/31/10 (A) 12/31/09 3/31/10 (A) US Plans 3.5% 5.75% 5.88% (822) (740) International Plans 2% 4.9% 4.8% (226)* (250) Global 2.9% 5.4% 5.45% (1,048) (990) ( $ Millions) ( $ Millions) The estimated improvement in the global funded status was approximately $58m in Q1 *The ($226m) net funded status of international plans is comprised underfunded plans of ($470m), and overfunded plans of $244m The overfunded plans are a result of local funding methodologies that use more conservative actuarial assumptions than GAAP ** The funding requirement for the US qualified plan assumes no funding relief legislation *** The funding of international plans is expected to decline significantly after 2013 reaching an annual amount of $10-$20 million (excluding the funding of future service cost) by 2015 as some of the underfunded plans reach fully funded status Due to pension plan closures, service cost is expected to decline to a level of about $10m per year (see slide #34) All future funding estimates are approximations based on expected asset returns, discount rates, and local requirements (A) Estimated based on data available at March 31,2010; for accounting purposes the pension plans are not marked-to-market on a quarterly basis |
30 NCR Confidential US Plans Only – Funded Status Bridge • Funded Status of US Plans improved ~$82m in Q1 to (740m) • Improvement was due to good asset returns and a 13bp increase in discount rate Liabilities Assets Benefit Payments Asset Returns Fees & Expenses Asset Value, 12/31/09 (52) (6) 2,610 Asset Value, 3/31/10 Benefit Payments Interest Liability Value, 12/31/09 (54) 46 3,350 Liability Value, 3/31/10 88 2,580 3,402 (44) Discount Rate Movement ($Millions) Funded Status (822) (740) +2 +38 +42 (A) (A) (A) (A) (A) Estimated based on data available at March 31,2010; for accounting purposes the pension plans are not marked-to-market on a quarterly basis |
31 NCR Confidential Shift pension asset allocation to 100% fixed income by end of 2012 • Risk of equity exposure in pension plan must be reduced – Size of NCR pension plan (and therefore the associated risk) is disproportionate to the size of NCR – Riskiness and volatility of pension plan increases stock price volatility and places a discount on the stock price – The US pension plan is closed and the duration of the liability is becoming shorter • Shifting over 3 years allows for some additional recovery from the recent market downturn – Potential additional upside in the equity markets and/or benefit from increase in the discount rate Pre-fund of US pension plan analyzed • Given NCR’s tax position, there is not a compelling financial benefit for NCR to fund early – NCR has minimal near-term U.S. tax liability, so cannot take advantage of accelerating tax deductions by funding earlier than required – Similarly, would not be able to take advantage of tax deductions for interest expense (if funded with debt) • Inefficient capital allocation – The underfunded pension liability is analogous to unsecured debt of NCR. NCR has no other outstanding debt. We believe we have better investment uses for our cash balances and operating cash flow than choosing to pre-pay debt at the present time • Cash flow deployed into business opportunities – No cash funding is projected to be required for the U.S. qualified pension plan in 2010 or 2011 – A pre-fund now does not materially change required funding in 2012 and 2013 Rationale – Analyzed Various Options |
NCR Confidential 32 Possible Impact of Pension Funding Relief Legislation on NCR Two relief options; 2+7 and 15-year vs. current law Two options potentially subject to “cash flow rules” (e.g., limits on employee compensation, dividends, and stock redemption) Balanced legislation passed in Senate – provides relief; currently bill in House Ways and Means Committee; anticipated closure by Q3 2010 Key Provisions Impact on NCR Conditions Status 2+7 vs. Current Law Provides marginal relief. NCR not likely to use. Senate: 2 yrs of cash flow rules House: 3 yrs TBD Senate: passed House: TBD 15-Year vs. Current Law Likely provides meaningful relief for NCR. Senate: 5 yrs of cash flow rules House: 3-5 yrs of cash flow rules and “active plan” requirement Senate: passed House: active plan issue Investment Expenses not Included in Normal Cost Helpful to NCR. N/A Senate: not addressed House: TBD NCR Leading Industry Coalition to Secure Passage of Pension Relief Possible Impact of Pension Funding Relief Legislation on NCR Pension Legislation Could Provide Relief |
33 NCR Confidential Plan 2000 2001 2002 2003 2004 2005 2006 2007 2008 2009 U.S. Plans $3,026 $2,686 $2,208 $2,797 $3,016 $3,098 $3,385 $3,423 $2,208 $2,582 International Plans 1,514 1,089 1,138 1,397 1,658 1,748 2,085 2,114 1,467 1,737 Total Plans $4,540 $3,775 $3,346 $4,194 $4,674 $4,846 $5,470 $5,537 $3,675 $4,319 Plan 2000 2001 2002 2003 2004 2005 2006 2007 2008 2009 U.S. Plans $2,408 $2,494 $2,700 $2,960 $3,194 $3,372 $3,290 $3,199 $3,227 $3,404 International Plans 1,185 1,127 1,380 1,635 1,939 1,932 2,046 2,020 1,645 1,963 Total Plans $3,593 $3,621 $4,080 $4,595 $5,133 $5,304 $5,336 $5,219 $4,872 $5,367 Plan 2000 2001 2002 2003 2004 2005 2006 2007 2008 2009 U.S. Plans $618 $192 ($492) ($163) ($178) ($274) $95 $224 ($1,019) ($822) International Plans 329 (38) (242) (238) (281) (184) 39 94 (178) (226) Total Plans $947 $154 ($734) ($401) ($459) ($458) $134 $318 ($1,197) ($1,048) Pension Assets Pension Liability Funded Status ($ Millions) NCR Historical Pension Overview |
34 NCR Confidential Historical Funded Status, Funding and Expense ($ Millions) Plan 2000 2001 2002 2003 2004 2005 2006 2007 2008 2009 U.S. Plans 126% 108% 82% 94% 94% 92% 103% 107% 68% 76% International Plans 128% 97% 82% 85% 86% 90% 102% 105% 89% 88% Total Plans 126% 104% 82% 91% 91% 91% 103% 106% 75% 80% Plan 2000 2001 2002 2003 2004 2005 2006 2007 2008 2009 All Plans 62 59 55 70 111 110 112 92 83 83 Plan 2000 2001 2002 2003 2004 2005 2006 2007 2008 2009 All Plans (124) (124) (74) 105 135 150 145 44 25 159 Plan 2000 2001 2002 2003 2004 2005 2006 2007 2008 2009 All Plans 78 77 76 88 89 87 89 38 27 17 Funded Status Pension Funding Pension Expense / (Income) Service Cost NCR has experienced significant volatility in the funded status of its pension plans over the years NCR’s focus moving forward will be to manage and reduce the risk of funded status volatility Due to pension plan closures, the annual service cost is expected to continue to decline to approximately $10m There are approximately 20 international plans, with approximately half still open at this time. |
35 NCR Confidential (A) Assumes 6% at end 2010, 6.25% at end of 2011, and 6.5% at end of 2012 (B) Contribution required for US Qualified plan in 2012 (no required contribution expected in 2010 or 2011), also assumes no pension reform legislation (C) Includes the impact of contributions on funded status 2000 2001 2002 2003 2004 2005 2006 2007 2008 2009 10 yr avg 20 yr avg Asset Returns -2% -6% -12% 36% 15% 10% 16% 7% -31% 28% 4% 10% Discount Rate 7.5% 7.3% 6.8% 6.3% 5.8% 5.5% 5.8% 6.3% 6.3% 5.8% 6.3% 7.0% Historical Asset Returns and discount Rates for US Plan ($ Millions) Projected Funded Status $ Contributions – Sensitivity Analysis Discount Rate remains at 5.75% Discount Rate increases to 6.5% (A) Scenario Annual Equity Returns through 2012 Required Contribution in 2012 (B) Projected Funded Status 12/31/2012 (C) Required Contribution in 2012 (B) Projected Funded Status 12/31/2012 (C) 3 yr. shift to 100% fixed income 5% $145 ($880) $130 ($770) 3 yr. shift to 100% fixed income 10% $125 ($775) $115 ($670) 3 yr. shift to 100% fixed income 15% $115 ($670) $100 ($565) Funded Status as of 12/31/2009 = ($822) Sensitivity Analysis - US Plans ONLY |