 Analyst Day November 16, 2010 New York Stock Exchange Gavin Bell VP, Investor Relations Exhibit 99.1 |
 NCR Confidential 2 Note to Investors Comments made during this event and in the related presentation materials may include forward- looking statements under the Private Securities Litigation Reform Act of 1995. These forward-looking statements are based on current expectations and assumptions, and are subject to a number of risks and uncertainties that could cause actual results to vary materially. These risks and uncertainties are detailed from time to time in NCR’s SEC reports, including, but not limited to, Forms 10-Q, 10-K, 8-K and NCR’s annual report to shareholders. Statements made during this event and in the related presentation materials are made only as of the date of this event, and NCR does not undertake any obligation to publicly update or revise any such statements, whether as a result of new information, future events or otherwise. While NCR reports its results in accordance with generally accepted accounting principles in the United States, or GAAP, in an effort to provide additional useful information regarding NCR’s financial results, certain materials presented during this event will include non-GAAP measures. NCR’s management evaluates NCR’s results excluding certain items, such as pension expense, to assess the company’s financial performance, and believes this information is useful for investors because it provides a more complete understanding of NCR’s underlying operational performance, as well as consistency and comparability with past reports of financial results. In addition, management uses earnings per share excluding these items to manage and determine effectiveness of its business managers and as a basis for incentive compensation. The non-GAAP measures presented during this event should not be considered as substitutes for, or superior to, results determined in accordance with GAAP. A reconciliation of these non-GAAP measures to comparable GAAP measures and other related information is included in the portion of these presentation materials entitled “Non-GAAP Supplementary Materials” and is available on the Investor Relations page of NCR’s website at www.ncr.com. Descriptions of many of these non-GAAP measures, including free cash flow, also are included in NCR’s SEC reports. These charts and the associated remarks are integrally related and are intended to be presented and understood together. |
 NCR Confidential 3 Agenda NCR Business Strategy Bill Nuti – Chairman & CEO ISG Overview John Bruno – EVP - ISG LoB Presentations Michael O’Laughlin – GM, Financial Services Mike Webster – GM, Retail & Hospitality Chris Askew – GM, NCR Services Intermission LoB Presentations Justin Hotard – GM, Entertainment Jeff Kao – GM, Healthcare John Bruno – Travel & Gaming Operations Strategy Peter Dorsman – SVP, Operations NCR Financial Overview Bob Fishman – CFO Audience Q&A Bill Nuti – Chairman & CEO |
     NCR Business Strategy NCR Analyst Day November 16, 2010 New York Stock Exchange Bill Nuti Chairman, CEO & President Companies that adopt a clear strategic posture and that invest in becoming more aware, resilient and flexible will be able to outperform those that simply stay in their bunkers, hoping the world will return to “normal.” -McKinsey Quarterly, May 2009 |
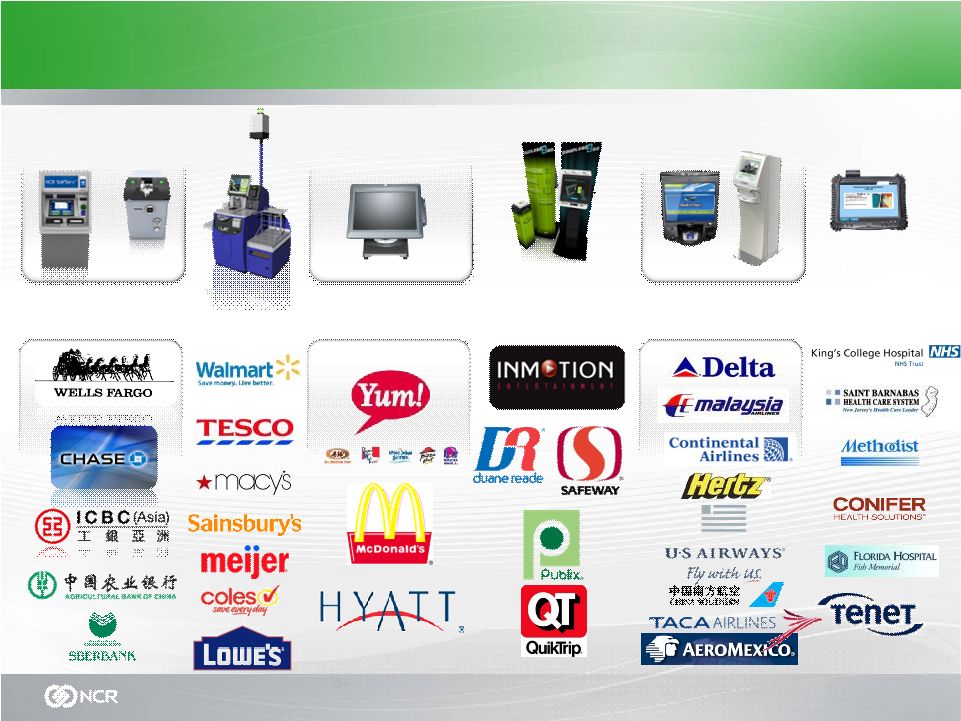
           NCR Confidential 5 NCR is Strong, Growing and an Exciting Company Revenue Growth Gross Margin Expansion Improving the customer experience Today, a consumer connects, interacts and transacts with a variety of technology, much of it from NCR Did you know: NCR enables over 245M transactions a day globally Key Take Aways • NCR is well positioned • Transformation has gone better than expected • Our outlook is balanced • The market is coming toward us |
       NCR Confidential 6 Achieved many of the productivity gains in this space. 1970 Over the Past 40 Years, Technology has been used to Streamline the “Back Office” to Increase Productivity Manually process: - Reports - Accounting - Inventory - Payroll Software processes: - ERP implemented broadly - Data mining mature - High speed networks in place - Storage/Virtualization Today Data storage Process Orders Back office run… Network Software Apps |
 NCR Confidential 7 Savings for each tax return filed electronically Savings per transaction when checking in at a kiosk vs. an agent $2.86 $2.15 …are in the “Front Office” Savings per transaction when using an intelligent deposit ATM vs. going into the bank branch $4.25 $0.40 $3.85 The Next Generation of Productivity Gains Source: ITIF APRIL 2010 • DANIEL CASTRO, ROBERT ATKINSON and STEPHEN EZELL |
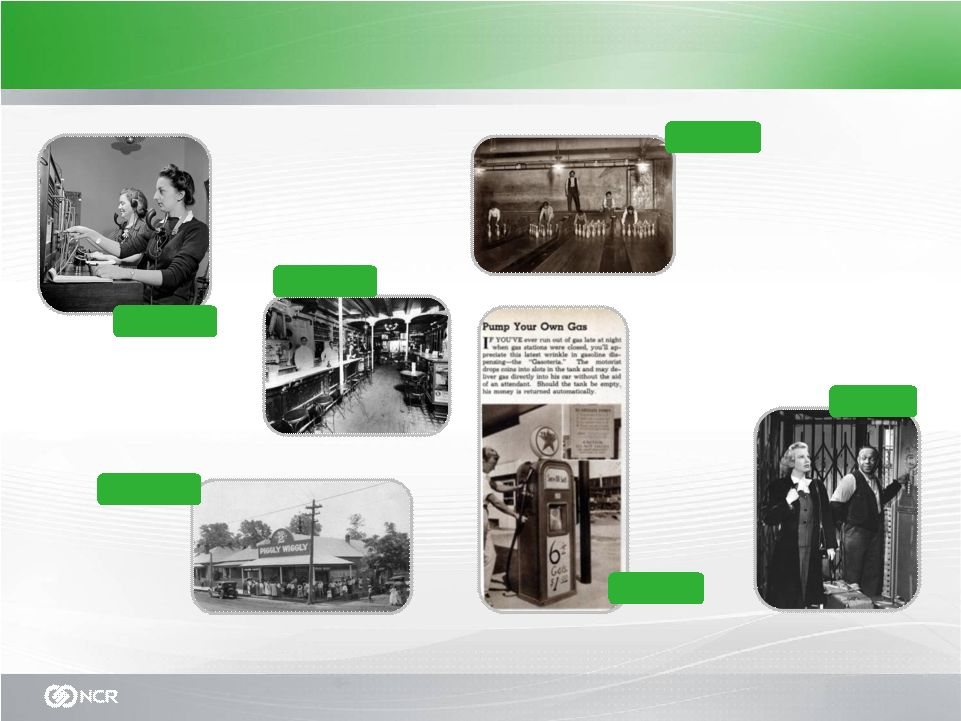 NCR Confidential 8 Self-Service has been Evolving for Decades… Three Forces of Change: Productivity, Technology and The Consumer 1958 First self- service gas station opens in Omaha, Nebraska 1916 Piggly Wiggly opens first self-service grocery store 1888 Automatic dialing allows people to place calls themselves 1953 By 1962, automatic elevators had replaced 4000 operators in NYC 1920 First soda vending machine replaces soda shop drugstores 1962 Hard to find pin boys are replaced with pinspotting machines |
 NCR Confidential 9 Financial Retail Hospitality Entertainment Travel Healthcare The Growth of Self-Service Business Models is Accelerating |
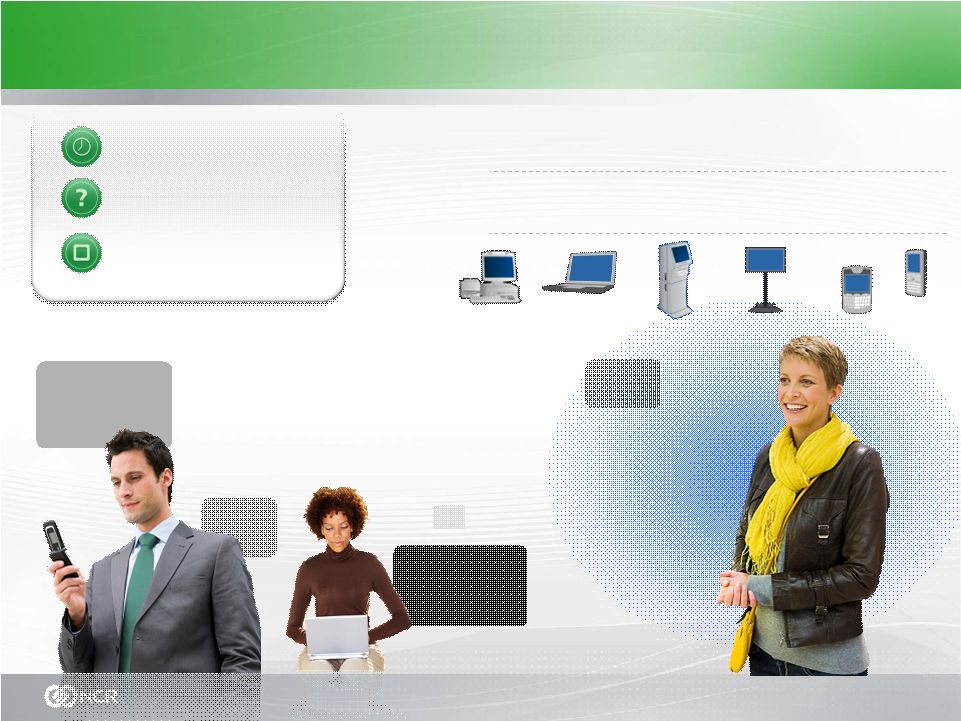       NCR Confidential 10 The Rapidly-Changing Consumer Less Loyal Digitally Enabled Time Starved Social Networking Mobile Applications Self-service is one of the key characteristics of digital natives, and with advances in communication technologies and a variety of end-user devices to access information, self-service enables the "pull" of information anywhere, anytime, anyplace on any device. Gartner Industry Research 13 September 2007 2012: The Store of the Digital Native of retailers measuring multichannel customer profitability say… these shoppers are more profitable than single channel shoppers. 88% RSR Research, July 2010 |
 NCR Confidential 11 In 2010, self-service kiosk transactions in North America are expected to total $740 billion and will likely reach $1.1 trillion by 2014. 2 out of 3 U.S. consumers would prefer to use a kiosk at quick-service 50 billion global ATM transactions annually 40% Self checkout reduces wait time by 40% Source: ITIF APRIL 2010 • DANIEL CASTRO, ROBERT ATKINSON and STEPHEN EZELL Self-Services Delivers Higher Productivity and Delights the Consumer Over 1.8 million ATMs are in operation in virtually every country 2010 Source: RBR 2010 Global ATM Report Source: IHL Research, North American Kiosk Study, 2010 |
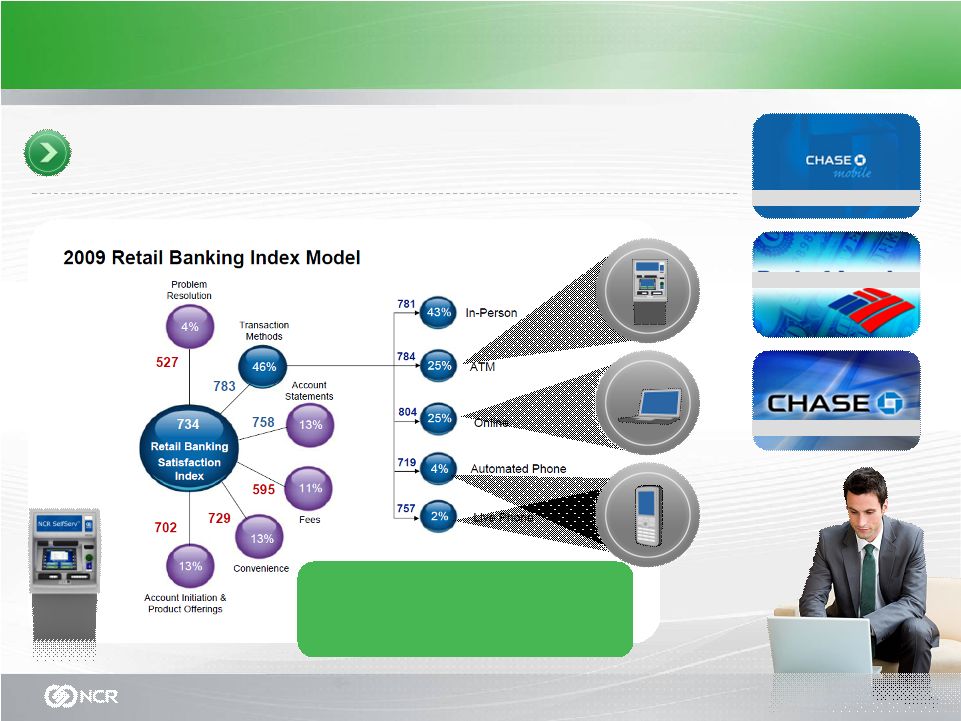         NCR Confidential 12 This Phenomenon Comes Together in All Industries 46% of people say transaction methods are the single most important element in customer satisfaction J. D. Power and Associates Bank of America Chase Chase/iPhone “Imagine what could happen if these channels were converged” |
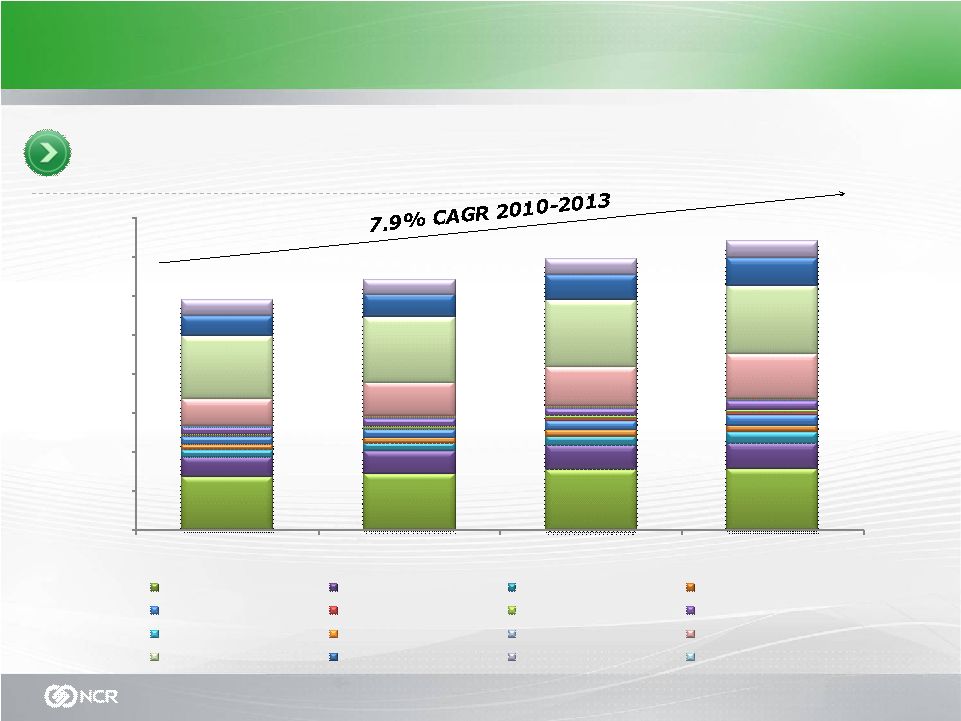 NCR Confidential 13 Self-Service is a Growth Market “Our strategy is to expand our available market” NCR Addressable Market 2010 - 2013 $0 $2,000 $4,000 $6,000 $8,000 $10,000 $12,000 $14,000 $16,000 2010 2011 2012 2013 ATMs Banking multichannel sw TCR/TACR Financial kiosks Self Checkout C-tailing software Digital Signage Retail kiosks Travel kiosks Travel mobile Healthcare kiosks & portals DVD kiosk rentals Services-financial Services -retail Services- travel Services -others $11.7B $12.8B $13.9B $14.8B |
 NCR Confidential 14 But There are Broader Market Trends we will Leverage It is estimated that by 2011, more than 500 million mobile devices will have integrated near-field communications, making mobile communications an even more integral part of how businesses connect and interact with their customers. -ABI Research 10X more mobile internet devices than desktop computers are expected 6 million m-payment subscribers in Kenya 7.2 million m-payment subscribers in Philippines Source: ITIF APRIL 2010 • DANIEL CASTRO, ROBERT ATKINSON and STEPHEN EZELL 40% of the Global population lives on less than $2.50/day 10 million unbanked in the US alone Source: World Bank |
 NCR Confidential 15 Next generation manufacturing, CRVE, PLM, CI Our Multi-phase Transformation Towards Sustainable Revenue Growth and Improved Margins Phase I 2003 G&A cost effectiveness Over $500M of savings to date 2010 2004 2005 2006 2007 2009 2008 Spin-off Global Recession Froze Pension Phase III 2011 2012 Return to growth Phase II Building a sustainable and lasting cost structure Period of rapid growth Move HQ and establish global COEs BU to LoB model Manufacturing Restructuring (NEXTGen) Long-term growth, margin expansion and the leader in customer loyalty |
   NCR Confidential 16 Capable and proven in building best-in-class cost structure; disruptive gains in productivity / efficiency are key features Leadership in converged channel innovation becomes reality Accelerating global adoption of self-service solutions and business models Expanding addressable market Excellent global balance, innovation and exceptional talent NCR: Ready and Executing Phase III We start with the end in mind 6-8% CAGR in revenue and 15-20% NPOI CAGR - 2010 through 2013 “NCR enters the next phase of our transformation poised to deliver profitable growth, margin expansion and an unparalleled customer experience” We’re organized efficiently and have successfully completed major change programs |
 NCR Vision and Mission Leading how the world connects, interacts and transacts with business. Vision Provide our customers with the next generation of productivity gains and customer experience innovation through our deep knowledge of the changing global consumer and technology. Mission |
 NCR Confidential 18 From Vision to Execution: Our Strategy “Leveraging what is core to NCR” Financial Services Retail and Hospitality Trusted Partner to the Customers we Serve Trusted Partner to the Customers we Serve NCR Services Expand and strengthen geographic presence and sales coverage Penetrate adjacent single and multichannel self-service solution segments NCR BUSINESS SYSTEM DRIVING A CONTINUOUS IMPROVEMENT CULTURE Highest Productivity – Most Efficient and Effective – Best Quality Design to win PLM Lean Six Sigma CRVE Invest in a world-class organization to be the most knowledgeable, well trained, and have a strong sense of corporate responsibility EXPAND INTO EMERGING GROWTH INDUSTRIES Travel and Gaming Healthcare Entertainment Leverage Consumable BU Innovations Innovation is the Foundation of our Strategy |
   NCR Confidential 19 NCR Management Priorities Driving our Global Strategy Revenue Growth Focus is on profitable, sustainable revenue growth All industries play a role; growing software and services are our top priorities Entertainment will contribute significantly in medium term Our strategy leads us to 25%+ gross margins over the medium term We’re aligned on execution…CI, CRVE, PLM, Quality, Innovation, Mix… Services will continue to lead the way; software mix will kick in Gross Margin Expansion Improving the Customer Experience Engagement in the customer loyalty survey process Focus on customer advocacy programs, i.e., CAP Changing the way we engage the customer, i.e., CE2C Making the customer our culture – listening to our customers preserves the health of our business |
 NCR Confidential 20 3-Year View for NCR As we View it Today Leading Financial Solutions provider Leading Retail Solutions provider Leader in Hospitality, Travel, Gaming and Healthcare and Public Sector Solutions Converged channel leadership Leader in Managed Services; 50% recurring revenue stream Sustainable, industry-leading cost structure Continued significant cash flow generation #1 or #2 market share leader in DVD Kiosk Market (US & Intl) Physical DVD rental and sell-through; digital download leadership “Automated Retail” Market leader in multi- channel distribution of digital entertainment media High growth; significant EBITDA; positive cash flow Brand leadership Under-funded pension position reduced Volatility and risk of current pension asset allocation significantly reduced Good progress towards pension independence Core Self-Service Industries Entertainment Operator Model Pension Business |
 John Bruno Executive Vice President Technology alone is rarely the key to unlocking economic value: Companies create real wealth when they combine technology with new ways of doing business. Source: MckinseyQuarterly.com DECEMBER 2007 • JAMES M. MANYIKA, ROGER P. ROBERTS, AND KARA L. SPRAGUE At your service every day and around the world At your service every day and around the world ISG Overview Analyst Day November 16, 2010 New York Stock Exchange |
   NCR Confidential 22 Hardware enabled and software-driven business models are emerging Consumer demand is changing globally Digitally-empowered consumer Businesses are adapting Tomorrow Will Require a New Way of Doing Business It is estimated that by 2011 more than 500 million mobile devices will have integrated near-field communications -ABI Research Industry segments are converging Customers are evolving differently in developed and emerging markets |
 NCR Confidential 23 Stateless Environment: Software–driven Business Model Kiosk Internet Mobile assisted-service Software Assisted seamless transition across all channels PS PS PS PS personalized self-service self-service |
 NCR Confidential 24 Presence Business Model Innovation C2B Adapting to consumer preference and presence Preference B2B B2C |
             NCR Confidential 25 Technology and Services Innovation NCR: Industry Solutions Group Organization and Process Innovation Design and Consumer Experience Innovation ISG Lines of Business R&D Customer and Professional Services Business and Decision Support |
   NCR Confidential 26 NCR Phase 2: ISG Initiatives 2008 2010 Consolidated R&D: • Hardware • Software • NCR Labs • Consumer Experience & Design 3 Centers of Excellence for Innovation 2009 2011 Last Analyst Day Vertically Integrated Functional BU Model Decentralized R&D 1 2 2 Line of Business Model • Focused strategy • Industry aligned • Cross-functional leadership 4 Integrated Customer and Professional Services Customer Care Centers Go-to-Market Model 5 Separate Engineering and Manufacturing Centers Lack of Enterprise-wide: •PLM •Offer integration •Marketing •North America •Europe •Asia •North America •Europe •Asia •Developed markets •Emerging markets |
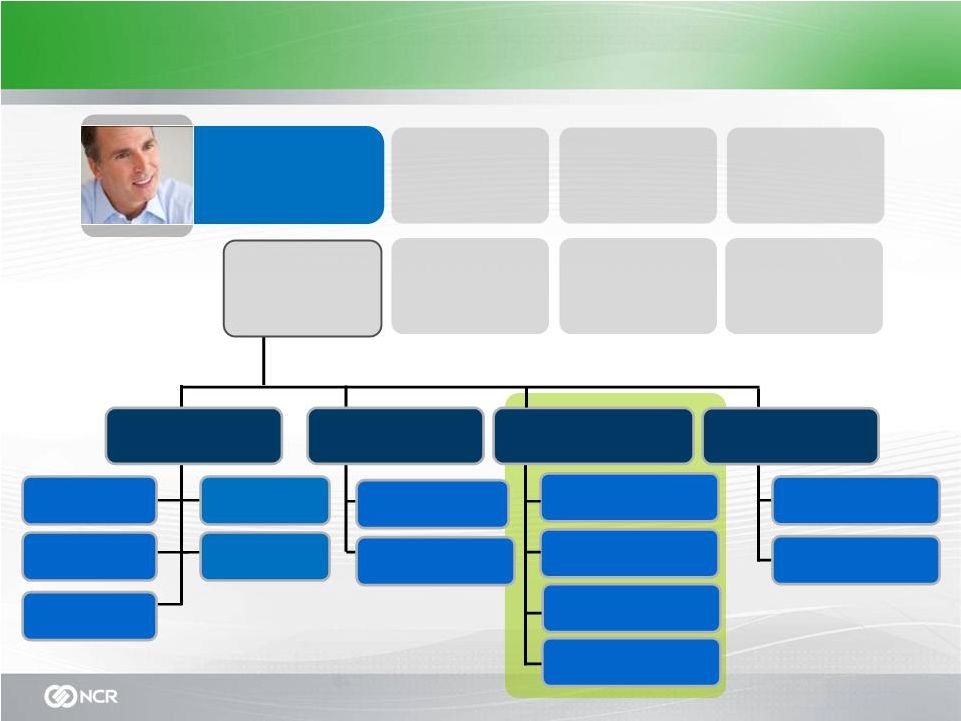
                 NCR Confidential 27 NCR Leadership Operations Sales Human Resources Finance Development and Realization Services Travel and Gaming Hardware Engineering Software Engineering Design and Consumer Experience Healthcare Customer Services Corporate Development Customer Assurance Program Professional Services Legal Consumables Lines of Business Research and Development Business and Decision Support NCR Services Financial Services Entertainment Retail and Hospitality Bill Nuti Chairman and CEO Industry Solutions Group |
 NCR Leadership Operations Sales Human Resources Finance Legal Consumables Bill Nuti Chairman and CEO Industry Solutions Group NCR Confidential 28 Lines of Business NCR Services Research and Development Business and Decisions Support Financial Services Retail and Hospitality Entertainment Travel and Gaming Healthcare Customer Services Professional Services Hardware Engineering Software Engineering Design and Consumer Experience Development and Realization Services Corporate Development Customer Assurance Program |
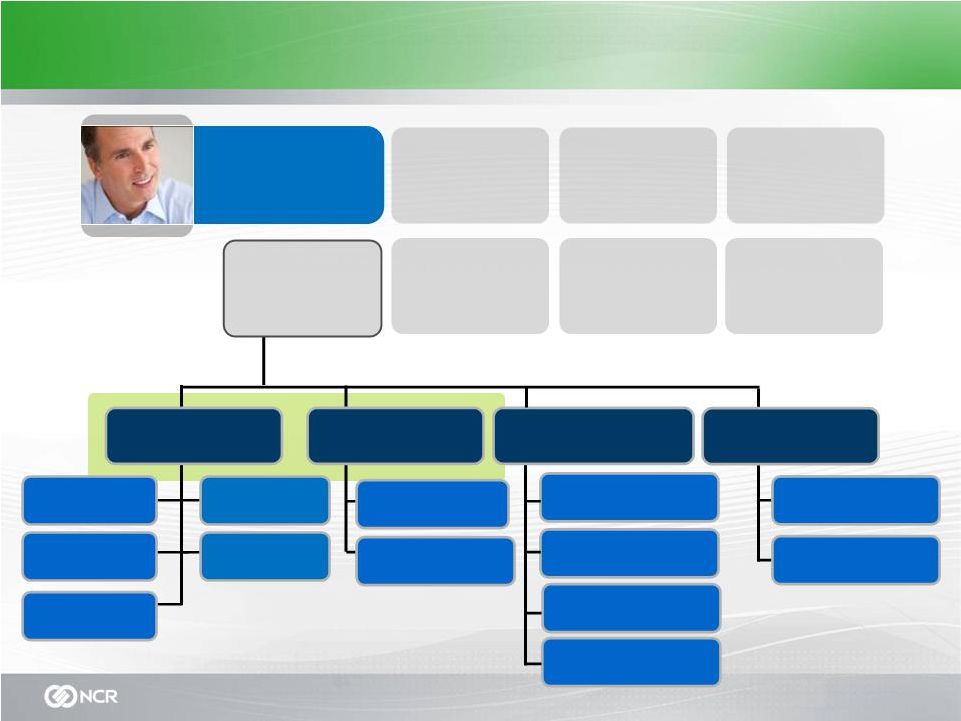
   NCR Confidential 29 Financial Service Leadership #1 in banking ATMs for 24 consecutive years #1 supplier of multivendor ATM middleware applications as recognized by RBR Michael O’Laughlin VP and GM NCR’s Financial line of business is the market leader in innovation and self-service solutions globally Did you know? NCR helps ~600 consumers interact with their financial institution every second globally Source: Global ATM Market and Forecasts to 2015 published by Retail Banking Research (RBR) and NCR internal analysis Source: Based on NCR internal analysis and data |
   NCR Confidential 30 Retail and Hospitality Leadership #1 in retail self checkout for seven consecutive years Mike Webster VP and GM NCR’s Retail and Hospitality line of business leads the industry in self-service transactions, and depth of solution portfolio Did you know? ~180M transactions are processed a day using NCR POS technology and another ~12.5M using self checkout Source: Based on NCR internal analysis and data #2 in retail point-of-sale Source: Based on NCR internal analysis and data Source: Retail Banking Research, May 2010 |
 NCR Confidential 31 NCR’s Services business is unmatched in global reach and capabilities and well positioned to be a sustainable profitable growth engine for the company NCR Services Leadership Chris Askew SVP 13,000 NCR Service professionals and proactive technologies Top 10 Support Provider Top 20 Global Outsourcer Excalibur Award for Predictive Services–TAG HDFC Tech Implementation Award– Asian Banker Support Manage Innovate Deploy Pre-emptive Strategic Value Proactive Predictive Reactive |
   NCR Confidential 32 NCR’s Entertainment continues to grow physical DVD distribution while building out strategy for digital download NCR Entertainment Leadership Entertainment #2 DVD kiosk operator in the U.S. Justin Hotard VP and GM Did you know? NCR DVD kiosks rent on average 136K movies per day in the US and growing Source: Based on NCR internal analysis and data Source: Based on NCR internal analysis and data |
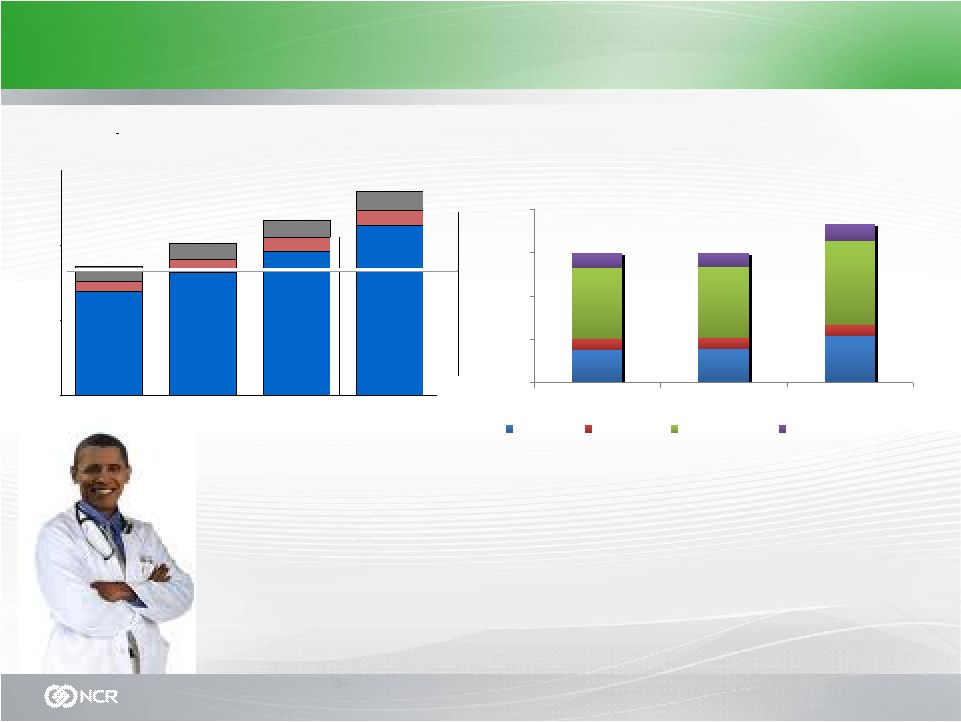
 NCR Confidential 33 NCR’s Healthcare business is well positioned for anticipated customer demands for automation and self-service NCR Healthcare Leadership Jeff Kao VP and GM #1 in U.S. hospital patient self-check in for three consecutive years Primary need for self-service technology remains in the physician space 1.1B patient check ins at doctors offices per year Source: Health, United States, 2007 (US Dept. of Health and Human Services) US Healthcare Expenditures: $2.3T Source: National Health Expediture Data, US Department of Health & Human Services Source: Based on NCR internal analysis and data $65 $101 $138 $234 $496 $718 $0 $200 $400 $600 $800 Hospitals Physicians Drugs Nursing Home Dental Home Care US He alt hc ar e Sp en di ng |
     NCR Confidential 34 Did you know? There are 195M passengers checking in on NCR solutions NCR Travel well positioned for global expansion NCR Travel and Gaming Leadership Theresa Heinz VP and GM Five of the top six U.S. airlines use NCR self-check-in 80% share in U.S. Mobile is the next evolution of self- service for travel More than 50% of passengers worldwide want more self-service options According to the 2009 IATA CATS (Corporate Air Travel Survey) >50% Source: Based on passengers as reported by IATA and NCR analysis Source: Based on NCR internal analysis and data Did you know? |
 NCR leadership Operations Sales Human Resources Finance Legal Bill Nuti Chairman and CEO Industry Solutions Group Lines of Business NCR Services Research and Development Business and Decisions Support Financial Services Travel and Gaming Customer Services Hardware Engineering Corporate Development Retail and Hospitality Healthcare Professional Services Software Engineering Customer Assurance Program Entertainment Design and Consumer Experience Development and Realization Services NCR Confidential 35 Consumables |
         NCR Confidential 36 In market and relevant to the consumers we serve (developed and emerging) Environments People • How people interact with machines Design and Consumer Experience • Physical and virtual space conditions influence behavior • Existing and emerging tools Technology Software Engineering Hardware Engineering >60% staff outside of U.S. >45% staff outside of U.S. Cross-industry scalable platforms: •Common reuse •Industrial-class •High-quality •Low-cost Cross-industry scalable platforms: •Component reuse •Enterprise-class •Standards based •Open architecture |
 NCR Confidential 37 Cross-industry scalable hardware platforms for an emerging world Entertainment Retail and Hospitality Healthcare Travel and Gaming Financial Services |
          NCR Confidential 38 Proactive Travel Management Cross-industry Scalable Software Platforms for an Emerging World Digital Download e-Commerce Software as a Service (SaaS) APTRA™ Consumer Passport REL 1.0.00 NCR APTRA™ Mobile Banking Online Text Mobile Web Mobile App Digital Signage Online and Mobile Bill Pay POS and Loyalty Software eMarketing CRM Integration |
   NCR Confidential 39 Intellectual Property NCR holds nearly 2,400 patents globally …and nearly 1,500 patent applications pending globally • Two-Sided Thermal technology (2ST™) • e-Commerce • Electronic shelf labels • Electronic signature capture NCR has several patent licensing programs: NCR has licensed approximately 80 companies under its e-Commerce relevant patents |
            NCR Confidential 40 NCR is at Your Service Every Day Around the World Touching more consumers Serving more industries With more solutions In more countries Unique Consumer Insight Highly available, secure, converged channel Cross-industry solutions for the consumer-driven enterprise Mission-critical hardware and enterprise-class software Architected to integrate and scale NCR Services ensure customer success Deliver on our partnership promise Unique Value Proposition Industry-leading platform portfolio Unmatched global services capabilities |
 Michael O’Laughlin GM, Financial Services Financial Services Strategy Analyst Day November 16, 2010 New York Stock Exchange At your service every day and around the world At your service every day and around the world |
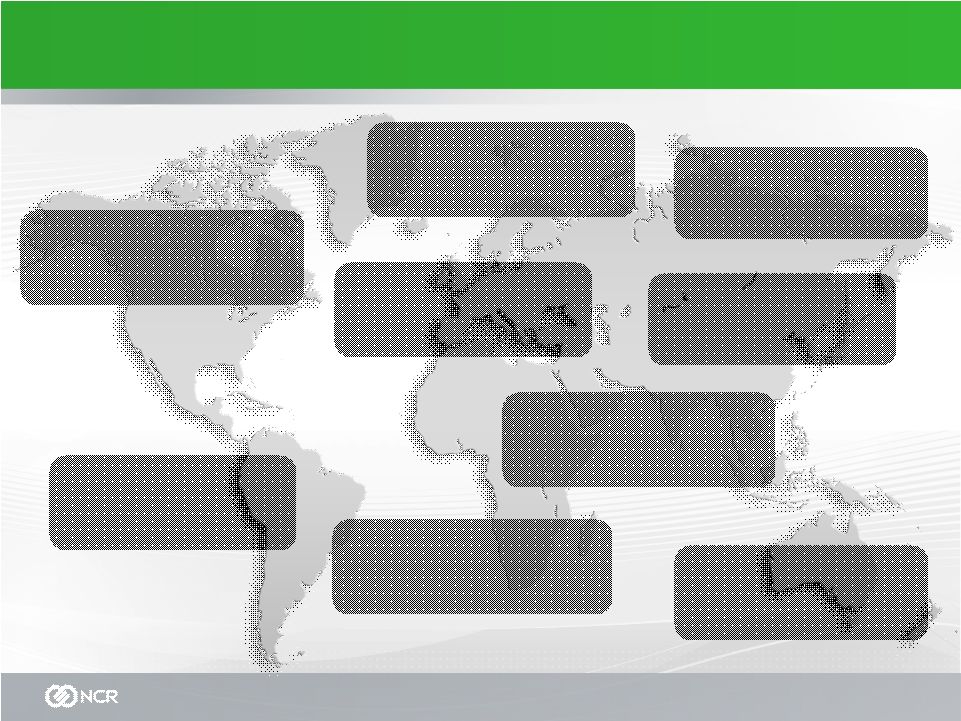
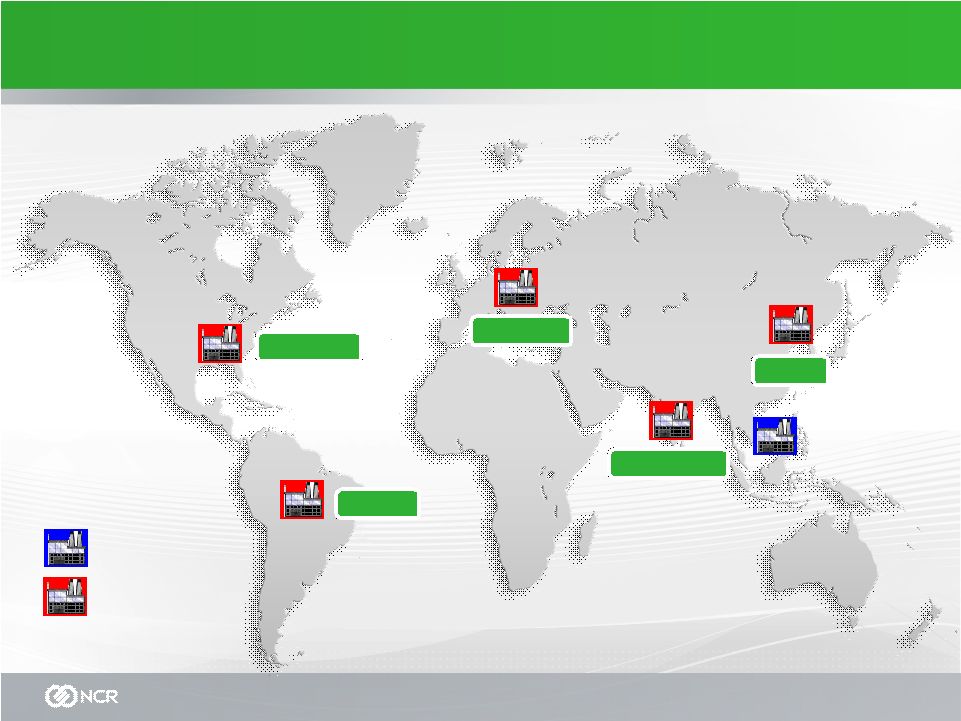
             NCR Confidential 42 Macro Trends create opportunity for NCR Americas • Intelligent deposit • Branch transformation • Remote data capture CLA • Capitalize on Brazilian investments to target new opportunities • New Brazil ATM series • Intelligent Deposit • Service expansion with Brazil growth • Managed services growth with introduction of Aptra Vision Europe • Intelligent deposit • Branch transformation • Multi channel Software solutions • Financial Kiosk MEA •Intelligent Deposit •Bill payments •Remittance solutions •Managed Services Eastern Europe • Bill payment & Financial Kiosk • Intelligent deposit • Turkey growing cash deposit and recycling • ATM penetration still below European averages Asia • Cash Dispenser growth in Southeast Asia • China Pocket recycling • Multi channel software solutions • Cash deposit growth • India outsourcing potential |
         NCR Confidential 43 Markets that will “move the needle” -5% 0.0% 5% 10% 15% 20% Install Base End 2010 Size of Circle = Total ATM Shipments 2011-2013 Total shipments: 1,058,240 units Total base 2010: 2,222,162 units Install Base CAGR 2011 => 2013 UAE, Serbia CEE Other, Asia Pac Other, Kenya, Vietnam, Pakistan Netherlands, Norway, Estonia, Denmark UK, Spain, Germany, Canada, France, Italy 71 largest countries Source: RBR 2010, NCR Large Mature USA Japan S Korea Emerging China India Russia Brazil Iran, Egypt, Kazakhstan, Nigeria 100,000 200,000 300,000 400,000 500,000 |
 NCR Confidential 44 Assisted/Branch ATM/Kiosk Internet Mobile Cx-banking Drive lower cost Increase dialogue Increase response seamless transition across all channels Strategy: Optimizing a Seamless Customer Experience |
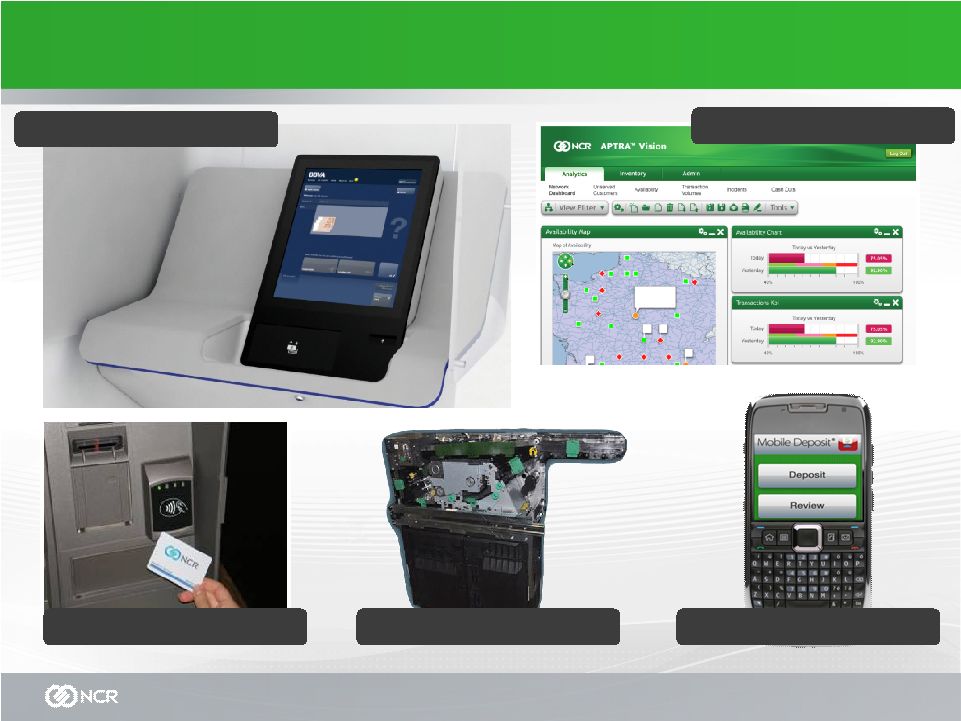  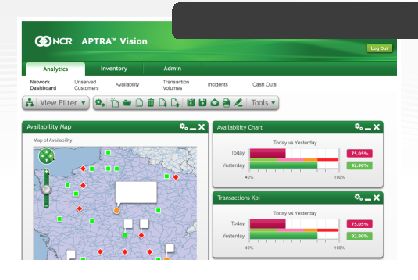   NCR Confidential 45 Innovation Drives Leadership BBVA APTRA Vision Scalable Deposit Module Remote Data Capture Contactless Card |
 NCR Confidential 46 Product Platform Strategy NCR SelfServ 20 Series 22 26 25 28 NCR SelfServ 30 Series 34 31 32 38 36 34 Emerging Market Platform 22e 42 Brazil TCR Coming Soon |
           NCR Confidential 47 Financial Software Strategy Channel Applications APTRA AANDC APTRA Activate Gasper APTRA Cash Connect APTRA Online Banking APTRA Mobile Banking Payment Solutions Cross Channel Applications • APTRA Vision • APTRA Scheduler • Bill Payment • APTRA E-Marketing • NCR APTRA Passport Deployment & Licensing Models • Licensed/On-Premise • Transaction Based Pricing • Hosted/SaaS Common Platform Components & Technology |
     NCR Confidential 48 Service Led Approach to Solutions Efficient and proactive management system Optimized cash management system Optimize self-service channel and improve customer satisfaction Best-in-class operational model NCR Services enables seamless, successful consumer interactions every time Consultative Resources for branch and process transformation More customer-facing resources Cx Consulting Branch Transformation design SaaS / Hosting Operational Help Desk APTRA Vision Predictive Incident Management Account Support, etc Total Branch Multivendor Support Annuity On-Site and Depot Maintenance Transaction and Deployment Services Technology Refresh |
 NCR Confidential 49 Global Leadership Global leader in ATM’s for the 24 th year Only self service company in the top 5 of the FinTech Top 100 (global technology and service providers to the Financial industry) Global leader in Intelligent deposit ATM Multivendor Middleware and Applications Leader in Multivendor Teller Cash Recycler applications Microsoft Gold certified partner |
 NCR Confidential 50 Financial LOB Strategy Quality Cost Reduction and Value Engineering Under-Penetrated Geographies Adjacent Solutions Improve Software and Services Mix PLM Gross Margin Expansion Develop Leaders Engaged Employees Continuous Improvement Customer Success Action Planning Improving the Customer Experience Hardware Software Self-Service Services Revenue Growth |
 At your service every day and around the world At your service every day and around the world Mike Webster GM, Retail and Hospitality Retail and Hospitality Strategy Analyst Day November 16, 2010 New York Stock Exchange |
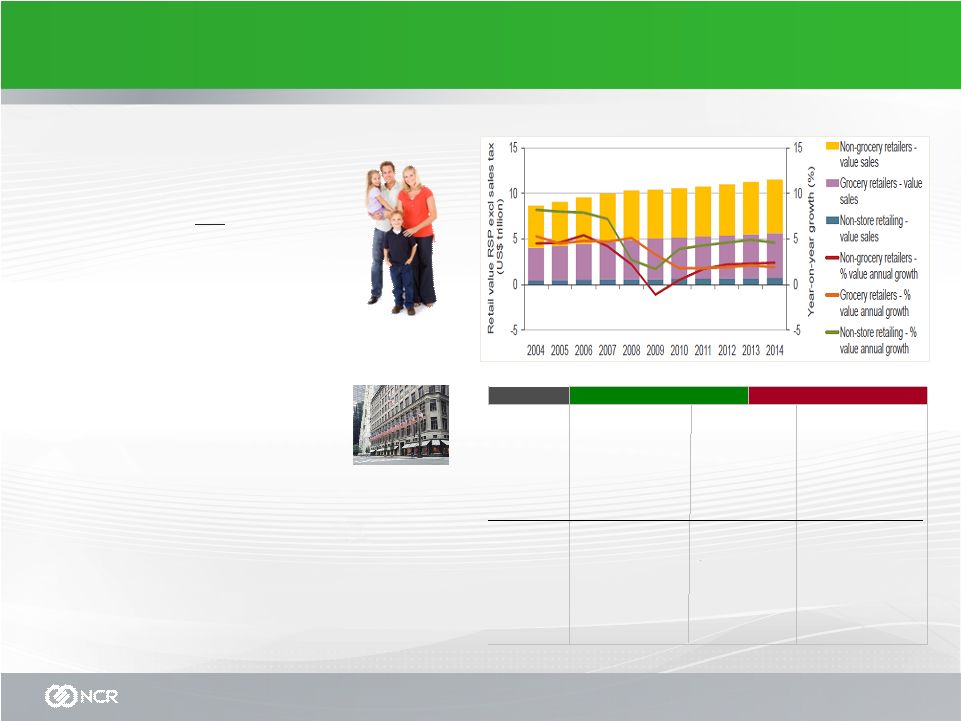 NCR Confidential 52 Business Climate Consumers – Global confidence increasing – Buying to need and trading down – Social media and mobile enabled – Cross channel customers are significantly more profitable Retailers – Mass merchants have rebounded faster than food retailers – Asia, Eastern Europe lead spend focus for global retailers – Smaller store formats planned for urban, rural – Merged channel focused – Regulatory changes impact consumer credit, hiring/healthcare and internet sales Winners Laggards Segments* Selective segments rebound as consumers address pent up demands. Favorable 2009 comparisons also in play. China +16.6% Brazil +4.1% India +4.0% Australia +2.2% Japan -1.1% Italy -1.8% UK -3.2% Spain -4.8% Mexico -6.1% Russia -7.9% France +.6% Canada +.2% Germany 0% USA -.6% Non-store retail +12.1% Consumer Electronics +7.3% Apparel +5.7% Department Stores +.5% Supermarkets +1.3% Leisure +1.5% Furniture +1.7% * Kantar Retail US June 2010 Industry Sales Growth: % change year-to-year seasonally adjusted ** Kantar Retail: Inflation-adjusted consumer spending growth in 2009 Foodservice +2.8% Building Materials & Hardware +2.7% Health & Personal Care +2.4% Geographies** Excepting China, emerging markets growth slows, with Russia as exception. Mature retail markets were challenged. Winners Laggards Segments* Selective segments rebound as consumers address pent up demands. Favorable 2009 comparisons also in play. China +16.6% Brazil +4.1% India +4.0% Australia +2.2% Japan -1.1% Italy -1.8% UK -3.2% Spain -4.8% Mexico -6.1% Russia -7.9% France +.6% Canada +.2% Germany 0% USA -.6% Non-store retail +12.1% Consumer Electronics +7.3% Apparel +5.7% Department Stores +.5% Supermarkets +1.3% Leisure +1.5% Furniture +1.7% * Kantar Retail US June 2010 Industry Sales Growth: % change year-to-year seasonally adjusted ** Kantar Retail: Inflation-adjusted consumer spending growth in 2009 Foodservice +2.8% Building Materials & Hardware +2.7% Health & Personal Care +2.4% Geographies** Excepting China, emerging markets growth slows, with Russia as exception. Mature retail markets were challenged. |
                   NCR Confidential 53 Market Indicators: Developed and Emerging North America Population: 344 M 5% 0f World GDP: $15.4 T 27% of World Consumer Spending: $ 2.8 T 26% of World Brazil Population: 201 M 3% 0f World GDP: $2.0 T 4% of World Consumer Spending: $244 B 2% of World South Africa Population: 49 M 1% 0f World GDP: $505 B 1% of World Consumer Spending: $62 B 1% of World Europe Population: 725 M 11% 0f World GDP: $19.3 T 34% of World Consumer Spending: $3.6 T 33% of World Russia Population: 139 M 2% 0f World GDP: $2.1 T 4% of World Consumer Spending: $292 B 3% of World Australia Population: 21 M 0.3% 0f World GDP: $851 B 1% of World Consumer Spending: $185 B 2% of World Japan Population: 128 M 2% 0f World GDP: $4.2 T 7% of World Consumer Spending: $1.0 T 9 % of World China Population: 1.3 B 19% 0f World GDP: $8.7 T 15% of World Consumer Spending: $1.1 T 9% of World India Population: 1.2 B 17% 0f World GDP: $3.6 T 6% of World Consumer Spending: $228 B 2% World Source: CIA Factbook, Euromonitor International, Gartner Research |
            NCR Confidential 54 Y2K 7-year typical life Market Analysis 1998 1999 2000 2001 2002 2003 2004 2005 2006 2007 2008 2009 2010 2011 Total Retail Store Automation Market $21.5B • Highly fragmented • Growing concentration in Tier I/II • Multiple channels of distribution NCR Share 8.0% POS Shipments Economic Delay Replacement Cycle |
         NCR Confidential 55 Self Checkout Penetration NAMER ~ 2.8% NAMER ~ 2.8% Japan ~ .4% Japan ~ .4% Australia ~ 1.5% Australia ~ 1.5% Europe ~ 1.0% Europe ~ 1.0% Total Market View of Self Checkout as a % of installed base of POS based on market and internal NCR data. |
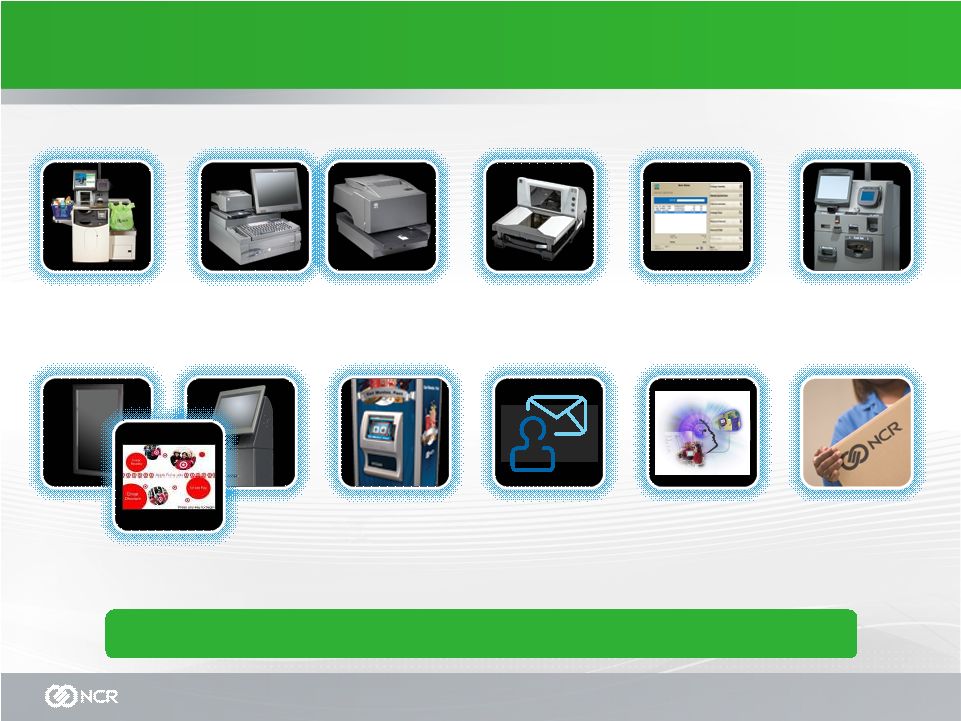 NCR Confidential 56 Celebrating 126 years of retail experience and innovation! POS and Loyalty Software POS Terminals and Peripherals POS Scanners Self checkout ATMs and Service Centers Entertainment Solutions Retail Services Kiosk and Digital Signage Solutions Human Factors Engineering eMarketing Enabling the c-tailing journey |
 NCR Confidential 57 Retail & Hospitality Strategy Quality Cost Reduction and Value Engineering Under-Penetrated Geographies and Segments Adjacent Solutions Improve Software and Services Mix PLM Gross Margin Expansion Develop Leaders Engaged Employees Continuous Improvement Customer Success Action Planning Improving the Customer Experience Hardware Software Self-Service Services Revenue Growth |
 Customer Services Strategy NCR Analyst Day November 16, 2010 New York Stock Exchange Chris Askew SVP Services At your service every day and around the world |
 NCR Services well placed to capitalize on Growth Focused on Revenue growth through Managed Services, Multi-Vendor & Total Premise * source: Gartner market data, RBR, IDC,NCR Market Research • Differentiating via customer experience • Increase availability, Reduce Failed Interactions • Funding alternative / converging channels Customer Trends / Challenges... • Multi-factor: Industry, Channel, Vendor • Global reach: 13,000 NCR certified professionals • Global consistency – Tools, Processes • Innovative end-to-end portfolio The NCR Advantage... With Innovation validated.... Top 10 Support Provider Top 20 Global Outsourcer Excalibur Award for Predictive Services–TAG HDFC Tech Implementation Award–Asian Banker NCR Confidential 59 |
   NCR Confidential 60 NCR Services Strategy # 1 in Customer Delight & Service Quality Expand Adjacencies Core Attach Managed Services Grow revenue Adjacencies Core Telecom l Total Premise l MS l MV l Support l Attach Gross Margin Expansion Defect Reduction Predictive, Remote Resolve High to Low Cost Customer Experience CE2 Customer Delivery ‘Pulse Check’ Survey Best of Breed Program Employee Engagement Financial • Retail • Telecom • Travel & Gaming • Healthcare • Entertainment MS, MV Total Premise Telecom EMERGING MARKETS Growth in Revenue, Gross Margin, Customer Delight & our People |
 NCR Confidential 61 Delivering higher value services...more efficiently Transitioning from break-fix provider to strategic business partner Gartner, Inc. Support Manage Innovate Deploy Gross Margin Expansion Seamless, Successful Consumer Interactions Pre-emptive Strategic Value Proactive Predictive Reactive |
   NCR Confidential 62 Service Innovation...Redefining the Customer Experience Our Reality today…. Failure Occurs Notify Service Provider Remote Diagnose Dispatch Travel to Site Repair Close with Customer Frequency of Occurrence and Resolution Time Current Model Imagine a world where…Predictive drives new levels of availability The New Service Model Gather Detailed Status info Fix it Before it Breaks Without a Visit to the Site Send Right Skills, Part & Procedure Scheduled at a Low Usage Time |
 NCR Confidential 63 The NCR Services Advantage: The Multi-Factor Global Capabilities 13k Badged, Certified Professionals Support • 2M Points-of-Service • 12M Incidents / Year Global Multi-vendor • 200+ OEM brands • Thousands of Products Global Coverage • 13 Managed Service Centers • 90+ Countries Managed Services Service Management Multi-vendor Maintenance Remote Monitoring Incident Management Consumer Help Desk Technical Help Desk Media Replenishment Currency Management SaaS/Hosting eCommerce Solutions Services Innovation No other competitor offers the portfolio, services intelligence, and innovation to provide a seamless consumer experience across all channels Interactive Insight SM • Improve product quality • Drive service delivery • Optimize estates Real-time data monitoring Dynamic transaction analytics Predictive Services Global Processes and Tools Enable Consistency |
 NCR Confidential 64 Summary Profitable growth engine for NCR Leverage solid foundation to scale into Emerging Markets Eliminate defects across services value chain for GM expansion Transform consumer experience with Predictive Service Innovation |
 At your service every day and around the world Entertainment Analyst Day November 16, 2010 New York Stock Exchange |
 NCR Confidential 66 Entertainment Market Trends US rental market shifting in favor of Self Service • Rapid Transition from Bricks and Mortar to Kiosk • Continued shift to Mail and Digital Kiosk market continues to grow rapidly • Market potential for up to 100K kiosks • $2B-$3B market for Kiosks over next 3-5 years Multiple opportunities exist • US Video Sell Through - $10B • US Video Games - $30B • Global Media Market - $300B Source: Adams Media, AMR, PWC, Internal Analysis 3,310 1,213 2,230 3,541 1,373 2,314 950 2,281 2009 2013E Bricks and Mortar Subscription Digital Kiosk US Rental Market Forecast (in $m) 7,863 9,349 25% 14% 12% (22%) CAGR 4% |
 NCR Confidential 67 How we are executing our business Revenue Growth • Focus remains on US and Canada near term New Offers – Sell Through, By Mail, Digital • Density– Fewer larger partners / fewer markets Improving the Customer Experience • Improved copy depth due to studio agreements • New interaction points – Online, Social, and Mobile • Joint promotion activity with retail partners Operational Excellence • Lean distribution operations • Optimized allocation of movies to align supply and demand |
   NCR Confidential 68 Studio & Content Strategy Update Other Studios Direct Relationship with a Day and Date rental test starting November 30 and a 28-day window on other titles Direct Relationship with a Day and Date rental test in Q1 ‘11 and a 28-day window on other rentals Sourcing day and date content test agreements and ongoing negotiations for long term agreements • Planning a multi-channel day and date test in December with movies not available at other kiosk and subscription channels • Expanding Blu-Ray rollout in Q4 in select markets |
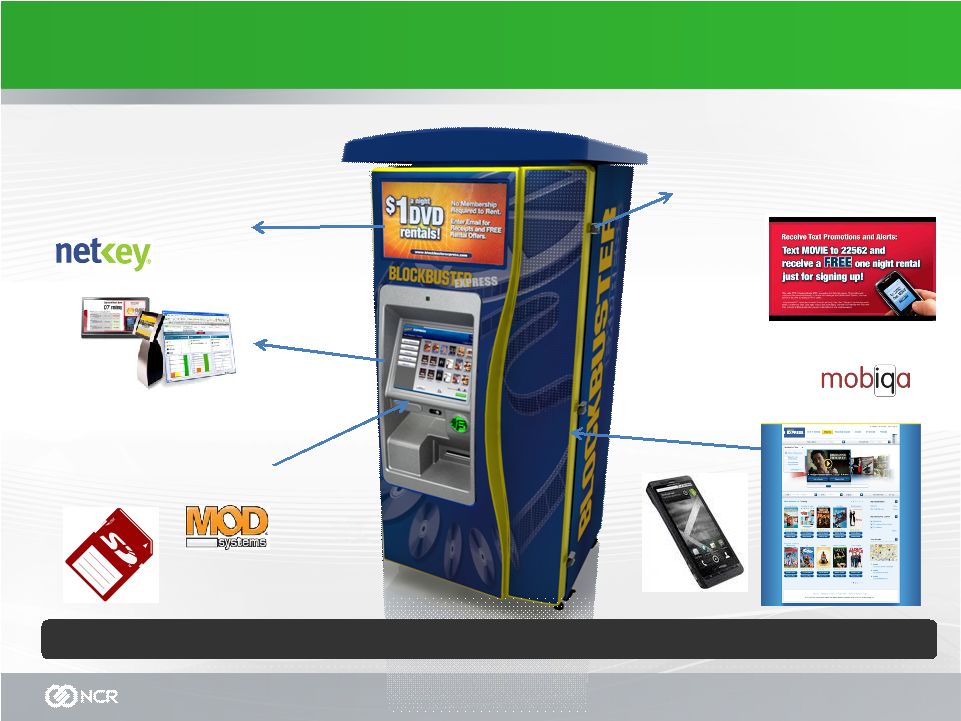   NCR Confidential 69 Enabling the Digital Endpoint Targeted Digital Offers to Consumers at the point of decision Online and Mobile Reservations Digital Delivery via Flash Memory (future) SMS and Email Marketing Campaigns Platform leverages NCR core technologies and supported by NCR managed services |
 NCR Confidential 70 Our Vision for Entertainment – Get What YOU Want Targeted Marketing to Increase Revenue per Customer Automated Retail Kiosk • Rental • Sell Through Pickup selected content at the store, in the kiosks At home • Rent Online • Purchase Online • Direct to Home At Stores • Digital Media Filling Station • Automated Retail On the go "Once I buy, I'm enabled" • Rentals and Purchases • Portable Digital Viewing 2013E US Market for Video Consumption (Purchase and Rental) - $18.7B |
 NCR Confidential 71 The NCR Advantage Market Opportunity • Continue to see large market opportunity in US over next 3-5 years with little risk of digital disruption near term • Ability to lead the transition to self-service in the global market for media consumption Expansion • Up to 10K end points in 2010 with continued build-out in 2011 • License to use Blockbuster brand in the kiosk channel in US and Canada Financials • EBITDA break-even in Q4 2010 with a goal of $25M-$35M positive EBITDA in 2011 • $1B+ revenue opportunity |
 At your service every day and around the world At your service every day and around the world Healthcare Strategy Analyst Day November 16, 2010 New York Stock Exchange Jeff Kao GM Healthcare |
 NCR Confidential 73 US Healthcare Market US Healthcare $65 $101 $138 $234 $496 $718 $0 $200 $400 $600 $800 Hospitals Physicians Drugs Nursing Home Dental Home Care US Healthcare Expenditures: $2.3T Source: National Health Expediture Data, US Department of Health & Human Services $B |
 NCR Confidential 74 The Market is Highly Fragmented with Over 200,000 Physicians Offices •121,643 •(53) •1 •41,188 •(18) •2 •44,186 •(19) •3-5 •14,595 •(6) •6-9 •6,304 •(3) •10-19 •2,271 •(1) •20+ •230,187 •(100) •Total 90% of practices have fewer than 6 physicians and account for 53% of all physicians Source: SK&A, National Physicians Report, 2008 • Number of U.S. physician practices by number of physicians • Percent 0 200 400 600 800 Physicians by practice size (K) 1 Physician 122 2 Physicians 82 3-5 Physicians 177 6-9 Physicians 109 10-19 Physicians 91 20+ Physicians 68 Total Physicians 650 |
    NCR Confidential 75 Healthcare Provider IT Spending, 2008-2014 Health Reform • ~34M uninsured entering system in ’14 • All preventive measures covered • Estimated 200M additional transactions per year • Expansion of Medicaid • Penalties for employers and citizens with no coverage • 1.1B Transactions with Physicians • 2X with retail pharmacy High Transaction 500 1,000 1,500 861 2000 1,015 2005 1,169 2010P Hospital ED Physician offices 1,364 0 1995 Current Environment - 10,000 20,000 30,000 40,000 2009 2010e 2014(e) Software Hardware Infrastructure Networks & Connectivity $29.9B $30.1B $36.6B CAGR '10-14 4% 4% 1% 8% 5% Source: Gartner, Forecast: Enterprise IT Spending by Vertical Industry Market Worldwide, 3Q 2010 |
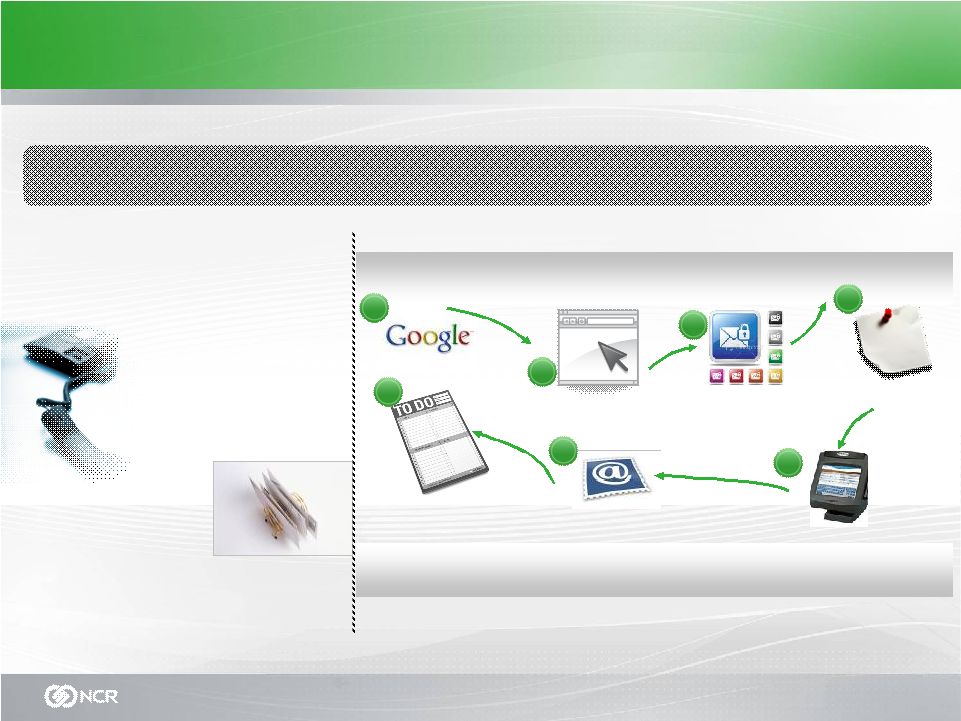   NCR Confidential 76 Physicians: 1.1B Transactions with little or no web/email/internet interactions Hospitals: Largest revenue expenditure … highly variable/complex transaction sets Present State: Phone/Mail • Access • Availability • Confirmation • Eligibility • Follow-up • Statements • Billing • Results • Insurance • Personal Information Access – Find Physician Presence – Web Site Contact Connect Communicate Schedule Remind Collect Via web & kiosk` PDF/email Statements Recurring & Reschedule via web Web Email Schedule 1 6 2 3 4 5 7 Self-Service Needed in Healthcare… Desired State: Internet/Mobile/Kiosk |
 Why Physicians Should be Interested 1 Physician x 35 patients $100 / Visit X 200 Days Per day 35 35 35 35 35 20 24 22 26 21 29 31 Healthcare is Seasonal 35 35 35 35 35 35 35 35 35 35 35 35 Workflow management Drives linearity Incremental Revenue Operational Efficiency Improved productivity ~.5% 5% Break even $75K investment $700K Incr Rev $75K investment 3 Visits / Dr / Month (20 Physician practice) $625K Incr Profit / Office (20 Physician practice) ~ $700K Billings Per Physician / Yr NCR Confidential 77 |
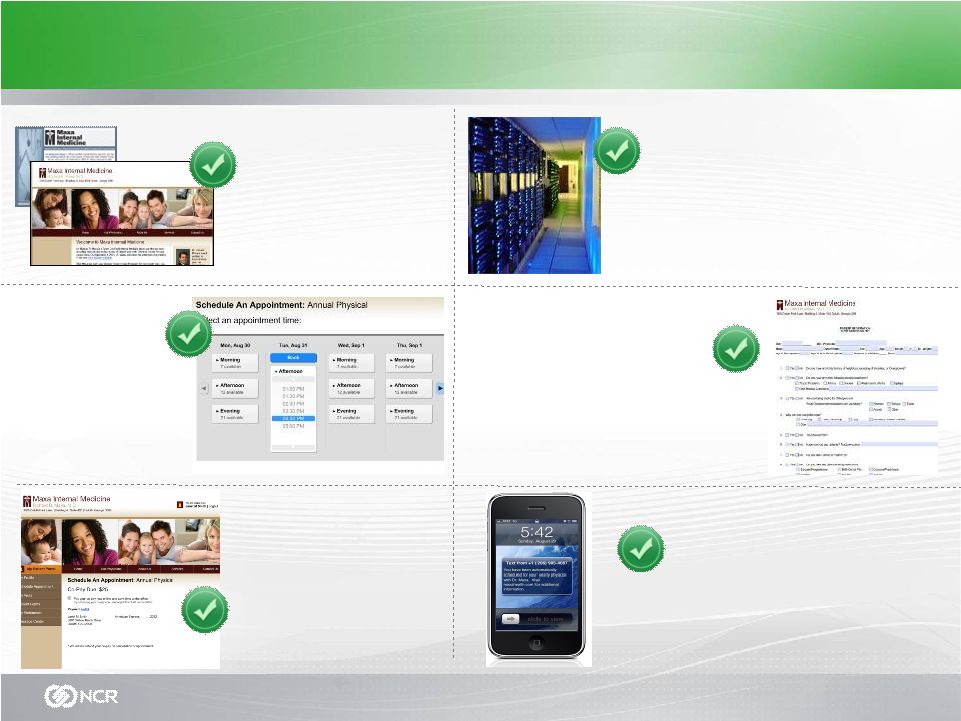 NCR Confidential 78 Design & Maintain Physician Web Sites E-Forms Medical History, Insurance, HIPAA, Medical Necessity Forms On-Line Scheduling & Appointment Request Hosted Data Center w/ 24 X 7 Disaster Recover w/ HIPAA Compliance Why NCR is Well Positioned Reminder, Alerts, & Automatically Schedule Recurring Appointments Before After Payment Collection & Cancellation Payment |
 NCR Confidential 79 Conclusion … Huge marketplace that is in dire need of self service automation solutions Help physicians develop capabilities available in all other markets (web, email, scheduling, payment collections) Enable optimization of patient and office/physician demographics and scheduling Physician markets … traditional challenged by cap ex and require a software as a service (SaaS) model NCR focused on a develop/test/grow strategy |
 John Bruno Executive Vice President At your service every day and around the world At your service every day and around the world Travel and Gaming Strategy Analyst Day November 16, 2010 New York Stock Exchange |
   NCR Confidential 81 Passenger use of Check-in 61% 14% 31% 13% 21% 2% 11% 10% 5% 32% 0% 20% 40% 60% 80% 100% Currently By 2012 Agent Internet Kiosk Mobile Phone Other • Revenues from corporate travel in 2010\11 expected to meet pre-recession (2008) levels • 2010\11 is a recovery year for airlines • Airline and car rental consolidations represent an opportunity • Airlines continue to increase their reliance on ancillary revenues (seats, meals, luggage) • Airports are becoming the primary deployer of common use kiosks • Hotel occupancy\rates seeing some recovery Business Climate Source: Airline Business 2009 Information Technology Survey Travel Suppliers Gaming Operators Las Vegas gaming still lagging (destination); Macau/Native American casinos still strong >50% More than 50% of passengers worldwide want more self-service options According to the 2009 IATA CATS (Corporate Air Travel Survey) |
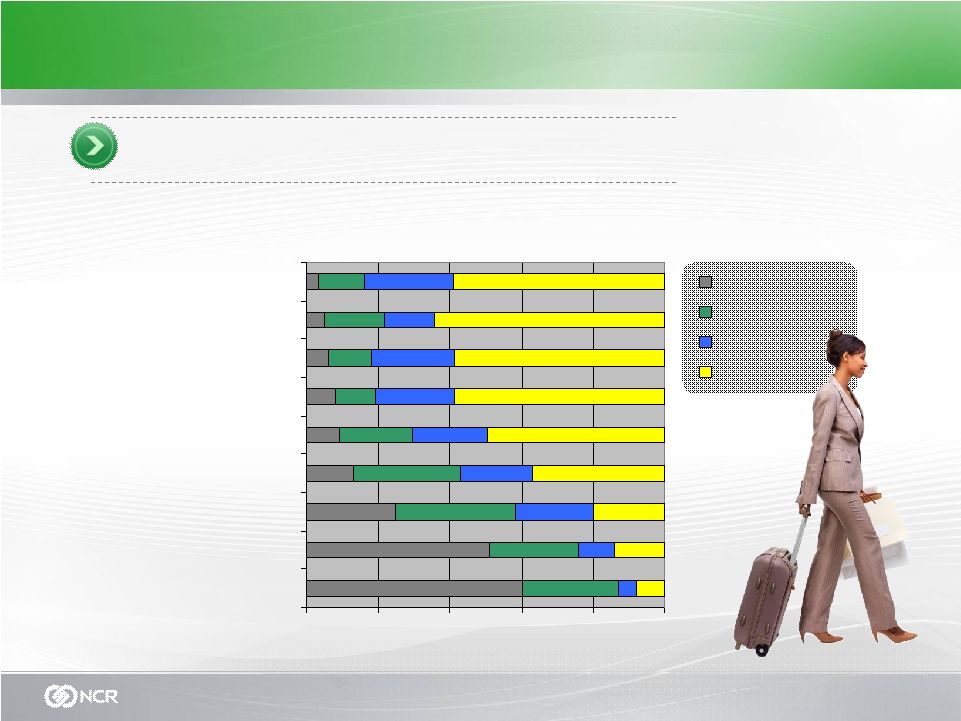   NCR Confidential 82 Airline Top Kiosk Priorities for Investment Source: Airline Business 2009 Information Technology Survey 90% of airlines rate “passenger processing and services” as the highest priority Implementation of Self-Service Functionality 60% 51% 25% 13% 9% 8% 6% 5% 3% 27% 25% 34% 30% 20% 11% 12% 17% 13% 5% 10% 22% 20% 21% 22% 23% 14% 25% 8% 14% 20% 37% 49% 58% 58% 65% 59% 0% 20% 40% 60% 80% 100% Web Check in Kiosk Check in Online check-in via mobile phone Print bag tag at kiosk Flight transfer kiosk Automated boarding gate Kiosk for disruption management Unassisted bag drop locations Kiosk to report lost baggage Already done By 2010 By 2012 No Plans |
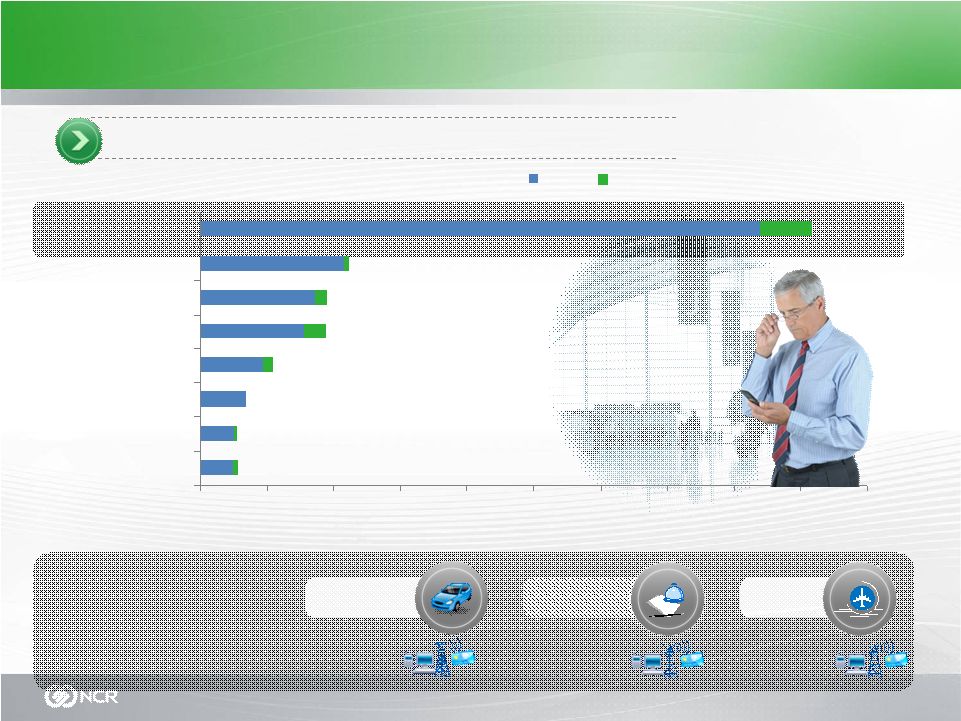     NCR Confidential 83 Hotel $16B Air Industry Top Priorities for Investment 2010 Gartner Air Industry IT Spend Forecast 500 508 695 943 1,574 1,727 2,157 8,402 1 152 313 192 89 782 57 81 - 1,000 2,000 3,000 4,000 5,000 6,000 7,000 8,000 9,000 10,000 Software Support Consulting HW Maint. & Support Process Management Software Dev. & Integration Hardware Managed Services (Millions) 2010 2013 '10-'13 CAGR: 3.3% 3.6% 5.2% 0.1% 5.1% 6.2% 3.6% 1.4% 3.0% Rental Air Today’s separate and disparate systems |
   NCR Confidential 84 Stateless Environment: Software–driven Business Model Tomorrow’s integrated service provider model PS PS Managed Services Software Enables personalized self-service Kiosk Internet Mobile Assisted |
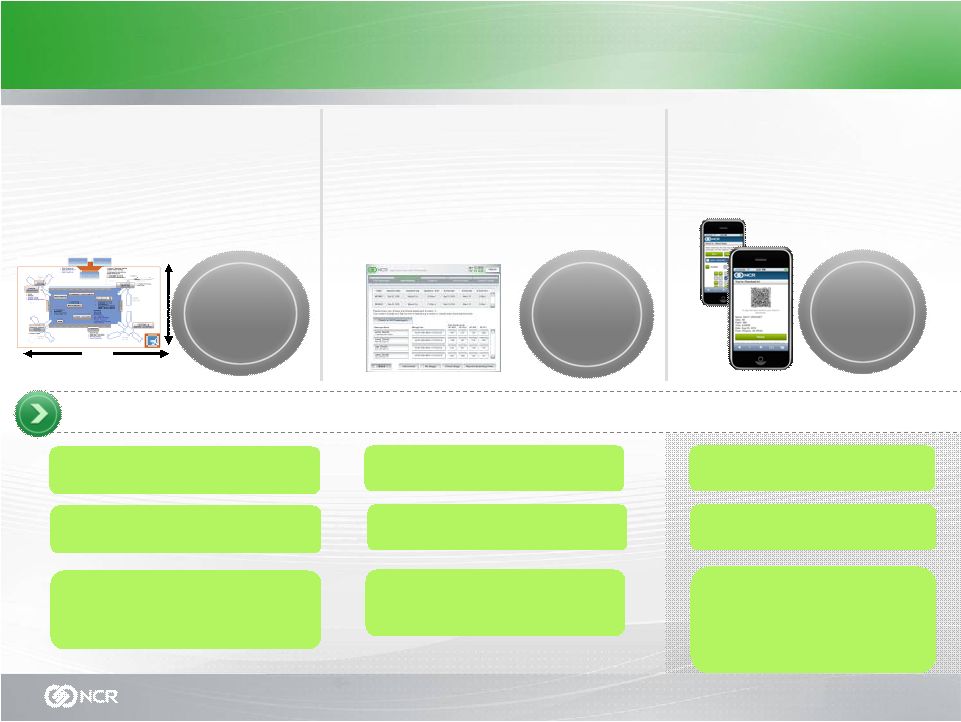    NCR Confidential 85 Travel Leverages Total NCR Capabilities Managed Services • Hosting, field services, help desk, passenger workflow operations, security, improving the customer experience • Total premise service Expansion of Core\Adj. Solutions • Domestic refresh • International expansion • Hosted software options • Subscription commercial models Game-Changing Converged Channel Travel Management Platform Ability to offer total premise OEM support Global coverage of CEs Currently service kiosks, ATMs and POS in airports and hotels Triple Play – web, mobile and kiosk applications Leverage overall industry knowledge & solutions portfolio Independent technology partner with a focus on self-service – Trusted Partner Connectivity to back end supplier host systems Ability to provide web, kiosk and now mobile solutions Nobody in the travel supply chain looks at the entire trip – during the time of journey $1.2 B (est.) $600 M (Kiosk check-in only) Market Creation What makes NCR unique? |
 Operations Strategy Analyst Day November 16, 2010 New York Stock Exchange Peter Dorsman SVP, Operations At your service every day and around the world |
                   NCR Confidential 87 Organization Model Continuous Improvement/Quality Continuous Improvement/Quality Talent Management Talent Management Customer Customer Sales and Operations Planning Sales and Operations Planning Sourcing Sourcing Manufacturing Operations Manufacturing Operations Customer Fulfillment Customer Fulfillment Service Parts and Logistics Service Parts and Logistics Customer Customer |
 NCR Confidential 88 Cost Operational Excellence |
         NCR Confidential 89 Sales & Operations Planning Journey Anticipate Anticipate Orchestrate Orchestrate Reaction Reaction Balance Balance 2009 2010 2011 Process improvements Demantra and SalesForce.com Implementation Customer collaboration and joint business planning Data Infrastructure (EDW) Analytics & Metrics Dashboards Kinaxis Supply Chain Analytics/ Simulations |
 NCR Confidential 90 • PLM / New Product Introduction • Global / Local Suppliers Sourcing • Supplier Performance (Assessments and PPM reductions) • Value Engineering • Supplier Managed Inventory (SMI) |
 NCR Confidential 91 Global Manufacturing Network Contract Manufacturing Site NCR Manufacturing Site Manaus Manaus Columbus Columbus Budapest Budapest Beijing Beijing Puducherry Puducherry |
 NCR Confidential 92 Plant Utilization “Journey” 2009 2010 2011 • New Manufacturing facilities • LEAN • In-Sourcing • Product Regionalization • In-Sourcing • Vertical Integration • Service Parts Field Consolidation • LEAN • In-Sourcing • Field Integration Activities |
 NCR Confidential 93 Field Integration Enabling Increased Utilization Plant Shipment ATM Software Applications Customer-Specific Branding Customer-Specific Security Rigging & Installation Kits Services or 3 rd Party Provider Local Staging Deliver complete customer solution to increase customer satisfaction, improve Gross Margin, reduce customer delivery lead time, improve quality, reduce field finished goods Third-Party Products Other Security Color Customization Locks Alarms Cameras Other Branding Complete Customer Solution |
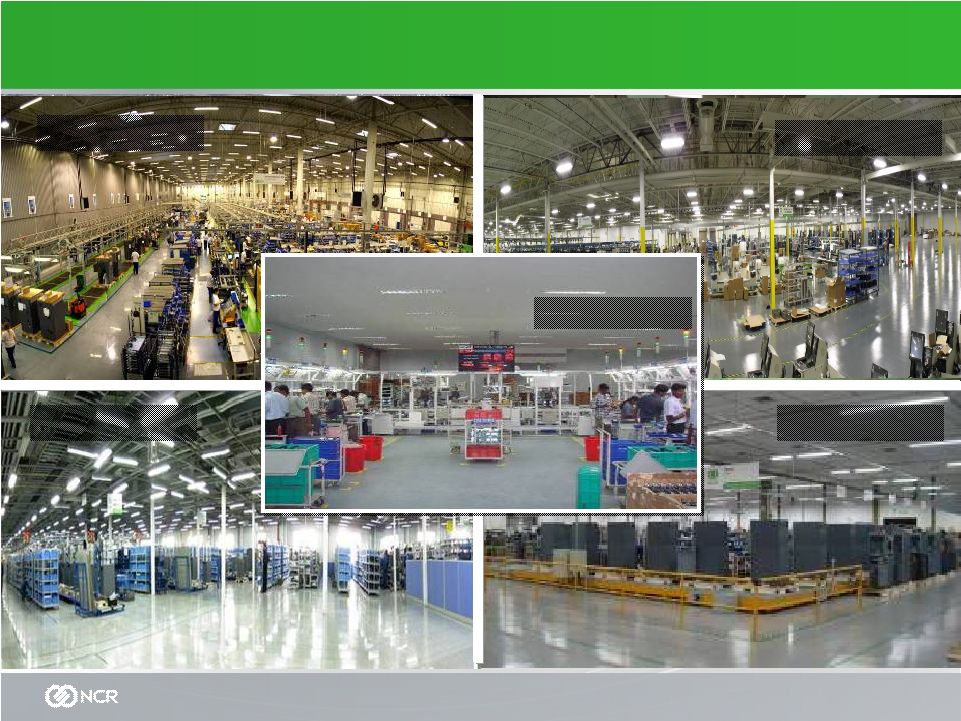     NCR Confidential 94 Beijing NCR Manufacturing Facilities Budapest Columbus Manaus Puducherry |
 NCR Confidential 95 Assemble to Order (ATO) Model Order “Hockey Stick” Sell Everything Custom Components Integrated Designs High PID/Feature Count Order Linearity Reduced Finished Goods Inventory Raw & Finished Goods Inventory Supplier Managed Inventory NCR Managed Inventory Inventory concentrated on core products/features Inventory spread across many products / features Shape Demand Common components across product platforms Limited component commonality across product platforms Standard Components Modular Designs Core set of Products and Features Product Sales Planning Current State Future State ATO Vision Ship an Assembled-to-Order (ATO) Core Product at industry best lead-times Local Sourcing Global Sourcing |
 NCR Confidential 96 Service Parts and Logistics Operations NCR Plants NCR Global Distribution & Logistics Centers Parts OEMs NCR Suppliers Personal Part Kit Forward Stocking Locations Field Stocking Locations NCR Customer Engineer Defective Parts Repair Centers Parts Parts Parts |
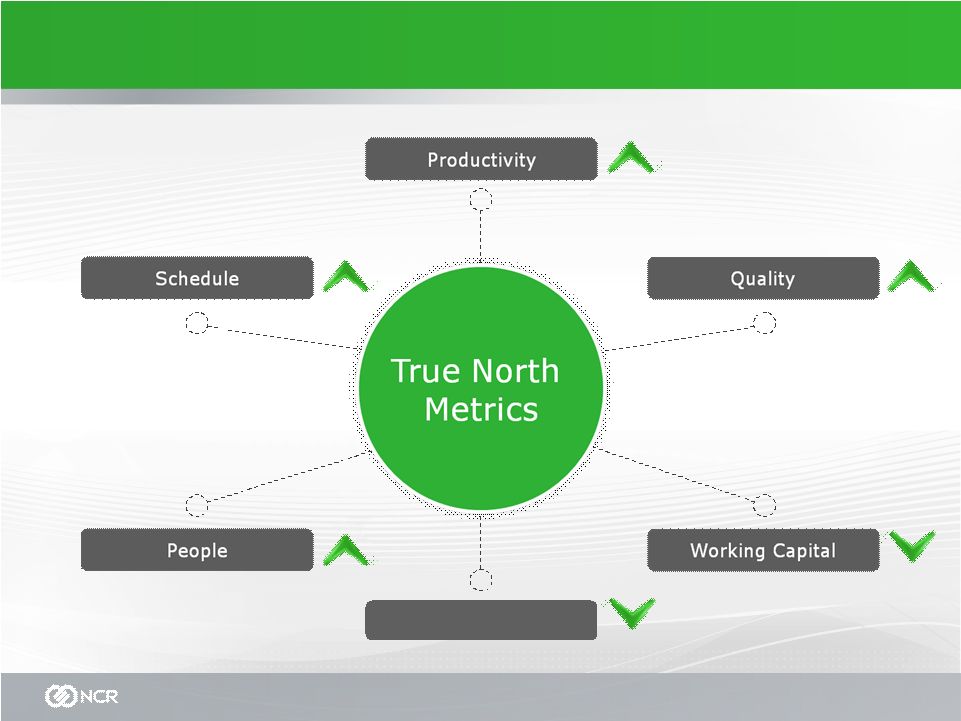
 Global Operations Development Program NCR Leadership Development Program Global Operations True North Metrics Schedule Cost and Working Capital People and Productivity Quality Georgia University System Partnership Peer Best Practice Sharing Industry Partnerships Experiential Learning/Stretch Assignments Supply Chain Competencies NCR Confidential 97 |
     Financial Strategy Analyst Day November 16, 2010 New York Stock Exchange Bob Fishman Chief Financial Officer |
      NCR Confidential 99 Creating Shareholder Value – Current State Profitable Revenue Growth Build a Sustainable & Leading Cost Structure Free Cash Flow Generation |
     NCR Confidential 100 NCR Revenue Trends ($’s in Millions) Return to Growth in 2010 Return to Growth in 2010 $4,970 2007 $5,315 2008 $4,612 2009 2%-5% Growth 2010 (e) Geographic Diversity (2010 Q3 YTD) Geographic Diversity (2010 Q3 YTD) 44% (USA 33%) Americas 36% EMEA 20% APJ 26% Emerging Markets Revenue 74% Developed Areas Revenue |
   NCR Confidential 101 Revenue and Gross Margin by Geography ($’s in Millions) Revenue growth led by EMEA. Gross margin improvement led by the Americas. Revenue growth led by EMEA. Gross margin improvement led by the Americas. Revenue 2008 2009 2010 Q3 YTD Americas $2,269 $2,022 $1,514 EMEA $2,066 $1,649 $1,213 APJ $980 $941 $686 Total $5,315 $4,612 $3,413 GM% (1) 2008 2009 2010 Q3 YTD Americas 19.3% 19.1% 21.9% EMEA 26.9% 24.3% 23.2% APJ 24.2% 22.0% 21.9% Total 23.1% 21.6% 22.4% (1) See reconciliation of GAAP to non-GAAP measures in the non-GAAP supplementary materials and/or on the investor relations page of NCR’s website. |
   NCR Confidential 102 Strong revenue growth in Products. Continued margin expansion in Services. GM in Products will continue to improve with higher volume and cost reductions. Strong revenue growth in Products. Continued margin expansion in Services. GM in Products will continue to improve with higher volume and cost reductions. Revenue 2008 2009 2010 Q3 YTD Products $2,861 $2,234 $1,655 Services $2,454 $2,378 $1,758 Total $5,315 $4,612 $3,413 Revenue and Gross Margin by Product and Service ($’s in Millions) GM% 2008 2009 2010 Q3 YTD Products 26.6% 20.3% 20.7% Services 19.2% 22.8% 23.9% Total 23.1% 21.6% 22.4% (1) See reconciliation of GAAP to non-GAAP measures in the non-GAAP supplementary materials and/or on the investor relations page of NCR’s website. (1) |
   NCR Confidential 103 NPOI: Return to Growth NPOI: Non-Pension Operating Income (1) NPOI: Non-Pension Operating Income (1) $349 $400 $284 $325 - $335 +26% +15% -29% +14% to 18% ($’s in Millions) $0 $400 2007 2008 2009 2010(e) (1) See reconciliation of GAAP to non-GAAP measures in the non-GAAP supplementary materials and/or on the investor relations page of NCR’s website. |
   NCR Confidential 104 Return to Non-Pension EPS Growth $1.64 $1.96 $1.27 $1.42 - $1.50 2007 2008 2009 2010(e) EPS: Excluding Pension and Special Items EPS: Excluding Pension and Special Items (1) See reconciliation of GAAP to non-GAAP measures in the non-GAAP supplementary materials and/or on the investor relations page of NCR’s website. YTD $13.31 Average Stock Price: $25.25 $22.14 $11.30 (1) |
      NCR Confidential 105 Creating Shareholder Value – Going Forward Profitable Revenue Growth Build a Sustainable & Leading Cost Structure Free Cash Flow Generation |
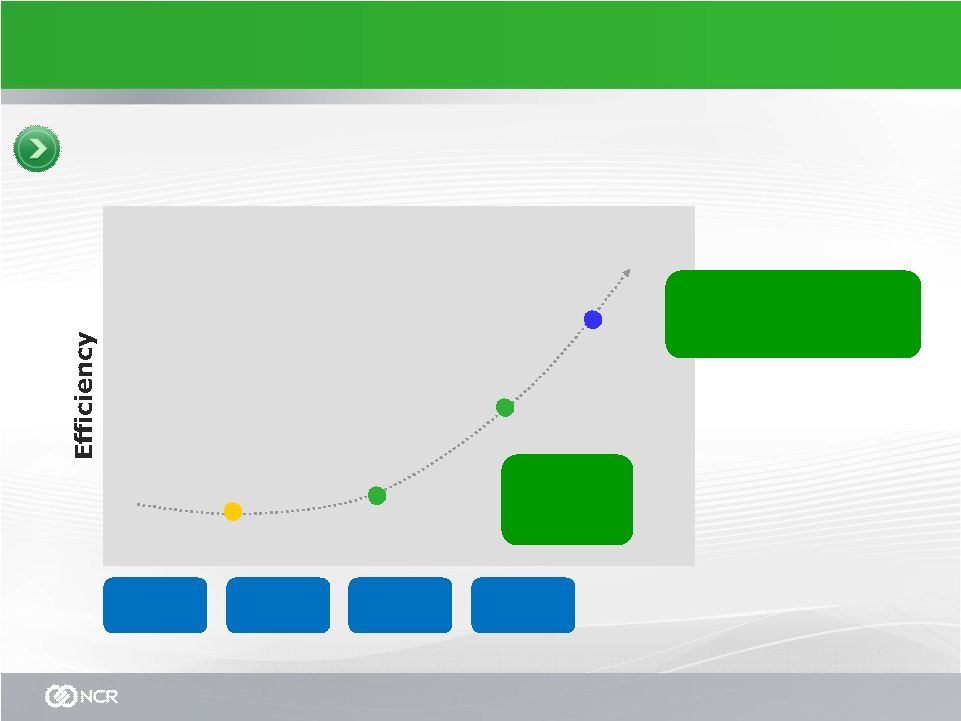
                   NCR Confidential 106 Evidence For a New Way of Thinking Core Solutions Emerging Industry Growth Entertainment ~$400 – $600M ~$400M ~$200 2010 Revenue 2013 Revenue ~6-8% CAGR |
     NCR Confidential 107 Managing for Margin Reducing our Cost Structure Reducing our Cost Structure $200 million to $300 million savings for the period 2011-2013 (50% reinvested) $200 million to $300 million savings for the period 2011-2013 (50% reinvested) Key Initiatives • Cost reduction and value engineering • Product lifecycle management • Design for serviceability, manufacturability, cost • Continuous Improvement – Cost of Quality • Improving labor productivity |
 NCR Confidential 108 Revenue & NPOI Growth Revenue NPOI $4,612 2%-5% $284 14%-18% $325-$335 ~15-20% CAGR ~6-8% CAGR ($’s in Millions) 2009 2010(e) 2013(e) 2009 2010(e) 2013(e) ~6.9% of Revenue 6.2% of Revenue ~9-10% of Revenue (1) (1) See reconciliation of GAAP to non-GAAP measures in the non-GAAP supplementary materials and/or on the investor relations page of NCR’s website. |
   NCR Confidential 109 Continued EPS Expansion $1.64 $1.96 $1.27 $2.15-$2.50 $1.42 - $1.50 2007 2008 2009 2010(e) 2013(e) EPS: Excluding Pension and Special Items EPS: Excluding Pension and Special Items (1) ~15-20% CAGR (1) See reconciliation of GAAP to non-GAAP measures in the non-GAAP supplementary materials and/or on the investor relations page of NCR’s website. |
      NCR Confidential 110 Creating Shareholder Value Profitable Revenue Growth Build a Sustainable & Leading Cost Structure Free Cash Flow Generation |
 NCR Confidential 111 Strong Balance Sheet Cash balance $ 360 Debt balance $ 10 Net cash position $ 350 9/30/10 Near-term Objectives Return on Invested Capital Financial Flexibility Working Capital Improvement Share Repurchases Long-term Objectives Substantial Free Cash Flow Generation ($ in Millions) Free Cash Flow of $100M+ in Q4, 2010 |
 NCR Confidential 112 Working Capital Metrics – AR and Inventory ($'s in Millions) 2008 2008 2009 2009 2010 2010 Q1 Q2 Q3 Q4 Q1 Q2 Q3 Q4 Q1 Q2 Q3 Q4(e) Key Working Capital Metrics Accounts Receivable $1,048 $991 $943 $913 $855 $856 $844 $896 $884 $879 $957 $911 DSO (External) 80 67 62 58 76 69 67 60 77 67 71 Inventory Balance $752 $735 $711 $692 $697 $691 $708 $686 $720 $729 $815 $760 Inventory Turns (Rolling 4 Qtr Average) 5.4 5.6 5.8 5.7 5.7 5.6 5.3 5.4 5.3 5.3 5.2 |
 NCR Confidential 113 NCR Pension Strategy NCR’s legacy pension assets and liabilities are large relative to current market capitalization. Reduce risk and volatility by re-allocating our domestic pension portfolio to fixed-income securities by year-end 2012. Target 60% fixed income by YE 2010, 80% by YE 2011 and 100% by YE 2012. Work with trustee boards of international pension plans to make similar changes where possible. Fund the pension plan according to regulatory requirements (i.e., do not pre-fund). Recently passed U.S. funding relief legislation provides significant additional flexibility in the next few years. |
 NCR Confidential 114 NCR Pension Update Cash Funding for Pension Plans 2008 2009 2010E 2011E 2012E 2013E US Qualified Plan $0 $0 $0 $0 $75 $110 US Non-qualified Plan 9 9 10 10 10 10 International Plans 74 74 100 115 115 115 Total $83 $83 $110 $125 $200 $235 Pension Metrics & Funded Status Asset Return Discount rate Funded Status 12/31/09 12/31/09 12/31/09 US Plans 28% 5.75% ($822) International Plans 13% 4.9% (226) Global 22% 5.4% ($1,048) ( $’s in Millions) ( $’s in Millions) The ($226m) net funded status of international plans comprised of underfunded plans of ($470m), and overfunded plans of $244m The overfunded plans are a result of local funding methodologies that use more conservative actuarial assumptions than GAAP The estimated funding requirement for the US qualified plan includes the impact of the new funding relief legislation The funding of international plans is expected to decline significantly after 2013 reaching an annual amount of $10-$20 million (excluding the funding of future service cost) by 2015 as some of the underfunded plans reach fully funded status Due to pension plan closures, service cost is expected to decline to a level of about $10m per year All future funding estimates are approximations based on expected asset returns, discount rates and local requirements |
 NCR Confidential 115 Free Cash Flow Generation ( $’s in Millions) 2009 2010(e) 2012 and 2013E $50M Break-even FCF $100-$200M per year Cash flow from core businesses Cash flow from Entertainment Cash flow for Pension Total Free Cash Flow (1) (1) See reconciliation of GAAP to non-GAAP measures in the non-GAAP supplementary materials and/or on the investor relations page of NCR’s website. |
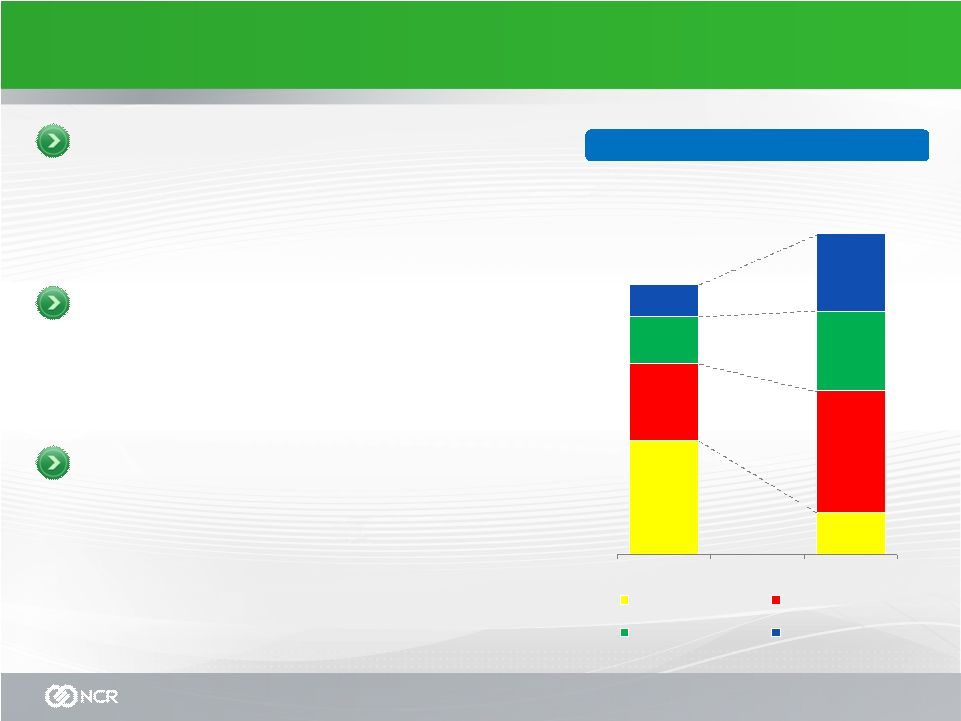
 NCR Confidential 116 NCR Value Equation Strong NPOI, EBITDAP (2) and Operational EPS growing by 12-15% CAGR to 2013 NPOI of $358M-$368M in 2010 EBITDAP of $483M-$493M in 2010 Operational EPS of $1.57 to $1.65 in 2010 FCF of approx. $200M in 2010 Bulk of investing complete by 2010 y/e – $85M investment, $33M NPOI loss and approx. negative $0.15 Operational EPS in 2010 Targeting $25M-$35M of EBITDA in 2011 growing to approx. $100M by 2013 FCF growing from ($90M) in 2010 to $40-50M by 2013 Potential EBITDA multiple of 10X or $250 - $350M valuation benefit Less after tax underfunded position of ~$750M at 12/31/09 Less after tax present value of future service cost (not included in liability above) of ~$90M at 12/31/09 Less after tax present value of post retirement obligation of ~$80M at 12/31/09 Plus net cash of ~$436M at 12/31/09 Core Business * Entertainment Pension + Other B/S Items * Excludes Entertainment and Pension (1) (1) See reconciliation of GAAP to non-GAAP measures in the non-GAAP supplementary materials and/or on the investor relations page of NCR’s website. (2) EBITDAP is calculated as GAAP income (loss) from operations plus pension expense, plus depreciation/amortization and plus/minus special items. |
                      NCR Confidential 117 Reporting Structure Changes for 2011 Current Reporting Structure Americas EMEA APJ 2011 Reporting Structure * Financial Financial Retail & Hospitality Retail & Hospitality Entertainment Entertainment Other Emerging Industries Other Emerging Industries Est. 2010 Revenue ’10 – ’13 CAGR ~$2.6B CAGR ~3-5% ~$2.6B CAGR ~3-5% ~$1.7B CAGR ~3-5% ~$1.7B CAGR ~3-5% ~$0.1B CAGR ~65% ~$0.1B CAGR ~65% ~$0.4B CAGR ~15% ~$0.4B CAGR ~15% 2010 Est. OI% ** ~18% ~18% * Each Industry includes NCR Services ** Estimated OI % of revenue is controllable operating income and excludes pension expense, non-operational items and corporate allocations of approx $425M per year. ~12% ~12% -37% -37% ~25% ~25% |
 NCR Confidential 118 Key Takeaways Very good year in 2010 - return to growth and significant profitability improvement. Solid revenue growth expected over next three years, especially in emerging markets. Cost reduction initiatives provide additional support to NPOI growth outlook. Free Cash Flow generation will improve as Entertainment business turns into a positive contributor and core businesses drive additional cash flow. Execute on pension strategy and continue to manage the balance sheet for flexibility and liquidity, continued focus on working capital. Cash generated to be used for organic growth, M&A opportunities and share repurchases. New line of business reporting will provide additional insight into our businesses. |
      NCR Confidential 119 Questions |
 Supplementary Non-GAAP Materials Analyst Day November 16, 2010 New York Stock Exchange Bob Fishman Chief Financial Officer |
 NCR Confidential 121 Non-GAAP Measures • While NCR reports its results in accordance with generally accepted accounting principles in the United States, or GAAP, in an effort to provide additional useful information regarding NCR’s financial results, certain materials presented during this event will include the non-GAAP information discussed below. This non-GAAP information should not be considered as a substitute for, or superior to, results determined in accordance with GAAP. • Due to the significant change in its pension expense from year to year and the non-operational nature of pension expense, NCR uses non-GAAP measures, such as Non-Pension Operating Income (NPOI), to evaluate year-over-year operating performance. Also, certain special items may be segregated from NCR’s GAAP results from time-to-time to reflect the on-going Earnings Per Share (Operational EPS) performance of the company. NCR also uses these non-GAAP measures to manage and determine the effectiveness of its business management and as a basis for incentive compensation. NCR determines NPOI for a given period based on its GAAP income (loss) from operations excluding pension expense and special items. • Free Cash Flow (FCF) does not have a uniform definition under GAAP and therefore, NCR’s definition may differ from other companies’ definitions of this measure. NCR defines Free Cash Flow as net cash provided by/used in operating activities and cash flow provided by/used in discontinued operations related to the Fox River environmental matter less capital expenditures for property, plant and equipment, and additions to capitalized software. NCR’s management uses Free Cash Flow to assess the financial performance of the company and believes it is useful for investors because it relates the operating cash flow of the company to the capital that is spent to continue and improve business operations. In particular, Free Cash Flow indicates the amount of cash generated after capital expenditures which can be used for among other things, investments in the company’s existing businesses, strategic acquisitions, strengthening the company’s balance sheet, repurchase of company stock and repayment of the company’s debt obligations. Free cash flow does not represent the residual cash flow available for discretionary expenditures since there may be other non- discretionary expenditures that are not deducted from the measure. • NCR utilizes EBITDAP (Earnings before Interest, Taxes, Depreciation, Amortization, Pension Expense and Special Items), for its Core Business (which excludes Entertainment), given the significance of its pension expense. NCR believes EBITDAP provides useful information to investors because it is an indicator of the strength and performance of the company’s ongoing business operations, including its ability to fund discretionary spending such as capital expenditures, strategic acquisitions and other investments. NCR determines EBITDAP for a given period based on its GAAP income (loss) from operations plus pension expense plus depreciation/amortization plus/minus special items. • The reconciliations of non-GAAP measures to comparable GAAP measures and other related information on the following slides are also available on the Investor Relations page of NCR’s website at www.ncr.com. |
 NCR Confidential 122 Income (Loss) from Operations (GAAP) to Non-Pension Operating Income (non-GAAP) 2007 2008 2009 2010E 2010E Core Income from Continuing Operations (GAAP) 219 322 97 92-102 125-135 (33) Pension expense 38 25 159 215 215 - Impairment of assets related to an Equity Investment - - 22 - - - Global headquarters relocation - - 6 18 18 - Organizational realignment charges 76 69 - - - Gain on sale of manufacturing facility in Canada - (16) - - - - TD Spin 16 - - - - - Non-Pension Operating Income (non-GAAP) 349 400 284 325-335 358-368 (33) 2010E Entertainment |
 NCR Confidential 123 Diluted Earnings (Loss) Per Share from Continuing Operations (GAAP) to Diluted Earnings Per Share from Continuing Operations (non-GAAP) 2007 2008 2009 2010E Diluted Earnings Per Share from Continuing Operations (GAAP) 0.99 1.49 0.36 0.65-0.73 0.80-0.88 (0.15) Pension expense (0.22) (0.23) (0.68) (0.94) (0.94) - Impairment of assets related to an Equity Investment - - (0.19) - - - Global Headquarters relocation - - (0.02) (0.07) (0.07) - Japanese subsidiary valuation reserve - - - 0.24 0.24 - Litigation charge - - (0.02) - - - Organizational realignment charges (0.31) (0.32) - - - - Gain on sale of manufacturing facility in Canada - 0.08 - - - - Tax Adjustment (0.05) - - TD Spin (0.07) - - - - - Diluted Earning Per Share from Continuing Operations (non- GAAP) 1.64 1.96 1.27 1.42-1.50 1.57-1.65 (0.15) 2010E Entertainment 2010E Core |
     NCR Confidential 124 Cash Provided by (Used in) Operating Activities (GAAP) to Free Cash Flow (non-GAAP) 2009 2010E 2010E Core* 2010E Entertainment Cash provided by (used in) Operating Activities (GAAP) 252 205 220 (15) Cash provided by (used in) Discontinued Operations (29) 10 10 - Net capital expenditures (173) (215) (140) (75) Free Cash Flow (non-GAAP) 50 - 90 (90) * Includes $110 million of cash funding for pension plans. |
   NCR Confidential 125 Gross Margin as a % of Revenue (GAAP) to Gross Margin as a % of Revenue Excluding Special Items 2008 2009 Q3 YTD 2010 Gross Margin as a % of Revenue (GAAP) 22.3% 19.1% 19.9% Pension expense 0.2% 2.0% 2.5% Organizational realignment 0.6% 0.0% 0.0% Impairment of assets related to Equity Investment 0.0% 0.5% 0.0% Gross Margin as a % of Revenue Excluding Special Items 23.1% 21.6% 22.4% Gross Margin as a % of Revenue (GAAP) to Gross Margin as a % of Revenue Excluding Special Items. Income (Loss) from Operations (GAAP) to Earnings Before Interest, Taxes, Depreciation, Amortization, Pension Expense and Special Items (EBITDAP) (Non-GAAP) Income (Loss) from Operations (GAAP) to Earnings Before Interest, Taxes, Depreciation, Amortization, Pension Expense and Special Items (EBITDAP) (non-GAAP) 2010E Core Business Income from Continuing Operations (GAAP) 125-135 Pension Expense 215 Depreciation & Amortization 125 Global headquarters relocation 18 EBITDAP 483-493 |