Exhibit 99.1
M c D E R M O T T I N T E R N A T I O N A L , I N C .
Boston / Chicago Investor Meetings
May 18-19, 2005
Cautionary Statements / Safe Harbor
Statements in this presentation which express a forecast, expectation or estimate, as well as those which are not historical fact, are forward looking. They involve a number of risks and uncertainties, including audit risks, which may cause actual results to differ materially from such forward-looking statements. These risks and uncertainties include factors detailed in McDermott International’s filings with the U.S. Securities & Exchange Commission, including its Form 10-K for the year ended December 31, 2004 and its Form 10-Q’s which are filed quarterly.
Investor Meetings: Boston & Chicago
May 18-19, 2005
2
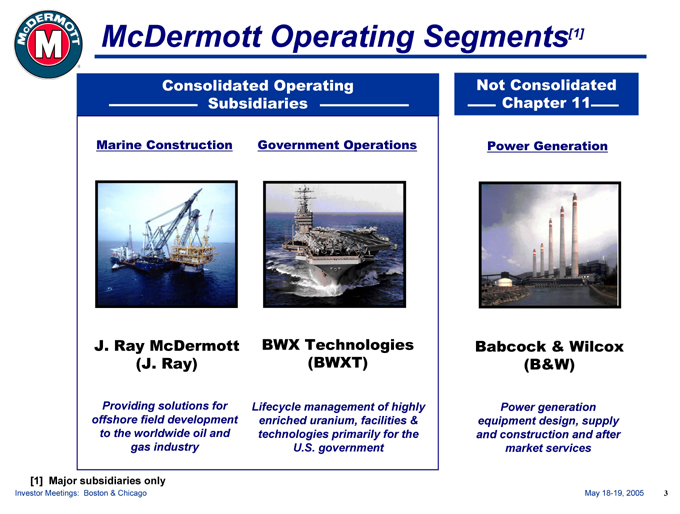
McDermott Operating Segments[1]
Consolidated Operating Subsidiaries
Marine Construction
Government Operations
J. Ray McDermott (J. Ray)
BWX Technologies (BWXT)
Providing solutions for offshore field development to the worldwide oil and gas industry
Lifecycle management of highly enriched uranium, facilities & technologies primarily for the U.S. government
Not Consolidated Chapter 11
Power Generation
Babcock & Wilcox (B&W)
Power generation equipment design, supply and construction and after market services
[1] Major subsidiaries only
Investor Meetings: Boston & Chicago
May 18-19, 2005
3
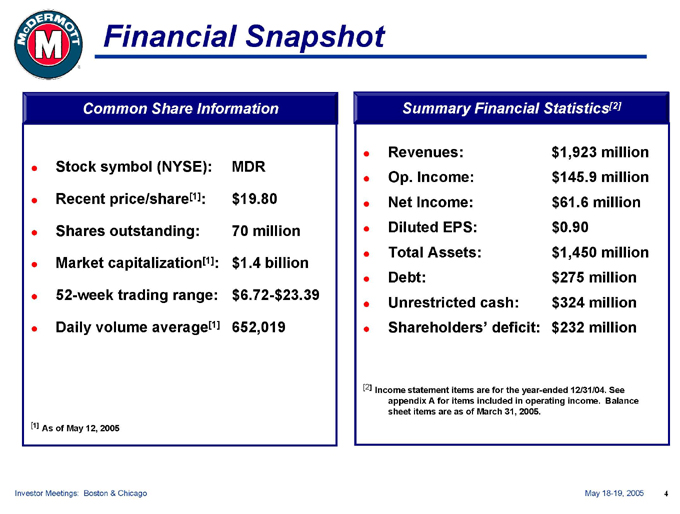
Financial Snapshot
Common Share Information
Stock symbol (NYSE): MDR Recent price/share[1]: $19.80 Shares outstanding: 70 million Market capitalization[1]: $1.4 billion 52-week trading range: $6.72-$23.39 Daily volume average[1] 652,019
[1] As of May 12, 2005
Summary Financial Statistics[2]
Revenues: $1,923 million Op. Income: $145.9 million Net Income: $61.6 million Diluted EPS: $0.90 Total Assets: $1,450 million Debt: $275 million Unrestricted cash: $324 million Shareholders’ deficit: $232 million
[2] Income statement items are for the year-ended 12/31/04. See appendix A for items included in operating income. Balance sheet items are as of March 31, 2005.
Investor Meetings: Boston & Chicago
May 18-19, 2005
4
Investment Highlights
Industry-leading, franchise-name businesses Valued supplier to our customers Improved bidding discipline at J. Ray Solid, predictable backlog at BWXT
B&W Chapter 11 bankruptcy resolution in sight Financial restructuring complete, liquidity improved Experienced, shareholder-focused management team
Investor Meetings: Boston & Chicago May 18-19, 2005 5
McDERMOTT INTERNATIONAL, INC .
J. Ray’s Core Capabilities
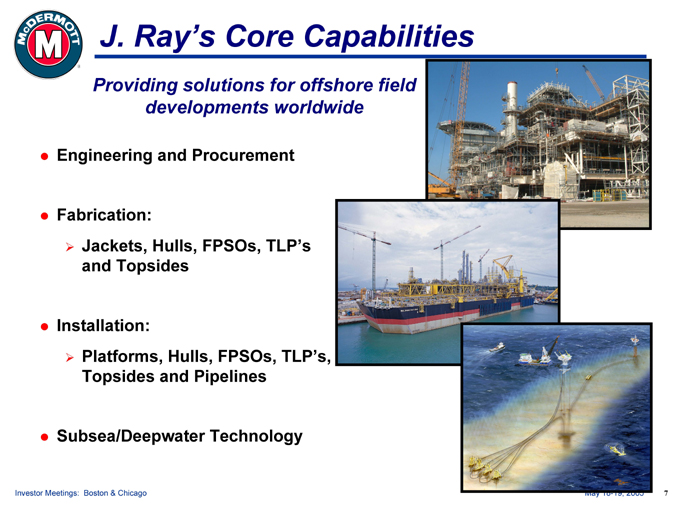
Providing solutions for offshore field developments worldwide
Engineering and Procurement
Fabrication:
Jackets, Hulls, FPSOs, TLP’s and Topsides
Installation:
Platforms, Hulls, FPSOs, TLP’s, Topsides and Pipelines
Subsea/Deepwater Technology
Investor Meetings: Boston & Chicago May 18-19, 2005 7
J. Ray McDermott Snapshot
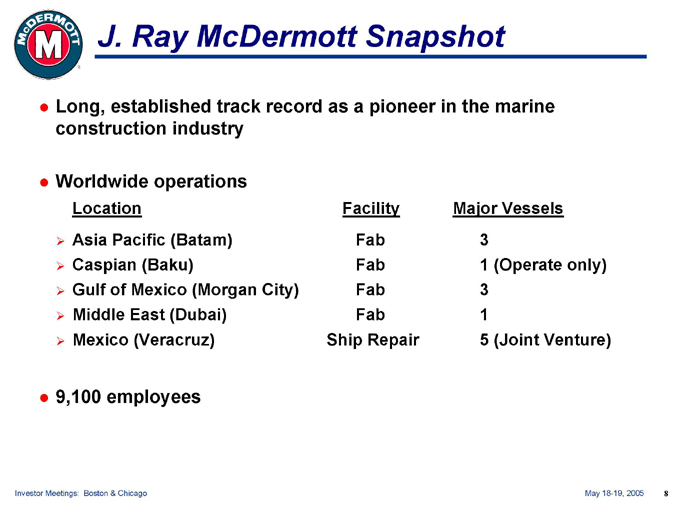
Long, established track record as a pioneer in the marine construction industry
Worldwide operations
Location Facility Major Vessels
Asia Pacific (Batam) Fab 3
Caspian (Baku) Fab 1 (Operate only)
Gulf of Mexico (Morgan City) Fab 3
Middle East (Dubai) Fab 1
Mexico (Veracruz) Ship Repair 5 (Joint Venture)
9,100 employees
Investor Meetings: Boston & Chicago May 18-19, 2005 8
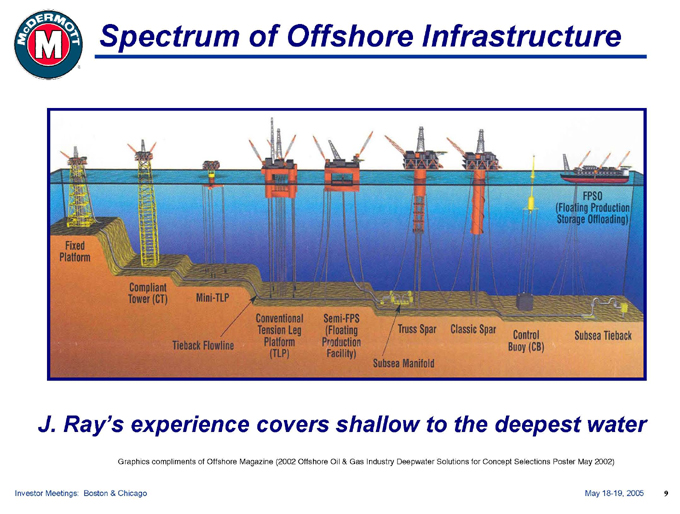
Spectrum of Offshore Infrastructure
J. Ray’s experience covers shallow to the deepest water
Graphics compliments of Offshore Magazine (2002 Offshore Oil & Gas Industry Deepwater Solutions for Concept Selections Poster May 2002)
Investor Meetings: Boston & Chicago May 18-19, 2005 9
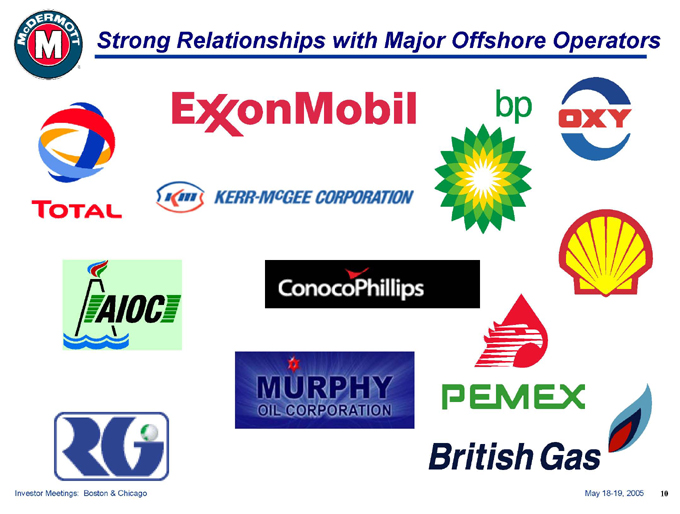
Strong Relationships with Major Offshore Operators
Investor Meetings: Boston & Chicago May 18-19, 2005 10
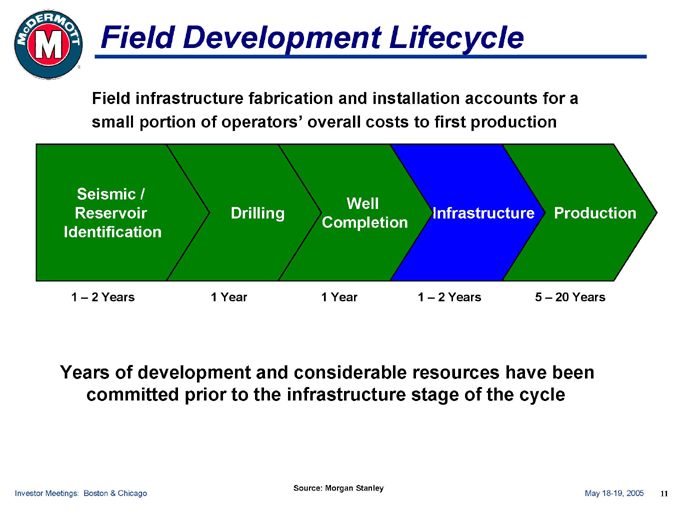
Field Development Lifecycle
Field infrastructure fabrication and installation accounts for a small portion of operators’ overall costs to first production
Seismic / Reservoir Identification
Drilling
Well Completion
Infrastructure
Production
1 – 2 Years 1 Year 1 Year 1 – 2 Years 5 – 20 Years
Years of development and considerable resources have been committed prior to the infrastructure stage of the cycle
Source: Morgan Stanley
Investor Meetings: Boston & Chicago May 18-19, 2005 11
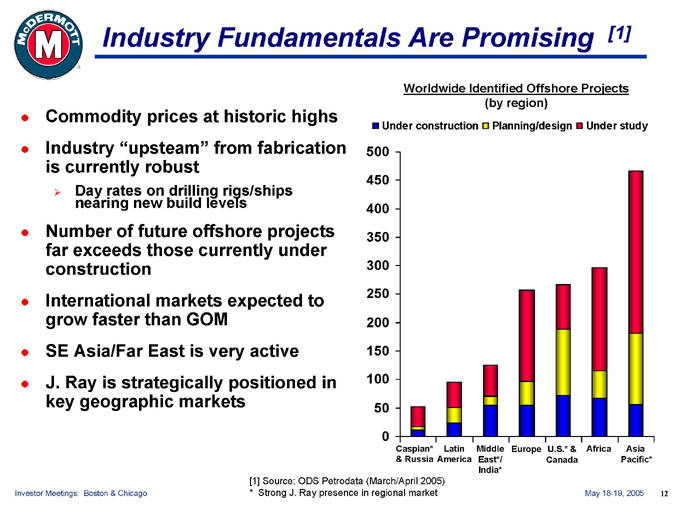
Industry Fundamentals Are Promising [1]
Commodity prices at historic highs Industry “upsteam” from fabrication is currently robust
Day rates on drilling rigs/ships nearing new build levels
Number of future offshore projects far exceeds those currently under construction International markets expected to grow faster than GOM
SE Asia/Far East is very active J. Ray is strategically positioned in key geographic markets
Worldwide Identified Offshore Projects (by region)
Under construction Planning/design Under study
500 450 400 350 300 250 200 150 100 50 0
Caspian* Latin Middle Europe U.S.* & Africa Asia & Russia America East*/ Canada Pacific* India*
[1] Source: ODS Petrodata (March/April 2005)
* Strong J. Ray presence in regional market
Investor Meetings: Boston & Chicago
May 18-19, 2005 12
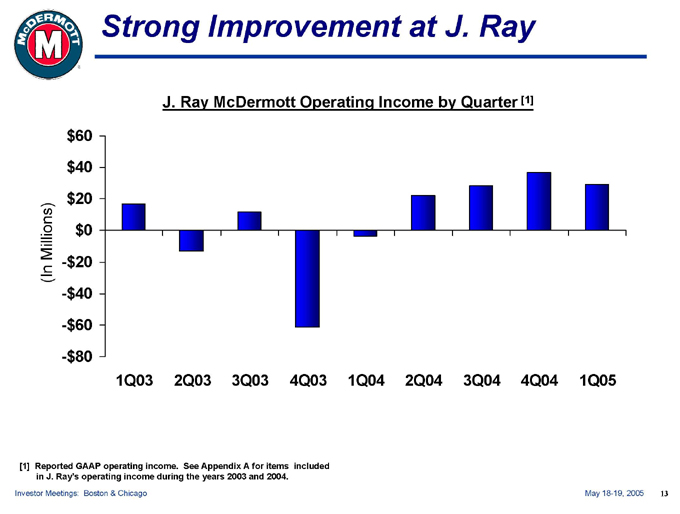
Strong Improvement at J. Ray
J. Ray McDermott Operating Income by Quarter [1] $60 $40 $20
Millions) $0
-$20
(In
-$40
-$60
-$80
1Q03 2Q03 3Q03 4Q03 1Q04 2Q04 3Q04 4Q04 1Q05
[1] Reported GAAP operating income. See Appendix A for items included in J. Ray’s operating income during the years 2003 and 2004.
Investor Meetings: Boston & Chicago May 18-19, 2005 13
J. Ray Turnaround in Progress
Recruited and built new leadership organization
Substantial improvements in business development, bidding, execution, and planning processes
Maintain strong historical relationships with key customers
Expect to successfully execute current backlog; approximately $1.1 billion at 3/31/05
Our challenge is to turn $1.5 billion of bids into profitable orders
Investor Meetings: Boston & Chicago May 18-19, 2005 14
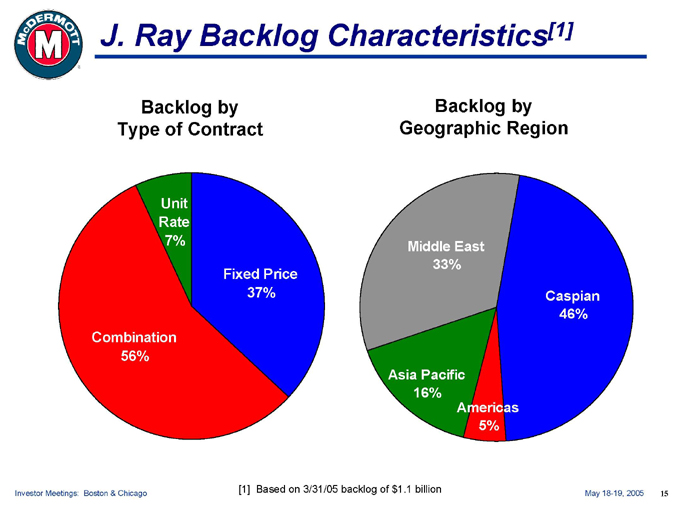
J. Ray Backlog Characteristics[1]
Backlog by Type of Contract
Unit Rate 7%
Combination 56%
Fixed Price 37%
Backlog by Geographic Region
Middle East 33%
Caspian 46%
Asia Pacific 16%
Americas 5%
[1] Based on 3/31/05 backlog of $1.1 billion
Investor Meetings: Boston & Chicago
May 18-19, 2005 15
J. Ray Summary
Well positioned to capture industry growth
Strong franchise in strategic geographical locations
New management team leading change in all areas
$1.1 billion backlog and good growth prospects
Turnaround is underway but not yet complete
Investor Meetings: Boston & Chicago May 18-19, 2005 16
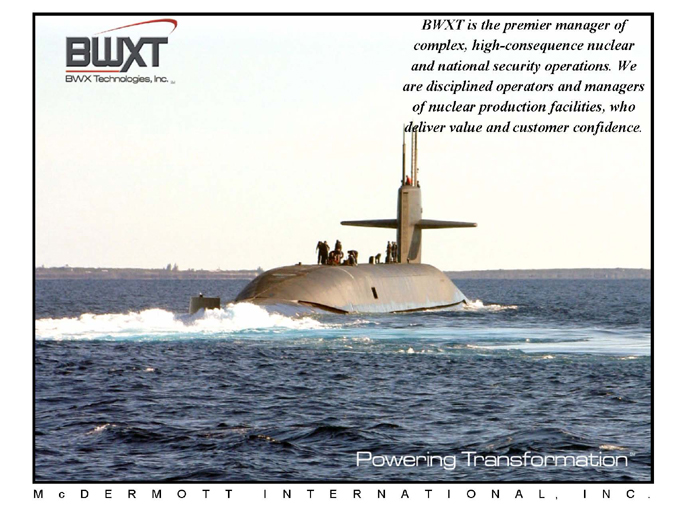
BWXT is the premier manager of complex, high-consequence nuclear and national security operations. We are disciplined operators and managers of nuclear production facilities, who deliver value and customer confidence.
Powering TransformationSM
M c D E R M O T T I N T E R N A T I O N A L , I N C .
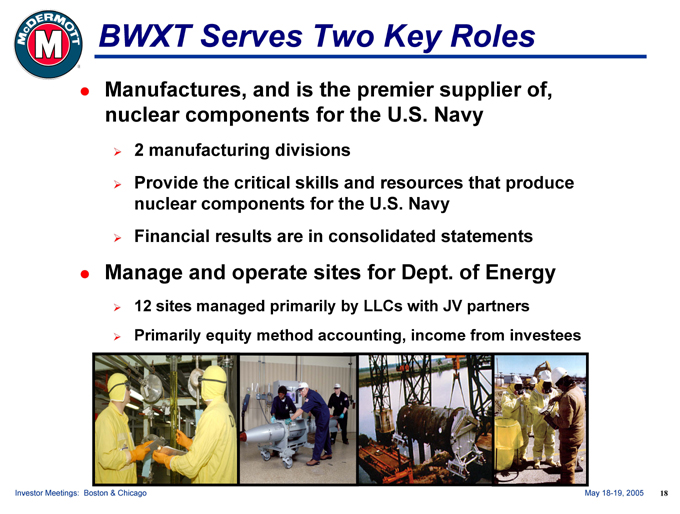
BWXT Serves Two Key Roles
Manufactures, and is the premier supplier of, nuclear components for the U.S. Navy
2 manufacturing divisions
Provide the critical skills and resources that produce nuclear components for the U.S. Navy Financial results are in consolidated statements
Manage and operate sites for Dept. of Energy
12 sites managed primarily by LLCs with JV partners Primarily equity method accounting, income from investees
Investor Meetings: Boston & Chicago May 18-19, 2005 18
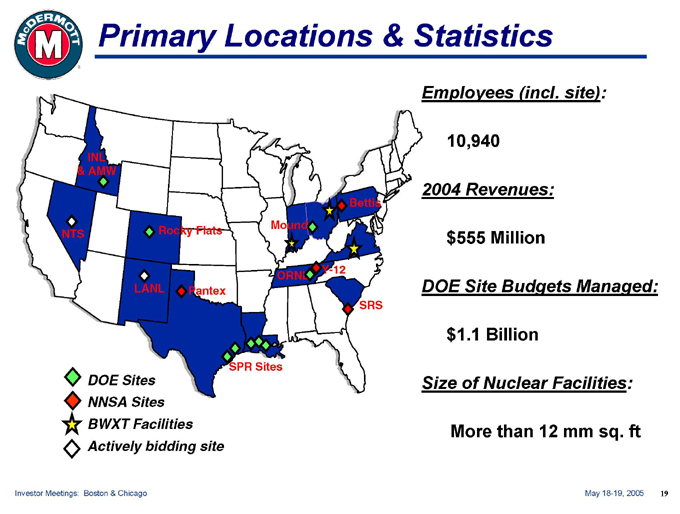
Primary Locations & Statistics
Employees (incl. site):
10,940
2004 Revenues:
$555 Million
DOE Site Budgets Managed:
$1.1 Billion
Size of Nuclear Facilities:
More than 12 mm sq. ft
DOE Sites NNSA Sites BWXT Facilities Actively bidding site
Investor Meetings: Boston & Chicago May 18-19, 2005 19
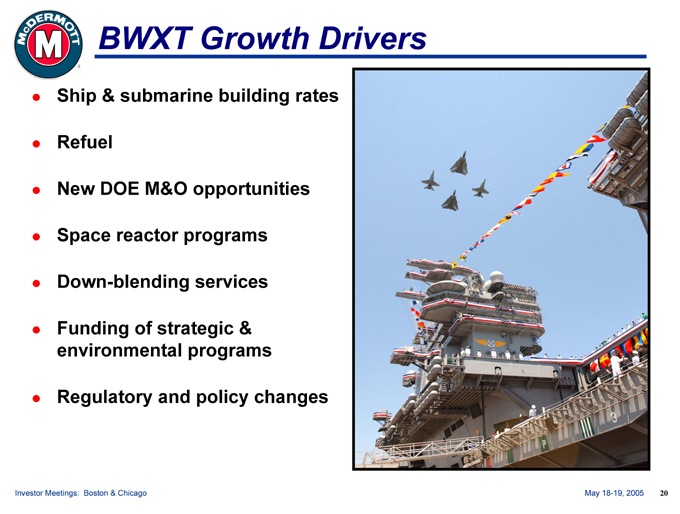
BWXT Growth Drivers
Ship & submarine building rates Refuel New DOE M&O opportunities Space reactor programs Down-blending services
Funding of strategic & environmental programs
Regulatory and policy changes
Investor Meetings: Boston & Chicago May 18-19, 2005 20
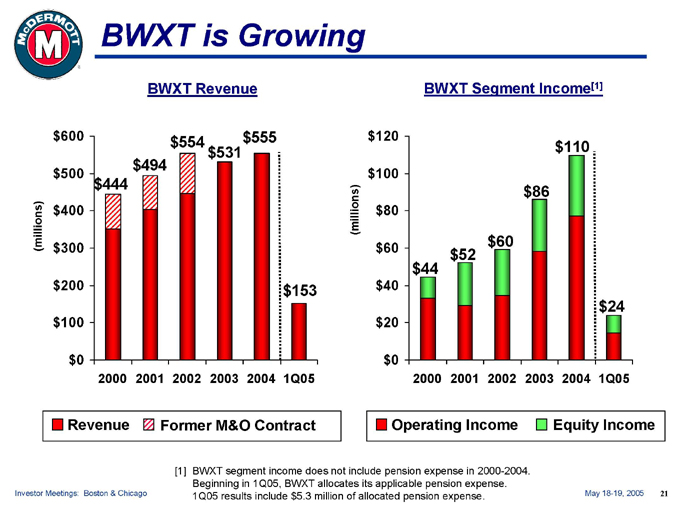
BWXT is Growing
BWXT Revenue
(millions) $600 $500 $400 $300 $200 $100 $0
2000 2001 2002 2003 2004 1Q05 $444 $494 $554 $531 $555 $153
Revenue Former M&O Contract
BWXT Segment Income[1]
(millions) $120 $100 $80 $60 $40 $20 $0
2000 2001 2002 2003 2004 1Q05 $44 $52 $60 $86 $110 $24
Operating Income Equity Income
[1] BWXT segment income does not include pension expense in 2000-2004.
Beginning in 1Q05, BWXT allocates its applicable pension expense. 1Q05 results include $5.3 million of allocated pension expense.
Investor Meetings: Boston & Chicago May 18-19, 2005 21
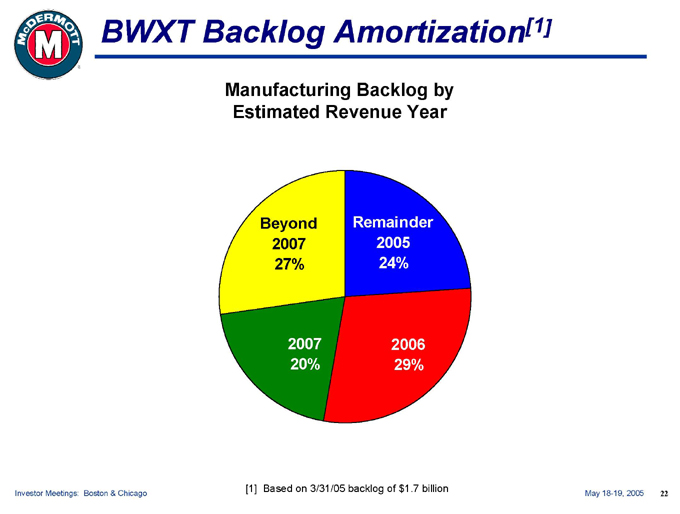
BWXT Backlog Amortization[1]
Manufacturing Backlog by Estimated Revenue Year
Beyond 2007 27%
Remainder 2005 24%
2007 20%
2006 29%
[1] Based on 3/31/05 backlog of $1.7 billion
Investor Meetings: Boston & Chicago
May 18-19, 2005 22
BWXT’s Strategy
Maintain leadership position Maintain customer confidence Generate cost reductions
Explore opportunities selectively outside the U.S.
Continue strong operational and financial performance
Investor Meetings: Boston & Chicago May 18-19, 2005 23

M c D E R M O T T I N T E R N A T I O N A L , I N C .
B&W Snapshot
The Babcock & Wilcox Company was incorporated in 1881
Premier coal-fired boiler manufacturer for electricity generation
Today’s key products and services
OEM boilers and related equipment to generate steam and power Environmental and emission reduction equipment Upgrades, service and replacement parts EPIC coal-fired power plants & projects Field engineering and construction services Replacement nuclear steam generators (US and Canada) Nuclear service and parts (Canada)
World-wide locations
Approximately 10,700 employees
Investor Meetings: Boston & Chicago May 18-19, 2005 25
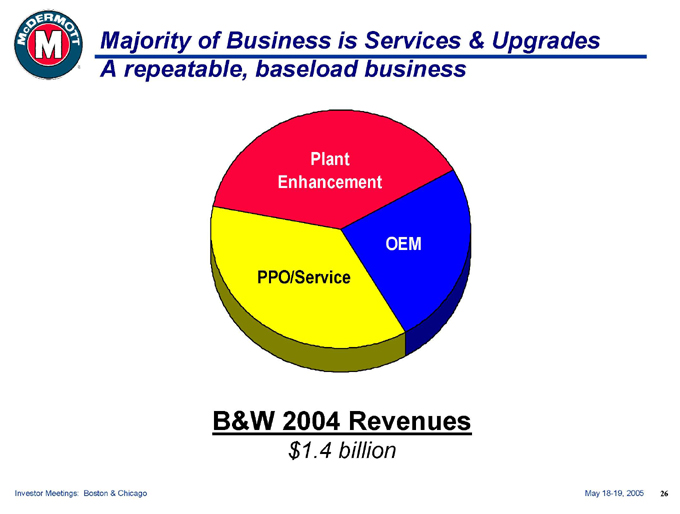
Majority of Business is Services & Upgrades A repeatable, baseload business
Plant Enhancement
PPO/Service
OEM
B&W 2004 Revenues
$1.4 billion
Investor Meetings: Boston & Chicago May 18-19, 2005 26
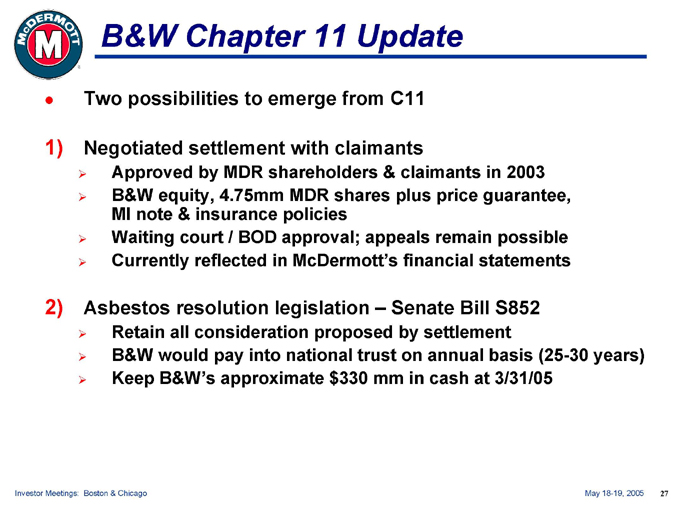
B&W Chapter 11 Update
Two possibilities to emerge from C11
Negotiated settlement with claimants
Approved by MDR shareholders & claimants in 2003 B&W equity, 4.75mm MDR shares plus price guarantee, MI note & insurance policies Waiting court / BOD approval; appeals remain possible Currently reflected in McDermott’s financial statements
Asbestos resolution legislation – Senate Bill S852
Retain all consideration proposed by settlement
B&W would pay into national trust on annual basis (25-30 years) Keep B&W’s approximate $330 mm in cash at 3/31/05
Investor Meetings: Boston & Chicago May 18-19, 2005 27
Financial Review
M c D E R M O T T I N T E R N A T I O N A L , I N C ..
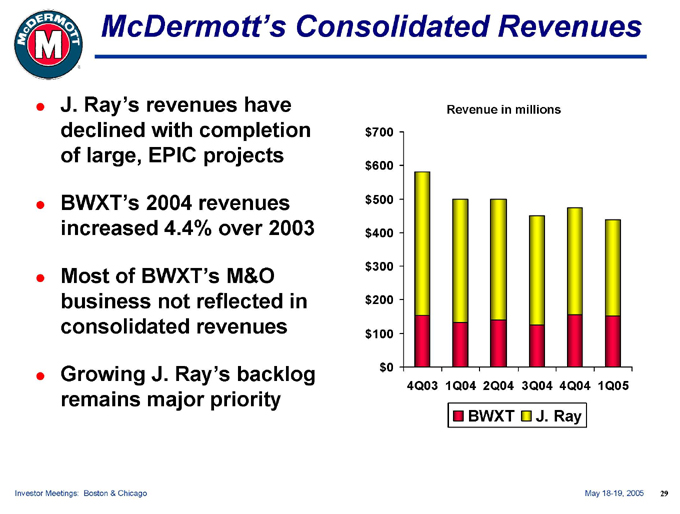
McDermott’s Consolidated Revenues
J. Ray’s revenues have declined with completion of large, EPIC projects
BWXT’s 2004 revenues increased 4.4% over 2003
Most of BWXT’s M&O business not reflected in consolidated revenues
Growing J. Ray’s backlog remains major priority
Revenue in millions $700
$600
$500 $400 $300 $200
$100
$0
4Q03 1Q04 2Q04 3Q04 4Q04 1Q05
BWXT J. Ray
Investor Meetings: Boston & Chicago May 18-19, 2005 29
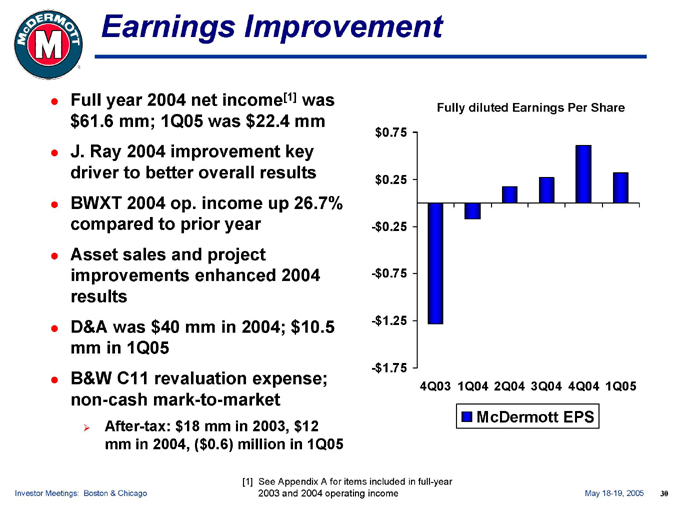
Earnings Improvement
Full year 2004 net income[1] was $61.6 mm; 1Q05 was $22.4 mm J. Ray 2004 improvement key driver to better overall results BWXT 2004 op. income up 26.7% compared to prior year Asset sales and project improvements enhanced 2004 results D&A was $40 mm in 2004; $10.5 mm in 1Q05 B&W C11 revaluation expense; non-cash mark-to-market
After-tax: $18 mm in 2003, $12 mm in 2004, ($0.6) million in 1Q05
Fully diluted Earnings Per Share $0.75
$0.25
-$0.25
-$0.75
-$1.25
-$1.75
4Q03 1Q04 2Q04 3Q04 4Q04 1Q05
McDermott EPS
[1] See Appendix A for items included in full-year 2003 and 2004 operating income
Investor Meetings: Boston & Chicago
Investor Meetings: Boston & Chicago May 18-19, 2005 30
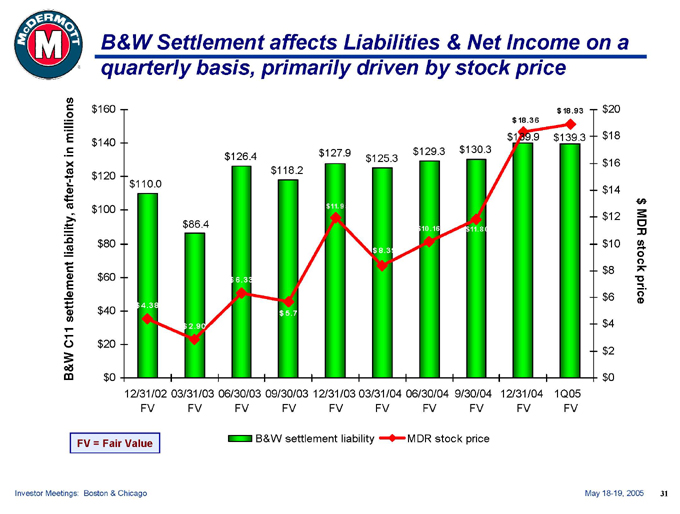
B&W Settlement affects Liabilities & Net Income on a quarterly basis, primarily driven by stock price
B&W C11 settlement liability, after-tax in millions $160 $140 $120 $100 $80 $60 $40 $20 $0
12/31/02 FV 03/31/03 FV 06/30/03 FV 09/30/03 FV 12/31/03 FV 03/31/04 FV 06/30/04 FV 9/30/04 FV 12/31/04 FV 1Q05 FV
$20 $18 $16 $14 $12 $10 $8 $6 $4 $2 $0 $MDR stock price $110.0 $4.38 $86.4 $2.90 $126.4 $6.33 $118.2 $5.71 $127.9 $11.9 5 $125.3 $8.39 $129.3 $10.16 $130.3 $11.80 $18.36 $139.9 $18.93 $139.3
FV = Fair Value
B&W settlement liability MDR stock price
Investor Meetings: Boston & Chicago May 18-19, 2005 31
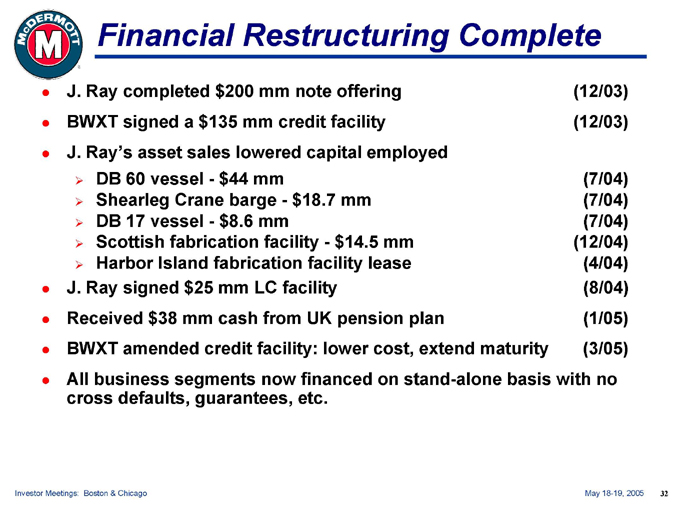
Financial Restructuring Complete
J. Ray completed $200 mm note offering (12/03)
BWXT signed a $135 mm credit facility (12/03)
J. Ray’s asset sales lowered capital employed
DB 60 vessel - $44 mm (7/04)
Shearleg Crane barge - $18.7 mm (7/04)
DB 17 vessel - $8.6 mm (7/04)
Scottish fabrication facility - $14.5 mm (12/04)
Harbor Island fabrication facility lease (4/04)
J. Ray signed $25 mm LC facility (8/04)
Received $38 mm cash from UK pension plan (1/05)
BWXT amended credit facility: lower cost, extend maturity (3/05)
All business segments now financed on stand-alone basis with no cross defaults, guarantees, etc.
Investor Meetings: Boston & Chicago May 18-19, 2005 32
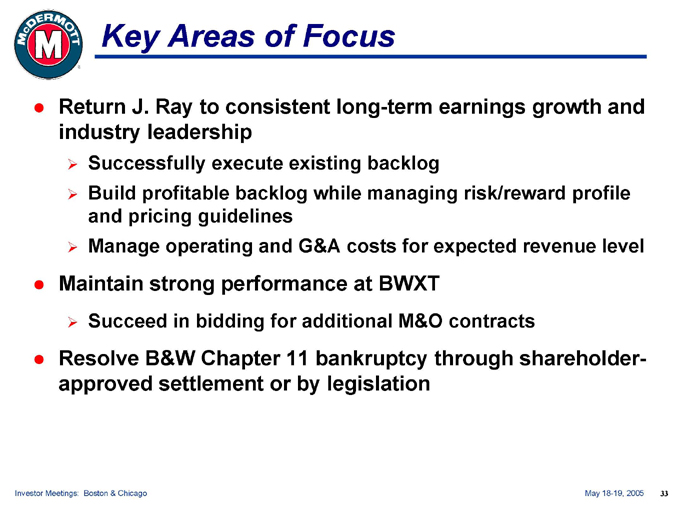
Key Areas of Focus
Return J. Ray to consistent long-term earnings growth and industry leadership
Successfully execute existing backlog
Build profitable backlog while managing risk/reward profile and pricing guidelines Manage operating and G&A costs for expected revenue level
Maintain strong performance at BWXT
Succeed in bidding for additional M&O contracts
Resolve B&W Chapter 11 bankruptcy through shareholder-approved settlement or by legislation
Investor Meetings: Boston & Chicago May 18-19, 2005 33
Investment Highlights
Industry-leading, franchise-name businesses Valued supplier to our customers Improved bidding discipline at J. Ray Solid, predictable backlog at BWXT
B&W Chapter 11 bankruptcy resolution in sight Financial restructuring complete, liquidity improved Experienced, shareholder-focused management team
Investor Meetings: Boston & Chicago May 18-19, 2005 34

McDERMOTT INTERNATIONAL, INC.
(NYSE: MDR)
For more information contact:
Jay Roueche
Director of Investor Relations
281-870-5462
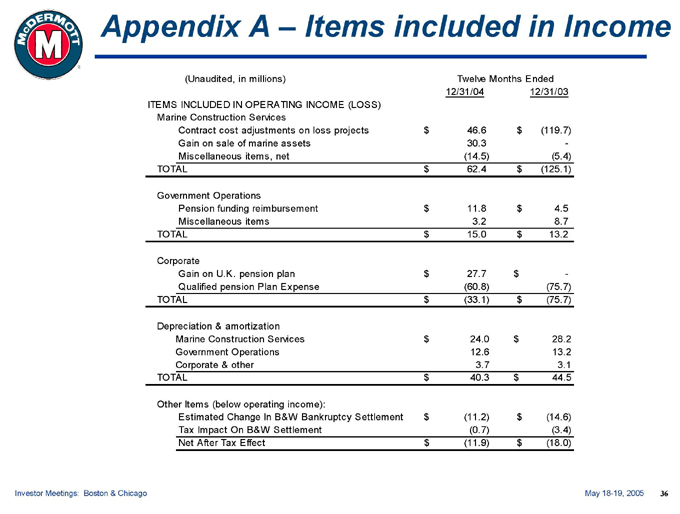
Appendix A – Items included in Income
(Unaudited, in millions) Twelve Months Ended
12/31/04 12/31/03
ITEMS INCLUDED IN OPERATING INCOME (LOSS)
Marine Construction Services
Contract cost adjustments on loss projects $46.6 $(119.7)
Gain on sale of marine assets 30.3 -
Miscellaneous items, net (14.5) (5.4)
TOTAL $62.4 $(125.1)
Government Operations
Pension funding reimbursement $11.8 $4.5
Miscellaneous items 3.2 8.7
TOTAL $15.0 $13.2
Corporate
Gain on U.K. pension plan $27.7 $-
Qualified pension Plan Expense (60.8) (75.7)
TOTAL $(33.1) $(75.7)
Depreciation & amortization
Marine Construction Services $24.0 $28.2
Government Operations 12.6 13.2
Corporate & other 3.7 3.1
TOTAL $40.3 $44.5
Other Items (below operating income):
Estimated Change In B&W Bankruptcy Settlement $(11.2) $(14.6)
Tax Impact On B&W Settlement (0.7) (3.4)
Net After Tax Effect $(11.9) $(18.0)
Investor Meetings: Boston & Chicago May 18-19, 2005 36
Business Photos
Investor Meetings: Boston & Chicago May 18-19, 2005 37