Exhibit 99.1
McDERMOTT INTERNATIONAL, INC.
Lehman Brothers 2005 CEO
Energy / Power Conference
September 6, 2005 New York

Cautionary Statements / Safe Harbor
Statements in this presentation which express a forecast, expectation or estimate, as well as those which are not historical fact, are forward looking and include statements regarding the proposed settlement of B&W’s Chapter 11 proceeding, B&W’s favorable business environment, management’s expectations regarding outstanding bids, J. Ray’s position to capture industry growth and prospects for growing its backlog, and management’s areas of focus. They involve a number of risks and uncertainties which may cause actual results to differ materially from such forward-looking statements. These risks and uncertainties include the risk that the proposed Chapter 11 settlement may not be finalized on the terms we have described, adverse changes in the company’s liquidity or in the industry, and such other factors detailed in McDermott International’s filings with the U.S. Securities & Exchange Commission, including its Form 10-K for the year ended December 31, 2004 and its Form 10-Q’s which are filed quarterly.
Lehman Brothers 2005 CEO Energy / Power Conference September 6, 2005 2
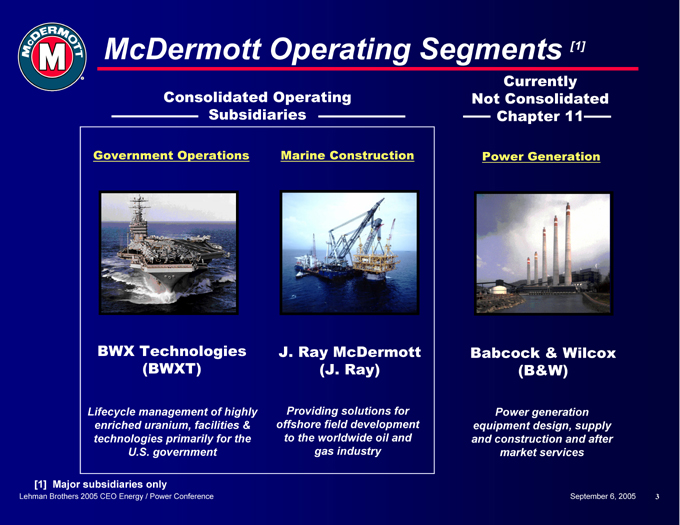
McDermott Operating Segments [1]
Consolidated Operating Subsidiaries
Government Operations
BWX Technologies (BWXT)
Lifecycle management of highly enriched uranium, facilities & technologies primarily for the U.S. government
Marine Construction
J. Ray McDermott (J. Ray)
Providing solutions for offshore field development to the worldwide oil and gas industry
Currently Not Consolidated Chapter 11
Power Generation
Babcock & Wilcox (B&W)
Power generation equipment design, supply and construction and after market services
[1] Major subsidiaries only
Lehman Brothers 2005 CEO Energy / Power Conference September 6, 2005 3
Investment Highlights
Three industry-leading, franchise-name businesses Solid, predictable backlog and performance at BWXT Improved disciplines and results at J. Ray B&W Chapter 11 bankruptcy resolution in sight
Revised settlement provides for retention of B&W Economic benefit of FAIR Act if signed into law Industry fundamentals for B&W are promising
Experienced, shareholder-focused management team
Lehman Brothers 2005 CEO Energy / Power Conference September 6, 2005 4
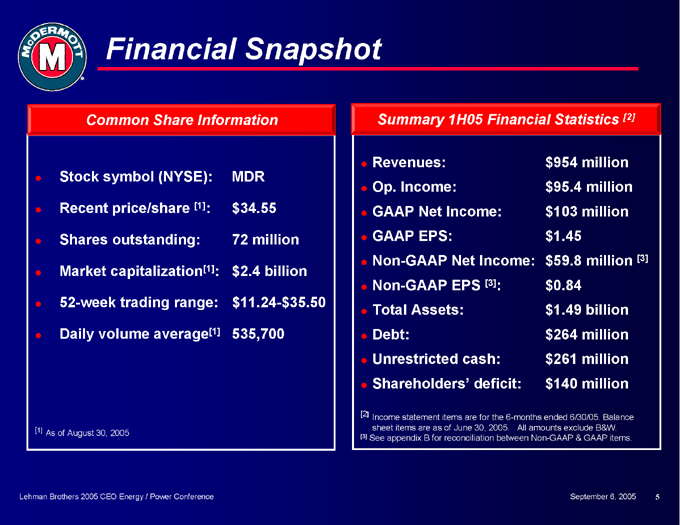
Financial Snapshot
Common Share Information
Stock symbol (NYSE): MDR Recent price/share [1]: $34.55 Shares outstanding: 72 million Market capitalization[1]: $2.4 billion 52-week trading range: $11.24-$35.50 Daily volume average[1] 535,700
[1] As of August 30, 2005
Summary 1H05 Financial Statistics [2]
Revenues: $954 million Op. Income: $95.4 million GAAP Net Income: $103 million GAAP EPS: $1.45 Non-GAAP Net Income: $59.8 million [3] Non-GAAP EPS [3]: $0.84 Total Assets: $1.49 billion Debt: $264 million Unrestricted cash: $261 million Shareholders’ deficit: $140 million
[2] Income statement items are for the 6-months ended 6/30/05. Balance sheet items are as of June 30, 2005. All amounts exclude B&W.
[3] See appendix B for reconciliation between Non-GAAP & GAAP items.
Lehman Brothers 2005 CEO Energy / Power Conference September 6, 2005 5
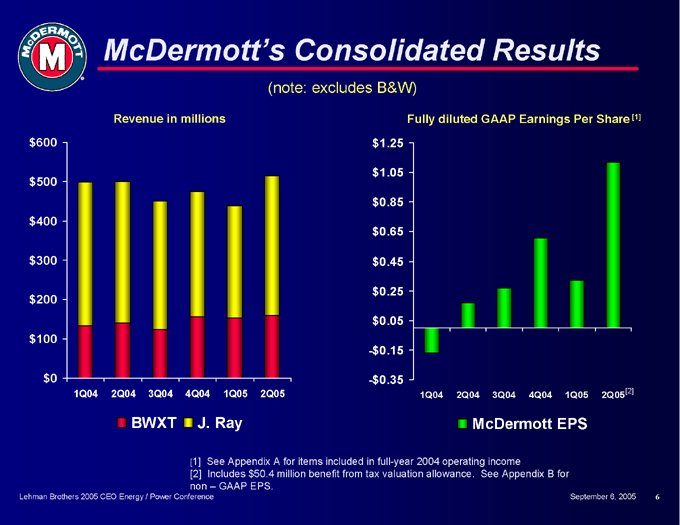
McDermott’s Consolidated Results
(note: excludes B&W)
Revenue in millions $600
$500 $400 $300 $200 $100
$0
1Q04 2Q04 3Q04 4Q04 1Q05 2Q05
BWXT J. Ray
Fully diluted GAAP Earnings Per Share [1] $1.25
$1.05 $0.85 $0.65 $0.45 $0.25 $0.05
-$0.15
-$0.35
1Q04 2Q04 3Q04 4Q04 1Q05 2Q05[2]
McDermott EPS
[1] See Appendix A for items included in full-year 2004 operating income
[2] Includes $50.4 million benefit from tax valuation allowance. See Appendix B for non – GAAP EPS.
Lehman Brothers 2005 CEO Energy / Power Conference September 6, 2005 6
BWX Technologies, Inc.SM
BWXT is the premier manager of complex, high-consequence nuclear and national security operations. We are disciplined operators and managers of nuclear production facilities, who deliver value and customer confidence.
Powering Transformation
McDERMOTT INTERNATIONAL, INC.
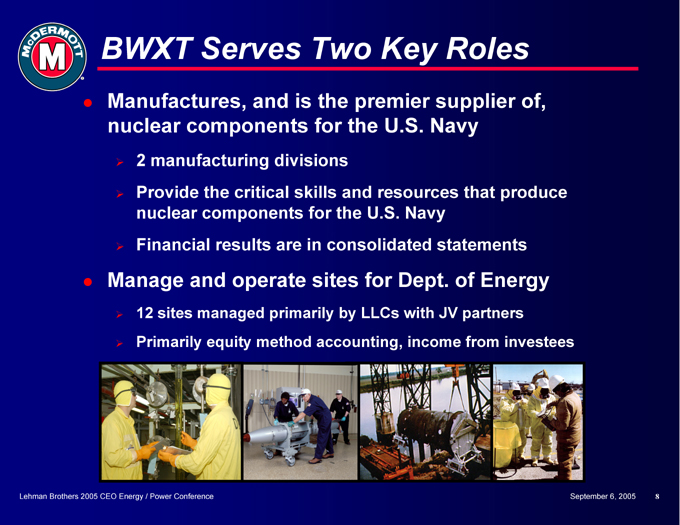
BWXT Serves Two Key Roles
Manufactures, and is the premier supplier of, nuclear components for the U.S. Navy
2 manufacturing divisions
Provide the critical skills and resources that produce nuclear components for the U.S. Navy Financial results are in consolidated statements
Manage and operate sites for Dept. of Energy
12 sites managed primarily by LLCs with JV partners Primarily equity method accounting, income from investees
Lehman Brothers 2005 CEO Energy / Power Conference September 6, 2005 8
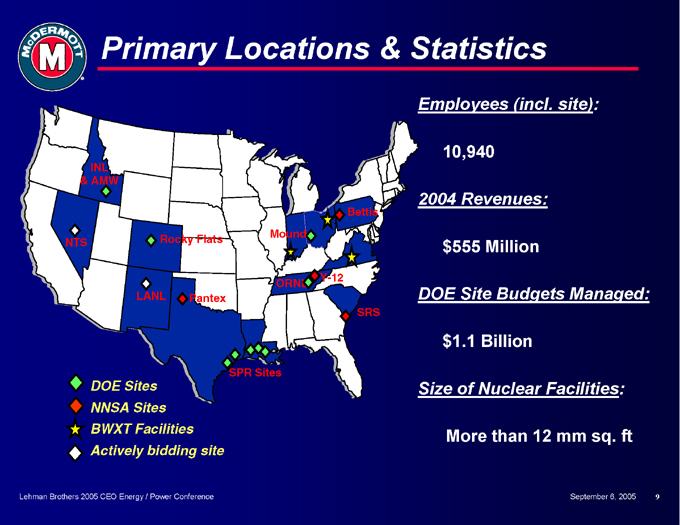
Primary Locations & Statistics
INL & AMW
Bettis Rocky Flats Mound NTS
Y-12 ORNL
LANL Pantex
SRS
SPR Sites
DOE Sites NNSA Sites BWXT Facilities Actively bidding site
Employees (incl. site):
10,940
2004 Revenues:
$555 Million
DOE Site Budgets Managed:
$1.1 Billion
Size of Nuclear Facilities:
More than 12 mm sq. ft
Lehman Brothers 2005 CEO Energy / Power Conference September 6, 2005 9
BWXT Growth Drivers
Ship & submarine building rates Refuel New DOE M&O opportunities Space reactor programs Down-blending services
Funding of strategic & environmental programs
Regulatory and policy changes
Lehman Brothers 2005 CEO Energy / Power Conference September 6, 2005 10
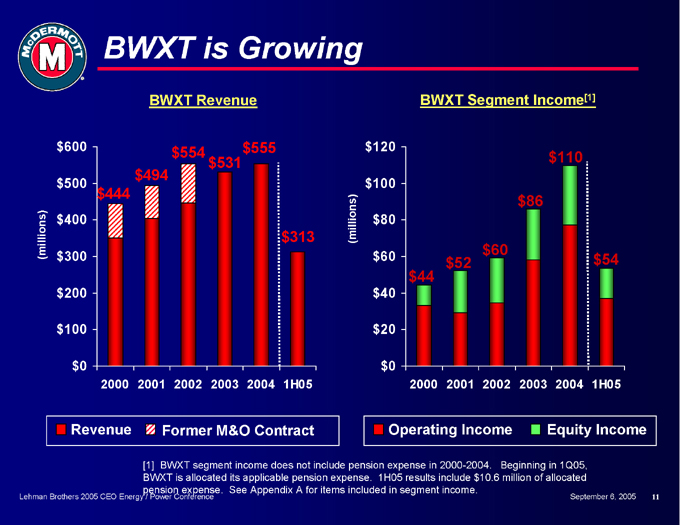
BWXT is Growing
BWXT Revenue $600 $554 $555 $531 $494
$500
$444
(millions) $400
$313
$300 $200 $100
$0
2000 2001 2002 2003 2004 1H05
Revenue
Former M&O Contract
BWXT Segment Income[1] $120
$110
$100
(millions) $86
$80
$60 $60
$52 $54 $44
$40
$20
$0
2000 2001 2002 2003 2004 1H05
Operating Income
Equity Income
[1] BWXT segment income does not include pension expense in 2000-2004. Beginning in 1Q05, BWXT is allocated its applicable pension expense. 1H05 results include $10.6 million of allocated pension expense. See Appendix A for items included in segment income.
Lehman Brothers 2005 CEO Energy / Power Conference September 6, 2005 11
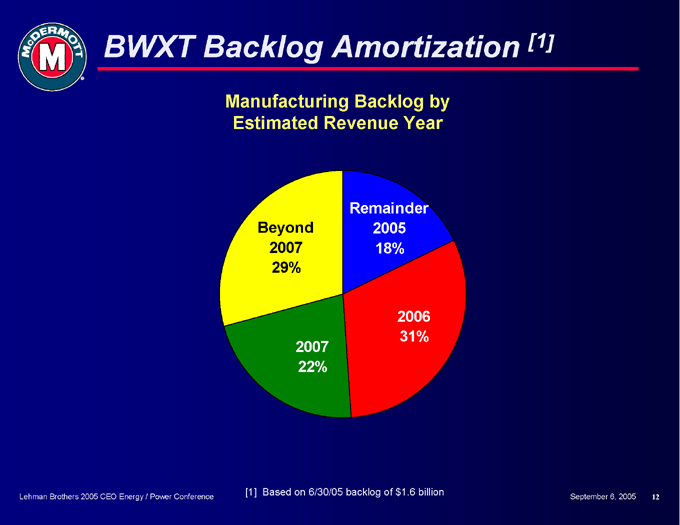
BWXT Backlog Amortization [1]
Manufacturing Backlog by Estimated Revenue Year
Beyond 2007 29%
2007 22%
2006 31%
Remainder 2005 18%
[1] Based on 6/30/05 backlog of $1.6 billion
Lehman Brothers 2005 CEO Energy / Power Conference
September 6, 2005 12

BWXT’s Strategy
Maintain leadership position Maintain customer confidence Generate cost reductions
Explore opportunities selectively outside the U.S.
Continue strong operational and financial performance
Lehman Brothers 2005 CEO Energy / Power Conference September 6, 2005 13
McDERMOTT INTERNATIONAL, INC.
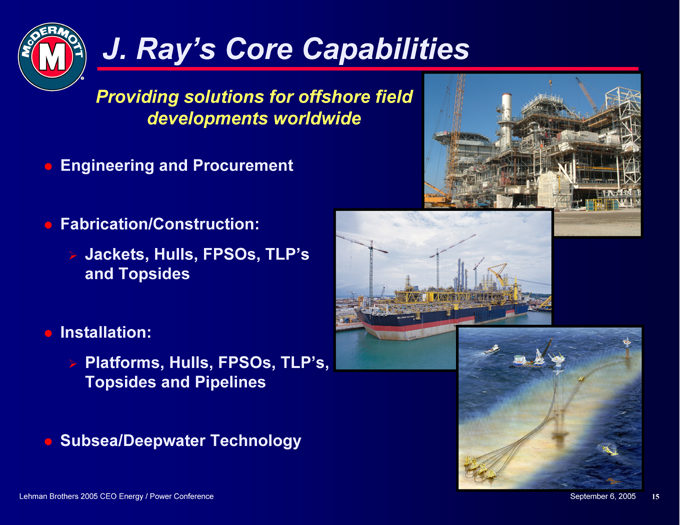
J. Ray’s Core Capabilities
Providing solutions for offshore field developments worldwide
Engineering and Procurement
Fabrication/Construction:
Jackets, Hulls, FPSOs, TLP’s and Topsides
Installation:
Platforms, Hulls, FPSOs, TLP’s, Topsides and Pipelines
Subsea/Deepwater Technology
Lehman Brothers 2005 CEO Energy / Power Conference September 6, 2005 15
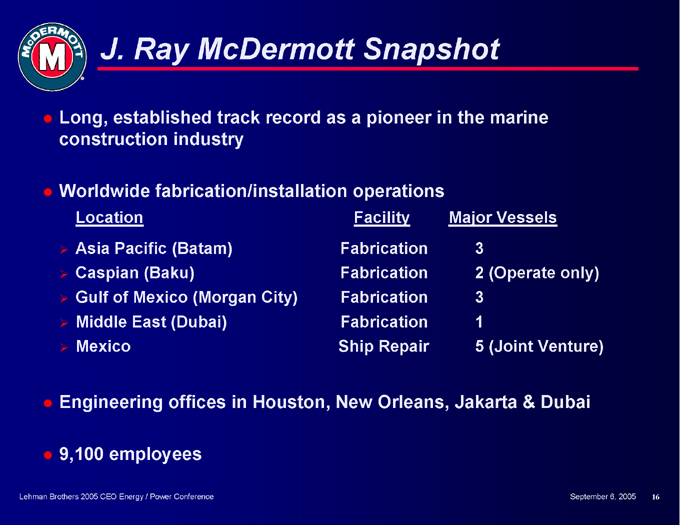
J. Ray McDermott Snapshot
Long, established track record as a pioneer in the marine construction industry
Worldwide fabrication/installation operations
Location Facility Major Vessels
Asia Pacific (Batam) Fabrication 3
Caspian (Baku) Fabrication 2 (Operate only)
Gulf of Mexico (Morgan City) Fabrication 3
Middle East (Dubai) Fabrication 1
Mexico Ship Repair 5 (Joint Venture)
Engineering offices in Houston, New Orleans, Jakarta & Dubai
9,100 employees
Lehman Brothers 2005 CEO Energy / Power Conference
September 6, 2005 16
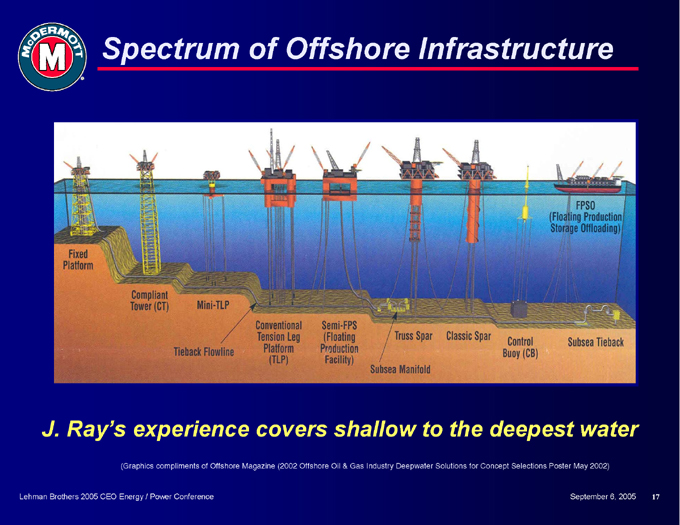
Spectrum of Offshore Infrastructure
FPSO (Floating Production Storage Offloading)
Fixed Platform
Compliant Tower (CT)
Mini-TLP
Tieback Flowline
Conventional Tension Leg Platform (TLP)
Semi-FPS (Floating Production Facility)
Subsea Manifold
Truss Spar
Classic Spar
Control Buoy (CB)
Subsea Tieback
J. Ray’s experience covers shallow to the deepest water
(Graphics compliments of Offshore Magazine (2002 Offshore Oil & Gas Industry Deepwater Solutions for Concept Selections Poster May 2002)
Lehman Brothers 2005 CEO Energy / Power Conference September 6, 2005 17
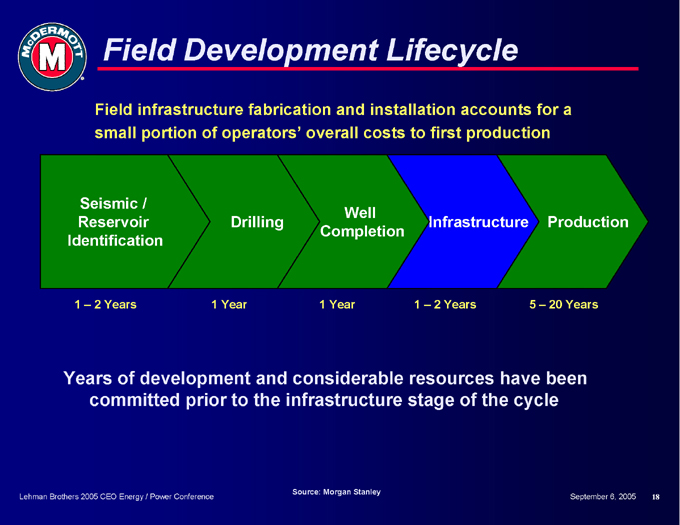
Field Development Lifecycle
Field infrastructure fabrication and installation accounts for a small portion of operators’ overall costs to first production
Seismic /
Well
Reservoir Drilling Infrastructure Production Completion Identification
1 – 2 Years 1 Year 1 Year 1 – 2 Years 5 – 20 Years
Years of development and considerable resources have been committed prior to the infrastructure stage of the cycle
Source: Morgan Stanley
Lehman Brothers 2005 CEO Energy / Power Conference
September 6, 2005 18
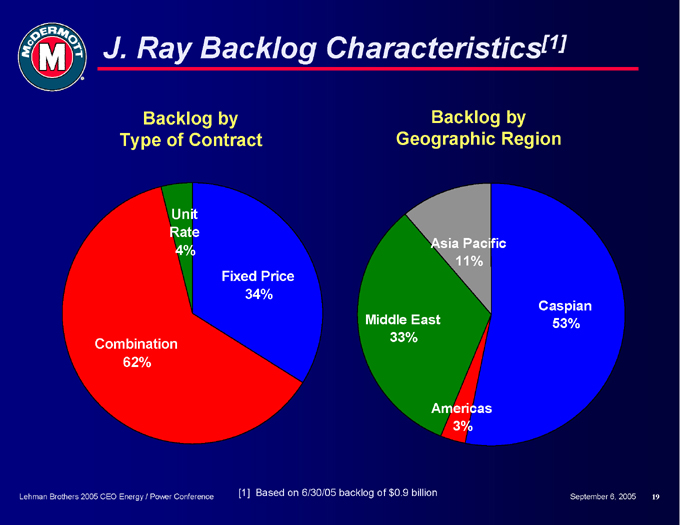
J. Ray Backlog Characteristics[1]
Backlog by Type of Contract
Unit Rate 4%
Fixed Price 34%
Combination 62%
Backlog by Geographic Region
Asia Pacific 11%
Caspian Middle East 53% 33%
Americas 3%
[1] Based on 6/30/05 backlog of $0.9 billion
Lehman Brothers 2005 CEO Energy / Power Conference
September 6, 2005 19
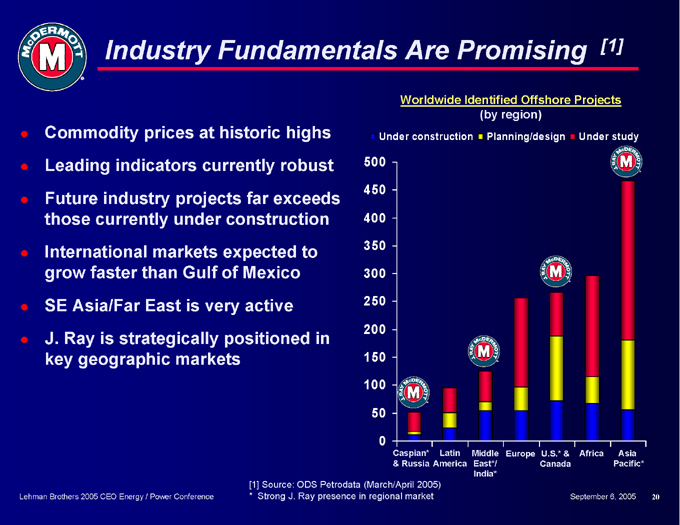
Industry Fundamentals Are Promising [1]
Commodity prices at historic highs Leading indicators currently robust Future industry projects far exceeds those currently under construction International markets expected to grow faster than Gulf of Mexico SE Asia/Far East is very active J. Ray is strategically positioned in key geographic markets
Worldwide Identified Offshore Projects (by region)
Under construction Planning/design Under study
500 450 400 350 300 250 200 150 100 50
0
Caspian* Latin Middle Europe U.S.* & Africa Asia & Russia America East*/ Canada Pacific* India*
[1] Source: ODS Petrodata (March/April 2005)
* Strong J. Ray presence in regional market
Lehman Brothers 2005 CEO Energy / Power Conference
September 6, 2005 20
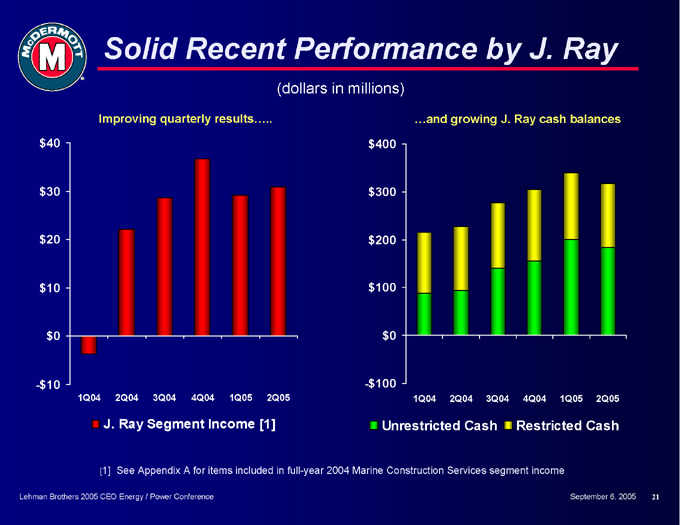
Solid Recent Performance by J. Ray
(dollars in millions)
Improving quarterly results
$40 $30 $20 $10 $0
-$10
1Q04 2Q04 3Q04 4Q04 1Q05 2Q05
J. Ray Segment Income [1]
…and growing J. Ray cash balances $400 $300 $200 $100 $0
-$ 100
1Q04 2Q04 3Q04 4Q04 1Q05 2Q05
Unrestricted Cash Restricted Cash
[1] See Appendix A for items included in full-year 2004 Marine Construction Services segment income
Lehman Brothers 2005 CEO Energy / Power Conference
September 6, 2005 21
Bidding Activity leads to 3rd Qtr. Awards
Bids outstanding exceeded $2 billion in June 2005 Awarded Saudi Aramco project in August Chevron Gulf of Mexico marine contract signed Expect near-term awards in the Asia Pacific market Plan to win our share of remaining bids
Maintain financial discipline in bids; manage risk and reward Selectively pursue projects, a rifle approach Manage the business from a global perspective
Lehman Brothers 2005 CEO Energy / Power Conference September 6, 2005 22
J. Ray Summary
Late-cycle service company in offshore field development
Well positioned to capture industry growth
Strong franchise in strategic geographical locations Management team leading change in all areas $930 million backlog with good growth prospects
Lehman Brothers 2005 CEO Energy / Power Conference September 6, 2005 23
McDERMOTT INTERNATIONAL, INC.
B&W Snapshot
The Babcock & Wilcox Company was incorporated in 1881
Premier coal-fired boiler manufacturer for electricity generation
Acquired by McDermott in 1978
B&W serves industry today through 6 operating entities
Product/service offerings have increased beyond only coal OEM Environmental requirements, upgrades & service reduce cyclicality Nuclear equipment, service and parts in addition to coal
Filed for Chapter 11 in 2000 to resolve asbestos claims World-wide locations
Approximately 6,500 employees
Lehman Brothers 2005 CEO Energy / Power Conference September 6, 2005 25
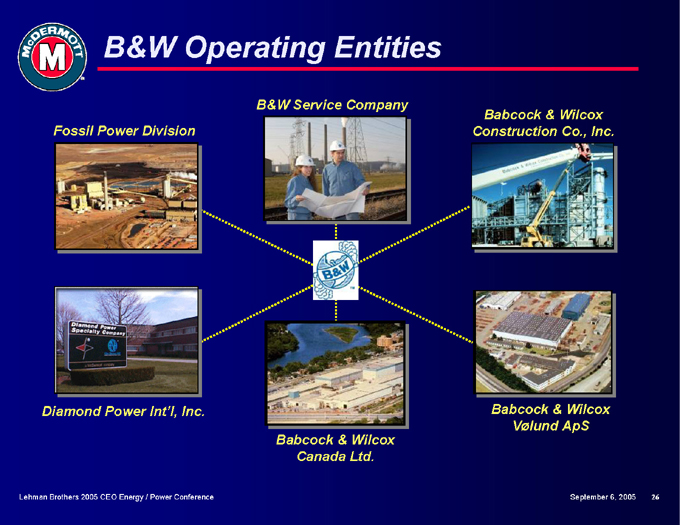
B&W Operating Entities
B&W Service Company
Babcock & Wilcox Fossil Power Division Construction Co., Inc.
Diamond Power Int’l, Inc. Babcock & Wilcox
Vølund ApS Babcock & Wilcox Canada Ltd.
Lehman Brothers 2005 CEO Energy / Power Conference September 6, 2005 26
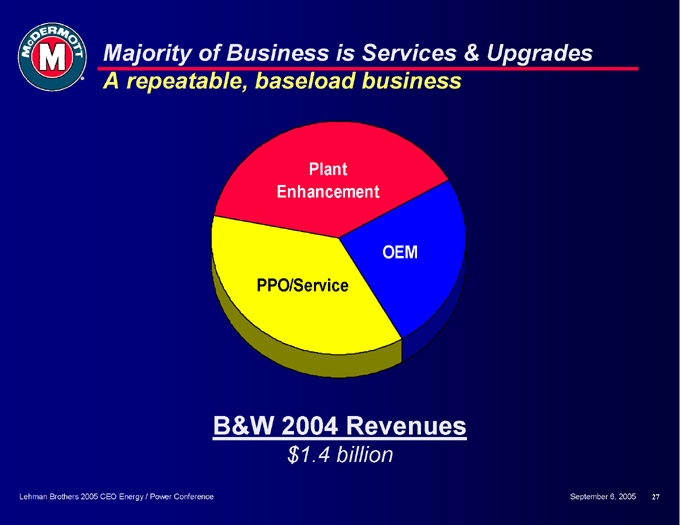
Majority of Business is Services & Upgrades A repeatable, baseload business
Plant Enhancement
OEM PPO/Service
B&W 2004 Revenues
$1.4 billion
Lehman Brothers 2005 CEO Energy / Power Conference September 6, 2005 27
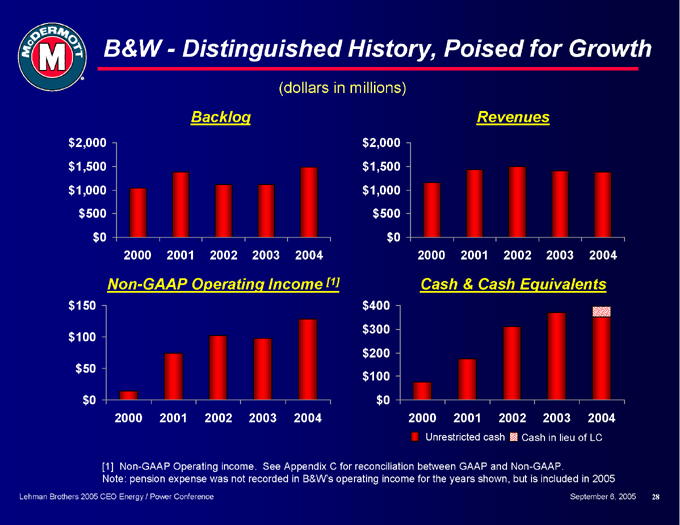
B&W - Distinguished History, Poised for Growth
(dollars in millions)
Backlog $2,000 $1,500 $1,000 $500 $0
2000 2001 2002 2003 2004
Revenues $2,000 $1,500 $1,000 $500 $0
2000 2001 2002 2003 2004
Non-GAAP Operating Income [1] $150 $100 $50
$0
2000 2001 2002 2003 2004
Cash & Cash Equivalents $400 $300 $200 $100 $0
2000 2001 2002 2003 2004
Unrestricted cash Cash in lieu of LC
[1] Non-GAAP Operating income. See Appendix C for reconciliation between GAAP and Non-GAAP.
Note: pension expense was not recorded in B&W’s operating income for the years shown, but is included in 2005
Lehman Brothers 2005 CEO Energy / Power Conference September 6, 2005 28

Revised Settlement Agreement – 8/29/05
Key points of revised agreement
MDR retains B&W – with or without FAIR Act passage Economic opportunity of FAIR Act preserved Fast track resolution to Chapter 11 versus existing settlement Greater certainty of effective settlement, not later than 2/22/06
Consideration of settlement $350 million payment on effective date (no later than 2/22/06) $250 million contingent note (5-years, 7% interest) $355 million contingent payment right (180 days after 11/30/06) Contingent payments dependent on FAIR Act status If FAIR Act becomes law by 11/30/06, only $25 million additional payment required, remaining contingent consideration cancelled
B&W $352 million of cash available on August 24, 2005
Lehman Brothers 2005 CEO Energy / Power Conference September 6, 2005 29
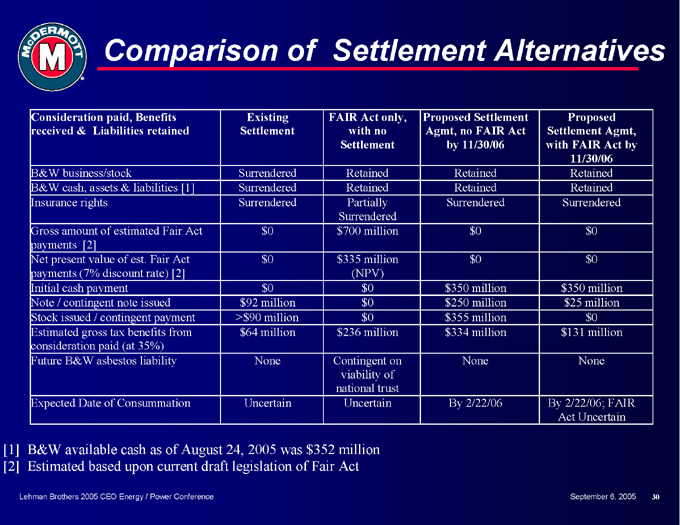
Comparison of Settlement Alternatives
Consideration paid, Benefits received & Liabilities retained Existing Settlement FAIR Act only, with no Settlement Proposed Settlement Agmt, no FAIR Act by 11/30/06 Proposed Settlement Agmt, with FAIR Act by 11/30/06
B&W business/stock Surrendered Retained Retained Retained
B&W cash, assets & liabilities [1] Surrendered Retained Retained Retained
Insurance rights Surrendered Partially Surrendered Surrendered Surrendered
Gross amount of estimated Fair Act payments [2] $0 $700 million $0 $0
Net present value of est. Fair Act payments (7% discount rate) [2] $0 $335 million (NPV) $0 $0
Initial cash payment $0 $0 $350 million $350 million
Note / contingent note issued $92 million $0 $250 million $25 million
Stock issued / contingent payment >$90 million $0 $355 million $0
Estimated gross tax benefits from consideration paid (at 35%) $64 million $236 million $334 million $131 million
Future B&W asbestos liability None Contingent on viability of national trust None None
Expected Date of Consummation Uncertain Uncertain By 2/22/06 By 2/22/06; FAIR Act Uncertain
[1] B&W available cash as of August 24, 2005 was $352 million [2] Estimated based upon current draft legislation of Fair Act
Lehman Brothers 2005 CEO Energy / Power Conference September 6, 2005 30
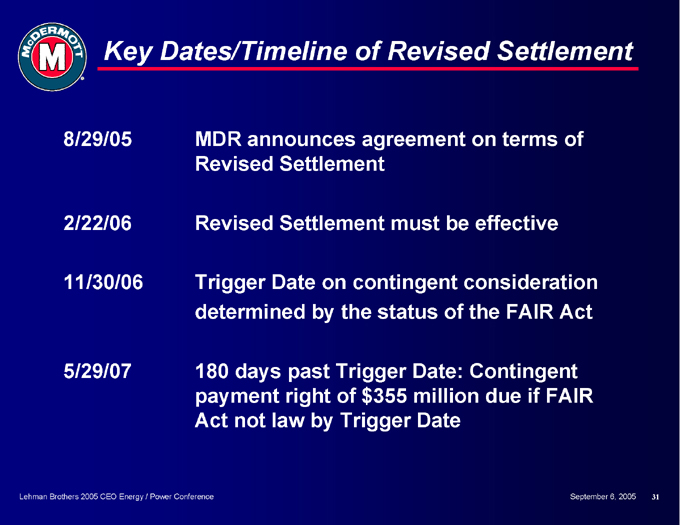
Key Dates/Timeline of Revised Settlement
8/29/05 MDR announces agreement on terms of Revised Settlement
2/22/06 Revised Settlement must be effective
11/30/06 Trigger Date on contingent consideration determined by the status of the FAIR Act
5/29/07 180 days past Trigger Date: Contingent payment right of $355 million due if FAIR Act not law by Trigger Date
Lehman Brothers 2005 CEO Energy / Power Conference September 6, 2005 31

Remaining Issues / Events for Settlement
Key remaining issues to reach effective date
Negotiate and sign acceptable definitive agreements Obtain necessary approvals: MDR Board, shareholder, asbestos claimants and Court confirmation Resolve any objections to plan of reorganization Install exit financing and book reconsolidation
Achieve effective date by February 22, 2006
Lehman Brothers 2005 CEO Energy / Power Conference September 6, 2005 32
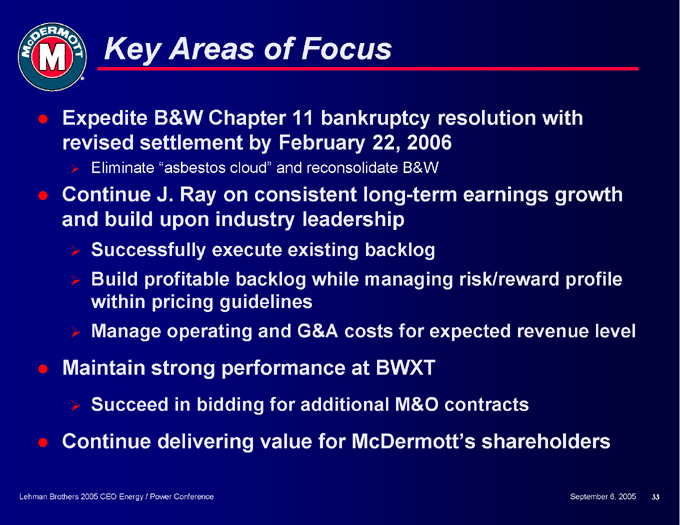
Key Areas of Focus
Expedite B&W Chapter 11 bankruptcy resolution with revised settlement by February 22, 2006
Eliminate “asbestos cloud” and reconsolidate B&W
Continue J. Ray on consistent long-term earnings growth and build upon industry leadership
Successfully execute existing backlog
Build profitable backlog while managing risk/reward profile within pricing guidelines Manage operating and G&A costs for expected revenue level
Maintain strong performance at BWXT
Succeed in bidding for additional M&O contracts
Continue delivering value for McDermott’s shareholders
Lehman Brothers 2005 CEO Energy / Power Conference September 6, 2005 33
McDERMOTT INTERNATIONAL, INC.
(NYSE: MDR)
For more information contact:
Jay Roueche Director of Investor Relations 281-870-5462
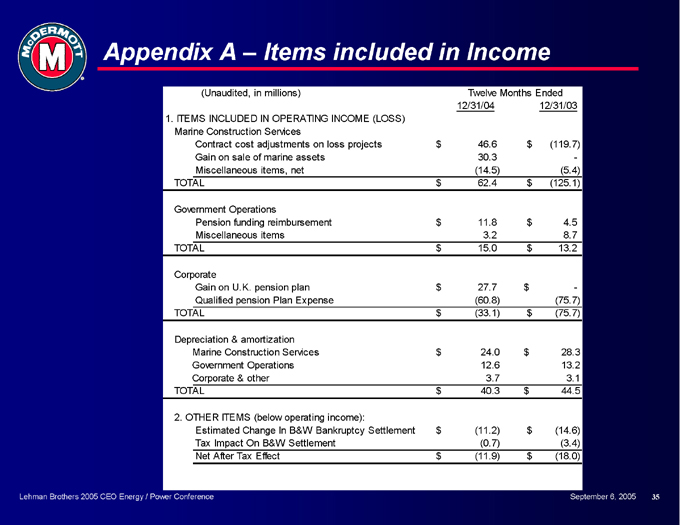
Appendix A – Items included in Income
(Unaudited, in millions) Twelve Months Ended
12/31/04 12/31/03
1. ITEMS INCLUDED IN OPERATING INCOME (LOSS)
Marine Construction Services
Contract cost adjustments on loss projects $46.6 $(119.7)
Gain on sale of marine assets 30.3 -
Miscellaneous items, net (14.5) (5.4)
TOTAL $62.4 $(125.1)
Government Operations
Pension funding reimbursement $11.8 $4.5
Miscellaneous items 3.2 8.7
TOTAL $15.0 $13.2
Corporate
Gain on U.K. pension plan $27.7 $-
Qualified pension Plan Expense (60.8) (75.7)
TOTAL $(33.1) $(75.7)
Depreciation & amortization
Marine Construction Services $24.0 $28.3
Government Operations 12.6 13.2
Corporate & other 3.7 3.1
TOTAL $40.3 $44.5
2. OTHER ITEMS (below operating income):
Estimated Change In B&W Bankruptcy Settlement $(11.2) $(14.6)
Tax Impact On B&W Settlement (0.7) (3.4)
Net After Tax Effect $(11.9) $(18.0)
Lehman Brothers 2005 CEO Energy / Power Conference September 6, 2005 35
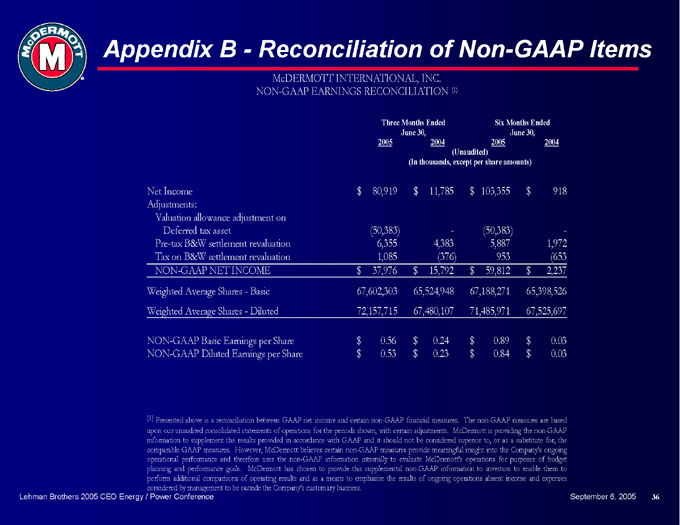
Appendix B - Reconciliation of Non-GAAP Items
McDERMOTT INTERNATIONAL, INC. NON-GAAP EARNINGS RECONCILIATION (1)
Three Months Ended June 30, Six Months Ended June 30,
2005 2004 2005 2004
(Unaudited)
(In thousands, except per share amounts)
Net Income $80,919 $11,785 $103,355 $918
Adjustments:
Valuation allowance adjustment on
Deferred tax asset (50,383) - (50,383) -
Pre-tax B&W settlement revaluation 6,355 4,383 5,887 1,972
Tax on B&W settlement revaluation 1,085 (376) 953 (653
NON-GAAP NET INCOME $37,976 $15,792 $59,812 $2,237
Weighted Average Shares—Basic 67,602,303 65,524,948 67,188,271 65,398,526
Weighted Average Shares—Diluted 72,157,715 67,480,107 71,485,971 67,525,697
NON-GAAP Basic Earnings per Share $0.56 $0.24 $0.89 $0.03
NON-GAAP Diluted Earnings per Share $0.53 $0.23 $0.84 $0.03
[1] Presented above is a reconciliation between GAAP net income and certain non-GAAP financial measures. The non-GAAP measures are based upon our unaudited consolidated statements of operations for the periods shown, with certain adjustments. McDermott is providing the non-GAAP information to supplement the results provided in accordance with GAAP and it should not be considered superior to, or as a substitute for, the comparable GAAP measures. However, McDermott believes certain non-GAAP measures provide meaningful insight into the Company’s ongoing operational performance and therefore uses the non-GAAP information internally to evaluate McDermott’s operations for purposes of budget planning and performance goals. McDermott has chosen to provide this supplemental non-GAAP information to investors to enable them to perform additional comparisons of operating results and as a means to emphasize the results of ongoing operations absent income and expenses considered by management to be outside the Company’s customary business.
Lehman Brothers 2005 CEO Energy / Power Conference September 6, 2005 36
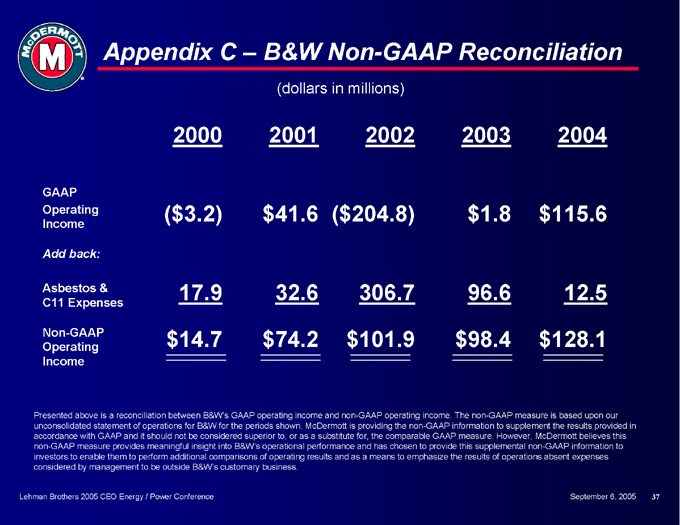
Appendix C – B&W Non-GAAP Reconciliation
(dollars in millions)
2000 2001 2002 2003 2004
GAAP
Operating ($3.2) $41.6 ($204.8) $1.8 $115.6
Income
Add back:
Asbestos & 17.9 32.6 306.7 96.6 12.5
C11 Expenses
Non-GAAP $14.7 $74.2 $101.9 $98.4 $128.1
Operating
Presented above is a reconciliation between B&W’s GAAP operating income and non-GAAP operating income. The non-GAAP measure is based upon our unconsolidated statement of operations for B&W for the periods shown. McDermott is providing the non-GAAP information to supplement the results provided in accordance with GAAP and it should not be considered superior to, or as a substitute for, the comparable GAAP measure. However, McDermott believes this non-GAAP measure provides meaningful insight into B&W’s operational performance and has chosen to provide this supplemental non-GAAP information to investors to enable them to perform additional comparisons of operating results and as a means to emphasize the results of operations absent expenses considered by management to be outside B&W’s customary business.
Lehman Brothers 2005 CEO Energy / Power Conference September 6, 2005 37