Exhibit 99.1

Unified Commerce Cloud Platform January 2022
Forward-Looking Statements.This presentation contains "forward-looking statements" within the meaning of Section 21E of the Securities Exchange Act of 1934, as amended, Section 27A of the Securities Act of 1933, as amended, and the Private Securities Litigation Reform Act of 1995. Forward-looking statements are not historical in nature, but rather are predictive of our future operations, financial condition, business strategies and prospects. Forward-looking statements are generally identified by words such as "anticipate," "believe," "belief," "continue," "could," "expect," "estimate," "intend," "may," "opportunity," "plan," "should," "will," "would," "will likely result," and similar expressions. Forward-looking statements are based on management’s current expectations and assumptions that are subject to a variety of risks and uncertainties, many of which are beyond our control, which could cause our actual results to differ materially from those expressed in or implied by forward-looking statements contained in this presentation, including forward-looking statements relating to and our expectations regarding the Punchh business and anticipated benefits of our acquisition and the impact of COVID-19 on our business, financial condition and results of operations. Factors that could cause our actual results to differ materially from those expressed in or implied by forward-looking statements contained in this presentation are described in our filings with the Securities and Exchange Commission.Industry and Market Data.Market, industry, and other data included in this presentation are from or based on our internal estimates and research, as well as publicly available information about our competitors, industry and general publications and research, surveys and studies conducted by third parties. While we believe that the publicly available information about our competitors, publications, research, surveys, and studies that we have used is reliable, we have not independently verified the information from third-party sources. Further, while we believe our internal estimates and research are reliable and market definitions are appropriate, we have not independently verified our internal estimates, research or market definitions. 2 Key Performance Indicators and Non-GAAP Financial Measures.(1)We monitor certain operating data and non-GAAP financial measures in the evaluation and management of our business; certain key operating data and non-GAAP financial measures have been provided as we believe these to be useful in facilitating period-to-period comparisons of our business performance. Operating data and non-GAAP financial measures do not reflect and should be viewed independently of our financial performance determined in accordance with GAAP. Operating data and non-GAAP financial measures are not forecasts or indicators of future or expected results and should not have undue reliance placed upon them by investors. Where non-GAAP financial measures are included in this presentation, the most directly comparable GAAP financial measures and a detailed reconciliation between GAAP and non-GAAP financial measures is included in the Appendix to this presentation. Unless otherwise indicated, financial and operating data included in this presentation is as of September 30, 2021Trademarks.“PAR,” “Brink POS®,” “Restaurant Magic®”, “Data Central®”, and “Punchh®” are trademarks of PAR Technology Corporation. This presentation may contain trade names and trademarks of other companies. Our reference to such other companies is not intended to imply any endorsement or sponsorship by these companies of PAR Technology Corporation or its products or services. (1) See Appendix for non-GAAP reconciliations and certain definitions.

3 To enable personalized experiences that connect people to the brands, meals, and moments they love. OUR MISSION

Nothingin between. TM Food. People.

A little about us… TM
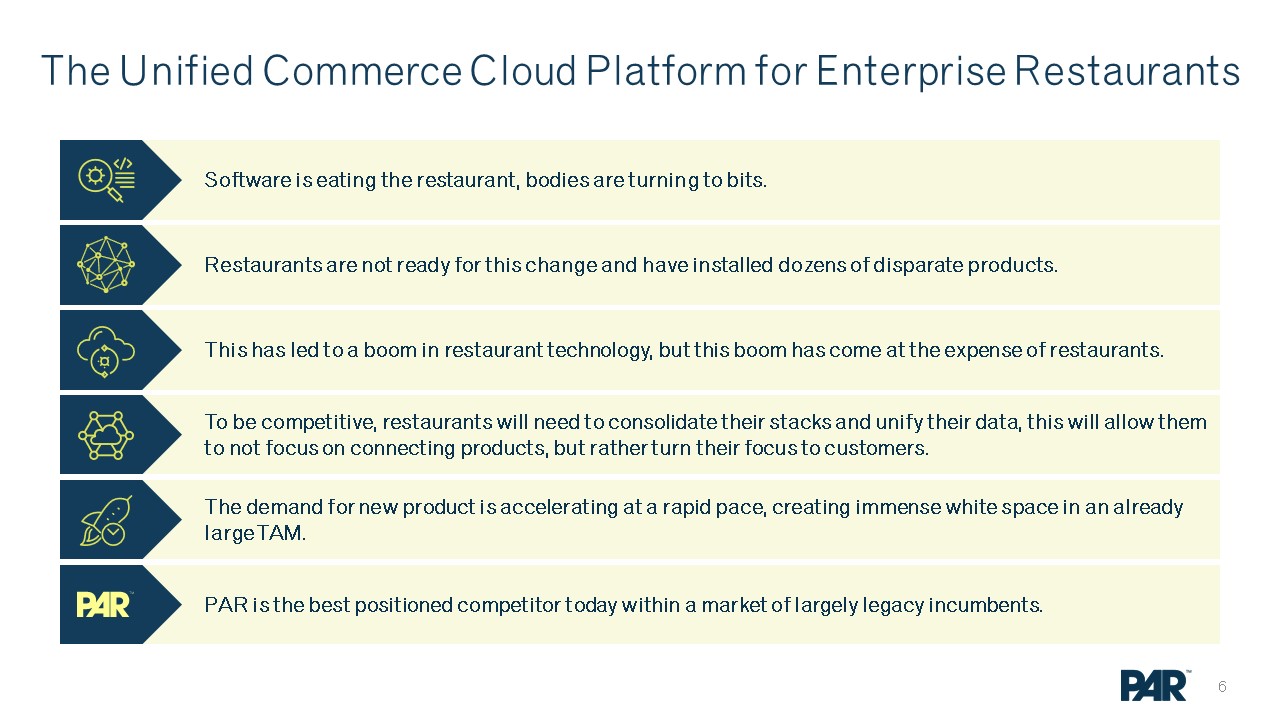
The Unified Commerce Cloud Platform for Enterprise Restaurants Software is eating the restaurant, bodies are turning to bits. Restaurants are not ready for this change and have installed dozens of disparate products. This has led to a boom in restaurant technology, but this boom has come at the expense of restaurants. To be competitive, restaurants will need to consolidate their stacks and unify their data, this will allow them to not focus on connecting products, but rather turn their focus to customers. The demand for new product is accelerating at a rapid pace, creating immense white space in an already large TAM. PAR is the best positioned competitor today within a market of largely legacy incumbents.
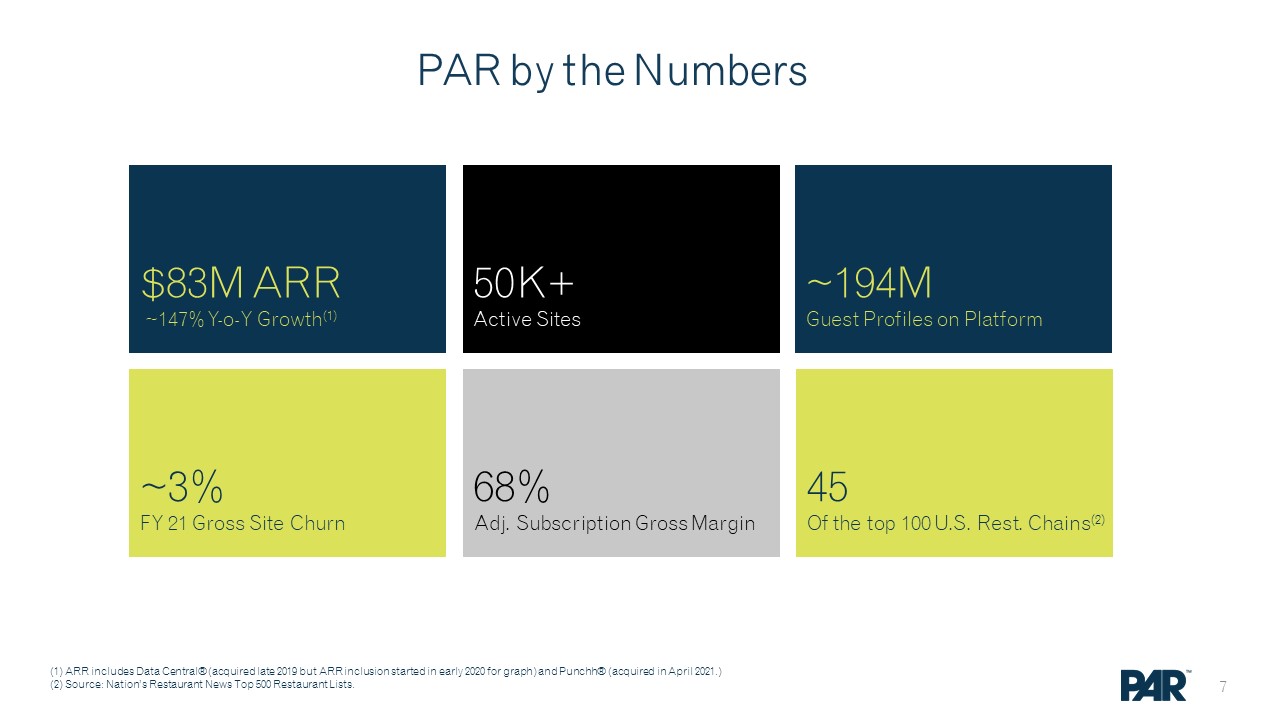
PAR by the Numbers (1) ARR includes Data Central® (acquired late 2019 but ARR inclusion started in early 2020 for graph) and Punchh® (acquired in April 2021.)(2) Source: Nation’s Restaurant News Top 500 Restaurant Lists. $83M ARR ~147% Y-o-Y Growth(1) 50K+Active Sites 45Of the top 100 U.S. Rest. Chains(2) 68%Adj. Subscription Gross Margin ~3%FY 21 Gross Site Churn ~194MGuest Profiles on Platform
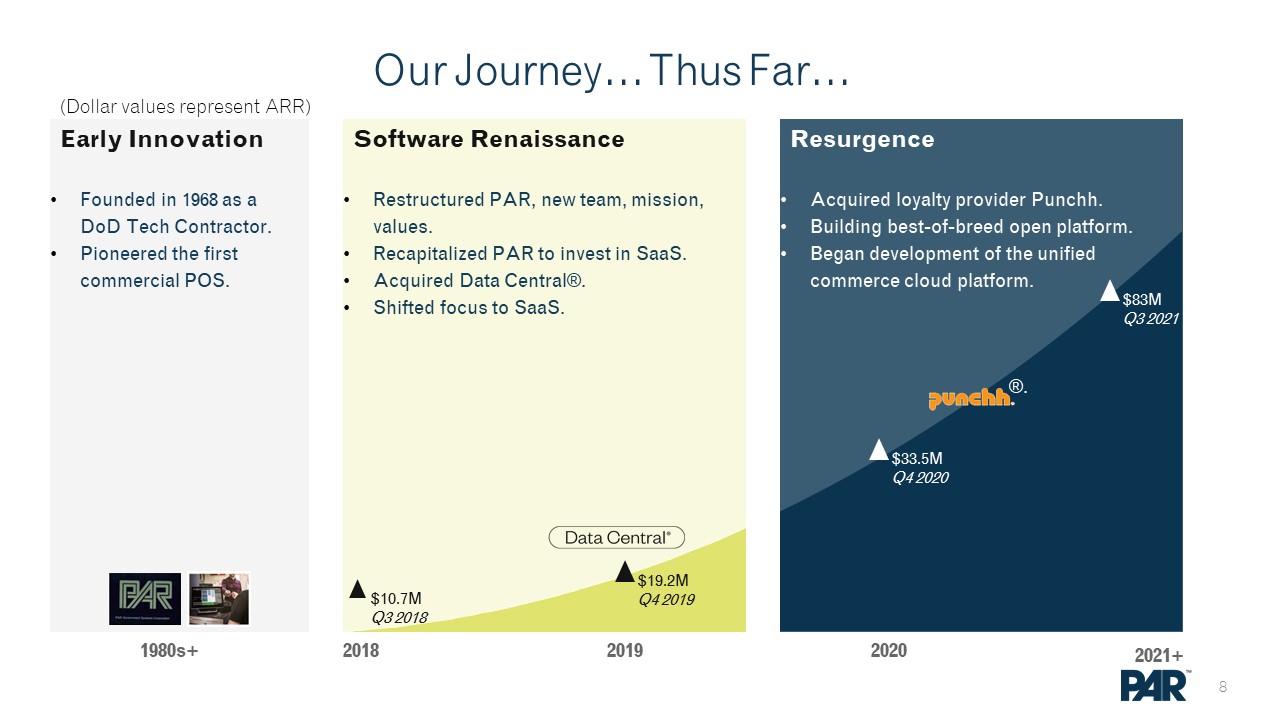
Software Renaissance Our Journey… Thus Far… Early Innovation 1980s+ 2019 2021+ Restructured PAR, new team, mission, values.Recapitalized PAR to invest in SaaS.Acquired Data Central®.Shifted focus to SaaS. Founded in 1968 as a DoD Tech Contractor.Pioneered the first commercial POS. 2020 Resurgence Acquired loyalty provider Punchh.Building best-of-breed open platform.Began development of the unified commerce cloud platform. 2018 $10.7MQ3 2018 $19.2MQ4 2019 $33.5MQ4 2020 $83MQ3 2021 ®. (Dollar values represent ARR)
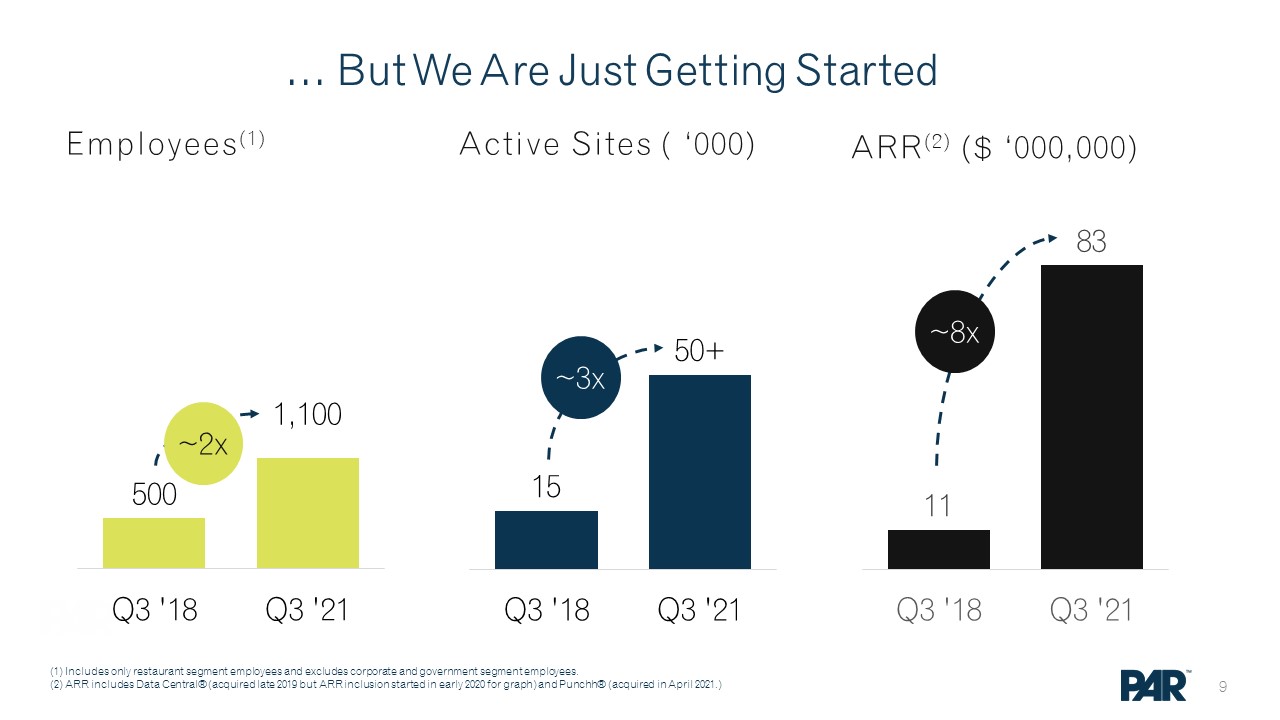
… But We Are Just Getting Started (1) Includes only restaurant segment employees and excludes corporate and government segment employees.(2) ARR includes Data Central® (acquired late 2019 but ARR inclusion started in early 2020 for graph) and Punchh® (acquired in April 2021.) ~3x ~8x ~2x ARR(2) ($ ‘000,000) Active Sites ( ‘000) Employees(1)


What we’re building TM
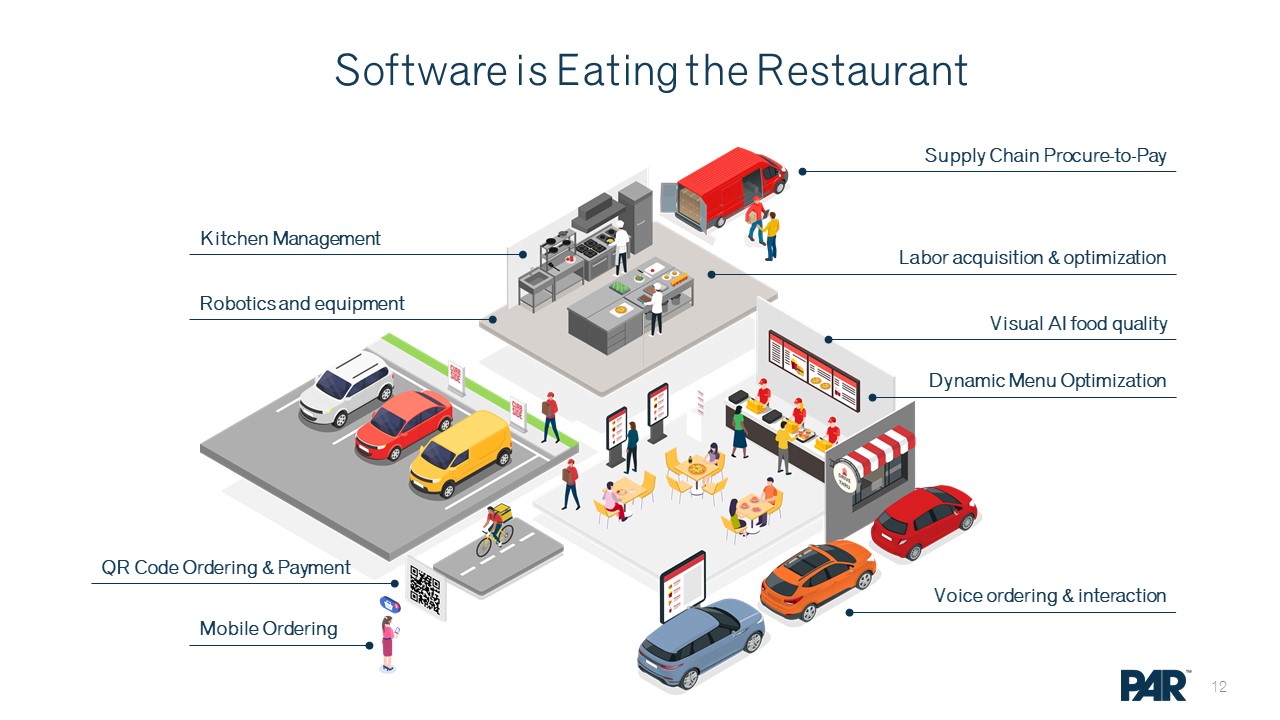
Software is Eating the Restaurant Kitchen Management Voice ordering & interaction Mobile Ordering QR Code Ordering & Payment Labor acquisition & optimization Supply Chain Procure-to-Pay Visual AI food quality Dynamic Menu Optimization Robotics and equipment
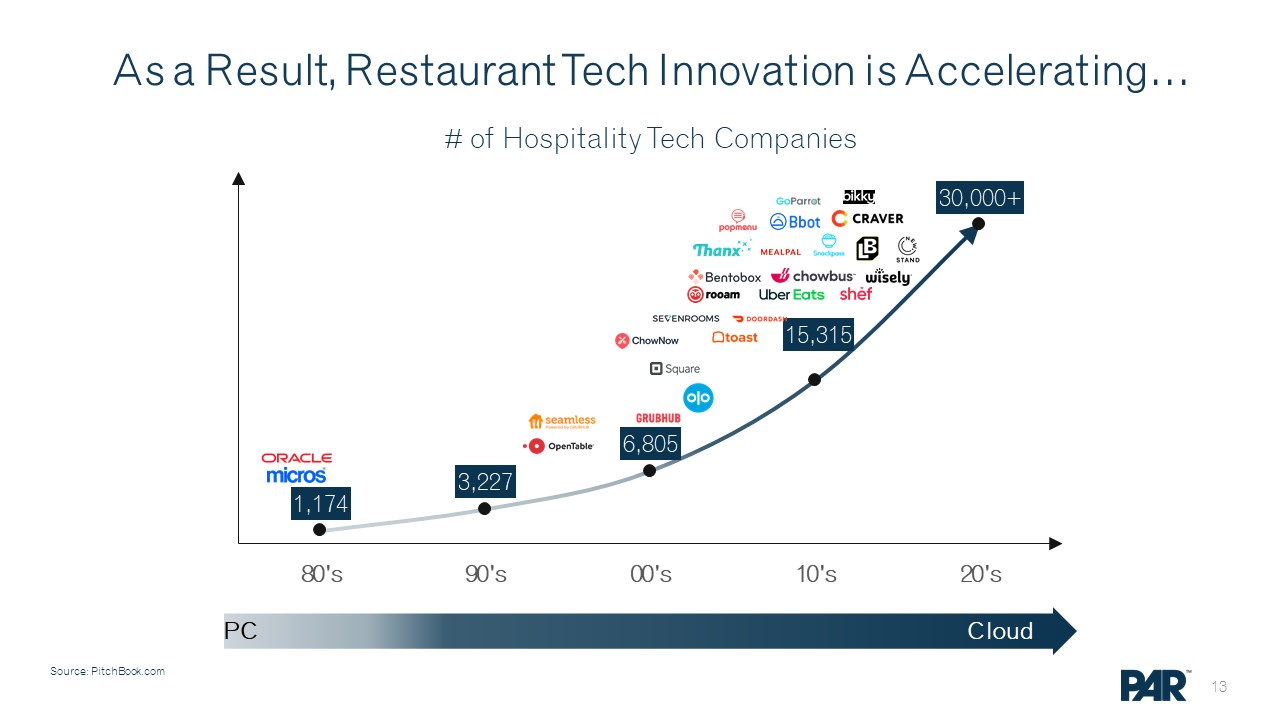
As a Result, Restaurant Tech Innovation is Accelerating… PC Cloud Source: PitchBook.com
Unified Commerce Cloud Platform January 2022
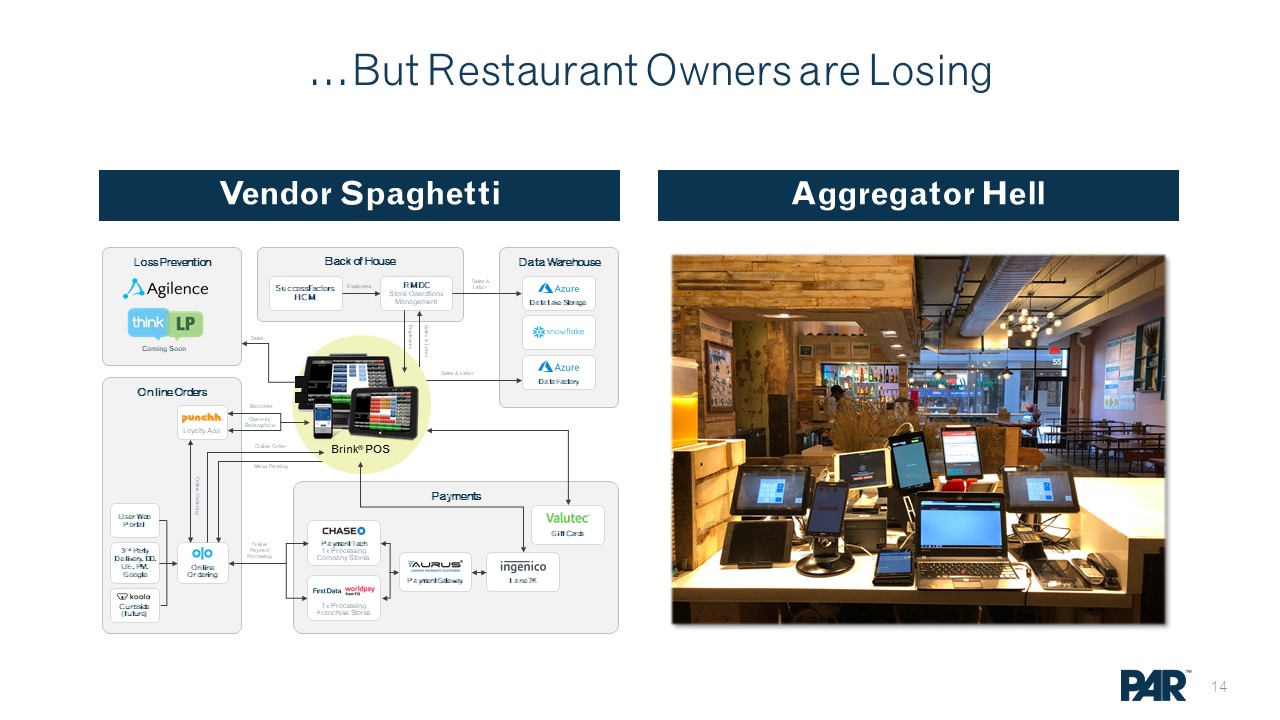
Aggregator Hell Vendor Spaghetti …But Restaurant Owners are Losing Back of House RMDCStore Operations Management SuccessFactors HCM Data Warehouse Data Factory Data Lake Storage Loss Prevention Coming Soon Payments Brink® POS Payment TechTx ProcessingCompany Stores Tx ProcessingFranchise Stores Payment Gateway Lane 7K Gift Cards Online Orders User Web Portal Loyalty App 3rd Party Delivery, DD, UE, PM. Google Curbside (future) Online Ordering Employees Sales & Labor Sales & Labor Sales & Labor Employees Online Ordering Online Payment Processing Online Order Menu Pending Barcodes Check-In/Redemptions Sales
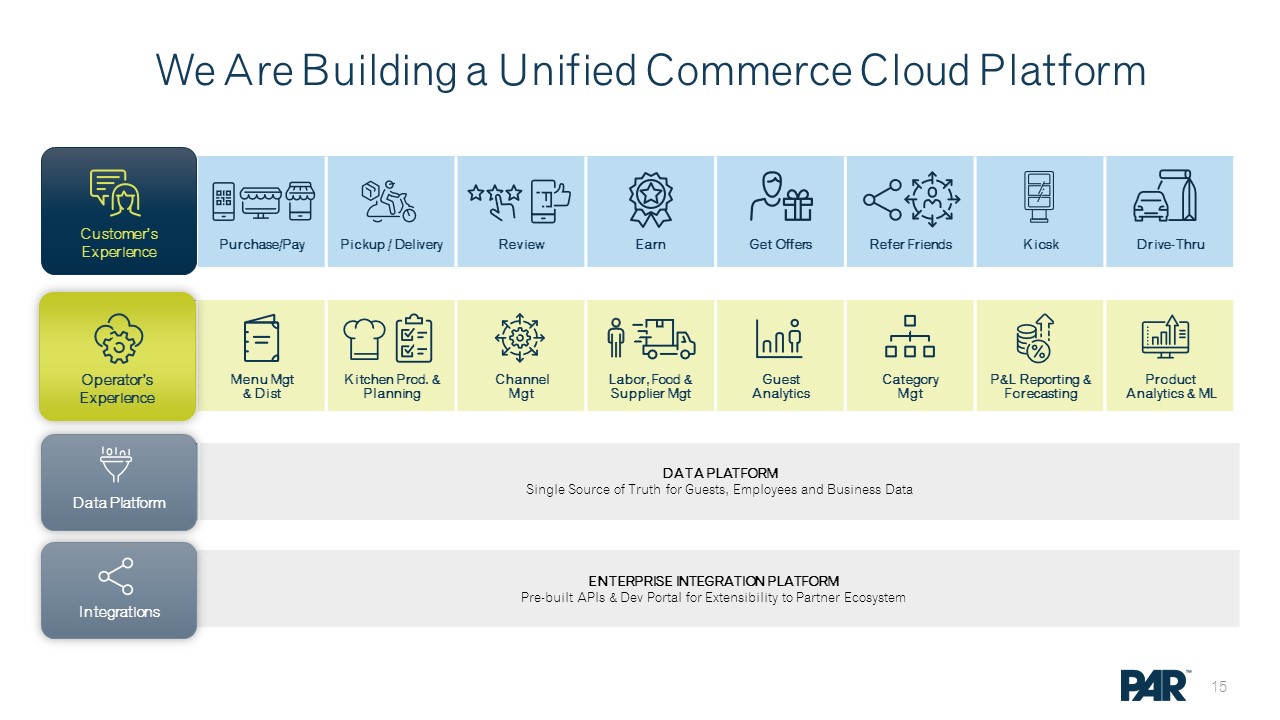
We Are Building a Unified Commerce Cloud Platform Data Management DATA PLATFORMSingle Source of Truth for Guests, Employees and Business Data Integrations ENTERPRISE INTEGRATION PLATFORMPre-built APIs & Dev Portal for Extensibility to Partner Ecosystem Operations Menu Mgt & Dist Kitchen Prod. & Planning Channel Mgt Labor, Food & Supplier Mgt Guest Analytics Category Mgt P&L Reporting & Forecasting Product Analytics & ML Operator’sExperience Data Platform Operations Purchase/Pay Pickup / Delivery Review Earn Get Offers Refer Friends Kiosk Drive-Thru Customer’s Experience Integrations
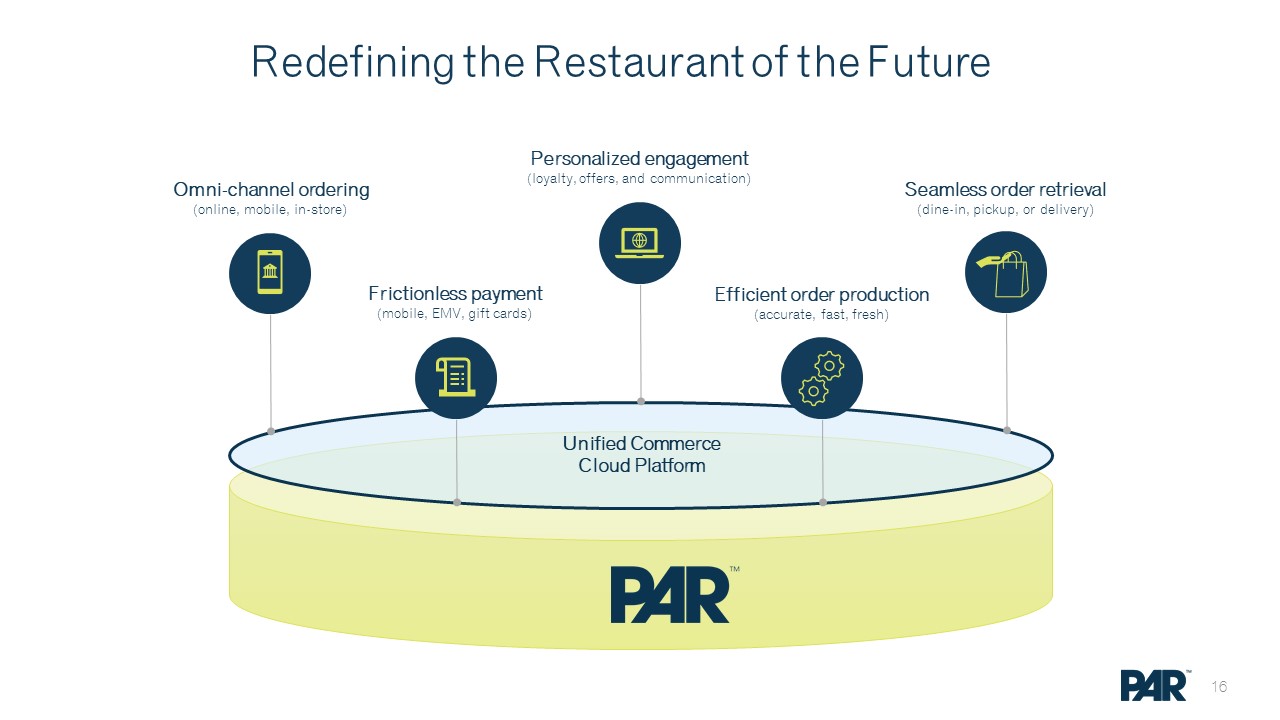
Redefining the Restaurant of the Future Omni-channel ordering (online, mobile, in-store) Personalized engagement(loyalty, offers, and communication) Seamless order retrieval(dine-in, pickup, or delivery) Frictionless payment(mobile, EMV, gift cards) Efficient order production(accurate, fast, fresh) Unified Commerce Cloud Platform 16
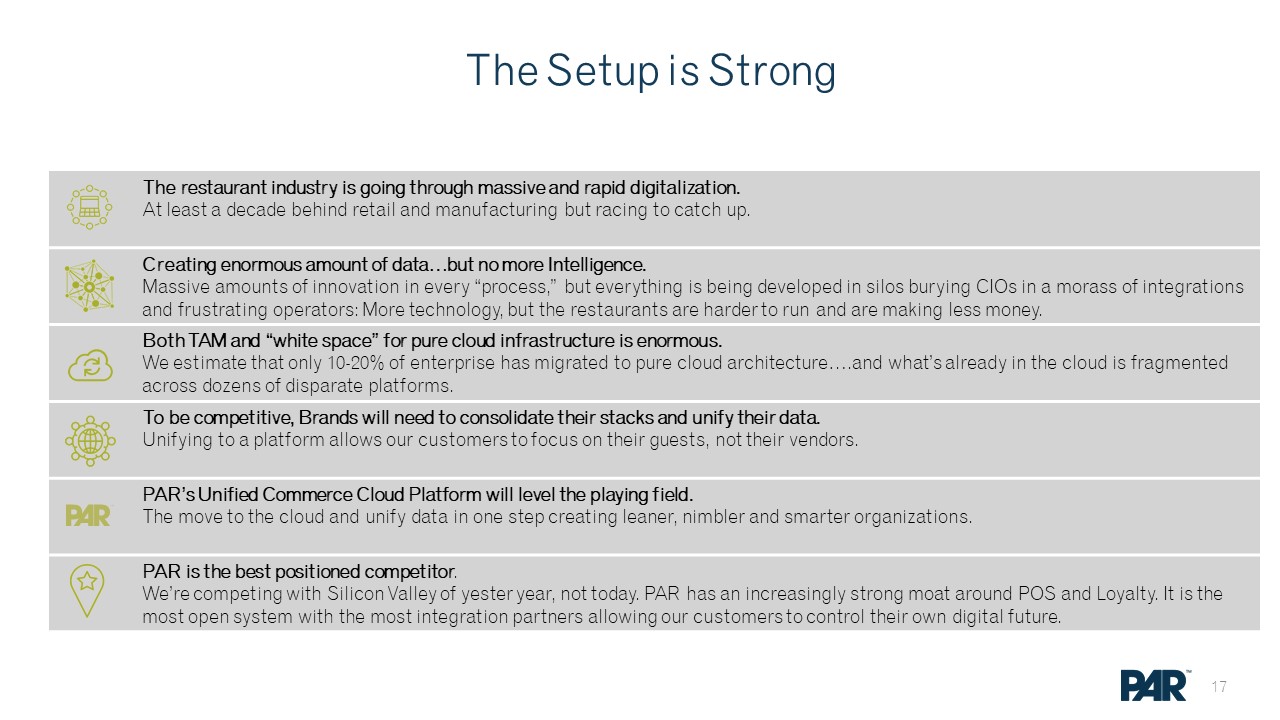
The Setup is Strong The restaurant industry is going through massive and rapid digitalization.At least a decade behind retail and manufacturing but racing to catch up. Creating enormous amount of data…but no more Intelligence.Massive amounts of innovation in every “process,” but everything is being developed in silos burying CIOs in a morass of integrations and frustrating operators: More technology, but the restaurants are harder to run and are making less money. Both TAM and “white space” for pure cloud infrastructure is enormous.We estimate that only 10-20% of enterprise has migrated to pure cloud architecture….and what’s already in the cloud is fragmented across dozens of disparate platforms. To be competitive, Brands will need to consolidate their stacks and unify their data. Unifying to a platform allows our customers to focus on their guests, not their vendors. PAR’s Unified Commerce Cloud Platform will level the playing field.The move to the cloud and unify data in one step creating leaner, nimbler and smarter organizations. PAR is the best positioned competitor.We’re competing with Silicon Valley of yester year, not today. PAR has an increasingly strong moat around POS and Loyalty. It is the most open system with the most integration partners allowing our customers to control their own digital future.

Our Financials TM

Investment Highlight Massive Total Addressable Market Large, growing TAM In restaurants with ~1M locations in the U.S. spending 2 – 3% of revenue(1) on technology. This TAM will continue to grow. Macro Factors Catalyzing Technology Adoption Consumer preference of accessible, digital-first experience; increased operational complexity increasing costs while hindering scale. Strong Execution PAR has demonstrated an ability to grow ARPU both organically and inorganically. Compelling Financial Profile and Growth Vector ARR has grown at a ~79% CAGR’ (’18 – Q3’21) while expanding Adjusted Subscription Gross Margin to 68% in Q3 ’21. 2 1 3 4 (1) Source: Hospitality Technology Study 2021.
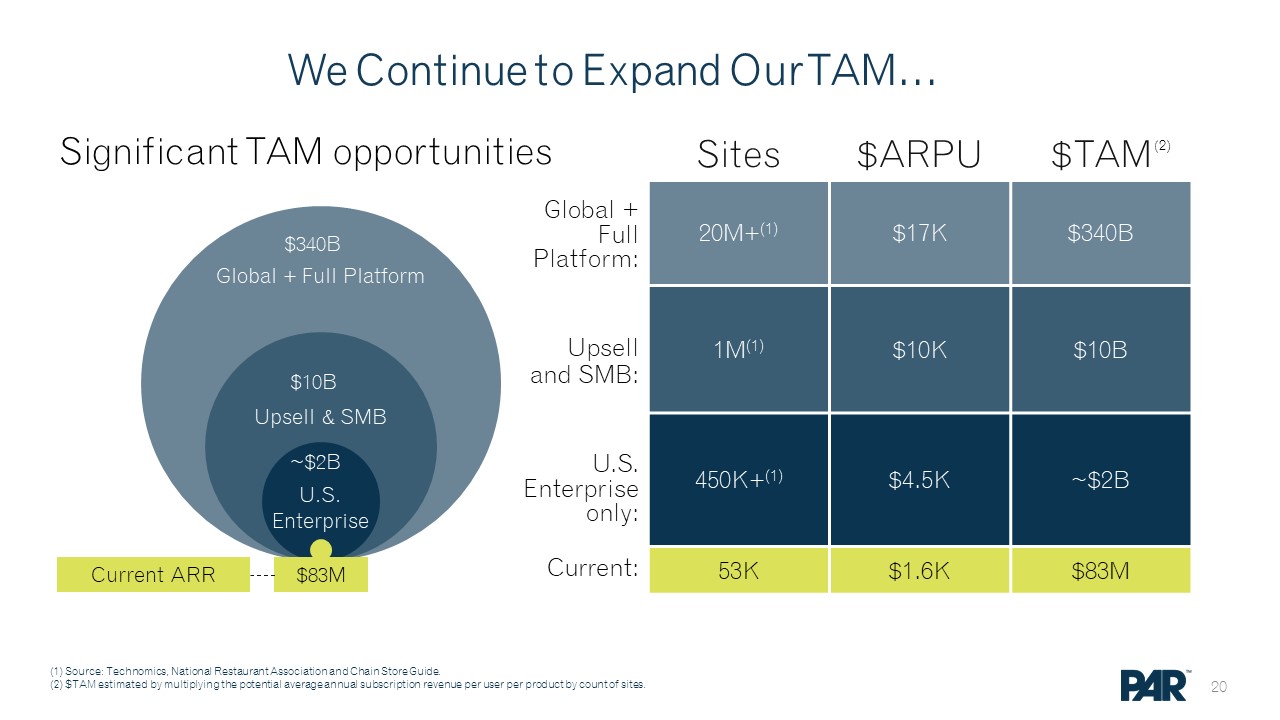
We Continue to Expand Our TAM… Significant TAM opportunities ~$2B $10B $340B $83M U.S. Enterprise Upsell & SMB Global + Full Platform Sites $ARPU $TAM 20M+(1) $17K $340B 1M(1) $10K $10B 450K+(1) $4.5K ~$2B 53K $1.6K $83M Current ARR Current: U.S. Enterprise only: Global + Full Platform: Upsell and SMB: (1) Source: Technomics, National Restaurant Association and Chain Store Guide.(2) $TAM estimated by multiplying the potential average annual subscription revenue per user per product by count of sites. (2)
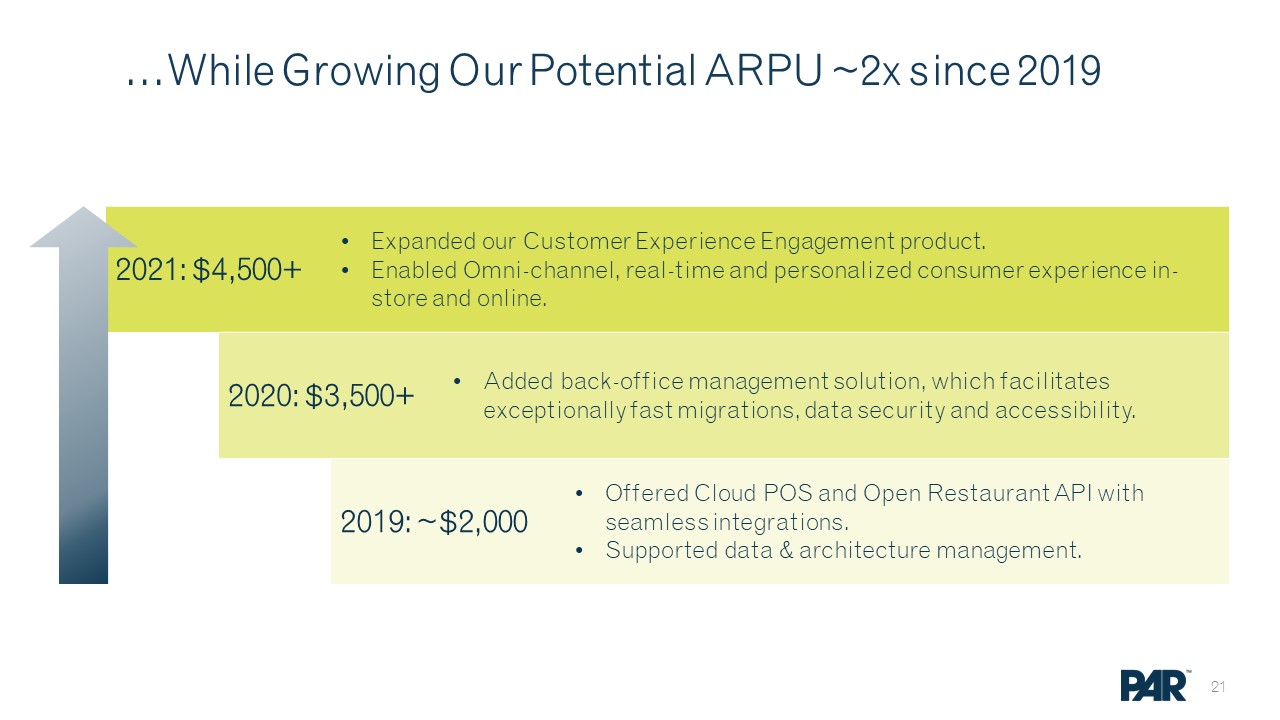
…While Growing Our Potential ARPU ~2x since 2019 2021: $4,500+ Expanded our Customer Experience Engagement product.Enabled Omni-channel, real-time and personalized consumer experience in-store and online. 2020: $3,500+ Added back-office management solution, which facilitates exceptionally fast migrations, data security and accessibility. 2019: ~$2,000 Offered Cloud POS and Open Restaurant API with seamless integrations.Supported data & architecture management.
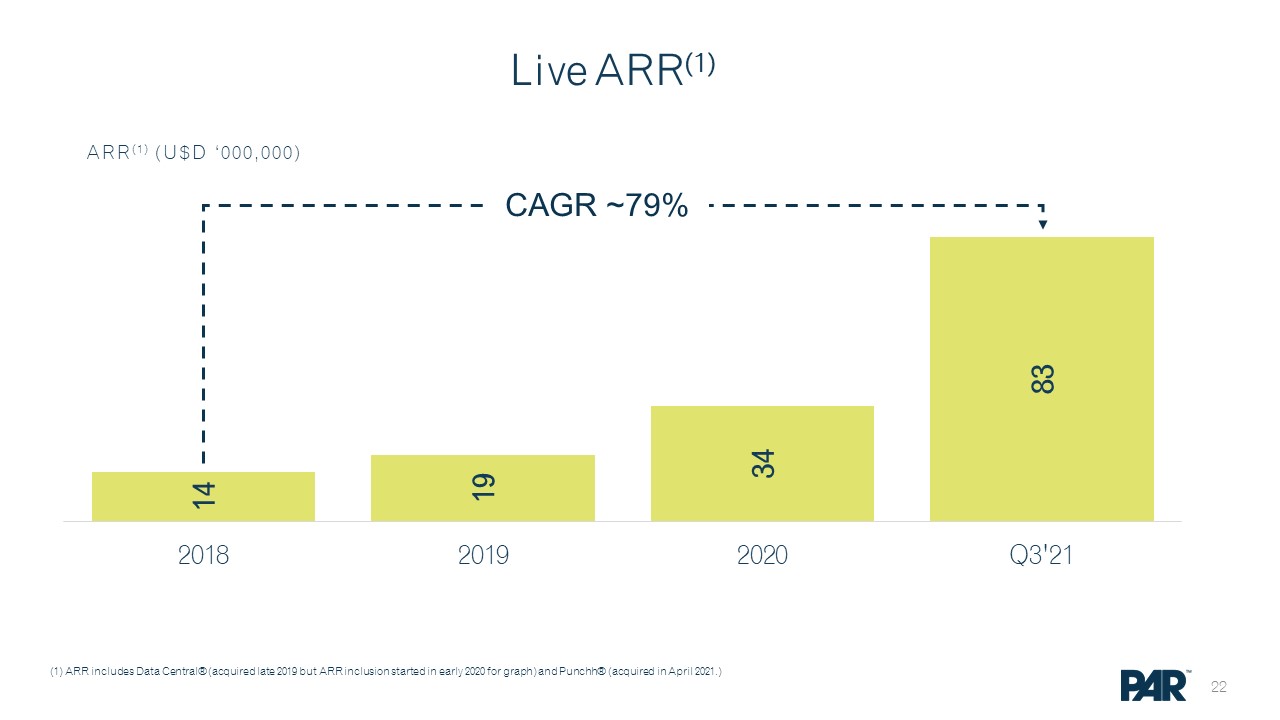
Live ARR(1) ARR(1) (U$D ‘000,000) (1) ARR includes Data Central® (acquired late 2019 but ARR inclusion started in early 2020 for graph) and Punchh® (acquired in April 2021.) CAGR ~79%
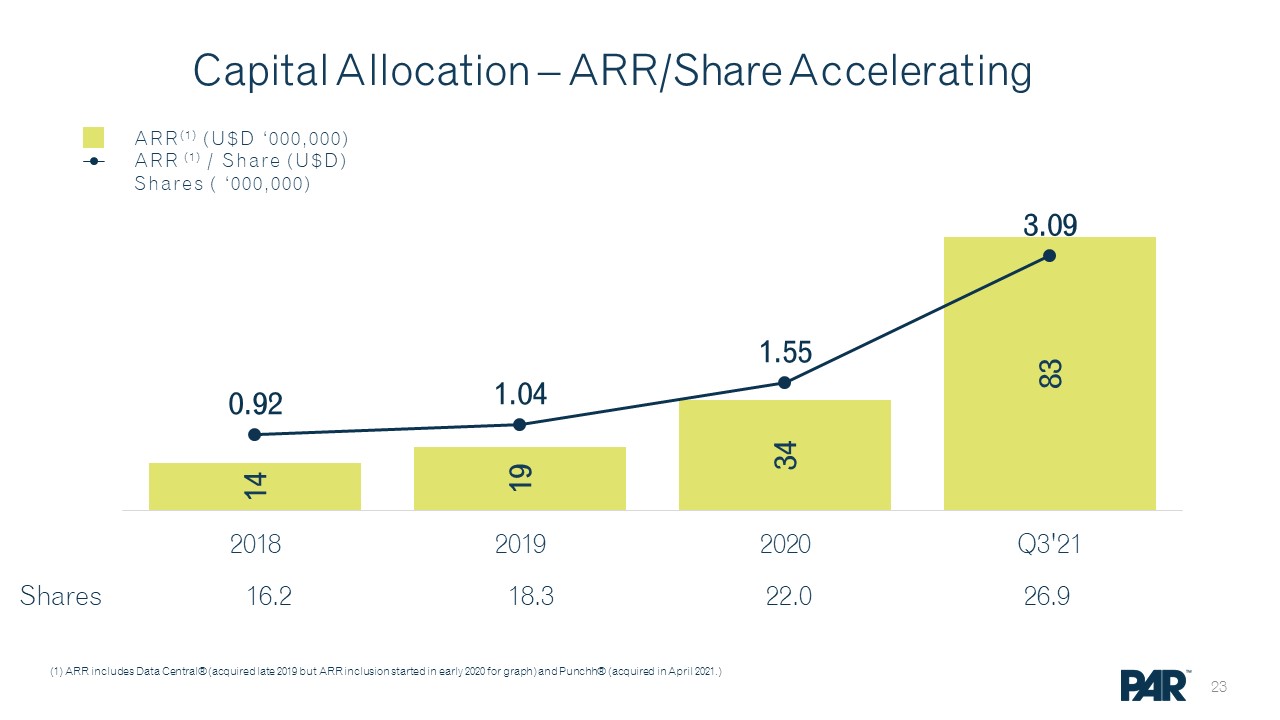
Capital Allocation – ARR/Share Accelerating ARR(1) (U$D ‘000,000)ARR (1) / Share (U$D)Shares ( ‘000,000) Shares 16.2 18.3 22.0 26.9 (1) ARR includes Data Central® (acquired late 2019 but ARR inclusion started in early 2020 for graph) and Punchh® (acquired in April 2021.)

Adjusted Subscription Gross Margin(1) Expanding (1) Subscription Margins were $6.4M 2018, $10.5M 2019, $15M 2020, and $48.3 Q3 2021 Annualized.(2) Adjusted Subscription Gross Margin excludes amortization of intangibles of both internally developed and acquired technologies. See Appendix for non-GAAP reconciliation.(3) 2020 Gross Margin impacted due to one-time COVID waiver and COGS. Adjusted Subscription Gross Margins(1)(2) (%) (3)

Operating Leverage (1) Gross R&D excludes Capitalization.(2) ARR includes Data Central® (acquired late 2019 but ARR inclusion started in early 2020 for graph) and Punchh® (acquired in April 2021.)(3) See Appendix for non-GAAP reconciliations.(4) Q3’21 R&D and S&M OpEx were annualized based on Q3 actuals. Research & Development(1) and Sales & Marketing (% of ARR(2))(3) Research & Development Sales & Marketing (4)

Appendix
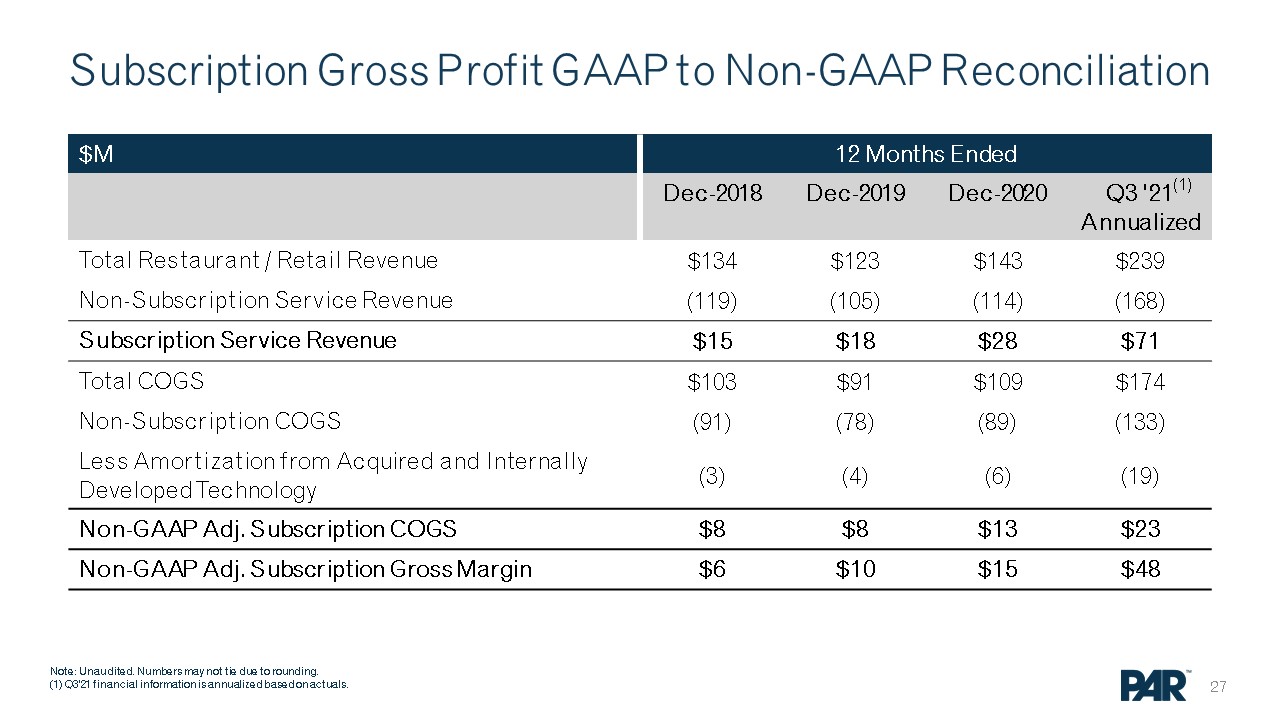
Subscription Gross Profit GAAP to Non-GAAP Reconciliation $M 12 Months Ended Dec-2018 Dec-2019 Dec-2020 Q3 ’21 Annualized Total Restaurant / Retail Revenue $134 $123 $143 $239 Non-Subscription Service Revenue (119) (105) (114) (168) Subscription Service Revenue $15 $18 $28 $71 Total COGS $103 $91 $109 $174 Non-Subscription COGS (91) (78) (89) (133) Less Amortization from Acquired and Internally Developed Technology (3) (4) (6) (19) Non-GAAP Adj. Subscription COGS $8 $8 $13 $23 Non-GAAP Adj. Subscription Gross Margin $6 $10 $15 $48 Note: Unaudited. Numbers may not tie due to rounding.(1) Q3'21 financial information is annualized based on actuals. (1)

R&D Operating Expense GAAP to Non-GAAP Reconciliation $M 12 Months Ended Dec-2018 Dec-2019 Dec-2020 Q3 ’21 Annualized Net R&D $12 $13 $19 $40 Less Hardware R&D (3) (3) (4) (6) Net Subscription R&D $10 $11 $16 $34 Plus Adjustment for Capitalized Software 4 4 7 4 Non-GAAP Gross Subscription R&D $14 $15 $23 $38 Note: Unaudited. Numbers may not tie due to rounding.(1) Q3’21 R&D OpEx were annualized based on Q3 actuals. (1)

S&M Operating Expense GAAP to Non-GAAP Reconciliation $M 12 Months Ended Dec-2018 Dec-2019 Dec-2020 Q3 ’21 Annualized Total S&M $14 $13 $14 $27 Less Non-Subscription S&M (1) (1) (1) (2) Non-GAAP Subscription S&M $13 $12 $12 $25 Note: Unaudited. Numbers may not tie due to rounding.(1) Q3’21 S&M OpEx were annualized based on Q3 actuals. (1)
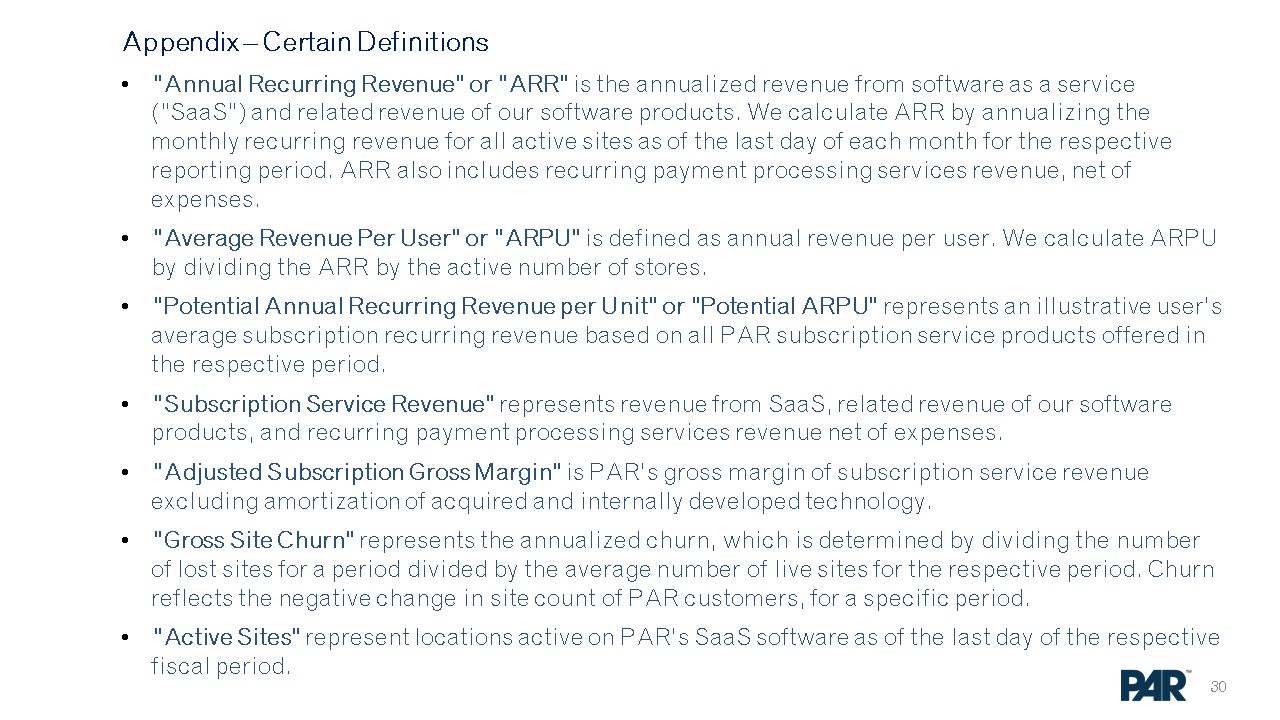
Appendix – Certain Definitions“Annual Recurring Revenue” or “ARR” is the annualized revenue from software as a service (“SaaS”) and related revenue of our software products. We calculate ARR by annualizing the monthly recurring revenue for all active sites as of the last day of each month for the respective reporting period. ARR also includes recurring payment processing services revenue, net of expenses.“Average Revenue Per User” or “ARPU” is defined as annual revenue per user. We calculate ARPU by dividing the ARR by the active number of stores.“Potential Annual Recurring Revenue per Unit” or “Potential ARPU” represents an illustrative user’s average subscription recurring revenue based on all PAR subscription service products offered in the respective period.“Subscription Service Revenue” represents revenue from SaaS, related revenue of our software products, and recurring payment processing services revenue net of expenses.“Adjusted Subscription Gross Margin” is PAR’s gross margin of subscription service revenue excluding amortization of acquired and internally developed technology.“Gross Site Churn” represents the annualized churn, which is determined by dividing the number of lost sites for a period divided by the average number of live sites for the respective period. Churn reflects the negative change in site count of PAR customers, for a specific period.“Active Sites” represent locations active on PAR’s SaaS software as of the last day of the respective fiscal period.
Appendix – Certain Definitions“Annual Recurring Revenue” or “ARR” is the annualized revenue from SaaS and related revenue of our software products. We calculate ARR by annualizing the monthly recurring revenue for all active sites as of the last day of each month for the respective reporting period. ARR also includes recurring payment processing services revenue, net of expenses.“Average Revenue Per User” or “ARPU” is defined as annual revenue per user. We calculate ARPU by dividing the ARR by the active number of stores“Potential Annual Recurring Revenue per Unit” or “Potential ARPU” represents an illustrative user’s average subscription recurring revenue based on all PAR subscription service products offered in the respective period.“Subscription Service Revenue” represents revenue from subscription as a service (SaaS), related revenue of our software products, and recurring payment processing services revenue net of expenses.“Adjusted Subscription Gross Margin” is PAR’s gross margin of subscription service revenue excluding amortization of acquired and internally developed technology.“Gross Site Churn” represents the annualized churn, which is determined by dividing the number of lost sites for a period divided by the average number of live sites for the respective period. Churn reflects the negative change in site count of PAR customers, for a specific period.“Active Sites” represent locations active on PAR’s SaaS software as of the last day of the respective fiscal period.