First Citizens Bancorporation (FCBN) Inactive
Filed: 29 Nov 05, 12:00am
Exhibit 2
CONFIDENTIAL
Fairness Review
For First Citizens Bancorporation, Inc.
September 2, 2005
Gary S. Penrose Managing Director 804-213-4301 gary.penrose@ryanbeck.com

Private and Confidential
The attached materials have been compiled and prepared by Ryan Beck & Co., Inc. solely for the use and information of the board of directors and management of First Citizens Bancorporation, Inc. Such materials are not intended for viewing by any other person or party for any purpose, and no such review should be undertaken without the prior written consent of Ryan Beck & Co., Inc. through one or more of its authorized officers.
Portions of the information contained herein are not publicly available and are not intended for public dissemination. The public disclosure or personal use of such information may be actionable under applicable federal and/or state securities laws.
Table of Contents
1. Transaction Summary
2. First Citizens Bancorporation, Inc. Overview
3. Valuation of First Citizens Bancorporation, Inc.
Discounted Cash Flow Analysis Peer Group Comparison
4. Premium Valuation
5. Repurchase Analysis
6. Conclusion
7. Ryan Beck Relationship
Page 3
Tab 1
Transaction Summary
Transaction Summary
First Citizens Bancorporation, Inc. (“First Citizens” or the “Company”) has engaged Ryan Beck & Co. to assist it in a possible de-registration from the SEC. As part of this process, Ryan Beck will provide a “fair valuation” for shareholders who will be cashed-out should the Company make the decision to de-register from the SEC.
The Company’s management realizes that its projected tangible equity to assets ratio, after taking into consideration the share buy-back contemplated in this transaction, will be approximately 4.3%. First Citizens is comfortable with this ratio as its business plan has the Company increasing this ratio to above 5.0% in 2006.
This repurchase of shares will be accomplished by using a cash-out merger or a reverse stock split (the “Transaction”).
First Citizens is represented by Powell Goldstein, Atlanta, Georgia, which has been counsel in several “going private” transactions. Ryan Beck is represented by Pitney Hardin.
Page 5
Transaction Summary
De-registering from the SEC will be accomplished by using a cash-out merger or a reverse stock split to reduce the number of current shareholders to below 300.
First Citizens has requested our opinion as investment bankers of the fair value of 30,053 shares, the estimated amount to be repurchased as part of the Transaction, of the Company’s common stock. The estimated number of shares to be redeemed through the Transaction is equal to approximately 3.3% of the total outstanding shares. The consummation of the Transaction will reduce First Citizens’ shareholder base to 200 shareholders, a 79.5% reduction in the number of current shareholders. The Transaction will target shareholders owning less than 167 shares.
The fair value range that we provide is expected to be used by First Citizens’ Board of Directors to support their determination of an offer price for its shareholders that will be cashed-out as a result of the Transaction.
Page 6
Transaction Summary
The Company has a two class common stock structure with 862,505 shares being voting stock and 36,409 being non-voting stock. Since the shares that will be repurchased do not include any of the non-voting stock, Ryan Beck has not assigned a value to those shares.
By factoring in a premium to the estimated current market value of First Citizens’ common stock, we were able to determine a fair value range of $700.00 to $770.00 per share. First Citizens trades on the OTC Bulletin Board. The Company’s common stock has traded approximately 72 shares per day over the last year. The weekly average trading volume represents 0.04% of the Company’s current shares outstanding. We have factored in the most recent market value of $572.00 into our analysis.
Page 7
Transaction Summary
Ryan Beck believes it has followed the court rulings for determining fair value and to arrive at the appropriate repurchase price range. However, courts have not provided a precise formula. It is ultimately the responsibility of the Board of Directors to set the repurchase price.
Ryan Beck has been advised by First Citizens’ counsel that the Company will pay “fair value” as determined under South Carolina law.
“Fair Value” is defined under South Carolina law as:
The value of the shares immediately before the effectuation of the corporate action to which the dissenter objects, excluding any appreciation or depreciation in anticipation of the corporate action unless exclusion would be inequitable. The value of the shares is to be determined by techniques that are accepted generally in the financial community.
Page 8
Transaction Summary
South Carolina case law provides additional guidance regarding the definition of “fair value.” South Carolina courts have explained that “fair value” means the “intrinsic value” of the shares, with the company viewed as an established and ongoing business. Although each transaction must be evaluated on its own facts and circumstances, South Carolina courts have determined that the following three factors should ordinarily be considered and accorded appropriate relative weight in computing stock value:
Net asset value Market value
Earnings or investment value
By determining a fair market value based upon the Comparable Peer Analysis, Ryan Beck eliminated the lack of marketability discount. Additionally, Ryan Beck added a premium to the fair market value of First Citizens common stock to eliminate the minority share discount. The premium was also incorporated in the Discounted Cash Flow Analysis by increasing the terminal value range.
Page 9
Transaction Summary
As part of the valuation process, Ryan Beck has:
Performed due diligence of the Company to identify the Company’s strengths/weaknesses and future prospects.
Discussed with management the financial condition, businesses, assets, earnings and management’s views about the future performance of the Company.
Reviewed certain publicly available financial information, both audited and unaudited, as well as other internally generated financial reports.
Reviewed certain financial forecasts and projections of First Citizens prepared by its management.
Reviewed certain information about the market prices and trading history of the common stock of First Citizens.
Reviewed certain aspects of the financial performance of First Citizens and compared it to similar available financial and stock trading data for a peer group of selected financial institutions.
Page 10
Transaction Summary
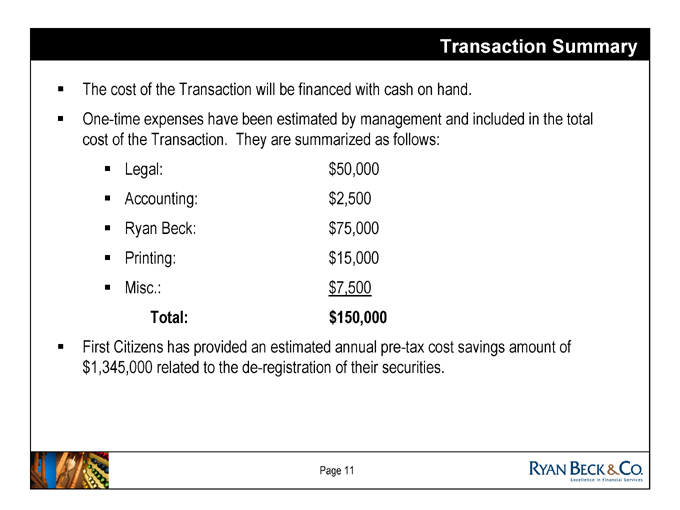
The cost of the Transaction will be financed with cash on hand.
One-time expenses have been estimated by management and included in the total cost of the Transaction. They are summarized as follows:
Legal: |
| $50,000 |
Accounting: |
| $2,500 |
Ryan |
| Beck: $75,000 |
Printing: |
| $15,000 |
Misc.: |
| $7,500 |
Total: |
| $150,000 |
First Citizens has provided an estimated annual pre-tax cost savings amount of $1,345,000 related to the de-registration of their securities.
Page 11

Tab 2
First Citizens Bancorporation, Inc. Overview
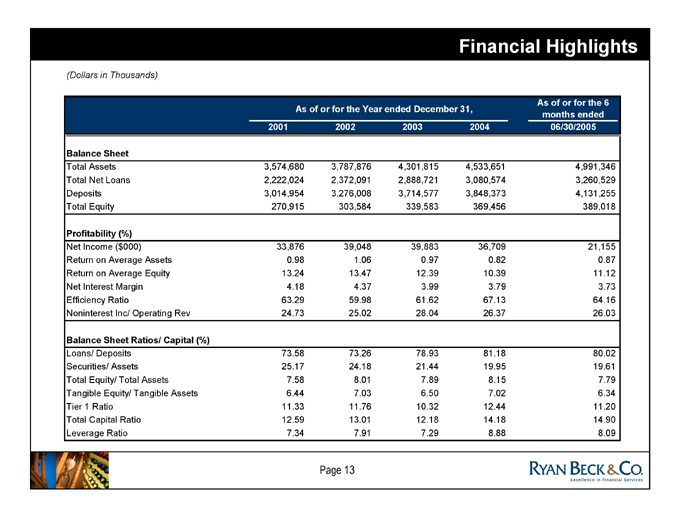
Financial Highlights
(Dollars in Thousands)
As |
| of or for the Year ended December 31, As of or for the 6 months ended |
2001 |
| 2002 2003 2004 06/30/2005 |
Balance |
| Sheet |
Total |
| Assets 3,574,680 3,787,876 4,301,815 4,533,651 4,991,346 |
Total |
| Net Loans 2,222,024 2,372,091 2,888,721 3,080,574 3,260,529 |
Deposits |
| 3,014,954 3,276,008 3,714,577 3,848,373 4,131,255 |
Total |
| Equity 270,915 303,584 339,583 369,456 389,018 |
Profitability |
| (%) |
Net |
| Income ($ 000) 33,876 39,048 39,883 36,709 21,155 |
Return |
| on Average Assets 0.98 1.06 0.97 0.82 0.87 |
Return |
| on Average Equity 13.24 13.47 12.39 10.39 11.12 |
Net |
| Interest Margin 4.18 4.37 3.99 3.79 3.73 |
Efficiency |
| Ratio 63.29 59.98 61.62 67.13 64.16 |
Noninterest |
| Inc/ Operating Rev 24.73 25.02 28.04 26.37 26.03 |
Balance |
| Sheet Ratios/ Capital (%) |
Loans/ |
| Deposits 73.58 73.26 78.93 81.18 80.02 |
Securities/ |
| Assets 25.17 24.18 21.44 19.95 19.61 |
Total |
| Equity/ Total Assets 7.58 8.01 7.89 8.15 7.79 |
Tangible |
| Equity/ Tangible Assets 6.44 7.03 6.50 7.02 6.34 |
Tier |
| 1 Ratio 11.33 11.76 10.32 12.44 11.20 |
Total |
| Capital Ratio 12.59 13.01 12.18 14.18 14.90 |
Leverage |
| Ratio 7.34 7.91 7.29 8.88 8.09 |
Page 13
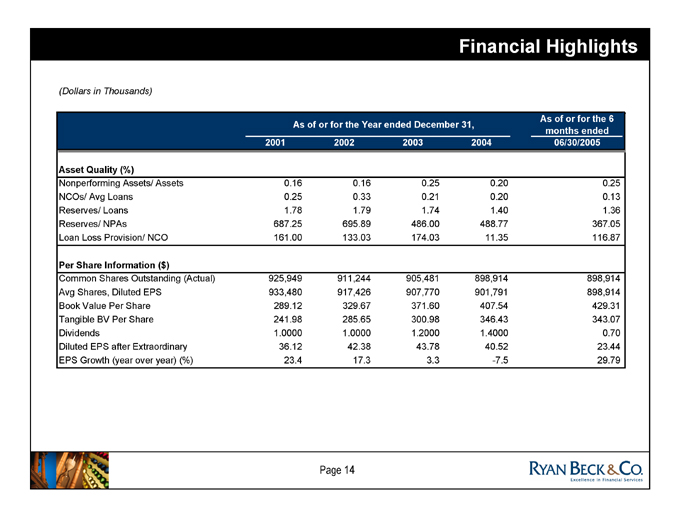
Financial Highlights
(Dollars in Thousands)
As |
| of or for the Year ended December 31, As of or for the 6 months ended |
2001 |
| 2002 2003 2004 06/30/2005 |
Asset |
| Quality (%) |
Nonperforming |
| Assets/ Assets 0.16 0.16 0.25 0.20 0.25 |
NCOs/ |
| Avg Loans 0.25 0.33 0.21 0.20 0.13 |
Reserves/ |
| Loans 1.78 1.79 1.74 1.40 1.36 |
Reserves/ |
| NPAs 687.25 695.89 486.00 488.77 367.05 |
Loan |
| Loss Provision/ NCO 161.00 133.03 174.03 11.35 116.87 |
Per |
| Share Information ($) |
Common |
| Shares Outstanding (Actual) 925,949 911,244 905,481 898,914 898,914 |
Avg |
| Shares, Diluted EPS 933,480 917,426 907,770 901,791 898,914 |
Book |
| Value Per Share 289.12 329.67 371.60 407.54 429.31 |
Tangible |
| BV Per Share 241.98 285.65 300.98 346.43 343.07 |
Dividends |
| 1.0000 1.0000 1.2000 1.4000 0.70 |
Diluted |
| EPS after Extraordinary 36.12 42.38 43.78 40.52 23.44 |
EPS |
| Growth (year over year) (%) 23.4 17.3 3.3 -7.5 29.79 |
Page 14
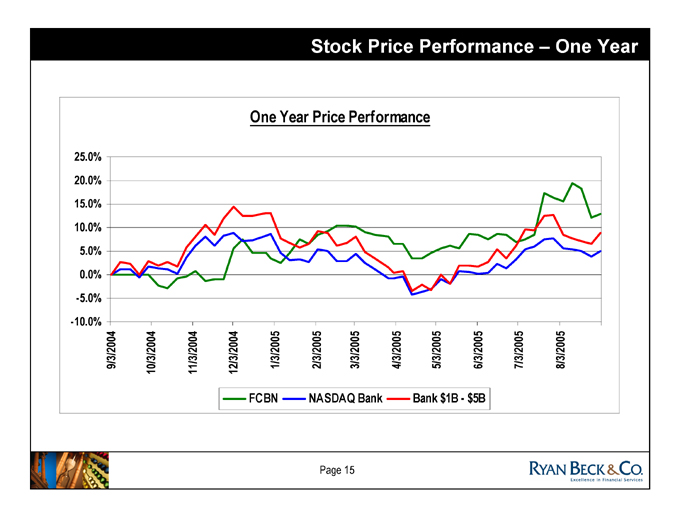
Stock Price Performance – One Year
One Year Price Performance
25.0% 20.0% 15.0% 10.0% 5.0% 0.0% -5.0% -10.0%
9/3/2004 10/3/2004 11/3/2004 12/3/2004 1/3/2005 2/3/2005 3/3/2005 4/3/2005 5/3/2005 6/3/2005 7/3/2005 8/3/2005
FCBN NASDAQ Bank Bank $1B - $5B
Page 15
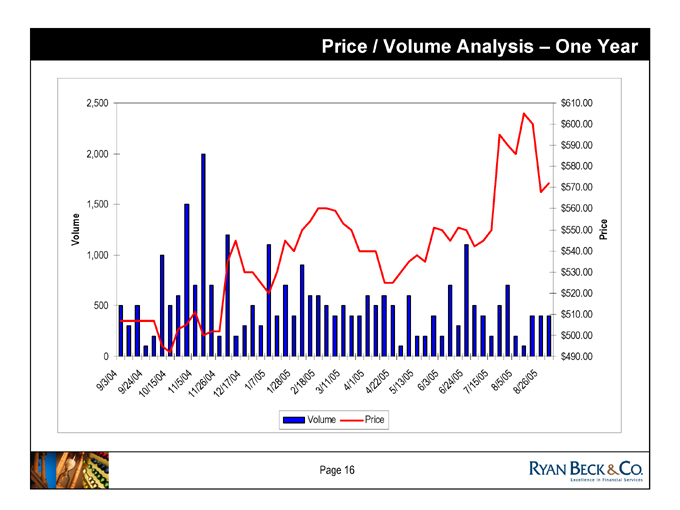
Price / Volume Analysis – One Year
Volume
2,500 2,000 1,500 1,000 500 0
9/3/04 9/24/04 10/15/04 11/5/04 11/26/04 12/17/04 1/7/05 1/28/05 2/18/05 3/11/05 4/1/05 4/22/05 5/13/05 6/3/05 6/24/05 7/15/05 8/5/05 8/26/05
$610.00 $600.00 $590.00 $580.00 $570.00 $560.00 $550.00 $540.00 $530.00 $520.00 $510.00 $500.00 $490.00
Price
Volume Price
Page 16
Tab 3
Valuation of First Citizens Bancorporation, Inc.
Discounted Cash Flow Analysis Peer Group Comparison
Discounted Cash Flow Analysis
Discounted Cash Flow Analysis
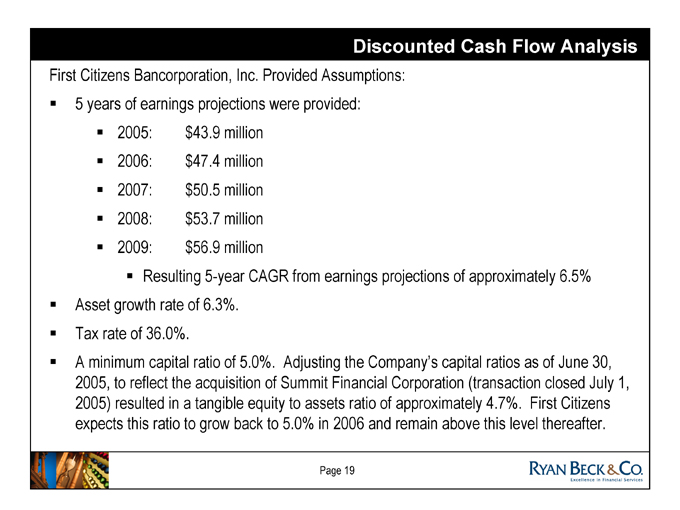
First Citizens Bancorporation, Inc. Provided Assumptions:
5 |
| years of earnings projections were provided: |
2005: |
| $43.9 million |
2006: |
| $47.4 million |
2007: |
| $50.5 million |
2008: |
| $53.7 million |
2009: |
| $56.9 million |
Resulting 5-year CAGR from earnings projections of approximately 6.5%
Asset growth rate of 6.3%. Tax rate of 36.0%.
A minimum capital ratio of 5.0%. Adjusting the Company’s capital ratios as of June 30, 2005, to reflect the acquisition of Summit Financial Corporation (transaction closed July 1, 2005) resulted in a tangible equity to assets ratio of approximately 4.7%. First Citizens expects this ratio to grow back to 5.0% in 2006 and remain above this level thereafter.
Page 19
Discounted Cash Flow Analysis
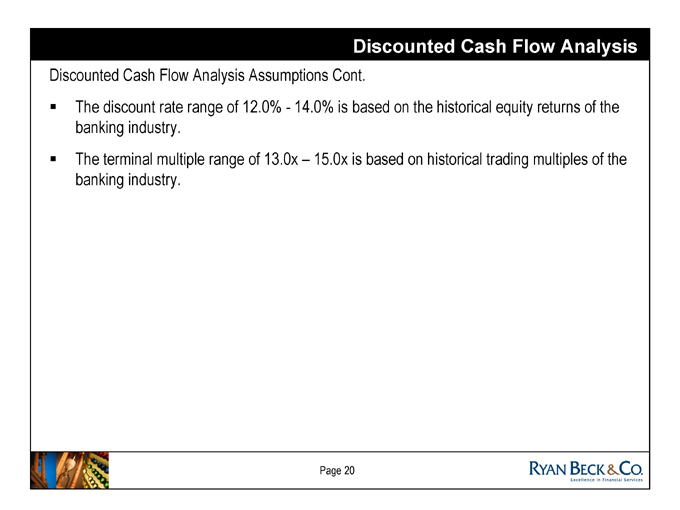
Discounted Cash Flow Analysis Assumptions Cont.
The discount rate range of 12.0% - 14.0% is based on the historical equity returns of the banking industry.
The terminal multiple range of 13.0x – 15.0x is based on historical trading multiples of the banking industry.
Page 20
Discounted Cash Flow Analysis
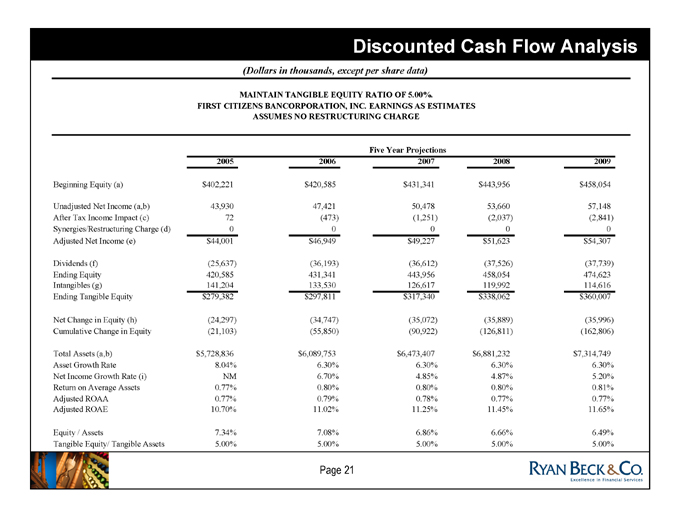
(Dollars in thousands, except per share data)
MAINTAIN TANGIBLE EQUITY RATIO OF 5.00%.
FIRST CITIZENS BANCORPORATION, INC. EARNINGS AS ESTIMATES
ASSUMES NO RESTRUCTURING CHARGE
Five |
| Year Projections |
2005 |
| 2006 2007 2008 2009 |
Beginning |
| Equity (a) $402,221 $420,585 $431,341 $443,956 $458,054 |
Unadjusted |
| Net Income (a,b) 43,930 47,421 50,478 53,660 57,148 |
After |
| Tax Income Impact (c) 72 (473) (1,251) (2,037) (2,841) |
Synergies/Restructuring |
| Charge (d) 0 0 0 0 0 |
Adjusted |
| Net Income (e) $44,001 $46,949 $49,227 $51,623 $54,307 |
Dividends |
| (f) (25,637) (36,193) (36,612) (37,526) (37,739) |
Ending |
| Equity 420,585 431,341 443,956 458,054 474,623 |
Intangibles |
| (g) 141,204 133,530 126,617 119,992 114,616 |
Ending |
| Tangible Equity $279,382 $297,811 $317,340 $338,062 $360,007 |
Net |
| Change in Equity (h) (24,297) (34,747) (35,072) (35,889) (35,996) |
Cumulative |
| Change in Equity (21,103) (55,850) (90,922) (126,811) (162,806) |
Total |
| Assets (a,b) $5,728,836 $6,089,753 $6,473,407 $6,881,232 $7,314,749 |
Asset |
| Growth Rate 8.04% 6.30% 6.30% 6.30% 6.30% |
Net |
| Income Growth Rate (i) NM 6.70% 4.85% 4.87% 5.20% |
Return |
| on Average Assets 0.77% 0.80% 0.80% 0.80% 0.81% |
Adjusted |
| ROAA 0.77% 0.79% 0.78% 0.77% 0.77% |
Adjusted |
| ROAE 10.70% 11.02% 11.25% 11.45% 11.65% |
Equity |
| / Assets 7.34% 7.08% 6.86% 6.66% 6.49% |
Tangible |
| Equity/ Tangible Assets 5.00% 5.00% 5.00% 5.00% 5.00% |
Page 21
Discounted Cash Flow Analysis
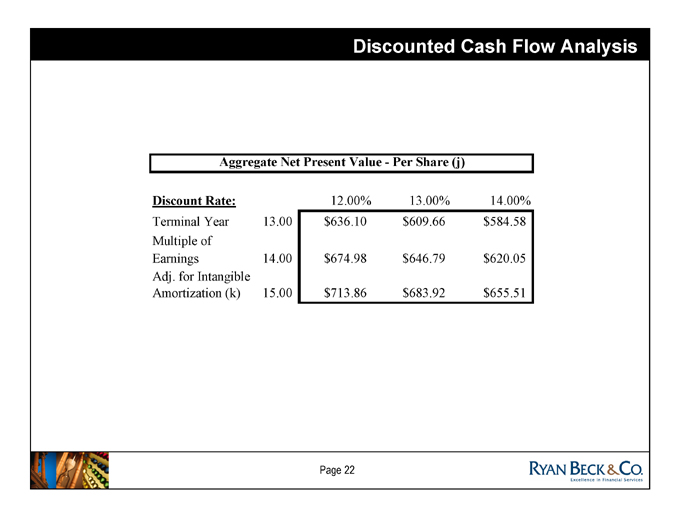
Aggregate Net Present Value - Per Share (j)
Discount |
| Rate: 12.00% 13.00% 14.00% |
Terminal |
| Year 13.00 $636.10 $609.66 $584.58 |
Multiple |
| of Earnings 14.00 $674.98 $646.79 $620.05 |
Adj. |
| for Intangible Amortization (k) 15.00 $713.86 $683.92 $655.51 |
Page 22
Discounted Cash Flow Analysis
Footnotes
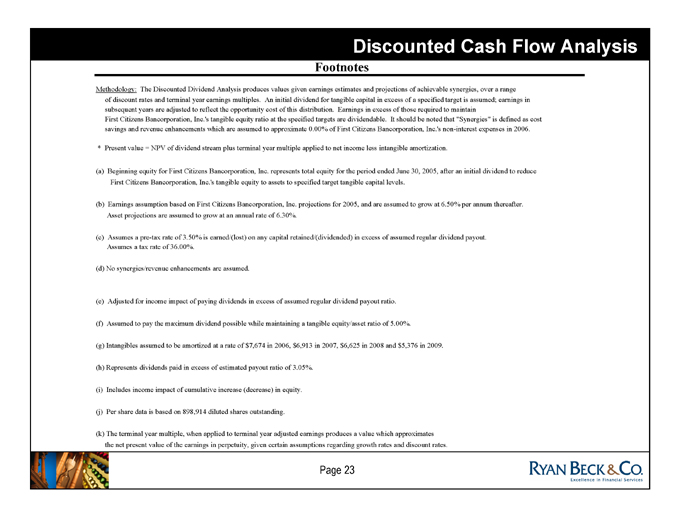
Methodology: The Discounted Dividend Analysis produces values given earnings estimates and projections of achievable synergies, over a range of discount rates and terminal year earnings multiples. An initial dividend for tangible capital in excess of a specified target is assumed; earnings in subsequent years are adjusted to reflect the opportunity cost of this distribution. Earnings in excess of those required to maintain
First Citizens Bancorporation, Inc.’s tangible equity ratio at the specified targets are dividendable. It should be noted that “Synergies” is defined as cost savings and revenue enhancements which are assumed to approximate 0.00% of First Citizens Bancorporation, Inc.’s non-interest expenses in 2006.
* Present value = NPV of dividend stream plus terminal year multiple applied to net income less intangible amortization.
(a) Beginning equity for First Citizens Bancorporation, Inc. represents total equity for the period ended June 30, 2005, after an initial dividend to reduce First Citizens Bancorporation, Inc.’s tangible equity to assets to specified target tangible capital levels.
(b) Earnings assumption based on First Citizens Bancorporation, Inc. projections for 2005, and are assumed to grow at 6.50% per annum thereafter.
Asset projections are assumed to grow at an annual rate of 6.30%.
(c) Assumes a pre-tax rate of 3.50% is earned/(lost) on any capital retained/(dividended) in excess of assumed regular dividend payout.
Assumes a tax rate of 36.00%.
(d) |
| No synergies/revenue enhancements are assumed. |
(e) |
| Adjusted for income impact of paying dividends in excess of assumed regular dividend payout ratio. |
(f) |
| Assumed to pay the maximum dividend possible while maintaining a tangible equity/asset ratio of 5.00%. |
(g) |
| Intangibles assumed to be amortized at a rate of $7,674 in 2006, $6,913 in 2007, $6,625 in 2008 and $5,376 in 2009. |
(h) |
| Represents dividends paid in excess of estimated payout ratio of 3.05%. |
(i) |
| Includes income impact of cumulative increase (decrease) in equity. |
(j) |
| Per share data is based on 898,914 diluted shares outstanding. |
(k) The terminal year multiple, when applied to terminal year adjusted earnings produces a value which approximates the net present value of the earnings in perpetuity, given certain assumptions regarding growth rates and discount rates.
Page 23
Peer Group Comparison
Peer Group Comparison
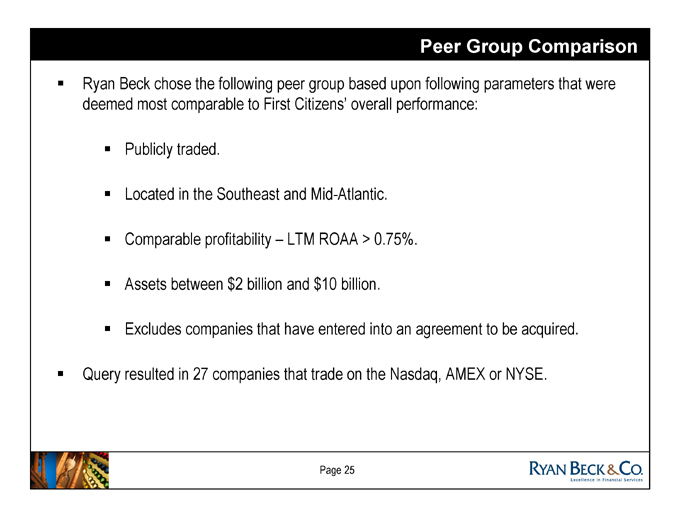
Ryan Beck chose the following peer group based upon following parameters that were deemed most comparable to First Citizens’ overall performance:
Publicly traded.
Located in the Southeast and Mid-Atlantic. Comparable profitability – LTM ROAA > 0.75%. Assets between $2 billion and $10 billion.
Excludes companies that have entered into an agreement to be acquired.
Query resulted in 27 companies that trade on the Nasdaq, AMEX or NYSE.
Page 25
Peer Group Comparison
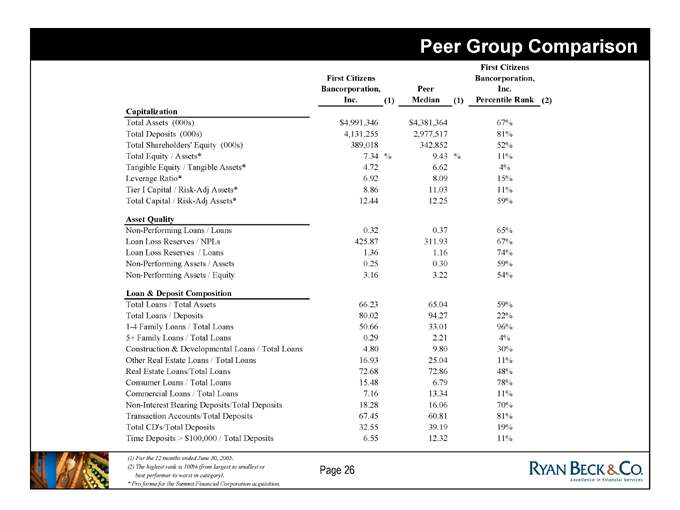
First |
| Citizens Bancorporation, Inc. (1) Peer Median (1) First Citizens Bancorporation, Inc. Percentile Rank (2) |
Capitalization |
|
Total |
| Assets (000s) $ 4,991,346 $ 4,381,364 67% |
Total |
| Deposits (000s) 4,131,255 2,977,517 81% |
Total |
| Shareholders’ Equity (000s) 389,018 342,852 52% |
Total |
| Equity / Assets* 7.34 % 9.43 % 11% |
Tangible |
| Equity / Tangible Assets* 4.72 6.62 4% |
Leverage |
| Ratio* 6.92 8.09 15% |
Tier |
| I Capital / Risk-Adj Assets* 8.86 11.03 11% |
Total |
| Capital / Risk-Adj Assets* 12.44 12.25 59% |
Asset |
| Quality |
Non-Performing |
| Loans / Loans 0.32 0.37 65% |
Loan |
| Loss Reserves / NPLs 425.87 311.93 67% |
Loan |
| Loss Reserves / Loans 1.36 1.16 74% |
Non-Performing |
| Assets / Assets 0.25 0.30 59% |
Non-Performing |
| Assets / Equity 3.16 3.22 54% |
Loan |
| & Deposit Composition |
Total |
| Loans / Total Assets 66.23 65.04 59% |
Total |
| Loans / Deposits 80.02 94.27 22% |
1-4 |
| Family Loans / Total Loans 50.66 33.01 96% |
5+ |
| Family Loans / Total Loans 0.29 2.21 4% |
Construction |
| & Developmental Loans / Total Loans 4.80 9.80 30% |
Other |
| Real Estate Loans / Total Loans 16.93 25.04 11% |
Real |
| Estate Loans/Total Loans 72.68 72.86 48% |
Consumer |
| Loans / Total Loans 15.48 6.79 78% |
Commercial |
| Loans / Total Loans 7.16 13.34 11% |
Non-Interest |
| Bearing Deposits/Total Deposits 18.28 16.06 70% |
Transaction |
| Accounts/Total Deposits 67.45 60.81 81% |
Total |
| CD’s/Total Deposits 32.55 39.19 19% |
Time |
| Deposits > $100,000 / Total Deposits 6.55 12.32 11% |
(1) |
| For the 12 months ended June 30, 2005. |
(2) |
| The highest rank is 100% (from largest to smallest or best performer to worst in category). |
* |
| Pro forma for the Summit Financial Corporation acquisition. |
Page 26
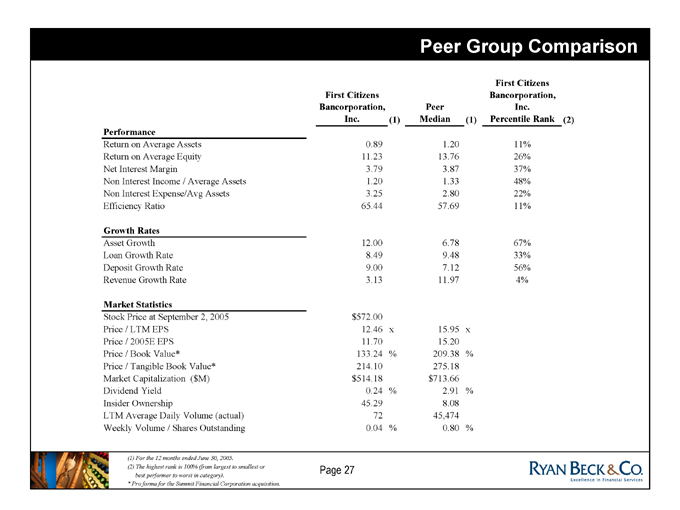
Peer Group Comparison
First |
| Citizens Bancorporation, Inc. (1) Peer Median (1) First Citizens Bancorporation, Inc. Percentile Rank (2) |
Performance |
|
Return |
| on Average Assets 0.89 % 1.20 % 11% |
Return |
| on Average Equity 11.23 13.76 26% |
Net |
| Interest Margin 3.79 3.87 37% |
Non |
| Interest Income / Average Assets 1.20 1.33 48% |
Non |
| Interest Expense/Avg Assets 3.25 2.80 22% |
Efficiency |
| Ratio 65.44 57.69 11% |
Growth |
| Rates |
Asset |
| Growth 12.00 6.78 67% |
Loan |
| Growth Rate 8.49 9.48 33% |
Deposit |
| Growth Rate 9.00 7.12 56% |
Revenue |
| Growth Rate 3.13 11.97 4% |
Market |
| Statistics |
Stock |
| Price at September 2, 2005 $572.00 |
Price |
| / LTM EPS 12.46 x 15.95 x |
Price |
| / 2005E EPS 11.70 15.20 |
Price |
| / Book Value* 133.24 % 209.38 % |
Price |
| / Tangible Book Value* 214.10 275.18 |
Market |
| Capitalization ($M) $514.18 $713.66 |
Dividend |
| Yield 0.24 % 2.91 % |
Insider |
| Ownership 45.29 8.08 |
LTM |
| Average Daily Volume (actual) 72 45,474 |
Weekly |
| Volume / Shares Outstanding 0.04 % 0.80 % |
(1) |
| For the 12 months ended June 30, 2005. |
(2) |
| The highest rank is 100% (from largest to smallest or best performer to worst in category). |
* |
| Pro forma for the Summit Financial Corporation acquisition. |
Page 27
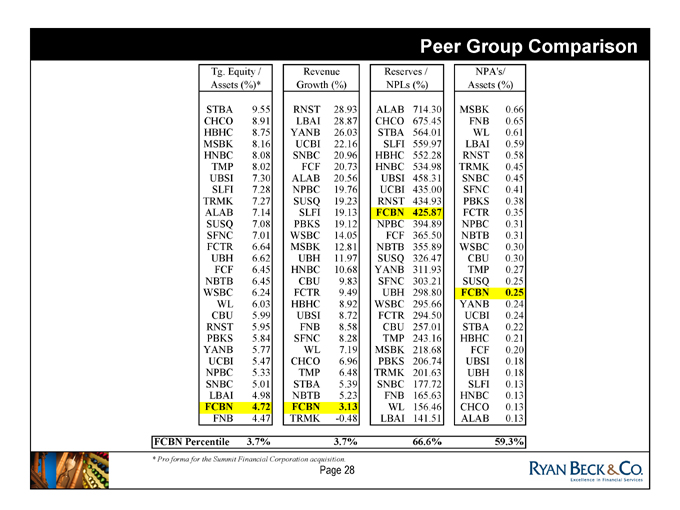
Peer Group Comparison
Tg. |
| Equity / Assets (%)* Revenue Growth (%) Reserves / NPLs (%) NPA’s/ Assets (%) |
STBA |
| 9.55 RNST 28.93 ALAB 714.30 MSBK 0.66 |
CHCO |
| 8.91 LBAI 28.87 CHCO 675.45 FNB 0.65 |
HBHC |
| 8.75 YANB 26.03 STBA 564.01 WL 0.61 |
MSBK |
| 8.16 UCBI 22.16 SLFI 559.97 LBAI 0.59 |
HNBC |
| 8.08 SNBC 20.96 HBHC 552.28 RNST 0.58 |
TMP |
| 8.02 FCF 20.73 HNBC 534.98 TRMK 0.45 |
UBSI |
| 7.30 ALAB 20.56 UBSI 458.31 SNBC 0.45 |
SLFI |
| 7.28 NPBC 19.76 UCBI 435.00 SFNC 0.41 |
TRMK |
| 7.27 SUSQ 19.23 RNST 434.93 PBKS 0.38 |
ALAB |
| 7.14 SLFI 19.13 FCBN 425.87 FCTR 0.35 |
SUSQ |
| 7.08 PBKS 19.12 NPBC 394.89 NPBC 0.31 |
SFNC |
| 7.01 WSBC 14.05 FCF 365.50 NBTB 0.31 |
FCTR |
| 6.64 MSBK 12.81 NBTB 355.89 WSBC 0.30 |
UBH |
| 6.62 UBH 11.97 SUSQ 326.47 CBU 0.30 |
FCF |
| 6.45 HNBC 10.68 YANB 311.93 TMP 0.27 |
NBTB |
| 6.45 CBU 9.83 SFNC 303.21 SUSQ 0.25 |
WSBC |
| 6.24 FCTR 9.49 UBH 298.80 FCBN 0.25 |
WL |
| 6.03 HBHC 8.92 WSBC 295.66 YANB 0.24 |
CBU |
| 5.99 UBSI 8.72 FCTR 294.50 UCBI 0.24 |
RNST |
| 5.95 FNB 8.58 CBU 257.01 STBA 0.22 |
PBKS |
| 5.84 SFNC 8.28 TMP 243.16 HBHC 0.21 |
YANB |
| 5.77 WL 7.19 MSBK 218.68 FCF 0.20 |
UCBI |
| 5.47 CHCO 6.96 PBKS 206.74 UBSI 0.18 |
NPBC |
| 5.33 TMP 6.48 TRMK 201.63 UBH 0.18 |
SNBC |
| 5.01 STBA 5.39 SNBC 177.72 SLFI 0.13 |
LBAI |
| 4.98 NBTB 5.23 FNB 165.63 HNBC 0.13 |
FCBN |
| 4.72 FCBN 3.13 WL 156.46 CHCO 0.13 |
FNB |
| 4.47 TRMK -0.48 LBAI 141.51 ALAB 0.13 |
FCBN |
| Percentile 3.7% 3.7% 66.6% 59.3% |
* |
| Pro forma for the Summit Financial Corporation acquisition. |
Page 28
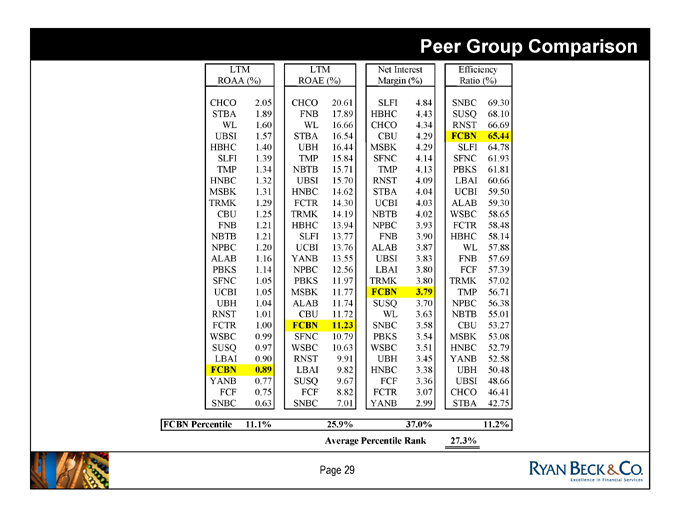
Peer Group Comparison
LTM |
| ROAA (%) LTM ROAE (%) Net Interest Margin (%) Efficiency Ratio (%) |
CHCO |
| 2.05 CHCO 20.61 SLFI 4.84 SNBC 69.30 |
STBA |
| 1.89 FNB 17.89 HBHC 4.43 SUSQ 68.10 |
WL |
| 1.60 WL 16.66 CHCO 4.34 RNST 66.69 |
UBSI |
| 1.57 STBA 16.54 CBU 4.29 FCBN 65.44 |
HBHC |
| 1.40 UBH 16.44 MSBK 4.29 SLFI 64.78 |
SLFI |
| 1.39 TMP 15.84 SFNC 4.14 SFNC 61.93 |
TMP |
| 1.34 NBTB 15.71 TMP 4.13 PBKS 61.81 |
HNBC |
| 1.32 UBSI 15.70 RNST 4.09 LBAI 60.66 |
MSBK |
| 1.31 HNBC 14.62 STBA 4.04 UCBI 59.50 |
TRMK |
| 1.29 FCTR 14.30 UCBI 4.03 ALAB 59.30 |
CBU |
| 1.25 TRMK 14.19 NBTB 4.02 WSBC 58.65 |
FNB |
| 1.21 HBHC 13.94 NPBC 3.93 FCTR 58.48 |
NBTB |
| 1.21 SLFI 13.77 FNB 3.90 HBHC 58.14 |
NPBC |
| 1.20 UCBI 13.76 ALAB 3.87 WL 57.88 |
ALAB |
| 1.16 YANB 13.55 UBSI 3.83 FNB 57.69 |
PBKS |
| 1.14 NPBC 12.56 LBAI 3.80 FCF 57.39 |
SFNC |
| 1.05 PBKS 11.97 TRMK 3.80 TRMK 57.02 |
UCBI |
| 1.05 MSBK 11.77 FCBN 3.79 TMP 56.71 |
UBH |
| 1.04 ALAB 11.74 SUSQ 3.70 NPBC 56.38 |
RNST |
| 1.01 CBU 11.72 WL 3.63 NBTB 55.01 |
FCTR |
| 1.00 FCBN 11.23 SNBC 3.58 CBU 53.27 |
WSBC |
| 0.99 SFNC 10.79 PBKS 3.54 MSBK 53.08 |
SUSQ |
| 0.97 WSBC 10.63 WSBC 3.51 HNBC 52.79 |
LBAI |
| 0.90 RNST 9.91 UBH 3.45 YANB 52.58 |
FCBN |
| 0.89 LBAI 9.82 HNBC 3.38 UBH 50.48 |
YANB |
| 0.77 SUSQ 9.67 FCF 3.36 UBSI 48.66 |
FCF |
| 0.75 FCF 8.82 FCTR 3.07 CHCO 46.41 |
SNBC |
| 0.63 SNBC 7.01 YANB 2.99 STBA 42.75 |
FCBN |
| Percentile 11.1% 25.9% 37.0% 11.2% |
Average |
| Percentile Rank 27.3% |
Page 29
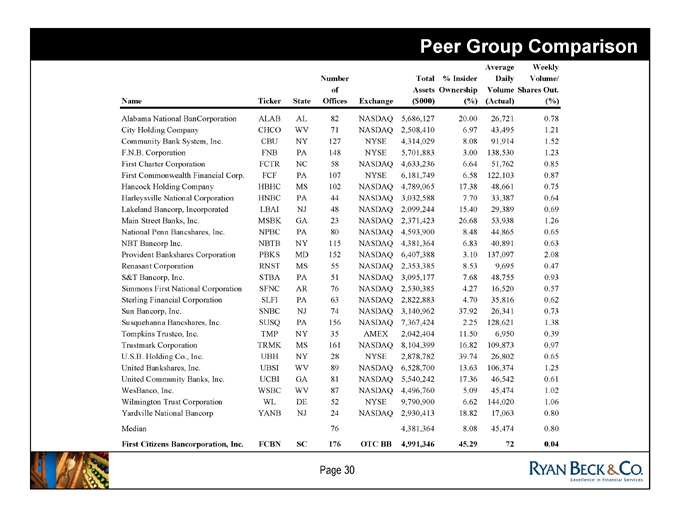
Peer Group Comparison
Name Ticker State Number of Offices Exchange Total Assets ($000) % Insider Ownership (%) Average Daily Volume (Actual) Weekly Volume/ Shares Out. (%)
Alabama |
| National BanCorporation ALAB AL 82 NASDAQ 5,686,127 20.00 26,721 0.78 |
City |
| Holding Company CHCO WV 71 NASDAQ 2,508,410 6.97 43,495 1.21 |
Community |
| Bank System, Inc. CBU NY 127 NYSE 4,314,029 8.08 91,914 1.52 |
F.N.B. |
| Corporation FNB PA 148 NYSE 5,701,883 3.00 138,530 1.23 |
First |
| Charter Corporation FCTR NC 58 NASDAQ 4,633,236 6.64 51,762 0.85 |
First |
| Commonwealth Financial Corp. FCF PA 107 NYSE 6,181,749 6.58 122,103 0.87 |
Hancock |
| Holding Company HBHC MS 102 NASDAQ 4,789,065 17.38 48,661 0.75 |
Harleysville |
| National Corporation HNBC PA 44 NASDAQ 3,032,588 7.70 33,387 0.64 |
Lakeland |
| Bancorp, Incorporated LBAI NJ 48 NASDAQ 2,099,244 15.40 29,389 0.69 |
Main |
| Street Banks, Inc. MSBK GA 23 NASDAQ 2,371,423 26.68 53,938 1.26 |
National |
| Penn Bancshares, Inc. NPBC PA 80 NASDAQ 4,593,900 8.48 44,865 0.65 |
NBT |
| Bancorp Inc. NBTB NY 115 NASDAQ 4,381,364 6.83 40,891 0.63 |
Provident |
| Bankshares Corporation PBKS MD 152 NASDAQ 6,407,388 3.10 137,097 2.08 |
Renasant |
| Corporation RNST MS 55 NASDAQ 2,353,385 8.53 9,695 0.47 |
S&T |
| Bancorp, Inc. STBA PA 51 NASDAQ 3,095,177 7.68 48,755 0.93 |
Simmons |
| First National Corporation SFNC AR 76 NASDAQ 2,530,385 4.27 16,520 0.57 |
Sterling |
| Financial Corporation SLFI PA 63 NASDAQ 2,822,883 4.70 35,816 0.62 |
Sun |
| Bancorp, Inc. SNBC NJ 74 NASDAQ 3,140,962 37.92 26,341 0.73 |
Susquehanna |
| Bancshares, Inc. SUSQ PA 156 NASDAQ 7,367,424 2.25 128,621 1.38 |
Tompkins |
| Trustco, Inc. TMP NY 35 AMEX 2,042,404 11.50 6,950 0.39 |
Trustmark |
| Corporation TRMK MS 161 NASDAQ 8,104,399 16.82 109,873 0.97 |
U.S.B. |
| Holding Co., Inc. UBH NY 28 NYSE 2,878,782 39.74 26,802 0.65 |
United |
| Bankshares, Inc. UBSI WV 89 NASDAQ 6,528,700 13.63 106,374 1.25 |
United |
| Community Banks, Inc. UCBI GA 81 NASDAQ 5,540,242 17.36 46,542 0.61 |
WesBanco, |
| Inc. WSBC WV 87 NASDAQ 4,496,760 5.09 45,474 1.02 |
Wilmington |
| Trust Corporation WL DE 52 NYSE 9,790,900 6.62 144,020 1.06 |
Yardville |
| National Bancorp YANB NJ 24 NASDAQ 2,930,413 18.82 17,063 0.80 |
Median |
| 76 4,381,364 8.08 45,474 0.80 |
First |
| Citizens Bancorporation, Inc. FCBN SC 176 OTC BB 4,991,346 45.29 72 0.04 |
Page 30
Peer Group Comparison
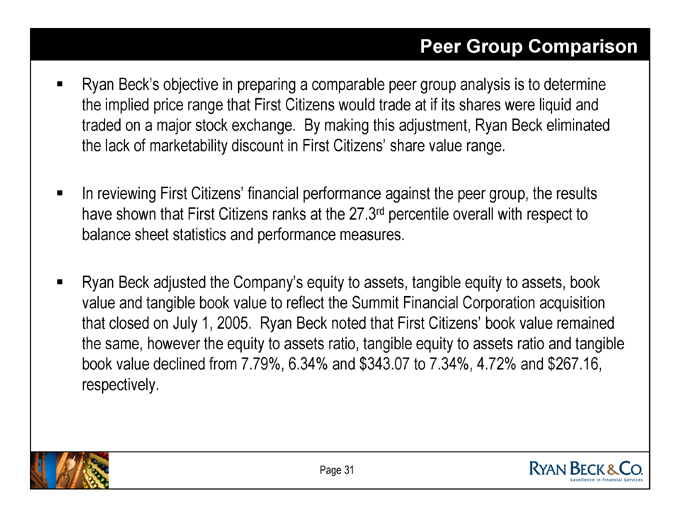
Ryan Beck’s objective in preparing a comparable peer group analysis is to determine the implied price range that First Citizens would trade at if its shares were liquid and traded on a major stock exchange. By making this adjustment, Ryan Beck eliminated the lack of marketability discount in First Citizens’ share value range.
In reviewing First Citizens’ financial performance against the peer group, the results have shown that First Citizens ranks at the 27.3rd percentile overall with respect to balance sheet statistics and performance measures.
Ryan Beck adjusted the Company’s equity to assets, tangible equity to assets, book value and tangible book value to reflect the Summit Financial Corporation acquisition that closed on July 1, 2005. Ryan Beck noted that First Citizens’ book value remained the same, however the equity to assets ratio, tangible equity to assets ratio and tangible book value declined from 7.79%, 6.34% and $343.07 to 7.34%, 4.72% and $267.16, respectively.
Page 31
Peer Group Comparison
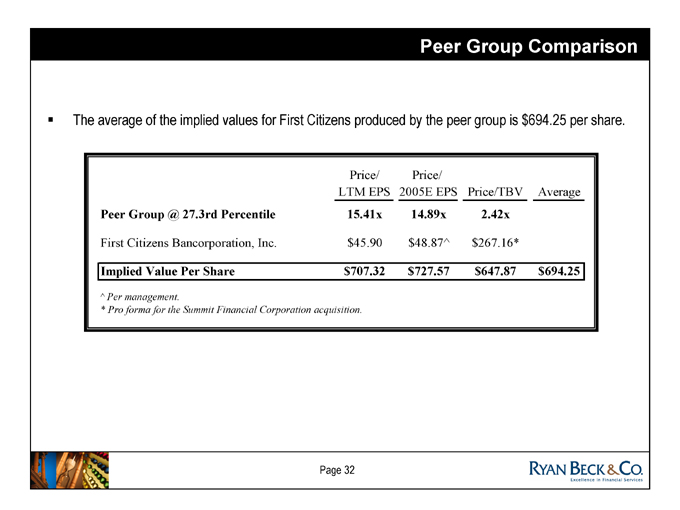
The average of the implied values for First Citizens produced by the peer group is $694.25 per share.
Price/LTM |
| EPS Price/2005E EPS Price/TBV Average |
Peer |
| Group @ 27.3rd Percentile 15.41x 14.89x 2.42x |
First |
| Citizens Bancorporation, Inc. $45.90 $48.87^ $267.16* |
Implied |
| Value Per Share $707.32 $727.57 $647.87 $694.25 |
^ Per management
* |
| Pro forma for the Summit Financial Corporation acquisition. |
Page 32
Market Value Conclusion
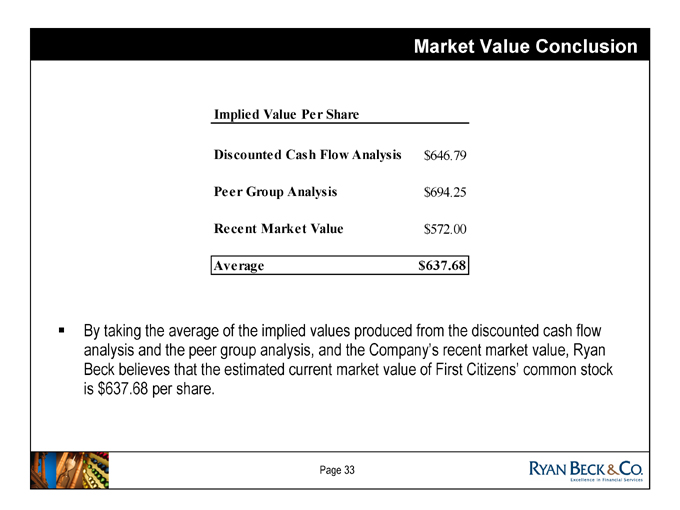
Implied |
| Value Per Share |
Discounted |
| Cash Flow Analysis $646.79 |
Peer |
| Group Analysis $694.25 |
Recent |
| Market Value $572.00 |
Average |
| $637.68 |
By taking the average of the implied values produced from the discounted cash flow analysis and the peer group analysis, and the Company’s recent market value, Ryan Beck believes that the estimated current market value of First Citizens’ common stock is $637.68 per share.
Page 33
Tab 4
Premium Valuation
Premium Valuation
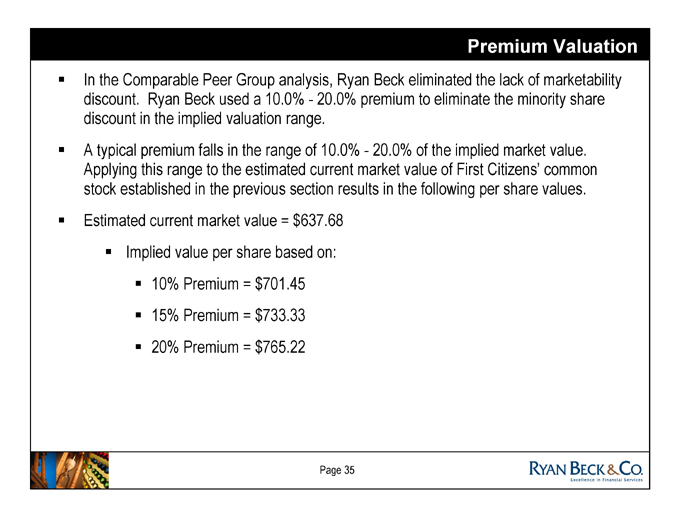
In the Comparable Peer Group analysis, Ryan Beck eliminated the lack of marketability discount. Ryan Beck used a 10.0% - 20.0% premium to eliminate the minority share discount in the implied valuation range.
A typical premium falls in the range of 10.0% - 20.0% of the implied market value. Applying this range to the estimated current market value of First Citizens’ common stock established in the previous section results in the following per share values. Estimated current market value = $637.68
Implied value per share based on:
10% Premium = $701.45 15% Premium = $733.33 20% Premium = $765.22
Page 35
Premium Valuation – Discounted Cash Flow Analysis
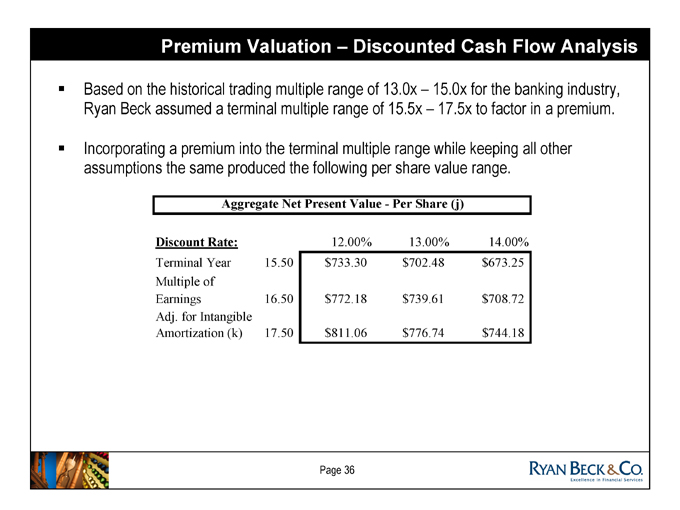
Based on the historical trading multiple range of 13.0x – 15.0x for the banking industry, Ryan Beck assumed a terminal multiple range of 15.5x – 17.5x to factor in a premium.
Incorporating a premium into the terminal multiple range while keeping all other assumptions the same produced the following per share value range.
Aggregate Net Present Value -Per Share (j)
Discount |
| Rate: 12.00% 13.00% 14.00% |
Terminal |
| Year 15.50 $733.30 $702.48 $673.25 |
Multiple |
| of Earnings 16.50 $772.18 $739.61 $708.72 |
Adj. |
| for Intangible Amortization (k) 17.50 $811.06 $776.74 $744.18 |
Page 36
Premium Valuation – Discounted Cash Flow Analysis
(Dollars in thousands, except per share data)
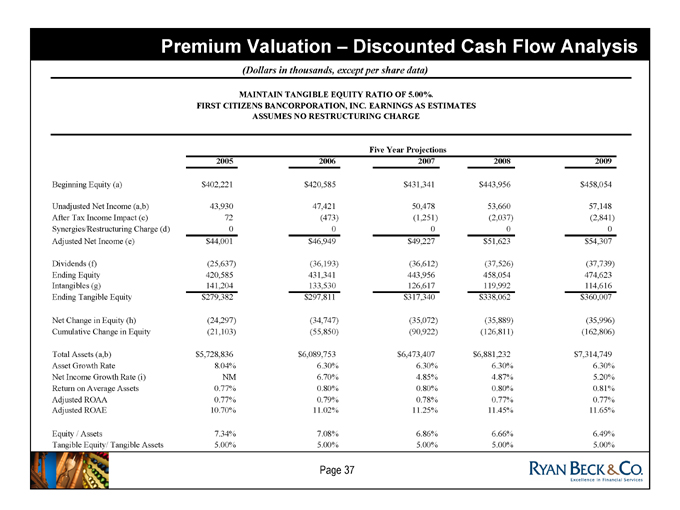
MAINTAIN TANGIBLE EQUITY RATIO OF 5.00%.
FIRST CITIZENS BANCORPORATION, INC. EARNINGS AS ESTIMATES
ASSUMES NO RESTRUCTURING CHARGE
Five |
| Year Projections |
2005 |
| 2006 2007 2008 2009 |
Beginning |
| Equity (a) $402,221 $420,585 $431,341 $443,956 $458,054 |
Unadjusted |
| Net Income (a,b) 43,930 47,421 50,478 53,660 57,148 |
After |
| Tax Income Impact (c) 72 (473) (1,251) (2,037) (2,841) |
Synergies/Restructuring |
| Charge (d) 0 0 0 0 0 |
Adjusted |
| Net Income (e) $44,001 $46,949 $49,227 $51,623 $54,307 |
Dividends |
| (f) (25,637) (36,193) (36,612) (37,526) (37,739) |
Ending |
| Equity 420,585 431,341 443,956 458,054 474,623 |
Intangibles |
| (g) 141,204 133,530 126,617 119,992 114,616 |
Ending |
| Tangible Equity $279,382 $297,811 $317,340 $338,062 $360,007 |
Net |
| Change in Equity (h) (24,297) (34,747) (35,072) (35,889) (35,996) |
Cumulative |
| Change in Equity (21,103) (55,850) (90,922) (126,811) (162,806) |
Total |
| Assets (a,b) $5,728,836 $6,089,753 $6,473,407 $6,881,232 $7,314,749 |
Asset |
| Growth Rate 8.04% 6.30% 6.30% 6.30% 6.30% |
Net |
| Income Growth Rate (i) NM 6.70% 4.85% 4.87% 5.20% |
Return |
| on Average Assets 0.77% 0.80% 0.80% 0.80% 0.81% |
Adjusted |
| ROAA 0.77% 0.79% 0.78% 0.77% 0.77% |
Adjusted |
| ROAE 10.70% 11.02% 11.25% 11.45% 11.65% |
Equity |
| / Assets 7.34% 7.08% 6.86% 6.66% 6.49% |
Tangible |
| Equity/ Tangible Assets 5.00% 5.00% 5.00% 5.00% 5.00% |
Page 37
Premium Valuation – Discounted Cash Flow Analysis
Footnotes
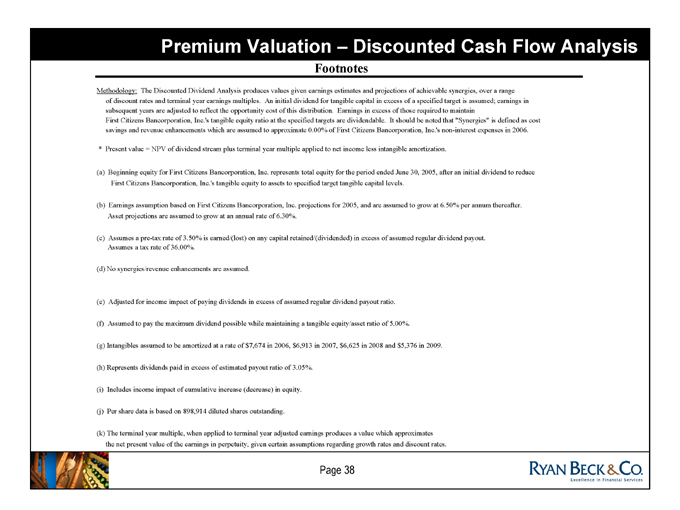
Methodology: The Discounted Dividend Analysis produces values given earnings estimates and projections of achievable synergies, over a range of discount rates and terminal year earnings multiples. An initial dividend for tangible capital in excess of a specified target is assumed; earnings in subsequent years are adjusted to reflect the opportunity cost of this distribution. Earnings in excess of those required to maintain
First Citizens Bancorporation, Inc.’s tangible equity ratio at the specified targets are dividendable. It should be noted that “Synergies” is defined as cost savings and revenue enhancements which are assumed to approximate 0.00% of First Citizens Bancorporation, Inc.’s non-interest expenses in 2006.
* Present value = NPV of dividend stream plus terminal year multiple applied to net income less intangible amortization.
(a) Beginning equity for First Citizens Bancorporation, Inc. represents total equity for the period ended June 30, 2005, after an initial dividend to reduce First Citizens Bancorporation, Inc.’s tangible equity to assets to specified target tangible capital levels.
(b) Earnings assumption based on First Citizens Bancorporation, Inc. projections for 2005, and are assumed to grow at 6.50% per annum thereafter.
Asset projections are assumed to grow at an annual rate of 6.30%.
(c) Assumes a pre-tax rate of 3.50% is earned/(lost) on any capital retained/(dividended) in excess of assumed regular dividend payout.
Assumes a tax rate of 36.00%.
(d) |
| No synergies/revenue enhancements are assumed. |
(e) |
| Adjusted for income impact of paying dividends in excess of assumed regular dividend payout ratio. |
(f) |
| Assumed to pay the maximum dividend possible while maintaining a tangible equity/asset ratio of 5.00%. |
(g) |
| Intangibles assumed to be amortized at a rate of $7,674 in 2006, $6,913 in 2007, $6,625 in 2008 and $5,376 in 2009. |
(h) |
| Represents dividends paid in excess of estimated payout ratio of 3.05%. |
(i) |
| Includes income impact of cumulative increase (decrease) in equity. |
(j) |
| Per share data is based on 898,914 diluted shares outstanding. |
(k) The terminal year multiple, when applied to terminal year adjusted earnings produces a value which approximates the net present value of the earnings in perpetuity, given certain assumptions regarding growth rates and discount rates.
Page 38
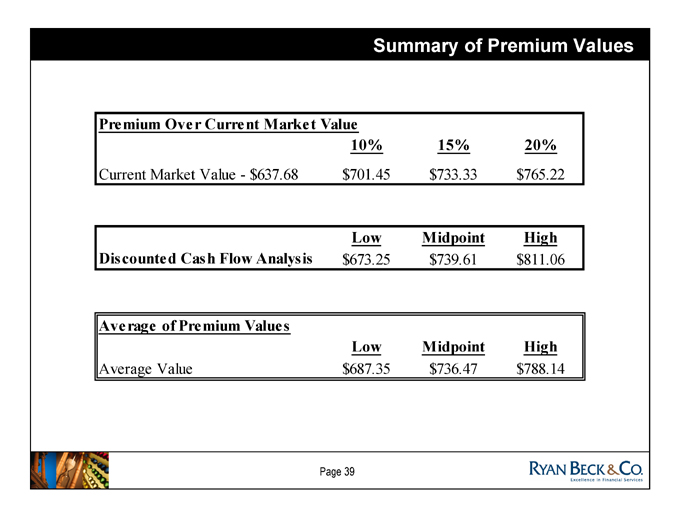
Summary of Premium Values
Premium |
| Over Current Market Value |
10% |
| 15% 20% |
Current |
| Market Value - $ 637.68 $ 701.45 $ 733.33 $ 765.22 |
Low |
| Midpoint High |
Discounted |
| Cash Flow Analysis $ 673.25 $ 739.61 $ 811.06 |
Average |
| of Premium Values |
Low |
| Midpoint High |
Average |
| Value $ 687.35 $ 736.47 $ 788.14 |
Page 39

Tab 5
Repurchase Analysis
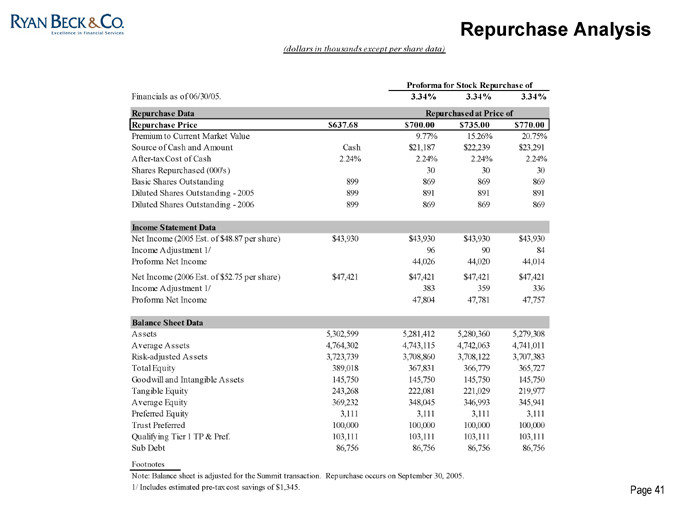
Repurchase Analysis
(dollars in thousands except per share data)
Proforma for Stock Repurchase of
Financials |
| as of 06/30/05. 3.34% 3.34% 3.34% |
Repurchase |
| Data Repurchased at Price of |
Repurchase |
| Price $637.68 $700.00 $735.00 $770.00 |
Premium |
| to Current Market Value 9.77% 15.26% 20.75% |
Source |
| of Cash and Amount Cash $21,187 $22,239 $23,291 |
After-tax |
| Cost of Cash 2.24% 2.24% 2.24% 2.24% |
Shares |
| Repurchased (000’s) 30 30 30 |
Basic |
| Shares Outstanding 899 869 869 869 |
Diluted |
| Shares Outstanding - 2005 899 891 891 891 |
Diluted |
| Shares Outstanding - 2006 899 869 869 869 |
Income |
| Statement Data |
Net |
| Income (2005 Est. of $48.87 per share) $43,930 $43,930 $43,930 $43,930 |
Income |
| Adjustment 1/ 96 90 84 |
Proforma |
| Net Income 44,026 44,020 44,014 |
Net |
| Income (2006 Est. of $52.75 per share) $47,421 $47,421 $47,421 $47,421 |
Income |
| Adjustment 1/ 383 359 336 |
Proforma |
| Net Income 47,804 47,781 47,757 |
Balance |
| Sheet Data |
Assets |
| 5,302,599 5,281,412 5,280,360 5,279,308 |
Average |
| Assets 4,764,302 4,743,115 4,742,063 4,741,011 |
Risk-adjusted |
| Assets 3,723,739 3,708,860 3,708,122 3,707,383 |
Total |
| Equity 389,018 367,831 366,779 365,727 |
Goodwill |
| and Intangible Assets 145,750 145,750 145,750 145,750 |
Tangible |
| Equity 243,268 222,081 221,029 219,977 |
Average |
| Equity 369,232 348,045 346,993 345,941 |
Preferred |
| Equity 3,111 3,111 3,111 3,111 |
Trust |
| Preferred 100,000 100,000 100,000 100,000 |
Qualifying |
| Tier 1 TP & Pref. 103,111 103,111 103,111 103,111 |
Sub |
| Debt 86,756 86,756 86,756 86,756 |
Footnotes
Note: Balance sheet is adjusted for the Summit transaction. Repurchase occurs on September 30, 2005. 1/ Includes estimated pre-tax cost savings of $1,345.
Page 41
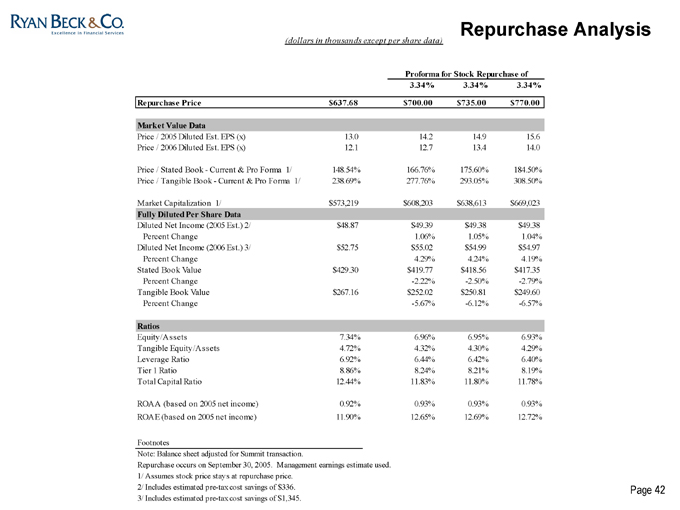
Repurchase Analysis
(dollars in thousands except per share data)
Proforma for Stock Repurchase of
3.34% |
| 3.34% 3.34% |
Repurchase |
| Price $637.68 $700.00 $735.00 $ 770.00 |
Market |
| Value Data |
Price |
| / 2005 Diluted Est. EPS (x) 13.0 14.2 14.9 15.6 |
Price |
| / 2006 Diluted Est. EPS (x) 12.1 12.7 13.4 14.0 |
Price |
| / Stated Book - Current & Pro Forma 1/ 148.54% 166.76% 175.60% 184.50% |
Price |
| / Tangible Book - Current & Pro Forma 1/ 238.69% 277.76% 293.05% 308.50% |
Market |
| Capitalization 1/ $573,219 $608,203 $638,613 $ 669,023 |
Fully |
| Diluted Per Share Data |
Diluted |
| Net Income (2005 Est.) 2/ $48.87 $49.39 $49.38 $ 49.38 |
Percent |
| Change 1.06% 1.05% 1.04% |
Diluted |
| Net Income (2006 Est.) 3/ $52.75 $55.02 $54.99 $ 54.97 |
Percent |
| Change 4.29% 4.24% 4.19% |
Stated |
| Book Value $429.30 $419.77 $418.56 $ 417.35 |
Percent |
| Change -2.22% -2.50% -2.79% |
Tangible |
| Book Value $267.16 $252.02 $250.81 $ 249.60 |
Percent |
| Change -5.67% -6.12% -6.57% |
Ratios |
|
Equity/Assets |
| 7.34% 6.96% 6.95% 6.93% |
Tangible |
| Equity/Assets 4.72% 4.32% 4.30% 4.29% |
Leverage |
| Ratio 6.92% 6.44% 6.42% 6.40% |
Tier |
| 1 Ratio 8.86% 8.24% 8.21% 8.19% |
Total |
| Capital Ratio 12.44% 11.83% 11.80% 11.78% |
ROAA |
| (based on 2005 net income) 0.92% 0.93% 0.93% 0.93% |
ROAE |
| (based on 2005 net income) 11.90% 12.65% 12.69% 12.72% |
Footnotes
Note: Balance sheet adjusted for Summit transaction.
Repurchase occurs on September 30, 2005. Management earnings estimate used.
1/ Assumes stock price stays at repurchase price.
2/ Includes estimated pre-tax cost savings of $336. 3/ Includes estimated pre-tax cost savings of $1,345.
Tab 6
Conclusion
Conclusion
Ryan Beck’s opinion is directed to the Board of Directors of First Citizens solely for their use in valuing the common stock of shareholders of First Citizens for purposes of executing the contemplated Transaction. Ryan Beck has not considered, nor is Ryan Beck expressing any opinion herein with respect to the price at which First Citizens common stock will trade subsequent to the share repurchase.
It is the opinion of Ryan Beck that:
GIVEN THE CONTEMPLATED TRANSACTION, THE FAIR VALUE OF A SHARE OF FIRST CITIZENS COMMON STOCK FALLS WITHIN A RANGE OF $700.00 AND $770.00 PER SHARE. VALUES WITHIN THIS RANGE MAY BE USED TO REPURCHASE UP TO 30,053 SHARES IN THE CONTEMPLATED TRANSACTION.
Page 44

Tab 7
Ryan Beck Relationship
Relationship with Ryan Beck
Ryan Beck has not had a prior Investment Banking relationship with First Citizens Bancorporation. Ryan Beck’s research department does not provide published investment analysis on First Citizens Bancorporation. Ryan Beck does act as a market maker in First Citizens Bancorporation common stock.
In the ordinary course of its business as a broker-dealer, Ryan Beck may trade equity securities of First Citizens Bancorporation for its own account and the accounts of its customers and, accordingly, may at any time hold long or short positions in such securities.
Page 46