moremore more more more more more more more 2011 Annual Report expecting more ???e????er???e? more? ??re?e??e? ?????????????? more ??r??e?????o??? more ????e more? ?er?orm???e mor
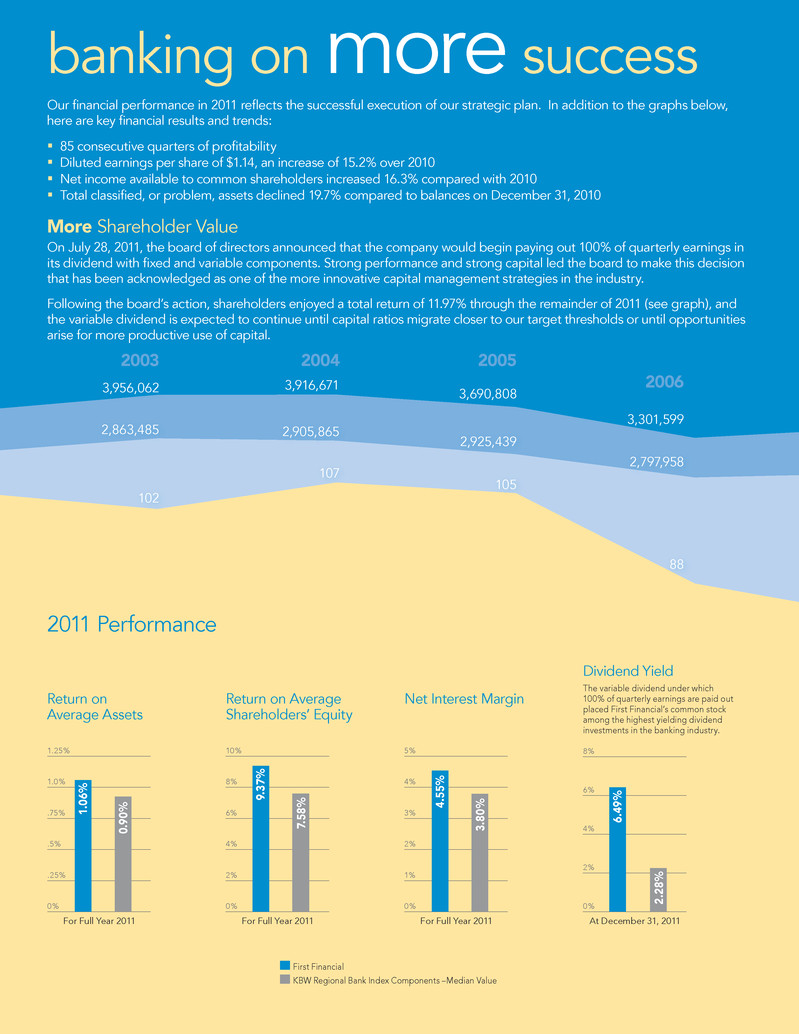
For Full Year 2011 Return on Average Shareholders’ Equity 7. 58 % For Full Year 2011 Net Interest Margin 5% 4% 3% 2% 1% 0% 4. 55 % 3. 80 % For Full Year 2011 Return on Average Assets 1.25% 1.0% .75% .5% .25% 0% 1. 06 % The variable dividend under which 100% of quarterly earnings are paid out placed First Financial’s common stock among the highest yielding dividend investments in the banking industry. Dividend Yield 8% 6% 4% 2% 0% At December 31, 2011 6. 49 % 2. 28 % 0. 90 %
102 106 104 87 banking on more success 2003 3,956,062 3,916,671 2004 3,690,808 2005 3,301,599 2006 2,863,485 2,905,865 2,925,439 2,797,958 Our financial performance in 2011 reflects the successful execution of our strategic plan. In addition to the graphs below, here are key financial results and trends: §? Diluted earnings per share of $1.14, an increase of 15.2% over 2010 §? Net income available to common shareholders increased 16.3% compared with 2010 §? Total classified or problem assets declined 19.7% compared to balances on December 31, 2010 More Shareholder Value On July 28, 2011, the board of directors announced that the company would begin paying out 100% of quarterly earnings in its dividend with fixed and variable components. Strong performance and strong capital led the board to make this decision that has been acknowledged as one of the more innovative capital management strategies in the industry. Following the board’s action, shareholders enjoyed a total return of 11.97% through the remainder of 2011 (see graph), and the variable dividend is expected to continue until capital ratios migrate closer to our target thresholds or until opportunities arise for more productive use of capital. 2011 Performance First Financial KBW Regional Bank Index Components –Median Value 10% 8% 6% 4% 2% 0% 9. 37 % As of December 31, 2011 Return on Average Shareholders’ Equity 7. 58 % As of December 31, 2011 Net Interest Margin 5% 4% 3% 2% 1% 0% 4. 55 % 3. 8% As of December 31, 2011 Return on Average Assets 1.25% 1.0% .75% .5% .25% 0% 1. 06 % The variable
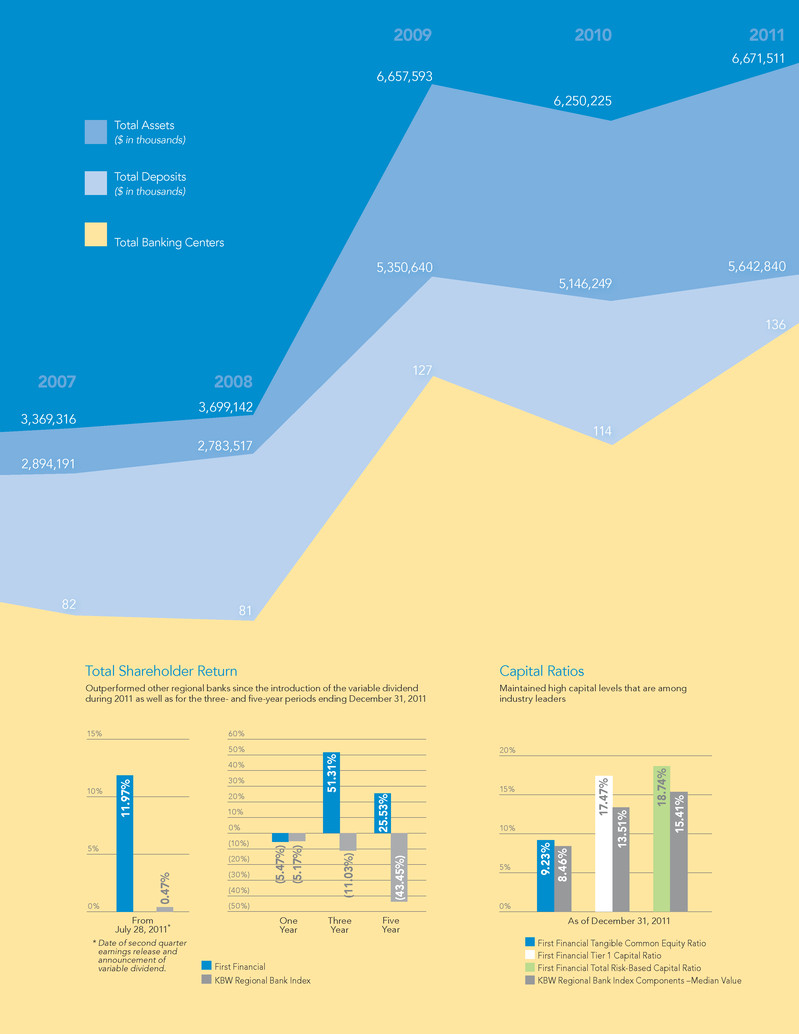
82 81 127 114 136 banking on more success 3,369,316 2007 3,699,142 2008 6,657,593 2009 6,250,225 2010 6,671,511 2011 2,894,191 2,783,517 5,350,640 5,146,249 5,642,840 Total Assets ($ in thousands) Total Deposits ($ in thousands) Total Banking Centers Maintained high capital levels that are among industry leaders Capital Ratios First Financial Tangible Common Equity Ratio First Financial Tier 1 Capital Ratio First Financial Total Risk-Based Capital Ratio KBW Regional Bank Index Components –Median Value 20% 15% 10% 5% 0% As of December 31, 2011 9. 23 % 8. 46 % 17 .4 7% 13 .5 1% 18 .7 4% 15 .4 1% First Financial KBW Regional Bank Index Outperformed other regional banks since the introduction of the variable dividend during 2011 as well as for the three- and five-year periods ending December 31, 2011 Total Shareholder Return 60% 50% 40% 30% 20% 10% 0% (10%) (20%) (30%) (40%) (50%) One Year Five Year Three Year 51.31 % 25.53 % (5.47% ) (5.17% ) (11.03% ) (43.45% ) * Date of second quarter earnings release and announcement of variable dividend. 15% 10% 5% 0% From July 28, 2011* 11.97 % 0.47 %
First Financial Bancorp 2011 Annual Report 1

an experience that delivers more More Client Service With our mission statement as a strategic foundation, we are focusing on creating a differentiated client experience through many touch points. Our banking center prototype continues to set the stage for a more visual and unique client experience. Large graphics in an open and inviting interior space create a welcoming environment where clients can visualize successful moments in their lives. During 2011, all newly acquired banking centers as well as 17 existing banking centers were updated with new graphics and other elements of our prototype. This expansion of the prototype look and feel across our footprint creates a more consistent brand and client experience. In 2011, online clients experienced a fresh new look on our redesigned bankatfirst.com website and the launch of our First Financial Facebook page. And there’s more to come in 2012. Our “on-the-go” clients will benefit from a more convenient mobile platform that provides simpler, easier access to their accounts. A new, more robust online banking solution will give clients greater control over their accounts and put real-time tracking, budgeting, and planning tools at their fingertips. Mission Statement We will exceed our clients’ expectations and satisfy their financial needs by building long-term relationships using a client-centered, value-added approach.
2 First Financial Bancorp 2011 Annual Report

Delivering More Value Our approach with clients is relationship focused, and we take the time to understand their current and future needs. Combining client information with our banking knowledge, financial expertise and common sense enables us to customize financial solutions and deliver them with personal care and more attention. As a community-oriented bank, we are able to attract more commercial loans with our laser-like focus on client needs, delivering an enhanced level of service that emphasizes all aspects of being “local.” Our goal is to create transparency in bringing together commercial, wealth management and personal banking choices for our clients. Deepening these relationships creates a differentiated and value-added client experience. Austin Allison, CEO of DotLoop, a growing business in Cincinnati, made this comment on his experience with his banking partner, “First Financial is agile and efficient in working with small businesses. It’s important for us to know that the people sitting at our table understand us, have access to the decision makers, and grow with us.”
First Financial Bancorp 2011 Annual Report 3
more presence and visibility First Financial Center In Downtown Cincinnati In 2011, we made a long-term commitment to establish our corporate headquarters in downtown Cincinnati. The First Financial Center at 255 East Fifth Street puts us in the heart of the central business district and adds the First Financial name to the Cincinnati skyline. The First Financial Center reflects the energy and excitement of the metropolitan area and provides office space for regional sales teams, key executives, and corporate support associates. This stronger Cincinnati presence fuels business development opportunities, brings and maintains jobs in the downtown area, and draws more top talent to our company. By mid-year 2012, our first full-service banking center in downtown Cincinnati will underscore our position as the largest community bank in Cincinnati and provide another convenient banking location for our clients who work and visit downtown.
4 First Financial Bancorp 2011 Annual Report
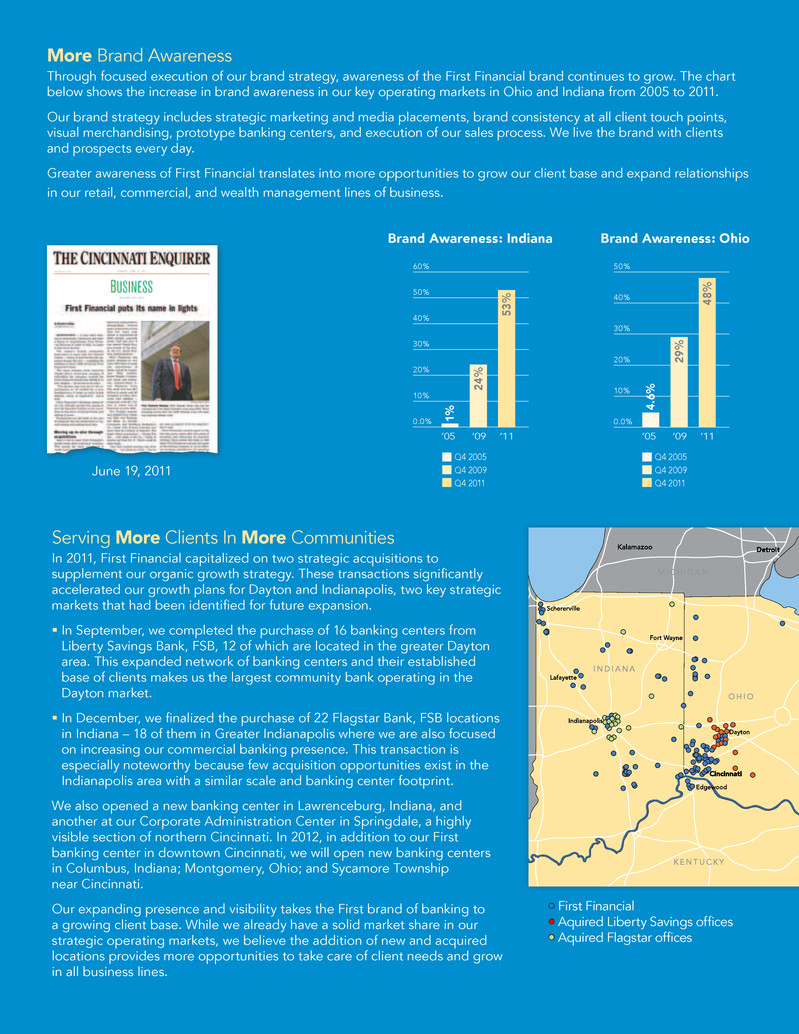
operating in the Dayton market. § In December, we finalized the purchase of 22 Flagstar Bank, FSB locations in Indiana – 18 of them in Greater Indianapolis where we are also focused on increasing our commercial banking presence. This transaction is especially noteworthy because few acquisition opportunities exist in the Indianapolis area with a similar scale and banking center footprint. We also opened a new banking center in Lawrenceburg, Indiana, and another at our Corporate Administration Center in Springdale, a highly visible section of northern Cincinnati. In 2012, in addition to our First banking center in downtown Cincinnati, we will open new banking centers in Columbus, Indiana; Montgomery, Ohio; and Sycamore Township near Cincinnati. Our expanding presence and visibility takes the First brand of banking to a growing client base. While we already have a solid market share in our strategic operating markets, we believe the addition of new and acquired locations provides more opportunities to take care of client needs and grow in all business lines. • First Financial • Aquired Liberty Savings offices • Aquired Flagstar offices 50% 40% 30% 20% 10% 0.0% 60% 50% 40% 30% 20% 10% 0.0% 29 % 24 % 4. 6% 1% 48 % 53 % Q4 2005 Q4 2009 Q4 2011 Q4 2005 Q4 2009 Q4 2011
First Financial Bancorp 2011 Annual Report 5
6 First Financial Bancorp 2011 Annual Report
and the many contributions of our associates that allow us to move into 2012 with a strong momentum for accomplishing more. Claude E. Davis, President and CEO
First Financial Bancorp 2011 Annual Report 7
directors and officers
|
| | |
| Board of Directors | | Senior Management |
| Murph Knapke | | Claude E. Davis |
| Chairman of the Board, | | President and |
| First Financial Bancorp; | | Chief Executive Officer |
| Owner, | | |
| Knapke Law Office, | | Richard Barbercheck |
| Attorney-at-Law | | Executive Vice President and |
| | | Chief Credit Officer |
| J. Wickliffe Ach | | |
| President and | | Michael J. Cassani |
| Chief Executive Officer, | | Executive Vice President, |
| Hixson, Inc. | | Wealth Management |
| | | |
| David S. Barker | | Gregory A. Gehlmann |
| President and | | Executive Vice President, |
| Chief Executive Officer, | | General Counsel |
| SIHO Insurance Services | | |
| | | J. Franklin Hall |
| Cynthia O. Booth | | Executive Vice President, |
| President and | | Chief Financial Officer and |
| Chief Executive Officer, | | Chief Operating Officer |
| COBCO Enterprises | | |
| | | Kevin T. Langford |
| Donald M. Cisle, Sr. | | Executive Vice President and |
| President, | | Chief Administrative Officer |
| Seward-Murphy, Inc. | | |
| | | C. Douglas Lefferson |
| Mark A. Collar | | Executive Vice President and |
| Partner, | | Chief Banking Officer |
| Triathlon Medical Ventures; | | |
| Retired President, | | Alisa E. Poe |
| Global Pharmaceuticals & | | Executive Vice President and |
| Personal Health, | | Chief Human Resources Officer |
| Procter & Gamble Company | | |
| | | Jill A. Stanton |
| Claude E. Davis | | Executive Vice President and |
| President and | | Co-Chief Retail Banking Officer |
| Chief Executive Officer, | | |
| First Financial Bancorp; | | Anthony M. Stollings |
| Chairman of the Board, President, | | Executive Vice President and |
| and Chief Executive Officer, | | Chief Risk Officer |
| First Financial Bank, N.A. | | |
| | | Jill L. Wyman |
| Corinne R. Finnerty | | Executive Vice President and |
| Partner, | | Co-Chief Retail Banking Officer |
| McConnell Finnerty Waggoner PC | | |
| | | Thomas J. Schuldt |
| Susan L. Knust | | Senior Vice President, |
| Managing Partner, | | Franchise and Specialty Finance |
| K.P. Properties and | | |
| Omega Warehouse Services | | John M. Gavigan |
| | | First Vice President and |
| William J. Kramer | | Corporate Controller |
| Vice President of Operations, | | |
| Valco Companies, Inc. | | |
| | | |
| Richard E. Olszewski | | |
| Owner, | | |
| 7 Eleven Food Stores | | |
| | | |
| Maribeth S. Rahe | | |
| President and | | |
| Chief Executive Officer, | | |
| Fort Washington Investment | | |
| Advisors, Inc. | | |
8 First Financial Bancorp 2011 Annual Report
|
| | | | | | | | | | | |
| FINANCIAL HIGHLIGHTS |
| | | | | | | |
| (Dollars in thousands, except per share data) | | 2011 | | 2010 | | % Change |
| Earnings | | | | | | |
| Net interest income | | $ | 263,896 |
| | $ | 275,510 |
| | (4.2 | )% |
| Net income | | 66,739 |
| | 59,251 |
| | 12.6 | % |
| Income available to common shareholders | | 66,739 |
| | 57,386 |
| | 16.3 | % |
| | | | | | | |
| Per Share | | | | | | |
| Net income per common share-basic | | $ | 1.16 |
| | $ | 1.01 |
| | 14.9 | % |
| Net income per common share-diluted | | 1.14 |
| | 0.99 |
| | 15.2 | % |
| Cash dividends declared per common share | | 0.78 |
| | 0.40 |
| | 95.0 | % |
| Tangible book value per common share (end of year) | | 10.41 |
| | 11.02 |
| | (5.5 | )% |
| Market price (end of year) | | 16.64 |
| | 18.48 |
| | (10.0 | )% |
| | | | | | | |
| Balance Sheet - End of Year | | | | | | |
| Total assets | | $ | 6,671,511 |
| | $ | 6,250,225 |
| | 6.7 | % |
| Deposits | | 5,642,840 |
| | 5,146,249 |
| | 9.6 | % |
| Loans, including covered loans | | 4,021,691 |
| | 4,297,586 |
| | (6.4 | )% |
| Investment securities | | 1,516,002 |
| | 1,015,205 |
| | 49.3 | % |
| Shareholders' equity | | 712,221 |
| | 697,394 |
| | 2.1 | % |
| | | | | | | |
| Ratios | | | | | | |
| Return on average assets | | 1.06 | % | | 0.91 | % | | |
| Return on average shareholders' equity | | 9.37 | % | | 8.68 | % | | |
| Average shareholders' equity to average assets | | 11.33 | % | | 10.53 | % | | |
| Net interest margin | | 4.55 | % | | 4.66 | % | | |
| Net interest margin (fully tax equivalent) | | 4.57 | % | | 4.68 | % | | |
First Financial Bancorp 2011 Annual Report 9
Management’s Discussion And Analysis Of Financial Condition And Results Of Operations
This annual report contains forward-looking statements. See the Forwarding Looking Statements section that follows for further information on the risks and uncertainties associated with forward-looking statements. The following discussion and analysis is presented to facilitate the understanding of the financial position and results of operations of First Financial Bancorp (First Financial or the Company). It identifies trends and material changes that occurred during the reporting periods and should be read in conjunction with the statistical data, Consolidated Financial Statements, and accompanying Notes.
EXECUTIVE SUMMARY
First Financial is a $6.7 billion bank holding company headquartered in Cincinnati, Ohio. As of December 31, 2011, First Financial, through its subsidiaries, operated in Ohio, Indiana, and Kentucky. These subsidiaries include a commercial bank, First Financial Bank, N.A. (First Financial Bank or the Bank) with 136 banking centers and 172 ATMs. An investment advisory company, First Financial Capital Advisors LLC, which had been a subsidiary of First Financial, was dissolved effective September 1, 2011. First Financial conducts three primary activities through its bank subsidiary: commercial banking, retail banking and wealth management. First Financial Bank provides credit based products, deposit accounts, corporate cash management support, and other services to commercial and retail clients. First Financial Wealth Management provides wealth planning, portfolio management, trust and estate, brokerage and retirement plan services. Additionally, the Bank conducts franchise lending by providing equipment and leasehold improvement financing for select franchisees and concepts in the quick service and casual dining restaurant sector throughout the United States. Loans to franchisees often include the financing of real estate as well as equipment.
First Financial’s return on average shareholders’ equity for 2011 was 9.37%, which compares to 8.68% and 47.44% for 2010 and 2009, respectively. First Financial’s return on average assets for 2011 was 1.06%, which compares to a return on average assets of 0.91% and 4.67% for 2010 and 2009, respectively.
The major components of First Financial’s operating results for the past five years are summarized in Table 1 – Financial Summary and discussed in greater detail on subsequent pages.
First Financial serves a combination of metropolitan and non-metropolitan markets in Ohio, Indiana and Kentucky through its full-service banking centers, while the franchise lending activity serves borrowers throughout the United States. First Financial’s market selection process includes a number of factors, but markets are primarily chosen for their potential for growth and long-term profitability. First Financial’s goal is to develop a competitive advantage utilizing a local market focus, building long-term relationships with clients, helping them reach greater levels of success in their financial life and providing a superior level of service. First Financial intends to continue to concentrate future growth plans and capital investments in its metropolitan markets. Smaller markets have historically provided stable, low-cost funding sources to First Financial and remain an important part of its funding base. First Financial believes its historical strength in these markets should enable it to retain or improve its market share.
During the first quarter of 2011, First Financial exited the four banking center locations comprising its Michigan geographic market as well as its single banking center in Louisville, Kentucky. First Financial decided to shift resources towards core markets such as Cincinnati and Dayton, Ohio and Indianapolis, Southern and Northwest Indiana that it believes will provide a higher level of potential overall growth while improving the efficiency of its operations. The five banking centers in Michigan and Louisville were acquired during 2009 as part of First Financial’s Federal Deposit Insurance Corporation (FDIC)-assisted transactions under which the Company assumed the banking operations of Irwin Union Bank and Trust Company and Irwin Union Bank, F.S.B. (collectively, Irwin).
BUSINESS COMBINATIONS
On September 23, 2011, First Financial Bank completed the purchase of 16 Ohio-based retail banking centers from Liberty Savings Bank, FSB (Liberty) including $126.5 million of performing loans and $341.9 million of deposits at their estimated fair values. First Financial also acquired $3.8 million of fixed assets at estimated fair value and paid Liberty a $22.4 million net deposit premium. Assets acquired in this transaction are not subject to a loss share agreement. First Financial recorded $17.1 million of goodwill related to this acquisition.
Loans acquired in conjunction with the Liberty banking center acquisition were evaluated for impairment in accordance with FASB ASC Topic 310-30, Loans and Debt Securities Acquired with Deteriorated Credit Quality. First Financial determined that the acquired loans were not impaired and is accounting for them under FASB ASC Topic 310-20, Receivables-Nonrefundable Fees and Costs.
10 First Financial Bancorp 2011 Annual Report
On December 2, 2011, First Financial Bank completed the purchase of 22 Indiana-based retail banking centers from Flagstar Bank, FSB (Flagstar) and assumed approximately $464.7 million of deposits at their estimated fair value. First Financial also acquired $6.6 million of fixed assets at estimated fair value and paid Flagstar a $22.5 million net deposit premium. Assets acquired in this transaction are not subject to a loss share agreement. First Financial recorded $26.1 million of goodwill related to this acquisition.
The majority of the retail banking centers acquired in the Liberty and Flagstar transactions are located in the metropolitan areas of Dayton, Ohio and Indianapolis, Indiana and are expected to help accelerate First Financial's growth plans in these strategic markets within the Company's footprint.
The Liberty and Flagstar banking center acquisitions were accounted for in accordance with FASB ASC Topic 805, Business Combinations. All acquired assets and liabilities, including identifiable intangible assets, were recorded at their estimated fair values as of the date of acquisition. Fair values are subject to refinement for up to one year after the closing date of the acquisition (the measurement period) as information relative to closing date fair values becomes available.
During the third quarter of 2009, through FDIC-assisted transactions, First Financial acquired the banking operations of Peoples Community Bank (Peoples) and Irwin. The acquisitions of the Peoples and Irwin franchises significantly expanded the First Financial footprint, opened new markets and strengthened the Company through the generation of additional capital.
In connection with the Peoples and Irwin FDIC-assisted transactions, First Financial entered into loss sharing agreements with the FDIC. Under the terms of these agreements the FDIC reimburses First Financial for a percentage of losses with respect to certain loans (covered loans) and other real estate owned (covered OREO) (collectively, covered assets). These agreements provide for loss protection on single-family, residential loans for a period of ten years and First Financial is required to share any recoveries of previously charged-off amounts for the same time period on the same pro-rata basis with the FDIC. All other loans are provided loss protection for a period of five years and recoveries of previously charged-off loans must be shared with the FDIC for a period of eight years, again on the same pro-rata basis. The FDIC's obligation to reimburse First Financial for losses with respect to covered assets acquired in these transactions began with the first dollar of loss incurred. Covered loans represent approximately 26% of First Financial’s loans at December 31, 2011.
First Financial must follow specific servicing and resolution procedures, as outlined in the loss share agreements, in order to receive reimbursement from the FDIC for losses on covered assets. The Company has established separate and dedicated teams of legal, finance, credit and technology staff to execute and monitor all activity related to each agreement, including the required periodic reporting to the FDIC. First Financial services all covered assets with the same resolution practices and diligence as it does for the assets that are not subject to a loss share agreement.
Covered loans acquired from Peoples totaling $421.0 million in unpaid principal balances at the date of acquisition are subject to a stated loss threshold of $190.0 million whereby the FDIC will reimburse First Financial for 80% of covered asset losses up to $190.0 million, and 95% of losses beyond $190.0 million.
Covered loans acquired from Irwin Union Bank totaling $1.9 billion in unpaid principal balances at the date of acquisition are subject to a stated loss threshold of $526.0 million whereby the FDIC will reimburse First Financial for 80% of covered asset losses up to $526.0 million, and 95% of losses beyond $526.0 million.
Covered loans acquired from Irwin FSB totaling $368.1 million in unpaid principal balances at the date of acquisition are subject to a stated loss threshold of $110.0 million whereby the FDIC will reimburse First Financial for 80% of covered asset losses up to $110.0 million, and 95% of losses beyond $110.0 million.
The Peoples and Irwin FDIC-assisted acquisitions were considered business combinations and were accounted for under FASB ASC Topic 805, Business Combinations; FASB ASC Topic 820, Fair Value Measurements and Disclosures; FASB ASC Topic 310-30, Loans and Debt Securities Acquired with Deteriorated Credit Quality; and FASB ASC Topic 310-20, Receivables-Nonrefundable Fees and Costs. All acquired assets and liabilities, including identifiable intangible assets, were recorded at their estimated fair values as of the date of acquisition.
First Financial Bancorp 2011 Annual Report 11
Management’s Discussion And Analysis Of Financial Condition And Results Of Operations
|
| | | | | | | | | | | | | | | | | | | |
| Table 1 • Financial Summary | | | | | | | | | |
| | | | | | | | | | |
| | December 31, |
| (Dollars in thousands, except per share data) | 2011 | | 2010 | | 2009 | | 2008 | | 2007 |
| Summary of operations | | | | | | | | | |
| Interest income | $ | 308,817 |
| | $ | 343,502 |
| | $ | 233,228 |
| | $ | 183,305 |
| | $ | 206,442 |
|
Tax equivalent adjustment (1) | 979 |
| | 866 |
| | 1,265 |
| | 1,808 |
| | 2,281 |
|
Interest income tax – equivalent (1) | 309,796 |
| | 344,368 |
| | 234,493 |
| | 185,113 |
| | 208,723 |
|
| Interest expense | 44,921 |
| | 67,992 |
| | 57,245 |
| | 67,103 |
| | 87,942 |
|
Net interest income tax – equivalent (1) | $ | 264,875 |
| | $ | 276,376 |
| | $ | 177,248 |
| | $ | 118,010 |
| | $ | 120,781 |
|
| Interest income | $ | 308,817 |
| | $ | 343,502 |
| | $ | 233,228 |
| | $ | 183,305 |
| | $ | 206,442 |
|
| Interest expense | 44,921 |
| | 67,992 |
| | 57,245 |
| | 67,103 |
| | 87,942 |
|
| Net interest income | 263,896 |
| | 275,510 |
| | 175,983 |
| | 116,202 |
| | 118,500 |
|
| Provision for loan and lease losses – uncovered | 19,210 |
| | 33,564 |
| | 56,084 |
| | 19,410 |
| | 7,652 |
|
| Provision for loan and lease losses – covered | 64,081 |
| | 63,144 |
| | 0 |
| | 0 |
| | 0 |
|
| Noninterest income | 142,531 |
| | 146,831 |
| | 404,715 |
| | 51,749 |
| | 63,588 |
|
| Noninterest expenses | 218,097 |
| | 233,680 |
| | 170,638 |
| | 115,176 |
| | 120,747 |
|
| Income before income taxes | 105,039 |
| | 91,953 |
| | 353,976 |
| | 33,365 |
| | 53,689 |
|
| Income tax expense | 38,300 |
| | 32,702 |
| | 132,639 |
| | 10,403 |
| | 18,008 |
|
| Net income | 66,739 |
| | 59,251 |
| | 221,337 |
| | 22,962 |
| | 35,681 |
|
| Dividends on preferred stock | 0 |
| | 1,865 |
| | 3,578 |
| | 0 |
| | 0 |
|
| Income available to common shareholders | $ | 66,739 |
| | $ | 57,386 |
| | $ | 217,759 |
| | $ | 22,962 |
| | $ | 35,681 |
|
| | | | | | | | | | |
| Per share data | | | | | | | | | |
| Earnings per common share | | | | | | | | | |
| Basic | $ | 1.16 |
| | $ | 1.01 |
| | $ | 4.84 |
| | $ | 0.62 |
| | $ | 0.93 |
|
| Diluted | $ | 1.14 |
| | $ | 0.99 |
| | $ | 4.78 |
| | $ | 0.61 |
| | $ | 0.93 |
|
| Cash dividends declared per common share | $ | 0.78 |
| | $ | 0.40 |
| | $ | 0.40 |
| | $ | 0.68 |
| | $ | 0.65 |
|
| Average common shares outstanding–basic (in thousands) | 57,692 |
| | 56,969 |
| | 45,029 |
| | 37,112 |
| | 38,455 |
|
| Average common shares outstanding–diluted (in thousands) | 58,693 |
| | 57,993 |
| | 45,557 |
| | 37,484 |
| | 38,459 |
|
| | | | | | | | | | |
| Selected year-end balances | | | | | | | | | |
| Total assets | $ | 6,671,511 |
| | $ | 6,250,225 |
| | $ | 6,657,593 |
| | $ | 3,699,142 |
| | $ | 3,369,316 |
|
| Earning assets | 6,110,934 |
| | 5,741,683 |
| | 5,964,853 |
| | 3,379,873 |
| | 3,054,128 |
|
Investment securities (2) | 1,516,002 |
| | 1,015,205 |
| | 579,147 |
| | 692,759 |
| | 346,536 |
|
| Loans, excluding covered loans | 2,968,447 |
| | 2,816,093 |
| | 2,895,129 |
| | 2,683,260 |
| | 2,599,087 |
|
| Covered loans | 1,053,244 |
| | 1,481,493 |
| | 1,934,740 |
| | 0 |
| | 0 |
|
| Total loans | 4,021,691 |
| | 4,297,586 |
| | 4,829,869 |
| | 2,683,260 |
| | 2,599,087 |
|
| FDIC indemnification asset | 173,009 |
| | 222,648 |
| | 287,407 |
| | 0 |
| | 0 |
|
| Interest-bearing demand deposits | 1,317,339 |
| | 1,111,877 |
| | 1,060,383 |
| | 636,945 |
| | 603,870 |
|
| Savings deposits | 1,724,659 |
| | 1,534,045 |
| | 1,231,081 |
| | 583,081 |
| | 596,636 |
|
| Time deposits | 1,654,662 |
| | 1,794,843 |
| | 2,229,500 |
| | 1,150,208 |
| | 1,227,954 |
|
| Noninterest-bearing demand deposits | 946,180 |
| | 705,484 |
| | 829,676 |
| | 413,283 |
| | 465,731 |
|
| Total deposits | 5,642,840 |
| | 5,146,249 |
| | 5,350,640 |
| | 2,783,517 |
| | 2,894,191 |
|
| Short-term borrowings | 99,431 |
| | 59,842 |
| | 37,430 |
| | 354,533 |
| | 98,289 |
|
| Long-term debt | 76,544 |
| | 128,880 |
| | 404,716 |
| | 148,164 |
| | 45,896 |
|
| Other long-term debt | 0 |
| | 20,620 |
| | 20,620 |
| | 20,620 |
| | 20,620 |
|
| Shareholders’ equity | 712,221 |
| | 697,394 |
| | 649,958 |
| | 348,327 |
| | 276,583 |
|
| | | | | | | | | | |
| Select Financial Ratios | | | | | | | | | |
Average loans to average deposits (3) | 78.53 | % | | 86.43 | % | | 92.56 | % | | 95.14 | % | | 90.03 | % |
| Net charge-offs to average loans, excluding covered loans | 0.84 | % | | 1.27 | % | | 1.16 | % | | 0.47 | % | | 0.24 | % |
| Average shareholders’ equity to average total assets | 11.33 | % | | 10.53 | % | | 9.85 | % | | 8.16 | % | | 8.47 | % |
| Average common shareholders’ equity to average total assets | 11.33 | % | | 10.35 | % | | 8.20 | % | | 8.11 | % | | 8.47 | % |
| Return on average assets | 1.06 | % | | 0.91 | % | | 4.67 | % | | 0.67 | % | | 1.08 | % |
| Return on average common equity | 9.37 | % | | 8.55 | % | | 56.07 | % | | 8.27 | % | | 12.73 | % |
| Return on average equity | 9.37 | % | | 8.68 | % | | 47.44 | % | | 8.21 | % | | 12.73 | % |
| Net interest margin | 4.55 | % | | 4.66 | % | | 4.05 | % | | 3.71 | % | | 3.94 | % |
Net interest margin (tax equivalent basis) (1) | 4.57 | % | | 4.68 | % | | 4.08 | % | | 3.77 | % | | 4.01 | % |
| Dividend payout | 67.24 | % | | 39.60 | % | | 8.26 | % | | 109.68 | % | | 69.89 | % |
(1) Tax equivalent basis was calculated using a 35.00% tax rate in all years presented.
(2) Includes investment securities held-to-maturity, investment securities available-for-sale, investment securities trading, and other investments.
(3) Includes covered loans.
12 First Financial Bancorp 2011 Annual Report
OVERVIEW OF OPERATIONS
The primary source of First Financial’s revenue is net interest income, the excess of interest received from earning assets over interest paid on interest-bearing liabilities, plus the fees for financial services provided to clients. First Financial’s business results tend to be influenced by overall economic factors and conditions, including market interest rates, competition within the marketplace, business spending, consumer confidence and regulatory changes.
Net interest income in 2011 declined 4.2% from 2010, compared to a 56.6% increase from 2009 to 2010. The decline in 2011 was attributable to a 26.8% decrease in average covered loan balances and a lower yield on the FDIC indemnification asset. Average earning assets declined $105.3 million, or 1.78%, during 2011. The net interest margin was 4.55% for 2011 compared with 4.66% in 2010 and 4.05% in 2009.
Loan growth during 2011 was negatively impacted by the runoff of covered loans as well as lower origination volume due to the prolonged weakness in the U.S. economy. Total loans decreased from $4.3 billion at December 31, 2010 to $4.0 billion at December 31, 2011, a $275.9 million decrease. Total loans, excluding covered loans, increased $152.4 million, from $2.8 billion at December 31, 2010 to $3.0 billion at December 31, 2011 while total covered loans decreased $428.2 million, from $1.5 billion at December 31, 2010 to $1.1 billion at December 31, 2011. The Liberty banking center acquisition completed in September 2011 included $126.5 million of performing, non-covered loans.
First Financial experienced significant deposit growth in 2011 as a result of the Liberty and Flagstar banking center acquisitions. Total deposits increased $496.6 million, or 9.6%, from 2010 to 2011. Total time deposits decreased $140.2, million or 7.8%, from 2010 to 2011, while total transaction and savings deposits increased $636.8 million, or 19.0%, during this time.
Noninterest income declined by $4.3 million in 2011. Noninterest income during 2011 was positively impacted by a gain on sale of investment securities as well as higher FDIC loss sharing income related to reimbursements for losses on covered loans but was negatively impacted by declines in service charges on deposits, income related to accelerated discounts on covered loans that prepay and other noninterest income.
Noninterest expense decreased by $15.6 million in 2011 primarily due to declines in salaries and benefits, debt extinguishment expense and FDIC assessment costs, partially offset by higher losses and valuation adjustments on OREO during the year.
First Financial's credit quality began to deteriorate early in 2009 and continued through much of 2010 due to sustained weakness in the economy and falling real estate values in all sectors. Positive signs began to emerge late in 2010 with respect to credit performance of the loan portfolio and credit conditions continued to improve at a moderate pace throughout much of 2011. First Financial experienced improvement in its commercial, construction real estate and home equity loan portfolios during 2011. However, the Company continued to experience stress in its commercial real estate portfolio as borrowers with previously sufficient capital levels and liquidity struggled to withstand the protracted economic strain of recent years. The lower levels of net charge-offs, nonperforming assets, classified assets and provision expense in 2011 reflect improving economic conditions, including lower unemployment rates and higher business and consumer spending as compared to 2010. While conditions were improved in 2011, significant challenges to a broad economic recovery remain, including elevated vacancy rates, lower rents, depressed property values and persistently high unemployment rates. Management expects credit quality trends could remain volatile until economic conditions exhibit consistent improvement, including lower levels of unemployment and stabilization of property values.
The allowance at December 31, 2011, was $52.6 million, or 1.77%, of loans, a 26 basis point decline from 2.03% of loans at December 31, 2010. While credit conditions remain volatile, management believes First Financial’s coverage ratios represent an appropriate level of reserves to absorb probable loan and lease losses inherent in the portfolio.
For a more detailed discussion of the above topics, please refer to the sections that follow.
NET INCOME
2011 vs. 2010. First Financial’s net income increased $7.5 million, or 12.6%, to $66.7 million in 2011, compared to net income of $59.3 million in 2010. Net interest income decreased $11.6 million, or 4.2%, in 2011 from 2010 due to lower interest income earned on loans and other earning assets, primarily driven by a 26.8% decrease in average covered loans outstanding. Net interest income in 2011 was positively impacted by the Liberty banking center acquisition as well as organic growth in both the commercial and commercial real estate loan portfolios. A contributing factor to the decline in net interest income was
First Financial Bancorp 2011 Annual Report 13
Management’s Discussion And Analysis Of Financial Condition And Results Of Operations
the decline in average earning assets of $105.3 million, or 1.8%, during 2011. For more detail, refer to Table 2 – Volume/Rate Analysis and the Net Interest Income section.
2010 vs. 2009. First Financial’s net income decreased $162.1 million, or 73.2%, to $59.3 million in 2010, compared to net income of $221.3 million in 2009. Net income in 2009 included a $213.2 million bargain purchase gain, net of taxes, related to the Irwin acquisition. Net interest income increased $99.5 million, or 56.6%, in 2010 from 2009 primarily due to the full year impact of First Financial’s expanded operations as a result of the Peoples and Irwin acquisitions in 2009. Net interest income in 2010 was positively impacted by the increased earning asset base resulting from acquisitions as well as continued runoff of retail and brokered certificates of deposit. Average earning assets increased $1.6 billion, or 36.0%, during 2010 due to the full year impact of the acquisitions in 2009.
NET INTEREST INCOME
First Financial’s net interest income for the years 2007 through 2011 is shown in Table 1 – Financial Summary. Net interest income, First Financial’s principal source of income, is the excess of interest received from earning assets over interest paid on interest-bearing liabilities. The amount of net interest income is determined by the volume and mix of earning assets, the rates earned on such earning assets, and the volume, mix, and rates paid for the deposits and borrowed money that support the earning assets. Table 2 – Volume/Rate Analysis describes the extent to which changes in interest rates and changes in volume of earning assets and interest-bearing liabilities have affected First Financial’s net interest income on a tax equivalent basis during the years indicated. Nonaccruing loans and loans held for sale, excluding covered loans, were included in the daily average loan balances used in determining the yields in Table 2 – Volume/Rate Analysis. Table 2 – Volume/Rate Analysis should be read in conjunction with the Statistical Information table.
Interest income on a tax equivalent basis is presented in Table 1 – Financial Summary. The tax equivalent adjustment recognizes the income tax savings when comparing taxable and tax-exempt assets and assumes a 35.0% tax rate for all years presented. The tax equivalent net interest margin was 4.57%, 4.68% and 4.08% for the years 2011, 2010 and 2009, respectively.
The amount of loan fees included in the interest income computation for 2011, 2010 and 2009 was $5.6 million, $4.4 million and $1.4 million, respectively. The increase in loan fees in 2011 is primarily due to collection fee income on covered loans.
2011 vs. 2010. Interest income was $308.8 million in 2011, a $34.7 million or 10.1% increase from 2010. The yield on earning assets decreased 49 basis points from 5.81% in 2010 to 5.32% in 2011, reflecting a decline in the acquired, covered loan portfolio which generally accretes a yield above market interest rates. Interest expense was $44.9 million in 2011, a decrease of $23.1 million, or 33.9%, from 2010. The total cost of funds decreased 44 basis points to 0.96% in 2011 from 1.40% in 2010, primarily due to a 39 basis point decrease in the cost of interest-bearing deposits to 0.91% in 2011 from 1.30% in 2010 as a result of deposit rationalization strategies implemented in 2011.
Net interest income decreased $11.6 million, or 4.2%, primarily due to the decreased level of earning assets. A contributing factor to the decline in net interest income was the decline in average earning assets of $105.3 million, or 1.8%, during 2011.
2010 vs. 2009. Interest income was $343.5 million in 2010, a $110.3 million, or 47.3%, increase from 2009. The yield on earning assets increased 44 basis points from 5.37% in 2009 to 5.81% in 2010, reflecting the positive full year impact of the acquired, covered loan portfolio which generally accretes a yield above market interest rates. Interest expense was $68.0 million in 2010, an increase of $10.7 million, or 18.8%, from 2009. The total cost of funds decreased 16 basis points to 1.40% in 2010, from 1.56% in 2009, primarily due to the continued runoff of higher priced retail and brokered certificates of deposit.
Net interest income increased $99.5 million, or 56.6%, primarily due to the increased level of earnings assets, including covered loans and their accretable yield. The increase was also positively impacted by the repricing of the assumed deposit portfolio. Average earning assets increased $1.6 billion, or 36.0%, during 2010.
14 First Financial Bancorp 2011 Annual Report
|
| | | | | | | | | | | | | | | | | | | | | | | | |
Table 2 • Volume/Rate Analysis - Tax Equivalent Basis (1) | | | | |
| | | | | | | | | |
| | | 2011 change from 2010 due to | | 2010 change from 2009 due to |
| (Dollars in thousands) | | VOLUME | RATE | | TOTAL | | VOLUME | RATE | | TOTAL |
| Interest income | | | | | | | | | | | | |
Loans (2) | | $ | 1,563 |
| | $ | (3,059 | ) | | $ | (1,496 | ) | | $ | (190 | ) | | $ | 1,719 |
| | $ | 1,529 |
|
| Covered loans and indemnification asset | | (49,103 | ) | | 10,231 |
| | (38,872 | ) | | 111,652 |
| | 3,810 |
| | 115,462 |
|
Investment securities (3) | | | | | | | | | | | | |
| Taxable | | 12,242 |
| | (5,751 | ) | | 6,491 |
| | 140 |
| | (7,768 | ) | | (7,628 | ) |
| Tax-exempt | | (356 | ) | | 99 |
| | (257 | ) | | (710 | ) | | (138 | ) | | (848 | ) |
Total investment securities interest (3) | | 11,886 |
| | (5,652 | ) | | 6,234 |
| | (570 | ) | | (7,906 | ) | | (8,476 | ) |
| Interest-bearing deposits with other banks | | (306 | ) | | (132 | ) | | (438 | ) | | 1,052 |
| | 308 |
| | 1,360 |
|
| Total | | (35,960 | ) | | 1,388 |
| | (34,572 | ) | | 111,944 |
| | (2,069 | ) | | 109,875 |
|
| | | | | | | | | | | | | |
| Interest expense | | | | | | | | | | | | |
| Interest-bearing demand deposits | | 284 |
| | (1,637 | ) | | (1,353 | ) | | 855 |
| | 355 |
| | 1,210 |
|
| Savings deposits | | 835 |
| | (3,358 | ) | | (2,523 | ) | | 3,711 |
| | 1,157 |
| | 4,868 |
|
| Time deposits | | (7,617 | ) | | (6,062 | ) | | (13,679 | ) | | 11,132 |
| | (6,454 | ) | | 4,678 |
|
| Short-term borrowings | | 82 |
| | (13 | ) | | 69 |
| | (389 | ) | | (835 | ) | | (1,224 | ) |
| Long-term debt | | (7,342 | ) | | 2,587 |
| | (4,755 | ) | | 2,083 |
| | (887 | ) | | 1,196 |
|
| Other long-term debt | | (402 | ) | | (428 | ) | | (830 | ) | | 0 |
| | 19 |
| | 19 |
|
| Total | | (14,160 | ) | | (8,911 | ) | | (23,071 | ) | | 17,392 |
| | (6,645 | ) | | 10,747 |
|
| Net interest income | | $ | (21,800 | ) | | $ | 10,299 |
| | $ | (11,501 | ) | | $ | 94,552 |
| | $ | 4,576 |
| | $ | 99,128 |
|
(1) Tax equivalent basis was calculated using a 35.00% tax rate.
(2) Includes nonaccrual loans and loans held-for-sale.
(3) Includes investment securities held-to-maturity, investment securities available-for-sale and other investments.
NONINTEREST INCOME AND NONINTEREST EXPENSES
Noninterest income and noninterest expenses for 2011, 2010 and 2009 are shown in Table 3 – Noninterest Income and Noninterest Expenses.
NONINTEREST INCOME
2011 vs. 2010. Noninterest income decreased $4.3 million, or 2.9%, from 2010. Noninterest income in 2011 included $60.9 million related to the proportionate share of credit losses on covered loans that First Financial expects to receive from the FDIC, which was a $9.0 million increase from $51.8 million in 2010. First Financial recorded a pre-tax gain on the sale of investment securities in the fourth quarter of 2011 of $2.5 million, also increasing non-interest income. These increases were offset by an $8.5, million or 29.4%, decrease in income related to accelerated discounts on covered loans as well as a $3.0 million, or 13.4%, decrease in service charges on deposits. Other noninterest income decreased $5.3 million in 2011 primarily related to a gain on sale of an insurance business and final resolution of FDIC settlement items related to the Irwin acquisition in 2010, as well as a decline in insurance fee income partially offset by an increase in client derivative fees in 2011. Accelerated discounts on covered loans result from the immediate or accelerated recognition of a component of the covered loan discount that would have been recognized over the expected life of the loan, had it not prepaid.
2010 vs. 2009. Noninterest income decreased $257.9 million, or 63.7%, from 2009. Noninterest income in 2009 included a $342.5 million bargain purchase gain on the Irwin acquisition. Noninterest income in 2010 also included $51.8 million related to the proportionate share of credit losses on covered loans that First Financial expects to receive from the FDIC. Net of the bargain purchase gain on acquisitions and the FDIC loss sharing income described above, noninterest income increased $32.8 million, or 52.7%, in 2010 as compared with 2009, primarily due to higher service charges on deposits, bankcard income and gains from sales of loans related to residential mortgage originations. The full year impact of income earned on covered loans that prepay was a significant factor as well.
First Financial Bancorp 2011 Annual Report 15
Management’s Discussion And Analysis Of Financial Condition And Results Of Operations
|
| | | | | | | | | | | | | | | | | |
| Table 3 • Noninterest Income and Noninterest Expense |
| | | | | | | | | |
| | 2011 | | 2010 | | 2009 |
| | | % Change | | | % Change | | | % Change |
| | | Increase | | | Increase | | | Increase |
| (Dollars in thousands) | Total | (Decrease) | | Total | (Decrease) | | Total | (Decrease) |
| Noninterest income | | | | | | | | |
| Service charges on deposit accounts | $ | 19,206 |
| (13.4 | )% | | $ | 22,188 |
| 12.8 | % | | $ | 19,662 |
| — | % |
| Trust and wealth management fees | 14,340 |
| 3.4 | % | | 13,862 |
| 2.9 | % | | 13,465 |
| (22.7 | )% |
| Bankcard income | 9,291 |
| 9.1 | % | | 8,518 |
| 42.9 | % | | 5,961 |
| 5.4 | % |
| Net gains from sales of loans | 4,258 |
| (8.1 | )% | | 4,632 |
| 287.3 | % | | 1,196 |
| 8.3 | % |
| Gain on acquisition | 0 |
| N/M |
| | 0 |
| (100.0 | )% | | 342,494 |
| N/M |
|
| FDIC loss sharing income | 60,888 |
| 17.4 | % | | 51,844 |
| N/M |
| | 0 |
| N/M |
|
| Accelerated discount on covered loans | 20,521 |
| (29.4 | )% | | 29,067 |
| 237.9 | % | | 8,601 |
| N/M |
|
| (Loss) income on preferred securities | 0 |
| (100.0 | )% | | (30 | ) | (121.6 | )% | | 139 |
| (103.7 | )% |
| Other | 11,486 |
| (31.4 | )% | | 16,750 |
| 70.1 | % | | 9,848 |
| (2.3 | )% |
| Subtotal | 139,990 |
| (4.7 | )% | | 146,831 |
| (63.4 | )% | | 401,366 |
| 700.1 | % |
| Gains on sales of investment securities | 2,541 |
| N/M |
| | 0 |
| (100.0 | )% | | 3,349 |
| 111.3 | % |
| Total | $ | 142,531 |
| (2.9 | )% | | $ | 146,831 |
| (63.7 | )% | | $ | 404,715 |
| 682.1 | % |
| | | | | | | | | |
| | | | | | | | | |
| Noninterest expenses | | | | | | | | |
| Salaries and employee benefits | $ | 106,914 |
| (8.9 | )% | | $ | 117,363 |
| 36.4 | % | | $ | 86,068 |
| 28.7 | % |
| Net occupancy | 21,410 |
| (5.1 | )% | | 22,555 |
| 39.2 | % | | 16,202 |
| 52.3 | % |
| Furniture and equipment | 9,945 |
| (3.4 | )% | | 10,299 |
| 27.9 | % | | 8,054 |
| 20.1 | % |
| Data processing | 5,716 |
| 10.9 | % | | 5,152 |
| 48.3 | % | | 3,475 |
| 7.3 | % |
| Marketing | 5,794 |
| 8.2 | % | | 5,357 |
| 53.3 | % | | 3,494 |
| 37.1 | % |
| Communication | 3,203 |
| (18.0 | )% | | 3,908 |
| 20.4 | % | | 3,246 |
| 13.5 | % |
| Professional services | 9,636 |
| 5.1 | % | | 9,169 |
| 52.0 | % | | 6,032 |
| 74.2 | % |
| Debt extinguishment | 0 |
| (100.0 | )% | | 8,029 |
| N/M |
| | 0 |
| N/M |
|
| State intangible tax | 3,583 |
| (26.0 | )% | | 4,843 |
| 93.1 | % | | 2,508 |
| 0.1 | % |
| FDIC assessments | 5,676 |
| (31.7 | )% | | 8,312 |
| 21.4 | % | | 6,847 |
| 1,786.2 | % |
| Loss-other real estate owned | 3,971 |
| 241.4 | % | | 1,163 |
| 334.0 | % | | 268 |
| N/M |
|
| Loss-covered other real estate owned | 9,224 |
| 907.0 | % | | 916 |
| N/M |
| | 0 |
| N/M |
|
| Other | 33,025 |
| (9.8 | )% | | 36,614 |
| 6.3 | % | | 34,444 |
| 115.4 | % |
| Total | $ | 218,097 |
| (6.7 | )% | | $ | 233,680 |
| 36.9 | % | | $ | 170,638 |
| 48.2 | % |
N/M = Not meaningful
NONINTEREST EXPENSES
2011 vs. 2010. Noninterest expenses decreased $15.6 million, or 6.7%, for 2011 compared to 2010 due to an $8.0 million prepayment penalty on Federal Home Loan Bank (FHLB) advances prepaid in 2010, lower FDIC assessment costs and lower salaries and benefits. Salaries and benefits expenses decreased $10.4 million, or 8.9%, from 2010 primarily as a result of pension income recognized in 2011 due to the funded status of the pension plan compared to expense in 2010, as well as the Company exiting five banking center locations in Michigan and Kentucky during the first quarter of 2011 and other cost management efforts.
Noninterest expenses included $4.0 million and $9.2 million of losses and valuation adjustments on uncovered and covered OREO properties, respectively, resulting in a combined increase of $11.1 million in noninterest expense compared to 2010 which was partially offset by a $3.6 million decline in acquisition and covered loan related expenses during 2011.
16 First Financial Bancorp 2011 Annual Report
2010 vs. 2009. Noninterest expenses increased $63.0 million, or 36.9%, for 2010 compared to 2009 due to higher FDIC costs, debt prepayment charges and general growth and expansion, including acquisitions. Salaries and employee benefits increased $31.3 million, or 36.4%, from 2009 primarily due to higher expenses related to acquisitions and greater staffing levels as well as the additional banking centers in operation during 2010.
Noninterest expenses in 2010 included an $8.0 million charge related to the prepayment of long term debt assumed in the 2009 acquisitions and $2.1 million in losses on the sale of OREO properties. Professional service fees increased $3.1 million, or 52.0%, primarily due to higher legal costs and other professional services directly related to the Company’s growth as well as continued costs related to the acquisitions in 2009. A $1.5 million increase in FDIC expense due to elevated assessment rates and increased deposits as well as a combined $10.3 million, or 37.1%, increase in net occupancy, furniture and equipment, and data processing expenses related to additional banking centers contributed to the increase in noninterest expense in 2010. The increase in other noninterest expense during 2010 was primarily due to amortization of intangible assets related to FDIC-assisted transactions and higher credit origination costs and regulatory assessment fees.
INCOME TAXES
First Financial’s tax expense in 2011 totaled $38.3 million compared to $32.7 million in 2010 and $132.6 million in 2009, resulting in effective tax rates of 36.5%, 35.6% and 37.5% in 2011, 2010 and 2009, respectively. The increase in the effective tax rate in 2011 compared to 2010 was primarily due to a decline in certain tax credits during the year as well as the marginal impact of 2011's higher pre-tax earnings. The decrease in the effective tax rate in 2010 from 2009 was due to the marginal impact of 2010’s lower pre-tax earnings.
Further information on income taxes is presented in Note 15 of the Notes to Consolidated Financial Statements.
LOANS
First Financial, primarily through its banking subsidiary, remains dedicated to meeting the financial needs of individuals and businesses through its client-focused business model. The loan portfolio is comprised of a broad range of borrowers primarily in the Ohio, Indiana and Kentucky markets; however, the franchise finance lending activity represents a national client base. All loans acquired in the Peoples and Irwin acquisitions during 2009 were acquired under loss share agreements whereby the FDIC reimburses First Financial for losses incurred in accordance with those loss sharing agreements. First Financial’s loan portfolio is composed of commercial, real estate construction and commercial real estate loans (collectively, commercial loans), as well as residential real estate, home equity and other consumer financing loans (collectively, consumer loans).
Commercial – Commercial loans include revolving lines of credit and term loans to commercial customers for use in normal business operations to finance working capital needs, equipment purchases, leasehold improvements or other projects. Commercial loans are generally underwritten individually and secured with the assets of the company and/or the personal guarantee of the business owners. Commercial loans also include equipment and leasehold improvement financing for franchisees, principally quick service and casual dining restaurants. First Financial focuses on a limited number of concepts that have sound economics, low closure rates, and brand awareness within specified local, regional, or national markets. Additionally, First Financial began to place additional emphasis on its asset-based lending (ABL) originations during 2011. ABL transactions typically involve larger commercial clients and are secured by specific assets, such as inventory, accounts receivable, machinery and equipment.
Real Estate Construction – Real estate construction loans are term loans to individuals, companies or developers used for the construction of a commercial or residential property for which repayment will be generated by the sale or permanent financing of the property. Generally, these loans are for construction projects that have been either presold, preleased, or have secured permanent financing, as well as loans to real estate companies with significant equity invested in the project. Real estate construction loans are underwritten and managed by experienced lending officers that actively monitor the construction phase and manage the loan disbursements. First Financial continues to restrict real estate construction lending due to excess supply and declining property values in recent years.
Commercial Real Estate – Commercial real estate loans consist of term loans secured by a mortgage lien on the real estate properties, such as apartment buildings, office and industrial buildings, and retail shopping centers. The credit underwriting for both owner-occupied and investor income producing real estate loans includes detailed market analysis, historical and projected cash flow analysis, appropriate equity margins, assessment of lessees and lessors, type of real estate and other analysis.
First Financial Bancorp 2011 Annual Report 17
Management’s Discussion And Analysis Of Financial Condition And Results Of Operations
Residential Real Estate – Residential real estate loans represent loans to consumers for the purchase or refinance of a residence.
These loans are generally financed over a 15 to 30 year term, and in most cases, are extended to borrowers to finance their primary residence. In 2005, First Financial made the strategic decision to discontinue the origination of residential real estate loans for retention on its balance sheet and currently sells substantially all residential real estate loan originations into the secondary market on a servicing released basis.
Home Equity – Home equity lending includes both home equity loans and lines of credit and is secured by a first- or second- lien on the borrower’s residence. Home equity loans and lines of credit are underwritten to adhere to debt-to-income and loan-to-value policy limits.
Other Consumer Financing – Other types of consumer financing consists of consumer loans not secured by real estate, including loans secured by automobiles, and personal unsecured loans.
Additionally, First Financial's franchise lending portfolio is managed to a risk-appropriate level so as not to create an industry, geographic or franchisee concept concentration.
|
| | | | | | | | | | | | | | | | | | | |
| Table 4 • Loan Portfolio | | | | | | | | | |
| | | | | | | | | | |
| | December 31, |
| (Dollars in thousands) | 2011 | | 2010 | | 2009 | | 2008 | | 2007 |
| Commercial | $ | 856,981 |
| | $ | 800,253 |
| | $ | 800,261 |
| | $ | 807,720 |
| | $ | 785,143 |
|
| Real estate – construction | 114,974 |
| | 163,543 |
| | 253,223 |
| | 232,989 |
| | 151,432 |
|
| Real estate – commercial | 1,233,067 |
| | 1,139,931 |
| | 1,079,628 |
| | 846,673 |
| | 706,409 |
|
| Real estate – residential | 287,980 |
| | 269,173 |
| | 321,047 |
| | 383,599 |
| | 539,332 |
|
| Installment | 67,543 |
| | 69,711 |
| | 82,989 |
| | 98,581 |
| | 138,895 |
|
| Home equity | 358,960 |
| | 341,310 |
| | 328,940 |
| | 286,110 |
| | 250,888 |
|
| Credit card | 31,631 |
| | 29,563 |
| | 29,027 |
| | 27,538 |
| | 26,610 |
|
| Lease financing | 17,311 |
| | 2,609 |
| | 14 |
| | 50 |
| | 378 |
|
| Total loans, excluding covered loans | 2,968,447 |
| | 2,816,093 |
| | 2,895,129 |
| | 2,683,260 |
| | 2,599,087 |
|
| Covered loans | 1,053,244 |
| | 1,481,493 |
| | 1,934,740 |
| | 0 |
| | 0 |
|
| Total | $ | 4,021,691 |
| | $ | 4,297,586 |
| | $ | 4,829,869 |
| | $ | 2,683,260 |
| | $ | 2,599,087 |
|
Table 5 – Loan Maturity/Rate Sensitivity indicates the contractual maturity of commercial loans and real estate construction loans outstanding at December 31, 2011. Loans due after one year are classified according to their sensitivity to changes in interest rates.
|
| | | | | | | | | | | | | | | | |
| Table 5 • Loan Maturity/Rate Sensitivity (Excluding Covered Loans) |
| | | | | | | | | |
| | | December 31, 2011 |
| | | Maturity |
| | | | | After one | | | | |
| | | Within | | but within | | After | | |
| (Dollars in thousands) | | one year | | five years | | five years | | Total |
| Commercial | | $ | 411,099 |
| | $ | 328,566 |
| | $ | 117,316 |
| | $ | 856,981 |
|
| Real estate – construction | | 80,013 |
| | 34,223 |
| | 738 |
| | 114,974 |
|
| Total | | $ | 491,112 |
| | $ | 362,789 |
| | $ | 118,054 |
| | $ | 971,955 |
|
| | | | | | | | | |
| | | | | Sensitivity to changes in interest rates |
| | | | | Predetermined |
| | Variable | | |
| (Dollars in thousands) | | | | rate | | rate | | Total |
| Due after one year but within five years | | | | $ | 208,272 |
| | $ | 154,517 |
| | $ | 362,789 |
|
| Due after five years | | | | 41,173 |
| | 76,881 |
| | 118,054 |
|
| Total | |
|
| | $ | 249,445 |
| | $ | 231,398 |
| | $ | 480,843 |
|
18 First Financial Bancorp 2011 Annual Report
|
| | | | | | | | | | | |
| Table 6 • Covered Loan Portfolio | | | | | |
| | December 31, |
| (Dollars in thousands) | 2011 | | 2010 | | 2009 |
| Commercial | $ | 195,892 |
| | $ | 334,039 |
| | $ | 506,887 |
|
| Real estate – construction | 17,120 |
| | 42,743 |
| | 97,560 |
|
| Real estate – commercial | 637,044 |
| | 855,725 |
| | 1,008,104 |
|
| Real estate – residential | 121,117 |
| | 147,052 |
| | 206,371 |
|
| Installment | 13,176 |
| | 21,071 |
| | 8,235 |
|
| Home equity | 64,978 |
| | 73,695 |
| | 87,933 |
|
| Other covered loans | 3,917 |
| | 7,168 |
| | 19,650 |
|
| Total covered loans | $ | 1,053,244 |
| | $ | 1,481,493 |
| | $ | 1,934,740 |
|
Subject to First Financial’s credit policy and guidelines, credit underwriting and approval occur within the market originating the loan. First Financial has delegated to each regional president a lending limit sufficient to handle the majority of client requests in a timely manner. Loan requests for amounts greater than the market limit require the approval of the regional credit officer and can include additional approval(s) from the chief credit officer, the chief executive officer and the board of directors as necessary. This allows First Financial to manage the initial credit risk exposure through a standardized, disciplined and strategically focused loan approval process, but with an increasingly higher level of authority. Plans to purchase or sell a participation in a loan or a group of loans require the approval of certain senior lending and administrative officers, and in some cases could include the board of directors.
Credit management practices are dependent on the type and nature of the loan. First Financial monitors all significant
exposures on an on-going basis. Commercial loans are assigned internal risk ratings reflecting the risk of loss inherent in the loan. These internal risk ratings are assigned upon initial approval of credit to borrowers and updated periodically thereafter. First Financial reviews and adjusts its risk ratings criteria based on actual experience, which provides the Company with an assessment of the current risk level in the portfolio and is the basis for determining an appropriate allowance for loan and lease losses.
First Financial utilizes the following categories of risk ratings, derived from standard regulatory rating definitions, to facilitate the monitoring of credit quality for commercial loans:
Pass - Higher quality loans that do not fit any of the other categories described below.
Special Mention - First Financial assigns a Special Mention rating to loans and leases with potential weaknesses that deserve management's close attention. If left uncorrected, these potential weaknesses may result in deterioration of the repayment prospects for the loan or lease or in First Financial's credit position at some future date.
Substandard - First Financial assigns a substandard rating to loans or leases that are inadequately protected by the current sound worth and paying capacity of the borrower or of the collateral pledged, if any. Substandard loans and leases have well-defined weaknesses that jeopardize repayment of the debt. Substandard loans and leases are characterized by the distinct possibility that the Company will sustain some loss if the deficiencies are not addressed.
Doubtful - First Financial assigns a doubtful rating to loans and leases with all the attributes of a substandard rating with the added characteristic that the weaknesses make collection or liquidation in full, on the basis of currently existing facts, conditions and values, highly questionable and improbable. The possibility of loss is extremely high, but because of certain important and reasonably specific pending factors that may work to the advantage and strengthening of the credit quality of the loan or lease, its classification as an estimated loss is deferred until its more exact status may be determined. Pending factors include proposed merger, acquisition or liquidation procedures, capital injection, perfecting liens on additional collateral and refinancing plans.
Commercial loans rated as Special Mention, Substandard or Doubtful are considered Criticized. Commercial loans rated as Substandard or Doubtful are considered Classified. Commercial loans may be designated as Criticized based on individual borrower performance or industry and environmental factors. Criticized loans are subject to additional reviews to adequately assess the borrower’s credit status and develop appropriate action plans.
First Financial Bancorp 2011 Annual Report 19
Management’s Discussion And Analysis Of Financial Condition And Results Of Operations
Classified loans are managed by the Special Assets Division (Special Assets) of the Company. Special Assets is a specialized credit group that handles the day-to-day management of workouts, commercial recoveries and problem loan resolutions. Special Assets allows First Financial to ensure appropriate oversight, improved communication, and timely resolution of issues throughout the loan portfolio, including those loans covered by FDIC loss sharing agreements. Additionally, the Commercial Credit Risk group within First Financial's Risk Management function provides objective oversight and assessment of commercial credit quality and credit processes using an independent, market-based credit risk review approach.
Consumer lending credit approvals are based on, among other factors, the financial strength and payment history of the borrower, type of exposure and the transaction structure. Consumer loans are generally smaller dollar amounts than other types of lending and are made to a large number of customers which help provide diversification within the portfolio. Credit risk in the consumer loan portfolio is managed by loan type. Consumer loan types are continuously monitored for changes in delinquency trends and other asset quality indicators. The Retail/Small Business Credit Risk function performs product-level reviews of portfolio performance and assesses credit quality and compliance with underwriting and loan administration guidelines.
First Financial believes its analytical and reporting capability provides timely and valuable portfolio information to aid in credit management.
|
| | | | | | | | | | | | | | | | |
| Table 7 • Covered Loan Maturity | | | | | | | | |
| | | | | | | | | |
| | | December 31, 2011 |
| | | Maturity |
| | | | | After one | | | | |
| | | Within | | but within | | After | | |
| (Dollars in thousands) | | one year | | five years | | five years | | Total |
| Commercial | | $ | 62,609 |
| | $ | 121,956 |
| | $ | 11,327 |
| | $ | 195,892 |
|
| Real estate – construction | | 14,188 |
| | 2,205 |
| | 727 |
| | 17,120 |
|
| Total | | $ | 76,797 |
| | $ | 124,161 |
| | $ | 12,054 |
| | $ | 213,012 |
|
|
| | | | | | | | | | | | |
| | | | | | | |
| | | Sensitivity to changes in interest rates |
| | | Predetermined | | Variable | | |
| (Dollars in thousands) | | rate | | rate | | Total |
| Due after one year but within five years | | $ | 103,369 |
| | $ | 20,792 |
| | $ | 124,161 |
|
| Due after five years | | 6,005 |
| | 6,049 |
| | 12,054 |
|
| Total | | $ | 109,374 |
| | $ | 26,841 |
| | $ | 136,215 |
|
LOANS – EXCLUDING COVERED LOANS
2011 vs. 2010. Loan demand was muted throughout much of 2011 as business and consumer spending remained under pressure and competition for credit-worthy borrowers was strong. First Financial experienced stronger loan demand towards the end of 2011 as economic conditions showed signs of improvement. Excluding covered loans, total loans increased $152.4 million, or 5.4%, during 2011, primarily due to the addition of $126.5 million of loans associated with the Liberty branch acquisition. Average loan balances increased $28.6 million, or 1.0%, during 2011. Excluding loan balances acquired in connection with the Liberty banking center acquisition, total loans increased $38.3 million, or 1.4%, primarily due to increases in the commercial and commercial real estate portfolios.
Period-end commercial, commercial real estate and real estate construction loans increased $101.3 million or 4.8% from December 31, 2010 to December 31, 2011. The increase in the commercial portfolio was due to a $56.7 million, or 7.1%, increase in commercial loans and a $93.1 million, or 8.2%, increase in commercial real estate loans, partially offset by a decline in real estate construction loans of $48.6 million, or 29.7%. The decline in real estate construction loans was the result of First Financial's decision to restrict lending in this category due to excess supply and declining property values in recent years. First Financial's consumer-related loan categories increased $51.1 million, or 7.2%, during 2011, which included an $18.8 million
20 First Financial Bancorp 2011 Annual Report
increase in residential real estate loans and a $17.7 million increase in home equity loan balances during the year primarily driven by loans acquired as a part of the Liberty transaction.
At December 31, 2011, commercial, commercial real estate and real estate construction loans comprised 74.3% of First Financial’s total loan portfolio, excluding covered loans. Residential real estate loans at 9.7%, home equity loans at 12.1%, and installment, credit card and other lending at 3.9%, comprised the remainder of the portfolio.
At December 31, 2011, residential development loans comprised 1.5% of First Financial’s total loan portfolio.
LOANS – COVERED
Acquired loans subject to loss share agreements whereby the FDIC reimburses First Financial for the majority of any losses incurred are referred to as covered loans.
First Financial evaluated loans purchased in conjunction with the acquisitions of Peoples and Irwin for impairment in accordance with the provisions of FASB ASC Topic 310-30, Loans and Debt Securities Acquired with Deteriorated Credit Quality. Acquired loans are considered impaired if there is evidence of credit deterioration since origination and if it is probable that not all contractually required payments will be collected. First Financial accounts for the majority of covered loans under FASB ASC Topic 310-30 with the exception of loans with revolving privileges, which were determined to be outside the scope of FASB ASC Topic 310-30, and other consumer loans for which expected cash flows could not be reasonably estimated. For further information regarding the accounting for covered loans, see the Critical Accounting Policies section included in Management’s Discussion and Analysis as well as the Notes to the Consolidated Financial Statements.
2011 vs. 2010. Total covered loans decreased $428.2 million, or 28.9%, during 2011. The decline in the covered loan portfolio is to be expected as there were no new acquisitions of loans subject to loss share agreements during 2011. The covered loan portfolio will continue to decline, through payoffs, charge-offs, termination or expiration of loss share coverage, unless First Financial acquires additional loans subject to loss share agreements in the future.
INVESTMENTS
First Financial’s investment portfolio at December 31, 2011 totaled $1.5 billion, a $500.8 million, or 49.3%, increase from the $1.0 billion balance at December 31, 2010. The increase in the investment portfolio was primarily related to the amortization and paydowns of both uncovered and covered loans as loan demand remained muted throughout much of the year as well as the deployment of a portion of cash received in the Liberty and Flagstar banking center acquisitions. First Financial purchased primarily agency debentures and fixed and floating rate agency-backed mortgage backed securities (MBSs) utilizing the same discipline and portfolio management philosophy as with past investment purchases including, but not limited to, avoidance of material credit risk and geographic concentration risk within the MBSs. The investment portfolio, which is managed with consideration to extension or maturity risk, provides a pool of assets eligible as a source of collateral for pledging to secure Federal, state and local depository funds, while also balancing overall asset/liability management objectives.
The other investments category in the Consolidated Balance Sheets consists primarily of First Financial’s investment in the stock of the Federal Reserve Bank and the FHLB.
The majority of the investment portfolio is comprised of lower-risk investment securities, primarily treasury, government agency and agency residential MBSs. The Company purchased $161.6 million of agency MBSs late in 2011 as part of a strategy to increase the duration of the portfolio under which $162.6 million of shorter duration securities were sold and replaced with longer duration purchases, resulting in a pre-tax gain of $2.5 million. First Financial also began to diversify its investment portfolio late in 2011 as a portion of its purchases consisted of investment grade single issuer trust preferred securities. The Company plans to purchase a limited amount of these securities on a selective basis with a maximum targeted exposure related to these types of securities of 10% of the total investment portfolio. First Financial continues to evaluate credit risk and duration risk related to investment securities as part of its on-going portfolio management practices.
The investment securities portfolio included a net unrealized pre-tax gain of $20.6 million representing the difference between fair value and amortized cost at December 31, 2011. This compares with a net unrealized pre-tax gain of $15.2 million at December 31, 2010. The total investment portfolio represented 22.7% and 16.2% of total assets at December 31, 2011 and December 31, 2010, respectively.
Security debentures issued by the U.S. government and U.S. government agencies and corporations, including the Federal Home Loan Bank (FHLB), FHLMC, Federal National Mortgage Association (FNMA) and Federal Farm Credit Bank
First Financial Bancorp 2011 Annual Report 21
Management’s Discussion And Analysis Of Financial Condition And Results Of Operations
represented 3.0% and 11.8% of the investment portfolio at December 31, 2011 and 2010, respectively. All U.S. government agencies and corporations’ securities were classified as available-for-sale at December 31, 2011, and 2010. Due to the government guarantees, either expressed or implied, U.S. government agency and corporation obligations are considered to have a lower credit risk and high liquidity profile.
Investments in MBSs, including collateralized mortgage obligations (CMOs), represented 89.9% and 77.7% of the investment portfolio at December 31, 2011 and 2010, respectively. MBSs represent participations in pools of residential real estate loans, the principal and interest payments of which are passed through to the security investors. MBSs are subject to prepayment risk, particularly during periods of falling interest rates, and duration is prone to extend during periods of rising interest rates. Prepayments of the underlying residential real estate loans may shorten the lives of the securities, thereby affecting yields to maturity and market values. First Financial invests primarily in MBSs issued by U.S. government agencies and corporations, such as Government National Mortgage Association (GNMA), FHLMC, and FNMA. Such securities, because of government agency guarantees, are considered to have a low credit risk and high liquidity profile.
CMOs totaled $682.9 million at December 31, 2011, and $336.5 million at December 31, 2010, all of which were classified as available-for-sale. All CMOs held by First Financial are AAA rated by Standard & Poor’s Corporation or similar rating agencies, and First Financial does not own any interest-only securities, principal-only securities, or other securities considered high risk.
Tax exempt securities of states, municipalities and other political subdivisions comprised only 0.8% and 1.7% of the investment portfolio at December 31, 2011 and 2010, respectively. The securities are diversified as to states and issuing authorities within states, thereby decreasing geographic portfolio risk. First Financial continues to monitor the risk associated with this sector as we review the underlying ratings for possible downgrades. First Financial does not own any currently impaired state or other political subdivision securities and has not added to this component of the portfolio in more than five years.
Other securities totaled 1.5% and 1.0% of First Financial’s investment portfolio at December 31, 2011 and 2010, respectively, and were primarily comprised of taxable obligations of state and other political subdivisions, Community Reinvestment Act qualified funds, and other small holdings.
|
| | | | | | | | | | | | | |
| Table 8 • Investment Securities as of December 31 | | | | | | | |
| | | | | | | | |
| | 2011 | | 2010 |
| | | | Percent of | | | | Percent of |
| (Dollars in thousands) | Amount | | Portfolio | | Amount | | Portfolio |
| U.S. Treasuries | $ | 0 |
| | 0.0 | % | | $ | 13,959 |
| | 1.5 | % |
| Securities of U.S. Government agencies and corporations | 46,190 |
| | 3.2 | % | | 105,985 |
| | 11.3 | % |
| Mortgage-backed securities | 1,363,468 |
| | 94.4 | % | | 788,868 |
| | 84.3 | % |
| Obligations of state and other political subdivisions | 11,960 |
| | 0.8 | % | | 17,153 |
| | 1.8 | % |
| Other securities | 22,892 |
| | 1.6 | % | | 10,551 |
| | 1.1 | % |
| Total | $ | 1,444,510 |
| | 100.0 | % | | $ | 936,516 |
| | 100.0 | % |
The estimated maturities and weighted-average yields of the held-to-maturity and available-for-sale investment securities are shown in Table 9 – Investment Securities as of December 31, 2011. Tax-equivalent adjustments, using a 35.0% rate, have been made in calculating yields on tax-exempt obligations of state and other political subdivisions.
At December 31, 2011 and 2010, 99.8% and 98.1%, respectively, of investment securities were classified as available-for-sale. The available-for-sale investment securities are reported at their market value of $1.4 billion at December 31, 2011 and $919.1 million at December 31, 2010. The market value of First Financial’s held-to-maturity investment securities portfolio exceeded the carrying value by $0.2 million and $0.7 million at December 31, 2011 and December 31, 2010, respectively. See Note 9 of the Notes to Consolidated Financial Statements for additional information.
First Financial held cash on deposit with the Federal Reserve of $375.4 million and $141.7 million at December 31, 2011 and 2010, respectively. Beginning in 2009 and during the first half of 2010, First Financial held cash on deposit with the Federal Reserve rather than investing excess cash overnight in federal funds sold when the Federal Reserve began paying interest on bank deposits. The increase in cash in 2011 is primarily a result of cash received from the Liberty and Flagstar banking center
22 First Financial Bancorp 2011 Annual Report
acquisitions in the third and fourth quarters of 2011. First Financial continually monitors its liquidity position as part of its enterprise risk management framework, specifically its asset/liability management process.
See Note 22 of the Notes to Consolidated Financial Statements for additional information on how First Financial determines the fair value of investment securities.
|
| | | | | | | | | | | | | | | | | | | | | | | | | | | |
| Table 9 • Investment Securities As Of December 31, 2011 |
| | Maturity |
| | Within one year | | After one but within five years | | After five but within ten years | | After ten years |
| (Dollars in thousands) | Amount | | Yield(1) | | Amount | | Yield(1) | | Amount | | Yield(1) | | Amount | | Yield(1) |
| Held-to-Maturity | | | | | | | | | | | | | | | |
| Mortgage-backed securities | $ | 3 |
| | 12.49 | % | | $ | 87 |
| | 3.73 | % | | $ | 0 |
| | 0.00 | % | | $ | 0 |
| | 0.00 | % |
| Obligations of state and other political subdivisions | 291 |
| | 6.09 | % | | 1,242 |
| | 7.05 | % | | 197 |
| | 7.69 | % | | 844 |
| | 7.69 | % |
| Total | $ | 294 |
| | 6.16 | % | | $ | 1,329 |
| | 6.83 | % | | $ | 197 |
| | 7.69 | % | | $ | 844 |
| | 7.69 | % |
| | | | | | | | | | | | | | | | |
| Available-for-Sale | | | | | | | | | | | | | | | |
| Securities of other U.S. government agencies and corporations | $ | 0 |
| | 0.00 | % | | $ | 26 |
| | 4.98 | % | | $ | 46,164 |
| | 3.16 | % | | $ | 0 |
| | 0.00 | % |
| Mortgage-backed securities | 24,217 |
| | 2.39 | % | | 849,681 |
| | 2.22 | % | | 123,277 |
| | 3.07 | % | | 366,203 |
| | 3.07 | % |
| Obligations of state and other political subdivisions | 2,238 |
| | 7.28 | % | | 4,066 |
| | 7.71 | % | | 3,082 |
| | 6.82 | % | | 0 |
| | 0.00 | % |
| Other securities | 12,164 |
| | 5.47 | % | | 110 |
| | 6.25 | % | | 0 |
| | 0.00 | % | | 10,618 |
| | 3.78 | % |
| Total | $ | 38,619 |
| | 3.66 | % | | $ | 853,883 |
| | 2.25 | % | | $ | 172,523 |
| | 3.16 | % | | $ | 376,821 |
| | 3.09 | % |
(1) Tax equivalent basis was calculated using a 35.00% tax rate and yields were based on amortized cost.
DERIVATIVES
The use of derivative instruments allows First Financial to meet the needs of its clients while managing the interest-rate risk associated with certain transactions. First Financial’s board of directors has authorized the use of certain derivative products, including interest rate caps, floors and swaps. First Financial does not use derivatives for speculative purposes and currently does not have any derivatives that are not designated as hedges.
In accordance with FASB ASC Topic 815, Derivatives and Hedging, the accounting for changes in the fair value of derivatives depends on the intended use of the derivative and the resulting designation. Derivatives used to hedge the exposure to changes in the fair value of an asset, liability or firm commitment attributable to a particular risk, such as interest rate risk, are considered fair value hedges. Derivatives used to hedge the exposure to variability in expected future cash flows, or other types of forecasted transactions, are considered cash flow hedges.
Fair Value Hedges. First Financial utilizes interest rate swaps as a means to offer commercial borrowers products that meet their needs, but are also designed to achieve First Financial’s desired interest rate risk profile at the time. The fair value hedge agreements generally involve the net receipt by First Financial of floating-rate amounts in exchange for net payments by First Financial, through its loan clients, of fixed-rate amounts over the life of the agreements without an exchange of the underlying principal or notional amount. This results in First Financial’s loan customers receiving fixed rate funding while providing First Financial with a floating rate asset. The net interest receivable or payable on the interest rate swaps is accrued and recognized as an adjustment to the interest income or interest expense of the hedged item. The fair value of the interest rate swaps is included within accrued interest and other assets or other liabilities on the Consolidated Balance Sheets. The corresponding fair-value adjustment is also included on the Consolidated Balance Sheets in the carrying value of the hedged item. Derivative gains and losses not considered effective in hedging the change in fair value of the hedged item are recognized immediately in income.
The notional amount of an interest rate swap merely establishes the basis on which interest payments are exchanged with counterparties. First Financial had interest rate swaps with a total counterparty notional value of $396.4 million as of December 31, 2011, compared to a total counterparty notional value of $300.1 million at December 31, 2010. As only interest rate payments are exchanged, cash requirements and credit risk are significantly less than the notional amounts.
First Financial Bancorp 2011 Annual Report 23
Management’s Discussion And Analysis Of Financial Condition And Results Of Operations
Cash Flow Hedges. First Financial may utilize interest rate swaps designated as cash flow hedges to manage the variability of cash flows, primarily net interest income, attributable to changes in interest rates. The net interest receivable or payable on an interest rate swap designated as a cash flow hedge is accrued and recognized as an adjustment to interest income or interest expense. The fair value of the interest rate swaps are included within accrued interest and other assets on the Consolidated Balance Sheets. Changes in the fair value of the interest rate swap are included in accumulated other comprehensive income (loss). Derivative gains and losses not considered effective in hedging the cash flows related to the underlying hedged item, if any, would be recognized immediately in income.
Effective March 30, 2009, First Financial executed a cash flow hedge utilizing an interest rate swap to hedge against interest rate volatility on $20.0 million of floating rate trust preferred securities based on the London Inter-Bank Offered Rate (LIBOR). The interest rate swap involved the receipt by First Financial of variable-rate interest amounts in exchange for fixed-rate interest payments by First Financial for a period of 10 years. This interest rate swap effectively fixed the rate of interest on the floating rate trust preferred securities at 6.20% for the 10 year life of the swap.
First Financial terminated the $20.0 million trust preferred interest rate swap during the fourth quarter of 2010 in the course of its normal interest rate risk and balance sheet management activities. Terminating the trust preferred interest rate swap resulted in a $0.6 million pre-tax loss that was included in accumulated comprehensive income (loss) on the Consolidated Balance Sheets. Due to the early redemption of the trust preferred securities, the remaining balance of the unrecognized loss of $0.6 million was recognized in noninterest expense in the second quarter of 2011. First Financial had no derivative instruments designated as cash flow hedges at December 31, 2011.
First Financial’s credit risk exposure related to derivative instruments is limited to the market value of the instrument. First Financial manages this credit risk exposure through counterparty credit policies and had bilateral collateral agreements in place with its counterparties at December 31, 2011. The counterparty credit policies require First Financial to maintain a total derivative notional position of less than 35.0% of assets, total credit exposure of less than 3.0% of capital, and no single counterparty credit risk exposure greater than $20.0 million. First Financial is currently well below all single counterparty and portfolio limits.
As of December 31, 2011, there were no delinquent amounts due related to derivative agreements. First Financial had $24.4 million and $12.5 million deposited as cash collateral with its counterparties as of December 31, 2011 and 2010, respectively. This cash collateral is held at commercial banks and earns a rate of interest generally equal to the overnight Federal Funds interest rate.
DEPOSITS
First Financial solicits deposits by offering a wide variety of savings and transaction accounts, including checking, regular savings, money-market and time deposits of various maturities and rates.
First Financial experienced deposit growth during 2011 as total deposits increased $496.6 million, or 9.6%, from $5.1 billion at December 31, 2010 to $5.6 billion as of December 31, 2011. Noninterest bearing checking deposits increased by $240.7 million, interest-bearing checking deposits increased by $205.5 million and savings deposits increased by $190.6 million while time deposits declined by $140.2 million during the period. The increase in total deposits during 2011 was primarily related to $806.6 million of deposits assumed in the Liberty and Flagstar banking center acquisitions, partially offset by the planned and continued runoff of certain deposits acquired as part of the Irwin acquisition in 2009.
The increase in deposit balances reflects a continued positive shift in the mix of First Financial's deposit base as outflows of time deposits and brokered deposits have been replaced with less expensive transaction-based core deposits. Additionally, First Financial focused on several strategic initiatives related to deposits that impacted the activity during 2011. Specifically, the Company implemented a more disciplined pricing strategy on all deposit products and initiated a deposit rationalization strategy focused on improving core relationship profitability and reducing non-core relationship deposits.
2011 vs. 2010. Total average deposits for 2011 declined $20.0 million, or 0.4%, from 2010 as the Liberty and Flagstar banking center acquisitions closed late in the year. Average time deposits decreased $390.6 million, or 19.2%, while average transaction and savings deposits increased $370.6 million, or 11.5%.
Table 10 – Maturities of Time Deposits Greater Than or Equal to $0.1 million shows the contractual maturity of time deposits of $0.1 million and over that were outstanding at December 31, 2011. These deposits represented 9.42% of total deposits.
24 First Financial Bancorp 2011 Annual Report
|
| | | | | | | | | | | | | | | |
| Table 10 • Maturities Of Time Deposits Greater Than Or Equal To $100,000 |
| | December 31, 2011 |
| (Dollars in thousands) | Certificates of Deposit | | IRAs | | Brokered CDs | | Total |
| Maturing in | | | | | | | |
| 3 months or less | $ | 94,975 |
| | $ | 9,414 |
| | $ | 4,227 |
| | $ | 108,616 |
|
| 3 months to 6 months | 100,779 |
| | 9,869 |
| | 4,305 |
| | 114,953 |
|
| 6 months to 12 months | 110,981 |
| | 13,689 |
| | 3,589 |
| | 128,259 |
|
| over 12 months | 119,387 |
| | 40,336 |
| | 19,859 |
| | 179,582 |
|
| Total | $ | 426,122 |
| | $ | 73,308 |
| | $ | 31,980 |
| | $ | 531,410 |
|
BORROWINGS
2011 vs. 2010. Short-term borrowings increased to $99.4 million at December 31, 2011, from $59.8 million at December 31, 2010, as a result of client activity in repurchase agreement sweep accounts. Long-term debt decreased $73.0 million to $76.5 million at December 31, 2011, from $149.5 million at December 31, 2010 due primarily to the maturity of $50.0 million of FHLB long term debt and the early redemption of $20.6 million in subordinated debentures during the period.
First Financial utilizes advances from the FHLB as a wholesale funding source. First Financial had no short-term borrowings from the FHLB at December 31, 2011 and 2010. Total long-term borrowings from the FHLB were $11.5 million and $63.9 million at December 31, 2011 and 2010, respectively. First Financial's total available borrowing capacity from the FHLB was $353.9 million at December 31, 2011.
First Financial utilizes a blanket collateral agreement with the FHLB for ease of borrowing execution. As of December 31, 2011, First Financial had pledged certain real estate loans and government and agency securities with a book value of approximately $1.1 billion as collateral for borrowings to the FHLB.
Other long-term debt, which appears on the Consolidated Balance Sheets, consisted of junior subordinated debentures owed to unconsolidated subsidiary trusts. Capital securities were issued in 2003 by a statutory business trust – First Financial (OH) Statutory Trust II. The debentures issued in 2003 were eligible for early redemption by First Financial in September of 2008. First Financial did not elect to redeem early, but under the terms of the agreement could redeem the securities on any interest payment date, with a final maturity in 2033. These debentures were fully redeemed on June 30, 2011.
These debentures qualified as Tier I capital under Federal Reserve Board guidelines, but had been limited to 25% of total qualifying tier 1 capital. The Company has the capacity to issue approximately $161.7 million in additional qualifying debentures under these guidelines.
See Note 14 of the Notes to Consolidated Financial Statements for additional information on borrowings and Note 17 for additional information on capital.
ENTERPRISE RISK MANAGEMENT
First Financial manages risks through a structured enterprise risk management (ERM) approach that routinely assesses the overall level of risk, identifies specific risks and evaluates the steps being taken to mitigate those risks. First Financial continues to enhance its risk management capabilities and has, over time, embedded risk awareness as part of the culture of the Company. ERM allows First Financial to align a variety of risk management activities within the Company into a cohesive, enterprise-wide approach, focus on process-level risk management activities and strategic objectives within the risk management culture, deliberately consider risk responses and effectiveness of mitigation compared to established standards for risk appetite and tolerance, recognize and respond to the significant organizational changes that have increased the size and complexity of the organization, and consolidate information obtained through a common process into concise business performance and risk information for management and the board of directors.
First Financial uses a robust regulatory risk framework as one of the foundational components of its ERM framework. This not only allows for a common categorization across the Company, but allows for a consistent and complete risk framework that can be summarized and assessed enterprise-wide. In addition, the framework is consistent with that used by the Company’s
First Financial Bancorp 2011 Annual Report 25
Management’s Discussion And Analysis Of Financial Condition And Results Of Operations
regulators, allowing for additional feedback on First Financial’s ability to assess and measure risk across the organization and for management and the board of directors to identify and understand differences in assessed risk profile using this same foundation.
ERM helps ensure that First Financial continues to identify and adequately address risks that emerge from a combination of new customers, products and associates, as well as changing markets, new or evolving systems and processes and new lines of business.
The goals of First Financial’s ERM framework are to:
| |
| • | focus on the Company at both the enterprise and line of business levels; |
| |
| • | align the Company's risk appetite with its strategic and related operational, compliance, and reporting objectives; |
| |
| • | enhance risk response decisions; |
| |
| • | reduce operational deficiencies and possible losses; |
| |
| • | identify and manage interrelated risks; |
| |
| • | provide integrated responses to multiple risks; |
| |
| • | improve the deployment and allocation of capital; and |
| |
| • | improve overall business performance. |
Specific enterprise level objectives include:
| |
| • | creating a holistic view of risk in which risk is comprehensively considered, consistently communicated and documented in decision making; |
| |
| • | centralizing the oversight of risk management activities; |
| |
| • | creating an awareness of risks facing the Company by defining the risks that will be addressed by the enterprise and each functional area or business unit; |
| |
| • | establishing and maintaining systems and mechanisms to comprehensively identify, assess and measure risks that may impact First Financial’s ability to achieve its business objectives; |
| |
| • | creating a process which ensures that, for all new lines of business and new product decisions, management evaluates the expertise needed and comprehensively assesses the risks involved; |
| |
| • | establishing and maintaining systems and mechanisms to monitor risk responses; |
| |
| • | developing risk occurrence information systems to provide early warning of events or situations that create risk for the Company; |
| |
| • | implementing and reviewing risk measurement techniques that management may use to establish the Company’s risk tolerance, assess risk likelihood and impact, and analyze risk monitoring processes; and |
| |
| • | establishing appropriate management reporting systems regarding the enterprise-wide risk exposures and allocation of capital. |
Line of business-level objectives focus on why the particular business or business unit exists; how the business affects the Company’s strategy, earnings, reputation and other key success factors; and whether the line of business objectives are aligned with the enterprise objectives.
First Financial has identified nine types of risk that it monitors in its ERM framework. These risks include information technology, market, legal, strategic, reputation, credit, regulatory (compliance), operational and external/environmental.
Board of Directors and Board Risk Committee. First Financial’s board of directors is responsible for understanding the Company’s risk management objectives and risk tolerance. Therefore, board oversight of the Company’s risk management activities is a key component to an effective risk management process. Responsibilities of the board of directors include:
| |
| • | establishing and guiding the Company’s strategic direction and tolerance for risk, including the determination of the aggregate risk appetite, and identifying the senior managers who have the responsibility for managing this risk; |
| |
| • | monitoring the Company’s performance and overall risk profile, ensuring that the level of risk is maintained at prudent levels and is supported by adequate capital; |
| |
| • | ensuring that the Company implements sound fundamental principles that facilitate the identification, measurement, monitoring and control of risk; and |
| |
| • | ensuring that adequate resources are dedicated to risk management. |
The board of directors has defined broad risk tolerance levels or limits to guide management in the decision-making process and is responsible for establishing management information and communication requirements to ensure that risk management
26 First Financial Bancorp 2011 Annual Report
activities remain within these tolerance limits. The board risk committee, a standing committee of the board of directors, is responsible for carrying out the board’s responsibilities in this regard. Other standing committees of the board (audit and compensation) oversee particular areas of risk assigned to them.
Executive and Senior Management. Executive and senior management members who are involved in ERM activities are responsible for managing risk activities and delegating risk authority and tolerance to the individual risk owners responsible for executing the specific business activities.
Management must identify which processes and activities are critical to achieving the Company’s business objectives within the designated tolerance levels. Management must then delegate responsibility, authority and accountability to the appropriate risk owners who are responsible for ensuring that the respective processes and activities are designed and implemented to manage the related risks within those delegated tolerance levels.
Information and communication requirements must be clearly communicated to risk owners in order to support management’s analysis of how effectively risk management activities are operating and that these requirements support and facilitate required reporting to the board of directors.
Chief Risk Officer. The chief risk officer is responsible for the oversight of the Company’s ERM processes. The chief risk officer may appoint such other officers or establish such other management committees as required for effective risk management and governance, including risk measurement, risk monitoring, risk control or mitigation and risk reporting. The chief risk officer is also responsible to maintain such procedures, methodology and guidelines as are necessary to administer the ERM program.
Committee Chairs. The ERM program is conducted through fourteen committees as its primary assessment and communication mechanism for the previously identified risks. Committee chairs play key roles in the execution of risk management activities throughout the enterprise and are responsible for continuous updates and communication amongst committee members as well as with the risk management department regarding changes to risk profiles, changes to risk assessments and the emergence of new risks that could impact the Company.
Internal Audit. Internal audit is responsible for planning audit activities to periodically reassess the design and operation of key risk management processes and to make periodic evaluations of the ongoing accuracy and effectiveness of the communications from risk owners to senior management and from senior management to the board of directors.
Risk Assessment Process. The periodic assessment of risks is a key component of a sound ERM program. Managers, business unit leaders and executives are responsible for developing the risk assessment for their individual departments, business units and subsidiaries consistent with their operating practices and strategies. The chief risk officer, management and the board risk committee are then responsible for ensuring that risk is viewed and analyzed from a portfolio perspective. Furthermore, interrelated risks should be considered, describing how a single risk/event may create multiple risks and the need for management to develop an entity-level portfolio view of risk.
First Financial’s risk management functional programs identify the objectives, scope, assessment frequency and methodology utilized in the assessment and reporting process.
Risk management programs, in total and in each functional component, accomplish the following:
| |
| • | identify risk issues and their respective risk owners; |
| |
| • | evaluate the risks as to their associated likelihood of occurrence and consequences; |
| |
| • | prioritize the risk issues in regards to the current risk status and trend; |
| |
| • | provide reports to management and risk owners that will assist them in implementing appropriate risk management processes; |
| |
| • | assist management in assessing the alternatives for managing the risks; |
| |
| • | assist management in the development of risk management plans; and |
| |
| • | track risk management efforts and respond accordingly. |
Monitoring and Reporting. The board of directors oversees risk reporting and monitoring through the board risk committee, which meets at least quarterly. The board risk committee is responsible for establishing tolerance limits for monitoring enterprise-wide key risks.
First Financial Bancorp 2011 Annual Report 27
Management’s Discussion And Analysis Of Financial Condition And Results Of Operations
Management continually reviews and challenges the identified key risks, as well as the appropriateness of established tolerance limits, and the actions identified as necessary to mitigate key risks. As circumstances warrant, management will provide recommendations to the board risk committee for changes or adjustments in key risks or tolerance limits.
First Financial believes that communication is fundamental to successful risk management and requires a successful partnership between risk management, management and the board of directors. Risk management must engage in productive reporting and dialogue with management across the Company to ensure collaborative and effective risk management.
|
| | | | | | | | | | | | | | | | | | | |
| Table 11 • Summary Of Allowance For Loan And Lease Losses And Selected Statistics (Excluding Covered Loans) |
| | | | | | | | | | |
| (Dollars in thousands) | 2011 | | 2010 | | 2009 | | 2008 | | 2007 |
| Transactions in the allowance for loan and lease losses: | | | | | | | | | |
| Balance at January 1 | $ | 57,235 |
| | $ | 59,311 |
| | $ | 35,873 |
| | $ | 29,057 |
| | $ | 27,386 |
|
| Loans charged-off: | | | | | | | | | |
| Commercial | 3,436 |
| | 13,324 |
| | 11,295 |
| | 5,227 |
| | 4,107 |
|
| Real estate – commercial | 16,661 |
| | 16,810 |
| | 17,194 |
| | 3,526 |
| | 863 |
|
| Real estate – residential | 1,551 |
| | 1,693 |
| | 1,315 |
| | 648 |
| | 255 |
|
| Installment and other consumer financing | 4,150 |
| | 6,524 |
| | 5,145 |
| | 5,236 |
| | 4,094 |
|
| Lease financing | 0 |
| | 0 |
| | 0 |
| | 0 |
| | 103 |
|
| Total loans charged off | 25,798 |
| | 38,351 |
| | 34,949 |
| | 14,637 |
| | 9,422 |
|
| | | | | | | | | | |
| Recoveries of loans previously charged-off: | | | | | | | | | |
| Commercial | 762 |
| | 620 |
| | 632 |
| | 654 |
| | 1,002 |
|
| Real estate – commercial | 341 |
| | 1,106 |
| | 557 |
| | 99 |
| | 862 |
|
| Real estate – residential | 45 |
| | 24 |
| | 27 |
| | 25 |
| | 56 |
|
| Installment and other consumer financing | 781 |
| | 960 |
| | 1,086 |
| | 1,253 |
| | 1,471 |
|
| Lease financing | 0 |
| | 1 |
| | 1 |
| | 12 |
| | 50 |
|
| Total recoveries | 1,929 |
| | 2,711 |
| | 2,303 |
| | 2,043 |
| | 3,441 |
|
| Net charge-offs | 23,869 |
| | 35,640 |
| | 32,646 |
| | 12,594 |
| | 5,981 |
|
| | | | | | | | | | |
| Provision for loan and lease losses | 19,210 |
| | 33,564 |
| | 56,084 |
| | 19,410 |
| | 7,652 |
|
| Balance at December 31 | $ | 52,576 |
| | $ | 57,235 |
| | $ | 59,311 |
| | $ | 35,873 |
| | $ | 29,057 |
|
| | | | | | | | | | |
| Credit quality ratios: | | | | | | | | | |
| As a percent of year-end loans, net of unearned income: | | | | | | | | | |
| Allowance for loan and lease losses | 1.77 | % | | 2.03 | % | | 2.05 | % | | 1.34 | % | | 1.12 | % |
Nonperforming loans (1) | 2.57 | % | | 2.84 | % | | 2.69 | % | | 0.68 | % | | 0.56 | % |
| | | | | | | | | | |
| As a percent of average loans, net of unearned income: | | | | | | | | | |
| Net charge-offs | 0.84 | % | | 1.27 | % | | 1.16 | % | | 0.47 | % | | 0.24 | % |
| | | | | | | | | | |
Allowance for loan and lease losses to nonperforming loans (1) | 68.84 | % | | 71.62 | % | | 76.25 | % | | 197.27 | % | | 197.94 | % |
(1) Includes nonaccrual and troubled debt restucturings.
CREDIT RISK
Credit risk represents the risk of loss due to failure of a customer or counterparty to meet its financial obligations in accordance with contractual terms. First Financial manages credit risk through its underwriting practices, periodically reviewing and approving its credit exposures using board of directors approved credit policies and guidelines.
28 First Financial Bancorp 2011 Annual Report
Allowance for loan and lease losses (excluding covered loans): First Financial records a provision for loan and lease losses (provision) in the Consolidated Statements of Income to provide for expected credit losses. Actual losses on loans and leases are charged against the allowance, which is a reserve accumulated on the Consolidated Balance Sheets through the recognition of the provision. The recorded values of the loans and leases actually removed from the Consolidated Balance Sheets due to credit deterioration are referred to as charge-offs. Any subsequent recovery of a previously charged off loan is credited back to the allowance. First Financial's policy is to charge-off all or a portion of a commercial loan when, in management's opinion, it is unlikely to collect the principal amount owed in full either through payments from the borrower or from the liquidation of collateral. All loans charged-off are subject to continuous review and concerted efforts are made to maximize any recovery. In most cases, the borrower’s debt obligation is not cancelled even though the balance may have been charged off.
For each reporting period, management maintains the allowance for loan and lease losses at a level that it considers sufficient to absorb probable loan and lease losses inherent in the portfolio. Management determines the adequacy of the allowance based on historical loss experience as well as other significant factors such as composition of the portfolio; economic conditions; geographic footprint; the results of periodic internal and external evaluations of delinquent, nonaccrual, and classified loans; and any other adverse situations that may affect a specific borrower's ability to repay (including the timing of future payments). This evaluation is inherently subjective as it requires utilizing material estimates that may be susceptible to significant change. The evaluation of these factors is the responsibility of the Allowance for Loan and Lease Losses Committee, which is comprised of senior officers from the risk management, credit administration, finance, and lending areas.
In the commercial portfolio, which includes time and demand notes, tax-exempt loans, and commercial real estate loans, non-homogeneous loan relationships greater than $250,000 that are considered impaired or designated as a troubled debt restructuring (TDR) are evaluated to determine the need for a specific allowance based on the borrower's overall financial condition, resources and payment record, support from guarantors, and the realizable value of any collateral.
The allowance for non-impaired commercial loans and impaired commercial loan relationships less than $250,000 includes a process of estimating the probable losses inherent in the portfolio by category, based on First Financial's internal system of credit risk ratings and historical loss data. These estimates may also be adjusted for management's estimate of probable losses on specific loan types dependent upon trends in the values of the underlying collateral, delinquent and nonaccrual loans, prevailing economic conditions, changes in lending strategies, and other influencing factors.
|
| | | | | | | | | | | | | | | | | | | | | | | | | | | | | |
| Table 12 • Allocation Of The Allowance For Loan And Lease Losses (Excluding Covered Loans) |
| | | | | | | | | | | | | | | |
| | December 31, |
| | 2011 | | 2010 | | 2009 | | 2008 | | 2007 |
| (Dollars in thousands) | Allowance | Percent of Loans to Total Loans | | Allowance | Percent of Loans to Total Loans | | Allowance | Percent of Loans to Total Loans | | Allowance | Percent of Loans to Total Loans | | Allowance | Percent of Loans to Total Loans |
| Balance at End of Period Applicable to: | | | | | | | | | | | | | | |
| Commercial | $ | 10,289 |
| 28.9 | % | | $ | 10,138 |
| 28.4 | % | | $ | 18,590 |
| 27.6 | % | | $ | 12,107 |
| 30.1 | % | | $ | 10,166 |
| 30.2 | % |
| Real estate – construction | 4,424 |
| 3.9 | % | | 8,326 |
| 5.8 | % | | 8,143 |
| 8.8 | % | | 2,086 |
| 8.7 | % | | 955 |
| 5.8 | % |
| Real estate – commercial | 18,228 |
| 41.5 | % | | 14,917 |
| 40.5 | % | | 15,190 |
| 37.3 | % | | 8,454 |
| 31.6 | % | | 7,799 |
| 27.2 | % |
| Real estate – residential | 4,994 |
| 9.7 | % | | 8,907 |
| 9.6 | % | | 5,308 |
| 11.1 | % | | 3,715 |
| 14.3 | % | | 4,382 |
| 20.8 | % |
| Installment, home equity & credit card | 14,516 |
| 15.4 | % | | 14,888 |
| 15.6 | % | | 12,079 |
| 15.2 | % | | 9,508 |
| 15.3 | % | | 5,747 |
| 16.0 | % |
| Lease financing | 125 |
| 0.6 | % | | 59 |
| 0.1 | % | | 1 |
| 0.0 | % | | 3 |
| 0.0 | % | | 8 |
| 0.0 | % |
| Total | $ | 52,576 |
| 100.0 | % | | $ | 57,235 |
| 100.0 | % | | $ | 59,311 |
| 100.0 | % | | $ | 35,873 |
| 100.0 | % | | $ | 29,057 |
| 100.0 | % |
First Financial Bancorp 2011 Annual Report 29
Management’s Discussion And Analysis Of Financial Condition And Results Of Operations
|
| | | | | | | |
| Table 13 • Summary Of Allowance For Loan And Lease Losses and Selected Statistics (Covered Loans) |
| | | | |
| (Dollars in thousands) | 2011 | | 2010 |
| Transactions in the allowance for loan and lease losses: | | |
| Balance at January 1 | $ | 16,493 |
| | $ | 0 |
|
| Loans charged-off: | | | |
| Commercial | 9,728 |
| | 16,518 |
|
| Real estate-construction | 2,749 |
| | 3,333 |
|
| Real estate-commercial | 25,746 |
| | 16,507 |
|
| Real estate-residential | 1,650 |
| | 8,142 |
|
| Installment and other consumer financing | 5,731 |
| | 2,492 |
|
| Total loans charged off | 45,604 |
| | 46,992 |
|
| | | | |
| Recoveries of loans previously charged-off: | | | |
| Commercial | 1,013 |
| | 338 |
|
| Real estate-construction | 527 |
| | 2 |
|
| Real estate-commercial | 5,391 |
| | 0 |
|
| Real estate-residential | 71 |
| | 0 |
|
| Installment and other consumer financing | 863 |
| | 1 |
|
| Total recoveries | 7,865 |
| | 341 |
|
| Net charge-offs | 37,739 |
| | 46,651 |
|
| | | | |
| Provision for loan and lease losses | 64,081 |
| | 63,144 |
|
| Balance at December 31 | $ | 42,835 |
| | $ | 16,493 |
|
Consumer loans are evaluated as an asset type within a category (i.e., residential real estate, installment, etc.), as these loans exhibit homogeneous characteristics. The allowance for consumer loans which includes residential real estate, installment, home equity, credit card loans and overdrafts, is established by estimating losses inherent in each particular category of consumer loans. The estimate of losses is primarily based on historical loss rates for each category as well as trends in delinquent and nonaccrual loans, prevailing economic conditions and other significant influencing factors. Consumer loans greater than $100,000 whose terms have been modified in a TDR are individually analyzed for estimated impairment.
As part of the regular reviews of the allowance in 2009, management became increasingly concerned about the potential impact the prolonged economic downturn could have on the commercial real estate portfolio. As a result, management added an additional component to the allowance review utilizing the “More Adverse” scenario of the U.S. Department of the Treasury (Treasury) bank stress test to assess expected remaining losses in the current credit cycle compared with the allowance. While not necessarily credit specific for First Financial, generally the outlook for this sector had deteriorated and was likely to see only moderate recovery in the near term, if at all. During 2011, management determined that sufficient time had passed to allow the Company's actual loan and lease loss experience to reflect the recent stress on the commercial real estate loan portfolio and discontinued the use of this additional component in the allowance review.
Net charge-offs, nonperforming assets and classified assets declined in 2011, reflecting further stabilization and improvement in the economic and credit trends that began to emerge late in 2010. Consistent with these asset quality trends, First Financial's allowance declined moderately throughout 2011. While the commercial real estate portfolio remains a significant concern, with higher vacancy rates, lower rents and falling property values, management is cautiously optimistic that improvement in unemployment rates and loan demand late in 2011 will continue and that credit quality trends will further stabilize in 2012.
The overall economy, while showing signs of improvement, remains fragile and has yet to demonstrate a clear ability to sustain this improvement. As a result, the Company expects that certain of its credit metrics may remain volatile over the next several quarters, or until there are more sustained signs of economic recovery, including lower unemployment rates and stabilized property values.
30 First Financial Bancorp 2011 Annual Report
The allowance at December 31, 2011, was $52.6 million, or 1.77%, of loans, a 26 basis point decline from 2.03% of loans at December 31, 2010. Provision for loan and lease loss expense of $19.2 million was $14.4 million lower in 2011 than in 2010, primarily due to the Company’s expectations of risk inherent in the real estate construction and residential real estate loan portfolios and the resulting decline in the allowance.
Excluding covered loans, the allowance for loan and lease losses (allowance) as a percent of nonperforming loans was 68.8% at December 31, 2011, compared with 71.6% at December 31, 2010. This allowance coverage ratio declined in 2011 as the decline in the allowance outpaced the decline in nonperforming loans during the period. Larger balance nonperforming loan relationships are reviewed for specific valuation allowances and these valuation allowances are often less than 100% of loan value primarily due to the value of collateral, resulting in lower coverage ratios.
It is management’s belief that the allowance for loan and lease losses is adequate to absorb estimated credit losses in the loan and lease portfolio at December 31, 2011.
|
| | | | | | | | | | | | | |
| Table 14 • Allocation Of The Allowance For Loan And Lease Losses (Covered Loans) |
| | | | | | | | |
| | December 31, |
| | 2011 | 2010 |
| (Dollars in thousands) | Allowance | | Percent of Loans to Total Loans | | Allowance | | Percent of Loans to Total Loans |
| Balance at end of period applicable to: | | | | | |
| Commercial | $ | 19,160 |
| | 18.6 | % | | $ | 8,787 |
| | 22.6 | % |
| Real estate-commercial | 21,930 |
| | 62.1 | % | | 7,213 |
| | 60.6 | % |
| Real estate-residential | 1,396 |
| | 11.5 | % | | 232 |
| | 9.9 | % |
| Installment, home equity, & other | 349 |
| | 7.8 | % | | 261 |
| | 6.9 | % |
| Total | $ | 42,835 |
| | 100.0 | % | | $ | 16,493 |
| | 100.0 | % |
|
| | | | | | | | | | | | | | | | | | | |
| Table 15 • Nonperforming Assets (Excluding Covered Assets) |
| | | | | | | | |
| | December 31, |
| (Dollars in thousands) | 2011 | 2010 | 2009 | | 2008 | | 2007 |
| Nonaccrual loans | $ | 54,299 |
| | $ | 62,302 |
| | $ | 71,657 |
| | $ | 17,981 |
| | $ | 14,113 |
|
| Troubled debt restructurings | 22,080 |
| | 17,613 |
| | 6,125 |
| | 204 |
| | 567 |
|
| Other real estate owned (OREO) | 11,317 |
| | 17,907 |
| | 4,145 |
| | 4,028 |
| | 2,636 |
|
| Total nonperforming assets | $ | 87,696 |
| | $ | 97,822 |
| | $ | 81,927 |
| | $ | 22,213 |
| | $ | 17,316 |
|
| | | | | | | | | | |
| Nonperforming assets as a percent of total loans plus OREO | 2.94 | % | | 3.45 | % | | 2.83 | % | | 0.83 | % | | 0.67 | % |
| | | | | | | | | | |
| Accruing loans past due 90 days or more | $ | 191 |
| | $ | 370 |
| | $ | 417 |
| | $ | 138 |
| | $ | 313 |
|
|
| | | | | | | | | | | |
| Table 16 • Nonperforming Assets (Covered Assets) |
| | | | | |
| | December 31, |
| (Dollars in thousands) | 2011 | 2010 | | 2009 |
| Nonaccrual loans | $ | 11,160 |
| | $ | 19,755 |
| | $ | 16,415 |
|
| Other real estate owned (OREO) | 44,818 |
| | 35,257 |
| | 12,916 |
|
| Total nonperforming assets | $ | 55,978 |
| | $ | 55,012 |
| | $ | 29,331 |
|
| | | | | | |
| Accruing loans past due 90 days or more | $ | 107 |
| | $ | 9 |
| | $ | 1 |
|
First Financial Bancorp 2011 Annual Report 31
Management’s Discussion And Analysis Of Financial Condition And Results Of Operations
Allowance for loan and lease losses (covered loans): All loans acquired in the 2009 Peoples and Irwin acquisitions were covered by loss sharing agreements with the FDIC whereby the FDIC reimburses First Financial for the majority of the losses incurred. In accordance with the accounting guidance for business combinations, there was no allowance brought forward on covered loans as any credit deterioration evident in the loans at the time of acquisition was included in the determination of the fair value of the loans at the acquisition date. Generally the determination of the fair value of the loans resulted in a significant write-down in the value of the loans, which was assigned to an accretable or nonaccretable balance, with the accretable balance being recognized as interest income over the remaining term of the loan. The majority of the nonaccretable balance is expected to be received from the FDIC through the loss sharing agreements and is recorded as a separate indemnification asset from the covered loans and reflected on the Consolidated Balance Sheets.
The majority of covered loans are accounted for under FASB ASC Topic 310-30, whereby First Financial is required to periodically re-estimate the expected cash flows on the loans. For purposes of applying the guidance under FASB ASC Topic 310-30, First Financial grouped acquired loans into pools based on common risk characteristics. Generally, a decline in expected cash flows for a pool of loans is referred to as impairment and recorded as provision expense, and a related allowance for loan and lease losses on covered loans, on a discounted basis during the period. Estimated reimbursements due from the FDIC under loss share agreements related to any declines in expected cash flows for a pool of loans are recorded as noninterest income and an increase to the FDIC indemnification asset in the same period. Improvement in expected cash flows for a pool of loans, once any previously recorded impairment is recaptured, is recognized prospectively as an adjustment to the yield on the loans in the pool and a related adjustment to the yield on the FDIC indemnification asset. These cash flow evaluations are inherently subjective as they require material estimates, all of which may be susceptible to significant change. First Financial recognized provision expense related to impairment in the expected cash flows on certain covered loans, as well as enhanced yields reflecting improved cash flow expectations on other covered loans during 2011 and 2010.
The allowance for loan and lease losses on covered loans was $42.8 million and $16.5 million at December 31, 2011 and 2010, respectively. The related, estimated reimbursement on covered loan losses due from the FDIC under loss sharing agreements was recorded as both FDIC loss sharing income and an increase to the FDIC indemnification asset during 2011 and 2010.
ASSET QUALITY
Excluding covered assets: Due to the significant difference in the accounting for covered loans and the loss sharing agreements with the FDIC, management believes that asset quality measures excluding covered assets are generally more meaningful. Therefore, management has included asset quality measures that exclude covered loans in tables 11 and 15.
Nonperforming assets consist of nonaccrual loans, TDRs and OREO. The level of nonaccrual and TDRs are important elements in assessing asset quality. Loans are classified as nonaccrual when, in the opinion of management, collection of principal or interest is doubtful or when principal or interest payments are 90 days or more past due. Generally, loans are placed in nonaccrual status due to the continued failure to adhere to contractual payment terms by the borrower coupled with other pertinent factors, such as insufficient collateral value. The accrual of interest income is discontinued and previously accrued, but unpaid interest is reversed when a loan is placed in nonaccrual status. Loans are classified as TDRs when management grants concessions to the debtor that it would not otherwise consider in order to protect its investment. See Table 15 – Nonperforming Assets (Excluding Covered Assets) for a summary of First Financial’s nonaccrual loans, TDRs and OREO properties.
2011 vs. 2010. Total nonperforming assets decreased $10.1 million to $87.7 million at December 31, 2011, from $97.8 million at December 31, 2010, due primarily to a $6.6 million decline in OREO. The decline in OREO during 2011 was the result of the resolution and sale of $6.5 million of commercial and residential real estate property and $4.4 million of valuation write-downs, partially offset by $4.2 million of additions during the year.
New accounting guidance related to TDRs took effect during the third quarter of 2011 and was applied by the Company in its accounting for loans classified as TDRs. The $4.5 million increase in TDRs during 2011 was driven primarily by renewals and term extensions of loans in various stages of resolution that were already on nonaccrual status and contributed to the $8.0 million decline in nonaccrual loan balances from 2010.
Nonperforming loans as a percent of total loans was 2.57% at December 31, 2011, compared to 2.84% at December 31, 2010. The allowance to nonperforming loans ratio was 68.8% at December 31, 2011, compared to 71.6% at December 31, 2010. Accruing loans past due 90 days or more declined slightly to $0.2 million at December 31, 2011 from $0.4 million at December 31, 2010.
32 First Financial Bancorp 2011 Annual Report
Net charge-offs in 2011 were $23.9 million, an $11.8 million, or 33.0%, decline from 2010, with the ratio of net charge-offs as a percent of average loans outstanding declining from 1.27% in 2010 to 0.84% in 2011 as shown in Table 11 – Summary of Allowance for Loan and Lease Losses and Selected Statistics. The decline in net charge-offs during 2011 was primarily related to a $10.0 million, or 79.0%, decline in net charge-offs on commercial loans, a $2.3 million, or 27.3%, decline in net charge-offs on real estate construction loans and a $1.2 million, or 37.5%, decline in net charge-offs on home equity loans during the period. These declines were partially offset by a $3.0 million, or 41.7%, increase in net charge-offs on commercial real estate loans during 2011.
While First Financial’s credit quality trends improved in 2011, overall economic conditions remain challenging amid continued pressure on the commercial and residential real estate sectors.
First Financial experienced growth in the commercial real estate loan portfolio of $93.1 million, or 8.2%, including loans acquired in the Liberty banking center acquisition, during 2011. First Financial believes its current underwriting criteria coupled with active credit monitoring of loan relationships provides adequate oversight of the commercial real estate loan portfolio. The type, age, condition and location of commercial real estate properties, as well as any environmental risks associated with the properties, are considered in the underwriting process for both owner-occupied and investment properties. Credit risk is mitigated by limiting total credit exposure to individual borrowers or groups of borrowers and by requiring borrowers to have adequate down payments or cash equity, thereby limiting the loan balance in relation to the market value of the property. First Financial also regularly reviews borrowers' financial performance, makes periodic site visits to financed properties and monitors the factors in the Company's markets that influence real estate collateral values such as rental rates, occupancy trends and capitalization rates. At December 31, 2011, 90.1% of First Financial's commercial real estate loan balances were considered pass-rated credits.
In 2011, First Financial experienced $17.7 million, or 5.2%, growth in its home equity lending portfolio, including loans acquired in the Liberty acquisition. First Financial believes its current underwriting criteria coupled with the monitoring of a number of portfolio metrics including credit scores, loan-to-value ratios, line size, and usage, provides adequate oversight. First Financial's origination practices for home equity lending also keep both the credit decision and the documentation under the control of First Financial associates. At December 31, 2011, approximately 95.2% and 84.2% of the outstanding home equity lines had credit line sizes of less than $100,000 and $50,000 respectively, and had an average outstanding balance of approximately $30,000. First Financial maintains a strong pricing discipline for its home equity line product and does not sacrifice credit quality for growth. Approximately 90% and 89% of First Financial’s home equity line originations had credit scores of 700 or better at origination in 2011 and 2010, respectively. First Financial's ratio of net charge-offs to average loans in the home equity portfolio declined to 0.59% in 2011 from 0.99% in 2010. From an industry perspective it is likely home equity lending will continue to experience stress as borrowers remain under pressure and property values remain volatile in the current economic environment.
While economic conditions in the markets in which First Financial operates were improved in 2011, significant challenges to a broad economic recovery remain, including elevated vacancy rates, lower rents, depressed property values and persistently high unemployment rates. Management expects credit quality trends to remain volatile until economic conditions exhibit considerable improvement, including sustained declines in unemployment rates and stabilization of property values.
Covered assets: Covered loans accounted for under FASB ASC Topic 310-30 were grouped into pools for purposes of periodically re-estimating the expected cash flows and recognizing impairment or improvement in the loan pools. Accordingly, loans accounted for under FASB ASC Topic 310-30 are classified as performing, even though they may be contractually past due, as any nonpayment of contractual principal or interest is considered in the periodic re-estimation of expected cash flows and is included in the resulting recognition of current period covered loan loss provision or future period yield adjustments.
2011 vs. 2010. First Financial had $11.2 million of covered nonaccrual loans, excluding loans accounted for under FASB ASC Topic 310-30, and $44.8 million of covered OREO at December 31, 2011. First Financial had $19.8 million of covered nonaccrual loans, excluding loans accounted for under FASB ASC Topic 310-30, and $35.3 million of covered OREO at December 31, 2010. First Financial had covered loans 90 days past due and still accruing, excluding loans accounted for under FASB ASC Topic 310-30, of $0.1 million at December 31, 2011 and less than $10,000 at December 31, 2010.
LIQUIDITY
Liquidity management is the process by which First Financial manages the continuing flow of funds necessary to meet its financial commitments on a timely basis and at a reasonable cost. These funding commitments include withdrawals by
First Financial Bancorp 2011 Annual Report 33
Management’s Discussion And Analysis Of Financial Condition And Results Of Operations
depositors, credit commitments to borrowers, shareholder dividends, expenses of its operations and capital expenditures. Liquidity is monitored and closely managed by First Financial’s Asset and Liability Committee (ALCO), a group of senior officers from the lending, deposit gathering, finance, risk management and treasury areas. It is ALCO’s responsibility to ensure First Financial has the necessary level of funds available for normal operations as well as maintain a contingency funding policy to ensure that liquidity stress events are quickly identified and management plans are in place to respond. This is accomplished through the use of policies which establish limits and require measurements to monitor liquidity trends, including modeling and management reporting that identifies the amounts and costs of all available funding sources. These sources are periodically tested for funding availability.
Liquidity is derived primarily from deposit growth, principal and interest payments on loans and investment securities, maturing loans and investment securities, access to wholesale funding sources, and collateralized borrowings. First Financial’s most stable source of liability-funded liquidity for both the long and short-term needs is deposit growth and retention of the core deposit base. The deposit base is diversified among individuals, partnerships, corporations, public entities and geographic markets. This diversification helps First Financial minimize dependence on large concentrations of wholesale funding sources.
First Financial Bank received $190.7 million and $429.9 million of cash upon closing of the Liberty and Flagstar banking center acquisitions in 2011, respectively. The Company believes this provides sufficient liquidity to fund any runoff of deposits assumed in the transactions.
Capital expenditures, such as banking center expansions and technology investments, were $23.5 million for 2011, $22.8 million for 2010 and $13.2 million for 2009. First Financial also acquired $3.8 million and $6.6 million of fixed assets at estimated fair value as part of the Liberty and Flagstar banking center acquisitions, respectively. In addition, remodeling is a planned and ongoing process given First Financial’s 136 banking centers. Material commitments for capital expenditures as of December 31, 2011, were $18.3 million. Management believes that First Financial has sufficient liquidity to fund its future capital expenditure commitments.
First Financial had pledged certain eligible residential and farm real estate loans, home equity lines of credit, as well as certain government and agency securities, totaling $1.1 billion as collateral for borrowings to the FHLB as of December 31, 2011. For ease of borrowing execution, First Financial utilizes a blanket collateral agreement with the FHLB.
From time to time, First Financial utilizes its short-term line of credit and longer-term advances from the FHLB as funding sources. The Company had no short-term borrowings from the FHLB as of December 31, 2011 and 2010. Total long-term borrowings from the FHLB were $11.5 million and $63.9 million at December 31, 2011 and 2010, respectively. First Financial's total remaining borrowing capacity from the FHLB at December 31, 2011 was $353.9 million.
The principal source of asset-funded liquidity is marketable investment securities, particularly those of shorter maturities. The market value of investment securities classified as available-for-sale totaled $1.4 billion at December 31, 2011. Securities classified as held-to-maturity that are maturing within a short period of time are also a source of liquidity and totaled $0.3 million at December 31, 2011. In addition, other types of assets such as cash and due from banks, federal funds sold and securities purchased under agreements to resell, as well as loans maturing within one year, are sources of liquidity.
At December 31, 2011, in addition to liquidity on hand of $525.1 million, First Financial had unused and available overnight wholesale funding of approximately $2.9 billion, or approximately 44.1% of total assets, to fund significant deposit runoff that may occur as a result of recent deposit rationalization strategies as well as general corporate requirements.
Certain restrictions exist regarding the ability of First Financial’s subsidiaries to transfer funds to First Financial in the form of cash dividends, loans, other assets or advances. The approval of the subsidiaries’ respective primary federal regulators is required for First Financial’s subsidiaries to pay dividends in excess of regulatory limitations. Dividends paid to First Financial from its subsidiaries totaled $48.7 million, $60.7 million and $40.7 million for the years 2011, 2010 and 2009, respectively. As of December 31, 2011, First Financial’s subsidiaries had retained earnings of $350.4 million of which $214.9 million was available for distribution to First Financial without prior regulatory approval. Additionally, First Financial had $111.6 million in cash as of December 31, 2011, which is approximately three times the Company’s annual base shareholder dividend (currently $0.48 per share) and operating expenses. Management is not aware of any other events or regulatory requirements that, if implemented, are likely to have a material effect on First Financial’s liquidity.
Until its prepayment during the second quarter 2011, First Financial made quarterly interest payments on its junior subordinated debentures owed to its unconsolidated subsidiary trust. The trust preferred securities were redeemed on June 30, 2011 and, therefore, there was no interest expense associated with the junior subordinated debentures for the last six months of
34 First Financial Bancorp 2011 Annual Report
2011. Interest expense associated with the junior subordinated debenture was $0.4 million, $1.2 million and $1.2 million for the years 2011, 2010 and 2009, respectively.
During the first quarter of 2010, First Financial made a $1.1 million cash quarterly dividend payment to the U.S. Treasury on the 80,000 perpetual preferred securities, which carried a 5.0% dividend rate for the first five years and a 9.0% rate thereafter. On February 24, 2010, First Financial redeemed all of the $80.0 million of senior preferred shares issued to the U.S. Treasury in December 2008 under its Capital Purchase Program (CPP). First Financial included in its computation of earnings per diluted common share the impact of a non-cash, deemed dividend of $0.8 million, representing the unaccreted preferred stock discount remaining on the transaction date. This one-time deemed dividend was in addition to the first quarter 2010 preferred cash dividends paid through the redemption date.
First Financial had no common stock repurchase activity under publicly announced plans in 2011 or 2010.
MARKET RISK
Market risk is the risk of loss arising from adverse changes in the fair value of financial instruments due to changes in interest rates, foreign exchange rates and equity prices. The primary source of market risk for First Financial is interest-rate risk. Interest-rate risk is the risk to earnings and equity value arising from changes in market interest rates and arises in the normal course of business to the extent that there is a divergence between the amount of First Financial’s interest-earning assets and the amount of interest-bearing liabilities that are prepaid/withdrawn, re-price or mature in specified periods. First Financial seeks to achieve consistent growth in net interest income and equity while managing volatility arising from shifts in market interest rates. First Financial’s board of directors establishes policy limits with respect to interest rate risk. First Financial’s ALCO oversees market risk management, monitoring risk measures, limits and policy guidelines for managing the amount of interest-rate risk and its effect on net interest income and capital.
Interest rate risk management is an active process that encompasses monitoring loan and deposit flows complemented by investment and funding activities. Effective interest rate risk management begins with understanding the dynamic characteristics of assets and liabilities and determining the appropriate interest rate risk position given business activities, management objectives, market expectations and ALCO policy limits and guidelines.
Interest-rate risk for First Financial’s Consolidated Balance Sheets consists of repricing, option and basis risks. Repricing risk results from differences in the maturity, or repricing, of interest-bearing assets and liabilities. Option risk in financial instruments arises from embedded options such as loan prepayments, early withdrawal of certificates of deposits and calls on investments and debt instruments that are primarily driven by third party or client behavior. Basis risk refers to the potential for changes in the underlying relationship between market rates or indices, which subsequently result in a narrowing of the net interest margin. Basis risk is also present in managed rate liabilities, such as interest-bearing checking accounts and savings accounts, where historical pricing relationships to market rates may change due to the level or directional change in market interest rates, or competitive pressures.
Table 17 – Market Risk Disclosure projects the principal maturities and yields of First Financial’s interest-bearing financial instruments at December 31, 2011 for the next five years and thereafter. Also included with each category is the fair value of the instruments. For loans, securities and liabilities with contractual maturities, the table presents principal cash flows and related weighted-average interest rates by contractual maturities. For investment securities, including mortgage-backed securities and collateralized mortgage obligations, principal cash flows are based on estimated average lives. For loan instruments without contractual maturities, such as credit card loans, principal payments are allocated based on historical trends of payment activity. Maturities for interest-bearing liability accounts with no set maturity are estimated according to historical experience of cash flows and current expectations of client behaviors. For interest rate swaps, the table includes notional amounts and weighted-average interest rates by contractual maturity dates. The variable receiving rates are indexed to the one-month LIBOR plus a spread.
The interest-rate risk position is measured and monitored using income simulation models and economic value of equity sensitivity analysis that capture both short-term and long-term interest-rate risk exposure. Income simulation involves forecasting net interest income under a variety of interest rate scenarios including instantaneous shocks.
First Financial Bancorp 2011 Annual Report 35
Management’s Discussion And Analysis Of Financial Condition And Results Of Operations
Presented below is the estimated impact on First Financial’s net interest income as of December 31, 2011, assuming immediate, parallel shifts in interest rates:
|
| | | | | | | | | | | | |
| |
| -200 basis points |
| | -100 basis points |
| | +100 basis points |
| | +200 basis points |
|
| December 31, 2011 | | (11.10 | )% | | (5.87 | )% | | (0.70 | )% | | 2.13 | % |
Modeling the sensitivity of net interest income and the economic value of equity to changes in market interest rates is highly dependent on numerous assumptions incorporated into the modeling process. These assumptions are periodically reviewed in the context of balance sheet changes, product offerings, external economic factors and anticipated client behavior. Early in 2011, First Financial completed an update to its core deposit product repricing and retention formulas, as well as average life estimates, used in its interest rate risk modeling. The Company employed linear regression analysis in developing these updated components while utilizing an average of various predominant industry approaches to arrive at updated average life estimates. Using these updated assumptions, First Financial's projected results for earnings at risk and long-term economic value of equity indicate the Company remains in an asset sensitive position, which is consistent with results from the previous method employed. First Financial continues to refine the assumptions used in its interest rate risk modeling.
“Asset sensitive position” refers to an increase in interest rates, primarily short-term rates, that is expected to generate higher net interest income as rates earned on our interest-earning assets would reprice upward more quickly or in greater quantities than rates paid on our interest-bearing liabilities would reprice. Conversely, “liability sensitive position” refers to an increase in short-term interest rates that is expected to generate lower net interest income as rates paid on our interest-bearing liabilities would reprice upward more quickly or in greater quantities than rates earned on our interest-earning assets.
The interest rate risk analysis provides a framework as to what First Financial's overall sensitivity is as of the Company's most recent reported position. Management strategies may impact future reporting periods as our actual results may differ from simulated results due to the timing, magnitude, and frequency of interest rate changes; the difference between actual experience; and the characteristics assumed, as well as changes in market conditions. Market based prepayment speeds are factored into the analysis for loan and securities portfolios. Rate sensitivity for transactional deposit accounts is modeled based on both historical experience and external industry studies. Due to the current low interest rate environment, funding rates on deposit and wholesale funding instruments were not reduced below 0.0% in the down 200 and down 100 basis points scenarios.
First Financial uses economic value of equity sensitivity analysis to understand the impact of interest rate changes on long-term cash flows, income and capital. Economic value of equity is based on discounting the cash flows for all balance sheet instruments under different interest rate scenarios. Deposit premiums are based on external industry studies and utilizing historical experience.
Presented below is the change in First Financial’s economic value of equity position as of December 31, 2011, assuming immediate, parallel shifts in interest rates:
|
| | | | | | | | | | | | |
| | | -200 basis points |
| | -100 basis points |
| | +100 basis points |
| | +200 basis points |
|
| December 31, 2011 | | (21.72 | )% | | (7.99 | )% | | 4.47 | % | | 6.09 | % |
First Financial, utilizing interest rates primarily based upon external industry studies, models additional scenarios covering the next twelve months. Based on these scenarios, First Financial has a relatively neutral interest rate risk position of a positive 1.90% when compared to a base-case scenario with interest rates held constant. Given its outlook for future interest rates, First Financial is managing its balance sheet with a bias toward asset sensitivity.
36 First Financial Bancorp 2011 Annual Report
|
| | | | | | | | | | | | | | | | | | | | | | | | |
| Table 17 • Market Risk Disclosure |
| | | Fair Value |
| | Principal Amount Maturing In: | December 31, |
| (Dollars in thousands) | 2012 | 2013 | 2014 | 2015 | 2016 | Thereafter | Total | 2011 |
| Rate sensitive assets | | | | | | | | |
Fixed interest rate loans (1) | $ | 237,181 |
| $ | 205,833 |
| $ | 179,527 |
| $ | 105,793 |
| $ | 139,094 |
| $ | 218,083 |
| $ | 1,085,511 |
| $ | 1,078,750 |
|
| Average interest rate | 5.25 | % | 6.17 | % | 6.01 | % | 6.05 | % | 5.94 | % | 5.41 | % | 5.74 | % | |
Variable interest rate loans (1) | 574,939 |
| 207,870 |
| 172,106 |
| 129,943 |
| 117,280 |
| 653,056 |
| 1,855,194 |
| 1,856,909 |
|
| Average interest rate | 4.12 | % | 4.23 | % | 4.57 | % | 4.24 | % | 4.20 | % | 4.31 | % | 4.26 | % | |
| Covered loans | 332,928 |
| 138,860 |
| 120,196 |
| 75,325 |
| 63,837 |
| 279,263 |
| 1,010,409 |
| 1,042,752 |
|
| Average interest rate | 3.43 | % | 5.16 | % | 5.70 | % | 5.98 | % | 5.17 | % | 5.84 | % | 4.95 | % | |
| Fixed interest rate securities | 29,204 |
| 97,083 |
| 242,589 |
| 147,995 |
| 80,629 |
| 338,070 |
| 935,570 |
| 935,790 |
|
| Average interest rate | 4.46 | % | 2.56 | % | 2.66 | % | 3.00 | % | 2.66 | % | 3.27 | % | 2.98 | % | |
| Variable interest rate securities | 9,709 |
| 3,931 |
| 67,157 |
| 180,323 |
| 35,506 |
| 283,806 |
| 580,432 |
| 580,441 |
|
| Average interest rate | 1.29 | % | 0.81 | % | 0.93 | % | 1.19 | % | 3.04 | % | 3.04 | % | 2.18 | % | |
| Other earning assets | 375,398 |
| 0 |
| 0 |
| 0 |
| 0 |
| 0 |
| 375,398 |
| 375,398 |
|
| Average interest rate | 0.25 | % | 0.00 | % | 0.00 | % | 0.00 | % | 0.00 | % | 0.00 | % | 0.25 | % | |
| FDIC indemnification asset | 55,653 |
| 50,712 |
| 36,227 |
| 6,842 |
| 6,544 |
| 17,031 |
| 173,009 |
| 151,114 |
|
| Average interest rate | (5.10 | )% | (5.10 | )% | (5.10 | )% | (5.10 | )% | (5.10 | )% | (5.10 | )% | (5.10 | )% | |
| | | | | | | | | |
| Rate sensitive liabilities | | | | | | | | |
| Noninterest-bearing checking | 946,180 |
| 0 |
| 0 |
| 0 |
| 0 |
| 0 |
| 946,180 |
| 946,180 |
|
| Savings and interest-bearing checking | 304,200 |
| 2,737,798 |
| 0 |
| 0 |
| 0 |
| 0 |
| 3,041,998 |
| 3,041,998 |
|
| Average interest rate | 0.16 | % | 0.16 | % | 0.00 | % | 0.00 | % | 0.00 | % | 0.00 | % | 0.16 | % | |
| Time deposits | 1,038,465 |
| 413,841 |
| 76,980 |
| 61,963 |
| 53,892 |
| 9,521 |
| 1,654,662 |
| 1,664,457 |
|
| Average interest rate | 1.72 | % | 2.50 | % | 2.37 | % | 1.97 | % | 1.68 | % | 1.72 | % | 1.95 | % | |
| Fixed interest rate borrowings | 2,056 |
| 14,356 |
| 28,753 |
| 26,252 |
| 1,252 |
| 3,875 |
| 76,544 |
| 81,168 |
|
| Average interest rate | 3.87 | % | 3.59 | % | 3.47 | % | 3.56 | % | 3.93 | % | 4.35 | % | 3.58 | % | |
| Variable interest rate borrowings | 99,431 |
| 0 |
| 0 |
| 0 |
| 0 |
| 0 |
| 99,431 |
| 99,431 |
|
| Average interest rate | 0.10 | % | 0.00 | % | 0.00 | % | 0.00 | % | 0.00 | % | 0.00 | % | 0.10 | % | |
| | | | | | | | | |
| Interest Rate Derivatives | | | | | | | | |
| Interest rate swaps | | | | | | | | |
| Fixed to variable | 2,458 |
| 2,688 |
| 1,572 |
| 3,375 |
| 6,390 |
| 973 |
| 17,456 |
| (3,557 | ) |
| Average pay rate (fixed) | 6.71 | % | 6.55 | % | 6.70 | % | 6.78 | % | 6.78 | % | 6.89 | % | 6.73 | % | |
| Average receive rate (variable) | 2.48 | % | 2.46 | % | 2.25 | % | 2.41 | % | 1.93 | % | 2.60 | % | 2.25 | % | |
(1) Includes loans held for sale, but excludes covered loans.
OPERATIONAL RISK
As with most companies, First Financial is subject to operational risk in the products and services offered and in every business line. Operational risk is the risk of loss due to human behavior, inadequate or failed internal systems and controls and external influences such as market conditions, fraudulent activities, disasters and security risks. First Financial continuously strives to strengthen the Company’s system of internal controls, operating processes and employee awareness to assess the impact on earnings and capital and to improve the oversight of our operational risk.
First Financial Bancorp 2011 Annual Report 37
Management’s Discussion And Analysis Of Financial Condition And Results Of Operations
COMPLIANCE RISK
Compliance risk represents the risk of regulatory sanctions, reputational impact or financial loss resulting from the Company’s failure to comply with rules and regulations issued by the various banking agencies and standards of good banking practice. Activities which may expose First Financial to compliance risk include, but are not limited to, those dealing with the prevention of money laundering, privacy and data protection, community reinvestment initiatives, fair lending challenges resulting from the Company’s expansion of its banking center network and employment and tax matters.
STRATEGIC AND/OR REPUTATION RISK
Strategic risk represents the risk of loss due to failure to fully develop and execute business plans, failure to assess current and new opportunities in business, markets and products, and any other event not identified in the defined risk types previously mentioned. Strategic risk focuses on analyzing factors that affect the direction of the institution or improper implementation of decisions.
Reputation risk represents the risk of loss due to impairment of earnings and capital from negative publicity. This affects the ability of First Financial to establish new relationships or services or to continue servicing existing relationships. Reputation risk is recognized by the potential effect the public opinion could have on First Financial's franchise value.
Mitigation of the various risk elements that represent strategic and/or reputation risk is achieved through initiatives to help First Financial better understand and report on the various risks it faces each day, including those related to the development of new products and business initiatives.
PENSION PLAN
First Financial sponsors a non-contributory defined-benefit pension plan covering substantially all employees. Plan assets are administered by First Financial’s Wealth Management division and primarily consist of equity and debt mutual funds, as well as money market funds. The pension plan does not own any shares of First Financial common stock, directly or through an equity fund.
The significant assumptions used in the valuations and accounting for the pension plan include the discount rate, expected return on plan assets and the rate of compensation increase. The discount rate assumption was determined using published December 31, 2011 corporate bond indices, projected cash flows of the pension plan and comparisons to external industry surveys for reasonableness. The overall expected long-term return on plan assets was based on the composition of plan assets and a consensus of estimates from similarly managed portfolios of expected future returns. The expected return on plan assets was 7.5% for 2011 and 2010. First Financial will continue to monitor the return on plan assets and the investment vehicle used to fund the plan. The assumed rate of compensation increase, 3.5%, is compared to historical increases for plan participants.
Presented below is the estimated impact on First Financial’s projected benefit obligation and pension expense as of December 31, 2011, assuming shifts in the significant assumptions:
|
| | | | | | | | | | | | | | | | | | | | | | | | |
| | Discount Rate | | Expected Return on Plan Assets | | Rate of Compensation Increase |
| |
| -100 basis |
| +100 basis |
| -100 basis |
| +100 basis |
| -100 basis |
| +100 basis |
| (Dollars in thousands) | | points | | points | | points | | points | | points | | points |
| Change in Projected Benefit Obligation | | $ | 7,286 |
| | $ | (5,741 | ) | | N/A |
| | N/A |
| | $ | (809 | ) | | $ | 1,119 |
|
| Change in Pension Expense | | $ | 508 |
| | $ | (358 | ) | | $ | 1,203 |
| | $ | (1,203 | ) | | $ | (164 | ) | | $ | 291 |
|
As a result of the plan's funded status and related actuarial projections in 2011, First Financial recorded pension income in the Consolidated Statements of Income of $1.3 million. First Financial recorded pension expense of $2.0 million and $0.9 million, for 2010 and 2009, respectively. First Financial made no cash contributions to fund the pension plan in 2011. However, the Company made cash contributions to the plan totaling $60.0 million in 2010 and $30.8 million in 2009. First Financial does not expect to make a cash contribution to its pension plan in 2012. Contributions, if necessary, are required to meet ERISA’s minimum funding standards and the estimated quarterly contribution requirements during this period.
38 First Financial Bancorp 2011 Annual Report
|
| | | | | | | | | | | | | | | | | | | | |
| Table 18 • Contractual Obligations as of December 31, 2011 | |
| | | | | |
| (Dollars in thousands) | | Less than one year | | One to three years | | Three to five years | | More than five years | | Total |
| Contractual Obligations | | | | | | | | | | |
| Long-term debt obligations (including interest) | | | | | | | | | |
|
| Federal Home Loan Bank borrowings | | $ | 2,276 |
| | $ | 3,792 |
| | $ | 2,889 |
| | $ | 4,097 |
| | $ | 13,054 |
|
| National Market Repurchase Agreement | | 2,126 |
| | 43,890 |
| | 25,609 |
| | 0 |
| | 71,625 |
|
| Operating lease obligations | | 8,155 |
| | 13,597 |
| | 10,518 |
| | 22,955 |
| | 55,225 |
|
| Total | | $ | 12,557 |
| | $ | 61,279 |
| | $ | 39,016 |
| | $ | 27,052 |
| | $ | 139,904 |
|
CAPITAL
Risk-Based Capital. First Financial and its subsidiary, First Financial Bank, are subject to regulatory capital requirements administered by federal banking agencies. Capital adequacy guidelines and, additionally for banks, prompt corrective action regulations involve quantitative measures of assets, liabilities and certain off-balance sheet items calculated under regulatory accounting practices. Capital amounts and classifications are also subject to qualitative judgments by regulators. Failure to meet minimum capital requirements can initiate regulatory action.
Quantitative measures established by regulation to ensure capital adequacy require First Financial to maintain minimum amounts and ratios as defined by the regulations for Total and Tier 1 capital to risk-weighted assets and to average assets. Management believes that, as of December 31, 2011, First Financial met all capital adequacy requirements to which it was subject. At December 31, 2011 and December 31, 2010, regulatory notifications categorized First Financial as well-capitalized under the regulatory framework for prompt corrective action. To be categorized as well-capitalized, First Financial must maintain minimum Total risk-based, Tier 1 risk-based, and Tier 1 leverage ratios as set forth by regulation. There have been no conditions or events since those notifications that management believes has changed the Company’s category.
First Financial’s Tier I capital is comprised of total shareholders’ equity and prior to June 30, 2011 included its junior subordinated debentures, less unrealized gains and losses on investment securities available-for-sale accounted for under FASB ASC Topic 320, Investments-Debt and Equity Securities, and any amounts resulting from the application of FASB ASC Topic 715, Compensation – Retirement Benefits, that is recorded within accumulated other comprehensive income (loss), intangible assets, and any valuation adjustments related to mortgage servicing rights. Total risk-based capital consists of Tier I capital plus qualifying allowance for loan and lease losses and gross unrealized gains on equity securities.
For purposes of calculating the leverage ratio average assets represents quarterly average assets less assets not qualifying for Total risk-based capital, including intangible assets and non-qualifying mortgage servicing rights and allowance for loan and lease losses.
First Financial's regulatory capital ratios were impacted by the goodwill and core deposit intangible assets recognized in connection with the Liberty and Flagstar banking center acquisitions as well as an increase in accumulated other comprehensive loss as a result of valuation adjustments related to the Company’s pension asset and benefit obligation during 2011. Additionally, the contribution to shareholders’ equity from 2011 earnings was reduced as a result of the Company's variable dividend payout as discussed below.
First Financial has consistently maintained regulatory capital ratios at or above the level that results in its classification as “well-capitalized.” For further detail on capital ratios, see Note 17 of the Notes to Consolidated Financial Statements.
First Financial Bancorp 2011 Annual Report 39
Management’s Discussion And Analysis Of Financial Condition And Results Of Operations
|
| | | | | | | | |
| Table 19 • Capital Adequacy | | |
| | | | | |
| | | December 31, |
| (Dollars in thousands) | 2011 | | 2010 |
| Consolidated capital calculations: | | |
| | Common stock | $ | 579,871 |
| | $ | 580,097 |
|
| | Retained earnings | 331,351 |
| | 310,271 |
|
| | Accumulated other comprehensive loss | (21,490 | ) | | (12,044 | ) |
| | Treasury stock, at cost | (177,511 | ) | | (180,930 | ) |
| Total shareholders' equity | 712,221 |
| | 697,394 |
|
| | Goodwill | (95,050 | ) | | (51,820 | ) |
| | Other intangibles | (10,844 | ) | | (5,604 | ) |
| Total tangible equity | $ | 606,327 |
| | $ | 639,970 |
|
| | Total assets | $ | 6,671,511 |
| | $ | 6,250,225 |
|
| | Goodwill | (95,050 | ) | | (51,820 | ) |
| | Other intangibles | (10,844 | ) | | (5,604 | ) |
| Total tangible assets | $ | 6,565,617 |
| | $ | 6,192,801 |
|
| Tier 1 capital | $ | 636,836 |
| | $ | 680,145 |
|
| Total capital | $ | 683,255 |
| | $ | 727,252 |
|
| Total risk-weighted assets | $ | 3,645,403 |
| | $ | 3,687,224 |
|
| Average assets (1) | $ | 6,453,040 |
| | $ | 6,242,293 |
|
| | | | | |
| Regulatory capital: | | | |
| | Tier 1 ratio | 17.47 | % | | 18.45 | % |
| | Total capital ratio | 18.74 | % | | 19.72 | % |
| | Leverage ratio | 9.87 | % | | 10.89 | % |
| | | | | |
| Other capital ratios: | | | |
| | Total shareholders' equity to ending assets | 10.68 | % | | 11.16 | % |
| | Total tangible shareholders' equity to ending tangible assets | 9.23 | % | | 10.33 | % |
| | | | | |
| (1) For purposes of calculating the Leverage Ratio, certain intangible assets are excluded from average assets. |
Shelf Registrations. On April 28, 2011, First Financial filed a shelf registration on Form S-3 with the Securities and Exchange Commission (SEC). This shelf registration allows First Financial to raise capital from time to time through the sale of various types of securities, subject to approval by the Company's board of directors.
On October 1, 2008, First Financial filed a shelf registration on Form S-3 with the Securities and Exchange Commission (SEC). Subsequently on May 1, 2009, the Company amended the shelf registration on Form S-3. This amended shelf registration statement allowed the Company to raise capital from time to time, up to an aggregate of $200.0 million, through the sale of various types of securities. On June 8, 2009, the Company completed a public offering of 13,800,000 shares of its common stock at a price of $7.50 per share resulting in net proceeds of $98.0 million of additional common equity after offering related costs. On February 2, 2010, the Company completed a public offering of 6,372,117 shares of its common stock at a price of $15.14 per share resulting in net proceeds of $91.2 million of additional common equity after offering related costs. The offering on February 2, 2010 utilized the remaining capacity under the amended shelf registration statement. As a result of the capital raise, the Company's already strong capital ratios further improved and continued to significantly exceed the amounts necessary to be classified as well capitalized.
Shareholder Dividends. First Financial’s dividend payout ratio, or total dividends paid divided by net income available to common shareholders, was 67.24%, 39.60% and 8.26% for the years 2011, 2010 and 2009, respectively. The dividend payout
40 First Financial Bancorp 2011 Annual Report
ratio is continually reviewed by management and the board of directors for consistency with First Financial’s overall capital planning activities and compliance with applicable regulatory limitations.
In January 2009, First Financial announced the board of directors’ decision to reduce its quarterly cash dividend to common shareholders in a continued effort to further strengthen First Financial’s capital level. The quarterly cash dividend was reduced to $0.10 per share from the previous $0.17 per share and was consistent with the board of directors’ long-term target dividend payout range at the time of between 40% and 60% of normalized earnings available to common shareholders.
In January 2011, First Financial announced that it would increase the quarterly cash dividend to common shareholders. The quarterly cash dividend was increased to $0.12 per share from the previous $0.10 per share and was consistent with the board of directors’ long-term target dividend payout range of between 40% and 60% of normalized earnings available to common shareholders.
In July 2011, First Financial announced that the board of directors authorized a 100% dividend payout ratio consisting of two parts: a recurring dividend based on the stated payout ratio of 40% to 60% of earnings, currently $0.12 per share, and a variable dividend that would equal the remainder of the quarterly earnings. The variable dividend is expected to continue until First Financial has acquisitions or organic capital utilization rates that equal or exceed its capital generation rates.
Share Repurchases. On January 25, 2000, the board of directors authorized First Financial to repurchase the number of common shares necessary to satisfy any restricted stock awards or stock options that were granted from time to time under the 1999 Stock Incentive Option Plan for Officers and Employees and the 1999 Stock Option Plan for Non-Employee Directors. In 2007, the plan was amended to allow for the purchase of shares for general corporate purposes. Under this plan, First Financial repurchased 1,612,285 shares in 2007, 276,000 shares in 2001, and 650,110 shares in 2000. The total number of shares that can be repurchased over the remaining life of the ten-year plan may not exceed 7,507,500 shares. At December 31, 2011, 4,969,105 shares remained available for purchase under this program as ammended.
Capital Purchase Program. The Treasury, working with the Federal Reserve Board, established the Troubled Asset Relief Program (TARP) Capital Purchase Program (CPP), which was intended to stabilize the financial services industry, late in 2008. One of the components of the CPP included a $250 billion voluntary capital purchase program for certain qualified and healthy banking institutions. Pursuant to the CPP, Treasury purchased from First Financial 80,000 shares of $1,000 par value senior perpetual preferred securities at a total price of $80.0 million equal to approximately 3.0% of the Company’s then risk-weighted assets. Treasury also received a warrant for the purchase of common stock in the amount of 930,233 shares at a strike price of $12.90 per share. As a result of the common equity raised during the second quarter of 2009, the number of common shares eligible for purchase under the warrant agreement was reduced by 50% to 465,117 shares. Such preferred shares paid a dividend of 5% for the first five years and increased to 9% thereafter. In addition, subject to certain limited exceptions, financial institutions participating in the CPP were prohibited from (a) increasing their dividend to common shareholders and (b) conducting share repurchases without the prior approval of the Treasury. Participating financial institutions were also subject to certain limitations on executive compensation as well as other conditions. On January 21, 2009, First Financial filed a registration statement on Form S-3 with the SEC to register these securities as required by the security purchase agreement with the Treasury. On February 19, 2009, the registration statement was deemed effective by the SEC.
During 2010 and 2009, the Company paid cash dividends of $1.1 million and $3.6 million, respectively, to the Treasury on its senior perpetual preferred securities.
On February 24, 2010, First Financial Bancorp redeemed all of the $80.0 million of senior preferred shares issued to the Treasury in December 2008 under its CPP. First Financial included in its computation of earnings per diluted common share the impact of a non-cash, deemed dividend of $0.8 million, representing the unaccreted preferred stock discount remaining on the transaction date. This one-time deemed dividend is in addition to the first quarter 2010 preferred cash dividends paid through the redemption date, totaling $1.1 million. First Financial did not repurchase the warrant at that time. In June 2010, Treasury conducted a public auction of the warrants in which they were sold at a price of $6.70 per warrant. This transaction represented the final step in the redemption process and the Treasury no longer owns any securities issued by First Financial.
First Financial also opted to participate in the FDIC’s temporary liquidity guarantee program during 2009. The components of this program include the guarantee, until December 31, 2012, of certain newly issued senior unsecured debt issued by banks and bank holding companies through October 31, 2009 and full deposit insurance coverage for noninterest-bearing transaction accounts, regardless of size, until June 30, 2010. Participation in these programs resulted in an increase in deposit insurance premiums and any debt issued under the program was subject to an insurance premium. First Financial discontinued its participation in the FDIC’s temporary liquidity guarantee program in 2010 and did not issue debt guaranteed by the FDIC.
First Financial Bancorp 2011 Annual Report 41
Management’s Discussion And Analysis Of Financial Condition And Results Of Operations
Total shareholders’ equity at December 31, 2011 was $712.2 million compared to total shareholders’ equity at December 31, 2010 of $697.4 million.
For further detail, see the Consolidated Statements of Changes in Shareholders’ Equity.
CRITICAL ACCOUNTING POLICIES
First Financial’s Consolidated Financial Statements are prepared based on the application of accounting policies, the most significant of which are described in Note 1 of the Notes to Consolidated Financial Statements. These policies require the reliance on estimates and assumptions. Changes in underlying factors, assumptions or estimates in any of these areas could have a material impact on First Financial’s future financial condition and results of operations. In management’s opinion, some of these areas have a more significant impact than others on First Financial’s financial reporting. For First Financial, these areas currently include accounting for the allowance for loan and lease losses, income taxes, covered loans, FDIC indemnification asset, pension, and goodwill.
Allowance for loan and lease losses (excluding covered loans). First Financial maintains the allowance for loan and lease losses at a level that it considers sufficient to absorb probable loan and lease losses inherent in the portfolio. Management determines the adequacy of the allowance based on periodic evaluations of the loan portfolio and other factors. These evaluations are inherently subjective as they require material estimates, all of which may be susceptible to significant change, including, among others:
| |
| • | exposure at date of default; |
| |
| • | amounts and timing of expected future cash flows on impaired loans; |
| |
| • | historical loss exposure; and |
| |
| • | the effects of changes in economic conditions that may not be reflected in historical results. |
To the extent actual outcomes differ from management’s estimates, additional provision for credit losses may be required that would impact First Financial’s operating results. The Credit Risk section of this annual report provide management’s analysis of the allowance for loan and lease losses.
Covered loans. Loans acquired in FDIC-assisted transactions are covered under loss sharing agreements. Covered loans were recorded at fair value at acquisition. Fair values for covered loans were based on a discounted cash flow methodology that considered various factors including the type of loan and related collateral, classification status, fixed or variable interest rate, term of loan and whether or not the loan was amortizing, and a discount rate reflecting the Company’s assessment of risk inherent in the cash flow estimates. For purposes of estimating the fair values of covered loans, the loans were grouped together according to similar characteristics and were treated in the aggregate when applying various valuation techniques. Generally the determination of the fair value of the loans resulted in a significant write-down in the value of the loans, which was assigned to an accretable or nonaccretable balance, with the accretable balance being recognized as interest income over the expected life of the loan. The nonaccretable portion of the write-down in the value of the loans represents expected credit impairment on the loans and is only recognized in income if the payments on the loan exceed the recorded fair value of the loan.
First Financial accounts for and evaluates acquired loans for impairment in accordance with the provisions of FASB ASC Topic 310-30, Loans and Debt Securities Acquired with Deteriorated Credit Quality. The cash flows expected to be collected on purchased loans are estimated based upon the expected remaining life of the underlying loans, which includes the effects of estimated prepayments. First Financial is accounting for the majority of purchased loans under FASB ASC Topic 310-30 except loans with revolving privileges, which are outside the scope of this guidance, and loans for which cash flows could not be estimated, which are accounted for under the cost recovery method. For purposes of applying the accounting guidance under FASB ASC Topic 310-30, First Financial groups acquired loans into pools based on common risk characteristics. Expected cash flows are re-estimated periodically for each pool of loans. Any decline in expected cash flows for a pool of loans is referred to as impairment and recorded as provision expense on a discounted basis during the period. Improvement in expected cash flows for a pool of loans, once any previously recorded impairment is recaptured, is recognized prospectively as an adjustment to the yield on the loans in the pool. These cash flow evaluations are inherently subjective as they require material estimates, all of which may be susceptible to significant change.
42 First Financial Bancorp 2011 Annual Report
In addition to the accretion income described above, covered loans impact noninterest income as described in the following two scenarios:
For covered loans that prepay, this income is a result of the net effect of:
| |
| • | the recovery of the remaining yield-based fair value adjustment, or accretable yield; and |
| |
| • | the recovery of the value adjustment associated with assumed credit impairment offset by the corresponding valuation adjustment on the FDIC indemnification asset |
This scenario can occur either through a strategic loan sale or ordinary prepayments that are typical in a loan portfolio.
For covered loans that pay according to their contractual obligation, this income is a result of the net effect of:
| |
| • | The value adjustment associated with assumed credit impairment offset by the corresponding valuation adjustment on the FDIC indemnification asset |
Allowance for loan and lease losses – covered loans. First Financial maintains an allowance for loan and lease losses on covered loans. For loans accounted for under FASB ASC Topic 310-30, expected cash flows are re-estimated periodically with any decline in expected cash flows recorded as provision expense on a discounted basis during the period. These cash flow evaluations are inherently subjective as they require material estimates, all of which may be susceptible to significant change. The related, estimated reimbursement on covered loan losses due from the FDIC under loss sharing agreements is recorded as both FDIC loss sharing income and an increase to the FDIC indemnification asset.
FDIC indemnification asset. FDIC indemnification assets result from the loss share agreements in the FDIC-assisted transactions and are measured separately from the related covered assets as they are not contractually embedded in those assets and are not transferable should First Financial choose to dispose of the covered assets. The FDIC indemnification assets represent the estimated fair value of expected reimbursements from the FDIC for losses on covered assets. Pursuant to the terms of the loss sharing agreements, covered assets are subject to stated loss thresholds whereby the FDIC will reimburse First Financial for 80% of losses up to the stated loss thresholds and 95% of losses in excess of these amounts. FDIC indemnification assets were recorded at their estimated fair values at the time of the FDIC-assisted transaction. Fair values were estimated using projected cash flows related to the loss sharing agreements based on the expected reimbursements for losses and the applicable loss sharing percentages. These cash flows are discounted to reflect the uncertainty of the timing of the loss sharing reimbursement from the FDIC.
The accounting for FDIC indemnification assets is closely related to the accounting for the underlying, indemnified assets. First Financial re-estimates the expected indemnification asset cash flows in conjunction with the periodic re-estimation of cash flows on covered loans accounted for under FASB ASC Topic 310-30. Improvements in cash flow expectations on covered loans generally result in a related decline in the expected indemnification cash flows and are reflected as a downward yield adjustment on the indemnification assets. Declines in cash flow expectations on covered loans generally result in an increase in expected indemnification cash flows and are reflected as both FDIC loss sharing income and an increase to the indemnification asset.
Reimbursement requests are submitted to the FDIC on a monthly basis for single family residential covered loans and on a quarterly basis for all other covered loans. As of December 31, 2011, the reimbursement claims submitted by First Financial to the FDIC had been reimbursed on a timely basis.
Goodwill. Goodwill arising from business acquisitions represents the value attributable to unidentifiable intangible elements in the business acquired. FASB ASC Topic 350, Intangibles – Goodwill and Other, requires goodwill to be tested for impairment on an annual basis and more frequently in certain circumstances. At least annually, First Financial reviews goodwill for impairment using both income- and asset-based approaches. The income-based approach utilizes a multiple of earnings method in which First Financial’s annualized earnings are compared to equity to provide an implied bookvalue-to-earnings multiple. First Financial then compares the implied multiple to current marketplace earnings multiples for which banks are being traded. An implied multiple less than current marketplace earnings multiples is an indication of possible goodwill impairment. The asset-based approach uses the discounted cash flows of First Financial’s assets and liabilities, inclusive of goodwill, to determine an implied fair value. This input is used to calculate the fair value of the Company, including goodwill, and is compared to the Company’s book value. An implied fair value that exceeds the Company’s book value is an indication that goodwill is not impaired. If First Financial’s book value exceeds the implied fair value, an impairment loss equal to the excess amount would be recognized. Based on First Financial’s analysis at year-end 2011, no impairment charges were required.
First Financial Bancorp 2011 Annual Report 43
Management’s Discussion And Analysis Of Financial Condition And Results Of Operations
Pension. First Financial sponsors a non-contributory defined-benefit pension plan covering substantially all employees. Accounting for the pension plan involves material estimates regarding future plan obligations and investment returns on plan assets. Significant assumptions used in the pension plan include the discount rate, expected return on plan assets, and the rate of compensation increase. First Financial determines the discount rate assumption using published corporate bond indices, projected cash flows of the pension plan and comparisons to external industry surveys for reasonableness. The expected long-term return on plan assets is based on the composition of plan assets and a consensus of estimates of expected future returns from similarly managed portfolios while the rate of compensation increase is compared to historical increases for plan participants. Changes in these assumptions can have a material impact on the amount of First Financial’s future pension obligations, on the funded status of the plan and can impact First Financial’s operating results.
Income Taxes. First Financial evaluates and assesses the relative risks and appropriate tax treatment of transactions after considering statutes, regulations, judicial precedent and other information and maintains tax accruals consistent with its evaluation of these relative risks. Changes to the estimate of accrued taxes occur periodically due to changes in tax rates, interpretations of tax laws, the status of examinations being conducted by taxing authorities and changes to statutory, judicial and regulatory guidance that impact the relative risks of tax positions. These changes, when they occur, can affect deferred taxes and accrued taxes as well as the current period’s income tax expense and can be material to First Financial’s operating results.
FORWARD-LOOKING STATEMENTS
Certain statements contained in this news release which are not statements of historical fact constitute forward-looking statements within the meaning of the Private Securities Litigation Reform Act (the Act). In addition, certain statements in future filings by First Financial with the SEC, in press releases, and in oral and written statements made by or with the approval of First Financial which are not statements of historical fact constitute forward-looking statements within the meaning of the Act. Examples of forward-looking statements include, but are not limited to, projections of revenues, income or loss, earnings or loss per share, the payment or non-payment of dividends, capital structure and other financial items, statements of plans and objectives of First Financial or its management or board of directors, and statements of future economic performances and statements of assumptions underlying such statements. Words such as ''believes'', ''anticipates'', “likely”, “expected”, ''intends'', and other similar expressions are intended to identify forward-looking statements but are not the exclusive means of identifying such statements. Management's analysis contains forward-looking statements that are provided to assist in the understanding of anticipated future financial performance. However, such performance involves risks and uncertainties that may cause actual results to differ materially. Factors that could cause actual results to differ from those discussed in the forward-looking statements include, but are not limited to:
| |
| ▪ | management's ability to effectively execute its business plan; |
| |
| ▪ | the risk that the strength of the United States economy in general and the strength of the local economies in which we conduct operations may continue to deteriorate resulting in, among other things, a further deterioration in credit quality or a reduced demand for credit, including the resultant effect on our loan portfolio, allowance for loan and lease losses and overall financial performance; |
| |
| ▪ | the effects of the potential delay or failure of the U.S. federal government to pay its debts as they become due or make payments in the ordinary course; |
| |
| ▪ | the ability of financial institutions to access sources of liquidity at a reasonable cost; |
| |
| ▪ | the impact of recent upheaval in the financial markets and the effectiveness of domestic and international governmental actions taken in response, such as the U.S. Treasury's TARP and the FDIC's Temporary Liquidity Guarantee Program, and the effect of such governmental actions on us, our competitors and counterparties, financial markets generally and availability of credit specifically, and the U.S. and international economies, including potentially higher FDIC premiums arising from increased payments from FDIC insurance funds as a result of depository institution failures; |
| |
| ▪ | the effect of and changes in policies and laws or regulatory agencies (notably the recently enacted Dodd-Frank Wall Street Reform and Consumer Protection Act); |
| |
| ▪ | inflation and possible changes in interest rates; |
| |
| ▪ | our ability to keep up with technological changes; |
| |
| ▪ | our ability to comply with the terms of loss sharing agreements with the FDIC; |
| |
| ▪ | mergers and acquisitions, including costs or difficulties related to the integration of acquired companies and the wind-down of non-strategic operations that may be greater than expected, such as the risks and uncertainties associated with the Irwin Mortgage Corporation bankruptcy proceedings and other acquired subsidiaries; |
| |
| ▪ | the risk that exploring merger and acquisition opportunities may detract from management's time and ability to |
44 First Financial Bancorp 2011 Annual Report
successfully manage our company;
| |
| ▪ | expected cost savings in connection with the consolidation of recent acquisitions may not be fully realized or realized within the expected time frames, and deposit attrition, customer loss and revenue loss following completed acquisitions may be greater than expected; |
| |
| ▪ | our ability to increase market share and control expenses; |
| |
| ▪ | the effect of changes in accounting policies and practices, as may be adopted by the regulatory agencies as well as the Financial Accounting Standards Board and the SEC; |
| |
| ▪ | adverse changes in the securities and debt markets; |
| |
| ▪ | our success in recruiting and retaining the necessary personnel to support business growth and expansion and maintain sufficient expertise to support increasingly complex products and services; |
| |
| ▪ | monetary and fiscal policies of the Board of Governors of the Federal Reserve System (Federal Reserve) and the U.S. government and other governmental initiatives affecting the financial services industry; |
| |
| ▪ | our ability to manage loan delinquency and charge-off rates and changes in estimation of the adequacy of the allowance for loan losses; and |
| |
| ▪ | the costs and effects of litigation and of unexpected or adverse outcomes in such litigation. |
Such forward-looking statements are meaningful only on the date when such statements are made, and First Financial undertakes no obligation to update any forward-looking statement to reflect events or circumstances after the date on which such a statement is made to reflect the occurrence of unanticipated events.
First Financial Bancorp 2011 Annual Report 45
|
| | | | | | | | | | | | | | | | | | | | | | | | | | | | | | | | |
| Statistical Information | | | | | | | | | | | | | | |
| | | | | | | | | | | | | | | | | | |
| | 2011 | | 2010 | | 2009 |
| | Balance | | Interest | | Yield | | Balance | | Interest | | Yield | | Balance | | Interest | | Yield |
| Earning assets | Daily average balances and interest rates (Tax equivalent basis; dollars in thousands) : |
Loans (1), (4) | | | | | | | | | | | | | | | | | |
Commercial (2) | $ | 811,474 |
| | $ | 44,003 |
| | 5.42 | % | | $ | 751,459 |
| | $ | 37,565 |
| | 5.00 | % | | $ | 841,088 |
| | $ | 39,181 |
| | 4.66 | % |
| Real estate-construction | 143,751 |
| | 5,374 |
| | 3.74 | % | | 198,395 |
| | 7,621 |
| | 3.84 | % | | 254,746 |
| | 9,673 |
| | 3.80 | % |
| Real estate-commercial | 1,155,209 |
| | 59,905 |
| | 5.19 | % | | 1,120,646 |
| | 64,015 |
| | 5.71 | % | | 945,456 |
| | 53,388 |
| | 5.65 | % |
| Real estate-residential | 283,346 |
| | 13,389 |
| | 4.73 | % | | 307,227 |
| | 15,265 |
| | 4.97 | % | | 351,376 |
| | 18,608 |
| | 5.30 | % |
| Installment and other consumer | 443,054 |
| | 21,087 |
| | 4.76 | % | | 438,742 |
| | 21,413 |
| | 4.88 | % | | 427,504 |
| | 23,501 |
| | 5.50 | % |
Lease financing (2) | 10,536 |
| | 628 |
| | 5.96 | % | | 72 |
| | 3 |
| | 4.17 | % | | 31 |
| | 2 |
| | 6.45 | % |
| Total loans, excluding covered loans | 2,847,370 |
| | 144,386 |
| | 5.07 | % | | 2,816,541 |
| | 145,882 |
| | 5.18 | % | | 2,820,201 |
| | 144,353 |
| | 5.12 | % |
| Covered loans and indemnification asset | 1,443,365 |
| | 134,861 |
| | 9.34 | % | | 1,968,896 |
| | 173,733 |
| | 8.82 | % | | 703,562 |
| | 58,271 |
| | 8.28 | % |
Investment securities (3) | | | | | | | | | | | | | | | | | |
| Taxable | 1,134,780 |
| | 28,239 |
| | 2.49 | % | | 642,831 |
| | 21,748 |
| | 3.38 | % | | 638,685 |
| | 29,376 |
| | 4.60 | % |
Tax-exempt (2) | 14,992 |
| | 1,180 |
| | 7.87 | % | | 19,513 |
| | 1,437 |
| | 7.36 | % | | 29,158 |
| | 2,285 |
| | 7.84 | % |
Total investment securities (3) | 1,149,772 |
| | 29,419 |
| | 2.56 | % | | 662,344 |
| | 23,185 |
| | 3.50 | % | | 667,843 |
| | 31,661 |
| | 4.74 | % |
| Interest-bearing deposits with other banks | 361,591 |
| | 1,130 |
| | 0.31 | % | | 459,618 |
| | 1,568 |
| | 0.34 | % | | 151,198 |
| | 208 |
| | 0.14 | % |
| Total earning assets | 5,802,098 |
| | 309,796 |
| | 5.34 | % | | 5,907,399 |
| | 344,368 |
| | 5.83 | % | | 4,342,804 |
| | 234,493 |
| | 5.40 | % |
| | | | | | | | | | | | | | | | | | |
| Nonearning assets | | | | | | | | | | | | | | | | | |
| Allowance for loan and lease losses | (97,826 | ) | | | | | | (64,694 | ) | | | | | | (42,553 | ) | | | | |
| Cash and due from banks | 115,692 |
| | | | | | 228,539 |
| | | | | | 133,611 |
| | | | |
| Accrued interest and other assets | 464,997 |
| | | | | | 414,388 |
| | | | | | 300,947 |
| | | | |
| Total assets | $ | 6,284,961 |
| | | | | | $ | 6,485,632 |
| | | | | | $ | 4,734,809 |
| | | | |
| | | | | | | | | | | | | | | | | | |
| Interest-bearing liabilities | | | | | | | | | | | | | | | | | |
| Deposits | | | | | | | | | | | | | | | | | |
| Interest-bearing demand | $ | 1,191,064 |
| | $ | 2,954 |
| | 0.25 | % | | $ | 1,076,403 |
| | $ | 4,307 |
| | 0.40 | % | | $ | 862,730 |
| | $ | 3,097 |
| | 0.36 | % |
| Savings | 1,624,840 |
| | 5,806 |
| | 0.36 | % | | 1,391,066 |
| | 8,329 |
| | 0.60 | % | | 771,202 |
| | 3,461 |
| | 0.45 | % |
| Time | 1,642,108 |
| | 32,021 |
| | 1.95 | % | | 2,032,719 |
| | 45,700 |
| | 2.25 | % | | 1,537,564 |
| | 41,022 |
| | 2.67 | % |
| Total interest-bearing deposits | 4,458,012 |
| | 40,781 |
| | 0.91 | % | | 4,500,188 |
| | 58,336 |
| | 1.30 | % | | 3,171,496 |
| | 47,580 |
| | 1.50 | % |
| Borrowed funds | | | | | | | | | | | | | | | | | |
| Short-term borrowings | 96,060 |
| | 163 |
| | 0.17 | % | | 47,536 |
| | 94 |
| | 0.20 | % | | 244,014 |
| | 1,318 |
| | 0.54 | % |
| Long-term debt | 98,185 |
| | 3,586 |
| | 3.65 | % | | 299,202 |
| | 8,341 |
| | 2.79 | % | | 224,475 |
| | 7,145 |
| | 3.18 | % |
| Other long-term debt | 10,169 |
| | 391 |
| | 3.85 | % | | 20,620 |
| | 1,221 |
| | 5.92 | % | | 20,620 |
| | 1,202 |
| | 5.83 | % |
| Total borrowed funds | 204,414 |
| | 4,140 |
| | 2.03 | % | | 367,358 |
| | 9,656 |
| | 2.63 | % | | 489,109 |
| | 9,665 |
| | 1.98 | % |
| Total interest-bearing liabilities | 4,662,426 |
| | 44,921 |
| | 0.96 | % | | 4,867,546 |
| | 67,992 |
| | 1.40 | % | | 3,660,605 |
| | 57,245 |
| | 1.56 | % |
| Noninterest-bearing liabilities | | | | | | | | | | | | | | | | | |
| Noninterest-bearing demand deposits | 766,366 |
| | | | | | 744,159 |
| | | | | | 539,336 |
| | | | |
| Other liabilities | 143,917 |
| | | | | | 190,940 |
| | | | | | 68,258 |
| | | | |
| Shareholders' equity | 712,252 |
| | | | | | 682,987 |
| | | | | | 466,610 |
| | | | |
| Total liabilities and shareholders' equity | $ | 6,284,961 |
| | | | | | $ | 6,485,632 |
| | | | | | $ | 4,734,809 |
| | | | |
| Net interest income and interest rate spread (fully tax equivalent) | | | $ | 264,875 |
| | 4.38 | % | | | | $ | 276,376 |
| | 4.43 | % | | | | $ | 177,248 |
| | 3.84 | % |
| Net interest margin (fully tax equivalent) | | | | | 4.57 | % | | | | | | 4.68 | % | | | | | | 4.08 | % |
| Interest income and yield | | | 308,817 |
| | 5.32 | % | | | | 343,502 |
| | 5.81 | % | | | | 233,228 |
| | 5.37 | % |
| Interest expense and rate | | | 44,921 |
| | 0.96 | % | | | | 67,992 |
| | 1.40 | % | | | | 57,245 |
| | 1.56 | % |
| Net interest income and spread | | | $ | 263,896 |
| | 4.36 | % | | | | $ | 275,510 |
| | 4.41 | % | | | | $ | 175,983 |
| | 3.81 | % |
| Net interest margin | | | | | 4.55 | % | | | | | | 4.66 | % | | | | | | 4.05 | % |
| | | | | | | | | | | | | | | | | | |
| (1) Nonaccrual loans are included in average loan balance and loan fees are included in interest income. | | | | | | |
| (2) Interest income on tax-exempt investments and on certain tax-exempt loans and leases has been adjusted to a tax equivalent basis using a 35.00% tax rate. |
| (3) Includes investment securities held-to-maturity, investment securities available-for-sale, investment securities trading, and other investments. |
| (4) Includes loans held-for-sale. | | | | | | | | | | | | | | | | | |
| N/M=Not meaningful | | | | | | | | | | | | | | | | | |
46 First Financial Bancorp 2011 Annual Report
Management’s Report On Internal Control Over Financial Reporting
First Financial’s management is responsible for establishing and maintaining adequate internal control over financial reporting. First Financial’s internal control over financial reporting is a process designed under the supervision of First Financial’s chief executive officer and chief financial officer to provide reasonable assurance regarding the reliability of financial reporting and the preparation of financial statements for external purposes in accordance with generally accepted accounting principles. Any system of internal control, no matter how well designed, has inherent limitations, including the possibility that a control can be circumvented or overridden and misstatements due to error or fraud may occur and not be detected. Also, because of changes in conditions, internal control effectiveness may vary over time. Accordingly, even an effective system of internal control will provide only reasonable assurance with respect to financial statement preparation. As of December 31, 2011, First Financial’s management, including the chief executive officer and the chief financial officer, evaluated the effectiveness of First Financial’s internal controls over financial reporting, using as its framework for that evaluation the Internal Control – Integrated Framework published by the Committee of Sponsoring Organizations (COSO) of the Treadway Commission. Based upon that evaluation, management believes that First Financial’s internal control over financial reporting is effective based on those criteria.
Ernst & Young LLP, the independent registered public accounting firm that audited the consolidated financial statements included in this Form 10-K, has issued an attestation report on First Financial’s internal control over financial reporting as of December 31, 2011. The report, which expresses an unqualified opinion on First Financial’s internal control over financial reporting as of December 31, 2011, is included in the information that follows under the heading “Report on Internal Control Over Financial Reporting.”
|
| | | |
| /s/ Claude E. Davis | | /s/ J. Franklin Hall | |
President and Chief Executive Officer | | Executive Vice President, Chief Financial Officer and Chief Operating Officer | |
| February 24, 2012 | | February 24, 2012 | |
First Financial Bancorp 2011 Annual Report 47
|
|
| Report Of Independent Registered Public Accounting Firm |
Report On Internal Control Over Financial Reporting
The Board of Directors and Shareholders of First Financial Bancorp
We have audited First Financial Bancorp’s Internal Control Over Financial Reporting as of December 31, 2011, based on criteria established in Internal Control – Integrated Framework issued by the Committee of Sponsoring Organizations of the Treadway Commission (the COSO criteria). First Financial Bancorp’s management is responsible for maintaining effective internal control over financial reporting, and for its assessment about the effectiveness of internal control over financial reporting included in the accompanying Management’s Report On Internal Control Over Financial Reporting. Our responsibility is to express an opinion on the Company’s internal control over financial reporting based on our audit.
We conducted our audit in accordance with the standards of the Public Company Accounting Oversight Board (United States). Those standards require that we plan and perform the audit to obtain reasonable assurance about whether effective internal control over financial reporting was maintained in all material respects. Our audit included obtaining an understanding of internal control over financial reporting, assessing the risk that a material weakness exists, testing and evaluating the design and operating effectiveness of internal control based on the assessed risk, and performing such other procedures as we considered necessary in the circumstances. We believe that our audit provides a reasonable basis for our opinion.
A company’s internal control over financial reporting is a process designed to provide reasonable assurance regarding the reliability of financial reporting and the preparation of financial statements for external purposes in accordance with generally accepted accounting principles. A company’s internal control over financial reporting includes those policies and procedures that (1) pertain to the maintenance of records that, in reasonable detail, accurately and fairly reflect the transactions and dispositions of the assets of the company; (2) provide reasonable assurance that transactions are recorded as necessary to permit preparation of financial statements in accordance with generally accepted accounting principles, and that receipts and expenditures of the company are being made only in accordance with authorizations of management and directors of the company; and (3) provide reasonable assurance regarding prevention or timely detection of unauthorized acquisition, use, or disposition of the company’s assets that could have a material effect on the financial statements.
Because of its inherent limitations, internal control over financial reporting may not prevent or detect misstatements. Also, projections of any evaluation of effectiveness to future periods are subject to the risk that controls may become inadequate because of changes in conditions, or that the degree of compliance with the policies or procedures may deteriorate.
In our opinion, First Financial Bancorp maintained, in all material respects, effective internal control over financial reporting as of December 31, 2011, based on the COSO criteria.
We also have audited, in accordance with the standards of the Public Company Accounting Oversight Board (United States), the consolidated balance sheets of First Financial Bancorp as of December 31, 2011, and 2010, and the related consolidated statements of income, changes in shareholders’ equity, and cash flows for each of the three years in the period ended December 31, 2011, of First Financial Bancorp and our report dated February 24, 2012 expressed an unqualified opinion thereon.
|
| |
| Cincinnati, Ohio | |
| February 24, 2012 |
|
|
| Report Of Independent Registered Public Accounting Firm |
Report On Consolidated Financial Statements
The Board of Directors and Shareholders of First Financial Bancorp
We have audited the accompanying consolidated balance sheets of First Financial Bancorp (the Company) as of December 31, 2011 and 2010, and the related consolidated statements of income, changes in shareholders’ equity, and cash flows for each of the three years in the period ended December 31, 2011. These financial statements are the responsibility of First Financial Bancorp’s management. Our responsibility is to express an opinion on these financial statements based on our audits.
We conducted our audits in accordance with the standards of the Public Company Accounting Oversight Board (United States). Those standards require that we plan and perform the audit to obtain reasonable assurance about whether the financial statements are free of material misstatement. An audit includes examining, on a test basis, evidence supporting the amounts and disclosures in the financial statements. An audit also includes assessing the accounting principles used and significant estimates made by management, as well as evaluating the overall financial statement presentation. We believe that our audits provide a reasonable basis for our opinion.
In our opinion, the financial statements referred to above present fairly, in all material respects, the consolidated financial position of First Financial Bancorp at December 31, 2011, and 2010, and the consolidated results of its operations and its cash flows for each of the three years in the period ended December 31, 2011, in conformity with U.S. generally accepted accounting principles.
We also have audited, in accordance with the standards of the Public Company Accounting Oversight Board (United States), First Financial Bancorp’s internal control over financial reporting as of December 31, 2011, based on criteria established in Internal Control – Integrated Framework issued by the Committee of Sponsoring Organizations of the Treadway Commission and our report dated February 24, 2012 expressed an unqualified opinion thereon.
|
| |
| Cincinnati, Ohio | |
| February 24, 2012 |
48 First Financial Bancorp 2011 Annual Report
Consolidated Balance Sheets
|
| | | | | | | |
| | December 31, |
| (Dollars in thousands) | 2011 | | 2010 |
| Assets | | | |
| Cash and due from banks | $ | 149,653 |
| | $ | 105,981 |
|
| Interest-bearing deposits with other banks | 375,398 |
| | 176,952 |
|
| Investment securities available-for-sale, at market value (cost $1,421,490 at December 31, 2011 and $904,546 at December 31, 2010) | 1,441,846 |
| | 919,110 |
|
| Investment securities held-to-maturity (market value $2,893 at December 31, 2011 and $18,066 at December 31, 2010) | 2,664 |
| | 17,406 |
|
| Other investments | 71,492 |
| | 78,689 |
|
| Loans held for sale | 24,834 |
| | 29,292 |
|
| Loans: | |
| | |
|
| Commercial | 856,981 |
| | 800,253 |
|
| Real estate-construction | 114,974 |
| | 163,543 |
|
| Real estate-commercial | 1,233,067 |
| | 1,139,931 |
|
| Real estate-residential | 287,980 |
| | 269,173 |
|
| Installment | 67,543 |
| | 69,711 |
|
| Home equity | 358,960 |
| | 341,310 |
|
| Credit card | 31,631 |
| | 29,563 |
|
| Lease financing | 17,311 |
| | 2,609 |
|
| Total loans, excluding covered loans | 2,968,447 |
| | 2,816,093 |
|
| Less: Allowance for loan and lease losses | 52,576 |
| | 57,235 |
|
| Net loans - excluding covered loans | 2,915,871 |
| | 2,758,858 |
|
| Covered loans | 1,053,244 |
| | 1,481,493 |
|
| Less: Allowance for loan and lease losses | 42,835 |
| | 16,493 |
|
| Net loans – covered | 1,010,409 |
| | 1,465,000 |
|
| Total net loans | 3,926,280 |
| | 4,223,858 |
|
| Premises and equipment | 138,096 |
| | 118,477 |
|
| Goodwill | 95,050 |
| | 51,820 |
|
| Other intangibles | 10,844 |
| | 5,604 |
|
| FDIC indemnification asset | 173,009 |
| | 222,648 |
|
| Accrued interest and other assets | 262,345 |
| | 300,388 |
|
| Total assets | $ | 6,671,511 |
| | $ | 6,250,225 |
|
| | | | |
| Liabilities | |
| | |
|
| Deposits: | |
| | |
|
| Interest-bearing demand | $ | 1,317,339 |
| | $ | 1,111,877 |
|
| Savings | 1,724,659 |
| | 1,534,045 |
|
| Time | 1,654,662 |
| | 1,794,843 |
|
| Total interest-bearing deposits | 4,696,660 |
| | 4,440,765 |
|
| Noninterest-bearing | 946,180 |
| | 705,484 |
|
| Total deposits | 5,642,840 |
| | 5,146,249 |
|
| Federal funds purchased and securities sold under agreements to repurchase | 99,431 |
| | 59,842 |
|
| Long-term debt | 76,544 |
| | 128,880 |
|
| Other long-term debt | 0 |
| | 20,620 |
|
| Total borrowed funds | 175,975 |
| | 209,342 |
|
| Accrued interest and other liabilities | 140,475 |
| | 197,240 |
|
| Total liabilities | 5,959,290 |
| | 5,552,831 |
|
| | | | |
| Shareholders' equity | |
| | |
|
| Common stock - no par value | |
| | |
|
| Authorized - 160,000,000 shares Issued - 68,730,731 shares in 2011 and 2010 | 579,871 |
| | 580,097 |
|
| Retained earnings | 331,351 |
| | 310,271 |
|
| Accumulated other comprehensive loss | (21,490 | ) | | (12,044 | ) |
| Treasury stock, at cost, 10,463,677 shares in 2011 and 10,665,754 shares in 2010 | (177,511 | ) | | (180,930 | ) |
| Total shareholders' equity | 712,221 |
| | 697,394 |
|
| Total liabilities and shareholders' equity | $ | 6,671,511 |
| | $ | 6,250,225 |
|
See notes to consolidated financial statements.
First Financial Bancorp 2011 Annual Report 49
Consolidated Statements of Income
|
| | | | | | | | | | | |
| | Years ended December 31, |
| (Dollars in thousands except per share data) | 2011 | | 2010 | | 2009 |
| Interest income | | | | | |
| Loans, including fees | $ | 285,689 |
| | $ | 306,075 |
| | $ | 195,917 |
|
| Investment securities | |
| | | | |
|
| Taxable | 28,239 |
| | 21,748 |
| | 29,376 |
|
| Tax-exempt | 767 |
| | 934 |
| | 1,492 |
|
| Total investment securities interest | 29,006 |
| | 22,682 |
| | 30,868 |
|
| Other earning assets | (5,878 | ) | | 14,745 |
| | 6,443 |
|
| Total interest income | 308,817 |
| | 343,502 |
| | 233,228 |
|
| Interest expense | |
| | |
| | |
| Deposits | 40,781 |
| | 58,336 |
| | 47,580 |
|
| Short-term borrowings | 163 |
| | 94 |
| | 1,318 |
|
| Long-term borrowings | 3,586 |
| | 8,341 |
| | 7,145 |
|
| Subordinated debentures and capital securities | 391 |
| | 1,221 |
| | 1,202 |
|
| Total interest expense | 44,921 |
| | 67,992 |
| | 57,245 |
|
| Net interest income | 263,896 |
| | 275,510 |
| | 175,983 |
|
| Provision for loan and lease losses - uncovered | 19,210 |
| | 33,564 |
| | 56,084 |
|
| Provision for loan and lease losses - covered | 64,081 |
| | 63,144 |
| | 0 |
|
| Net interest income after provision for loan and lease losses | 180,605 |
| | 178,802 |
| | 119,899 |
|
| | | | | | |
| Noninterest income | |
| | |
| | |
| Service charges on deposit accounts | 19,206 |
| | 22,188 |
| | 19,662 |
|
| Trust and wealth management fees | 14,340 |
| | 13,862 |
| | 13,465 |
|
| Bankcard income | 9,291 |
| | 8,518 |
| | 5,961 |
|
| Net gains from sales of loans | 4,258 |
| | 4,632 |
| | 1,196 |
|
| Gains on sales of investment securities | 2,541 |
| | 0 |
| | 3,349 |
|
| Gain on acquisition | 0 |
| | 0 |
| | 342,494 |
|
| FDIC loss sharing income | 60,888 |
| | 51,844 |
| | 0 |
|
| Accelerated discount on covered loans | 20,521 |
| | 29,067 |
| | 8,601 |
|
| (Loss) income on preferred securities | 0 |
| | (30 | ) | | 139 |
|
| Other | 11,486 |
| | 16,750 |
| | 9,848 |
|
| Total noninterest income | 142,531 |
| | 146,831 |
| | 404,715 |
|
| | | | | | |
| Noninterest expenses | |
| | |
| | |
| Salaries and employee benefits | 106,914 |
| | 117,363 |
| | 86,068 |
|
| Net occupancy | 21,410 |
| | 22,555 |
| | 16,202 |
|
| Furniture and equipment | 9,945 |
| | 10,299 |
| | 8,054 |
|
| Data processing | 5,716 |
| | 5,152 |
| | 3,475 |
|
| Marketing | 5,794 |
| | 5,357 |
| | 3,494 |
|
| Communication | 3,203 |
| | 3,908 |
| | 3,246 |
|
| Professional services | 9,636 |
| | 9,169 |
| | 6,032 |
|
| Debt extinguishment | 0 |
| | 8,029 |
| | 0 |
|
| State intangible tax | 3,583 |
| | 4,843 |
| | 2,508 |
|
| FDIC assessments | 5,676 |
| | 8,312 |
| | 6,847 |
|
| Loss-other real estate owned | 3,971 |
| | 1,163 |
| | 268 |
|
| Loss-covered other real estate owned | 9,224 |
| | 916 |
| | 0 |
|
| Other | 33,025 |
| | 36,614 |
| | 34,444 |
|
| Total noninterest expenses | 218,097 |
| | 233,680 |
| | 170,638 |
|
| Income before income taxes | 105,039 |
| | 91,953 |
| | 353,976 |
|
| Income tax expense | 38,300 |
| | 32,702 |
| | 132,639 |
|
| Net income | 66,739 |
| | 59,251 |
| | 221,337 |
|
| Dividends on preferred stock | 0 |
| | 1,865 |
| | 3,578 |
|
| Income available to common shareholders | $ | 66,739 |
| | $ | 57,386 |
| | $ | 217,759 |
|
| | | | | | |
| Earnings per common share: | | | | | |
| Basic | $ | 1.16 |
| | $ | 1.01 |
| | $ | 4.84 |
|
| Diluted | $ | 1.14 |
| | $ | 0.99 |
| | $ | 4.78 |
|
| Average common shares outstanding-basic | 57,691,979 |
| | 56,969,491 |
| | 45,028,640 |
|
| Average common shares outstanding-diluted | 58,693,205 |
| | 57,993,078 |
| | 45,556,868 |
|
See Notes to Consolidated Financial Statements.
50 First Financial Bancorp 2011 Annual Report
Consolidated Statements of Changes in Shareholders' Equity
|
| | | | | | | | | | | | | | | | | | | | | | | | | | | | | | | | |
| | Preferred Stock | | Preferred Stock | | Common Stock | | Common Stock | | Retained | | Accumulated other comprehensive | | Treasury stock | | |
| (Dollars in thousands, except share amounts) | Shares | | Amount | | Shares | | Amount | | earnings | | income (loss) | | Shares | | Amount | | Total |
| Balances at January 1, 2009 | 80,000 |
| | $ | 78,019 |
| | 48,558,614 |
| | $ | 394,169 |
| | $ | 76,339 |
| | $ | (11,905 | ) | | (11,077.413 | ) | | $ | (188,295 | ) | | $ | 348,327 |
|
| Net income | |
| | |
| | |
| | |
| | 221,337 |
| | |
| | |
| | |
| | 221,337 |
|
| Unrealized holding gains on securities available-for-sale arising during the period | |
| | |
| | |
| | |
| | |
| | 3,285 |
| | |
| | |
| | 3,285 |
|
| Change in retirement obligation | |
| | |
| | |
| | |
| | |
| | (2,148 | ) | | |
| | |
| | (2,148 | ) |
| Unrealized loss on derivatives-Prime Swap | |
| | |
| | |
| | |
| | |
| | (474 | ) | | |
| | |
| | (474 | ) |
| Unrealized gain on derivatives-Trust Preferred Swap | |
| | |
| | |
| | |
| | |
| | 636 |
| | |
| | |
| | 636 |
|
| Foreign Currency Exchange | |
| | |
| | |
| | |
| | |
| | 119 |
| | |
| | |
| | 119 |
|
| Total comprehensive income | |
| | |
| | |
| | |
| | |
| | |
| | |
| | |
| | 222,755 |
|
| Issuance of common stock | |
| | |
| | 13,800,000 |
| | 97,985 |
| | |
| | |
| | |
| | |
| | 97,985 |
|
| Cash dividends declared : | |
| | |
| | |
| | |
| | |
| | |
| | |
| | |
| | |
| Common stock at $0.40 per share | |
| | |
| | |
| | |
| | (17,794 | ) | | |
| | |
| | |
| | (17,794 | ) |
| Preferred stock | |
| | |
| | |
| | |
| | (3,578 | ) | | |
| | |
| | |
| | (3,578 | ) |
| Warrant reduction | | | 826 |
| | | | (991 | ) | | 165 |
| | | | | | | | 0 |
|
| Discount on preferred stock | |
| | 350 |
| | |
| | |
| | (350 | ) | | |
| | |
| | |
| | 0 |
|
| Excess tax benefit on share-based compensation | |
| | |
| | |
| | (189 | ) | | |
| | |
| | |
| | |
| | (189 | ) |
| Restricted stock awards, net of forfeitures | |
| | |
| | |
| | (3,241 | ) | | |
| | |
| | 152,620 |
| | 2,894 |
| | (347 | ) |
| Share-based compensation expense | |
| | |
| | |
| | 2,799 |
| | |
| | |
| | |
| | |
| | 2,799 |
|
| Balances at December 31, 2009 | 80,000 |
| | 79,195 |
| | 62,358,614 |
| | 490,532 |
| | 276,119 |
| | (10,487 | ) | | (10,924,793 | ) | | (185,401 | ) | | 649,958 |
|
| | | | | | | | | | | | | | | | | | |
| Net income | | | | | | | | | 59,251 |
| | | | | | | | 59,251 |
|
| Unrealized holding losses on securities available-for-sale arising during the period | | | | | | | | | | | (1,160 | ) | | | | | | (1,160 | ) |
| Change in retirement obligation | | | | | | | | | | | 479 |
| | | | | | 479 |
|
| Unrealized loss on derivatives-Prime Swap | | | | | | | | | | | (295 | ) | | | | | | (295 | ) |
| Unrealized loss on derivatives-Trust Preferred Swap | | | | | | | | | | | (1,027 | ) | | | | | | (1,027 | ) |
| Foreign Currency Exchange | | | | | | | | | | | 446 |
| | | | | | 446 |
|
| Total comprehensive income | | | | | | | | | | | | | | | | | 57,694 |
|
| Issuance of common stock | | | | | 6,372,117 |
| | 91,224 |
| | | | | | | | | | 91,224 |
|
| Preferred stock-CPP payoff | (80,000 | ) | | (79,235 | ) | | | | | | | | | | | | | | (79,235 | ) |
| Cash dividends declared : | | | | | | | | | | | | | | | | | |
| Common stock at $0.40 per share | | | | | | | | | (23,194 | ) | | | | | | | | (23,194 | ) |
| Preferred stock | | | | | | | | | (1,100 | ) | | | | | | | | (1,100 | ) |
| Discount on preferred stock | | | 40 |
| | | | | | (805 | ) | | | | | | | | (765 | ) |
| Excess tax benefit on share-based compensation | | | | | | | 535 |
| | | | | | | | | | 535 |
|
| Exercise of stock options, net of shares purchased | | | | | | | (1,692 | ) | | | | | | 88,794 |
| | 1,506 |
| | (186 | ) |
| Restricted stock awards, net of forfeitures | | | | | | | (3,586 | ) | | | | | | 170,245 |
| | 2,965 |
| | (621 | ) |
| Share-based compensation expense | | | | | | | 3,084 |
| | | | | | | | | | 3,084 |
|
| Balances at December 31, 2010 | 0 |
| | 0 |
| | 68,730,731 |
| | 580,097 |
| | 310,271 |
| | (12,044 | ) | | (10,665,754 | ) | | (180,930 | ) | | 697,394 |
|
| | | | | | | | | | | | | | | | | | |
| Net income | | | | | | | | | 66,739 |
| | | | | | | | 66,739 |
|
| Unrealized holding gains on securities available-for-sale arising during the period | | | | | | | | | | | 3,605 |
| | | | | | 3,605 |
|
| Change in retirement obligation | | | | | | | | | | | (12,854 | ) | | | | | | (12,854 | ) |
| Unrealized gain on derivatives-Trust Preferred Swap | | | | | | | | | | | 391 |
| | | | | | 391 |
|
| Foreign Currency Exchange | | | | | | | | | | | (588 | ) | | | | | | (588 | ) |
| Total comprehensive income | | | | | | | | | | | | | | | | | 57,293 |
|
| Cash dividends declared : | | | | | | | | | | | | | | | | | |
| Common stock at $0.78 per share | | | | | | | | | (45,659 | ) | | | | | | | | (45,659 | ) |
| Excess tax benefit on share-based compensation | | | | | | | 259 |
| | | | | | | | | | 259 |
|
| Exercise of stock options, net of shares purchased | | | | | | | (485 | ) | | | | | | 23,492 |
| | 398 |
| | (87 | ) |
| Restricted stock awards, net of forfeitures | | | | | | | (3,935 | ) | | | | | | 178,585 |
| | 3,021 |
| | (914 | ) |
| Share-based compensation expense | | | | | | | 3,935 |
| | | | | | | | | | 3,935 |
|
| Balances at December 31, 2011 | 0 |
| | $ | 0 |
| | 68,730,731 |
| | $ | 579,871 |
| | $ | 331,351 |
| | $ | (21,490 | ) | | (10,463,677 | ) | | $ | (177,511 | ) | | $ | 712,221 |
|
See Notes to Consolidated Financial Statements.
First Financial Bancorp 2011 Annual Report 51
Consolidated Statements Of Cash Flows
|
| | | | | | | | | | | |
| | Year ended December 31, |
| (Dollars in thousands) | 2011 | | 2010 | | 2009 |
| Operating activities | | | | | |
| Net income | $ | 66,739 |
| | $ | 59,251 |
| | $ | 221,337 |
|
| Adjustments to reconcile net income to net cash provided by operating activities: | |
| | | | |
| Provision for loan and lease losses | 83,291 |
| | 96,708 |
| | 56,084 |
|
| Depreciation and amortization | 11,951 |
| | 10,978 |
| | 8,626 |
|
| Stock-based compensation expense | 3,935 |
| | 3,084 |
| | 2,799 |
|
| Pension (income) expense | (1,349 | ) | | 2,011 |
| | 914 |
|
| Net amortization of premiums/accretion of discounts on investment securities | 5,224 |
| | 998 |
| | 1,148 |
|
| Gains on sales of investments securities | (2,541 | ) | | 0 |
| | (3,349 | ) |
| Income (loss) on trading securities | 0 |
| | 30 |
| | (139 | ) |
| Gain on acquisition | 0 |
| | 0 |
| | (342,494 | ) |
| Originations of loans held for sale | (157,825 | ) | | (166,333 | ) | | (141,697 | ) |
| Net gains from sales of loans held for sale | (4,258 | ) | | (4,632 | ) | | (1,196 | ) |
| Proceeds from sales of loans held for sale | 166,541 |
| | 146,029 |
| | 138,633 |
|
| Deferred income taxes | (14,463 | ) | | (11,460 | ) | | 116,399 |
|
| (Increase) decrease in interest receivable | (1,438 | ) | | 8,584 |
| | (7,424 | ) |
| Increase in cash surrender value of life insurance | (805 | ) | | (3,819 | ) | | (3,586 | ) |
| Decrease (increase) in prepaid expenses | 6,230 |
| | 4,832 |
| | (17,721 | ) |
| Decrease in indemnification asset | 49,639 |
| | 64,759 |
| | 349 |
|
| (Increase) decrease in accrued expenses | (17,422 | ) | | 7,828 |
| | 26,187 |
|
| (Decrease) increase in interest payable | (1,853 | ) | | 757 |
| | (1,274 | ) |
| Contribution to pension plan | 0 |
| | (60,000 | ) | | (30,800 | ) |
| Other | 11,482 |
| | 25,410 |
| | 16,657 |
|
| Net cash provided by operating activities | 203,078 |
| | 185,015 |
| | 39,453 |
|
| | | | | | |
| Investing activities | |
| | |
| | |
|
| Proceeds from sales of investment securities available-for-sale | 165,153 |
| | 0 |
| | 152,751 |
|
| Proceeds from calls, paydowns and maturities of securities available-for-sale | 342,973 |
| | 168,385 |
| | 185,308 |
|
| Purchases of securities available-for-sale | (1,027,754 | ) | | (618,978 | ) | | (113,151 | ) |
| Proceeds from calls, paydowns and maturities of securities held-to-maturity | 12,002 |
| | 1,288 |
| | 708 |
|
| Purchases of securities held-to-maturity | 0 |
| | (577 | ) | | (248 | ) |
| Net (increase) decrease in interest-bearing deposits with other banks | (198,446 | ) | | 85,065 |
| | (262,017 | ) |
| Net (increase) decrease in loans and leases, excluding covered loans | (53,946 | ) | | 24,746 |
| | (214,531 | ) |
| Net decrease in covered assets | 340,877 |
| | 374,532 |
| | 150,185 |
|
| Proceeds from disposal of other real estate owned | 40,994 |
| | 14,168 |
| | 5,665 |
|
| Purchases of premises and equipment | (23,541 | ) | | (22,789 | ) | | (13,180 | ) |
| Net cash acquired from acquisition | 620,640 |
| | 0 |
| | 285,562 |
|
| Net cash proceeds received from FDIC-assisted transactions | 0 |
| | 0 |
| | 967,391 |
|
| Net cash provided by investing activities | 218,952 |
| | 25,840 |
| | 1,144,443 |
|
| | | | | | |
| Financing activities | |
| | |
| | |
|
| Net increase in total deposits | (310,029 | ) | | (204,391 | ) | | (536,669 | ) |
| Net increase (decrease) in short-term borrowings | 39,589 |
| | 22,412 |
| | (372,103 | ) |
| Payments on long-term borrowings | (52,308 | ) | | (255,486 | ) | | (107,103 | ) |
| Redemption of other long-term debt | (20,620 | ) | | 0 |
| | 0 |
|
| Cash dividends paid on common stock | (35,312 | ) | | (22,490 | ) | | (19,024 | ) |
| Cash dividends paid on preferred stock | 0 |
| | (1,100 | ) | | (3,578 | ) |
| Redemption of preferred stock | 0 |
| | (80,000 | ) | | 0 |
|
| Issuance of common stock, net of issuance costs | 0 |
| | 91,224 |
| | 97,985 |
|
| Proceeds from exercise of stock options | 63 |
| | 272 |
| | 0 |
|
| Excess tax benefit on share-based compensation | 259 |
| | 535 |
| | (189 | ) |
| Net cash used in financing activities | (378,358 | ) | | (449,024 | ) | | (940,681 | ) |
| | | | | | |
| Cash and Due from Banks: | |
| | |
| | |
|
| Net increase (decrease) in Cash and Due from Banks | 43,672 |
| | (238,169 | ) | | 243,215 |
|
| Cash and Due from Banks at beginning of period | 105,981 |
| | 344,150 |
| | 100,935 |
|
| Cash and Due from Banks at end of period | $ | 149,653 |
| | $ | 105,981 |
| | $ | 344,150 |
|
52 First Financial Bancorp 2011 Annual Report
Consolidated Statements Of Cash Flows (continued)
|
| | | | | | | | | | | |
| Supplemental disclosures | | | | | |
| Interest paid | $ | 46,774 |
| | $ | 67,235 |
| | $ | 58,519 |
|
| Income taxes paid | $ | 60,438 |
| | $ | 45,665 |
| | $ | 16,485 |
|
| Acquisition of other real estate owned through foreclosure | $ | 53,865 |
| | $ | 50,714 |
| | $ | 19,052 |
|
| Issuance of restricted stock awards | $ | 4,188 |
| | $ | 4,719 |
| | $ | 2,418 |
|
| | | | | | |
| Supplemental schedule for investing activities | | | | | |
| Acquisitions | | | | | |
| Assets acquired - branch acquisitions | $ | 765,125 |
| | $ | 0 |
| | $ | 79,101 |
|
| Liabilities assumed - branch acquisitions | 808,355 |
| | 0 |
| | 84,641 |
|
| Goodwill | $ | 43,230 |
| | $ | 0 |
| | $ | 5,540 |
|
| Assets acquired - Peoples | $ | 0 |
| | $ | 0 |
| | $ | 566,642 |
|
| Liabilities assumed - Peoples | 0 |
| | 0 |
| | 584,661 |
|
| Goodwill | $ | 0 |
| | $ | 0 |
| | $ | 18,019 |
|
| Assets acquired - Irwin | $ | 0 |
| | $ | 0 |
| | $ | 3,230,376 |
|
| Liabilities assumed - Irwin | $ | 0 |
| | $ | 0 |
| | $ | 2,887,882 |
|
| Bargain purchase gain | $ | 0 |
| | $ | 0 |
| | $ | 342,494 |
|
See Notes to Consolidated Financial Statements.
First Financial Bancorp 2011 Annual Report 53
Notes To Consolidated Financial Statements
1. Summary Of Significant Accounting Policies
Basis of presentation. The Consolidated Financial Statements of First Financial Bancorp. (First Financial or the Company), a bank holding company, principally serving Ohio, Indiana and Kentucky, include the accounts and operations of First Financial and its wholly owned subsidiary, First Financial Bank, N.A. (First Financial Bank or the Bank). All significant intercompany transactions and accounts have been eliminated in consolidation. Certain reclassifications of prior years' amounts have been made to conform to current year presentation. Such reclassifications had no effect on net earnings.
Use of estimates. The preparation of Consolidated Financial Statements in conformity with U.S. Generally Accepted Accounting Principles (GAAP) requires management to make estimates, assumptions, and judgments that affect the amounts reported in the Consolidated Financial Statements and accompanying Notes. Actual realized amounts could differ materially from those estimates.
Investment securities. First Financial classifies debt and equity securities into three categories: trading, held-to-maturity, and available-for-sale.
Management determines the appropriate classification of investment securities at the time of purchase and reevaluates such designation as of each balance sheet date. Investment securities are classified as held-to-maturity when First Financial has the positive intent and ability to hold the securities to maturity. Held-to-maturity securities are stated at amortized cost.
Investment securities classified as trading are held principally for resale in the near term and are recorded at fair value. Gains or losses, either unrealized or realized, are reported in noninterest income. Quoted market prices are used to determine the fair value of trading securities.
Investment securities not classified as either held-to-maturity or trading are classified as available-for-sale. Available-for-sale securities are stated at aggregate fair value, with the unrealized gains and losses, net of tax, reported as a separate component of accumulated other comprehensive income (loss) in shareholders' equity.
The amortized cost of investment securities classified as either held-to-maturity or available-for-sale is adjusted for amortization of premiums and accretion of discounts to maturity, or in the case of mortgage-backed securities, over the estimated life of the security. Such amortization is considered an adjustment to the yield on the security and included in interest income from investments. Interest and dividends are included in interest income from investment securities.
Realized gains and losses are based on amortized cost of the security sold using the specific identification method. Available-for-sale and held-to-maturity securities are reviewed quarterly for potential impairment in fair value. In performing this review, management considers the length of time and extent to which the security’s fair value has been less than amortized cost, the financial condition and near-term prospects of the issuer, and the ability and intent of First Financial to hold the security for a period sufficient to allow for any anticipated recovery in fair value. If the fair value of a security is less than the amortized cost and the impairment is determined to be other-than-temporary, the security is written down, establishing a new and reduced cost basis. The related charge is recorded in the Consolidated Statements of Income as impairment on investment securities.
Other investments include holdings in Federal Reserve Bank (FRB) stock and Federal Home Loan Bank (FHLB) stock. FRB and FHLB stock are both carried at cost.
Loans and leases (excluding covered loans). Loans and leases for which First Financial has the intent and ability to hold for the foreseeable future, or until maturity or payoff, are classified in the Consolidated Balance Sheets as loans and leases. Except for loans which are subject to fair value requirements, loans and leases are carried at the principal amount outstanding, net of unamortized deferred loan origination fees and costs and net of unearned income. Loan origination and commitment fees received, as well as certain direct loan origination costs paid, are deferred, and the net amount is amortized as an adjustment to the related loan's yield. Interest income is recorded on the accrual basis. The accrual of interest income is discontinued and previously accrued, but unpaid interest is reversed when a loan is placed in nonaccrual status. Any payments received while a loan is in nonaccrual status are applied as a reduction to the carrying value of the loan. A loan may be placed back on accrual status if all contractual payments have been received and collection of future principal and interest payments is no longer doubtful.
54 First Financial Bancorp 2011 Annual Report
Loans held for sale may come from two sources: residential real estate loans newly originated for the purpose of sale to third parties and in certain circumstances, previously originated loans that have been specifically identified by management for sale based on predetermined criteria. Loans originated for sale are placed immediately into that category upon origination and are considered to be at fair market value due to the commitment to sell in a short timeframe. Loans transferred to held for sale status are carried at the lower of cost or fair value with any difference charged to the allowance for loan and lease losses. Any subsequent change in carrying value of transferred loans, not to exceed original cost, is recorded in the Consolidated Statements of Income.
Allowance for loan and lease losses (excluding covered loans). For each reporting period, management maintains the allowance for loan and lease losses at a level that it considers sufficient to absorb probable loan and lease losses inherent in the portfolio. Management determines the adequacy of the allowance based on historical loss experience as well as other significant factors such as composition of the portfolio, economic conditions, geographic footprint, the results of periodic internal and external evaluations of delinquent, nonaccrual, and classified loans, and any other adverse situations that may affect a specific borrower's ability to repay (including the timing of future payments). This evaluation is inherently subjective as it requires utilizing material estimates that may be susceptible to significant change. Allocation of the allowance may be made for specific loans, but the entire allowance is available for any loan that, in management's judgment, is deemed to be uncollectible.
Management's determination of the adequacy of the allowance is based on an assessment of the probable loan and lease losses inherent in the portfolio given the conditions at the time. The allowance is increased by provisions charged to expense and decreased by actual charge-offs, net of recoveries of amounts previously charged-off. Loans are charged off when management believes that the collection of the principal amount owed in full either through payments from the borrower or from the liquidation of collateral is unlikely.
In the commercial portfolio, which includes time and demand notes, tax-exempt loans, and commercial real estate loans, non-homogeneous loan relationships greater than $250,000 that are considered impaired or designated as a troubled debt restructuring (TDR) are evaluated to determine the need for a specific allowance based on the borrower's overall financial condition, resources and payment record, support from guarantors, and the realizable value of any collateral. Interest income for impaired loans is recorded on a cash basis during the period the loan is considered impaired.
The allowance for non-impaired commercial loans and impaired commercial loan relationships less than $250,000 includes a process of estimating the probable losses inherent in the portfolio by category, based on First Financial's internal system of credit risk ratings and historical loss data. These estimates may also be adjusted for management's estimate of probable losses on specific loan types dependent upon trends in the values of the underlying collateral, delinquent and nonaccrual loans, prevailing economic conditions, changes in lending strategies, and other influencing factors.
Consumer loans are generally evaluated as an asset type within a category (i.e., residential real estate, installment, etc.), as these loans exhibit homogeneous characteristics. The allowance for consumer loans which includes residential real estate, installment, home equity, credit card loans, and overdrafts, is established by estimating losses inherent in each particular category of consumer loans. The estimate of losses is primarily based on historical loss rates for each category, as well as trends in delinquent and nonaccrual loans, prevailing economic conditions, and other significant influencing factors. Consumer loans greater than $100,000 whose terms have been modified in a TDR are individually analyzed for estimated impairment.
Covered loans: Loans acquired in Federal Deposit Insurance Corporation (FDIC)-assisted transactions are initially covered under loss sharing agreements and are referred to as covered loans. Pursuant to the terms of the loss sharing agreements, covered loans are subject to a stated loss threshold, as outlined in each loss sharing agreement, whereby the FDIC will reimburse First Financial for 80% of losses of up to a stated loss threshold, and 95% of losses in excess of the threshold. First Financial will reimburse the FDIC for its share of recoveries with respect to losses for which the FDIC paid First Financial a reimbursement under the loss sharing agreement. The FDIC’s obligation to reimburse First Financial for losses with respect to covered loans began with the first dollar of loss incurred.
Covered loans were recorded at their estimated fair value at the time of acquisition. Estimated fair values for covered loans were based on a discounted cash flow methodology that considered various factors including the type of loan and related collateral, classification status, interest rate, term of loan, whether or not the loan was amortizing, and a discount rate reflecting the Company's assessment of risk inherent in the cash flow estimates. Covered loans were grouped together according to similar characteristics and were treated in the aggregate when applying various valuation techniques.
First Financial evaluates purchased loans for impairment in accordance with the provisions of FASB Accounting Standards Codification (ASC) Topic 310-30, Loans and Debt Securities Acquired with Deteriorated Credit Quality. The cash flows
First Financial Bancorp 2011 Annual Report 55
Notes To Consolidated Financial Statements
expected to be collected on purchased loans are estimated based upon the expected remaining life of the underlying loans, which includes the effects of estimated prepayments. First Financial is accounting for the majority of purchased loans under FASB ASC Topic 310-30 except loans with revolving privileges, which are outside the scope of this guidance, and loans for which cash flows could not be estimated, which are accounted for under the cost recovery method. Interest income, through accretion of the difference between the carrying value of the loans and the expected cash flows is recognized on all purchased loans being accounted for under FASB ASC Topic 310-30.
For purposes of applying the guidance under FASB ASC Topic 310-30, First Financial groups acquired loans into pools based on common risk characteristics. Expected cash flows are re-estimated periodically for all loans accounted for under FASB ASC Topic 310-30. Generally, a decline in expected cash flows for a pool of loans is referred to as impairment and recorded as provision expense on a discounted basis during the period. Improvement in expected cash flows for a pool of loans, once any previously recorded impairment is recaptured, is recognized prospectively as an adjustment to the yield on the loans in the pool. These cash flow evaluations are inherently subjective as they require material estimates, all of which may be susceptible to significant change.
Covered loans outside the scope of FASB ASC Topic 310-30 are accounted for under FASB ASC Topic 310-20, Receivables-Nonrefundable Fees and Costs. Discounts created when the loans were recorded at their estimated fair values at acquisition are amortized over the remaining term of the loan as an adjustment to the related loan's yield. The accrual of interest income is discontinued when the collection of a loan or interest, in whole or in part, is doubtful.
Allowance for loan and lease losses – covered loans. First Financial maintains an allowance for loan and lease losses on covered loans. For loans accounted for under FASB ASC Topic 310-30, expected cash flows are re-estimated periodically with any decline in expected cash flows recorded as provision expense on a discounted basis during the period. These cash flow evaluations are inherently subjective as they require material estimates, all of which may be susceptible to significant change. The related, estimated reimbursement on covered loan losses due from the FDIC under loss sharing agreements is recorded as both FDIC loss sharing income and an increase to the FDIC indemnification asset.
FDIC indemnification asset. FDIC indemnification assets result from the loss share agreements in the FDIC-assisted transactions and are measured separately from the related assets covered by loss sharing agreements with by the FDIC (covered assets) as they are not contractually embedded in those assets and are not transferable should First Financial choose to dispose of the covered assets. The FDIC indemnification assets represent expected reimbursements from the FDIC for losses on covered loans. Pursuant to the terms of the loss sharing agreements, covered loans are subject to stated loss thresholds whereby the FDIC will reimburse First Financial for 80% of losses of up to the stated loss thresholds, and 95% of losses in excess of these amounts. FDIC indemnification assets were recorded at their estimated fair values at the time of the FDIC-assisted transaction. Fair values were estimated using projected cash flows related to the loss sharing agreements based on the expected reimbursements for losses and the applicable loss sharing percentages. These cash flows are discounted to reflect the uncertainty of the timing of the loss sharing reimbursement from the FDIC.
The accounting for FDIC indemnification assets is closely related to the accounting for the underlying, indemnified assets. First Financial re-estimates the expected indemnification asset cash flows in conjunction with the periodic re-estimation of cash flows on covered loans accounted for under FASB ASC Topic 310-30. Improvements in cash flow expectations on covered loans generally result in a related decline in the expected indemnification cash flows and are reflected as a yield adjustment on the indemnification assets. Declines in cash flow expectations on covered loans generally result in an increase in expected indemnification cash flows and are reflected as both FDIC loss sharing income and an increase to the indemnification asset.
Premises and equipment. Premises and equipment are stated at cost, less accumulated depreciation and amortization. Depreciation and amortization are computed principally on the straight-line method over the estimated useful lives of the assets. Useful lives generally range from ten to 40 years for building and building improvements; three to ten years for furniture, fixtures, and equipment; and three to five years for software, hardware, and data handling equipment. Land improvements are depreciated over 20 years and leasehold improvements are depreciated over the lesser of the base term of the respective lease or the asset useful life. Premises and equipment are evaluated for impairment whenever events or changes in circumstances indicate that the carrying amount of an asset may not be recoverable. Maintenance and repairs are charged to operations as incurred.
Goodwill and other intangible assets. Under accounting for business combinations, the net assets of entities acquired by First Financial are recorded at their estimated fair value at the date of acquisition. The excess cost of the acquisition over the fair value of net assets acquired is recorded as goodwill. Goodwill and intangible assets deemed to have indefinite lives, if any, are not amortized, but are subject to annual impairment tests.
56 First Financial Bancorp 2011 Annual Report
Core deposit intangibles. Core deposit intangibles represent the estimated value of acquired relationships with deposit customers. The estimated fair value of core deposit intangibles are based on a discounted cash flow methodology that gives appropriate consideration to expected customer attrition rates, cost of the deposit base, reserve requirements and the net maintenance cost attributable to customer deposits. Core deposit intangibles are amortized on an accelerated basis over their useful lives.
Other real estate owned (OREO). OREO represents properties primarily acquired by First Financial's bank subsidiary through loan defaults by clients. OREO properties are recorded at the lower of cost or fair value, minus estimated costs to sell at the date acquired. Subsequently, the properties are valued at the lower of the amount recorded when the property was placed into OREO or fair value minus estimated costs to sell based on periodic valuations performed by management. Any gains or losses realized at the time of disposal are reflected in the Consolidated Statements of Income.
Other real estate owned – covered (Covered OREO). Covered OREO represents properties primarily acquired by First Financial's bank subsidiary through loan defaults by clients on covered loans. Pursuant to the terms of the loss sharing agreements, covered assets are subject to stated loss thresholds whereby the FDIC will reimburse First Financial for 80% of losses of up to the stated loss thresholds, and 95% of losses in excess of these amounts. Covered OREO properties are recorded at the lower of cost or fair value, minus estimated costs to sell at the date acquired. Subsequently, the properties are valued at the lower of the amount recorded when the properties were placed into other real estate owned or fair value minus estimated costs to sell based on periodic valuations performed by management. Gains or losses realized at the time of disposal are reflected in the Consolidated Statements of Income and, in general, are substantially offset by a related adjustment to the FDIC indemnification asset.
Income taxes. First Financial and its subsidiaries file a consolidated federal income tax return. Each subsidiary provides for income taxes on a separate return basis, and remits to First Financial amounts determined to be currently payable.
Deferred tax assets and liabilities are measured using enacted tax rates expected to apply to taxable income in the years in which those temporary differences are expected to be recovered or settled. The effect on deferred tax assets and liabilities of a change in tax rates is recognized in income in the period that includes the enactment date.
Pension. First Financial sponsors a non-contributory defined benefit pension plan covering substantially all employees. The measurement of the accrued benefit liability and the annual pension expense involves actuarial and economic assumptions. The assumptions used in pension accounting include those related to the discount rates, the expected return on plan assets, and the rate of compensation increase.
Derivative instruments. First Financial accounts for its derivative financial instruments in accordance with FASB ASC Topic 815, Derivatives and Hedging. FASB ASC Topic 815 requires all derivative instruments to be carried at fair value on the balance sheet. First Financial designates derivative instruments used to manage interest-rate risk as hedge relationships with certain assets or liabilities being hedged.
First Financial utilizes derivative instruments, primarily interest rate swaps, designated as fair value hedges to mitigate exposure to changes in the fair value of an asset, liability, or firm commitment attributable to a particular risk, such as interest rate risk. As the critical terms of the hedged financial instruments and the derivative instruments coincide, the changes in the fair value of the hedged financial instruments and the derivative instruments offset and the hedges are considered to be highly effective. For a fair value hedge, the fair value of the interest rate swap is recognized on the Consolidated Balance Sheets as either a freestanding asset or liability with a corresponding adjustment to the hedged financial instrument. Subsequent adjustments due to changes in the fair value of a derivative that qualifies as a fair value hedge are offset in current period earnings. Under the fair value method, any derivative gains or losses not effective in hedging the change in fair value of the hedged item would be recognized in the Consolidated Statements of Income.
First Financial utilizes derivative instruments, primarily interest rate swaps, designated as cash flow hedges to manage the variability of cash flows, primarily net interest income, attributable to changes in interest rates. The net interest receivable or payable on an interest rate swap designated as a cash flow hedge is accrued and recognized as an adjustment to interest income or interest expense. The fair value of the interest rate swaps is included within accrued interest and other assets on the Consolidated Balance Sheets. Changes in the fair value of the interest rate swap are included in accumulated comprehensive income (loss). Derivative gains and losses not considered effective in hedging the cash flows related to the underlying assets or liabilities, if any, would be recognized immediately in income.
Like other financial instruments, derivatives contain an element of credit risk, which is the possibility that First Financial will incur a loss because a counterparty fails to meet its contractual obligations. Generally, the notional values of interest rate swaps
First Financial Bancorp 2011 Annual Report 57
Notes To Consolidated Financial Statements
and other off-balance sheet financial instruments significantly exceed the credit risk associated with these instruments and represent contractual balances on which calculations of amounts to be exchanged are based. First Financial manages this credit risk through counterparty credit policies.
Stock-based compensation. First Financial grants stock-based awards, including restricted stock awards for and options to purchase the Company’s common stock. Stock option grants are for a fixed number of shares to employees and directors with an exercise price equal to the fair value of the shares at the date of grant. Stock-based compensation expense is recognized in the Consolidated Statements of Income on a straight-line basis over the vesting period. The amortization of stock-based compensation expense reflects estimated forfeitures adjusted for actual forfeiture experience. As compensation expense is recognized, a deferred tax asset is recorded that represents an estimate of the future tax deduction from exercise. At the time stock-based awards are exercised, cancelled, or expire, First Financial may be required to recognize an adjustment to tax expense.
Earnings per share. Basic net income per common share is computed by dividing net income applicable to common stock by the weighted average number of shares of common stock outstanding during the period. Diluted net income per common share is computed by dividing net income applicable to common stock by the weighted average number of shares, nonvested stock, and dilutive common stock equivalents outstanding during the period. Common stock equivalents consist of common stock issuable under the assumed exercise of stock options granted under First Financial's stock plans and the assumed conversion of common stock warrants, using the treasury stock method.
Cash and Due from Banks. Cash and due from banks consist of currency, coin, and cash items due from banks. Cash items due from banks include noninterest bearing deposits held at other banks.
Segments and related information. In 2011, management continued to review operating performance and make decisions as one banking segment in contiguous geographic markets.
2. Recently Adopted and Issued Accounting Standards
In April 2011, the FASB issued an update (ASU No. 2011-02, A Creditor’s Determination of Whether a Restructuring is a Troubled Debt Restructuring) clarifying the requirements of FASB ASC Topic 310-40, Troubled Debt Restructurings by Creditors. This update provides additional guidance related to determining whether a creditor has granted a concession, including factors and examples for creditors to consider in evaluating whether a restructuring results in a delay in payment that is insignificant, prohibits creditors from using the borrower’s effective rate test to evaluate whether a concession has been granted to the borrower, and adds factors for creditors to use in determining whether a borrower is experiencing financial difficulties. This update also ends the FASB’s deferral of the additional disclosure requirements around troubled debt restructurings included in ASU No. 2010-20, Disclosure about the Credit Quality of Financing Receivables and the Allowance for Credit Losses. The provisions of ASU No. 2011-02, as well as the additional disclosure requirements around troubled debt restructurings, became effective for First Financial for the interim reporting period ended September 30, 2011. For further detail on troubled debt restructurings, see Note 10 – Loans (Excluding Covered Loans).
In April 2011, the FASB issued an update (ASU No. 2011-03, Reconsideration of Effective Control for Repurchase Agreements), which simplified the accounting for arrangements such as repurchase and securities lending agreements. The collateral maintenance requirement will be eliminated from the assessment of effective control, which could result in more transactions being accounted for as secured borrowings rather than sales. The assessment of effective control will focus on a transferor's contractual rights and obligations, not the amount of collateral obtained to repurchase or redeem the transferred financial asset. Under the amended guidance, a transferor maintains effective control over transferred financial assets, and thus accounts for the transfer as a secured borrowing, if there is an agreement that both entitles and obligates the transferor to repurchase the financial assets before maturity and all of the conditions already described in FASB ASC Topic 860, Transfers and Servicing, are met. This revised guidance is applicable to new transactions and transactions that are modified on or after the first interim or annual period beginning after December 15, 2011. First Financial does not anticipate this update will have a material impact on its consolidated financial statements.
In May 2011, the FASB issued an update (ASU No. 2011-04, Fair Value Measurement (Topic 820): Amendments to Achieve Common Fair Value Measurement and Disclosure Requirements in U.S. GAAP and IFRSs), which expands the disclosure requirements around fair value measurements categorized in Level 3 of the fair value hierarchy and requires disclosure of the level in the fair value hierarchy of items that are not measured at fair value but whose fair value must be disclosed. It also clarifies and expands upon existing requirements for fair value measurements of financial assets and liabilities as well as
58 First Financial Bancorp 2011 Annual Report
instruments classified in shareholders' equity. The guidance is effective for interim and annual financial periods beginning after December 15, 2011. First Financial does not anticipate this update will have a material impact on its consolidated financial statements.
In June 2011, the FASB issued an update (ASU 2011-05, Presentation of Comprehensive Income), which revises the manner in which entities present comprehensive income in their financial statements. This update eliminates the option to present components of other comprehensive income (OCI) as part of the statement of changes in stockholders' equity. The amendments to the existing standard require that all non-owner changes in stockholders' equity be presented either in a single continuous statement of comprehensive income or in two separate but consecutive statements. Under either method, adjustments must be displayed for items that are reclassified from OCI to net income, in both net income and OCI. The amendments to the existing standard do not change the current option for presenting components of OCI gross or net of the effect of income taxes, provided that such tax effects are presented in the statement in which OCI is presented or disclosed in the notes to the financial statements. Additionally, the standard does not affect the calculation or reporting of earnings per share. This guidance is effective for interim and annual financial periods beginning after December 15, 2011 and is to be applied retrospectively, with early adoption permitted. First Financial does not anticipate this update will have a material impact on its consolidated financial statements.
In September 2011, the FASB issued an update (ASU 2011-08, Testing Goodwill for Impairment), to simplify the current two-step goodwill impairment test in FASB ASC Topic 350-20, Intangibles - Goodwill and Other: Goodwill. This update permits entities to first perform a qualitative assessment to determine whether it is more likely than not (a likelihood of more than 50 percent) that the fair value of a reporting unit is less than its carrying amount. If the entity determines that it is more likely than not that the fair value of a reporting unit is less than its carrying amount, it would then perform the first step of the goodwill impairment test; otherwise, no further impairment test would be required. This guidance is effective for interim and annual goodwill impairment tests performed for fiscal years beginning after December 15, 2011, with early adoption permitted. First Financial does not anticipate this update will have a material impact on its consolidated financial statements.
In December 2011, the FASB issued an update (ASU 2011-11, Disclosures About Offsetting Assets and Liabilities), which creates new disclosure requirements about the nature of an entity's rights of offset and related arrangements associated with its financial instruments and derivative instruments. New disclosure requirements will be required for recognized financial and derivative instruments that are offset in accordance with the guidance in FASB ASC Topic 210-20-45, Balance Sheet - Offsetting - Other Presentation Matters, FASB ASC Topic 815-10-45, Derivatives and Hedging - Other Presentation Matters, or are subject to an enforceable master netting arrangement or similar agreement. Recognized assets and liabilities within the scope of this update include financial instruments such as derivatives, repurchase agreements, reverse repurchase agreements and securities lending and borrowing arrangements subject to master netting arrangements. An entity will be required to disclose information to enable users of its financial statements to evaluate the effect or potential effect of netting arrangements on its financial position, including the effect or potential effect of rights of set-off associated with certain financial instruments and derivative instruments. This guidance is effective for fiscal years beginning on or after January 1, 2013, and interim periods within those annual periods. The guidance must be applied retrospectively for any period presented that begins before an entity's date of initial application. First Financial does not anticipate this update will have a material impact on its consolidated financial statements.
In December 2011, the FASB issued an update (ASU 2011-12, Deferral of the Effective Date for Amendments to the Presentation of Reclassifications of Items Out of Accumulated Other Comprehensive Income in ASU 2011-05), which deferred the requirement that companies present reclassification adjustments for each component of accumulated other comprehensive income in both net income and other comprehensive income on the face of the financial statements. The deferral will not affect the requirement that companies present items of net income, other comprehensive income and total comprehensive income in either one continuous statement or two consecutive statements. This guidance is effective for interim and annual financial periods beginning after December 15, 2011, with early adoption permitted. First Financial does not anticipate this update will have a material impact on its consolidated financial statements.
3. Business Combinations
On September 23, 2011, First Financial Bank completed the purchase of 16 Ohio banking centers from Liberty Savings Bank, FSB (Liberty) including $126.5 million of performing loans and $341.9 million of deposits at their estimated fair values. First Financial also acquired $3.8 million of fixed assets at estimated fair value and paid Liberty a $22.4 million net deposit premium. Assets acquired in this transaction are not subject to a loss share agreement. First Financial recorded $17.1 million of goodwill related to this acquisition.
First Financial Bancorp 2011 Annual Report 59
Notes To Consolidated Financial Statements
Loans acquired in conjunction with the Liberty banking center acquisition were evaluated for impairment in accordance with FASB ASC Topic 310-30, Loans and Debt Securities Acquired with Deteriorated Credit Quality. First Financial determined that the acquired loans were not impaired and is accounting for them under FASB ASC Topic 310-20, Receivables-Nonrefundable Fees and Costs.
On December 2, 2011, First Financial Bank completed the purchase of 22 Indiana-based retail banking centers from Flagstar Bank, FSB (Flagstar) and assumed approximately $464.7 million of deposits at their estimated fair value. First Financial also acquired $6.6 million of fixed assets at estimated fair value and paid Flagstar a $22.5 million net deposit premium. Assets acquired in this transaction are not subject to a loss share agreement. First Financial recorded $26.1 million of goodwill related to this acquisition.
The Liberty and Flagstar banking center acquisitions were accounted for in accordance with FASB ASC Topic 805, Business Combinations. Fair values are subject to refinement for up to one year after the closing date of the acquisition (the measurement period) as information relative to closing date fair values becomes available.
On July 31, 2009, First Financial Bank, N.A. (First Financial Bank), a wholly owned subsidiary of First Financial Bancorp, entered into a purchase and assumption agreement (Peoples Agreement) with the FDIC, as receiver, pursuant to which First Financial acquired certain assets and assumed substantially all of the deposits and certain liabilities of Peoples Community Bank (Peoples).
On September 18, 2009, First Financial Bank entered into separate purchase and assumption agreements (Irwin Agreements) with the FDIC, as receiver, pursuant to which First Financial acquired certain assets and assumed substantially all of the deposits and certain liabilities of Irwin Union Bank and Trust Company (Irwin Union Bank) and Irwin Union Bank, F.S.B. (Irwin FSB). Irwin Union Bank and Irwin FSB are collectively referred to herein as Irwin.
In connection with both the Peoples and Irwin acquisitions, First Financial Bank entered into loss sharing agreements with the FDIC that covers single family residential mortgage loans, commercial real estate and commercial and industrial loans, and OREO acquired through foreclosure, all of which are referred to collectively as covered assets.
4. Goodwill and Other Intangible Assets
Goodwill. Assets and liabilities of acquired entities are recorded at their estimated fair values as of the acquisition date and are subject to refinement for up to one year as additional information relative to initial estimated fair value data becomes available. The excess cost of the acquisition over the fair value of net assets acquired is recorded as goodwill. First Financial recorded additions to goodwill in 2011 related to the Liberty and Flagstar banking center acquisitions. First Financial expects all of the goodwill resulting from these acquisitions to be deductible for tax purposes.
Changes in the carrying amount of goodwill for the year ended December 31, 2011 are shown below.
|
| | | | |
| (Dollars in thousands) | | |
| Balance at December 31, 2010 | | $ | 51,820 |
|
| Goodwill acquired: | | |
| Liberty banking center acquisition | | 17,102 |
|
| Flagstar banking center acquisition | | 26,128 |
|
| Balance at December 31, 2011 | | $ | 95,050 |
|
Goodwill is not amortized, but is measured for impairment on an annual basis as of October 1 of each year or whenever events or changes in circumstances indicate that the fair value of a reporting unit may be below its carrying value. First Financial performed its annual impairment test as of October 1, 2011, and no impairment was indicated.
Other intangible assets. Other intangible assets primarily consist of core deposit intangibles.
Core deposit intangibles are recorded at their estimated fair value as of acquisition and are then amortized on an accelerated basis over their estimated useful lives. First Financial recorded $4.0 million of core deposit intangibles associated with the Liberty banking center acquisition and $3.0 million of core deposit intangibles associated with the Flagstar banking center
60 First Financial Bancorp 2011 Annual Report
acquisition during 2011, contributing to a total of $9.9 million of core deposit intangibles as of December 31, 2011. As of December 31, 2010, core deposit intangibles were $4.1 million. First Financial's core deposit intangibles have an estimated weighted average remaining life of 8.9 years as of December 31, 2011. Amortization expense recognized on intangible assets for 2011, 2010, and 2009 was $1.2 million, $1.3 million, and $0.3 million, respectively.
5. Restrictions On Cash And Due From Bank Accounts
First Financial's bank subsidiary is required to maintain average reserve balances either in the form of vault cash or reserves held on deposit with the Federal Reserve Bank, Federal Home Loan Bank, or in pass-through reserve accounts with correspondent banks. The average amounts of these required reserve balances, based upon the average level of First Financial's transaction accounts, for 2011 and 2010 were approximately $33.3 million and $30.6 million, respectively.
6. Restrictions on subsidiary dividends, loans, or advances
Dividends paid by First Financial to its shareholders are principally funded through dividends paid to First Financial by its subsidiaries. However, certain restrictions exist regarding the ability of bank subsidiaries to transfer funds to First Financial in the form of cash dividends, loans, or advances. The approval of the subsidiaries' respective primary federal regulators is required for First Financial's subsidiaries to pay dividends in excess of regulatory limitations, which is equal to the net income of the current year through the dividend date, combined with its retained net income of the preceding two years. As of December 31, 2011, First Financial's subsidiaries had retained earnings of $350.4 million of which $214.9 million was available for distribution to First Financial without prior regulatory approval.
7. Commitments And Contingencies
In the normal course of business, First Financial offers a variety of financial instruments with off-balance-sheet risk to its clients to aid them in meeting their requirements for liquidity and credit enhancement. These financial instruments include standby letters of credit and outstanding commitments to extend credit. GAAP does not require these financial instruments to be recorded in the Consolidated Balance Sheets, Consolidated Statements of Income, Consolidated Statements of Changes in Shareholders’ Equity, and Consolidated Statements of Cash Flows.
First Financial’s exposure to credit loss, in the event of nonperformance by the other party to the financial instrument for standby letters of credit, and outstanding commitments to extend credit, is represented by the contractual amounts of those instruments. First Financial uses the same credit policies in making commitments and conditional obligations as it does for on-balance-sheet instruments.
Letters of credit. These transactions are conditional commitments issued by First Financial to guarantee the performance of a client to a third party. First Financial’s portfolio of standby letters of credit consists primarily of performance assurances made on behalf of clients who have a contractual commitment to produce or deliver goods or services. The risk to First Financial arises from its obligation to make payment in the event of the clients’ contractual default to produce the contracted good or service to a third party. First Financial has issued letters of credit (including standby letters of credit) aggregating $20.0 million and $17.6 million at December 31, 2011, and December 31, 2010, respectively. Management conducts regular reviews of these instruments on an individual client basis.
Loan commitments. Commitments to extend credit are agreements to lend to a client as long as there is no violation of any condition established in the commitment. Commitments generally have fixed expiration dates or other termination clauses and may require payment of a fee. Since many of the commitments are expected to expire without being drawn upon, the total commitment amounts do not necessarily represent future cash requirements. First Financial evaluates each client’s creditworthiness on an individual basis. The amount of collateral obtained, if deemed necessary by First Financial upon extension of credit, is based on management’s credit evaluation of the client. The collateral held varies, but may include securities, real estate, inventory, plant, or equipment. First Financial had commitments outstanding to extend credit totaling $1.2 billion at December 31, 2011, and $1.0 billion at December 31, 2010.
First Financial utilizes the allowance for loan and lease losses methodology to maintain a reserve that it considers sufficient to absorb probable losses inherent in standby letters of credit and outstanding loan commitments. For further detail on the allowance for loan and lease losses methodology, see Note 1 – Summary of Significant Accounting Policies.
First Financial Bancorp 2011 Annual Report 61
Notes To Consolidated Financial Statements
Contingencies/Litigation – First Financial and its subsidiaries are from time to time engaged in various matters of litigation, other assertions of improper or fraudulent loan practices or lending violations, and other matters, and have a number of unresolved claims pending. In addition, as part of the ordinary course of business, First Financial and its subsidiaries are parties to litigation involving claims to the ownership of funds in particular accounts, the collection of delinquent accounts, challenges to security interests in collateral, and foreclosure interests, that is incidental to our regular business activities. While the ultimate liability with respect to these other litigation matters and claims cannot be determined at this time, First Financial believes that damages, if any, and other amounts relating to pending matters are not likely to be material to its consolidated financial position or results of operations. Reserves are established for these various matters of litigation, when appropriate under FASB ASC Topic 450, Contingencies, based in part upon the advice of legal counsel.
8. Derivatives
The use of derivative instruments allows First Financial to meet the needs of its clients while managing the interest-rate risk associated with certain transactions. First Financial’s board of directors has authorized the use of certain derivative products, including interest rate caps, floors, and swaps. First Financial does not use derivatives for speculative purposes and currently does not have any derivatives that are not designated as hedges.
The following table summarizes the derivative financial instruments utilized by First Financial by the nature of the underlying asset or liability:
|
| | | | | | | | |
| | Fair Value Hedges |
| (Dollars in thousands) | | December 31, |
| | | 2011 | | 2010 |
| Instruments associated with loans: | | | | |
| Total notional value | | $ | 775,328 |
| | $ | 578,959 |
|
While authorized to use a variety of derivative products, First Financial primarily utilizes interest rate swaps as a means to offer borrowers credit-based products that meet their needs and may from time to time utilize interest rate swaps to manage the macro interest rate risk profile of the Company. These agreements establish the basis on which interest rate payments are exchanged with counterparties and are referred to as the notional amount. As only interest rate payments are exchanged, cash requirements and credit risk are significantly less than the notional amount and the Company’s credit risk exposure is limited to the market value of the instrument.
First Financial manages this market value credit risk through counterparty credit policies. These policies require the Company to maintain a total derivative notional position of less than 35% of assets, total credit exposure of less than 3% of capital, and no single counterparty credit risk exposure greater than $20.0 million. The Company is currently well below all single counterparty and portfolio limits. At December 31, 2011, the Company had a total counterparty notional amount outstanding of approximately $396.4 million, spread among seven counterparties, with an outstanding liability from these contracts of $27.3 million. At December 31, 2010, First Financial had a total counterparty notional amount outstanding of $300.1 million, spread among six counterparties, with an outstanding liability from these contracts of $17.0 million.
In connection with its use of derivative instruments, First Financial is required from time to time to post cash collateral with its counterparties to offset its market position. Derivative collateral balances were $24.4 million, and $12.5 million at December 31, 2011, and December 31, 2010, respectively. First Financial classifies the derivative cash collateral outstanding with its counterparties as an adjustment to the fair value of the derivative contracts within accrued interest and other liabilities in the Consolidated Balance Sheets.
62 First Financial Bancorp 2011 Annual Report
The following table summarizes the derivative financial instruments utilized by First Financial and their balances:
|
| | | | | | | | | | | | | | | | | | | | | | | | | | |
| | | | December 31, 2011 | | December 31, 2010 |
| | | | | | | Estimated Fair Value | | | | Estimated Fair Value |
| (Dollars in thousands) | | Balance Sheet Location | | Notional Amount | | Gain | | Loss | | Notional Amount | | Gain | | Loss |
| Fair Value Hedges | | | | | | | | | | | | | | |
| Pay fixed interest rate swaps with counterparty | | Accrued interest and other liabilities | | $ | 17,456 |
| | $ | 0 |
| | $ | (2,263 | ) | | $ | 21,301 |
| | $ | 0 |
| | $ | (2,302 | ) |
| Matched interest rate swaps with borrower | | Accrued interest and other assets | | 378,936 |
| | 24,566 |
| | 0 |
| | 278,829 |
| | 14,843 |
| | (131 | ) |
| Matched interest rate swaps with counterparty | | Accrued interest and other liabilities | | 378,936 |
| | 0 |
| | (25,860 | ) | | 278,829 |
| | 131 |
| | (15,502 | ) |
| Total | | | | $ | 775,328 |
| | $ | 24,566 |
| | $ | (28,123 | ) | | $ | 578,959 |
| | $ | 14,974 |
| | $ | (17,935 | ) |
The following table details the derivative financial instruments, the average remaining maturities and the weighted-average interest rates being paid and received by First Financial at December 31, 2011:
|
| | | | | | | | | | | | | | | | |
| | | | | | | | | Weighted-Average Rate |
| (Dollars in thousands) | | Notional Value | | Average Maturity (years) | | Fair Value | | Receive | | Pay |
| Asset conversion swaps | | | | | | | | | | |
| Pay fixed interest rate swaps with counterparty | | $ | 17,456 |
| | 4.3 | | $ | (2,263 | ) | | 2.22 | % | | 6.73 | % |
| Receive fixed, matched interest rate swaps with borrower | | 378,936 |
| | 4.5 | | 24,566 |
| | 5.64 | % | | 3.05 | % |
| Pay fixed, matched interest rate swaps with counterparty | | 378,936 |
| | 4.5 | | (25,860 | ) | | 3.05 | % | | 5.64 | % |
| Total swap portfolio | | $ | 775,328 |
| | 4.5 | | $ | (3,557 | ) | | 4.30 | % | | 4.40 | % |
The accounting for changes in the fair value of derivatives depends on the intended use of the derivative and the resulting designation. Derivatives used to hedge the exposure to changes in the fair value of an asset, liability, or firm commitment attributable to a particular risk, such as interest rate risk, are considered fair value hedges. Derivatives used to hedge the exposure to variability in expected future cash flows, or other types of forecasted transactions, are considered cash flow hedges.
Fair Value Hedges. First Financial utilizes interest rate swaps as a means to offer commercial borrowers products that meet their needs, but are also designed to achieve First Financial’s desired interest rate risk profile at the time. The fair value hedge agreements generally involve the net receipt by First Financial of floating-rate amounts in exchange for net payments by First Financial, through its loan clients, of fixed-rate amounts over the life of the agreements without an exchange of the underlying principal or notional amount. This results in First Financial’s loan customers receiving fixed rate funding, while providing First Financial with a floating rate asset. The net interest receivable or payable on the interest rate swaps is accrued and recognized as an adjustment to the interest income or interest expense of the hedged item. The fair value of the interest rate swaps is included within accrued interest and other assets on the Consolidated Balance Sheets. The corresponding fair-value adjustment is also included on the Consolidated Balance Sheets in the carrying value of the hedged item. Derivative gains and losses not considered effective in hedging the change in fair value of the hedged item are recognized immediately in income.
First Financial Bancorp 2011 Annual Report 63
Notes To Consolidated Financial Statements
The following table details the location and amounts recognized for fair value hedges:
|
| | | | | | | | | | |
| | | | Decrease to Interest Income |
| (Dollars in thousands) | | | | Years Ended |
| Derivatives in fair value hedging relationships | | Location of change in fair value derivative | | December 31, |
| | | | | 2011 | | 2010 |
| Interest Rate Contracts | | | | | | |
| Loans | | Interest Income - Loans | | $ | (891 | ) | | $ | (1,004 | ) |
| Total | | | | $ | (891 | ) | | $ | (1,004 | ) |
Cash Flow Hedges. First Financial may utilize interest rate swaps designated as cash flow hedges to manage the variability of cash flows, primarily net interest income, attributable to changes in interest rates. The net interest receivable or payable on an interest rate swap designated as a cash flow hedge is accrued and recognized as an adjustment to interest income or interest expense. The fair value of the interest rate swaps is included within accrued interest and other assets on the Consolidated Balance Sheets. Changes in the fair value of the interest rate swaps are included in accumulated comprehensive income (loss). Derivative gains and losses not considered effective in hedging the cash flows related to the underlying loans, if any, would be recognized immediately in income.
Effective March 30, 2009, First Financial executed a cash flow hedge utilizing an interest rate swap to hedge against interest rate volatility on $20.0 million of floating rate trust preferred securities based on the London Inter-Bank Offered Rate (LIBOR). The interest rate swap involved the receipt by First Financial of variable-rate interest amounts in exchange for fixed-rate interest payments by First Financial for a period of 10 years. This interest rate swap effectively fixed the rate of interest on the floating rate trust preferred securities at 6.20% for the 10 year life of the swap.
First Financial terminated the $20.0 million trust preferred interest rate swap during the fourth quarter of 2010 in the course of its normal interest rate risk and balance sheet management activities. Terminating the trust preferred interest rate swap resulted in a $0.6 million pre-tax loss that was included in accumulated comprehensive income (loss) on the Consolidated Balance Sheets. Due to the early redemption of the trust preferred securities, the remaining balance of the unrecognized loss of $0.6 million was recognized in noninterest expense in the second quarter of 2011. First Financial had no derivative instruments designated as cash flow hedges at December 31, 2011.
9. Investment Securities
The following is a summary of held-to-maturity and available-for-sale investment securities as of December 31, 2011.
|
| | | | | | | | | | | | | | | | | | | | | | | | | | | | | | | | |
| | Held-to-Maturity | | Available-for-Sale |
| (Dollars in thousands) | | Amortized Cost | | Unrealized Gains | | Unrealized Losses | | Market Value | | Amortized Cost | | Unrealized Gains | | Unrealized Losses | | Market Value |
| Securities of U.S. government agencies and corporations | | $ | 0 |
| | $ | 0 |
| | $ | 0 |
| | $ | 0 |
| | $ | 45,757 |
| | $ | 433 |
| | $ | 0 |
| | $ | 46,190 |
|
| Mortgage-backed securities | | 90 |
| | 2 |
| | 0 |
| | 92 |
| | 1,344,015 |
| | 21,394 |
| | (2,031 | ) | | 1,363,378 |
|
| Obligations of state and other political subdivisions | | 2,574 |
| | 227 |
| | 0 |
| | 2,801 |
| | 9,270 |
| | 121 |
| | (5 | ) | | 9,386 |
|
| Other securities | | 0 |
| | 0 |
| | 0 |
| | 0 |
| | 22,448 |
| | 530 |
| | (86 | ) | | 22,892 |
|
| Total | | $ | 2,664 |
| | $ | 229 |
| | $ | 0 |
| | $ | 2,893 |
| | $ | 1,421,490 |
| | $ | 22,478 |
| | $ | (2,122 | ) | | $ | 1,441,846 |
|
64 First Financial Bancorp 2011 Annual Report
The following is a summary of held-to-maturity and available-for-sale investment securities as of December 31, 2010.
|
| | | | | | | | | | | | | | | | | | | | | | | | | | | | | | | | |
| | Held-to-Maturity | | Available-for-Sale |
| | | Amortized | | Unrealized | | Unrealized | | Market | | Amortized | | Unrealized | | Unrealized | | Market |
| (Dollars in thousands) | | Cost | | Gains | | Losses | | Value | | Cost | | Gains | | Losses | | Value |
| U.S. Treasuries | | $ | 13,959 |
| | $ | 390 |
| | $ | (18 | ) | | $ | 14,331 |
| | $ | 0 |
| | $ | 0 |
| | $ | 0 |
| | $ | 0 |
|
| Securities of U.S. government agencies and corporations | | 0 |
| | 0 |
| | 0 |
| | 0 |
| | 105,028 |
| | 957 |
| | 0 |
| | 105,985 |
|
| Mortgage-backed securities | | 118 |
| | 4 |
| | 0 |
| | 122 |
| | 775,867 |
| | 15,513 |
| | (2,630 | ) | | 788,750 |
|
| Obligations of state and other political subdivisions | | 3,329 |
| | 284 |
| | 0 |
| | 3,613 |
| | 13,708 |
| | 207 |
| | (91 | ) | | 13,824 |
|
| Other securities | | 0 |
| | 0 |
| | 0 |
| | 0 |
| | 9,943 |
| | 614 |
| | (6 | ) | | 10,551 |
|
| Total | | $ | 17,406 |
| | $ | 678 |
| | $ | (18 | ) | | $ | 18,066 |
| | $ | 904,546 |
| | $ | 17,291 |
| | $ | (2,727 | ) | | $ | 919,110 |
|
During the year ended December 31, 2011, First Financial sold available-for-sale securities with a fair value of $162.6 million at the date of sale and recorded a $2.5 million pre-tax gain. The investment gain after taxes was $1.6 million for the year ended December 31, 2011.
During the year ended December 31, 2010, no available-for-sale securities were sold.
During the year ended December 31, 2009, First Financial sold available-for-sale securities with a fair value of $152.8 million at the date of sale and recorded a $3.3 million net pre-tax gain. There was a net investment gain after taxes of $2.1 million for the year ended December 31, 2009.
The carrying value of investment securities pledged as collateral to secure public deposits, repurchase agreements, and for other purposes as required by law totaled $757.4 million at December 31, 2011, and $671.2 million at December 31, 2010.
The amortized cost and market value of investment securities, including mortgage-backed securities at December 31, 2011, by estimated lives, are shown in the table that follows. The estimated lives on mortgage-backed securities may differ from contractual maturities as issuers may have the right to call or prepay obligations with or without call or prepayment penalties.
The following is a summary of investment securities by estimated maturity as of December 31, 2011.
|
| | | | | | | | | | | | | | | |
| | Held-to-Maturity | | Available-for-Sale |
| (Dollars in thousands) | Amortized Cost | | Market Value | | Amortized Cost | | Market Value |
| Due in one year or less | $ | 294 |
| | $ | 296 |
| | $ | 38,331 |
| | $ | 38,619 |
|
| Due after one year through five years | 1,329 |
| | 1,392 |
| | 836,507 |
| | 853,883 |
|
| Due after five years through ten years | 197 |
| | 230 |
| | 170,743 |
| | 172,523 |
|
| Due after ten years | 844 |
| | 975 |
| | 375,909 |
| | 376,821 |
|
| Total | $ | 2,664 |
| | $ | 2,893 |
| | $ | 1,421,490 |
| | $ | 1,441,846 |
|
The following tables present the age of gross unrealized losses and associated fair value by investment category.
|
| | | | | | | | | | | | | | | | | | | | | | | | |
| | | December 31, 2011 |
| | | Less than 12 Months | | 12 Months or More | | Total |
| (Dollars in thousands) | | Fair Value | | Unrealized Loss | | Fair Value | | Unrealized Loss | | Fair Value | | Unrealized Loss |
| Mortgage-backed securities | | $ | 343,883 |
| | $ | 1,938 |
| | $ | 29,562 |
| | $ | 93 |
| | $ | 373,445 |
| | $ | 2,031 |
|
| Obligations of state and other political subdivisions | | 0 |
| | 0 |
| | 2,278 |
| | 5 |
| | 2,278 |
| | 5 |
|
| Other securities | | 9,133 |
| | 86 |
| | 17 |
| | 0 |
| | 9,150 |
| | 86 |
|
| Total | | $ | 353,016 |
| | $ | 2,024 |
| | $ | 31,857 |
| | $ | 98 |
| | $ | 384,873 |
| | $ | 2,122 |
|
First Financial Bancorp 2011 Annual Report 65
Notes To Consolidated Financial Statements
|
| | | | | | | | | | | | | | | | | | | | | | | | |
| | | December 31, 2010 |
| | | Less than 12 Months | | 12 Months or More | | Total |
| | | Fair | | Unrealized | | Fair | | Unrealized | | Fair | | Unrealized |
| (Dollars in thousands) | | Value | | Loss | | Value | | Loss | | Value | | Loss |
| U.S. Treasuries | | $ | 2,334 |
| | $ | 18 |
| | $ | 0 |
| | $ | 0 |
| | $ | 2,334 |
| | $ | 18 |
|
| Mortgage-backed securities | | 280,445 |
| | 2,538 |
| | 1,336 |
| | 92 |
| | 281,781 |
| | 2,630 |
|
| Obligations of state and other political subdivisions | | 0 |
| | 0 |
| | 2,194 |
| | 91 |
| | 2,194 |
| | 91 |
|
| Other securities | | 2,217 |
| | 6 |
| | 17 |
| | 0 |
| | 2,234 |
| | 6 |
|
| Total | | $ | 284,996 |
| | $ | 2,562 |
| | $ | 3,547 |
| | $ | 183 |
| | $ | 288,543 |
| | $ | 2,745 |
|
Unrealized losses on debt securities are generally due to higher current market yields relative to the yields of the debt securities at their amortized cost. All securities with unrealized losses are reviewed quarterly to determine if any impairment is considered other than temporary, requiring a write-down to fair market value. First Financial considers the percentage loss on a security, duration of the loss, average life or duration of the security, credit rating of the security, payment performance, and the Company’s intent and ability to hold the security when determining whether any impairment is other than temporary. At this time First Financial does not intend to sell, and it is not more likely than not that the Company will be required to sell debt security issues temporarily impaired prior to maturity or recovery of book value. First Financial had no other than temporary impairment charges for the years ended December 31, 2011 and 2010.
For further detail on the fair value of investment securities, see Note 22 – Fair Value Disclosures.
10. Loans (Excluding Covered Loans)
Commercial loans are made to all types of businesses for a variety of purposes. First Financial works with businesses to meet their shorter term working capital needs while also providing long-term financing for their business plans. Credit risk is managed through standardized loan policies, established and authorized credit limits, centralized portfolio management and the diversification of market area and industries. The overall strength of the borrower is evaluated through the credit underwriting process and includes a variety of analytical activities including the review of historical and projected cash flows, historical financial performance, financial strength of the principals and guarantors, and collateral values, where applicable. Additionally, First Financial offers lease and equipment financing to small and mid-size companies in various industries with significant diversity in the types of underlying equipment.
First Financial's commercial lending activities also include equipment and leasehold improvement financing for franchisees, principally quick service and casual dining restaurants. The underwriting of these loans incorporates basic credit proficiencies combined with knowledge of select franchise concepts to measure the creditworthiness of proposed multi-unit borrowers. The focus is on a limited number of concepts that have sound economics, low closure rates, and brand awareness within specified local, regional, or national markets. Loan terms for equipment are generally up to 84 months fully amortizing and up to 180 months on real estate.
Commercial real estate loans are secured by a mortgage lien on the real property. The credit underwriting for both owner-occupied and investor income producing real estate loans includes detailed market analysis, historical and projected cash flow analysis, appropriate equity margins, assessment of lessees and lessors, type of real estate and other analysis. Risk of loss is managed by adherence to standard loan policies that establish certain levels of performance prior to the extension of a loan to the borrower. Market diversification within First Financial’s service area, as well as a diversification by industry, are other means by which the risk of loss is managed by First Financial.
The majority of residential real estate loans originated by the Bank conform to secondary market underwriting standards and are sold within a short timeframe to unaffiliated third parties, including the future servicing rights to the loans. The credit underwriting standards for these loans require a certain level of documentation, verifications, valuation, and overall credit performance of the borrower.
Consumer loans are primarily loans made to individuals. Types of consumer loans include new and used vehicle loans, second mortgages on residential real estate, and unsecured loans. Risk elements in the consumer loan portfolio are primarily focused on the borrower’s cash flow and credit history, key indicators of the borrower's ability to repay. A certain level of security is
66 First Financial Bancorp 2011 Annual Report
provided through liens on automobile titles and second mortgage liens, where applicable. Home equity lines of credit consist mainly of revolving lines of credit secured by residential real estate. Home equity lines of credit are generally governed by the same lending policies and subject to the same credit risk as described previously for residential real estate loans. Economic conditions that affect consumers in First Financial’s markets have a direct impact on the credit quality of these loans. Higher levels of unemployment, lower levels of income growth and weaker economic growth are factors that may adversely impact consumer loan credit quality.
Delinquency. Loans are considered past due or delinquent when the contractual principal or interest due in accordance with the terms of the loan agreement or any portion thereof remains unpaid after the due date of the scheduled payment.
Loan delinquency, including nonaccrual loans, was as follows:
|
| | | | | | | | | | | | | | | | | | | | | | | | | | | | |
| | | As of December 31, 2011 |
| (Dollars in thousands) | | 30 – 59 Days past due | | 60 – 89 Days past due | | > 90 days past due | | Total past due | | Current | | Total | | > 90 days past due and still accruing |
| Loans | | | | | | | | | | | | | | |
| Commercial | | $ | 2,964 |
| | $ | 96 |
| | $ | 7,473 |
| | $ | 10,533 |
| | $ | 846,448 |
| | $ | 856,981 |
| | $ | 0 |
|
| Real estate - construction | | 47 |
| | 0 |
| | 17,004 |
| | 17,051 |
| | 97,923 |
| | 114,974 |
| | 0 |
|
| Real estate - commercial | | 4,940 |
| | 2,102 |
| | 16,654 |
| | 23,696 |
| | 1,209,371 |
| | 1,233,067 |
| | 0 |
|
| Real estate - residential | | 8,602 |
| | 236 |
| | 7,012 |
| | 15,850 |
| | 272,130 |
| | 287,980 |
| | 0 |
|
| Installment | | 437 |
| | 53 |
| | 355 |
| | 845 |
| | 66,698 |
| | 67,543 |
| | 0 |
|
| Home equity | | 1,304 |
| | 246 |
| | 1,637 |
| | 3,187 |
| | 355,773 |
| | 358,960 |
| | 0 |
|
| Other | | 495 |
| | 231 |
| | 191 |
| | 917 |
| | 48,025 |
| | 48,942 |
| | 191 |
|
| Total | | $ | 18,789 |
| | $ | 2,964 |
| | $ | 50,326 |
| | $ | 72,079 |
| | $ | 2,896,368 |
| | $ | 2,968,447 |
| | $ | 191 |
|
|
| | | | | | | | | | | | | | | | | | | | | | | | | | | | |
| | | As of December 31, 2010 |
| (Dollars in thousands) | | 30 - 59 days past due | | 60 - 89 days past due | | > 90 days past due | | Total past due | | Current | | Total | | > 90 days past due and still accruing |
| Loans | | | | | | | | | | | | | | |
| Commercial | | $ | 2,241 |
| | $ | 1,573 |
| | $ | 11,684 |
| | $ | 15,498 |
| | $ | 784,755 |
| | $ | 800,253 |
| | $ | 0 |
|
| Real estate - construction | | 1,754 |
| | 3,782 |
| | 8,973 |
| | 14,509 |
| | 149,034 |
| | 163,543 |
| | 0 |
|
| Real estate - commercial | | 3,202 |
| | 3,979 |
| | 16,435 |
| | 23,616 |
| | 1,116,315 |
| | 1,139,931 |
| | 0 |
|
| Real estate - residential | | 7,671 |
| | 1,930 |
| | 5,127 |
| | 14,728 |
| | 254,445 |
| | 269,173 |
| | 0 |
|
| Installment | | 456 |
| | 48 |
| | 120 |
| | 624 |
| | 69,087 |
| | 69,711 |
| | 0 |
|
| Home equity | | 1,260 |
| | 392 |
| | 2,166 |
| | 3,818 |
| | 337,492 |
| | 341,310 |
| | 0 |
|
| Other | | 366 |
| | 176 |
| | 370 |
| | 912 |
| | 31,260 |
| | 32,172 |
| | 370 |
|
| Total | | $ | 16,950 |
| | $ | 11,880 |
| | $ | 44,875 |
| | $ | 73,705 |
| | $ | 2,742,388 |
| | $ | 2,816,093 |
| | $ | 370 |
|
Nonaccrual. Loans are classified as nonaccrual when, in the opinion of management, collection of principal or interest is doubtful or when principal or interest payments are 90 days or more past due. Generally, loans are placed on nonaccrual status due to the continued failure to adhere to contractual payment terms by the borrower coupled with other pertinent factors, such as, insufficient collateral value. The accrual of interest income is discontinued and previously accrued, but unpaid interest is reversed when a loan is placed in nonaccrual status. Any payments received while a loan is on nonaccrual status are applied as a reduction to the carrying value of the loan. A loan may be placed back on accrual status if all contractual payments have been received and collection of future principal and interest payments is no longer doubtful.
Troubled Debt Restructurings. A loan modification is considered a TDR when two conditions are met: 1) the borrower is experiencing financial difficulty and 2) concessions are made by the Company that would not otherwise be considered for a borrower with similar credit characteristics. The most common types of modifications include interest rate reductions, maturity
First Financial Bancorp 2011 Annual Report 67
Notes To Consolidated Financial Statements
extensions, and modifications to principal amortization including interest only structures. Modified terms are dependent upon the financial position and needs of the individual borrower. If the modification agreement is violated, the loan is handled by the Company’s credit administration group for resolution, which may result in foreclosure in the case of real estate.
TDRs are generally classified as nonaccrual for a minimum period of six months and may qualify for return to accrual status once they have demonstrated performance with the restructured terms of the loan agreement.
First Financial had 78 TDRs totaling $22.1 million at December 31, 2011, including $4.0 million of loans on accrual status and $18.1 million of loans classified as nonaccrual. First Financial has no commitments outstanding to lend additional funds to borrowers whose loan terms have been modified in TDRs. At December 31, 2011, the allowance for loan and lease losses included reserves of $4.3 million related to TDRs. For the year ended December 31, 2011, First Financial charged off $3.0 million for the portion of TDRs determined to be uncollectible.
At December 31, 2011, approximately $1.3 million of the accruing TDRs have been performing in accordance with the restructured terms for more than one year.
The following table provides information on TDRs during 2011.
|
| | | |
| | Year Ended December 31, |
| | 2011 |
| | Total TDRs |
| (Dollars in thousands) | Number of Loans | Pre-Modification Loan Balance | Period End Balance |
| Commercial | 4 | $2,675 | $2,673 |
| Real estate - construction | 1 | 1,193 | 1,193 |
| Real estate - commercial | 9 | 3,251 | 3,150 |
| Real estate - residential | 16 | 1,790 | 1,811 |
| Installment | 2 | 114 | 114 |
| Home equity | 1 | 101 | 101 |
| Total | 33 | $9,124 | $9,042 |
The following table provides information on how TDRs were modified during 2011.
|
| |
| | Year Ended December 31, |
| (Dollars in thousands) | 2011 (2) |
| Extended Maturities | $3,539 |
| Adjusted Interest Rates | 338 |
| Combination of Rate and Maturity Changes | 1,487 |
| Forbearance | 3,563 |
Other (1) | 115 |
| Total | $9,042 |
__________________________________________
(1) Other includes covenant modifications and other concessions or combination of concessions that do not consist of interest rate adjustments, forbearance, and maturity extensions.
(2) Balances are as of period end.
First Financial considers repayment performance as an indication of the effectiveness of the Company's loan modifications. First Financial considers a borrower that is 90 days or more past due on any principal or interest payments for a TDR, or who prematurely terminates a restructured loan agreement without paying off the contractual principal balance (for example, in a deed-in-lieu arrangement), to be in payment default of the terms of the TDR agreement.
68 First Financial Bancorp 2011 Annual Report
The following tables provide information on TDRs for which there was a payment default during the period that occurred within twelve months of the loan modification.
|
| | | | |
| | | Year Ended December 31, |
| | | 2011 |
| (Dollars in thousands) | | Number of Loans | | Period End Balance |
| Commercial | | 0 | | $0 |
| Real estate - construction | | 1 | | 6,229 |
| Real estate - commercial | | 3 | | 2,274 |
| Real estate - residential | | 2 | | 255 |
| Installment | | 0 | | 0 |
| Home equity | | 0 | | 0 |
| Total | | 6 | | $8,758 |
Impaired Loans. Loans placed in nonaccrual status and TDRs are considered impaired. The following table provides information on nonaccrual, TDRs, and impaired loans as of December 31:
|
| | | | | | | | | | | | |
| (Dollars in thousands) | | 2011 | | 2010 | | 2009 |
| Principal balance | | | | | | |
| Nonaccrual loans | | | | | | |
| Commercial | | $ | 7,809 |
| | $ | 13,729 |
| | $ | 13,798 |
|
| Real estate-construction | | 10,005 |
| | 12,921 |
| | 35,604 |
|
| Real estate-commercial | | 28,349 |
| | 28,342 |
| | 15,320 |
|
| Real estate-residential | | 5,692 |
| | 4,607 |
| | 3,993 |
|
| Installment | | 371 |
| | 150 |
| | 618 |
|
| Home equity | | 2,073 |
| | 2,553 |
| | 2,324 |
|
| Nonaccrual loans | | 54,299 |
| | 62,302 |
| | 71,657 |
|
| Troubled debt restructurings | | | | | | |
| Accruing | | 4,009 |
| | 3,508 |
| | 679 |
|
| Nonaccrual | | 18,071 |
| | 14,105 |
| | 5,446 |
|
| Total troubled debt restructurings | | 22,080 |
| | 17,613 |
| | 6,125 |
|
| Total impaired loans | | $ | 76,379 |
| | $ | 79,915 |
| | $ | 77,782 |
|
| | | | | | | |
| Interest income effect | | | | | | |
| Gross amount of interest that would have been recorded under original terms | | $ | 5,500 |
| | $ | 5,462 |
| | $ | 4,576 |
|
| Interest included in income | | | | | | |
| Nonaccrual loans | | 468 |
| | 1,772 |
| | $ | 2,384 |
|
| Troubled debt restructurings | | 299 |
| | 521 |
| | $ | 35 |
|
| Total interest included in income | | 767 |
| | 2,293 |
| | $ | 2,419 |
|
| Net impact on interest income | | $ | 4,733 |
| | $ | 3,169 |
| | $ | 2,157 |
|
| | | | | | | |
| Commitments outstanding to borrowers with nonaccrual loans | | $ | 0 |
| | $ | 77 |
| | $ | 4 |
|
First Financial individually reviews all impaired commercial loan relationships greater than $250,000, as well as consumer loan troubled debt restructurings greater than $100,000, to determine if a specific allowance based on the borrower’s overall financial condition, resources and payment record, support from guarantors, and the realizable value of any collateral is
necessary. Specific allowances are based on discounted cash flows using the loan's initial effective interest rate or the fair value of the collateral for certain collateral dependent loans.
First Financial Bancorp 2011 Annual Report 69
Notes To Consolidated Financial Statements
First Financial's investment in impaired loans was as follows:
|
| | | | | | | | | | | | | | | | | | | | |
| | | As of December 31, 2011 |
| (Dollars in thousands) | | Current Balance | | Contractual Principal Balance | | Related Allowance | | Average Current Balance | | YTD Interest Income Recognized |
| Loans with no related allowance recorded | | | | | | | | | | |
| Commercial | | $ | 6,351 |
| | $ | 8,387 |
| | $ | 0 |
| | $ | 7,337 |
| | $ | 62 |
|
| Real estate - construction | | 6,289 |
| | 11,129 |
| | 0 |
| | 5,657 |
| | 2 |
|
| Real estate - commercial | | 14,999 |
| | 22,718 |
| | 0 |
| | 18,306 |
| | 249 |
|
| Real estate - residential | | 8,639 |
| | 9,580 |
| | 0 |
| | 6,848 |
| | 66 |
|
| Installment | | 485 |
| | 526 |
| | 0 |
| | 356 |
| | 5 |
|
| Home equity | | 2,073 |
| | 2,206 |
| | 0 |
| | 2,337 |
| | 10 |
|
| | | | | | | | | | | |
| Loans with an allowance recorded | | | | | | | | | | |
| Commercial | | 4,131 |
| | 4,267 |
| | 3,205 |
| | 3,683 |
| | 15 |
|
| Real estate - construction | | 11,098 |
| | 13,905 |
| | 2,578 |
| | 13,731 |
| | 92 |
|
| Real estate - commercial | | 19,521 |
| | 26,357 |
| | 6,441 |
| | 15,484 |
| | 225 |
|
| Real estate - residential | | 2,692 |
| | 2,705 |
| | 313 |
| | 3,630 |
| | 37 |
|
| Installment | | 0 |
| | 0 |
| | 0 |
| | 15 |
| | 1 |
|
| Home equity | | 101 |
| | 101 |
| | 2 |
| | 81 |
| | 3 |
|
| | | | | | | | | | | |
| Total | | |
| | |
| | |
| | |
| | |
|
| Commercial | | 10,482 |
| | 12,654 |
| | 3,205 |
| | 11,020 |
| | 77 |
|
| Real estate - construction | | 17,387 |
| | 25,034 |
| | 2,578 |
| | 19,388 |
| | 94 |
|
| Real estate - commercial | | 34,520 |
| | 49,075 |
| | 6,441 |
| | 33,790 |
| | 474 |
|
| Real estate - residential | | 11,331 |
| | 12,285 |
| | 313 |
| | 10,478 |
| | 103 |
|
| Installment | | 485 |
| | 526 |
| | 0 |
| | 371 |
| | 6 |
|
| Home equity | | 2,174 |
| | 2,307 |
| | 2 |
| | 2,418 |
| | 13 |
|
| Total | | $ | 76,379 |
| | $ | 101,881 |
| | $ | 12,539 |
| | $ | 77,465 |
| | $ | 767 |
|
70 First Financial Bancorp 2011 Annual Report
|
| | | | | | | | | | | | | | | | | | | | |
| | | As of December 31, 2010 |
| (Dollars in thousands) | | Current Balance | | Contractual Principal Balance | | Related Allowance | | Average Current Balance | | Interest Income Recognized |
| Loans with no related allowance recorded | | | | | | | | | | |
| Commercial | | $ | 9,375 |
| | $ | 12,008 |
| | $ | 0 |
| | $ | 7,432 |
| | $ | 228 |
|
| Real estate - construction | | 4,925 |
| | 8,458 |
| | 0 |
| | 9,935 |
| | 98 |
|
| Real estate - commercial | | 17,431 |
| | 21,660 |
| | 0 |
| | 14,113 |
| | 804 |
|
| Real estate - residential | | 5,854 |
| | 6,447 |
| | 0 |
| | 6,611 |
| | 84 |
|
| Installment | | 150 |
| | 179 |
| | 0 |
| | 336 |
| | 6 |
|
| Home equity | | 2,553 |
| | 3,345 |
| | 0 |
| | 2,188 |
| | 74 |
|
| | | | | | | | | | | |
| Loans with an allowance recorded | | |
| | | | | | | | |
| Commercial | | 4,354 |
| | 6,090 |
| | 2,017 |
| | 10,423 |
| | 77 |
|
| Real estate - construction | | 14,407 |
| | 18,261 |
| | 3,716 |
| | 11,063 |
| | 378 |
|
| Real estate - commercial | | 16,693 |
| | 19,799 |
| | 4,347 |
| | 13,391 |
| | 392 |
|
| Real estate - residential | | 4,173 |
| | 4,264 |
| | 336 |
| | 2,727 |
| | 152 |
|
| | | | | | | | | | | |
| Total | | |
| | |
| | |
| | |
| | |
|
| Commercial | | 13,729 |
| | 18,098 |
| | 2,017 |
| | 17,855 |
| | 305 |
|
| Real estate - construction | | 19,332 |
| | 26,719 |
| | 3,716 |
| | 20,998 |
| | 476 |
|
| Real estate - commercial | | 34,124 |
| | 41,459 |
| | 4,347 |
| | 27,504 |
| | 1,196 |
|
| Real estate - residential | | 10,027 |
| | 10,711 |
| | 336 |
| | 9,338 |
| | 236 |
|
| Installment | | 150 |
| | 179 |
| | 0 |
| | 336 |
| | 6 |
|
| Home equity | | 2,553 |
| | 3,345 |
| | 0 |
| | 2,188 |
| | 74 |
|
| Total | | $ | 79,915 |
| | $ | 100,511 |
| | $ | 10,416 |
| | $ | 78,219 |
| | $ | 2,293 |
|
Credit Quality. To facilitate the monitoring of credit quality for commercial loans, and for purposes of determining an appropriate allowance for loan and lease losses, First Financial utilizes the following categories of credit grades:
Pass - Higher quality loans that do not fit any of the other categories described below.
Special Mention - First Financial assigns a Special Mention rating to loans and leases with potential weaknesses that deserve management's close attention. If left uncorrected, these potential weaknesses may result in deterioration of the repayment prospects for the loan or lease or in First Financial's credit position at some future date.
Substandard - First Financial assigns a substandard rating to loans or leases that are inadequately protected by the current sound financial worth and paying capacity of the borrower or of the collateral pledged, if any. Substandard loans and leases have well-defined weaknesses that jeopardize repayment of the debt. Substandard loans and leases are characterized by the distinct possibility that the Company will sustain some loss if the deficiencies are not addressed.
Doubtful - First Financial assigns a doubtful rating to loans and leases with all the attributes of a substandard rating with the added characteristic that the weaknesses make collection or liquidation in full, on the basis of currently existing facts, conditions, and values, highly questionable and improbable. The possibility of loss is extremely high, but because of certain important and reasonably specific pending factors that may work to the advantage and strengthening of the credit quality of the loan or lease, its classification as an estimated loss is deferred until its more exact status may be determined. Pending factors include proposed merger, acquisition, or liquidation procedures, capital injection, perfecting liens on additional collateral and refinancing plans.
The credit grades described above, which are derived from standard regulatory rating definitions, are assigned upon initial approval of credit to borrowers and updated periodically thereafter.
First Financial Bancorp 2011 Annual Report 71
Notes To Consolidated Financial Statements
First Financial considers repayment performance as the best indicator of credit quality for consumer loans. Consumer loans that have principal and interest payments that are past due by ninety days or more are generally classified as nonperforming. Additionally, consumer loans that have been modified in a troubled debt restructuring are classified as nonperforming unless such loans have a sustained repayment performance of six months or greater and are reasonably assured of repayment in accordance with the restructured terms. All other consumer loans and leases are classified as performing.
Commercial and consumer credit exposure by risk attribute was as follows:
|
| | | | | | | | | | | | | | | | |
| | | As of December 31, 2011 |
| | | | | Real Estate | | |
| (Dollars in thousands) | | Commercial | | Construction | | Commercial | | Total |
| Pass | | $ | 799,471 |
| | $ | 89,072 |
| | $ | 1,110,718 |
| | $ | 1,999,261 |
|
| Special Mention | | 37,547 |
| | 1,751 |
| | 28,994 |
| | 68,292 |
|
| Substandard | | 19,435 |
| | 24,151 |
| | 93,355 |
| | 136,941 |
|
| Doubtful | | 528 |
| | 0 |
| | 0 |
| | 528 |
|
| Total | | $ | 856,981 |
| | $ | 114,974 |
| | $ | 1,233,067 |
| | $ | 2,205,022 |
|
|
| | | | | | | | | | | | | | | | | | | | |
| | | Real Estate Residential | | Installment | | Home Equity | | Other | | Total |
| Performing | | $ | 279,958 |
| | $ | 67,136 |
| | $ | 356,887 |
| | $ | 48,942 |
| | $ | 752,923 |
|
| Nonperforming | | 8,022 |
| | 407 |
| | 2,073 |
| | 0 |
| | 10,502 |
|
| Total | | $ | 287,980 |
| | $ | 67,543 |
| | $ | 358,960 |
| | $ | 48,942 |
| | $ | 763,425 |
|
|
| | | | | | | | | | | | | | | | |
| | | As of December 31, 2010 |
| | | | | Real Estate | | |
| (Dollars in thousands) | | Commercial | | Construction | | Commercial | | Total |
| Pass | | $ | 731,932 |
| | $ | 115,988 |
| | $ | 979,023 |
| | $ | 1,826,943 |
|
| Special Mention | | 36,453 |
| | 4,829 |
| | 63,618 |
| | 104,900 |
|
| Substandard | | 31,557 |
| | 42,726 |
| | 97,290 |
| | 171,573 |
|
| Doubtful | | 311 |
| | 0 |
| | 0 |
| | 311 |
|
| Total | | $ | 800,253 |
| | $ | 163,543 |
| | $ | 1,139,931 |
| | $ | 2,103,727 |
|
|
| | | | | | | | | | | | | | | | | | | | |
| | | Real Estate Residential | | Installment | | Home Equity | | Other | | Total |
| Performing | | $ | 262,654 |
| | $ | 69,561 |
| | $ | 338,757 |
| | $ | 32,172 |
| | $ | 703,144 |
|
| Nonperforming | | 6,519 |
| | 150 |
| | 2,553 |
| | 0 |
| | 9,222 |
|
| Total | | $ | 269,173 |
| | $ | 69,711 |
| | $ | 341,310 |
| | $ | 32,172 |
| | $ | 712,366 |
|
OREO. OREO is comprised of properties acquired by the Company through the loan foreclosure or repossession process, or other resolution activities that result in partial or total satisfaction of problem loans. The acquired properties are recorded at the lower of cost, or fair value less estimated costs of disposal (net realizable value), upon acquisition. Losses arising at the time of acquisition of such properties are charged against the allowance for loan and lease losses. Subsequent write-downs in the carrying value of OREO properties are expensed as incurred. Improvements to the properties may be capitalized if the improvements contribute to the overall value of the property, but may not be capitalized in excess of the net realizable value of the property.
72 First Financial Bancorp 2011 Annual Report
Changes in OREO were as follows:
|
| | | | | | | | | | | | |
| | | Years Ended December 31, |
| (Dollars in thousands) | | 2011 | | 2010 | | 2009 |
| Balance at beginning of year | | $ | 17,907 |
| | $ | 4,145 |
| | $ | 4,028 |
|
| Additions | | |
| | |
| | |
| Commercial | | 1,328 |
| | 17,520 |
| | 3,074 |
|
| Residential | | 2,904 |
| | 1,130 |
| | 3,062 |
|
| Total additions | | 4,232 |
| | 18,650 |
| | 6,136 |
|
| Disposals | | |
| | |
| | |
| Commercial | | 3,916 |
| | 2,315 |
| | 3,237 |
|
| Residential | | 2,536 |
| | 1,674 |
| | 2,428 |
|
| Total disposals | | 6,452 |
| | 3,989 |
| | 5,665 |
|
| Write-downs | | |
| | |
| | |
| Commercial | | 4,042 |
| | 727 |
| | 55 |
|
| Residential | | 328 |
| | 172 |
| | 299 |
|
| Total write-downs | | 4,370 |
| | 899 |
| | 354 |
|
| Balance at end of year | | $ | 11,317 |
| | $ | 17,907 |
| | $ | 4,145 |
|
11. Loans (covered)
First Financial evaluates purchased loans for impairment in accordance with the provisions of FASB ASC Topic 310-30, Loans and Debt Securities Acquired with Deteriorated Credit Quality. The cash flows expected to be collected on purchased loans are estimated based upon the expected remaining life of the underlying loans, which includes the effects of estimated prepayments. Purchased loans are considered impaired if there is evidence of credit deterioration since origination and if it is probable that not all contractually required payments will be collected. First Financial is accounting for the majority of loans purchased in the Peoples and Irwin acquisitions under FASB ASC Topic 310-30 except loans with revolving privileges, which are outside the scope of this guidance, and loans for which cash flows could not be estimated, which are accounted for under the cost recovery method. Purchased impaired loans are not classified as nonperforming assets as the loans are considered to be performing under FASB ASC Topic 310-30. Therefore, interest income, through accretion of the difference between the carrying value of the loans and the expected cash flows is being recognized on all purchased loans being accounted for under FASB ASC Topic 310-30.
First Financial Bancorp 2011 Annual Report 73
Notes To Consolidated Financial Statements
The following table reflects the carrying value of all purchased impaired and nonimpaired covered loans:
|
| | | | | | | | | | | | | | | | | | | | | | | | |
| | | December 31, 2011 | | December 31, 2010 |
| (Dollars in thousands) | | Loans Accounted For Under FASB ASC Topic 310-30 | | Loans excluded from FASB ASC Topic 310-30 (1) | | Total Purchased Loans | | Loans Accounted For Under FASB ASC Topic 310-30 | | Loans Excluded From FASB ASC Topic 310-30 (1) | | Total Purchased Loans |
| Commercial | | $ | 182,625 |
| | $ | 13,267 |
| | $ | 195,892 |
| | $ | 295,600 |
| | $ | 38,439 |
| | $ | 334,039 |
|
| Real estate - construction | | 17,120 |
| | 0 |
| | 17,120 |
| | 42,743 |
| | 0 |
| | 42,743 |
|
| Real estate - commercial | | 627,257 |
| | 9,787 |
| | 637,044 |
| | 837,942 |
| | 17,783 |
| | 855,725 |
|
| Real estate - residential | | 121,117 |
| | 0 |
| | 121,117 |
| | 147,052 |
| | 0 |
| | 147,052 |
|
| Installment | | 12,123 |
| | 1,053 |
| | 13,176 |
| | 19,560 |
| | 1,511 |
| | 21,071 |
|
| Home equity | | 4,146 |
| | 60,832 |
| | 64,978 |
| | 7,241 |
| | 66,454 |
| | 73,695 |
|
| Other covered loans | | 0 |
| | 3,917 |
| | 3,917 |
| | 0 |
| | 7,168 |
| | 7,168 |
|
| Total covered loans | | $ | 964,388 |
| | $ | 88,856 |
| | $ | 1,053,244 |
| | $ | 1,350,138 |
| | $ | 131,355 |
| | $ | 1,481,493 |
|
(1) Includes loans with revolving privileges which are scoped out of FASB ASC Topic 310-30 and certain loans which First Financial elected to treat under the cost recovery method of accounting.
The outstanding balance of all loans accounted for under FASB ASC Topic 310-30, including contractual principal, interest, fees, and penalties, was $1.6 billion and $2.2 billion as of December 31, 2011 and December 31, 2010, respectively.
Changes in the carrying amount of accretable yield for loans accounted for under FASB ASC Topic 310-30 for the years ended December 31 were as follows:
|
| | | | | | | | | | | | |
| (Dollars in thousands) | | 2011 | | 2010 | | 2009 |
Balance at beginning of period (1) | | $ | 509,945 |
| | $ | 623,669 |
| | $ | 0 |
|
| Additions | | 0 |
| | 0 |
| | 691,266 |
|
| Reclassification from non-accretable difference | | 39,079 |
| | 97,808 |
| | 0 |
|
| Accretion | | (125,524 | ) | | (139,356 | ) | | (48,673 | ) |
Other net activity (2) | | (79,090 | ) | | (72,176 | ) | | (18,924 | ) |
| Balance at end of period | | $ | 344,410 |
| | $ | 509,945 |
| | $ | 623,669 |
|
(1) Excludes loans with revolving privileges which are scoped out of FASB Topic 310-30 and certain loans which First Financial elected to treat under the cost recovery method.
(2) Includes the impact of loan repayments and charge-offs.
First Financial reviewed its forecast of expected cash flows for loans accounted for under FASB ASC Topic 310-30 throughout 2011. The Company recognized improvement in the cash flow expectations related to certain loan pools resulting in the reclassification from nonaccretable to accretable difference of $39.1 million and $97.8 million during 2011 and 2010, respectively. These reclassifications resulted in yield adjustments on these loan pools on a prospective basis. The Company also recognized declines in the cash flow expectations of certain loan pools. Any decline in expected cash flows for a pool of loans is considered impairment and recorded as provision expense, and a related allowance for loan and lease losses on covered loans, on a discounted basis during the period. Improved cash flow expectations for loan pools that were impaired during prior periods is recorded first as a reversal of previously recorded impairment and then as an increase in prospective yield when all previously recorded impairment has been recaptured. For further detail on impairment and provision expense related to loans accounted for under FASB ASC Topic 310-30, see "Covered Loans" under Note 12 - Allowance for Loan and Lease Losses.
Covered loans are considered past due or delinquent when the contractual principal or interest due in accordance with the terms of the loan agreement or any portion thereof remains unpaid after the due date of the scheduled payment.
74 First Financial Bancorp 2011 Annual Report
Delinquency. Covered loan delinquency, excluding loans accounted for under FASB ASC Topic 310-30, was as follows:
|
| | | | | | | | | | | | | | | | | | | | | | | | | | | |
| | As of December 31, 2011 |
| (Dollars in thousands) | 30 - 59 days past due | | 60 - 89 days past due | | > 90 days past due | | Total past due | | Current | | Total | | > 90 days past due and still accruing |
| Loans | | | | | | | | | | | | | |
| Commercial | $ | 73 |
| | $ | 294 |
| | $ | 6,490 |
| | $ | 6,857 |
| | $ | 6,410 |
| | $ | 13,267 |
| | $ | 0 |
|
| Real estate - commercial | 184 |
| | 0 |
| | 1,870 |
| | 2,054 |
| | 7,733 |
| | 9,787 |
| | 0 |
|
| Installment | 0 |
| | 0 |
| | 0 |
| | 0 |
| | 1,053 |
| | 1,053 |
| | 0 |
|
| Home equity | 1,344 |
| | 11 |
| | 1,679 |
| | 3,034 |
| | 57,798 |
| | 60,832 |
| | 0 |
|
| All other | 10 |
| | 6 |
| | 125 |
| | 141 |
| | 3,776 |
| | 3,917 |
| | 107 |
|
| Total | $ | 1,611 |
| | $ | 311 |
| | $ | 10,164 |
| | $ | 12,086 |
| | $ | 76,770 |
| | $ | 88,856 |
| | $ | 107 |
|
|
| | | | | | | | | | | | | | | | | | | | | | | | | | | |
| | As of December 31, 2010 |
| (Dollars in thousands) | 30 - 59 days past due | | 60 - 89 days past due | | > 90 days past due | | Total past due | | Current | | Total | | > 90 days past due and still accruing |
| Loans | | | | | | | | | | | | | |
| Commercial | $ | 880 |
| | $ | 419 |
| | $ | 13,764 |
| | $ | 15,063 |
| | $ | 23,376 |
| | $ | 38,439 |
| | $ | 0 |
|
| Real estate - commercial | 225 |
| | 62 |
| | 1,896 |
| | 2,183 |
| | 15,600 |
| | 17,783 |
| | 0 |
|
| Installment | 0 |
| | 0 |
| | 0 |
| | 0 |
| | 1,511 |
| | 1,511 |
| | 0 |
|
| Home equity | 656 |
| | 443 |
| | 1,424 |
| | 2,523 |
| | 63,931 |
| | 66,454 |
| | 0 |
|
| All other | 87 |
| | 10 |
| | 9 |
| | 106 |
| | 7,062 |
| | 7,168 |
| | 9 |
|
| Total | $ | 1,848 |
| | $ | 934 |
| | $ | 17,093 |
| | $ | 19,875 |
| | $ | 111,480 |
| | $ | 131,355 |
| | $ | 9 |
|
Nonaccrual. Covered loans accounted for under FASB ASC Topic 310-30 are classified as performing, even though they may be contractually past due, as any nonpayment of contractual principal or interest is considered in the periodic re-estimation of expected cash flows and is included in the resulting recognition of current period covered loan loss provision or prospective yield adjustments.
Similar to uncovered loans, covered loans accounted for outside FASB ASC Topic 310-30 are classified as nonaccrual when, in the opinion of management, collection of principal or interest is doubtful or when principal or interest payments are 90 days or more past due. Generally, loans are placed on nonaccrual status due to the continued failure to adhere to contractual payment terms by the borrower coupled with other pertinent factors, such as, insufficient collateral value. The accrual of interest income is discontinued and previously accrued, but unpaid interest is reversed when a loan is placed in nonaccrual status. Any payments received while a loan is in nonaccrual status are applied as a reduction to the carrying value of the loan. A loan may be placed back on accrual status if all contractual payments have been received and collection of future principal and interest payments is no longer doubtful.
First Financial Bancorp 2011 Annual Report 75
Notes To Consolidated Financial Statements
Information as to covered nonaccrual loans was as follows:
|
| | | | | | | | | | | | |
| (Dollars in thousands) | | 2011 | | 2010 | | 2009 |
| Principal balance | | | | | | |
| Nonaccrual loans | | | | | | |
| Commercial | | $ | 7,203 |
| | $ | 16,190 |
| | $ | 8,458 |
|
| Real estate-commercial | | 2,192 |
| | 2,074 |
| | 5,745 |
|
| Home equity | | 1,747 |
| | 1,491 |
| | 1,703 |
|
| All other | | 18 |
| | 0 |
| | 509 |
|
| Total | | $ | 11,160 |
| | $ | 19,755 |
| | $ | 16,415 |
|
| | | | | | | |
| Interest income effect | | | | | | |
| Gross amount of interest that would have been recorded under original terms | | $ | 1,020 |
| | $ | 1,453 |
| | $ | 1,049 |
|
| Interest included in income | | 58 |
| | 398 |
| | 608 |
|
| Net impact on interest income | | $ | 962 |
| | $ | 1,055 |
| | $ | 441 |
|
Impaired Loans – Covered loans placed on nonaccrual status, excluding loans accounted for under FASB ASC Topic 310-30, are considered impaired. First Financial’s investment in covered impaired loans, excluding loans accounted for under FASB ASC Topic 310-30, was as follows:
|
| | | | | | | | | | | | | | | | | | | | |
| | | As of December 31, 2011 |
| (Dollars in thousands) | | Recorded Investment | | Unpaid Principal Balance | | Related Allowance | | Average Recorded Investment | | YTD Interest Income Recognized |
| Loans with no related allowance recorded | | | | | | | | | | |
| Commercial | | $ | 7,203 |
| | $ | 10,152 |
| | $ | 0 |
| | $ | 9,873 |
| | $ | 47 |
|
| Real estate - commercial | | 2,192 |
| | 4,002 |
| | 0 |
| | 2,504 |
| | 5 |
|
| Home equity | | 1,747 |
| | 2,878 |
| | 0 |
| | 1,559 |
| | 6 |
|
| All other | | 18 |
| | 18 |
| | 0 |
| | 9 |
| | 0 |
|
| Total | | $ | 11,160 |
| | $ | 17,050 |
| | $ | 0 |
| | $ | 13,945 |
| | $ | 58 |
|
|
| | | | | | | | | | | | | | | | | | | | |
| | | As of December 31, 2010 |
| (Dollars in thousands) | | Recorded Investment | | Unpaid Principal Balance | | Related Allowance | | Average Recorded Investment | | YTD Interest Income Recognized |
| Loans with no related allowance recorded | | | | | | | | | | |
| Commercial | | $ | 16,190 |
| | $ | 18,346 |
| | $ | 0 |
| | $ | 12,324 |
| | $ | 316 |
|
| Real estate - commercial | | 2,074 |
| | 5,412 |
| | 0 |
| | 3,910 |
| | 14 |
|
| Installment | | 0 |
| | 0 |
| | 0 |
| | 255 |
| | 0 |
|
| Home equity | | 1,491 |
| | 3,137 |
| | 0 |
| | 1,597 |
| | 68 |
|
| Total | | $ | 19,755 |
| | $ | 26,895 |
| | $ | 0 |
| | $ | 18,086 |
| | $ | 398 |
|
Credit Quality – For further discussion of First Financial's monitoring of credit quality for commercial and consumer loans, including discussion of the risk attributes noted below, please see Note 10 - Loans.
76 First Financial Bancorp 2011 Annual Report
Covered commercial and consumer credit exposure by risk attribute was as follows:
|
| | | | | | | | | | | | | | | | |
| | | As of December 31, 2011 |
| | | | | Real Estate | | |
| (Dollars in thousands) | | Commercial | | Construction | | Commercial | | Total |
| Pass | | $ | 113,201 |
| | $ | 2,506 |
| | $ | 340,889 |
| | $ | 456,596 |
|
| Special Mention | | 22,468 |
| | 3,597 |
| | 63,880 |
| | 89,945 |
|
| Substandard | | 52,103 |
| | 11,017 |
| | 230,870 |
| | 293,990 |
|
| Doubtful | | 8,120 |
| | 0 |
| | 1,405 |
| | 9,525 |
|
| Total | | $ | 195,892 |
| | $ | 17,120 |
| | $ | 637,044 |
| | $ | 850,056 |
|
|
| | | | | | | | | | | | | | | | | | | | |
| | | Real Estate Residential | | Installment | | Home Equity | | Other | | Total |
| Performing | | $ | 121,117 |
| | $ | 13,176 |
| | $ | 63,231 |
| | $ | 3,899 |
| | $ | 201,423 |
|
| Nonperforming | | 0 |
| | 0 |
| | 1,747 |
| | 18 |
| | 1,765 |
|
| Total | | $ | 121,117 |
| | $ | 13,176 |
| | $ | 64,978 |
| | $ | 3,917 |
| | $ | 203,188 |
|
|
| | | | | | | | | | | | | | | | |
| | | As of December 31, 2010 |
| | | | | Real Estate | | |
| (Dollars in thousands) | | Commercial | | Construction | | Commercial | | Total |
| Pass | | $ | 225,088 |
| | $ | 14,021 |
| | $ | 476,140 |
| | $ | 715,249 |
|
| Special Mention | | 35,768 |
| | 5,743 |
| | 106,057 |
| | 147,568 |
|
| Substandard | | 60,090 |
| | 22,979 |
| | 268,651 |
| | 351,720 |
|
| Doubtful | | 13,093 |
| | 0 |
| | 4,877 |
| | 17,970 |
|
| Total | | $ | 334,039 |
| | $ | 42,743 |
| | $ | 855,725 |
| | $ | 1,232,507 |
|
|
| | | | | | | | | | | | | | | | | | | | |
| | | Real Estate Residential | | Installment | | Home Equity | | Other | | Total |
| Performing | | $ | 147,052 |
| | $ | 21,071 |
| | $ | 72,204 |
| | $ | 7,168 |
| | $ | 247,495 |
|
| Nonperforming | | 0 |
| | 0 |
| | 1,491 |
| | 0 |
| | 1,491 |
|
| Total | | $ | 147,052 |
| | $ | 21,071 |
| | $ | 73,695 |
| | $ | 7,168 |
| | $ | 248,986 |
|
Covered OREO – Covered OREO is comprised of properties acquired by the Company through the loan foreclosure or repossession process, or other resolution activities that result in partial or total satisfaction of problem covered loans. These properties remain subject to loss share agreements whereby the FDIC reimburses First Financial for the majority of any losses incurred. The acquired properties are recorded at the lower of cost or fair value upon acquisition. Losses arising at the time of acquisition of such properties are charged against the allowance for loan and lease losses. Subsequent write-downs in the carrying value of covered OREO properties are expensed as incurred. Improvements to the properties may be capitalized if the improvements contribute to the overall value of the property, but may not be capitalized in excess of the net realizable value of the property.
First Financial Bancorp 2011 Annual Report 77
Notes To Consolidated Financial Statements
Changes in covered OREO were as follows:
|
| | | | | | | | | | | | |
| | | Years Ended December 31, |
| (Dollars in thousands) | | 2011 | | 2010 | | 2009 |
| Balance at beginning of year | | $ | 35,257 |
| | $ | 12,916 |
| | $ | 0 |
|
| Additions | | |
| | |
| | |
| Commercial | | 46,880 |
| | 22,237 |
| | 12,916 |
|
| Residential | | 2,753 |
| | 9,827 |
| | 0 |
|
| Total additions | | 49,633 |
| | 32,064 |
| | 12,916 |
|
| Disposals | | |
| | |
| | |
| Commercial | | 26,693 |
| | 4,744 |
| | 0 |
|
| Residential | | 7,849 |
| | 4,536 |
| | 0 |
|
| Total disposals | | 34,542 |
| | 9,280 |
| | 0 |
|
| Write-downs | | |
| | |
| | |
| Commercial | | 4,407 |
| | 414 |
| | 0 |
|
| Residential | | 1,123 |
| | 29 |
| | 0 |
|
| Total write-downs | | 5,530 |
| | 443 |
| | 0 |
|
| Balance at end of year | | $ | 44,818 |
| | $ | 35,257 |
| | $ | 12,916 |
|
12. Allowance for Loan and Lease Losses
Uncovered Loans – For each reporting period, management maintains the allowance for loan and lease losses at a level that it considers sufficient to absorb probable loan and lease losses inherent in the portfolio. Management determines the adequacy of the allowance based on historical loss experience as well as other significant factors such as composition of the portfolio, economic conditions, geographic footprint, the results of periodic internal and external evaluations of delinquent, nonaccrual, and classified loans, and any other adverse situations that may affect a specific borrower's ability to repay (including the timing of future payments). This evaluation is inherently subjective as it requires utilizing material estimates that may be susceptible to significant change.
In the commercial portfolio, which includes time and demand notes, tax-exempt loans, and commercial real estate loans, non-homogeneous loan relationships greater than $250,000 that are considered impaired or designated as a TDR are evaluated to determine the need for a specific allowance based on the borrower's overall financial condition, resources and payment record, support from guarantors, and the realizable value of any collateral.
The allowance for non-impaired commercial loans and impaired commercial loan relationships less than $250,000 includes a process of estimating the probable losses inherent in the portfolio by category, based on First Financial's internal system of credit risk ratings and historical loss data. These estimates may also be adjusted for management's estimate of probable losses on specific loan types dependent upon trends in the values of the underlying collateral, delinquent and nonaccrual loans, prevailing economic conditions, changes in lending strategies, and other influencing factors.
With the exception of loans modified as TDRs, consumer loans are evaluated as an asset type within a category (i.e., residential real estate, installment, etc.), as these loans exhibit homogeneous characteristics. The allowance for consumer loans which includes residential real estate, installment, home equity, credit card loans, and overdrafts, is established by estimating losses inherent in each particular category of consumer loans. The estimate of losses is primarily based on historical loss rates for each category, as well as trends in delinquent and nonaccrual loans, prevailing economic conditions, and other significant influencing factors. Consumer loan relationships modified as TDRs greater than $100,000 are individually reviewed to determine if a specific allowance is necessary.
There were no material changes to First Financial's accounting policies or methodology related to the allowance for loan and lease losses during 2011.
First Financial's policy is to charge-off all or a portion of a commercial loan when, in management's opinion, it is unlikely to collect the principal amount owed in full either through payments from the borrower or from the liquidation of collateral.
78 First Financial Bancorp 2011 Annual Report
Changes in the allowance for loan and lease losses for the three years ended December 31 were as follows:
|
| | | | | | | | | | | | | |
| (Dollars in thousands) | | | 2011 | | 2010 | | 2009 |
| Balance at beginning of period | | | $ | 57,235 |
| | $ | 59,311 |
| | $ | 35,873 |
|
| Provision for loan losses | | | 19,210 |
| | 33,564 |
| | 56,084 |
|
| Loans charged off | | | (25,798 | ) | | (38,351 | ) | | (34,949 | ) |
| Recoveries | | | 1,929 |
| | 2,711 |
| | 2,303 |
|
| Balance at end of period | | | $ | 52,576 |
| | $ | 57,235 |
| | $ | 59,311 |
|
Changes in the allowance for loan and lease losses by loan category as of December 31 were as follows:
|
| | | | | | | | | | | | | | | | | | | | | | | | | | | | | | | | |
| | 2011 |
| | | | | Real Estate | | | | | | | | |
| (Dollars in thousands) | | Commercial | | Construction | | Commercial | | Residential | | Installment | | Home Equity | | Other | | Total |
| Allowance for loan and lease losses | | | | | | | | | | | | | | | | |
| Balance at beginning of period | | $ | 10,138 |
| | $ | 8,326 |
| | $ | 14,917 |
| | $ | 8,907 |
| | $ | 1,981 |
| | $ | 10,939 |
| | $ | 2,027 |
| | $ | 57,235 |
|
| Provision for loan and lease losses | | 2,825 |
| | 2,345 |
| | 13,384 |
| | (2,407 | ) | | (159 | ) | | 1,878 |
| | 1,344 |
| | 19,210 |
|
| Gross charge-offs | | 3,436 |
| | 6,279 |
| | 10,382 |
| | 1,551 |
| | 526 |
| | 2,183 |
| | 1,441 |
| | 25,798 |
|
| Recoveries | | 762 |
| | 32 |
| | 309 |
| | 45 |
| | 363 |
| | 117 |
| | 301 |
| | 1,929 |
|
| Total net charge-offs | | 2,674 |
| | 6,247 |
| | 10,073 |
| | 1,506 |
| | 163 |
| | 2,066 |
| | 1,140 |
| | 23,869 |
|
| Ending allowance for loan and lease losses | | $ | 10,289 |
| | $ | 4,424 |
| | $ | 18,228 |
| | $ | 4,994 |
| | $ | 1,659 |
| | $ | 10,751 |
| | $ | 2,231 |
| | $ | 52,576 |
|
| Ending allowance on loans individually evaluated for impairment | | $ | 3,205 |
| | $ | 2,578 |
| | $ | 6,441 |
| | $ | 313 |
| | $ | 0 |
| | $ | 2 |
| | $ | 0 |
| | $ | 12,539 |
|
| Ending allowance on loans collectively evaluated for impairment | | 7,084 |
| | 1,846 |
| | 11,787 |
| | 4,681 |
| | 1,659 |
| | 10,749 |
| | 2,231 |
| | 40,037 |
|
| Ending allowance for loan and lease losses | | $ | 10,289 |
| | $ | 4,424 |
| | $ | 18,228 |
| | $ | 4,994 |
| | $ | 1,659 |
| | $ | 10,751 |
| | $ | 2,231 |
| | $ | 52,576 |
|
| Loans and Leases | | |
| | |
| | |
| | |
| | |
| | |
| | |
| | |
|
| Ending balance of loans individually evaluated for impairment | | $ | 8,351 |
| | $ | 17,387 |
| | $ | 30,708 |
| | $ | 3,730 |
| | $ | 0 |
| | $ | 101 |
| | $ | 0 |
| | $ | 60,277 |
|
| Ending balance of loans collectively evaluated for impairment | | 848,630 |
| | 97,587 |
| | 1,202,359 |
| | 284,250 |
| | 67,543 |
| | 358,859 |
| | 48,942 |
| | 2,908,170 |
|
| Total loans, excluding covered loans | | $ | 856,981 |
| | $ | 114,974 |
| | $ | 1,233,067 |
| | $ | 287,980 |
| | $ | 67,543 |
| | $ | 358,960 |
| | $ | 48,942 |
| | $ | 2,968,447 |
|
|
| | | | | | | | | | | | | | | | | | | | | | | | | | | | | | | | |
| | | 2010 |
| | | | | Real Estate | | | | | | | | |
| (Dollars in thousands) | | Commercial | | Construction | | Commercial | | Residential | | Installment | | Home Equity | | Other | | Total |
| Allowance for loan and lease losses | | | | | | | | | | | | | | | | |
| Balance at beginning of period | | $ | 18,590 |
| | $ | 8,143 |
| | $ | 15,190 |
| | $ | 5,308 |
| | $ | 2,159 |
| | $ | 8,063 |
| | $ | 1,858 |
| | $ | 59,311 |
|
| Provision for loan and lease losses | | 4,252 |
| | 8,778 |
| | 6,836 |
| | 5,268 |
| | 457 |
| | 6,183 |
| | 1,790 |
| | 33,564 |
|
| Gross charge-offs | | 13,324 |
| | 8,619 |
| | 8,191 |
| | 1,693 |
| | 1,154 |
| | 3,499 |
| | 1,871 |
| | 38,351 |
|
| Recoveries | | 620 |
| | 24 |
| | 1,082 |
| | 24 |
| | 519 |
| | 192 |
| | 250 |
| | 2,711 |
|
| Total net charge-offs | | 12,704 |
| | 8,595 |
| | 7,109 |
| | 1,669 |
| | 635 |
| | 3,307 |
| | 1,621 |
| | 35,640 |
|
| Ending allowance for loan and lease losses | | $ | 10,138 |
| | $ | 8,326 |
| | $ | 14,917 |
| | $ | 8,907 |
| | $ | 1,981 |
| | $ | 10,939 |
| | $ | 2,027 |
| | $ | 57,235 |
|
| Ending allowance on loans individually evaluated for impairment | | $ | 2,017 |
| | $ | 3,716 |
| | $ | 4,347 |
| | $ | 336 |
| | $ | 0 |
| | $ | 0 |
| | $ | 0 |
| | $ | 10,416 |
|
| Ending allowance on loans collectively evaluated for impairment | | 8,121 |
| | 4,610 |
| | 10,570 |
| | 8,571 |
| | 1,981 |
| | 10,939 |
| | 2,027 |
| | 46,819 |
|
| Ending allowance for loan and lease losses | | $ | 10,138 |
| | $ | 8,326 |
| | $ | 14,917 |
| | $ | 8,907 |
| | $ | 1,981 |
| | $ | 10,939 |
| | $ | 2,027 |
| | $ | 57,235 |
|
| Loans and Leases | | |
| | |
| | |
| | |
| | |
| | |
| | |
| | |
|
| Ending balance of loans individually evaluated for impairment | | $ | 12,175 |
| | $ | 19,294 |
| | $ | 31,260 |
| | $ | 5,420 |
| | $ | 0 |
| | $ | 0 |
| | $ | 0 |
| | $ | 68,149 |
|
| Ending balance of loans collectively evaluated for impairment | | 788,078 |
| | 144,249 |
| | 1,108,671 |
| | 263,753 |
| | 69,711 |
| | 341,310 |
| | 32,172 |
| | 2,747,944 |
|
| Total loans, excluding covered loans | | $ | 800,253 |
| | $ | 163,543 |
| | $ | 1,139,931 |
| | $ | 269,173 |
| | $ | 69,711 |
| | $ | 341,310 |
| | $ | 32,172 |
| | $ | 2,816,093 |
|
First Financial Bancorp 2011 Annual Report 79
Notes To Consolidated Financial Statements
Covered Loans – In accordance with the accounting guidance for business combinations, there was no allowance brought forward on covered loans as any credit deterioration evident in the loans at the time of acquisition was included in the determination of the fair value of the loans at the acquisition date.
The majority of covered loans are accounted for under FASB ASC Topic 310-30, whereby First Financial is required to periodically re-estimate the expected cash flows on the loans. For purposes of applying the guidance under FASB ASC Topic 310-30, First Financial grouped acquired loans into pools based on common risk characteristics. Generally, a decline in expected cash flows for a pool of loans is referred to as impairment and recorded as provision expense, and a related allowance for loan and lease losses on covered loans, on a discounted basis during the period. Estimated reimbursements due from the FDIC under loss share agreements related to any declines in expected cash flows for a pool of loans are recorded as noninterest income and an increase to the FDIC indemnification asset in the same period. Improvement in expected cash flows for a pool of loans, once any previously recorded impairment is recaptured, is recognized prospectively as an adjustment to the yield on the loans in the pool and a related adjustment to the yield on the FDIC indemnification asset.
First Financial performs periodic valuation procedures to re-estimate the expected cash flows on covered loans accounted for under FASB ASC Topic 310-30 and compare the present value of expected cash flows to the carrying value of the loans at the pool level. In order to estimate expected cash flows, First Financial specifically reviews a sample of these covered loans each period to assist in the determination of appropriate probability of default and loss given default assumptions to be applied to the remainder of the portfolio. The estimate of expected cash flows may also be adjusted for management's estimate of probable losses on specific loan types dependent upon trends in observable market and industry data, such as prepayment speeds and collateral values. These cash flow evaluations are inherently subjective as they require material estimates, all of which may be susceptible to significant change.
First Financial continued to update the valuations related to covered loans during 2011 and, as a result of impairment in certain loan pools, recognized total provision expense of $64.1 million and realized net charge-offs of $37.7 million, resulting in an allowance of $42.8 million as of December 31, 2011. During 2010, the Company recognized total provision expense of $63.1 million and realized net charge-offs of $46.7 million, resulting in an ending allowance of $16.5 million. Additionally, the Company recognized loss share expenses of $12.8 million for 2011 and $1.5 million for 2010 primarily related to losses on covered OREO during the period. The receivable due from the FDIC under loss share agreements related to the covered provision expense and losses on covered OREO of $60.9 million for 2011 and $51.8 million for 2010 was recognized as FDIC loss sharing income and a corresponding increase to the FDIC indemnification asset.
The allowance for loan and lease losses on covered loans is presented in the tables below:
|
| | | | | | | | | | | | | | | | | | | | |
| | | December 31, 2011 |
| | | | | Real Estate | | | | |
| (Dollars in thousands) | | Commercial | | Commercial | | Residential | | Installment | | Total |
| Ending allowance on loans acquired with deteriorated credit quality (ASC 310-30) | | $ | 19,160 |
| | $ | 21,930 |
| | $ | 1,396 |
| | $ | 349 |
| | $ | 42,835 |
|
| Ending allowance on acquired loans outside the scope of ASC 310-30 | | 0 |
| | 0 |
| | 0 |
| | 0 |
| | 0 |
|
| Ending allowance on covered loans | | $ | 19,160 |
| | $ | 21,930 |
| | $ | 1,396 |
| | $ | 349 |
| | $ | 42,835 |
|
|
| | | | | | | | | | | | | | | | | | | | |
| | | December 31, 2010 |
| | | | | Real Estate | | | | |
| (Dollars in thousands) | | Commercial | | Commercial | | Residential | | Installment | | Total |
| Ending allowance on loans acquired with deteriorated credit quality (ASC 310-30) | | $ | 8,787 |
| | $ | 7,213 |
| | $ | 232 |
| | $ | 261 |
| | $ | 16,493 |
|
| Ending allowance on acquired loans outside the scope of ASC 310-30 | | 0 |
| | 0 |
| | 0 |
| | 0 |
| | 0 |
|
| Ending allowance on covered loans | | $ | 8,787 |
| | $ | 7,213 |
| | $ | 232 |
| | $ | 261 |
| | $ | 16,493 |
|
80 First Financial Bancorp 2011 Annual Report
Changes in the allowance for loan and lease losses on covered loans for the two years ended December 31 were as follows:
|
| | | | | | | | | |
| (Dollars in thousands) | | | 2011 | | 2010 |
| Balance at beginning of year | | | $ | 16,493 |
| | $ | 0 |
|
| Provision for loan and lease losses | | | 64,081 |
| | 63,144 |
|
| Loans charged-off | | | (45,604 | ) | | (46,992 | ) |
| Recoveries | | | 7,865 |
| | 341 |
|
| Balance at end of year | | | $ | 42,835 |
| | $ | 16,493 |
|
13. Premises and Equipment
Premises and equipment at December 31 were as follows:
|
| | | | | | | |
| (Dollars in thousands) | 2011 | | 2010 |
| Land and land improvements | $ | 41,160 |
| | $ | 35,487 |
|
| Buildings | 104,835 |
| | 99,823 |
|
| Furniture and fixtures | 57,857 |
| | 54,384 |
|
| Leasehold improvements | 11,526 |
| | 9,160 |
|
| Construction in progress | 13,502 |
| | 3,951 |
|
| | 228,880 |
| | 202,805 |
|
| | | | |
| Less accumulated depreciation and amortization | 90,784 |
| | 84,328 |
|
| Total | $ | 138,096 |
| | $ | 118,477 |
|
Rental expense recorded under operating leases in 2011, 2010, and 2009, was $9.5 million, $9.2 million, and $7.7 million, respectively.
First Financial's future minimum lease payments for operating leases are as follows:
|
| | | |
(Dollars in thousands) | December 31, 2011 |
| 2012 | $ | 8,155 |
|
| 2013 | 7,295 |
|
| 2014 | 6,302 |
|
| 2015 | 5,774 |
|
| 2016 | 4,744 |
|
| Thereafter | 22,955 |
|
| Total | $ | 55,225 |
|
First Financial Bancorp 2011 Annual Report 81
Notes To Consolidated Financial Statements
14. Borrowings
The following is a summary of short-term borrowings for the last three years:
|
| | | | | | | | | | | | | | | | | | | | |
| | 2011 | | 2010 | | 2009 |
| (Dollars in thousands) | Amount | | Rate | | Amount | | Rate | | Amount | | Rate |
| At December 31, | | | | | | | | | | | |
| Federal funds purchased and securities sold under agreements to repurchase | $ | 99,431 |
| | 0.10 | % | | $ | 59,842 |
| | 0.20 | % | | $ | 37,430 |
| | 0.19 | % |
| Federal Home Loan Bank borrowings | 0 |
| | N/A |
| | 0 |
| | N/A |
| | 0 |
| | N/A |
|
| Other short-term borrowings | 0 |
| | N/A |
| | 0 |
| | N/A |
| | 0 |
| | N/A |
|
| Total | $ | 99,431 |
| | 0.10 | % | | $ | 59,842 |
| | 0.20 | % | | $ | 37,430 |
| | 0.19 | % |
| | | | | | | | | | | | |
| Average for the year | | | | | | | | | | | |
| Federal funds purchased and securities sold under agreements to repurchase | $ | 96,060 |
| | 0.17 | % | | $ | 47,531 |
| | 0.20 | % | | $ | 99,865 |
| | 0.25 | % |
| Federal Home Loan Bank borrowings | 0 |
| | N/A |
| | 0 |
| | N/A |
| | 114,636 |
| | 0.37 | % |
| Other short-term borrowings | 0 |
| | N/A |
| | 0 |
| | N/A |
| | 29,512 |
| | 2.20 | % |
| Total | $ | 96,060 |
| | 0.17 | % | | $ | 47,531 |
| | 0.20 | % | | $ | 244,013 |
| | 0.54 | % |
| | | | | | | | | | | | |
| Maximum month-end balances | | | | | | | | | | | |
| Federal funds purchased and securities sold under agreements to repurchase | $ | 105,291 |
| | | | $ | 64,995 |
| | | | $ | 240,557 |
| | |
| Federal Home Loan Bank borrowings | 0 |
| | | | 0 |
| | | | 250,000 |
| | |
| Other short-term borrowings | 0 |
| | | | 0 |
| | | | 58,000 |
| | |
Repurchase Agreements are utilized for corporate sweep accounts with cash management account agreements in place. All are subject to the terms and conditions of Repurchase/Security Agreements between First Financial Bank and the client. To secure the Bank's liability to the client, First Financial Bank is authorized to sell or repurchase U.S. Treasury, government agency, and mortgage-backed securities.
First Financial previously maintained a short-term revolving credit facility with an unaffiliated bank. This facility provided First Financial an additional liquidity resource for various corporate activities, including the repurchase of First Financial shares and the payment of dividends to shareholders. First Financial determined that the credit facility was no longer necessary and elected not to renew it at its March 2010 annual renewal date given the cash position of the Company.
Long-term debt consists of FHLB long-term advances and repurchase agreements utilizing investment securities pledged as collateral. These instruments are primarily utilized to reduce overnight liquidity risk and to mitigate interest rate sensitivity on the Consolidate Balance Sheets. First Financial has $65.0 million in repurchase agreements which have remaining maturities of between one and four years and a weighted average rate of 3.50%. Securities pledged as collateral in conjunction with the repurchase agreements are included within Investment securities available-for-sale on the Consolidated Balance Sheets. First Financial assumed additional FHLB long-term advances in the Peoples and Irwin acquisitions of $63.5 million and $216.3 million, respectively. During the third quarter of 2010, approximately $232.0 million of these advances were prepaid. These advances had a weighted average maturity of 5.5 years, an effective duration of 3.3 years, and a weighted average effective yield of 2.08% after adjusting for the impact of purchase accounting. The funding for the prepayments consisted entirely of interest-bearing deposits with other banks that were previously earning 0.25%. As of December 31, 2011, the remaining FHLB long-term advances assumed in the transactions totaled $1.7 million, had remaining maturities of less than eight years, and a weighted average effective yield of 3.79%.
FHLB advances, both short-term and long-term, must be collateralized with qualifying assets, typically certain commercial and residential real estate loans, as well as certain government and agency securities. For ease of borrowing execution, First Financial utilizes a blanket collateral agreement with the FHLB, and at December 31, 2011, had collateral available with a book value of $1.1 billion.
82 First Financial Bancorp 2011 Annual Report
The following is a summary of First Financial's long-term debt:
|
| | | | | | | | | | | | | |
| | 2011 | | 2010 |
(Dollars in thousands) | Amount | | Average Rate | | Amount | | Average Rate |
| Federal Home Loan Bank | $ | 11,544 |
| | 3.80 | % | | $ | 63,880 |
| | 3.79 | % |
| National Market Repurchase Agreement | 65,000 |
| | 3.50 | % | | 65,000 |
| | 3.50 | % |
| Total long-term debt | $ | 76,544 |
| | 3.55 | % | | $ | 128,880 |
| | 3.64 | % |
As of December 31, 2011, the long-term debt matures as follows:
|
| | | | | | | |
(Dollars in thousands) | FHLB | | Repurchase Agreement |
| 2012 | $ | 29 |
| | $ | 0 |
|
| 2013 | 29 |
| | 12,500 |
|
| 2014 | 28 |
| | 27,500 |
|
| 2015 | 28 |
| | 25,000 |
|
| 2016 | 28 |
| | 0 |
|
| Thereafter | 11,402 |
| | 0 |
|
| Total | $ | 11,544 |
| | $ | 65,000 |
|
Other long-term debt on the Consolidated Balance Sheets previously consisted of junior subordinated debentures owed to unconsolidated subsidiary trusts. Capital securities were issued in the third quarter of 2003 by a statutory business trust, First Financial (OH) Statutory Trust II (Trust II). These debentures were first eligible for early redemption by First Financial in September 2008 and were fully redeemed on June 30, 2011.
The debenture qualified as Tier I capital under Federal Reserve Board guidelines, but had been limited to 25% of qualifying Tier I capital. After the early redemption, the Company has the capacity to issue approximately $161.7 million in additional qualifying debentures under these guidelines.
15. Income Taxes
Income tax expense consisted of the following components:
|
| | | | | | | | | | | |
| (Dollars in thousands) | 2011 | | 2010 | | 2009 |
| Current expense | | | | | |
| Federal | $ | 46,270 |
| | $ | 38,572 |
| | $ | 14,740 |
|
| State | 6,493 |
| | 5,590 |
| | 1,500 |
|
| Total | 52,763 |
| | 44,162 |
| | 16,240 |
|
| Deferred (benefit) expense | | | | | |
| Federal | (12,836 | ) | | (10,170 | ) | | 103,218 |
|
| State | (1,627 | ) | | (1,290 | ) | | 13,181 |
|
| Total | (14,463 | ) | | (11,460 | ) | | 116,399 |
|
| Income tax expense | $ | 38,300 |
| | $ | 32,702 |
| | $ | 132,639 |
|
First Financial Bancorp 2011 Annual Report 83
Notes To Consolidated Financial Statements
The difference between the federal income tax rates, applied to income before income taxes, and the effective rates were due to the following:
|
| | | | | | | | | | | |
| (Dollars in thousands) | 2011 | | 2010 | | 2009 |
| Income taxes computed at federal statutory rate (35%) on income before income taxes | $ | 36,763 |
| | $ | 32,183 |
| | $ | 123,891 |
|
| Tax-exempt income | (586 | ) | | (519 | ) | | (754 | ) |
| Bank-owned life insurance | (612 | ) | | (581 | ) | | (255 | ) |
| Tax credits | (1,200 | ) | | (1,596 | ) | | (380 | ) |
| State income taxes, net of federal tax benefit | 3,163 |
| | 2,795 |
| | 9,542 |
|
| Other | 772 |
| | 420 |
| | 595 |
|
| Income tax expense | $ | 38,300 |
| | $ | 32,702 |
| | $ | 132,639 |
|
The major components of the temporary differences that give rise to deferred tax assets and liabilities at December 31, 2011, and 2010, were as follows:
|
| | | | | | | |
| (Dollars in thousands) | 2011 | | 2010 |
| Deferred tax assets | | | |
| Allowance for loan and lease losses | $ | 36,030 |
| | $ | 27,841 |
|
| Deferred compensation | 556 |
| | 359 |
|
| Mark to market adjustment on loans and derivatives | 177 |
| | 227 |
|
| Postretirement benefits other than pension liability | 141 |
| | 156 |
|
| Accrued stock-based compensation | 1,493 |
| | 1,198 |
|
| Other reserves | 219 |
| | 392 |
|
| Accrued expenses | 4,521 |
| | 2,714 |
|
| Other | 2,332 |
| | 1,019 |
|
| Total deferred tax assets | 45,469 |
| | 33,906 |
|
| | | | |
| Deferred tax liabilities | | | |
| Tax depreciation greater than book depreciation | (8,251 | ) | | (8,881 | ) |
| FHLB and FRB stock | (17,060 | ) | | (19,716 | ) |
| Mortgage-servicing rights | (339 | ) | | (567 | ) |
| Leasing activities | (676 | ) | | (4 | ) |
| Deferred section 597 gain | (62,421 | ) | | (83,229 | ) |
| Prepaid pension | (1,454 | ) | | (3,995 | ) |
| Intangible assets | (7,536 | ) | | (5,872 | ) |
| Deferred loan fees and costs | (1,472 | ) | | (862 | ) |
| Prepaid expenses | (1,310 | ) | | (1,080 | ) |
| Net unrealized gains on securities available-for-sale and derivatives | (7,687 | ) | | (5,263 | ) |
| Fair value adjustments on acquisitions | (14,945 | ) | | (2,439 | ) |
| Other | (1,278 | ) | | (796 | ) |
| Total deferred tax liabilities | (124,429 | ) | | (132,704 | ) |
| Total net deferred tax liability | $ | (78,960 | ) | | $ | (98,798 | ) |
At December 31, 2011, and 2010, First Financial had no FASB ASC Topic 740-10 unrecognized tax benefits recorded. First Financial does not expect the total amount of unrecognized tax benefits to significantly increase within the next twelve months.
First Financial recognizes interest and penalties on income tax assessments or income tax refunds in the Consolidated Financial Statements as a component of noninterest expense.
First Financial and its subsidiaries are subject to U.S. federal income tax as well as state and local income tax in several jurisdictions. Tax years prior to 2008 have been closed and are no longer subject to U.S. federal income tax examinations. The tax year 2009 is currently under examination by the federal taxing authority. At this time, First Financial is not aware of any
84 First Financial Bancorp 2011 Annual Report
material impact to the Company's financial position and results of operations as a result of this examination. Tax year 2010 remains open to examination by the federal taxing authority.
First Financial is no longer subject to state and local income tax examinations for years prior to 2008. Tax years 2008 through 2010 remain open to state and local examination by various other jurisdictions.
16. Accumulated Other Comprehensive Income (Loss)
Shareholders’ equity is affected by transactions and valuations of asset and liability positions that require adjustments to accumulated other comprehensive income (loss). The related tax effects allocated to other comprehensive income and accumulated other comprehensive income (loss) are as follows:
|
| | | | | | | | | | | | | | | | |
| | | December 31, 2011 |
| | | Transactions | | |
| (Dollars in thousands) | | Pre-tax | | Tax-effect | | Net of tax | | Balances Net of tax |
| Unrealized gain on securities available-for-sale | | $ | 5,792 |
| | $ | (2,187 | ) | | $ | 3,605 |
| | $ | 12,669 |
|
| Unrealized loss on derivatives | | 628 |
| | (237 | ) | | 391 |
| | 0 |
|
| Retirement obligation | | (20,652 | ) | | 7,798 |
| | (12,854 | ) | | (34,136 | ) |
| Foreign currency translation | | (588 | ) | | 0 |
| | (588 | ) | | (23 | ) |
| Total | | $ | (14,820 | ) | | $ | 5,374 |
| | $ | (9,446 | ) | | $ | (21,490 | ) |
|
| | | | | | | | | | | | | | | | |
| | | December 31, 2010 |
| | | Transactions | | |
| (Dollars in thousands) | | Pre-tax | | Tax-effect | | Net of tax | | Balances Net of tax |
| Unrealized gain on securities available-for-sale | | $ | (1,485 | ) | | $ | 325 |
| | $ | (1,160 | ) | | $ | 9,064 |
|
| Unrealized loss on derivatives | | (2,089 | ) | | 767 |
| | (1,322 | ) | | (391 | ) |
| Retirement obligation | | (46 | ) | | 525 |
| | 479 |
| | (21,282 | ) |
| Foreign currency translation | | 446 |
| | 0 |
| | 446 |
| | 565 |
|
| Total | | $ | (3,174 | ) | | $ | 1,617 |
| | $ | (1,557 | ) | | $ | (12,044 | ) |
|
| | | | | | | | | | | | | | | | |
| | | December 31, 2009 |
| | | Transactions | | |
| (Dollars in thousands) | | Pre-tax | | Tax-effect | | Net of tax | | Balances Net of tax |
| Unrealized gain on securities available-for-sale | | $ | 5,138 |
| | $ | (1,853 | ) | | $ | 3,285 |
| | $ | 10,224 |
|
| Unrealized loss on derivatives | | 251 |
| | (89 | ) | | 162 |
| | 931 |
|
| Retirement obligation | | (3,310 | ) | | 1,162 |
| | (2,148 | ) | | (21,761 | ) |
| Foreign currency translation | | 119 |
| | 0 |
| | 119 |
| | 119 |
|
| Total | | $ | 2,198 |
| | $ | (780 | ) | | $ | 1,418 |
| | $ | (10,487 | ) |
First Financial Bancorp 2011 Annual Report 85
Notes To Consolidated Financial Statements
17. Capital
Risk-Based Capital. First Financial and its subsidiary, First Financial Bank, are subject to regulatory capital requirements administered by federal banking agencies. Capital adequacy guidelines and, additionally for banks, prompt corrective action regulations involve quantitative measures of assets, liabilities, and certain off-balance sheet items calculated under regulatory accounting practices. Capital amounts and classifications are also subject to qualitative judgments by regulators. Failure to meet minimum capital requirements can initiate regulatory action.
Quantitative measures established by regulation to ensure capital adequacy require First Financial to maintain minimum amounts and ratios (as defined in the regulations and set forth in the table below) of Total and Tier 1 capital to risk-weighted assets and to average assets, respectively. Management believes that, as of December 31, 2011, First Financial meets all capital adequacy requirements to which it is subject. At December 31, 2011 and 2010, regulatory notifications categorized First Financial as well-capitalized under the regulatory framework for prompt corrective action. To be categorized as well-capitalized, First Financial must maintain minimum Total risk-based capital, Tier 1 risk-based capital, and Tier 1 leverage ratios as set forth in the table below. There have been no conditions or events since those notifications that management believes has changed the Company's category.
First Financial's Tier 1 capital is comprised of total shareholders' equity and prior to June 30, 2011 included junior subordinated debentures, less unrealized gains and losses on investment securities available-for-sale accounted for under FASB ASC Topic 320, Investments-Debt and Equity Securities, and any amounts resulting from the application of FASB ASC Topic 715, Compensation-Retirement Benefits, that is recorded within accumulated other comprehensive income (loss), intangible assets, and any valuation related to mortgage servicing rights. Total risk-based capital consists of Tier 1 capital plus the qualifying allowance for loan and lease losses and gross unrealized gains on equity securities.
For purposes of calculating the leverage ratio, average assets represents quarterly average assets less assets ineligible for total risk-based capital including all or portions of intangibles, mortgage servicing assets and allowance for loan and lease losses.
Actual and required capital amounts and ratios at year-end are presented in the table that follows.
|
| | | | | | | | | | | | | | | | | | | | |
| | Actual | | For Capital Adequacy Purposes | | To Be Well Capitalized Under Prompt Corrective Action Provisions |
| (Dollars in thousands) | Amount | | Ratio | | Amount | | Ratio | | Amount | | Ratio |
| December 31, 2011 | | | | | | | | | | | |
| Total capital to risk-weighted assets | | | | | | | | | | | |
| Consolidated | $ | 683,255 |
| | 18.74 | % | | $ | 291,632 |
| | 8.00 | % | | N/A |
| | N/A |
|
| First Financial Bank | 578,042 |
| | 15.89 | % | | 290,992 |
| | 8.00 | % | | $ | 363,740 |
| | 10.00 | % |
| | | | | | | | | | | | |
| Tier 1 capital to risk-weighted assets | | | | | | | | | | | |
| Consolidated | 636,836 |
| | 17.47 | % | | 145,816 |
| | 4.00 | % | | N/A |
| | N/A |
|
| First Financial Bank | 524,363 |
| | 14.42 | % | | 145,496 |
| | 4.00 | % | | 218,244 |
| | 6.00 | % |
| | | | | | | | | | | | |
| Tier 1 capital to average assets | | | | | | | | | | | |
| Consolidated | 636,836 |
| | 9.87 | % | | 258,122 |
| | 4.00 | % | | N/A |
| | N/A |
|
| First Financial Bank | 524,363 |
| | 8.13 | % | | 258,035 |
| | 4.00 | % | | 322,543 |
| | 5.00 | % |
86 First Financial Bancorp 2011 Annual Report
|
| | | | | | | | | | | | | | | | | | | | |
| | Actual | | For Capital Adequacy Purposes | | To Be Well Capitalized Under Prompt Corrective Action Provisions |
| (Dollars in thousands) | Amount | | Ratio | | Amount | | Ratio | | Amount | | Ratio |
| December 31, 2010 | | | | | | | | | | | |
| Total capital to risk-weighted assets | | | | | | | | | | | |
| Consolidated | $ | 727,252 |
| | 19.72 | % | | $ | 294,978 |
| | 8.00 | % | | N/A |
| | N/A |
|
| First Financial Bank | 600,911 |
| | 16.36 | % | | 293,930 |
| | 8.00 | % | | $ | 367,412 |
| | 10.00 | % |
| | | | | | | | | | | | |
| Tier 1 capital to risk-weighted assets | | | | | | | | | | | |
| Consolidated | 680,145 |
| | 18.45 | % | | 147,489 |
| | 4.00 | % | | N/A |
| | N/A |
|
| First Financial Bank | 546,726 |
| | 14.88 | % | | 146,965 |
| | 4.00 | % | | 220,447 |
| | 6.00 | % |
| | | | | | | | | | | | |
| Tier 1 capital to average assets | | | | | | | | | | | |
| Consolidated | 680,145 |
| | 10.89 | % | | 248,847 |
| | 4.00 | % | | N/A |
| | N/A |
|
| First Financial Bank | 546,726 |
| | 8.75 | % | | 248,437 |
| | 4.00 | % | | 310,546 |
| | 5.00 | % |
Shelf Registrations. On February 2, 2010, First Financial completed a public offering of 6,400,000 shares of its common stock adding $91.2 million of additional common equity after offering related costs. This public offering completed the issuance of common shares available to be offered pursuant to a prospectus supplement and base prospectus filed as part of an existing shelf registration statement, filed with the Securities and Exchange Commission (SEC) on Form S-3.
On April 28, 2011, First Financial filed a shelf registration on Form S-3 with the SEC. This shelf registration allows First Financial to raise capital from time to time through the sale of various types of securities, subject to approval by the Company's board of directors.
Capital Purchase Program. In December 2008, First Financial completed the sale of $80.0 million in perpetual preferred securities to the U.S. Department of the Treasury (Treasury) under its Capital Purchase Program (CPP), as a component of its Troubled Asset Relief Program (TARP). The preferred shares paid a cumulative dividend of 5.00% per year for the first 5 years and reset to a rate of 9.00% per year thereafter. The dividends were payable quarterly in arrears. The preferred shares were non-voting, other than class voting rights on certain matters that could adversely affect the Senior Preferred Shares. They were also callable by First Financial at the par value of $1,000 per share, subject to consultation with First Financial’s primary regulator, the Office of the Comptroller of the Currency and with the approval of the Treasury. The Treasury could also transfer the Senior Preferred Shares to a third party at any time.
In conjunction with the purchase of the preferred shares, the Treasury received a warrant to purchase 930,233 common shares. The warrant has a term of 10 years. The Treasury agreed not to exercise voting power with respect to the common shares that it would acquire upon exercise of the warrant. As a result of the Company’s common equity raised during the second quarter of 2009, the number of common shares eligible for purchase under the warrant was reduced by 50% to 465,117 shares. On February 24, 2010, First Financial redeemed all of the $80.0 million of senior preferred shares issued to the Treasury in December 2008 under the CPP. First Financial did not repurchase the warrant at that time. In June 2010, Treasury conducted an auction of the warrant in which the warrant was sold in a public offering at a price of $6.70 per warrant. This transaction represented the final step in the redemption process and the Treasury no longer owns any securities issued by First Financial.
First Financial Bancorp 2011 Annual Report 87
Notes To Consolidated Financial Statements
18. Employee Benefit Plans
First Financial sponsors a non-contributory defined benefit pension plan covering substantially all employees and uses a December 31 measurement date for its defined benefit pension plan.
First Financial made no cash contributions to the pension plan in 2011. First Financial does not expect to make a cash contribution to its pension plan in 2012. As a result of the plan’s funding status and related actuarial projections for 2011, First Financial recorded income in 2011 of $1.3 million, compared to expense of $2.0 million for 2010 and $0.9 million for 2009.
The following tables set forth information concerning amounts recognized in First Financial's Consolidated Balance Sheets and Consolidated Statements of Income:
|
| | | | | | | | |
| | | December 31, |
| (Dollars in thousands) | | 2011 | | 2010 |
| Change in benefit obligation | | | | |
| Benefit obligation at beginning of year | | $ | 52,312 |
| | $ | 47,996 |
|
| Service cost | | 3,177 |
| | 2,590 |
|
| Interest cost | | 2,723 |
| | 2,711 |
|
| Actuarial loss | | 9,180 |
| | 2,542 |
|
| Benefits paid, excluding settlement | | (3,482 | ) | | (3,527 | ) |
| Benefit obligation at end of year | | 63,910 |
| | 52,312 |
|
| | | | | |
| Change in plan assets | | | | |
| Fair value of plan assets at beginning of year | | 122,677 |
| | 60,418 |
|
| Actual return on plan assets | | (4,223 | ) | | 5,786 |
|
| Employer contribution | | 0 |
| | 60,000 |
|
| Benefits paid, excluding settlement | | (3,482 | ) | | (3,527 | ) |
| Fair value of plan assets at end of year | | 114,972 |
| | 122,677 |
|
| | | | | |
| Amounts recognized in the Consolidated Balance Sheets | | | | |
| Assets | | 51,062 |
| | 70,365 |
|
| Liabilities | | 0 |
| | 0 |
|
| Net amount recognized | | $ | 51,062 |
| | $ | 70,365 |
|
| | | | | |
| Amounts recognized in accumulated other comprehensive income (loss) | | | | |
| Net actuarial loss | | $ | 59,390 |
| | $ | 39,160 |
|
| Net prior service cost | | (4,542 | ) | | (4,965 | ) |
| Deferred tax assets | | (20,712 | ) | | (12,913 | ) |
| Net amount recognized | | $ | 34,136 |
| | $ | 21,282 |
|
| | | | | |
| Change in accumulated other comprehensive income (loss) | | $ | 12,854 |
| | $ | (479 | ) |
| | | | | |
| Accumulated benefit obligation | | $ | 60,485 |
| | $ | 49,619 |
|
88 First Financial Bancorp 2011 Annual Report
|
| | | | | | | | | | | | |
| Components of net periodic benefit cost | | | | | | |
| | | December 31, |
| (Dollars in thousands) | | 2011 | | 2010 | | 2009 |
| Service cost | | $ | 3,177 |
| | $ | 2,590 |
| | $ | 2,301 |
|
| Interest cost | | 2,723 |
| | 2,711 |
| | 2,704 |
|
| Expected return on assets | | (9,020 | ) | | (4,932 | ) | | (5,273 | ) |
| Amortization of prior service cost | | (423 | ) | | (423 | ) | | (423 | ) |
| Recognized net actuarial loss | | 2,194 |
| | 2,065 |
| | 1,605 |
|
| Net periodic benefit (income) cost | | (1,349 | ) | | 2,011 |
| | 914 |
|
| | | | | | | |
| Other changes recognized in accumulated other comprehensive income | | | | |
| Net actuarial loss | | 22,423 |
| | 1,688 |
| | 4,492 |
|
| Amortization of prior service cost | | 423 |
| | 423 |
| | 423 |
|
| Amortization of gain | | (2,194 | ) | | (2,065 | ) | | (1,605 | ) |
| Total recognized in accumulated other comprehensive income | | 20,652 |
| | 46 |
| | 3,310 |
|
| Total recognized in net periodic benefit cost and accumulated other comprehensive income | | $ | 19,303 |
| | $ | 2,057 |
| | $ | 4,224 |
|
| | | | | | | |
| Amount expected to be recognized in net periodic pension expense in the coming year | | | | |
| Amortization of loss | | $ | 3,039 |
| | $ | 2,191 |
| | $ | 2,055 |
|
| Amortization of prior service credit | | (423 | ) | | (423 | ) | | (423 | ) |
|
| | | | | | |
| Weighted-average assumptions to determine | | | | |
| | | December 31, |
| | | 2011 | | 2010 |
| Benefit obligations | | | | |
| Discount rate | | 4.22 | % | | 5.36 | % |
| Rate of compensation increase | | 3.50 | % | | 3.50 | % |
| | | | | |
| Net periodic benefit cost | | | | |
| Discount rate | | 5.36 | % | | 5.88 | % |
| Expected return on plan assets | | 7.50 | % | | 7.50 | % |
| Rate of compensation increase | | 3.50 | % | | 3.50 | % |
The determination of the overall expected long-term return on plan assets was based on the composition of plan assets and a consensus of estimates from similarly managed portfolios of expected future returns.
Plan assets are administered and managed by the Wealth Management division of First Financial Bank, N.A. Plan assets are invested in a broad range of equity, fixed income, and cash securities, consisting entirely of publicly traded individual stocks and bonds and publicly traded mutual funds and exchange traded funds.
The pension plan does not directly own any shares of First Financial common stock or any other First Financial security or product.
The investment objective of the Plan is to structure the assets to, as much as feasible, mirror the liabilities of the Plan. The current target asset allocation set by the Bank for the Plan is 60% equities and 40% fixed income, with the aim to use the fixed income component to match the identified near term and long term plan distributions and the equity component to generate growth of capital to meet other future Plan liabilities.
First Financial Bancorp 2011 Annual Report 89
Notes To Consolidated Financial Statements
The fair value of the plan assets as of December 31, 2011 by asset category is shown in the table that follows.
|
| | | | | | | | | | | | | | | | |
| | | Fair Value Measurements |
| (Dollars in thousands) | | Total | | Quoted Prices in Active Markets for Identical Assets (Level 1) | | Significant Observable Inputs (Level 2) | | Significant Unobservable Inputs (Level 3) |
| Asset Category | | | | | | | | |
| Money market fund | | $ | 1,551 |
| | $ | 1,551 |
| | $ | 0 |
| | $ | 0 |
|
| U.S. Treasury securities | | 3,745 |
| | 0 |
| | 3,745 |
| | 0 |
|
| Securities of U.S. government agencies and corporations | | 2,019 |
| | 0 |
| | 2,019 |
| | 0 |
|
| Corporate bonds | | 7,249 |
| | 0 |
| | 7,249 |
| | 0 |
|
| Equity securities: | | | | | | | | |
| Common stock | | 19,368 |
| | 19,368 |
| | 0 |
| | 0 |
|
| Mutual funds | | 63,106 |
| | 63,106 |
| | 0 |
| | 0 |
|
| Exchange traded funds | | 17,756 |
| | 17,756 |
| | 0 |
| | 0 |
|
| Total | | $ | 114,794 |
| | $ | 101,781 |
| | $ | 13,013 |
| | $ | 0 |
|
The fair value of the plan assets as of December 31, 2010 by asset category is shown below.
|
| | | | | | | | | | | | | | | | |
| | | Fair Value Measurements |
| (Dollars in thousands) | | Total | | Quoted Prices in Active Markets for Identical Assets (Level 1) | | Significant Observable Inputs (Level 2) | | Significant Unobservable Inputs (Level 3) |
| Asset Category | | | | | | | | |
| Money market fund | | $ | 60,967 |
| | $ | 60,967 |
| | $ | 0 |
| | $ | 0 |
|
| U.S. Treasury securities | | 494 |
| | 0 |
| | 494 |
| | 0 |
|
| Corporate bonds | | 3,078 |
| | 0 |
| | 3,078 |
| | 0 |
|
| Equity securities: | | | | | | | | |
| Common stock | | 1,594 |
| | 1,594 |
| | 0 |
| | 0 |
|
| Mutual funds | | 48,141 |
| | 48,141 |
| | 0 |
| | 0 |
|
| Exchange traded funds | | 8,350 |
| | 8,350 |
| | 0 |
| | 0 |
|
| Total | | $ | 122,624 |
| | $ | 119,052 |
| | $ | 3,572 |
| | $ | 0 |
|
The asset’s or liability’s fair value measurement level within the fair value hierarchy is based on the lowest level of any input that is significant to the fair value measurement. See Note 22 – Fair Value Disclosures for further information related to the framework for measuring fair value and the fair value hierarchy.
The following benefit payments, which reflect expected future service, as appropriate, are expected to be paid:
|
| | | | |
| (Dollars in thousands) | | Retirement Benefits |
| 2012 | | $ | 4,908 |
|
| 2013 | | 5,274 |
|
| 2014 | | 5,146 |
|
| 2015 | | 4,677 |
|
| 2016 | | 9,621 |
|
| Thereafter | | 28,858 |
|
90 First Financial Bancorp 2011 Annual Report
First Financial also sponsors a defined contribution 401(k) thrift plan which covers substantially all employees. Employees may contribute up to 50.0% of their earnings into the plan, not to exceed applicable limitations prescribed by the Internal Revenue Service. First Financial contributes $1.00 for every $1.00 an employee contributes up to 3.00% of the employee's earnings and then contributes $0.50 for every $1.00 thereafter, up to a maximum First Financial total contribution of 5.00% of the employee's earnings. All First Financial matching contributions vest immediately. First Financial contributions to the 401(k) plan are at the discretion of the board of directors. Total First Financial contributions to the 401(k) plan were $2.7 million during 2011, $2.6 million during 2010, and $1.7 million during 2009.
First Financial has purchased bank-owned life insurance on certain of its employees. The cash surrender value of these policies is carried as an asset on the Consolidated Balance Sheets in Accrued interest and other assets. The carrying value was $85.9 million and $85.1 million at December 31, 2011, and 2010, respectively.
19. Earnings Per Common Share
The following table sets forth the computation of basic and diluted earnings per share:
|
| | | | | | | | | | | | |
| (Dollars in thousands, except per share data) | | 2011 | | 2010 | | 2009 |
| Numerator for basic and diluted earnings per share -income available to common shareholders: | | | | | | |
| Net income | | $ | 66,739 |
| | $ | 59,251 |
| | $ | 221,337 |
|
| Dividends on preferred stock | | 0 |
| | 1,865 |
| | 3,578 |
|
| Income available to common shareholders | | $ | 66,739 |
| | $ | 57,386 |
| | $ | 217,759 |
|
| Denominator for basic earnings per share - weighted average shares | | 57,691,979 |
| | 56,969,491 |
| | 45,028,640 |
|
| Effect of dilutive securities — | | | | | | |
| Employee stock awards | | 907,428 |
| | 913,809 |
| | 508,507 |
|
| Warrants | | 93,798 |
| | 109,778 |
| | 19,721 |
|
| Denominator for diluted earnings per share - adjusted weighted average shares | | 58,693,205 |
| | 57,993,078 |
| | 45,556,868 |
|
| Earnings per share available to common shareholders | | | | | | |
| Basic | | $ | 1.16 |
| | $ | 1.01 |
| | $ | 4.84 |
|
| Diluted | | $ | 1.14 |
| | $ | 0.99 |
| | $ | 4.78 |
|
Stock options and warrants, where the exercise price was greater than the average market price of the common shares, were not included in the computation of net income per diluted share as they would have been antidilutive. These out-of-the-money options were 420,076, 41,426, and 1,833,037 at December 31, 2011, 2010, and 2009, respectively. The warrants to purchase 465,117 shares of common stock were outstanding as of December 31, 2011, 2010, and 2009, respectively.
20. Stock Options And Awards
First Financial follows the provisions of FASB ASC Topic 718, Compensation-Stock Compensation, which requires measurement of compensation cost for all stock-based awards at fair value on the date of grant and recognition of compensation expense over the service period for all awards expected to vest. Share-based compensation expense for stock options and restricted stock awards included in salaries and employee benefits expense for the year ended December 31, 2011, and 2010, was $3.9 million and $3.1 million, respectively. Total unrecognized compensation cost related to nonvested share-based compensation was $5.5 million at December 31, 2011 and is expected to be recognized over a weighted average period of 1.9 years.
As of December 31, 2011, First Financial had four stock-based compensation plans. The 1999 Stock Incentive Plan provides incentive stock options and stock awards to certain key employees and non-qualified stock options to non-employee directors of First Financial for up to 7,507,500 common shares of First Financial. The options become exercisable at a rate of 25% per year on the anniversary date of the grant and remain outstanding for 10 years after the initial grant date. All options expire at the end of the exercise period. No additional options are available for grant under the 1999 plans. On June 15, 2009, the
First Financial Bancorp 2011 Annual Report 91
Notes To Consolidated Financial Statements
shareholders approved the 2009 Employee Stock Plan and the 2009 Non-Employee Director Plan that provides for the issuance of 1,500,000 shares and 75,000 shares, respectively.
First Financial utilizes the Black-Scholes valuation model to determine the fair value of its stock options. As well as the stock option strike price, the Black-Scholes valuation model requires the use of the following assumptions: the expected dividend yield based on historical dividend payouts; the expected stock price volatility based on the historical volatility of company stock for a period approximating the expected life of the options; the risk-free rate based on the U.S. Treasury yield curve in effect at the time of grant for periods corresponding with the expected life of the option; and the expected option life represented by the period of time the options are expected to be outstanding and is based on historical trends. No options were granted in 2011 or 2010. In 2009, the estimated fair value of the options granted, as well as the weighted average assumptions used in the computations were as follows:
|
| | | | |
| | | 2009 |
| Fair value of options granted | | $ | 1.76 |
|
| Expected dividend yield | | 4.20 | % |
| Expected volatility | | 0.283 |
|
| Risk-free interest rate | | 2.50 | % |
| Expected life | | 7.2 years |
|
Activity in the stock option plan for the year ended December 31, 2011, is summarized as follows:
|
| | | | | | | | | | | | | |
| (Dollars in thousands, except per share data) | | Number of shares | | Weighted Average Exercise Price | | Weighted Average Remaining Contractual Life | | Aggregate Intrinsic Value |
| Outstanding at beginning of year | | 2,613,658 |
| | $ | 14.03 |
| | | | |
| Granted | | 0 |
| | 0.00 |
| | | | |
| Exercised | | (158,285 | ) | | 13.59 |
| | | | |
| Forfeited or expired | | (90,447 | ) | | 15.59 |
| | | | |
| Outstanding at end of year | | 2,364,926 |
| | $ | 13.99 |
| | 5.0 years | | $ | 6,633 |
|
| Exercisable at end of year | | 2,034,833 |
| | $ | 14.38 |
| | 4.8 years | | $ | 4,982 |
|
Intrinsic value for stock options is defined as the difference between the current market value and the grant price. First Financial uses treasury shares purchased under the Company's share repurchase program to satisfy share-based exercises.
|
| | | | | | | | | | | | |
| | | 2011 | | 2010 | | 2009 |
| Total intrinsic value of options exercised | | $ | 477 |
| | $ | 1,862 |
| | $ | 0 |
|
| Cash received from exercises | | $ | 150 |
| | $ | 272 |
| | $ | 0 |
|
| Tax benefit from exercises | | $ | 1,421 |
| | $ | 1,033 |
| | $ | 0 |
|
Restricted stock awards have historically been recorded as deferred compensation, a component of shareholders' equity, at the fair value of these awards at the grant date and amortized on a straight-line basis to salaries and benefits expense over the specified vesting periods, which is currently three years for employees and non-employee directors, but was four years prior to April 2010 for employees only. For awards granted to non-employee directors through 2010, the vesting of the awards only required a service period to be met. For restricted stock awards granted to employees in 2005 through 2008, First Financial must have met a minimum performance threshold in order for the awards to vest. The minimum level of performance was the achievement of an annual return on average equity greater than or equal to the return on average equity of the twenty-fifth percentile of a national peer group for each respective vesting year. In subsequent years, an award that did not previously vest may vest if the average annual return on average equity for the grant period is greater than or equal to the average return on average equity of the twenty-fifth percentile of the national peer group for the grant period. The national peer group is the group of publicly traded bank holding companies between $3 billion and $10 billion in total assets for the reporting period. For stock awards granted in 2009 and later, there is no longer a performance threshold that must be met.
92 First Financial Bancorp 2011 Annual Report
Activity in restricted stock for the previous three years ended December 31 is summarized as follows:
|
| | | | | | | | | | | | | | | | | | | | | |
| | | 2011 | | 2010 | | 2009 |
| | | Number of shares | | Weighted Average of shares Fair Value | | Number of shares | | Weighted Average of shares Fair Value | | Number of shares | | Weighted Average of shares Fair Value |
| Nonvested at beginning of year | | 485,498 |
| | $ | 15.63 |
| | 401,934 |
| | $ | 12.05 |
| | 346,972 |
| | $ | 14.23 |
|
| Granted | | 261,356 |
| | 16.02 |
| | 235,964 |
| | 20.00 |
| | 219,695 |
| | 11.01 |
|
| Vested | | (200,525 | ) | | 14.87 |
| | (120,073 | ) | | 12.97 |
| | (131,508 | ) | | 14.84 |
|
| Forfeited | | (27,593 | ) | | 18.10 |
| | (32,327 | ) | | 12.93 |
| | (33,225 | ) | | 16.91 |
|
| Nonvested at end of year | | 518,736 |
| | $ | 15.99 |
| | 485,498 |
| | $ | 15.63 |
| | 401,934 |
| | $ | 12.05 |
|
The fair value of restricted stock is determined based on the number of shares granted and the quoted price of First Financial's common stock. The total fair value of restricted stock vested during 2011 was $3.0 million.
21. Loans to Related Parties
Activity of loans to directors, executive officers, principal holders of First Financial’s common stock, and certain related persons was as follows:
|
| | | | | | | | | | | | |
| (Dollars in thousands) | | 2011 | | 2010 | | 2009 |
| Beginning balance | | $ | 10,375 |
| | $ | 16,047 |
| | $ | 9,491 |
|
| Additions | | 1,297 |
| | 1,533 |
| | 7,042 |
|
| Deductions | | (1,073 | ) | | (7,205 | ) | | (486 | ) |
| Ending balance | | $ | 10,599 |
| | $ | 10,375 |
| | $ | 16,047 |
|
| Loans 90 days past due | | $ | 0 |
| | $ | 0 |
| | $ | 0 |
|
Related parties of First Financial, as defined above, were clients of and had transactions with subsidiaries of First Financial in the ordinary course of business during the periods noted above. Additional transactions may be expected in the ordinary course of business in the future. All outstanding loans, commitments, financing leases, transactions in money market instruments and deposit relationships included in such transactions were made on substantially the same terms, including interest rates and collateral, as those prevailing at the time for comparable transactions with others, and did not involve more than a normal risk of collectibility or present other unfavorable features.
22. Fair Value Disclosures
Fair Value Measurement
The fair value framework as disclosed in the Fair Value Measurements and Disclosure Topic of the FASB ASC Topic 825, Financial Instruments (Fair Value Topic) includes a hierarchy which focuses on prioritizing the inputs used in valuation techniques. The fair value hierarchy gives the highest priority to quoted prices in active markets for identical assets or liabilities (Level 1), a lower priority to observable inputs other than quoted prices in active markets for identical assets and liabilities (Level 2), and the lowest priority to unobservable inputs (Level 3). When determining the fair value measurements for assets and liabilities, First Financial looks to active markets to price identical assets or liabilities whenever possible and classifies such items in Level 1. When identical assets and liabilities are not traded in active markets, First Financial looks to market observable data for similar assets and liabilities and classifies such items as Level 2. Certain assets and liabilities are not actively traded in observable markets and First Financial must use alternative techniques, based on unobservable inputs, to determine the fair value and classifies such items as Level 3. The level within the fair value hierarchy is based on the lowest level of input that is significant in the fair value measurement.
The following methods, assumptions, and valuation techniques were used by First Financial to measure different financial assets and liabilities at fair value and in estimating its fair value disclosures for financial instruments.
First Financial Bancorp 2011 Annual Report 93
Notes To Consolidated Financial Statements
Cash and short-term investments. The carrying amounts reported in the Consolidated Balance Sheets for cash and short-term investments, such as federal funds sold, approximated the fair value of those instruments.
Investment securities. Investment securities classified as trading and available-for-sale are recorded at fair value on a recurring basis. Fair value measurement is based upon quoted market prices, when available (Level 1). If quoted market prices are not available, fair values are measured utilizing independent valuation techniques of identical or similar investment securities. First Financial compiles prices from various sources who may apply such techniques as matrix pricing to determine the value of identical or similar investment securities (Level 2). Matrix pricing is a mathematical technique widely used in the banking industry to value investment securities without relying exclusively on quoted prices for the specific investment securities but rather relying on the investment securities’ relationship to other benchmark quoted investment securities. Any investment securities not valued based upon the methods above are considered Level 3.
First Financial utilizes information provided by an investment securities portfolio manager in analyzing the investment securities portfolio in accordance with the fair value hierarchy of the Fair Value Topic. The portfolio manager’s evaluation of investment security portfolio pricing is performed using a combination of prices and data from other sources, along with internally developed matrix pricing models and assistance from the provider’s internal fixed income analysts and trading desk. The portfolio manager’s month-end pricing process includes a series of quality assurance activities where prices are compared to recent market conditions, previous evaluation prices, and between the various pricing services. These processes produce a series of quality assurance reports on which price exceptions are identified, reviewed, and where appropriate, securities are repriced. In the event of a materially different price, the portfolio manager will report the variance as a “price challenge” and review the pricing methodology in detail. The results of the quality assurance process are incorporated into the selection of pricing providers by the portfolio manager. First Financial reviews the reports provided by the portfolio manager and investigates unusual and significant valuation fluctuations.
Loans held for sale. Loans held for sale are carried at the lower of cost or market value. These loans currently consist of one-to-four family residential real estate loans originated for sale to qualified third parties. Fair value is based on the contractual price to be received from these third parties, which is not materially different than cost due to the short duration between origination and sale (Level 2). As such, First Financial records any fair value adjustments on a nonrecurring basis. Gains and losses on the sale of loans are recorded as net gains from sales of loans within noninterest income in the Consolidated Statements of Income.
Loans (excluding covered loans). The fair value of commercial, commercial real estate, residential real estate, and consumer loans were estimated by discounting the future cash flows using the current rates at which similar loans would be made to borrowers with similar credit ratings and for the same remaining maturities or repricing frequency. The carrying amount of accrued interest approximates its fair value.
Loans are designated as impaired when, in the judgment of management based on current information and events, it is probable that all amounts due according to the contractual terms of the loan agreement will not be collected. Impaired loans are valued at the lower of cost or market for purposes of determining the appropriate amount of impairment to be allocated to the allowance for loan and lease losses. Market value is measured based on the value of the collateral securing the loans. Collateral may be in the form of real estate or business assets including equipment, inventory, and accounts receivable. The vast majority of the collateral is real estate. The value of real estate collateral is determined utilizing an income or market valuation approach based on an appraisal conducted by an independent, licensed appraiser from outside of the Company (Level 2). The value of business equipment is based upon an outside appraisal if deemed significant, or the net book value on the applicable borrower financial statements if not considered significant. Likewise, values for inventory and accounts receivable collateral are based on borrower financial statement balances or aging reports (Level 3). Impaired loans allocated to the allowance for loan and lease losses are measured at fair value on a nonrecurring basis. Any fair value adjustments are recorded in the period incurred as provision for loan and lease losses on the Consolidated Statements of Income.
Covered loans. Fair values for covered loans accounted for under FASB ASC Topic 310-30 were based on a discounted cash flow methodology that considered factors including the type of loan and related collateral, classification status, fixed or variable interest rate, term of loan and whether or not the loan was amortizing, and a discount rate reflecting the Company's assessment of risk inherent in the cash flow estimates. These covered loans were grouped together according to similar characteristics and were treated in the aggregate when applying various valuation techniques. First Financial estimated the cash flows expected to be collected on these loans based upon the expected remaining life of the underlying loans, which includes the effects of estimated prepayments.
94 First Financial Bancorp 2011 Annual Report
Fair values for covered loans accounted for outside of FASB ASC Topic 310-30 were estimated by discounting the estimated future cash flows using current interest rates at which similar loans would be made to borrowers with similar credit ratings and for the same remaining maturities or repricing frequency. The carrying amount of accrued interest approximates its fair value.
These cash flow evaluations are inherently subjective as they require material estimates, all of which may be susceptible to significant change.
FDIC indemnification asset. The accounting for FDIC indemnification assets is closely related to the accounting for the underlying, indemnified assets. Fair value of the FDIC indemnification asset was estimated using projected cash flows related to the loss sharing agreements based on the expected reimbursements for losses and the applicable loss sharing percentages. First Financial re-estimates the expected indemnification asset cash flows in conjunction with the periodic re-estimation of cash flows on covered loans accounted for under FASB ASC Topic 310-30. Improvements in cash flow expectations on covered loans generally result in a related decline in the expected indemnification cash flows while declines in cash flow expectations on covered loans generally result in an increase in expected indemnification cash flows.
The expected cash flows are discounted to reflect the uncertainty of the timing and receipt of the loss sharing reimbursement from the FDIC. These cash flow evaluations are inherently subjective as they require material estimates, all of which may be susceptible to significant change.
Deposit liabilities. The fair value of demand deposits, savings accounts, and certain money-market deposits was the amount payable on demand at the reporting date. The carrying amounts for variable-rate certificates of deposit approximated their fair values at the reporting date. The fair value of fixed-rate certificates of deposit was estimated using a discounted cash flow calculation which applies the interest rates currently offered for deposits of similar remaining maturities. The carrying amount of accrued interest approximated its fair value.
Borrowings. The carrying amounts of federal funds purchased and securities sold under agreements to repurchase and other short-term borrowings approximated their fair values. The fair value of long-term debt was estimated using a discounted cash flow calculation which utilizes the interest rates currently offered for borrowings of similar remaining maturities. Third-party valuations were used for long-term debt with embedded options, such as call features.
Commitments to extend credit and standby letters of credit. Pricing of these financial instruments is based on the credit quality and relationship, fees, interest rates, probability of funding and compensating balance and other covenants or requirements. Loan commitments generally have fixed expiration dates, are variable rate and contain termination and other clauses which provide for relief from funding in the event that there is a significant deterioration in the credit quality of the client. Many loan commitments are expected to expire without being drawn upon. The rates and terms of the commitments to extend credit and the standby letters of credit are competitive with those in First Financial’s market area. The carrying amounts are reasonable estimates of the fair value of these financial instruments. Carrying amounts, which are comprised of the
unamortized fee income and, where necessary, reserves for any expected credit losses from these financial instruments, are immaterial.
Derivatives. First Financial utilizes interest rate swaps as a means to offer commercial borrowers products that meet their needs and also to achieve First Financial’s desired interest rate risk profile at the time. The net interest receivable or payable is accrued and recognized as an adjustment to the interest income or interest expense of the hedged item. The fair values of derivative instruments are based primarily on a net present value calculation of the cash flows related to the interest rate swaps using primarily observable market inputs such as interest rate yield curves. The discounted net present value calculated represents the cost to terminate the swap if First Financial should choose to do so on the applicable measurement date. Additionally, First Financial utilizes a vendor-developed, proprietary model to value the credit risk component of both the derivative assets and liabilities. The credit valuation adjustment is recorded as an adjustment to the fair value of the derivative asset or liability on the applicable measurement date (Level 2).
First Financial Bancorp 2011 Annual Report 95
Notes To Consolidated Financial Statements
The estimated fair values of First Financial’s financial instruments were as follows:
|
| | | | | | | | | | | | | | | | |
| | | 2011 | | 2010 |
| (Dollars in thousands) | | Carrying value | | Fair value | | Carrying value | | Fair value |
| Financial assets | | | | | | | | |
| Cash and short-term investments | | $ | 525,051 |
| | $ | 525,051 |
| | $ | 282,933 |
| | $ | 282,933 |
|
| Investment securities held-to-maturity | | 2,664 |
| | 2,893 |
| | 17,406 |
| | 18,066 |
|
| Investment securities available-for-sale | | 1,441,846 |
| | 1,441,846 |
| | 919,110 |
| | 919,110 |
|
| Other investments | | 71,492 |
| | 71,492 |
| | 78,689 |
| | 78,689 |
|
| Loans held for sale | | 24,834 |
| | 24,834 |
| | 29,292 |
| | 29,292 |
|
| Loans, excluding covered loans | | 2,915,871 |
| | 2,910,825 |
| | 2,758,858 |
| | 2,720,080 |
|
| Covered loans | | 1,010,409 |
| | 1,042,752 |
| | 1,465,000 |
| | 1,477,631 |
|
| FDIC indemnification asset | | 173,009 |
| | 151,114 |
| | 222,648 |
| | 212,431 |
|
| Accrued interest receivable | | 12,732 |
| | 12,732 |
| | 14,063 |
| | 14,063 |
|
| Derivative financial instruments | | 0 |
| | 0 |
| | 262 |
| | 262 |
|
| | | | | | | | | |
| Financial liabilities | | |
| | |
| | |
| | |
|
| Deposits | | |
| | |
| | |
| | |
|
| Noninterest-bearing | | $ | 946,180 |
| | $ | 946,180 |
| | $ | 705,484 |
| | $ | 705,484 |
|
| Interest-bearing demand | | 1,317,339 |
| | 1,317,339 |
| | 1,111,877 |
| | 1,111,877 |
|
| Savings | | 1,724,659 |
| | 1,724,659 |
| | 1,534,045 |
| | 1,534,045 |
|
| Time | | 1,654,662 |
| | 1,664,457 |
| | 1,794,843 |
| | 1,818,237 |
|
| Total deposits | | 5,642,840 |
| | 5,652,635 |
| | 5,146,249 |
| | 5,169,643 |
|
| Short-term borrowings | | 99,431 |
| | 99,431 |
| | 59,842 |
| | 59,842 |
|
| Long-term debt | | 76,544 |
| | 81,168 |
| | 128,880 |
| | 125,825 |
|
| Other long-term debt | | 0 |
| | 0 |
| | 20,620 |
| | 20,620 |
|
| Accrued interest payable | | 3,663 |
| | 3,663 |
| | 5,516 |
| | 5,516 |
|
| Derivative financial instruments | | 3,557 |
| | 3,557 |
| | 3,223 |
| | 3,223 |
|
The following table summarizes the financial assets and liabilities measured at fair value on a recurring basis at December 31, 2011:
|
| | | | | | | | | | | | | | | | | | | | |
| | | Fair Value Measurements Using | | Netting | | Assets/Liabilities |
| (Dollars in thousands) | | Level 1 | | Level 2 | | Level 3 | | Adjustments (1) | | at Fair Value |
| Assets | | | | | | | | | | |
| Derivatives | | $ | 0 |
| | $ | 24,566 |
| | $ | 0 |
| | $ | (24,566 | ) | | $ | 0 |
|
| Available-for-sale investment securities | | 141 |
| | 1,441,705 |
| | 0 |
| | 0 |
| | 1,441,846 |
|
| Total | | $ | 141 |
| | $ | 1,466,271 |
| | $ | 0 |
| | $ | (24,566 | ) | | $ | 1,441,846 |
|
| | | | | | | | | | | |
| Liabilities | | |
| | |
| | |
| | |
| | |
|
| Derivatives | | $ | 0 |
| | $ | 28,123 |
| | $ | 0 |
| | $ | (24,566 | ) | | $ | 3,557 |
|
| |
| (1) | Amounts represent the impact of legally enforceable master netting arrangements that allow First Financial to settle positive and negative positions and also cash collateral held with the same counterparties. |
96 First Financial Bancorp 2011 Annual Report
Certain financial assets and liabilities are measured at fair value on a nonrecurring basis. Adjustments to the fair market value of these assets usually result from the application of lower-of-cost-or-market accounting or write-downs of individual assets. The following table summarizes financial assets and liabilities measured at fair value on a nonrecurring basis at December 31, 2011:
|
| | | | | | | | | | | | | | | | |
| | | Fair Value Measurements Using | | |
| (Dollars in thousands) | | Level 1 | | Level 2 | | Level 3 | | Year-to-date Gains/(Losses) |
| Assets | | | | | | | | |
| Loans held for sale | | $ | 0 |
| | $ | 24,834 |
| | $ | 0 |
| | $ | 0 |
|
Impaired loans (1) | | 0 |
| | 20,017 |
| | 262 |
| | 0 |
|
(1) Amounts represent the fair value of collateral for impaired loans allocated to the allowance for loan and lease losses. Fair values are determined using actual market prices (Level 1), independent third party valuations, discounted as appropriate (Level 2), and borrower records discounted as appropriate (Level 3).
23. First Financial Bancorp. (Parent Company Only) Financial Information
Balance Sheets
|
| | | | | | | |
| | December 31, |
| (Dollars in thousands) | 2011 | | 2010 |
| Assets | | | |
| Cash | $ | 111,657 |
| | $ | 117,784 |
|
| Investment securities, available for sale | 2,682 |
| | 2,966 |
|
| Subordinated notes from subsidiaries | 7,500 |
| | 7,500 |
|
| Investment in subsidiaries | | | |
| Commercial banks | 573,295 |
| | 557,743 |
|
| Nonbanks | 18,659 |
| | 19,102 |
|
| Total investment in subsidiaries | 591,954 |
| | 576,845 |
|
| | | | |
| Loans | | | |
| Real estate – commercial | 0 |
| | 3,551 |
|
| Total loans | 0 |
| | 3,551 |
|
| Allowance for loan and lease losses | 0 |
| | 131 |
|
| Net loans | 0 |
| | 3,420 |
|
| Premises and equipment | 1,842 |
| | 2,038 |
|
| Other assets | 14,889 |
| | 15,078 |
|
| Total assets | $ | 730,524 |
| | $ | 725,631 |
|
| | | | |
| Liabilities | | | |
| Subordinated debentures | $ | 0 |
| | $ | 20,620 |
|
| Dividends payable | 16,196 |
| | 5,854 |
|
| Other liabilities | 2,107 |
| | 1,763 |
|
| Total liabilities | 18,303 |
| | 28,237 |
|
| Shareholders’ equity | 712,221 |
| | 697,394 |
|
| Total liabilities and shareholders’ equity | $ | 730,524 |
| | $ | 725,631 |
|
First Financial Bancorp 2011 Annual Report 97
Notes To Consolidated Financial Statements
Statements of Income
|
| | | | | | | | | | | |
| | Years Ended December 31, |
| (Dollars in thousands) | 2011 | | 2010 | | 2009 |
| Income | | | | | |
| Interest income | $ | 70 |
| | $ | 192 |
| | $ | 296 |
|
| Noninterest income | 0 |
| | 143 |
| | 0 |
|
| Dividends from subsidiaries | 48,700 |
| | 60,700 |
| | 40,700 |
|
| Total income | 48,770 |
| | 61,035 |
| | 40,996 |
|
| | | | | | |
| Expenses | | | | | |
| Interest expense | 391 |
| | 1,221 |
| | 1,851 |
|
| Provision for (recovery of) loan and lease losses | 739 |
| | (37 | ) | | 146 |
|
| Salaries and employee benefits | 4,449 |
| | 3,377 |
| | 2,949 |
|
| Miscellaneous professional services | 719 |
| | 928 |
| | 384 |
|
| Other | 5,240 |
| | 3,190 |
| | 2,443 |
|
| Total expenses | 11,538 |
| | 8,679 |
| | 7,773 |
|
| Income before income taxes and equity in undistributed net earnings of subsidiaries | 37,232 |
| | 52,356 |
| | 33,223 |
|
| Income tax benefit | (4,263 | ) | | (3,162 | ) | | (2,597 | ) |
| Equity in undistributed earnings of subsidiaries | 25,244 |
| | 3,733 |
| | 185,517 |
|
| Net income | $ | 66,739 |
| | $ | 59,251 |
| | $ | 221,337 |
|
98 First Financial Bancorp 2011 Annual Report
Statements of Cash Flows
|
| | | | | | | | | | | |
| | Years Ended December 31, |
| (Dollars in thousands) | 2011 | | 2010 | | 2009 |
| Operating activities | | | | | |
| Net income | $ | 66,739 |
| | $ | 59,251 |
| | $ | 221,337 |
|
| Adjustments to reconcile net income to net cash provided by operating activities | | | | |
| Equity in undistributed earnings of subsidiaries | (25,244 | ) | | (3,733 | ) | | (185,517 | ) |
| Provision for (recovery of) loan and lease losses | 739 |
| | (37 | ) | | 146 |
|
| Depreciation and amortization | 31 |
| | 42 |
| | 67 |
|
| Stock-based compensation expense | 3,935 |
| | 3,084 |
| | 2,799 |
|
| Pension expense | 0 |
| | 0 |
| | 34 |
|
| Deferred income taxes | (509 | ) | | (569 | ) | | (416 | ) |
| Increase (decrease) in dividends payable | 10,342 |
| | 710 |
| | (1,228 | ) |
| (Decrease) increase in accrued expenses | (10,003 | ) | | (140 | ) | | 1,094 |
|
| (Increase) decrease in other assets | (241 | ) | | 170 |
| | 573 |
|
| Net cash provided by operating activities | 45,789 |
| | 58,778 |
| | 38,889 |
|
| | | | | | |
| Investing activities | | | | | |
| Capital contributions to subsidiaries | 0 |
| | 0 |
| | (71,500 | ) |
| Proceeds from calls and maturities of investment securities | 158 |
| | 0 |
| | 0 |
|
| Purchases of investment securities, available-for-sale | (137 | ) | | (290 | ) | | (127 | ) |
| Net decrease (increase) in loans | 2,681 |
| | (1,743 | ) | | 2,113 |
|
| Purchases of premises and equipment | 0 |
| | (1,285 | ) | | 0 |
|
| Other | 514 |
| | (548 | ) | | 674 |
|
| Net cash (used in) provided by investing activities | 3,216 |
| | (3,866 | ) | | (68,840 | ) |
| | | | | | |
| Financing activities | | | | | |
| Decrease in short-term borrowings | 0 |
| | 0 |
| | (57,000 | ) |
| Redemption of junior subordinated debentures | (20,620 | ) | | 0 |
| | 0 |
|
| Cash dividends paid on common stock | (35,312 | ) | | (22,490 | ) | | (19,024 | ) |
| Cash dividends paid on preferred stock | 0 |
| | (1,100 | ) | | (3,578 | ) |
| Issuance of common stock | 0 |
| | 91,224 |
| | 97,985 |
|
| Payment to repurchase preferred stock | 0 |
| | (80,000 | ) | | 0 |
|
| Proceeds from exercise of stock options, net of shares purchased | 63 |
| | 272 |
| | 0 |
|
| Excess tax benefit (liability) on share-based compensation | 259 |
| | 535 |
| | (189 | ) |
| Other | 478 |
| | (1,086 | ) | | 0 |
|
| Net cash (used in) provided by financing activities | (55,132 | ) | | (12,645 | ) | | 18,194 |
|
| (Decrease) increase in cash | (6,127 | ) | | 42,267 |
| | (11,757 | ) |
| Cash at beginning of year | 117,784 |
| | 75,517 |
| | 87,274 |
|
| Cash at end of year | $ | 111,657 |
| | $ | 117,784 |
| | $ | 75,517 |
|
First Financial Bancorp 2011 Annual Report 99
|
| | | | | | | | | | | | | | | | |
| Quarterly Financial And Common Stock Data (Unaudited) | | | |
| | | | | | | | | |
| | | Three months ended |
| (Dollars in thousands, except per share data) | | March 31 | | June 30 | | September 30 | | December 31 |
| 2011 | | | | | | | | |
| Interest income | | $ | 80,063 |
| | $ | 77,817 |
| | $ | 75,952 |
| | $ | 74,985 |
|
| Interest expense | | 12,728 |
| | 11,950 |
| | 10,734 |
| | 9,509 |
|
| Net interest income | | 67,335 |
| | 65,867 |
| | 65,218 |
| | 65,476 |
|
| Provision for loan and lease losses - uncovered | | 647 |
| | 5,756 |
| | 7,643 |
| | 5,164 |
|
| Provision for loan and lease losses - covered | | 26,016 |
| | 23,895 |
| | 7,260 |
| | 6,910 |
|
| Noninterest income | | | | | | | | |
| Gain on sale of investment securities | | 0 |
| | 0 |
| | 0 |
| | 2,541 |
|
| FDIC loss sharing income | | 23,435 |
| | 21,643 |
| | 8,377 |
| | 7,433 |
|
| Accelerated discount on covered loans | | 5,783 |
| | 4,756 |
| | 5,207 |
| | 4,775 |
|
| All other | | 14,440 |
| | 14,719 |
| | 14,531 |
| | 14,891 |
|
| Total noninterest income | | 43,658 |
| | 41,118 |
| | 28,115 |
| | 29,640 |
|
| Noninterest expenses | | 57,790 |
| | 52,497 |
| | 53,142 |
| | 54,668 |
|
| Income before income taxes | | 26,540 |
| | 24,837 |
| | 25,288 |
| | 28,374 |
|
| Income tax expense | | 9,333 |
| | 8,864 |
| | 9,670 |
| | 10,433 |
|
| Net income | | $ | 17,207 |
| | $ | 15,973 |
| | $ | 15,618 |
| | $ | 17,941 |
|
| | | | | | | | | |
| Earnings per common share: | | | | | | | | |
| Basic | | $ | 0.30 |
| | $ | 0.28 |
| | $ | 0.27 |
| | $ | 0.31 |
|
| Diluted | | $ | 0.29 |
| | $ | 0.27 |
| | $ | 0.27 |
| | $ | 0.31 |
|
| Cash dividends paid per common share | | $ | 0.12 |
| | $ | 0.12 |
| | $ | 0.27 |
| | $ | 0.27 |
|
| Market price | | | | | | | | |
| High | | $ | 18.91 |
| | $ | 17.20 |
| | $ | 17.12 |
| | $ | 17.06 |
|
| Low | | $ | 15.65 |
| | $ | 15.04 |
| | $ | 13.34 |
| | $ | 13.40 |
|
| | | | | | | | | |
| 2010 | | | | | | | | |
| Interest income | | $ | 90,559 |
| | $ | 85,938 |
| | $ | 84,684 |
| | $ | 82,321 |
|
| Interest expense | | 18,539 |
| | 18,200 |
| | 16,838 |
| | 14,415 |
|
| Net interest income | | 72,020 |
| | 67,738 |
| | 67,846 |
| | 67,906 |
|
| Provision for loan and lease losses - uncovered | | 11,378 |
| | 6,158 |
| | 6,287 |
| | 9,741 |
|
| Provision for loan and lease losses - covered | | 9,460 |
| | 18,962 |
| | 20,725 |
| | 13,997 |
|
| Noninterest income | | | | | | | | |
| Loss on preferred securities | | (30 | ) | | 0 |
| | 0 |
| | 0 |
|
| FDIC loss sharing income | | 7,568 |
| | 15,170 |
| | 17,800 |
| | 11,306 |
|
| Accelerated discount on covered loans | | 6,098 |
| | 7,408 |
| | 9,448 |
| | 6,113 |
|
| All other | | 13,299 |
| | 17,889 |
| | 17,647 |
| | 17,115 |
|
| Total noninterest income | | 26,935 |
| | 40,467 |
| | 44,895 |
| | 34,534 |
|
| Noninterest expenses | | 60,261 |
| | 55,819 |
| | 61,310 |
| | 56,290 |
|
| Income before income taxes | | 17,856 |
| | 27,266 |
| | 24,419 |
| | 22,412 |
|
| Income tax expense | | 6,258 |
| | 9,492 |
| | 8,840 |
| | 8,112 |
|
| Net income | | 11,598 |
| | 17,774 |
| | 15,579 |
| | 14,300 |
|
| Dividends on preferred stock | | 1,865 |
| | 0 |
| | 0 |
| | 0 |
|
| Income available to common shareholders | | $ | 9,733 |
| | $ | 17,774 |
| | $ | 15,579 |
| | $ | 14,300 |
|
| Earnings per common share: | | | | | | | | |
| Basic | | $ | 0.18 |
| | $ | 0.31 |
| | $ | 0.27 |
| | $ | 0.25 |
|
| Diluted | | $ | 0.17 |
| | $ | 0.30 |
| | $ | 0.27 |
| | $ | 0.24 |
|
| Cash dividends paid per common share | | $ | 0.10 |
| | $ | 0.10 |
| | $ | 0.10 |
| | $ | 0.10 |
|
| Market price | | | | | | | | |
| High | | $ | 19.00 |
| | $ | 21.32 |
| | $ | 17.10 |
| | $ | 19.41 |
|
| Low | | $ | 13.89 |
| | $ | 14.95 |
| | $ | 14.19 |
| | $ | 16.21 |
|
First Financial Bancorp common stock trades on The Nasdaq Stock Market under the symbol FFBC.
100 First Financial Bancorp 2011 Annual Report
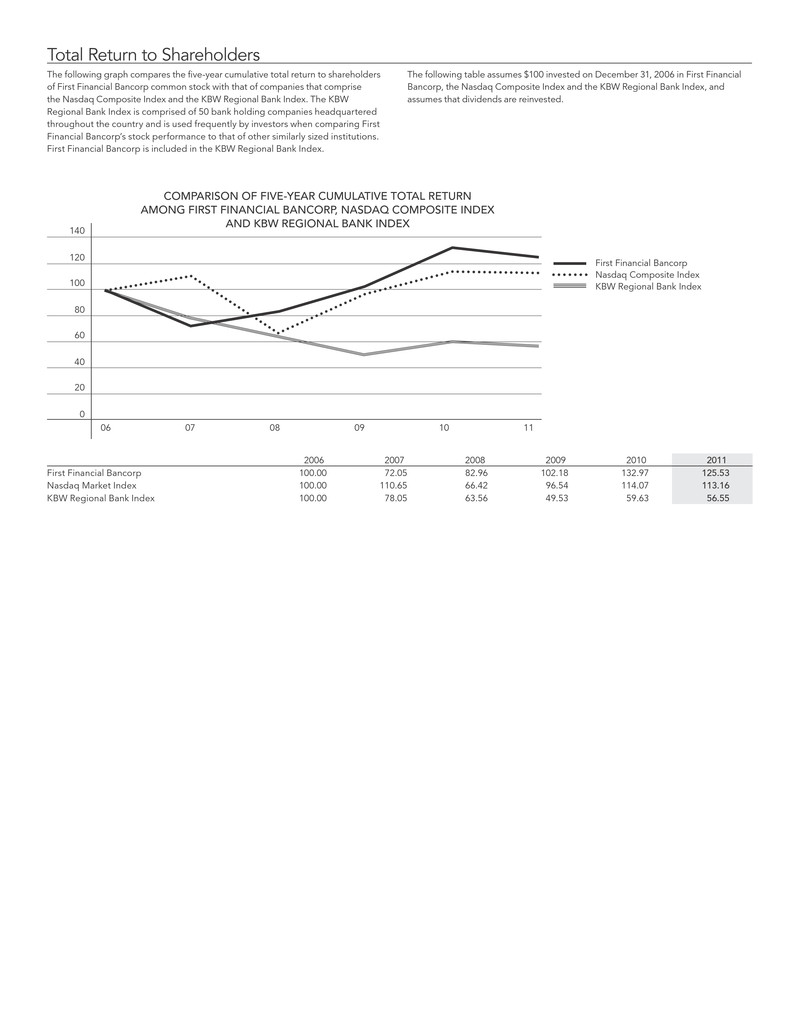
0 20 40 60 80 100 120 140 Total Return to Shareholders The following graph compares the five-year cumulative total return to shareholders of First Financial Bancorp common stock with that of companies that comprise the Nasdaq Composite Index and the KBW Regional Bank Index. The KBW Regional Bank Index is comprised of 50 bank holding companies headquartered throughout the country and is used frequently by investors when comparing First Financial Bancorp’s stock performance to that of other similarly sized institutions. First Financial Bancorp is included in the KBW Regional Bank Index. The following table assumes $100 invested on December 31, 2006 in First Financial Bancorp, the Nasdaq Composite Index and the KBW Regional Bank Index, and assumes that dividends are reinvested. 2006 2007 2008 2009 2010 2011 First Financial Bancorp 100.00 72.05 82.96 102.18 132.97 125.53 Nasdaq Market Index 100.00 110.65 66.42 96.54 114.07 113.16 KBW Regional Bank Index 100.00 78.05 63.56 49.53 59.63 56.55 06 07 08 09 10 CompARison of fivE-YEAR CumulAtivE totAl REtuRn Among fiRst finAnCiAl BAnCoRp, nAsDAq CompositE inDEx AnD KBW REgionAl BAnK inDEx 11 First Financial Bancorp Nasdaq Composite Index KBW Regional Bank Index
First Financial Bancorp 2011 Annual Report
101
shareholder information
2012 Annual Shareholder Meeting
The annual meeting of shareholders will be held on Tuesday, May 22, 2012, at 10:00 a.m. (EDT) at:
First Financial Bancorp
First Financial Center
255 East Fifth Street
29th Floor, Suite 2900
Cincinnati, OH 45202
Common Stock Listing
|
|
| First Financial Bancorp’s common stock trades on the Nasdaq Stock Market under the symbol FFBC. |

Registrar & Transfer Agent
Registrar and Transfer Company serves as the registrar and transfer agent for First Financial Bancorp common stock for registered shareholders. Shareholder account inquiries, including changes of address or ownership, transferring stock, and replacing lost certificates or dividend checks should be directed to Registrar and Transfer Company at:
Registrar and Transfer Company
10 Commerce Drive
Cranford, NJ 07016
1-800-368-5948
Shareholders of record can also access their shareholder account records and request information related to their shareholder account via the internet. To register for online account access, go to: www.rtco.com.
Dividend Reinvestment & Stock Purchase Plan
Shareholders of record holding 25 shares or more are eligible to participate in our Dividend Reinvestment Plan. Shareholders of record may elect to have cash dividends automatically reinvested in additional common shares and can also purchase additional common shares by making optional cash payments. To obtain a prospectus and authorization card to enroll in the plan, please visit the Investor Relations section of our website at www.bankatfirst.com/investor to print the documents or contact Investor Relations.
Investor Relations
Corporate and investor information, including news releases, webcasts, investor presentations, annual reports, proxy statements and SEC filings as well as information on the company’s corporate governance practices is available within the Investor Relations section of our website at www.bankatfirst.com/investor.
Shareholders, analysts and other investment professionals who would like corporate and financial information on First Financial Bancorp should contact:
Kenneth J. Lovik
Vice President, Investor Relations and Corporate Development
First Financial Bancorp
255 East Fifth Street, Suite 900
Cincinnati, OH 45202-4248
Phone: 513-979-5837
E-mail: kenneth.lovik@bankatfirst.com
Securities & Exchange Commission Filings
All reports filed electronically by First Financial Bancorp with the United States Securities and Exchange Commission (SEC), including the Annual Report on Form 10-K, quarterly reports on Form 10-Q, and current event reports on Form 8-K, as well as any amendments to those reports, are accessible at no cost within the Investor Relations section of our website at www.bankatfirst.com/investor, or by contacting Investor Relations. These filings are also accessible on the SEC’s website at www.sec.gov.
Media Requests
Members of the media should contact:
Cheryl Lipp
First Vice President, Director of Communication
First Financial Bancorp
255 East Fifth Street, Suite 700
Cincinnati, OH 45202
Phone: 513-979-5797
E-Mail: cheryl.lipp@bankatfirst.com
102 First Financial Bancorp 2011 Annual Report
First Financial Bancorp First Financial Center 255 East Fifth Street, Suite 700 Cincinnati, OH 45202-4248 bankatfirst.com more shareholder return