Another step on the path to success 1 Investor Presentation First Quarter 2012 EXHIBIT 99.1
Another step on the path to success 2 Certain statements contained in this presentation which are not statements of historical fact constitute forward-looking statements within the meaning of the Private Securities Litigation Reform Act (the ‘‘Act’’). In addition, certain statements in future filings by First Financial with the SEC, in press releases, and in oral and written statements made by or with the approval of First Financial which are not statements of historical fact constitute forward-looking statements within the meaning of the Act. Examples of forward-looking statements include, but are not limited to, projections of revenues, income or loss, earnings or loss per share, the payment or non-payment of dividends, capital structure and other financial items, statements of plans and objectives of First Financial or its management or board of directors, and statements of future economic performances and statements of assumptions underlying such statements. Words such as ‘‘believes’’, ‘‘anticipates’’, “likely”, “expected”, ‘‘intends’’, and other similar expressions are intended to identify forward-looking statements but are not the exclusive means of identifying such statements. Management’s analysis contains forward-looking statements that are provided to assist in the understanding of anticipated future financial performance. However, such performance involves risks and uncertainties that may cause actual results to differ materially. Factors that could cause actual results to differ from those discussed in the forward-looking statements include, but are not limited to: • management’s ability to effectively execute its business plan; • the risk that the strength of the United States economy in general and the strength of the local economies in which we conduct operations may continue to deteriorate resulting in, among other things, a further deterioration in credit quality or a reduced demand for credit, including the resultant effect on our loan portfolio, allowance for loan and lease losses and overall financial performance; • the effects of the potential delay or failure of the U.S. federal government to pay its debts as they become due or make payments in the ordinary course; • the ability of financial institutions to access sources of liquidity at a reasonable cost; • the impact of recent upheaval in the financial markets and the effectiveness of domestic and international governmental actions taken in response, such as the U.S. Treasury’s TARP and the FDIC’s Temporary Liquidity Guarantee Program, and the effect of such governmental actions on us, our competitors and counterparties, financial markets generally and availability of credit specifically, and the U.S. and international economies, including potentially higher FDIC premiums arising from increased payments from FDIC insurance funds as a result of depository institution failures; • the effect of and changes in policies and laws or regulatory agencies (notably the recently enacted Dodd-Frank Wall Street Reform and Consumer Protection Act); • inflation and possible changes in interest rates; • our ability to keep up with technological changes; • our ability to comply with the terms of loss sharing agreements with the FDIC; • mergers and acquisitions, including costs or difficulties related to the integration of acquired companies and the wind-down of non-strategic operations that may be greater than expected, such as the previous activities of Irwin Union Bank & Trust Company and its former affiliates, including the risks and uncertainties associated with the Irwin Mortgage Corporation bankruptcy proceedings and other acquired subsidiaries; • the risk that exploring merger and acquisition opportunities may detract from management’s time and ability to successfully manage our company; • expected cost savings in connection with the consolidation of recent acquisitions may not be fully realized or realized within the expected time frames, and deposit attrition, customer loss and revenue loss following completed acquisitions may be greater than expected; • our ability to increase market share and control expenses; • the effect of changes in accounting policies and practices, as may be adopted by the regulatory agencies as well as the Financial Accounting Standards Board and the SEC; • adverse changes in the securities and debt markets; • our success in recruiting and retaining the necessary personnel to support business growth and expansion and maintain sufficient expertise to support increasingly complex products and services; • monetary and fiscal policies of the Board of Governors of the Federal Reserve System (Federal Reserve) and the U.S. government and other governmental initiatives affecting the financial services industry; • our ability to manage loan delinquency and charge-off rates and changes in estimation of the adequacy of the allowance for loan losses; and • the costs and effects of litigation and of unexpected or adverse outcomes in such litigation. In addition, please refer to our Annual Report on Form 10-K for the year ended December 31, 2011, as well as our other filings with the SEC, for a more detailed discussion of these risks and uncertainties and other factors. Such forward-looking statements are meaningful only on the date when such statements are made, and First Financial undertakes no obligation to update any forward-looking statement to reflect events or circumstances after the date on which such a statement is made to reflect the occurrence of unanticipated events. Forward Looking Statement Disclosure
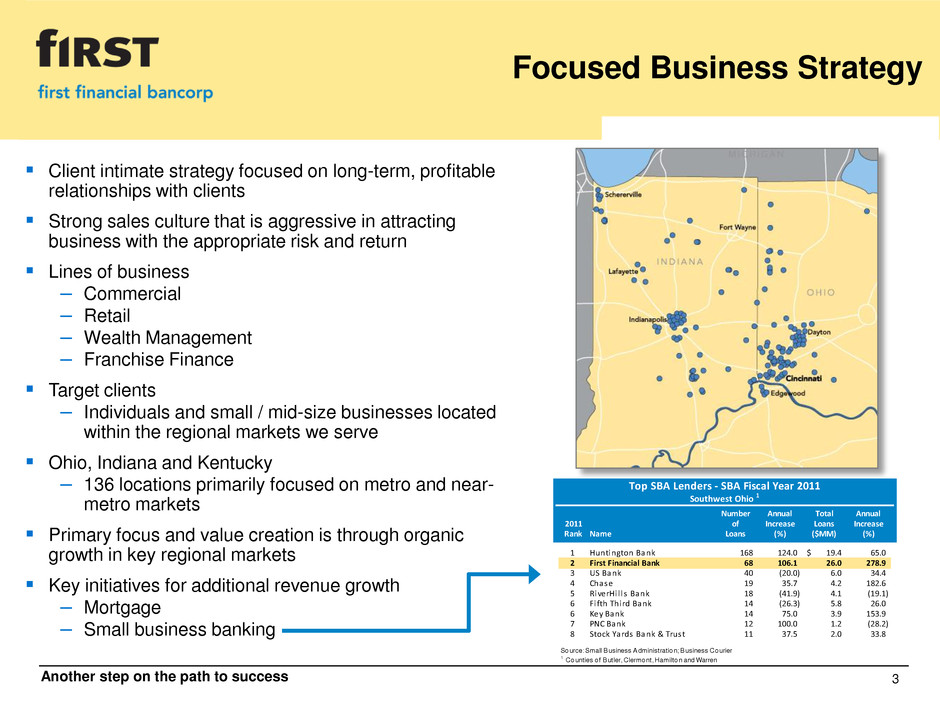
Another step on the path to success 3 Focused Business Strategy Client intimate strategy focused on long-term, profitable relationships with clients Strong sales culture that is aggressive in attracting business with the appropriate risk and return Lines of business – Commercial – Retail – Wealth Management – Franchise Finance Target clients – Individuals and small / mid-size businesses located within the regional markets we serve Ohio, Indiana and Kentucky – 136 locations primarily focused on metro and near- metro markets Primary focus and value creation is through organic growth in key regional markets Key initiatives for additional revenue growth – Mortgage – Small business banking Top SBA Lenders - SBA Fiscal Year 2011 Southwest Ohio 1 Number Annual Total Annual 2011 of Increase Loans Increase Rank Name Loans (%) ($MM) (%) 1 Huntington Bank 168 124.0 19.4$ 65.0 2 First Financial Bank 68 106.1 26.0 278.9 3 US Bank 40 (20.0) 6.0 34.4 4 Chase 19 35.7 4.2 182.6 5 RiverHi l l s Bank 18 (41.9) 4.1 (19.1) 6 Fi fth Third Bank 14 (26.3) 5.8 26.0 6 Key Bank 14 75.0 3.9 153.9 7 PNC Bank 12 100.0 1.2 (28.2) 8 Stock Yards Bank & Trust 11 37.5 2.0 33.8 Source: Small Business Administration; Business Courier 1 Counties of Butler, Clermont, Hamilton and Warren
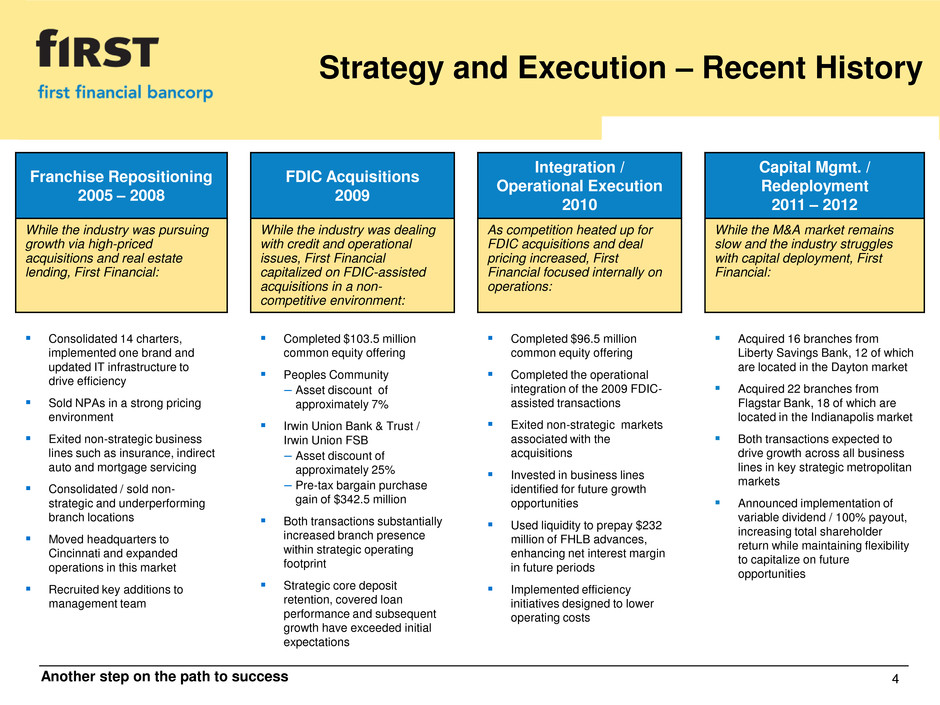
Another step on the path to success 4 Strategy and Execution – Recent History Franchise Repositioning 2005 – 2008 FDIC Acquisitions 2009 Integration / Operational Execution 2010 Capital Mgmt. / Redeployment 2011 – 2012 While the industry was pursuing growth via high-priced acquisitions and real estate lending, First Financial: While the industry was dealing with credit and operational issues, First Financial capitalized on FDIC-assisted acquisitions in a non- competitive environment: As competition heated up for FDIC acquisitions and deal pricing increased, First Financial focused internally on operations: While the M&A market remains slow and the industry struggles with capital deployment, First Financial: Consolidated 14 charters, implemented one brand and updated IT infrastructure to drive efficiency Sold NPAs in a strong pricing environment Exited non-strategic business lines such as insurance, indirect auto and mortgage servicing Consolidated / sold non- strategic and underperforming branch locations Moved headquarters to Cincinnati and expanded operations in this market Recruited key additions to management team Completed $103.5 million common equity offering Peoples Community – Asset discount of approximately 7% Irwin Union Bank & Trust / Irwin Union FSB – Asset discount of approximately 25% – Pre-tax bargain purchase gain of $342.5 million Both transactions substantially increased branch presence within strategic operating footprint Strategic core deposit retention, covered loan performance and subsequent growth have exceeded initial expectations Completed $96.5 million common equity offering Completed the operational integration of the 2009 FDIC- assisted transactions Exited non-strategic markets associated with the acquisitions Invested in business lines identified for future growth opportunities Used liquidity to prepay $232 million of FHLB advances, enhancing net interest margin in future periods Implemented efficiency initiatives designed to lower operating costs Acquired 16 branches from Liberty Savings Bank, 12 of which are located in the Dayton market Acquired 22 branches from Flagstar Bank, 18 of which are located in the Indianapolis market Both transactions expected to drive growth across all business lines in key strategic metropolitan markets Announced implementation of variable dividend / 100% payout, increasing total shareholder return while maintaining flexibility to capitalize on future opportunities
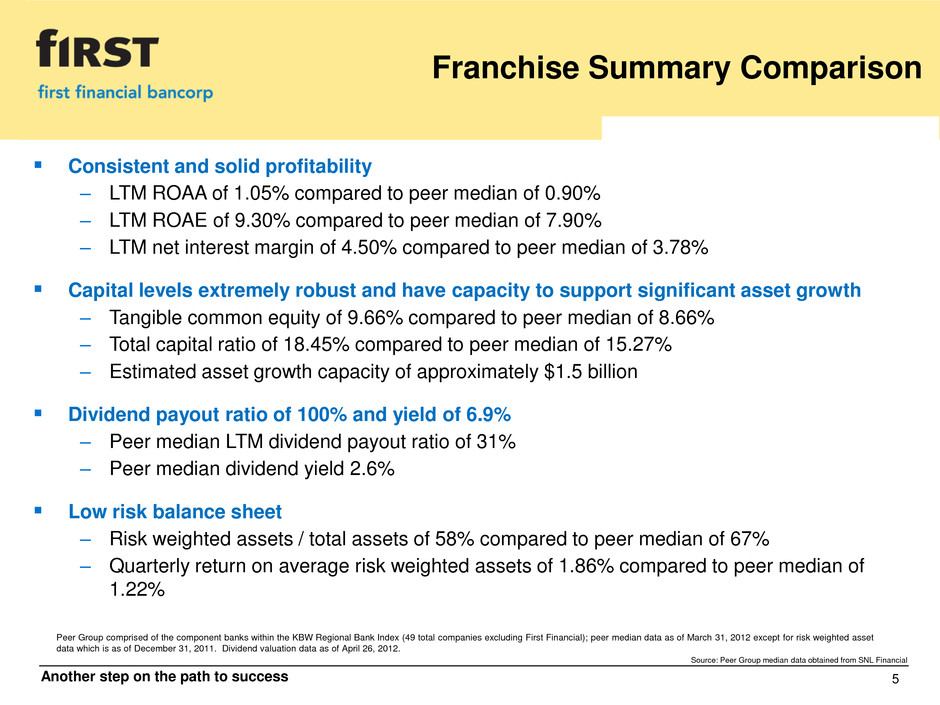
Another step on the path to success Franchise Summary Comparison Consistent and solid profitability – LTM ROAA of 1.05% compared to peer median of 0.90% – LTM ROAE of 9.30% compared to peer median of 7.90% – LTM net interest margin of 4.50% compared to peer median of 3.78% Capital levels extremely robust and have capacity to support significant asset growth – Tangible common equity of 9.66% compared to peer median of 8.66% – Total capital ratio of 18.45% compared to peer median of 15.27% – Estimated asset growth capacity of approximately $1.5 billion Dividend payout ratio of 100% and yield of 6.9% – Peer median LTM dividend payout ratio of 31% – Peer median dividend yield 2.6% Low risk balance sheet – Risk weighted assets / total assets of 58% compared to peer median of 67% – Quarterly return on average risk weighted assets of 1.86% compared to peer median of 1.22% Peer Group comprised of the component banks within the KBW Regional Bank Index (49 total companies excluding First Financial); peer median data as of March 31, 2012 except for risk weighted asset data which is as of December 31, 2011. Dividend valuation data as of April 26, 2012. Source: Peer Group median data obtained from SNL Financial 5

Another step on the path to success 6 First Quarter 2012 Financial Highlights Quarterly net income of $17.0 million, or $0.29 per diluted common share Adjusted pre-tax, pre-provision income remained strong, totaling $31.2 million, or 1.94% of average assets Continued strong profitability – Return on average assets of 1.05% – Return on average risk-weighted assets of 1.86% – Return on average shareholders’ equity of 9.67% Quarterly net interest margin increased to 4.51% – Cash proceeds from branch acquisitions fully deployed into investment portfolio – Cost of deposit funding continues to improve as a result of strategic initiatives Continued decline in classified assets and improvement in net charge-offs – Classified assets declined $7.7 million, or 4.7%, compared to linked quarter – Net charge-offs decreased 10.2% compared to linked quarter Continued focus on efficiency and optimal use of resources – Announced openings, actual and planned, of four new locations in key strategic markets – Announced branch consolidation plan involving ten locations with estimated annual pre-tax operating costs of $2.3 million, net of anticipated revenue impact related to deposit attrition
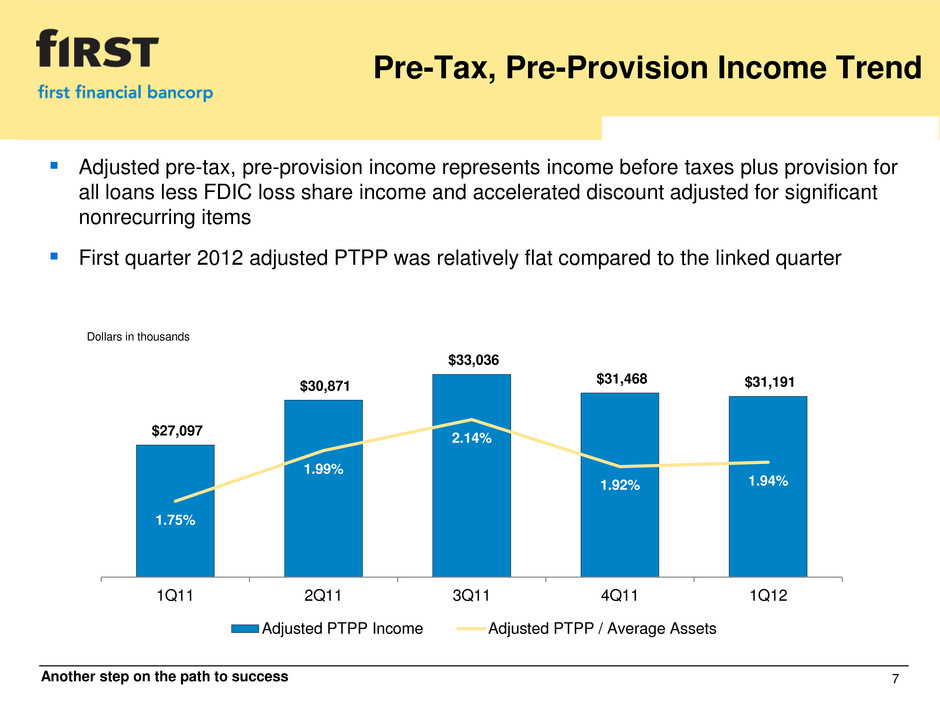
Another step on the path to success 7 Pre-Tax, Pre-Provision Income Trend Adjusted pre-tax, pre-provision income represents income before taxes plus provision for all loans less FDIC loss share income and accelerated discount adjusted for significant nonrecurring items First quarter 2012 adjusted PTPP was relatively flat compared to the linked quarter $27,097 $30,871 $33,036 $31,468 $31,191 1.75% 1.99% 2.14% 1.92% 1.94% 1Q11 2Q11 3Q11 4Q11 1Q12 Dollars in thousands Adjusted PTPP Income Adjusted PTPP / Average Assets
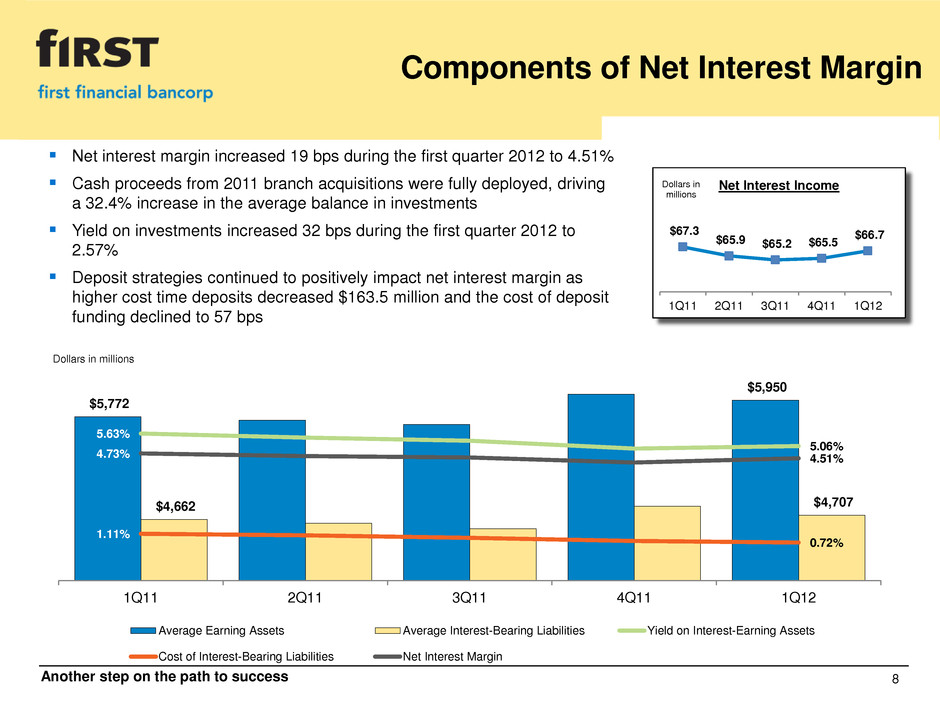
Another step on the path to success 8 Components of Net Interest Margin Net interest margin increased 19 bps during the first quarter 2012 to 4.51% Cash proceeds from 2011 branch acquisitions were fully deployed, driving a 32.4% increase in the average balance in investments Yield on investments increased 32 bps during the first quarter 2012 to 2.57% Deposit strategies continued to positively impact net interest margin as higher cost time deposits decreased $163.5 million and the cost of deposit funding declined to 57 bps $5,772 $5,950 $4,662 $4,707 5.63% 5.06% 1.11% 0.72% 4.73% 4.51% 1Q11 2Q11 3Q11 4Q11 1Q12 Dollars in millions Average Earning Assets Average Interest-Bearing Liabilities Yield on Interest-Earning Assets Cost of Interest-Bearing Liabilities Net Interest Margin $67.3 $65.9 $65.2 $65.5 $66.7 1Q11 2Q11 3Q11 4Q11 1Q12 Dollars in millions Net Interest Income
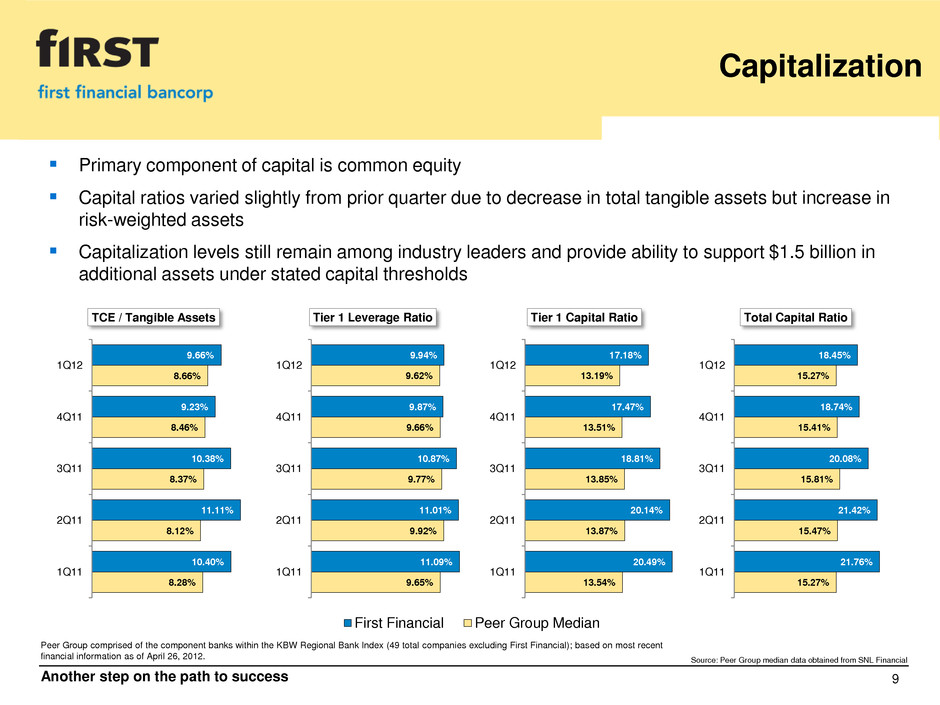
Another step on the path to success 9 Capitalization Primary component of capital is common equity Capital ratios varied slightly from prior quarter due to decrease in total tangible assets but increase in risk-weighted assets Capitalization levels still remain among industry leaders and provide ability to support $1.5 billion in additional assets under stated capital thresholds Source: Peer Group median data obtained from SNL Financial Peer Group comprised of the component banks within the KBW Regional Bank Index (49 total companies excluding First Financial); based on most recent financial information as of April 26, 2012. 10.38% 10.33% 10.40% 11.11% 10.38%7.96% 8.06% 8.28% 8.12% 8.39% 3Q10 4Q1 1Q11 2Q1 3Q11 First Financial Peer Group Median 8.28% 8.12% 8.37% 8.46% 8.66% 10.40% 11.11% 10.38% 9.23% 9.66% 1Q11 2Q11 3Q11 4Q11 1Q12 TCE / Tangible Assets 9.65% 9.92% 9.77% 9.66% 9.62% 11.09% 11.01% 10.87% 9.87% 9.94% 1Q11 2Q11 3Q11 4Q11 1Q12 Tier 1 Leverage Ratio 13.54% 13.87% 13.85% 13.51% 13.19% 20.49% 20.14% 18.81% 17.47% 17.18% 1Q11 2Q11 3Q11 4Q11 1Q12 Tier 1 Capital Ratio 15.27% 15.47% 15.81% 15.41% 15.27% 21.76% 21.42% 20.08% 18.74% 18.45% 1Q11 2Q11 3Q11 4Q11 1Q12 T tal Capital Ratio
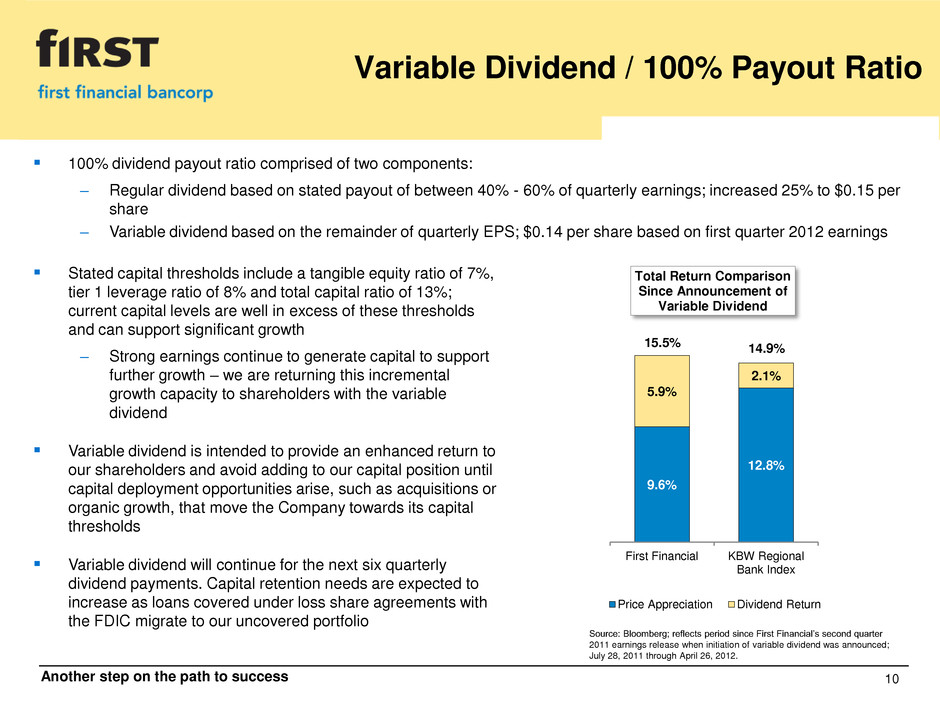
Another step on the path to success 10 Variable Dividend / 100% Payout Ratio 100% dividend payout ratio comprised of two components: – Regular dividend based on stated payout of between 40% - 60% of quarterly earnings; increased 25% to $0.15 per share – Variable dividend based on the remainder of quarterly EPS; $0.14 per share based on first quarter 2012 earnings Stated capital thresholds include a tangible equity ratio of 7%, tier 1 leverage ratio of 8% and total capital ratio of 13%; current capital levels are well in excess of these thresholds and can support significant growth – Strong earnings continue to generate capital to support further growth – we are returning this incremental growth capacity to shareholders with the variable dividend Variable dividend is intended to provide an enhanced return to our shareholders and avoid adding to our capital position until capital deployment opportunities arise, such as acquisitions or organic growth, that move the Company towards its capital thresholds Variable dividend will continue for the next six quarterly dividend payments. Capital retention needs are expected to increase as loans covered under loss share agreements with the FDIC migrate to our uncovered portfolio Source: Bloomberg; reflects period since First Financial’s second quarter 2011 earnings release when initiation of variable dividend was announced; July 28, 2011 through April 26, 2012. 9.6% 12.8% 5.9% 2.1% First Financial KBW Regional Bank Index Total Return Comparison Since Announcement of Variable Dividend Price Appreciation Dividend Return 15.5% 14.9%
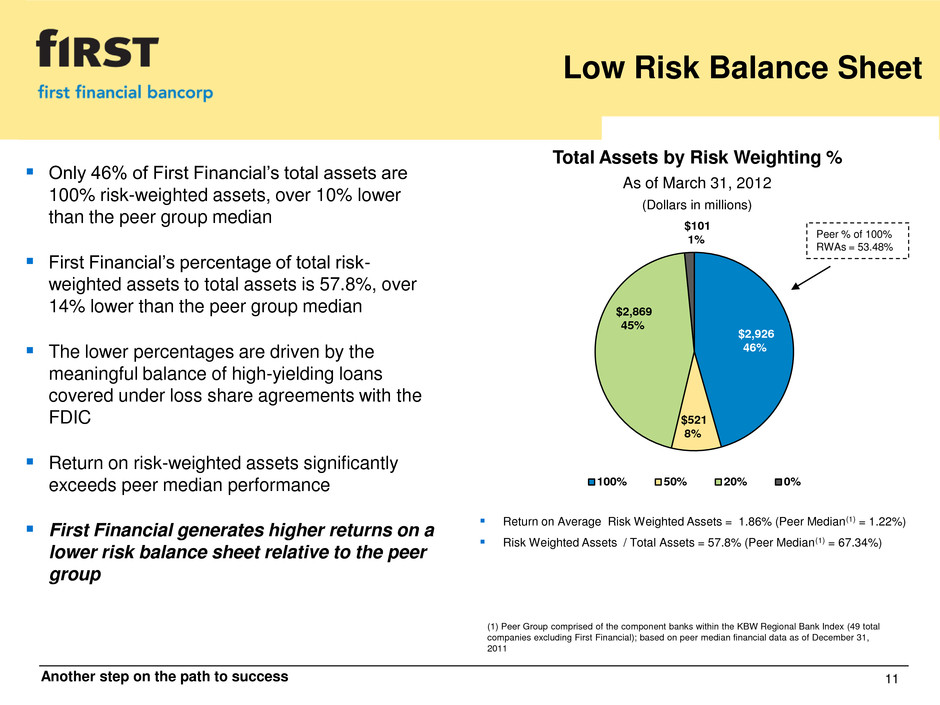
Another step on the path to success 11 Low Risk Balance Sheet Total Assets by Risk Weighting % As of March 31, 2012 (Dollars in millions) Return on Average Risk Weighted Assets = 1.86% (Peer Median(1) = 1.22%) Risk Weighted Assets / Total Assets = 57.8% (Peer Median(1) = 67.34%) (1) Peer Group comprised of the component banks within the KBW Regional Bank Index (49 total companies excluding First Financial); based on peer median financial data as of December 31, 2011 Peer % of 100% RWAs = 53.48% Only 46% of First Financial’s total assets are 100% risk-weighted assets, over 10% lower than the peer group median First Financial’s percentage of total risk- weighted assets to total assets is 57.8%, over 14% lower than the peer group median The lower percentages are driven by the meaningful balance of high-yielding loans covered under loss share agreements with the FDIC Return on risk-weighted assets significantly exceeds peer median performance First Financial generates higher returns on a lower risk balance sheet relative to the peer group $2,926 46% $521 8% $2,869 45% $101 1% 100% 50% 20% 0%

Another step on the path to success 12 Credit Quality Review Classified assets totaled $154.7 million as of March 31, 2012, declining 4.7% compared to the linked quarter and 16.7% compared to March 31, 2011 Increase in NPLs during the quarter were impacted by an increase in accruing TDRs First quarter 2012 provision for loan losses declined 36.9% and net charge-offs declined 10.2% compared to the fourth quarter 2011 Peer Group comprised of the component banks within the KBW Regional Bank Index (49 total companies excluding First Financial); based on most recent financial information as of February 8, 2012. Source: Peer Group median data obtained from SNL Financial 10.38% 10.33% 10.40% 11.11% 10.38%7.96% 8.06% 8.28% 8.12% 8.39% 3Q10 4Q1 1Q11 2Q1 3Q11 First Financial Peer Group Median 1.94% 1.88% 1.75% 1.77% 1.70% 1.51% 1.50% 1.40% 1.31% 1.52% 1Q11 2Q11 3Q11 4Q11 1Q12 NPAs / Total Assets 2.70% 2.55% 2.28% 2.19% 1.99% 2.90% 2.65% 2.60% 2.57% 2.79% 1Q11 2Q11 3Q11 4Q11 1Q12 NPLs / Total Loans 1.93% 1.88% 1.81% 1.62% 1.59% 1.93% 1.92% 1.86% 1.77% 1.67% 1Q11 2Q11 3Q11 4Q11 1Q12 Reserves / Total Loans 73.27% 75.00% 80.50% 82.02% 94.56% 66.57% 72.51% 71.35% 68.84% 59.82% 1Q11 2Q11 3Q11 4Q11 1Q12 Reserves / NPLs

Another step on the path to success 13 Selective Acquisitions Supplements organic growth strategy through expansion in strategic markets Transactions met all internal criteria for acquisitions Loss sharing arrangements provide significant protection on acquired loans Developed scalable covered asset and loss share management team comprised of credit, legal, accounting and finance Loan Portfolio June 30, 2009 $145 mm select performing commercial and consumer loans Peoples (FDIC) July 31, 2009 19 banking centers $521mm deposits $331mm in loss share covered loans1 No first loss position Banking Centers August 28, 2009 3 banking centers in Indiana $85mm deposits $41mm in select performing commercial and consumer loans Irwin (FDIC) September 18, 2009 27 banking centers $2.5B deposits $1.8B in loss share covered loans1 No first loss position Liberty Banking Centers September 23, 2011 16 banking centers $342mm deposits $127mm in select in-market performing loans Flagstar Banking Centers December 2, 2011 22 banking centers $342mm retail deposits $123mm government deposits 1 Estimated fair market value of loans We will continue to evaluate opportunities but never lose sight of the core franchise Core philosophy and strategy remain unchanged

Another step on the path to success 14 Franchise Highlights 1. Strong operating fundamentals – 86 consecutive quarters of profitability 2. Strong capital levels 3. Dividend yield of 6.9% 4. Low risk balance sheet 5. Credit metrics have remained strong throughout the economic downturn 6. Solid market share in strategic operating markets 7. Platform for growth in commercial and CRE business lines in our key metropolitan markets and building scale in specialty finance product offerings Dividend yield data as of April 26, 2012.

Another step on the path to success 15 Appendix

Another step on the path to success 16 Pre-Tax, Pre-Provision Income For the three months ended March 31, December 31, September 30, June 30, March 31, Dollars in thousands 2012 2011 2011 2011 2011 Pre-tax, pre-provision income 1 30,020$ 33,015$ 31,814$ 32,845$ 29,768$ Less: accelerated discount on covered loans 3,645 4,775 5,207 4,756 5,783 Plus: loss on covered OREO 2 3,043 2,521 3,755 2,621 3,112 Pre-tax, pre-provision income, net of accelerated discount and loss on covered OREO 29,418 30,761 30,362 30,710 27,097 Less: gain on sales of investment securities - 2,541 - - - Less: gain on sales of non-mortgage loans 3 66 290 700 429 - Plus: acceleration of deferred swap fees associated with trust preferred redemption - - - 590 - Plus: One-time expenses related to branch acquisitions - 1,037 1,791 - - Plus: One-time other exit and retention costs - 2,501 1,583 - - Plus: One-time pension, trust and other costs 1,839 - - - - Adjusted pre-tax, pre-provision income 31,191$ 31,468$ 33,036$ 30,871$ 27,097$ 1 Represents income before taxes plus provision for all loans less FDIC loss sharing income 2 Reimbursements related to losses on covered OREO and other credit-related costs are included in FDIC loss sharing income, w hich is excluded from the pre-tax, pre-provision income above 3 Represents gain on sale of loans originated by franchise f inance business

Another step on the path to success 17 Revenue by Source Strategic – Elements of the business that either existed prior to the acquisitions or were acquired with the intent to retain and grow. On a reported basis, approximately 76% of total revenue is derived from strategic businesses. Not including the FDIC loss sharing income, strategic operations represents 87% of total revenue. Acquired-Non-Strategic – Elements of the business that the Company intends to exit but will continue to support to obtain maximum economic value. No growth or replacement is expected. Revenue will decrease over time as loans and deposits will not be renewed when they mature. FDIC Loss Sharing Income – In accordance with guidance provided by the SEC, amounts recoverable from the FDIC related to credit losses on covered loans under loss sharing agreements are required to be recorded as noninterest income Accelerated Discount on Loan Prepayments and Dispositions – The acceleration of the unrealized valuation discount. Noninterest income results from the prepayment or sale of covered loans. This item will be ongoing but diminishing as covered loan balances decline over time. Total Revenue: $98.6 million For the Three Months Ended March 31, 2012 (Dollars in millions) $74.6 76% $7.6 8% $12.8 13% $3.6 3% Strategic Transition Related/Acquired-Non-Strategic FDIC Loss Sharing Income Accelerated Discount on Paid in Full Loans
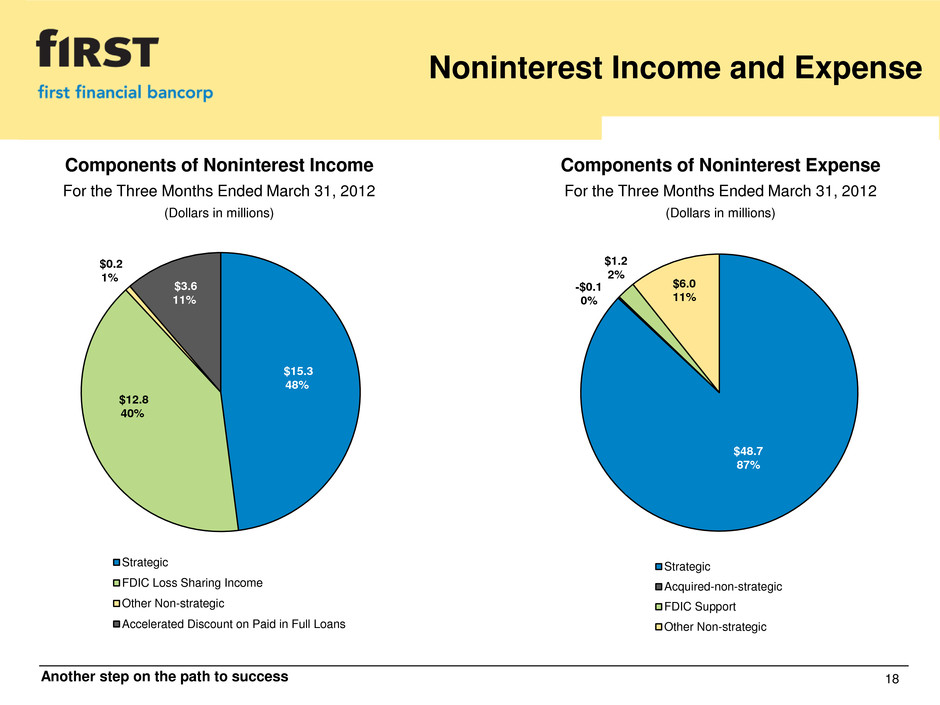
Another step on the path to success 18 Noninterest Income and Expense Components of Noninterest Expense For the Three Months Ended March 31, 2012 (Dollars in millions) Components of Noninterest Income For the Three Months Ended March 31, 2012 (Dollars in millions) $15.3 48% $12.8 40% $0.2 1% $3.6 11% Strategic FDIC Loss Sharing Income Other Non-strategic Accelerated Discount on Paid in Full Loans $48.7 87% -$0.1 0% $1.2 2% $6.0 11% Strategic Acquired-non-strategic FDIC Support Other Non-strategic
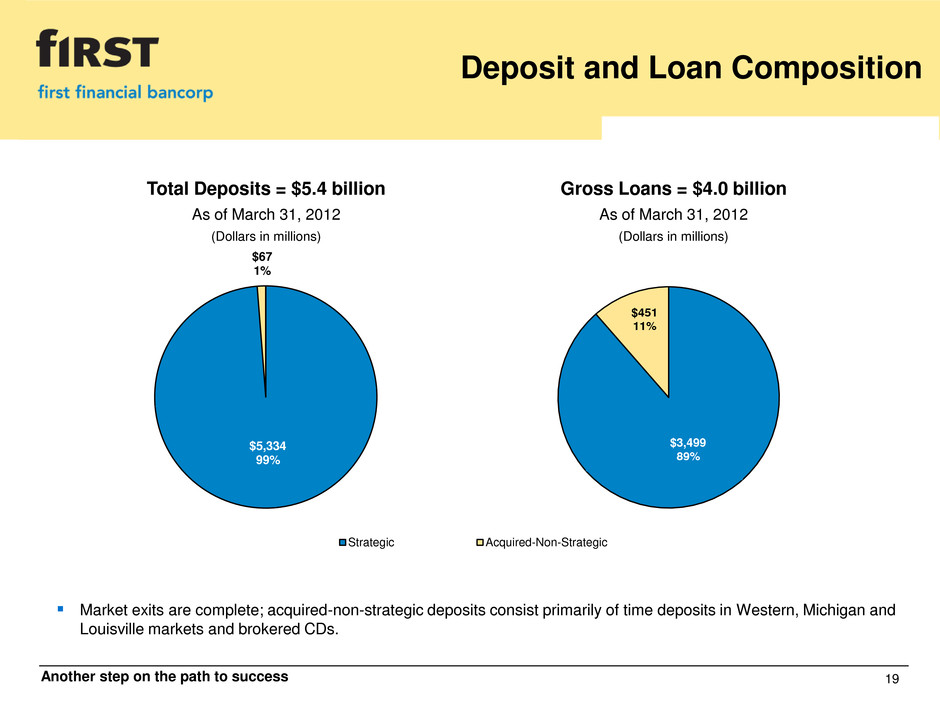
Another step on the path to success 19 Deposit and Loan Composition Total Deposits = $5.4 billion As of March 31, 2012 (Dollars in millions) Gross Loans = $4.0 billion As of March 31, 2012 (Dollars in millions) Market exits are complete; acquired-non-strategic deposits consist primarily of time deposits in Western, Michigan and Louisville markets and brokered CDs. $5,334 99% $67 1% Strategic Acquired-Non-Strategic $3,499 89% $451 11%

Another step on the path to success 20 Loan Composition Covered Loans - $1.0 billion Uncovered Loans - $3.0 billion Total Loan Portfolio – March 31, 2012 $4.0 billion In-house lending limit of $15 million – significantly below legal limit 25.0% of total loans covered under FDIC loss share agreements Total uncovered loans were essentially unchanged compared to the linked quarter and increased $182.5 million, or 6.6%, compared to March 31, 2011 25% 3% 48% 10% 11% 3% Commercial Real estate - construction Real estate - commercial Real estate - residential Home equity Installment and other 17% 2% 62% 12% 6% 1% 28% 3% 43% 10% 12% 4%

Another step on the path to success 21 Uncovered Loans – RE Collateral Total Uncovered Loan Portfolio 1 – March 31, 2012 $3.0 Billion 1 Excludes loans covered by FDIC loss sharing agreements Construction and acquisition and land development loans represent small portion of overall portfolio Commercial real estate and constructions loans located primarily in Ohio and Indiana markets 3% 43% Real estate - construction Real estate - commercial $1,262,775 $104,305 Dollars in thousands 62% 36% 2% Non-owner occupied Owner occupied Acquisition & land development

Another step on the path to success 22 Deposit Composition Non-time deposit balances declined $78.4 million during the first quarter 2012, driven by a $149.9 million decrease in balances, primarily repriced public fund savings accounts, associated with the Flagstar acquisition. Offsetting the decline in repriced Flagstar balances was an increase of $80.0 million in core retail transactional accounts Time deposit balances decreased $163.5 million during the first quarter 2012 as a result of the continued focus on reducing non-core relationship deposits Deposit rationalization strategies related to deposit pricing continued to have a positive impact as the total costs of deposit funding declined to 57 bps, or 10.9% compared to the fourth quarter 2011 Rationalization strategies are improving the quality of the deposit base and resulting in a stronger, core-funded balance sheet Total Deposits – March 31, 2012 $5.4 Billion 19% 24% 30% 27% Noninterest-bearing deposits Interest-bearing deposits Savings and MMDA Time deposits
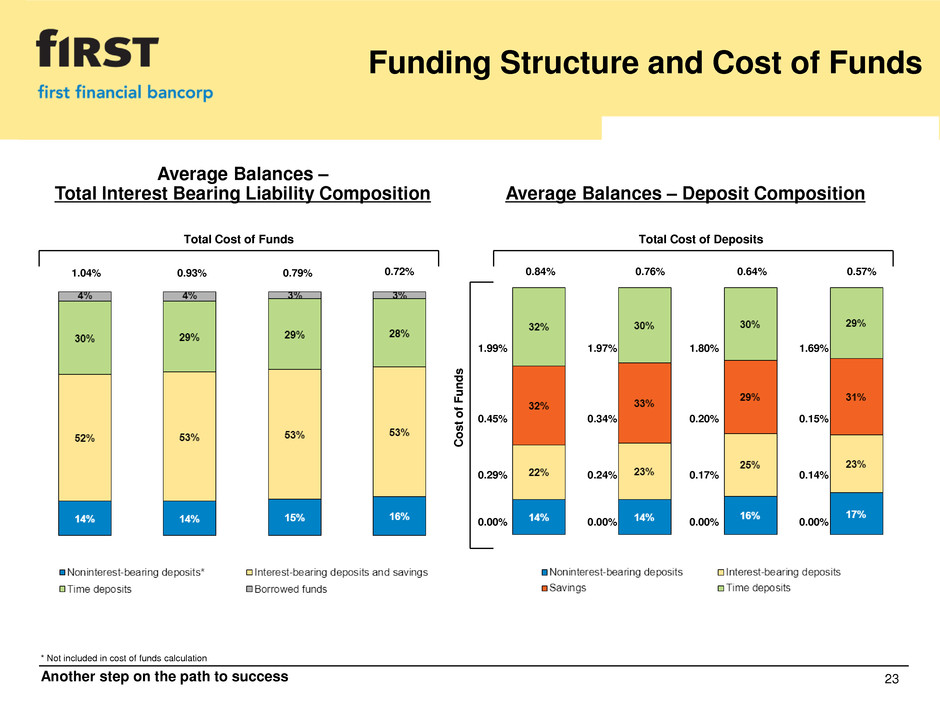
Another step on the path to success 23 1.04% 0.93% 0.79% * Not included in cost of funds calculation Average Balances – Total Interest Bearing Liability Composition Average Balances – Deposit Composition 0.29% 1.99% Co s t of F u n d s Total Cost of Funds Funding Structure and Cost of Funds 0.00% 0.72% 0.24% 1.97% 0.00% 0.17% 1.80% 0.00% 0.15% 1.69% 0.00% 0.45% 0.34% 0.20% 0.14% Total Cost of Deposits 0.57% 0.64% 0.76% 0.84%

Another step on the path to success 24 Investment Portfolio Investment portfolio represents 26.9% of total assets Average balance of investments increased $407.1 million during the first quarter 2012 as cash proceeds from 2011 branch acquisitions have been fully deployed Yield earned on portfolio increased 32 bps during the quarter to 2.57% Overall duration of portfolio increased to 2.6 years during the first quarter 2012 from 2.4 years as of December 31, 2011 As of March 31, 2012 Securities Securities Other Total Percent Tax Equiv. Effective (Dollars in thousands) HTM AFS Investments Securities of Portfolio Yield Duration Agencies 31,394$ 15,052$ -$ 46,446$ 2.7% 2.90% 3.3 CMO - fixed rate 552,577 85,975 - 638,552 37.0% 2.38% 2.6 CMO - variable rate - 225,732 - 225,732 13.1% 0.73% 1.5 MBS - fixed rate 136,678 271,709 - 408,387 23.7% 3.05% 2.5 MBS - variable rate 194,837 77,396 - 272,233 15.8% 2.93% 3.4 Municipal 2,272 8,690 - 10,962 0.6% 7.16% 1.2 Corporate - 40,443 - 40,443 2.3% 5.73% 12.2 Other AFS securities - 11,312 - 11,312 0.7% 3.72% 0.1 Regulatory stock - - 71,492 71,492 4.1% 3.72% - 917,758$ 736,309$ 71,492$ 1,725,559$ 100.0% 2.60% 2.6

Another step on the path to success 25 Covered Loan Balances During the first quarter 2012, the total balance of covered loans decreased $66.6 million, 6.3%, as compared to December 31, 2011 Covered Loan Activity - First Quarter 2012 Reduction in Recorded Investment Due to: December 31, Contractual Net Loans With March 31, (Dollars in thousands) 2011 Sales 1 Prepayments Activity 2 Charge-Offs 3 Coverage Rem. 2012 Commercial 195,892$ -$ 12,656$ 12,546$ 5,757$ -$ 164,933$ Real estate - construction 17,120 - 40 482 (129) - 16,727 Real estate - commercial 637,044 (6,338) 25,117 6,310 2,814 - 609,141 Real estate - residential 121,117 - 3,709 1,941 39 - 115,428 Installment 13,176 - 280 281 536 - 12,079 Home equity 64,978 - 1,778 (2,237) 613 - 64,824 Other covered loans 3,917 - - 430 - - 3,487 Total covered loans 1,053,244$ (6,338)$ 43,580$ 19,753$ 9,630$ -$ 986,619$ 1 Negative amount represents repurchased loan participations associated w ith loans covered under loss share agreements 2 Includes partial paydow ns, accretion of the valuation discount and advances on revolving loans 3 Indemnified at 80% from the FDIC

Another step on the path to success 26 Covered Loan Activity The majority of the loans acquired as part of the FDIC-assisted transactions are accounted for under ASC Topic 310-30 which requires the Company to periodically update its forecast of expected cash flows from these loans. As of March 31, 2012, the allowance for loan and lease losses attributed to valuation of loans accounted for under ASC Topic 310-30 was $46.2 million, an increase of $3.3 million from the fourth quarter 2011. Expected payments from the FDIC, in the form of FDIC loss sharing income, offset approximately 80% of the recorded impairment and charge-offs. Covered loans continue to maintain yields significantly higher than the Company’s uncovered loan portfolio. First Quarter 2012 Results Current Impairment Net Current Projected Life-to- Day 1 Balance as of Period Recapture / Period Improvement Wtd. Avg. Date Projected Dollars in th us nds Mar. 31, 2012 Impairment Relief Impairment Rate Avg. Rate Rate Total loans 910,331$ 11,911$ (8,590)$ 3,321$ 3,333$ 11.01% 1 Allowance for loan and lease losses (46,156) - - - - 0.59% Total net loans 864,175$ 11,911$ (8,590)$ 3,321$ 3 3,333$ 11.60% 2 10.72% 9.10% FDIC indemnification asset 156,397$ NA NA NA NA (5.70%) 1.56% 6.50% Weighted average yield 8.95% 9.47% 8.75% 1 The actual yield realized may be different than the projected yield due to activity that occurs after the periodic valuation. 2 Accretion rates are applied to the net carrying value of the loan w hich includes the allow ance for loan and lease losses. 3 Covered loan provision expense of $12.9 million w as comprised of net charge-offs during the period of $9.6 million and net impairment / (relief) of $3.3 million.

Another step on the path to success 27 Covered Loan Performance While covered loans continue to decline, better than expected performance has resulted in a consistently high yield on the portfolio Improvement and impairment result from quarterly re-estimation of cash flows expectations; net present value of expected cash flows are influenced by the amount and timing of such cash flows $1,336 $1,243 $1,151 $1,053 $987 10.97% 11.03% 11.38% 11.16% 11.15% 1Q11 2Q11 3Q11 4Q11 1Q12 Dollars in millions Covered Loan Balances and Yields Ending Balance of Covered Loans Yield on Covered Loans $(15,062) $(19,489) $2,932 $5,277 $(3,321) $20,718 $777 $1,990 $2,443 $3,333 1Q11 2Q11 3Q11 4Q11 1Q12 Dollars in thousands Quarterly Valuation Results Net (Impairment) / Relief Improvement

Another step on the path to success Components of Credit Losses Covered Assets 28 $4,873 $2,638 $1,998 $3,178 2Q11 3Q11 4Q11 1Q12 Actual Covered Asset Credit Losses For the three months ended March 31, Dollars in thousands 2012 Description Net incremental impairment for period $3,321 Reduction in expected cash flows related to certain loan pools net of prior period impairment relief / recapture Net charge-offs 9,630 Represents actual net charge-offs of the recorded investment in covered loans during the period 1 Provision for loan and lease losses - covered 12,951 Loss on sale - covered OREO 1,292 Other credit-related expenses 1,751 Total gross credit losses $15,994 FDIC loss share income $12,816 Represents receivable due from FDIC on estimated credit (Noninterest income) losses; calculated as approximately 80% of gross credit losses related to covered assets $3,178 Difference between these two amounts represents actual credit costs for the period 1 Investment in covered loans originally recorded at less than unpaid principal balance to reflect anticipated credit losses at time of acquisition

Another step on the path to success 29 Comparison of Financial Impact 1 Extreme Cases If all acquired loans were to prepay immediately, diluted EPS would benefit by $0.84 per share as of the first quarter 2012 The absolute worst case scenario – a 100% loss on all acquired loans – would negatively impact diluted EPS by $0.99 per share as of the first quarter 2012 The tables below present a comparison of the impact on diluted earnings per share under various scenarios Best Estimate If only ASC Topic 310-30 loans were to pay as expected, the benefit to after-tax revenue per diluted share would be $3.29, earned over the remaining life of the portfolio. Current weighted average life is approximately 3.5 years. Extreme Scenarios - All Acquired Loans Payment as Expected Recognition of Noninterest Income Estimated Maximum Credit Loss Exposure Recognition of Interest Income Assumes All Acquired Loans Prepay Immediately Assumes 100% Loss on Total UPB Assumes Loans Amortize Over Expected Life As of As of As of Dollars in millions 3/31/12 12/31/11 Dollars in millions 3/31/12 12/31/11 Dollars in millions 3/31/12 12/31/11 Unamortized discount $166 $189 FFBC share of stated loss threshold $114 $116 Total expected cash flows $1,226 $1,320 FDIC indemnification asset 1 (136) (144) FFBC share of max. additional losses 52 58 Recorded investment 914 977 Allowance for loan losses - covered 46 43 Maximum possible credit loss 166 174 Total accretable difference 312 343 Discount net of indemnification asset FDIC indemnification asset 1 136 144 FDIC indemnification asset 3 (14) (17) and allowa ce $76 $88 Unamortized discount (166) (189) Total net accretable difference $298 $326 Allowance for loan losses - acquired (46) (43) Adjusted max. possible credit loss $90 $86 Impac of i ediate recognition of Impact of immediate recognition of Impact of accretable difference on unamortized discount on after-tax additional credit losses on after-tax after-tax revenue per diluted share diluted earnings per share 2 $0.84 $0.97 diluted earnings per share 2 ($0.99) ($0.95) over the expected life of the loans 2 $3.29 $3.61 1 Represents the amount presented on the balance sheet less claims submitted to the FDIC but not yet received and FDIC indemnification related to OREO 2 Based on first quarter 2012 average diluted common shares outstanding of 58,881,043 and fourth quarter 2011 average diluted common shares outstanding of 58,672,575; tax rate of 35% applied 3 Pro jected amortization of FDIC indemnification asset over average expected life of portfo lio
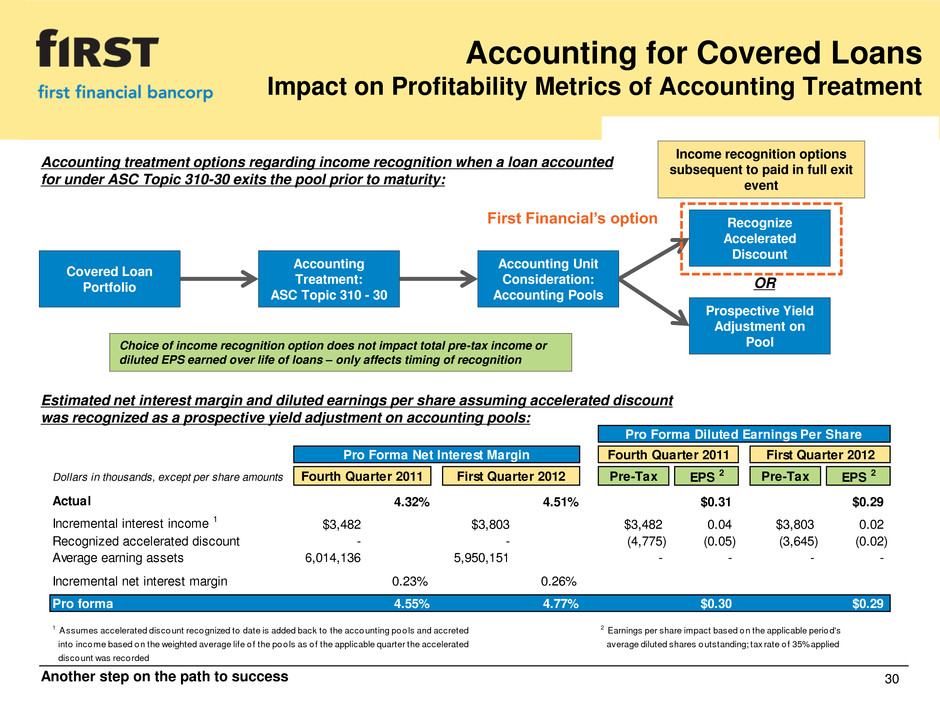
Another step on the path to success 30 Accounting for Covered Loans Impact on Profitability Metrics of Accounting Treatment Covered Loan Portfolio Accounting Treatment: ASC Topic 310 - 30 Accounting Unit Consideration: Accounting Pools Prospective Yield Adjustment on Pool Recognize Accelerated Discount Accounting treatment options regarding income recognition when a loan accounted for under ASC Topic 310-30 exits the pool prior to maturity: Income recognition options subsequent to paid in full exit event OR First Financial’s option Estimated net interest margin and diluted earnings per share assuming accelerated discount was recognized as a prospective yield adjustment on accounting pools: Choice of income recognition option does not impact total pre-tax income or diluted EPS earned over life of loans – only affects timing of recognition Pro Forma Diluted Earnings Per Share Pro Forma Net Interest Margin Fourth Quarter 2011 First Quarter 2012 D llars in thou ands, except per share amounts Fourth Quarter 2011 First Quarter 2012 Pre-Tax EPS 2 Pre-Tax EPS 2 Actual 4.32% 4.51% $0.31 $0.29 Incremental interest income 1 $3,482 $3,803 $3,482 0.04 $3,803 0.02 R gnized accelerated discount - - (4,775) (0.05) (3,645) (0.02) Avera ear ing assets 6,014,136 5,950,151 - - - - Incremental net interest margin 0.23% 0.26% Pro forma 4.55% 4.77% $0.30 $0.29 1 Assumes accelerated discount recognized to date is added back to the accounting pools and accreted 2 Earnings per share impact based on the applicable period's into income based on the weighted average life of the pools as of the applicable quarter the accelerated average diluted shares outstanding; tax rate of 35% applied discount was recorded

Another step on the path to success 31 Liberty Savings Bank Branch Acquisition Branch Map and Deposit Market Share Significantly enhances presence in key market of Dayton Deposit composition and cost of funds similar to existing First Financial deposit base Strong growth potential in all business lines under First Financial brand Positions First Financial as largest community bank operating in the Dayton MSA Southwestern Ohio Pro Forma Deposit Market Share Dayton, OH MSA FDIC Deposit Data as of June 30, 2011 - Holding Company Level Number Total Market 2011 of Deposits Share Rank Name City, State Branches ($000s) (%) 1 Fi fth Third Bancorp Cincinnati , OH 47 2,423,183$ 23.3 2 JPMorgan Chase & Co. New York, NY 33 1,701,335 16.4 3 PNC Financia l Services Grp Inc. Pi ttsburgh, PA 32 1,549,300 14.9 4 KeyCorp Cleveland, OH 20 1,054,931 10.1 5 U.S. Bancorp Minneapol is , MN 30 756,701 7.3 6 Huntington Bancshares Inc. Columbus, OH 12 584,777 5.6 7 Pro Forma First Financial Bancorp Cincinnati, OH 16 466,620 4.5 7 U.S. Bancorp Cincinnati , OH 5 423,480 4.1 8 Liberty Capital Inc. Wilmington, OH 12 295,022 2.8 9 Park National Corp. Newark, OH 9 291,026 2.8 10 First Financial Bancorp. Cincinnati, OH 4 171,598 1.7 Other institutions 52 992,322 9.5 Market total 261 10,405,113$ 100.0 Source: SNL Financial LC

Another step on the path to success 32 Flagstar Bank Branch Acquisition Branch Map and Deposit Market Share Indiana Pro Forma Deposit Market Share Indianapolis, IN MSA FDIC Deposit Data as of June 30, 2011 - Holding Company Level Number Total Market 2011 of Deposits Share Rank Name City, State Branches ($000s) (%) 1 JPMorgan Chase & Co. New York, NY 83 7,762,689$ 25.0 2 PNC Financia l Services Grp Inc. Pi ttsburgh, PA 71 6,899,386 22.2 3 Fi fth Third Bancorp Cincinnati , OH 47 2,817,795 9.1 4 BMO Financia l Group Toronto, ON 42 2,254,450 7.3 5 Huntington Bancshares Inc. Columbus, OH 45 2,061,363 6.6 6 Natl Bank of Indianapol is Corp. Indianapol is , IN 12 1,210,994 3.9 7 Regions Financia l Corp. Birmingham, AL 29 1,207,981 3.9 8 KeyCorp Cleveland, OH 34 1,207,717 3.9 9 Old National Bancorp Evansvi l le, IN 51 762,100 2.5 10 Firs t Merchants Corp. Muncie, IN 17 596,578 1.9 11 Pro Forma First Financial Bancorp Cincinnati, OH 23 519,359 1.7 15 First Financial Bancorp. Cincinnati, OH 5 260,220 0.8 16 Flagstar Bancorp Inc. Troy, MI 18 259,139 0.8 Other institutions 138 3,801,648 12.2 Market total 592 31,102,060$ 100.0 Source: SNL Financial LC Note: Flagstar Indiana deposits do not include deposits held by Indiana-based public entities Significantly enhances presence in key market of Indianapolis Demographically desirable branch locations Strong growth potential in all business lines under First Financial brand High scarcity value – few acquisitions targets available in market with similar scale and footprint

Another step on the path to success 33 Another step on the path to success


