First Financial Bancorp Investor Presentation Fourth Quarter 2012 EXHIBIT 99.1
2 Certain statements contained in this presentation which are not statements of historical fact constitute forward-looking statements within the meaning of the Private Securities Litigation Reform Act (the ‘‘Act’’). In addition, certain statements in future filings by First Financial with the SEC, in press releases, and in oral and written statements made by or with the approval of First Financial which are not statements of historical fact constitute forward-looking statements within the meaning of the Act. Examples of forward-looking statements include, but are not limited to, projections of revenues, income or loss, earnings or loss per share, the payment or non-payment of dividends, capital structure and other financial items, statements of plans and objectives of First Financial or its management or board of directors, and statements of future economic performances and statements of assumptions underlying such statements. Words such as ‘‘believes,’’ ‘‘anticipates,’’ “likely,” “expected,” ‘‘intends,’’ and other similar expressions are intended to identify forward-looking statements but are not the exclusive means of identifying such statements. Management’s analysis contains forward-looking statements that are provided to assist in the understanding of anticipated future financial performance. However, such performance involves risks and uncertainties that may cause actual results to differ materially. Factors that could cause actual results to differ from those discussed in the forward-looking statements include, but are not limited to: • management’s ability to effectively execute its business plan; • the risk that the strength of the United States economy in general and the strength of the local economies in which we conduct operations may continue to deteriorate resulting in, among other things, a further deterioration in credit quality or a reduced demand for credit, including the resultant effect on our loan portfolio, allowance for loan and lease losses and overall financial performance; • U.S. fiscal debt and budget matters; • the ability of financial institutions to access sources of liquidity at a reasonable cost; • the impact of recent upheaval in the financial markets and the effectiveness of domestic and international governmental actions taken in response, and the effect of such governmental actions on us, our competitors and counterparties, financial markets generally and availability of credit specifically, and the U.S. and international economies, including potentially higher FDIC premiums arising from increased payments from FDIC insurance funds as a result of depository institution failures; • the effect of and changes in policies and laws or regulatory agencies (notably the recently enacted Dodd-Frank Wall Street Reform and Consumer Protection Act); • the effect of the current low interest rate environment or changes in interest rates on our net interest margin and our loan originations and securities holdings; • our ability to keep up with technological changes; • failure or breach of our operational or security systems or infrastructure, or those of our third party vendors and other service providers; • our ability to comply with the terms of loss sharing agreements with the FDIC; • mergers and acquisitions, including costs or difficulties related to the integration of acquired companies and the wind-down of non-strategic operations that may be greater than expected, such as the risks and uncertainties associated with the Irwin Mortgage Corporation bankruptcy proceedings and other acquired subsidiaries; • the risk that exploring merger and acquisition opportunities may detract from management’s time and ability to successfully manage our company; • expected cost savings in connection with the consolidation of recent acquisitions may not be fully realized or realized within the expected time frames, and deposit attrition, customer loss and revenue loss following completed acquisitions may be greater than expected; • our ability to increase market share and control expenses; • the effect of changes in accounting policies and practices, as may be adopted by the regulatory agencies as well as the Financial Accounting Standards Board and the SEC; • adverse changes in the securities, debt and/or derivatives markets; • our success in recruiting and retaining the necessary personnel to support business growth and expansion and maintain sufficient expertise to support increasingly complex products and services; • monetary and fiscal policies of the Board of Governors of the Federal Reserve System (Federal Reserve) and the U.S. government and other governmental initiatives affecting the financial services industry; • our ability to manage loan delinquency and charge-off rates and changes in estimation of the adequacy of the allowance for loan losses; and • the costs and effects of litigation and of unexpected or adverse outcomes in such litigation. In addition, please refer to our Annual Report on Form 10-K for the year ended December 31, 2011, as well as our other filings with the SEC, for a more detailed discussion of these risks and uncertainties and other factors. Such forward-looking statements are meaningful only on the date when such statements are made, and First Financial undertakes no obligation to update any forward-looking statement to reflect events or circumstances after the date on which such a statement is made to reflect the occurrence of unanticipated events. Forward Looking Statement Disclosure

3 Focused Business Strategy Client intimate strategy focused on long-term, profitable relationships with clients Strong sales culture across all business lines Lines of business Commercial Retail Wealth Management Target clients – individuals and small / mid-size businesses located in-market Ohio, Indiana and Kentucky 124 locations with focus on metro and near-metro markets Primary focus and value creation is through organic growth in key regional markets Key initiatives for additional revenue growth Specialty finance Mortgage
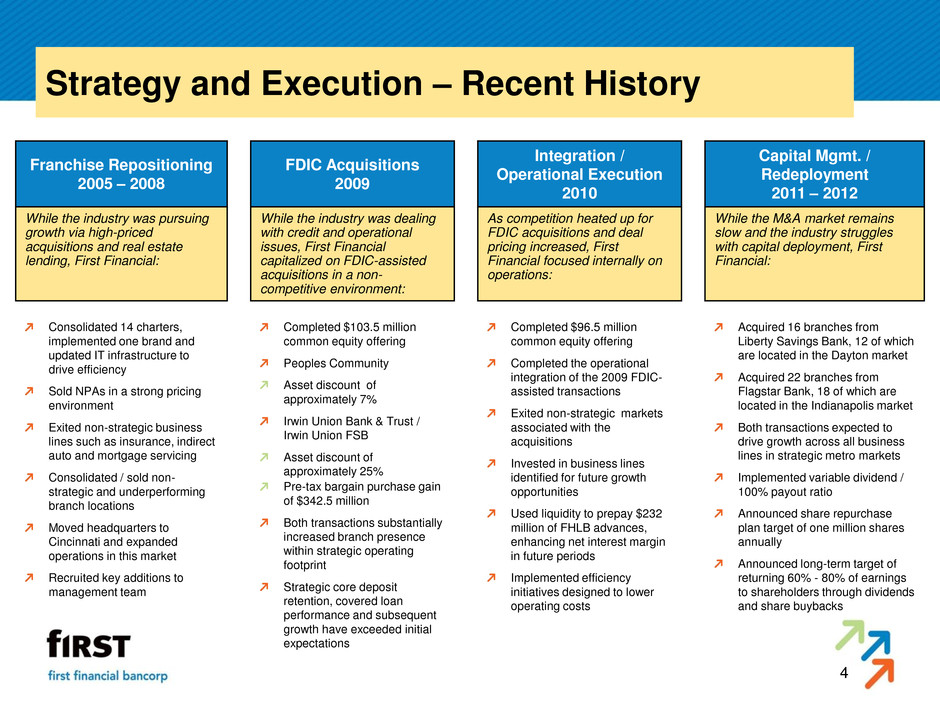
4 Strategy and Execution – Recent History Franchise Repositioning 2005 – 2008 FDIC Acquisitions 2009 Integration / Operational Execution 2010 Capital Mgmt. / Redeployment 2011 – 2012 While the industry was pursuing growth via high-priced acquisitions and real estate lending, First Financial: While the industry was dealing with credit and operational issues, First Financial capitalized on FDIC-assisted acquisitions in a non- competitive environment: As competition heated up for FDIC acquisitions and deal pricing increased, First Financial focused internally on operations: While the M&A market remains slow and the industry struggles with capital deployment, First Financial: Consolidated 14 charters, implemented one brand and updated IT infrastructure to drive efficiency Sold NPAs in a strong pricing environment Exited non-strategic business lines such as insurance, indirect auto and mortgage servicing Consolidated / sold non- strategic and underperforming branch locations Moved headquarters to Cincinnati and expanded operations in this market Recruited key additions to management team Completed $103.5 million common equity offering Peoples Community Asset discount of approximately 7% Irwin Union Bank & Trust / Irwin Union FSB Asset discount of approximately 25% Pre-tax bargain purchase gain of $342.5 million Both transactions substantially increased branch presence within strategic operating footprint Strategic core deposit retention, covered loan performance and subsequent growth have exceeded initial expectations Completed $96.5 million common equity offering Completed the operational integration of the 2009 FDIC- assisted transactions Exited non-strategic markets associated with the acquisitions Invested in business lines identified for future growth opportunities Used liquidity to prepay $232 million of FHLB advances, enhancing net interest margin in future periods Implemented efficiency initiatives designed to lower operating costs Acquired 16 branches from Liberty Savings Bank, 12 of which are located in the Dayton market Acquired 22 branches from Flagstar Bank, 18 of which are located in the Indianapolis market Both transactions expected to drive growth across all business lines in strategic metro markets Implemented variable dividend / 100% payout ratio Announced share repurchase plan target of one million shares annually Announced long-term target of returning 60% - 80% of earnings to shareholders through dividends and share buybacks
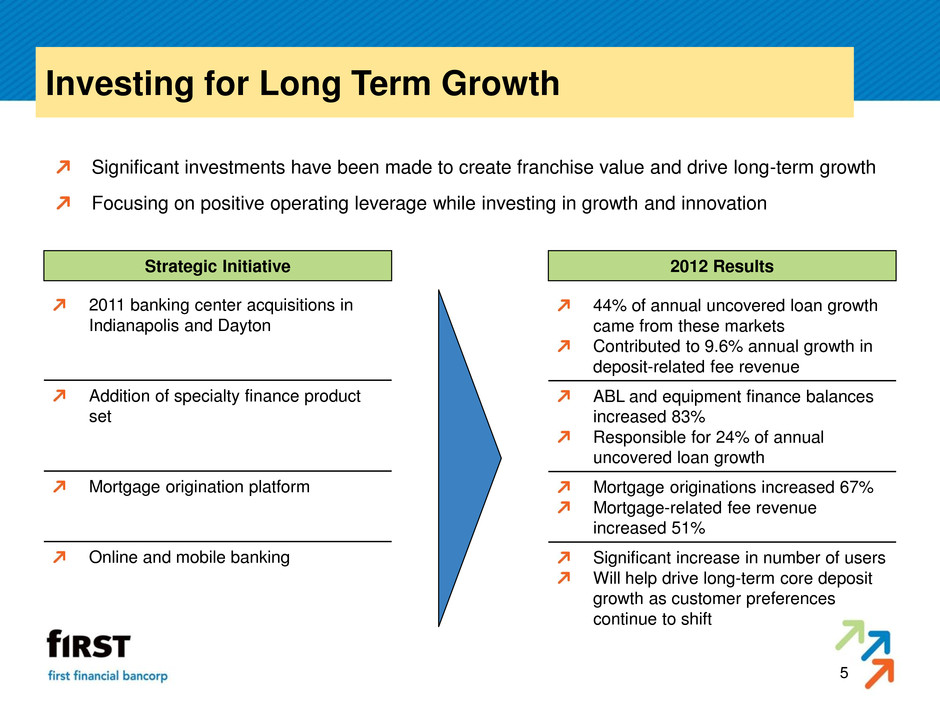
5 Investing for Long Term Growth Significant investments have been made to create franchise value and drive long-term growth Focusing on positive operating leverage while investing in growth and innovation Strategic Initiative 2012 Results 44% of annual uncovered loan growth came from these markets Contributed to 9.6% annual growth in deposit-related fee revenue ABL and equipment finance balances increased 83% Responsible for 24% of annual uncovered loan growth Mortgage originations increased 67% Mortgage-related fee revenue increased 51% Significant increase in number of users Will help drive long-term core deposit growth as customer preferences continue to shift 2011 banking center acquisitions in Indianapolis and Dayton Addition of specialty finance product set Mortgage origination platform Online and mobile banking
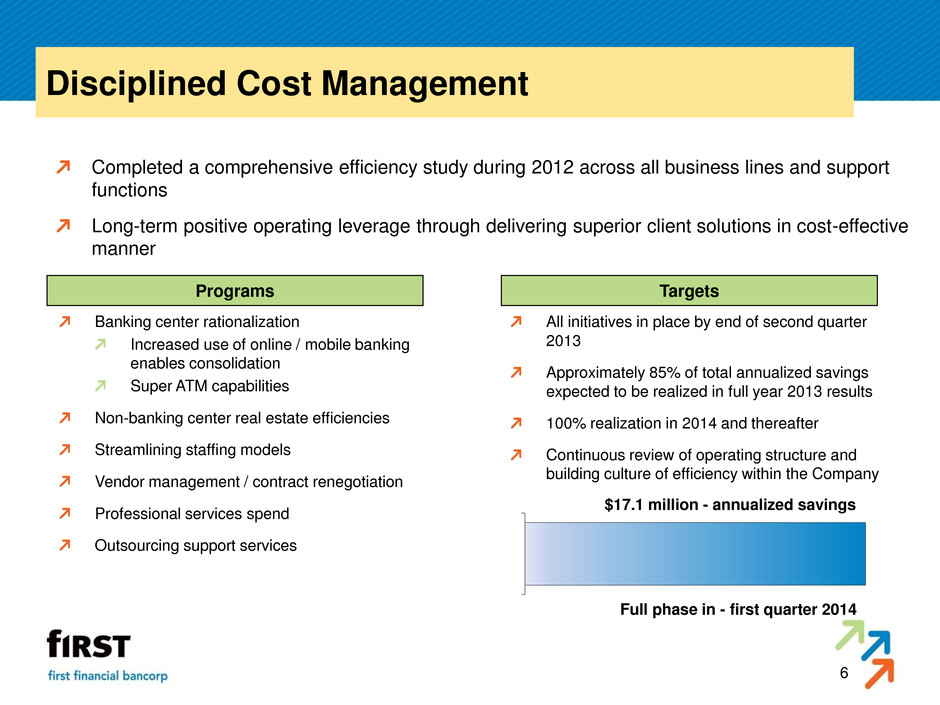
6 Disciplined Cost Management Completed a comprehensive efficiency study during 2012 across all business lines and support functions Long-term positive operating leverage through delivering superior client solutions in cost-effective manner Programs Targets Banking center rationalization Increased use of online / mobile banking enables consolidation Super ATM capabilities Non-banking center real estate efficiencies Streamlining staffing models Vendor management / contract renegotiation Professional services spend Outsourcing support services All initiatives in place by end of second quarter 2013 Approximately 85% of total annualized savings expected to be realized in full year 2013 results 100% realization in 2014 and thereafter Continuous review of operating structure and building culture of efficiency within the Company Full phase in - first quarter 2014 $17.1 million - annualized savings

7 Franchise Summary Comparison Consistent and solid profitability LTM ROAA of 1.07% compared to peer median of 0.96% LTM ROAE of 9.43% compared to peer median of 8.34% LTM net interest margin of 4.37% compared to peer median of 3.69% Capital levels extremely robust and have capacity to support significant asset growth Tangible common equity of 9.50% compared to peer median of 8.66% Total capital ratio of 17.60% compared to peer median of 14.70% Estimated asset growth capacity of approximately $1.4 billion under current regulatory guidelines Dividend payout ratio of 100% and yield of 7.3% Peer median LTM dividend payout ratio of 37.5% Peer median dividend yield 2.54% Low risk balance sheet Risk weighted assets / total assets of 60% compared to peer median of 69% Quarterly return on average risk weighted assets of 1.68% compared to peer median of 1.35% Peer Group comprised of the component banks within the KBW Regional Bank Index (49 total companies excluding First Financial); peer median data as of December 31, 2012 except for risk weighted asset data which is as of September 30, 2012. Dividend valuation data as of February 4, 2013. Source: Peer Group median data obtained from SNL Financial

8 Fourth Quarter 2012 Financial Highlights Quarterly net income of $16.3 million, or $0.28 per diluted common share Adjusted pre-tax, pre-provision income increased $4.2 million, or 17.1%, to $28.6 million Continued solid profitability Return on average assets of 1.03% Return on average risk-weighted assets of 1.68% Return on average shareholders’ equity of 9.06% Quarterly net interest margin increased to 4.27% from 4.21% for the linked quarter Excluding a $2.2 million prepayment fee, net interest margin declined 10 bps to 4.11% Cost of deposit funding continues to improve as a result of strategic initiatives Uncovered loan balances increased $113.0 million, or 14.7% on an annualized basis Strong growth in C&I, commercial real estate, specialty finance and residential mortgage Uncovered loan growth exceeded covered loan decline by $35.6 million Significant core deposit growth as non-time deposit balances increased 15.1% on an annualized basis Classified assets declined $4.3 million, or 3.3%, compared to the linked quarter and $33.3 million, or 20.5%, compared to December 31, 2011

9 Pre-Tax, Pre-Provision Income Trend Adjusted pre-tax, pre-provision income represents income before taxes plus provision for all loans less FDIC loss share income and accelerated discount adjusted for significant nonrecurring items The increase in fourth quarter 2012 adjusted PTPP income was driven primarily by an increase in net interest income, including a $2.2 million prepayment fee, and improvements in noninterest income and expense $31,468 $31,191 $30,178 $24,389 $28,561 1.92% 1.94% 1.92% 1.57% 1.81% 4Q11 1Q12 2Q12 3Q12 4Q12 (Dollars in thousands) Adjusted PTPP Income Adjusted PTPP / Average Assets
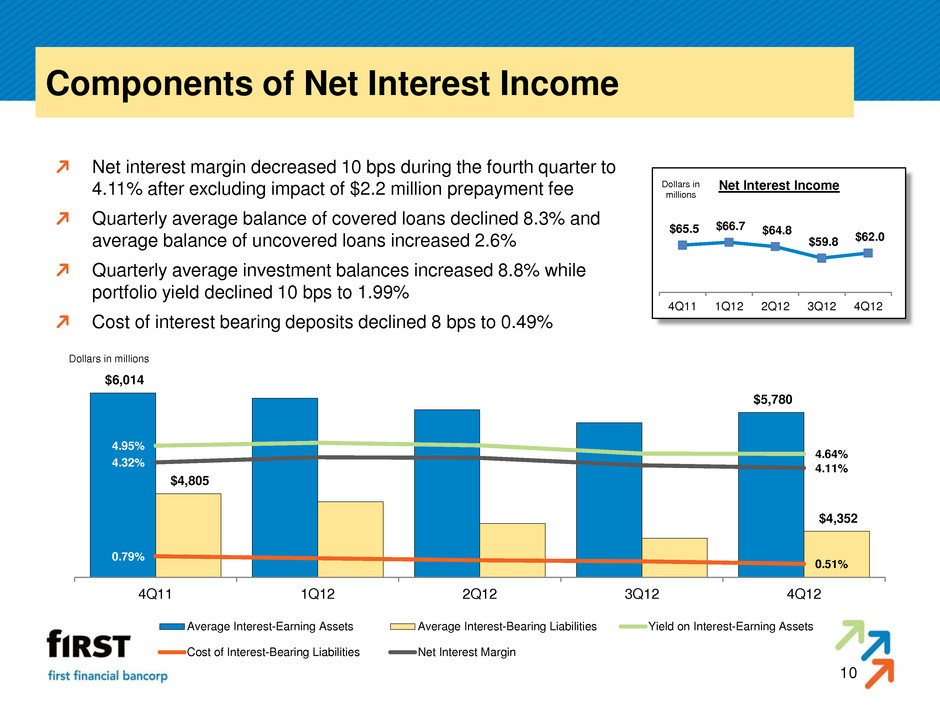
10 Components of Net Interest Income Net interest margin decreased 10 bps during the fourth quarter to 4.11% after excluding impact of $2.2 million prepayment fee Quarterly average balance of covered loans declined 8.3% and average balance of uncovered loans increased 2.6% Quarterly average investment balances increased 8.8% while portfolio yield declined 10 bps to 1.99% Cost of interest bearing deposits declined 8 bps to 0.49% $65.5 $66.7 $64.8 $59.8 $62.0 4Q11 1Q12 2Q12 3Q12 4Q12 Dollars in millions Net Interest Income $6,014 $5,780 $4,805 $4,352 4.95% 4.64% 0.79% 0.51% 4.32% 4.11% 4Q11 1Q12 2Q12 3Q12 4Q12 Dollars in millions Average Interest-Earning Assets Average Interest-Bearing Liabilities Yield on Interest-Earning Assets Cost of Interest-Bearing Liabilities Net Interest Margin
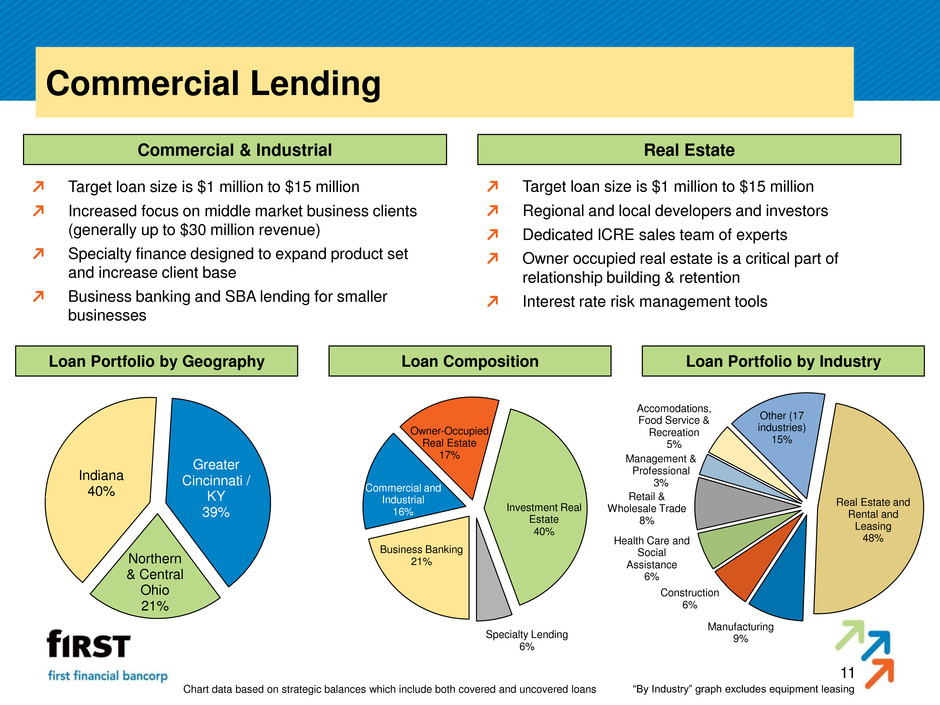
11 Commercial Lending Commercial & Industrial Real Estate Loan Portfolio by Geography Loan Portfolio by Industry Target loan size is $1 million to $15 million Increased focus on middle market business clients (generally up to $30 million revenue) Specialty finance designed to expand product set and increase client base Business banking and SBA lending for smaller businesses Target loan size is $1 million to $15 million Regional and local developers and investors Dedicated ICRE sales team of experts Owner occupied real estate is a critical part of relationship building & retention Interest rate risk management tools “By Industry” graph excludes equipment leasing Loan Composition Chart data based on strategic balances which include both covered and uncovered loans Indiana 40% Greater Cincinnati / KY 39% Northern & Central Ohio 21% Business Banking 21% Commercial and Industrial 16% Owner-Occupied Real Estate 17% Investment Real Estate 40% Specialty Lending 6% Real Estate and Rental and Leasing 48% Manufacturing 9% Construction 6% Health Care and Social Assistance 6% Retail & Wholesale Trade 8% Management & Professional 3% Accomodations, Food Service & Recreation 5% Other (17 industries) 15%

12 Retail Lending $1.1 billion in total strategic loans, including home equity, mortgage, business banking and credit cards Serving retail households in Ohio, Indiana and Kentucky markets Mortgage loan originators located across footprint with concentrations in Cincinnati, Dayton and Indianapolis Business banking sales managers located in sales centers Revenue Contribution Loan Composition Loan Portfolio by Geography Chart data based on strategic balances which include both covered and uncovered loans Greater Cincinnati/KY 44% Indiana 27% Northern & Central Ohio 24% Corporate 5% Home Equity/ Installment 42% Residential Mortgage 39% Business Banking 16% Credit Cards 3% Other <1% Home Equity and Installment 41% Residential Mortgage 36% Business Banking 12% Credit Cards 8% Other 3%
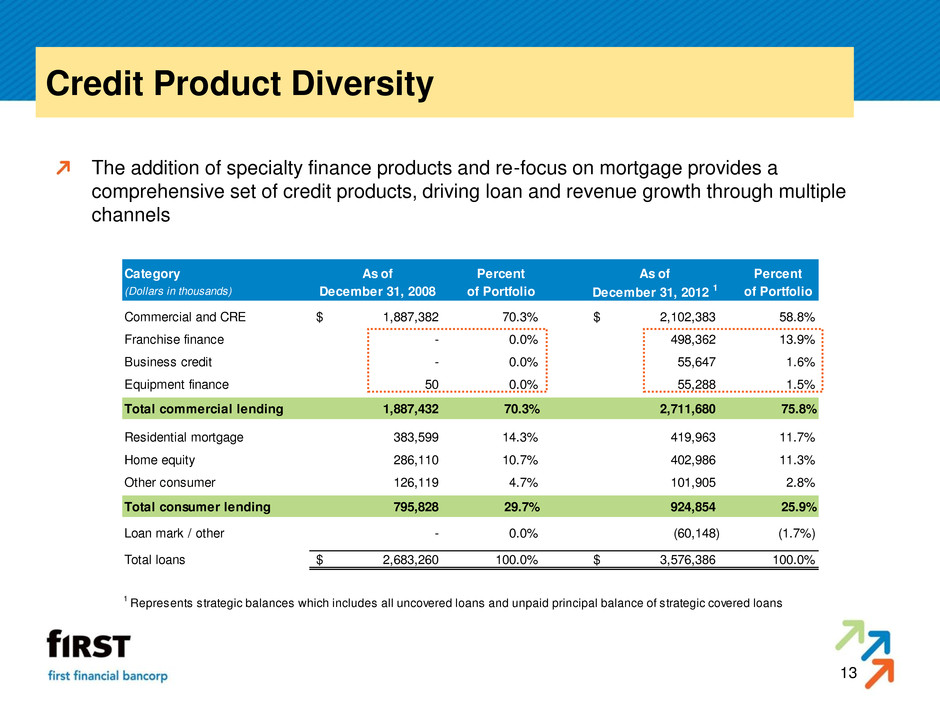
13 Credit Product Diversity The addition of specialty finance products and re-focus on mortgage provides a comprehensive set of credit products, driving loan and revenue growth through multiple channels Category As of Percent As of Percent (Dollars in thousands) December 31, 2008 of Portfolio December 31, 2012 1 of Portfolio Commercial and CRE 1,887,382$ 70.3% 2,102,383$ 58.8% Franchise finance - 0.0% 498,362 13.9% Business credit - 0.0% 55,647 1.6% Equipment finance 50 0.0% 55,288 1.5% Total commercial lending 1,887,432 70.3% 2,711,680 75.8% Residential mortgage 383,599 14.3% 419,963 11.7% Home equity 286,110 10.7% 402,986 11.3% Other consumer 126,119 4.7% 101,905 2.8% Total consumer lending 795,828 29.7% 924,854 25.9% Loan mark / other - 0.0% (60,148) (1.7%) Total loans 2,683,260$ 100.0% 3,576,386$ 100.0% 1 Represents strategic balances which includes all uncovered loans and unpaid principal balance of strategic covered loans

14 Building the “fIRST” Brand Significant growth in brand awareness Award-winning sales center prototype Proactive marketing and media relations Expands presence and market share Deeper relationships and differentiated client experience 2012 Metropolitan Brand Awareness Cincinnati 64% Dayton 47% Indianapolis 40%
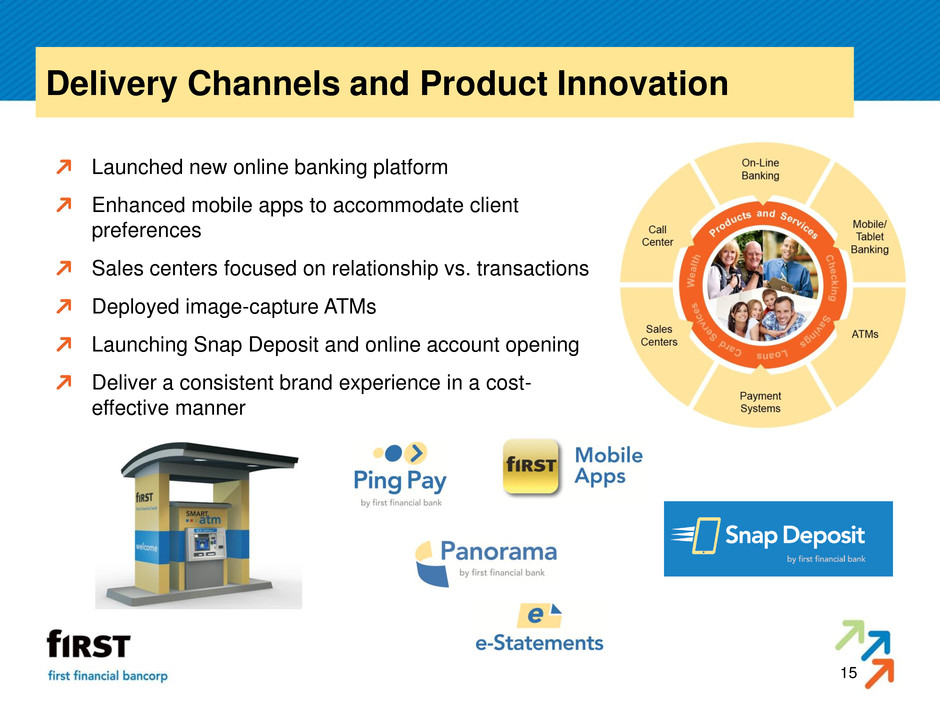
15 Delivery Channels and Product Innovation Launched new online banking platform Enhanced mobile apps to accommodate client preferences Sales centers focused on relationship vs. transactions Deployed image-capture ATMs Launching Snap Deposit and online account opening Deliver a consistent brand experience in a cost- effective manner

16 Capital Management Current dividend policy consists of a 100% payout ratio comprised of two components: Regular dividend based on payout of between 40% - 60% of earnings; currently $0.15 per share Variable dividend based on the remainder of quarterly EPS; $0.13 per share based on fourth quarter results Variable dividend will continue through 2013 unless the Company’s capital position changes materially or capital deployment opportunities arise Announced a share repurchase plan targeting one million shares annually beginning in the fourth quarter Repurchased 460,500 shares during the fourth quarter and an additional 84,000 shares during the first quarter 2013 When combined with the dividend policy, returned 110.8% of 2012 full year net income to shareholders during 2012 As both the variable dividend and the share repurchase plan are expected to remain in place during 2013, the return of capital to shareholders is expected to exceed 100% of earnings throughout the year On a long term basis, expectation is to return to shareholders a target range of 60% - 80% of earnings through combination of the regular dividend and share repurchases Despite strong capital return levels, the Company expects to maintain capital ratios that exceed internal target thresholds, current regulatory requirements and the proposed requirements under Basel III – while retaining capital to support growth opportunities
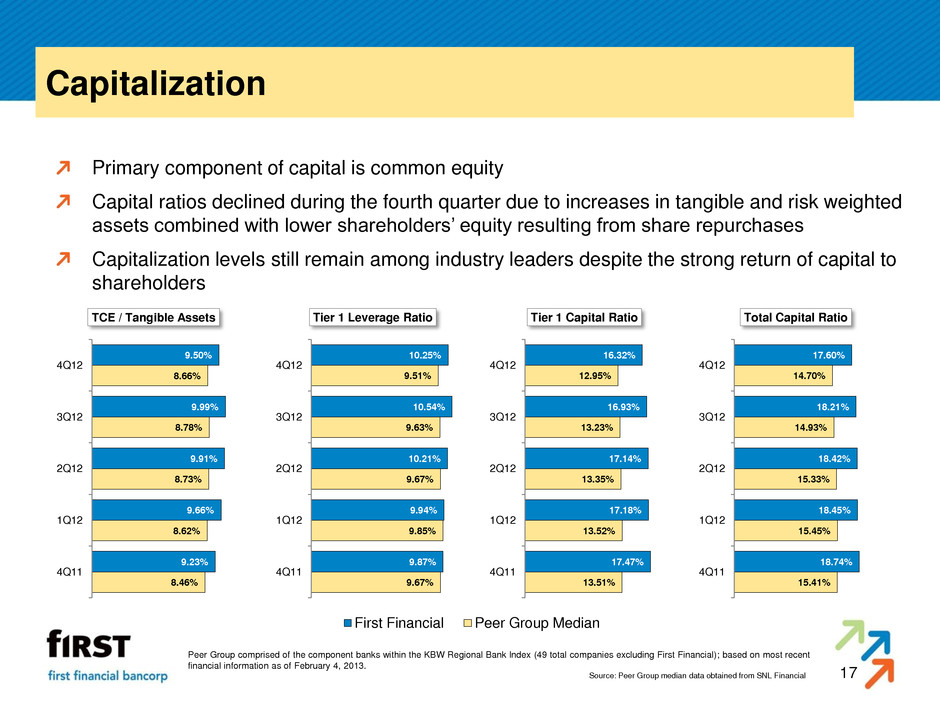
17 Capitalization Primary component of capital is common equity Capital ratios declined during the fourth quarter due to increases in tangible and risk weighted assets combined with lower shareholders’ equity resulting from share repurchases Capitalization levels still remain among industry leaders despite the strong return of capital to shareholders 10.38% 10.33% 10.40% 11.11% 10.38%7.96% 8.06% 8.28% 8.12% 8.39% 3Q10 4Q1 1Q11 2Q1 3Q11 First Financial Peer Group Median Peer Group comprised of the component banks within the KBW Regional Bank Index (49 total companies excluding First Financial); based on most recent financial information as of February 4, 2013. Source: Peer Group median data obtained from SNL Financial 8.46% 8.62% 8.73% 8.78% 8.66% 9.23% 9.66% 9.91% 9.99% 9.50% 4Q11 1Q12 2Q12 3Q12 4Q12 TCE / Tangible Assets 9.67% 9.85% 9.67% 9.63% 9.51% 9.87% 9.94% 10.21% 10.54% 10.25% 4Q11 1Q12 2Q12 3Q12 4Q12 Tier 1 Leverage Ratio 13.51% 13.52% 13.35% 13.23% 12.95% 17.47% 17.18% 17.14% 16.93% 16.32% 4Q11 1Q12 2Q12 3Q12 4Q12 Tier 1 Capital Ratio 15.41% 15.45% 15.33% 14.93% 14.70% 18.74% 18.45% 18.42% 18.21% 17.60% 4Q11 1Q12 2Q12 3Q12 4Q12 T tal Capital Ratio
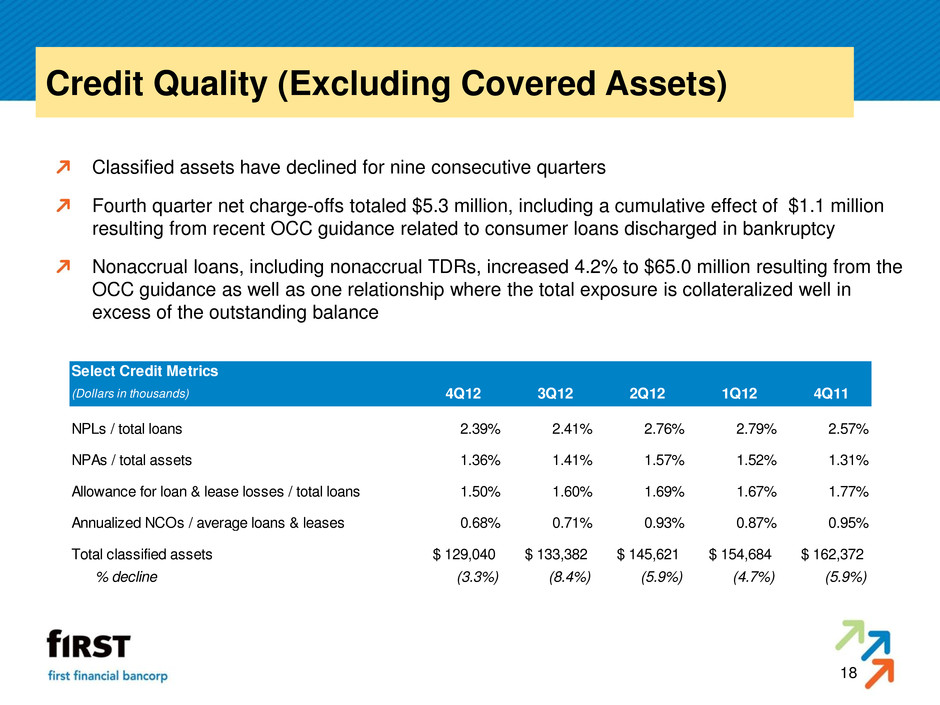
18 Credit Quality (Excluding Covered Assets) Classified assets have declined for nine consecutive quarters Fourth quarter net charge-offs totaled $5.3 million, including a cumulative effect of $1.1 million resulting from recent OCC guidance related to consumer loans discharged in bankruptcy Nonaccrual loans, including nonaccrual TDRs, increased 4.2% to $65.0 million resulting from the OCC guidance as well as one relationship where the total exposure is collateralized well in excess of the outstanding balance Select Credit Metrics (Dollars in thousands) 4Q12 3Q12 2Q12 1Q12 4Q11 NPL / total loans 2.39% 2.41% 2.76% 2.79% 2.57% PAs / total assets 1.36% 1.41% 1.57% 1.52% 1.31% Allowance for loan & lease losses / total loans 1.50% 1.60% 1.69% 1.67% 1.77% Annualized NCOs / average loans & leases 0.68% 0.71% 0.93% 0.87% 0.95% Total classified assets 129,040$ 133,382$ 145,621$ 154,684$ 162,372$ % decline (3.3%) (8.4%) (5.9%) (4.7%) (5.9%)
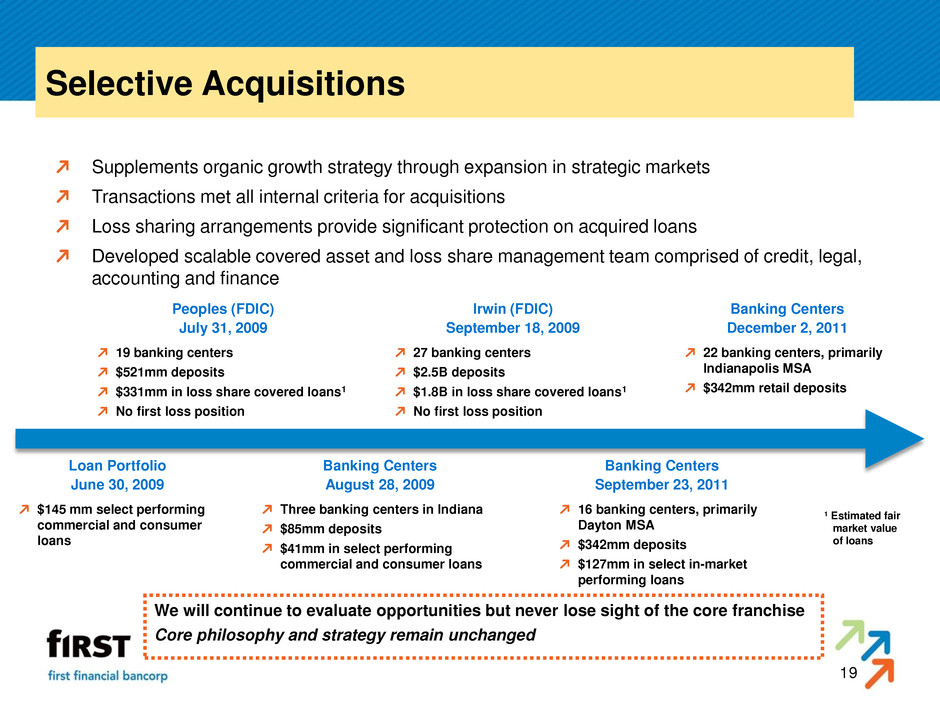
19 Selective Acquisitions Supplements organic growth strategy through expansion in strategic markets Transactions met all internal criteria for acquisitions Loss sharing arrangements provide significant protection on acquired loans Developed scalable covered asset and loss share management team comprised of credit, legal, accounting and finance Peoples (FDIC) July 31, 2009 19 banking centers $521mm deposits $331mm in loss share covered loans1 No first loss position Irwin (FDIC) September 18, 2009 27 banking centers $2.5B deposits $1.8B in loss share covered loans1 No first loss position Banking Centers December 2, 2011 22 banking centers, primarily Indianapolis MSA $342mm retail deposits Loan Portfolio June 30, 2009 $145 mm select performing commercial and consumer loans Banking Centers August 28, 2009 Three banking centers in Indiana $85mm deposits $41mm in select performing commercial and consumer loans Banking Centers September 23, 2011 16 banking centers, primarily Dayton MSA $342mm deposits $127mm in select in-market performing loans 1 Estimated fair market value of loans We will continue to evaluate opportunities but never lose sight of the core franchise Core philosophy and strategy remain unchanged
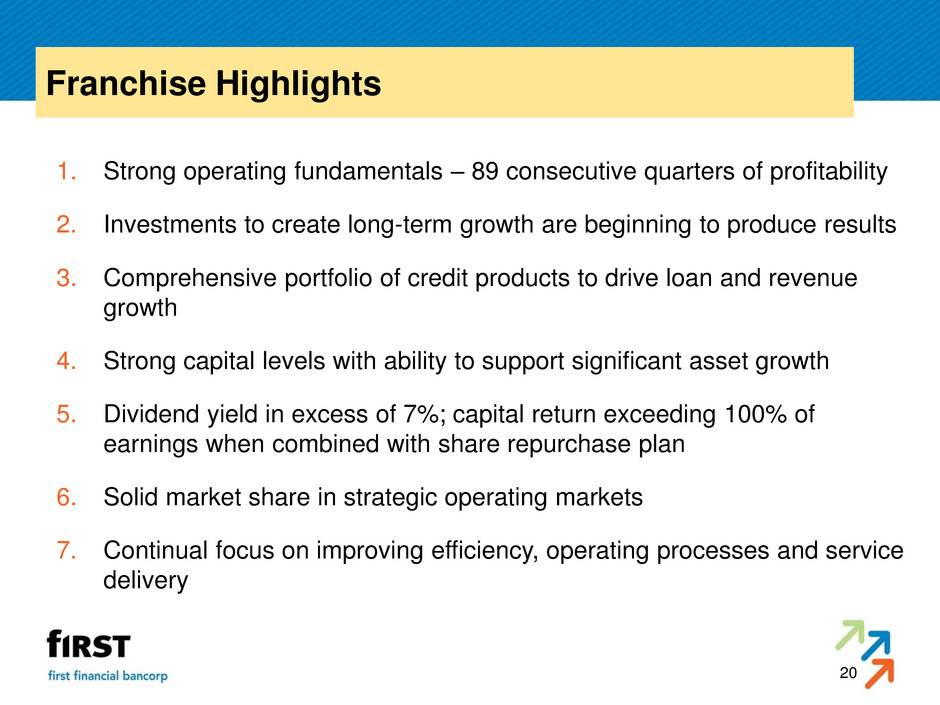
20 Franchise Highlights 1. Strong operating fundamentals – 89 consecutive quarters of profitability 2. Investments to create long-term growth are beginning to produce results 3. Comprehensive portfolio of credit products to drive loan and revenue growth 4. Strong capital levels with ability to support significant asset growth 5. Dividend yield in excess of 7%; capital return exceeding 100% of earnings when combined with share repurchase plan 6. Solid market share in strategic operating markets 7. Continual focus on improving efficiency, operating processes and service delivery
Appendix Investor Presentation Fourth Quarter 2012

22 Pre-Tax, Pre-Provision Income For the three months ended December 31, September 30, June 30, March 31, December 31, (Dollars in thousands) 2012 2012 2012 2012 2011 Pre-tax, pre-provision income 1 28,869$ 26,894$ 32,636$ 30,020$ 33,015$ Less: accelerated discount on covered loans 2,455 3,798 3,764 3,645 4,775 Plus: loss share and covered asset expense 2 2,251 3,559 4,317 3,043 2,521 Pre-tax, pre-provision income, net of accelerated discount and loss on covered OREO 28,665 26,655 33,189 29,418 30,761 Less: gain on sales of investment securities 1,011 2,617 - - 2,541 Less: gain on sales of non-mortgage loans 3 45 - 171 66 290 Less: gain related to litigation settlement - - 5,000 - - Plus: One-time expenses related to branch acquisitions - - - - 1,037 Plus: One-time other employee benefit, exit and and retention costs 952 351 2,160 - 2,501 Plus: On -time pension, trust and other costs - - - 1,839 - Adjusted pre-tax, pre-provision income 28,561$ 24,389$ 30,178$ 31,191$ 31,468$ 1 Represents income before taxes plus provision for all loans less FDIC loss sharing income 2 Reimbursements related to losses on covered OREO and other credit-related costs are included in FDIC loss sharing income, w hich is excluded from the pre-tax, pre-provision income above 3 Represents gain on sale of loans originated by franchise f inance business

23 Low Risk Balance Sheet 49% of First Financial’s total assets are 100% risk-weighted assets compared to the peer group median of 56% First Financial’s percentage of total risk- weighted assets to total assets is 60.1% compared to the peer group median of 69.1% The lower percentages are driven by the meaningful balance of high-yielding loans covered under loss share agreements with the FDIC Return on risk-weighted assets significantly exceeds peer median performance First Financial generates higher returns on a lower risk balance sheet relative to the peer group Total Assets by Risk Weighting % As of December 31, 2012 (Dollars in millions) Peer % of 100% RWAs = 56.4% Return on Avg. Risk Weighted Assets = 1.68% (Peer Median = 1.35%) Risk Weighted Assets / Total Assets = 60.1% (Peer Median = 69.1%) Peer Group comprised of the component banks within the KBW Regional Bank Index (49 total companies excluding First Financial); based on financial information as of September 30, 2012 Source: Peer Group median data obtained from SNL Financial $3,155 49% $585 9% $2,504 38% $253 4% 100% 50% 20% 0%
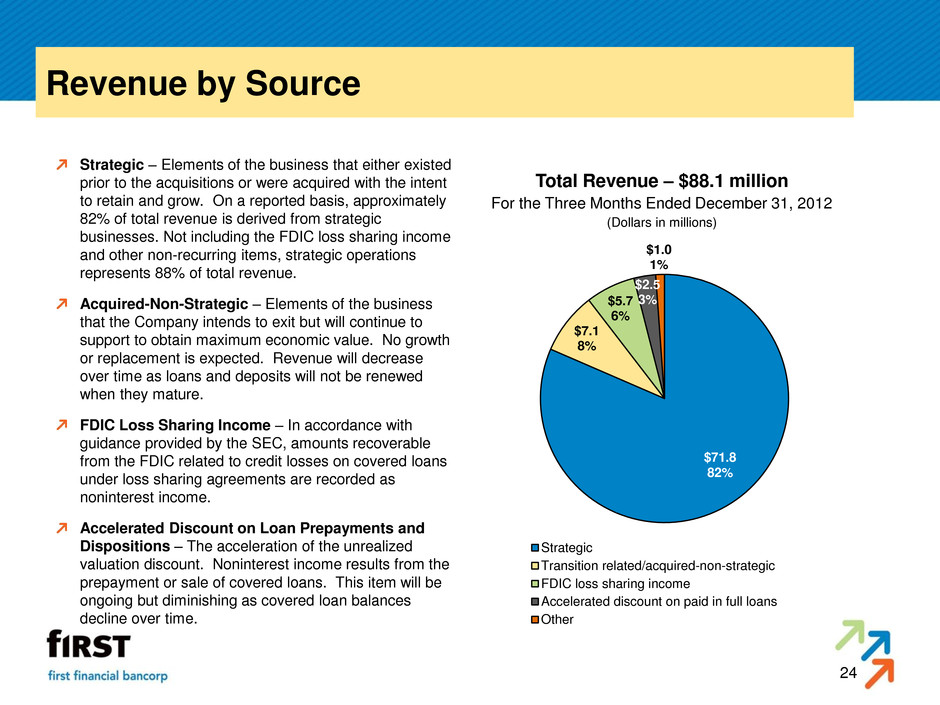
24 Revenue by Source Strategic – Elements of the business that either existed prior to the acquisitions or were acquired with the intent to retain and grow. On a reported basis, approximately 82% of total revenue is derived from strategic businesses. Not including the FDIC loss sharing income and other non-recurring items, strategic operations represents 88% of total revenue. Acquired-Non-Strategic – Elements of the business that the Company intends to exit but will continue to support to obtain maximum economic value. No growth or replacement is expected. Revenue will decrease over time as loans and deposits will not be renewed when they mature. FDIC Loss Sharing Income – In accordance with guidance provided by the SEC, amounts recoverable from the FDIC related to credit losses on covered loans under loss sharing agreements are recorded as noninterest income. Accelerated Discount on Loan Prepayments and Dispositions – The acceleration of the unrealized valuation discount. Noninterest income results from the prepayment or sale of covered loans. This item will be ongoing but diminishing as covered loan balances decline over time. Total Revenue – $88.1 million For the Three Months Ended December 31, 2012 (Dollars in millions) $71.8 82% $7.1 8% $5.7 6% $2.5 3% $1.0 1% Strategic Transition related/acquired-non-strategic FDIC loss sharing income Accelerated discount on paid in full loans Other
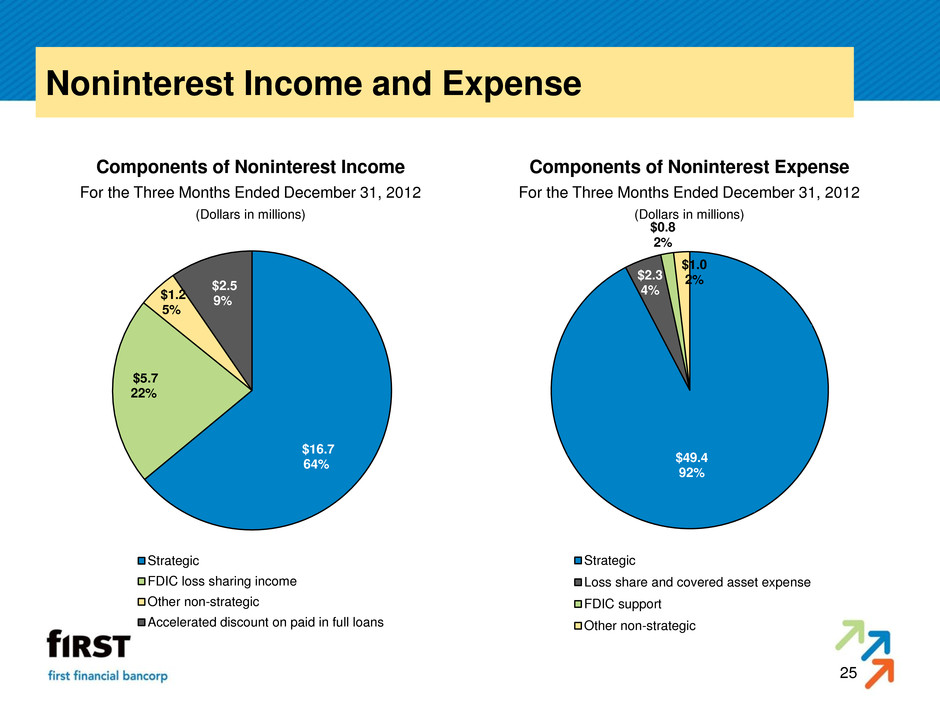
25 Noninterest Income and Expense Components of Noninterest Income For the Three Months Ended December 31, 2012 (Dollars in millions) Components of Noninterest Expense For the Three Months Ended December 31, 2012 (Dollars in millions) $16.7 64% $5.7 22% $1.2 5% $2.5 9% Strategic FDIC loss sharing income Other non-strategic Accelerated discount on paid in full loans $49.4 92% $2.3 4% $0.8 2% $1.0 2% Strategic Loss share and covered asset expense FDIC support Other non-strategic

26 Deposit and Loan Composition Total Deposits – $5.0 billion As of December 31, 2012 (Dollars in millions) Gross Loans – $3.9 billion As of December 31, 2012 (Dollars in millions) Market exits are complete; acquired-non-strategic deposits consist primarily of time deposits in Western, Michigan and Louisville markets and brokered CDs. $4,908 99% $48 1% Strategic Acquired-Non-Strategic $3,576 91% $351 9%
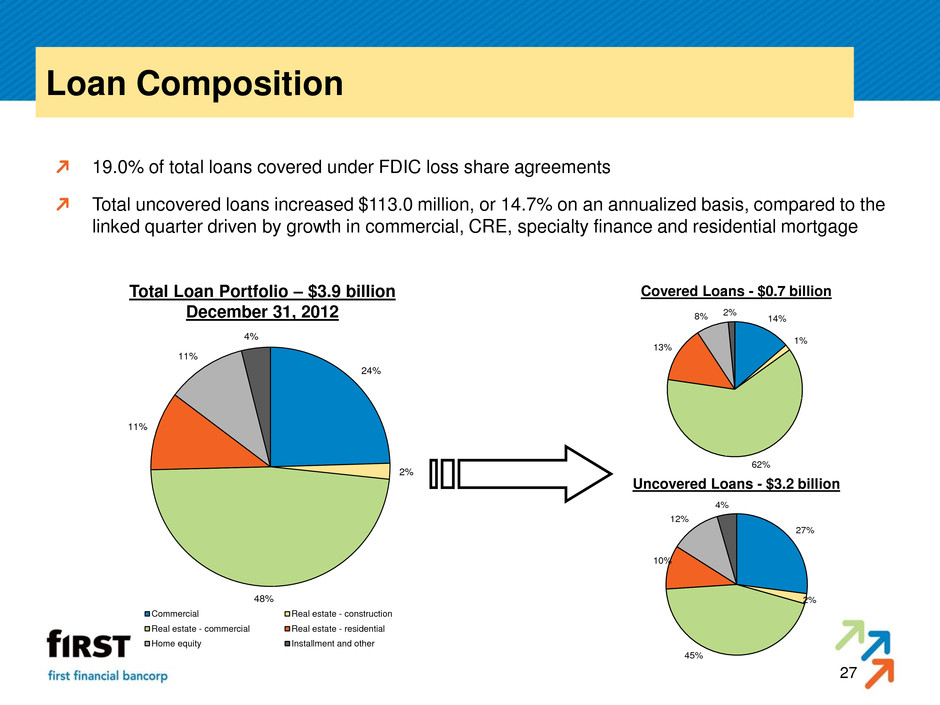
27 Loan Composition 19.0% of total loans covered under FDIC loss share agreements Total uncovered loans increased $113.0 million, or 14.7% on an annualized basis, compared to the linked quarter driven by growth in commercial, CRE, specialty finance and residential mortgage Total Loan Portfolio – $3.9 billion December 31, 2012 Covered Loans - $0.7 billion Uncovered Loans - $3.2 billion 24% 2% 48% 11% 11% 4% Commercial Real estate - construction Real estate - commercial Real estate - residential Home equity Installment and other 14% 1% 62% 13% 8% 2% 27% 2% 45% 10% 12% 4%

28 Uncovered Loans – Real Estate Collateral Construction and acquisition and land development loans represent small portion of overall portfolio Commercial real estate and constructions loans located primarily in Ohio and Indiana markets Total Uncovered Loan Portfolio – $3.2 billion December 31, 2012 2% 45% Real estate - construction Real estate - commercial $1,417,008 $73,517 Dollars in thousands 63% 36% 1% Non-owner occupied Owner occupied Acquisition & land development
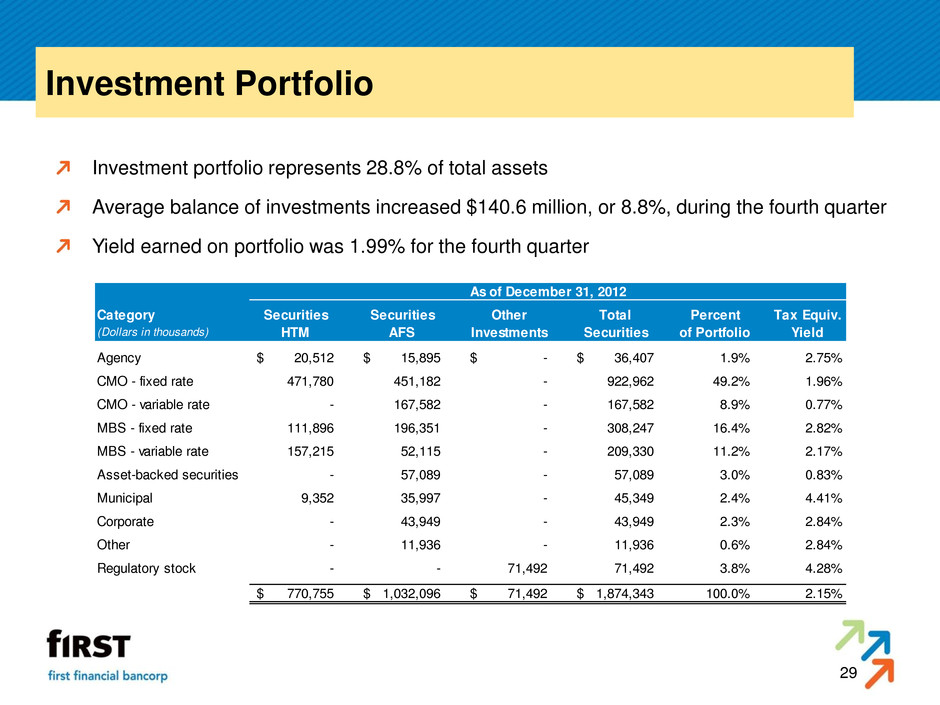
29 Investment Portfolio Investment portfolio represents 28.8% of total assets Average balance of investments increased $140.6 million, or 8.8%, during the fourth quarter Yield earned on portfolio was 1.99% for the fourth quarter As of December 31, 2012 Category Securities Securities Other Total Percent Tax Equiv. (Dollars in thousands) HTM AFS Investments Securities of Portfolio Yield Agency 20,512$ 15,895$ -$ 36,407$ 1.9% 2.75% CMO - fixed rate 471,780 451,182 - 922,962 49.2% 1.96% CMO - variable rate - 167,582 - 167,582 8.9% 0.77% MBS - fixed rate 111,896 196,351 - 308,247 16.4% 2.82% MBS - variable rate 157,215 52,115 - 209,330 11.2% 2.17% Ass -b cked securities - 57,089 - 57,089 3.0% 0.83% Municipal 9,352 35,997 - 45,349 2.4% 4.41% Corporate - 43,949 - 43,949 2.3% 2.84% Other - 11,936 - 11,936 0.6% 2.84% Regulatory stock - - 71,492 71,492 3.8% 4.28% 770,755$ 1,032,096$ 71,492$ 1,874,343$ 100.0% 2.15%
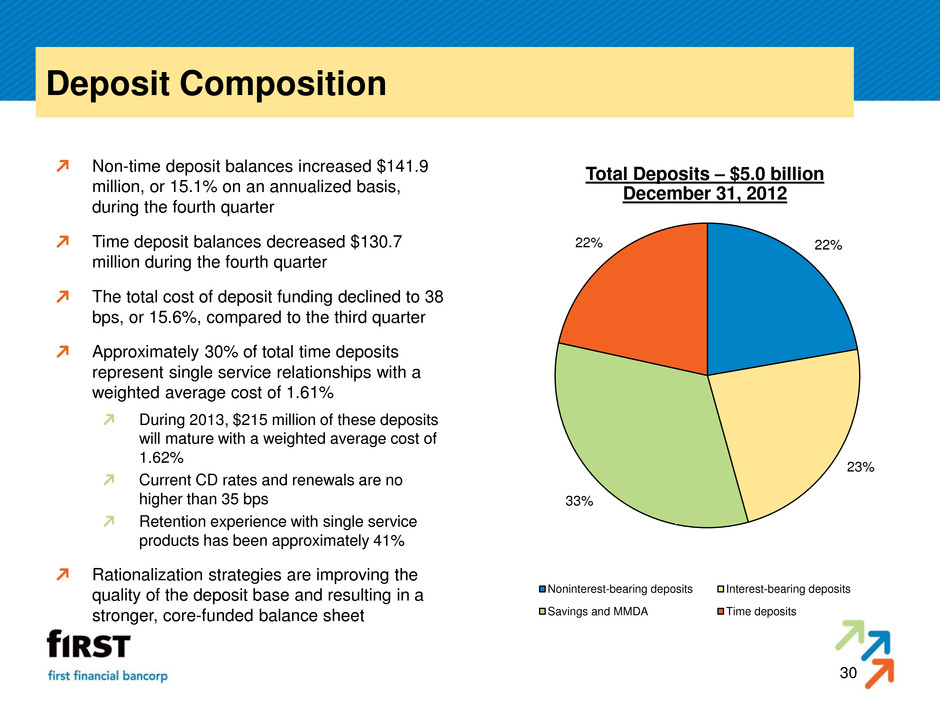
30 Deposit Composition Non-time deposit balances increased $141.9 million, or 15.1% on an annualized basis, during the fourth quarter Time deposit balances decreased $130.7 million during the fourth quarter The total cost of deposit funding declined to 38 bps, or 15.6%, compared to the third quarter Approximately 30% of total time deposits represent single service relationships with a weighted average cost of 1.61% During 2013, $215 million of these deposits will mature with a weighted average cost of 1.62% Current CD rates and renewals are no higher than 35 bps Retention experience with single service products has been approximately 41% Rationalization strategies are improving the quality of the deposit base and resulting in a stronger, core-funded balance sheet Total Deposits – $5.0 billion December 31, 2012 22% 23% 33% 22% Noninterest-bearing deposits Interest-bearing deposits Savings and MMDA Time deposits
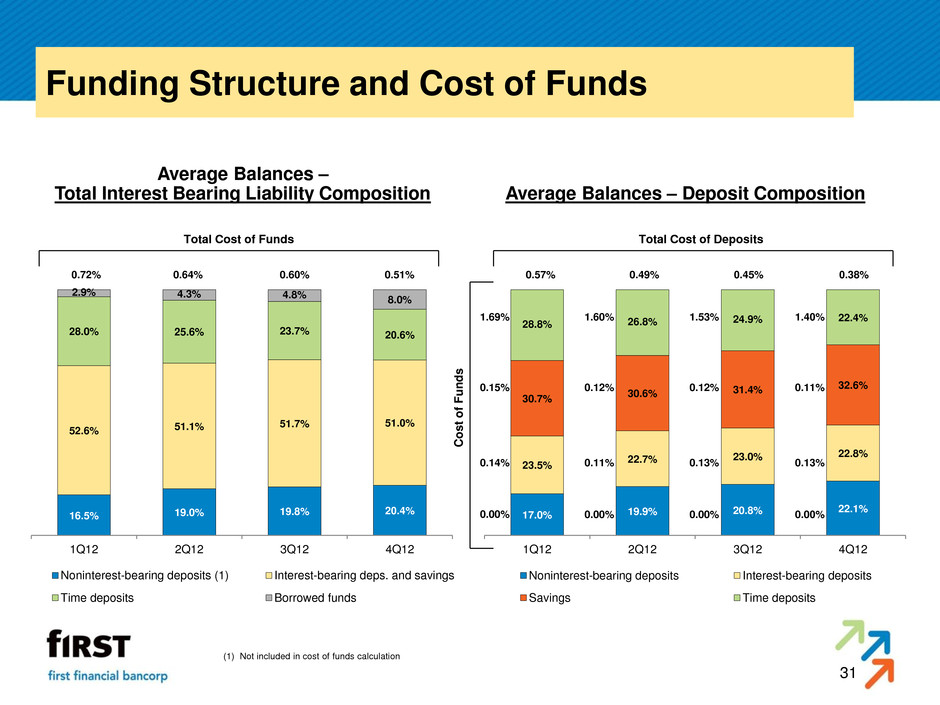
31 Funding Structure and Cost of Funds Average Balances – Total Interest Bearing Liability Composition Average Balances – Deposit Composition Total Cost of Funds (1) Not included in cost of funds calculation Total Cost of Deposits Co s t of F u n d s 0.72% 0.64% 0.60% 0.51% 0.57% 0.49% 0.45% 0.38% 0.00% 0.00% 0.00% 0.00% 0.14% 0.11% 0.13% 0.13% 0.15% 0.12% 0.12% 0.11% 1.69% 1.60% 1.53% 1.40% 20.4%19.8%19.0%16.5% 51.0%51.7%51.1%52.6% 20.6%23.7%25.6%28.0% 8.0% 4.8%4.3%2.9% 4Q123Q122Q121Q12 Noninterest-bearing deposits (1) Interest-bearing deps. and savings Time deposits Borrowed funds 22.1%20.8%19. %17.0% 22.8%23.0%22.7% 23.5% 32.6%31.4%30.6%30.7% 22.4%24.9%26.8%28.8% 4Q123Q122Q121Q12 Nonin erest-bearing depo its Intere t-bearing deposits Savings Time deposits
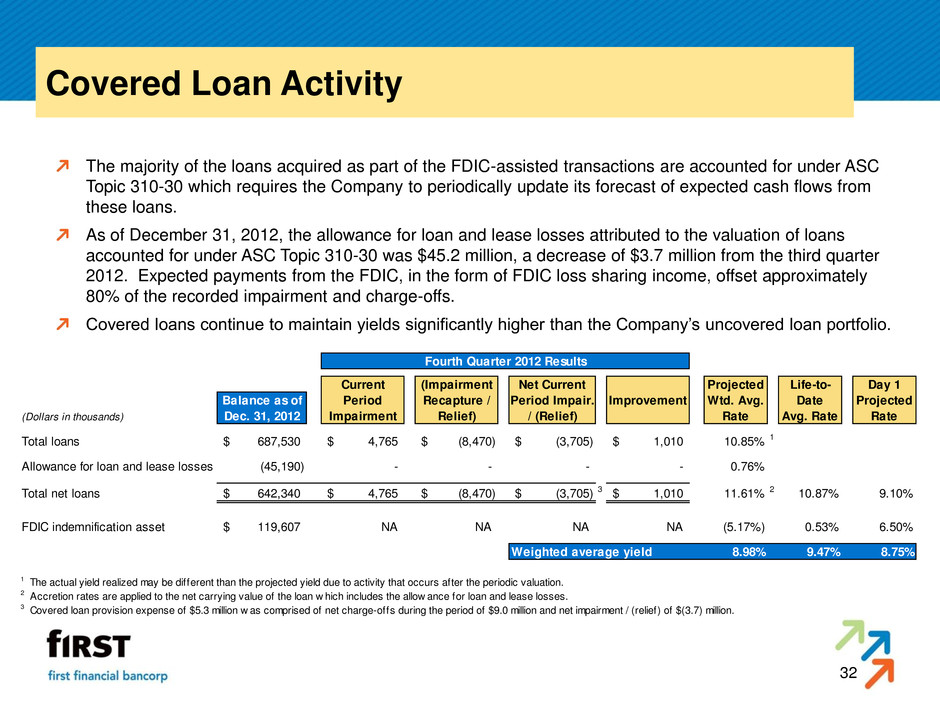
32 Covered Loan Activity The majority of the loans acquired as part of the FDIC-assisted transactions are accounted for under ASC Topic 310-30 which requires the Company to periodically update its forecast of expected cash flows from these loans. As of December 31, 2012, the allowance for loan and lease losses attributed to the valuation of loans accounted for under ASC Topic 310-30 was $45.2 million, a decrease of $3.7 million from the third quarter 2012. Expected payments from the FDIC, in the form of FDIC loss sharing income, offset approximately 80% of the recorded impairment and charge-offs. Covered loans continue to maintain yields significantly higher than the Company’s uncovered loan portfolio. Fourth Quarter 2012 Results Current (Impairment Net Current Projected Life-to- Day 1 Balance as of Period Recapture / Period Impair. Improvement Wtd. Avg. Date Projected (Dollars in thousands) Dec. 31, 2012 Impairment Relief) / (Relief) Rate Avg. Rate Rate Tot l loans 687,530$ 4,765$ (8,470)$ (3,705)$ 1,010$ 10.85% 1 Allowanc for loan and lease losses (45,190) - - - - 0.76% T tal net loans 642,340$ 4,765$ (8,470)$ (3,705)$ 3 1,010$ 11.61% 2 10.87% 9.10% FDIC indemnification asset 119,607$ NA NA NA NA (5.17%) 0.53% 6.50% Weighted average yield 8.98% 9.47% 8.75% 1 The actual yield realized may be different than the projected yield due to activity that occurs after the periodic valuation. 2 Accretion rates are applied to the net carrying value of the loan w hich includes the allow ance for loan and lease losses. 3 Covered loan provision expense of $5.3 million w as comprised of net charge-offs during the period of $9.0 million and net impairment / (relief) of $(3.7) million.
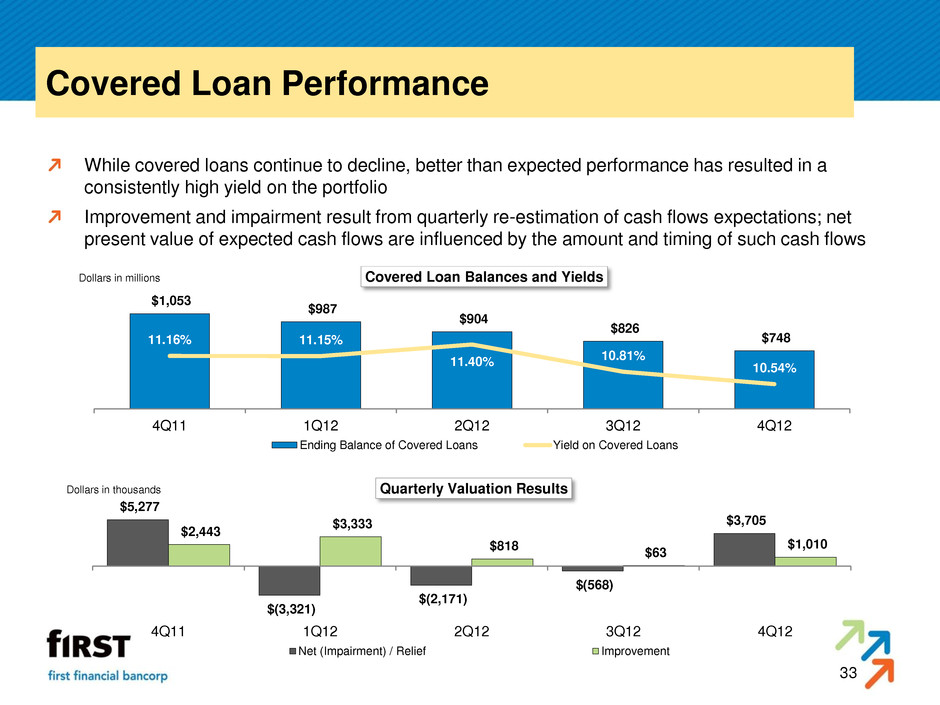
33 Covered Loan Performance While covered loans continue to decline, better than expected performance has resulted in a consistently high yield on the portfolio Improvement and impairment result from quarterly re-estimation of cash flows expectations; net present value of expected cash flows are influenced by the amount and timing of such cash flows $1,053 $987 $904 $826 $748 11.16% 11.15% 11.40% 10.81% 10.54% 4Q11 1Q12 2Q12 3Q12 4Q12 Dollars in millions Covered Loan Balances and Yields Ending Balance of Covered Loans Yield on Covered Loans $5,277 $(3,321) $(2,171) $(568) $3,705 $2,443 $3,333 $818 $63 $1,010 4Q11 1Q12 2Q12 3Q12 4Q12 Dollars in thousands Quarterly Valuation Results Net (Impairment) / Relief Improvement
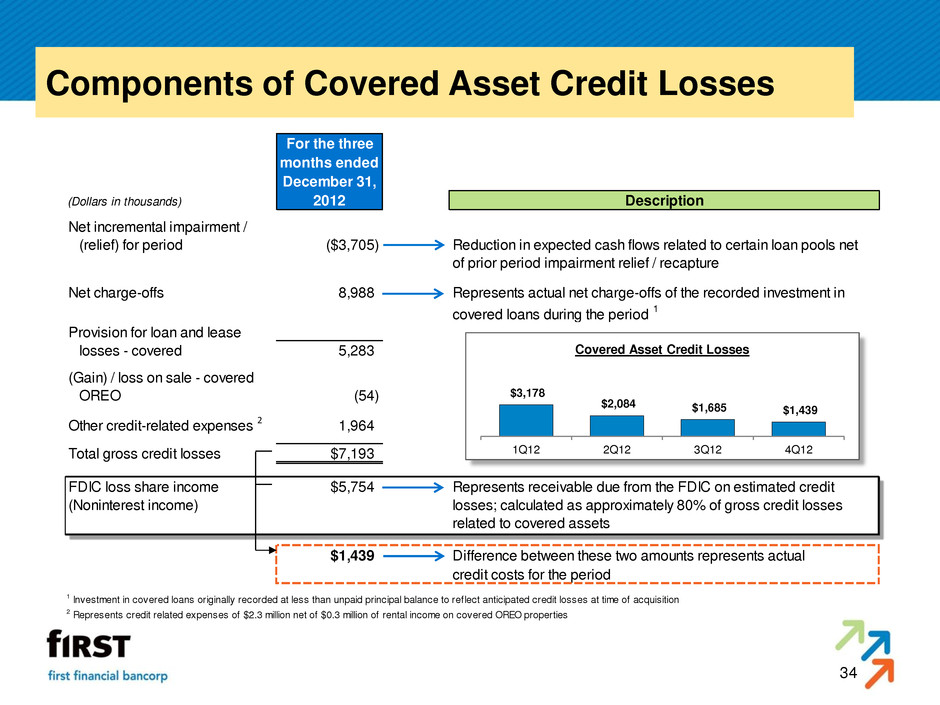
34 Components of Covered Asset Credit Losses $3,178 $2,084 $1,685 $1,439 1Q12 2Q12 3Q12 4Q12 Covered Asset Credit Losses For the three months ended December 31, (Dollars in thousands) 2012 Description Net incremental impairment / (relief) for period ($3,705) Reduction in expected cash flows related to certain loan pools net of prior period impairment relief / recapture Net charge-offs 8,988 Represents actual net charge-offs of the recorded investment in covered loans during the period 1 Provision for loan and lease losses - covered 5,283 (Gain) / loss on sale - covered OREO (54) Other credit-related expenses 2 1,964 Total gross credit losses $7,193 FDIC loss share income $5,754 Represents receivable due from the FDIC on estimated credit (Noninterest income) losses; calculated as approximately 80% of gross credit losses related to covered assets $1,439 Difference between these two amounts represents actual credit costs for the period 1 Investment in covered loans originally recorded at less than unpaid principal balance to reflect anticipated credit losses at time of acquisition 2 Represents credit related expenses of $2.3 million net of $0.3 million of rental income on covered OREO properties
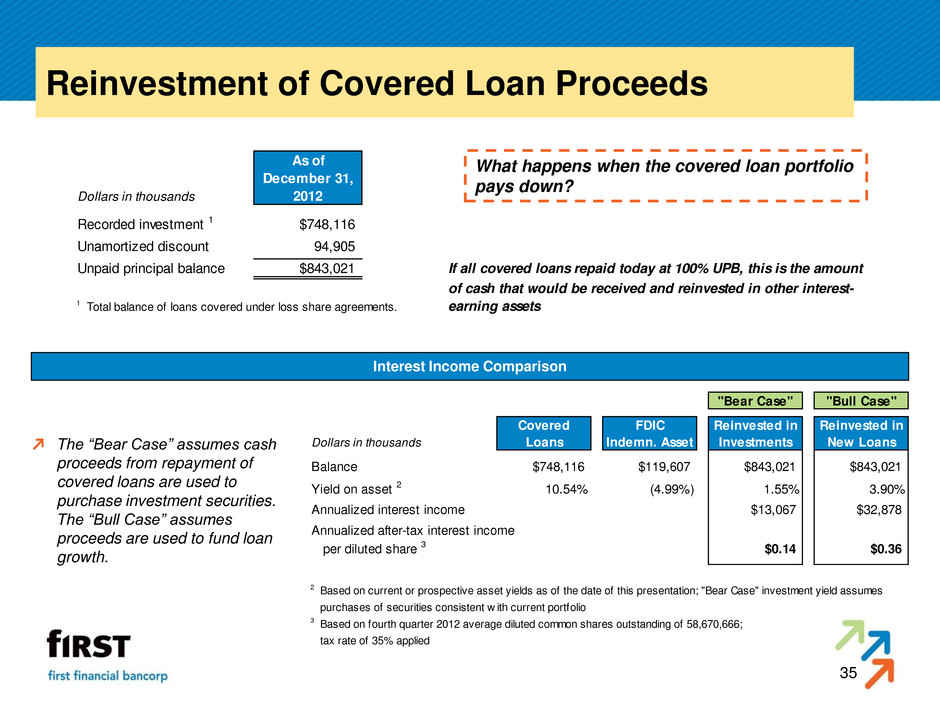
35 Reinvestment of Covered Loan Proceeds What happens when the covered loan portfolio pays down? Interest Income Comparison The “Bear Case” assumes cash proceeds from repayment of covered loans are used to purchase investment securities. The “Bull Case” assumes proceeds are used to fund loan growth. As of December 31, Dollars in thousands 2012 Recorded investment 1 $748,116 Unamortized discount 94,905 Unpaid principal balance $843,021 If all covered loans repaid today at 100% UPB, this is the amount of cash that would be received and reinvested in other interest- 1 Total balance of loans covered under loss share agreements. earning assets "Bear Case" "Bull Case" Covered FDIC Reinvested in Reinvested in Dollars in thousands Loans Indemn. Asset Investments New Loans Balance $748,116 $119,607 $843,021 $843,021 Yield on asset 2 10.54% (4.99%) 1.55% 3.90% Annualized interest income $13,067 $32,878 Annualized after-tax interest income per diluted share 3 $0.14 $0.36 2 Based on current or prospective asset yields as of the date of this presentation; "Bear Case" investment yield assumes purchases of securities consistent w ith current portfolio 3 Based on fourth quarter 2012 average diluted common shares outstanding of 58,670,666; tax rate of 35% applied
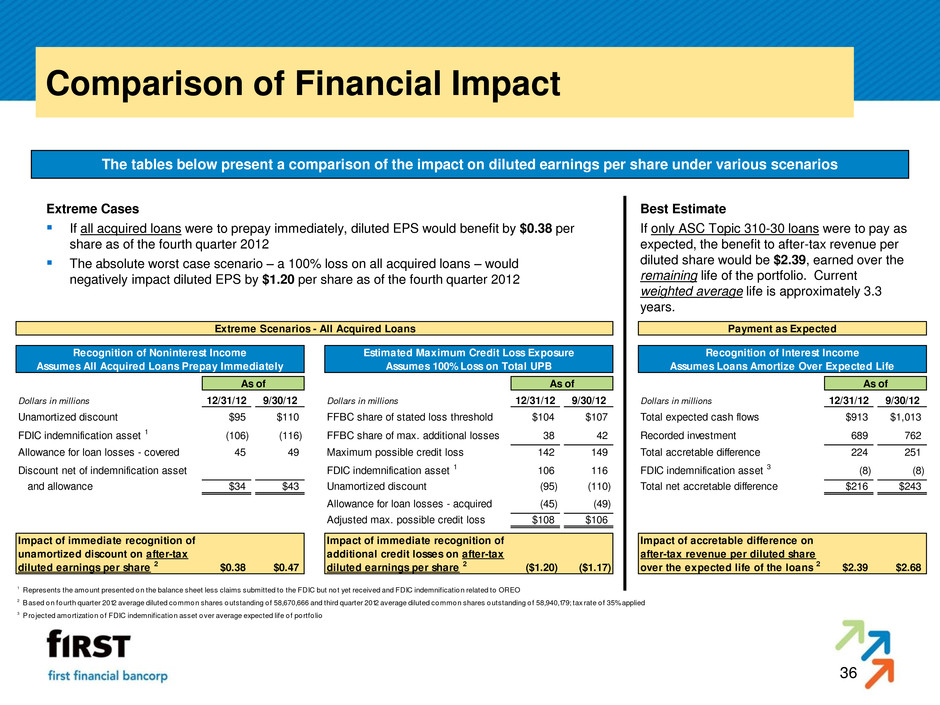
36 Comparison of Financial Impact The tables below present a comparison of the impact on diluted earnings per share under various scenarios Extreme Cases If all acquired loans were to prepay immediately, diluted EPS would benefit by $0.38 per share as of the fourth quarter 2012 The absolute worst case scenario – a 100% loss on all acquired loans – would negatively impact diluted EPS by $1.20 per share as of the fourth quarter 2012 Best Estimate If only ASC Topic 310-30 loans were to pay as expected, the benefit to after-tax revenue per diluted share would be $2.39, earned over the remaining life of the portfolio. Current weighted average life is approximately 3.3 years. Extreme Scenarios - All Acquired Loans Payment as Expected Recognition of Noninterest Income Estimated Maximum Credit Loss Exposure Recognition of Interest Income Assumes All Acquired Loans Prepay Immediately Assumes 100% Loss on Total UPB Assumes Loans Amortize Over Expected Life As of As of As of Dollars in millions 12/31/12 9/30/12 Dollars in millions 12/31/12 9/30/12 Dollars in millions 12/31/12 9/30/12 Unamortized discount $95 $110 FFBC share of stated loss threshold $104 $107 Total expected cash flows $913 $1,013 FDIC indemnification asset 1 (106) (116) FFBC share of max. additional losses 38 42 Recorded investment 689 762 Allowance for loan losses - covered 45 49 Maximum possible credit loss 142 149 Total accretable difference 224 251 Discount net of indemnification asset FDIC indemnification asset 1 106 116 FDIC indemnification asset 3 (8) (8) and allowance $34 $43 Unamortized discount (95) (110) Total net accretable difference $216 $243 Allowance for loan losses - acquired (45) (49) Adjusted max. possible credit loss $108 $106 Impact of i ediate recognition of Impact of immediate recognition of Impact of accretable difference on unamortized discount on after-tax additional credit losses on after-tax after-tax revenue per diluted share diluted earnings per share 2 $0.38 $0.47 diluted earnings per share 2 ($1.20) ($1.17) over the expected life of the loans 2 $2.39 $2.68 1 Represents the amount presented on the balance sheet less claims submitted to the FDIC but not yet received and FDIC indemnification related to OREO 2 Based on fourth quarter 2012 average diluted common shares outstanding of 58,670,666 and third quarter 2012 average diluted common shares outstanding of 58,940,179; tax rate of 35% applied 3 Pro jected amortization of FDIC indemnification asset over average expected life of portfo lio
First Financial Bancorp Investor Presentation Fourth Quarter 2012


