EXHIBIT 13
 2013 Annual Report 1863 ➔ 2013 YEARS 150 Here. Now.
First Financial Bancorp
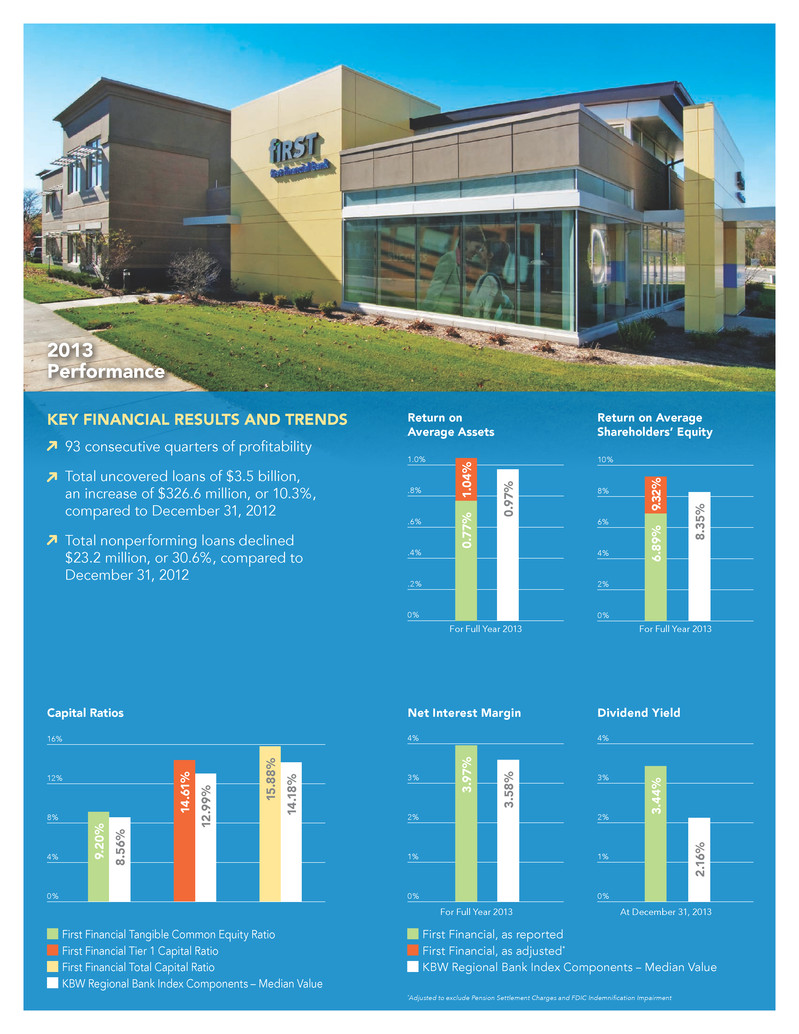 2013 Performance KEY FINANCIAL RESULTS AND TRENDS Return on Average Assets Return on Average Shareholders’ Equity 1.0% .8% .6% .4% .2% 0% 93 consecutive quarters of profitability Total uncovered loans of $3.5 billion, an increase of $326.6 million, or 10.3%, compared to December 31, 2012 Total nonperforming loans declined $23.2 million, or 30.6%, compared to December 31, 2012 10% 8% 6% 4% 2% 0% 16% 12% 8% 4% 0% Capital Ratios 9. 2 0 % 8. 56 % 14 .1 8 % 15 .8 8 % 12 .9 9 % 14 .6 1 % First Financial Tangible Common Equity Ratio First Financial Tier 1 Capital Ratio First Financial Total Capital Ratio KBW Regional Bank Index Components - Median Value 1. 0 4 % 0. 7 7 % 0 .9 7 % 8. 35 % 9 .3 2 % 6. 89 % For Full Year 2013 For Full Year 2013 Net Interest Margin Dividend Yield *Adjusted to exclude Pension Settlement Charges and FDIC Indemnification Impairment 4% 3% 2% 1% 0% 4% 3% 2% 1% 0% 3. 97 % 3. 58 % 3. 4 4 % 2 .1 6 % First Financial, as reported First Financial, as adjusted* KBW Regional Bank Index Components - Median Value At December 31, 2013For Full Year 2013

Here. Now. ALwAYS GRowING. 2013 was an eventful year for First Financial. We saw continued loan growth and positive momentum in our financial results, strategic priorities, brand awareness and geographic presence. It was a year of carrying our vision forward for the benefit of our clients, associates, shareholders and business partners. We’ve gained momentum from a wide variety of initiatives and the hard work that our associates do every day. Our market expansion into Columbus, Ohio and Fort Wayne, Indiana will provide many new opportunities to serve clients and grow our business. New products and investments in banking centers and technology are making it easier to meet client needs and serve them in more ways. The sales teams achieved significant progress in growing loan balances, which fuels our success. Achievement of our efficiency objectives, while difficult, happened thanks to the efforts of associates across the organization who found ways to work smarter and save money. Effective credit discipline and asset resolution activities led to meaningful improvement in asset quality metrics. Continued enhancement of our enterprise risk management program to further align activities with line of business strategies. It was also a year of reflection, celebration and remembering our roots. 2013 marked First Financial’s 150th anniversary. Since 1863 the bank has maintained a consistent mission and focus. It’s amazing how our heritage has prepared us to make strategic decisions here, now and for the future. It is true that our roots have given us strong wings. The story of First Financial and our ability to survive and thrive for fifteen decades is compelling and sets the stage for our continuing success. We hope you will take some time to read more about our story that begins on the back cover. It’s worth the read! This year First Financial reached a company milestone by celebrating its 150th anniversary
First Financial Bancorp 2013 Annual Report 1

*Excludes covered loans Commercial Banking First Financial offers the same sophisticated products as the larger regional banks, but our size allows us to make decisions at the local level and support our clients’ success. This high-quality service, delivered by experienced bankers, deepens client relationships and has helped us build a solid reputation in the communities we serve. Traditional commercial and industrial balances, including owner-occupied commercial real estate loans, increased $170.3 million, or 26.6 percent.* Specialty finance balances, comprised of asset-based lending and equipment finance, increased $81.3 million, or 73.3 percent. Franchise finance, a lender in the franchise restaurant segment, grew its balances $80.3 million, or 26.0 percent.* Average commercial deposit balances increased $70.8 million, or 9.3 percent. wealth Management During 2013, our wealth management group continued to refine and improve its investment management process. The team utilizes a holistic approach with the objective of growing, preserving and ultimately transferring our clients’ wealth with services delivered in a solutions-based, rather than a product-based, manner. Implementation of our flagship core strategic portfolios built to comprehensively address portfolio needs across the classic risk spectrum. Significant product and technology investments in our Retirement Plan Services business to assist employers in providing competitive retirement benefit packages. Total client assets under management and administration increased 6.7 percent. Total investment advisory, trust administration and retirement plan services revenues increased 2.6 percent. Capitalizing on our competitive advantages to BUILD STRoNGER
2 First Financial Bancorp 2013 Annual Report

Mortgage We re-entered the mortgage business in 2011 with the objective of building a model that delivers a consistent and sustainable revenue stream through a variety of interest rate and housing cycles. During 2013, we continued to strengthen our mortgage program with several initiatives designed to further grow our business and deliver a better experience to our clients. Increased originations of our First Simplified mortgage product which we retain on our balance sheet, contributing to residential mortgage balance growth of $34.7 million, or 10.9 percent. Received approval to service loans for Fannie Mae and Ginnie Mae, allowing us to retain increased fee revenue related to mortgages we originate and sell to these government agencies. Introduced a third party origination channel through which we purchase mortgages from mortgage brokers, smaller banks and credit unions. Continued to improve our online sales experience as more consumers prefer to conduct mortgage business through this channel. Consumer Banking Delivering a superior client experience coupled with leveraging our distinctive and growing brand was a key area of focus for our consumer banking line of business during 2013. To further differentiate the First brand of banking, grow our client base and increase client share-of-wallet, we continued to invest in our online and mobile capabilities as well as introduced innovative deposit products throughout the year. Usage of the mobile channel increased 111 percent, with approximately 12 percent of consumer banking clients now using our mobile app. Online banking users increased 19 percent and we are approaching one million monthly logins. A 19 percent increase in the adoption of eStatements, which provides clients faster access in an environmentally-friendly manner. Enhancements included Snap Deposit, which experienced an average monthly increase in utilization and deposits of more than 10 percent. 125 percent increase in the number of deposits made through our network of image-capable smart ATMs. Introduction of new deposit products such as our indexed money market account and Celebration CD commemorating the company’s 150th anniversary and offering incentives for additional transaction deposit accounts. RELATIoNSHIPS 111% increase in usage of mobile channel growth of $34.7 million in residential mortgage balance
First Financial Bancorp 2013 Annual Report 3

New market EXPANSIoN Growth, both organic and through acquisitions, is integral to the execution of our strategy and fulfillment of our mission. During 2013 and early 2014, we announced our entrance to two key strategic markets where we believe our business model presents strong prospects for future growth. New market EXPANSIoN Even with these growth initiatives, our capital levels remain strong, leaving First Financial well positioned to capitalize on future organic growth and acquisition opportunities that meet our strategic, operational and financial criteria. Columbus, Ohio In December 2013, we announced the signing of definitive merger agreements with The First Bexley Bank and Insight Bank, two well-established and successful banks serving businesses and consumers in their local communities and surrounding areas in Central Ohio. These acquisitions will immediately position First Financial as one of the larger community banks serving the growth-oriented Columbus market. Both institutions have found success using a client-centric business model similar to ours and have built strong and meaningful relationships with their clients. Their continued growth will be supported by our larger capital base and expanded product set to serve both commercial and consumer clients as well as the introduction of wealth management services to further enhance and grow client relationships. These transactions are subject to regulatory approval and are expected to close in the first half of 2014. Fort Wayne, Indiana In January 2014, we announced the hiring of well- known and high-performing commercial and residential mortgage teams serving the greater Fort Wayne area that will be responsible for establishing the First brand in this important Indiana market. With our strong presence throughout Indiana that includes 45 banking centers, Fort Wayne complements our existing Indiana-West Central Ohio network and provides meaningful opportunities for additional growth. As part of First Financial, these bankers will be able to leverage their current relationships to deliver expanded credit and deposit products to middle market, small business and residential mortgage clients. These teams are a great cultural fit for us with their community banking experience and passion for delivering the highest level of client service. During 2014, we expect to supplement the commercial and residential mortgage services in the market by adding our full line of consumer banking products for retail clients as we look to expand our presence in the Fort Wayne area. Traverse City Dayton Schererville Lafayette Indianapolis Edgewood Columbus Fort Wayne New locations marking our entrance to two key strategic markets: Columbus, OH & Fort Wayne, IN
4 First Financial Bancorp 2013 Annual Report

Introducing Focus. We remain client focused by putting our clients at the center of everything we do. True to our mission, we strive to put our clients at the center of everything we do. Our goal is to make a lasting impression in every interaction with every client. This lasting impression creates a legacy for our brand and differentiates us from our competitors. In 2013, we introduced Focus within the company. Focus defines our client-centric business model and provides all associates with a stronger framework for living our mission every day. Introducing Building a great team: This means hiring the right people who are committed to uniting associates across all markets, departments and lines of business to do what’s best for our client. Providing needs-based solutions: A client-centric sales approach that fully uncovers the basic financial needs of each client today and also uncovers their future aspirations. Doing the right thing: We exist because of our clients, so we should make decisions with all the facts, be fair and client-centered. Never losing a client: Each associate plays a role in creating a superior service experience for clients and being an ambassador for the company. Knowing our clients: This means developing a deep relationship with all of our clients so we can offer proactive solutions to help them be more successful. Making a difference: From our processes, programs, ongoing communications and continuing interactions with clients, associates are empowered to make a difference for our clients every day. 1 2 3 4 5 6
First Financial Bancorp 2013 Annual Report 5

Positioned for GRowTH 2013 was a year of significant change, transition and improvement for First Financial. Remaining relevant to our clients in a highly competitive industry is critical as we constantly strive to improve the client experience of banking with First Financial across all lines of business. To successfully fulfill our mission, we implemented organizational changes that better integrate our line of business strategies and the market-based approach in which our products and services are delivered by local decision makers responsible for the client experience in their markets. We made several key steps to position First Financial for continued growth. This includes our expansion into the Columbus, Ohio and Fort Wayne, Indiana markets, adding high-quality sales personnel across all lines of business and further investment in new products, services and technologies. We are well positioned to take advantage of our competitive strengths and remain focused on organic growth across all business lines and markets. Our strong capital base also provides the ability to capitalize on additional strategic opportunities to supplement this growth. Effective execution across all aspects of our business will be the key to our success. During 2013, we delivered on the execution of our efficiency plan which identified more than $17 million in annual cost savings and formed the basis of a culture dedicated to process improvement and more efficient client service. Through the unwavering commitment of our associates, we exceeded our original goal and realized 100 percent of the annual target in the year’s financial results with future annual savings expected to exceed $17 million. The culture of process improvement took hold as we identified an additional $5 million of savings beyond the original initiatives. As we enter 2014, we have made significant strides toward right-sizing our operating structure with a healthy balance between operating in a responsible, cost-effective manner while having the capacity to effectively handle future growth without compromising safety and soundness. As we reflect on our 150 year history and look towards the future, we want to thank our shareholders, associates and clients for their ongoing commitment to First Financial. Our success would not be possible without you and we look forward to a prosperous 2014. Here. Now. Always Growing. Strategic Priorities for 2014 Sustain our commitment to the collaborative and team-oriented culture and business model we are building that is focused on growth and client service. Maintain our organic growth momentum as well as continue to evaluate franchise-enhancing acquisition opportunities. Continued discipline in our operating efficiency and dedication to continual process improvements. Remain vigilant in our enterprise risk management processes, especially in light of increased regulations and threats, such as cyber fraud. Capitalize on 2013 accomplishments to deliver positive operating leverage and earnings growth. Claude E. Davis, President and CEO
6 First Financial Bancorp 2013 Annual Report
Directors and Officers
|
| | | | |
| Board of Directors | | | | Senior Management |
| | | | | |
| Murph Knapke | | Corinne R. Finnerty | | Claude E. Davis |
| Chairman of the Board, | | Partner, | | President and |
| First Financial Bancorp; | | McConnell Finnerty PC | | Chief Executive Officer |
| Partner, | | | | |
| Knapke Law Office, | | Susan L. Knust | | Matthew B. Burgess |
| | | Managing Partner, | | Executive Vice President and |
| J. Wickliffe Ach | | K.P. Properties and | | Chief Internal Auditor |
| President and | | Omega Warehouse Services | | |
| Chief Executive Officer, | | | | Kevin T. Langford |
| Hixson, Inc. | | William J. Kramer | | President, Consumer Banking |
| | | Vice President of Operations, | | President, Western Markets |
| David S. Barker | | Valco Companies, Inc. | | |
| President and | | | | C. Douglas Lefferson |
| Chief Executive Officer, | | Richard E. Olszewski | | President, Commercial Banking |
| SIHO Insurance Services | | Owner/Operator | | and Wealth Management |
| | | 7 Eleven Food Stores | | President, Eastern Markets |
| Cynthia O. Booth | | | | |
| President and | | Maribeth S. Rahe | | Alisa E. Poe |
| Chief Executive Officer, | | President and | | Executive Vice President, |
| COBCO Enterprises | | Chief Executive Officer, | | Chief Talent Officer and |
| | | Fort Washington Investment | | Chief of Staff |
| Donald M. Cisle, Sr. | | Advisors, Inc. | | |
| Managing Member, | | | | Jill A. Stanton |
| The Cisle Co. LLC | | | | President, Mortgage Banking |
| | | | | |
| Mark A. Collar | | | | Anthony M. Stollings |
| Retired Executive, | | | | Executive Vice President, |
| Procter & Gamble Company | | | | Chief Financial Officer and |
| | | | | Chief Administrative Officer |
| Claude E. Davis | | | | |
| President and | | | | Holly M. Foster |
| Chief Executive Officer, | | | | Senior Vice President and |
| First Financial Bancorp; | | | | Chief Risk Officer |
| Chairman of the Board | | | | |
| and Chief Executive Officer, | | | | John M. Gavigan |
| First Financial Bank, N.A. | | | | First Vice President and |
| | | | | Corporate Controller |
| | | | | |
| | | | | |
| | | | | |
First Financial Bancorp 2013 Annual Report 7
|
| | | | | | | | | | | |
| FINANCIAL HIGHLIGHTS |
| | | | | | | |
| (Dollars in thousands, except per share data) | | 2013 | | 2012 | | % Change |
| Earnings | | | | | | |
| Net interest income | | $ | 228,320 |
| | $ | 253,341 |
| | (9.9 | )% |
| Net income | | 48,349 |
| | 67,303 |
| | (28.2 | )% |
| | | | | | | |
| Per Share | | | | | | |
| Net income per common share-basic | | $ | 0.84 |
| | $ | 1.16 |
| | (27.6 | )% |
| Net income per common share-diluted | | 0.83 |
| | 1.14 |
| | (27.2 | )% |
| Cash dividends declared per common share | | 0.94 |
| | 1.18 |
| | (20.3 | )% |
| Tangible book value per common share (end of year) | | 10.10 |
| | 10.47 |
| | (3.5 | )% |
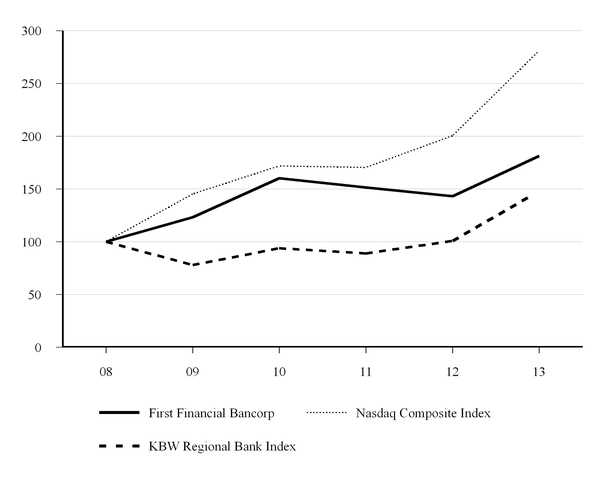
| Market price (end of year) | | 17.43 |
| | 14.62 |
| | 19.2 | % |
| | | | | | | |
| Balance Sheet - End of Year | | | | | | |
| Total assets | | $ | 6,417,213 |
| | $ | 6,497,048 |
| | (1.2 | )% |
| Deposits | | 4,837,507 |
| | 4,955,840 |
| | (2.4 | )% |
| Loans, including covered loans | | 3,963,514 |
| | 3,927,180 |
| | 0.9 | % |
| Investment securities | | 1,798,300 |
| | 1,874,343 |
| | (4.1 | )% |
| Shareholders' equity | | 682,161 |
| | 710,425 |
| | (4.0 | )% |
| | | | | | | |
| Ratios | | | | | | |
| Return on average assets | | 0.77 | % | | 1.07 | % | | |
| Return on average shareholders' equity | | 6.89 | % | | 9.43 | % | | |
| Return on average tangible shareholders' equity | | 8.05 | % | | 11.01 | % | | |
| Net interest margin | | 3.97 | % | | 4.37 | % | | |
| Net interest margin (fully tax equivalent) | | 4.01 | % | | 4.39 | % | | |
8 First Financial Bancorp 2013 Annual Report
|
| |
| | 2013 Financial Information |
First Financial Bancorp 2013 Annual Report 9
Management’s Discussion And Analysis Of Financial Condition And Results Of Operations
This annual report contains forward-looking statements. See the Forward-Looking Statements section that follows for further information on the risks and uncertainties associated with forward-looking statements. The following discussion and analysis is presented to facilitate the understanding of the financial position and results of operations of First Financial Bancorp. (First Financial or the Company). It identifies trends and material changes that occurred during the reporting periods and should be read in conjunction with the Statistical Data, Consolidated Financial Statements and accompanying Notes.
EXECUTIVE SUMMARY
First Financial is a $6.4 billion bank holding company headquartered in Cincinnati, Ohio. As of December 31, 2013, First Financial, through its subsidiaries, operated primarily in Ohio, Indiana and Kentucky. These subsidiaries include a commercial bank, First Financial Bank, N.A. (First Financial Bank or the Bank) with 110 banking centers and 137 ATMs. First Financial provides banking and financial services products through its four lines of business: commercial, consumer, wealth management and mortgage. The commercial, consumer and mortgage business lines provide credit-based products, deposit accounts, retail brokerage, corporate cash management support and other services to commercial and consumer clients. First Financial Wealth Management provides wealth planning, portfolio management, trust and retirement plan services and had approximately $2.5 billion in assets under management as of December 31, 2013. Additionally, the Bank provides franchise lending products, primarily equipment, real estate and leasehold improvement financing, for select concepts and franchisees in the quick service and casual dining restaurant sector located throughout the United States.
First Financial acquired the banking operations of Peoples Community Bank (Peoples), and Irwin Union Bank and Trust Company and Irwin Union Bank, F.S.B. (collectively, Irwin), through Federal Deposit Insurance Corporation (FDIC)-assisted transactions in 2009. In connection with these FDIC-assisted transactions, First Financial entered into loss sharing agreements with the FDIC. Under the terms of these agreements the FDIC reimburses First Financial for a percentage of losses with respect to certain loans (covered loans) and other real estate owned (covered OREO) (collectively, covered assets). These agreements provide for loss protection on single-family, residential loans for a period of ten years and First Financial is required to share any recoveries of previously charged-off amounts for the same time period, on the same pro-rata basis with the FDIC. All other loans are provided loss protection for a period of five years and recoveries of previously charged-off amounts must be shared with the FDIC for an additional three year period, on the same pro-rata basis. First Financial must follow specific servicing and resolution procedures, as outlined in the loss sharing agreements, in order to receive reimbursement from the FDIC for losses on covered assets.
The major components of First Financial’s operating results for the past five years are summarized in Table 1 – Financial Summary and discussed in greater detail on subsequent pages.
MARKET STRATEGY AND BUSINESS COMBINATIONS
First Financial serves a combination of metropolitan and non-metropolitan markets in Ohio, Indiana and Kentucky through its full-service banking centers, while providing franchise lending services to borrowers throughout the United States. First Financial’s market selection process includes a number of factors, but markets are primarily chosen for their potential for growth and long-term profitability. First Financial’s goal is to develop a competitive advantage utilizing a local market focus, building long-term relationships with clients to help them reach greater levels of success in their financial life and providing a superior level of service. First Financial intends to continue focusing plans for future growth and capital investments within its current metropolitan markets and evaluating other growth opportunities in metropolitan markets located within, or in close proximity to, the Company's current geographic footprint. Smaller markets have historically provided stable, low-cost funding sources to First Financial and remain an important part of its funding base. First Financial believes its historical strength in these markets should enable it to retain or improve its market share.
On December 17, 2013, First Financial and First Financial Bank entered into a definitive merger agreement with The First Bexley Bank (First Bexley or Bexley). Founded in 2006 and conducting operations out of one full service branch location in Bexley, Ohio, First Bexley serves commercial and consumer clients throughout central Ohio. Under the merger agreement, First Financial will acquire Bexley in a cash and stock transaction in which Bexley will merge with and into First Financial Bank. Shareholders of First Bexley will receive $30.50 for each share of First Bexley common stock consisting of $24.40 in the Company’s common stock and $6.10 in cash, subject to certain adjustment depending upon changes in the price of the Company’s common stock. Including outstanding options on First Bexley common stock, the transaction is valued at approximately $44.5 million. As of September 30, 2013, First Bexley had total assets of $295.4 million, total deposits of $271.1 million, and total common shareholders’ equity of $22.7 million.
10 First Financial Bancorp 2013 Annual Report
On December 19, 2013, First Financial and First Financial Bank signed a definitive merger agreement with Insight Bank (Insight). Founded in 2006 and conducting operations out of one full service location in Worthington, Ohio, and a mortgage origination office in Newark, Ohio, Insight provides commercial and consumer banking services to clients throughout central Ohio. Under the merger agreement, First Financial will acquire Insight in a cash and stock transaction in which Insight will merge with and into First Financial Bank. Shareholders of Insight will receive $20.50 for each share of Insight common stock consisting of $16.40 in the Company’s common stock and $4.10 in cash, subject to certain adjustment depending upon changes in the price of the Company’s common stock. Including outstanding options on Insight common stock, the transaction is valued at approximately $36.6 million. As of September 30, 2013, Insight had total assets of $200.2 million, total deposits of $165.4 million, and total common shareholders’ equity of $20.1 million.
The Bexley and Insight transactions are subject to approval by both regulators and their respective shareholders, and are expected to close in the first half of 2014.
While the Bexley and Insight acquisitions will provide First Financial entrance into the Columbus, Ohio metropolitan market, First Financial also entered the Fort Wayne, Indiana market through the hiring of experienced and well-established commercial and residential mortgage lending teams in January of 2014. On a combined basis, these actions provide First Financial entrance into two new metropolitan markets that it believes have attractive demographics and future growth prospects.
Efficiency. During the third quarter 2012, First Financial completed a comprehensive efficiency study across all business lines and support functions in an effort to mitigate earnings growth challenges related to the current interest rate and economic environment as well as declining balances in the Company's high-yielding covered loan portfolio. As a result, the Company identified approximately $17.1 million of annualized cost savings impacting several expense categories. Realization of the identified cost savings began late in 2012, however the Company did not recognize net savings during 2012 as costs associated with implementing the efficiency plan offset initial savings. Based on 2013 operating performance, the Company surpassed its original realization goal and achieved 100% of its annual target of $17.1 million during the year.
All initiatives related to the original plan are fully implemented and annualized cost savings are expected to exceed the original target. Ultimately, the achievement of these cost savings will be contingent upon management's continued ability to maintain efficiency plans while managing external factors, such as regulatory changes and a dynamic business environment, without impacting client service levels throughout the Company.
As part of the on-going evaluation of its banking center network and the efficiency plans discussed above, First Financial consolidated 17 banking centers located in Ohio and Indiana in 2013. Additionally, during 2012, the Company consolidated 11 banking centers located in Ohio and Indiana and closed 5 other banking centers in areas of Indiana where the Company had a limited presence. Customer relationships related to the consolidated banking centers were transferred to the nearest First Financial location where those customers continue to receive the same high level of service.
These banking center actions allow First Financial to focus additional resources in core markets, such as Cincinnati, Dayton and Columbus, Ohio and Indianapolis, Fort Wayne, Southern and Northwest Indiana, that the Company believes provide a higher level of potential overall growth and improve the efficiency of its operations.
First Financial Bancorp 2013 Annual Report 11
Management’s Discussion And Analysis Of Financial Condition And Results Of Operations
|
| | | | | | | | | | | | | | | | | | | |
| Table 1 • Financial Summary | | | | | | | | | |
| | December 31, |
| (Dollars in thousands, except per share data) | 2013 | | 2012 | | 2011 | | 2010 | | 2009 |
| Summary of operations | | | | | | | | | |
| Interest income | $ | 245,208 |
| | $ | 280,930 |
| | $ | 308,817 |
| | $ | 343,502 |
| | $ | 233,228 |
|
Tax equivalent adjustment (1) | 2,142 |
| | 1,055 |
| | 979 |
| | 866 |
| | 1,265 |
|
Interest income tax – equivalent (1) | 247,350 |
| | 281,985 |
| | 309,796 |
| | 344,368 |
| | 234,493 |
|
| Interest expense | 16,888 |
| | 27,589 |
| | 44,921 |
| | 67,992 |
| | 57,245 |
|
Net interest income tax – equivalent (1) | $ | 230,462 |
| | $ | 254,396 |
| | $ | 264,875 |
| | $ | 276,376 |
| | $ | 177,248 |
|
| Interest income | $ | 245,208 |
| | $ | 280,930 |
| | $ | 308,817 |
| | $ | 343,502 |
| | $ | 233,228 |
|
| Interest expense | 16,888 |
| | 27,589 |
| | 44,921 |
| | 67,992 |
| | 57,245 |
|
| Net interest income | 228,320 |
| | 253,341 |
| | 263,896 |
| | 275,510 |
| | 175,983 |
|
| Provision for loan and lease losses – uncovered | 8,714 |
| | 19,117 |
| | 19,210 |
| | 33,564 |
| | 56,084 |
|
| Provision for loan and lease losses – covered | 195 |
| | 30,903 |
| | 64,081 |
| | 63,144 |
| | 0 |
|
| Noninterest income | 73,647 |
| | 122,421 |
| | 142,531 |
| | 146,831 |
| | 404,715 |
|
| Noninterest expenses | 225,475 |
| | 221,997 |
| | 218,097 |
| | 233,680 |
| | 170,638 |
|
| Income before income taxes | 67,583 |
| | 103,745 |
| | 105,039 |
| | 91,953 |
| | 353,976 |
|
| Income tax expense | 19,234 |
| | 36,442 |
| | 38,300 |
| | 32,702 |
| | 132,639 |
|
| Net income | 48,349 |
| | 67,303 |
| | 66,739 |
| | 59,251 |
| | 221,337 |
|
| Dividends on preferred stock | 0 |
| | 0 |
| | 0 |
| | 1,865 |
| | 3,578 |
|
| Income available to common shareholders | $ | 48,349 |
| | $ | 67,303 |
| | $ | 66,739 |
| | $ | 57,386 |
| | $ | 217,759 |
|
| | | | | | | | | | |
| Per share data | | | | | | | | | |
| Earnings per common share | | | | | | | | | |
| Basic | $ | 0.84 |
| | $ | 1.16 |
| | $ | 1.16 |
| | $ | 1.01 |
| | $ | 4.84 |
|
| Diluted | $ | 0.83 |
| | $ | 1.14 |
| | $ | 1.14 |
| | $ | 0.99 |
| | $ | 4.78 |
|
| Cash dividends declared per common share | $ | 0.94 |
| | $ | 1.18 |
| | $ | 0.78 |
| | $ | 0.40 |
| | $ | 0.40 |
|
| Average common shares outstanding–basic (in thousands) | 57,270 |
| | 57,877 |
| | 57,692 |
| | 56,969 |
| | 45,029 |
|
| Average common shares outstanding–diluted (in thousands) | 58,073 |
| | 58,869 |
| | 58,693 |
| | 57,993 |
| | 45,557 |
|
| | | | | | | | | | |
| Selected year-end balances | | | | | | | | | |
| Total assets | $ | 6,417,213 |
| | $ | 6,497,048 |
| | $ | 6,671,511 |
| | $ | 6,250,225 |
| | $ | 6,657,593 |
|
| Earning assets | 5,840,849 |
| | 5,961,727 |
| | 6,110,934 |
| | 5,741,683 |
| | 5,964,853 |
|
Investment securities (2) | 1,798,300 |
| | 1,874,343 |
| | 1,516,002 |
| | 1,015,205 |
| | 579,147 |
|
| Loans, excluding covered loans | 3,505,641 |
| | 3,179,064 |
| | 2,968,447 |
| | 2,816,093 |
| | 2,895,129 |
|
| Covered loans | 457,873 |
| | 748,116 |
| | 1,053,244 |
| | 1,481,493 |
| | 1,934,740 |
|
| Total loans | 3,963,514 |
| | 3,927,180 |
| | 4,021,691 |
| | 4,297,586 |
| | 4,829,869 |
|
| FDIC indemnification asset | 45,091 |
| | 119,607 |
| | 173,009 |
| | 222,648 |
| | 287,407 |
|
| Interest-bearing demand deposits | 1,125,723 |
| | 1,160,815 |
| | 1,317,339 |
| | 1,111,877 |
| | 1,060,383 |
|
| Savings deposits | 1,612,005 |
| | 1,623,614 |
| | 1,724,659 |
| | 1,534,045 |
| | 1,231,081 |
|
| Time deposits | 952,327 |
| | 1,068,637 |
| | 1,654,662 |
| | 1,794,843 |
| | 2,229,500 |
|
| Noninterest-bearing demand deposits | 1,147,452 |
| | 1,102,774 |
| | 946,180 |
| | 705,484 |
| | 829,676 |
|
| Total deposits | 4,837,507 |
| | 4,955,840 |
| | 5,642,840 |
| | 5,146,249 |
| | 5,350,640 |
|
| Short-term borrowings | 748,749 |
| | 624,570 |
| | 99,431 |
| | 59,842 |
| | 37,430 |
|
| Long-term debt | 60,780 |
| | 75,202 |
| | 76,544 |
| | 128,880 |
| | 404,716 |
|
| Other long-term debt | 0 |
| | 0 |
| | 0 |
| | 20,620 |
| | 20,620 |
|
| Shareholders’ equity | 682,161 |
| | 710,425 |
| | 712,221 |
| | 697,394 |
| | 649,958 |
|
| | | | | | | | | | |
| Select Financial Ratios | | | | | | | | | |
Average loans to average deposits (3) | 82.12 | % | | 75.66 | % | | 78.53 | % | | 86.43 | % | | 92.56 | % |
| Net charge-offs to average loans, excluding covered loans | 0.38 | % | | 0.79 | % | | 0.84 | % | | 1.27 | % | | 1.16 | % |
| Average shareholders’ equity to average total assets | 11.17 | % | | 11.30 | % | | 11.33 | % | | 10.53 | % | | 9.85 | % |
| Average common shareholders’ equity to average total assets | 11.17 | % | | 11.30 | % | | 11.33 | % | | 10.35 | % | | 8.20 | % |
| Return on average assets | 0.77 | % | | 1.07 | % | | 1.06 | % | | 0.91 | % | | 4.67 | % |
| Return on average common equity | 6.89 | % | | 9.43 | % | | 9.37 | % | | 8.55 | % | | 56.07 | % |
| Return on average equity | 6.89 | % | | 9.43 | % | | 9.37 | % | | 8.68 | % | | 47.44 | % |
| Net interest margin | 3.97 | % | | 4.37 | % | | 4.55 | % | | 4.66 | % | | 4.05 | % |
Net interest margin (tax equivalent basis) (1) | 4.01 | % | | 4.39 | % | | 4.57 | % | | 4.68 | % | | 4.08 | % |
| Dividend payout | 111.90 | % | | 101.72 | % | | 67.24 | % | | 39.60 | % | | 8.26 | % |
(1) Tax equivalent basis was calculated using a 35.00% tax rate in all years presented.
(2) Includes investment securities held-to-maturity, investment securities available-for-sale, investment securities trading, and other investments.
(3) Includes covered loans and loans held for sale.
12 First Financial Bancorp 2013 Annual Report
OVERVIEW OF OPERATIONS
The primary source of First Financial’s revenue is net interest income, or the excess of interest received from earning assets over interest paid on interest-bearing liabilities, plus fees for financial services provided to clients. First Financial’s business results are influenced by overall economic factors and conditions, including market interest rates, competition within the marketplace, business spending, consumer confidence and regulatory changes.
Net interest income in 2013 declined 9.9% from 2012, compared to a 4.0% decrease in 2012 compared to 2011. The decline in 2013 was attributable to a 32.8% decrease in average covered loan balances and lower yields on the FDIC indemnification asset and uncovered loans, partially offset by a decline in the cost of interest bearing liabilities, during the year. The net interest margin was 3.97% for 2013 compared with 4.37% in 2012 and 4.55% in 2011.
Noninterest income declined $48.8 million during the year, from $122.4 million in 2012 to $73.6 million in 2013. The decline in noninterest income was primarily due to lower FDIC loss sharing income and income from the accelerated discount on covered loans that prepay during the year. FDIC loss sharing income represents reimbursements due from the FDIC under loss sharing agreements for losses and resolution expenses on covered assets.
Noninterest expense increased $3.5 million during the year, from $222.0 million in 2012 to $225.5 million in 2013. The increase was primarily due to a valuation adjustment to the FDIC indemnification asset and pension settlement charges incurred in 2013, partially offset by lower salaries and benefits, loss sharing expenses and losses on noncovered and covered OREO during the year.
Net income for the year ended December 31, 2013 was $48.3 million, resulting in basic earnings per share of $0.84, and $0.83 of earnings per diluted common share. This represented a 28.2% decrease in net income from $67.3 million in 2012. Basic and diluted earnings per share for the year ended December 31, 2012 were $1.16 and $1.14, respectively. First Financial’s return on average shareholders’ equity for 2013 was 6.89%, which compares to 9.43% for 2012. First Financial’s return on average assets for 2013 was 0.77%, which compares to a return on average assets of 1.07% for 2012.
Total loans increased $36.3 million from $3.9 billion at December 31, 2012 to $4.0 billion at December 31, 2013. Total uncovered loans increased $326.6 million, from $3.2 billion at December 31, 2012 to $3.5 billion at December 31, 2013 while total covered loans decreased $290.2 million, from $748.1 million at December 31, 2012 to $457.9 million at December 31, 2013.
First Financial experienced a $118.3 million or 2.4% decline in total deposits during 2013, from $5.0 billion at December 31, 2012 to $4.8 billion as of December 31, 2013, as a result of a continued focus on core deposit relationships and lowering the Company's funding costs. Noninterest bearing deposits increased by $44.7 million, while interest-bearing checking deposits decreased by $35.1 million, savings deposits decreased by $11.6 million and time deposits declined by $116.3 million during the period. The decline in deposits during 2013 was offset by a $124.2 million or 19.9% increase in lower cost, short-term borrowings from $624.6 million as of December 31, 2012 to $748.7 million as of December 31, 2013. The Company's total cost of funds declined to 0.31% in 2013 from 0.50% in 2012.
The uncovered allowance for loan and lease losses at December 31, 2013, was $43.8 million, or 1.25%, of uncovered loans compared to $47.8 million, or 1.50% of uncovered loans at December 31, 2012. The Company's credit quality performance improved moderately in 2012 and more notably in 2013, reflecting the continued recovery in the U.S. economy from the period of sustained weakness and falling real estate values experienced from 2007 to 2010. First Financial's lower levels of nonaccrual loans and classified assets in 2013 reflect improving economic conditions, including lower unemployment rates and higher levels of business and consumer spending.
For a more detailed discussion of the above topics, please refer to the sections that follow.
First Financial Bancorp 2013 Annual Report 13
Management’s Discussion And Analysis Of Financial Condition And Results Of Operations
NET INCOME
2013 vs. 2012. First Financial’s net income decreased $19.0 million or 28.2% to $48.3 million in 2013, compared to net income of $67.3 million in 2012. The decrease was primarily related to declines in net interest income of $25.0 million, or 9.9%, and noninterest income of $48.8 million or 39.8%, partially offset by a $30.7 million, or 99.4% reduction in provision for loan and lease losses on covered loans, a $10.4 million, or 54.4% reduction in provision for loan and lease losses on uncovered loans and a $17.2 million, or 47.2% decrease in income tax expense. For more detail, refer to the Net interest income, Noninterest income and Noninterest expense sections that follow.
2012 vs. 2011. First Financial’s net income increased $0.6 million or 0.8% to $67.3 million in 2012, compared to net income of $66.7 million in 2011. The increase was primarily related to a $33.2 million or 51.8% reduction in provision for loan and lease losses on covered loans, offset by a related $20.1 million or 14.1% decline in noninterest income as well as a $10.6 million or 4.0% decline in net interest income in 2012. The decline in net interest income during 2012 was primarily driven by a 27.7% decrease in average covered loan balances. Noninterest expenses increased $3.9 million or 1.8% in 2012.
NET INTEREST INCOME
First Financial’s net interest income for the years 2009 through 2013 is shown in Table 1 – Financial Summary. Net interest income, First Financial’s principal source of income, is the excess of interest received from earning assets over interest paid on interest-bearing liabilities, plus fees for financial services provided to clients. The amount of net interest income is determined by the volume and mix of earning assets, the rates earned on such earning assets and the volume, mix and rates paid for the deposits and borrowed money that support the earning assets. Table 2 – Volume/Rate Analysis describes the extent to which changes in interest rates and changes in the volume of earning assets and interest-bearing liabilities have affected First Financial’s net interest income on a tax equivalent basis during the years presented. Nonaccrual loans and loans held for sale, were included in the daily average loan balances used to determine the yields in Table 2 – Volume/Rate Analysis. Table 2 – Volume/Rate Analysis should be read in conjunction with the Statistical Information table.
Interest income on a tax equivalent basis is presented in Table 1 – Financial Summary. The tax equivalent adjustment recognizes the income tax savings when comparing taxable and tax-exempt assets and assumes a 35.0% tax rate for all years presented. First Financial's tax equivalent net interest margin was 4.01%, 4.39% and 4.57% for 2013, 2012 and 2011, respectively.
Loan fees included in the interest income computation for 2013, 2012 and 2011 were $6.7 million, $9.4 million and $5.6 million, respectively. The decrease in loan fees in 2013 was primarily due to lower prepayment fee income as a result of reduced levels of payoffs and loan refinancings. Loan fee income in 2012 included a $2.2 million fee related to the early payoff of a single commercial relationship.
2013 vs. 2012. Net interest income decreased $25.0 million or 9.9%, from $253.3 million in 2012 to $228.3 million in 2013, primarily due to lower yields on earning assets partially offset by a decline in the cost of interest-bearing liabilities during 2013. While average earning assets were relatively unchanged, the yield on earning assets declined 58 basis points from 4.84% in 2012 to 4.26% in 2013.
Interest income was $245.2 million in 2013, a $35.7 million or 12.7% decrease from 2012. The decline in interest income and the lower yield on earning assets in 2013 were primarily the result of a $290.2 million or 38.8% decrease in covered loans, which generally accrete a yield above market interest rates, as well as declines in the yields on uncovered loans and investment securities in 2013.
Interest expense was $16.9 million in 2013, a $10.7 million or 38.8% decrease from 2012. The total cost of funds declined 24 basis points to 0.38% in 2013 from 0.62% in 2012, primarily due to a 24 basis point decrease in the cost of interest-bearing deposits to 0.35% in 2013 from 0.59% in 2012. The lower cost of funds in 2013 was primarily a result of the lower interest rate environment as well as deposit pricing and rationalization strategies executed by the Company in recent years.
2012 vs. 2011. Net interest income decreased $10.6 million, or 4.0%, primarily due to lower yields on earning assets during 2012. Average earning assets declined $105.3 million, or 1.8%, during 2011. While average earning assets were relatively unchanged, the yield on earning assets declined 48 basis points from 5.32% in 2012 to 4.84% in 2012.
Interest income was $280.9 million in 2012, a $27.9 million or 9.0% decrease from 2011. The decline in interest income and the lower yield on earning assets in 2012 are primarily the result of a $305.1 million or 29.0% decrease in covered loans, which generally accrete a yield above market interest rates. The decline in interest income on covered loans was partially offset by
14 First Financial Bancorp 2013 Annual Report
higher interest income on investment securities in 2012 related to a $358.3 million or 23.6% increase in investment securities during the period.
Interest expense was $27.6 million in 2012, a $17.3 million or 38.6% decrease from 2011. The total cost of funds declined 34 basis points to 0.62% in 2012 from 0.96% in 2011, primarily due to a 32 basis point decrease in the cost of interest-bearing deposits to 0.59% in 2012 from 0.91% in 2011. The lower cost of funds in 2012 was primarily a result of the lower interest rate environment as well as deposit pricing and rationalization strategies the Company implemented in 2011 and continued throughout 2012.
|
| | | | | | | | | | | | | | | | | | | | | | | | |
Table 2 • Volume/Rate Analysis - Tax Equivalent Basis (1) | | | | |
| | | 2013 change from 2012 due to | | 2012 change from 2011 due to |
| (Dollars in thousands) | | Volume | Rate | | Total | | Volume | Rate | | Total |
| Interest income | | | | | | | | | | | | |
Loans (2) | | $ | 13,894 |
| | $ | (9,862 | ) | | $ | 4,032 |
| | $ | 8,652 |
| | $ | (9,715 | ) | | $ | (1,063 | ) |
| Covered loans and indemnification asset | | (30,427 | ) | | (7,200 | ) | | (37,627 | ) | | (37,357 | ) | | 2,251 |
| | (35,106 | ) |
Investment securities (3) | | | | | | | | | | | | |
| Taxable | | (1,270 | ) | | (2,247 | ) | | (3,517 | ) | | 11,873 |
| | (2,448 | ) | | 9,425 |
|
| Tax-exempt | | 2,731 |
| | (170 | ) | | 2,561 |
| | 470 |
| | (518 | ) | | (48 | ) |
Total investment securities interest (3) | | 1,461 |
| | (2,417 | ) | | (956 | ) | | 12,343 |
| | (2,966 | ) | | 9,377 |
|
| Interest-bearing deposits with other banks | | (126 | ) | | 42 |
| | (84 | ) | | (983 | ) | | (36 | ) | | (1,019 | ) |
| Total | | (15,198 | ) | | (19,437 | ) | | (34,635 | ) | | (17,345 | ) | | (10,466 | ) | | (27,811 | ) |
| | | | | | | | | | | | | |
| Interest expense | | | | | | | | | | | | |
| Interest-bearing demand deposits | | (92 | ) | | 42 |
| | (50 | ) | | 7 |
| | (1,455 | ) | | (1,448 | ) |
| Savings deposits | | (5 | ) | | (191 | ) | | (196 | ) | | 7 |
| | (3,807 | ) | | (3,800 | ) |
| Time deposits | | (3,602 | ) | | (7,530 | ) | | (11,132 | ) | | (4,722 | ) | | (6,186 | ) | | (10,908 | ) |
| Short-term borrowings | | 780 |
| | 135 |
| | 915 |
| | 135 |
| | (36 | ) | | 99 |
|
| Long-term debt | | (205 | ) | | (33 | ) | | (238 | ) | | (811 | ) | | (73 | ) | | (884 | ) |
| Other long-term debt | | N/M |
| | N/M |
| | N/M |
| | (391 | ) | | 0 |
| | (391 | ) |
| Total | | (3,124 | ) | | (7,577 | ) | | (10,701 | ) | | (5,775 | ) | | (11,557 | ) | | (17,332 | ) |
| Net interest income | | $ | (12,074 | ) | | $ | (11,860 | ) | | $ | (23,934 | ) | | $ | (11,570 | ) | | $ | 1,091 |
| | $ | (10,479 | ) |
(1) Tax equivalent basis was calculated using a 35.00% tax rate.
(2) Includes nonaccrual loans and loans held-for-sale.
(3) Includes investment securities held-to-maturity, investment securities available-for-sale and other investments.
N/M = Not meaningful.
NONINTEREST INCOME AND NONINTEREST EXPENSES
Noninterest income and noninterest expenses for 2013, 2012 and 2011 are shown in Table 3 – Noninterest Income and Noninterest Expenses.
NONINTEREST INCOME
2013 vs. 2012. Noninterest income decreased $48.8 million or 39.8% from $122.4 million in 2012 to $73.6 million in 2013 primarily related to lower FDIC loss sharing income, income from the accelerated discount on covered loans that prepay, gains on sales of securities and mortgages and other income. FDIC loss sharing income declined $31.6 million or 89.5% from 2012 to 2013 as a result of improvement in future expected cash flows on covered loans and declining losses on covered assets during the year. FDIC loss sharing income represents the proportionate share of credit losses on covered assets that First Financial expects to receive from the FDIC. Income from the accelerated discount on covered loans decreased $6.5 million or 47.6%, while other income declined $7.9 million or 39.7%. Accelerated discounts on covered loans that prepay result from the accelerated recognition of a component of the covered loan discount that would have been recognized over the expected life of the loan had it not prepaid. Income from the sale of mortgages declined $1.4 million, or 31.1% due to lower mortgage demand as a result of rising interest rates during 2013. The decrease in other noninterest income was primarily related to a $5.0 million legal settlement received in 2012 as well as lower income from bank owned life insurance and client derivative fees in 2013.
First Financial Bancorp 2013 Annual Report 15
Management’s Discussion And Analysis Of Financial Condition And Results Of Operations
2012 vs. 2011. Noninterest income decreased $20.1 million, or 14.1%, from $142.5 million in 2011 to $122.4 million in 2012 primarily related to lower FDIC loss sharing income and income from the accelerated discount on covered loans that prepay. FDIC loss sharing income declined $25.5 million or 41.9% from 2011 to 2012. Net of the FDIC loss sharing income described above, noninterest income increased $5.4 million, or 6.7%, in 2012 as compared with 2011, primarily due to higher service charges on deposits, bankcard income and other noninterest income partially offset by lower income from the accelerated discount on covered loans that prepay. The increases in service charges on deposits and bankcard income during 2012 were primarily a result of the Company's banking center acquisitions late in 2011. The increase in other noninterest income was primarily related to a $5.0 million legal settlement received in the second quarter as well as increased rental income on OREO properties, both covered and uncovered, as well as the credit valuation adjustment applied to the derivative portfolio.
|
| | | | | | | | | | | | | | | | | |
| Table 3 • Noninterest Income and Noninterest Expense |
| | 2013 | | 2012 | | 2011 |
| | | % Change | | | % Change | | | % Change |
| | | Increase | | | Increase | | | Increase |
| (Dollars in thousands) | Total | (Decrease) | | Total | (Decrease) | | Total | (Decrease) |
| Noninterest income | | | | | | | | |
| Service charges on deposit accounts | $ | 20,595 |
| (2.9 | )% | | $ | 21,215 |
| 10.5 | % | | $ | 19,206 |
| (13.4 | )% |
| Trust and wealth management fees | 14,319 |
| 2.6 | % | | 13,951 |
| (2.7 | )% | | 14,340 |
| 3.4 | % |
| Bankcard income | 10,914 |
| 8.8 | % | | 10,028 |
| 7.9 | % | | 9,291 |
| 9.1 | % |
| Net gains from sales of loans | 3,150 |
| (31.1 | )% | | 4,570 |
| 7.3 | % | | 4,258 |
| (8.1 | )% |
| FDIC loss sharing income | 3,720 |
| (89.5 | )% | | 35,346 |
| (41.9 | )% | | 60,888 |
| 17.4 | % |
| Accelerated discount on covered loans | 7,153 |
| (47.6 | )% | | 13,662 |
| (33.4 | )% | | 20,521 |
| (29.4 | )% |
| Other | 12,072 |
| (39.7 | )% | | 20,021 |
| 74.3 | % | | 11,486 |
| (31.4 | )% |
| Subtotal | 71,923 |
| (39.5 | )% | | 118,793 |
| (15.1 | )% | | 139,990 |
| (4.7 | )% |
| Gains on sales of investment securities | 1,724 |
| (52.5 | )% | | 3,628 |
| 42.8 | % | | 2,541 |
| N/M |
|
| Total | $ | 73,647 |
| (39.8 | )% | | $ | 122,421 |
| (14.1 | )% | | $ | 142,531 |
| (2.9 | )% |
| | | | | | | | | |
| Noninterest expenses | | | | | | | | |
| Salaries and employee benefits | $ | 101,402 |
| (10.4 | )% | | $ | 113,154 |
| 5.8 | % | | $ | 106,914 |
| (8.9 | )% |
| Pension settlement charges | 6,174 |
| N/M |
| | 0 |
| N/M |
| | 0 |
| N/M |
|
| Net occupancy | 21,207 |
| 2.5 | % | | 20,682 |
| (3.4 | )% | | 21,410 |
| (5.1 | )% |
| Furniture and equipment | 8,970 |
| (2.4 | )% | | 9,190 |
| (7.6 | )% | | 9,945 |
| (3.4 | )% |
| Data processing | 10,229 |
| 15.8 | % | | 8,837 |
| 54.6 | % | | 5,716 |
| 10.9 | % |
| Marketing | 4,270 |
| (23.1 | )% | | 5,550 |
| (4.2 | )% | | 5,794 |
| 8.2 | % |
| Communication | 3,207 |
| (5.9 | )% | | 3,409 |
| 6.4 | % | | 3,203 |
| (18.0 | )% |
| Professional services | 6,876 |
| (5.4 | )% | | 7,269 |
| (24.6 | )% | | 9,636 |
| 5.1 | % |
| State intangible tax | 3,929 |
| 0.8 | % | | 3,899 |
| 8.8 | % | | 3,583 |
| (26.0 | )% |
| FDIC assessments | 4,501 |
| (3.9 | )% | | 4,682 |
| (17.5 | )% | | 5,676 |
| (31.7 | )% |
| Loss-other real estate owned | 1,250 |
| (61.5 | )% | | 3,250 |
| (18.2 | )% | | 3,971 |
| 241.4 | % |
| Loss-covered other real estate owned | (1,219 | ) | (149.8 | )% | | 2,446 |
| (73.5 | )% | | 9,224 |
| 907.0 | % |
| Loss sharing expense | 7,083 |
| (34.0 | )% | | 10,725 |
| 197.9 | % | | 3,600 |
| 485.4 | % |
| FDIC indemnification impairment | 22,417 |
| N/M |
| | 0 |
| N/M |
| | 0 |
| N/M |
|
| Other | 25,179 |
| (12.9 | )% | | 28,904 |
| (1.8 | )% | | 29,425 |
| (18.3 | )% |
| Total | $ | 225,475 |
| 1.6 | % | | $ | 221,997 |
| 1.8 | % | | $ | 218,097 |
| (6.7 | )% |
N/M = Not meaningful
NONINTEREST EXPENSES
16 First Financial Bancorp 2013 Annual Report
2013 vs. 2012. Noninterest expenses increased $3.5 million or 1.6% in 2013 compared to 2012, primarily due to a $22.4 million FDIC indemnification valuation adjustment and $6.2 million of pension settlement charges incurred during 2013 as well as a $1.4 million, or 15.8% increase in data processing expenses. These increases were partially offset by an $11.8 million, or 10.4% decrease in salaries and employee benefits, a $3.6 million, or 34.0% decline in loss sharing expenses, a $2.0 million, or 61.5% decline in losses on OREO, a $3.7 million, or 149.8% decrease in losses on covered OREO and a $3.7 million, or 12.9% decline in other noninterest expense during 2013. Excluding the FDIC indemnification valuation adjustment and pension settlement charges, noninterest expenses declined $25.1 million or 11.3% during 2013 primarily as a result of the Company's ongoing efficiency efforts.
The FDIC indemnification valuation adjustment was primarily a result of improvement in future expected cash flows on covered loans, a meaningful decline in loss claims filed with the FDIC, higher reimbursements to the FDIC related to positive asset resolutions in recent periods and the significantly shorter remaining life of the indemnification asset in comparison to the weighted average life of the related covered loans.
The accounting and valuation for the FDIC indemnification asset is closely related to the accounting and valuation for covered loans. Improvement in expected cash flows related to covered loans is driven primarily by their actual or estimated credit performance and is generally reflected in changes in the yield on the loans. There is an opposite effect on the FDIC indemnification asset and those changes in estimated credit performance are reflected by a change in its yield as well. The Company continues to amortize the FDIC indemnification asset over the remaining life of the loss sharing agreements, a significantly shorter period than the remaining life of the covered loans as required by the related accounting guidance, causing a meaningful increase in the negative yield of the FDIC indemnification asset in the fourth quarter of 2013.
Also contributing to the FDIC indemnification valuation adjustment was improvement in the expected credit performance of the commercial covered loan portfolio compared to earlier estimates as criticized and classified covered loan balances have declined substantially and actual credit losses to date have been lower than First Financial originally estimated. In addition to this improved credit outlook, the Company experienced both an increase in recoveries related to covered loans, 80% of which are required to be shared back to the FDIC, as well as a significant decline in loss sharing claims filed with the FDIC late in 2013.
Given these factors and the significant negative yield that would have been required to amortize the commercial portion of the FDIC indemnification asset to zero at its expiration date, management concluded during the fourth quarter of 2013 that the FDIC indemnification asset was impaired. As a result, the Company recorded a $22.4 million pre-tax non-cash valuation adjustment to reduce the value of the FDIC indemnification asset as of December 31, 2013.
During 2013, First Financial recognized $6.2 million of pension settlement charges as a result of the level of lump sum distributions from the Company's pension plan. Consistent with FASB ASC Topic 715, Compensation - Retirement Benefits, pension settlement charges are an acceleration of previously deferred costs that would have been recognized in future periods and are triggered when lump sum distributions exceed an annual accounting threshold for the plan. First Financial incurred these pension settlement charges as a result of employee-related changes, including staff retirements and reductions due to recent efficiency initiatives, and the resulting lump sum distributions from the plan. The annual threshold for recognizing lump-sum distributions as pension settlement charges reset on January 1, 2014.
The decrease in salaries and benefits during 2013 was primarily attributable to staffing reductions associated with ongoing efficiency initiatives. The increase in data processing expense in 2013 was the full year effect of various software and system implementations in 2012, including new internet and mobile banking platforms. The decline in noninterest expenses related to OREO and covered OREO reflect continued stabilization and improvement in real estate values in 2013.
The decrease in loss sharing expense relates primarily to lower collection costs incurred to resolve problem covered loans. First Financial views the combination of provision expense on covered loans, losses on covered OREO and loss sharing expense, net of the related reimbursements due under loss sharing agreements recorded as FDIC loss sharing income, as the net credit costs associated with covered assets during the period. For additional discussion of the credit costs associated with covered assets, see "Allowance for loan and lease losses, covered loans."
The decline in other noninterest expenses is primarily attributable to a $1.1 million, or 43.3% decline in amortization expense related to core deposit intangibles due to accelerated amortization in conjunction with branch consolidation activities in 2012, a $0.6 million pension administration expense during 2012 and a decline in the reserve for off-balance sheet commitments during 2013.
First Financial Bancorp 2013 Annual Report 17
Management’s Discussion And Analysis Of Financial Condition And Results Of Operations
2012 vs. 2011. Noninterest expenses increased $3.9 million or 1.8% in 2012 compared to 2011, due primarily to a $6.2 million or 5.8% increase in salaries and employee benefits, a $3.1 million or 54.6% increase in data processing expense and a $7.1 million or 197.9% increase in loss sharing expense. These increases were partially offset by a $2.4 million or 24.6% decrease in professional services expense, a $1.0 million or 17.5% decrease in FDIC assessments and a $6.8 million or 73.5% decrease in losses incurred on the sale of covered OREO properties during 2012.
The increase in salaries and benefits during 2012 was primarily attributable to the banking center acquisitions late in 2011 as well as higher incentive payments related to elevated loan originations in 2012. The increase in data processing expense in 2012 was due to various software and system implementations finalized during the year, including new internet and mobile banking platforms introduced late in 2012. The increase in loss sharing expense related primarily to collection costs incurred to resolve problem covered loans. The decline in professional services expense in 2012 was primarily attributable to lower legal costs during the year while the decline in FDIC assessments was related to reduced assessment rates that took effect mid-2011.
INCOME TAXES
First Financial’s tax expense in 2013 totaled $19.2 million compared to $36.4 million in 2012 and $38.3 million in 2011, resulting in effective tax rates of 28.5%, 35.1% and 36.5% in 2013, 2012 and 2011, respectively. The decrease in the effective tax rate in 2013 compared to 2012 was a result of state tax planning strategies implemented during 2013, including formation of a captive real estate investment trust, a favorable adjustment to deferred tax liabilities relating to a change in state tax laws, favorable tax reversals related to an intercompany tax obligation associated with an unconsolidated former Irwin subsidiary and higher income earned on tax exempt securities during the year. The decrease in the effective tax rate in 2012 compared to 2011 was primarily due to a one-time provision to return adjustment related to state income taxes at the subsidiary level as well as the marginal impact of 2011's higher pre-tax earnings. A normalized effective tax rate in future periods is estimated to be 34.0%.
Further information on income taxes is presented in Note 14 of the Notes to Consolidated Financial Statements.
LENDING PRACTICES
First Financial remains dedicated to meeting the financial needs of individuals and businesses through its client-focused business model. The loan portfolio is comprised of a broad range of borrowers primarily in the Ohio, Indiana and Kentucky markets; however, the franchise finance business serves a national client base. All loans acquired in the Peoples and Irwin acquisitions during 2009 were acquired under loss sharing agreements whereby the FDIC reimburses First Financial for the majority of losses incurred in accordance with the agreements.
First Financial’s loan portfolio is composed of commercial loan types, including commercial and industrial (commercial), real estate construction, commercial real estate and equipment leasing (lease financing), as well as consumer loan types, including residential real estate, home equity, installment and credit card loans.
Commercial – Commercial loans include revolving lines of credit and term loans to commercial customers for use in normal business operations to finance working capital needs, equipment purchases, leasehold improvements or other projects. Commercial loans are generally underwritten individually and secured with the assets of the Company and/or the personal guarantee of the business owners. Commercial loans also include asset based lending (ABL), as well as equipment and leasehold improvement financing for select concepts and franchisees in the quick service and casual dining restaurant sector. ABL transactions typically involve larger commercial clients and are secured by specific assets, such as inventory, accounts receivable, machinery and equipment. In the franchise lending space, First Financial focuses on a limited number of restaurant concepts that have sound economics, low closure rates and strong brand awareness within specified local, regional or national markets. First Financial's franchise lending portfolio is managed to a risk-appropriate level so as not to create an industry, geographic or franchisee concept concentration.
While economic trends continued to improve during 2013, the slow and uneven pace of recovery remains a challenge. First Financial maintains vigorous underwriting processes to assess prospective commercial borrowers' credit worthiness prior to origination and actively monitors commercial relationships subsequent to funding in order to ensure adequate oversight of the portfolio.
Real Estate Construction – Real estate construction loans are term loans to individuals, companies or developers used for the construction of a commercial or residential property for which repayment will be generated by the sale or permanent financing of the property. Generally, these loans are for construction projects that have been either pre-sold, pre-leased or have secured permanent financing, as well as loans to real estate companies with significant equity invested in the project. Real estate
18 First Financial Bancorp 2013 Annual Report
construction loans are underwritten by an independent credit team, managed by experienced lending officers and monitored through the construction phase by a centralized funding desk that manages loan disbursements.
First Financial actively monitors industry and portfolio-specific credit trends affecting the Company's construction real estate loan portfolio and continues to restrict real estate construction lending to select opportunities due to excess supply and declines in property values in recent years.
Commercial Real Estate – Commercial real estate loans consist of term loans secured by a mortgage lien on real estate properties such as apartment buildings, office and industrial buildings and retail shopping centers. Additionally, the Company's franchise lending activities discussed in the "Commercial" section above often include the financing of real estate as well as equipment. The credit underwriting for both owner-occupied and investor income producing real estate loans includes detailed market analysis, historical and projected cash flow analysis, appropriate equity margins, assessment of lessees and lessors, type of real estate and other analysis.
While the commercial real estate sector continues to experience residual stress as a result of elevated vacancy levels, lower rents and depressed property values in recent years, First Financial believes the sector is improving and that its current underwriting criteria coupled with active credit monitoring of loan relationships provides adequate oversight of the commercial real estate loan portfolio. The type, age, condition and location of commercial real estate properties, as well as any environmental risks associated with the properties, are considered in the underwriting process for both owner-occupied and investment properties. Credit risk is mitigated by limiting total credit exposure to individual borrowers or groups of borrowers and by requiring borrowers to have adequate down payments or cash equity, thereby limiting the loan balance in relation to the market value of the property. First Financial also regularly reviews borrowers' financial performance, makes periodic site visits to financed properties and monitors factors in the Company's markets that influence real estate collateral values such as rental rates, occupancy trends and capitalization rates.
Lease Financing – Lease financing consists of lease transactions for the purchase of both new and used business equipment for commercial clients. Lease products may include tax leases, finance leases, lease lines of credit and interim funding. The credit underwriting for lease transactions includes detailed analysis of the lessee's industry and business model, nature of the equipment, equipment resale values, historical and projected cash flow analysis, secondary sources of repayment and guarantor analysis as well as other considerations.
Residential Real Estate – Residential real estate loans represent loans to consumers for the financing of a residence.
These loans generally have a 15 to 30 year term and a fixed interest rate, but may have a shorter term to maturity with an adjustable interest rate, and in most cases, are extended to borrowers to finance their primary residence. First Financial sells the majority of residential real estate loan originations into the secondary market on a servicing released basis. Residential real estate loans are generally underwritten to secondary market lending standards, utilizing underwriting systems that rely on empirical data to assess credit risk as well as analysis of the borrowers’ ability to repay their obligations, credit history, the amount of any down payment and the market value or other characteristics of the property. First Financial also offers a residential mortgage product that features similar borrower credit characteristics but a more streamlined underwriting process than typically required to sell to the government-sponsored enterprises and thus is retained on the Consolidated Balance Sheets.
While First Financial continues to sell the majority of residential real estate originations into the secondary market, the Company believes its current underwriting criteria coupled with the monitoring of a number of portfolio metrics, including credit scores and loan-to-value ratios, provides adequate oversight in light of depressed residential property values in recent years.
Home Equity – Home equity lending includes both home equity loans and revolving lines of credit secured by a first or second lien on the borrower’s residence. First Financial's origination practices for home equity lending keep both the credit decision and the documentation under the control of First Financial associates. Home equity lending underwriting includes consideration of the borrowers' credit history as well as to debt-to-income and loan-to-value policy limits.
From an industry perspective, it is likely home equity lending will continue to experience stress as borrowers remain under pressure and property values, while improving, remain depressed in many areas. However, First Financial believes its current underwriting criteria coupled with the monitoring of a number of portfolio metrics including credit scores, loan-to-value ratios, line size and usage provides adequate oversight. At December 31, 2013, approximately 95.0% and 83.7% of the Company's outstanding home equity lines had credit line sizes of less than $100,000 and $50,000 respectively, and had an average outstanding balance of approximately $30,000.
First Financial Bancorp 2013 Annual Report 19
Management’s Discussion And Analysis Of Financial Condition And Results Of Operations
Installment – Installment lending consists of consumer loans not secured by real estate, including loans secured by automobiles and personal unsecured loans.
Credit Card – Credit card lending consists of secured and unsecured revolving lines of credit to consumer and business customers. Credit card lines are generally available for an indefinite period of time as long as the borrower's credit characteristics do not materially or adversely change, but may be canceled by the Company under certain circumstances.
Underwriting for installment and credit card lending focuses on the borrowers’ ability to repay their obligations, including debt-to-income analysis, prior credit history and other information.
Credit Management. Subject to First Financial’s credit policy and guidelines, credit underwriting and approval occur within the region originating the loan and/or the centralized line of business. First Financial has delegated to each market president and line of business manager a lending limit sufficient to handle the majority of client requests in a timely manner. Loan requests for amounts greater than those limits require the approval of a senior credit committee and can include additional approval(s) from the chief credit officer, the chief executive officer and the board of directors as necessary. This allows First Financial to manage the initial credit risk exposure through a standardized, disciplined and strategically focused loan approval process, but with an increasingly higher level of authority. Plans to purchase or sell a participation in a loan or a group of loans require the approval of certain senior lending and administrative officers, and in some cases could include the board of directors.
Credit management practices are dependent on the type and nature of the loan. First Financial monitors all significant
exposures on an on-going basis. Commercial loans are assigned internal risk ratings reflecting the risk of loss inherent in the loan. These internal risk ratings are assigned upon initial approval of credit to borrowers and updated periodically thereafter. First Financial reviews and adjusts its risk rating criteria based on actual experience, which provides the Company with an assessment of the current risk level in the portfolio and is the basis for determining an appropriate allowance for loan and lease losses. First Financial's commercial risk ratings of pass, special mention, substandard and doubtful are derived from standard regulatory rating definitions and facilitate the monitoring of credit quality across the commercial loan portfolio. For further information regarding these risk ratings, see Note 9 in the Notes to the Consolidated Financial Statements.
Commercial loans rated as special mention, substandard or doubtful are considered criticized. Commercial loans rated as substandard or doubtful are considered classified. Commercial loans may be designated as criticized based on individual borrower performance or industry and environmental factors. Criticized loans are subject to additional reviews to adequately assess the borrower’s credit status and develop appropriate action plans.
Classified loans are managed by the Special Assets Division (Special Assets) of the Company. Special Assets is a credit group whose primary focus is to handle the day-to-day management of workouts, commercial recoveries and problem loan resolutions. Special Assets ensures that First Financial has appropriate oversight, improved communication and timely resolution of issues throughout the loan portfolio, including those loans covered by FDIC loss sharing agreements. Additionally, the Credit Risk Management group within First Financial's Risk Management function provides objective oversight and assessment of commercial credit quality and processes using an independent credit risk review approach.
Consumer lending credit approvals are based on, among other factors, the financial strength and payment history of the borrower, type of exposure and the transaction structure. Consumer loans are generally smaller dollar amounts than other types of lending and are made to a large number of customers which provides diversification within the portfolio. Credit risk in the consumer loan portfolio is managed by loan type. Consumer loan types are continuously monitored for changes in delinquency trends and other asset quality indicators. The Credit Risk Management group performs product-level reviews of portfolio performance and assesses credit quality and compliance with underwriting and loan administration guidelines across the consumer loan portfolio.
20 First Financial Bancorp 2013 Annual Report
LOANS, EXCLUDING COVERED LOANS
2013 vs. 2012. First Financial experienced strong loan demand in 2013 as a result of focused sales efforts across the portfolio, as well as success from the investments made in the lease financing and mortgage origination platforms in recent years. While the earnings impact of this loan demand remains muted due to the low interest rate environment, sales efforts across the loan product suite and investments in new and existing markets continue to position the Company for sustained success in generating future earning asset growth. Uncovered loans increased $326.6 million, or 10.3%, from $3.2 billion at December 31, 2012 to $3.5 billion at December 31, 2013, primarily due to growth in the commercial, commercial real estate, lease financing and residential real estate portfolios. Average loan balances increased $320.8 million, or 10.7%, from $3.0 billion at December 31, 2012 to $3.3 billion at December 31, 2013.
Period-end commercial, commercial real estate, real estate construction and lease financing balances increased $291.2 million or 12.1% from December 31, 2012 to December 31, 2013. The increase in the commercial portfolio consisted of a $174.6 million or 20.3% increase in commercial loans, an $80.0 million or 5.6% increase in commercial real estate loans and a $29.3 million, or 57.8% increase in lease financing balances as well as a modest increase in real estate construction loans. First Financial's consumer loan categories increased $35.4 million or 4.6% during 2013, primarily due to a $34.7 million or 10.9% increase in residential real estate loans during the year. This increase is primarily related to the full year impact of a new residential mortgage product introduced in 2012 as described above.
At December 31, 2013, commercial loans represent 29.5% of uncovered loans while commercial real estate, real estate construction and lease financing balances represent 42.7%, 2.3% and 2.3%, respectively. Residential real estate loans represent 10.1% of uncovered loan balances while home equity, installment and credit card loans represent 10.7%, 1.3% and 1.0%, respectively.
Comparatively, at December 31, 2012, commercial loans represented 27.1% of uncovered loans while commercial real estate, real estate construction and lease financing balances represented 44.6%, 2.3% and 1.6%, respectively. Residential real estate loans represented 10.0% of uncovered loan balances while home equity, installment and credit card loans represented 11.6%, 1.8% and 1.1%, respectively.
|
| | | | | | | | | | | | | | | | | | | |
| Table 4 • Loan Portfolio | | | | | | | | | |
| | December 31, |
| (Dollars in thousands) | 2013 | | 2012 | | 2011 | | 2010 | | 2009 |
| Commercial | $ | 1,035,668 |
| | $ | 861,033 |
| | $ | 856,981 |
| | $ | 800,253 |
| | $ | 800,261 |
|
| Real estate – construction | 80,741 |
| | 73,517 |
| | 114,974 |
| | 163,543 |
| | 253,223 |
|
| Real estate – commercial | 1,496,987 |
| | 1,417,008 |
| | 1,233,067 |
| | 1,139,931 |
| | 1,079,628 |
|
| Real estate – residential | 352,931 |
| | 318,210 |
| | 287,980 |
| | 269,173 |
| | 321,047 |
|
| Installment | 47,133 |
| | 56,810 |
| | 67,543 |
| | 69,711 |
| | 82,989 |
|
| Home equity | 376,454 |
| | 367,500 |
| | 358,960 |
| | 341,310 |
| | 328,940 |
|
| Credit card | 35,592 |
| | 34,198 |
| | 31,631 |
| | 29,563 |
| | 29,027 |
|
| Lease financing | 80,135 |
| | 50,788 |
| | 17,311 |
| | 2,609 |
| | 14 |
|
| Total loans, excluding covered loans | 3,505,641 |
| | 3,179,064 |
| | 2,968,447 |
| | 2,816,093 |
| | 2,895,129 |
|
| Covered loans | 457,873 |
| | 748,116 |
| | 1,053,244 |
| | 1,481,493 |
| | 1,934,740 |
|
| Total | $ | 3,963,514 |
| | $ | 3,927,180 |
| | $ | 4,021,691 |
| | $ | 4,297,586 |
| | $ | 4,829,869 |
|
Table 5 – Loan Maturity/Rate Sensitivity indicates the contractual maturity of commercial loans and real estate construction loans outstanding at December 31, 2013. Loans due after one year are classified according to their sensitivity to changes in interest rates.
For discussion of risks associated with the loan portfolio and First Financial's allowance for loan and lease losses, see the Credit Risk section included in Management’s Discussion and Analysis.
First Financial Bancorp 2013 Annual Report 21
Management’s Discussion And Analysis Of Financial Condition And Results Of Operations
|
| | | | | | | | | | | | | | | | |
| Table 5 • Loan Maturity/Rate Sensitivity (Excluding Covered Loans) |
| | | December 31, 2013 |
| | | Maturity |
| | | | | After one | | | | |
| | | Within | | but within | | After | | |
| (Dollars in thousands) | | one year | | five years | | five years | | Total |
| Commercial | | $ | 402,448 |
| | $ | 461,886 |
| | $ | 171,334 |
| | $ | 1,035,668 |
|
| Real estate – construction | | 40,269 |
| | 35,543 |
| | 4,929 |
| | 80,741 |
|
| Total | | $ | 442,717 |
| | $ | 497,429 |
| | $ | 176,263 |
| | $ | 1,116,409 |
|
| | | | | | | | | |
| | | | | Sensitivity to changes in interest rates |
| | | | | Predetermined |
| | Variable | | |
| (Dollars in thousands) | | | | rate | | rate | | Total |
| Due after one year but within five years | | | | $ | 323,929 |
| | $ | 173,500 |
| | $ | 497,429 |
|
| Due after five years | | | | 89,410 |
| | 86,853 |
| | 176,263 |
|
| Total | |
|
| | $ | 413,339 |
| | $ | 260,353 |
| | $ | 673,692 |
|
COVERED LOANS
Acquired loans subject to loss sharing agreements whereby the FDIC reimburses First Financial for the majority of any losses incurred are referred to as covered loans. These agreements provide for partial loss protection on single-family, residential loans for a period of ten years and First Financial is required to share any recoveries of previously charged-off amounts for the same time period, on the same pro-rata basis with the FDIC. All other loans are provided loss protection for a period of five years and recoveries of previously charged-off amounts must be shared with the FDIC for an additional three year period, again on the same pro-rata basis. The five year period of loss protection will expire for the majority of First Financial's covered commercial loans and covered OREO during the third quarter of 2014. The ten year period of loss protection on all other covered loans and covered OREO will expire during the third quarter of 2019.
First Financial evaluated the loans acquired in conjunction with the Peoples and Irwin acquisitions for impairment in accordance with the provisions of FASB ASC Topic 310-30, Loans and Debt Securities Acquired with Deteriorated Credit Quality (FASB ASC Topic 310-30). Acquired loans are considered impaired if there is evidence of credit deterioration since origination and if it is probable that not all contractually required payments will be collected. First Financial accounts for the majority of covered loans under FASB ASC Topic 310-30 with the exception of loans with revolving privileges, which are outside the scope of FASB ASC Topic 310-30, and other consumer loans for which expected cash flows could not be reasonably estimated.
The expiration of loss sharing protection will result in a reclassification of loan balances in the Consolidated Balance Sheets from covered loans to uncovered loans, but will not have an effect on the accounting for these loans.
For further information regarding the accounting for covered loans, see the Critical Accounting Policies section included in Management’s Discussion and Analysis as well as the Notes to the Consolidated Financial Statements. For discussion of risks associated with the covered loan portfolio and First Financial's allowance for losses on covered loans, see the Credit Risk section included in Management’s Discussion and Analysis.
2013 vs. 2012. Total covered loans decreased $290.2 million, or 38.8%, from $748.1 million at December 31, 2012 to $457.9 million at December 31, 2013. The decline in the covered loan portfolio is to be expected as there were no new acquisitions of loans subject to loss sharing agreements during 2013. The covered loan portfolio will continue to decline through payoffs, charge-offs and termination or expiration of loss sharing coverage, unless First Financial acquires additional loans subject to loss sharing agreements in the future.
22 First Financial Bancorp 2013 Annual Report
|
| | | | | | | | | | | | | | | | | | | |
| Table 6 • Covered Loan Portfolio | | | | | | | | | |
| | December 31, |
| (Dollars in thousands) | 2013 | | 2012 | | 2011 | | 2010 | | 2009 |
| Commercial | $ | 42,316 |
| | $ | 102,126 |
| | $ | 195,892 |
| | $ | 334,039 |
| | $ | 506,887 |
|
| Real estate – construction | 8,556 |
| | 10,631 |
| | 17,120 |
| | 42,743 |
| | 97,560 |
|
| Real estate – commercial | 268,633 |
| | 465,555 |
| | 637,044 |
| | 855,725 |
| | 1,008,104 |
|
| Real estate – residential | 80,733 |
| | 100,694 |
| | 121,117 |
| | 147,052 |
| | 206,371 |
|
| Installment | 5,641 |
| | 8,674 |
| | 13,176 |
| | 21,071 |
| | 8,235 |
|
| Home equity | 49,624 |
| | 57,458 |
| | 64,978 |
| | 73,695 |
| | 87,933 |
|
| Other covered loans | 2,370 |
| | 2,978 |
| | 3,917 |
| | 7,168 |
| | 19,650 |
|
| Total covered loans | $ | 457,873 |
| | $ | 748,116 |
| | $ | 1,053,244 |
| | $ | 1,481,493 |
| | $ | 1,934,740 |
|
|
| | | | | | | | | | | | | | | | |
| Table 7 • Covered Loan Maturity | | | | | | | | |
| | | December 31, 2013 |
| | | Maturity |
| | | | | After one | | | | |
| | | Within | | but within | | After | | |
| (Dollars in thousands) | | one year | | five years | | five years | | Total |
| Commercial | | $ | 16,814 |
| | $ | 24,007 |
| | $ | 1,495 |
| | $ | 42,316 |
|
| Real estate – construction | | 7,164 |
| | 664 |
| | 728 |
| | 8,556 |
|
| Total | | $ | 23,978 |
| | $ | 24,671 |
| | $ | 2,223 |
| | $ | 50,872 |
|
|
| | | | | | | | | | | | |
| | | Sensitivity to changes in interest rates |
| | | Predetermined | | Variable | | |
| (Dollars in thousands) | | rate | | rate | | Total |
| Due after one year but within five years | | $ | 20,667 |
| | $ | 4,004 |
| | $ | 24,671 |
|
| Due after five years | | 333 |
| | 1,890 |
| | 2,223 |
|
| Total | | $ | 21,000 |
| | $ | 5,894 |
| | $ | 26,894 |
|
ASSET QUALITY
Excluding covered assets: Due to the significant difference in the accounting for covered loans and the loss sharing agreements with the FDIC, management believes that asset quality measures excluding covered assets are generally more meaningful. Therefore, management has included asset quality measures that exclude covered assets in tables 8 and 15.
Nonperforming assets consist of nonaccrual loans, accruing troubled debt restructurings (TDRs) and OREO. Loans are classified as nonaccrual when, in the opinion of management, collection of principal or interest is doubtful or when principal or interest payments are 90 days or more past due. Generally, loans are placed on nonaccrual status due to the continued failure to adhere to contractual payment terms by the borrower coupled with other pertinent factors, such as insufficient collateral value. The accrual of interest income is discontinued and previously accrued but unpaid interest is reversed when a loan is classified as nonaccrual. Classified assets include nonperforming assets plus performing loans internally rated substandard or worse.
Loans are classified as TDRs when the borrowers are experiencing financial difficulties and management grants concessions to the borrowers that it would not otherwise consider in order to protect its investment. TDRs are generally classified as nonaccrual for a minimum period of six months and may qualify for return to accrual status once they have demonstrated performance with the restructured terms of the loan agreement. OREO represents properties acquired by First Financial primarily through loan defaults by borrowers.
See Table 8 – Nonperforming Assets (Excluding Covered Assets) for a summary of First Financial’s nonaccrual loans, TDRs and OREO.
First Financial Bancorp 2013 Annual Report 23
Management’s Discussion And Analysis Of Financial Condition And Results Of Operations
2013 vs. 2012. Total nonperforming assets decreased $15.9 million to $72.5 million at December 31, 2013 from $88.4 million at December 31, 2012, primarily due to a $27.4 million decline in nonaccrual loan balances offset by a $4.2 million increase in accruing TDRs and a $7.3 million increase in OREO.
The decline in nonaccrual loan balances during 2013 relates to resolution strategies, including collections, write-downs, transfers to OREO, charge-offs and reclassifications back to accrual status when appropriate. The increase in accruing TDRs during 2013 was driven primarily by renewals and term extensions of loans in various stages of resolution. The increase in OREO during 2013 was the result of $13.0 million of additions during the year, including $7.3 million related to a single commercial property, partially offset by the resolution and sale of $4.3 million of commercial and residential real estate property and $1.4 million of valuation write-downs.
The level of First Financial's nonperforming loans as a percentage of total loans declined to 1.50% at December 31, 2013 from 2.39% at December 31, 2012 as a result of both the decline in nonperforming loans as well as growth in the loan portfolio during 2013. Additionally, the Company continued to experience declines in classified asset balances throughout 2013, decreasing $18.5 million, or 14.4%, to $110.5 million at December 31, 2013 from $129.0 million at December 31, 2012.
The declines in nonperforming loans, nonperforming assets and classified assets during 2013 reflect the Company's successful resolution efforts as well as modest but steady improvement in economic conditions in the markets in which First Financial operates. While the recovery in the U.S. economy has been slow and, at times, uneven across different industries and markets, management remains optimistic that gradual improvements in the employment outlook and real estate markets, as well as higher levels of business and consumer confidence, will contribute to continued improvement in credit quality trends in future periods.
|
| | | | | | | | | | | | | | | | | | | |
| Table 8 • Nonperforming Assets (Excluding Covered Assets) |
| | December 31, |
| (Dollars in thousands) | 2013 | 2012 | 2011 | | 2010 | 2009 |
Nonaccrual loans (1) | $ | 37,605 |
| | $ | 65,041 |
| | 72,370 |
| | $ | 76,407 |
| | $ | 77,103 |
|
| Accruing troubled debt restructurings | 15,094 |
| | 10,856 |
| | 4,009 |
| | 3,508 |
| | 679 |
|
| Other real estate owned (OREO) | 19,806 |
| | 12,526 |
| | 11,317 |
| | 17,907 |
| | 4,145 |
|
| Total nonperforming assets | $ | 72,505 |
| | $ | 88,423 |
| | $ | 87,696 |
| | $ | 97,822 |
| | $ | 81,927 |
|
| | | | | | | | | | |
| Nonperforming assets as a percent of total loans plus OREO | 2.06 | % | | 2.77 | % | | 2.94 | % | | 3.45 | % | | 2.83 | % |
| | | | | | | | | | |
| Accruing loans past due 90 days or more | $ | 218 |
| | $ | 212 |
| | $ | 191 |
| | $ | 370 |
| | $ | 417 |
|
| | | | | | | | | | |
| Classified assets | $ | 110,509 |
| | $ | 129,040 |
| | $ | 162,372 |
| | $ | 202,140 |
| | $ | 163,451 |
|
(1) Nonaccrual loans include nonaccrual TDRs of $13.0 million, $14.1 million, $18.1 million, $14.1 million and $5.4 million as of December 31, 2013, 2012, 2011, 2010 and 2009, respectively.
Covered assets: Covered loans accounted for under FASB ASC Topic 310-30 were grouped into pools for purposes of periodically re-estimating the expected cash flows and recognizing impairment or improvement in the loan pools. Accordingly, loans accounted for under FASB ASC Topic 310-30 are classified as performing, even though they may be contractually past due, as any nonpayment of contractual principal or interest is considered in the periodic re-estimation of expected cash flows and is included in the resulting recognition of current period covered loan loss provision or future period yield adjustments.
2013 vs. 2012. First Financial had $3.8 million of covered nonaccrual loans, excluding loans accounted for under FASB ASC Topic 310-30, and $27.1 million of covered OREO at December 31, 2013. First Financial had $11.7 million of covered nonaccrual loans, excluding loans accounted for under FASB ASC Topic 310-30, and $28.9 million of covered OREO at December 31, 2012. Classified covered loan balances declined $134.7 million, or 58.2% to $97.0 million at December 31, 2013 from $231.7 million at December 31, 2012. The decline in classified covered loan balances during 2013 reflects the Company's continued progress in bringing troubled covered loans to resolution.
24 First Financial Bancorp 2013 Annual Report
|
| | | | | | | | | | | | | | | | | | | |
| Table 9 • Nonperforming Assets (Covered Assets) | | | | |
| | | | | | | | | |
| | December 31, |
| (Dollars in thousands) | 2013 | | 2012 | | 2011 | | 2010 | | 2009 |
| Nonaccrual loans | $ | 3,787 |
| | $ | 11,722 |
| | $ | 11,160 |
| | $ | 19,755 |
| | $ | 16,415 |
|
| Accruing trouble debt restructuring | 335 |
| | 0 |
| | 0 |
| | 0 |
| | 0 |
|
| Other real estate owned (OREO) | 27,120 |
| | 28,862 |
| | 44,818 |
| | 35,257 |
| | 12,916 |
|
| Total nonperforming assets | $ | 31,242 |
| | $ | 40,584 |
| | $ | 55,978 |
| | $ | 55,012 |
| | $ | 29,331 |
|
| | | | | | | | | | |
| Accruing loans past due 90 days or more | $ | 0 |
| | $ | 31 |
| | $ | 107 |
| | $ | 9 |
| | $ | 1 |
|
(1) Nonaccrual loans include nonaccrual TDRs of $0.9 million as of December 31, 2013 and none as of December 31, 2012, 2011, and 2010.
INVESTMENTS
First Financial utilizes its investment portfolio as a source of liquidity and interest income, as well as a tool for managing the Company's interest rate risk profile. As such, the Company's primary investment strategy is to invest in debt securities with low credit risk, such as treasury, government agency and agency residential mortgage-backed securities (MBSs). First Financial invests primarily in MBSs issued by U.S. government agencies and corporations, such as the Government National Mortgage Association (GNMA), the Federal Home Loan Mortgage Corporation (FHLMC) and the Federal National Mortgage Association (FNMA). Such securities, because of government agency guarantees, are considered to have a low credit risk and high liquidity profile. The investment portfolio is also managed with consideration to prepayment and extension / maturity risk.
The other investments category in the Consolidated Balance Sheets consists primarily of First Financial’s investments in Federal Reserve Bank and Federal Home Loan Bank (FHLB) stock.
Gains and losses on debt securities are generally due to fluctuations in current market yields relative to the yields of the debt securities at their amortized cost. All securities with unrealized losses are reviewed quarterly to determine if any impairment is considered other than temporary, requiring a write-down to fair market value. First Financial considers the percentage loss on a security, duration of the loss, average life or duration of the security, credit rating of the security as well as payment performance and the Company’s intent and ability to hold the security when determining whether any impairment is other than temporary. First Financial had no other than temporary impairment expense for the years ended December 31, 2013 and 2012.
2013 vs. 2012. First Financial’s investment portfolio at December 31, 2013 totaled $1.8 billion, a $76.0 million, or 4.1%, decrease from $1.9 billion at December 31, 2012. The decline in the investment portfolio during 2013 was primarily related to normal amortization on securities during the year.
At December 31, 2013 and 2012, First Financial classified $913.6 million or 52.2% of investment securities and $1.0 billion or 57.2% of investment securities, respectively, as available-for-sale. At December 31, 2013 and 2012, First Financial classified $837.3 million or 47.8% of investment securities and $770.8 million or 42.8% of investment securities, respectively, as held-to-maturity.
First Financial's investment portfolio included a net unrealized pre-tax loss of $43.7 million at December 31, 2013, representing the difference between the estimated fair value and the amortized cost of securities in the portfolio. This compares with a net unrealized pre-tax gain of $22.7 million at December 31, 2012. The carrying value of First Financial’s held-to-maturity investment securities portfolio exceeded the fair value by $12.3 million at December 31, 2013, while the fair value exceeded the carrying value by $7.7 million at December 31, 2012. The decline in value of the Company's investment portfolio at December 31, 2013 is primarily due to the impact from rising interest rates and the effect on securities prices during 2013.
The investment portfolio represented 28.0% and 28.8% of total assets at December 31, 2013 and December 31, 2012, respectively. Investments in MBSs, including Collateralized Mortgage Obligations (CMOs), represented 81.7% and 89.2% of the investment portfolio at December 31, 2013 and 2012, respectively. MBSs are participations in pools of residential real estate loans, the principal and interest payments of which are passed through to the security investors. MBSs are subject to prepayment risk, particularly during periods of falling interest rates, and duration is prone to extend during periods of rising interest rates. Prepayments of the underlying residential real estate loans may shorten the lives of the securities, thereby
First Financial Bancorp 2013 Annual Report 25
Management’s Discussion And Analysis Of Financial Condition And Results Of Operations
affecting yields to maturity and market values. First Financial does not own any interest-only securities, principal-only securities or other securities considered high risk.
Security debentures issued by the U.S. government and U.S. government agencies and corporations, including the FHLB, FHLMC, FNMA and the U.S. Export / Import Bank represented 1.6% and 2.0% of the investment portfolio at December 31, 2013 and 2012, respectively.
Asset-backed securities were $113.6 million or 6.5% of the investment portfolio at December 31, 2013 and $57.1 million, or 3.2% of the investment portfolio at December 31, 2012. First Financial considers these investment securities to have lower credit risk and a high liquidity profile as a result of explicit guarantees on the collateral.
Tax-exempt securities of states, municipalities and other political subdivisions increased to $56.1 million as of December 31, 2013 from $45.4 million as of December 31, 2012 and comprised 3.2% and 2.5% of the investment portfolio at December 31, 2013 and 2012, respectively. The securities are diversified to include states and issuing authorities within states, thereby decreasing geographic portfolio risk. First Financial continues to monitor the risk associated with this sector and reviews the underlying ratings for possible downgrades. First Financial does not own any currently impaired state or other political subdivision securities.
Other securities, consisting primarily of taxable securities of states, municipalities and other political subdivisions and debt securities issued by corporations, increased to $122.5 million or 7.0% of the investment portfolio at December 31, 2013 from $55.9 million or 3.1% at December 31, 2012.
|
| | | | | | | | | | | | | |
| Table 10 • Investment Securities as of December 31 | | | | | | | |
| | 2013 | | 2012 |
| | | | Percent of | | | | Percent of |
| (Dollars in thousands) | Amount | | Portfolio | | Amount | | Portfolio |
| U.S. Treasuries | $ | 90 |
| | 0.0 | % | | $ | 0 |
| | 0.0 | % |
| Securities of U.S. Government agencies and corporations | 28,557 |
| | 1.6 | % | | 36,407 |
| | 2.0 | % |
| Mortgage-backed securities | 1,430,071 |
| | 81.7 | % | | 1,608,120 |
| | 89.2 | % |
| Obligations of state and other political subdivisions | 56,111 |
| | 3.2 | % | | 45,350 |
| | 2.5 | % |
| Asset-backed securities | 113,594 |
| | 6.5 | % | | 57,089 |
| | 3.2 | % |
| Other securities | 122,450 |
| | 7.0 | % | | 55,885 |
| | 3.1 | % |
| Total | $ | 1,750,873 |
| | 100.0 | % | | $ | 1,802,851 |
| | 100.0 | % |
The estimated maturities and weighted-average yields of the held-to-maturity and available-for-sale investment securities are shown in Table 11 – Investment Securities as of December 31, 2013. Tax-equivalent adjustments, using a 35.0% rate, were included in calculating yields on tax-exempt obligations of state and other political subdivisions.
First Financial held cash on deposit with the Federal Reserve of $25.8 million and $24.3 million at December 31, 2013 and 2012, respectively. First Financial continually monitors its liquidity position as part of its enterprise risk management framework, specifically through its asset/liability management process.
First Financial will continue to monitor loan and deposit demand, as well as balance sheet and capital sensitivity, as it manages investment strategies in future periods. See Note 8 in the Notes to Consolidated Financial Statements for additional information on First Financial's investment portfolio and Note 21 for additional information on how First Financial determines the fair value of investment securities.
26 First Financial Bancorp 2013 Annual Report
|
| | | | | | | | | | | | | | | | | | | | | | | | | | | |
| Table 11 • Investment Securities As Of December 31, 2013 |
| | Maturity |
| | Within one year | | After one but within five years | | After five but within ten years | | After ten years |
| (Dollars in thousands) | Amount | | Yield(1) | | Amount | | Yield(1) | | Amount | | Yield(1) | | Amount | | Yield(1) |
| Held-to-Maturity | | | | | | | | | | | | | | | |
| Securities of other U.S. government agencies and corporations | $ | 0 |
| | 0.00 | % | | $ | 0 |
| | 0.00 | % | | $ | 18,981 |
| | 2.78 | % | | $ | 0 |
| | 0.00 | % |
| Mortgage-backed securities | 0 |
| | 0.00 | % | | 375,076 |
| | 2.43 | % | | 282,544 |
| | 2.76 | % | | 117,405 |
| | 2.87 | % |
| Obligations of state and other political subdivisions | 216 |
| | 4.48 | % | | 3,856 |
| | 3.22 | % | | 20,930 |
| | 3.26 | % | | 786 |
| | 4.99 | % |
| Other securities | 0 |
| | 0.00 | % | | 0 |
| | 0.00 | % | | 0 |
| | 0.00 | % | | 17,478 |
| | 4.28 | % |
| Total | $ | 216 |
| | 4.48 | % | | $ | 378,932 |
| | 2.43 | % | | $ | 322,455 |
| | 2.79 | % | | $ | 135,669 |
| | 3.07 | % |
| | | | | | | | | | | | | | | | |
| Available-for-Sale | | | | | | | | | | | | | | | |
| U.S. Treasuries | $ | 0 |
| | 0.00 | % | | $ | 0 |
| | 0.00 | % | | $ | 90 |
| | 2.00 | % | | $ | 0 |
| | 0.00 | % |
| Securities of other U.S. government agencies and corporations | 4 |
| | 6.35 | % | | 0 |
| | 0.00 | % | | 9,572 |
| | 2.69 | % | | 0 |
| | 0.00 | % |
| Mortgage-backed securities | 4,641 |
| | 3.35 | % | | 248,250 |
| | 2.50 | % | | 201,098 |
| | 1.58 | % | | 201,057 |
| | 1.95 | % |
| Obligations of state and other political subdivisions | 2,382 |
| | 4.93 | % | | 5,162 |
| | 2.25 | % | | 5,610 |
| | 2.81 | % | | 17,169 |
| | 2.51 | % |
| Asset-backed securities | 0 |
| | 0.00 | % | | 7,021 |
| | 1.34 | % | | 70,360 |
| | 1.13 | % | | 36,213 |
| | 1.75 | % |
| Other securities | 0 |
| | 0.00 | % | | 16,317 |
| | 3.52 | % | | 16,747 |
| | 1.90 | % | | 71,908 |
| | 2.86 | % |
| Total | $ | 7,027 |
| | 3.90 | % | | $ | 276,750 |
| | 2.53 | % | | $ | 303,477 |
| | 1.56 | % | | $ | 326,347 |
| | 2.16 | % |
(1) Tax equivalent basis was calculated using a 35.00% tax rate and yields were based on amortized cost.
DERIVATIVES
First Financial uses certain derivative instruments, including interest rate caps, floors and swaps, to meet the needs of its clients while managing the interest rate risk associated with certain transactions. First Financial does not use derivatives for speculative purposes.
While authorized to use a variety of derivative products, First Financial primarily utilizes interest rate swaps as a means to offer borrowers credit-based products that meet their needs and achieve the Company's desired interest rate risk profile. These interest rate swaps generally involve the receipt by First Financial of floating rate amounts from the swap counterparties in exchange for payments to these counterparties by First Financial of fixed rate amounts received from borrowers. This results in First Financial's loan customers receiving fixed rate funding while providing First Financial with a floating rate asset.
Additionally, as the Company's deposit base continues to shift away from fixed-rate time deposits toward market-priced or indexed deposit products, First Financial has executed interest rate swaps to manage interest rate volatility on indexed floating rate deposits. These interest rate swaps, totaling $100.0 million as of December 31, 2013 and $35.0 million as of December 31, 2012, involve the receipt by First Financial of variable-rate interest payments in exchange for fixed-rate interest payments by First Financial for approximately 6 years. As a result, First Financial has secured fixed rate funding associated with these swaps at a weighted average cost of funds of 1.45% for the duration of these interest rate swaps. Additionally, in a rising interest rate environment, the market value of these interest rate swaps increases, resulting in an increase in Other Comprehensive Income.
See Note 7 of the Notes to Consolidated Financial Statements for additional information regarding First Financial's use of derivative instruments.
DEPOSITS
First Financial solicits deposits by offering a wide variety of savings and transaction accounts, including checking, savings, money-market and time deposits of various maturities and rates.
First Financial Bancorp 2013 Annual Report 27
Management’s Discussion And Analysis Of Financial Condition And Results Of Operations
2013 vs. 2012. First Financial experienced a $118.3 million, or 2.4% decline in total deposits from $5.0 billion at December 31, 2012 to $4.8 billion as of December 31, 2013. Noninterest bearing deposits increased $44.7 million, while interest-bearing checking deposits decreased $35.1 million, savings deposits decreased $11.6 million and time deposits declined $116.3 million during the period. The decline in total deposits during 2013 was a result of the Company's continued focus on improving core relationship profitability and reducing non-core relationship deposits as well as the Company's banking center consolidations during 2012 and 2013. The increase in noninterest bearing deposit balances in 2013 reflects a continued positive shift in the mix of First Financial's deposit base as outflows of time deposits and brokered deposits were replaced with less expensive transaction-based core deposits to support the earning asset base.
Total average deposits for 2013 declined $387.7 million, or 7.5%, from 2012 as the strategic initiatives outlined above were executed. Average time deposits decreased $355.9 million, or 26.5%, while average transaction and savings deposits decreased $31.8 million, or 0.8%.
First Financial implemented certain core deposit growth initiatives during 2013, including the introduction of a prime rate indexed money market account and promotional deposit products rewarding expanded customer relationships. These efforts resulted in non-time deposits increasing to 80.3% of total deposits at December 31, 2013 from 78.4% at December 31, 2012. The Company also continues to actively manage its funding base, extending the duration of the deposit portfolio to a weighted average life of 1.9 years as of December 31, 2013, compared to 1.3 years as of December 31, 2012.
Table 12 – Maturities of Time Deposits Greater Than or Equal to $100,000 shows the contractual maturity of these deposits that were outstanding at December 31, 2013, representing 6.8% of total deposits.
|
| | | | | | | | | | | | | | | |
| Table 12 • Maturities Of Time Deposits Greater Than Or Equal To $100,000 |
| | December 31, 2013 |
| (Dollars in thousands) | Certificates of Deposit | | IRAs | | Brokered CDs | | Total |
| Maturing in | | | | | | | |
| 3 months or less | $ | 42,205 |
| | $ | 2,602 |
| | $ | 0 |
| | $ | 44,807 |
|
| 3 months to 6 months | 41,537 |
| | 2,547 |
| | 2,200 |
| | 46,284 |
|
| 6 months to 12 months | 51,251 |
| | 5,337 |
| | 3,769 |
| | 60,357 |
|
| over 12 months | 134,549 |
| | 40,956 |
| | 4,222 |
| | 179,727 |
|
| Total | $ | 269,542 |
| | $ | 51,442 |
| | $ | 10,191 |
| | $ | 331,175 |
|
BORROWINGS
First Financial's short-term borrowings include repurchase agreements utilized for corporate sweep accounts with cash management account agreements in place as well as overnight advances from the FHLB. The Company's long-term borrowings consist of FHLB long-term advances and repurchase agreements utilizing investment securities pledged as collateral.
2013 vs. 2012. Short-term borrowings increased to $748.7 million at December 31, 2013, from $624.6 million at December 31, 2012. Short-term borrowings with the FHLB, which are utilized to manage normal liquidity needs, increased primarily as a result of the deposit strategies outlined above and efforts to manage the Company's funding costs. First Financial continued to replace higher-cost time deposits and brokered deposits with lower-cost transaction deposits and short-term borrowings during 2013.
First Financial utilizes short-term borrowings and longer-term advances from the FHLB as wholesale funding sources. First Financial had $654.0 million of short-term borrowings from the FHLB at December 31, 2013 as compared with $502.0 million at December 31, 2012.
Long-term debt decreased $14.4 million, or 19.2%, to $60.8 million at December 31, 2013, from $75.2 million at December 31, 2012 primarily due to the maturity of a single agreement during the year. Total long-term borrowings from the FHLB were $7.5 million and $9.4 million at December 31, 2013 and 2012, respectively.
FHLB advances, both short-term and long-term, must be collateralized with qualifying assets, typically certain commercial and residential real estate loans, as well as certain government and agency securities. For ease of borrowing execution First
28 First Financial Bancorp 2013 Annual Report
Financial utilizes a blanket collateral agreement with the FHLB and had collateral pledged with a book value of $3.0 billion at December 31, 2013.
See Note 13 of the Notes to Consolidated Financial Statements for additional information on First Financial's borrowings.
LIQUIDITY
Liquidity management is the process by which First Financial manages the continuing flow of funds necessary to meet its financial commitments on a timely basis and at a reasonable cost. These funding commitments include withdrawals by depositors, credit commitments to borrowers, shareholder dividends, share repurchases, operating expenses and capital expenditures. Liquidity is monitored and closely managed by First Financial’s Asset and Liability Committee (ALCO), a group of senior officers from the lending, deposit gathering, finance, risk management and treasury areas. It is ALCO’s responsibility to ensure First Financial has the necessary level of funds available for normal operations as well as maintain a contingency funding policy to ensure that liquidity stress events are quickly identified and management response plans are in place. This is accomplished through the use of policies which establish limits and require measurements to monitor liquidity trends, including modeling and management reporting that identifies the amounts and costs of all available funding sources. These sources are periodically tested for funding availability.
Liquidity is derived primarily from deposit growth, principal and interest payments on loans and investment securities, maturing loans and investment securities, access to wholesale funding sources and collateralized borrowings. First Financial’s most stable source of liability-funded liquidity for both long and short-term needs is deposit growth and retention of the core deposit base. The deposit base is diversified among individuals, partnerships, corporations, public entities and geographic markets. This diversification helps First Financial minimize dependence on large concentrations of wholesale funding sources.
As discussed in the Borrowings section above, First Financial also utilizes its short-term line of credit and longer-term advances from the FHLB as funding sources. First Financial had a remaining borrowing capacity from the FHLB of $420.4 million at December 31, 2013.
First Financial's principal source of asset-funded liquidity is marketable investment securities, particularly those of shorter maturities. The market value of investment securities classified as available-for-sale totaled $913.6 million at December 31, 2013. In addition, other types of assets such as cash and due from banks and federal funds sold, as well as loans maturing within one year, are sources of liquidity.
At December 31, 2013, in addition to liquidity on hand of $143.5 million, First Financial had unused and available overnight wholesale funding sources of approximately $1.9 billion, or approximately 30.2% of total assets, to fund loan and deposit activities as well as general corporate requirements.
Certain restrictions exist regarding the ability of First Financial’s subsidiaries to transfer funds to First Financial in the form of cash dividends, loans, other assets or advances. The approval of the subsidiaries’ respective primary federal regulators is required for First Financial’s subsidiaries to pay dividends in excess of regulatory limitations. Dividends paid to First Financial from its subsidiaries totaled $58.7 million, $73.8 million and $48.7 million for the years 2013, 2012 and 2011, respectively. As of December 31, 2013, First Financial’s subsidiaries had retained earnings of $346.0 million of which $20.8 million was available for distribution to First Financial without prior regulatory approval. Additionally, First Financial had $88.4 million in cash as of December 31, 2013, which is approximately two times the Company’s annual regular shareholder dividend (currently $0.60 per share) and operating expenses.
First Financial repurchased 750,145 shares of the Company's common stock for $11.8 million during 2013 under a previously announced share repurchase plan and 460,500 shares for $6.8 million under this same plan during 2012. First Financial had no common stock repurchase activity under publicly announced plans in 2011.
Capital expenditures, such as banking center expansion, remodeling and technology investments, were $7.3 million for 2013, $25.5 million for 2012 and $23.5 million for 2011. Remodeling is a planned and ongoing process given First Financial’s 110 banking centers. Material commitments for capital expenditures as of December 31, 2013, were $12.9 million. Management believes that sufficient liquidity exists to fund its future capital expenditure commitments.
Management is not aware of any other events or regulatory requirements that, if implemented, are likely to have a material effect on First Financial’s liquidity.
First Financial Bancorp 2013 Annual Report 29
Management’s Discussion And Analysis Of Financial Condition And Results Of Operations
|
| | | | | | | | | | | | | | | | | | | | |
| Table 13 • Contractual Obligations as of December 31, 2013 | |
| (Dollars in thousands) | | Less than one year | | One to three years | | Three to five years | | More than five years | | Total |
| Contractual Obligations | | | | | | | | | | |
| Long-term debt obligations (including interest) | | | | | | | | | |
|
| Federal Home Loan Bank borrowings | | $ | 1,837 |
| | $ | 3,139 |
| | $ | 2,440 |
| | $ | 682 |
| | $ | 8,098 |
|
| National Market Repurchase Agreement | | 28,967 |
| | 25,683 |
| | 0 |
| | 0 |
| | 54,650 |
|
| Capital loan with municipality | | 0 |
| | 0 |
| | 0 |
| | 775 |
| | 775 |
|
| Operating lease obligations | | 7,527 |
| | 12,838 |
| | 8,779 |
| | 18,840 |
| | 47,984 |
|
| Total | | $ | 38,331 |
| | $ | 41,660 |
| | $ | 11,219 |
| | $ | 20,297 |
| | $ | 111,507 |
|
CAPITAL
Risk-Based Capital. First Financial and its subsidiary, First Financial Bank, are subject to regulatory capital requirements administered by federal banking agencies. Capital adequacy guidelines and, additionally for banks, prompt corrective action regulations involve quantitative measures of assets, liabilities and certain off-balance sheet items calculated under regulatory accounting practices. Capital amounts and classifications are also subject to qualitative judgments by regulators. Failure to meet minimum capital requirements can initiate regulatory action.
Quantitative measures established by regulation to ensure capital adequacy require First Financial to maintain minimum amounts and ratios as defined by the regulations for Total and Tier 1 capital to risk-weighted assets and to average assets. Management believes that, as of December 31, 2013, First Financial met all capital adequacy requirements to which it was subject. At December 31, 2013 and December 31, 2012, regulatory notifications categorized First Financial Bank as well-capitalized under the regulatory framework for prompt corrective action. To be categorized as well-capitalized, First Financial Bank must maintain minimum Total risk-based, Tier 1 risk-based and Tier 1 leverage ratios as set forth by regulation. There have been no conditions or events since those notifications that management believes has changed the Company’s category.
First Financial's Tier 1 capital is comprised of total shareholders' equity less unrealized gains and losses on investment securities available-for-sale, any amounts resulting from the application of FASB ASC Topic 715, Compensation-Retirement Benefits, that are recorded within accumulated other comprehensive income (loss), intangible assets and any valuation related to mortgage servicing rights. Total risk-based capital consists of Tier 1 capital plus the qualifying allowance for loan and lease losses and gross unrealized gains on investment securities.
For purposes of calculating the leverage ratio, average assets represents quarterly average assets less assets not qualifying for Total risk-based capital, including intangible assets, non-qualifying mortgage servicing rights and allowance for loan and lease losses.
First Financial's Tier I and Total capital ratios were negatively impacted by the shift in risk weighted assets during 2013 primarily as a result of declines in lower risk weighted covered assets offset by increases in uncovered loans. Further, the Company's Tier I capital ratio was also negatively impacted by the declines in shareholders' equity resulting from the variable dividend payout and share repurchase activity during 2013 as discussed in the "Shareholder Dividends" and "Share Repurchases" sections that follow.
For further detail on First Financial's capital ratios at December 31, 2013, see Note 16 of the Notes to Consolidated Financial Statements.
In July 2013, the Board of Governors of the Federal Reserve System approved a final rule implementing changes intended to strengthen the regulatory capital framework for all banking organizations (Basel III). The final rule includes transition periods to ease the potential burden, with community banks such as First Financial subject to the final rule beginning January 1, 2015. Among other things, Basel III includes new minimum risk-based and leverage capital requirements for all banks. The rule includes a new minimum ratio of common equity tier 1 capital to risk-weighted assets of 4.5% and a new capital conservation buffer of 2.5% of risk-weighted assets that will be phased-in over a transition period ending December 31, 2018. Further, the minimum ratio of tier 1 capital to risk-weighted assets is increased from 4.0% to 6.0% and all banks are now subject to a 4.0% minimum leverage ratio. The required total risk-based capital ratio will not change.
Failure to maintain the required common equity tier 1 capital conservation buffer will result in potential restrictions on a bank’s ability to pay dividends, repurchase stock and/or pay discretionary compensation to its employees. The Basel III requirements
30 First Financial Bancorp 2013 Annual Report
also provide strict eligibility criteria for regulatory capital instruments and change the method for calculating risk-weighted assets in an effort to better identify riskier assets requiring higher capital allocations.
While First Financial continues to evaluate this final rule and its potential impact, management expects that the Company will continue to exceed all regulatory capital requirements under Basel III.
|
| | | | | | | | |
| Table 14 • Capital Adequacy | | |
| | | December 31, |
| (Dollars in thousands) | 2013 | | 2012 |
| Consolidated capital calculations | | |
| | Common stock | $ | 577,076 |
| | $ | 579,293 |
|
| | Retained earnings | 324,192 |
| | 330,004 |
|
| | Accumulated other comprehensive loss | (31,281 | ) | | (18,677 | ) |
| | Treasury stock, at cost | (187,826 | ) | | (180,195 | ) |
| Total shareholders' equity | 682,161 |
| | 710,425 |
|
| | Goodwill | (95,050 | ) | | (95,050 | ) |
| | Other intangibles | (5,924 | ) | | (7,648 | ) |
| Total tangible equity | $ | 581,187 |
| | $ | 607,727 |
|
| | Total assets | $ | 6,417,213 |
| | $ | 6,497,048 |
|
| | Goodwill | (95,050 | ) | | (95,050 | ) |
| | Other intangibles | (5,924 | ) | | (7,648 | ) |
| Total tangible assets | $ | 6,316,239 |
| | $ | 6,394,350 |
|
| Tier 1 capital | $ | 624,850 |
| | $ | 637,176 |
|
| Total capital | $ | 679,074 |
| | $ | 686,961 |
|
| Total risk-weighted assets | $ | 4,276,152 |
| | $ | 3,904,096 |
|
Average assets (1) | $ | 6,177,644 |
| | $ | 6,219,035 |
|
| | | | | |
| Regulatory capital | | | |
| | Tier 1 ratio | 14.61 | % | | 16.32 | % |
| | Total capital ratio | 15.88 | % | | 17.60 | % |
| | Leverage ratio | 10.11 | % | | 10.25 | % |
| | | | | |
| Other capital ratios | | | |
| | Total shareholders' equity to ending assets | 10.63 | % | | 10.93 | % |
| | Total tangible shareholders' equity to ending tangible assets | 9.20 | % | | 9.50 | % |
| | | | | |
(1) For purposes of calculating the Leverage ratio, certain intangible assets are excluded from average assets. |
Shelf Registrations. On April 28, 2011, First Financial filed a shelf registration on Form S-3 with the Securities and Exchange Commission (SEC). This shelf registration allows First Financial to raise capital from time to time through the sale of various types of securities, subject to approval by the Company's board of directors, and expires on April 28, 2014.
Shareholder Dividends. First Financial’s dividend payout ratio, or total dividends paid divided by net income available to common shareholders, was 111.90%, 101.72% and 67.24% for the years 2013, 2012 and 2011, respectively. The dividend payout ratio is continually reviewed by management and the board of directors for consistency with First Financial’s overall capital planning activities and compliance with applicable regulatory limitations.
During 2013, First Financial's board of directors authorized a 100% dividend payout ratio consisting of two parts: a regular dividend of $0.15 per share based on the stated payout ratio of 40% to 60% of earnings and a variable dividend that would equal the remainder of the quarterly earnings. Subsequent to the dividend paid on October 1, 2013 to shareholders of record as
First Financial Bancorp 2013 Annual Report 31
Management’s Discussion And Analysis Of Financial Condition And Results Of Operations
of August 30, 2013, First Financial resumed paying only a regular quarterly cash dividend to common shareholders of $0.15 per common share.
In April 2012, First Financial increased the regular quarterly cash dividend to common shareholders to $0.15 per common share. Further, the Company announced that future dividend payments were expected to consist of the higher regular dividend and continuation of the previously announced variable dividend through the end of 2013 unless the Company's capital position materially changed or capital deployment opportunities arose.
Dividend decisions are evaluated quarterly by the Company's board of directors in the context of numerous factors, and the board will evaluate the regular dividend for increase only when such an increase is sustainable.
Share Repurchases. In January 2014, First Financial's board of directors suspended further share repurchase activity under the 2012 share repurchase plan discussed below in connection with the pending regulatory applications related to the Bexley and Insight transactions.
In October 2012, First Financial's board of directors approved a share repurchase plan under which the Company has the ability to repurchase up to 5,000,000 common shares. Under the plan, the Company expects to repurchase approximately 1,000,000 common shares annually beginning in the fourth quarter 2012. This annual target is subject to market conditions and quarterly evaluation by the board as well as balance sheet composition and growth. The Company generally expects to return to shareholders a target range of 60% - 80% of earnings through a combination of its regular dividend and share repurchases while still maintaining capital ratios that exceed internal target thresholds, current regulatory capital requirements and proposed capital requirements under the Basel Committee on Banking Supervision's final framework for strengthening international capital and liquidity regulation released in December 2010 (Basel III).
As discussed in the Liquidity section above, the Company repurchased 750,145 shares under this plan during 2013 at an average price of $15.70 per share and 460,500 shares during 2012 at an average price of $14.78 per share. At December 31, 2013, 3,789,355 shares remained available for purchase under this repurchase plan.
Shareholders' Equity. Total shareholders’ equity at December 31, 2013 was $682.2 million compared to total shareholders’ equity at December 31, 2012 of $710.4 million.
For further detail, see the Consolidated Statements of Changes in Shareholders’ Equity.
PENSION PLAN
First Financial sponsors a non-contributory defined-benefit pension plan covering substantially all employees. Prior to the fourth quarter of 2013, plan assets were administered and managed by the Wealth Management division of First Financial Bank, N.A. During the fourth quarter of 2013, the investment management and trustee services were transitioned to a third party vendor. As of December 31, 2013, plan assets were primarily invested in publicly traded equity and fixed income mutual funds. The pension plan does not own any shares of First Financial common stock or any other First Financial security or product, directly or through an equity fund.
The significant assumptions used in the valuations and accounting for the pension plan include the discount rate, expected return on plan assets and the rate of employee compensation increase. The discount rate assumption was determined using published December 31, 2013 corporate bond indices, projected cash flows of the pension plan and comparisons were made to external industry surveys to test reasonableness. The expected return on plan assets was 7.5% for 2013 and 2012, and was based on the composition of plan assets as well as a consensus of estimates from similarly managed portfolios of expected future returns. First Financial will continue to monitor the return on plan assets and the investment vehicle used to fund the plan. The assumed rate of compensation increase was 3.5% and is compared to historical increases for plan participants.
As a result of First Financial's efficiency initiatives and other associate-related actions, the Company incurred pension settlement charges in 2013. Consistent with FASB ASC Topic 715, Compensation - Retirement Benefits, pension settlement charges are an acceleration of previously deferred costs that would have been recognized in future periods and are triggered when lump sum distributions exceed an annual accounting threshold for the plan. First Financial recognized pension settlement charges of $6.2 million for 2013, as a result of the year-to-date level of lump sum distributions from the Company's pension plan. The accounting threshold for lump sum distributions reset on January 1, 2014.
32 First Financial Bancorp 2013 Annual Report
Presented below is the estimated impact on First Financial’s projected benefit obligation and pension expense as of December 31, 2013, assuming shifts in the significant assumptions:
|
| | | | | | | | | | | | | | | | | | | | | | | | |
| | Discount Rate | | Expected Return on Plan Assets | | Rate of Compensation Increase |
| (Dollars in thousands) | | -100 BP | | +100 BP | | -100 BP | | +100 BP | | -100 BP | | +100 BP |
| Change in Projected Benefit Obligation | | $ | 6,331 |
| | $ | (4,847 | ) | | N/A |
| | N/A |
| | $ | (892 | ) | | $ | 1,059 |
|
| Change in Pension Expense | | $ | 529 |
| | $ | (452 | ) | | $ | 1,209 |
| | $ | (1,209 | ) | | $ | (315 | ) | | $ | 353 |
|
As a result of the plan’s updated actuarial projections for 2013 as well as the previously mentioned settlement charges, First
Financial recorded expenses related to its pension plan of $5.5 million for 2013 in the Consolidated Statements of Income, compared to pension income of $0.5 million and $1.3 million for 2012 and 2011, respectively. First Financial made no cash contributions to fund the pension plan in 2013, 2012 or 2011 and does not expect to make a cash contribution to its pension plan in 2014. Contributions, if necessary, are required to meet ERISA’s minimum funding standards and the estimated quarterly contribution requirements during this period.
ENTERPRISE RISK MANAGEMENT
First Financial manages risks through a structured enterprise risk management (ERM) approach that routinely assesses the overall level of risk, identifies specific risks and evaluates the steps being taken to mitigate those risks. First Financial continues to enhance its risk management capabilities and has, over time, embedded risk awareness as part of the culture of the Company. ERM allows First Financial to align a variety of risk management activities within the Company into a cohesive, enterprise-wide approach and focus on process-level risk management activities and strategic objectives within the risk management culture. Additionally, ERM allows the Company to deliberately consider risk responses and effectiveness of mitigation compared to established standards for risk appetite and tolerance, recognize and respond to the significant organizational changes and consolidate information obtained through a common process into concise business performance and risk information for management and the board of directors.
First Financial uses a robust regulatory risk framework as one of the foundational components of its ERM framework. This not only allows for a common categorization across the Company, but provides a consistent and complete risk framework that can be summarized and assessed enterprise-wide. In addition, the framework is consistent with that used by the Company’s regulators, allowing for additional feedback on First Financial’s ability to assess and measure risk across the organization and for management and the board of directors to identify and understand differences in assessed risk profiles using this same foundation.
ERM helps ensure that First Financial continues to identify and adequately address risks that emerge from a combination of new customers, products and associates, as well as changing markets, new or evolving systems and processes and new lines of business.
The goals of First Financial’s ERM framework are to:
| |
| • | focus on the Company at both the enterprise and line of business levels; |
| |
| • | align the Company's risk appetite with its strategic and related operational, compliance and reporting objectives; |
| |
| • | enhance risk response decisions; |
| |
| • | reduce operational deficiencies and possible losses; |
| |
| • | identify and manage interrelated risks; |
| |
| • | provide integrated responses to multiple risks; |
| |
| • | improve the deployment and allocation of capital; and |
| |
| • | improve overall business performance. |
Specific enterprise-level objectives include:
| |
| • | creating a holistic view of risk in which risk is comprehensively considered, consistently communicated and documented in decision making; |
| |
| • | centralizing the oversight of risk management activities; |
| |
| • | creating an awareness of risks facing the Company by defining the risks that will be addressed by the enterprise and each functional area or business unit; |
First Financial Bancorp 2013 Annual Report 33
Management’s Discussion And Analysis Of Financial Condition And Results Of Operations
| |
| • | establishing and maintaining systems and mechanisms to comprehensively identify, assess, monitor and measure risks that may impact First Financial’s ability to achieve its business objectives; |
| |
| • | creating a process which ensures that, for all new lines of business and new product decisions, management evaluates the expertise needed and comprehensively assesses the risks involved; |
| |
| • | establishing and maintaining systems and mechanisms to monitor risk responses; |
| |
| • | developing risk occurrence information systems to provide early warning of events or situations that create risk for the Company; |
| |
| • | implementing and reviewing risk measurement techniques that management may use to establish the Company’s risk tolerance, assess risk likelihood and impact, and analyze risk monitoring processes; and |
| |
| • | establishing appropriate management reporting systems regarding the enterprise-wide risk exposures and allocation of capital. |
Line of business-level objectives focus on why the particular business or business unit exists; how the business affects the Company’s strategy, earnings, reputation and other key success factors; and whether the line of business objectives are aligned with the enterprise objectives.
First Financial has identified nine types of risk that it monitors in its ERM framework. These risks include information technology, market, legal, strategic, reputation, credit, regulatory (compliance), operational and external/environmental.
Board of Directors and Board Risk Committee. First Financial’s board of directors is responsible for understanding the Company’s risk management objectives and risk tolerance. Therefore, board oversight of the Company’s risk management activities is a key component to an effective risk management process. Responsibilities of the board of directors include:
| |
| • | establishing and guiding the Company’s strategic direction and tolerance for risk, including the determination of the aggregate risk appetite, and identifying the senior managers who have the responsibility for managing this risk; |
| |
| • | monitoring the Company’s performance and overall risk profile, ensuring that the level of risk is maintained at prudent levels and is supported by adequate capital; |
| |
| • | ensuring that the Company implements sound fundamental principles that facilitate the identification, measurement, monitoring and control of risk; and |
| |
| • | ensuring that adequate resources are dedicated to risk management and that awareness of risk management activities is evident throughout the organization. |
The board of directors has defined broad risk tolerance levels or limits to guide management in the decision-making process and is responsible for establishing information and communication requirements to ensure that risk management activities remain within these tolerance limits. The board risk committee, a standing committee of the board of directors, is responsible for carrying out the board’s responsibilities in this regard. Other standing committees of the board (audit, mergers and acquisitions / capital markets and compensation) oversee particular areas of risk assigned to them.
Executive and Senior Management. Executive and senior management members are responsible for managing risk activities and delegating risk authority and tolerance to the individual risk owners responsible for executing the specific business activities.
Management must identify which processes and activities are critical to achieving the Company’s business objectives within the designated tolerance levels. Management must then delegate responsibility, authority and accountability to the appropriate risk owners who are responsible for ensuring that the respective processes and activities are designed and implemented to manage the related risks within those delegated tolerance levels.
Information and communication requirements must be clearly communicated to risk owners in order to support management’s analysis of how effectively risk management activities are operating and that these requirements support and facilitate required reporting to the board of directors.
Chief Risk Officer. The chief risk officer is responsible for the oversight of the Company’s ERM processes. The chief risk officer may appoint such other officers or establish other management committees as required for effective risk management and governance, including risk identification, risk measurement, risk monitoring, risk control or mitigation and risk reporting. The chief risk officer is also responsible for the maintenance of such procedures, methodologies and guidelines as are necessary to administer the ERM program.
Committee Chairs. The ERM program utilizes fifteen committees as its primary assessment and communication mechanism for the previously identified risks. Committee chairs play key roles in the execution of risk management activities throughout
34 First Financial Bancorp 2013 Annual Report
the enterprise and are responsible for continuous updates and communication among committee members as well as with the risk management department regarding changes to risk profiles, changes to risk assessments and the emergence of new risks that could impact the Company.
Internal Audit. Internal audit is responsible for planning audit activities to periodically reassess the design and operation of key risk management processes and to make periodic evaluations of the ongoing accuracy and effectiveness of the communications from risk owners to senior management and from senior management to the board of directors.
Risk Assessment Process. The periodic assessment of risks is a key component of a sound ERM program. Managers, business line leaders and executives are responsible for developing the risk assessment for their individual departments, business lines and subsidiaries consistent with their operating practices and strategies. The chief risk officer, management and the board risk committee are responsible for ensuring that risk is viewed and analyzed from a portfolio perspective. Furthermore, interrelated risks should be considered, describing how a single risk or event may create multiple risks and the need for management to develop an entity-level portfolio view of risk.
First Financial’s risk management functional programs identify the objectives, scope, assessment frequency and methodology utilized in the assessment and reporting process.
Risk management programs, in total and in each functional component, accomplish the following:
| |
| • | identify risk issues and their respective risk owners; |
| |
| • | link identified risks and their mitigation to the Company's strategic objectives; |
| |
| • | evaluate the risks and their associated likelihood of occurrence and consequences; |
| |
| • | prioritize the risk issues in regards to the current risk status and trend; |
| |
| • | provide reports to management and risk owners that will assist them in implementing appropriate risk management processes; |
| |
| • | assist management in assessing the alternatives for managing the risks; |
| |
| • | assist management in the development of risk management plans; and |
| |
| • | track risk management efforts and respond accordingly. |
Monitoring and Reporting. The board of directors oversees risk reporting and monitoring through the board risk committee, which meets at least quarterly. The board risk committee is responsible for establishing tolerance limits for monitoring enterprise-wide key risks.
Management continually reviews and challenges the risks identified as key, as well as the appropriateness of established tolerance limits and the actions identified as necessary to mitigate key risks. As circumstances warrant, management will provide recommendations to the board risk committee for changes or adjustments to key risks or tolerance limits.
First Financial believes that communication is fundamental to successful risk management and is based on a strong partnership between risk management, management and the board of directors. Productive reporting and dialogue with management is necessary to ensure collaborative and effective risk management.
CREDIT RISK
Credit risk represents the risk of loss due to failure of a customer or counterparty to meet its financial obligations in accordance with contractual terms. First Financial manages credit risk through its underwriting practices, periodically reviewing and approving its credit exposures using credit policies and guidelines approved by the board of directors.
Allowance for loan and lease losses, excluding covered loans: First Financial records a provision for loan and lease losses (provision) in the Consolidated Statements of Income to maintain the allowance for loan and lease losses (allowance) at a level considered sufficient to absorb probable loan and lease losses inherent in the portfolio. Actual losses on loans and leases are charged against the allowance, which is a reserve accumulated on the Consolidated Balance Sheets through the recognition of the provision. The recorded values of the loans and leases actually removed from the Consolidated Balance Sheets due to credit deterioration are referred to as charge-offs. Any subsequent recovery of a previously charged-off loan is credited back to the allowance. First Financial's policy is to charge-off all or a portion of a loan when, in management's opinion, it is unlikely to collect the principal amount owed in full either through payments from the borrower or from the liquidation of collateral. All loans charged-off are subject to continuous review and concerted efforts are made to maximize any recovery. In most cases, the borrower’s debt obligation is not canceled even though the balance may have been charged-off.
First Financial Bancorp 2013 Annual Report 35
Management’s Discussion And Analysis Of Financial Condition And Results Of Operations
Management determines the adequacy of the allowance based on historical loss experience as well as other significant factors such as composition of the portfolio; economic conditions; geographic footprint; the results of periodic internal and external evaluations of delinquent, nonaccrual and classified loans; and any other adverse situations that may affect a specific borrower's ability to repay (including the timing of future payments). This evaluation is inherently subjective as it requires utilizing material estimates that may be susceptible to significant change. The evaluation of these factors is the responsibility of the Allowance for Loan and Lease Losses Committee, which is comprised of senior officers from the risk management, credit administration, finance and lending areas.
See Table 15 – Summary of Allowance for Loan and Lease Losses and Selected Statistics for a summary of activity impacting the allowance and Table 16 – Allocation of the Allowance for Loan and Lease Losses for detail on the composition of the allowance.
2013 vs. 2012. The allowance at December 31, 2013 was $43.8 million or 1.25% of loans, a $3.9 million and 8.3% decline from a balance of $47.8 million or 1.50% of loans at December 31, 2012. Provision expense declined $10.4 million, or 54.4%, to $8.7 million in 2013 from $19.1 million in 2012. Net charge-offs decreased $11.3 million, or 47.1%, to $12.7 million for 2013 compared to $23.9 million for 2012, while the ratio of net charge-offs as a percentage of average loans outstanding declined to 0.38% in 2013 from 0.79% in 2012. The allowance as a percentage of net charge-offs was 346.1% for the year ended December 31, 2013 compared to 199.8% for the year ended December 31, 2012.
The decline in net charge-offs during 2013 was primarily the result of lower net losses across the portfolio, coupled with higher levels of recoveries, particularly in the commercial real estate and construction real estate portfolios. The decline in the allowance was primarily related to lower levels of nonperforming loans resulting from positive resolution efforts during 2013 as well as declining reserve rates across the portfolio as a result of lower loss levels in recent periods. Loan growth also contributed to the decrease in the allowance as a percentage of loans at December 31, 2013 as compared to December 31, 2012.
The decline in the allowance during 2013 was consistent with declines in net charge-offs, nonaccrual loans, nonperforming assets and classified assets over the same period and reflects continued improvement in overall economic conditions and real estate values across First Financial’s customer base and the markets in which the Company operates.
For further discussion of First Financial's allowance for loan and lease losses, see Note 11 of the Notes to Consolidated Financial Statements.
36 First Financial Bancorp 2013 Annual Report
|
| | | | | | | | | | | | | | | | | | | |
| Table 15 • Summary Of Allowance For Loan And Lease Losses And Selected Statistics (Excluding Covered Loans) |
| (Dollars in thousands) | 2013 | | 2012 | | 2011 | | 2010 | | 2009 |
| Transactions in the allowance for loan and lease losses: | | | | | | | | | |
| Balance at January 1 | $ | 47,777 |
| | $ | 52,576 |
| | $ | 57,235 |
| | $ | 59,311 |
| | $ | 35,873 |
|
| Loans charged-off: | | | | | | | | | |
| Commercial | 3,415 |
| | 4,312 |
| | 3,436 |
| | 13,324 |
| | 11,295 |
|
| Real estate – construction | 1 |
| | 2,684 |
| | 6,279 |
| | 8,619 |
| | 12,680 |
|
| Real estate – commercial | 8,326 |
| | 11,012 |
| | 10,382 |
| | 8,191 |
| | 4,514 |
|
| Real estate – residential | 1,016 |
| | 1,814 |
| | 1,551 |
| | 1,693 |
| | 1,315 |
|
| Installment | 335 |
| | 577 |
| | 526 |
| | 1,154 |
| | 1,468 |
|
| Home equity | 2,409 |
| | 3,661 |
| | 2,183 |
| | 3,499 |
| | 2,037 |
|
| Credit card | 1,285 |
| | 1,252 |
| | 1,441 |
| | 1,871 |
| | 1,640 |
|
| Lease financing | 496 |
| | 0 |
| | 0 |
| | 0 |
| | 0 |
|
| Total loans charged-off | 17,283 |
| | 25,312 |
| | 25,798 |
| | 38,351 |
| | 34,949 |
|
| | | | | | | | | | |
| Recoveries of loans previously charged-off: | | | | | | | | | |
| Commercial | 672 |
| | 393 |
| | 762 |
| | 620 |
| | 632 |
|
| Real estate – construction | 672 |
| | 0 |
| | 32 |
| | 24 |
| | 0 |
|
| Real estate – commercial | 1,994 |
| | 265 |
| | 309 |
| | 1,082 |
| | 557 |
|
| Real estate – residential | 203 |
| | 73 |
| | 45 |
| | 24 |
| | 27 |
|
| Installment | 310 |
| | 323 |
| | 363 |
| | 519 |
| | 857 |
|
| Home equity | 508 |
| | 115 |
| | 117 |
| | 192 |
| | 16 |
|
| Credit card | 253 |
| | 227 |
| | 301 |
| | 249 |
| | 213 |
|
| Lease financing | 9 |
| | 0 |
| | 0 |
| | 1 |
| | 1 |
|
| Total recoveries | 4,621 |
| | 1,396 |
| | 1,929 |
| | 2,711 |
| | 2,303 |
|
| Net charge-offs | 12,662 |
| | 23,916 |
| | 23,869 |
| | 35,640 |
| | 32,646 |
|
| | | | | | | | | | |
| Provision for loan and lease losses | 8,714 |
| | 19,117 |
| | 19,210 |
| | 33,564 |
| | 56,084 |
|
| Balance at December 31 | $ | 43,829 |
| | $ | 47,777 |
| | $ | 52,576 |
| | $ | 57,235 |
| | $ | 59,311 |
|
| | | | | | | | | | |
| Credit quality ratios: | | | | | | | | | |
| As a percent of year-end loans, net of unearned income: | | | | | | | | | |
| Allowance for loan and lease losses | 1.25 | % | | 1.50 | % | | 1.77 | % | | 2.03 | % | | 2.05 | % |
Nonperforming loans (1) | 1.50 | % | | 2.39 | % | | 2.57 | % | | 2.84 | % | | 2.69 | % |
| | | | | | | | | | |
| As a percent of average loans, net of unearned income: | | | | | | | | | |
| Net charge-offs | 0.38 | % | | 0.79 | % | | 0.84 | % | | 1.27 | % | | 1.16 | % |
| | | | | | | | | | |
Allowance for loan and lease losses to nonperforming loans (1) | 83.17 | % | | 62.95 | % | | 68.84 | % | | 71.62 | % | | 76.25 | % |
(1) Includes loans classified as nonaccrual and troubled debt restructurings.
First Financial Bancorp 2013 Annual Report 37
Management’s Discussion And Analysis Of Financial Condition And Results Of Operations
|
| | | | | | | | | | | | | | | | | | | | | | | | | | | | | |
| Table 16 • Allocation Of The Allowance For Loan And Lease Losses (Excluding Covered Loans) |
| | December 31, |
| | 2013 | | 2012 | | 2011 | | 2010 | | 2009 |
| (Dollars in thousands) | Allowance | Percent of Loans to Total Loans | | Allowance | Percent of Loans to Total Loans | | Allowance | Percent of Loans to Total Loans | | Allowance | Percent of Loans to Total Loans | | Allowance | Percent of Loans to Total Loans |
| Balance at End of Period Applicable to: | | | | | | | | | | | | | | |
| Commercial | $ | 10,568 |
| 29.5 | % | | $ | 7,926 |
| 27.1 | % | | $ | 10,289 |
| 28.9 | % | | $ | 10,138 |
| 28.4 | % | | $ | 18,590 |
| 27.6 | % |
| Real estate – construction | 824 |
| 2.3 | % | | 3,268 |
| 2.3 | % | | 4,424 |
| 3.9 | % | | 8,326 |
| 5.8 | % | | 8,143 |
| 8.8 | % |
| Real estate – commercial | 20,478 |
| 42.7 | % | | 24,151 |
| 44.6 | % | | 18,228 |
| 41.5 | % | | 14,917 |
| 40.5 | % | | 15,190 |
| 37.3 | % |
| Real estate – residential | 3,379 |
| 10.1 | % | | 3,599 |
| 10.0 | % | | 4,994 |
| 9.7 | % | | 8,907 |
| 9.6 | % | | 5,308 |
| 11.1 | % |
| Installment, home equity & credit card | 8,119 |
| 13.1 | % | | 8,464 |
| 14.4 | % | | 14,516 |
| 15.4 | % | | 14,888 |
| 15.6 | % | | 12,079 |
| 15.2 | % |
| Lease financing | 461 |
| 2.3 | % | | 369 |
| 1.6 | % | | 125 |
| 0.6 | % | | 59 |
| 0.1 | % | | 1 |
| 0.0 | % |
| Total | $ | 43,829 |
| 100.0 | % | | $ | 47,777 |
| 100.0 | % | | $ | 52,576 |
| 100.0 | % | | $ | 57,235 |
| 100.0 | % | | $ | 59,311 |
| 100.0 | % |
Allowance for loan and lease losses, covered loans: In accordance with the accounting guidance for business combinations, no allowance was recorded on covered loans at the time of acquisition as any credit deterioration evident in the loans was included in the determination of the fair value of the loans at the acquisition date. The majority of covered loans are accounted for under FASB ASC Topic 310-30, whereby First Financial is required to periodically re-estimate the expected cash flows on the loans. For purposes of applying the guidance under FASB ASC Topic 310-30, First Financial grouped acquired loans into pools based on common risk characteristics.
Generally, a decline in expected cash flows for a pool of loans is considered impairment and recorded as provision expense, and a related allowance for loan and lease losses on covered loans, on a discounted basis during the period. Estimated reimbursements due from the FDIC under loss sharing agreements related to any declines in expected cash flows for a pool of loans are recorded as noninterest income and an increase to the FDIC indemnification asset in the same period. Improvement in expected cash flows for a pool of loans, once any previously recorded impairment is recaptured, is recognized prospectively as an adjustment to the yield on the loans in the pool and a related adjustment to the yield on the FDIC indemnification asset. These cash flow evaluations are inherently subjective as they require material estimates, all of which may be susceptible to significant change.
2013 vs. 2012. The allowance for losses on covered loans was $18.9 million and $45.2 million at December 31, 2013 and 2012, respectively. Covered provision expense declined $30.7 million, or 99.4% to $0.2 million in 2013 from $30.9 million in 2012. The related, estimated reimbursement on covered loan losses due from the FDIC under loss sharing agreements was recorded as both FDIC loss sharing income and an increase to the FDIC indemnification asset during 2013 and 2012. The declines in the allowance on covered loans and covered provision expense reflect continued improvement in credit expectations for the covered loan portfolio and a significant reduction in classified covered loan balances during 2013.
First Financial views the combination of provision expense on covered loans, losses on covered OREO and loss sharing expense, net of the related reimbursements due under loss sharing agreements recorded as FDIC loss sharing income, as the net credit costs associated with covered assets during the period. Net credit costs decreased $6.9 million or 81.8% during 2013, from $8.4 million at December 31, 2012 to $1.5 million at December 31, 2013.
38 First Financial Bancorp 2013 Annual Report
|
| | | | | | | | | | | | | | | |
| Table 17 • Summary Of Allowance For Loan And Lease Losses (Covered Loans) |
| (Dollars in thousands) | 2013 | | 2012 | | 2011 | | 2010 |
| Transactions in the allowance for loan and lease losses: | | | | | |
| Balance at January 1 | $ | 45,190 |
| | $ | 42,835 |
| | $ | 16,493 |
| | $ | 0 |
|
| Loans charged-off: | | | | | | | |
| Commercial | 8,280 |
| | 12,876 |
| | 9,728 |
| | 16,518 |
|
| Real estate-construction | 610 |
| | 2,871 |
| | 2,749 |
| | 3,333 |
|
| Real estate-commercial | 28,296 |
| | 12,974 |
| | 25,746 |
| | 16,507 |
|
| Real estate-residential | 713 |
| | 1,296 |
| | 1,650 |
| | 8,142 |
|
| Installment and other consumer financing | 1,325 |
| | 3,890 |
| | 5,731 |
| | 2,492 |
|
| Total loans charged off | 39,224 |
| | 33,907 |
| | 45,604 |
| | 46,992 |
|
| | | | | | | | |
| Recoveries of loans previously charged-off: | | | | | | | |
| Commercial | 3,546 |
| | 2,153 |
| | 1,013 |
| | 338 |
|
| Real estate-construction | 7 |
| | 61 |
| | 527 |
| | 2 |
|
| Real estate-commercial | 8,636 |
| | 2,767 |
| | 5,391 |
| | 0 |
|
| Real estate-residential | 62 |
| | 17 |
| | 71 |
| | 0 |
|
| Installment and other consumer financing | 489 |
| | 361 |
| | 863 |
| | 1 |
|
| Total recoveries | 12,740 |
| | 5,359 |
| | 7,865 |
| | 341 |
|
| Net charge-offs | 26,484 |
| | 28,548 |
| | 37,739 |
| | 46,651 |
|
| | | | | | | | |
| Provision for loan and lease losses | 195 |
| | 30,903 |
| | 64,081 |
| | 63,144 |
|
| Balance at December 31 | $ | 18,901 |
| | $ | 45,190 |
| | $ | 42,835 |
| | $ | 16,493 |
|
|
| | | | | | | | | | | | | | | | | | | | | | | | | | | |
| Table 18 • Allocation Of The Allowance For Loan And Lease Losses (Covered Loans) |
| | December 31, |
| | 2013 | 2012 | 2011 | | 2010 |
| (Dollars in thousands) | Allowance | | Percent of Loans to Total Loans | | Allowance | | Percent of Loans to Total Loans | | Allowance | | Percent of Loans to Total Loans | | Allowance | | Percent of Loans to Total Loans |
| Balance at end of period applicable to: | | | | | | | | | | |
| Commercial | $ | 9,400 |
| | 9.2 | % | | $ | 19,136 |
| | 13.7 | % | | $ | 19,160 |
| | 18.6 | % | | $ | 8,787 |
| | 22.6 | % |
| Real estate-commercial | 8,515 |
| | 60.6 | % | | 22,918 |
| | 63.6 | % | | 21,930 |
| | 62.1 | % | | 7,213 |
| | 60.6 | % |
| Real estate-residential | 761 |
| | 17.6 | % | | 2,599 |
| | 13.5 | % | | 1,396 |
| | 11.5 | % | | 232 |
| | 9.9 | % |
| Installment, home equity, & other | 225 |
| | 12.6 | % | | 537 |
| | 9.2 | % | | 349 |
| | 7.8 | % | | 261 |
| | 6.9 | % |
| Total | $ | 18,901 |
| | 100.0 | % | | $ | 45,190 |
| | 100.0 | % | | $ | 42,835 |
| | 100.0 | % | | $ | 16,493 |
| | 100.0 | % |
MARKET RISK
Market risk is the risk of loss arising from adverse changes in the fair value of financial instruments due to changes in interest rates, foreign exchange rates and equity prices. The primary source of market risk for First Financial is interest rate risk. Interest rate risk is the risk to earnings and the value of equity arising from changes in market interest rates and arises in the normal course of business to the extent that there is a divergence between the amount of First Financial's interest-earning assets and the amount of interest-bearing liabilities that are prepaid, withdrawn, re-priced or mature in specified periods. First Financial seeks to achieve consistent growth in net interest income and equity while managing volatility arising from actual or expected shifts in market interest rates. First Financial's board of directors establishes policy limits with respect to interest rate risk. First Financial's ALCO oversees market risk management, monitoring risk measures, limits and policy guidelines for managing the amount of interest rate risk and its effect on net interest income and capital.
First Financial Bancorp 2013 Annual Report 39
Management’s Discussion And Analysis Of Financial Condition And Results Of Operations
Interest rate risk management is an active process that encompasses monitoring loan and deposit flows complemented by investment and funding activities. Effective interest rate risk management begins with understanding the dynamic characteristics of assets and liabilities and determining the appropriate interest rate risk position given business activities, management objectives, market expectations and ALCO policy limits and guidelines.
Interest rate risk for First Financial's Consolidated Balance Sheets consists of repricing, option and basis risks. Repricing risk results from differences in the maturity, or repricing, of interest-bearing assets and liabilities. Option risk in financial instruments arises from embedded options such as loan prepayments, early withdrawal of certificates of deposits and calls on investments and debt instruments that are primarily driven by third party or client behavior. Basis risk refers to the potential for changes in the underlying relationship between market rates or indices, which subsequently result in a narrowing of the net interest margin. Basis risk is also present in managed rate liabilities, such as interest-bearing checking accounts and savings accounts, where historical pricing relationships to market rates may change due to the level or directional change in market interest rates or competitive pressures.
Table 19 – Market Risk Disclosure projects the principal maturities and yields of First Financial’s interest-bearing financial instruments at December 31, 2013 for the next five years and thereafter, as well as the fair value of the instruments. For loans, securities and liabilities with contractual maturities, the table presents principal cash flows and related weighted-average interest rates by contractual maturities. For investment securities, including MBSs and CMOs, principal cash flows are based on estimated average lives. For loan instruments without contractual maturities, such as credit card loans, principal payments are allocated based on historical trends of payment activity. Maturities for interest-bearing liability accounts with no set maturity are estimated according to historical experience of cash flows and current expectations of client behaviors. For interest rate swaps, the table includes notional amounts and weighted-average interest rates by contractual maturity dates. The variable receiving rates are indexed to one-month LIBOR or Prime plus a spread.
The interest rate risk position is measured and monitored using income simulation models and economic value of equity (EVE) sensitivity analysis that capture both short-term and long-term interest rate risk exposure. Income simulation involves forecasting net interest income (NII) under a variety of interest rate scenarios including instantaneous shocks. First Financial uses EVE sensitivity analysis to understand the impact of changes in interest rates on long-term cash flows, income and capital. EVE is calculated by discounting the cash flows for all balance sheet instruments under different interest rate scenarios.
Presented below is the estimated impact on First Financial’s NII and EVE as of December 31, 2013, assuming immediate, parallel shifts in interest rates:
|
| | | | | |
| | % Change from Base Case for Immediate Parallel Changes in Rates |
| | -100 BP (1) | | +100 BP | | +200 BP |
| NII - Year 1 | (4.09)% | | (0.95)% | | 0.30% |
| NII - Year 2 | (4.31)% | | 0.97% | | 3.14% |
| EVE | (6.91)% | | (1.43)% | | (0.26)% |
(1) Because certain current interest rates are at or below 1.00%, the 100 basis point downward shock assumes that certain corresponding interest rates approach an implied floor that, in effect, reflects a decrease of less than the full 100 basis point downward shock.
Modeling the sensitivity of NII and EVE to changes in market interest rates is highly dependent on the assumptions incorporated into the modeling process. These assumptions are periodically reviewed in the context of balance sheet changes, product offerings, external economic factors and anticipated client behavior. In addition, the Company internally evaluates the impact of yield curve twist scenarios (i.e. flattening, steepening and inversions of the yield curve) on NII and EVE. First Financial's projected results for both near-term earnings at risk and long-term EVE indicate a risk-neutral to modestly asset-sensitive position. First Financial is actively managing its balance sheet with a bias toward asset sensitivity while simultaneously balancing the potential earnings impact of this strategy.
"Risk-neutral position" refers to the absence of a strong bias toward either asset or liability sensitivity. “Asset sensitive position” refers to an increase in interest rates, primarily short-term rates, that is expected to generate higher net interest income as rates earned on our interest-earning assets would reprice upward more quickly or in greater quantities than rates paid on our interest-bearing liabilities would reprice. Conversely, “liability sensitive position” refers to an increase in short-term interest rates that is expected to generate lower net interest income as rates paid on our interest-bearing liabilities would reprice upward more quickly or in greater quantities than rates earned on our interest-earning assets.
40 First Financial Bancorp 2013 Annual Report
The interest rate risk analysis provides a framework as to what First Financial's overall sensitivity is as of the Company's most recent reported position. Management strategies may impact future reporting periods, as actual results may differ from simulated results due to the timing, magnitude and frequency of interest rate changes, the difference between actual experience and the characteristics assumed, as well as changes in portfolio composition and market conditions. Market based and historical prepayment speeds are factored into the analysis for loan and securities portfolios. Deposit premiums and rate sensitivity for transactional deposit accounts are modeled based on both historical experience and external industry studies. Due to the current low interest rate environment, funding rates on deposit and wholesale funding instruments were not reduced below 0.0% in the down 100 basis point scenario. First Financial continues to refine the assumptions used in its interest rate risk modeling.
First Financial Bancorp 2013 Annual Report 41
Management’s Discussion And Analysis Of Financial Condition And Results Of Operations
|
| | | | | | | | | | | | | | | | | | | | | | | | |
| Table 19 • Market Risk Disclosure |
| | | Fair Value |
| | Principal Amount Maturing In: | December 31, |
| (Dollars in thousands) | 2014 | 2015 | 2016 | 2017 | 2018 | Thereafter | Total | 2013 |
| Rate sensitive assets | | | | | | | | |
Fixed interest rate loans (1) | $ | 267,066 |
| $ | 225,442 |
| $ | 221,521 |
| $ | 219,433 |
| $ | 255,129 |
| $ | 347,361 |
| $ | 1,535,952 |
| $ | 1,530,546 |
|
| Average interest rate | 4.67 | % | 4.62 | % | 5.25 | % | 4.74 | % | 4.38 | % | 4.33 | % | 4.63 | % | |
Variable interest rate loans (1) | 486,717 |
| 181,894 |
| 202,775 |
| 178,460 |
| 164,517 |
| 719,611 |
| 1,933,974 |
| 1,933,344 |
|
| Average interest rate | 3.66 | % | 3.51 | % | 4.20 | % | 3.43 | % | 3.50 | % | 4.04 | % | 3.81 | % | |
| Covered loans | 132,219 |
| 39,166 |
| 48,809 |
| 31,209 |
| 43,504 |
| 144,065 |
| 438,972 |
| 451,545 |
|
Average interest rate (2) | 3.84 | % | 5.73 | % | 4.99 | % | 5.44 | % | 5.13 | % | 5.26 | % | 4.87 | % | |
| Fixed interest rate securities | 5,581 |
| 23,089 |
| 112,726 |
| 137,279 |
| 289,791 |
| 745,730 |
| 1,314,196 |
| 1,303,219 |
|
| Average interest rate | 4.15 | % | 4.03 | % | 2.67 | % | 2.47 | % | 2.82 | % | 2.60 | % | 2.67 | % | |
| Variable interest rate securities | 1,662 |
| 31,784 |
| 18,222 |
| 22,812 |
| 19,978 |
| 342,219 |
| 436,677 |
| 435,367 |
|
| Average interest rate | 3.09 | % | 1.63 | % | 3.59 | % | 1.87 | % | 1.45 | % | 1.56 | % | 1.67 | % | |
| Other earning assets | 25,830 |
| 0 |
| 0 |
| 0 |
| 0 |
| 0 |
| 25,830 |
| 25,830 |
|
| Average interest rate | 0.25 | % | 0.00 | % | 0.00 | % | 0.00 | % | 0.00 | % | 0.00 | % | 0.25 | % | |
| FDIC indemnification asset | 24,456 |
| 5,855 |
| 5,223 |
| 4,158 |
| 3,314 |
| 2,085 |
| 45,091 |
| 34,820 |
|
| Average interest rate | (13.11 | )% | (13.11 | )% | (13.11 | )% | (13.11 | )% | (13.11 | )% | (13.11 | )% | (13.11 | )% | |
| | | | | | | | | |
| Rate sensitive liabilities | | | | | | | | |
| Noninterest-bearing checking | 1,147,452 |
| 0 |
| 0 |
| 0 |
| 0 |
| 0 |
| 1,147,452 |
| 1,147,452 |
|
| Savings and interest-bearing checking | 273,773 |
| 2,463,955 |
| 0 |
| 0 |
| 0 |
| 0 |
| 2,737,728 |
| 2,737,728 |
|
| Average interest rate | 0.08 | % | 0.08 | % | 0.00 | % | 0.00 | % | 0.00 | % | 0.00 | % | 0.08 | % | |
| Time deposits | 444,837 |
| 179,408 |
| 106,194 |
| 73,331 |
| 139,410 |
| 9,147 |
| 952,327 |
| 951,220 |
|
| Average interest rate | 0.66 | % | 0.90 | % | 0.72 | % | 1.19 | % | 1.84 | % | 1.60 | % | 0.94 | % | |
| Fixed interest rate borrowings | 683,634 |
| 26,950 |
| 1,198 |
| 1,164 |
| 1,164 |
| 670 |
| 714,780 |
| 716,706 |
|
| Average interest rate | 0.31 | % | 3.38 | % | 3.58 | % | 3.94 | % | 3.94 | % | 5.46 | % | 0.46 | % | |
| Variable interest rate borrowings | 94,749 |
| 0 |
| 0 |
| 0 |
| 0 |
| 0 |
| 94,749 |
| 94,749 |
|
| Average interest rate | 0.05 | % | 0.00 | % | 0.00 | % | 0.00 | % | 0.00 | % | 0.00 | % | 0.05 | % | |
| | | | | | | | | |
| Interest Rate Derivatives | | | | | | | | |
| Interest rate swaps | | | | | | | | |
| Fixed to variable | 793 |
| 2,957 |
| 4,530 |
| 1,035 |
| 344 |
| 177 |
| 9,836 |
| (954 | ) |
| Average pay rate (fixed) | 6.77 | % | 6.65 | % | 6.97 | % | 6.93 | % | 6.72 | % | 7.33 | % | 6.85 | % | |
| Average receive rate (variable) | 2.21 | % | 2.15 | % | 1.99 | % | 2.40 | % | 2.40 | % | 2.90 | % | 2.13 | % | |
| | | | | | | | | |
| Variable to fixed | 0 |
| 0 |
| 0 |
| 0 |
| 0 |
| 100,000 |
| 100,000 |
| 848 |
|
| Average pay rate (fixed) | 0.00 | % | 0.00 | % | 0.00 | % | 0.00 | % | 0.00 | % | 4.60 | % | 4.60 | % | |
| Average receive rate (variable) | 0.00 | % | 0.00 | % | 0.00 | % | 0.00 | % | 0.00 | % | 3.28 | % | 3.28 | % | |
(1) Includes loans held for sale, but excludes covered loans.
(2) Represents average contractual interest rates.
OPERATIONAL RISK
Operational risk is the risk of loss due to human behavior, inadequate or failed internal systems and controls and external influences such as market conditions, fraudulent activities, disasters and security risks. First Financial continuously strives to strengthen the Company’s system of internal controls, operating processes and employee awareness to assess the impact on earnings and capital and to improve the oversight of operational risk.
42 First Financial Bancorp 2013 Annual Report
COMPLIANCE RISK
Compliance risk represents the risk of regulatory sanctions, reputational impact or financial loss resulting from the Company’s failure to comply with rules and regulations issued by the various banking agencies and standards of good banking practice. Activities which may expose First Financial to compliance risk include, but are not limited to, those dealing with the prevention of money laundering, privacy and data protection, community reinvestment initiatives, fair lending challenges resulting from the Company’s expansion of its banking center network and employment and tax matters.
STRATEGIC AND REPUTATION RISK
Strategic risk represents the risk of loss due to failure to fully develop and execute business plans, failure to assess current and new opportunities in business, markets and products and any other event not identified in the defined risk types previously mentioned. Strategic risk focuses on analyzing factors that affect the direction of the institution or improper implementation of decisions.
Reputation risk represents the risk of loss due to impairment of earnings and capital from negative publicity. This affects the ability of First Financial to establish new relationships or services or to continue servicing existing relationships. Reputation risk is recognized by the potential effect that public opinion could have on First Financial's franchise value.
Mitigation of the various risk elements that represent strategic and reputation risk is achieved through initiatives to help First Financial better understand and report on the various risks it faces each day, including those related to the development of new products and business initiatives as well as the growth in social media.
CRITICAL ACCOUNTING POLICIES
First Financial’s Consolidated Financial Statements are prepared based on the application of accounting policies, the most significant of which are described in Note 1 of the Notes to Consolidated Financial Statements. These policies require the reliance on estimates and assumptions. Changes in underlying factors, assumptions or estimates could have a material impact on First Financial’s future financial condition and results of operations. In management’s opinion, some of these estimates and assumptions have a more significant impact than others on First Financial’s financial reporting. For First Financial, these estimates and assumptions include accounting for the allowance for loan and lease losses, covered loans, the FDIC indemnification asset, goodwill, pension and income taxes.
Allowance for loan and lease losses, excluding covered loans. First Financial maintains the allowance for loan and lease losses at a level that it considers sufficient to absorb probable loan and lease losses inherent in the portfolio. Management determines the adequacy of the allowance based on periodic evaluations of the loan portfolio and other factors. These evaluations are inherently subjective as they require material estimates, all of which may be susceptible to significant change, including, among others:
| |
| • | exposure at date of default; |
| |
| • | amounts and timing of expected future cash flows on impaired loans; |
| |
| • | historical loss exposure; and |
| |
| • | the effects of changes in economic conditions that may not be reflected in historical results. |
To the extent actual outcomes differ from management’s estimates, additional provision for credit losses may be required that would impact First Financial’s operating results. The Credit Risk section of this annual report provides management’s analysis of the allowance for loan and lease losses.
Covered loans. Loans acquired in FDIC-assisted transactions are covered under loss sharing agreements. Covered loans were recorded at estimated fair value at acquisition. First Financial evaluates purchased loans for impairment in accordance with the provisions of FASB ASC Topic 310-30. First Financial accounts for covered loans under FASB ASC Topic 310-30 except for loans with revolving privileges, which are outside the scope of this guidance, and loans for which cash flows could not be estimated, which are accounted for under the cost recovery method.
First Financial Bancorp 2013 Annual Report 43
Management’s Discussion And Analysis Of Financial Condition And Results Of Operations
The initial fair values of covered loans, as well as the periodic re-valuation of covered loans accounted for under FASB ASC Topic 310-30, are based on a discounted cash flow methodology that considers various factors including the type of loan and related collateral, classification status, fixed or variable interest rate, term of loan and whether or not the loan is amortizing, and a discount rate reflecting the Company’s assessment of risk inherent in the cash flow estimates. For purposes of estimating the values of covered loans, the loans were grouped together according to similar characteristics and were treated in the aggregate when applying various valuation techniques. Generally the determination of the initial fair value of the loans resulted in a significant write-down in the value of the loans, which was assigned to an accretable or nonaccretable balance, with the accretable balance being recognized as interest income over the expected life of the loan. The nonaccretable portion of the write-down in the value of the loans represents expected credit impairment on the loans and is only recognized in income if the payments on the loan exceed the recorded fair value of the loan.
The periodic re-valuation of covered loans accounted for under FASB ASC Topic 310-30 includes estimating expected cash flows based upon the expected remaining life of the underlying loans, which includes the effects of estimated prepayments. Any decline in expected cash flows for a pool of loans is considered impairment and recorded as provision expense on a discounted basis during the period. Improvement in expected cash flows for a pool of loans, once any previously recorded impairment is recaptured, is recognized prospectively as an adjustment to the yield on the loans in the pool. These cash flow evaluations are inherently subjective as they require material estimates, all of which may be susceptible to significant change, including, among others:
| |
| • | exposure at date of default; |
| |
| • | amounts and timing of expected future cash flows on impaired loans; |
| |
| • | historical loss exposure; and |
| |
| • | the effects of changes in economic conditions that may not be reflected in historical results. |
To the extent actual outcomes differ from management’s estimates, additional provision for credit losses on covered loans may be required that would impact First Financial’s operating results, net of the related reimbursements due under loss sharing agreements recorded as FDIC loss sharing income. The Credit Risk section of this annual report provides management’s analysis of the allowance for loan and lease losses on covered loans.
Allowance for loan and lease losses, covered loans. First Financial maintains an allowance for loan and lease losses on covered loans. For loans accounted for under FASB ASC Topic 310-30, expected cash flows are re-estimated periodically with any decline in expected cash flows recorded as provision expense and an allowance for covered loan losses on a discounted basis during the period. These cash flow evaluations are inherently subjective as they require material estimates, all of which may be susceptible to significant change. The related, estimated reimbursement on covered loan losses due from the FDIC under loss sharing agreements is recorded as both FDIC loss sharing income and an increase to the FDIC indemnification asset.
FDIC indemnification asset. FDIC indemnification assets result from the loss sharing agreements associated with FDIC-assisted transactions and are measured separately from the related covered assets as they are not contractually embedded in those assets and are not transferable should First Financial choose to dispose of the covered assets. The FDIC indemnification assets represent the estimated fair value of expected reimbursements from the FDIC for losses on covered assets. Pursuant to the terms of the loss sharing agreements, covered assets are subject to stated loss thresholds whereby the FDIC will reimburse First Financial for 80% of losses up to the stated loss thresholds and 95% of losses in excess of these amounts. FDIC indemnification assets were recorded at their estimated fair values at the time of the FDIC-assisted transaction. Fair values were estimated using projected cash flows related to the loss sharing agreements based on the expected reimbursements for losses and the applicable loss sharing percentages. These cash flows are discounted to reflect the uncertainty of the timing of the loss sharing reimbursement from the FDIC.
The accounting for FDIC indemnification assets is closely related to the accounting for the underlying, indemnified assets as well as the on-going assessment of the collectibility of the assets. First Financial re-estimates the expected indemnification asset cash flows in conjunction with the periodic re-estimation of cash flows on covered loans accounted for under FASB ASC Topic 310-30. Improvements in cash flow expectations on covered loans generally result in a related decline in the expected indemnification cash flows and are reflected as a downward yield adjustment on the indemnification assets. Declines in cash flow expectations on covered loans generally result in an increase in expected indemnification cash flows and are reflected as both FDIC loss sharing income and an increase to the indemnification asset. The collectibility assessment includes evaluation of claims activity with the FDIC, adjustments to the indemnification asset from the accelerated discount on covered loans, the yield on the indemnification asset in relation to the yield on the underlying covered loans and the remaining term of the loss
44 First Financial Bancorp 2013 Annual Report
sharing agreements. The expected indemnification asset cash flow evaluations and collectibility assessments are inherently subjective as they require material estimates, all of which may be susceptible to significant change, and may be impacted in future periods by the relatively short remaining term of loss sharing coverage on covered commercial assets.
Reimbursement requests are submitted to the FDIC on a quarterly basis for all covered loans. As of December 31, 2013, the reimbursement claims submitted by First Financial to the FDIC had been reimbursed on a timely basis.
Goodwill. Goodwill arising from business combinations represents the value attributable to unidentifiable intangible elements of the acquired business. FASB ASC Topic 350, Intangibles – Goodwill and Other, requires goodwill to be tested for impairment on an annual basis and more frequently in certain circumstances. At least annually, First Financial reviews goodwill for impairment using both income and asset-based approaches. The income-based approach utilizes a multiple of earnings method in which First Financial’s annualized earnings are compared to equity to provide an implied book value-to-earnings multiple. First Financial then compares the implied multiple to current marketplace earnings multiples at which banks are being traded. An implied multiple less than current marketplace earnings multiples is an indication of possible goodwill impairment. The asset-based approach uses the discounted cash flows of First Financial’s assets and liabilities, inclusive of goodwill, to determine an implied fair value. This input is used to calculate the fair value of the Company, including goodwill, and is compared to the Company’s book value. An implied fair value that exceeds the Company’s book value is an indication that goodwill is not impaired. If First Financial’s book value exceeds the implied fair value, an impairment loss equal to the excess amount would be recognized. Based on First Financial’s 2013 analysis, no impairment charges were required.
Pension. First Financial sponsors a non-contributory defined-benefit pension plan covering substantially all employees. Accounting for the pension plan involves material estimates regarding future plan obligations and investment returns on plan assets. Significant assumptions used in the pension plan include the discount rate, expected return on plan assets and the rate of compensation increase. First Financial determines the discount rate assumption using published corporate bond indices, projected cash flows of the pension plan and comparisons to external industry surveys for reasonableness. The expected long-term return on plan assets is based on the composition of plan assets and a consensus of estimates of expected future returns from similarly managed portfolios while the rate of compensation increase is compared to historical increases for plan participants. Changes in these assumptions can have a material impact on the amount of First Financial’s future pension obligations, on the funded status of the plan and on the Company's operating results.
Income Taxes. First Financial evaluates and assesses the relative risks and appropriate tax treatment of transactions after considering statutes, regulations, judicial precedent and other information, and maintains tax accruals consistent with its evaluation of these relative risks. Changes to the estimate of accrued taxes occur periodically due to changes in tax rates, interpretations of tax laws, the status of examinations being conducted by taxing authorities and changes to statutory, judicial and regulatory guidance that impact the relative risks of tax positions. These changes, when they occur, can affect deferred taxes and accrued taxes as well as the current period’s income tax expense and can be material to the Company's operating results.
First Financial regularly reviews its tax positions and establishes reserves for income tax-related uncertainties based on estimates of whether it is more likely than not that the tax uncertainty would be sustained upon challenge by the appropriate tax authorities which would then result in additional taxes, penalties and interest due. These evaluations are inherently subjective as they require material estimates and may be susceptible to significant change. Provisions for tax reserves, if any, are included in income tax expense in the Consolidated Financial Statements.
First Financial Bancorp 2013 Annual Report 45
Management’s Discussion And Analysis Of Financial Condition And Results Of Operations
FORWARD-LOOKING STATEMENTS
Certain statements contained in this report which are not statements of historical fact constitute forward-looking statements within the meaning of the Private Securities Litigation Reform Act (the Act). In addition, certain statements in future filings by First Financial with the SEC, in press releases, and in oral and written statements made by or with the approval of First Financial which are not statements of historical fact constitute forward-looking statements within the meaning of the Act. Examples of forward-looking statements include, but are not limited to, projections of revenues, income or loss, earnings or loss per share, the payment or non-payment of dividends, capital structure and other financial items, statements of plans and objectives of First Financial or its management or board of directors and statements of future economic performances and statements of assumptions underlying such statements. Words such as ''believes,'' ''anticipates,'' “likely,” “expected,” ''intends,'' and other similar expressions are intended to identify forward-looking statements but are not the exclusive means of identifying such statements. Management's analysis contains forward-looking statements that are provided to assist in the understanding of anticipated future financial performance. However, such performance involves risks and uncertainties that may cause actual results to differ materially. Factors that could cause actual results to differ from those discussed in the forward-looking statements include, but are not limited to:
| |
| ▪ | management's ability to effectively execute its business plan; |
| |
| ▪ | the risk that the strength of the United States economy in general and the strength of the local economies in which we conduct operations may deteriorate resulting in, among other things, a further deterioration in credit quality or a reduced demand for credit, including the resultant effect on our loan portfolio, allowance for loan and lease losses and overall financial performance; |
| |
| ▪ | U.S. fiscal debt and budget matters; |
| |
| ▪ | the ability of financial institutions to access sources of liquidity at a reasonable cost; |
| |
| ▪ | the impact of recent upheaval in the financial markets and the effectiveness of domestic and international governmental actions taken in response, and the effect of such governmental actions on us, our competitors and counterparties, financial markets generally and availability of credit specifically, and the U.S. and international economies, including potentially higher FDIC premiums arising from increased payments from FDIC insurance funds as a result of depository institution failures; |
| |
| ▪ | the effect of and changes in policies and laws or regulatory agencies (notably the recently enacted Dodd-Frank Wall Street Reform and Consumer Protection Act); |
| |
| ▪ | the effect of the current low interest rate environment or changes in interest rates on our net interest margin and our loan originations and securities holdings; |
| |
| ▪ | our ability to keep up with technological changes; |
| |
| ▪ | failure or breach of our operational or security systems or infrastructure, or those of our third party vendors or other service providers; |
| |
| ▪ | our ability to comply with the terms of loss sharing agreements with the FDIC; |
| |
| ▪ | the expiration of loss sharing agreements with the FDIC; |
| |
| ▪ | mergers and acquisitions, including costs or difficulties related to the integration of acquired companies and the wind-down of non-strategic operations that may be greater than expected; |
| |
| ▪ | the risk that exploring merger and acquisition opportunities may detract from management's time and ability to successfully manage our Company; |
| |
| ▪ | expected cost savings in connection with the consolidation of recent acquisitions may not be fully realized or realized within the expected time frames, and deposit attrition, customer loss and revenue loss following completed acquisitions may be greater than expected; |
| |
| ▪ | our ability to increase market share and control expenses; |
| |
| ▪ | the effect of changes in accounting policies and practices, as may be adopted by the regulatory agencies as well as the Financial Accounting Standards Board and the SEC; |
| |
| ▪ | adverse changes in the creditworthiness of our borrowers and lessees, collateral values, the value of investment securities and asset recovery values, including the value of the FDIC indemnification asset and related assets covered by FDIC loss sharing agreements; |
| |
| ▪ | adverse changes in the securities, debt and/or derivatives markets; |
| |
| ▪ | our success in recruiting and retaining the necessary personnel to support business growth and expansion and maintain sufficient expertise to support increasingly complex products and services; |
| |
| ▪ | monetary and fiscal policies of the Board of Governors of the Federal Reserve System (Federal Reserve) and the U.S. government and other governmental initiatives affecting the financial services industry; |
| |
| ▪ | unpredictable natural or other disasters could have an adverse effect on us in that such events could materially disrupt our operations or our vendors' operations or willingness of our customers to access the financial services we offer; |
| |
| ▪ | our ability to manage loan delinquency and charge-off rates and changes in estimation of the adequacy of the allowance for loan losses; and |
46 First Financial Bancorp 2013 Annual Report
| |
| ▪ | the costs and effects of litigation and of unexpected or adverse outcomes in such litigation. |
Such forward-looking statements are meaningful only on the date when such statements are made, and First Financial undertakes no obligation to update any forward-looking statement to reflect events or circumstances after the date on which such a statement is made to reflect the occurrence of unanticipated events.
These and other risk factors are more fully described in First Financial's Annual Report on Form 10-K for the year ended December 31, 2013 under the section entitled “Item 1A. Risk Factors” and from time to time, in other filings with the SEC. Readers are cautioned not to place undue reliance on these forward-looking statements, which speak only as of the date of this report. Actual results may differ materially from those expressed in or implied by any forward-looking statements. Except to the extent required by applicable law or regulation, First Financial undertakes no obligation to revise or update publicly any forward-looking statements for any reason.
First Financial Bancorp 2013 Annual Report 47
|
| | | | | | | | | | | | | | | | | | | | | | | | | | | | | | | | |
| Statistical Information | | | | | | | | | | | | | | |
| | | | | | | | | | | | | | | | | | |
| | 2013 | | 2012 | | 2011 |
| (Dollars in thousands) | Average Balance | | Interest | | Average Yield | | Average Balance | | Interest | | Average Yield | | Average Balance | | Interest | | Average Yield |
| Earning assets | |
Loans (1), (4) | | | | | | | | | | | | | | | | | |
Commercial (2) | $ | 923,336 |
| | $ | 43,071 |
| | 4.66 | % | | $ | 827,205 |
| | $ | 41,628 |
| | 5.03 | % | | $ | 811,474 |
| | $ | 44,003 |
| | 5.42 | % |
| Real estate-construction | 86,832 |
| | 3,553 |
| | 4.09 | % | | 97,278 |
| | 3,830 |
| | 3.94 | % | | 143,751 |
| | 5,374 |
| | 3.74 | % |
| Real estate-commercial | 1,459,119 |
| | 63,192 |
| | 4.33 | % | | 1,303,155 |
| | 60,963 |
| | 4.68 | % | | 1,155,209 |
| | 59,905 |
| | 5.19 | % |
| Real estate-residential | 354,960 |
| | 13,547 |
| | 3.82 | % | | 315,651 |
| | 13,658 |
| | 4.33 | % | | 283,346 |
| | 13,389 |
| | 4.73 | % |
| Installment and other consumer | 455,204 |
| | 21,290 |
| | 4.68 | % | | 457,120 |
| | 21,824 |
| | 4.77 | % | | 443,054 |
| | 21,087 |
| | 4.76 | % |
Lease financing (2) | 66,317 |
| | 2,702 |
| | 4.07 | % | | 29,899 |
| | 1,420 |
| | 4.75 | % | | 10,536 |
| | 628 |
| | 5.96 | % |
| Total loans, excluding covered loans | 3,345,768 |
| | 147,355 |
| | 4.40 | % | | 3,030,308 |
| | 143,323 |
| | 4.73 | % | | 2,847,370 |
| | 144,386 |
| | 5.07 | % |
| Covered loans and indemnification asset | 704,894 |
| | 62,128 |
| | 8.81 | % | | 1,050,114 |
| | 99,755 |
| | 9.50 | % | | 1,443,365 |
| | 134,861 |
| | 9.34 | % |
Investment securities (3) | | | | | | | | | | | | | | | | | |
| Taxable | 1,597,763 |
| | 34,147 |
| | 2.14 | % | | 1,657,183 |
| | 37,664 |
| | 2.27 | % | | 1,134,780 |
| | 28,239 |
| | 2.49 | % |
Tax-exempt (2) | 98,448 |
| | 3,693 |
| | 3.75 | % | | 25,638 |
| | 1,132 |
| | 4.42 | % | | 14,992 |
| | 1,180 |
| | 7.87 | % |
Total investment securities (3) | 1,696,211 |
| | 37,840 |
| | 2.23 | % | | 1,682,821 |
| | 38,796 |
| | 2.31 | % | | 1,149,772 |
| | 29,419 |
| | 2.56 | % |
| Interest-bearing deposits with other banks | 6,464 |
| | 27 |
| | 0.42 | % | | 36,674 |
| | 111 |
| | 0.30 | % | | 361,591 |
| | 1,130 |
| | 0.31 | % |
| Total earning assets | 5,753,337 |
| | 247,350 |
| | 4.30 | % | | 5,799,917 |
| | 281,985 |
| | 4.86 | % | | 5,802,098 |
| | 309,796 |
| | 5.34 | % |
| | | | | | | | | | | | | | | | | | |
| Nonearning assets | | | | | | | | | | | | | | | | | |
| Allowance for loan and lease losses | (84,033 | ) | | | | | | (100,089 | ) | | | | | | (97,826 | ) | | | | |
| Cash and due from banks | 115,486 |
| | | | | | 120,492 |
| | | | | | 115,692 |
| | | | |
| Accrued interest and other assets | 496,621 |
| | | | | | 497,861 |
| | | | | | 464,997 |
| | | | |
| Total assets | $ | 6,281,411 |
| | | | | | $ | 6,318,181 |
| | | | | | $ | 6,284,961 |
| | | | |
| | | | | | | | | | | | | | | | | | |
| Interest-bearing liabilities | | | | | | | | | | | | | | | | | |
| Deposits | | | | | | | | | | | | | | | | | |
| Interest-bearing demand | $ | 1,125,836 |
| | 1,456 |
| | 0.13 | % | | $ | 1,196,764 |
| | 1,506 |
| | 0.13 | % | | $ | 1,191,064 |
| | 2,954 |
| | 0.25 | % |
| Savings | 1,626,025 |
| | 1,810 |
| | 0.11 | % | | 1,630,426 |
| | 2,006 |
| | 0.12 | % | | 1,624,840 |
| | 5,806 |
| | 0.36 | % |
| Time | 986,085 |
| | 9,981 |
| | 1.01 | % | | 1,341,985 |
| | 21,113 |
| | 1.57 | % | | 1,642,108 |
| | 32,021 |
| | 1.95 | % |
| Total interest-bearing deposits | 3,737,946 |
| | 13,247 |
| | 0.35 | % | | 4,169,175 |
| | 24,625 |
| | 0.59 | % | | 4,458,012 |
| | 40,781 |
| | 0.91 | % |
| Borrowed funds | | | | | | | | | | | | | | | | | |
| Short-term borrowings | 587,548 |
| | 1,177 |
| | 0.20 | % | | 198,275 |
| | 262 |
| | 0.13 | % | | 96,060 |
| | 163 |
| | 0.17 | % |
| Long-term debt | 69,717 |
| | 2,464 |
| | 3.53 | % | | 75,523 |
| | 2,702 |
| | 3.58 | % | | 98,185 |
| | 3,586 |
| | 3.65 | % |
| Other long-term debt | 0 |
| | 0 |
| | N/M |
| | 0 |
| | 0 |
| | N/M |
| | 10,169 |
| | 391 |
| | 3.85 | % |
| Total borrowed funds | 657,265 |
| | 3,641 |
| | 0.55 | % | | 273,798 |
| | 2,964 |
| | 1.08 | % | | 204,414 |
| | 4,140 |
| | 2.03 | % |
| Total interest-bearing liabilities | 4,395,211 |
| | 16,888 |
| | 0.38 | % | | 4,442,973 |
| | 27,589 |
| | 0.62 | % | | 4,662,426 |
| | 44,921 |
| | 0.96 | % |
| Noninterest-bearing liabilities | | | | | | | | | | | | | | | | | |
| Noninterest-bearing demand deposits | 1,078,800 |
| | | | | | 1,035,319 |
| | | | | | 766,366 |
| | | | |
| Other liabilities | 105,975 |
| | | | | | 126,172 |
| | | | | | 143,917 |
| | | | |
| Shareholders' equity | 701,425 |
| | | | | | 713,717 |
| | | | | | 712,252 |
| | | | |
| Total liabilities and shareholders' equity | $ | 6,281,411 |
| | | | | | $ | 6,318,181 |
| | | | | | $ | 6,284,961 |
| | | | |
| Net interest income and interest rate spread (fully tax equivalent) | | | $ | 230,462 |
| | 3.92 | % | | | | $ | 254,396 |
| | 4.24 | % | | | | $ | 264,875 |
| | 4.38 | % |
| Net interest margin (fully tax equivalent) | | | | | 4.01 | % | | | | | | 4.39 | % | | | | | | 4.57 | % |
| Interest income and yield | | | $ | 245,208 |
| | 4.26 | % | | | | $ | 280,930 |
| | 4.84 | % | | | | $ | 308,817 |
| | 5.32 | % |
| Interest expense and rate | | | 16,888 |
| | 0.38 | % | | | | 27,589 |
| | 0.62 | % | | | | 44,921 |
| | 0.96 | % |
| Net interest income and spread | | | $ | 228,320 |
| | 3.88 | % | | | | $ | 253,341 |
| | 4.22 | % | | | | $ | 263,896 |
| | 4.36 | % |
| Net interest margin | | | | | 3.97 | % | | | | | | 4.37 | % | | | | | | 4.55 | % |
| | | | | | | | | | | | | | | | | | |
(1) Nonaccrual loans are included in average loan balance and loan fees are included in interest income. | | | | | | |
(2) Interest income on tax-exempt investments and on certain tax-exempt loans and leases has been adjusted to a tax equivalent basis using a 35.00% tax rate. |
(3) Includes investment securities held-to-maturity, investment securities available-for-sale, investment securities trading and other investments. |
(4) Includes loans held-for-sale. | | | | | | | | | | | | | | | | | |
| N/M=Not meaningful | | | | | | | | | | | | | | | | | |
48 First Financial Bancorp 2013 Annual Report
Management’s Report On Internal Control Over Financial Reporting
First Financial’s management is responsible for establishing and maintaining adequate internal control over financial reporting. First Financial’s internal control over financial reporting is a process designed under the supervision of First Financial’s chief executive officer and chief financial officer to provide reasonable assurance regarding the reliability of financial reporting and the preparation of financial statements for external purposes in accordance with generally accepted accounting principles. Any system of internal control, no matter how well designed, has inherent limitations, including the possibility that a control can be circumvented or overridden and misstatements due to error or fraud may occur and not be detected. Also, because of changes in conditions, internal control effectiveness may vary over time. Accordingly, even an effective system of internal control will provide only reasonable assurance with respect to financial statement preparation. As of December 31, 2013, First Financial’s management, including the chief executive officer and the chief financial officer, evaluated the effectiveness of First Financial’s internal controls over financial reporting, using as its framework for that evaluation the Internal Control – Integrated Framework published by the Committee of Sponsoring Organizations (COSO) of the Treadway Commission (1992 framework). Based upon that evaluation, management believes that First Financial’s internal control over financial reporting is effective based on those criteria.
Ernst & Young LLP, the independent registered public accounting firm that audited the consolidated financial statements included in this Form 10-K, has issued an attestation report on First Financial’s internal control over financial reporting as of December 31, 2013. The report, which expresses an unqualified opinion on First Financial’s internal control over financial reporting as of December 31, 2013, is included in the information that follows under the heading “Report on Internal Control Over Financial Reporting.”
|
| | | |
| /s/ Claude E. Davis | | /s/ Anthony M. Stollings | |
President and Chief Executive Officer | | Executive Vice President, Chief Financial Officer and Chief Administrative Officer | |
| February 25, 2014 | | February 25, 2014 | |
First Financial Bancorp 2013 Annual Report 49
|
|
| Report of Independent Registered Public Accounting Firm |
Report On Internal Control Over Financial Reporting
The Board of Directors and Shareholders of First Financial Bancorp
We have audited First Financial Bancorp’s Internal Control Over Financial Reporting as of December 31, 2013, based on criteria established in Internal Control – Integrated Framework issued by the Committee of Sponsoring Organizations of the Treadway Commission (1992 framework) (the COSO criteria). First Financial Bancorp’s management is responsible for maintaining effective internal control over financial reporting, and for its assessment of the effectiveness of internal control over financial reporting included in the accompanying Management’s Report On Internal Control Over Financial Reporting. Our responsibility is to express an opinion on the Company’s internal control over financial reporting based on our audit.
We conducted our audit in accordance with the standards of the Public Company Accounting Oversight Board (United States). Those standards require that we plan and perform the audit to obtain reasonable assurance about whether effective internal control over financial reporting was maintained in all material respects. Our audit included obtaining an understanding of internal control over financial reporting, assessing the risk that a material weakness exists, testing and evaluating the design and operating effectiveness of internal control based on the assessed risk, and performing such other procedures as we considered necessary in the circumstances. We believe that our audit provides a reasonable basis for our opinion.
A company's internal control over financial reporting is a process designed to provide reasonable assurance regarding the reliability of financial reporting and the preparation of financial statements for external purposes in accordance with generally accepted accounting principles. A company's internal control over financial reporting includes those policies and procedures that (1) pertain to the maintenance of records that, in reasonable detail, accurately and fairly reflect the transactions and dispositions of the assets of the company; (2) provide reasonable assurance that transactions are recorded as necessary to permit preparation of financial statements in accordance with generally accepted accounting principles, and that receipts and expenditures of the company are being made only in accordance with authorizations of management and directors of the company; and (3) provide reasonable assurance regarding prevention or timely detection of unauthorized acquisition, use or disposition of the company's assets that could have a material effect on the financial statements.
Because of its inherent limitations, internal control over financial reporting may not prevent or detect misstatements. Also, projections of any evaluation of effectiveness to future periods are subject to the risk that controls may become inadequate because of changes in conditions, or that the degree of compliance with the policies or procedures may deteriorate.
In our opinion, First Financial Bancorp maintained, in all material respects, effective internal control over financial reporting as of December 31, 2013, based on the COSO criteria.
We also have audited, in accordance with the standards of the Public Company Accounting Oversight Board (United States), the consolidated balance sheets of First Financial Bancorp as of December 31, 2013 and 2012, and the related consolidated statements of income, comprehensive income, changes in shareholders’ equity, and cash flows for each of the three years in the period ended December 31, 2013, of First Financial Bancorp and our report dated February 25, 2014 expressed an unqualified opinion thereon.
.
|
| |
| Cincinnati, Ohio | |
| February 25, 2014 |
|
|
| Report Of Independent Registered Public Accounting Firm |
Report On Consolidated Financial Statements
The Board of Directors and Shareholders of First Financial Bancorp
We have audited the accompanying consolidated balance sheets of First Financial Bancorp as of December 31, 2013 and 2012, and the related consolidated statements of income, comprehensive income, changes in shareholders’ equity and cash flows for each of the three years in the period ended December 31, 2013. These financial statements are the responsibility of the Company’s management. Our responsibility is to express an opinion on these financial statements based on our audits.
We conducted our audits in accordance with the standards of the Public Company Accounting Oversight Board (United States). Those standards require that we plan and perform the audit to obtain reasonable assurance about whether the financial statements are free of material misstatement. An audit includes examining, on a test basis, evidence supporting the amounts and disclosures in the financial statements. An audit also includes assessing the accounting principles used and significant estimates made by management, as well as evaluating the overall financial statement presentation. We believe that our audits provide a reasonable basis for our opinion.
In our opinion, the financial statements referred to above present fairly, in all material respects, the consolidated financial position of First Financial Bancorp at December 31, 2013 and 2012, and the consolidated results of its operations and its cash flows for each of the three years in the period ended December 31, 2013, in conformity with U.S. generally accepted accounting principles.
We also have audited, in accordance with the standards of the Public Company Accounting Oversight Board (United States), First Financial Bancorp’s internal control over financial reporting as of December 31, 2013, based on criteria established in Internal Control – Integrated Framework issued by the Committee of Sponsoring Organizations of the Treadway Commission (1992 framework) and our report dated February 25, 2014 expressed an unqualified opinion thereon.
|
| |
| Cincinnati, Ohio | |
| February 25, 2014 |
50 First Financial Bancorp 2013 Annual Report
Consolidated Balance Sheets
|
| | | | | | | |
| | December 31, |
| (Dollars in thousands) | 2013 | | 2012 |
| Assets | | | |
| Cash and due from banks | $ | 117,620 |
| | $ | 134,502 |
|
| Interest-bearing deposits with other banks | 25,830 |
| | 24,341 |
|
| Investment securities available-for-sale, at market value (cost $945,052 at December 31, 2013 and $1,017,104 at December 31, 2012) | 913,601 |
| | 1,032,096 |
|
| Investment securities held-to-maturity (market value $824,985 at December 31, 2013 and $778,474 at December 31, 2012) | 837,272 |
| | 770,755 |
|
| Other investments | 47,427 |
| | 71,492 |
|
| Loans held for sale | 8,114 |
| | 16,256 |
|
| Loans: | |
| | |
|
| Commercial | 1,035,668 |
| | 861,033 |
|
| Real estate - construction | 80,741 |
| | 73,517 |
|
| Real estate - commercial | 1,496,987 |
| | 1,417,008 |
|
| Real estate - residential | 352,931 |
| | 318,210 |
|
| Installment | 47,133 |
| | 56,810 |
|
| Home equity | 376,454 |
| | 367,500 |
|
| Credit card | 35,592 |
| | 34,198 |
|
| Lease financing | 80,135 |
| | 50,788 |
|
| Total loans, excluding covered loans | 3,505,641 |
| | 3,179,064 |
|
| Less: Allowance for loan and lease losses - uncovered | 43,829 |
| | 47,777 |
|
| Net loans - excluding covered loans | 3,461,812 |
| | 3,131,287 |
|
| Covered loans | 457,873 |
| | 748,116 |
|
| Less: Allowance for loan and lease losses - covered | 18,901 |
| | 45,190 |
|
| Net loans – covered | 438,972 |
| | 702,926 |
|
| Total net loans | 3,900,784 |
| | 3,834,213 |
|
| Premises and equipment | 137,110 |
| | 146,716 |
|
| Goodwill | 95,050 |
| | 95,050 |
|
| Other intangibles | 5,924 |
| | 7,648 |
|
| FDIC indemnification asset | 45,091 |
| | 119,607 |
|
| Accrued interest and other assets | 283,390 |
| | 244,372 |
|
| Total assets | $ | 6,417,213 |
| | $ | 6,497,048 |
|
| | | | |
| Liabilities | |
| | |
|
| Deposits: | |
| | |
|
| Interest-bearing demand | $ | 1,125,723 |
| | $ | 1,160,815 |
|
| Savings | 1,612,005 |
| | 1,623,614 |
|
| Time | 952,327 |
| | 1,068,637 |
|
| Total interest-bearing deposits | 3,690,055 |
| | 3,853,066 |
|
| Noninterest-bearing | 1,147,452 |
| | 1,102,774 |
|
| Total deposits | 4,837,507 |
| | 4,955,840 |
|
| Federal funds purchased and securities sold under agreements to repurchase | 94,749 |
| | 122,570 |
|
| Federal Home Loan Bank short-term borrowings | 654,000 |
| | 502,000 |
|
| Total short-term borrowings | 748,749 |
| | 624,570 |
|
| Long-term debt | 60,780 |
| | 75,202 |
|
| Total borrowed funds | 809,529 |
| | 699,772 |
|
| Accrued interest and other liabilities | 88,016 |
| | 131,011 |
|
| Total liabilities | 5,735,052 |
| | 5,786,623 |
|
| | | | |
| Shareholders' equity | |
| | |
|
| Common stock - no par value | |
| | |
|
| Authorized - 160,000,000 shares Issued - 68,730,731 shares in 2013 and 2012 | 577,076 |
| | 579,293 |
|
| Retained earnings | 324,192 |
| | 330,004 |
|
| Accumulated other comprehensive loss | (31,281 | ) | | (18,677 | ) |
| Treasury stock, at cost, 11,197,685 shares in 2013 and 10,684,496 shares in 2012 | (187,826 | ) | | (180,195 | ) |
| Total shareholders' equity | 682,161 |
| | 710,425 |
|
| Total liabilities and shareholders' equity | $ | 6,417,213 |
| | $ | 6,497,048 |
|
See Notes to Consolidated Financial Statements.
First Financial Bancorp 2013 Annual Report 51
Consolidated Statements of Income
|
| | | | | | | | | | | |
| | Years ended December 31, |
| (Dollars in thousands except per share data) | 2013 | | 2012 | | 2011 |
| Interest income | | | | | |
| Loans, including fees | $ | 216,306 |
| | $ | 249,751 |
| | $ | 285,689 |
|
| Investment securities | |
| | | | |
|
| Taxable | 34,147 |
| | 37,664 |
| | 28,239 |
|
| Tax-exempt | 2,400 |
| | 736 |
| | 767 |
|
| Total investment securities interest | 36,547 |
| | 38,400 |
| | 29,006 |
|
| Other earning assets | (7,645 | ) | | (7,221 | ) | | (5,878 | ) |
| Total interest income | 245,208 |
| | 280,930 |
| | 308,817 |
|
| Interest expense | |
| | |
| | |
| Deposits | 13,247 |
| | 24,625 |
| | 40,781 |
|
| Short-term borrowings | 1,177 |
| | 262 |
| | 163 |
|
| Long-term borrowings | 2,464 |
| | 2,702 |
| | 3,586 |
|
| Subordinated debentures and capital securities | 0 |
| | 0 |
| | 391 |
|
| Total interest expense | 16,888 |
| | 27,589 |
| | 44,921 |
|
| Net interest income | 228,320 |
| | 253,341 |
| | 263,896 |
|
| Provision for loan and lease losses - uncovered | 8,714 |
| | 19,117 |
| | 19,210 |
|
| Provision for loan and lease losses - covered | 195 |
| | 30,903 |
| | 64,081 |
|
| Net interest income after provision for loan and lease losses | 219,411 |
| | 203,321 |
| | 180,605 |
|
| | | | | | |
| Noninterest income | |
| | |
| | |
| Service charges on deposit accounts | 20,595 |
| | 21,215 |
| | 19,206 |
|
| Trust and wealth management fees | 14,319 |
| | 13,951 |
| | 14,340 |
|
| Bankcard income | 10,914 |
| | 10,028 |
| | 9,291 |
|
| Net gains from sales of loans | 3,150 |
| | 4,570 |
| | 4,258 |
|
| Gains on sales of investment securities | 1,724 |
| | 3,628 |
| | 2,541 |
|
| FDIC loss sharing income | 3,720 |
| | 35,346 |
| | 60,888 |
|
| Accelerated discount on covered loans | 7,153 |
| | 13,662 |
| | 20,521 |
|
| Other | 12,072 |
| | 20,021 |
| | 11,486 |
|
| Total noninterest income | 73,647 |
| | 122,421 |
| | 142,531 |
|
| | | | | | |
| Noninterest expenses | |
| | |
| | |
| Salaries and employee benefits | 101,402 |
| | 113,154 |
| | 106,914 |
|
| Pension settlement charges | 6,174 |
| | 0 |
| | 0 |
|
| Net occupancy | 21,207 |
| | 20,682 |
| | 21,410 |
|
| Furniture and equipment | 8,970 |
| | 9,190 |
| | 9,945 |
|
| Data processing | 10,229 |
| | 8,837 |
| | 5,716 |
|
| Marketing | 4,270 |
| | 5,550 |
| | 5,794 |
|
| Communication | 3,207 |
| | 3,409 |
| | 3,203 |
|
| Professional services | 6,876 |
| | 7,269 |
| | 9,636 |
|
| State intangible tax | 3,929 |
| | 3,899 |
| | 3,583 |
|
| FDIC assessments | 4,501 |
| | 4,682 |
| | 5,676 |
|
| Loss (gain) - other real estate owned | 1,250 |
| | 3,250 |
| | 3,971 |
|
| Loss (gain) - covered other real estate owned | (1,219 | ) | | 2,446 |
| | 9,224 |
|
| Loss sharing expense | 7,083 |
| | 10,725 |
| | 3,600 |
|
| FDIC indemnification impairment | 22,417 |
| | 0 |
| | 0 |
|
| Other | 25,179 |
| | 28,904 |
| | 29,425 |
|
| Total noninterest expenses | 225,475 |
| | 221,997 |
| | 218,097 |
|
| Income before income taxes | 67,583 |
| | 103,745 |
| | 105,039 |
|
| Income tax expense | 19,234 |
| | 36,442 |
| | 38,300 |
|
| Net income | $ | 48,349 |
| | $ | 67,303 |
| | $ | 66,739 |
|
| | | | | | |
| Earnings per common share | | | | | |
| Basic | $ | 0.84 |
| | $ | 1.16 |
| | $ | 1.16 |
|
| Diluted | $ | 0.83 |
| | $ | 1.14 |
| | $ | 1.14 |
|
| Average common shares outstanding-basic | 57,270,233 |
| | 57,876,685 |
| | 57,691,979 |
|
| Average common shares outstanding-diluted | 58,073,054 |
| | 58,868,792 |
| | 58,693,205 |
|
See Notes to Consolidated Financial Statements.
52 First Financial Bancorp 2013 Annual Report
Consolidated Statements of Comprehensive Income
|
| | | | | | | | | | | |
| | Years ended December 31, |
| (Dollars in thousands except per share data) | 2013 | | 2012 | | 2011 |
| Net income | $ | 48,349 |
| | $ | 67,303 |
| | $ | 66,739 |
|
| Other comprehensive income, net of tax: | | | | | |
| Unrealized gains (losses) on investment securities arising during the period | (29,091 | ) | | 133 |
| | 3,605 |
|
| Change in retirement obligation | 15,773 |
| | 2,798 |
| | (12,854 | ) |
| Unrealized gain (loss) on derivatives | 745 |
| | (143 | ) | | 391 |
|
| Unrealized gain (loss) on foreign currency exchange | (31 | ) | | 25 |
| | (588 | ) |
| Other comprehensive income (loss) | (12,604 | ) | | 2,813 |
| | (9,446 | ) |
| Comprehensive income | $ | 35,745 |
| | $ | 70,116 |
| | $ | 57,293 |
|
See Notes to Consolidated Financial Statements.
First Financial Bancorp 2013 Annual Report 53
Consolidated Statements of Changes in Shareholders' Equity
|
| | | | | | | | | | | | | | | | | | | | | | | | | |
| | Common Stock | | Common Stock | | Retained | | Accumulated other comprehensive | | Treasury stock | | |
| (Dollars in thousands, except share amounts) | Shares | | Amount | | earnings | | income (loss) | | Shares | | Amount | | Total |
| Balances at January 1, 2011 | 68,730,731 |
| | $ | 580,097 |
| | $ | 310,271 |
| | $ | (12,044 | ) | | (10,665,754 | ) | | $ | (180,930 | ) | | $ | 697,394 |
|
| | | | | | | | | | | | | | |
| Net income | |
| | |
| | 66,739 |
| | |
| | |
| | |
| | 66,739 |
|
| Other comprehensive loss | |
| | |
| | |
| | (9,446 | ) | | |
| | |
| | (9,446 | ) |
| Cash dividends declared: | |
| | |
| | |
| | |
| | |
| | |
| | |
| Common stock at $0.78 per share | |
| | |
| | (45,659 | ) | | |
| | |
| | |
| | (45,659 | ) |
| Excess tax benefit on share-based compensation | |
| | 259 |
| | |
| | |
| | |
| | |
| | 259 |
|
| Exercise of stock options, net of shares purchased | | | (485 | ) | | | | | | 23,492 |
| | 398 |
| | (87 | ) |
| Restricted stock awards, net of forfeitures | |
| | (3,935 | ) | | |
| | |
| | 178,585 |
| | 3,021 |
| | (914 | ) |
| Share-based compensation expense | |
| | 3,935 |
| | |
| | |
| | |
| | |
| | 3,935 |
|
| Balances at December 31, 2011 | 68,730,731 |
| | 579,871 |
| | 331,351 |
| | (21,490 | ) | | (10,463,677 | ) | | (177,511 | ) | | 712,221 |
|
| | | | | | | | | | | | | | |
| Net income | | | | | 67,303 |
| | | | | | | | 67,303 |
|
| Other comprehensive loss | | | | | | | 2,813 |
| | | | | | 2,813 |
|
| Cash dividends declared: | | | | | | | | | | | | | |
| Common stock at $1.18 per share | | | | | (68,650 | ) | | | | | | | | (68,650 | ) |
| Purchase of common stock | | | | | | | | | (460,500 | ) | | (6,806 | ) | | (6,806 | ) |
| Excess tax benefit on share-based compensation | | | 438 |
| | | | | | | | | | 438 |
|
| Exercise of stock options, net of shares purchased | | | (1,280 | ) | | | | | | 75,232 |
| | 1,276 |
| | (4 | ) |
| Restricted stock awards, net of forfeitures | | | (3,922 | ) | | | | | | 164,449 |
| | 2,846 |
| | (1,076 | ) |
| Share-based compensation expense | | | 4,186 |
| | | | | | | | | | 4,186 |
|
| Balances at December 31, 2012 | 68,730,731 |
| | 579,293 |
| | 330,004 |
| | (18,677 | ) | | (10,684,496 | ) | | (180,195 | ) | | 710,425 |
|
| | | | | | | | | | | | | | |
| Net income | | | | | 48,349 |
| | | | | | | | 48,349 |
|
| Other comprehensive income | | | | | | | (12,604 | ) | | | | | | (12,604 | ) |
| Cash dividends declared: | | | | | | | | | | | | | |
| Common stock at $0.94 per share | | | | | (54,161 | ) | | | | | | | | (54,161 | ) |
| Purchase of common stock | | | | | | | | | (750,145 | ) | | (11,778 | ) | | (11,778 | ) |
| Excess tax benefit on share-based compensation | | | 686 |
| | | | | | | | | | 686 |
|
| Exercise of stock options, net of shares purchased | | | (3,271 | ) | | | | | | 121,597 |
| | 2,041 |
| | (1,230 | ) |
| Restricted stock awards, net of forfeitures | | | (3,435 | ) | | | | | | 115,359 |
| | 2,106 |
| | (1,329 | ) |
| Share-based compensation expense | | | 3,803 |
| | | | | | | | | | 3,803 |
|
| Balances at December 31, 2013 | 68,730,731 |
| | $ | 577,076 |
| | $ | 324,192 |
| | $ | (31,281 | ) | | (11,197,685 | ) | | $ | (187,826 | ) | | $ | 682,161 |
|
See Notes to Consolidated Financial Statements.
54 First Financial Bancorp 2013 Annual Report
Consolidated Statements of Cash Flows
|
| | | | | | | | | | | |
| | Year ended December 31, |
| (Dollars in thousands) | 2013 | | 2012 | | 2011 |
| Operating activities | | | | | |
| Net income | $ | 48,349 |
| | $ | 67,303 |
| | $ | 66,739 |
|
| Adjustments to reconcile net income to net cash provided by operating activities: | |
| | | | |
| Provision for loan and lease losses | 8,909 |
| | 50,020 |
| | 83,291 |
|
| Depreciation and amortization | 14,270 |
| | 15,833 |
| | 11,951 |
|
| Stock-based compensation expense | 3,803 |
| | 4,186 |
| | 3,935 |
|
| Pension expense (income) | 5,496 |
| | (481 | ) | | (1,349 | ) |
| Net amortization of premiums/accretion of discounts on investment securities | 13,088 |
| | 12,171 |
| | 5,224 |
|
| Gains on sales of investments securities | (1,724 | ) | | (3,628 | ) | | (2,541 | ) |
| Originations of loans held for sale | (152,324 | ) | | (223,075 | ) | | (157,825 | ) |
| Net gains from sales of loans held for sale | (3,150 | ) | | (4,570 | ) | | (4,258 | ) |
| Proceeds from sales of loans held for sale | 158,853 |
| | 232,523 |
| | 166,541 |
|
| Deferred income taxes | (25,328 | ) | | (14,085 | ) | | (14,463 | ) |
| (Increase) decrease in interest receivable | (1,181 | ) | | 3,267 |
| | (1,438 | ) |
| (Increase) decrease in cash surrender value of life insurance | (4,187 | ) | | 1,422 |
| | (805 | ) |
| Decrease in prepaid expenses | 495 |
| | 5,321 |
| | 6,230 |
|
| Decrease in indemnification asset | 74,516 |
| | 53,402 |
| | 49,639 |
|
| (Decrease) increase in accrued expenses | (1,536 | ) | | 3,374 |
| | (17,422 | ) |
| Decrease in interest payable | (350 | ) | | (1,686 | ) | | (1,853 | ) |
| Other | 26,355 |
| | 10,537 |
| | 11,482 |
|
| Net cash provided by operating activities | 164,354 |
| | 211,834 |
| | 203,078 |
|
| | | | | | |
| Investing activities | |
| | |
| | |
|
| Proceeds from sales of investment securities available-for-sale | 92,684 |
| | 240,316 |
| | 165,153 |
|
| Proceeds from calls, paydowns and maturities of securities available-for-sale | 186,820 |
| | 269,236 |
| | 342,973 |
|
| Purchases of securities available-for-sale | (214,398 | ) | | (1,022,772 | ) | | (1,027,754 | ) |
| Proceeds from calls, paydowns and maturities of securities held-to-maturity | 157,647 |
| | 154,071 |
| | 12,002 |
|
| Purchases of securities held-to-maturity | (233,111 | ) | | (7,521 | ) | | 0 |
|
| Net (increase) decrease in interest-bearing deposits with other banks | (1,489 | ) | | 351,057 |
| | (198,446 | ) |
| Net increase in loans and leases, excluding covered loans | (347,451 | ) | | (240,113 | ) | | (53,946 | ) |
| Net decrease in covered assets | 239,034 |
| | 255,905 |
| | 340,877 |
|
| Proceeds from disposal of other real estate owned | 27,319 |
| | 35,357 |
| | 40,994 |
|
| Purchases of premises and equipment | (7,295 | ) | | (25,502 | ) | | (23,541 | ) |
| Net cash acquired from acquisition | 0 |
| | 0 |
| | 620,640 |
|
| Net cash (used in) provided by investing activities | (100,240 | ) | | 10,034 |
| | 218,952 |
|
| | | | | | |
| Financing activities | |
| | |
| | |
|
| Net decrease in total deposits | (118,333 | ) | | (687,000 | ) | | (310,029 | ) |
| Net increase in short-term borrowings | 124,179 |
| | 525,139 |
| | 39,589 |
|
| Payments on long-term borrowings | (14,394 | ) | | (1,313 | ) | | (52,308 | ) |
| Redemption of other long-term debt | 0 |
| | 0 |
| | (20,620 | ) |
| Cash dividends paid on common stock | (61,429 | ) | | (67,797 | ) | | (35,312 | ) |
| Treasury stock purchase | (11,778 | ) | | (6,806 | ) | | 0 |
|
| Proceeds from exercise of stock options | 73 |
| | 320 |
| | 63 |
|
| Excess tax benefit on share-based compensation | 686 |
| | 438 |
| | 259 |
|
| Net cash used in financing activities | (80,996 | ) | | (237,019 | ) | | (378,358 | ) |
| | | | | | |
| Cash and Due from Banks | |
| | |
| | |
|
| Net (decrease) increase in Cash and Due from Banks | (16,882 | ) | | (15,151 | ) | | 43,672 |
|
| Cash and Due from Banks at beginning of year | 134,502 |
| | 149,653 |
| | 105,981 |
|
| Cash and Due from Banks at end of year | $ | 117,620 |
| | $ | 134,502 |
| | $ | 149,653 |
|
First Financial Bancorp 2013 Annual Report 55
Consolidated Statements of Cash Flows (continued)
|
| | | | | | | | | | | |
| Supplemental disclosures | | | | | |
| Interest paid | $ | 17,238 |
| | $ | 29,276 |
| | $ | 46,774 |
|
| Income taxes paid | $ | 36,312 |
| | $ | 54,685 |
| | $ | 60,438 |
|
| Acquisition of other real estate owned through foreclosure | $ | 37,700 |
| | $ | 29,956 |
| | $ | 53,865 |
|
| Issuance of restricted stock awards | $ | 4,730 |
| | $ | 4,943 |
| | $ | 4,188 |
|
| | | | | | |
| Supplemental schedule for investing activities | | | | | |
| Acquisitions | | | | | |
| Assets acquired - banking center acquisitions | $ | 0 |
| | $ | 0 |
| | $ | 765,125 |
|
| Liabilities assumed - banking center acquisitions | 0 |
| | 0 |
| | 808,355 |
|
| Goodwill | $ | 0 |
| | $ | 0 |
| | $ | 43,230 |
|
See Notes to Consolidated Financial Statements.
56 First Financial Bancorp 2013 Annual Report
Notes To Consolidated Financial Statements
1. Summary Of Significant Accounting Policies
Basis of presentation. The Consolidated Financial Statements of First Financial Bancorp. (First Financial or the Company), a bank holding company, principally serving Ohio, Indiana and Kentucky, include the accounts and operations of First Financial and its wholly owned subsidiary, First Financial Bank, N.A. (First Financial Bank or the Bank). All significant intercompany transactions and accounts have been eliminated in consolidation. Certain reclassifications of prior years' amounts have been made to conform to current year presentation. Such reclassifications had no effect on net earnings.
Use of estimates. The preparation of Consolidated Financial Statements in conformity with U.S. Generally Accepted Accounting Principles (GAAP) requires management to make estimates, assumptions and judgments that affect the amounts reported in the Consolidated Financial Statements and accompanying Notes. Actual realized amounts could differ materially from those estimates.
Investment securities. First Financial classifies debt and equity securities into three categories: trading, held-to-maturity and available-for-sale. Management determines the appropriate classification of investment securities at the time of purchase and reevaluates such designation as appropriate.
Investment securities are classified as held-to-maturity when First Financial has the positive intent and ability to hold the securities to maturity. Held-to-maturity securities are recorded at amortized cost.
Investment securities classified as trading are held principally for resale in the near term and are recorded at fair value. Gains or losses, either unrealized or realized, are reported in noninterest income. Quoted market prices are used to determine the fair value of trading securities.
Investment securities not classified as either held-to-maturity or trading are classified as available-for-sale. Available-for-sale securities are recorded at fair value, with the unrealized gains and losses, net of tax, reported as a separate component of accumulated other comprehensive income (loss) in shareholders' equity.
The amortized cost of investment securities classified as either held-to-maturity or available-for-sale is adjusted for amortization of premiums and accretion of discounts to maturity, or in the case of mortgage-backed securities, over the estimated life of the security. Such amortization is considered an adjustment to the yield on the security and included in interest income from investments. Interest and dividends are included in interest income from investment securities.
Realized gains and losses are based on amortized cost of the security sold using the specific identification method. Available-for-sale and held-to-maturity securities are reviewed quarterly for potential impairment. In performing this review, management considers the length of time and extent to which the fair value of the security has been less than amortized cost, the financial condition and near-term prospects of the issuer and the ability and intent of First Financial to hold the security for a period sufficient to allow for any anticipated recovery in fair value. If the fair value of a security is less than the amortized cost and the impairment is determined to be other-than-temporary, the security is written down, establishing a new and reduced cost basis. The related charge is recorded in the Consolidated Statements of Income.
Other investments include holdings in Federal Reserve Bank (FRB) stock and Federal Home Loan Bank (FHLB) stock. FRB and FHLB stock are both carried at cost.
Loans held for sale. Loans held for sale may come from residential real estate loans newly originated for the purpose of sale to third parties, and in certain circumstances, loans previously originated that have been specifically identified by management for sale based on predetermined criteria. Loans originated for sale are immediately classified as held for sale upon origination and are considered to be at fair market value due to the commitment to sell in a short timeframe. Loans transferred to held for sale status are carried at the lower of cost or fair value with any difference charged to the allowance for loan and lease losses. Any subsequent change in the carrying value of transferred loans, not to exceed original cost, is recorded in the Consolidated Statements of Income.
Loans and leases, excluding covered loans. Loans and leases for which First Financial has the intent and ability to hold for the foreseeable future, or until maturity or payoff, are classified in the Consolidated Balance Sheets as loans and leases. Except for loans which are subject to fair value requirements, loans and leases are carried at the principal amount outstanding, net of unamortized deferred loan origination fees and costs, and net of unearned income. Loan origination and commitment fees
First Financial Bancorp 2013 Annual Report 57
Notes To Consolidated Financial Statements
received, as well as certain direct loan origination costs paid, are deferred, and the net amount is amortized as an adjustment to the related loan's yield. Interest income is recorded on an accrual basis. When a loan is placed on nonaccrual status, the accrual of interest income is discontinued and previously accrued, but unpaid, interest is reversed. Any payments received while a loan is on nonaccrual status are applied as a reduction to the carrying value of the loan. A loan may be placed back on accrual status if collection of future principal and interest payments is no longer doubtful.
Allowance for loan and lease losses, excluding covered loans. For each reporting period, management maintains the allowance for loan and lease losses at a level that it considers sufficient to absorb probable loan and lease losses inherent in the portfolio. Management determines the adequacy of the allowance based on historical loss experience as well as other significant factors such as composition of the portfolio, economic conditions, geographic footprint, the results of periodic internal and external evaluations of delinquent, nonaccrual and classified loans and any other adverse situations that may affect a specific borrower's ability to repay (including the timing of future payments). This evaluation is inherently subjective as it requires utilizing material estimates that may be susceptible to significant change.
Management's determination of the adequacy of the allowance is based on an assessment of the probable loan and lease losses inherent in the portfolio given the conditions at the time. The allowance is generally increased by provision expense and decreased by actual charge-offs, net of recoveries of amounts previously charged-off. Loans are charged off when management believes that the collection of the principal amount owed in full, either through payments from the borrower or from the liquidation of collateral, is unlikely.
In the commercial portfolio, which includes time and demand notes, tax-exempt loans, construction and commercial real estate loans, loan relationships greater than $250,000 that are considered impaired, or designated as a troubled debt restructuring (TDR), are evaluated to determine the need for a specific allowance based on the borrower's overall financial condition, resources, payment record, guarantor support and the realizable value of any collateral.
The allowance for non-impaired commercial loans and impaired commercial loan relationships less than $250,000 includes a process of estimating the probable losses inherent in the portfolio by loan type, based on First Financial's internal system of credit risk ratings and historical loss data. These estimates may also be adjusted for management's estimate of probable losses dependent upon trends in the values of the underlying collateral, delinquent and nonaccrual loans, prevailing economic conditions, changes in lending strategies and other influencing factors.
Consumer loans are generally evaluated by loan type, as these loans exhibit homogeneous characteristics. The allowance for consumer loans, which includes residential real estate, installment, home equity, credit card loans and overdrafts, is established by estimating losses inherent in each particular category of consumer loans. The estimate of losses is primarily based on historical loss rates for each category, as well as trends in delinquent and nonaccrual loans, prevailing economic conditions and other significant influencing factors. Consumer loans greater than $100,000 classified as TDRs are individually evaluated to determine an appropriate allowance.
Covered loans. Loans acquired in Federal Deposit Insurance Corporation (FDIC)-assisted transactions that are initially covered under loss sharing agreements are referred to as covered loans. Covered loans were recorded at their estimated fair value at the time of acquisition. Estimated fair values for covered loans were based on a discounted cash flow methodology that considered various factors including the type of loan and related collateral, classification status, interest rate, term of loan, whether or not the loan was amortizing and a discount rate reflecting the Company's assessment of risk inherent in the cash flow estimates. Covered loans were grouped together according to similar characteristics and were treated in the aggregate when applying various valuation techniques.
First Financial evaluates acquired purchased loans for impairment in accordance with the provisions of FASB Accounting Standards Codification (ASC) Topic 310-30, Loans and Debt Securities Acquired with Deteriorated Credit Quality. First Financial accounts for covered loans under FASB ASC Topic 310-30 except for loans with revolving privileges, which are outside the scope of this guidance, and loans for which cash flows could not be estimated, which are accounted for under the cost recovery method. Loans accounted for under FASB ASC Topic 310-30 are referred to as purchased impaired loans. Interest income, through accretion of the difference between the carrying value of the loans and the expected cash flows (accretable difference) is recognized on all covered purchased impaired loans.
For purposes of applying the guidance under FASB ASC Topic 310-30, First Financial groups acquired loans into pools based on common risk characteristics. Expected cash flows are re-estimated periodically for all purchased impaired loans. The cash flows expected to be collected are estimated based upon the expected remaining life of the underlying loans, which includes the effects of estimated prepayments. Generally, a decline in expected cash flows for a pool of loans is referred to as impairment and recorded as provision expense on a discounted basis during the period (see "Allowance for loan and lease losses - covered
58 First Financial Bancorp 2013 Annual Report
loans" below). Improvement in expected cash flows for a pool of loans, once any previously recorded impairment is recaptured, is recognized prospectively as an adjustment to the yield on the loans in the pool. These cash flow evaluations are inherently subjective as they require material estimates, all of which may be susceptible to significant change.
In addition to the accretion income discussed above, covered loans impact noninterest income as well. For covered loans that prepay, noninterest income may be recorded related to the accelerated recognition of the remaining purchase discount that would have been recognized over the life of the loan had it not prepaid offset by a related adjustment to the FDIC indemnification asset. This scenario can occur either through a loan sale or ordinary prepayments that are typical in a loan portfolio.
Covered loans outside the scope of FASB ASC Topic 310-30 are accounted for under FASB ASC Topic 310-20, Receivables-Nonrefundable Fees and Costs. Discounts created when the loans were recorded at their estimated fair values at acquisition are amortized over the remaining term of the loan as an adjustment to the related loan's yield. The accrual of interest income is discontinued when the collection of a loan or interest, in whole or in part, is doubtful.
Allowance for loan and lease losses, covered loans. First Financial maintains an allowance for loan and lease losses on covered loans. For loans accounted for under FASB ASC Topic 310-30, expected cash flows are re-estimated periodically with any decline in pool level expected cash flows recorded as provision expense on a discounted basis during the period. These cash flow evaluations are inherently subjective as they require material estimates, all of which may be susceptible to significant change. The related, estimated reimbursement on covered loan losses due from the FDIC under loss sharing agreements is recorded as both FDIC loss sharing income and an increase to the FDIC indemnification asset.
FDIC indemnification asset. The FDIC indemnification asset results from the loss sharing agreements entered into in conjunction with First Financial's FDIC-assisted transactions and is measured separately from the related assets covered by loss sharing agreements with the FDIC (covered assets), as it is not contractually embedded in those assets and is not transferable should First Financial choose to dispose of the covered assets. The FDIC indemnification asset represents expected reimbursements from the FDIC for losses on covered loans. Pursuant to the terms of the loss sharing agreements, covered loans are subject to stated loss thresholds whereby the FDIC will reimburse First Financial for 80% of losses up to the stated loss thresholds, and 95% of losses in excess of the thresholds. The FDIC indemnification asset was recorded at its estimated fair value at the time of the FDIC-assisted transactions. Fair values were estimated using projected cash flows related to the loss sharing agreements based on the expected reimbursements for losses and the applicable loss sharing percentages. These cash flows were discounted to reflect the uncertainty of the timing of the loss sharing reimbursement from the FDIC.
The accounting for FDIC indemnification assets is closely related to the accounting for the underlying, indemnified assets as well as on-going assessment of the collectibility of the assets. First Financial re-estimates the expected indemnification asset cash flows in conjunction with the periodic re-estimation of cash flows on covered loans accounted for under FASB ASC Topic 310-30. Improvements in cash flow expectations on covered loans generally result in a related decline in the expected indemnification cash flows and are reflected as a yield adjustment on the indemnification asset. Declines in cash flow expectations on covered loans generally result in an increase in expected indemnification cash flows and are reflected as both FDIC loss sharing income and an increase to the indemnification asset. The collectibility assessment includes evaluation of claims activity with the FDIC, adjustments to the indemnification asset from the accelerated discount on covered loans, the yield on the indemnification asset in relation to the yield on the underlying covered loans and the remaining term of the loss sharing agreements.
Premises and equipment. Premises and equipment are stated at cost, less accumulated depreciation and amortization. Depreciation and amortization are principally computed on the straight-line method over the estimated useful lives of the assets. Useful lives generally range from 10 to 40 years for building and building improvements; 3 to 10 years for furniture, fixtures and equipment; and 3 to 5 years for software, hardware and data handling equipment. Land improvements are depreciated over 20 years and leasehold improvements are depreciated over the lesser of the base term of the respective lease or the useful life of the asset. Premises and equipment are evaluated for impairment whenever events or changes in circumstances indicate that the carrying amount of an asset may not be recoverable. Maintenance and repairs are charged to operations as incurred.
Goodwill and other indefinite lived intangible assets. Under accounting for business combinations, the net assets of entities acquired by First Financial are recorded at their estimated fair value at the date of acquisition. The excess cost of the acquisition over the fair value of net assets acquired is recorded as goodwill. Goodwill and intangible assets deemed to have indefinite lives, if any, are not amortized, but are subject to annual impairment tests. First Financial performs its annual impairment test effective October 1 or whenever events or changes in circumstances indicate that the carrying value may not be recoverable. First Financial reviews goodwill for impairment using both income and asset-based approaches.
First Financial Bancorp 2013 Annual Report 59
Notes To Consolidated Financial Statements
Core deposit intangibles. Core deposit intangibles represent the estimated value of acquired relationships with deposit customers. The estimated fair value of core deposit intangibles are based on a discounted cash flow methodology that gives appropriate consideration to expected customer attrition rates, cost of the deposit base, reserve requirements and the net maintenance cost attributable to customer deposits. Core deposit intangibles are amortized on an accelerated basis over their useful lives.
Other real estate owned (OREO). OREO represents properties acquired by the Company primarily through the loan foreclosure or repossession process, or other resolution activity that results in partial or total satisfaction of problem loans. OREO properties are recorded at the lower of cost or fair value, less estimated disposal costs (net realizable value) upon acquisition. Losses arising at the time of acquisition of such properties are charged against the allowance for loan and lease losses. Management performs periodic valuations to assess the adequacy of the recorded OREO balances and subsequent write-downs in the carrying value of OREO properties are expensed as incurred. Improvements to OREO properties may be capitalized if the improvements contribute to the overall value of the property, but may not be capitalized in excess of the net realizable value of the property. When management disposes of an OREO property, any gains or losses realized at the time of disposal are reflected in the Consolidated Statements of Income.
Other real estate owned – covered (covered OREO). Covered OREO represents properties acquired by the Company primarily through the loan foreclosure or repossession process, or other resolution activity that results in partial or total satisfaction of problem covered loans. Pursuant to the terms of the loss sharing agreements, covered assets are subject to stated loss thresholds whereby the FDIC will reimburse First Financial for 80% of losses up to the stated loss thresholds, and 95% of losses in excess of the thresholds. Covered OREO properties are recorded at the lower of cost or fair value, less estimated disposal costs upon acquisition. Management performs periodic valuations to assess the adequacy of the recorded covered OREO balances and subsequent write-downs in the carrying value of covered OREO properties are expensed as incurred. Improvements to covered OREO properties may be capitalized if the improvements contribute to the overall value of the property, but may not be capitalized in excess of the net realizable value of the property. When management disposes of a covered OREO property, any gains or losses realized at the time of disposal are reflected in the Consolidated Statements of Income, and, in general, are substantially offset by a related adjustment to the FDIC indemnification asset.
Income taxes. First Financial and its subsidiaries file a consolidated federal income tax return. Each subsidiary provides for income taxes on a separate return basis, and remits to First Financial amounts determined to be currently payable. Deferred tax assets and liabilities are measured using enacted tax rates expected to apply to taxable income in the years in which temporary differences are expected to be recovered or settled. The effect on deferred tax assets and liabilities of a change in tax rates is recognized in income in the period that includes the enactment date. Interest and penalties on income tax assessments or income tax refunds are recognized in the Consolidated Financial Statements as a component of noninterest expense.
Pension. First Financial sponsors a non-contributory defined benefit pension plan covering substantially all employees. The measurement of the accrued benefit liability and the annual pension expense involves actuarial and economic assumptions. The assumptions used in pension accounting include those related to the discount rates, the expected return on plan assets and the rate of compensation increase.
Derivative instruments. First Financial accounts for its derivative financial instruments in accordance with FASB ASC Topic 815, Derivatives and Hedging. FASB ASC Topic 815 requires all derivative instruments to be carried at fair value on the balance sheet.
The accounting for changes in the fair value of derivatives depends on the intended use of the derivative and the resulting designation. Derivatives used to hedge the exposure to changes in the fair value of an asset, liability or firm commitment attributable to a particular risk, such as interest rate risk, are considered fair value hedges. Derivatives used to hedge the exposure to variability in expected future cash flows, or other types of forecasted transactions, are considered cash flow hedges.
First Financial utilizes interest rate swaps designated as fair value hedges as a means to offer commercial borrowers products that meet their needs, but are also designed to achieve First Financial’s desired interest rate risk profile. First Financial utilizes interest rate swaps designated as cash flow hedges to manage the variability of cash flows, primarily net interest income, attributable to changes in interest rates.
Back to back swaps - First Financial enters into swap agreements with commercial borrowers and simultaneously enters into offsetting swap agreements, with substantially matching terms, with institutional counterparties. These matched interest rate swap agreements generally involve the receipt by First Financial of floating rate amounts from the counterparties in exchange for payments to these counterparties by First Financial of fixed rate amounts received from commercial borrowers over the life
60 First Financial Bancorp 2013 Annual Report
of the agreements. This results in First Financial’s loan customers receiving fixed rate funding, while providing First Financial with a floating rate asset.
First Financial's matched interest rate swaps qualify as derivatives, but are not designated as hedging instruments. The net interest receivable or payable on matched interest rate swaps is accrued and recognized as an adjustment to interest income. The fair values of matched interest rate swaps are included within Accrued interest and other assets and Accrued interest and other liabilities on the Consolidated Balance Sheets.
Pay fixed interest rate swaps - For unmatched, pay fixed interest rate swaps, which qualify for hedge accounting, the corresponding fair-value adjustment is included on the Consolidated Balance Sheets in the carrying value of the hedged item. The net interest receivable or payable on unmatched interest rate swaps is accrued and recognized as an adjustment to the interest income of the hedged item. Gains and losses from derivatives not considered effective in hedging the change in fair value of the hedged item, if any, are recognized in income immediately.
Cash flow hedges - The net interest receivable or payable on an interest rate swap designated as a cash flow hedge is accrued and recognized as an adjustment to interest income or interest expense, while the fair value is included within Accrued interest and other assets or Accrued interest and other liabilities on the Consolidated Balance Sheets. Changes in the fair value of interest rate swaps designated as cash flow hedges are included in accumulated other comprehensive income (loss). Gains and losses from derivatives not considered effective in hedging the cash flows related to the hedged items, if any, are recognized in income immediately.
Like other financial instruments, derivatives contain an element of credit risk, which is the possibility that First Financial will incur a loss because a counterparty fails to meet its contractual obligations. Generally, the credit risk associated with interest rate swaps is significantly less than the notional values associated with these instruments. The notional values represent contractual balances on which the calculations of amounts to be exchanged are based. First Financial manages this credit risk through counterparty credit policies.
Stock-based compensation. First Financial grants stock-based awards, including restricted stock awards for and options to purchase the Company’s common stock. Stock option grants are for a fixed number of shares to employees and directors with an exercise price equal to the fair value of the shares at the date of grant. Stock-based compensation expense is recognized in the Consolidated Statements of Income on a straight-line basis over the vesting period. The amortization of stock-based compensation expense reflects estimated forfeitures adjusted for actual forfeiture experience. As compensation expense is recognized, a deferred tax asset is recorded that represents an estimate of the future tax deduction from exercise. At the time stock-based awards are exercised, canceled or expire, First Financial may be required to recognize an adjustment to tax expense.
Earnings per share. Basic earnings per common share is computed by dividing net income available to common shareholders by the weighted average number of shares of common stock outstanding during the period. Diluted net earnings per common share is computed by dividing net income available to common shareholders by the weighted average number of common shares outstanding, unvested shares and dilutive common stock equivalents outstanding during the period. Common stock equivalents consist of common stock issuable under the assumed exercise of stock options granted under First Financial's stock plans and the assumed conversion of common stock warrants, using the treasury stock method.
Cash and Due from Banks. Cash and due from banks consist of currency, coin and cash items due from banks. Cash items due from banks include noninterest bearing deposits held at other banks.
Segments and related information. Consistent with prior years, management continued to review operating performance and make decisions as one banking segment in 2013.
2. Recently Adopted and Issued Accounting Standards
In December 2011, the FASB issued an update (ASU 2011-11, Disclosures About Offsetting Assets and Liabilities) which creates new disclosure requirements about the nature of an entity's rights of offset and related arrangements associated with its financial instruments and derivative instruments. These disclosure requirements are required for recognized financial and derivative instruments that are offset in accordance with the guidance in FASB ASC Topic 210-20-45, Balance Sheet - Offsetting - Other Presentation Matters, FASB ASC Topic 815-10-45, Derivatives and Hedging - Other Presentation Matters, or are subject to an enforceable master netting arrangement or similar agreement. Subsequently, the FASB issued ASU 2013-01, Scope Clarification of Disclosures about Offsetting Assets and Liabilities, which limits the scope of ASU 2011-11 to
First Financial Bancorp 2013 Annual Report 61
Notes To Consolidated Financial Statements
derivatives, repurchase agreements and reverse repurchase agreements, and securities borrowing and lending transactions. Companies are required to disclose information to enable users of its financial statements to evaluate the effect or potential effect of netting arrangements on its financial position, including the effect or potential effect of rights of set-off associated with certain financial instruments and derivative instruments. The provisions of ASU 2011-11 became effective for the interim reporting period ended March 31, 2013 and resulted in additional disclosures related to the Company's derivatives programs. For further detail, see Note 7 - Derivatives.
In July 2012, the FASB issued an update (ASU 2012-02, Intangibles—Goodwill and Other (Topic 350): Testing Indefinite-Lived Intangible Assets for Impairment) which allows an entity testing an indefinite-lived intangible asset for impairment the option of performing a qualitative assessment before calculating the fair value of the asset. This update also addresses circumstances that a company should consider in interim periods, but does not remove the requirement for testing of indefinite-lived intangible assets for impairment annually and between annual tests if there is a change in events and circumstances. The provisions of ASU 2012-02 became effective for the interim reporting period ended March 31, 2013 and did not have a material impact on the Company's Consolidated Financial Statements.
In October 2012, the FASB issued an update (ASU 2012-06, Business Combinations (Topic 805): Subsequent Accounting for an Indemnification Asset Recognized at the Acquisition Date as a Result of a Government-Assisted Acquisition of a Financial Institution) which clarifies the applicable guidance for subsequently measuring an indemnification asset recognized as a result of a government-assisted acquisition of a financial institution. When a company recognizes an indemnification asset as a result of a government-assisted acquisition of a financial institution and subsequently a change in the cash flows expected to be collected on the indemnification asset occurs (as a result of a change in cash flows expected to be collected on the assets subject to indemnification), the company should subsequently account for the change in the measurement of the indemnification asset on the same basis as the change in the assets subject to indemnification. Any amortization of changes in value should be limited to the contractual term of the indemnification agreement (that is, the lesser of the term of the indemnification agreement and the remaining life of the indemnified assets). The provisions of ASU 2012-06 became effective for the interim reporting period ended March 31, 2013 and did not have a material impact on the Company's Consolidated Financial Statements.
On February 5, 2013, the FASB issued an update (ASU 2013-02, Reporting of Amounts Reclassified Out of Accumulated Other Comprehensive Income (AOCI)) which requires preparers to report information about reclassifications out of AOCI. The ASU also requires companies to report changes in AOCI balances and expands the disclosure requirements in FASB ASC Topic 220, Comprehensive Income (ASC 220), for presentation of changes in AOCI. This ASU requires companies to disaggregate the total change of each component of other comprehensive income and separately present (1) reclassification adjustments and (2) current-period OCI. ASU 2013-02 also requires companies to present information about significant items reclassified out of AOCI by component either (1) on the face of the statement where net income is presented or (2) as a separate disclosure in the notes to the financial statements. The provisions of ASU 2013-02 became effective for the interim reporting period ended March 31, 2013 and resulted in additional disclosures related to reclassifications from AOCI. For further detail, see Note 15 - Accumulated Other Comprehensive Income (Loss).
3. Goodwill and Other Intangible Assets
Goodwill. Assets and liabilities of acquired entities are recorded at their estimated fair values as of the acquisition date. The excess cost of the acquisition over the fair value of net assets acquired is recorded as goodwill. First Financial had goodwill of $95.1 million as of December 31, 2013 and December 31, 2012.
Goodwill is not amortized, but is measured for impairment on an annual basis as of October 1 of each year, or whenever events or changes in circumstances indicate that the fair value of a reporting unit may be below its carrying value. First Financial performed its annual impairment test of goodwill as of October 1, 2013 and no impairment was indicated. As of December 31, 2013, no events or changes in circumstances indicated that the fair value of a reporting unit was below its carrying value.
Other intangible assets. Other intangible assets primarily consist of core deposit intangibles. Core deposit intangibles are recorded at their estimated fair value at the date of acquisition and are then amortized on an accelerated basis over their estimated useful lives. As of December 31, 2013 and December 31, 2012, core deposit intangibles were $5.9 million and $7.4 million, respectively. First Financial's core deposit intangibles have an estimated weighted average remaining life of 6.8 years as of December 31, 2013. Amortization expense recognized on intangible assets for 2013, 2012 and 2011 was $1.5 million, $2.6 million and $1.2 million, respectively.
62 First Financial Bancorp 2013 Annual Report
4. Restrictions On Cash And Due From Bank Accounts
First Financial's bank subsidiary is required to maintain average reserve balances either in the form of vault cash or reserves held on deposit with the Federal Reserve Bank, Federal Home Loan Bank or in pass-through reserve accounts with correspondent banks. The average amounts of these required reserve balances, based upon the average level of First Financial's transaction accounts, for 2013 and 2012 were approximately $43.1 million and $41.3 million, respectively. Additionally, First Financial had $2.0 million of cash acquired in conjunction with an FDIC-assisted transaction that was restricted for withdrawal and usage as of December 31, 2013 and 2012.
5. Restrictions On Subsidiary Dividends, Loans Or Advances
Dividends paid by First Financial to its shareholders are principally funded through dividends paid to the Company by its subsidiaries. However, certain restrictions exist regarding the ability of bank subsidiaries to transfer funds to First Financial in the form of cash dividends, loans or advances. The approval of the subsidiaries' respective primary federal regulators is required for First Financial's subsidiaries to pay dividends in excess of the regulatory limit, which is equal to the net income of the current year through the dividend date, combined with its retained net income from the two preceding years. As of December 31, 2013, First Financial's subsidiaries had retained earnings of $346.0 million of which $20.8 million was available for distribution to First Financial without prior regulatory approval.
6. Commitments And Contingencies
In the normal course of business, First Financial offers a variety of financial instruments with off-balance-sheet risk to its clients to assist them in meeting their liquidity and credit enhancement requirements. These financial instruments include standby letters of credit and outstanding commitments to extend credit. GAAP does not require these financial instruments to be recorded in the Consolidated Financial Statements.
First Financial’s exposure to credit loss, in the event of nonperformance by the counterparty to the financial instrument for standby letters of credit and outstanding commitments to extend credit, is represented by the contractual amounts of those instruments. First Financial uses the same credit policies in issuing commitments and conditional obligations as it does for credit instruments recorded on the Consolidated Balance Sheets.
Letters of credit. Letters of credit are conditional commitments issued by First Financial to guarantee the performance of a client to a third party. First Financial’s portfolio of standby letters of credit consists primarily of performance assurances made on behalf of clients who have a contractual commitment to produce or deliver goods or services. The risk to First Financial arises from its obligation to make payment in the event of the clients’ contractual default to produce the contracted good or service to a third party. First Financial has issued letters of credit (including standby letters of credit) aggregating $14.0 million and $14.8 million at December 31, 2013, and December 31, 2012, respectively. Management conducts regular reviews of these instruments on an individual client basis.
Loan commitments. Loan commitments are agreements to extend credit to a client as long as there is no violation of any condition established in the commitment agreement. Commitments generally have fixed expiration dates or other termination clauses and may require payment of a fee. Since many of the commitments are expected to expire without being drawn upon, the total commitment amounts do not necessarily represent future cash requirements. First Financial evaluates each client’s creditworthiness on an individual basis. The amount of collateral obtained, if deemed necessary by First Financial upon extension of credit, is based on management’s credit evaluation of the client. The collateral held varies, but may include securities, real estate, inventory, plant or equipment. First Financial had commitments outstanding to extend credit totaling $1.4 billion and $1.2 billion at December 31, 2013 and December 31, 2012, respectively.
First Financial utilizes the allowance for loan and lease losses methodology to maintain a reserve that it considers sufficient to absorb probable losses inherent in standby letters of credit and outstanding loan commitments and records the reserve within Accrued interest and other liabilities on the Consolidated Balance Sheets. For further detail on the allowance for loan and lease losses methodology, see Note 1 – Summary of Significant Accounting Policies.
Contingencies/Litigation – First Financial and its subsidiaries are engaged in various matters of litigation, assertions of improper or fraudulent loan practices or lending violations and other matters from time to time, and have a number of unresolved claims pending. Additionally, as part of the ordinary course of business, First Financial and its subsidiaries are
First Financial Bancorp 2013 Annual Report 63
Notes To Consolidated Financial Statements
parties to litigation involving claims to the ownership of funds in particular accounts, the collection of delinquent accounts, challenges to security interests in collateral and foreclosure interests, that is incidental to our regular business activities. While the ultimate liability with respect to these other litigation matters and claims cannot be determined at this time, First Financial believes that damages, if any, and other amounts relating to pending matters are not probable or cannot be reasonably estimated as of December 31, 2013. Reserves are established for various matters of litigation under FASB ASC Topic 450, Contingencies, based in part upon the advice of legal counsel.
7. Derivatives
First Financial uses certain derivative instruments, including interest rate caps, floors and swaps, to meet the needs of its clients while managing the interest rate risk associated with certain transactions. First Financial does not use derivatives for speculative purposes. For discussion of First Financial's accounting for derivative instruments, see Note 1 - Summary of Significant Accounting Policies.
First Financial primarily utilizes interest rate swaps as a means to offer borrowers credit-based products that meet their needs and may from time to time utilize interest rate swaps to manage the interest rate risk profile of the Company. The interest rate swap agreements establish the basis on which interest rate payments are exchanged with counterparties, referred to as the notional amount.
As only interest rate payments are exchanged, the cash requirements and credit risk associated with interest rate swaps are significantly less than the notional amount and the Company’s credit risk exposure is limited to the market value of the instruments. First Financial manages this market value credit risk through counterparty credit policies. These policies require the Company to maintain a total derivative notional position of less than 35% of assets, total credit exposure of less than 3% of capital and no single counterparty credit risk exposure greater than $20.0 million. The Company is currently well below all single counterparty and portfolio limits. At December 31, 2013, the Company had a total counterparty notional amount outstanding of approximately $561.6 million, spread among nine counterparties, with an outstanding liability from these contracts of $9.3 million. At December 31, 2012, First Financial had a total counterparty notional amount outstanding of $509.1 million, spread among eight counterparties, with an outstanding liability from these contracts of $26.0 million.
First Financial’s exposure to credit loss, in the event of nonperformance by a borrower, is limited to the market value of the derivative instrument associated with that borrower. First Financial monitors its derivative credit exposure to borrowers by monitoring the creditworthiness of the related loan customers through the normal credit review processes the Company performs on all borrowers. Additionally, the Company monitors derivative credit risk exposure related to problem loans through the Company's allowance for loan and lease losses committee. First Financial considers the market value of a derivative instrument to be part of the carrying value of the related loan for these purposes as the borrower is contractually obligated to pay First Financial this amount in the event the derivative contract is terminated.
The following table summarizes the derivative financial instruments utilized by First Financial and their balances:
|
| | | | | | | | | | | | | | | | | | | | | | | | | | |
| | | | December 31, 2013 | | December 31, 2012 |
| | | | | | | Estimated fair value | | | | Estimated fair value |
| (Dollars in thousands) | | Balance Sheet Location | | Notional amount | | Gain | | Loss | | Notional amount | | Gain | | Loss |
| Fair Value Hedges - Instruments associated with loans | | | | | | | | | | | | |
| Pay fixed interest rate swaps with counterparty | | Accrued interest and other liabilities | | $ | 9,836 |
| | $ | 0 |
| | $ | (865 | ) | | $ | 12,739 |
| | $ | 0 |
| | $ | (1,445 | ) |
| Matched interest rate swaps with borrower | | Accrued interest and other assets and other liabilities | | 451,744 |
| | 11,710 |
| | (1,767 | ) | | 461,377 |
| | 24,135 |
| | 0 |
|
| Matched interest rate swaps with counterparty | | Accrued interest and other liabilities | | 451,744 |
| | 1,767 |
| | (11,799 | ) | | 461,377 |
| | 0 |
| | (24,978 | ) |
| Total | | | | $ | 913,324 |
| | $ | 13,477 |
| | $ | (14,431 | ) | | $ | 935,493 |
| | $ | 24,135 |
| | $ | (26,423 | ) |
In connection with its use of derivative instruments, from time to time First Financial and its counterparties are required to post cash collateral to offset the market position of the derivative instruments. First Financial maintains the right to offset these derivative positions with the collateral posted against them by or with the relevant counterparties. First Financial classifies the derivative cash collateral outstanding with its counterparties as an adjustment to the fair value of the derivative contracts within Accrued interest and other assets or Accrued interest and other liabilities in the Consolidated Balance Sheets.
64 First Financial Bancorp 2013 Annual Report
The following table discloses the gross and net amounts of liabilities recognized in the Consolidated Balance Sheets:
|
| | | | | | | | | | | | | | | | | | | | | | | |
| | December 31, 2013 | | December 31, 2012 |
| (Dollars in thousands) | Gross amounts of recognized liabilities | | Gross amounts offset in the Consolidated Balance Sheets | | Net amounts of liabilities presented in the Consolidated Balance Sheets | | Gross amounts of recognized liabilities | | Gross amounts offset in the Consolidated Balance Sheets | | Net amounts of liabilities presented in the Consolidated Balance Sheets |
| Fair value hedges | | | | | | | | | | | |
| Pay fixed interest rate swaps with counterparty | $ | 865 |
| | $ | (663 | ) | | $ | 202 |
| | $ | 1,445 |
| | $ | (669 | ) | | $ | 776 |
|
| Matched interest rate swaps | 13,566 |
| | (9,533 | ) | | 4,033 |
| | 24,978 |
| | (23,057 | ) | | 1,921 |
|
| Total | $ | 14,431 |
| | $ | (10,196 | ) | | $ | 4,235 |
| | $ | 26,423 |
| | $ | (23,726 | ) | | $ | 2,697 |
|
The following table details the derivative financial instruments, the average remaining maturities and the weighted-average interest rates being paid and received by First Financial at December 31, 2013:
|
| | | | | | | | | | | | | | | | |
| | | | | | | | | Weighted-Average Rate |
| (Dollars in thousands) | | Notional amount | | Average maturity (years) | | Fair value | | Receive | | Pay |
| Asset conversion swaps | | | | | | | | | | |
| Pay fixed interest rate swaps with counterparty | | $ | 9,836 |
| | 2.9 | | $ | (865 | ) | | 2.14 | % | | 6.85 | % |
| Receive fixed, matched interest rate swaps with borrower | | 451,744 |
| | 4.2 | | 9,943 |
| | 4.83 | % | | 2.86 | % |
| Pay fixed, matched interest rate swaps with counterparty | | 451,744 |
| | 4.2 | | (10,032 | ) | | 2.86 | % | | 4.83 | % |
| Total asset conversion swaps | | $ | 913,324 |
| | 4.2 | | $ | (954 | ) | | 3.83 | % | | 3.88 | % |
Fair Value Hedges. First Financial utilizes interest rate swaps designated as fair value hedges as a means to offer commercial borrowers products that meet their needs, but are also designed to achieve First Financial’s desired interest rate risk profile. The following table details the location and amounts recognized in the Consolidated Statements of Income for fair value hedges: |
| | | | | | | | | | | | | | |
| | | | Decrease to Interest Income |
| (Dollars in thousands) | | | | Years Ended |
| Derivatives in fair value hedging relationships | | Location of change in fair value | | December 31, |
| | | | | 2013 | | 2012 | | 2011 |
| Interest rate contracts | | | | | | | | |
| Loans | | Interest income - loans | | $ | (515 | ) | | $ | (706 | ) | | $ | (891 | ) |
| Total | | | | $ | (515 | ) | | $ | (706 | ) | | $ | (891 | ) |
Cash Flow Hedges. First Financial utilizes interest rate swaps designated as cash flow hedges to hedge against interest rate volatility on indexed floating rate deposits, totaling $100.0 million as of December 31, 2013 and $35.0 million as of December 31, 2012. These interest rate swaps qualify for hedge accounting and involve the receipt by First Financial of variable-rate interest amounts in exchange for fixed-rate interest payments by First Financial and have a remaining weighted average term of approximately 6 years. Accrued interest and other assets included $0.8 million at December 31, 2013 and accrued interest and other liabilities included $0.2 million at December 31, 2012, respectively, reflecting the fair value of these cash flow hedges.
First Financial Bancorp 2013 Annual Report 65
Notes To Consolidated Financial Statements
8. Investment Securities
The following is a summary of held-to-maturity and available-for-sale investment securities as of December 31, 2013:
|
| | | | | | | | | | | | | | | | | | | | | | | | | | | | | | | | |
| | Held-to-Maturity | | Available-for-Sale |
| (Dollars in thousands) | | Amortized Cost | | Unrealized Gain | | Unrealized Loss | | Market Value | | Amortized Cost | | Unrealized Gain | | Unrealized Loss | | Market Value |
| U.S. Treasuries | | $ | 0 |
| | $ | 0 |
| | $ | 0 |
| | $ | 0 |
| | $ | 97 |
| | $ | 0 |
| | $ | (7 | ) | | $ | 90 |
|
| Securities of U.S. government agencies and corporations | | 18,981 |
| | 0 |
| | (791 | ) | | 18,190 |
| | 9,980 |
| | 0 |
| | (404 | ) | | 9,576 |
|
| Mortgage-backed securities | | 775,025 |
| | 1,337 |
| | (12,229 | ) | | 764,133 |
| | 678,267 |
| | 5,372 |
| | (28,593 | ) | | 655,046 |
|
| Obligations of state and other political subdivisions | | 25,788 |
| | 152 |
| | (1,039 | ) | | 24,901 |
| | 33,410 |
| | 10 |
| | (3,097 | ) | | 30,323 |
|
| Asset-backed securities | | 0 |
| | 0 |
| | 0 |
| | 0 |
| | 114,209 |
| | 1 |
| | (616 | ) | | 113,594 |
|
| Other securities | | 17,478 |
| | 283 |
| | 0 |
| | 17,761 |
| | 109,089 |
| | 262 |
| | (4,379 | ) | | 104,972 |
|
| Total | | $ | 837,272 |
| | $ | 1,772 |
| | $ | (14,059 | ) | | $ | 824,985 |
| | $ | 945,052 |
| | $ | 5,645 |
| | $ | (37,096 | ) | | $ | 913,601 |
|
The following is a summary of held-to-maturity and available-for-sale investment securities as of December 31, 2012:
|
| | | | | | | | | | | | | | | | | | | | | | | | | | | | | | | | |
| | Held-to-Maturity | | Available-for-Sale |
| | | Amortized | | Unrealized | | Unrealized | | Market | | Amortized | | Unrealized | | Unrealized | | Market |
| (Dollars in thousands) | | Cost | | Gain | | Loss | | Value | | Cost | | Gain | | Loss | | Value |
| Securities of U.S. government agencies and corporations | | $ | 20,512 |
| | $ | 679 |
| | $ | 0 |
| | $ | 21,191 |
| | $ | 15,562 |
| | $ | 333 |
| | $ | 0 |
| | $ | 15,895 |
|
| Mortgage-backed securities | | 740,891 |
| | 8,077 |
| | (1,290 | ) | | 747,678 |
| | 854,150 |
| | 14,564 |
| | (1,485 | ) | | 867,229 |
|
| Obligations of state and other political subdivisions | | 9,352 |
| | 265 |
| | (12 | ) | | 9,605 |
| | 35,913 |
| | 169 |
| | (84 | ) | | 35,998 |
|
| Asset-backed securities | | 0 |
| | 0 |
| | 0 |
| | 0 |
| | 57,000 |
| | 90 |
| | (1 | ) | | 57,089 |
|
| Other securities | | 0 |
| | 0 |
| | 0 |
| | 0 |
| | 54,479 |
| | 1,569 |
| �� | (163 | ) | | 55,885 |
|
| Total | | $ | 770,755 |
| | $ | 9,021 |
| | $ | (1,302 | ) | | $ | 778,474 |
| | $ | 1,017,104 |
| | $ | 16,725 |
| | $ | (1,733 | ) | | $ | 1,032,096 |
|
During the year ended December 31, 2013, First Financial sold available-for-sale securities with a fair value of $91.0 million at the date of sale and recorded a $1.7 million pre-tax gain. The investment gain after taxes was $1.1 million for the year ended December 31, 2013.
During the year ended December 31, 2012, First Financial sold available-for-sale securities with a fair value of $236.7 million at the date of sale and recorded a $3.6 million net pre-tax gain. There was a net investment gain after taxes of $2.3 million for the year ended December 31, 2012.
During the year ended December 31, 2011, First Financial sold available-for-sale securities with a fair value of $162.6 million at the date of sale and recorded a $2.5 million net pre-tax gain. There was a net investment gain after taxes of $1.6 million for the year ended December 31, 2011.
The carrying value of investment securities pledged as collateral to secure public deposits, repurchase agreements and for other purposes as required by law totaled $1.1 billion at December 31, 2013, and $1.2 billion at December 31, 2012.
66 First Financial Bancorp 2013 Annual Report
The following table provides a summary of investment securities by estimated weighted average life as of December 31, 2013. Estimated lives on certain investment securities may differ from contractual maturities as issuers may have the right to call or prepay obligations with or without call or prepayment penalties.
|
| | | | | | | | | | | | | | | |
| | Held-to-Maturity | | Available-for-Sale |
| (Dollars in thousands) | Amortized Cost | | Market Value | | Amortized Cost | | Market Value |
| Due in one year or less | $ | 216 |
| | $ | 219 |
| | $ | 6,819 |
| | $ | 7,027 |
|
| Due after one year through five years | 378,932 |
| | 375,323 |
| | 279,035 |
| | 276,750 |
|
| Due after five years through ten years | 322,455 |
| | 314,375 |
| | 314,854 |
| | 303,477 |
|
| Due after ten years | 135,669 |
| | 135,068 |
| | 344,344 |
| | 326,347 |
|
| Total | $ | 837,272 |
| | $ | 824,985 |
| | $ | 945,052 |
| | $ | 913,601 |
|
The following tables provide the fair value and gross unrealized losses on investment securities in an unrealized loss position, aggregated by investment category and the length of time the individual securities have been in a continuous unrealized loss position:
|
| | | | | | | | | | | | | | | | | | | | | | | | |
| | | December 31, 2013 |
| | | Less than 12 Months | | 12 Months or More | | Total |
| (Dollars in thousands) | | Fair Value | | Unrealized Loss | | Fair Value | | Unrealized Loss | | Fair Value | | Unrealized Loss |
| Securities of U.S. government agencies and corporations | | $ | 27,851 |
| | $ | (970 | ) | | $ | 0 |
| | $ | 0 |
| | $ | 27,851 |
| | $ | (970 | ) |
| Mortgage-backed securities | | 966,718 |
| | (32,432 | ) | | 108,929 |
| | (6,101 | ) | | 1,075,647 |
| | (38,533 | ) |
| Obligations of state and other political subdivisions | | 66,502 |
| | (5,294 | ) | | 1,935 |
| | (46 | ) | | 68,437 |
| | (5,340 | ) |
| Asset-backed securities | | 93,355 |
| | (616 | ) | | 0 |
| | 0 |
| | 93,355 |
| | (616 | ) |
| Other securities | | 54,866 |
| | (2,142 | ) | | 7,798 |
| | (561 | ) | | 62,664 |
| | (2,703 | ) |
| Total | | $ | 1,209,292 |
| | $ | (41,454 | ) | | $ | 118,662 |
| | $ | (6,708 | ) | | $ | 1,327,954 |
| | $ | (48,162 | ) |
|
| | | | | | | | | | | | | | | | | | | | | | | | |
| | | December 31, 2012 |
| | | Less than 12 Months | | 12 Months or More | | Total |
| | | Fair | | Unrealized | | Fair | | Unrealized | | Fair | | Unrealized |
| (Dollars in thousands) | | Value | | Loss | | Value | | Loss | | Value | | Loss |
| Mortgage-backed securities | | $ | 240,641 |
| | $ | (1,635 | ) | | $ | 25,513 |
| | $ | (405 | ) | | $ | 266,154 |
| | $ | (2,040 | ) |
| Obligations of state and other political subdivisions | | 21,341 |
| | (96 | ) | | 0 |
| | 0 |
| | 21,341 |
| | (96 | ) |
| Asset-backed securities | | 9,999 |
| | (1 | ) | | 0 |
| | 0 |
| | 9,999 |
| | (1 | ) |
| Other securities | | 8,454 |
| | (163 | ) | | 0 |
| | 0 |
| | 8,454 |
| | (163 | ) |
| Total | | $ | 280,435 |
| | $ | (1,895 | ) | | $ | 25,513 |
| | $ | (405 | ) | | $ | 305,948 |
| | $ | (2,300 | ) |
Gains and losses on debt securities are generally due to higher current market yields relative to the yields of the debt securities at their amortized cost. All securities with unrealized losses are reviewed quarterly to determine if any impairment is considered other than temporary, requiring a write-down to fair value. First Financial considers the percentage loss on a security, duration of the loss, average life or duration of the security, credit rating of the security and payment performance, as well as the Company’s intent and ability to hold the security to maturity when determining whether any impairment is other than temporary. At this time First Financial does not intend to sell, and it is not more likely than not that the Company will be required to sell debt securities temporarily impaired prior to maturity or recovery of the recorded value. First Financial had no other than temporary impairment related to its investment securities portfolio as of December 31, 2013 or 2012.
For further detail on the fair value of investment securities, see Note 21 – Fair Value Disclosures.
First Financial Bancorp 2013 Annual Report 67
Notes To Consolidated Financial Statements
9. Loans, Excluding Covered Loans
First Financial offers clients a variety of commercial and consumer loan and lease products with various interest rates and payment terms. Lending activities are primarily concentrated in Ohio, Indiana and Kentucky, states where the Bank currently operates banking centers. Additionally, First Financial provides equipment and leasehold improvement financing for franchisees in the quick service and casual dining restaurant sector throughout the United States. Commercial loan categories include commercial and industrial (commercial), commercial real estate, construction real estate and lease financing. Consumer loan categories include residential real estate, home equity, installment and credit card. For more information on First Financial's lending practices, see "Lending Practices" in Management’s Discussion and Analysis of Financial Condition and Results of Operations.
Credit Quality. To facilitate the monitoring of credit quality for commercial loans, and for purposes of determining an appropriate allowance for loan and lease losses, First Financial utilizes the following categories of credit grades:
Pass - Higher quality loans that do not fit any of the other categories described below.
Special Mention - First Financial assigns a special mention rating to loans and leases with potential weaknesses that deserve management's close attention. If left uncorrected, these potential weaknesses may result in deterioration of the repayment prospects for the loan or lease or in First Financial's credit position at some future date.
Substandard - First Financial assigns a substandard rating to loans or leases that are inadequately protected by the current sound financial worth and paying capacity of the borrower or of the collateral pledged, if any. Substandard loans and leases have well-defined weaknesses that jeopardize repayment of the debt. Substandard loans and leases are characterized by the distinct possibility that the Company will sustain some loss if the deficiencies are not addressed.
Doubtful - First Financial assigns a doubtful rating to loans and leases with all the attributes of a substandard rating with the added characteristic that the weaknesses make collection or liquidation in full, on the basis of currently existing facts, conditions and values, highly questionable and improbable. The possibility of loss is extremely high, but because of certain important and reasonably specific pending factors that may work to the advantage and strengthening of the credit quality of the loan or lease, its classification as an estimated loss is deferred until its more exact status may be determined. Pending factors include proposed merger, acquisition or liquidation procedures, capital injection, perfecting liens on additional collateral and refinancing plans.
The credit grades described above, which are derived from standard regulatory rating definitions, are assigned upon initial approval of credit to borrowers and updated periodically thereafter.
First Financial considers repayment performance as the best indicator of credit quality for consumer loans. Consumer loans that have principal and interest payments that are past due by ninety days or more are generally classified as nonperforming. Additionally, consumer loans that have been modified in a TDR are classified as nonperforming.
68 First Financial Bancorp 2013 Annual Report
Commercial and consumer credit exposure by risk attribute was as follows:
|
| | | | | | | | | | | | | | | | |
| | | As of December 31, 2013 |
| | | | | Real Estate | | |
| (Dollars in thousands) | | Commercial | | Construction | | Commercial | | Total |
| Pass | | $ | 991,161 |
| | $ | 78,872 |
| | $ | 1,422,215 |
| | $ | 2,492,248 |
|
| Special Mention | | 23,053 |
| | 65 |
| | 23,832 |
| | 46,950 |
|
| Substandard | | 21,454 |
| | 1,804 |
| | 50,940 |
| | 74,198 |
|
| Doubtful | | 0 |
| | 0 |
| | 0 |
| | 0 |
|
| Total | | $ | 1,035,668 |
| | $ | 80,741 |
| | $ | 1,496,987 |
| | $ | 2,613,396 |
|
|
| | | | | | | | | | | | | | | | | | | | |
| | | Real Estate Residential | | Installment | | Home Equity | | Other | | Total |
| Performing | | $ | 344,325 |
| | $ | 46,559 |
| | $ | 373,472 |
| | $ | 115,727 |
| | $ | 880,083 |
|
| Nonperforming | | 8,606 |
| | 574 |
| | 2,982 |
| | 0 |
| | 12,162 |
|
| Total | | $ | 352,931 |
| | $ | 47,133 |
| | $ | 376,454 |
| | $ | 115,727 |
| | $ | 892,245 |
|
|
| | | | | | | | | | | | | | | | |
| | | As of December 31, 2012 |
| | | | | Real Estate | | |
| (Dollars in thousands) | | Commercial | | Construction | | Commercial | | Total |
| Pass | | $ | 803,351 |
| | $ | 64,866 |
| | $ | 1,307,370 |
| | $ | 2,175,587 |
|
| Special Mention | | 29,663 |
| | 65 |
| | 38,516 |
| | 68,244 |
|
| Substandard | | 28,019 |
| | 8,586 |
| | 71,122 |
| | 107,727 |
|
| Doubtful | | 0 |
| | 0 |
| | 0 |
| | 0 |
|
| Total | | $ | 861,033 |
| | $ | 73,517 |
| | $ | 1,417,008 |
| | $ | 2,351,558 |
|
|
| | | | | | | | | | | | | | | | | | | | |
| | | Real Estate Residential | | Installment | | Home Equity | | Other | | Total |
| Performing | | $ | 310,341 |
| | $ | 56,358 |
| | $ | 364,248 |
| | $ | 84,490 |
| | $ | 815,437 |
|
| Nonperforming | | 7,869 |
| | 452 |
| | 3,252 |
| | 496 |
| | 12,069 |
|
| Total | | $ | 318,210 |
| | $ | 56,810 |
| | $ | 367,500 |
| | $ | 84,986 |
| | $ | 827,506 |
|
Delinquency. Loans are considered past due or delinquent when the contractual principal or interest due in accordance with the terms of the loan agreement or any portion thereof remains unpaid after the due date of the scheduled payment.
First Financial Bancorp 2013 Annual Report 69
Notes To Consolidated Financial Statements
Loan delinquency, including nonaccrual loans, was as follows:
|
| | | | | | | | | | | | | | | | | | | | | | | | | | | | |
| | | As of December 31, 2013 |
| (Dollars in thousands) | | 30 – 59 days past due | | 60 – 89 days past due | | > 90 days past due | | Total past due | | Current | | Total | | > 90 days past due and still accruing |
| Loans | | | | | | | | | | | | | | |
| Commercial | | $ | 2,016 |
| | $ | 161 |
| | $ | 7,136 |
| | $ | 9,313 |
| | $ | 1,026,355 |
| | $ | 1,035,668 |
| | $ | 0 |
|
| Real estate - construction | | 0 |
| | 0 |
| | 223 |
| | 223 |
| | 80,518 |
| | 80,741 |
| | 0 |
|
| Real estate - commercial | | 7,800 |
| | 4,269 |
| | 12,732 |
| | 24,801 |
| | 1,472,186 |
| | 1,496,987 |
| | 0 |
|
| Real estate - residential | | 2,030 |
| | 685 |
| | 5,526 |
| | 8,241 |
| | 344,690 |
| | 352,931 |
| | 0 |
|
| Installment | | 213 |
| | 40 |
| | 379 |
| | 632 |
| | 46,501 |
| | 47,133 |
| | 0 |
|
| Home equity | | 985 |
| | 292 |
| | 1,648 |
| | 2,925 |
| | 373,529 |
| | 376,454 |
| | 0 |
|
| Other | | 680 |
| | 144 |
| | 218 |
| | 1,042 |
| | 114,685 |
| | 115,727 |
| | 218 |
|
| Total | | $ | 13,724 |
| | $ | 5,591 |
| | $ | 27,862 |
| | $ | 47,177 |
| | $ | 3,458,464 |
| | $ | 3,505,641 |
| | $ | 218 |
|
|
| | | | | | | | | | | | | | | | | | | | | | | | | | | | |
| | | As of December 31, 2012 |
| (Dollars in thousands) | | 30 - 59 days past due | | 60 - 89 days past due | | > 90 days past due | | Total past due | | Current | | Total | | > 90 days past due and still accruing |
| Loans | | | | | | | | | | | | | | |
| Commercial | | $ | 1,770 |
| | $ | 832 |
| | $ | 4,197 |
| | $ | 6,799 |
| | $ | 854,234 |
| | $ | 861,033 |
| | $ | 0 |
|
| Real estate - construction | | 0 |
| | 0 |
| | 892 |
| | 892 |
| | 72,625 |
| | 73,517 |
| | 0 |
|
| Real estate - commercial | | 2,549 |
| | 1,931 |
| | 27,966 |
| | 32,446 |
| | 1,384,562 |
| | 1,417,008 |
| | 0 |
|
| Real estate - residential | | 6,071 |
| | 1,463 |
| | 6,113 |
| | 13,647 |
| | 304,563 |
| | 318,210 |
| | 0 |
|
| Installment | | 280 |
| | 148 |
| | 344 |
| | 772 |
| | 56,038 |
| | 56,810 |
| | 0 |
|
| Home equity | | 1,311 |
| | 869 |
| | 1,440 |
| | 3,620 |
| | 363,880 |
| | 367,500 |
| | 0 |
|
| Other | | 386 |
| | 168 |
| | 708 |
| | 1,262 |
| | 83,724 |
| | 84,986 |
| | 212 |
|
| Total | | $ | 12,367 |
| | $ | 5,411 |
| | $ | 41,660 |
| | $ | 59,438 |
| | $ | 3,119,626 |
| | $ | 3,179,064 |
| | $ | 212 |
|
Nonaccrual. Loans are classified as nonaccrual when, in the opinion of management, collection of principal or interest is doubtful or when principal or interest payments are 90 days or more past due. Generally, loans are classified as nonaccrual due to the continued failure to adhere to contractual payment terms by the borrower coupled with other pertinent factors, such as, insufficient collateral value. The accrual of interest income is discontinued and previously accrued, but unpaid interest is reversed when a loan is classified as nonaccrual. Any payments received while a loan is on nonaccrual status are applied as a reduction to the carrying value of the loan. A loan may be placed back on accrual status if collection of future principal and interest payments is no longer doubtful.
Troubled Debt Restructurings. A loan modification is considered a TDR when two conditions are met: 1) the borrower is experiencing financial difficulty and 2) concessions are made by the Company that would not otherwise be considered for a borrower with similar credit characteristics. The most common types of modifications include interest rate reductions, maturity extensions and modifications to principal amortization including interest only structures. Modified terms are dependent upon the financial position and needs of the individual borrower. If the modification agreement is violated, the loan is handled by the Company’s credit administration group for resolution, which may result in foreclosure in the case of real estate.
TDRs are generally classified as nonaccrual for a minimum period of six months and may qualify for return to accrual status once they have demonstrated sustained performance with the restructured terms of the loan agreement.
First Financial had 217 TDRs totaling $28.1 million at December 31, 2013, including $15.1 million of loans on accrual status and $13.0 million of loans classified as nonaccrual. First Financial has an insignificant amount of commitments outstanding to lend additional funds to borrowers whose loan terms have been modified in TDRs as of December 31, 2013. At December 31,
70 First Financial Bancorp 2013 Annual Report
2013, the allowance for loan and lease losses included reserves of $4.4 million related to TDRs. For the year ended December 31, 2013, First Financial charged off $2.8 million for the portion of TDRs determined to be uncollectible. At December 31, 2013, approximately $9.0 million of the accruing TDRs have been performing in accordance with the restructured terms for more than one year.
First Financial had 145 TDRs totaling $25.0 million at December 31, 2012, including $10.9 million of loans on accrual status and $14.1 million of loans classified as nonaccrual. First Financial had $3.5 million of commitments outstanding to lend additional funds to borrowers whose loan terms have been modified in TDRs as of December 31, 2012. At December 31, 2012, the allowance for loan and lease losses included reserves of $3.0 million related to TDRs. For the year ended December 31, 2012, First Financial charged off $7.2 million for the portion of TDRs determined to be uncollectible. At December 31, 2012, approximately $2.7 million of the accruing TDRs had been performing in accordance with the restructured terms for more than one year.
The following table provides information on loan modifications classified as TDRs during the years ended December 31, 2013 and 2012.
|
| | | | | | | | | | | | | | | | | | | | |
| | Years ended December 31, |
| | 2013 | | 2012 |
| | Total TDRs | | Total TDRs |
| (Dollars in thousands) | Number of loans | | Pre-modification loan balance | | Period end balance | | Number of loans | | Pre-modification loan balance | | Period end balance |
| Commercial | 15 |
| | $ | 8,582 |
| | $ | 6,431 |
| | 23 | | $ | 8,955 |
| | $ | 7,050 |
|
| Real estate - construction | 0 |
| | 0 |
| | 0 |
| | 0 | | 0 |
| | 0 |
|
| Real estate - commercial | 18 |
| | 4,925 |
| | 3,477 |
| | 28 | | 11,018 |
| | 7,201 |
|
| Real estate - residential | 38 |
| | 2,612 |
| | 2,317 |
| | 22 | | 1,572 |
| | 1,578 |
|
| Installment | 18 |
| | 333 |
| | 227 |
| | 0 | | 0 |
| | 0 |
|
| Home equity | 42 |
| | 1,615 |
| | 1,117 |
| | 22 | | 753 |
| | 753 |
|
| Total | 131 |
| | $ | 18,067 |
| | $ | 13,569 |
| | 95 | | $ | 22,298 |
| | $ | 16,582 |
|
The following table provides information on how TDRs were modified during the years ended December 31, 2013 and 2012.
|
| | | | | | | |
| | Years Ended December 31, |
| (Dollars in thousands) | 2013 (2) | | 2012 (2) |
| Extended maturities | $ | 8,146 |
| | $ | 8,838 |
|
| Adjusted interest rates | 520 | | 220 |
|
| Combination of rate and maturity changes | 950 | | 1,403 |
|
| Forbearance | 0 | | 3,261 |
|
Other (1) | 3,953 | | 2,860 |
|
| Total | $ | 13,569 |
| | $ | 16,582 |
|
(1) Other includes covenant modifications and other concessions or combination of concessions that do not consist of interest rate adjustments, forbearance and maturity extensions.
(2) Balances are as of year end.
First Financial considers repayment performance as an indication of the effectiveness of the Company's loan modifications. Borrowers that are ninety days or more past due on any principal or interest payments for a TDR, or who prematurely terminates a restructured loan agreement without paying off the contractual principal balance (for example, in a deed-in-lieu arrangement), are considered to be in payment default of the terms of the TDR agreement.
First Financial Bancorp 2013 Annual Report 71
Notes To Consolidated Financial Statements
The following table provides information on TDRs for which there was a payment default during the period that occurred within twelve months of the loan modification:
|
| | | | | | | | | | | | |
| | | Years ended December 31, |
| | | 2013 | | 2012 |
| (Dollars in thousands) | | Number of loans | | Period end balance | | Number of loans | | Period end balance |
| Commercial | | 4 | | $ | 4,875 |
| | 2 | | $ | 1,646 |
|
| Real estate - construction | | 0 | | 0 | | 1 | | 301 |
| Real estate - commercial | | 3 | | 236 | | 3 | | 767 |
| Real estate - residential | | 3 | | 112 | | 0 | | 0 |
| Installment | | 4 | | 24 | | 0 | | 0 |
| Home equity | | 8 | | 198 | | 0 | | 0 |
| Total | | 22 | | $ | 5,445 |
| | 6 | | $ | 2,714 |
|
Impaired Loans. Loans classified as nonaccrual and loans modified as TDRs are considered impaired. The following table provides information on impaired loans as of December 31:
|
| | | | | | | | | | | | |
| (Dollars in thousands) | | 2013 | | 2012 | | 2011 |
| Impaired loans | | | | | | |
Nonaccrual loans (1) | | | | | | |
| Commercial | | $ | 7,934 |
| | $ | 15,893 |
| | $ | 10,477 |
|
| Real estate-construction | | 223 |
| | 2,102 |
| | 17,387 |
|
| Real estate-commercial | | 17,286 |
| | 34,977 |
| | 34,004 |
|
| Real estate-residential | | 8,606 |
| | 7,869 |
| | 8,022 |
|
| Installment | | 574 |
| | 452 |
| | 407 |
|
| Home equity | | 2,982 |
| | 3,252 |
| | 2,073 |
|
| Other | | 0 |
| | 496 |
| | 0 |
|
| Total nonaccrual loans | | 37,605 |
| | 65,041 |
| | 72,370 |
|
| Accruing troubled debt restructurings | | 15,094 |
| | 10,856 |
| | 4,009 |
|
| Total impaired loans | | $ | 52,699 |
| | $ | 75,897 |
| | $ | 76,379 |
|
| | | | | | | |
| Interest income effect | | | | | | |
| Gross amount of interest that would have been recorded under original terms | | $ | 4,286 |
| | $ | 4,842 |
| | $ | 5,500 |
|
| Interest included in income | | | | | | |
| Nonaccrual loans | | 536 |
| | 787 |
| | 675 |
|
| Troubled debt restructurings | | 438 |
| | 338 |
| | 92 |
|
| Total interest included in income | | 974 |
| | 1,125 |
| | 767 |
|
| Net impact on interest income | | $ | 3,312 |
| | $ | 3,717 |
| | $ | 4,733 |
|
| | | | | | | |
| Commitments outstanding to borrowers with nonaccrual loans | | $ | 0 |
| | $ | 3,489 |
| | $ | 0 |
|
(1) Nonaccrual loans include nonaccrual TDRs of $13.0 million, $14.1 million and $18.1 million as of December 31, 2013, 2012 and 2011, respectively.
First Financial individually reviews all impaired commercial loan relationships greater than $250,000, as well as consumer loan TDRs greater than $100,000, to determine if a specific allowance is necessary based on the borrower’s overall financial condition, resources, payment record, support from guarantors and the realizable value of any collateral. Specific allowances are based on discounted cash flows using the loan's initial effective interest rate or the fair value of the collateral for certain collateral dependent loans.
72 First Financial Bancorp 2013 Annual Report
First Financial's investment in impaired loans is as follows:
|
| | | | | | | | | | | | | | | | | | | | |
| | | As of December 31, 2013 |
| (Dollars in thousands) | | Current Balance | | Contractual Principal Balance | | Related Allowance | | Average Balance | | Interest Income Recognized |
| Loans with no related allowance recorded | | | | | | | | | | |
| Commercial | | $ | 5,212 |
| | $ | 7,083 |
| | $ | 0 |
| | $ | 10,712 |
| | $ | 165 |
|
| Real estate - construction | | 223 |
| | 443 |
| | 0 |
| | 599 |
| | 0 |
|
| Real estate - commercial | | 12,355 |
| | 16,431 |
| | 0 |
| | 16,563 |
| | 380 |
|
| Real estate - residential | | 10,291 |
| | 12,087 |
| | 0 |
| | 10,225 |
| | 152 |
|
| Installment | | 642 |
| | 663 |
| | 0 |
| | 463 |
| | 6 |
|
| Home equity | | 3,208 |
| | 4,108 |
| | 0 |
| | 3,145 |
| | 44 |
|
| Other | | 0 |
| | 0 |
| | 0 |
| | 148 |
| | 0 |
|
| Total | | 31,931 |
| | 40,815 |
| | 0 |
| | 41,855 |
| | 747 |
|
| | | | | | | | | | | |
| Loans with an allowance recorded | | | | | | | | | | |
| Commercial | | 7,013 |
| | 8,353 |
| | 2,080 |
| | 5,047 |
| | 71 |
|
| Real estate - construction | | 0 |
| | 0 |
| | 0 |
| | 726 |
| | 7 |
|
| Real estate - commercial | | 11,638 |
| | 14,424 |
| | 2,872 |
| | 21,098 |
| | 110 |
|
| Real estate - residential | | 2,016 |
| | 2,072 |
| | 348 |
| | 1,997 |
| | 37 |
|
| Installment | | 0 |
| | 0 |
| | 0 |
| | 0 |
| | 0 |
|
| Home equity | | 101 |
| | 101 |
| | 2 |
| | 101 |
| | 2 |
|
| Other | | 0 |
| | 0 |
| | 0 |
| | 167 |
| | 0 |
|
| Total | | 20,768 |
| | 24,950 |
| | 5,302 |
| | 29,136 |
| | 227 |
|
| | | | | | | | | | | |
| Total | | |
| | |
| | |
| | |
| | |
|
| Commercial | | 12,225 |
| | 15,436 |
| | 2,080 |
| | 15,759 |
| | 236 |
|
| Real estate - construction | | 223 |
| | 443 |
| | 0 |
| | 1,325 |
| | 7 |
|
| Real estate - commercial | | 23,993 |
| | 30,855 |
| | 2,872 |
| | 37,661 |
| | 490 |
|
| Real estate - residential | | 12,307 |
| | 14,159 |
| | 348 |
| | 12,222 |
| | 189 |
|
| Installment | | 642 |
| | 663 |
| | 0 |
| | 463 |
| | 6 |
|
| Home equity | | 3,309 |
| | 4,209 |
| | 2 |
| | 3,246 |
| | 46 |
|
| Other | | 0 |
| | 0 |
| | 0 |
| | 315 |
| | 0 |
|
| Total | | $ | 52,699 |
| | $ | 65,765 |
| | $ | 5,302 |
| | $ | 70,991 |
| | $ | 974 |
|
First Financial Bancorp 2013 Annual Report 73
Notes To Consolidated Financial Statements
|
| | | | | | | | | | | | | | | | | | | | |
| | | As of December 31, 2012 |
| (Dollars in thousands) | | Current Balance | | Contractual Principal Balance | | Related Allowance | | Average Balance | | Interest Income Recognized |
| Loans with no related allowance recorded | | | | | | | | | | |
| Commercial | | $ | 14,961 |
| | $ | 17,269 |
| | $ | 0 |
| | $ | 9,337 |
| | $ | 215 |
|
| Real estate - construction | | 462 |
| | 672 |
| | 0 |
| | 3,857 |
| | 15 |
|
| Real estate - commercial | | 15,782 |
| | 21,578 |
| | 0 |
| | 15,554 |
| | 277 |
|
| Real estate - residential | | 9,222 |
| | 10,817 |
| | 0 |
| | 8,463 |
| | 81 |
|
| Installment | | 452 |
| | 556 |
| | 0 |
| | 452 |
| | 2 |
|
| Home equity | | 3,251 |
| | 4,132 |
| | 0 |
| | 2,423 |
| | 19 |
|
| Other | | 326 |
| | 326 |
| | 0 |
| | 65 |
| | 0 |
|
| Total | | 44,456 |
| | 55,350 |
| | 0 |
| | 40,151 |
| | 609 |
|
| | | | | | | | | | | |
| Loans with an allowance recorded | | |
| | | | | | | | |
| Commercial | | 3,560 |
| | 4,252 |
| | 1,151 |
| | 5,350 |
| | 161 |
|
| Real estate - construction | | 1,640 |
| | 2,168 |
| | 838 |
| | 5,033 |
| | 81 |
|
| Real estate - commercial | | 24,014 |
| | 25,684 |
| | 7,155 |
| | 25,499 |
| | 235 |
|
| Real estate - residential | | 1,956 |
| | 2,003 |
| | 290 |
| | 2,278 |
| | 38 |
|
| Installment | | 0 |
| | 0 |
| | 0 |
| | 0 |
| | 0 |
|
| Home equity | | 101 |
| | 101 |
| | 2 |
| | 81 |
| | 1 |
|
| Other | | 170 |
| | 170 |
| | 92 |
| | 34 |
| | 0 |
|
| Total | | 31,441 |
| | 34,378 |
| | 9,528 |
| | 38,275 |
| | 516 |
|
| | | | | | | | | | | |
| Total | | |
| | |
| | |
| | |
| | |
|
| Commercial | | 18,521 |
| | 21,521 |
| | 1,151 |
| | 14,687 |
| | 376 |
|
| Real estate - construction | | 2,102 |
| | 2,840 |
| | 838 |
| | 8,890 |
| | 96 |
|
| Real estate - commercial | | 39,796 |
| | 47,262 |
| | 7,155 |
| | 41,053 |
| | 512 |
|
| Real estate - residential | | 11,178 |
| | 12,820 |
| | 290 |
| | 10,741 |
| | 119 |
|
| Installment | | 452 |
| | 556 |
| | 0 |
| | 452 |
| | 2 |
|
| Home equity | | 3,352 |
| | 4,233 |
| | 2 |
| | 2,504 |
| | 20 |
|
| Other | | 496 |
| | 496 |
| | 92 |
| | 99 |
| | 0 |
|
| Total | | $ | 75,897 |
| | $ | 89,728 |
| | $ | 9,528 |
| | $ | 78,426 |
| | $ | 1,125 |
|
74 First Financial Bancorp 2013 Annual Report
|
| | | | | | | | | | | | | | | | | | | | |
| | | As of December 31, 2011 |
| (Dollars in thousands) | | Current Balance | | Contractual Principal Balance | | Related Allowance | | Average Balance | | Interest Income Recognized |
| Loans with no related allowance recorded | | | | | | | | | | |
| Commercial | | $ | 6,351 |
| | $ | 8,387 |
| | $ | 0 |
| | $ | 7,337 |
| | $ | 62 |
|
| Real estate - construction | | 6,289 |
| | 11,129 |
| | 0 |
| | 5,657 |
| | 2 |
|
| Real estate - commercial | | 14,999 |
| | 22,718 |
| | 0 |
| | 18,306 |
| | 249 |
|
| Real estate - residential | | 8,639 |
| | 9,580 |
| | 0 |
| | 6,848 |
| | 66 |
|
| Installment | | 485 |
| | 526 |
| | 0 |
| | 356 |
| | 5 |
|
| Home equity | | 2,073 |
| | 2,206 |
| | 0 |
| | 2,337 |
| | 10 |
|
| Total | | 38,836 |
| | 54,546 |
| | 0 |
| | 40,841 |
| | 394 |
|
| | | | | | | | | | | |
| Loans with an allowance recorded | | |
| | | | | | | | |
| Commercial | | 4,131 |
| | 4,267 |
| | 3,205 |
| | 3,683 |
| | 15 |
|
| Real estate - construction | | 11,098 |
| | 13,905 |
| | 2,578 |
| | 13,731 |
| | 92 |
|
| Real estate - commercial | | 19,521 |
| | 26,357 |
| | 6,441 |
| | 15,484 |
| | 225 |
|
| Real estate - residential | | 2,692 |
| | 2,705 |
| | 313 |
| | 3,630 |
| | 37 |
|
| Installment | | 0 |
| | 0 |
| | 0 |
| | 15 |
| | 1 |
|
| Home equity | | 101 |
| | 101 |
| | 2 |
| | 81 |
| | 3 |
|
| Total | | 37,543 |
| | 47,335 |
| | 12,539 |
| | 36,624 |
| | 373 |
|
| | | | | | | | | | | |
| Total | | |
| | |
| | |
| | |
| | |
|
| Commercial | | 10,482 |
| | 12,654 |
| | 3,205 |
| | 11,020 |
| | 77 |
|
| Real estate - construction | | 17,387 |
| | 25,034 |
| | 2,578 |
| | 19,388 |
| | 94 |
|
| Real estate - commercial | | 34,520 |
| | 49,075 |
| | 6,441 |
| | 33,790 |
| | 474 |
|
| Real estate - residential | | 11,331 |
| | 12,285 |
| | 313 |
| | 10,478 |
| | 103 |
|
| Installment | | 485 |
| | 526 |
| | 0 |
| | 371 |
| | 6 |
|
| Home equity | | 2,174 |
| | 2,307 |
| | 2 |
| | 2,418 |
| | 13 |
|
| Total | | $ | 76,379 |
| | $ | 101,881 |
| | $ | 12,539 |
| | $ | 77,465 |
| | $ | 767 |
|
First Financial Bancorp 2013 Annual Report 75
Notes To Consolidated Financial Statements
OREO. OREO is comprised of properties acquired by the Company primarily through the loan foreclosure or repossession process, or other resolution activities that result in partial or total satisfaction of problem loans.
Changes in OREO were as follows:
|
| | | | | | | | | | | | |
| | | Years Ended December 31, |
| (Dollars in thousands) | | 2013 | | 2012 | | 2011 |
| Balance at beginning of year | | $ | 12,526 |
| | $ | 11,317 |
| | $ | 17,907 |
|
| Additions | | |
| | |
| | |
| Commercial | | 12,120 |
| | 6,741 |
| | 1,328 |
|
| Residential | | 855 |
| | 2,540 |
| | 2,904 |
|
| Total additions | | 12,975 |
| | 9,281 |
| | 4,232 |
|
| Disposals | | |
| | |
| | |
| Commercial | | 3,149 |
| | 3,572 |
| | 3,916 |
|
| Residential | | 1,157 |
| | 1,921 |
| | 2,536 |
|
| Total disposals | | 4,306 |
| | 5,493 |
| | 6,452 |
|
| Valuation adjustments | | |
| | |
| | |
| Commercial | | 864 |
| | 2,290 |
| | 4,042 |
|
| Residential | | 525 |
| | 289 |
| | 328 |
|
| Total valuation adjustments | | 1,389 |
| | 2,579 |
| | 4,370 |
|
| Balance at end of year | | $ | 19,806 |
| | $ | 12,526 |
| | $ | 11,317 |
|
10. Covered Loans
Loans acquired in FDIC-assisted transactions initially covered under loss sharing agreements whereby the FDIC will reimburse First Financial for the majority of any losses incurred are referred to as covered loans. Pursuant to the terms of the loss sharing agreements, covered loans are subject to a stated loss threshold, as outlined in each loss sharing agreement, whereby the FDIC will reimburse First Financial for 80% of losses up to a stated loss threshold, and 95% of losses in excess of the threshold. These loss sharing agreements provide for partial loss protection on single-family, residential loans for a period of ten years and First Financial is required to share any recoveries of previously charged-off amounts for the same time period, on the same pro-rata basis with the FDIC. All other loans are provided loss protection for a period of five years and recoveries of previously charged-off amounts must be shared with the FDIC for an additional three year period, again on the same pro-rata basis. The five year period of loss protection will expire for the majority of First Financial's covered commercial loans and covered OREO during the third quarter of 2014. The ten year period of loss protection on all other covered loans and covered OREO will expire during the third quarter of 2019.
First Financial accounts for the majority of covered loans under FASB ASC Topic 310-30, Loans and Debt Securities Acquired with Deteriorated Credit Quality, except loans with revolving privileges, which are outside the scope of this guidance, and loans for which cash flows could not be estimated, which are accounted for under the cost recovery method. Loans accounted for under FASB ASC Topic 310-30 are referred to as purchased impaired loans. For more information on First Financial's accounting for covered loans, see Note 1 - Summary of Significant Accounting Policies.
Purchased impaired loans are not classified as nonperforming assets as the loans are considered to be performing under FASB ASC Topic 310-30. Therefore, interest income, through accretion of the difference between the carrying value of the loans and the expected cash flows (accretable difference) is recognized on all covered purchased impaired loans.
76 First Financial Bancorp 2013 Annual Report
The following table reflects the carrying value of all covered purchased impaired and nonimpaired loans as of December 31:
|
| | | | | | | | | | | | | | | | | | | | | | | | |
| | | 2013 | | 2012 |
| (Dollars in thousands) | | Loans Accounted For Under FASB ASC Topic 310-30 | | Loans excluded from FASB ASC Topic 310-30 | | Total Covered Loans | | Loans Accounted For Under FASB ASC Topic 310-30 | | Loans Excluded From FASB ASC Topic 310-30 | | Total Covered Loans |
| Commercial | | $ | 41,172 |
| | $ | 1,144 |
| | $ | 42,316 |
| | $ | 94,775 |
| | $ | 7,351 |
| | $ | 102,126 |
|
| Real estate - construction | | 8,556 |
| | 0 |
| | 8,556 |
| | 10,631 |
| | 0 |
| | 10,631 |
|
| Real estate - commercial | | 263,146 |
| | 5,487 |
| | 268,633 |
| | 458,066 |
| | 7,489 |
| | 465,555 |
|
| Real estate - residential | | 80,733 |
| | 0 |
| | 80,733 |
| | 100,694 |
| | 0 |
| | 100,694 |
|
| Installment | | 5,073 |
| | 568 |
| | 5,641 |
| | 7,911 |
| | 763 |
| | 8,674 |
|
| Home equity | | 975 |
| | 48,649 |
| | 49,624 |
| | 2,080 |
| | 55,378 |
| | 57,458 |
|
| Other covered loans | | 0 |
| | 2,370 |
| | 2,370 |
| | 0 |
| | 2,978 |
| | 2,978 |
|
| Total covered loans | | $ | 399,655 |
| | $ | 58,218 |
| | $ | 457,873 |
| | $ | 674,157 |
| | $ | 73,959 |
| | $ | 748,116 |
|
The outstanding balance of all purchased impaired and nonimpaired loans accounted for under FASB ASC Topic 310-30, including all contractual principal, interest, fees and penalties, was $493.6 million and $852.9 million as of December 31, 2013 and December 31, 2012, respectively. These balances exclude contractual interest not yet accrued.
Changes in the carrying amount of accretable difference for covered purchased impaired loans for the years ended December 31 were as follows:
|
| | | | | | | | | | | | |
| (Dollars in thousands) | | 2013 | | 2012 | | 2011 |
| Balance at beginning of year | | $ | 224,694 |
| | $ | 344,410 |
| | $ | 509,945 |
|
| Reclassification from non-accretable difference | | 1,470 |
| | 29,606 |
| | 39,079 |
|
| Accretion | | (58,422 | ) | | (91,485 | ) | | (125,524 | ) |
Other net activity (1) | | (34,071 | ) | | (57,837 | ) | | (79,090 | ) |
| Balance at end of year | | $ | 133,671 |
| | $ | 224,694 |
| | $ | 344,410 |
|
(1) Includes the impact of loan repayments and charge-offs.
First Financial regularly reviews its forecast of expected cash flows for covered purchased impaired loans. During 2013, the Company implemented certain enhancements to its valuation methodology and the estimation of impairment to place greater emphasis on changes in total expected cash flows and less emphasis on changes in the net present value of expected cash flows. These enhancements, as well as other improvements in the expected cash flows from covered purchased impaired loans, contributed to a net reclassification from nonaccretable to accretable difference of $1.5 million and resulted in higher yields on certain loan pools during 2013, compared to reclassifications from nonaccretable to accretable difference of a $29.6 million and $39.1 million during 2012 and 2011.
Credit Quality. For further discussion of First Financial's monitoring of credit quality for commercial and consumer loans, including discussion of the risk attributes noted below, please see Note 9 - Loans.
First Financial Bancorp 2013 Annual Report 77
Notes To Consolidated Financial Statements
Covered commercial and consumer credit exposure by risk attribute was as follows:
|
| | | | | | | | | | | | | | | | |
| | | As of December 31, 2013 |
| | | | | Real Estate | | |
| (Dollars in thousands) | | Commercial | | Construction | | Commercial | | Total |
| Pass | | $ | 25,196 |
| | $ | 1,714 |
| | $ | 182,621 |
| | $ | 209,531 |
|
| Special Mention | | 2,011 |
| | 0 |
| | 12,904 |
| | 14,915 |
|
| Substandard | | 14,693 |
| | 6,842 |
| | 73,108 |
| | 94,643 |
|
| Doubtful | | 416 |
| | 0 |
| | 0 |
| | 416 |
|
| Total | | $ | 42,316 |
| | $ | 8,556 |
| | $ | 268,633 |
| | $ | 319,505 |
|
|
| | | | | | | | | | | | | | | | | | | | |
| | | Real Estate Residential | | Installment | | Home Equity | | Other | | Total |
| Performing | | $ | 80,733 |
| | $ | 5,636 |
| | $ | 47,731 |
| | $ | 2,370 |
| | $ | 136,470 |
|
| Nonperforming | | 0 |
| | 5 |
| | 1,893 |
| | 0 |
| | 1,898 |
|
| Total | | $ | 80,733 |
| | $ | 5,641 |
| | $ | 49,624 |
| | $ | 2,370 |
| | $ | 138,368 |
|
|
| | | | | | | | | | | | | | | | |
| | | As of December 31, 2012 |
| | | | | Real Estate | | |
| (Dollars in thousands) | | Commercial | | Construction | | Commercial | | Total |
| Pass | | $ | 48,213 |
| | $ | 2,304 |
| | $ | 213,143 |
| | $ | 263,660 |
|
| Special Mention | | 16,293 |
| | 7 |
| | 70,894 |
| | 87,194 |
|
| Substandard | | 35,596 |
| | 8,320 |
| | 181,345 |
| | 225,261 |
|
| Doubtful | | 2,024 |
| | 0 |
| | 173 |
| | 2,197 |
|
| Total | | $ | 102,126 |
| | $ | 10,631 |
| | $ | 465,555 |
| | $ | 578,312 |
|
|
| | | | | | | | | | | | | | | | | | | | |
| | | Real Estate Residential | | Installment | | Home Equity | | Other | | Total |
| Performing | | $ | 100,694 |
| | $ | 8,674 |
| | $ | 53,231 |
| | $ | 2,967 |
| | $ | 165,566 |
|
| Nonperforming | | 0 |
| | 0 |
| | 4,227 |
| | 11 |
| | 4,238 |
|
| Total | | $ | 100,694 |
| | $ | 8,674 |
| | $ | 57,458 |
| | $ | 2,978 |
| | $ | 169,804 |
|
Covered loans are considered past due or delinquent when the contractual principal or interest due in accordance with the terms of the loan agreement or any portion thereof remains unpaid after the due date of the scheduled payment.
78 First Financial Bancorp 2013 Annual Report
Delinquency. Covered loan delinquency, excluding loans accounted for under FASB ASC Topic 310-30, was as follows:
|
| | | | | | | | | | | | | | | | | | | | | | | | | | | |
| | As of December 31, 2013 |
| (Dollars in thousands) | 30 - 59 days past due | | 60 - 89 days past due | | > 90 days past due | | Total past due | | Current | | Total | | > 90 days past due and still accruing |
| Loans | | | | | | | | | | | | | |
| Commercial | $ | 60 |
| | $ | 335 |
| | $ | 483 |
| | $ | 878 |
| | $ | 266 |
| | $ | 1,144 |
| | $ | 0 |
|
| Real estate - commercial | 184 |
| | 0 |
| | 1,263 |
| | 1,447 |
| | 4,040 |
| | 5,487 |
| | 0 |
|
| Installment | 0 |
| | 0 |
| | 5 |
| | 5 |
| | 563 |
| | 568 |
| | 0 |
|
| Home equity | 239 |
| | 36 |
| | 1,727 |
| | 2,002 |
| | 46,647 |
| | 48,649 |
| | 0 |
|
| All other | 9 |
| | 4 |
| | 0 |
| | 13 |
| | 2,357 |
| | 2,370 |
| | 0 |
|
| Total | $ | 492 |
| | $ | 375 |
| | $ | 3,478 |
| | $ | 4,345 |
| | $ | 53,873 |
| | $ | 58,218 |
| | $ | 0 |
|
|
| | | | | | | | | | | | | | | | | | | | | | | | | | | |
| | As of December 31, 2012 |
| (Dollars in thousands) | 30 - 59 days past due | | 60 - 89 days past due | | > 90 days past due | | Total past due | | Current | | Total | | > 90 days past due and still accruing |
| Loans | | | | | | | | | | | | | |
| Commercial | $ | 351 |
| | $ | 148 |
| | $ | 3,781 |
| | $ | 4,280 |
| | $ | 3,071 |
| | $ | 7,351 |
| | $ | 0 |
|
| Real estate - commercial | 138 |
| | 1,149 |
| | 2,201 |
| | 3,488 |
| | 4,001 |
| | 7,489 |
| | 0 |
|
| Installment | 0 |
| | 0 |
| | 0 |
| | 0 |
| | 763 |
| | 763 |
| | 0 |
|
| Home equity | 286 |
| | 296 |
| | 3,697 |
| | 4,279 |
| | 51,099 |
| | 55,378 |
| | 0 |
|
| All other | 19 |
| | 26 |
| | 42 |
| | 87 |
| | 2,891 |
| | 2,978 |
| | 31 |
|
| Total | $ | 794 |
| | $ | 1,619 |
| | $ | 9,721 |
| | $ | 12,134 |
| | $ | 61,825 |
| | $ | 73,959 |
| | $ | 31 |
|
Nonaccrual. Covered purchased impaired loans are classified as performing, even though they may be contractually past due, as any nonpayment of contractual principal or interest is considered in the periodic re-estimation of expected cash flows and is included in the resulting recognition of current period covered loan loss provision or prospective yield adjustments.
Similar to uncovered loans, covered loans accounted for outside FASB ASC Topic 310-30 are classified as nonaccrual when, in the opinion of management, collection of principal or interest is doubtful or when principal or interest payments are 90 days or more past due. Generally, loans are classified as nonaccrual due to the continued failure to adhere to contractual payment terms by the borrower coupled with other pertinent factors, such as, insufficient collateral value. The accrual of interest income is discontinued and previously accrued, but unpaid interest is reversed when a loan is classified as nonaccrual. Any payments received while a loan is classified as nonaccrual are applied as a reduction to the carrying value of the loan. A loan may be returned to accrual status if collection of future principal and interest payments is no longer doubtful.
First Financial Bancorp 2013 Annual Report 79
Notes To Consolidated Financial Statements
Information as to covered nonaccrual loans, excluding loans accounted for under FASB ASC Topic 310-30, was as follows:
|
| | | | | | | | | | | | |
| (Dollars in thousands) | | 2013 | | 2012 | | 2011 |
| Impaired loans | | | | | | |
Nonaccrual loans (1) | | | | | | |
| Commercial | | $ | 540 |
| | $ | 4,498 |
| | $ | 7,203 |
|
| Real estate-commercial | | 1,349 |
| | 2,986 |
| | 2,192 |
|
| Installment | | 5 |
| | 0 |
| | 0 |
|
| Home equity | | 1,893 |
| | 4,227 |
| | 1,747 |
|
| All other | | 0 |
| | 11 |
| | 18 |
|
| Total nonaccrual loans | | 3,787 |
| | 11,722 |
| | 11,160 |
|
| Accruing troubled debt restructurings | | 335 |
| | 0 |
| | 0 |
|
| Total impaired loans | | $ | 4,122 |
| | $ | 11,722 |
| | $ | 11,160 |
|
| | | | | | | |
| Interest income effect | | | | | | |
| Gross amount of interest that would have been recorded under original terms | | $ | 412 |
| | $ | 673 |
| | $ | 1,020 |
|
| Interest included in income | | | | | | |
| Nonaccrual loans | | 24 |
| | 85 |
| | 58 |
|
| Troubled debt restructurings | | 6 |
| | 0 |
| | 0 |
|
| Total interest included in income | | 30 |
| | 85 |
| | 58 |
|
| Net impact on interest income | | $ | 382 |
| | $ | 588 |
| | $ | 962 |
|
(1) Nonaccrual loans include nonaccrual TDRs of $0.9 million as of December 31, 2013 and none as of December 31, 2012 and 2011.
Impaired Loans. Covered loans classified as nonaccrual, excluding loans accounted for under FASB ASC Topic 310-30, are considered impaired. First Financial’s investment in covered impaired loans, excluding loans accounted for under FASB ASC Topic 310-30, was as follows:
|
| | | | | | | | | | | | | | | | | | | | |
| | | As of 12/31/2013 |
| (Dollars in thousands) | | Current Balance | | Unpaid Principal Balance | | Related Allowance | | Average Balance | | Interest Income Recognized |
| Loans with no related allowance recorded | | | | | | | | | | |
| Commercial | | $ | 875 |
| | $ | 1,131 |
| | $ | 0 |
| | $ | 1,832 |
| | $ | 11 |
|
| Real estate - commercial | | 1,349 |
| | 2,648 |
| | 0 |
| | 1,786 |
| | 4 |
|
| Installment | | 5 |
| | 5 |
| | 0 |
| | 2 |
| | 0 |
|
| Home equity | | 1,893 |
| | 2,899 |
| | 0 |
| | 2,611 |
| | 15 |
|
| All other | | 0 |
| | 0 |
| | 0 |
| | 8 |
| | 0 |
|
| Total | | $ | 4,122 |
| | $ | 6,683 |
| | $ | 0 |
| | $ | 6,239 |
| | $ | 30 |
|
|
| | | | | | | | | | | | | | | | | | | | |
| | | As of December 31, 2012 |
| (Dollars in thousands) | | Current Balance | | Unpaid Principal Balance | | Related Allowance | | Average Balance | | Interest Income Recognized |
| Loans with no related allowance recorded | | | | | | | | | | |
| Commercial | | $ | 4,498 |
| | $ | 4,660 |
| | $ | 0 |
| | $ | 4,526 |
| | $ | 62 |
|
| Real estate - commercial | | 2,986 |
| | 3,216 |
| | 0 |
| | 2,153 |
| | 18 |
|
| Home equity | | 4,227 |
| | 5,260 |
| | 0 |
| | 2,006 |
| | 5 |
|
| All other | | 11 |
| | 11 |
| | 0 |
| | 13 |
| | 0 |
|
| Total | | $ | 11,722 |
| | $ | 13,147 |
| | $ | 0 |
| | $ | 8,698 |
| | $ | 85 |
|
80 First Financial Bancorp 2013 Annual Report
|
| | | | | | | | | | | | | | | | | | | | |
| | | As of December 31, 2011 |
| (Dollars in thousands) | | Current Balance | | Unpaid Principal Balance | | Related Allowance | | Average Balance | | Interest Income Recognized |
| Loans with no related allowance recorded | | | | | | | | | | |
| Commercial | | $ | 7,203 |
| | $ | 10,152 |
| | $ | 0 |
| | $ | 9,873 |
| | $ | 47 |
|
| Real estate - commercial | | 2,192 |
| | 4,002 |
| | 0 |
| | 2,504 |
| | 5 |
|
| Home equity | | 1,747 |
| | 2,878 |
| | 0 |
| | 1,559 |
| | 6 |
|
| All other | | 18 |
| | 18 |
| | 0 |
| | 9 |
| | 0 |
|
| Total | | $ | 11,160 |
| | $ | 17,050 |
| | $ | 0 |
| | $ | 13,945 |
| | $ | 58 |
|
Covered OREO. Covered OREO is comprised of properties acquired by the Company primarily through the loan foreclosure or repossession process, or other resolution activities that result in partial or total satisfaction of problem covered loans. These properties remain subject to loss sharing agreements whereby the FDIC reimburses First Financial for the majority of any losses incurred.
Changes in covered OREO were as follows:
|
| | | | | | | | | | | | |
| | | Years Ended December 31, |
| (Dollars in thousands) | | 2013 | | 2012 | | 2011 |
| Balance at beginning of year | | $ | 28,862 |
| | $ | 44,818 |
| | $ | 35,257 |
|
| Additions | | |
| | |
| | |
| Commercial | | 23,846 |
| | 16,759 |
| | 46,880 |
|
| Residential | | 879 |
| | 3,916 |
| | 2,753 |
|
| Total additions | | 24,725 |
| | 20,675 |
| | 49,633 |
|
| Disposals | | |
| | |
| | |
| Commercial | | 22,065 |
| | 27,044 |
| | 26,693 |
|
| Residential | | 948 |
| | 2,820 |
| | 7,849 |
|
| Total disposals | | 23,013 |
| | 29,864 |
| | 34,542 |
|
| Valuation adjustments | | |
| | |
| | |
| Commercial | | 3,320 |
| | 5,872 |
| | 4,407 |
|
| Residential | | 134 |
| | 895 |
| | 1,123 |
|
| Total valuation adjustments | | 3,454 |
| | 6,767 |
| | 5,530 |
|
| Balance at end of year | | $ | 27,120 |
| | $ | 28,862 |
| | $ | 44,818 |
|
FDIC indemnification asset. As a result of improvement in future expected cash flows on covered loans, a meaningful decline in loss claims filed with the FDIC, higher reimbursements to the FDIC related to positive asset resolutions in recent periods and the significantly shorter remaining life of the indemnification asset in comparison to the weighted average life of the related covered loans, the Company recorded a valuation adjustment to reduce the value of the FDIC indemnification asset of $22.4 million during 2014.
11. Allowance for Loan and Lease Losses
Loans, excluding covered loans. For each reporting period, management maintains the allowance for loan and lease losses at a level that it considers sufficient to absorb probable loan and lease losses inherent in the portfolio. Management determines the adequacy of the allowance based on historical loss experience as well as other significant factors such as composition of the portfolio, economic conditions, geographic footprint, the results of periodic internal and external evaluations of delinquent, nonaccrual and classified loans and any other adverse situations that may affect a specific borrower's ability to repay (including the timing of future payments). This evaluation is inherently subjective as it requires utilizing material estimates that may be susceptible to significant change. For further discussion of First Financial's allowance methodology, see Note 1 - Summary of Significant Accounting Policies.
First Financial Bancorp 2013 Annual Report 81
Notes To Consolidated Financial Statements
There were no material changes to First Financial's accounting policies or methodology related to the allowance for loan and lease losses during 2013, however certain modifications were made to the estimation process during 2012 to place greater emphasis on quantitative factors such as historical loan losses and less emphasis on qualitative factors. This resulted in a shift in the allocation of the allowance between certain consumer and commercial loan types but had no significant impact on the total allowance for loan and lease losses at December 31, 2013.
The allowance is increased by provision expense and decreased by actual charge-offs, net of recoveries of amounts previously charged-off. First Financial's policy is to charge-off all or a portion of a loan when, in management's opinion, it is unlikely to collect the principal amount owed in full either through payments from the borrower or from the liquidation of collateral.
Changes in the allowance for loan and lease losses for the three years ended December 31 were as follows:
|
| | | | | | | | | | | | |
| (Dollars in thousands) | | 2013 | | 2012 | | 2011 |
| Balance at beginning of year | | $ | 47,777 |
| | $ | 52,576 |
| | $ | 57,235 |
|
| Provision for loan and lease losses | | 8,714 |
| | 19,117 |
| | 19,210 |
|
| Loans charged-off | | (17,283 | ) | | (25,312 | ) | | (25,798 | ) |
| Recoveries | | 4,621 |
| | 1,396 |
| | 1,929 |
|
| Balance at end of year | | $ | 43,829 |
| | $ | 47,777 |
| | $ | 52,576 |
|
Changes in the allowance for loan and lease losses by loan category as of December 31 were as follows:
|
| | | | | | | | | | | | | | | | | | | | | | | | | | | | | | | | |
| | 2013 |
| | | | | Real Estate | | | | | | | | |
| (Dollars in thousands) | | Commercial | | Construction | | Commercial | | Residential | | Installment | | Home Equity | | Other | | Total |
| Allowance for loan and lease losses | | | | | | | | | | | | | | | | |
| Balance at beginning of year | | $ | 7,926 |
| | $ | 3,268 |
| | $ | 24,151 |
| | $ | 3,599 |
| | $ | 522 |
| | $ | 5,173 |
| | $ | 3,138 |
| | $ | 47,777 |
|
| Provision for loan and lease losses | | 5,385 |
| | (3,115 | ) | | 2,659 |
| | 593 |
| | (132 | ) | | 1,937 |
| | 1,387 |
| | 8,714 |
|
| Gross charge-offs | | 3,415 |
| | 1 |
| | 8,326 |
| | 1,016 |
| | 335 |
| | 2,409 |
| | 1,781 |
| | 17,283 |
|
| Recoveries | | 672 |
| | 672 |
| | 1,994 |
| | 203 |
| | 310 |
| | 508 |
| | 262 |
| | 4,621 |
|
| Total net charge-offs | | 2,743 |
| | (671 | ) | | 6,332 |
| | 813 |
| | 25 |
| | 1,901 |
| | 1,519 |
| | 12,662 |
|
| Ending allowance for loan and lease losses | | $ | 10,568 |
| | $ | 824 |
| | $ | 20,478 |
| | $ | 3,379 |
| | $ | 365 |
| | $ | 5,209 |
| | $ | 3,006 |
| | $ | 43,829 |
|
| Ending allowance on loans individually evaluated for impairment | | $ | 2,080 |
| | $ | 0 |
| | $ | 2,872 |
| | $ | 348 |
| | $ | 0 |
| | $ | 2 |
| | $ | 0 |
| | $ | 5,302 |
|
| Ending allowance on loans collectively evaluated for impairment | | 8,488 |
| | 824 |
| | 17,606 |
| | 3,031 |
| | 365 |
| | 5,207 |
| | 3,006 |
| | 38,527 |
|
| Ending allowance for loan and lease losses | | $ | 10,568 |
| | $ | 824 |
| | $ | 20,478 |
| | $ | 3,379 |
| | $ | 365 |
| | $ | 5,209 |
| | $ | 3,006 |
| | $ | 43,829 |
|
| Loans and Leases | | |
| | |
| | |
| | |
| | |
| | |
| | |
| | |
|
| Ending balance of loans individually evaluated for impairment | | $ | 10,391 |
| | $ | 0 |
| | $ | 18,023 |
| | $ | 3,493 |
| | $ | 122 |
| | $ | 648 |
| | $ | 0 |
| | $ | 32,677 |
|
| Ending balance of loans collectively evaluated for impairment | | 1,025,277 |
| | 80,741 |
| | 1,478,964 |
| | 349,438 |
| | 47,011 |
| | 375,806 |
| | 115,727 |
| | 3,472,964 |
|
| Total loans, excluding covered loans | | $ | 1,035,668 |
| | $ | 80,741 |
| | $ | 1,496,987 |
| | $ | 352,931 |
| | $ | 47,133 |
| | $ | 376,454 |
| | $ | 115,727 |
| | $ | 3,505,641 |
|
82 First Financial Bancorp 2013 Annual Report
|
| | | | | | | | | | | | | | | | | | | | | | | | | | | | | | | | |
| | | 2012 |
| | | | | Real Estate | | | | | | | | |
| (Dollars in thousands) | | Commercial | | Construction | | Commercial | | Residential | | Installment | | Home Equity | | Other | | Total |
| Allowance for loan and lease losses | | | | | | | | | | | | | | | | |
| Balance at beginning of year | | $ | 10,289 |
| | $ | 4,424 |
| | $ | 18,228 |
| | $ | 4,994 |
| | $ | 1,659 |
| | $ | 10,751 |
| | $ | 2,231 |
| | $ | 52,576 |
|
| Provision for loan and lease losses | | 1,556 |
| | 1,528 |
| | 16,670 |
| | 346 |
| | (883 | ) | | (2,032 | ) | | 1,932 |
| | 19,117 |
|
| Gross charge-offs | | 4,312 |
| | 2,684 |
| | 11,012 |
| | 1,814 |
| | 577 |
| | 3,661 |
| | 1,252 |
| | 25,312 |
|
| Recoveries | | 393 |
| | 0 |
| | 265 |
| | 73 |
| | 323 |
| | 115 |
| | 227 |
| | 1,396 |
|
| Total net charge-offs | | 3,919 |
| | 2,684 |
| | 10,747 |
| | 1,741 |
| | 254 |
| | 3,546 |
| | 1,025 |
| | 23,916 |
|
| Ending allowance for loan and lease losses | | $ | 7,926 |
| | $ | 3,268 |
| | $ | 24,151 |
| | $ | 3,599 |
| | $ | 522 |
| | $ | 5,173 |
| | $ | 3,138 |
| | $ | 47,777 |
|
| Ending allowance on loans individually evaluated for impairment | | $ | 1,151 |
| | $ | 838 |
| | $ | 7,155 |
| | $ | 290 |
| | $ | 0 |
| | $ | 2 |
| | $ | 92 |
| | $ | 9,528 |
|
| Ending allowance on loans collectively evaluated for impairment | | 6,775 |
| | 2,430 |
| | 16,996 |
| | 3,309 |
| | 522 |
| | 5,171 |
| | 3,046 |
| | 38,249 |
|
| Ending allowance for loan and lease losses | | $ | 7,926 |
| | $ | 3,268 |
| | $ | 24,151 |
| | $ | 3,599 |
| | $ | 522 |
| | $ | 5,173 |
| | $ | 3,138 |
| | $ | 47,777 |
|
| Loans and Leases | | |
| | |
| | |
| | |
| | |
| | |
| | |
| | |
|
| Ending balance of loans individually evaluated for impairment | | $ | 16,661 |
| | $ | 2,076 |
| | $ | 35,422 |
| | $ | 2,604 |
| | $ | 0 |
| | $ | 101 |
| | $ | 496 |
| | $ | 57,360 |
|
| Ending balance of loans collectively evaluated for impairment | | 844,372 |
| | 71,441 |
| | 1,381,586 |
| | 315,606 |
| | 56,810 |
| | 367,399 |
| | 84,490 |
| | 3,121,704 |
|
| Total loans, excluding covered loans | | $ | 861,033 |
| | $ | 73,517 |
| | $ | 1,417,008 |
| | $ | 318,210 |
| | $ | 56,810 |
| | $ | 367,500 |
| | $ | 84,986 |
| | $ | 3,179,064 |
|
|
| | | | | | | | | | | | | | | | | | | | | | | | | | | | | | | | |
| | | 2011 |
| | | | | Real Estate | | | | | | | | |
| (Dollars in thousands) | | Commercial | | Construction | | Commercial | | Residential | | Installment | | Home Equity | | Other | | Total |
| Allowance for loan and lease losses | | | | | | | | | | | | | | | | |
| Balance at beginning of year | | $ | 10,138 |
| | $ | 8,326 |
| | $ | 14,917 |
| | $ | 8,907 |
| | $ | 1,981 |
| | $ | 10,939 |
| | $ | 2,027 |
| | $ | 57,235 |
|
| Provision for loan and lease losses | | 2,825 |
| | 2,345 |
| | 13,384 |
| | (2,407 | ) | | (159 | ) | | 1,878 |
| | 1,344 |
| | 19,210 |
|
| Gross charge-offs | | 3,436 |
| | 6,279 |
| | 10,382 |
| | 1,551 |
| | 526 |
| | 2,183 |
| | 1,441 |
| | 25,798 |
|
| Recoveries | | 762 |
| | 32 |
| | 309 |
| | 45 |
| | 363 |
| | 117 |
| | 301 |
| | 1,929 |
|
| Total net charge-offs | | 2,674 |
| | 6,247 |
| | 10,073 |
| | 1,506 |
| | 163 |
| | 2,066 |
| | 1,140 |
| | 23,869 |
|
| Ending allowance for loan and lease losses | | $ | 10,289 |
| | $ | 4,424 |
| | $ | 18,228 |
| | $ | 4,994 |
| | $ | 1,659 |
| | $ | 10,751 |
| | $ | 2,231 |
| | $ | 52,576 |
|
| Ending allowance on loans individually evaluated for impairment | | $ | 3,205 |
| | $ | 2,578 |
| | $ | 6,441 |
| | $ | 313 |
| | $ | 0 |
| | $ | 2 |
| | $ | 0 |
| | $ | 12,539 |
|
| Ending allowance on loans collectively evaluated for impairment | | 7,084 |
| | 1,846 |
| | 11,787 |
| | 4,681 |
| | 1,659 |
| | 10,749 |
| | 2,231 |
| | 40,037 |
|
| Ending allowance for loan and lease losses | | $ | 10,289 |
| | $ | 4,424 |
| | $ | 18,228 |
| | $ | 4,994 |
| | $ | 1,659 |
| | $ | 10,751 |
| | $ | 2,231 |
| | $ | 52,576 |
|
| Loans and Leases | | |
| | |
| | |
| | |
| | |
| | |
| | |
| | |
|
| Ending balance of loans individually evaluated for impairment | | $ | 8,351 |
| | $ | 17,387 |
| | $ | 30,708 |
| | $ | 3,730 |
| | $ | 0 |
| | $ | 101 |
| | $ | 0 |
| | $ | 60,277 |
|
| Ending balance of loans collectively evaluated for impairment | | 848,630 |
| | 97,587 |
| | 1,202,359 |
| | 284,250 |
| | 67,543 |
| | 358,859 |
| | 48,942 |
| | 2,908,170 |
|
| Total loans, excluding covered loans | | $ | 856,981 |
| | $ | 114,974 |
| | $ | 1,233,067 |
| | $ | 287,980 |
| | $ | 67,543 |
| | $ | 358,960 |
| | $ | 48,942 |
| | $ | 2,968,447 |
|
Covered loans. In accordance with the accounting guidance for business combinations, there was no allowance brought forward on covered loans as any credit deterioration evident in the loans at the time of acquisition was included in the determination of the fair value of the loans at the acquisition date. The majority of covered loans are accounted for under FASB ASC Topic 310-30, whereby First Financial is required to periodically re-estimate the expected cash flows on the loans. For further detail regarding covered loan accounting and the related allowance, see Note 1 - Summary of Significant Accounting Policies.
First Financial updated the valuations related to covered loans periodically during 2013 and, as a result of impairment in certain loan pools, recognized provision expense of $0.2 million and realized net charge-offs of $26.5 million, resulting in an ending allowance of $18.9 million as of December 31, 2013. During 2012, the Company recognized total provision expense of $30.9 million and realized net charge-offs of $28.5 million, resulting in an ending allowance of $45.2 million. During
First Financial Bancorp 2013 Annual Report 83
Notes To Consolidated Financial Statements
2011, the Company recognized total provision expense of $64.1 million and realized net charge-offs of $37.7 million, resulting in an ending allowance of $42.8 million.
First Financial also recognized expenses of $5.9 million for 2013, $13.2 million for 2012 and $12.8 million for 2011 primarily related to attorney fees, delinquent taxes, appraisals and losses on covered OREO during the period. The receivable due from the FDIC under loss sharing agreements related to covered provision expense, losses on covered OREO and loss sharing expenses of $3.7 million for 2013, $35.3 million for 2012, and $60.9 million for 2011, was recognized as FDIC loss sharing income and a corresponding increase to the FDIC indemnification asset.
The allowance for loan and lease losses on covered loans as of December 31 was:
|
| | | | | | | | |
| (Dollars in thousands) | | 2013 | | 2012 |
| Commercial | | $ | 9,400 |
| | $ | 19,136 |
|
| Real estate - commercial | | 8,515 |
| | 22,918 |
|
| Real estate - residential | | 761 |
| | 2,599 |
|
| Installment | | 225 |
| | 537 |
|
| Total | | $ | 18,901 |
| | $ | 45,190 |
|
Changes in the allowance for loan and lease losses on covered loans for the three years ended December 31 were as follows:
|
| | | | | | | | | | | | |
| (Dollars in thousands) | | 2013 | | 2012 | | 2011 |
| Balance at beginning of year | | $ | 45,190 |
| | $ | 42,835 |
| | $ | 16,493 |
|
| Provision for loan and lease losses | | 195 |
| | 30,903 |
| | 64,081 |
|
| Loans charged-off | | (39,224 | ) | | (33,907 | ) | | (45,604 | ) |
| Recoveries | | 12,740 |
| | 5,359 |
| | 7,865 |
|
| Balance at end of year | | $ | 18,901 |
| | $ | 45,190 |
| | $ | 42,835 |
|
12. Premises and Equipment
Premises and equipment at December 31 were as follows:
|
| | | | | | | |
| (Dollars in thousands) | 2013 | | 2012 |
| Land and land improvements | $ | 40,802 |
| | $ | 41,550 |
|
| Buildings | 108,231 |
| | 107,939 |
|
| Furniture and fixtures | 59,563 |
| | 63,248 |
|
| Leasehold improvements | 19,070 |
| | 23,941 |
|
| Construction in progress | 184 |
| | 4,653 |
|
| | 227,850 |
| | 241,331 |
|
| | | | |
| Less accumulated depreciation and amortization | 90,740 |
| | 94,615 |
|
| Total | $ | 137,110 |
| | $ | 146,716 |
|
Rental expense recorded under operating leases in 2013, 2012 and 2011 was $8.3 million, $7.5 million and $9.5 million, respectively.
84 First Financial Bancorp 2013 Annual Report
First Financial's future minimum lease payments for operating leases are as follows:
|
| | | |
(Dollars in thousands) | |
| 2014 | $ | 7,527 |
|
| 2015 | 6,903 |
|
| 2016 | 5,935 |
|
| 2017 | 4,733 |
|
| 2018 | 4,046 |
|
| Thereafter | 18,840 |
|
| Total | $ | 47,984 |
|
13. Borrowings
Short-term borrowings on the Consolidated Balance Sheets include repurchase agreements utilized for corporate sweep accounts with cash management account agreements in place, as well as overnight advances from the Federal Loan Home Bank (FHLB). All repurchase agreements are subject to the terms and conditions of repurchase/security agreements between First Financial Bank and the client. To secure the Bank's liability to the client, First Financial Bank is authorized to sell or repurchase U.S. Treasury, government agency and mortgage-backed securities.
The following is a summary of short-term borrowings for the last three years:
|
| | | | | | | | | | | | | | | | | | | | |
| | 2013 | | 2012 | | 2011 |
| (Dollars in thousands) | Amount | | Rate | | Amount | | Rate | | Amount | | Rate |
| At December 31, | | | | | | | | | | | |
| Federal funds purchased and securities sold under agreements to repurchase | $ | 94,749 |
| | 0.05 | % | | $ | 122,570 |
| | 0.13 | % | | $ | 99,431 |
| | 0.10 | % |
| Federal Home Loan Bank borrowings | 654,000 |
| | 0.17 | % | | 502,000 |
| | 0.17 | % | | 0 |
| | N/A |
|
| Total | $ | 748,749 |
| | 0.16 | % | | $ | 624,570 |
| | 0.16 | % | | $ | 99,431 |
| | 0.10 | % |
| | | | | | | | | | | | |
| Average for the year | | | | | | | | | | | |
| Federal funds purchased and securities sold under agreements to repurchase | $ | 115,486 |
| | 0.08 | % | | $ | 86,980 |
| | 0.08 | % | | $ | 96,060 |
| | 0.17 | % |
| Federal Home Loan Bank borrowings | 472,062 |
| | 0.23 | % | | 111,295 |
| | 0.17 | % | | 0 |
| | N/A |
|
| Total | $ | 587,548 |
| | 0.20 | % | | $ | 198,275 |
| | 0.13 | % | | $ | 96,060 |
| | 0.17 | % |
| | | | | | | | | | | | |
| Maximum month-end balances | | | | | | | | | | | |
| Federal funds purchased and securities sold under agreements to repurchase | $ | 158,911 |
| | | | $ | 170,751 |
| | | | $ | 105,291 |
| | |
| Federal Home Loan Bank borrowings | 654,000 |
| | | | 502,000 |
| | | | 0 |
| | |
Long-term debt primarily consists of FHLB long-term advances and repurchase agreements utilizing investment securities pledged as collateral. These instruments are primarily utilized to reduce overnight liquidity risk and to mitigate interest rate sensitivity on the Consolidated Balance Sheets. First Financial has $52.5 million in repurchase agreements which have remaining maturities of less than 2 years and a weighted average rate of 3.49%. Securities pledged as collateral in conjunction with the repurchase agreements are included within Investment securities available-for-sale on the Consolidated Balance Sheets.
FHLB advances, both short-term and long-term, must be collateralized with qualifying assets, typically certain commercial and residential real estate loans, as well as certain government and agency securities. For ease of borrowing execution, First Financial utilizes a blanket collateral agreement with the FHLB, and at December 31, 2013, had collateral pledged with a book value of $3.0 billion.
First Financial Bancorp 2013 Annual Report 85
Notes To Consolidated Financial Statements
The following is a summary of First Financial's long-term debt:
|
| | | | | | | | | | | | | |
| | 2013 | | 2012 |
(Dollars in thousands) | Amount | | Average Rate | | Amount | | Average Rate |
| Federal Home Loan Bank | $ | 7,505 |
| | 3.72 | % | | $ | 9,427 |
| | 3.74 | % |
| National Market Repurchase Agreement | 52,500 |
| | 3.49 | % | | 65,000 |
| | 3.50 | % |
| Capital loan with municipality | 775 |
| | 0.00 | % | | 775 |
| | 0.00 | % |
| Total long-term debt | $ | 60,780 |
| | 3.48 | % | | $ | 75,202 |
| | 3.49 | % |
As of December 31, 2013, the long-term debt matures as follows:
|
| | | | | | | |
(Dollars in thousands) | FHLB | | Repurchase Agreement |
| 2014 | $ | 28 |
| | $ | 27,500 |
|
| 2015 | 29 |
| | 25,000 |
|
| 2016 | 28 |
| | 0 |
|
| 2017 | 29 |
| | 0 |
|
| 2018 | 4,300 |
| | 0 |
|
| Thereafter | 3,091 |
| | 0 |
|
| Total | $ | 7,505 |
| | $ | 52,500 |
|
14. Income Taxes
Income tax expense consisted of the following components:
|
| | | | | | | | | | | |
| (Dollars in thousands) | 2013 | | 2012 | | 2011 |
| Current expense | | | | | |
| Federal | $ | 41,679 |
| | $ | 45,571 |
| | $ | 46,270 |
|
| State | 2,883 |
| | 4,956 |
| | 6,493 |
|
| Total current expense | 44,562 |
| | 50,527 |
| | 52,763 |
|
| Deferred (benefit) expense | | | | | |
| Federal | (21,393 | ) | | (12,499 | ) | | (12,836 | ) |
| State | (3,935 | ) | | (1,586 | ) | | (1,627 | ) |
| Total deferred (benefit) expense | (25,328 | ) | | (14,085 | ) | | (14,463 | ) |
| Income tax expense | $ | 19,234 |
| | $ | 36,442 |
| | $ | 38,300 |
|
The difference between the federal income tax rates, applied to income before income taxes, and the effective rates were due to the following:
|
| | | | | | | | | | | |
| (Dollars in thousands) | 2013 | | 2012 | | 2011 |
| Income taxes computed at federal statutory rate (35%) on income before income taxes | $ | 23,646 |
| | $ | 36,311 |
| | $ | 36,763 |
|
| Tax-exempt income | (1,266 | ) | | (626 | ) | | (586 | ) |
| Bank-owned life insurance | (409 | ) | | (680 | ) | | (612 | ) |
| Tax credits | (1,100 | ) | | (1,200 | ) | | (1,200 | ) |
| State income taxes, net of federal tax benefit | (588 | ) | | 2,191 |
| | 3,163 |
|
| Tax settlement of unconsolidated subsidiary | (1,318 | ) | | 0 |
| | 0 |
|
| Other | 269 |
| | 446 |
| | 772 |
|
| Income tax expense | $ | 19,234 |
| | $ | 36,442 |
| | $ | 38,300 |
|
86 First Financial Bancorp 2013 Annual Report
The major components of the temporary differences that give rise to deferred tax assets and liabilities at December 31, 2013, and 2012, were as follows:
|
| | | | | | | |
| (Dollars in thousands) | 2013 | | 2012 |
| Deferred tax assets | | | |
| Allowance for loan and lease losses | $ | 23,074 |
| | $ | 35,107 |
|
| Deferred compensation | 564 |
| | 496 |
|
| Mark to market adjustment on loans and derivatives | 77 |
| | 128 |
|
| Postretirement benefits other than pension liability | 86 |
| | 113 |
|
| Accrued stock-based compensation | 1,222 |
| | 1,681 |
|
| Other reserves | 143 |
| | 438 |
|
| Other real estate owned write-downs | 2,507 |
| | 3,640 |
|
| Accrued expenses | 3,617 |
| | 4,611 |
|
| Net unrealized losses on investment securities and derivatives | 8,871 |
| | 0 |
|
| Other | 1,390 |
| | 1,094 |
|
| Total deferred tax assets | 41,551 |
| | 47,308 |
|
| | | | |
| Deferred tax liabilities | | | |
| Tax depreciation greater than book depreciation | (7,450 | ) | | (7,997 | ) |
| FHLB and FRB stock | (6,230 | ) | | (17,060 | ) |
| Mortgage-servicing rights | (12 | ) | | (109 | ) |
| Leasing activities | (3,833 | ) | | (1,919 | ) |
| Deferred section 597 gain | (20,550 | ) | | (41,614 | ) |
| Prepaid pension | (15,727 | ) | | (5,839 | ) |
| Intangible assets | (11,612 | ) | | (10,214 | ) |
| Deferred loan fees and costs | (2,136 | ) | | (1,737 | ) |
| Prepaid expenses | (535 | ) | | (721 | ) |
| Net unrealized gains on investment securities and derivatives | 0 |
| | (7,682 | ) |
| Fair value adjustments on acquisitions | (6,714 | ) | | (17,181 | ) |
| Other | (1,180 | ) | | (1,803 | ) |
| Total deferred tax liabilities | (75,979 | ) | | (113,876 | ) |
| Total net deferred tax liability | $ | (34,428 | ) | | $ | (66,568 | ) |
At December 31, 2013, and 2012, First Financial had no FASB ASC Topic 740-10 unrecognized tax benefits recorded. First Financial does not expect the total amount of unrecognized tax benefits to significantly increase within the next twelve months.
First Financial regularly reviews its tax positions and establishes reserves for income tax-related uncertainties based on estimates of whether it is more likely than not that the tax uncertainty would be sustained upon challenge by the appropriate tax authorities which would then result in additional taxes, penalties and interest due. These evaluations are inherently subjective as they require material estimates and may be susceptible to significant change. Provision for tax reserves, if any, is included in income tax expense in the Consolidated Financial Statements. Management determined that no reserve for income tax-related uncertainties was necessary as of December 31, 2013 and 2012.
First Financial and its subsidiaries are subject to U.S. federal income tax as well as state and local income tax in several jurisdictions. Tax years prior to 2010 have been closed and are no longer subject to U.S. federal income tax examinations. Tax years 2010 through 2012 remain open to examination by the federal taxing authority.
First Financial is no longer subject to state and local income tax examinations for years prior to 2009. Tax years 2009 through 2012 remain open to state and local examination by various other jurisdictions.
First Financial Bancorp 2013 Annual Report 87
Notes To Consolidated Financial Statements
15. Accumulated Other Comprehensive Income (Loss)
Shareholders’ equity is affected by transactions and valuations of asset and liability positions that require adjustments to accumulated other comprehensive income (loss). The related tax effects allocated to other comprehensive income and accumulated other comprehensive income (loss) are as follows:
|
| | | | | | | | | | | | | | | | | | | | | | | | | | | | | | | |
| | December 31, 2013 |
| | Total other comprehensive income | | Total accumulated other comprehensive income |
| (Dollars in thousands) | Prior to Reclassification | | Reclassification from | | Pre-tax | | Tax-effect | | Net of tax | | Beginning Balance | | Net Activity | | Ending Balance |
| Unrealized gain (loss) on investment securities | $ | (44,365 | ) | | $ | 1,724 |
| | $ | (46,089 | ) | | $ | 16,998 |
| | $ | (29,091 | ) | | $ | 12,802 |
| | $ | (29,091 | ) | | $ | (16,289 | ) |
| Unrealized gain (loss) on derivatives | 778 |
| | (412 | ) | | 1,190 |
| | (445 | ) | | 745 |
| | (143 | ) | | 745 |
| | 602 |
|
| Retirement obligation | 17,054 |
| | (8,460 | ) | | 25,514 |
| | (9,741 | ) | | 15,773 |
| | (31,338 | ) | | 15,773 |
| | (15,565 | ) |
| Foreign currency translation | (31 | ) | | 0 |
| | (31 | ) | | 0 |
| | (31 | ) | | 2 |
| | (31 | ) | | (29 | ) |
| Total | $ | (26,564 | ) | | $ | (7,148 | ) | | $ | (19,416 | ) | | $ | 6,812 |
| | $ | (12,604 | ) | | $ | (18,677 | ) | | $ | (12,604 | ) | | $ | (31,281 | ) |
|
| | | | | | | | | | | | | | | | | | | | | | | | |
| | | December 31, 2012 |
| | | Total other comprehensive income | | Total accumulated other comprehensive income |
| (Dollars in thousands) | | Pre-tax | | Tax-effect | | Net of tax | | Beginning Balance | | Net Activity | | Ending Balance |
| Unrealized gain (loss) on investment securities | | $ | 214 |
| | $ | (81 | ) | | $ | 133 |
| | $ | 12,669 |
| | $ | 133 |
| | $ | 12,802 |
|
| Unrealized gain (loss) on derivatives | | (229 | ) | | 86 |
| | (143 | ) | | 0 |
| | (143 | ) | | (143 | ) |
| Retirement obligation | | 4,495 |
| | (1,697 | ) | | 2,798 |
| | (34,136 | ) | | 2,798 |
| | (31,338 | ) |
| Foreign currency translation | | 25 |
| | 0 |
| | 25 |
| | (23 | ) | | 25 |
| | 2 |
|
| Total | | $ | 4,505 |
| | $ | (1,692 | ) | | $ | 2,813 |
| | $ | (21,490 | ) | | $ | 2,813 |
| | $ | (18,677 | ) |
|
| | | | | | | | | | | | | | | | | | | | | | | | |
| | | December 31, 2011 |
| | | Total other comprehensive income | | Total accumulated other comprehensive income |
| (Dollars in thousands) | | Pre-tax | | Tax-effect | | Net of tax | | Beginning Balance | | Net Activity | | Ending Balance |
| Unrealized gain (loss) on investment securities | | $ | 5,792 |
| | $ | (2,187 | ) | | $ | 3,605 |
| | $ | 9,064 |
| | $ | 3,605 |
| | $ | 12,669 |
|
| Unrealized gain (loss) on derivatives | | 628 |
| | (237 | ) | | 391 |
| | (391 | ) | | 391 |
| | 0 |
|
| Retirement obligation | | (20,652 | ) | | 7,798 |
| | (12,854 | ) | | (21,282 | ) | | (12,854 | ) | | (34,136 | ) |
| Foreign currency translation | | (588 | ) | | 0 |
| | (588 | ) | | 565 |
| | (588 | ) | | (23 | ) |
| Total | | $ | (14,820 | ) | | $ | 5,374 |
| | $ | (9,446 | ) | | $ | (12,044 | ) | | $ | (9,446 | ) | | $ | (21,490 | ) |
88 First Financial Bancorp 2013 Annual Report
The following table details the activity reclassified from accumulated other comprehensive income into income during the period:
|
| | | | | | |
| | | December 31, 2013 |
| (Dollars in thousands) | | Amount Reclassified from Accumulated Other Comprehensive Income (1) | | Affected Line Item in the Consolidated Statements of Income |
| Gains and loss on cash flow hedges | | | | |
| Interest rate contracts | | $ | (412 | ) | | Interest expense - deposits |
| | | | | |
| Realized gains and losses on securities available-for-sale | | 1,724 |
| | Gains on sales of investments securities |
| | | | | |
| Defined benefit pension plan | | | | |
| Amortization of prior service cost | | 423 |
| | (2) |
| Recognized net actuarial loss | | (2,709 | ) | | (2) |
| Pension settlement charges | | (6,174 | ) | | Pension settlement charges |
| Amortization and settlement charges of defined benefit pension items | | (8,460 | ) | | |
| | | | | |
| Total reclassifications for the period, before tax | | $ | (7,148 | ) | | |
(1) Negative amounts are debits to profit/loss.
(2) Included in the computation of net periodic pension cost (see Note 17 - Employee Benefit Plans for additional details).
16. Capital
Risk-Based Capital. First Financial and its subsidiary, First Financial Bank, are subject to regulatory capital requirements administered by federal banking agencies. Capital adequacy guidelines and, additionally for banks, prompt corrective action regulations involve quantitative measures of assets, liabilities and certain off-balance sheet items calculated under regulatory accounting practices. Capital amounts and classifications are also subject to qualitative judgments by regulators. Failure to meet minimum capital requirements can initiate regulatory action.
Quantitative measures established by regulation to ensure capital adequacy require First Financial to maintain minimum amounts and ratios as defined by the regulations of Total and Tier 1 capital to risk-weighted assets and to average assets. Management believes, as of December 31, 2013, that First Financial met all capital adequacy requirements to which it is subject. At December 31, 2013 and 2012, regulatory notifications categorized First Financial as well-capitalized under the regulatory framework for prompt corrective action. To be categorized as well-capitalized, First Financial must maintain minimum Total risk-based capital, Tier 1 risk-based capital and Tier 1 leverage ratios as set forth in the table below. There have been no conditions or events since those notifications that management believes has changed the Company's categorization.
First Financial's Tier 1 capital is comprised of total shareholders' equity less unrealized gains and losses on investment securities available-for-sale, accounted for under FASB ASC Topic 320, Investments-Debt and Equity Securities, and any amounts resulting from the application of FASB ASC Topic 715, Compensation-Retirement Benefits, that are recorded within accumulated other comprehensive income (loss), intangible assets and any valuation related to mortgage servicing rights. Total risk-based capital consists of Tier 1 capital plus the qualifying allowance for loan and lease losses and gross unrealized gains on equity securities.
For purposes of calculating the leverage ratio, average assets represents quarterly average assets less assets ineligible for total risk-based capital including all or portions of intangible assets, mortgage servicing assets and the allowance for loan and lease losses.
First Financial Bancorp 2013 Annual Report 89
Notes To Consolidated Financial Statements
Actual and required capital amounts and ratios at year-end are presented in the table that follows.
|
| | | | | | | | | | | | | | | | | | | | |
| | Actual | | For Capital Adequacy Purposes | | To Be Well Capitalized Under Prompt Corrective Action Provisions |
| (Dollars in thousands) | Amount | | Ratio | | Amount | | Ratio | | Amount | | Ratio |
| December 31, 2013 | | | | | | | | | | | |
| Total capital to risk-weighted assets | | | | | | | | | | | |
| Consolidated | $ | 679,074 |
| | 15.88 | % | | $ | 342,092 |
| | 8.00 | % | | N/A |
| | N/A |
|
| First Financial Bank | 588,643 |
| | 13.80 | % | | 341,184 |
| | 8.00 | % | | $ | 426,480 |
| | 10.00 | % |
| | | | | | | | | | | | |
| Tier 1 capital to risk-weighted assets | | | | | | | | | | | |
| Consolidated | 624,850 |
| | 14.61 | % | | 171,046 |
| | 4.00 | % | | N/A |
| | N/A |
|
| First Financial Bank | 527,712 |
| | 12.37 | % | | 170,592 |
| | 4.00 | % | | 255,888 |
| | 6.00 | % |
| | | | | | | | | | | | |
| Tier 1 capital to average assets | | | | | | | | | | | |
| Consolidated | 624,850 |
| | 10.11 | % | | 247,106 |
| | 4.00 | % | | N/A |
| | N/A |
|
| First Financial Bank | 527,712 |
| | 8.55 | % | | 246,739 |
| | 4.00 | % | | 308,423 |
| | 5.00 | % |
|
| | | | | | | | | | | | | | | | | | | | |
| | Actual | | For Capital Adequacy Purposes | | To Be Well Capitalized Under Prompt Corrective Action Provisions |
| (Dollars in thousands) | Amount | | Ratio | | Amount | | Ratio | | Amount | | Ratio |
| December 31, 2012 | | | | | | | | | | | |
| Total capital to risk-weighted assets | | | | | | | | | | | |
| Consolidated | $ | 686,961 |
| | 17.60 | % | | $ | 312,328 |
| | 8.00 | % | | N/A |
| | N/A |
|
| First Financial Bank | 586,023 |
| | 15.04 | % | | 311,618 |
| | 8.00 | % | | $ | 389,523 |
| | 10.00 | % |
| | | | | | | | | | | | |
| Tier 1 capital to risk-weighted assets | | | | | | | | | | | |
| Consolidated | 637,176 |
| | 16.32 | % | | 156,164 |
| | 4.00 | % | | N/A |
| | N/A |
|
| First Financial Bank | 529,196 |
| | 13.59 | % | | 155,809 |
| | 4.00 | % | | 233,714 |
| | 6.00 | % |
| | | | | | | | | | | | |
| Tier 1 capital to average assets | | | | | | | | | | | |
| Consolidated | 637,176 |
| | 10.25 | % | | 248,761 |
| | 4.00 | % | | N/A |
| | N/A |
|
| First Financial Bank | 529,196 |
| | 8.52 | % | | 248,408 |
| | 4.00 | % | | 310,511 |
| | 5.00 | % |
Shelf Registrations. On April 28, 2011, First Financial filed a shelf registration on Form S-3 with the SEC. This shelf registration allows First Financial to raise capital from time to time through the sale of various types of securities, subject to approval by the Company's board of directors, and expires on April 28, 2014.
Share Repurchases. In October 2012, First Financial's board of directors approved a share repurchase plan under which the Company has the ability to repurchase up to 5,000,000 common shares. Under the plan, the Company expects to repurchase approximately 1,000,000 common shares annually. This annual target is subject to market conditions and quarterly evaluation by the board as well as balance sheet composition and growth. The Company repurchased 750,145 shares under this plan during 2013 at an average price of $15.70 per share and 460,500 shares under this plan during 2012 at an average price of $14.78. At December 31, 2013, 3,789,355 common shares remained available for purchase under this repurchase plan.
90 First Financial Bancorp 2013 Annual Report
17. Employee Benefit Plans
Pension Plan. First Financial sponsors a non-contributory defined benefit pension plan covering substantially all employees and uses a December 31 measurement date for the plan.
Prior to the fourth quarter of 2013, plan assets were administered and managed by the Wealth Management division of First Financial Bank, N.A. During the fourth quarter of 2013, the investment management and trustee services were transitioned to a third party vendor. As of December 31, 2013, plan assets were primarily invested in publicly traded equity mutual funds and fixed income mutual funds. The pension plan does not directly own any shares of First Financial common stock or any other First Financial security or product.
The investment objective of the Plan is to structure the assets to, as much as feasible, mirror the liabilities of the Plan. The current target asset allocation set by the Bank for the Plan is 60% equities and 40% fixed income, with the aim to use the fixed income component to match the identified near term and long term plan distributions and the equity component to generate growth of capital to meet other future Plan liabilities. The determination of the overall expected long-term return on plan assets was based on the composition of plan assets and a consensus of estimates from similarly managed portfolios of expected future returns.
First Financial re-measured the Company's pension assets and liabilities, and recognized pension settlement charges, as a result of the year-to-date level of lump sum distributions from the Company's pension plan. Consistent with FASB ASC Topic 715, Compensation - Retirement Benefits, pension settlement charges are an acceleration of previously deferred costs that would have been recognized in future periods and are triggered when lump sum distributions exceed an annual accounting threshold for the plan. These pension settlement charges were a result of employee-related changes, including staff retirements as well as reductions due to recent efficiency initiatives, and the resulting lump sum distributions from the plan. First Financial recognized pension settlement charges of $6.2 million for the year ended December 31, 2013. The accounting threshold for lump sum distributions reset January 1, 2014.
As a result of the plan’s updated actuarial projections for 2013 as well as the previously mentioned settlement charges, First Financial recorded expenses related to its pension plan of $5.5 million for 2013, compared to income of $0.5 million and $1.3 million for 2012 and 2011, respectively. First Financial made no cash contributions to the pension plan in 2013 and does not expect to make a cash contribution to the plan in 2014.
First Financial Bancorp 2013 Annual Report 91
Notes To Consolidated Financial Statements
The following tables set forth information concerning amounts recognized in First Financial's Consolidated Balance Sheets and Consolidated Statements of Income:
|
| | | | | | | | |
| | | December 31, |
| (Dollars in thousands) | | 2013 | | 2012 |
| Change in benefit obligation | | | | |
| Benefit obligation at beginning of year | | $ | 67,678 |
| | $ | 63,910 |
|
| Service cost | | 3,705 |
| | 3,483 |
|
| Interest cost | | 2,319 |
| | 2,550 |
|
| Amendments | | 124 |
| | 0 |
|
| Actuarial loss | | (6,745 | ) | | 3,822 |
|
| Benefits paid, excluding settlement | | (1,111 | ) | | (6,087 | ) |
| Settlements | | (10,379 | ) | | 0 |
|
| Benefit obligation at end of year | | 55,591 |
| | 67,678 |
|
| | | | | |
| Change in plan assets | | | | |
| Fair value of plan assets at beginning of year | | 123,716 |
| | 114,972 |
|
| Actual return on plan assets | | 19,421 |
| | 14,831 |
|
| Employer contribution | | 0 |
| | 0 |
|
| Benefits paid, excluding settlement | | (1,111 | ) | | (6,087 | ) |
| Settlements | | (10,379 | ) | | 0 |
|
| Fair value of plan assets at end of year | | 131,647 |
| | 123,716 |
|
| | | | | |
| Amounts recognized in the Consolidated Balance Sheets | | | | |
| Assets | | 76,056 |
| | 56,038 |
|
| Liabilities | | 0 |
| | 0 |
|
| Net amount recognized | | $ | 76,056 |
| | $ | 56,038 |
|
| | | | | |
| Amounts recognized in accumulated other comprehensive income (loss) | | | | |
| Net actuarial loss | | $ | 28,411 |
| | $ | 54,471 |
|
| Net prior service cost | | (3,573 | ) | | (4,119 | ) |
| Deferred tax assets | | (9,273 | ) | | (19,014 | ) |
| Net amount recognized | | $ | 15,565 |
| | $ | 31,338 |
|
| | | | | |
| Change in accumulated other comprehensive income (loss) | | $ | (15,773 | ) | | $ | (2,798 | ) |
| | | | | |
| Accumulated benefit obligation | | $ | 53,664 |
| | $ | 64,273 |
|
92 First Financial Bancorp 2013 Annual Report
|
| | | | | | | | | | | | |
| Components of net periodic benefit cost | | | | | | |
| | | December 31, |
| (Dollars in thousands) | | 2013 | | 2012 | | 2011 |
| Service cost | | $ | 3,705 |
| | $ | 3,483 |
| | $ | 3,177 |
|
| Interest cost | | 2,319 |
| | 2,550 |
| | 2,723 |
|
| Expected return on assets | | (8,988 | ) | | (9,055 | ) | | (9,020 | ) |
| Amortization of prior service cost | | (423 | ) | | (423 | ) | | (423 | ) |
| Recognized net actuarial loss | | 2,709 |
| | 2,964 |
| | 2,194 |
|
| Settlement charges | | 6,174 |
| | 0 |
| | 0 |
|
| Net periodic benefit (income) cost | | 5,496 |
| | (481 | ) | | (1,349 | ) |
| | | | | | | |
| Other changes recognized in accumulated other comprehensive income | | | | |
| Net actuarial (gain) loss | | (17,178 | ) | | (1,954 | ) | | 22,423 |
|
| Prior service cost | | 124 |
| | 0 |
| | 0 |
|
| Amortization of prior service cost | | 423 |
| | 423 |
| | 423 |
|
| Amortization of gain | | (2,709 | ) | | (2,964 | ) | | (2,194 | ) |
| Settlement charges | | (6,174 | ) | | 0 |
| | 0 |
|
| Total recognized in accumulated other comprehensive income | | (25,514 | ) | | (4,495 | ) | | 20,652 |
|
| Total recognized in net periodic benefit cost and accumulated other comprehensive income | | $ | (20,018 | ) | | $ | (4,976 | ) | | $ | 19,303 |
|
| | | | | | | |
| Amount expected to be recognized in net periodic pension expense in the coming year | | | | |
| Amortization of loss | | $ | 1,926 |
| | $ | 3,248 |
| | $ | 3,039 |
|
| Amortization of prior service credit | | (413 | ) | | (423 | ) | | (423 | ) |
|
| | | | | | |
| Weighted-average assumptions to determine | | | | |
| | | December 31, |
| | | 2013 | | 2012 |
| Benefit obligations | | | | |
| Discount rate | | 4.62 | % | | 3.73 | % |
| Rate of compensation increase | | 3.50 | % | | 3.50 | % |
| | | | | |
| Net periodic benefit cost | | | | |
| Discount rate | | 3.73 | % | | 4.22 | % |
| Expected return on plan assets | | 7.50 | % | | 7.50 | % |
| Rate of compensation increase | | 3.50 | % | | 3.50 | % |
The fair value of the plan assets as of December 31, 2013 by asset category is shown in the table that follows:
|
| | | | | | | | | | | | | | | | |
| | | Fair Value Measurements |
| (Dollars in thousands) | | Total | | Quoted Prices in Active Markets for Identical Assets (Level 1) | | Significant Observable Inputs (Level 2) | | Significant Unobservable Inputs (Level 3) |
| Asset Category | | | | | | | | |
| Cash | | $ | 126 |
| | $ | 126 |
| | $ | 0 |
| | $ | 0 |
|
| Fixed income mutual funds | | 50,277 |
| | 50,277 |
| | 0 |
| | 0 |
|
| Equity mutual funds | | 81,244 |
| | 81,244 |
| | 0 |
| | 0 |
|
| Total | | $ | 131,647 |
| | $ | 131,647 |
| | $ | 0 |
| | $ | 0 |
|
First Financial Bancorp 2013 Annual Report 93
Notes To Consolidated Financial Statements
The fair value of the plan assets as of December 31, 2012 by asset category is shown below.
|
| | | | | | | | | | | | | | | | |
| | | Fair Value Measurements |
| (Dollars in thousands) | | Total | | Quoted Prices in Active Markets for Identical Assets (Level 1) | | Significant Observable Inputs (Level 2) | | Significant Unobservable Inputs (Level 3) |
| Asset Category | | | | | | | | |
| Money market fund | | $ | 1,338 |
| | $ | 1,338 |
| | $ | 0 |
| | $ | 0 |
|
| U.S. Treasury securities | | 3,923 |
| | 0 |
| | 3,923 |
| | 0 |
|
| Securities of U.S. government agencies and corporations | | 1,543 |
| | 0 |
| | 1,543 |
| | 0 |
|
| Corporate bonds | | 6,983 |
| | 0 |
| | 6,983 |
| | 0 |
|
| Equity securities: | | | | | | | | |
| Common stock | | 20,899 |
| | 20,899 |
| | 0 |
| | 0 |
|
| Mutual funds | | 22,168 |
| | 22,168 |
| | 0 |
| | 0 |
|
| Exchange traded funds | | 66,844 |
| | 66,844 |
| | 0 |
| | 0 |
|
| Total | | $ | 123,698 |
| | $ | 111,249 |
| | $ | 12,449 |
| | $ | 0 |
|
An asset’s or liability’s fair value measurement level within the fair value hierarchy is based on the lowest level of any input that is significant to the fair value measurement. See Note 21 – Fair Value Disclosures for further information related to the framework for measuring fair value and the fair value hierarchy.
The following benefit payments, which reflect expected future service, as appropriate, are expected to be paid:
|
| | | | |
| (Dollars in thousands) | | Retirement Benefits |
| 2014 | | $ | 3,851 |
|
| 2015 | | 3,840 |
|
| 2016 | | 5,588 |
|
| 2017 | | 4,066 |
|
| 2018 | | 4,893 |
|
| Thereafter | | 27,203 |
|
Effective January 1, 2014 all active plan participants will immediately vest in their benefit, compared to the three year vesting period in effect as of December 31, 2013. Also beginning January 1, 2014, the Pension Plan will no longer offer additional benefits for associates with compensation in excess of 50% of the Social Security wage base.
Thrift Plan. First Financial also sponsors a defined contribution 401(k) thrift plan which covers substantially all employees. Employees may contribute up to 50.0% of their earnings into the plan, not to exceed applicable limitations prescribed by the Internal Revenue Service. Prior to January 1, 2014, First Financial contributed $1.00 for every $1.00 an employee contributed up to 3.00% of the employee's earnings and then contributed $0.50 for every $1.00 thereafter, up to a maximum First Financial total contribution of 4.00% of the employee's earnings. All First Financial matching contributions vest immediately. First Financial contributions to the 401(k) plan are at the discretion of the board of directors. Total First Financial contributions to the 401(k) plan were $2.4 million during 2013, $2.6 million during 2012 and $2.7 million during 2011.
Effective January 1, 2014, First Financial will make matching contributions based on the Company's performance compared to its identified peer group, with the amount of the matching contribution to be determined utilizing management's discretion, and not exceeding 3% of the employee's annual earnings.
Bank-owned Life Insurance. First Financial has purchased life insurance policies on certain employees. The cash surrender value of these policies is carried as an asset on the Consolidated Balance Sheets in Accrued interest and other assets. The carrying value was $88.7 million and $84.5 million at December 31, 2013, and 2012, respectively.
94 First Financial Bancorp 2013 Annual Report
18. Earnings Per Common Share
The following table sets forth the computation of basic and diluted earnings per share:
|
| | | | | | | | | | | | |
| (Dollars in thousands, except per share data) | | 2013 | | 2012 | | 2011 |
| Numerator | | | | | | |
| Net income | | $ | 48,349 |
| | $ | 67,303 |
| | $ | 66,739 |
|
| | | | | | | |
| Denominator | | | | | | |
| Basic earnings per common share - weighted average shares | | 57,270,233 |
| | 57,876,685 |
| | 57,691,979 |
|
| Effect of dilutive securities | | | | | | |
| Employee stock awards | | 692,050 |
| | 873,293 |
| | 907,428 |
|
| Warrants | | 110,771 |
| | 118,814 |
| | 93,798 |
|
| Diluted earnings per common share - adjusted weighted average shares | | 58,073,054 |
| | 58,868,792 |
| | 58,693,205 |
|
| | | | | | | |
| Earnings per share available to common shareholders | | | | | | |
| Basic | | $ | 0.84 |
| | $ | 1.16 |
| | $ | 1.16 |
|
| Diluted | | $ | 0.83 |
| | $ | 1.14 |
| | $ | 1.14 |
|
Warrants to purchase 465,117 shares of the Company's common stock were outstanding as of December 31, 2013, 2012 and 2011, respectively. These warrants, each representing the right to purchase one share of common stock, no par value per share, have an exercise price of $12.12 and expire on December 23, 2018.
Stock options and warrants, with an exercise price greater than the average market price of the common shares, were not included in the computation of net income per diluted share as they would have been anti-dilutive. These out-of-the-money options were 215,452, 1,092,253 and 420,076 at December 31, 2013, 2012 and 2011, respectively.
19. Stock Options And Awards
First Financial follows the provisions of FASB ASC Topic 718, Compensation-Stock Compensation, which requires measurement of compensation cost for all stock-based awards at fair value on the date of grant and recognition of compensation expense over the service period for all awards expected to vest. Share-based compensation expense for stock options and restricted stock awards included in salaries and employee benefits expense for the year ended December 31, 2013, and 2012, was $3.8 million and $4.2 million, respectively. Total unrecognized compensation cost related to nonvested share-based compensation was $4.2 million at December 31, 2013 and is expected to be recognized over a weighted average period of 1.9 years.
As of December 31, 2013, First Financial had five stock-based compensation plans. The 1999 Stock Incentive Plan for Officers and Employees and the 1999 Stock Option Plan for Non-Employee Directors provided incentive stock options, non-qualified stock options and stock awards to certain key employees and non-qualified stock options to non-employee directors (the 1999 Plans) of First Financial for up to 7,507,500 common shares. The options become exercisable at a rate of 25% per year on the anniversary date of the grant and remain outstanding for 10 years after the initial grant date. All options expire at the end of the exercise period. No additional awards may be granted under the 1999 Plans. On June 15, 2009, the shareholders approved the 2009 Employee Stock Plan and the 2009 Non-Employee Director Plan providing for the issuance of 1,500,000 shares and 75,000 shares, respectively. The 2009 Employee Stock Plan expired on June 15, 2012, and thus, no new awards may be granted under this plan. On May 22, 2012, First Financial shareholders approved the First Financial Bancorp. 2012 Stock Plan and amendments to the 2009 Non-Employee Director Plan. At December 31, 2013, there were 1,502,848 shares and 25,647 shares available for issuance under these plans, respectively.
First Financial utilizes the Black-Scholes valuation model to determine the fair value of its stock options. In addition to the stock option strike price, the Black-Scholes valuation model utilizes the use of the following assumptions: the expected dividend yield based on historical dividend payouts; the expected stock price volatility based on the historical volatility of Company stock for a period approximating the expected life of the options; the risk-free rate based on the U.S. Treasury yield
First Financial Bancorp 2013 Annual Report 95
Notes To Consolidated Financial Statements
curve in effect at the time of grant for periods corresponding with the expected life of the option; and the expected option life represented by the period of time the options are expected to be outstanding and is based on historical trends. No options were granted in 2013, 2012 or 2011.
Stock option activity for the year ended December 31, 2013, is summarized as follows:
|
| | | | | | | | | | | | | |
| (Dollars in thousands, except per share data) | | Number of shares | | Weighted Average Exercise Price | | Weighted Average Remaining Contractual Life | | Aggregate Intrinsic Value |
| Outstanding at beginning of year | | 1,991,375 |
| | $ | 14.13 |
| | | | |
| Granted | | 0 |
| | 0.00 |
| | | | |
| Exercised | | (841,888 | ) | | 12.84 |
| | | | |
| Forfeited or expired | | (162,811 | ) | | 16.62 |
| | | | |
| Outstanding at end of year | | 986,676 |
| | $ | 14.82 |
| | 2.5 years | | $ | 2,641 |
|
| Exercisable at end of year | | 986,676 |
| | $ | 14.82 |
| | 2.5 years | | $ | 2,641 |
|
The intrinsic value of stock options is defined as the difference between the current market value and the exercise price. First Financial uses treasury shares purchased under the Company's share repurchase program to satisfy share-based exercises.
|
| | | | | | | | | | | | |
| | | 2013 | | 2012 | | 2011 |
| Total intrinsic value of options exercised | | $ | 3,247 |
| | $ | 1,277 |
| | $ | 477 |
|
| Cash received from exercises | | $ | 73 |
| | $ | 320 |
| | $ | 150 |
|
| Tax benefit from exercises | | $ | 1,422 |
| | $ | 1,576 |
| | $ | 1,421 |
|
Restricted stock awards have historically been recorded as deferred compensation, a component of shareholders' equity, at the fair value of these awards at the grant date and amortized on a straight-line basis to salaries and benefits expense over the specified vesting periods, which is currently three years for employees and one year for non-employee directors. The vesting of these awards for employees and non-employee directors only require a service period to be met, however, in 2013, additional awards were granted which also require certain performance measures to be met.
Activity in restricted stock for the previous three years ended December 31 is summarized as follows:
|
| | | | | | | | | | | | | | | | | | | | | |
| | | 2013 | | 2012 | | 2011 |
| | | Number of shares | | Weighted Average Grant Date Fair Value | | Number of shares | | Weighted Average Grant Date Fair Value | | Number of shares | | Weighted Average Grant Date Fair Value |
| Nonvested at beginning of year | | 518,756 |
| | $ | 16.65 |
| | 518,736 |
| | $ | 15.99 |
| | 485,498 |
| | $ | 15.63 |
|
| Granted | | 302,175 |
| | 15.65 |
| | 290,706 |
| | 17.00 |
| | 261,356 |
| | 16.02 |
|
| Vested | | (263,302 | ) | | 16.63 |
| | (228,233 | ) | | 15.58 |
| | (200,525 | ) | | 14.87 |
|
| Forfeited | | (101,597 | ) | | 16.26 |
| | (62,453 | ) | | 16.61 |
| | (27,593 | ) | | 18.10 |
|
| Nonvested at end of year | | 456,032 |
| | $ | 16.00 |
| | 518,756 |
| | $ | 16.65 |
| | 518,736 |
| | $ | 15.99 |
|
The fair value of restricted stock is determined based on the number of shares granted and the quoted price of First Financial's common stock. The total fair value of restricted stock vested during 2013 was $4.4 million.
96 First Financial Bancorp 2013 Annual Report
20. Loans to Related Parties
Loans to directors, executive officers, principal holders of First Financial’s common stock and certain related persons were as follows:
|
| | | | | | | | | | | | |
| (Dollars in thousands) | | 2013 | | 2012 | | 2011 |
| Beginning balance | | $ | 10,426 |
| | $ | 10,599 |
| | $ | 10,375 |
|
| Additions | | 827 |
| | 1,791 |
| | 1,297 |
|
| Deductions | | (3,156 | ) | | (1,964 | ) | | (1,073 | ) |
| Ending balance | | $ | 8,097 |
| | $ | 10,426 |
| | $ | 10,599 |
|
| Loans 90 days past due | | $ | 0 |
| | $ | 0 |
| | $ | 0 |
|
Related parties of First Financial, as defined for inclusion in the table above, were clients of and had transactions with subsidiaries of First Financial in the ordinary course of business during the periods noted. Additional transactions may be expected in the ordinary course of business in the future. All outstanding loans, commitments, financing leases, transactions in money market instruments and deposit relationships included in such transactions were made on substantially the same terms, including interest rates and collateral, as those prevailing at the time for comparable transactions with non-related parties, and did not involve greater than a normal risk of collectibility or present other unfavorable features.
21. Fair Value Disclosures
Fair Value Measurement
The fair value framework as disclosed in the Fair Value Measurements and Disclosure Topic of FASB ASC Topic 825, Financial Instruments (Fair Value Topic), includes a hierarchy which focuses on prioritizing the inputs used in valuation techniques. The fair value hierarchy gives the highest priority to quoted prices in active markets for identical assets or liabilities (Level 1), a lower priority to observable inputs other than quoted prices in active markets for identical assets and liabilities (Level 2), and the lowest priority to unobservable inputs (Level 3). When determining the fair value measurements for assets and liabilities, First Financial looks to active markets to price identical assets or liabilities whenever possible and classifies such items in Level 1. When identical assets and liabilities are not traded in active markets, First Financial looks to observable market data for similar assets and liabilities and classifies such items as Level 2. Certain assets and liabilities are not actively traded in observable markets and First Financial must use alternative techniques, based on unobservable inputs, to determine the fair value and classifies such items as Level 3. The level within the fair value hierarchy is based on the lowest level of input that is significant in the fair value measurement.
The following methods, assumptions and valuation techniques were used by First Financial to measure different financial assets and liabilities at fair value and in estimating its fair value disclosures for financial instruments.
Cash and short-term investments. The carrying amounts reported in the Consolidated Balance Sheets for cash and short-term investments, such as federal funds sold, approximated the fair value of those instruments. The Company classifies cash and short-term investments in Level 1 of the fair value hierarchy.
Investment securities. Investment securities classified as trading and available-for-sale are recorded at fair value on a recurring basis. Fair value measurement is based upon quoted market prices, when available (Level 1). If quoted market prices are not available, fair values are measured utilizing independent valuation techniques of identical or similar investment securities. First Financial compiles prices from various sources who may apply such techniques as matrix pricing to determine the value of identical or similar investment securities (Level 2). Matrix pricing is a mathematical technique widely used in the banking industry to value investment securities without relying exclusively on quoted prices for the specific investment securities but rather relying on the investment securities’ relationship to other benchmark quoted investment securities. Any investment securities not valued based upon the methods above are considered Level 3.
First Financial utilizes information provided by a third-party investment securities administrator in analyzing the investment securities portfolio in accordance with the fair value hierarchy of the Fair Value Topic. The administrator’s evaluation of investment security portfolio pricing is performed using a combination of prices and data from other sources, along with internally developed matrix pricing models and assistance from the provider’s internal fixed income analysts and trading desk. The administrator’s month-end pricing process includes a series of quality assurance activities where prices are
First Financial Bancorp 2013 Annual Report 97
Notes To Consolidated Financial Statements
compared to recent market conditions, previous evaluation prices and between the various pricing services. These processes produce a series of quality assurance reports on which price exceptions are identified, reviewed and where appropriate, securities are repriced. In the event of a materially different price, the administrator will report the variance as a “price challenge” and review the pricing methodology in detail. The results of the quality assurance process are incorporated into the selection of pricing providers by the portfolio manager.
First Financial reviews the pricing methodologies utilized by the administrator to ensure the fair value determination is consistent with the applicable accounting guidance and that the investments are properly classified in the fair value hierarchy. Further, the Company periodically validates the fair values for a sample of securities in the portfolio by comparing the fair values provided by the administrator to prices from other independent sources for the same or similar securities. First Financial analyzes unusual or significant variances and conducts additional research with the administrator, if necessary, and takes appropriate action based on its findings.
Loans held for sale. Loans held for sale are carried at the lower of cost or fair value. These loans currently consist of one-to-four family residential real estate loans originated for sale to qualified third parties. Fair value is based on the contractual price to be received from these third parties, which is not materially different than cost due to the short duration between origination and sale (Level 2). As such, First Financial records any fair value adjustments on a nonrecurring basis. Gains and losses on the sale of loans are recorded as net gains from sales of loans within noninterest income in the Consolidated Statements of Income.
Loans, excluding covered loans. The fair value of commercial, commercial real estate, residential real estate and consumer loans were estimated by discounting the future cash flows using the current rates at which similar loans would be made to borrowers with similar credit ratings and for the same remaining maturities or repricing frequency. The Company classifies the estimated fair value of uncovered loans as Level 3 in the fair value hierarchy.
Loans are designated as impaired when, in the judgment of management based on current information and events, it is probable that all amounts due according to the contractual terms of the loan agreement will not be collected. Impaired loans are valued at the lower of cost or fair value for purposes of determining the appropriate amount of impairment to be allocated to the allowance for loan and lease losses. Fair value is generally measured based on the value of the collateral securing the loans. Collateral may be in the form of real estate or business assets including equipment, inventory and accounts receivable. The vast majority of the collateral is real estate. The value of real estate collateral is determined utilizing an income or market valuation approach based on an appraisal conducted by an independent, licensed third-party appraiser (Level 3). The value of business equipment is based upon an outside appraisal if deemed significant, or the net book value on the applicable borrower financial statements if not considered significant. Likewise, values for inventory and accounts receivable collateral are based on borrower financial statement balances or aging reports on a discounted basis as appropriate (Level 3). Impaired loans allocated to the allowance for loan and lease losses are measured at fair value on a nonrecurring basis. Any fair value adjustments are recorded in the period incurred as provision for loan and lease losses on the Consolidated Statements of Income.
Covered loans. Fair values for covered loans accounted for under FASB ASC Topic 310-30 were based on a discounted cash flow methodology that considered factors including the type of loan and related collateral, classification status, fixed or variable interest rate, term of loan and whether or not the loan was amortizing, and a discount rate reflecting the Company's assessment of risk inherent in the cash flow estimates. These covered loans were grouped together according to similar characteristics and were treated in the aggregate when applying various valuation techniques. First Financial estimated the cash flows expected to be collected on these loans based upon the expected remaining life of the underlying loans, which includes the effects of estimated prepayments. These cash flow evaluations are inherently subjective as they require material estimates, all of which may be susceptible to significant change.
Fair values for covered loans accounted for outside of FASB ASC Topic 310-30 were estimated by discounting the future cash flows using current interest rates at which similar loans would be made to borrowers with similar credit ratings and for the same remaining maturities or repricing frequency. The carrying amount of accrued interest approximates its fair value.
The Company classifies the estimated fair value of covered loans as Level 3 in the fair value hierarchy.
FDIC indemnification asset. Fair value of the FDIC indemnification asset was estimated using projected cash flows related to the loss sharing agreements based on expected reimbursements for losses and the applicable loss sharing percentages. The expected cash flows are discounted to reflect the uncertainty of the timing and receipt of the loss sharing reimbursement from the FDIC. These cash flow evaluations are inherently subjective as they require material estimates, all of which may be susceptible to significant change, and may be impacted by the relatively short remaining term of loss sharing coverage on covered commercial assets. The five year period of loss protection will expire for the majority of First Financial's covered
98 First Financial Bancorp 2013 Annual Report
commercial loans and covered OREO during the third quarter of 2014. The Company classifies the estimated fair value of the indemnification asset as Level 3 in the fair value hierarchy.
Deposit liabilities. The fair value of demand deposits, savings accounts and certain money-market deposits was the amount payable on demand at the reporting date. The carrying amounts for variable-rate certificates of deposit approximated their fair values at the reporting date. The fair value of fixed-rate certificates of deposit was estimated using a discounted cash flow calculation which applies the interest rates currently offered for deposits of similar remaining maturities. The carrying amount of accrued interest approximates its fair value. The Company classifies the estimated fair value of deposit liabilities as Level 2 in the fair value hierarchy.
Borrowings. The carrying amounts of federal funds purchased and securities sold under agreements to repurchase and other short-term borrowings approximate their fair values. The Company classifies the estimated fair value of short-term borrowings as Level 1 of the fair value hierarchy.
The fair value of long-term debt is estimated using a discounted cash flow calculation which utilizes the interest rates currently offered for borrowings of similar remaining maturities. Third-party valuations are used for long-term debt with embedded options, such as call features. The Company classifies the estimated fair value of long-term debt as Level 2 in the fair value hierarchy.
Commitments to extend credit and standby letters of credit. Pricing of these financial instruments is based on the credit quality and relationship, fees, interest rates, probability of funding and compensating balance and other covenants or requirements. Loan commitments generally have fixed expiration dates, are variable rate and contain termination and other clauses which provide for relief from funding in the event that there is a significant deterioration in the credit quality of the client. Many loan commitments are expected to expire without being drawn upon. The rates and terms of the commitments to extend credit and the standby letters of credit are competitive with those in First Financial’s market area. The carrying amounts are reasonable estimates of the fair value of these financial instruments. Carrying amounts, which are comprised of the
unamortized fee income and, where necessary, reserves for any expected credit losses from these financial instruments, are immaterial.
Derivatives. The fair values of derivative instruments are based primarily on a net present value calculation of the cash flows related to the interest rate swaps at the reporting date, using primarily observable market inputs such as interest rate yield curves. The discounted net present value calculated represents the cost to terminate the swap if First Financial should choose to do so. Additionally, First Financial utilizes a vendor-developed, proprietary model to value the credit risk component of both the derivative assets and liabilities. The credit valuation adjustment is recorded as an adjustment to the fair value of the derivative asset or liability on the reporting date. Derivative instruments are classified as Level 2 in the fair value hierarchy.
First Financial Bancorp 2013 Annual Report 99
Notes To Consolidated Financial Statements
The estimated fair values of financial instruments not measured at fair value on either a recurring or nonrecurring basis in First Financial’s consolidated financial statements were as follows:
|
| | | | | | | | | | | | | | | |
| | Carrying | Estimated fair value |
| (Dollars in thousands) | value | Total | Level 1 | Level 2 | Level 3 |
| December 31, 2013 | | | | | |
| Financial assets | | | | | |
| Cash and short-term investments | $ | 143,450 |
| $ | 143,450 |
| $ | 143,450 |
| $ | 0 |
| $ | 0 |
|
| Investment securities held-to-maturity | 837,272 |
| 824,985 |
| 0 |
| 824,985 |
| 0 |
|
| Other investments | 47,427 |
| 47,427 |
| 0 |
| 47,427 |
| 0 |
|
| Loans held for sale | 8,114 |
| 8,114 |
| 0 |
| 8,114 |
| 0 |
|
| Loans, excluding covered loans | 3,461,812 |
| 3,455,776 |
| 0 |
| 0 |
| 3,455,776 |
|
| Covered loans | 438,972 |
| 451,545 |
| 0 |
| 0 |
| 451,545 |
|
| FDIC indemnification asset | 45,091 |
| 34,820 |
| 0 |
| 0 |
| 34,820 |
|
| | | | | | |
| Financial liabilities | |
| |
| | | |
| Deposits | |
| |
| | | |
| Noninterest-bearing | $ | 1,147,452 |
| $ | 1,147,452 |
| $ | 0 |
| $ | 1,147,452 |
| $ | 0 |
|
| Interest-bearing demand | 1,125,723 |
| 1,125,723 |
| 0 |
| 1,125,723 |
| 0 |
|
| Savings | 1,612,005 |
| 1,612,005 |
| 0 |
| 1,612,005 |
| 0 |
|
| Time | 952,327 |
| 951,220 |
| 0 |
| 951,220 |
| 0 |
|
| Total deposits | 4,837,507 |
| 4,836,400 |
| 0 |
| 4,836,400 |
| 0 |
|
| Short-term borrowings | 748,749 |
| 748,749 |
| 748,749 |
| 0 |
| 0 |
|
| Long-term debt | 60,780 |
| 62,706 |
| 0 |
| 62,706 |
| 0 |
|
100 First Financial Bancorp 2013 Annual Report
|
| | | | | | | | | | | | | | | |
| | Carrying | Estimated Fair Value |
| (Dollars in thousands) | Value | Total | Level 1 | Level 2 | Level 3 |
| December 31, 2012 | | | | | |
| Financial assets | | | | | |
| Cash and short-term investments | $ | 158,843 |
| $ | 158,843 |
| $ | 158,843 |
| $ | 0 |
| $ | 0 |
|
| Investment securities held-to-maturity | 770,755 |
| 778,474 |
| 0 |
| 778,474 |
| 0 |
|
| Other investments | 71,492 |
| 71,492 |
| 0 |
| 71,492 |
| 0 |
|
| Loans held for sale | 16,256 |
| 16,256 |
| 0 |
| 16,256 |
| 0 |
|
| Loans, excluding covered loans | 3,131,287 |
| 3,145,120 |
| 0 |
| 0 |
| 3,145,120 |
|
| Covered loans | 702,926 |
| 713,797 |
| 0 |
| 0 |
| 713,797 |
|
| FDIC indemnification asset | 119,607 |
| 106,380 |
| 0 |
| 0 |
| 106,380 |
|
| | | | | | |
| Financial liabilities | | | | | |
| Deposits | | | | | |
| Noninterest-bearing | $ | 1,102,774 |
| $ | 1,102,774 |
| $ | 0 |
| $ | 1,102,774 |
| $ | 0 |
|
| Interest-bearing demand | 1,160,815 |
| 1,160,815 |
| 0 |
| 1,160,815 |
| 0 |
|
| Savings | 1,623,614 |
| 1,623,614 |
| 0 |
| 1,623,614 |
| 0 |
|
| Time | 1,068,637 |
| 1,072,201 |
| 0 |
| 1,072,201 |
| 0 |
|
| Total deposits | 4,955,840 |
| 4,959,404 |
| 0 |
| 4,959,404 |
| 0 |
|
| Short-term borrowings | 624,570 |
| 624,570 |
| 624,570 |
| 0 |
| 0 |
|
| Long-term debt | 75,202 |
| 78,941 |
| 0 |
| 78,941 |
| 0 |
|
First Financial Bancorp 2013 Annual Report 101
Notes To Consolidated Financial Statements
The following table summarizes the financial assets and liabilities measured at fair value on a recurring basis were as follows:
|
| | | | | | | | | | | | | | | | | | | | |
| | | Fair Value Measurements Using | | Netting | | Assets/Liabilities |
| (Dollars in thousands) | | Level 1 | | Level 2 | | Level 3 | | Adjustments (1) | | at Fair Value |
| December 31, 2013 | | | | | | | | | | |
| Assets | | | | | | | | | | |
| Derivatives | | $ | 0 |
| | $ | 13,477 |
| | $ | 0 |
| | $ | (13,477 | ) | | $ | 0 |
|
| Available-for-sale investment securities | | 7,976 |
| | 905,625 |
| | 0 |
| | 0 |
| | 913,601 |
|
| Total | | $ | 7,976 |
| | $ | 919,102 |
| | $ | 0 |
| | $ | (13,477 | ) | | $ | 913,601 |
|
| | | | | | | | | | | |
| Liabilities | | |
| | |
| | |
| | |
| | |
|
| Derivatives | | $ | 0 |
| | $ | 14,431 |
| | $ | 0 |
| | $ | (13,477 | ) | | $ | 954 |
|
|
| | | | | | | | | | | | | | | | | | | | |
| | | Fair Value Measurements Using | | Netting | | Assets/Liabilities |
| (Dollars in thousands) | | Level 1 | | Level 2 | | Level 3 | | Adjustments (1) | | at Fair Value |
| December 31, 2012 | | | | | | | | | | |
| Assets | | | | | | | | | | |
| Derivatives | | $ | 0 |
| | $ | 24,135 |
| | $ | 0 |
| | $ | (24,135 | ) | | $ | 0 |
|
| Available-for-sale investment securities | | 144 |
| | 1,031,952 |
| | 0 |
| | 0 |
| | 1,032,096 |
|
| Total | | $ | 144 |
| | $ | 1,056,087 |
| | $ | 0 |
| | $ | (24,135 | ) | | $ | 1,032,096 |
|
| | | | | | | | | | | |
| Liabilities | | |
| | |
| | |
| | |
| | |
|
| Derivatives | | $ | 0 |
| | $ | 26,652 |
| | $ | 0 |
| | $ | (24,135 | ) | | $ | 2,517 |
|
| |
(1) | Amounts represent the impact of legally enforceable master netting arrangements that allow First Financial to settle positive and negative positions and also cash collateral held with the same counterparties. |
Certain financial assets and liabilities are measured at fair value on a nonrecurring basis. Adjustments to the fair market value of these assets usually result from the application of lower-of-cost-or-market accounting or write-downs of individual assets. The following table summarizes financial assets and liabilities measured at fair value on a nonrecurring basis were as follows:
|
| | | | | | | | | | | | |
| | | Fair Value Measurements Using |
| (Dollars in thousands) | | Level 1 | | Level 2 | | Level 3 |
| December 31, 2013 | | | | | | |
| Assets | | | | | | |
Impaired loans (1) | | $ | 0 |
| | $ | 0 |
| | $ | 13,699 |
|
| OREO | | 0 |
| | 0 |
| | 5,358 |
|
| Covered OREO | | 0 |
| | 0 |
| | 8,937 |
|
102 First Financial Bancorp 2013 Annual Report
|
| | | | | | | | | | | | |
| | | Fair Value Measurements Using |
| (Dollars in thousands) | | Level 1 | | Level 2 | | Level 3 |
| December 31, 2012 | | | | | | |
| Assets | | | | | | |
Impaired loans (1) | | $ | 0 |
| | $ | 0 |
| | $ | 19,564 |
|
| OREO | | 0 |
| | 0 |
| | 5,651 |
|
| Covered OREO | | 0 |
| | 0 |
| | 14,059 |
|
(1) Amounts represent the fair value of collateral for impaired loans allocated to the allowance for loan and lease losses. Fair values are determined using actual market prices (Level 1), observable market data for similar assets and liabilities (Level 2), and independent third party valuations and borrower records, discounted as appropriate (Level 3).
22. First Financial Bancorp. (Parent Company Only) Financial Information
Balance Sheets
|
| | | | | | | |
| | December 31, |
| (Dollars in thousands) | 2013 | | 2012 |
| Assets | | | |
| Cash | $ | 88,420 |
| | $ | 106,196 |
|
| Investment securities, available for sale | 229 |
| | 3,623 |
|
| Other investments | 4,851 |
| | 0 |
|
| Subordinated notes from subsidiaries | 7,500 |
| | 7,500 |
|
| Investment in subsidiaries | | | |
| Commercial banks | 557,872 |
| | 575,701 |
|
| Nonbanks | 18,682 |
| | 18,671 |
|
| Total investment in subsidiaries | 576,554 |
| | 594,372 |
|
| Premises and equipment | 1,455 |
| | 1,706 |
|
| Other assets | 13,942 |
| | 15,058 |
|
| Total assets | $ | 692,951 |
| | $ | 728,455 |
|
| | | | |
| Liabilities | | | |
| Dividends payable | $ | 9,178 |
| | $ | 16,869 |
|
| Other liabilities | 1,612 |
| | 1,161 |
|
| Total liabilities | 10,790 |
| | 18,030 |
|
| Shareholders’ equity | 682,161 |
| | 710,425 |
|
| Total liabilities and shareholders’ equity | $ | 692,951 |
| | $ | 728,455 |
|
First Financial Bancorp 2013 Annual Report 103
Notes To Consolidated Financial Statements
Statements of Income
|
| | | | | | | | | | | |
| | Years Ended December 31, |
| (Dollars in thousands) | 2013 | | 2012 | | 2011 |
| Income | | | | | |
| Interest income | $ | 75 |
| | $ | 55 |
| | $ | 70 |
|
| Noninterest income | 0 |
| | 421 |
| | 0 |
|
| Dividends from subsidiaries | 58,700 |
| | 73,800 |
| | 48,700 |
|
| Total income | 58,775 |
| | 74,276 |
| | 48,770 |
|
| | | | | | |
| Expenses | | | | | |
| Interest expense | 0 |
| | 0 |
| | 391 |
|
| Provision for loan and lease losses | 0 |
| | 0 |
| | 739 |
|
| Salaries and employee benefits | 4,042 |
| | 4,612 |
| | 4,449 |
|
| Miscellaneous professional services | 663 |
| | 916 |
| | 719 |
|
| Other | 5,059 |
| | 5,209 |
| | 5,240 |
|
| Total expenses | 9,764 |
| | 10,737 |
| | 11,538 |
|
| Income before income taxes and equity in undistributed net earnings of subsidiaries | 49,011 |
| | 63,539 |
| | 37,232 |
|
| Income tax benefit | (3,659 | ) | | (3,869 | ) | | (4,263 | ) |
| Equity in undistributed (loss) earnings of subsidiaries | (4,321 | ) | | (105 | ) | | 25,244 |
|
| Net income | $ | 48,349 |
| | $ | 67,303 |
| | $ | 66,739 |
|
104 First Financial Bancorp 2013 Annual Report
Statements of Cash Flows
|
| | | | | | | | | | | |
| | Years Ended December 31, |
| (Dollars in thousands) | 2013 | | 2012 | | 2011 |
| Operating activities | | | | | |
| Net income | $ | 48,349 |
| | $ | 67,303 |
| | $ | 66,739 |
|
| Adjustments to reconcile net income to net cash provided by operating activities | | | | |
| Equity in undistributed loss (earnings) of subsidiaries | 4,321 |
| | 105 |
| | (25,244 | ) |
| Provision for loan and lease losses | 0 |
| | 0 |
| | 739 |
|
| Depreciation and amortization | 26 |
| | 27 |
| | 31 |
|
| Stock-based compensation expense | 3,803 |
| | 4,186 |
| | 3,935 |
|
| Deferred income taxes | (676 | ) | | (207 | ) | | (509 | ) |
| (Decrease) increase in dividends payable | (7,691 | ) | | 673 |
| | 10,342 |
|
| Increase (decrease) in other liabilities | 7,719 |
| | (1,799 | ) | | (10,003 | ) |
| Decrease (increase) in other assets | 1,266 |
| | (139 | ) | | (241 | ) |
| Net cash provided by operating activities | 57,117 |
| | 70,149 |
| | 45,789 |
|
| | | | | | |
| Investing activities | | | | | |
| Proceeds from calls and maturities of investment securities | 48 |
| | 0 |
| | 158 |
|
| Purchases of investment securities | (88 | ) | | (474 | ) | | (137 | ) |
| Net decrease in loans | 0 |
| | 0 |
| | 2,681 |
|
| Purchases of premises and equipment | (80 | ) | | 0 |
| | 0 |
|
| Other | 307 |
| | 109 |
| | 514 |
|
| Net cash provided by (used in) investing activities | 187 |
| | (365 | ) | | 3,216 |
|
| | | | | | |
| Financing activities | | | | | |
| Redemption of junior subordinated debentures | 0 |
| | 0 |
| | (20,620 | ) |
| Cash dividends paid on common stock | (61,429 | ) | | (67,797 | ) | | (35,312 | ) |
| Treasury stock purchase | (11,778 | ) | | (6,806 | ) | | 0 |
|
| Proceeds from exercise of stock options, net of shares purchased | 73 |
| | 320 |
| | 63 |
|
| Excess tax benefit on share-based compensation | 686 |
| | 438 |
| | 259 |
|
| Other | (2,632 | ) | | (1,400 | ) | | 478 |
|
| Net cash used in financing activities | (75,080 | ) | | (75,245 | ) | | (55,132 | ) |
| Decrease in cash | (17,776 | ) | | (5,461 | ) | | (6,127 | ) |
| Cash at beginning of year | 106,196 |
| | 111,657 |
| | 117,784 |
|
| Cash at end of year | $ | 88,420 |
| | $ | 106,196 |
| | $ | 111,657 |
|
First Financial Bancorp 2013 Annual Report 105
|
| | | | | | | | | | | | | | | | |
| Quarterly Financial And Common Stock Data (Unaudited) | | | |
| | | | | | | | | |
| | | Three months ended |
| (Dollars in thousands, except per share data) | | March 31 | | June 30 | | September 30 | | December 31 |
| 2013 | | | | | | | | |
| Interest income | | $ | 63,509 |
| | $ | 62,321 |
| | $ | 59,531 |
| | $ | 59,847 |
|
| Interest expense | | 4,843 |
| | 4,243 |
| | 3,759 |
| | 4,043 |
|
| Net interest income | | 58,666 |
| | 58,078 |
| | 55,772 |
| | 55,804 |
|
| Provision for loan and lease losses - uncovered | | 3,041 |
| | 2,409 |
| | 1,413 |
| | 1,851 |
|
| Provision for loan and lease losses - covered | | 9,042 |
| | (8,283 | ) | | 5,293 |
| | (5,857 | ) |
| Noninterest income | | | | | | | | |
| Gain on sale of investment securities | | 1,536 |
| | 188 |
| | 0 |
| | 0 |
|
| FDIC loss sharing income | | 8,934 |
| | (7,384 | ) | | 5,555 |
| | (3,385 | ) |
| Accelerated discount on covered loans | | 1,935 |
| | 1,935 |
| | 1,711 |
| | 1,572 |
|
| All other | | 14,293 |
| | 16,876 |
| | 15,025 |
| | 14,856 |
|
| Total noninterest income | | 26,698 |
| | 11,615 |
| | 22,291 |
| | 13,043 |
|
| Noninterest expenses | | 53,106 |
| | 53,283 |
| | 48,801 |
| | 70,285 |
|
| Income before income taxes | | 20,175 |
| | 22,284 |
| | 22,556 |
| | 2,568 |
|
| Income tax expense | | 6,351 |
| | 6,455 |
| | 7,645 |
| | (1,217 | ) |
| Net income | | $ | 13,824 |
| | $ | 15,829 |
| | $ | 14,911 |
| | $ | 3,785 |
|
| | | | | | | | | |
| Earnings per common share: | | | | | | | | |
| Basic | | $ | 0.24 |
| | $ | 0.28 |
| | $ | 0.26 |
| | $ | 0.07 |
|
| Diluted | | $ | 0.24 |
| | $ | 0.27 |
| | $ | 0.26 |
| | $ | 0.07 |
|
| Cash dividends paid per common share | | $ | 0.28 |
| | $ | 0.28 |
| | $ | 0.24 |
| | $ | 0.27 |
|
| Market price | | | | | | | | |
| High | | $ | 16.07 |
| | $ | 16.05 |
| | $ | 16.47 |
| | $ | 17.59 |
|
| Low | | $ | 14.46 |
| | $ | 14.52 |
| | $ | 14.89 |
| | $ | 14.56 |
|
| | | | | | | | | |
| 2012 | | | | | | | | |
| Interest income | | $ | 75,097 |
| | $ | 71,923 |
| | $ | 66,305 |
| | $ | 67,605 |
|
| Interest expense | | 8,408 |
| | 7,093 |
| | 6,459 |
| | 5,629 |
|
| Net interest income | | 66,689 |
| | 64,830 |
| | 59,846 |
| | 61,976 |
|
| Provision for loan and lease losses - uncovered | | 3,258 |
| | 8,364 |
| | 3,613 |
| | 3,882 |
|
| Provision for loan and lease losses - covered | | 12,951 |
| | 6,047 |
| | 6,622 |
| | 5,283 |
|
| Noninterest income | | | | | | | | |
| Gain on sale of investment securities | | 0 |
| | 0 |
| | 2,617 |
| | 1,011 |
|
| FDIC loss sharing income | | 12,816 |
| | 8,280 |
| | 8,496 |
| | 5,754 |
|
| Accelerated discount on covered loans | | 3,645 |
| | 3,764 |
| | 3,798 |
| | 2,455 |
|
| All other | | 15,464 |
| | 21,501 |
| | 15,919 |
| | 16,901 |
|
| Total noninterest income | | 31,925 |
| | 33,545 |
| | 30,830 |
| | 26,121 |
|
| Noninterest expenses | | 55,778 |
| | 57,459 |
| | 55,286 |
| | 53,474 |
|
| Income before income taxes | | 26,627 |
| | 26,505 |
| | 25,155 |
| | 25,458 |
|
| Income tax expense | | 9,633 |
| | 8,703 |
| | 8,913 |
| | 9,193 |
|
| Net income | | $ | 16,994 |
| | $ | 17,802 |
| | $ | 16,242 |
| | $ | 16,265 |
|
| | | | | | | | | |
| Earnings per common share: | | | | | | | | |
| Basic | | $ | 0.29 |
| | $ | 0.31 |
| | $ | 0.28 |
| | $ | 0.28 |
|
| Diluted | | $ | 0.29 |
| | $ | 0.30 |
| | $ | 0.28 |
| | $ | 0.28 |
|
| Cash dividends paid per common share | | $ | 0.27 |
| | $ | 0.31 |
| | $ | 0.29 |
| | $ | 0.30 |
|
| Market price | | | | | | | | |
| High | | $ | 18.28 |
| | $ | 17.70 |
| | $ | 17.86 |
| | $ | 16.95 |
|
| Low | | $ | 16.11 |
| | $ | 14.88 |
| | $ | 15.58 |
| | $ | 13.90 |
|
First Financial Bancorp common stock trades on the Nasdaq Stock Market under the symbol FFBC.
106 First Financial Bancorp 2013 Annual Report
Total Return to Shareholders
The following graph compares the five-year cumulative total return to shareholders of First Financial Bancorp common stock with that of companies that comprise the Nasdaq Composite Index and the KBW Regional Bank Index. The KBW Regional Bank Index is comprised of 50 bank holding companies headquartered throughout the country and is used frequently by investors when comparing First Financial Bancorp's stock performance to that of other similarly sized institutions. First Financial Bancorp is included in the KBW Regional Bank Index.
The following table assumes $100 invested on December 31, 2008 in First Financial Bancorp, the Nasdaq Composite Index and the KBW Regional Bank Index, and assumes that dividends are reinvested.
COMPARISON OF FIVE-YEAR CUMULATIVE TOTAL RETURN
AMONG FIRST FINANCIAL BANCORP, NASDAQ COMPOSITE INDEX
AND KBW REGIONAL BANK INDEX
|
| | | | | | | | | | | | |
| | 2008 | 2009 | 2010 | 2011 | 2012 | 2013 |
| First Financial Bancorp | 100.00 |
| 123.17 |
| 160.07 |
| 151.31 |
| 143.25 |
| 181.37 |
|
| Nasdaq Composite Index | 100.00 |
| 145.34 |
| 171.70 |
| 170.34 |
| 200.54 |
| 281.07 |
|
| KBW Regional Bank Index | 100.00 |
| 77.93 |
| 93.84 |
| 88.98 |
| 100.77 |
| 147.93 |
|
First Financial Bancorp 2013 Annual Report 107
Shareholder Information
2013 Annual Shareholder Meeting
The annual meeting of shareholders will be held on Tuesday, May 27, 2014, at 10:00 a.m. (EDT) at:
First Financial Bancorp
First Financial Center
255 East Fifth Street, Suite 2900
Cincinnati, OH 45202
Common Stock Listing
|
|
| First Financial Bancorp’s common stock trades on the Nasdaq Stock Market under the symbol FFBC. |

Registrar & Transfer Agent
Registrar and Transfer Company serves as the registrar and transfer agent for First Financial Bancorp common stock for registered shareholders. Shareholder account inquiries, including changes of address or ownership, transferring stock, and replacing lost certificates or dividend checks should be directed to Registrar and Transfer Company at:
Registrar and Transfer Company
10 Commerce Drive
Cranford, NJ 07016
1-800-368-5948
Shareholders of record can also access their shareholder account records and request information related to their shareholder account via the internet. To register for online account access, go to: www.rtco.com.
Dividend Reinvestment and Stock Purchase Plan
Shareholders of record holding 25 shares or more are eligible to participate in our Dividend Reinvestment Plan. Shareholders of record may elect to have cash dividends automatically reinvested in additional common shares and can also purchase additional common shares by making optional cash payments. To obtain a prospectus and authorization card to enroll in the plan, please visit the Investor Relations section of our website at www.bankatfirst.com/investor to print the documents or contact Investor Relations.
Investor Relations
Corporate and investor information, including news releases, webcasts, investor presentations, annual reports, proxy statements and SEC filings as well as information on the company’s corporate governance practices is available within the Investor Relations section of our website at www.bankatfirst.com/investor.
Shareholders, analysts and other investment professionals who would like corporate and financial information on First Financial Bancorp should contact:
Kenneth J. Lovik
Senior Vice President, Investor Relations and Corporate Development
First Financial Bancorp
255 East Fifth Street, Suite 2900
Cincinnati, OH 45202
Phone: 513-979-5837
E-mail: kenneth.lovik@bankatfirst.com
Securities & Exchange Commission Filings
All reports filed electronically by First Financial Bancorp with the United States Securities and Exchange Commission (SEC), including the Annual Report on Form 10-K, quarterly reports on Form 10-Q, and current event reports on Form 8-K, as well as any amendments to those reports, are accessible at no cost within the Investor Relations section of our website at www.bankatfirst.com/investor, or by contacting Investor Relations. These filings are also accessible on the SEC’s website at www.sec.gov.
Media Requests
Members of the media should contact:
Jenny Keighley
Assistant Vice President, Media Relations Manager
First Financial Bancorp
255 East Fifth Street, Suite 700
Cincinnati, OH 45202
Phone: 513-979-5852
E-mail: jennifer.keighley@bankatfirst.com
108 First Financial Bancorp 2013 Annual Report
First Financial Bancorp A L w A YS G R o w ING . 2 0 1 3 A n n u a l R e p o r t 1 8 6 3 ➔ 2 0 1 3 Y E A R S 1 5 0

LEGACY that inspires our FUTURE 150 years of continuous banking service is a remarkable milestone! The Beginning It all started on Saturday, August 15, 1863, when the First National Bank of Hamilton opened for business under Charter #56 which was granted as a result of the National Bank Act of 1863. At that time, our country was experiencing the struggle of the Civil War as well as other challenges throughout the frontier. The decision to start a bank in those wild and uncertain times impacted the course of history for Hamilton and First Financial for the next 15 decades. The courage and determination of our founders helped prepare us for the wild and uncertain times we have today. Then, as now, banks were valued by their communities as a source of economic growth and vitality. So it was with Hamilton. From its original storefront, the bank grew and occupied various downtown buildings over the years. Our current location in downtown Hamilton opened on August 30, 1930, and was completed at a cost “not to exceed $550,000.” Once again our predecessors showed courage and determination by moving forward during one of the most uncertain of times - the Great Depression. The historic stock market crash occurred on Black Tuesday, October 29, 1929, and 744 banks failed in the first ten months of 1930. Looking back, the bank’s decision to invest in the community and its future has shaped the company that we are today. Strategic Decisions in the 1980’s In the early 1980’s, the bank and thrift industry changed dramatically through deregulation and the savings and loan crisis. Financial institutions were able to offer new products and determine their own interest rates for deposits and loans among other things. This legislation changed the landscape of banking, and created a new vision for bank President Richard Fitton, the bank’s management and board of directors - a vision for an affiliation of community banks that would be stronger together than they could be alone. That vision became a reality when the holding company, First Financial Bancorp, was formed on April 26, 1983. At that time, First Financial acquired the stock of First National Bank of Southwestern Ohio in Hamilton and Citizens Commercial Bank & Trust in Celina. Of note, attorney Murph Knapke, a board member of Citizens Commercial and resident of Celina was named to the board of First Financial when it was formed. Mr. Knapke continues his service today as Chairman of the Board of Directors.

Fun Facts About Our History Until 1935, the First National Bank of Hamilton issued its own currency called national bank notes. These notes were legal tender for citizens to buy goods, borrow money and make deposits. In the Hamilton flood of 1913, bank officials removed records from the vault in the bank’s basement before nine feet of water flooded the banking room and left behind six inches of mud. Three days later, with currency shipped in from Cincinnati, the bank quickly reopened and calmed the fears of anxious clients. The Trust Department came along in 1923 when Federal Banking laws permitted these services to be performed by banks. Over the years, the Trust Department has built a strong reputation and earned the confidence and respect of its clients and the community. In the early 1950’s, the bank began to branch out. By 1969, there were branches in Seven Mile, Oxford, Fairfield and Ross. In 1967, the bank announced a major expansion program to renovate space for a more sophisticated computer and high-speed proof equipment. Computers and technology were coming of age in the banking business. First Financial Bank opened on August 15, 1863, at 239 High Street in Hamilton, Ohio.
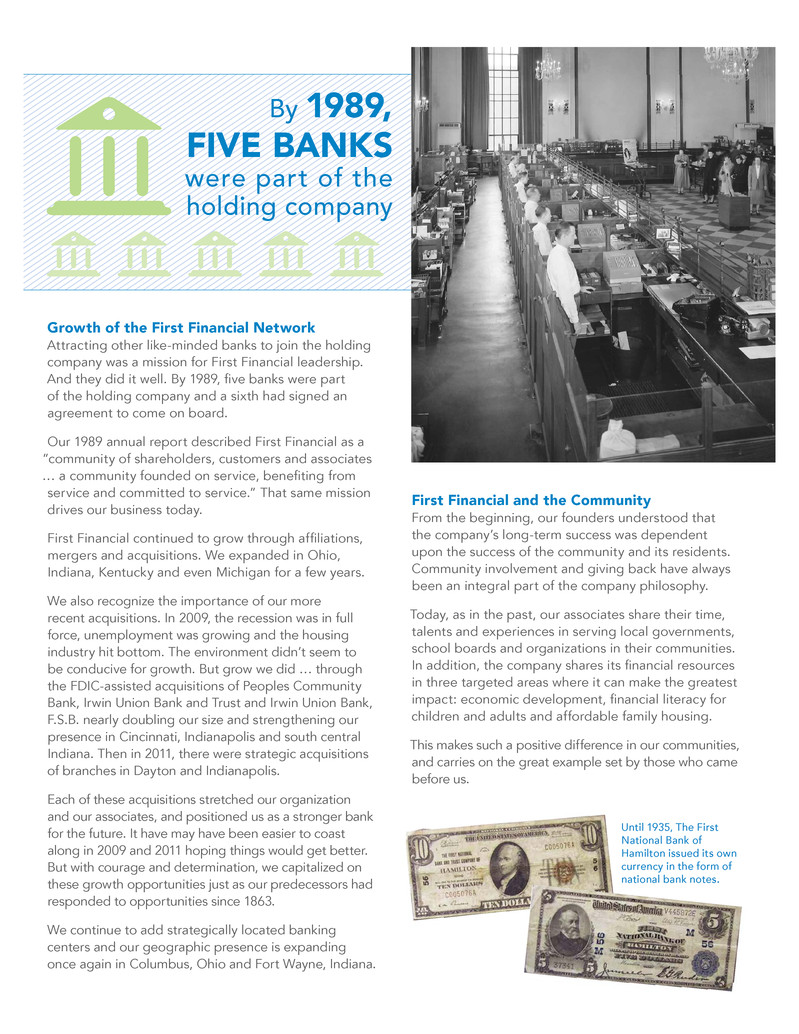
Growth of the First Financial Network Attracting other like-minded banks to join the holding company was a mission for First Financial leadership. And they did it well. By 1989, five banks were part of the holding company and a sixth had signed an agreement to come on board. Our 1989 annual report described First Financial as a “community of shareholders, customers and associates … a community founded on service, benefiting from service and committed to service.” That same mission drives our business today. First Financial continued to grow through affiliations, mergers and acquisitions. We expanded in Ohio, Indiana, Kentucky and even Michigan for a few years. We also recognize the importance of our more recent acquisitions. In 2009, the recession was in full force, unemployment was growing and the housing industry hit bottom. The environment didn’t seem to be conducive for growth. But grow we did … through the FDIC-assisted acquisitions of Peoples Community Bank, Irwin Union Bank and Trust and Irwin Union Bank, F.S.B. nearly doubling our size and strengthening our presence in Cincinnati, Indianapolis and south central Indiana. Then in 2011, there were strategic acquisitions of branches in Dayton and Indianapolis. Each of these acquisitions stretched our organization and our associates, and positioned us as a stronger bank for the future. It have may have been easier to coast along in 2009 and 2011 hoping things would get better. But with courage and determination, we capitalized on these growth opportunities just as our predecessors had responded to opportunities since 1863. We continue to add strategically located banking centers and our geographic presence is expanding once again in Columbus, Ohio and Fort Wayne, Indiana. First Financial and the Community From the beginning, our founders understood that the company’s long-term success was dependent upon the success of the community and its residents. Community involvement and giving back have always been an integral part of the company philosophy. Today, as in the past, our associates share their time, talents and experiences in serving local governments, school boards and organizations in their communities. In addition, the company shares its financial resources in three targeted areas where it can make the greatest impact: economic development, financial literacy for children and adults and affordable family housing. This makes such a positive difference in our communities, and carries on the great example set by those who came before us. By 1989, FIVE BANKS were part of the holding company until 1935, the First National Bank of Hamilton issued its own currency in the form of national bank notes.

The Last 10 Years The First Financial story is one of change based on a firm foundation of time-tested principles and values with a passion for service. First Financial has gone through a makeover in the last ten years. Every area of the company has been touched and retooled. Here are a few highlights: Articulation and execution of our mission statement and strategic plan, the roadmap for our future. Our singular brand that brought together different names, colors, logos and tag lines to create a more consistent and recognizable experience for our clients, shareholders and the community. The excitement of opening the NASDAQ market in New York City on June 1, 2006. The development of an award-winning sales center design that includes visual merchandising and an open environment where every client touch point reflects who we are and what we do to help our clients be more successful. Using new technologies to improve products and service delivery for the changing needs of our clients. New processing systems that add efficiency for us and deliver improved service for our clients. An evolving organizational structure that enables us to stay close to clients and remain relevant in their lives. More comfortable working environments like the Corporate Administration Center and First Financial Center in Cincinnati, and our associate training and development centers in Hamilton and downtown Columbus, Indiana that promote team work and camaraderie among our associates. Celebrating our Legacy in 2013 We believe that 150 years in business is a big deal. That’s why we engaged our associates, clients and the community in our celebration: Associates enjoyed learning the story of First Financial through a special 150th anniversary video and a weeklong celebration that included trivia questions, giveaways and a company-wide birthday party. Clients benefited from special anniversary offers including a Celebration CD, cash bonus offers and bill payment contest. 15 organizations each received a $10,000 grant to support their good work in the communities we serve. Our associates had the opportunity to nominate local organizations for consideration. The recipient organizations were announced in December 2013 and the list may be found on our website: www.bankatfirst.com. Visit the company’s Facebook page for some great photos of the check presentations. As we reflect on the history of First Financial, it’s clear that a focus on clients, strategic thinking, smart ideas, community involvement, courage, determination and leveraging the right opportunities have been foundational to our company’s survival and success over the last 150 years. We look forward to safeguarding the values, principles and hard work of those that came before us … and to continue serving our clients, our communities and shareholders well into the future. we’re here, now, always growing. The strong foundation we have cultivated over the last 150 years is one based on time-tested principles and values with a passion for service.