First Financial Bancorp Investor Presentation First Quarter 2014 EXHIBIT 99.1
2 Certain statements contained in this release which are not statements of historical fact constitute forward-looking statements within the meaning of the Private Securities Litigation Reform Act. Examples of forward-looking statements include, but are not limited to, projections of revenues, income or loss, earnings or loss per share, the payment or non- payment of dividends, capital structure and other financial items, statements of plans and objectives of First Financial or its management or board of directors and statements of future economic performances and statements of assumptions underlying such statements. Words such as ‘‘believes,’’ ‘‘anticipates,’’ “likely,” “expected,” ‘‘intends,’’ and other similar expressions are intended to identify forward-looking statements but are not the exclusive means of identifying such statements. Management’s analysis contains forward-looking statements that are provided to assist in the understanding of anticipated future financial performance. However, such performance involves risks and uncertainties that may cause actual results to differ materially. These factors include, but are not limited to: economic, market, liquidity, credit, interest rate, operational and technological risks associated with the Company’s business; the effect of and changes in policies and laws or regulatory agencies (notably the recently enacted Dodd-Frank Wall Street Reform and Consumer Protection Act); management’s ability to effectively execute its business plan; mergers and acquisitions, including costs or difficulties related to the integration of acquired companies, including the recently announced proposed acquisitions of The First Bexley Bank, Insight Bank and Guernsey Bancorp; the Company’s ability to comply with the terms of loss sharing agreements with the FDIC; the effect of changes in accounting policies and practices; and the costs and effects of litigation and of unexpected or adverse outcomes in such litigation. Please refer to the Company’s Annual Report on Form 10-K for the year ended December 31, 2013, as well as its other filings with the SEC, for a more detailed discussion of these risks, uncertainties and other factors that could cause actual results to differ from those discussed in the forward-looking statements. Such forward-looking statements are meaningful only on the date when such statements are made, and the Company undertakes no obligation to update any forward-looking statement to reflect events or circumstances after the date on which such a statement is made to reflect the occurrence of unanticipated events. Forward Looking Statement Disclosure
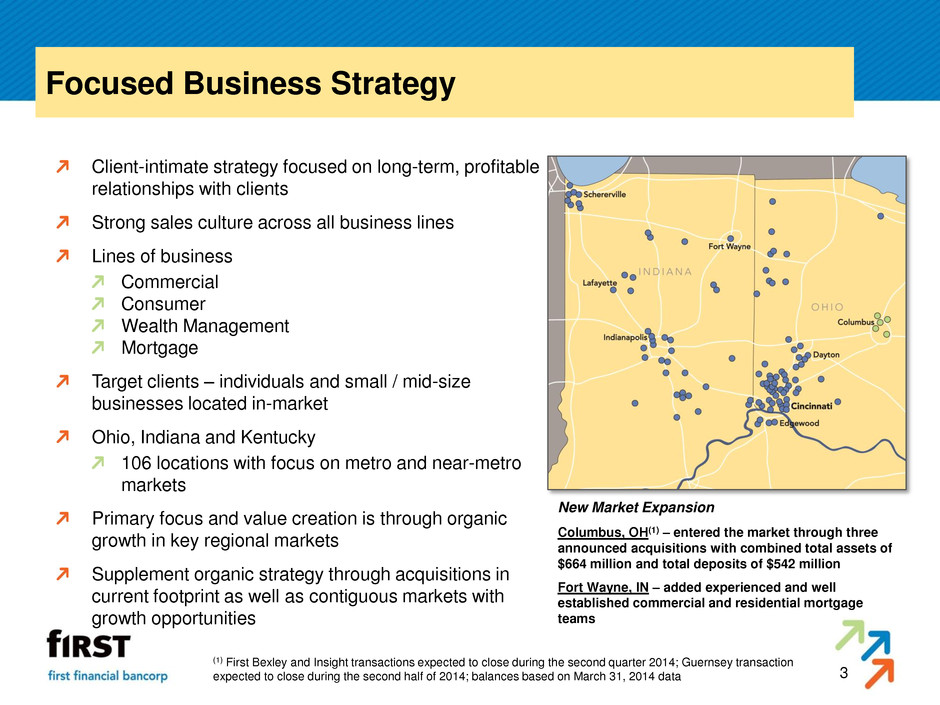
3 Focused Business Strategy Client-intimate strategy focused on long-term, profitable relationships with clients Strong sales culture across all business lines Lines of business Commercial Consumer Wealth Management Mortgage Target clients – individuals and small / mid-size businesses located in-market Ohio, Indiana and Kentucky 106 locations with focus on metro and near-metro markets Primary focus and value creation is through organic growth in key regional markets Supplement organic strategy through acquisitions in current footprint as well as contiguous markets with growth opportunities New Market Expansion Columbus, OH(1) – entered the market through three announced acquisitions with combined total assets of $664 million and total deposits of $542 million Fort Wayne, IN – added experienced and well established commercial and residential mortgage teams (1) First Bexley and Insight transactions expected to close during the second quarter 2014; Guernsey transaction expected to close during the second half of 2014; balances based on March 31, 2014 data
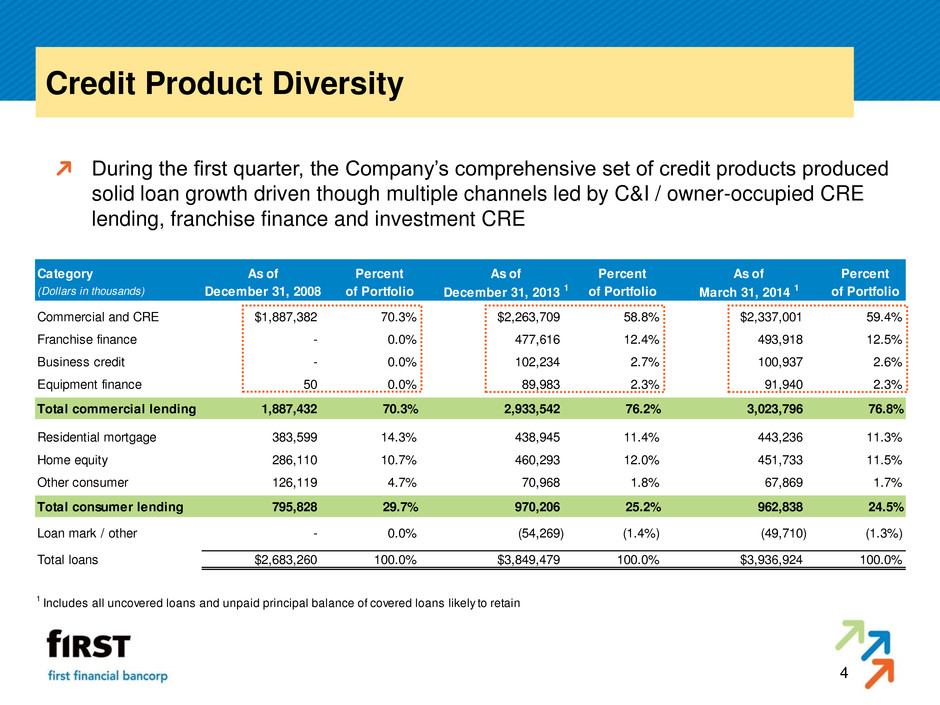
4 Credit Product Diversity During the first quarter, the Company’s comprehensive set of credit products produced solid loan growth driven though multiple channels led by C&I / owner-occupied CRE lending, franchise finance and investment CRE Category As of Percent As of Percent As of Percent (Dollars in thousands) December 31, 2008 of Portfolio December 31, 2013 1 of Portfolio March 31, 2014 1 of Portfolio Commercial and CRE $1,887,382 70.3% $2,263,709 58.8% $2,337,001 59.4% Franchise finance - 0.0% 477,616 12.4% 493,918 12.5% Business credit - 0.0% 102,234 2.7% 100,937 2.6% Equipment finance 50 0.0% 89,983 2.3% 91,940 2.3% Total commercial lending 1,887,432 70.3% 2,933,542 76.2% 3,023,796 76.8% Residential mortgage 383,599 14.3% 438,945 11.4% 443,236 11.3% Home equity 286,110 10.7% 460,293 12.0% 451,733 11.5% Other consumer 126,119 4.7% 70,968 1.8% 67,869 1.7% Total consumer lending 795,828 29.7% 970,206 25.2% 962,838 24.5% Loan mark / other - 0.0% (54,269) (1.4%) (49,710) (1.3%) Total loans $2,683,260 100.0% $3,849,479 100.0% $3,936,924 100.0% 1 Includes all uncovered loans and unpaid principal balance of covered loans likely to retain
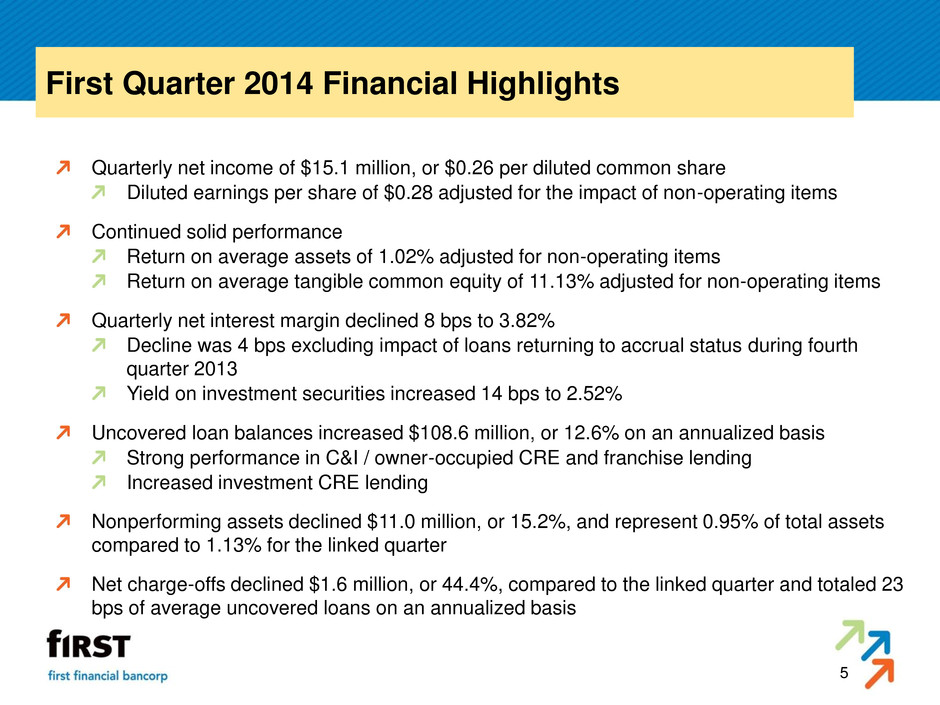
5 First Quarter 2014 Financial Highlights Quarterly net income of $15.1 million, or $0.26 per diluted common share Diluted earnings per share of $0.28 adjusted for the impact of non-operating items Continued solid performance Return on average assets of 1.02% adjusted for non-operating items Return on average tangible common equity of 11.13% adjusted for non-operating items Quarterly net interest margin declined 8 bps to 3.82% Decline was 4 bps excluding impact of loans returning to accrual status during fourth quarter 2013 Yield on investment securities increased 14 bps to 2.52% Uncovered loan balances increased $108.6 million, or 12.6% on an annualized basis Strong performance in C&I / owner-occupied CRE and franchise lending Increased investment CRE lending Nonperforming assets declined $11.0 million, or 15.2%, and represent 0.95% of total assets compared to 1.13% for the linked quarter Net charge-offs declined $1.6 million, or 44.4%, compared to the linked quarter and totaled 23 bps of average uncovered loans on an annualized basis
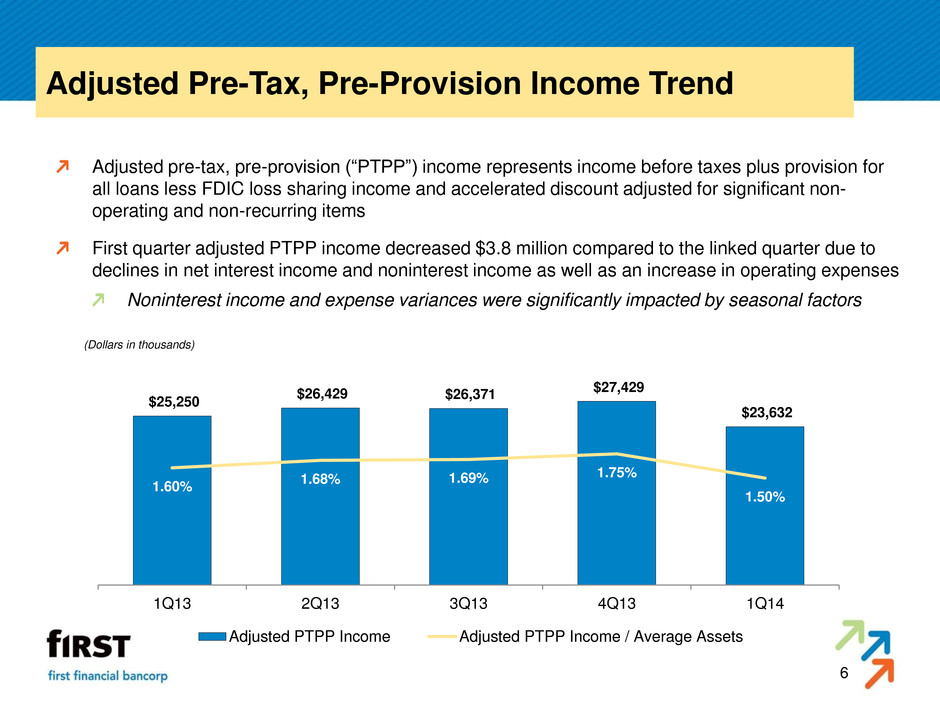
6 Adjusted Pre-Tax, Pre-Provision Income Trend Adjusted pre-tax, pre-provision (“PTPP”) income represents income before taxes plus provision for all loans less FDIC loss sharing income and accelerated discount adjusted for significant non- operating and non-recurring items First quarter adjusted PTPP income decreased $3.8 million compared to the linked quarter due to declines in net interest income and noninterest income as well as an increase in operating expenses Noninterest income and expense variances were significantly impacted by seasonal factors $25,250 $26,429 $26,371 $27,429 $23,632 1.60% 1.68% 1.69% 1.75% 1.50% 1Q13 2Q13 3Q13 4Q13 1Q14 (Dollars in thousands) Adjusted PTPP Income Adjusted PTPP Income / Average Assets
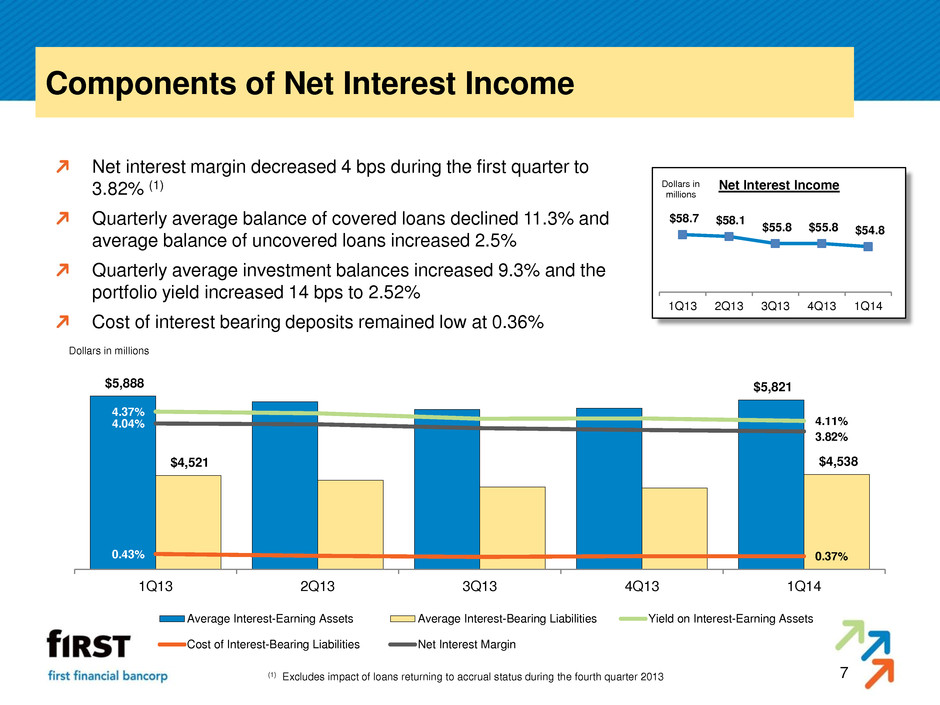
7 Components of Net Interest Income Net interest margin decreased 4 bps during the first quarter to 3.82% (1) Quarterly average balance of covered loans declined 11.3% and average balance of uncovered loans increased 2.5% Quarterly average investment balances increased 9.3% and the portfolio yield increased 14 bps to 2.52% Cost of interest bearing deposits remained low at 0.36% $58.7 $58.1 $55.8 $55.8 $54.8 1Q13 2Q13 3Q13 4Q13 1Q14 Dollars in millions Net Interest Income $5,888 $5,821 $4,521 $4,538 4.37% 4.11% 0.43% 0.37% 4.04% 3.82% 1Q13 2Q13 3Q13 4Q13 1Q14 Dollars in millions Average Interest-Earning Assets Average Interest-Bearing Liabilities Yield on Interest-Earning Assets Cost of Interest-Bearing Liabilities Net Interest Margin (1) Excludes impact of loans returning to accrual status during the fourth quarter 2013
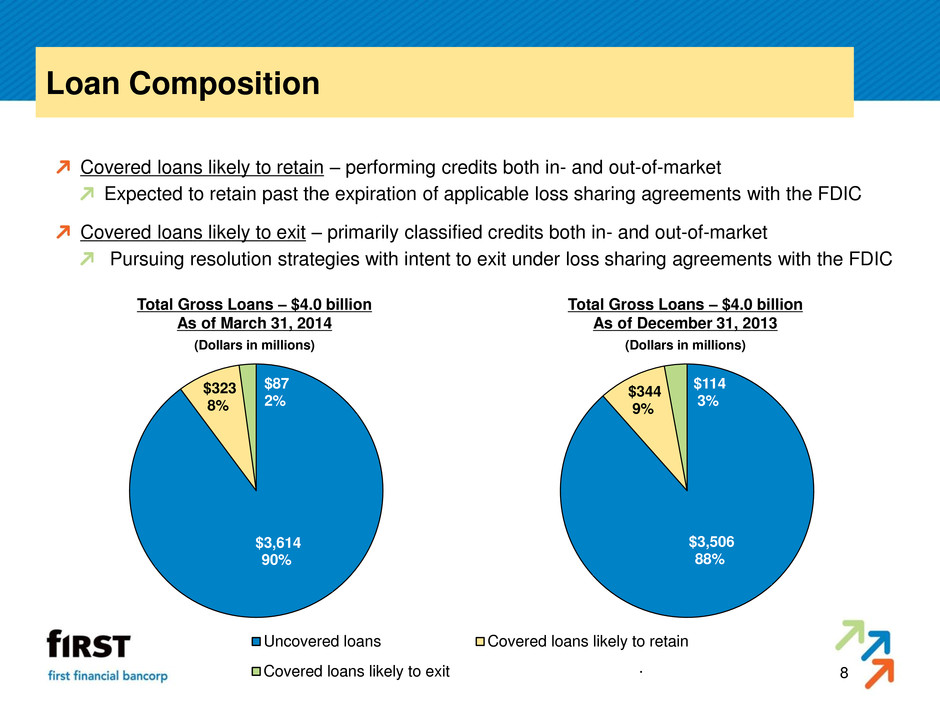
8 Loan Composition Total Gross Loans – $4.0 billion As of March 31, 2014 (Dollars in millions) Covered loans likely to retain – performing credits both in- and out-of-market Expected to retain past the expiration of applicable loss sharing agreements with the FDIC Covered loans likely to exit – primarily classified credits both in- and out-of-market Pursuing resolution strategies with intent to exit under loss sharing agreements with the FDIC Total Gross Loans – $4.0 billion As of December 31, 2013 (Dollars in millions) Uncovered loans Covered loans likely to retain Covered loans likely to exit $3,614 90% $323 8% $87 2% $3,506 88% $344 9% $114 3%
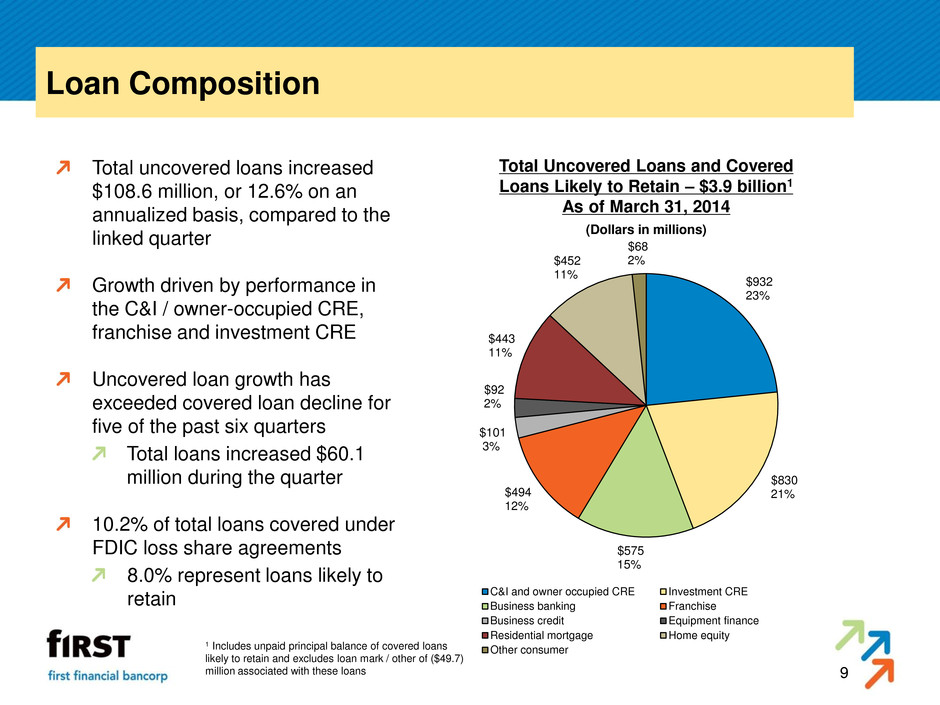
9 Loan Composition Total uncovered loans increased $108.6 million, or 12.6% on an annualized basis, compared to the linked quarter Growth driven by performance in the C&I / owner-occupied CRE, franchise and investment CRE Uncovered loan growth has exceeded covered loan decline for five of the past six quarters Total loans increased $60.1 million during the quarter 10.2% of total loans covered under FDIC loss share agreements 8.0% represent loans likely to retain 1 Includes unpaid principal balance of covered loans likely to retain and excludes loan mark / other of ($49.7) million associated with these loans Total Uncovered Loans and Covered Loans Likely to Retain – $3.9 billion1 As of March 31, 2014 (Dollars in millions) $932 23% $830 21% $575 15% $494 12% $101 3% $92 2% $443 11% $452 11% $68 2% C&I and owner occupied CRE Investment CRE Business banking Franchise Business credit Equipment finance Residential mortgage Home equity Other consumer
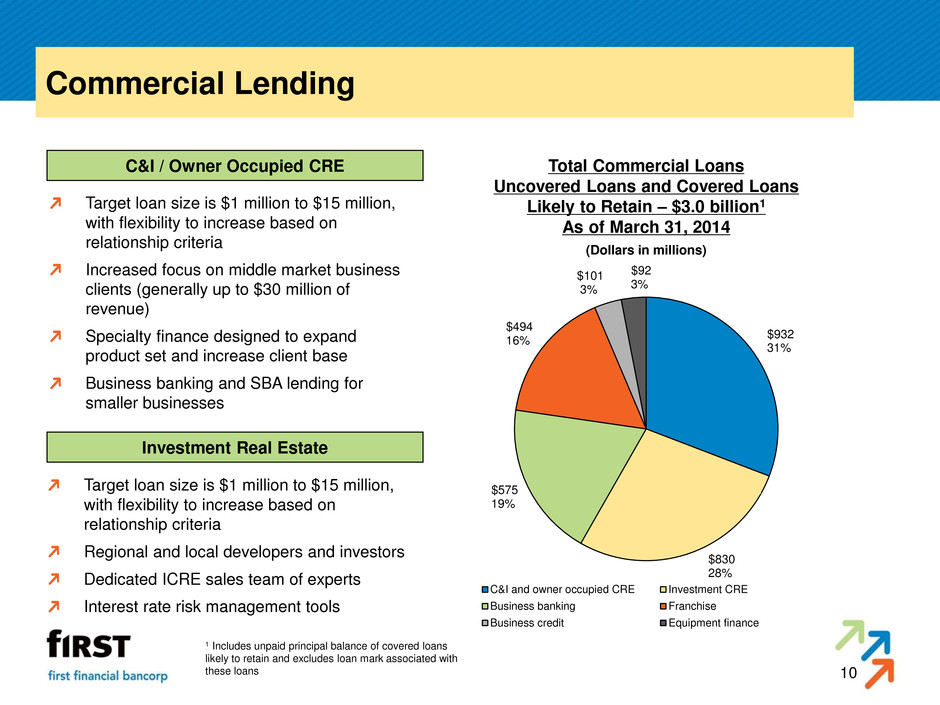
10 Commercial Lending C&I / Owner Occupied CRE Investment Real Estate Target loan size is $1 million to $15 million, with flexibility to increase based on relationship criteria Increased focus on middle market business clients (generally up to $30 million of revenue) Specialty finance designed to expand product set and increase client base Business banking and SBA lending for smaller businesses Target loan size is $1 million to $15 million, with flexibility to increase based on relationship criteria Regional and local developers and investors Dedicated ICRE sales team of experts Interest rate risk management tools Total Commercial Loans Uncovered Loans and Covered Loans Likely to Retain – $3.0 billion1 As of March 31, 2014 (Dollars in millions) 1 Includes unpaid principal balance of covered loans likely to retain and excludes loan mark associated with these loans $932 31% $830 28% $575 19% $494 16% $101 3% $92 3% C&I and owner occupied CRE Investment CRE Business banking Franchise Business credit Equipment finance
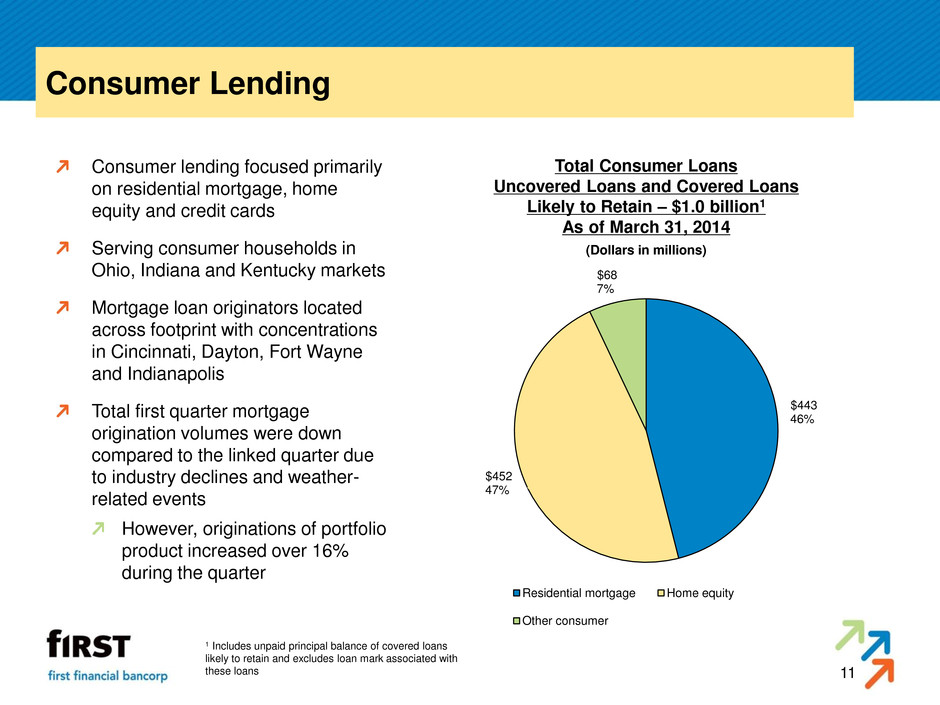
11 Consumer Lending Consumer lending focused primarily on residential mortgage, home equity and credit cards Serving consumer households in Ohio, Indiana and Kentucky markets Mortgage loan originators located across footprint with concentrations in Cincinnati, Dayton, Fort Wayne and Indianapolis Total first quarter mortgage origination volumes were down compared to the linked quarter due to industry declines and weather- related events However, originations of portfolio product increased over 16% during the quarter Total Consumer Loans Uncovered Loans and Covered Loans Likely to Retain – $1.0 billion1 As of March 31, 2014 (Dollars in millions) 1 Includes unpaid principal balance of covered loans likely to retain and excludes loan mark associated with these loans $443 46% $452 47% $68 7% Residential mortgage Home equity Other consumer

12 Delivery Channels and Product Innovation Launched new online banking platform in 2012 Added mobile apps to accommodate client preferences with further enhancements such as Snap Deposit Client usage of mobile and online channels has increased significantly Deployed image-capture ATMs Sales centers focused on relationship vs. transactions Deliver a consistent brand experience in a cost-effective manner Introducing enhanced online treasury management platform State-of-the-art paperless mortgage process with local underwriting and processing
13 Capital Management Long-term capital return target to shareholders of 60% - 80% of earnings through combination of dividends and share repurchases Quarterly dividend of $0.15 per share Translates into yield of 3.8% compared to current peer median dividend yield of 2.5% Announced a share repurchase plan targeting one million shares annually beginning fourth quarter 2012 Repurchased 250,000 shares during fourth quarter 2013 and first quarter 2014 Repurchased approximately 1,250,000 total shares to date under the plan Suspending repurchases during second quarter 2014 due to cash consideration related to the Guernsey transaction and increasingly active M&A environment Established revised long-term capital targets based on Basel III analysis and impact Tier 1 leverage ratio of 8.5% Common equity tier 1 capital ratio of 9.0% Tier 1 capital ratio of 10.5% Total capital ratio of 12.5% Peer Group comprised of the component banks within the KBW Regional Bank Index (49 total companies excluding First Financial); Dividend valuation data as of May 9, 2014.
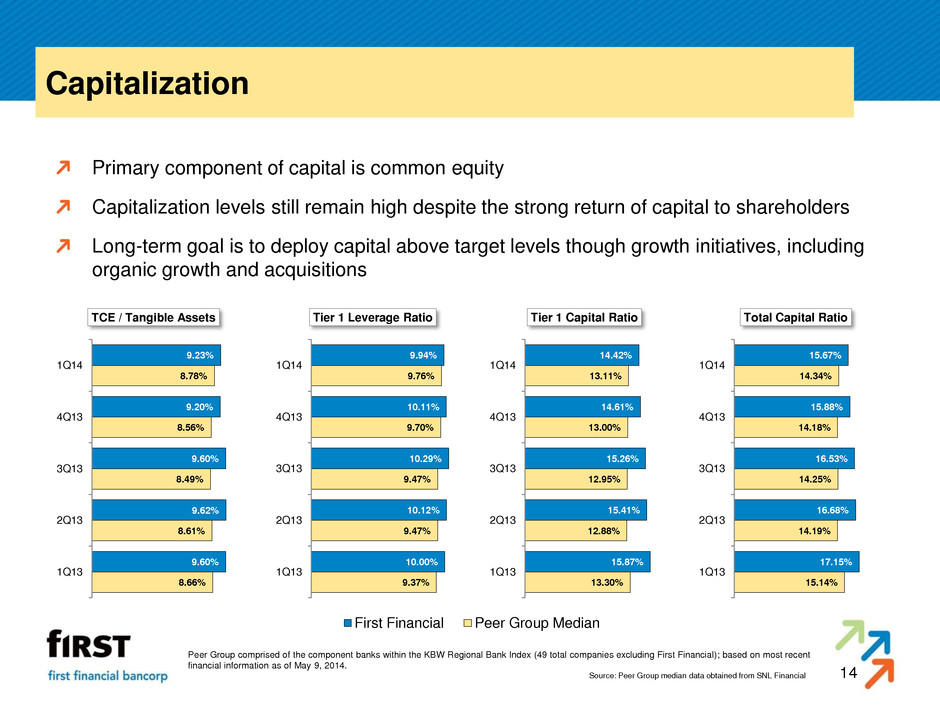
14 Capitalization Primary component of capital is common equity Capitalization levels still remain high despite the strong return of capital to shareholders Long-term goal is to deploy capital above target levels though growth initiatives, including organic growth and acquisitions 10.38% 10.33% 10.40% 11.11% 10.38%7.96% 8.06% 8.28% 8.12% 8.39% 3Q10 4Q1 1Q11 2Q1 3Q11 First Financial Peer Group Median Peer Group comprised of the component banks within the KBW Regional Bank Index (49 total companies excluding First Financial); based on most recent financial information as of May 9, 2014. Source: Peer Group median data obtained from SNL Financial 8.66% 8.61% 8.49% 8.56% 8.78% 9.60% 9.62% 9.60% 9.20% 9.23% 1Q13 2Q13 3Q13 4Q13 1Q14 TCE / Tangible Assets 9.37% 9.47% 9.47% 9.70% 9.76% 10.00% 10.12% 10.29% 10.11% 9.94% 1Q13 2Q13 3Q13 4Q13 1Q14 Tier 1 Leverage Ratio 13.30% 12.88% 12.95% 13.00% 13.11% 15.87% 15.41% 15.26% 14.61% 14.42% 1Q13 2Q13 3Q13 4Q13 1Q14 Tier 1 Capital Ratio 15.14% 14.19% 14.25% 14.18% 14.34% 17.15% 16.68% 16.53% 15.88% 15.67% 1Q13 2Q13 3Q13 4Q13 1Q14 T tal Capital Ratio
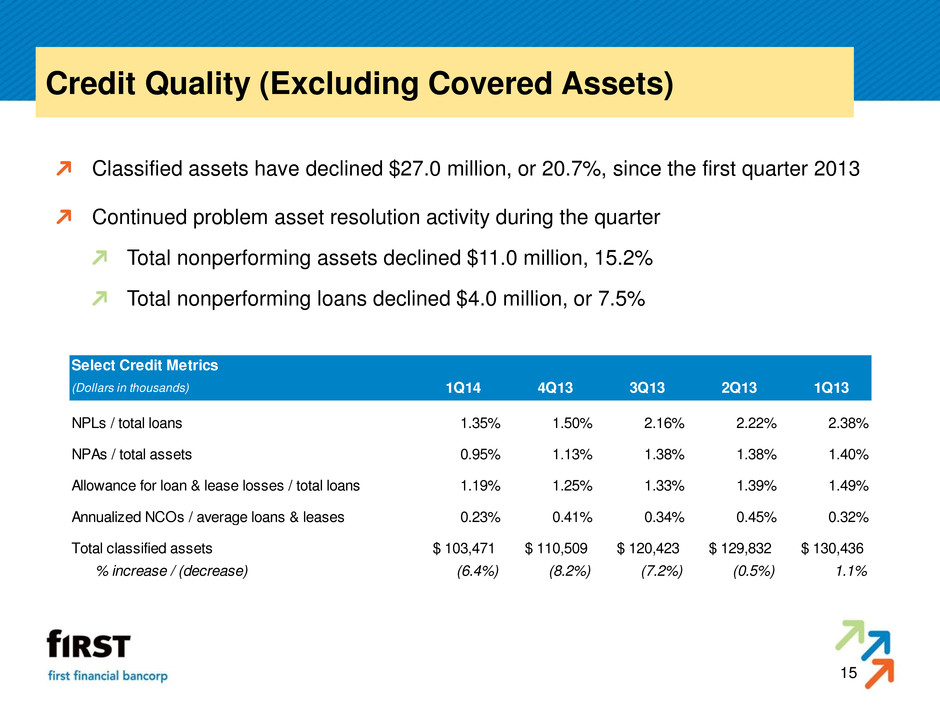
15 Credit Quality (Excluding Covered Assets) Classified assets have declined $27.0 million, or 20.7%, since the first quarter 2013 Continued problem asset resolution activity during the quarter Total nonperforming assets declined $11.0 million, 15.2% Total nonperforming loans declined $4.0 million, or 7.5% Select Credit Metrics (Dollars in thousands) 1Q14 4Q13 3Q13 2Q13 1Q13 NPLs / total loans 1.35% 1.50% 2.16% 2.22% 2.38% NPA / total assets 0.95% 1.13% 1.38% 1.38% 1.40% Allowance for loan & lease losses / total loans 1.19% 1.25% 1.33% 1.39% 1.49% Annualized NCOs / average loans & leases 0.23% 0.41% 0.34% 0.45% 0.32% Total classified assets 103,471$ 110,509$ 120,423$ 129,832$ 130,436$ % increase / (decrease) (6.4%) (8.2%) (7.2%) (0.5%) 1.1%
16 Recent Transaction Summary Since December 2013, First Financial announced the acquisitions of The First Bexley Bank, Insight Bank, and Guernsey Bancorp, all headquartered in the Columbus, OH market Entering the growth-oriented Columbus market through the acquisition of three highly successful and complementary institutions with client-focused business models similar to First Financial Strong business development teams will have access to greater resources, higher lending limits and wider commercial and consumer product sets to drive further growth and better serve their communities Attractive financial returns for shareholders before factoring in potential revenue synergies resulting from the enhanced product set and capabilities Integration risk is manageable and will not be a distraction to current and future strategic initiatives Pro forma capital levels are strong, leaving First Financial well positioned to capitalize on future organic growth and acquisition opportunities
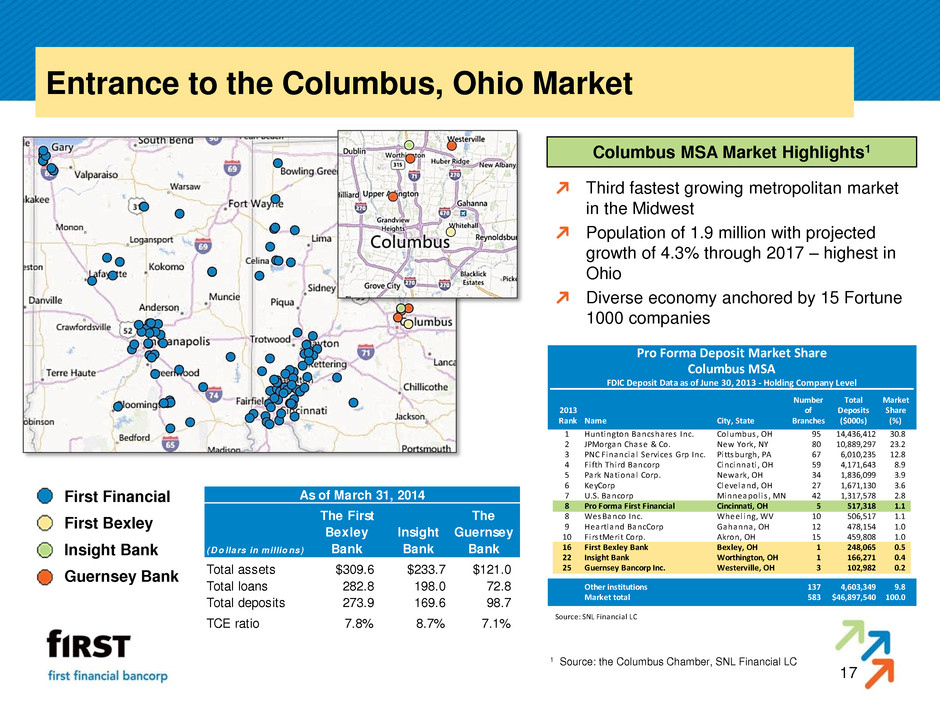
17 Entrance to the Columbus, Ohio Market Third fastest growing metropolitan market in the Midwest Population of 1.9 million with projected growth of 4.3% through 2017 – highest in Ohio Diverse economy anchored by 15 Fortune 1000 companies Columbus MSA Market Highlights1 1 Source: the Columbus Chamber, SNL Financial LC First Financial First Bexley Insight Bank Guernsey Bank Pro Forma Deposit Market Share Columbus MSA FDIC Deposit Data as of June 30, 2013 - Holding Company Level Number Total Market 2013 of Deposits Share Rank Name City, State Branches ($000s) (%) 1 Huntington Bancshares Inc. Columbus, OH 95 14,436,412 30.8 2 JPMorgan Chase & Co. New York, NY 80 10,889,297 23.2 3 PNC Financia l Services Grp Inc. Pi ttsburgh, PA 67 6,010,235 12.8 4 Fi fth Third Bancorp Cincinnati , OH 59 4,171,643 8.9 5 Park National Corp. Newark, OH 34 1,836,099 3.9 6 KeyCorp Cleveland, OH 27 1,671,130 3.6 7 U.S. Bancorp Minneapol is , MN 42 1,317,578 2.8 8 Pro Forma First Financial Cincinnati, OH 5 517,318 1.1 8 WesBanco Inc. Wheel ing, WV 10 506,517 1.1 9 Heartland BancCorp Gahanna, OH 12 478,154 1.0 10 Firs tMerit Corp. Akron, OH 15 459,808 1.0 16 First Bexley Bank Bexley, OH 1 248,065 0.5 22 Insight Bank Worthington, OH 1 166,271 0.4 25 Guernsey Bancorp Inc. Westerville, OH 3 102,982 0.2 Other institutions 137 4,603,349 9.8 Market total 583 46,897,540$ 100.0 Source: SNL Financial LC As of March 31, 2014 The First The Bexley Insight Guernsey (D o llars in millio ns) Bank Bank Bank Total assets $309.6 $233.7 $121.0 Total loans 282.8 198.0 72.8 Total deposits 273.9 169.6 98.7 TCE ratio 7.8% 8.7% 7.1%
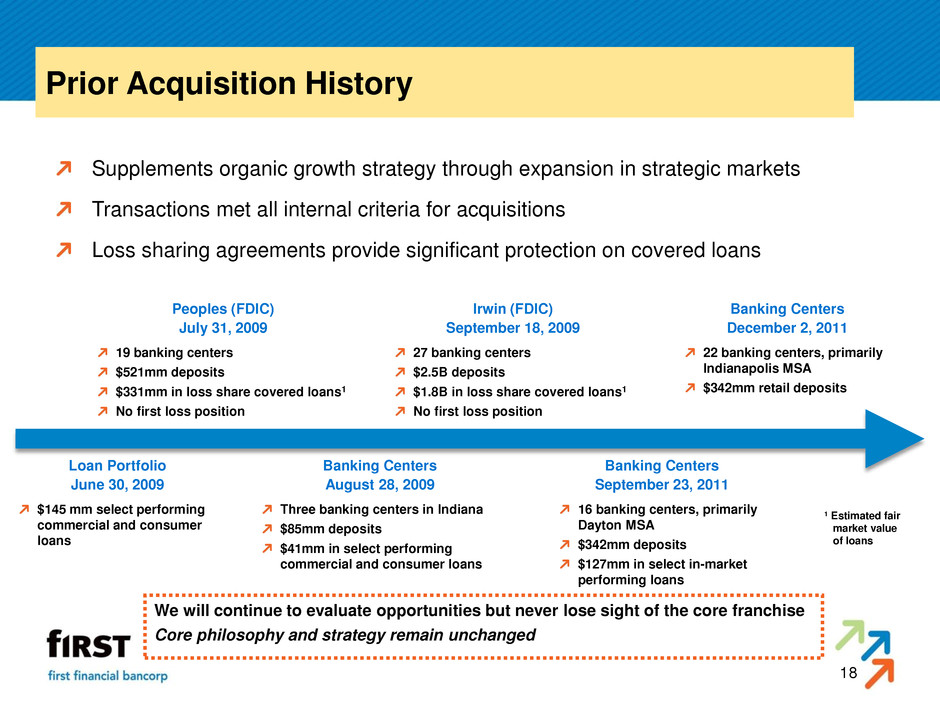
18 Prior Acquisition History Supplements organic growth strategy through expansion in strategic markets Transactions met all internal criteria for acquisitions Loss sharing agreements provide significant protection on covered loans Peoples (FDIC) July 31, 2009 19 banking centers $521mm deposits $331mm in loss share covered loans1 No first loss position Irwin (FDIC) September 18, 2009 27 banking centers $2.5B deposits $1.8B in loss share covered loans1 No first loss position Banking Centers December 2, 2011 22 banking centers, primarily Indianapolis MSA $342mm retail deposits Loan Portfolio June 30, 2009 $145 mm select performing commercial and consumer loans Banking Centers August 28, 2009 Three banking centers in Indiana $85mm deposits $41mm in select performing commercial and consumer loans Banking Centers September 23, 2011 16 banking centers, primarily Dayton MSA $342mm deposits $127mm in select in-market performing loans 1 Estimated fair market value of loans We will continue to evaluate opportunities but never lose sight of the core franchise Core philosophy and strategy remain unchanged

19 Franchise Highlights 1. Strong operating fundamentals – 94 consecutive quarters of profitability 2. Investments to create long-term growth are producing results 3. Strong loan growth momentum driven by comprehensive portfolio of credit products 4. Well positioned in current markets and executing on new market expansion strategies 5. Growth strategies focused on increasing core deposits and fee revenue 6. Strong capital levels with ability to support further organic growth and acquisition opportunities 7. Balanced long-term capital management strategy returning 60% - 80% of earnings through dividends and share repurchases 8. Delivered on efficiency plan with focus on continual process improvement

Appendix Investor Presentation First Quarter 2014
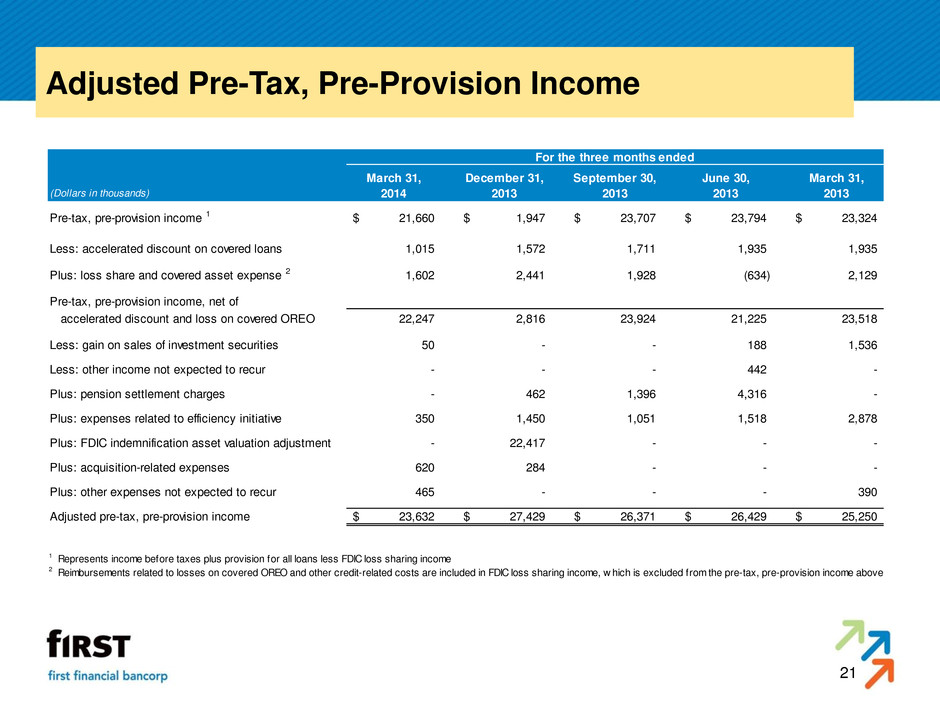
21 Adjusted Pre-Tax, Pre-Provision Income For the three months ended March 31, December 31, September 30, June 30, March 31, (Dollars in thousands) 2014 2013 2013 2013 2013 Pre-tax, pre-provision income 1 21,660$ 1,947$ 23,707$ 23,794$ 23,324$ Less: accelerated discount on covered loans 1,015 1,572 1,711 1,935 1,935 Plus: loss share and covered asset expense 2 1,602 2,441 1,928 (634) 2,129 Pre-tax, pre-provision income, net of accelerated discount and loss on covered OREO 22,247 2,816 23,924 21,225 23,518 Less: gain on sales of investment securities 50 - - 188 1,536 Less: other income not expected to recur - - - 442 - Plus: pension settlement charges - 462 1,396 4,316 - Plus: expenses related to efficiency initiative 350 1,450 1,051 1,518 2,878 Plus: FDIC indemnification asset valuation adjustment - 22,417 - - - Plus: acquisition-related expenses 620 284 - - - Plus: other expenses not expected to recur 465 - - - 390 Adjusted pre-tax, pre-provision income 23,632$ 27,429$ 26,371$ 26,429$ 25,250$ 1 Represents income before taxes plus provision for all loans less FDIC loss sharing income 2 Reimbursements related to losses on covered OREO and other credit-related costs are included in FDIC loss sharing income, w hich is excluded from the pre-tax, pre-provision income above
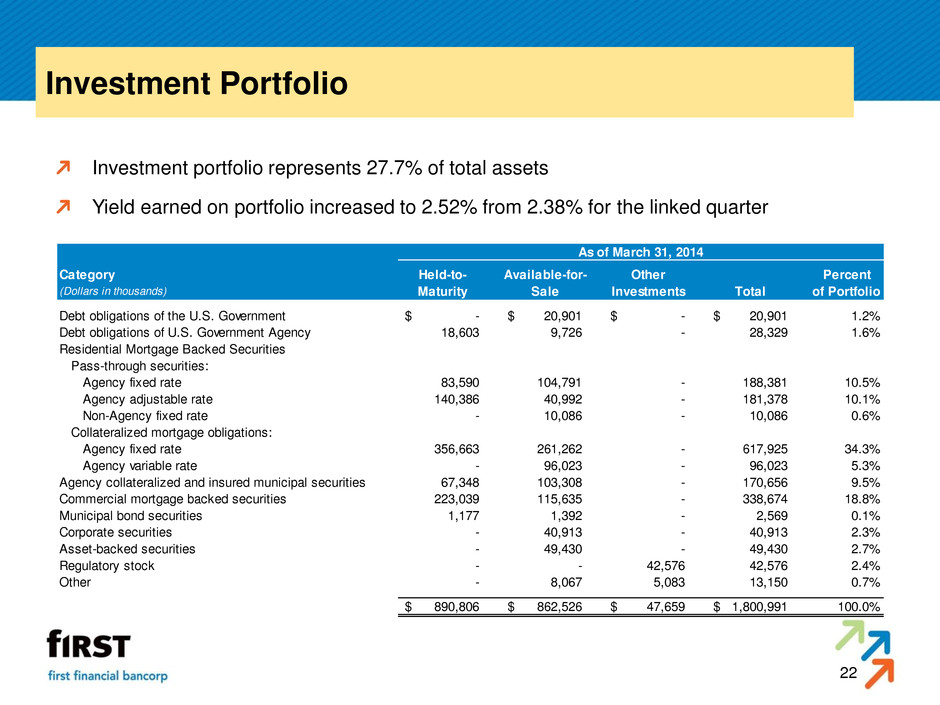
22 Investment Portfolio Investment portfolio represents 27.7% of total assets Yield earned on portfolio increased to 2.52% from 2.38% for the linked quarter As of March 31, 2014 Category Held-to- Available-for- Other Percent (Dollars in thousands) Maturity Sale Investments Total of Portfolio Debt obligations of the U.S. Government -$ 20,901$ -$ 20,901$ 1.2% Debt obligations of U.S. Government Agency 18,603 9,726 - 28,329 1.6% Residential Mortgage Backed Securities Pass-through securities: Agency fixed rate 83,590 104,791 - 188,381 10.5% Agency adjustable rate 140,386 40,992 - 181,378 10.1% Non-Agency fixed rate - 10,086 - 10,086 0.6% Collateralized mortgage obligations: Agency fixed rate 356,663 261,262 - 617,925 34.3% Agency variable rate - 96,023 - 96,023 5.3% Agency collateralized and insured municipal securities 67,348 103,308 - 170,656 9.5% Commercial mortgage backed securities 223,039 115,635 - 338,674 18.8% Mu i ipal bond securities 1,177 1,392 - 2,569 0.1% Corporate securities - 40,913 - 40,913 2.3% Asset-backed securities - 49,430 - 49,430 2.7% Regulatory stock - - 42,576 42,576 2.4% Other - 8,067 5,083 13,150 0.7% 890,806$ 862,526$ 47,659$ 1,800,991$ 100.0%
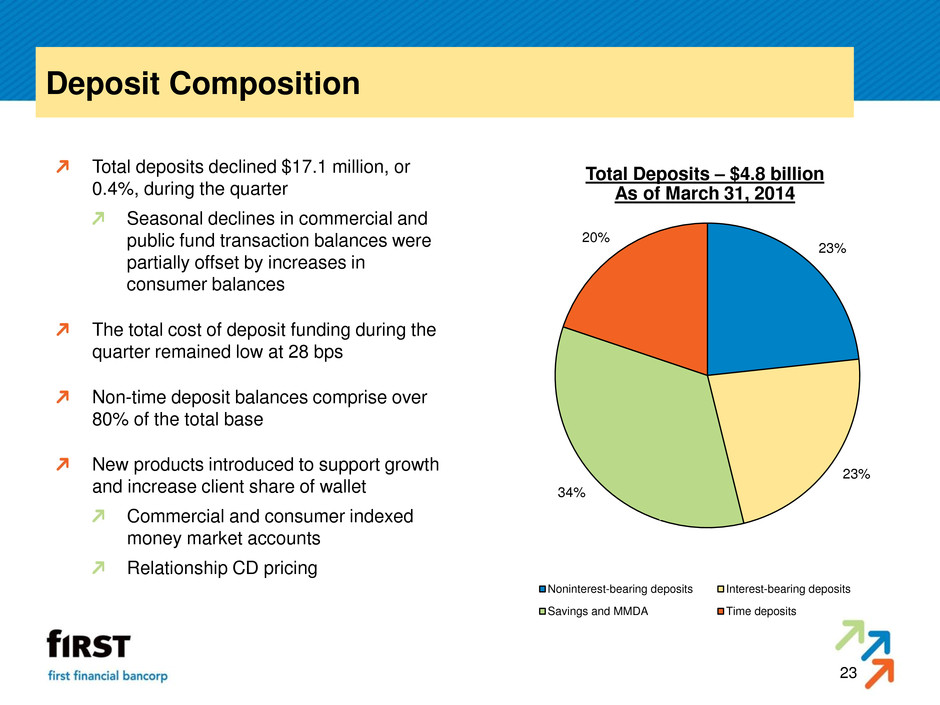
23 Deposit Composition Total deposits declined $17.1 million, or 0.4%, during the quarter Seasonal declines in commercial and public fund transaction balances were partially offset by increases in consumer balances The total cost of deposit funding during the quarter remained low at 28 bps Non-time deposit balances comprise over 80% of the total base New products introduced to support growth and increase client share of wallet Commercial and consumer indexed money market accounts Relationship CD pricing Total Deposits – $4.8 billion As of March 31, 2014 23% 23% 34% 20% Noninterest-bearing deposits Interest-bearing deposits Savings and MMDA Time deposits

24 Funding Structure and Cost of Funds Average Balances – Total Interest Bearing Liability Composition Average Balances – Deposit Composition Total Cost of Funds (1) Not included in cost of funds calculation Total Cost of Deposits Co s t of F u n d s 0.38% 0.35% 0.37% 0.37% 0.27% 0.24% 0.27% 0.28% 0.00% 0.00% 0.00% 0.00% 0.09% 0.12% 0.19% 0.12% 0.10% 0.09% 0.15% 0.20% 1.04% 0.90% 0.90% 0.94% 19.5%20.8%19.9%19.3% 48.7% 51.3%50.2%50.6% 16.9% 17.2%17.6%18.4% 15.0% 10.7%12.4%11.7% 1Q144Q133Q132Q13 Noninterest-bearing deposits (1) Interest-bearing deps. and savings Time deposits Borrowed funds 22.9%23.3%22.7%21.9% 23.1%23.7%23.2%23.5% 34.1%33.8%34.0%33.8% 19.9%19.2%20.0%20.8% 1Q144Q133Q132Q13 Nonin erest-bearing depo its Intere t-bearing deposits Savings Time deposits
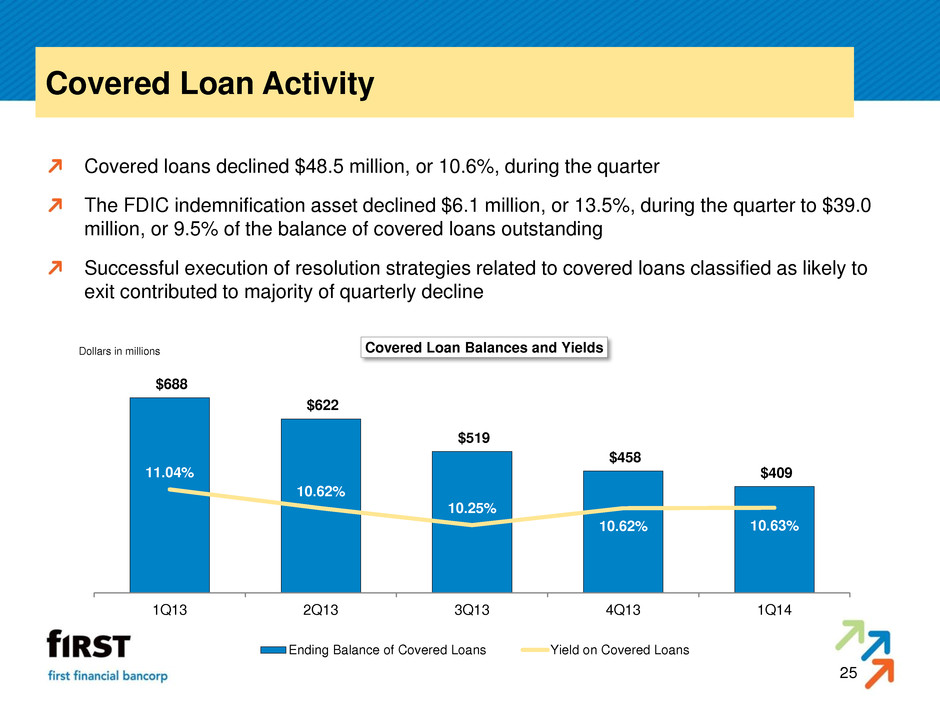
25 Covered Loan Activity Covered loans declined $48.5 million, or 10.6%, during the quarter The FDIC indemnification asset declined $6.1 million, or 13.5%, during the quarter to $39.0 million, or 9.5% of the balance of covered loans outstanding Successful execution of resolution strategies related to covered loans classified as likely to exit contributed to majority of quarterly decline $688 $622 $519 $458 $409 11.04% 10.62% 10.25% 10.62% 10.63% 1Q13 2Q13 3Q13 4Q13 1Q14 Dollars in millions Covered Loan Balances and Yields Ending Balance of Covered Loans Yield on Covered Loans
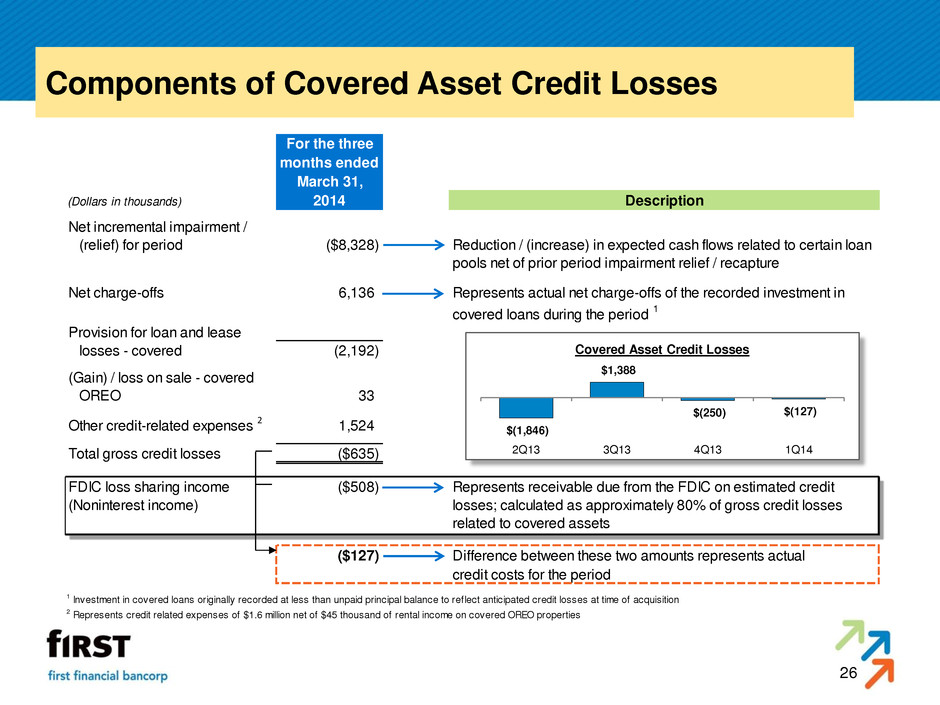
26 Components of Covered Asset Credit Losses For the three months ended March 31, (Dollars in thousands) 2014 Description Net incremental impairment / (relief) for period ($8,328) Reduction / (increase) in expected cash flows related to certain loan pools net of prior period impairment relief / recapture Net charge-offs 6,136 Represents actual net charge-offs of the recorded investment in covered loans during the period 1 Provision for loan and lease losses - covered (2,192) (Gain) / loss on sale - covered OREO 33 Other credit-related expenses 2 1,524 Total gross credit losses ($635) FDIC loss sharing income ($508) Represents receivable due from the FDIC on estimated credit (Noninterest income) losses; calculated as approximately 80% of gross credit losses related to covered assets ($127) Difference between these two amounts represents actual credit costs for the period 1 Investment in covered loans originally recorded at less than unpaid principal balance to reflect anticipated credit losses at time of acquisition 2 Represents credit related expenses of $1.6 million net of $45 thousand of rental income on covered OREO properties $(1,846) $1,388 $(250) $(127) 2Q13 3Q13 4Q13 1Q14 Covered Asset Credit Losses
First Financial Bancorp Investor Presentation First Quarter 2014


