Earnings Presentation Second Quarter 2017 Exhibit 99.2
2 This earnings presentation contains “forward-looking statements” within the meaning of the Private Securities Litigation Reform Act of 1995. These statements are not based on historical or current facts, but rather on our current beliefs, expectations, assumptions and projections about our business, the economy and other future conditions. Forward-looking statements often include words such as „„believes,‟‟ „„anticipates,‟‟ “likely,” “expected,” „„intends,‟‟ “could,” “should,” and other similar references to future periods. Examples of forward-looking statements include, but are not limited to, statements we make about (i) our future operating or financial performance, including revenues, income or loss and earnings or loss per share, (ii) future common stock dividends, (iii) our capital structure, including future capital levels, (iv) our plans, objectives and strategies, and (v) the assumptions that underlie our forward-looking statements. As with any forecast or projection, forward-looking statements are subject to inherent uncertainties, risks and changes in circumstances that may cause actual results to differ materially from those set forth in the forward-looking statements. Important factors that could cause actual results to differ materially from those in our forward-looking statements include the following, without limitation: (i) economic, market, liquidity, credit, interest rate, operational and technological risks associated with the Company‟s business; (ii) the effect of and changes in policies and laws or regulatory agencies, including the Dodd-Frank Wall Street Reform and Consumer Protection Act and other legislation and regulation relating to the banking industry; (iii) management‟s ability to effectively execute its business plans; (iv) mergers and acquisitions, including cost or difficulties related to the integration of acquired companies; (v) the Company‟s ability to comply with the terms of loss sharing agreements with the FDIC; (vi) the effect of changes in accounting policies and practices; (vii) changes in consumer spending, borrowing and saving and changes in unemployment; (viii) changes in customers‟ performance and creditworthiness; and (ix) the costs and effects of litigation and of unexpected or adverse outcomes in such litigation. Additional factors that may cause our actual results to differ materially from those described in our forward-looking statements can be found in the Company‟s Annual Report on Form 10-K for the year ended December 31, 2016, as well as its other filings with the SEC, which are available on the SEC website at www.sec.gov. Forward-looking statements are meaningful only on the date when such statements are made. We undertake no obligation to update any forward-looking statement to reflect events or circumstances that may arise after the date on which a forward-looking statement is made. Forward Looking Statement Disclosure
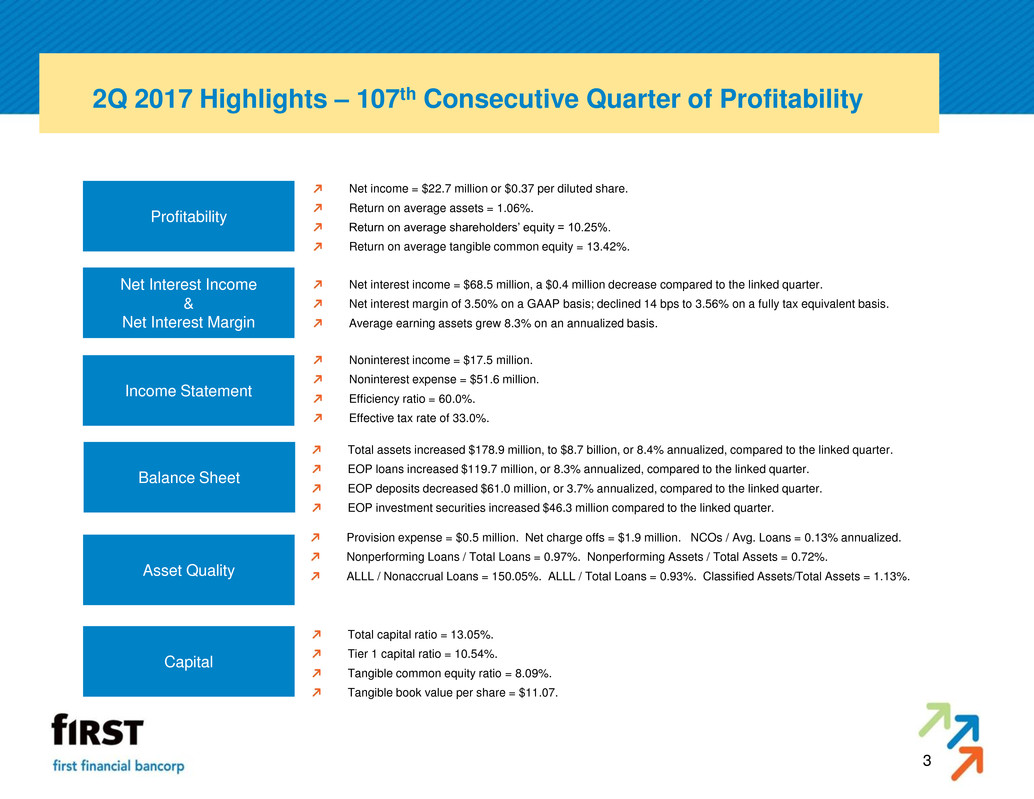
3 2Q 2017 Highlights – 107th Consecutive Quarter of Profitability Total assets increased $178.9 million, to $8.7 billion, or 8.4% annualized, compared to the linked quarter. EOP loans increased $119.7 million, or 8.3% annualized, compared to the linked quarter. EOP deposits decreased $61.0 million, or 3.7% annualized, compared to the linked quarter. EOP investment securities increased $46.3 million compared to the linked quarter. Balance Sheet Profitability Asset Quality Net Interest Income & Net Interest Margin Income Statement Capital Noninterest income = $17.5 million. Noninterest expense = $51.6 million. Efficiency ratio = 60.0%. Effective tax rate of 33.0%. Net interest income = $68.5 million, a $0.4 million decrease compared to the linked quarter. Net interest margin of 3.50% on a GAAP basis; declined 14 bps to 3.56% on a fully tax equivalent basis. Average earning assets grew 8.3% on an annualized basis. Net income = $22.7 million or $0.37 per diluted share. Return on average assets = 1.06%. Return on average shareholders‟ equity = 10.25%. Return on average tangible common equity = 13.42%. Provision expense = $0.5 million. Net charge offs = $1.9 million. NCOs / Avg. Loans = 0.13% annualized. Nonperforming Loans / Total Loans = 0.97%. Nonperforming Assets / Total Assets = 0.72%. ALLL / Nonaccrual Loans = 150.05%. ALLL / Total Loans = 0.93%. Classified Assets/Total Assets = 1.13%. Total capital ratio = 13.05%. Tier 1 capital ratio = 10.54%. Tangible common equity ratio = 8.09%. Tangible book value per share = $11.07.
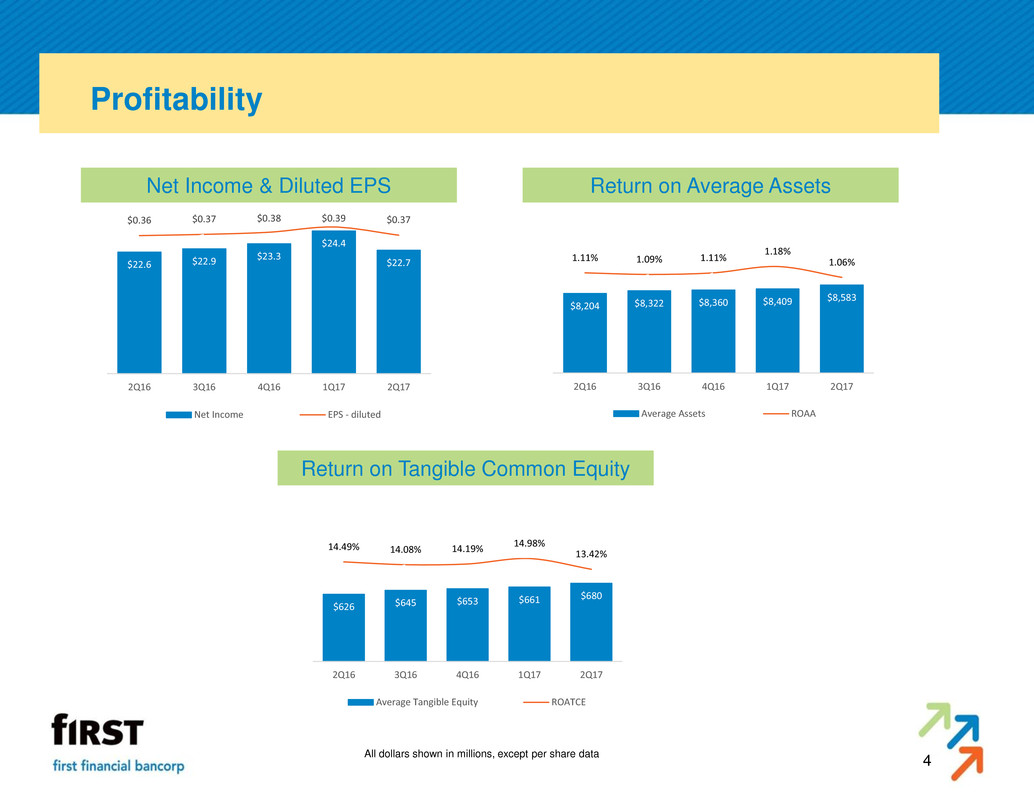
4 Profitability Net Income & Diluted EPS Return on Average Assets Return on Tangible Common Equity All dollars shown in millions, except per share data $22.7 $24.4 $23.3 $22.9 $22.6 $0.37 $0.39 $0.38 $0.37 $0.36 2Q171Q174Q163Q162Q16 Net Income EPS - diluted $8,583 $8,409 $8,360 $8,322 $8,204 1.06% 1.18% 1.11% 1.09% 1.11% 2Q171Q174Q163Q162Q16 Average Assets ROAA $680 $661 $653 $645 $626 13.42% 14.98% 14.19% 14.08% 14.49% 2Q171Q174Q163Q162Q16 Average Tangible Equity ROATCE
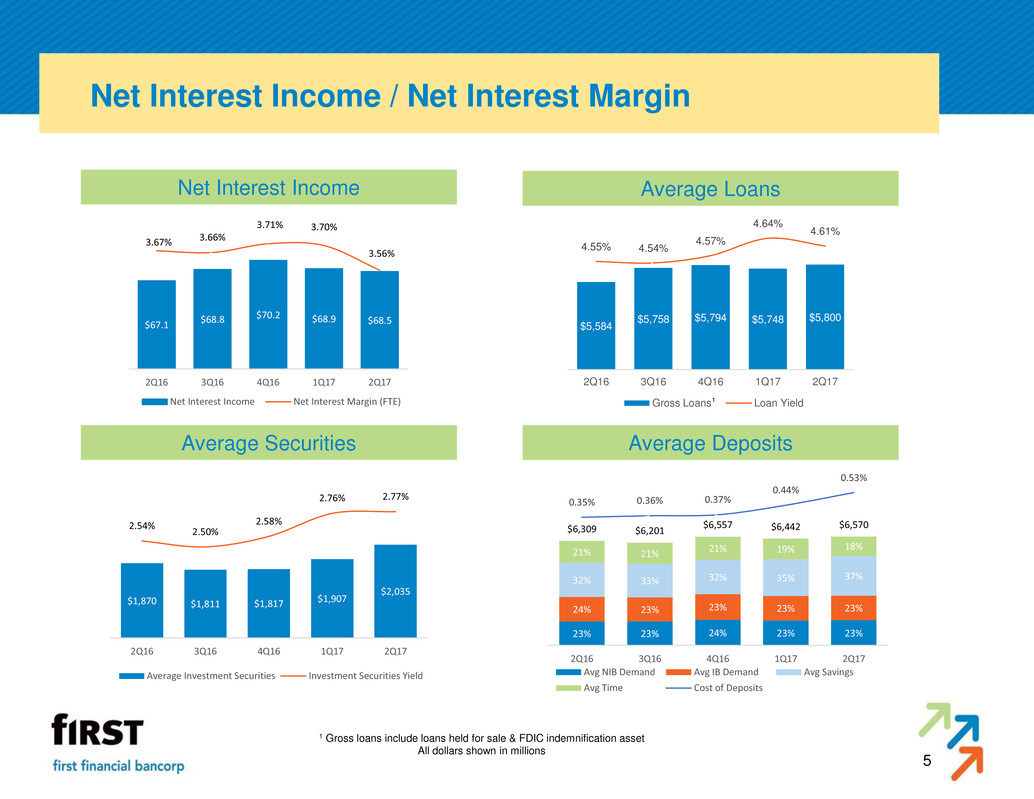
5 Net Interest Income / Net Interest Margin 1 Gross loans include loans held for sale & FDIC indemnification asset All dollars shown in millions Net Interest Income Average Loans Average Securities Average Deposits $68.5 $68.9 $70.2 $68.8 $67.1 3.56% 3.70% 3.71% 3.66% 3.67% 2Q171Q174Q163Q162Q16 Net Interest Income Net Interest Margin (FTE) $2,035 $1,907 $1,817 $1,811 $1,870 2.77% 2.76% 2.58% 2.50% 2.54% 2Q171Q174Q163Q162Q16 Average Investment Securities Investment Securities Yield 23% 23% 24% 23% 23% 23% 23% 23% 23% 24% 37% 35% 32% 33% 32% 18% 19% 21% 21% 21% $6,570 $6,442 $6,557 $6,201 $6,309 0.53% 0.44% 0.37% 0.36% 0.35% 2Q171Q174Q163Q162Q16 Avg NIB Demand Avg IB Demand Avg Savings Avg Time Cost of Deposits $5,800 $5,748 $5,794 $5,758 $5,584 4.61% 4.64% 4.57% 4.54% 4.55% 2Q171Q174Q163Q162Q16 Gross Loans Loan Yield1
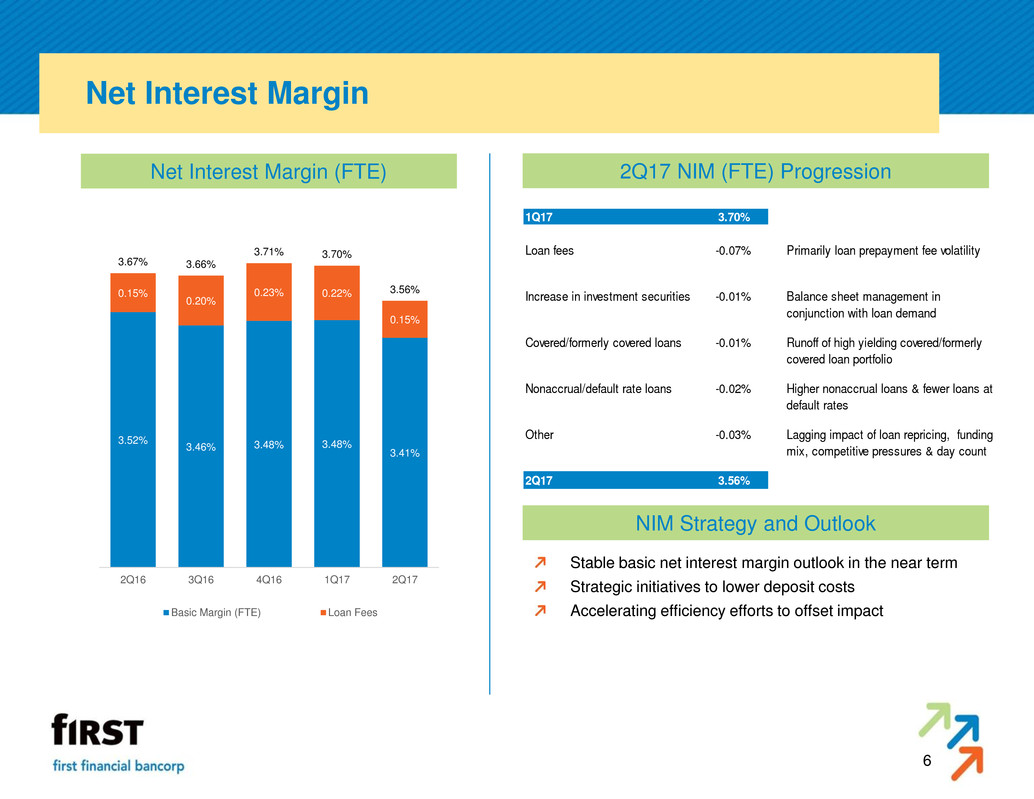
6 Net Interest Margin Net Interest Margin (FTE) 2Q17 NIM (FTE) Progression NIM Strategy and Outlook Stable basic net interest margin outlook in the near term Strategic initiatives to lower deposit costs Accelerating efficiency efforts to offset impact 3.41% 3.48% 3.48% 3.46% 3.52% 0.15% 0.22% 0.23% 0.20% 0.15% 3.56% 3.70% 3.71% 3.66% 3.67% 2Q171Q174Q163Q162Q16 Basic Margin (FTE) Loan Fees 1Q17 3.70% Loan fees -0.07% Primarily loan prepayment fee volatility Increase in investment securities -0.01% Balance sheet management in conjunction with loan demand Covered/formerly covered loans -0.01% Runoff of high yielding covered/formerly covered loan portfolio Nonaccrual/default rate loans -0.02% Higher nonaccrual loans & fewer loans at default rates Other -0.03% Lagging impact of loan repricing, funding mix, competitive pressures & day count 2Q17 3.56%
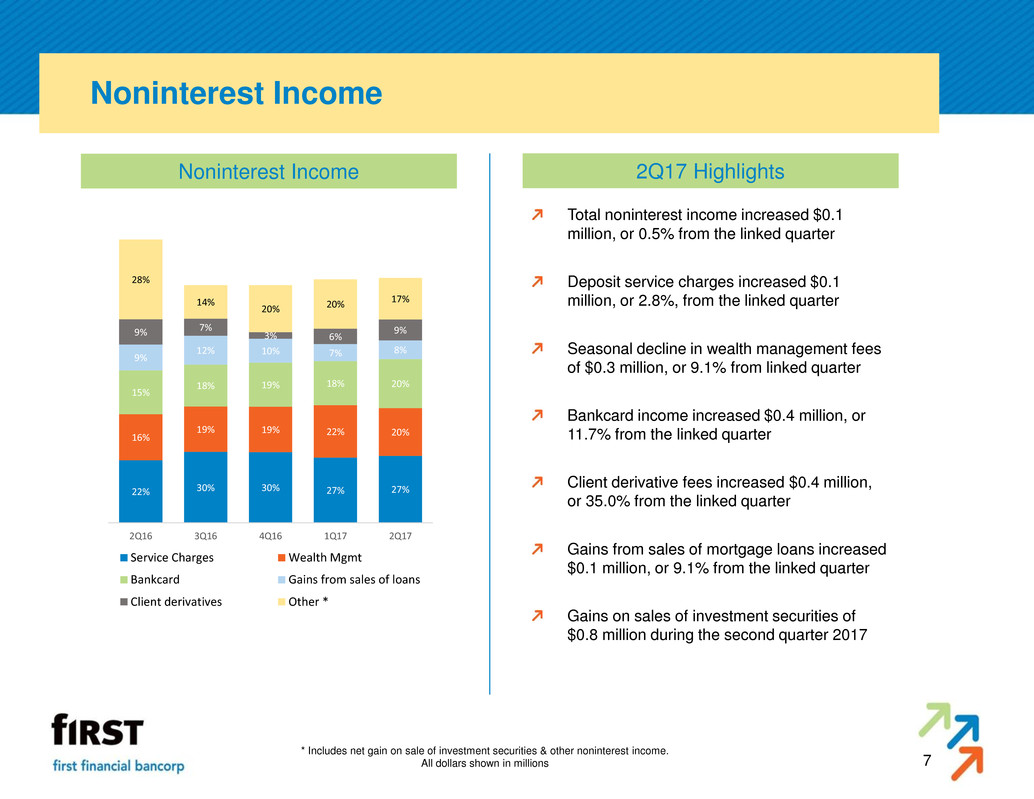
7 Noninterest Income Noninterest Income 2Q17 Highlights * Includes net gain on sale of investment securities & other noninterest income. All dollars shown in millions Total noninterest income increased $0.1 million, or 0.5% from the linked quarter Deposit service charges increased $0.1 million, or 2.8%, from the linked quarter Seasonal decline in wealth management fees of $0.3 million, or 9.1% from linked quarter Bankcard income increased $0.4 million, or 11.7% from the linked quarter Client derivative fees increased $0.4 million, or 35.0% from the linked quarter Gains from sales of mortgage loans increased $0.1 million, or 9.1% from the linked quarter Gains on sales of investment securities of $0.8 million during the second quarter 2017 27% 27% 30% 30% 22% 20% 22% 19% 19% 16% 20% 18% 19% 18% 15% 8% 7% 10% 12% 9% 9% 6% 3% 7% 9% 17% 20% 20% 14% 28% 2Q171Q174Q163Q162Q16 Service Charges Wealth Mgmt Bankcard Gains from sales of loans Client derivatives Other *
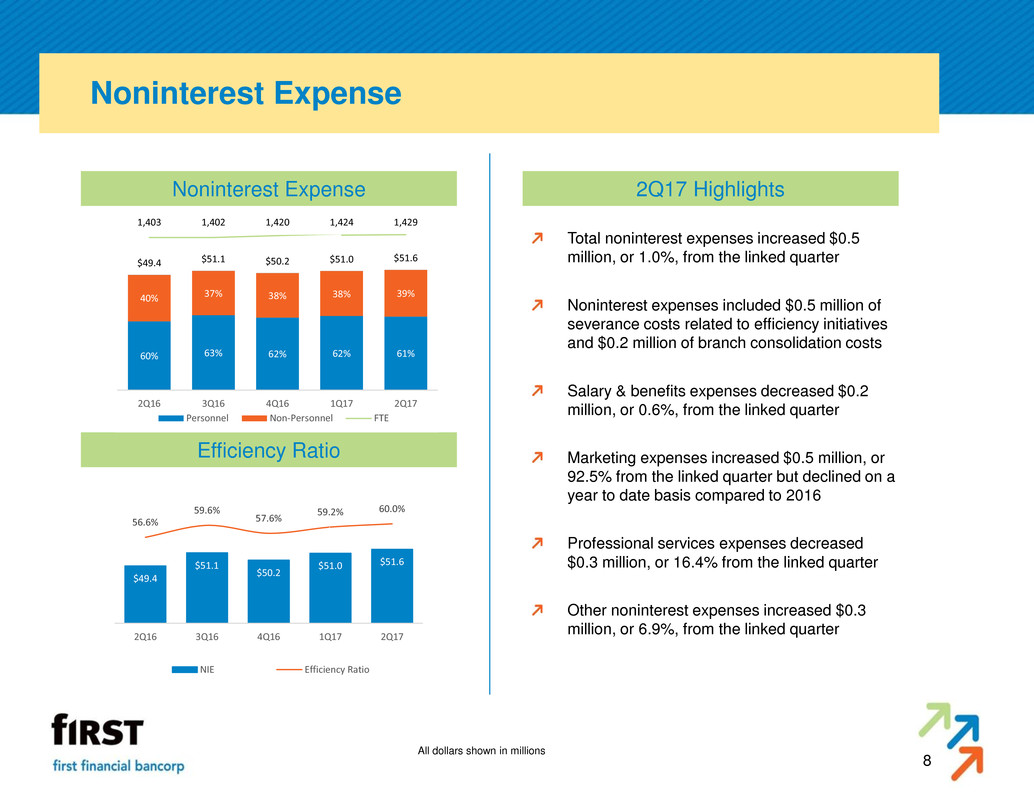
8 Noninterest Expense Noninterest Expense 2Q17 Highlights Efficiency Ratio All dollars shown in millions Total noninterest expenses increased $0.5 million, or 1.0%, from the linked quarter Noninterest expenses included $0.5 million of severance costs related to efficiency initiatives and $0.2 million of branch consolidation costs Salary & benefits expenses decreased $0.2 million, or 0.6%, from the linked quarter Marketing expenses increased $0.5 million, or 92.5% from the linked quarter but declined on a year to date basis compared to 2016 Professional services expenses decreased $0.3 million, or 16.4% from the linked quarter Other noninterest expenses increased $0.3 million, or 6.9%, from the linked quarter 61% 62% 62% 63% 60% 39% 38% 38% 37% 40% $51.6 $51.0 $50.2 $51.1 $49.4 1,429 1,424 1,420 1,402 1,403 2Q171Q174Q163Q162Q16 Personnel Non-Personnel FTE $51.6 $51.0 $50.2 $51.1 $49.4 60.0% 59.2% 57.6% 59.6% 56.6% 2Q171Q174Q163Q162Q16 NIE Efficiency Ratio
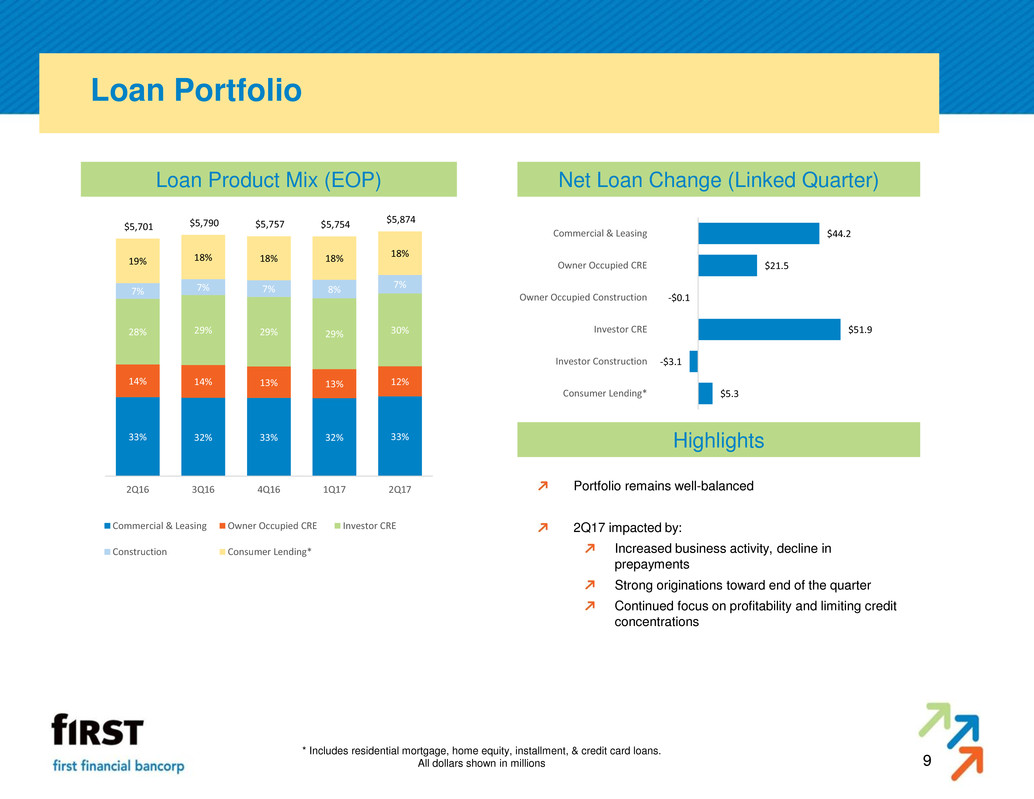
9 Loan Portfolio Loan Product Mix (EOP) Net Loan Change (Linked Quarter) * Includes residential mortgage, home equity, installment, & credit card loans. All dollars shown in millions Highlights Portfolio remains well-balanced 2Q17 impacted by: Increased business activity, decline in prepayments Strong originations toward end of the quarter Continued focus on profitability and limiting credit concentrations 33% 32% 33% 32% 33% 12% 13% 13% 14% 14% 30% 29% 29% 29% 28% 7% 8% 7% 7% 7% 18% 18% 18% 18% 19% $5,874 $5,754 $5,757 $5,790 $5,701 2Q171Q174Q163Q162Q16 Commercial & Leasing Owner Occupied CRE Investor CRE Construction Consumer Lending* $44.2 $21.5 -$0.1 $51.9 -$3.1 $5.3 Commercial & Leasing Owner Occupied CRE Owner Occupied Construction Investor CRE Investor Construction Consumer Lending*
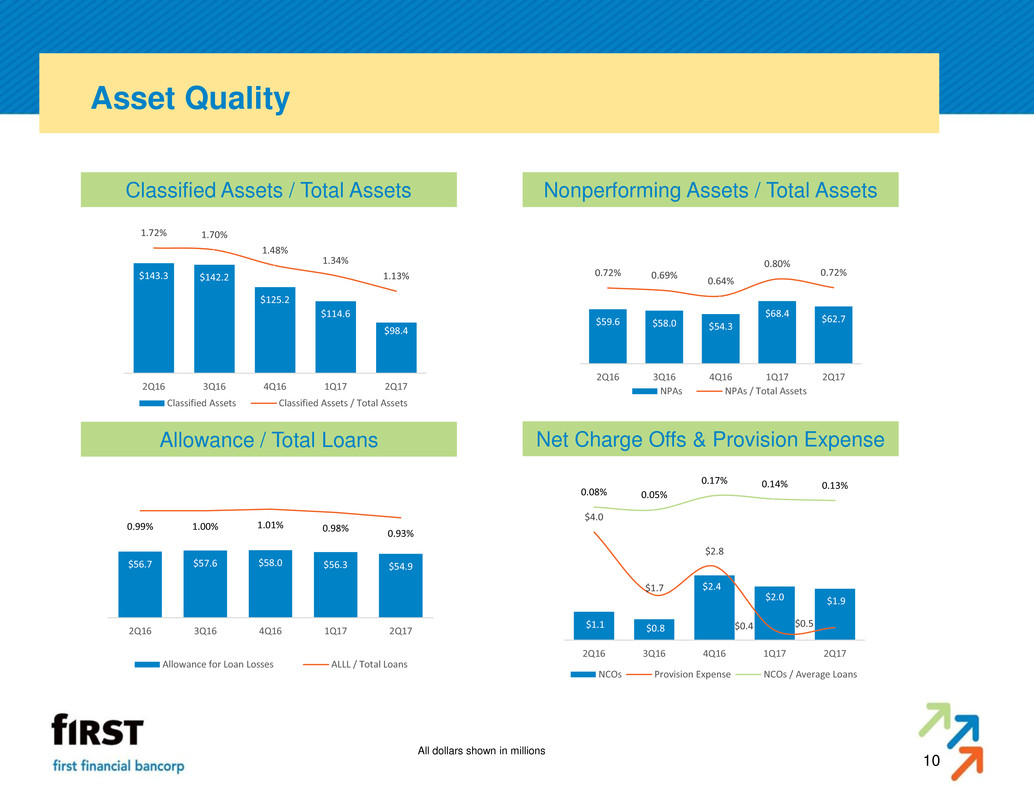
10 Asset Quality Nonperforming Assets / Total Assets Classified Assets / Total Assets Allowance / Total Loans Net Charge Offs & Provision Expense All dollars shown in millions $98.4 $114.6 $125.2 $142.2 $143.3 1.13% 1.34% 1.48% 1.70% 1.72% 2Q171Q174Q163Q162Q16 Classified Assets Classified Assets / Total Assets $62.7 $68.4 $54.3 $58.0 $59.6 0.72% 0.80% 0.64% 0.69% 0.72% 2Q171Q174Q163Q162Q16 NPAs NPAs / Total Assets $54.9 $56.3 $58.0 $57.6 $56.7 0.93% 0.98% 1.01% 1.00% 0.99% 2Q171Q174Q163Q162Q16 Allowance for Loan Losses ALLL / Total Loans $1.9 $2.0 $2.4 $0.8 $1.1 $0.5 $0.4 $2.8 $1.7 $4.0 0.13% 0.14% 0.17% 0.05% 0.08% 2Q171Q174Q163Q162Q16 NCOs Provision Expense NCOs / Average Loans
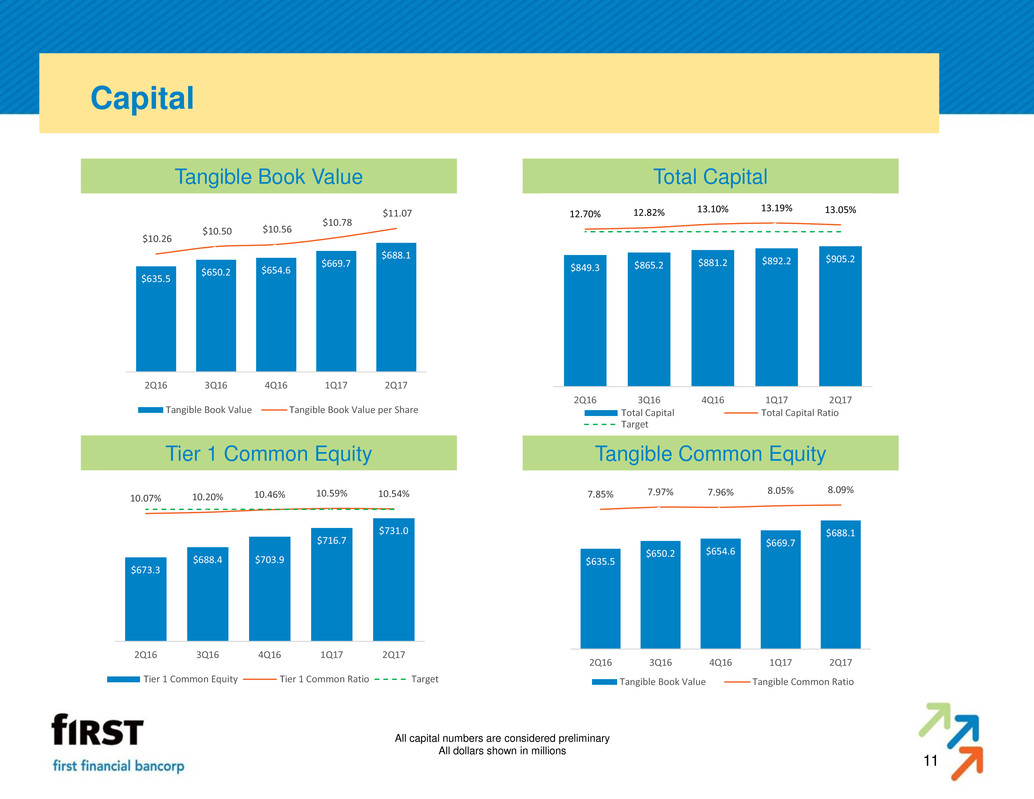
11 Capital Tier 1 Common Equity Tangible Book Value Total Capital Tangible Common Equity All capital numbers are considered preliminary All dollars shown in millions $905.2 $892.2 $881.2 $865.2 $849.3 13.05% 13.19% 13.10% 12.82% 12.70% 2Q171Q174Q163Q162Q16 Total Capital Total Capital Ratio Target $688.1 $669.7 $654.6 $650.2 $635.5 8.09% 8.05% 7.96% 7.97% 7.85% 2Q171Q174Q163Q162Q16 Tangible Book Value Tangible Common Ratio $688.1 $669.7 $654.6 $650.2 $635.5 $11.07 $10.78 $10.56 $10.50 $10.26 2Q171Q174Q163Q162Q16 Tangible Book Value Tangible Book Value per Share $731.0 $716.7 $703.9 $688.4 $673.3 10.54% 10.59% 10.46% 10.20% 10.07% 2Q171Q174Q163Q162Q16 Tier 1 Common Equity Tier 1 Common Ratio Target
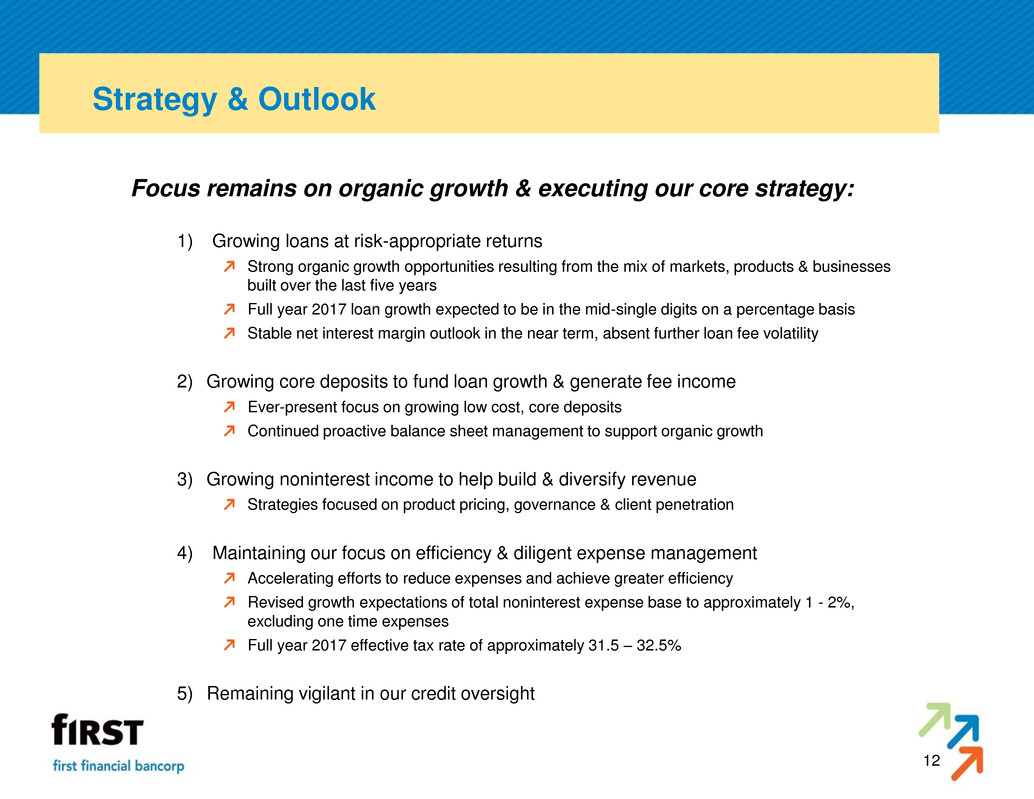
12 Strategy & Outlook Focus remains on organic growth & executing our core strategy: 1) Growing loans at risk-appropriate returns Strong organic growth opportunities resulting from the mix of markets, products & businesses built over the last five years Full year 2017 loan growth expected to be in the mid-single digits on a percentage basis Stable net interest margin outlook in the near term, absent further loan fee volatility 2) Growing core deposits to fund loan growth & generate fee income Ever-present focus on growing low cost, core deposits Continued proactive balance sheet management to support organic growth 3) Growing noninterest income to help build & diversify revenue Strategies focused on product pricing, governance & client penetration 4) Maintaining our focus on efficiency & diligent expense management Accelerating efforts to reduce expenses and achieve greater efficiency Revised growth expectations of total noninterest expense base to approximately 1 - 2%, excluding one time expenses Full year 2017 effective tax rate of approximately 31.5 – 32.5% 5) Remaining vigilant in our credit oversight
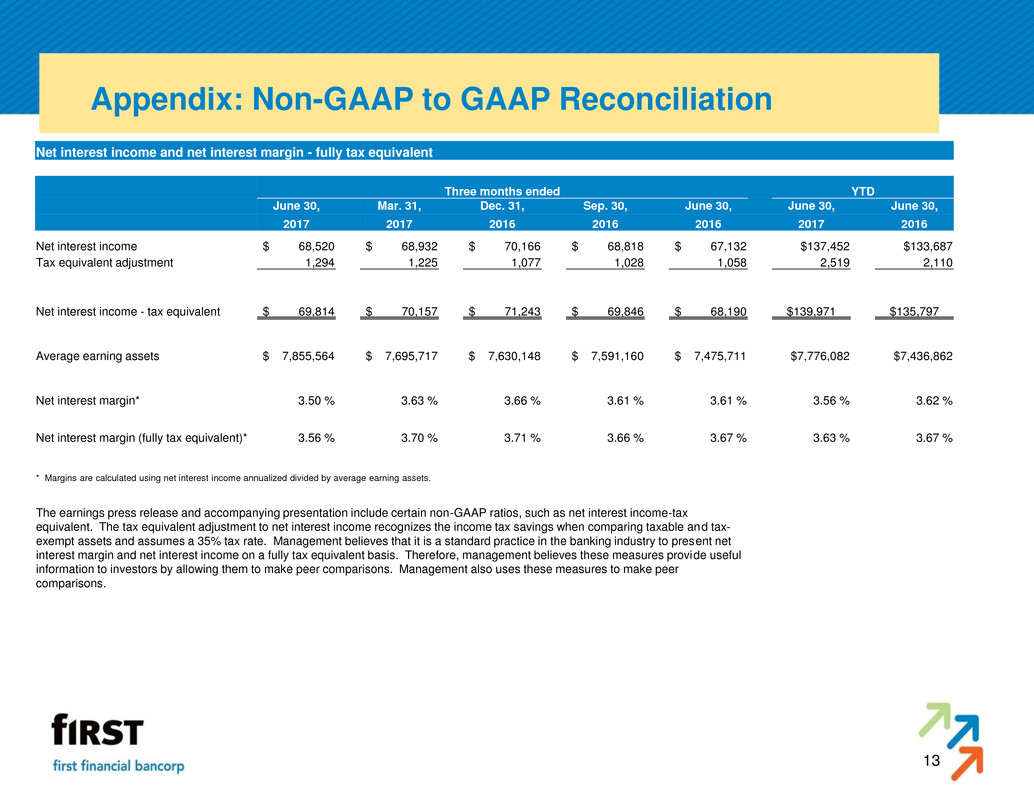
13 Appendix: Non-GAAP to GAAP Reconciliation Net interest income and net interest margin - fully tax equivalent Three months ended YTD June 30, Mar. 31, Dec. 31, Sep. 30, June 30, June 30, June 30, 2017 2017 2016 2016 2016 2017 2016 Net interest income $ 68,520 $ 68,932 $ 70,166 $ 68,818 $ 67,132 $137,452 $133,687 Tax equivalent adjustment 1,294 1,225 1,077 1,028 1,058 2,519 2,110 Net interest income - tax equivalent $ 69,814 $ 70,157 $ 71,243 $ 69,846 $ 68,190 $139,971 $135,797 Average earning assets $ 7,855,564 $ 7,695,717 $ 7,630,148 $ 7,591,160 $ 7,475,711 $7,776,082 $7,436,862 Net interest margin* 3.50 % 3.63 % 3.66 % 3.61 % 3.61 % 3.56 % 3.62 % Net interest margin (fully tax equivalent)* 3.56 % 3.70 % 3.71 % 3.66 % 3.67 % 3.63 % 3.67 % * Margins are calculated using net interest income annualized divided by average earning assets. The earnings press release and accompanying presentation include certain non-GAAP ratios, such as net interest income-tax equivalent. The tax equivalent adjustment to net interest income recognizes the income tax savings when comparing taxable and tax- exempt assets and assumes a 35% tax rate. Management believes that it is a standard practice in the banking industry to present net interest margin and net interest income on a fully tax equivalent basis. Therefore, management believes these measures provide useful information to investors by allowing them to make peer comparisons. Management also uses these measures to make peer comparisons.
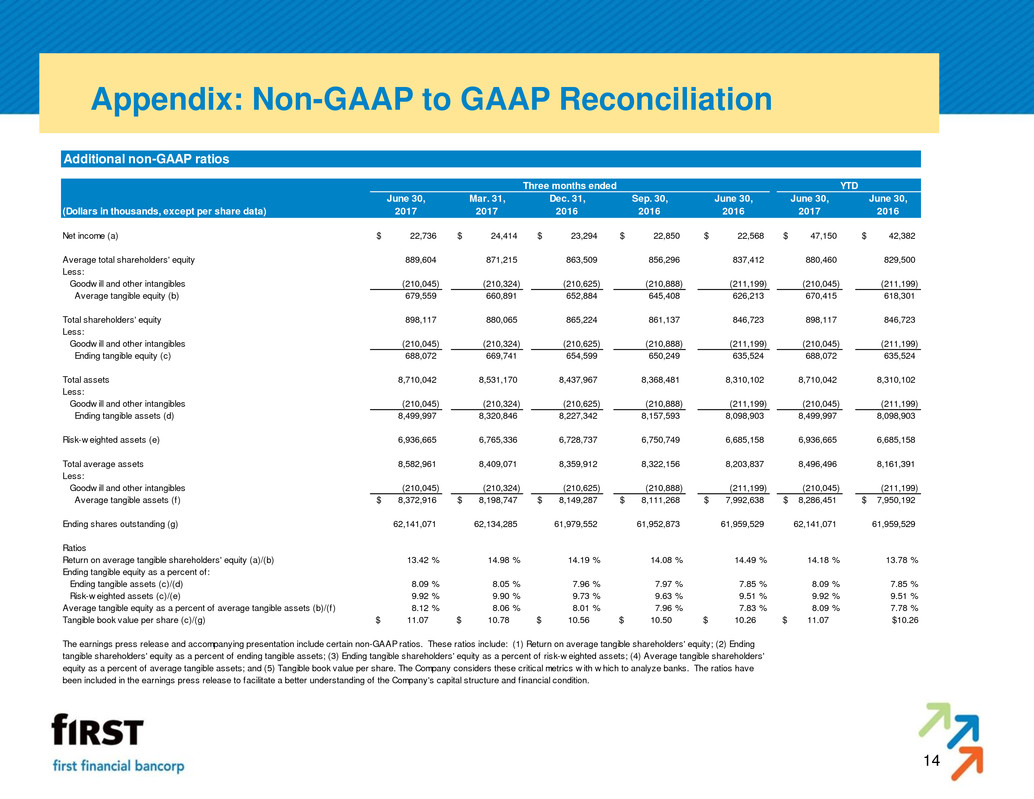
14 Appendix: Non-GAAP to GAAP Reconciliation Additional non-GAAP ratios June 30, Mar. 31, Dec. 31, Sep. 30, June 30, June 30, June 30, (Dollars in thousands, except per share data) 2017 2017 2016 2016 2016 2017 2016 Net income (a) 22,736$ 24,414$ 23,294$ 22,850$ 22,568$ 47,150$ 42,382$ Average total shareholders' equity 889,604 871,215 863,509 856,296 837,412 880,460 829,500 Less: Goodw ill and other intangibles (210,045) (210,324) (210,625) (210,888) (211,199) (210,045) (211,199) Average tangible equity (b) 679,559 660,891 652,884 645,408 626,213 670,415 618,301 Total shareholders' equity 898,117 880,065 865,224 861,137 846,723 898,117 846,723 Less: Goodw ill and other intangibles (210,045) (210,324) (210,625) (210,888) (211,199) (210,045) (211,199) Ending tangible equity (c) 688,072 669,741 654,599 650,249 635,524 688,072 635,524 Total assets 8,710,042 8,531,170 8,437,967 8,368,481 8,310,102 8,710,042 8,310,102 Less: Goodw ill and other intangibles (210,045) (210,324) (210,625) (210,888) (211,199) (210,045) (211,199) Ending tangible assets (d) 8,499,997 8,320,846 8,227,342 8,157,593 8,098,903 8,499,997 8,098,903 Risk-w eighted assets (e) 6,936,665 6,765,336 6,728,737 6,750,749 6,685,158 6,936,665 6,685,158 Total average assets 8,582,961 8,409,071 8,359,912 8,322,156 8,203,837 8,496,496 8,161,391 Less: Goodw ill and other intangibles (210,045) (210,324) (210,625) (210,888) (211,199) (210,045) (211,199) Average tangible assets (f) 8,372,916$ 8,198,747$ 8,149,287$ 8,111,268$ 7,992,638$ 8,286,451$ 7,950,192$ Ending shares outstanding (g) 62,141,071 62,134,285 61,979,552 61,952,873 61,959,529 62,141,071 61,959,529 Ratios Return on average tangible shareholders' equity (a)/(b) 13.42 % 14.98 % 14.19 % 14.08 % 14.49 % 14.18 % 13.78 % Ending tangible equity as a percent of: Ending tangible assets (c)/(d) 8.09 % 8.05 % 7.96 % 7.97 % 7.85 % 8.09 % 7.85 % Risk-w eighted assets (c)/(e) 9.92 % 9.90 % 9.73 % 9.63 % 9.51 % 9.92 % 9.51 % Average tangible equity as a percent of average tangible assets (b)/(f) 8.12 % 8.06 % 8.01 % 7.96 % 7.83 % 8.09 % 7.78 % Tangible book value per share (c)/(g) 11.07$ 10.78$ 10.56$ 10.50$ 10.26$ 11.07$ $10.26 Three months ended YTD The earnings press release and accompanying presentation include certain non-GAAP ratios. These ratios include: (1) Return on average tangible shareholders' equity; (2) Ending tangible shareholders' equity as a percent of ending tangible assets; (3) Ending tangible shareholders' equity as a percent of risk-w eighted assets; (4) Average tangible shareholders' equity as a percent of average tangible assets; and (5) Tangible book value per share. The Company considers these critical metrics w ith w hich to analyze banks. The ratios have been included in the earnings press release to facilitate a better understanding of the Company's capital structure and f inancial condition.

15


