EXHIBIT 99.1
Dear Shareholder:
In early August, we sent you a letter with our perspective on why the turmoil in the financial markets is happening and how First Financial Bancorp (FFBC) is positioned. The disruption in the credit markets has now expanded to include issues beyond the sub-prime market, and it continues to cause uncertainty from a macro-economic perspective.
Because of this broad market uncertainty and the impact that the market has had on the stock price of First Financial, we feel it is important to give you another update on our strategic progress.
In addition, we want to share some exciting new developments for First Financial.
Here is an excerpt from our August letter that relates to market issues and our position:
“The concern about the financial services industry is generally over two issues:
| | • | | Continued net interest income and margin compression caused by the market interest rate environment |
| |
| | • | | Recent concerns about the credit quality of sub-prime lending and residential real estate developer lending |
First Financial is certainly subject to the effects of market interest rates, but it has positioned the balance sheet so the margin and net interest income are strong relative to peers through both the structure and mix of the earning assets and funding.
We believe our company has limited credit exposure to the areas of broad industry concern. We have done no lending to sub-prime borrowers, and the exposure to residential real estate developers is approximately 2% of the total loan portfolio.”
These issues continue to challenge the industry, and several of our peer banks have taken or announced significant loan loss charges. In this letter, we have outlined additional information about our credit portfolio performance and other critical performance measurements.
Credit Quality
Recent credit market turmoil and the slowdown in the housing market have contributed to an uncertain credit environment for banks. Many financial institutions have already experienced higher loan losses due to changing market conditions.
For the third quarter, First Financial reportedimproved credit quality measures:
| | • | | Year-to-date net losses of 0.23% compared to guidance of 0.30% to 0.40% |
| |
| | • | | Loan loss reserve to non-performing loans of 212%. (The level of our reserve to loans that are not accruing interest due to concerns of repayment of principal and interest.) |
| | • | | Non-performing assets to total assets of 0.51%. (The percentage of our assets that are not performing as a percentage of total assets.) |
The graph below outlines our credit quality performance since 2002.
Credit Quality Trends
| | | | | | | | | | | | | | | | | | | | | | | | | |
| | | | | | | | | | | | | | | | | | | | | | | YTD |
| | | 2002 | | 2003 | | 2004 | | 2005 | | 2006* | | 9/30/2007 |
| | | | | | | | | | | | | | | | | | | | | | | | | |
Net Charge-off Ratio | | | 0.54 | % | | | 0.69 | % | | | 0.26 | % | | | 0.30 | % | | | 0.47 | % | | | 0.23 | % |
| | | | | | | | | | | | | | | | | | | | | | | | | |
Non-performing Loans / Loans | | | 0.92 | % | | | 0.96 | % | | | 0.70 | % | | | 1.08 | % | | | 0.44 | % | | | 0.53 | % |
| | | | | | | | | | | | | | | | | | | | | | | | | |
Reserve Ratio | | | 1.77 | % | | | 1.71 | % | | | 1.61 | % | | | 1.62 | % | | | 1.10 | % | | | 1.12 | % |
Our loan loss levels and non-performing loan levels have improved; and as a result, our loan loss reserve ratio has declined.
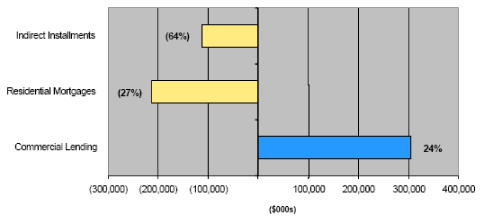
In addition to emphasizing the importance of making good underwriting decisions, we have also been changing the composition and mix of our loan portfolio. In 2005, we announced our plan to reduce our mortgage portfolio exposure and to exit the indirect auto lending business. At the same time, we began to focus more actively on the commercial market in order to grow that business.
The graph below outlines the changes in our loan portfolios since 2005.
Loan Portfolio Changes Since 2005
During 2006 and early 2007, we sold $53 million of under performing loans or loans that contained higher-risk characteristics than we wanted to retain. These decisions caused a short-term revenue reduction but also better positioned FFBC to manage the current credit environment.
We are working hard to manage our credit risk. We are pleased with our credit performance thus far, but we also understand that in uncertain economic times our clients may experience difficulties and create higher credit risk for FFBC. We will continue to stay diligent in our credit management.
Third-Quarter Financial Performance
The next table includes FFBC’s third quarter financial performance compared to both national and regional peer-group averages. We are still in the early stages of our financial improvement plan, but our third-quarter performance was at or above peer financial performance for most financial metrics. We continue to work hard to improve our performance and to achieve our long-term goal of being a top-quartile performer in the industry.
First Financial Performance Compared to Peers
| | | | | | | | | | | | | |
| | | | | | | *National | | **Regional |
| | | | | | | Peers — 2Q | | Peers |
| | | FFBC | | $3-$10BN | | Peer — 3Q |
Financial: | | | | | | | | | | | | |
| Return on Equity | | | 12.03 | % | | | 10.57 | % | | | 11.44 | % |
| Return on Assets | | | 1.00 | % | | | 0.99 | % | | | 1.04 | % |
| Net Interest Margin | | | 3.88 | % | | | 3.73 | % | | | 3.54 | % |
| Efficiency Ratio | | | 65.48 | % | | | 61.63 | % | | | 62.18 | % |
Credit: | | | | | | | | | | | | |
| Net charge-off | | | 0.23 | % | | | 0.19 | % | | | 0.41 | % |
| Non Performing Loan (NPL) | | | 0.53 | % | | | 0.68 | % | | | 0.82 | % |
| Reserve level | | | 1.12 | % | | | 1.24 | % | | | 1.26 | % |
| Reserve to NPLs | | | 212.42 | % | | | 182.30 | % | | | 174.24 | % |
| | |
| * | | The national peer group represents all banks in the $3-$10 billion asset size range nationally and shows the second-quarter averages for the group. The national peer group’s third-quarter average performance will not be available until late December. |
| |
| ** | | Regional peers include Fifth Third, Huntington, National City, Park National, Integra, Old National, Amcore, First Merit, First Merchants, Mainsource, US Bank, and Keycorp. |
Our 2007 performance has been highlighted by:
| | • | | Strong commercial loan growth over the last twelve months of 17% |
| |
| | • | | Strong net interest margin |
| |
| | • | | Improved credit quality |
| | • | | Decreasing non-interest expense |
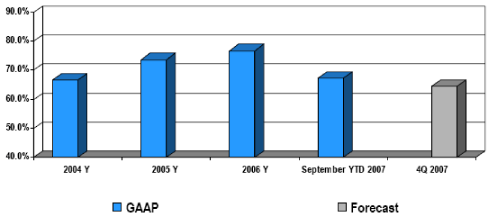
To make continued progress on our long-term financial goal of achieving a return on equity at or above 15%, we need to improve our efficiency through revenue growth and effective expense management.
An example of expense management is the reduction of our staffing levels to match our revenue due to exiting certain business lines and markets.
The following graphs show our efficiency ratio since 2004 and our staffing (FTE) levels since mid 2006. The efficiency ratio is the percentage of our revenue consumed by non-interest expenses. Our stated long-term goal is 55% - 60%.
Efficiency Ratio
Full-Time Staff Positions
Dividend Increase
The strategy we have followed for our capital and shareholder dividend policy is to increase the dividend when it is appropriate and when it is sustainable.
During 2007, we completed the major steps of our reorganization plan that started in 2005. Emerging from the reorganization, our company continues to be well capitalized; and we are optimistic in our long-term outlook.
Therefore, on November 27, 2007, the board of directors approved an increase in the dividend to $.17 per share. This dividend will be paid on January 2, 2008.
Over the years, we have weathered the cyclical conditions of the market, credit, and investments, and we take pride in the fact that we have paid a quarterly cash dividend every quarter since First Financial Bancorp was formed in 1983.
Headquarters Relocation
On December 7, 2007, we announced plans to relocate our corporate headquarters to Cincinnati, Ohio, during the first quarter of 2008. The purpose of this move is to position our corporate headquarters in a market more consistent with our plans to expand in metropolitan markets. In addition, this move will allow us to attract and retain the talent necessary to manage and grow the company.
We also announced that our banking subsidiary, First Financial Bank, will continue to be headquartered in Hamilton, Ohio. Our largest base of banking assets is in the city of Hamilton and in Butler County; and thus it continues to be an important growth market for the company.
Summary
In spite of the challenges that face the banking industry, our management is confident about our market position and our long-term prospects for growth. When the current cycle is over, we expect that our value will be more fully recognized by quality
small/mid cap bank investors.
To those of you who are clients of the bank, we appreciate the opportunity to help you on your path to success. Please recommend our services to your friends, family, and colleagues.
We appreciate your support and patience.
| | | |
| Sincerely, | | Sincerely, |
| | | |
| |  |
| Barry S. Porter | | Claude E. Davis |
| Chairman of the Board | | President and CEO |
| | | |
| December 14, 2007 | | |


