1
EXHIBIT 99.2
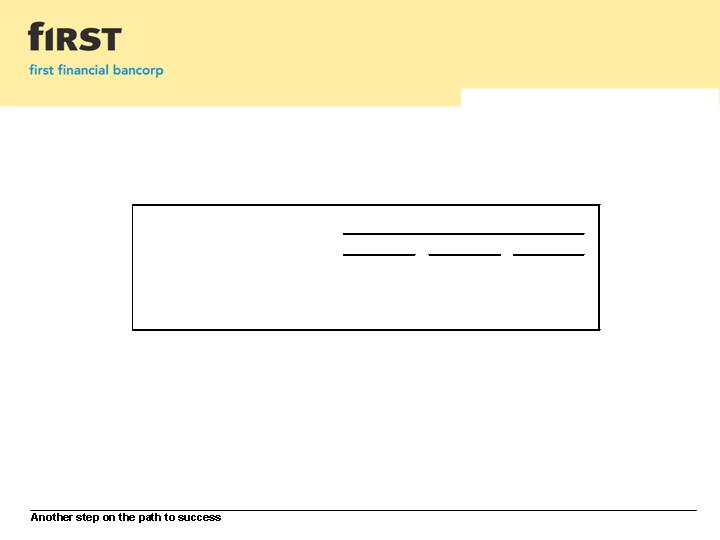
Return on Average Assets &
Return on Average Common Shareholders’ Equity
Table I
1Q-09
4Q-08
1Q-08
Return on Average Assets
0.62%
0.23%
0.89%
Return on Average Common
Shareholders' Equity
7.67%
2.97%
10.66%
Quarter

2
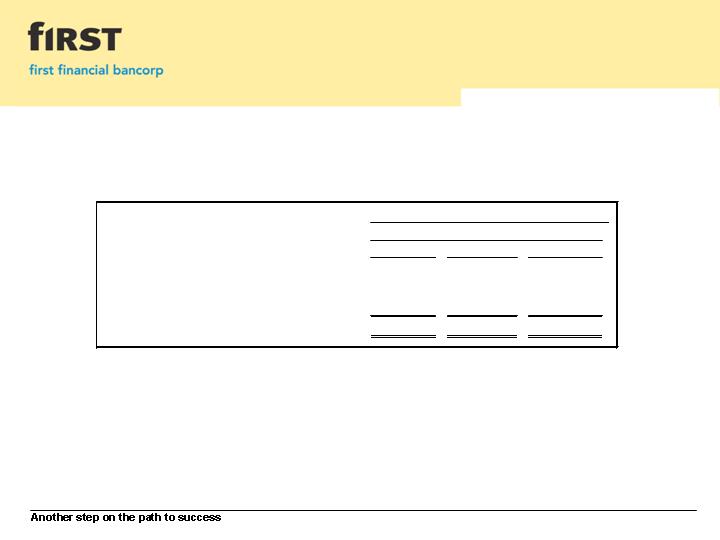
Pre-Tax, Pre-Provision Income
(including and excluding applicable securities gains and losses)
Table II
1Q-09
4Q-08
1Q-08
Pre-Tax Income
8,768
$
2,455
$
10,881
$
Excluding Provision Expense
4,259
10,475
3,223
Pre-Tax, Pre-Provision Income
13,027
$
12,930
$
14,104
$
Securities Gains (Losses)
11
1
(137)
1
1,605
2
Pre-Tax, Pre-Provision Income, excluding
Securities Gains (Losses)
13,016
$
13,067
$
12,499
$
1
2
($ in thousands)
Quarter
Gains (losses) related to the company's investment in 200,000 Federal Home Loan Mortgage Corporation (FHLMC) perpetual
preferred series V shares.
Includes a $1,585 gain associated with the partial redemption of Visa, Inc. common shares.

3
Credit Quality Trends
Table III
March 31,
2009
December 31,
2008
September 30,
2008
June 30,
2008
March 31,
2008
Total Nonperforming Loans
24,892
$
18,185
$
14,038
$
15,366
$
15,253
$
Total Nonperforming Assets
28,405
$
22,213
$
18,648
$
19,129
$
17,621
$
Nonperforming Assets as a % of:
Period-End Loans, Plus Other Real Estate Owned
1.04%
0.83%
0.70%
0.71%
0.67%
Total Assets
0.75%
0.60%
0.53%
0.55%
0.53%
Nonperforming Loans as a % of Total Loans
0.91%
0.68%
0.53%
0.57%
0.58%
Allowance for Loan & Lease Losses
36,437
$
35,873
$
30,353
$
29,580
$
29,718
$
Allowance for Loan & Lease Losses as a % of:
Period-End Loans
1.33%
1.34%
1.14%
1.11%
1.14%
Nonaccrual Loans
147.6%
199.5%
219.5%
199.7%
202.3%
Nonperforming Loans
146.4%
197.3%
216.2%
192.5%
194.8%
Total Net Charge-Offs
3,695
$
4,955
$
2,446
$
2,631
$
2,562
$
Annualized Net Charge-Offs as a % of Average
Loans & Leases
0.55%
0.73%
0.36%
0.40%
0.40%
($ in thousands)
Three Months Ended

4
Capital Management
Table IV
FFBC
First
Financial Bank
Regulatory
"well-capitalized"
minimum
Leverage Ratio
9.51%
8.26%
5%
Tier 1 Capital Ratio
12.16%
10.58%
6%
Total Risk-Based Capital Ratio
13.39%
12.07%
10%
EOP Tangible Equity /
EOP Tangible Assets
8.60%
N/A
N/A
EOP Tangible Common Equity /
EOP Tangible Assets
6.54%
N/A
N/A
N/A = not applicable

5
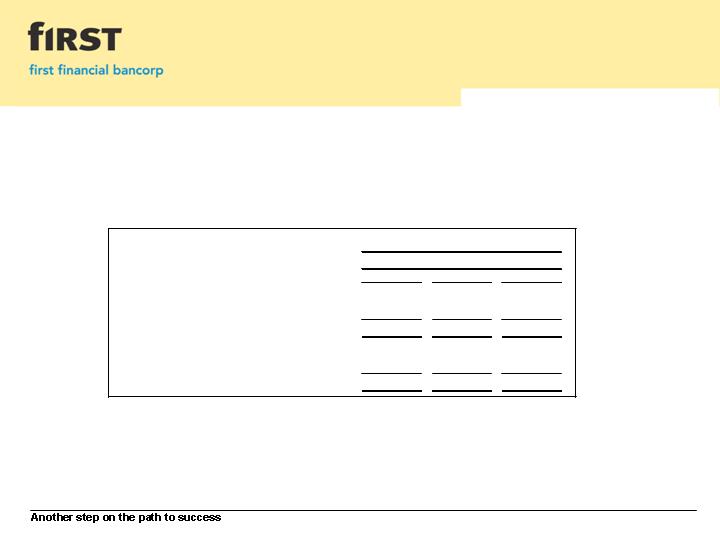
Net Interest Income &
Net Interest Margin
Table V
1Q-09
4Q-08
1Q-08
Net Interest Income
30,928
$
30,129
$
28,249
$
Net Interest Margin
3.61%
3.67%
3.78%
Net Interest Margin
(fully tax equivalent)
3.65%
3.71%
3.85%
Quarter
($ in thousands)
6
Noninterest Income
Table VI
1Q-09
4Q-08
1Q-08
Gain on Sale of Propery & Casualty Liability
Portion of Insurance Business
574
$
-
$
-
$
Gain on Sales of Investment Securities (VISA)
-
-
1,585
Impact to Noninterest Income
574
$
-
$
1,585
$
($ in thousands)
Quarter
7
Components of noninterest income negatively impacted by the current economic conditions and their effect
on consumer spending activity, as well as volatility in the investment and equity markets
Service Charges on Deposit Accounts &
Trust & Wealth Management Fees
Table VII
1Q-09
4Q-08
1Q-08
Overdraft/Non-Sufficient Fund Fees
2,785
$
3,445
$
3,329
$
Other Deposit Fees
1,294
1,307
1,278
Total Service Charges on Deposit Accounts
4,079
$
4,752
$
4,607
$
Trust Fees
2,946
3,284
3,913
Investment Advisory Fees
343
461
709
Total Trust & Wealth Management Fees
3,289
$
3,745
$
4,622
$
($ in thousands)
Quarter
8
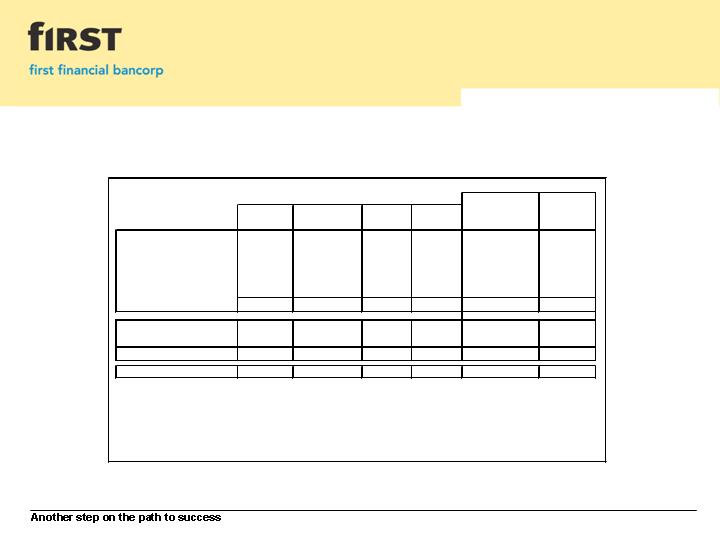
Investment Portfolio
March 31, 2009
Table VIII
($ in thousands, excluding book price)
Base
% of
Book
Book
Book
03/31/2009
Gain/
Total
Value
Yield
Price
Market Value
(Loss)
Agency's
5.4%
$ 41,534
5.31%
$ 99.78
103.66
$
$ 1,554
CMO's (Agency)
22.3%
170,397
4.62%
100.87
103.00
3,526
CMO's (Private)
0.0%
85
2.04%
100.00
98.04
(2)
MBS's (Agency)
63.8%
488,448
4.87%
101.01
103.50
11,790
Agency Preferred
0.0%
72
-
0.36
0.36
-
91.5%
$ 700,536
4.83%
100.89
$
103.38
$
$ 16,868
Municipal
4.4%
$ 33,699
7.15%
$ 99.17
100.28
$ 376
Other *
4.1%
31,382
4.41%
100.91
99.45
(461)
8.5%
$ 65,081
5.83%
100.01
$
99.88
$
(85)
$
Total Investment Portfolio
100.0%
765,617
$
4.92%
100.82
$
102.40
$
16,783
$
Net Unrealized Gain/(Loss)
16,783
$
Aggregate Gains
17,836
$
Aggregate Losses
(1,053)
$
Net Unrealized Gain/(Loss) % of Book Value
2.19%
* Other includes $28.0 million of regulatory stock
Subtotal
Subtotal